
19th World Congress of Soil Science Symposium 4.1.2 ...
240
19th World Congress of Soil Science Symposium 4.1.2 Management and protection of receiving environments Soil Solutions for a Changing World, Brisbane, Australia 1 – 6 August 2010
-
Upload
khangminh22 -
Category
Documents
-
view
1 -
download
0
Transcript of 19th World Congress of Soil Science Symposium 4.1.2 ...

19th World Congress of Soil Science
Symposium 4.1.2
Management and protection of receiving
environments
Soil Solutions for a Changing World,
Brisbane, Australia
1 – 6 August 2010

ii
Table of Contents
Page
Table of Contents ii
1 A municipal scale eco-balance analysis of carbon and nitrogen cycle in Japanese agriculture
1
2 A pragmatic water-balance based protocol for assessing water quality from agricultural lands
5
3 A preliminary examination of the spatial distribution of acidic soil and required rates of ameliorant in the Avon River Basin, Western Australia
9
4 Application of soil survey to assess phosphorus loss by runoff from agricultural watersheds
13
5 Assessment of heavy metals contamination of paddy soil in Xiangyin county, China
17
6 Changes of soil organic carbon in different agro-ecological zones in China over 20 years
21
7 Clinoptilolite amendment to increase ammonium removal from landfill leachate in a clay loam soil
25
8 Comparison study between the methods for compost maturity determination
29
9 Connecting soil policies with plans to improve water quality – an example with acid sulfate soils from two north Queensland regions
32
10 Describing N leaching under urine patches in pastoral soils 34
11 Detecting a landfill leachate plume using a DUALEM-421 and a laterally constrained inversion model
38
12 Dicyandiamide (DCD) reduces nitrate losses from Irish soils 42
13 Effect of biosolids P removal treatment on P soil test and availability to corn
46
14 Effects of a urease inhibitor NBPT on the growth and quality of rape
50
15 ESP fly ash application effects on plant biomass and bioconcentration of micronutrients in nursery seedlings of Populus deltoides
54
16 Evidence of soil microbial population acclimatisation to long-term application of winery wastewater
57
17 Gully erosion stabilization in a highly erodible Kandiustalf soil 61
18 Impact of soil texture and organic matter content on mitc volatilization from soil columns
64

iii
Table of Contents (cont.)
Page
Table of Contents ii
19 Impacts of long-term intensive potato production and conservation terraces/grassed waterway on runoff hydrology and soil quality
68
20 Influence of adding Pb to soil on the growth of wheat seedlings 72
21 Influence of wastewater application and fertilizer use on the quality of irrigation water, soil and food crops: Case Studies from Northwestern India
76
22 Integrated nutrient management for sustainable crop production, improving crop quality and soil health, and minimizing environmental pollution
80
23 Investigation of nitrogen-fixing potential in soil bacterial microbiota from Lapland boreal forest limit
84
24 Long-term effects of black carbon on soil properties 87
25 Long-term tillage effects on bacterial biomass and community structure distribution within water stable aggregates
91
26 Managing forage-based cow-calf operations in subtropics: implication to surface and ground water quality
95
27 Mapping ‘unsuitability’ for de-rocking in Northwestern Syria 98
28 Mediator solution influence on the sorption potential of sulfo-conjugated estrogenic steroid hormone and its metabolite in New Zealand dairy farm soils
102
29 Mine landform cover design and environmental evaluation 106
30 Modeling of sediment yield and bicarbonate concentration in Kordan watershed, Iran
110
31 Modelling of water, sediment and phosphorus runoff: implications for grain cropping in southwest Australia
114
32 Modelling the role of DCD in mitigating nitrogen losses under grazed pastures
118
33 National acid sulfate soils identification, assessment and management short course
122
34 Nitrogen leaching from effluent irrigated pasture, on a vitrand (pumice soil), Taupo, New Zealand – initial results
126
35 Nutrient availability from anaerobic baffled reactor effluent for maize growth in three contrasting soils from KwaZulu-Natal, South Africa
130
36 Nutrient distribution in three contrasting soils after anaerobic baffled reactor effluent application: A soil column study
134
iv
Table of Contents (cont.)
Page
Table of Contents ii
37 Nutrient transport from various agricultural sources in the Pagsanjan-Lumban watershed in Laguna de Bay, Philippines
136
38 Organic carbon in topsoil from arable land and grazing land of Europe
139
39 Phosphorus export in runoff from a dairy pasture, laneway and watering trough
40 Phosphorus inflow into agricultural and urban soil: the perspective from food production and consumption in China
147
41 Present use and physical properties relationships in soils under mediterranean semiarid conditions
151
42 Quantifying the relative contribution of hillslope and channel erosion in water reservoir catchments of subtropical South East Queensland, Australia
154
43 Reducing nitrate leaching losses by using duration-controlled grazing of dairy cows
157
44 Relation of evaporation and transpiration to maintain plant production
161
45 Resistivity imaging across native vegetation and irrigated Vertosols of the Condamine catchment—a snapshot of changing regolith water storage
164
46 Reuse of wastewater for irrigation in Saudi Arabia and its effect on soil and plant
165
47 Sediment erosion research in the Fitzroy basin central Queensland: an overview
169
48 Soil carbon management and filtering of organic pesticides 171
49 Soil management and stream water quality at the agricultural catchment scale in Ireland
175
50 Soil physical changes of a coastal mudflat after wave breaker installation
179
51 Soil properties affecting pesticide leaching - application in groundwater vulnerability mapping in the Czech Republic
183
52 Sorption of sulfamethoxazole, sulfachloropyridazine and sulfamethazine onto six New Zealand dairy farm soils
187
53 Sources, characteristics, and management of agricultural dust, San Joaquin Valley, California, USA
191
54 Space-time monitoring of prescribed burnt soils performance – an effective tool for forest management
195

v
Table of Contents (cont.)
Page
Table of Contents ii
55 Stakeholders participation in watershed management for sustainable agriculture
199
56 Strategic thinking on soil protection in China 202
57 Technology development of soil fertility management based on understanding local agricultural systems of the Sahel in Niger, West Africa
206
58 The effect of PGPR strain on wheat yield and quality parameters 209
59 The evolution of soil salinization in the Yellow River Irrigation District of Ningxia, China during the period of 1958 to 2007
213
60 The potential for direct application of papermill sludge to land: a greenhouse study
217
61 The residual concentration of regular gasoline in unsaturated soil 221
62 Variation in soil heavy metal concentrations around and downstream of a municipal waste landfill
225
63 Examining phosphorus contributions from alluvial soils – a comparison of three Vermont, U.S.A. River corridors
228
64 Getting the soil pH profile right helps with weed control and sustainability
232
© 2010 19th World Congress of Soil Science, Soil Solutions for a Changing World 1 1 – 6 August 2010, Brisbane, Australia. Published on DVD.
A municipal scale eco-balance analysis of carbon and nitrogen cycle in Japanese
agriculture Sonoko D. KimuraA and Shin-Ichiro MishimaB AGraduate School of Agriculture, Department of International Environmental & Agricultural Science, Tokyo University of Agriculture and Technology, Tokyo, Japan, Email [email protected] BCarbon and Nutrient Cycles Division, National Institute for Agro-Environmental Sciences, Email [email protected]
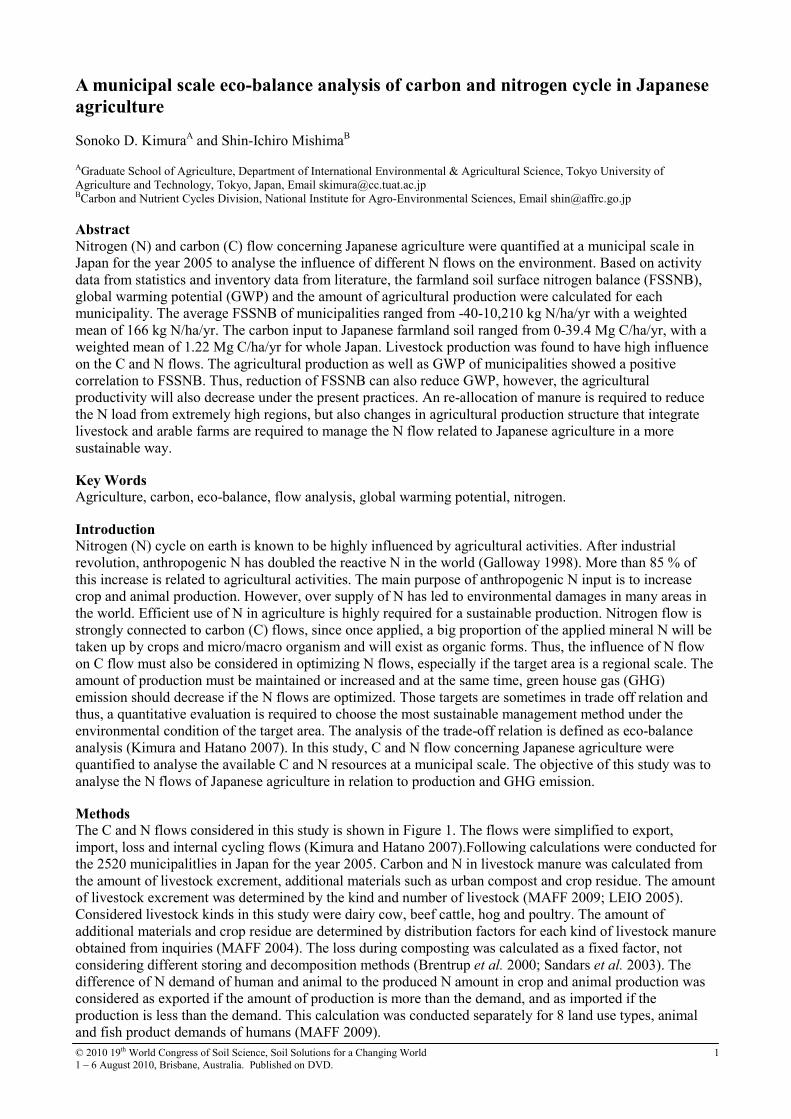
Abstract Nitrogen (N) and carbon (C) flow concerning Japanese agriculture were quantified at a municipal scale in Japan for the year 2005 to analyse the influence of different N flows on the environment. Based on activity data from statistics and inventory data from literature, the farmland soil surface nitrogen balance (FSSNB), global warming potential (GWP) and the amount of agricultural production were calculated for each municipality. The average FSSNB of municipalities ranged from -40-10,210 kg N/ha/yr with a weighted mean of 166 kg N/ha/yr. The carbon input to Japanese farmland soil ranged from 0-39.4 Mg C/ha/yr, with a weighted mean of 1.22 Mg C/ha/yr for whole Japan. Livestock production was found to have high influence on the C and N flows. The agricultural production as well as GWP of municipalities showed a positive correlation to FSSNB. Thus, reduction of FSSNB can also reduce GWP, however, the agricultural productivity will also decrease under the present practices. An re-allocation of manure is required to reduce the N load from extremely high regions, but also changes in agricultural production structure that integrate livestock and arable farms are required to manage the N flow related to Japanese agriculture in a more sustainable way. Key Words Agriculture, carbon, eco-balance, flow analysis, global warming potential, nitrogen. Introduction Nitrogen (N) cycle on earth is known to be highly influenced by agricultural activities. After industrial revolution, anthropogenic N has doubled the reactive N in the world (Galloway 1998). More than 85 % of this increase is related to agricultural activities. The main purpose of anthropogenic N input is to increase crop and animal production. However, over supply of N has led to environmental damages in many areas in the world. Efficient use of N in agriculture is highly required for a sustainable production. Nitrogen flow is strongly connected to carbon (C) flows, since once applied, a big proportion of the applied mineral N will be taken up by crops and micro/macro organism and will exist as organic forms. Thus, the influence of N flow on C flow must also be considered in optimizing N flows, especially if the target area is a regional scale. The amount of production must be maintained or increased and at the same time, green house gas (GHG) emission should decrease if the N flows are optimized. Those targets are sometimes in trade off relation and thus, a quantitative evaluation is required to choose the most sustainable management method under the environmental condition of the target area. The analysis of the trade-off relation is defined as eco-balance analysis (Kimura and Hatano 2007). In this study, C and N flow concerning Japanese agriculture were quantified to analyse the available C and N resources at a municipal scale. The objective of this study was to analyse the N flows of Japanese agriculture in relation to production and GHG emission. Methods The C and N flows considered in this study is shown in Figure 1. The flows were simplified to export, import, loss and internal cycling flows (Kimura and Hatano 2007).Following calculations were conducted for the 2520 municipalitlies in Japan for the year 2005. Carbon and N in livestock manure was calculated from the amount of livestock excrement, additional materials such as urban compost and crop residue. The amount of livestock excrement was determined by the kind and number of livestock (MAFF 2009; LEIO 2005). Considered livestock kinds in this study were dairy cow, beef cattle, hog and poultry. The amount of additional materials and crop residue are determined by distribution factors for each kind of livestock manure obtained from inquiries (MAFF 2004). The loss during composting was calculated as a fixed factor, not considering different storing and decomposition methods (Brentrup et al. 2000; Sandars et al. 2003). The difference of N demand of human and animal to the produced N amount in crop and animal production was considered as exported if the amount of production is more than the demand, and as imported if the production is less than the demand. This calculation was conducted separately for 8 land use types, animal and fish product demands of humans (MAFF 2009).
© 2010 19th World Congress of Soil Science, Soil Solutions for a Changing World 2 1 – 6 August 2010, Brisbane, Australia. Published on DVD.
Farmland
Main
product
Farmland
Human
Livestock Manure
By-
product
Export
Import Internal cycle
Loss
Figure 1. Carbon and nitrogen flows considered in this study.
The agricultural land use types were compiled to 8 categories; paddy rice, cereals (except paddy rice), root crops, beans, fodder crops, grass, vegetable and other crops (fruit, tee, sugar beets, sugar cane etc.). The amount of C and N of crops were calculated from the area, amount of yield (MAFF 2009) and their C and N concentration (Matsumoto 2000). The amount of residue of a given land use type is calculated using the ratio of residue to the yield (Matsumoto 2000). The allocation of manure to farmlands was calculated for paddy rice, upland crops and fodder crops, where upland included cereals (except paddy rice), root crops, beans, and vegetable and fodder crops included fodder crops and grass. The allocation to paddy rice, upland crops and fodder crops are based on farmer’s inquiry (MAFF 2004). The farmland soil surface N balance (FSSNB) was calculated as below: Soil surface N balance (kg N/ha/yr) = {Chemical fertilizer (Mg N/municipality/yr) + Biological N2 fixation (Mg N/municipality/yr)) + Atmospheric deposition (Mg N/municipality/yr) – Harvested N in crops (Mg N/municipality/yr)} / total farmland area of the municipality (ha)} --- (1) Nitrous oxide (N2O) emission from chemical fertilizer, livestock, manure and composting was calculated from the emission factors (GIO 2009). Methane (CH4) emission was calculated for paddy rice fields, manure and digestion of ruminants (GIO 2009). The decomposition of organic matter after application to the field was not considered in this study and the C input to farmland was considered as the mitigation potential. Global warming potential (GWP) for each GHG was considered (IPCC 2007) and the GHG mitigation potential was calculated as below; Green house gas mitigation (Mg CO2 eq/ha/yr-1) = {C input to farmland (Mg CO2 eq /municipal/yr) – N2O emission (Mg CO2 eq/municipal/yr) – CH4 emission (Mg CO2 eq/municipal/ yr)} / total farmland area of the municipal (ha)} --- (2) Results and discussion Farmland soil surface N balance
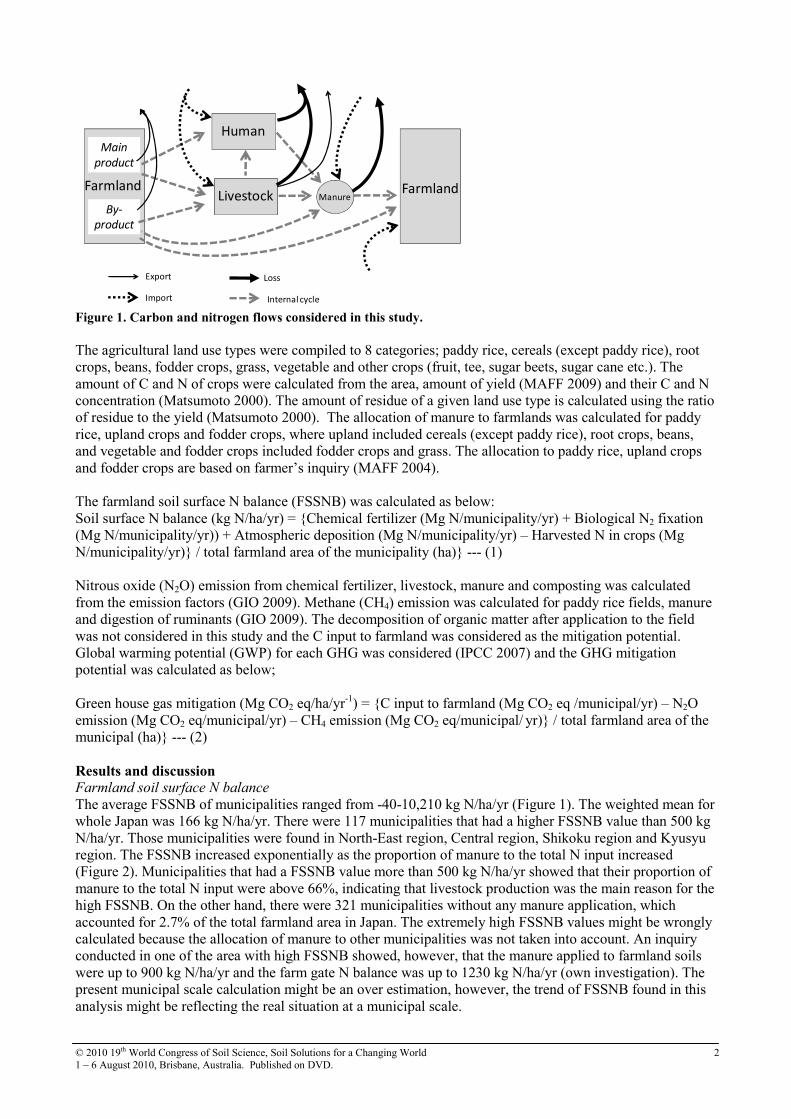
The average FSSNB of municipalities ranged from -40-10,210 kg N/ha/yr (Figure 1). The weighted mean for whole Japan was 166 kg N/ha/yr. There were 117 municipalities that had a higher FSSNB value than 500 kg N/ha/yr. Those municipalities were found in North-East region, Central region, Shikoku region and Kyusyu region. The FSSNB increased exponentially as the proportion of manure to the total N input increased (Figure 2). Municipalities that had a FSSNB value more than 500 kg N/ha/yr showed that their proportion of manure to the total N input were above 66%, indicating that livestock production was the main reason for the high FSSNB. On the other hand, there were 321 municipalities without any manure application, which accounted for 2.7% of the total farmland area in Japan. The extremely high FSSNB values might be wrongly calculated because the allocation of manure to other municipalities was not taken into account. An inquiry conducted in one of the area with high FSSNB showed, however, that the manure applied to farmland soils were up to 900 kg N/ha/yr and the farm gate N balance was up to 1230 kg N/ha/yr (own investigation). The present municipal scale calculation might be an over estimation, however, the trend of FSSNB found in this analysis might be reflecting the real situation at a municipal scale.
© 2010 19th World Congress of Soil Science, Soil Solutions for a Changing World 3 1 – 6 August 2010, Brisbane, Australia. Published on DVD.
-40 - 100
100 - 200
200 - 300
300 - 400
400 - 500
500 -
(kg N ha-1 yr-1)
0 20 40 60 80 100
0
2500
5000
7500
10000
12500
Soil surface nitrogen balance
(kgN/ha/yr)
Proportion of manure to the total
N input (%) Figure 2. Farmland soil surface nitrogen balance Figure 3. Relation of proportion of manure to the
of Japan in 2005 at a municipal scale. total N input and Soil surface nitrogen balance. Each
point stands for one municipality in Japan.
Carbon input to Japanese soil
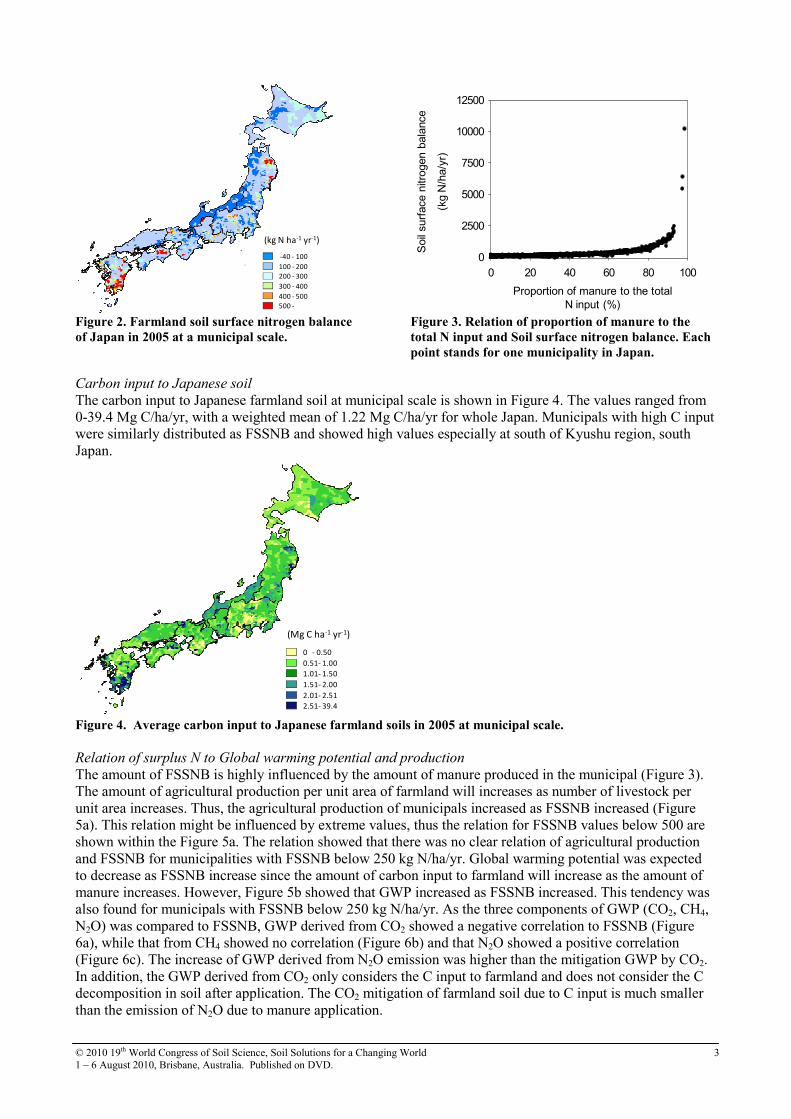
The carbon input to Japanese farmland soil at municipal scale is shown in Figure 4. The values ranged from 0-39.4 Mg C/ha/yr, with a weighted mean of 1.22 Mg C/ha/yr for whole Japan. Municipals with high C input were similarly distributed as FSSNB and showed high values especially at south of Kyushu region, south Japan.
0 - 0.50
0.51- 1.00
1.01- 1.50
1.51- 2.00
2.01- 2.51
2.51- 39.4
(Mg C ha-1 yr-1)
Figure 4. Average carbon input to Japanese farmland soils in 2005 at municipal scale. Relation of surplus N to Global warming potential and production
The amount of FSSNB is highly influenced by the amount of manure produced in the municipal (Figure 3). The amount of agricultural production per unit area of farmland will increases as number of livestock per unit area increases. Thus, the agricultural production of municipals increased as FSSNB increased (Figure 5a). This relation might be influenced by extreme values, thus the relation for FSSNB values below 500 are shown within the Figure 5a. The relation showed that there was no clear relation of agricultural production and FSSNB for municipalities with FSSNB below 250 kg N/ha/yr. Global warming potential was expected to decrease as FSSNB increase since the amount of carbon input to farmland will increase as the amount of manure increases. However, Figure 5b showed that GWP increased as FSSNB increased. This tendency was also found for municipals with FSSNB below 250 kg N/ha/yr. As the three components of GWP (CO2, CH4, N2O) was compared to FSSNB, GWP derived from CO2 showed a negative correlation to FSSNB (Figure 6a), while that from CH4 showed no correlation (Figure 6b) and that N2O showed a positive correlation (Figure 6c). The increase of GWP derived from N2O emission was higher than the mitigation GWP by CO2. In addition, the GWP derived from CO2 only considers the C input to farmland and does not consider the C decomposition in soil after application. The CO2 mitigation of farmland soil due to C input is much smaller than the emission of N2O due to manure application.

© 2010 19th World Congress of Soil Science, Soil Solutions for a Changing World 4 1 – 6 August 2010, Brisbane, Australia. Published on DVD.
Soil surface nitrogen balance (kg N/ha/yr)
Global warming potential
(Mg CO2eq/ha/yr)
-50
0
50
100
150
200
0 2500 5000 7500 1000012500
-5
0
5
10
15
0 250 500
0
10
20
30
40
0 2500 5000 7500 1000012500
Agricultural Production
(Mg C/ha/yr)
0
1
2
3
4
5
0 250 500
a) b)
Figure 5. Relation of a) agricultural production and b) global warming potential to farmland soil surface
nitrogen balance.
Soil surface nitrogen balance (kg N/ha/yr)
Global warming potential
(Mg CO2eq/ha/yr)
-175
-150
-125
-100
-75
-50
-25
0
0 2500 5000 75001000012500
0
2
4
6
8
0 2500 5000 75001000012500
0
50
100
150
200
250
300
350
0 2500 5000 75001000012500
a) b) c)
Figure 6. Relation of soil surface nitrogen balance to global warming potential of a) CO2, b) CH4 and c) N2O.
Conclusion The analysis of FSSNB in relation to amount of manure, agricultural production and GWP showed that the intensity of livestock production has a high influence on FSSNB. The calculated amount might be overestimated since the estimation was conducted at a municipal scale and the tendency rather than the amount should be discussed. The analysis showed that there is a positive relation of FSSNB to agricultural production and GWP. It indicates that the reduction of FSSNB can also reduce GWP, however, the agricultural productivity will decrease under the present practice. An re-allocation of manure is required to reduce the N load from extremely high regions, but also changes in agricultural production structure that integrate livestock and arable farms are required to manage the N flow related to Japanese agriculture more sustainably. References Brentrup F, Küstres J, Lammel J, Kuhlmann H (2000) Methods to estimate on-field nitrogen emissions from
crop production as an input to LCA studies in the agricultural sector. Int. J. LCA 5, 349–357. Galloway JN (1998) The global nitrogen cycle: Changes and consequences. Environ. Pollut. 102, 15-26. GLO: Green house gas inventory office (2009) Japanese inventory of Green house gas emission 2009, (Ed
GIO) pp 465 (CGER, Tokyo) IPCC: Intergovernmental Panel on Climate Change (2007) Climate Change 2007: The Physical Scientific
Basis. Chapter 2. (Eds S Solomon et al.) pp. 1-106. (Cambridge University Press, New York) Kimura SD Hatano R (2007) An Eco-Balance approach to evaluate the historical change in N loads caused
by agricultural land use change at a regional scale. Agric. Sys. 94, 165–176. LEIO: Livestock Industry’s Environmental Improvement Organization (2005) Handbook for livestock
manure treatment 2004. (Ed LEIO) pp202 (LEIO, Tokyo) MAFF: Ministry of Agriculture and Fishery (2004) Survey about present situation of sustainable production
environment for 2002, (Ed. Statistics Dept.) http://www.tdb.maff.go.jp/toukei/a02smenu?TouID=D002 MAFF (Ministry of Agriculture, Forestry and Fishery) (2009) Food Balance Sheets (Ed. Statistics Dept.)
http://www.tdb.maff.go.jp/toukei/a02smenu?TouID=H001 Matsumoto N (2000) Development of estimation method and evaluation of nitrogen flow in regional areas.
Bull. Natl. Inst. Agro-Environ. Sci. 18, 81–152 Sandars DL Audsley E, Canete C, Cumby TR, Scotford IM Williams AG (2003) Environmental Benefits of
Livestock Manure Management Practices and Technology by LCA. Biosyst. Eng. 84, p. 267–281
© 2010 19th World Congress of Soil Science, Soil Solutions for a Changing World 5 1 – 6 August 2010, Brisbane, Australia. Published on DVD.
A pragmatic water-balance based protocol for assessing water quality from
agricultural lands
David FreebairnA Dan RattrayB Mark SilburnC and Will HighamD AConics Ltd, Fortitude Valley, QLD, Australia, Email [email protected] BTreecrop Technologies, Toowoomba, QLD, Australia, Email [email protected] CDepartment Environment and Resource Management, Toowoomba, QLD, Email [email protected] DReef Catchments, Mackay, QLD, Email [email protected]
Abstract Poor water quality from agricultural lands has come into focus worldwide as the pressure for increased food production has pushed production to less stable environments and community attitudes demand more environmental accountability. Even in a dry continent like Australia, water quality attracts community attention when algal blooms occur in ephemeral streams and iconic natural assets such as the Great Barrier Reef (GBR) are threatened by poor water quality. In order to better allocate resources toward improved natural resource management, there is a need to quantify water quality signatures of alternative land use and management practices, along with impacts on receiving environments. A pragmatic approach to quantifying water quality is described. Application of water balance models support the merging of expertise from a range of disciplines and literature. Key Words Runoff, drainage, model, erosion, sediment, nutrient, pesticide, natural resources. Introduction Deterioration in water quality entering freshwater and marine systems has been attributed to agricultural worldwide. In most cases, agricultural practices have resulted in soil disturbance, exposure of bare soil and changes in water use patterns which increase loss of water as surface runoff and deep drainage. Changes in erosion rates and water quality have in many cases resulted in an order of magnitude increases in sediment and agri-chemical loads compared to natural systems.
A common feature of reports of field experiments dealing with water quality is that data are either incomplete (e.g. only some elements of water quality are reported), constrained by a short record or insufficient site descriptions are available to generalise results. Literature, while reporting detailed results at a range of temporal and spatial scales, often presents conclusions from experiments with disclaimers such as the experimental period being drier or wetter than the long term average. It is uncommon in NRM literature that simple annual averages of water balance and pollutant load are reported, making it difficult for quantitative evaluation of management options across locations, soil types and management options. In short, empirical studies are limited by the narrow range of conditions that have been observed, yet they can be used to inform more generalised relationships. Water balance models adapted to consider soil erosion, sediment, nutrient and pesticide losses offers a pathway to deal with these constraints.
The need for quantification
Evaluations of large public NRM investments in Australia have struggled to demonstrate impact after decades of investment by public and private sectors. In some cases this “lack of evidence” is a result of a variable climate making it difficult to observe changes in attributes such as water quality or it might be argued that investments were either misguided or inefficient, resulting in little change. This situation is unacceptable for investors who are seeking a quantitative basis for allocating resources and evaluating impacts. While management practices have been developed that reduce the impact of agriculture on soil and water resources, allocation of investment in natural resource management (NRM) is often based on qualitative evaluations of alternatives. From an economic viewpoint it stands to reason that we should know the impact of intervention options and costs associated with implementing changes. NRM agencies are being asked to quantify improvements in natural resource attributes such as water quality, beyond the traditional reporting of activities such as attendance at field days or number of farmers adopting “best practice”.

© 2010 19th World Congress of Soil Science, Soil Solutions for a Changing World 6 1 – 6 August 2010, Brisbane, Australia. Published on DVD.
This paper describes a relatively pragmatic approach, in that: it is physically based; uses best available information; can capture information from a range of disciplines; and is sufficiently rigorous to support decision making. The approach The principle behind a water balance driven approach is that pollutants are moved by water and an estimate of water flow is a basis for estimating water quality. Water balance models deal with water flows explicitly and when combined with descriptions of soil, vegetation and landscape features provide a physical basis for estimating water quality (Figure 1). Models can act as collections of summaries from experimental studies.
Figure 1. Schematic of an agricultural system showing some dynamics of vegetation cover, evapotranspiration,
soil water, runoff and deep drainage.
A time series of water flows can be combined with relationships from the literature and local empirical studies to provide estimates of soil, nutrient and pesticide movement. Figure 2 is a simple representation of the main factors involved in determining water quality from a specified land use and environment.
Figure 2 A function describing the main factors controlling water quality (WQ) at a paddock scale. Runoff and
slope are the driving forces for movement while cover describes the exposure and hydraulic roughness of the
surface. Cohesion describes the ease with which material can be dislodged while concentration describes the
amount of chemical available in the soil.
Water balance accounting is intrinsically conservative in that mass balance must be preserved. In most cases there are natural resets (saturated or completely dry) in a time series which adds stability through time. Well understood limits to estimates of water store sizes and rates provide further checks to simulation based estimates. For example, plant available water capacity (PAWC) of a soil is known with reasonable accuracy. When water inputs exceed PAWC, water must become either runoff or deep drainage. The allocation of water excess to runoff or drainage can be assessed based on soil properties, stream flow patterns and field observations. Typically, models operate on a daily time step, being the period of most common weather observation, although there are no intrinsic limitations to the length of time step (from seconds to weeks or months). Understanding how agricultural and pastoral systems function in a landscape is the domain of many disciplines. This requires an approach that can bring a breadth of knowledge to bear on solutions. Models provide a mechanism to bring together knowledge from a range of sources. For example, the processes presented in Figures 1 and 2 require an understanding of soil-climate-management interactions, pesticide and nutrient processes, hydrology and erosion.

© 2010 19th World Congress of Soil Science, Soil Solutions for a Changing World 7 1 – 6 August 2010, Brisbane, Australia. Published on DVD.
The process In order to apply water balance models to estimating water quality signatures, the following steps have been applied: • Develop conceptual models of water quality-management interactions based on experience from
literature and experts. This ensures the main management options are identified and provides an interface for discussion between land managers, scientists and modeller;
• Using subset of climate, soil and crop system combinations, apply model(s) to generate a 1st pass estimate of water quality signatures;
• Engage local experts (soil scientist, agronomist, water quality specialist, economists) to better describe systems, bring local data and experience to the Table and build local ownership (ask - are the water balance and water quality estimates sensible? Why not?)
• Refine model estimates based on local data and knowledge and summarise outputs • Summarise management options in terms of effectiveness in reducing pollutant loads and costs to
implement ($/reduction in load from baseline condition). Note that there is no requirement for collating detailed experimental data typical of most modelling exercises where intensive model tuning would occur; with statistics describing goodness of fit for several physical attributes e.g. biomass, hydrology and water quality. Model calibration is a necessary requirement for complete analysis of key datasets but it is impractical when best bet estimates of water quality are required for a number of management options in a short time frame with limited resources. Skills derived from detailed modelling are a preferred requirement for the process described here but the key requirement is the ability to synthesise data with a wide range of quality (sensibility testing), informed by water balance estimates and known relationships between land conditions, hydrology and water quality. For this exercise we used the Howleaky? model (Freebairn et al. 2003, McClymont et al. 2008), a derivative of PERFECT (Littleboy et al. 1992) and similar to APSIM (McCown et al. 1996). Howleaky? was chosen as the modelling environment as the authors were familiar with the model which is well informed by extensive field and laboratory studies of agri-chemical behaviour in the Queensland environment (e.g. Freebairn and Wockner 1986, Silburn 2003, Rattray et al. 2007). In summary, runoff and deep drainage are modelled essentially the same as in most water balance models. Transpiration is dealt with in a simpler manner than many models by describing a Leaf Area or green cover distribution through time rather than a fully dynamic crop growth model. This allowed us to efficiently capture expert opinion on growth habits of a wide range of vegetations while not compromising the basic elements of water balance accounting. Predictions of pesticide losses are based on concentration of pesticide in the soil which is a function of chemical half life. The amount of pesticide in soluble and sediment phases is dependent on the sorption coefficient of the chemical. Groundwater losses were not explicitly considered beyond estimates of accession to groundwater associated with deep drainage at the paddock scale. Risks of pesticide and nitrate accession to groundwater associated with deep drainage are described qualitatively based on estimates of chemical loads in the soil through time. Qualitative assessment of environmental toxicity can be made based on chemical properties, chemical loads and concentrations. A combination of load/concentration probabilities and toxicities provide an assessment of the relative performance of a range of land uses and management practices. Current practice is used as a benchmark for environmental performance. In practice, a water balance analysis requires accessing climate, soil and land use and management descriptions that are compatible with the model. Figure 3 provides a graphical view of inputs and outputs for a typical water balance analysis. One feature of any synthesis activity is that there will be many uncertainties and model output should not be viewed literally – it is a “best bet” estimate informed by water flows. Data is brought together from a range of sources. For example, soil descriptions may come from soil surveys from related landscapes, hydrological data from local or adjacent stream monitoring networks, descriptions of relationships between soil conditions and water quality from controlled plot studies or models such as the USLE (Wischmeier and Smith 1978), vegetation patterns from agronomists and farmers, and climate records from public databases. The quality and local relevance of inputs will be varied, yet together can provide a picture of site conditions, hydrologic and water quality responses. A water balance analysis adds value to these disparate data sources.

© 2010 19th World Congress of Soil Science, Soil Solutions for a Changing World 8 1 – 6 August 2010, Brisbane, Australia. Published on DVD.
Figure 3. Schematic of linkages in a water quality modelling environment between inputs (weather, vegetation
cover, soil hydrology and landscape), water balance and water quality outputs.
Conclusion Water balance models provide a well tested approach to bring data together from a wide range of sources in order to provide a credible set of estimates of water quality for a specified land use when little empirical data are available. Where empirical studies are limited in terms environmental conditions and land conditions, models are an efficient tool for “stretching” data and knowledge in time and space. To date, the application of water balance simulation has been in the hands of a few specialist “modellers”. The protocol presented here has been tested in the GBR catchments of eastern Australia, and while estimates of water quality are open for discussion and disagreement, the resulting estimates provide a defendable basis for assessing the efficiency of alternative management options for improving water quality at the farm scale. The process is relatively efficient and confidence in estimates will improve as more data and experience is brought to the Table. References Freebairn DM, McClymont D, Rattray D, Owens J, Robinson JB, Silburn DM. Howleaky? (2003) An
instructive model for exploring the impact of different land uses on water balance and water quality. Proc. 9th PUR$L National Conference, Yeppoon 29 Sept – 2 Oct 2003.
Freebairn DM, Wockner GH (1986) A study of soil erosion on vertisols of the eastern Darling Downs. II. The effect of soil, rainfall and flow conditions on suspended sediment. Australian J. Soil Research 24, 159-172.
Littleboy M, Silburn DM, Freebairn DM, Woodruff DR, Hammer GL, Leslie JK (1992) Impact of soil erosion on production in cropping systems. I. Development and validation of a simulation model. Aust. J.
Soil Res. 30,757-74.
McClymont D, Freebairn DM, Rattray DJ, Robinson JB. White S (2008) ‘Howleaky2008: Exploring water balance and water quality implication of different land uses’. Software V2.18. http://www.apsru.gov.au/apsru/.
McCown RL, Hammer GL, Hargreaves JNG, Holzworth D. Freebairn DM (1996) APSIM: A novel software system for model development, model testing, and simulation in agricultural systems research. Agric.
Systems 50, 255-71.
Rattray DJ, J. Standley J, Silburn DM, Freebairn, Spann KP (2007) Where does atrazine go when applied to a black Vertosol? Australian J. Soil Research 45, 598–606
Silburn DM (2003) Characterising Pesticide Runoff from Soil on Cotton Farms using a Rainfall Simulator. Unpublished Ph.D, Faculty of Agriculture, Food and Natural Resources, University of Sydney.
Wischmeier WH, Smith DD (1978) ‘Predicting rainfall erosion losses’. Agric. Handb. 537. (USDA. Agricultural Research Service: Washington, DC).
© 2010 19th World Congress of Soil Science, Soil Solutions for a Changing World 9 1 – 6 August 2010, Brisbane, Australia. Published on DVD.
A preliminary examination of the spatial distribution of acidic soil and required
rates of ameliorant in the Avon River Basin, Western Australia
Joel AndrewA and Chris GazeyB APrecision SoilTech, Belmont, WA, Australia, Email [email protected] B Department of Agriculture and Food, Western Australia, Northam, WA, Australia, Email [email protected] Abstract Soil acidity is a major constraint to agricultural production in the south-west of Western Australia. This paper will examine a simplistic approach to mapping the spatial distribution of soil acidity in the Avon River Basin (ARB) of Western Australia and discuss the implication this has on liming requirements in this region. Soil pHCa at 0.1 m intervals to a maximum depth of 0.3 m was analysed at 39480 locations across the ARB. The geo-location of these samples was recorded and soil pHCa distribution mapped using soil-landscape polygons. Nearly seven million hectares of topsoil (0–10 cm) is estimated to be extremely to moderately acidic (pHCa 4.3–5.5) and nearly four million hectares of shallow subsurface (10–30 cm) is estimated to be extremely to highly acidic (pHCa <4.8). At these levels of acidity, it is calculated that the ARB will require nearly twelve million tonnes of agricultural lime to increase the topsoil to pHCa 5.5 over a shallow subsurface of pHCa 4.8.
Key Words Soil acidity, Avon River Basin, spatial distribution, Western Australia.
Introduction Soil acidity has been shown to constrain productivity in cropping and pasture based agriculture, resulting in reduced plant biomass and lower crop yields (see Gazey and Andrew these proceedings; Hajkowicz and Young 2005). This reduction in plant biomass has financial consequences for growers and can lead to adverse and unsustainable events such as water and wind erosion, dryland salinity and loss of soil organic carbon. Current estimates of acidity in Western Australia may not accurately represent the extent of soil acidity in regions such as the ARB. This paper uses an existing soil database to more accurately quantify the current spatial extent and severity of soil pHCa of the ARB. Data used in this paper have only recently become available hence data analysis is still in the preliminary stages. The data are extracted from a three-year project, which was finalised in September 2009. Soil pHCa distribution maps and associated liming recommendations were completed in mid October 2009. It is planned that more detailed analysis will be carried out in the near future. Methods Data collection and analysis
Soil pHCa data used in this study were collected, and are held by, the commercial soil sampling company Precision SoilTech. All pH values presented were measured in 1:5 soil:0.01 M CaCl2. The samples were collected between 2000 and 2006 as part of Precision SoilTech’s commercial operations and between 2007 and 2009 as part of a project in partnership with the Department of Agriculture and Food, Western Australia and the Avon Catchment Council (Gazey and Andrew 2008; Gazey and Andrew 2009). Soil samples were collected using Precision SoilTech sampling machines, which consist of a vehicle-mounted vacuum system to lift samples from the soil profile. All samples were collected using the same sampling method of bulking 10 cores over a 3 m x 10 m area at each sampling location. Each location was recorded using a Rinex Saturn HBox guidance computer in datum GDA94.
Spatial analysis
Soil-landscape map polygons developed by Schoknecht, Tille and Purdie (2004) were used to produce soil pHCa distribution maps. Sample geo-location, soil pHCa and soil-landscape polygons were viewed and intersected using Geomedia (Intergraph). The average soil pHCa was calculated at each soil-landscape polygon for each sampling depth (0–10 cm, 10–20 cm and 20–30 cm). Not all soil-landscape polygons contained sampling locations. Those polygons that did contain sites were given the average pHCa of the samples collected within it and were termed ‘Level 1’ polygons. Those that did not contain sampling

© 2010 19th World Congress of Soil Science, Soil Solutions for a Changing World 10 1 – 6 August 2010, Brisbane, Australia. Published on DVD.
locations, though were part of a collective soil-landscape unit or sub-system (see Schoknecht, Tille and Purdie 2004), were given the average soil pHCa of all the points that were contained within that sub-system and termed ‘Level 2’ polygons. If no sampling locations were contained by any polygon that made up a sub-system it was given a ‘null’ value (Figure 1). The resulting Table was joined to the soil-landscape polygon feature and thematic layers created (Figure 2).
Figure 3. The Avon River Basin of Western Australia showing the soil pHCa sampling locations used in this
study. Coloured polygons represent the various polygon levels of data.
Liming recommendations Liming recommendations were developed for each individual polygon based on the soil pHCa of each sampling layer available. As not all polygons had shallow sub-surface (10–20 cm and/or 20–30 cm) pHCa information recorded, three separate liming recommendation calculations were used (Table 1). The soil acidity management tool Optlime (O’Connell 2008) was used to assess the suitability of these calculations.
Table 1. Liming recommendations for individual soil-landscape polygons were calculated using the following
criteria. A simple formulae was used which summed the pHCa values for each polygon. As not all polygons had
soil pHCa information collected at each depth, there are three formula that were used. i) 0–10 cm pHCa data only,
ii) 0–10 cm and 10–20cm only, iii) 0–10 cm and 10–20cm and 20–30 cm data available.
Criteria for given lime requirement based on pHCa data available Calculated lime requirement (t/ha)
IF 0–10cm only ∑ pHCa
(IF 0–10 cm + 10–20 cm only) ∑ pHCa
(0–10 cm + 10–20 cm + 20–30 cm) 0 > 5.9 > 12.0 > 16.8 1 > 5.3 > 10.2 > 14.9 2 > 4.8 > 9.90 > 14.2 3 > 4.6 > 8.40 > 13.4 4 >3.86 >7.90 > 12.4 5 - > 7.5 > 11.4
Results Soil pHCa distribution in the Avon River Basin
The vast majority of the topsoil in the Avon River Basin has been estimated to be acidic (pHCa <7) and is widespread across the entire Avon River Basin. Almost 80% of the 0–10 cm soil layer is pHCa <5.5 with over 11% pHCa <4.8. Less than 1% of the soil area was estimated to be neutral or alkaline (Table 2). Soil acidity is not restricted to any particular soil group, though any light textured soil (Sandy Duplex, Duplex Sandy gravel, Yellow Sandy Earth) is generally acidic. Areas of higher pHCa are generally found in the eastern regions of the ARB and are dominated by the Saline Wet and Calcareous Loamy Earth soil groups (Figure 2a).
© 2010 19th World Congress of Soil Science, Soil Solutions for a Changing World 11 1 – 6 August 2010, Brisbane, Australia. Published on DVD.
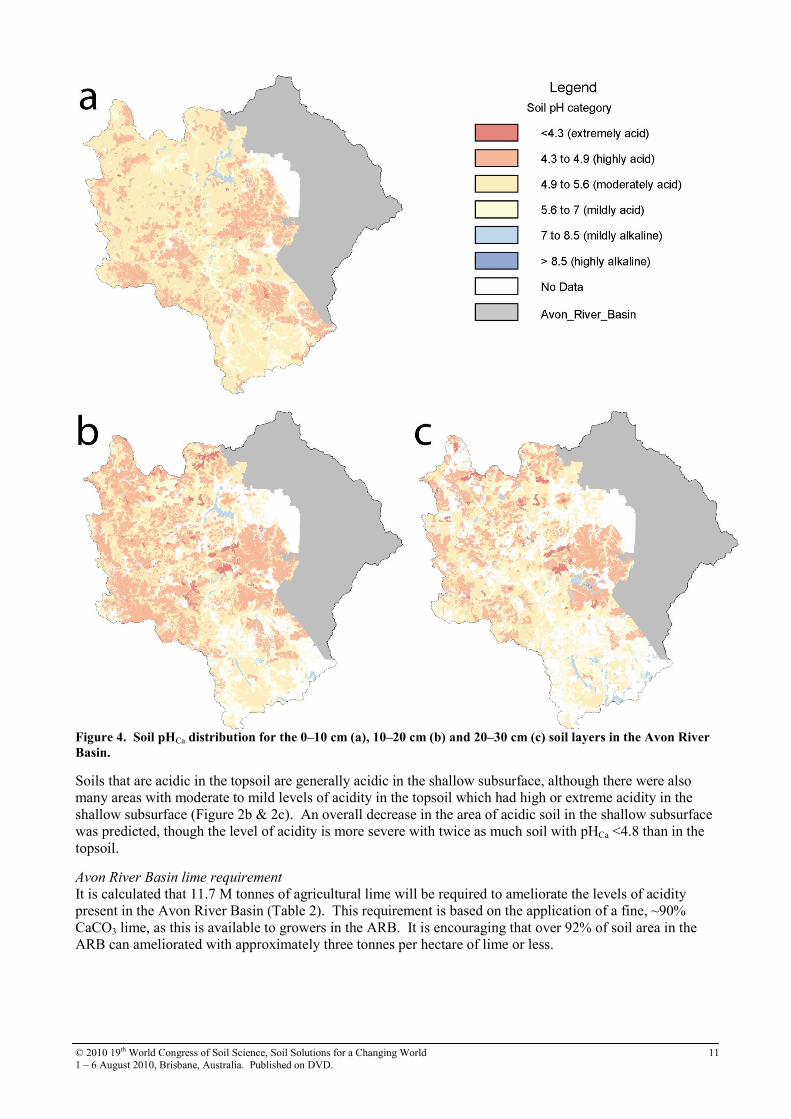
Figure 4. Soil pHCa distribution for the 0–10 cm (a), 10–20 cm (b) and 20–30 cm (c) soil layers in the Avon River
Basin.
Soils that are acidic in the topsoil are generally acidic in the shallow subsurface, although there were also many areas with moderate to mild levels of acidity in the topsoil which had high or extreme acidity in the shallow subsurface (Figure 2b & 2c). An overall decrease in the area of acidic soil in the shallow subsurface was predicted, though the level of acidity is more severe with twice as much soil with pHCa <4.8 than in the topsoil.
Avon River Basin lime requirement
It is calculated that 11.7 M tonnes of agricultural lime will be required to ameliorate the levels of acidity present in the Avon River Basin (Table 2). This requirement is based on the application of a fine, ~90% CaCO3 lime, as this is available to growers in the ARB. It is encouraging that over 92% of soil area in the ARB can ameliorated with approximately three tonnes per hectare of lime or less.

© 2010 19th World Congress of Soil Science, Soil Solutions for a Changing World 12 1 – 6 August 2010, Brisbane, Australia. Published on DVD.
Table 2. Summary of the severity and extent of soil acidity in the Avon River Basin. Soil acidity classifications
are based on the National Land and Water Resources Audit (2001).
Topsoil (0–10 cm) Midsoil (10–20 cm) Subsoil (20–30 cm) NLWRA Category Area (Ha) % of area
in ARB Area (Ha) % of area
in ARB Area (Ha) % of area
in ARB extremely acid (< 4.3) 8,830 0.1 149,370 1.8 129,659 1.6 highly acid (4.3–4.8) 969,046 11.6 1,896,884 22.8 1,370,132 16.5 moderately acid (4.8–5.5) 5,504,830 66.1 3,167,187 38.0 2,637,569 31.7 mildly acid (5.5–7.0) 1,129,860 13.6 1,219,923 14.6 1,266,682 15.2 mildly alkaline (7.0–7.7) 45,333 0.5 59,274 0.7 98,259 1.2 moderately alkaline (7.7–8.5) 32,608 0.4 30,980 0.4 52,905 0.6 highly alkaline (>8.5) 0 0.0 0 0.0 0 0.0 No Data 638,266 7.7 1,805,157 21.7 2,773,568 33.3 Total 8,328,773 100 8,328,773 100 8,328,773 100
Table 3. Calculated agricultural lime requirements to treat current levels of acidic soil in the Avon River Basin.
Estimated lime recommendation (t/ha)
Soil area (ha) Required amount of lime (tonnes)
0 1,231,017 0 1 2,957,559 2,957,559 2 1,895,819 3,791,637 3 1,384,286 4,152,857 4 220,751 883,005 5 1,076 5,380 No Data 638,266 - Total 8,328,773 11,790,438
Conclusion This preliminary examination indicates that soil acidity is widespread throughout the ARB and is at, or approaching, levels likely to cause losses in agricultural production. In many situations, it is estimated that a 1–4 t/ha application of lime will ameliorate present topsoil and/or subsurface soil acidity, and ongoing liming will be needed to counteract ongoing acidification. The profitability of liming, amount of lime needed and period of time required to ameliorate acidity, should still be assessed by individual land managers. This study highlights the potential for further analysis to be conducted on agricultural regions to the north and south of the Avon River Basin. References Gazey C, Andrew J (2008) Soil Acidity—Identification of contributing land management practices and
options. Final report project 04A1-08. (Department of Agriculture and Food, Western Australia). http://www.avonnrm.org.au/reports_publications/Soil_Acidity/SAR/
Gazey C, Andrew J (2009) Optimising soil pH for sustainable farm practices. Final report project CFOC: 08A-07. (Department of Agriculture and Food, Western Australia, in press).
Hajkowicz S, Young M (2005) Costing yield loss from acidity, sodicity and dryland salinity to Australian Agriculture. Land Degradation and Development 16, 417-433.
O’Connell M (2008) Optlime–a bioeconomic model of soil acidity management in agricultural systems Version 2008. In ‘Final report Revision of ‘Optlime’ NLP Soil Health Extension Project 053039e’. (Department of Agriculture and Food, Western Australia).
Schoknecht N, Tille P, Purdie B (2004) Soil-landscape mapping in south-western Australia. Overview and methodology and outputs. Technical Report 280. (Department of Agriculture, Western Australia)

© 2010 19th World Congress of Soil Science, Soil Solutions for a Changing World 13 1 – 6 August 2010, Brisbane, Australia. Published on DVD.
Application of soil survey to assess phosphorus loss by runoff from agricultural
watersheds
Moustafa ElrashidiA and Larry WestA
AUSDA-NRCS, National Soil Survey Center, Lincoln, NE 68508, USA, Email [email protected], Email [email protected]
Abstract The loss of nutrients in runoff from agricultural land is a major cause of poor surface water quality in the United State. Scientists (NRCS) developed a technique to estimate the impact of agricultural watersheds on natural water resources. The objectives of this study were to apply this technique on the Wagon Train (WT) watershed (Lancaster County, Nebraska) to predict: loss of phosphorus (P) from soils by runoff, and P loading for WT reservoir. The predicted annual P loss by runoff was 844 kg and could be considered as the annual loading for WT reservoir. The predicted P concentration in the runoff water at field sites was 196 µg/L. The average P concentration in water samples taken from different locations in the reservoir was 140 µg/L . The average P concentration observed in the main stream samples for the entire rainy season (March through October), ranged between 157 and 346 µg/L with an average of 267 µg/L (SD = 65 µg/L). Application of P fertilizers (April/May) for summer crops might explain the increase in P concentration. When factors affecting P concentration in streams are considered, the technique could provide a reasonable estimation of P concentration in stream water.
Key Words Runoff phosphorus, runoff water, agricultural watershed. Introduction Managing nonpoint sources of contamination from agricultural land is technically complex. Contamination sources often are located over a large geographic area and are difficult to identify. Identifying hot spots within a watershed enables more efficient use of funds to alleviate potential problems and protect water resources. The NRCS developed an exploratory technique (Elrashidi et al. 2003; 2005; 2008) to estimate P loss by runoff for agricultural watersheds. The NRCS technique applies the USDA runoff curve number (USDA/SCS 1991) to estimate loss of runoff from soils by rainfall. The technique assumes that dissolved P is lost from a specific depth of surface soil that interacts with runoff and leaching water. Geographical Information Systems, GIS (ESRI 2006) are used to present data spatially in watershed maps. The objective was to apply the NRCS technique on Wagon Train (WT) watershed in southeast Nebraska to estimate P loss from soils by runoff and loading in WT reservoir. Methods Estimation of Runoff Water
Rainfall is the primary source of water that runs off the surface of small agricultural watersheds. The main factors affecting the volume of rainfall that runs off are the kind of soil and the type of vegetation in the watershed (USDA/SCS, 1991). The runoff equation can be written as follows: Q = {R – [2(100 – CN)/ CN]}2 ÷ {R + [8(100 – CN)/CN]} (1) Where : Q = runoff (inches), R = effective rainfall (inches), CN is runoff curve number which is dependent on both the hydrologic soil group and type of land cover. The hydrologic groups of the major soils are used to determine CN’s for different land covers in the watershed.
Soil & water sampling
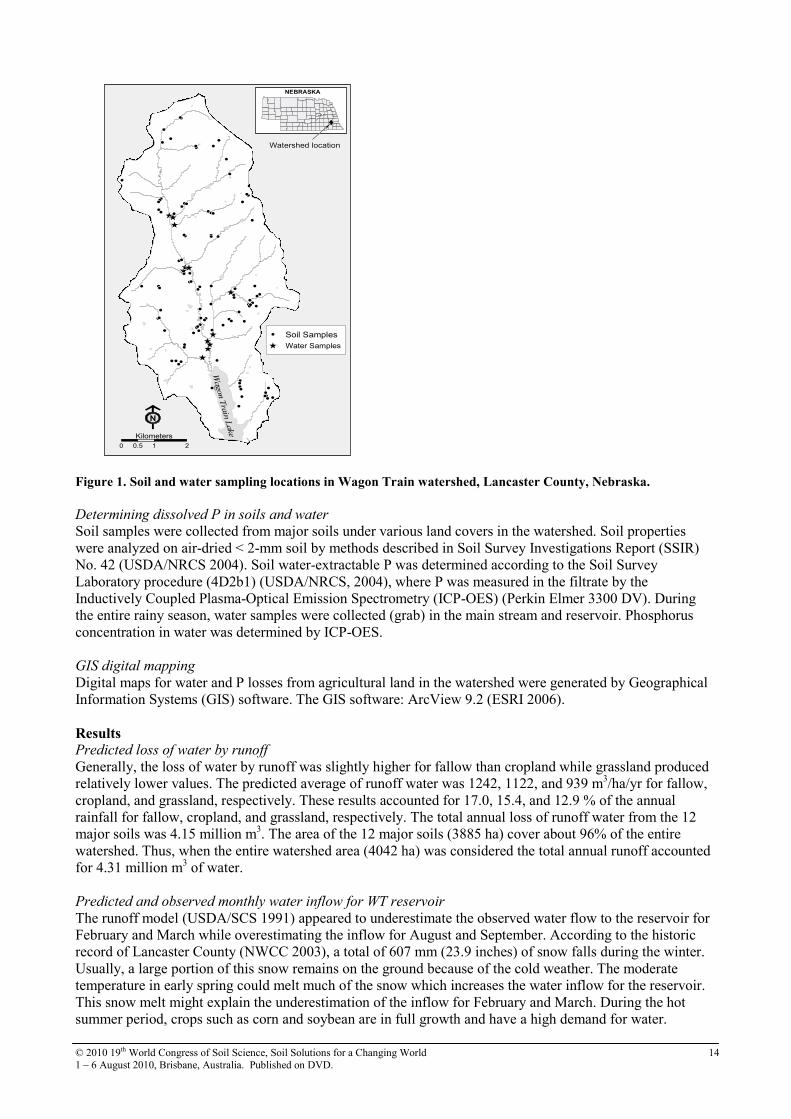
Wagon Train (WT) watershed lake is a 128-hectare (315-acre) reservoir. The total drainage area encompass 4,042 hectare (9,984 acre) of agricultural land. Most of the area (70%) is cultivated with crops while the rest of the watershed is covered with grassland. We used the Soil Survey Report of Lancaster County, Nebraska (Brown et al. 1980) to determine the major soil series in WT watershed. In total, 72 soil samples from cropland and 24 from grassland were collected. Water samples taken along the main stream were assumed to represent the surface water runoff generated from the entire watershed. During the rainy season period from April to October, monthly samples were collected from three locations along the main stream and the reservoir. The soil and water sampling locations are shown in Figure 1.
© 2010 19th World Congress of Soil Science, Soil Solutions for a Changing World 14 1 – 6 August 2010, Brisbane, Australia. Published on DVD.
�
���
������
�
�
���
�
��
�
�� �
����� �
����
�� �� �
���
���
�
�
��
��
��
���
����
�
��� � ���
�� �
���
�
���
��
�
��
����
�����
��� ���
��
�
� ��
�
��
����
��
�
�
�
Wagon T
rain
Lake
0 1 20.5
Kilometers
�
NEBRASKA
Watershed location
N
� Water Samples
� Soil Samples
Figure 1. Soil and water sampling locations in Wagon Train watershed, Lancaster County, Nebraska.
Determining dissolved P in soils and water
Soil samples were collected from major soils under various land covers in the watershed. Soil properties were analyzed on air-dried < 2-mm soil by methods described in Soil Survey Investigations Report (SSIR) No. 42 (USDA/NRCS 2004). Soil water-extractable P was determined according to the Soil Survey Laboratory procedure (4D2b1) (USDA/NRCS, 2004), where P was measured in the filtrate by the Inductively Coupled Plasma-Optical Emission Spectrometry (ICP-OES) (Perkin Elmer 3300 DV). During the entire rainy season, water samples were collected (grab) in the main stream and reservoir. Phosphorus concentration in water was determined by ICP-OES.
GIS digital mapping
Digital maps for water and P losses from agricultural land in the watershed were generated by Geographical Information Systems (GIS) software. The GIS software: ArcView 9.2 (ESRI 2006).
Results Predicted loss of water by runoff
Generally, the loss of water by runoff was slightly higher for fallow than cropland while grassland produced relatively lower values. The predicted average of runoff water was 1242, 1122, and 939 m3/ha/yr for fallow, cropland, and grassland, respectively. These results accounted for 17.0, 15.4, and 12.9 % of the annual rainfall for fallow, cropland, and grassland, respectively. The total annual loss of runoff water from the 12 major soils was 4.15 million m3. The area of the 12 major soils (3885 ha) cover about 96% of the entire watershed. Thus, when the entire watershed area (4042 ha) was considered the total annual runoff accounted for 4.31 million m3 of water. Predicted and observed monthly water inflow for WT reservoir
The runoff model (USDA/SCS 1991) appeared to underestimate the observed water flow to the reservoir for February and March while overestimating the inflow for August and September. According to the historic record of Lancaster County (NWCC 2003), a total of 607 mm (23.9 inches) of snow falls during the winter. Usually, a large portion of this snow remains on the ground because of the cold weather. The moderate temperature in early spring could melt much of the snow which increases the water inflow for the reservoir. This snow melt might explain the underestimation of the inflow for February and March. During the hot summer period, crops such as corn and soybean are in full growth and have a high demand for water.
© 2010 19th World Congress of Soil Science, Soil Solutions for a Changing World 15 1 – 6 August 2010, Brisbane, Australia. Published on DVD.
Further, the high temperature and low relative humidity could dry the surface soil and increase evapotranspiration by plants. These combined factors could reduce the runoff and reservoir inflow and thus explain the overestimation for August and September. The underestimation in early spring appeared to offset the summer’s overestimation and kept the predicted annual runoff water (4.31 million m3) in good agreement with the observed annual inflow (4.25 million m3). Predicted P loss by runoff
The average annual runoff P was 243 g/ha for fallow, 217 g/ha for cropland and 190 g/ha for grassland in the watershed. No large livestock feedlots or intensive cattle grazing are currently present in the WT watershed area. Phosphorus fertilizer (50-60 kg P2O5/ha) is usually applied to cropped soils during the preparation for summer crop while grassland soils receive smaller amounts and less frequent fertilizer application as well as occasional animal-waste additions. The fact that the soil sampling had been completed prior to fertilizer application might explain the relatively low P content found particularly for cropped soils and runoff waters. Predicted monthly P loading
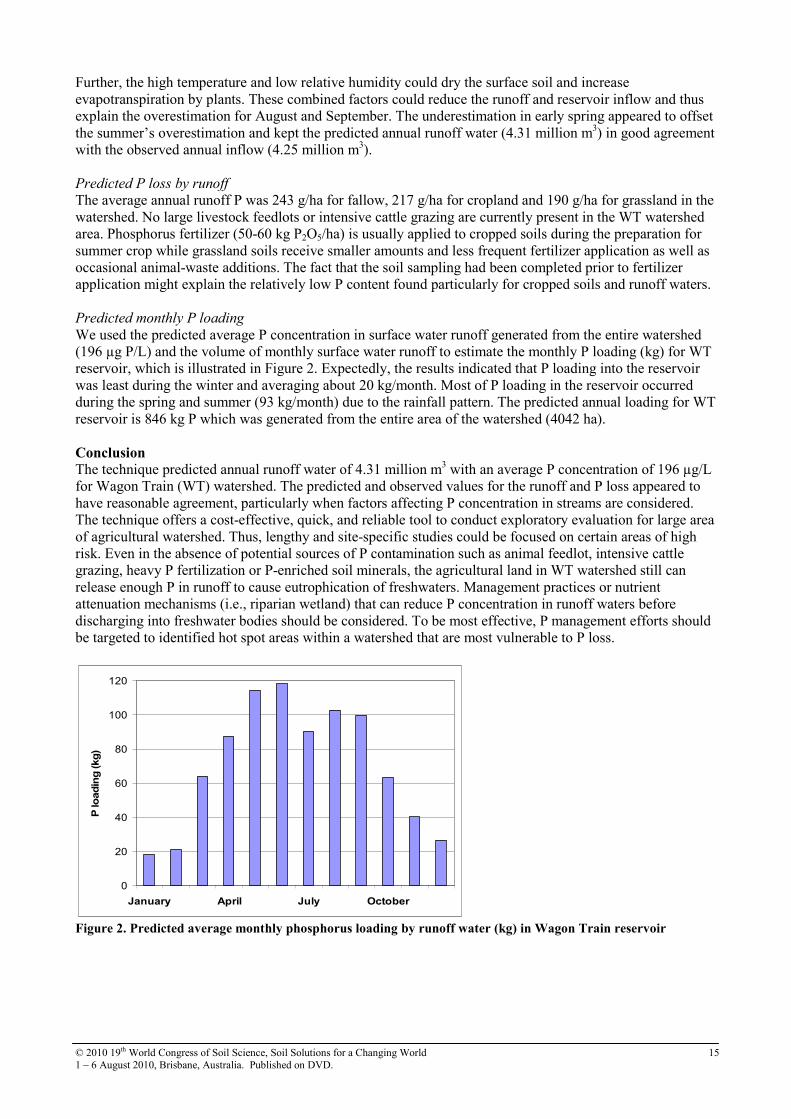
We used the predicted average P concentration in surface water runoff generated from the entire watershed (196 µg P/L) and the volume of monthly surface water runoff to estimate the monthly P loading (kg) for WT reservoir, which is illustrated in Figure 2. Expectedly, the results indicated that P loading into the reservoir was least during the winter and averaging about 20 kg/month. Most of P loading in the reservoir occurred during the spring and summer (93 kg/month) due to the rainfall pattern. The predicted annual loading for WT reservoir is 846 kg P which was generated from the entire area of the watershed (4042 ha). Conclusion The technique predicted annual runoff water of 4.31 million m3 with an average P concentration of 196 µg/L for Wagon Train (WT) watershed. The predicted and observed values for the runoff and P loss appeared to have reasonable agreement, particularly when factors affecting P concentration in streams are considered. The technique offers a cost-effective, quick, and reliable tool to conduct exploratory evaluation for large area of agricultural watershed. Thus, lengthy and site-specific studies could be focused on certain areas of high risk. Even in the absence of potential sources of P contamination such as animal feedlot, intensive cattle grazing, heavy P fertilization or P-enriched soil minerals, the agricultural land in WT watershed still can release enough P in runoff to cause eutrophication of freshwaters. Management practices or nutrient attenuation mechanisms (i.e., riparian wetland) that can reduce P concentration in runoff waters before discharging into freshwater bodies should be considered. To be most effective, P management efforts should be targeted to identified hot spot areas within a watershed that are most vulnerable to P loss.
0
20
40
60
80
100
120
January April July October
P loading (kg)
Figure 2. Predicted average monthly phosphorus loading by runoff water (kg) in Wagon Train reservoir
© 2010 19th World Congress of Soil Science, Soil Solutions for a Changing World 16 1 – 6 August 2010, Brisbane, Australia. Published on DVD.
References Brown LE, Quandt L, Scheinost S, Wilson J, Witte D, Hartung S (1980) Soil Survey of Lancaster County,
Nebraska. U.S. Dept. of Agriculture, Soil Conservation Service, pp.1-174.
Elrashidi MA, Mays MD, Jones PE (2003). A technique to estimate release characteristics and runoff phosphorus for agricultural land. Commun. Soil Sci. Plant Anal. 34, 1759-1790.
Elrashidi MA, Mays MD, Harder JL, Schroeder D, Brakhage P, Peaslee SD, Schaecher C (2005) Loss of phosphorus by runoff for agricultural watersheds. Soil Sci. 170, 543-558.
Elrashidi, MA, Seybold CA, Wysocki DA, Peaslee SD, Ferguson R, West LT (2008) Phosphorus in runoff from two watersheds in Lost River Basin, West Virginia. Soil Sci. 173, 792-806.
ESRI (2006) Environmental Systems Research Institute, ArcGIS Version 9.2 [Online]. Available at http://www.esri.com
NWCC (2003) National Water & Climate Center. http: //www.WCC.NRCS.gov/water/W_
CLIM.html
USDA/NRCS (2004) Soil Survey Laboratory Methods Manual. Soil Survey Investigations Report No. 42, Version No. 4 . USDA-NRCS, Washington, DC.
USDA/SCS (1991) National Engineering Field Manual. Chapter 2: Estimating Runoff and Peak Discharges.
USDA-NRCS, Washington, D.C. pp. 1-19.
USGS (2001) Platte river basin, Lower Platte River Basin, Salt Creek at Roca. In ‘Water resource Data, Nebraska water year 2000’. Water-Data Report NE-00-1, pp. 180-181. (U.S. Department of the Interior, USGS, Washington, DC).

© 2010 19th World Congress of Soil Science, Soil Solutions for a Changing World 17 1 – 6 August 2010, Brisbane, Australia. Published on DVD.
Assessment of heavy metals contamination of paddy soil in Xiangyin county,
China Laiyuan ZhongA,B, Liming LiuA,C and Jiewen YangB
ADepartment of Land Resources Management, College of Resources and Environment, China Agricultural University. BCollege of Agronomy, Guangdong Ocean University, Zhanjiang, 524088, China. CCorresponding author. Email [email protected] Abstract A field survey was conducted to investigate the heavy metal contamination of paddy soils in Xiangyin County, China. The total concentration of Cd, Pb, Zn, Cu, Cr and Ni in paddy soil was measured, and the environmental quality of paddy soil was assessed using pollution index methods. Paddy soils were slightly polluted with the content of Cd exceeding the standard value. The moderately polluted soils were mainly distributed in the land-reclamation area from Dongting Lake, and slight pollution was found in the eastern hilly area. Key Words Paddy soil, heavy metal contamination, Xiangyin county. Introduction In China, heavy metal contamination in soils has attracted serious attention in recent years, which poses a considerable hazard to health (Cheng 2003; Zhao 2004). After long-term application of untreated wastewaters, significant amounts of heavy metals can accumulate in the soil at toxic levels. At present, heavy metals, such as Cr, Zn, Pb, Cd, Ni, etc., are commonly found in subsurface soil irrigated with wastewater. Once the adsorption sites of the soil for heavy metals is saturated, more heavy metals would be distributed in the aqueous phase and the bioavailability of heavy metals would subsequently be enhanced (Sridhara et al. 2008). The accumulation of heavy metals in agricultural soils has been a wide concern of the public as well as governmental agencies, due to the food safety issues and potential health risks as well as its detrimental effects on soil ecosystems (McLaughlin et al. 1999; Yanez et al. 2002). Combined pollution with heavy metals has frequently been reported in many contaminated sites in China, such as in Wenzhou, Zhejiang Province (Jin et al. 2002). As a very toxic element, Cd is of primary concern in soil and food contamination, particularly in the rice cropping system (Reeves and Chaney 2001). These potentially toxic elements accumulate in soils and induce a potential contamination of food chain and endanger the ecosystem safety and human health (Reynders et al. 2008). Sources of heavy metals in soils mainly include natural occurrence derived from parent materials and human activities (anthropogenic sources). Anthropogenic inputs are associated with industrialization and agricultural activities such as atmospheric deposition, waste disposal, waste incineration, urban effluent, vehicle exhausts, fertilizer application and long-term application of sewage sludge in agricultural land (Bilos et al. 2001; Hlavay et al. 2001; Koch and Rotard 2001). Pollution index methods have been widely used to assess soil environmental quality. The methods employ definite limit to differentiate and quantify the extent of soil pollution (He et al. 2007). Accordingly, the objectives of this study were to assess heavy metals contamination of paddy soil by using pollution index methods and to analyse the spatial distribution character of heavy metal contamination of paddy soil. Methods Soil sampling
The studying site is located in Xiangyin(Long. 112°30′-113°02′E and Lat. 28°30′-29°03′N), Hunan Province, China, and has an area of 1582 km2, with Xiangjiang River, the largest river of this province, flowing across its centre. The river has seriously suffered from heavy metals pollution during the past decades due to the improper disposal of waste water from chemical factories and smelting plants. Although these factories have been legally closed by local governments in recent years, heavy metals accumulated in river sediments still poses a threat to the environment and health once they are released to soils by irrigation. To fully assess the status of heavy metals in agricultural soils, 99 soil samples, uniformly distributed in space, were collected from the 0-20 layer. The sample sites as seen in Figure 1 and positioned by use of hand-held GPS equipment. The soil samples were air-dried and ground in an agate mortar to pass through a 100-mesh sieve prior to chemical analysis.

© 2010 19th World Congress of Soil Science, Soil Solutions for a Changing World 18 1 – 6 August 2010, Brisbane, Australia. Published on DVD.
Figure 1. Location of the sample points.
Analytical Methods
Analysis of soil samples for total heavy metals were conducted based on the Environmental Monitoring of China Method. Briefly, 0.5g of soil were placed in a 50 mL Teflon crucibles, mixed with 10 mL of HCl and heated on a hot plate for about 2h until the digestion liquid has evaporated to approximately 3 mL. After cooling, 5 mL of concentrated HNO3, 5 mL of concentrated HF and 2 mL of concentrated HClO4 were consequently added and the digestion liquid was continuously reheated until no further oxidation of the sample was observed. After cooling, 1 mL of 1:5 HNO3/H2O was added to the digestion liquid and heated for 15 min at 95℃. The clear digests were diluted to 50 mL with distilled water and filtered into 100 mL plastic bottles. Metal concentrations were determined using a Hitachi atomic absorption spectrophotometer (Z-2300/2700). All standards and samples were analyzed in duplicate and mean values were shown. Calculation formulas of pollution index methods
Two pollution index methods such as single-factor index and Nemero Comprehensive Index (NCI) method were employed to evaluate the environmental quality of the polluted soils. The calculation of the single factor index method can be expressed as:
/i i iP C S= (1) and the mathematical formula of the Nemero comprehensive index method is:
( )2
2
1
1max
2
n
i i
i
P Pn
P=
+
=∑
(2) where Pi is the pollution index of heavy metal i; Ci (mg/kg) is the actual monitoring data of heavy metal i; Si (mg/kg) is the environmental value; P is the Nemero comprehensive pollution index. Assessment criteria were established based on the National Environmental Quality Standards of China (GB15618-1995). The soil quality was classified on five levels: class I, excellent; class II, clean; class III, slightly polluted; class IV, moderately polluted; and class V, heavily polluted (Table 1). Table 1. Assessment standard of soil Nemerow synthetical contamination index.
Class NCI (P) Pollution Level I P≤0.7 excellent II 0.7<P≤1.0 clean III 1<P≤2.0 slightly polluted IV 2.0<P≤3.0 moderately polluted V P>3.0 heavily polluted
Results Descriptive statistics and general variation in soil heavy metals
Table 2 shows the descriptive statistics for Pb, Cd, Cr, Ni, Cu and Zn on the analyzed sampling dates. All the mathematical and statistical computations were made using Statistical Package for Social Sciences (SPSS® (Statistical Package for Social Studies) version 6.1, USA. Professional Statistics 6.1, 385, Marija J. Norusis/SPSS Inc., Chicago 1995). The CVi of these data are in the following sequence: Zn > Cd > Pb > Cu > Ni > Cr.

© 2010 19th World Congress of Soil Science, Soil Solutions for a Changing World 19 1 – 6 August 2010, Brisbane, Australia. Published on DVD.
Table 2. Statistical Table of heavy metal content of paddy soil in Xiangyin county (mg/kg).
Ci Pb Cd Cr Ni Cu Zn criteria 250 0.3 250 40 50 200 Range 30.97-81.56 0.28-1.19 25.41-77.715 11.165-58.145 12.855-50.18 45.565-277.165 mean 55.7725 0.6608 53.6671 28.3569 30.4565 136.9583 max 81.5600 1.1900 77.7150 58.1450 50.1800 277.1650 min 30.9700 0.2800 25.4100 11.1650 12.8550 45.5650 Std. dev. 12.9312 0.2213 7.3771 4.2616 4.8265 47.6254 CVi
a 23.19% 33.49% 13.75% 15.03% 15.85% 34.77% OCRb 0 95.96% 0 1.01% 1.01% 19.19%
a. Coefficient of variation, b. Over criteria rate. Nemerow synthetical contamination index
According to the calculation of Eqs.1 and 2, the degree of heavy metals pollution indicated by the Nemero pollution comprehensive index were obtained based on actual heavy metal monitoring data (Ci) for the 99 soil samples. 1.01% of the sample points are at an excellent level, 17.17% at clean, 50.51% at slightly polluted, 31.31% at moderately polluted. The mean value of pollution comprehensive index is 1.65, indicating that the total pollution level is slightly polluted. Spatial analysis was carried out, Figure 2 is a map of the spatial distribution of heavy metal comprehensive pollution level, which was performed according to Kriging interpolation of Nemero pollution comprehensive index by using the geostatistical analyst extension of ArcGIS 9.2 (ESRI, Redlands, CA, USA).
Figure 2. The spatial distribution of heavy metal comprehensive pollution class.
In the study area, the high level of heavy metal pollution was mainly found in the central area of land-reclamation from Dongting Lake which is consistent with the result of fairly high content of Cd in soils reported by Zhi-gang et al. (2006), and the low levels of heavy metal pollution found in the eastern hilly region. Lake pollution is high as parent material of the soil was river sediment with high levels of heavy metal contents, and on the other hand the heavy metals accumulated in the paddy soil by using water from Xiangjiang River for irrigation during the past 20 years. The relatively low level of heavy metal pollution in the eastern part of the study area could be explained by the following. Firstly, these metal contents may be representative of the local geochemical background in which the parent material of the soil is weathered slate residuals. Next, since the land altitude is higher, it is difficult to utilize water from Xiangjiang River for irrigation in the eastern hilly area. With the development of modern agriculture and industry, increasing amounts of waste water and sewage may be discharged into Xiangjiang River, resulting in serious pollution of agricultural environments. Therefore, more emphasis should be put on heavy metal pollution in soils of the central part.

© 2010 19th World Congress of Soil Science, Soil Solutions for a Changing World 20 1 – 6 August 2010, Brisbane, Australia. Published on DVD.
Conclusion The total concentration of four heavy metals (Cu, Pb, Cr and Ni) in paddy soils of Xiangyin County was lower than the standard value of the National Environmental Quality Standards of China (GB15618-1995), which meet the environmental requirement of general farmland described in the above standards. In the study area, 1.01% of the sample points are at an excellent level and 17.17% at clean, while 50.51% are slightly polluted with 31.31% moderately polluted. The results show that most of the soils were suffering from slight pollution and attention should be focused on these areas. Additionally, heavy metal polluted soils were mainly distributed in the lake plain area, especially those directly reclaimed from the lake. The following points on soils heavy metal in the study area should be highlighted: 1) The Cd content exceeds the average background value of soil in China, and 2) irrigation with Xiangjiang River water is the main reason for high accumulations of heavy metal in paddy soils. Acknowledgment This study was supported by National Science and Technology Support Project (Project Number 2006BAD20B07) and National Natural Science Foundation of China (Project Number 40871156). References Bilos C, Colombo JC, Skorupka CN, Rodriguez PMJ (2001) Sources, distribution and variability of airborne
trace metals in La Plata City area, Argentina. Environmental Pollution 111,149-58.
Cheng SP (2003). Heavy metal pollution in China: Origin, pattern and control. Environmental Science and
Pollution Research 10, 192-198.
He T, Liao BH, Zeng M (2007) Investigation on arsenic pollution of paddy fields in 4 mining areas in southern Hunan. Asian Journal of Ecotoxicology 2, 470-475.
Hlavay J, Polyak K, Weisz M (2001) Monitoring of the natural environment by chemical speciation of elements in aerosol and sediment samples. Journal of Environmental Monitoring 3, 74-80.
Jin T, Nordberg M, Frech W, Dumont X, Bernard A, Ye T (2002) Cadmium biomonitoring and renal dysfunction among a population environmentally exposed to cadmium from smelting in China (ChinaCad). BioMetals. 15, 397-410.
Koch M, Rotard W (2001) On the contribution of background sources to the heavy metal content of municipal sewage sludge. Water Science and Technology. 43, 67-74.
McLaughlin MJ, Singh BR (1999) Cadmium in soil and plants: a global perspective. In: ‘Cadmium in soils and plants’. (Eds MJ McLaughlin, BR Singh). pp. 13-21. (The Netherlands: Kluwer Academic Publishing).
Reeves PG, Chaney RL(2001) Mineral nutrients status of female rats affects the absorption and organ distribution of cadmium from sunflower kernels (Helianthus annuus L.). Environmental Research 85, 215-25.
Reynders H, Bervoets L, Gelders M, De Coen WM, Blust R (2008) Accumulation and effects of metals in caged carp and resident roach along a metal pollution gradient. Science of the Total Environment 391, 82-95.
Sridhara CN, Kamala CT, Samuel Suman Raj D (2008) Assessing risk of heavy metals from consuming food grown on sewage irrigated soils and food chain transfer. Ecotoxicology and Environmental Safety 69, 513-524.
Yanez L, Ortiz D, Calderon J, Batres L, Carrizales L, Mejia J (2002) Overview of human health and chemical mixtures: problems facing developing countries. Environmental Health Perspectives. 110, 901-9.
Zhao QG (2004) Land resources, mother earth-Protection, construction and sustainable utilization of the land resourcesof China, issues that deserve high attention. Soils (in Chinese). 36, 337-339.
Zhi-gang YAO, Zheng-yu BAO, Pu GAO (2006) Environmental geochemistry of heavy metals in sediments of Dongting Lake.Geochimica (in Chinese) 35, 629-638.

© 2010 19th World Congress of Soil Science, Soil Solutions for a Changing World 21 1 – 6 August 2010, Brisbane, Australia. Published on DVD.
Changes of soil organic carbon in different agro-ecological zones in China over
20 years Yan XuA, Fengrong Zhang
A and Jingkuan WangB
ADept. Land Resource and Management, China Agriculture University, Beijing, P.R. China, 100094. BCollege of Land Resources and Environment, Shenyang Agricultural University, Liaoning province, P.R. China. 110106.
Abstract Soil organic carbon (SOC) is important to the cycling of carbon in ecosystems which is related to greenhouse gas emissions and global warming. The changes of SOC caused by different management practices over 20 years were investigated in three different agro-ecological zones: (1) the North China Plain where soils were derived from an alluvial flood plain in warm and sub-humid conditions, (2) the Loess Plateau developed from aeolian deposits in warm and sub-arid climate, and (3) the Northeastern China Plain representing cool and sub-humid climate and soils developed from loess-like materials. A total of 130 soil profile (0 to 1.5 m) and 1184 plough layer samples were collected twice at the same location, one was in the early 1980s and the other was in 2000. The results showed that the SOC increased by 1.83 and 0.97 kg C/m2 in the North China Plain and the Loess Plateau over 20 years, respectively; whereas it decreased by 2.33 kg C/m2 in the Northeast China at the same period. High fertilizer input (300 to 350 kg N/ha and 100 to 120 kg P2O5/ha) and high cropping index have produced more crop residues, thus resulting in a net gain of SOC in the North China Plain and the Loess Plateau. The very low SOC content (2 to 5 g/kg) of the benchmark soils in the 1980s was possibly another reason for SOC increase in these two regions. Low fertilizer input (80 to 250 kg N/ha and 80 to 250 kg P2O5/ha) and low cropping index, and high SOC content (20 to 50 g/kg) of the bench mark soils may be responsible for the apparent decrease of SOC in the Northeastern China.
Key Words Agro-ecological zone, farmland, soil organic carbon, total carbon storage.
Introduction Soils may act as a sink or a source of atmospheric CO2 depending upon carbon additions via primary and secondary production (including excretions) and carbon losses via erosion, leaching and decomposition of soil organic matter. Agricultural soil plays a key role as the C sink. Recently, many researches estimated the agricultural soil carbon stock on different scales, for instance, the global scale (Post et al. 1982; Eswaran et
al. 1993; Kirschbaum et al. 2000), the national scale (Paul et al. 1995; Tatyana et al. 1998; Lars et al. 2003), and the regional scale (Susan et al. 1998). The change of soil carbon stock and the physical and humans driving factors, such as soil characteristics, altitude, tillage management, crop system, etc, are research hotspots (Alessandra et al. 2002; Follett, 2001; Lal, 2004).With economic development in China where arable land is only 0.1ha per capita, the pattern and intensity of land uses have been changed, but the changes of soil carbon content in the last 20 years have been rarely reported. Almost all documented papers dealt with soil carbon content data collected in the early 1980s. Therefore, the aims of this study are: (i) to estimate the changes of soil organic carbon in different agro-ecological regions in China over 20 years; and (ii) to determine the impacts of soil managements on the SOC stock in China.
Materials and methods Site descriptions
Three different agro-ecological zones, the North China Plain, the Loess Plateau and the Northeastern China Plain were selected for this study. The two Ustepts soils (Haplustepts), located in Daxing county (N39º26′-39°51′, E116º13′-116°43′) of southern Beijing and Quzhou County (N36º35′-36º58', E114º50′-115º13′), Hebei Province were selected in the temperate sub-humid region in North China Plain. Both locations had a similar annual precipitation (556 to 569 mm), but Quzhou was characterized with slightly higher annual temperature (13.1ºC) and ≥10ºC heat degree day (DD = 4472ºC) than Daxing (11.5ºC and DD = 4161ºC) and a longer frost free days (201 vs. 190 days, Table 1). Soils at both locations were developed from alluvial deposits. Crops have been cultivated over thousands of years. In warm and semi-arid region of the Loess Plateau two loess soils were selected in Youyu county (N39º41′-40°18′, E112º6′-112°38′) in northern Shanxi province and Lishi county (N37º20′-37°44′, E110º56′-111°36′) in central Shanxi province. The topography is upland and mesa covered with deep loess. Both locations had a similar annual temperature (8.6 to 8.7°C),

© 2010 19th World Congress of Soil Science, Soil Solutions for a Changing World 22 1 – 6 August 2010, Brisbane, Australia. Published on DVD.
Table 1. Relationships between SOC and depth in soil profile.
Sample site Number of samples Regression equationa R2 Average SOC content g/kg North China Plain Quzhou2000 31 Y=-1.6566Ln(x)+10.069 0.5861 4.096 Quzhou 1980 45 Y=-1.0266Ln(x)+7.0454 0.5126 3.344 Daxing2000 6 Y=-2.5915Ln(x)+14.187 0.6221 4.844 Daxing1981 4 Y=-1.1494Ln(x)+6.8765 0.5453 2.733 Loess Plateau Lishi2000 3 Y=-1.8156Ln(x)+10.937 0.548 4.391 Lishi1980 3 Y=-1.1903Ln(x)+6.2089 0.6184 1.918 Youyu2001 8 Y=-1.5568Ln(x)+10.438 0.7169 4.825 Youyu 1981 8 Y=-0.9525Ln(x)+6.5943 0.502 3.160 Northeastern China Gongzhuling2000 6 Y=13.033e-0.0138x 0.5728 7.068 Gongzhuling1980 6 Y=13.129e-0.0088x 0.5547 8.731 Hailun2000 5 Y=30.72e-0.0155x 0.8582 15.613 Hailun 1980 5 Y=33.935e-0.0138x 0.8599 18.404
while Lishi had higher precipitation (550 mm), greater ≥10ºC heat degree day (DD = 3000 to 3500ºC), and a longer frost free period (100 to 150 days) than Youyu (442.8 mm and DD = 2300 to 2500ºC). The two Udolls soil locations selected from the cold humid region in Northeastern China were Beian (N47º53′-48º33′, E126º16′-127º53′) in northern Heilongjiang and Hailun (N46º58′-47º52′, E126º14′-127º45′) in central Heilongjiang Province. The average annual temperature was much lower in Beian (0.2ºC) and Hailun (1.5ºC) than Usteps and loess soils. The DD was 1710 to 2300 and frost free day was 105 to 121 days. The annual precipitation was in the range of 553 to 570 mm. The precipitation was mainly concentrated in summer. The Udolls has been cropped for about one hundred years.
Data acquisition
Background soil samples at all six locations were collected from 1980 to 1982, and comparable samples were taken in 2000. A total of 126 soil profiles and 1184 plough layers (0 to 20 cm) were sampled (Table 2). The SOC content was determined using a Verio EL III element analyzer (Elementar, Hanau, Germany) for the Udolls soil samples and rapid dichromate oxidation techniques as described by Tiessen and Moir (1993) for samples of the Ustept soil and loess soil. The relationship between these two SOC measurements was investigated. Table 2. The change of the density and the storage of agri-soil organic carbon (0-20cm) in the research area in
recent 20 years.
agro-ecological regions Sample site Sample No.
C g/Kg
SOC density kgC/m2
SOC stock kgC
Change scope %
Quzhou2000 79 11.93 3.08 2.05×10⁹ 40.33 Quzhou 1980 79 8.50 2.20 1.46×10⁹ Daxing2000 297 12.41 3.16 3.37×10⁹ 28.72
North China Plain
Daxing1981 208 9.64 2.45 2.62×10⁹ Lishi2000 70 5.55 1.40 1.84×10⁹ 47.12 Lishi1980 58 3.77 0.95 1.25×10⁹ Youyu2001 70 6.87 1.72 3.66×10⁹ 63.54
Loess Plateau
Youyu 1981 70 4.20 1.05 2.24×10⁹ Gongzhuling2000 70 12.37 2.63 12.25×10⁹ -6.72 Gongzhuling 1980 51 13.26 2.82 13.13×10⁹ Hailun2000 76 28.21 5.84 32.56×10⁹ -10.81
Northeastern China
Hailun 1980 56 31.62 6.55 36.46×10⁹ The change of SOC density and storage (1 m) in the North China Plain, the Loess Plateau and the Northeastern China Climatic conditions and soil pedongenic processes were similar in each agro-ecological zone, thus, soil properties in the whole region are considered relatively homogeneous within the same dominant soil type.
Calculations and statistics
The SOC density is defined as the amount of soil organic carbon in one cubic meter (in kg m-3), and is calculated by multiplying SOC content with soil bulk density (BD). The total SOC stock (kg C) for each agro-ecological regions was estimated by multiplying the SOC density and the total arable land at a given depth in an eco-zone. Thus, SOC density and stock can be obtained as:

© 2010 19th World Congress of Soil Science, Soil Solutions for a Changing World 23 1 – 6 August 2010, Brisbane, Australia. Published on DVD.
100/)1( δ−×××= dBDCSOCdensity (1) where C is SOC average content (g/kg), BD is the bulk density of soil <2mm fraction (g cm-3) at a given depth, d is soil profile depth (cm), δ is the gravel (>2mm) content.
densitystock SOCdSSOC ××= (2)
Where S is total area interested and d is soil depth (m). The calculated model of SOC density and SOC storage in sample site Taking soil SOC data (1999) at Quzhou as an example, a strong logarithm relationship between SOC and soil profile depth was obtained after performing regression analyses. Y=-1.6566Ln(d) + 10.069 (3) R2 = 0.5861, sample number n = 31 where Y is SOC content (unit), and d is soil profile depth (cm). Through the definition of SOC density, soil profile depth is 100 cm. According to integral median theorem (Newton-Leibniz formula),
∫∫ =+100
0
100
0)10.069x)-1.6566Ln(( Cdxdx (4)
C is the SOC content; From equation 4, the estimated SOC content was is 4.096g/kg in 1m soil profile, on the average.Similarly, the estimations of SOC content and total stock estimation could be applied to other regions. The parameters of BD and δ varied slightly with soil profile, however, they were assumed as a constant in a given region, because the targeted region had a similar soil management practice, soils were derived from the same deposits, and more than 2 mm gravels were rarely found in research regions. Based on above assumptions, the BD averaged 1.36 g/cm3 at Quzhou. The SOC density was 5.29 kg/m3 when δ value was 0.5% and the SOC storage was approximately 3.51×10⁹ kg in 2000 in Quzhou.
Results and discussion The SOC storage change in the North China Plain
With adoption of the household responsibility system and land tenure in the early 1980s, more fertilizers were used (300 to 350 kg/ha for N and 100 to 120 kg/ha for P2O5) to produce crop yields 3 to 8 times (3500 to 4500 kg/ha for wheat, 5000-6500 kg/ha for corn) higher than pre-1980. The cropping system changed to two crops per year. With high inorganic fertilizer input, the amount of crop residue (straw and roots) produced has increased considerably, thus resulting in the increase of SOC in North China plain. This was well paid off from declining use of organic fertilizer (livestock manure or municipal sewage). Increases in SOC after adopting the land reform policy were also reported in other regions of Northern China since both aboveground biomass and root residues increased with fertilizer use. In addition, with the improvement in living standards farmers have not taken crop residue as the fuel for heating and cooking. Thus, a greater proportion of crop residue is retained on agricultural land. This also contributed to the increase of SOC in Ustepts soils. Apart from crop residues (shoot and roots) left over on the field after harvest, C and N compounds are also released by plant roots into the soil during the growing season, and undergo several transformation processes. This improves soil structure and contributes to increases in SOC content.
The SOC storage change in the Loess Plateau
The low input was reflected by low SOC content, especially in the early 1980s. Cultivation worsened soil erosion, thus resulting in a negative soil cycle: mature-erosion-mature, this low input cycle did not obtain high and stable yields. As SOC content had reached to the lowest level, any increasing inputs management would improve SOC content. With the comprehensive treatment and development of watershed, the improvement of field ecological environment, the control of the erosion to some extent, the farmers’ labor zest brought by the household responsibility system and land tenure, all these can explain the inputs continually increasing. The field investigations in Lishi location gain the crop yield (500-550 kg/ha for soybean, 1300-1450 kg/ha for millet, 4500 kg/ha for corn) and fertilizer input (80-250 kg/ha for N and 80-250 kg/ha for P2O5). There are different fertilizer inputs for different crop. The corn yield is higher relative to higher fertilizer inputs. Soybean is the opposite.
The SOC storage change in the Northeastern China Plain
The initial SOC in the Northeastern China Plain was from 2 to 8 times of that in the North China Plain in the early 1980s. Crop production in this region relied largely on the soil’s natural fertility rather than fertilizer input. Thus, high yields were achieved through depletion of soil fertility, leading to the decrease of SOC in

© 2010 19th World Congress of Soil Science, Soil Solutions for a Changing World 24 1 – 6 August 2010, Brisbane, Australia. Published on DVD.
the Northeastern China Plain. The combination of short cultivation history, lower fertilizer input and lower crop residues were attributed to the rate of SOC decomposition exceeding that of SOC formation. Thus, SOC has decreased and will probably continue to decrease under current practices. The SOC decrease in the Northeastern China Plain will lead to erodibility to be increased, causing more offsite transport of soil particles and associated nutrients to surface water. This further illustrates the need to increase crop residue input for sustainable agriculture production.
Table 3. The change of the density and the storage of agri-soil organic carbon in North China Plain, Loess
plateau and northeast of China in recent 20a.
agro-ecological regions depth cm
SOC density kg C m-3
SOC storage kg C
Change of SOC storage kg C
Change scope %
North China Plain 100(1980-82) 3.90 9.56×10¹⁰ 4.48×10¹⁰ 46.92 100(2000) 5.73 14.04×10¹⁰ 20(1980-82) 9.07 5.71×10¹⁰ 1.94×10¹⁰ 20(2000) 12.17 7.64×10¹⁰ Loess Plateau 100(1980-82) 3.19 4.88×10¹⁰ 3.99×10¹⁰ 81.82 100(2000) 5.80 8.87×10¹⁰ 20(1980-82) 22.44 2.30×10¹⁰ -0.69×10¹⁰ 20(2000) 20.29 3.59×10¹⁰ Northeastern China 100(1980-82) 14.18 32.61×10¹⁰ -5.36×10¹⁰ -16.43 100(2000) 11.85 27.26×10¹⁰ 20(1980s) 3.98 7.18×10¹⁰ 1.29×10¹⁰ 20(2000) 6.21 6.49×10¹⁰
Conclusion Soil organic carbon loses by conversion of natural vegetation to cultivated use. For example, the low fertilizer input in northeastern China makes low crop yields, which results in depletion of soil organic carbon. As a result, the net balance between built-up and mineralization of SOC the rate of soil organic carbon inputs and rate of mineralization is negative. Soil organic carbon storage will be increasing through more fertilizer input. This was demonstrated by the case study in the North China Plain and the Loess Plateau in recent 20 years. Since agricultural soils play dual roles, sink and source for CO2 in the atmosphere, it is an effective way to use soil as an important means of sequestrating global warming gas CO2. For the large population pressure, it is unfeasible to adopt fallow mode. The food security of the 1.3 billion people is the most important thing for the development of national economy. It is realism that farmland per capita is limited in China, and the best way increased inputs will result in more outputs. The above study indicates that increasing the agricultural inputs not only meets food demand but also promotes SOC content, which will make some contribution to the sequestration of global warming gas CO2.
Acknowledgement Key Project of the National Eleventh-Five Year Research Program of China (2006BAB15B05).
References Alessandra AF, Pedro LO, Henrique PS, Carlos AS, Francisco SF (2002) Soil organic carbon and fractions of a Rhodic
Ferralsol under the influence of tillage and crop rotation systems in southern Brazil. Soil and Tillage Research 64, 221-230.
Chevallier T, Voltz M, Blanchart E, Chotte JL, Eschenbrenner V, Mahieu M, Albrecht A (2000) Spatial and temporal changes of soil C after establishment of a pasture on a long-term cultivated vertisol (Martinique). Geoderma 94, 43-58.
Follett RF (2001) Soil management concepts and carbon sequestration zin cropland soils. Soil and Tillage Research 61, 77-92 Genxu W, Ju Q, Guodong C, Yuanmin L (2002) Soil organic carbon pool of grassland soils on the Qinghai-Tibetan Plateau
and its global implication. The Science of the Total Environment 291, 207-217. Jens L, Seraina B, Jürg F (2004) Carbon stocks in Swiss agricultural soils predicted by land-use, soil characteristics and
altitude. Agriculture, Ecosystems & Environment 1-12. Lal R (2004) Soil carbon sequestraion to mitigate climate change. Geoderma 123, 1-22. Lars K, Anette N (2003) Preliminary estimates of contemporary soil organic carbon stocks in Denmark using multiple datasets
and four scaling-up methods. Agriculture Ecosystems and Environment 96, 19-28. Lars K, Anette N, Martin H, Mogens HG, Thomas B, Henrik BM (2003) Preliminary estimates of contemporary soil organic
carbon stocks in Denmark using multiple datasets and four scaling-up methods. Agriculture Ecosystems&Environment 96, 19-28.
Paul ES, Jack W (1995) Assessing Brazil’s carbon budget: I. Biotic carbon pools. Forest Ecology and Management 75, 77-86
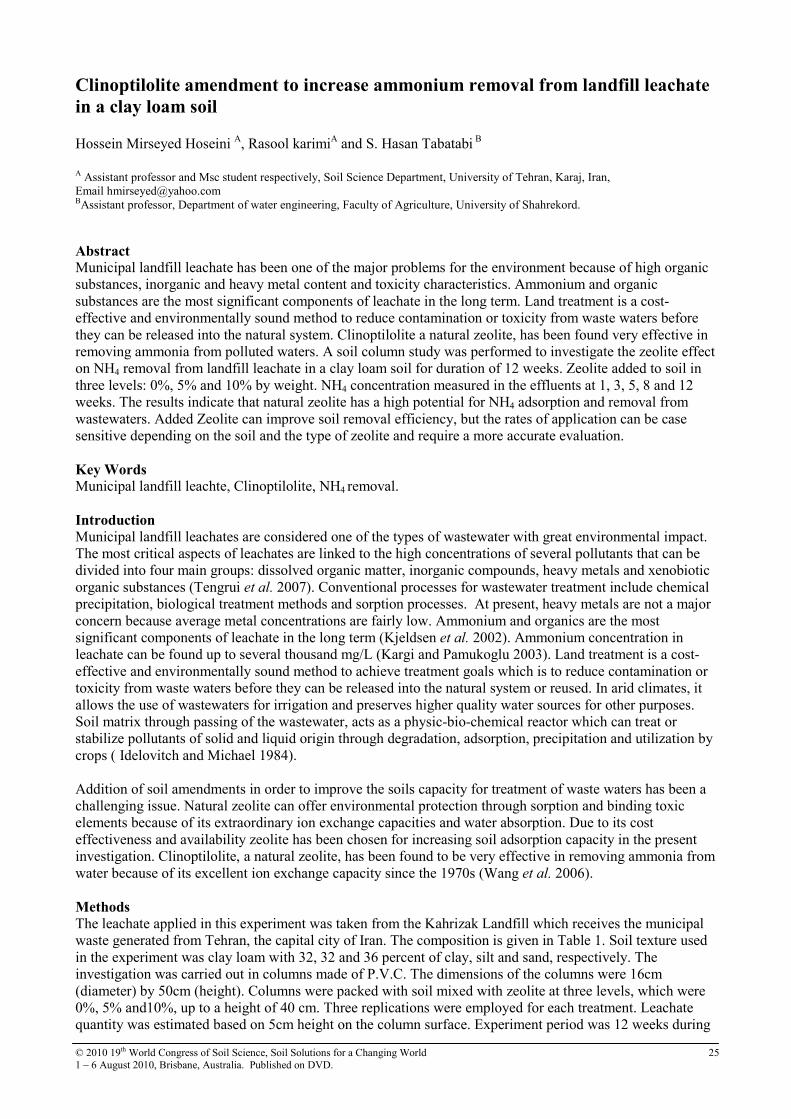
© 2010 19th World Congress of Soil Science, Soil Solutions for a Changing World 25 1 – 6 August 2010, Brisbane, Australia. Published on DVD.
Clinoptilolite amendment to increase ammonium removal from landfill leachate
in a clay loam soil Hossein Mirseyed Hoseini A, Rasool karimiA and S. Hasan Tabatabi B A Assistant professor and Msc student respectively, Soil Science Department, University of Tehran, Karaj, Iran, Email [email protected] BAssistant professor, Department of water engineering, Faculty of Agriculture, University of Shahrekord.
Abstract Municipal landfill leachate has been one of the major problems for the environment because of high organic substances, inorganic and heavy metal content and toxicity characteristics. Ammonium and organic substances are the most significant components of leachate in the long term. Land treatment is a cost-effective and environmentally sound method to reduce contamination or toxicity from waste waters before they can be released into the natural system. Clinoptilolite a natural zeolite, has been found very effective in removing ammonia from polluted waters. A soil column study was performed to investigate the zeolite effect on NH4 removal from landfill leachate in a clay loam soil for duration of 12 weeks. Zeolite added to soil in three levels: 0%, 5% and 10% by weight. NH4 concentration measured in the effluents at 1, 3, 5, 8 and 12 weeks. The results indicate that natural zeolite has a high potential for NH4 adsorption and removal from wastewaters. Added Zeolite can improve soil removal efficiency, but the rates of application can be case sensitive depending on the soil and the type of zeolite and require a more accurate evaluation.
Key Words Municipal landfill leachte, Clinoptilolite, NH4 removal. Introduction Municipal landfill leachates are considered one of the types of wastewater with great environmental impact. The most critical aspects of leachates are linked to the high concentrations of several pollutants that can be divided into four main groups: dissolved organic matter, inorganic compounds, heavy metals and xenobiotic organic substances (Tengrui et al. 2007). Conventional processes for wastewater treatment include chemical precipitation, biological treatment methods and sorption processes. At present, heavy metals are not a major concern because average metal concentrations are fairly low. Ammonium and organics are the most significant components of leachate in the long term (Kjeldsen et al. 2002). Ammonium concentration in leachate can be found up to several thousand mg/L (Kargi and Pamukoglu 2003). Land treatment is a cost-effective and environmentally sound method to achieve treatment goals which is to reduce contamination or toxicity from waste waters before they can be released into the natural system or reused. In arid climates, it allows the use of wastewaters for irrigation and preserves higher quality water sources for other purposes. Soil matrix through passing of the wastewater, acts as a physic-bio-chemical reactor which can treat or stabilize pollutants of solid and liquid origin through degradation, adsorption, precipitation and utilization by crops ( Idelovitch and Michael 1984). Addition of soil amendments in order to improve the soils capacity for treatment of waste waters has been a challenging issue. Natural zeolite can offer environmental protection through sorption and binding toxic elements because of its extraordinary ion exchange capacities and water absorption. Due to its cost effectiveness and availability zeolite has been chosen for increasing soil adsorption capacity in the present investigation. Clinoptilolite, a natural zeolite, has been found to be very effective in removing ammonia from water because of its excellent ion exchange capacity since the 1970s (Wang et al. 2006). Methods The leachate applied in this experiment was taken from the Kahrizak Landfill which receives the municipal waste generated from Tehran, the capital city of Iran. The composition is given in Table 1. Soil texture used in the experiment was clay loam with 32, 32 and 36 percent of clay, silt and sand, respectively. The investigation was carried out in columns made of P.V.C. The dimensions of the columns were 16cm (diameter) by 50cm (height). Columns were packed with soil mixed with zeolite at three levels, which were 0%, 5% and10%, up to a height of 40 cm. Three replications were employed for each treatment. Leachate quantity was estimated based on 5cm height on the column surface. Experiment period was 12 weeks during
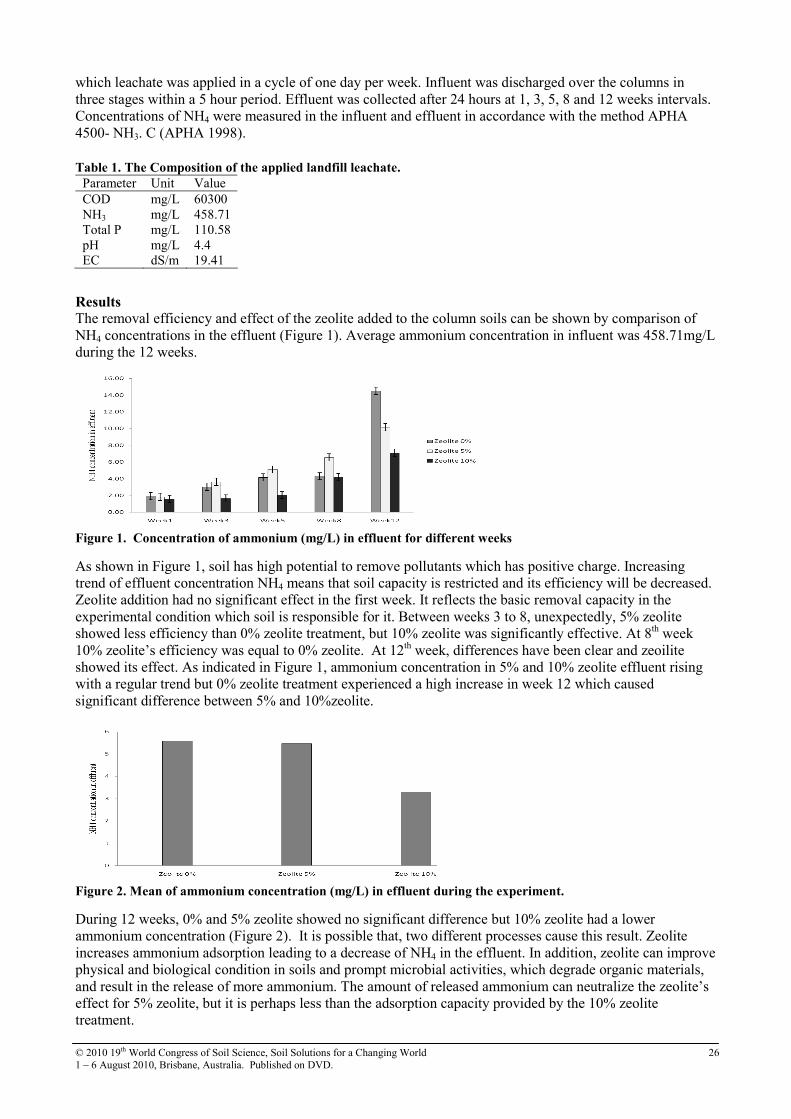
© 2010 19th World Congress of Soil Science, Soil Solutions for a Changing World 26 1 – 6 August 2010, Brisbane, Australia. Published on DVD.
which leachate was applied in a cycle of one day per week. Influent was discharged over the columns in three stages within a 5 hour period. Effluent was collected after 24 hours at 1, 3, 5, 8 and 12 weeks intervals. Concentrations of NH4 were measured in the influent and effluent in accordance with the method APHA 4500- NH3. C (APHA 1998). Table 1. The Composition of the applied landfill leachate.
Parameter Unit Value COD mg/L 60300 NH3 mg/L 458.71 Total P mg/L 110.58 pH mg/L 4.4 EC dS/m 19.41
Results The removal efficiency and effect of the zeolite added to the column soils can be shown by comparison of NH4 concentrations in the effluent (Figure 1). Average ammonium concentration in influent was 458.71mg/L during the 12 weeks.
Figure 1. Concentration of ammonium (mg/L) in effluent for different weeks
As shown in Figure 1, soil has high potential to remove pollutants which has positive charge. Increasing trend of effluent concentration NH4 means that soil capacity is restricted and its efficiency will be decreased. Zeolite addition had no significant effect in the first week. It reflects the basic removal capacity in the experimental condition which soil is responsible for it. Between weeks 3 to 8, unexpectedly, 5% zeolite showed less efficiency than 0% zeolite treatment, but 10% zeolite was significantly effective. At 8th week 10% zeolite’s efficiency was equal to 0% zeolite. At 12th week, differences have been clear and zeoilite showed its effect. As indicated in Figure 1, ammonium concentration in 5% and 10% zeolite effluent rising with a regular trend but 0% zeolite treatment experienced a high increase in week 12 which caused significant difference between 5% and 10%zeolite.
Figure 2. Mean of ammonium concentration (mg/L) in effluent during the experiment.
During 12 weeks, 0% and 5% zeolite showed no significant difference but 10% zeolite had a lower ammonium concentration (Figure 2). It is possible that, two different processes cause this result. Zeolite increases ammonium adsorption leading to a decrease of NH4 in the effluent. In addition, zeolite can improve physical and biological condition in soils and prompt microbial activities, which degrade organic materials, and result in the release of more ammonium. The amount of released ammonium can neutralize the zeolite’s effect for 5% zeolite, but it is perhaps less than the adsorption capacity provided by the 10% zeolite treatment.

© 2010 19th World Congress of Soil Science, Soil Solutions for a Changing World 27 1 – 6 August 2010, Brisbane, Australia. Published on DVD.
Conclusion Clinoptilolite, used in the experiment as an adsorbent is a natural zeolite with high potential for NH4 adsorption and removal from wastewater. Its ability has been investigated for use in land treatment systems. Our results indicate that added Zeolite can improve soil ammonium removal efficiency, but the rates of application required can be case sensitive depending on the soil and the type of zeolite and development of criteria requires a more accurate evaluation. References APHA (1998) ‘Standard methods for the examination of water and wastewater’. (American Public Health
Association, Washington, D.C.) p.1566.
EPA (2006) ‘Land treatment of municipal wastewater effluent’. (U. S Environmental Protection Agency, Cincinnaty, Ohio).
Idelovitch E, Michael MA (1984) New approach to an old method of wastewater reuses, Journal of Water
Polluion Control Fed. 56, 9300. Kargi F, Pamukoglu MY (2003) Simultaneous adsorption and biological treatment of pre-treated landfill
leachate by fed-batch operation, Process Biochemistry. 38, 1413–1420. Kjeldsen P, Barlaz MA, Rooker AP, Baun A, Ledin A, Christensen TH (2002) Present and long-term
composition of MSW landfill leachate: a review. Critical Reviews in Environmental Science and
Technology 32, 297–336. Wang Y, Liu S, Xu Z, Han T, Chuan S, Zhu T (2006) Ammonia removal from leachate solution using
natural Chinese clinoptilolite. Journal of Hazardous Materials 136, 735–740.

© 2010 19th World Congress of Soil Science, Soil Solutions for a Changing World 28 1 – 6 August 2010, Brisbane, Australia. Published on DVD.
Comparison study between the methods for compost maturity determination
Soon Ik KwonA, Kwon Rae KimB, Seung Gil HongA, Woo Kyun ParkA and Deog Bae LeeA ADepartment of Agro-environment, National Academy of Agricultural Science, RDA, Suwon, Korea, Email [email protected] BDivision of Environmental Science & Ecological Engineering, Korea University, Seoul, Korea, Email [email protected] Abstract Manure-based composts can have detrimental effects on the agricultural lands and crops if they are applied without a proper stabilization process. Composting is a well-known method for stabilization of manure-based composts and it can be examined by a maturity test. Among various maturity tests, two mechanical methods (Solvita and CoMMe-100) were compared with germination test. The mechanical methods are considered as relatively objective compared to other methods. Also they are cost and time efficient. Ten commercially available composts collected in Korea were used for this study. Despite some differences between the extents of maturity determined by the two methods, it was possible to adjust the measurements to be in good agreement between two methods through extending the reaction time for CoMMe-100 and adjusting the index level for maturity determination in the standard color chart. Also both methods were in good agreement with results of the seed germination test. Key Words Compost maturity, Solvita, CoMMe-100, germination index. Introduction Manure composting is a well established approach for the stabilization of nutrients and the reduction of pathogens and odours in manures (US Composting Council 2000), which can be evaluated as compost mature. Compost maturity is one of the significant parameters to evaluate the quality of compost and hence a wide range of maturity test has been developed and applied. Maturity can be estimated by self-heating reaction, seed germination rate, oxygen consumption rate, respiration rate, earthworm response, and generation of CO2/NH3. Each method has disadvantages such as being time consuming, less accuracy, and high cost. Also, in most cases, maturity test using only one method does not reflect the actual extent of maturity. Hence, application of multi methodologies is recommended. The current study was conducted to compare the commercially available maturity testers Solvita and CoMMe-100 in association with a comparison with a seed germination test. Solvita and CoMMe-100 use colorimetric methods to examine the amount of generated CO2 and NH3 from sample compost. Methods Composts
Commercially available composts in Korea were collected for this study. The composts consisted of about 50 % animal manure and the rest of organic materials such as hulls and saw dusts. From the preliminary test, ten composts at different stage of composting were selected and measured by selected methods for determining maturity. Measurement
Solvita measurement: Moisture adjusted compost (100 mL) was incubated in 200 mL container with solvita reactor for 4 hours and then the extent of collar change was measured using DCR (Digital Color Reader, Solvita®). The maturity was determined through comparison between measured DCR value and the standard color chart. CoMMe-100: Measurement using CoMMe-100 was similar with the procedure of Solvita but for comparison study, the measurement was conduced at different reaction times (one, two, and 4 hours). Seed germination test: Radish and lettuce seeds were germinated in the water extracts from composts. Five days after germination, root elongation and germination rate were measured. Result and Conclusion Both methods color reaction testes indicated similar trends in maturity for ten samples even if there was some difference in the absolute maturity level. For example, CoMMe-100 indicated the compost was be fully matured for C2 sample while Solvita showed it was in the last stage of composting. The discrepancy between the two methods could be corrected by adjusting the reaction time and changing the index level in the

© 2010 19th World Congress of Soil Science, Soil Solutions for a Changing World 29 1 – 6 August 2010, Brisbane, Australia. Published on DVD.
standard color chart. In the seed germination test, lettuce seed was more sensitive than radish seed but the trend of germination rate to reflect compost maturity was similar. Also the results of the chemical methods were in good agreement with those of the seed germination test. Table 1. Comparison of two methods using color reactions of ammonia and carbon dioxide for testing compost
maturity.
Solvita CoMMe-100
←raw mature→ ←raw mature→
Sample
1 2 3 4 5 6 7 8 1 2 3 4 5
C1 ● ●
C2 ● ●
C3 ● ●
C4 ● ●
C5 ● ●
C6 ● ●
C7 ● ●
C8 ● ●
C9 ● ●
C10 ● ● Table 2. Seed germination index for compost maturity.
radish lettuce Sample
GR RE GI GR RE GI
C1 9.2 8.9 0.8 79.5 0.0 0.0
C2 101.1 89.4 90.4 86.6 93.6 81.1
C3 95.3 58.5 55.7 66.8 55.6 37.2
C4 100.0 71.6 71.6 91.6 59.8 54.7
C5 101.1 77.4 78.2 88.0 51.9 45.6
C6 101.1 74.5 75.3 83.7 67.7 56.7
C7 101.1 70.8 71.6 75.3 47.0 35.4
C8 102.3 100.0 102.3 2.9 0.0 0.0
C9 75.8 52.7 40.0 0.0 0.0 0.0
C10 98.9 79.4 78.5 57.0 61.7 35.2 GR : Germination ratio, RE : Root elongation, GI : Germination index GR = (germination rate/germination rate of control) × 100 RE = (root length/root length of control) × 100 GI = GR × RE / 100 Table 3. Pierson correlation coefficient between compost maturity tests.
Solvita CoMMe-100 Radish GI
CoMMe-100 0.830**
Radish GI 0.586 0.196
Lettuce GI 0.675* 0.724** 0.498
Reference Changa CM, Wang P, Watson ME, Hoitink HAJ, Michel Jr. FC (2003) Assessment of the reliability of a
commercial maturity test kit for composted manures. Compost Science and Utilization 11,125-143.

© 2010 19th World Congress of Soil Science, Soil Solutions for a Changing World 30 1 – 6 August 2010, Brisbane, Australia. Published on DVD.
Connecting soil policies with plans to improve water quality – an example with
acid sulfate soils from two north Queensland regions
Bernard PowellA ADepartment of Environment and Resource Management, Queensland, Australia, Email [email protected]
Abstract In recent years, Australian Government investment in preparing catchment-based water quality improvement plans has been substantial. At the same time the overall level of investment in the understanding, planning and management of the soils in these catchments has not been to the same level, despite their critical place in the likely success of such plans. A recently completed exception was the Queensland Government (with funding support from the Australian Government), completing acid sulfate soil water quality improvement plans (ASS WQIPs) for two regions comprising a number of catchments draining into the Great Barrier Reef. These plans were based on the principles and processes of the Australian Government’s Framework for Marine and Estuarine Water Quality Protection. Approximately 666 000 ha of coastal acid sulfate soils (ASS) are estimated to occur within the Great Barrier Reef catchments. The disturbance of coastal ASS, in both disturbed and undisturbed condition, represents a significant threat to coastal and marine reef ecosystems. It is critically important to prevent further disturbance and to identify and establish timelines for measures to address existing disturbed ASS. ASS WQIPs were prepared for the Far North Queensland and Mackay-Whitsunday regions. These plans addressed actual and potential ASS in existing urban, regional and agricultural contexts and the need to specifically manage these soils for a water quality outcome. Key Words Water quality, acid sulfate soil, Great Barrier Reef. Introduction To protect the Great Barrier Reef from risks of pollution and eutrophication, considerable effort is being undertaken to reduce pollutant delivery from catchments. The National Water Quality Management Strategy (NWQMS 2008) and the Queensland Environmental Protection Policy (Water) 1997 promote the sustainable management of water resources by determining environmental values of waterways and corresponding water quality objectives for different water quality indicators as a basis of management actions to protect these values (Environmental Protection Agency 2005). The Australian Government’s Coastal Catchment Initiative supports the development and implementation of water quality improvement plans (WQIPs) in accordance with the Australian Government Framework for Marine and Estuarine Water Quality Protection. The development of WQIPs provides an approach consistent with the National Water Quality Management Strategy to set water quality objectives and targets for reducing pollution. WQIPs are targeted toward the high risk catchments identified in the Reef Water Quality Protection Plan (The State of Queensland and Commonwealth of Australia 2003). The WQIPs (and hence their water quality objectives) were mainly focused on impacts of sediments, nutrients and pesticides on Great Barrier Reef waterways. Disturbance of coastal acid sulfate soils, if not managed appropriately, also poses a threat to the environment (including water quality and coastal values) of the Great Barrier Reef and to its economic and social base. The annual cost of acid sulfate soil disturbance and management in Queensland was estimated to be more than $180 million in 2000 (Sutherland & Powell 2000). The ASS WQIPs for the Far North Queensland (wet tropics) region (McClurg et al. 2009a) and the Mackay-Whitsunday region (McClurg et al. 2009b) address these threats in urban, rural and agricultural contexts and complement the existing water quality improvement plans for these regions. Approximately 666 000 ha of acid sulfate soils (ASS) are estimated to occur within the Great Barrier Reef catchments (Powell & Martens 2005). This represents about 30% of the estimated total area of 2.3 million hectares of ASS in Queensland (Powell, Smith & Ahern 1996). There is an increasing body of evidence of existing and historical environmental harm in reef catchments that may be due to acid sulfate soil disturbances. The intent of these plans is to ensure that acid sulfate soils are identified within the regions and that further disturbance does not contribute to degradation of soil, water and biological resources. This will help achieve ecologically sustainable production and development while maintaining the water quality objectives specified in the plans.

© 2010 19th World Congress of Soil Science, Soil Solutions for a Changing World 31 1 – 6 August 2010, Brisbane, Australia. Published on DVD.
Methods For these plans, the following acid sulfate soil related water quality objectives were adopted, based mainly on the water quality objectives for aquatic ecosystems environmental values specified for Trinity Inlet mid-estuary conditions (Environmental Protection Agency 2007): pH: 6.5–8.4, dissolved oxygen should not be reduced by more than 10% below natural minimal diurnal concentration, alkalinity: >2 meq/L, aluminium: <55 µg/L (pH > 6.5) (sourced from ANZECC & ARMCANZ 2000a), arsenic: <36 µg/L, iron: <1000 µg/L, hydrogen sulfide: <1 µg/L (un-ionised H2S measured as [S]). It is important to note that these water quality objectives are long term targets. In the shorter term they are guideline trigger values that if not met, identify the need for a management response. The appropriate management responses are described in the plans. It is also important to understand that these trigger values apply to ambient water quality, not to freshwater flows during peak runoff events. As runoff recedes and acidic groundwater comes to increasingly contribute to waterway flows, the trigger values apply. They also assess ASS areas and disturbance risk of the catchments or subcatchments within the regions. This allows consistency and easy integration where appropriate between this Plan and other WQIPs produced. Impacts that may arise if these water quality objectives are not met are also outlined By adopting the WQIP process, the following issues were addressed: climate impacts on acid sulfate soil, acid sulfate soil disturbances from historical land uses, acid discharges, consultation processes, threats of ASS disturbance, effect of economic growth, effect of climate change, existing programs addressing ASS such as Commonwealth legislation, Queensland legislation, non-statutory plans and strategies, industry codes of practice, existing mapping and identification of priority areas for future mapping. Having articulated the main drivers and pressures that have led to the present situation, the ASS WQIPs articulated proposed management measures and control actions for each region based on the goals of the National strategy for the management of ASS (ANZECC & ARMCANZ 2000b): Goal 1 - Avoid or minimise future disturbance of ASS Goal 2 - Promote sustainable management of ASS disturbed by development Goal 3 - Undertake rehabilitation of previously disturbed ASS to minimise damaging Effects The plan concludes with recommendations that support implementation such as monitoring and adaptive management systems, institutional and organisational reforms, reforms to the Queensland statutory planning framework, amendments to Queensland environment protection legislation, changes to local government within Queensland, changes to Commonwealth and state government natural resource management investment programs, priority additional research and development activities, a review and reporting framework, statutory capacity to implement this Plan, and programs and funding for the implementation of the Plans
Results In the Mackay- Whitsunday ASS WQIP 63 400ha of ASS are estimated to be present. Four catchments are identified as high priority for further attention: Lethe Brook, Thompson Creek, Mackay City and Bakers Creek. There are an estimated 155 000ha of ASS in the Far North Queensland Region. A threat analysis concluded three WQIP areas are high priority and in need of urgent attention: the Barron - Trinity Inlet, Tully and Herbert areas (representing about 100 000ha of ASS). Little detailed ASS mapping is available to support planning and development processes for these areas. Mapping associated with the plan helped alleviate this gap for the Barron- Trinity Inlet area and a small percentage of the vast Herbert River delta area. Expansion of sugar cane onto the coastal wetlands and swamps, particularly in the 1970s to 1980s led to drainage and disturbance of ASS. Since the 1990s urban development and port expansion have also significantly encroached low-lying coastal areas involving ASS. There is compelling evidence that ASS disturbance is implicated in the fish kills that occur periodically in the Barron, Mulgrave, Russell, Johnstone and Herbert. While many ASS problems are locally expressed and need region specific responses, the principles of ASS distribution, impacts and management and planning responses are common for all reef regions. Consequently many aspects of any ASS WQIP would be the same or similar for all catchments adjacent to the Great Barrier Reef. To support these plans, common responses could be most efficiently shared across a number of reef regions. Major recommendations arising from the planning exercise include filling extensive gaps in ASS risk mapping, upgrading best management practices and management guidelines, provision of awareness and training, coordinated and targeted water quality monitoring and feasibility assessment of potential remediation sites.

© 2010 19th World Congress of Soil Science, Soil Solutions for a Changing World 32 1 – 6 August 2010, Brisbane, Australia. Published on DVD.
Conclusion The plans will make a lasting contribution to an improved understanding of ASS occurrence, severity and management planning requirements in the two regions. The involvement of stakeholders from a wide variety of areas has led to improved protection from ASS disturbance in the Far North Queensland Regional Plan 2008- 2031. While many ASS problems relating to water quality need region-specific responses, good quality ASS mapping, and planning/management responses are common for all reef regions. Consequently to support the ASS WQIPs, common recommended responses could be efficiently shared across a number of Reef regions. Major activities involving soil disturbance and drainage should follow the requirements of the State Planning Policy 2/02; the Guidelines for Sampling and Analysis of Lowland Acid Sulfate Soils (ASS) in
Queensland (Ahern et al. 1998) and the Soil Management Guidelines (Dear et al. 2002). The ASS WQIPs make a strong case for the connection between water quality in reef waterways and acid sulfate soil disturbance, but successful water quality outcomes depend on additional resource allocations. The current Commonwealth Reef Rescue program and Queensland Reef Regulations address sediments, nutrients and pesticide impacts on water quality but need to go further and also address ASS. This would allow the plan recommendations to be substantially progressed. Acknowledgements The contributions of Jim McClurg, Phil Norman, David Morrison and Bob Hampson (all Queensland Department of Environment and Resource Management) to the authorship of the ASS WQIPs are gratefully acknowledged. Vaughn Cox (Department of Environment, Water, Heritage and the Arts) provided encouragement and support to see ASS issues being considered in reef water quality management. References Ahern CR, Ahern MR, Powell B (1998) ‘Guidelines for Sampling and Analysis of Lowland Acid Sulfate
Soils in Queensland’. (QASSIT: Department of Natural Resources, Indooroopilly, Queensland).
ANZECC, ARMCANZ (Australian and New Zealand Environment and Conservation Council and Agriculture and Resource Management Council of Australia and New Zealand) (2000a) ‘Australian and New Zealand Guidelines for Fresh and Marine Water Quality, National Water Quality Management Strategy’. (Australian and New Zealand Environment and Conservation Council and Agriculture and Resource Management Council of Australia and New Zealand: Canberra).
ANZECC and ARMCANZ (Australian and New Zealand Environment and Conservation Council and Agriculture and Resource Management Council of Australia and New Zealand) (2000b) ‘National strategy for the Management of Coastal Acid Sulfate Soils’. (Australian and New Zealand Environment and Conservation Council and Agriculture and Resource Management Council of Australia and New Zealand: Canberra).
Dear SE, Moore NG, Dobos SK, Watling KM, Ahern CR (2002) ‘Soil Management Guidelines, in Queensland Acid Sulfate Soil Technical Manual’. (Department of Natural Resources and Mines: Indooroopilly).
Environmental Protection Agency (2005) ‘Establishing Draft Environmental Values and Water Quality Objectives: Guideline Resource Assessment’. (Environmental Protection Agency: Brisbane).
Environmental Protection Agency (2007) ‘Trinity Inlet Environmental Values and Water Quality Objectives’. Basin 111 (part), Environment Protection (Water) Policy 1997. (Environmental Protection Agency: Brisbane).
McClurg JI, Powell B, Norman P, Morrison D, Hampson RJ (2009a) ‘Acid Sulfate Soil Water Quality Improvement Plan Far North Queensland Region’. (Queensland Department of Environment and Resource Management).
McClurg JI, Powell B, Norman P, Hampson RJ (2009b) ‘Acid Sulfate Soil Water Quality Improvement Plan Mackay Whitsunday Region’. (Queensland Department of Environment and Resource Management).
NWQMS (2008) ‘National Water Quality Management Strategy’. www.environment.gov.au/water/quality/nwqms/index.html
Powell B, Ahern CR (1999) ‘QASSMAC Acid Sulfate Soil Management Strategy for Queensland’. (QASSMAC and Queensland Department of Natural Resources: Indooroopilly, Queensland).
Powell B, Smith CD, Ahern CR (1996) Mapping acid sulfate soils in Queensland. In ‘Proceedings 2nd national conference on acid sulfate soils, Coffs Harbour, 5–6 September’. (Eds RJ Smith et al.)

© 2010 19th World Congress of Soil Science, Soil Solutions for a Changing World 33 1 – 6 August 2010, Brisbane, Australia. Published on DVD.
(ASSMAC: Australia).
Sutherland NM, Powell B (2000) Overview of the Queensland Acid Sulfate Soils Management Advisory Committee. In ‘Acid sulfate soils: Environmental issues, assessment and management’. Technical Papers, 20–22 June 2000, Brisbane. (Eds CR Ahern, KM Hey, KM Watling, VJ Eldershaw) pp. 1–4. (Department of Natural Resources: Indooroopilly).
The State of Queensland and Commonwealth of Australia (2003) ‘Reef Water Quality Protection Plan for catchments adjacent to the Great Barrier Reef World Heritage Area, Queensland’. (Department of Premier and Cabinet: Brisbane).

© 2010 19th World Congress of Soil Science, Soil Solutions for a Changing World 34 1 – 6 August 2010, Brisbane, Australia. Published on DVD.
Describing N leaching under urine patches in pastoral soils Rogerio Cichota
A, Iris VogelerA and Valerie SnowA AAgResearch, Palmerston North, New Zealand, Email [email protected]
Abstract Urine patches are the major source of nitrogen (N) leaching from grazing systems as the nitrogen load under these spots far exceeds the plants needs. The high concentration of nitrogen under urine patches is also challenging for modelling as some processes, such as ion adsorption, cannot be assumed to be linear. We have employed the APSIM model framework with a newly developed pasture module to describe the results of an experiment where lysimeters were treated with a load of 1000 kg/ha of nitrogen as urine. To model this data we used a mechanistic soil model with NH4 adsorption modelled by a Freundlich isotherm The model showed good agreement with measured drainage and both NO3 and NH4 leaching. The effect of the assumption that NH4 is completely immobile was compared with the Freundlich isotherm and found to underestimate leaching by 20% in this loamy soil. In soils, such as sandy soils, with lower adsorption capacity the underestimation is expected to be greater. Key Words Nitrogen leaching, pasture, APSIM, modelling, ammonium adsorption. Introduction The high use of fertilisers under intensive dairying is regarded as a major cause of ground-water contamination and eutrophication of surface water bodies adjacent to agricultural areas (Goodlass et al. 2003; Monaghan et al. 2007). Best management practices can significantly reduce the nutrient losses derived from fertilisers but in pastoral systems, especially with grazing ruminants, considerable losses of N can occur even at low fertiliser input levels. These losses increase exponentially as inputs increase (Ledgard 2001). This occurs because grazing animals have a low efficiency in the utilisation of the N taken in. Some 80 to 95% of the N ingested is returned via excrements, mostly in urine. Urine depositions cover a fairly small portion of the paddock, about 3-5% after one grazing event, and up to 25% over the whole year. Thus animals concentrate N taken up from a larger area into small patches where application rates often surpass the plants needs. The concentration of N under urine patches from dairy cows can range from 500 to 1000 kg/ha. As such, urine patches are by far the biggest source of N leached from grazing systems (Haynes and Williams 1993; Ledgard 2001). Urine patches are not only hotspots for N leaching, but also for other losses, especially greenhouse gases, which have also gaining increased attention recently. These issues are particularly important for New Zealand, given its production system, based on grazing animals, and the relevance of the agricultural sector to the economy. Existing or proposed regulations are increasing the pressure on farmers to improve N management and reduce losses from their systems. The use of models is crucial for improving N management. However, the current quantification of some processes occurring in the soil and plant under urine patches is not sufficiently understood. The high N loads in these spots put the N concentration in the soil outside the range typically used in research. In this situation, some of the processes, such as ion adsorption, which in most conditions can be reasonably assumed to vary linearly with concentration, will show a non-linear behaviour. Thus, validation of the models under a urine patch conditions is necessary. For instance, in several models ammonium (NH4) has been often considered to be totally immobile, or to follow a linear isotherm. Under urine patches, however, very high concentrations of ammonium occur and so a nonlinear isotherm should be more appropriate. The APSIM model (Keating et al. 2003) is a well known modelling framework composed of several modules that are added to the simulation according to the experimental needs in order to describe the several processes of the soil-plant-atmosphere system (Holzworth et al. 2009). The APSIM model and its modules have been extensively tested and have been widely used to simulate cropping and forestry systems. Simulations of grazing systems are improving with the addition of pasture and animal modules to the framework. One of the water modules in APSIM, SWIM2 (Ross and Smettem 1993; Verburg et al. 1996), uses a mechanistic approach based on Richards’ equation and the convection-dispersion equation to describe water and solute movement through the soil. This includes the ability to represent a non-linear ion adsorption isotherm.

© 2010 19th World Congress of Soil Science, Soil Solutions for a Changing World 35 1 – 6 August 2010, Brisbane, Australia. Published on DVD.
The objective of this work is to evaluate the performance of the APSIM model, using SWIM2 for describing water and solute transport and the newly developed AgPasture module to simulate pasture growth. The model output was compared with results from a lysimeter experiment simulating urine patches. Material and methods Measured data
The measured data were obtained from a lysimeter study (Shepherd 2009) containing undisturbed columns (50 cm diameter×70 cm height) of the Horotiu silt loam soil (from Ruakura Research Centre, Hamilton, New Zealand). The lysimeters received a cow urine application at a volume equivalent to 10 mm and 1000 kg N /ha, simulating a urine patch. The urine amount added is at the high end of the range of a single urine patch typical of that for beef or dairy cattle (Haynes and Williams 1993). There were four replicates. Prior to the urine application the grass was cut down to 3.5 cm height; subsequently eight other cuts were done through the experiment, which started on 15/05/2008 and continuing until 28/12/2008. During the experiment, the lysimeters received a combination of natural rainfall and irrigation. Irrigation was applied at regular intervals to supplement rainfall so that the lysimeters received enough water to avoid stress during the period of the experiment. Leachate was collected at regular intervals, the amount of drainage was calculated and samples were analysed for ammonium and nitrate concentrations. Modelling
To model this experiment the APSIM model (version 7.0) was employed (Keating et al. 2003). The SoilN and SurfaceOM modules (Probert et al. 1998) were used to describe the C-N cycle, and SWIM2 (Verburg et
al. 1996) for the transport of water and solutes. To simulate pasture development, the AgPasture module (F. Li, AgResearch, personal communication) was employed. AgPasture has been developed using the pasture module from EcoMod (Johnson et al. 2008) as a starting point and is designed to simulate the growth of multiple pastures species. It is currently in its final stages of development. The required parameters to set up SWIM2 and SoilN were gathered from the literature (Close et al. 2003; Singleton 1991) and from the New Zealand Soil Database (Wilde 2003). Ion adsorption for NH4 was assumed to obey a Freundlich isotherm. Its parameters were estimated from measurements with the support of a pedo-transfer function derived from data from ten different New Zealand soils, including the Horotiu soil. The pedo-transfer function relates the adsorption parameters with soil texture and carbon content (I Vogeler, personal communication). Climate data was obtained from the Ruakura Weather Station, and the detailed management of the experiments was described using the APSIM manager module. Results and discussion The total water input over the experimental period was 1035 mm (962 mm from rainfall and 73 mm from irrigation). This resulted in a considerable amount of drainage, more than half of the water inputs (Figure 1). The drainage amounts were simulated reasonably well with APSIM (Figure 1). In spring drainage amounts were overestimated, which probably was a result of pasture growth being under-predicted at this period.
0
100
200
300
400
500
600
700
800
May Jun Jul Aug Sep Oct Nov Dec
Cu
mu
lati
ve
dra
ina
ge
(m
m)
Figure 1. Cumulative drainage over the experiment measured (points) and simulated (line).

© 2010 19th World Congress of Soil Science, Soil Solutions for a Changing World 36 1 – 6 August 2010, Brisbane, Australia. Published on DVD.
Both treatments showed higher variability between replicates for N leaching than for drainage. The relative variability was higher for NH4 than NO3 (Figure 2). The model predicted the leaching pattern reasonably well, although the timing for first appearance and the peak of NH4 leaching was modelled a bit later than was observed. Timing and amount of N leached as NH4 predicted by the model was quite sensitive to the parameters for NH4 adsorption and nitrification rate. This emphasises the need for more studies to better understand and quantify these processes under high N loads.
0.0
0.2
0.4
0.6
0.8
1.0
1.2
1.4
1.6
1.8
2.0
May Jun Jul Aug Sep Oct Nov Dec
Cu
mu
lati
ve
NH
4le
ach
ing
(k
g/
ha
)
0
100
200
300
400
500
600
700
May Jun Jul Aug Sep Oct Nov Dec
Cu
mu
lati
ve
NO
3le
ach
ing
(k
g/
ha
)
Figure 2. Measured (points) and simulated (lines) values of cumulative N leaching as NH4 or NO3.
Many models assume either a linear NH4 isotherm or that NH4 is completely immobile. We tested the effect of this using a linear isotherm with the same initial slope as the Freundlich isotherm used above. With the linear isotherm less NH4 and total N leaching was predicted but for the Horotiu soil the effect was not great. Simulations repeated with an isotherm appropriate for a sandy soil showed a greater effect of a linear isotherm. When NH4 was assumed to be completely immobile in the Horotiu soil N leaching was under predicted by approximately 100 kg/ha. With complete immobility of NH4 , the N remained in the layers closer to the soil surface for longer and that resulted in greater uptake by the pasture. This issue will be more important in soils with low NH4 adsorption and where mitigation options such as nitrification inhibitors are to be considered.
References Close ME, Magesan GN, Lee R, Stewart MK, Hadfield JC (2003) Field study of pesticide leaching in an
allophanic soil in New Zealand. 1: Experimental results. Australian Journal of Soil Research 41, 809-824.
Goodlass G, Halberg N, Verschuur G (2003) Input output accounting systems in the European community - An appraisal of their usefulness in raising awareness of environmental problems. European Journal of
Agronomy 20, 17-24.
Haynes RJ, Williams PH (1993) Nutrient cycling and soil fertility in the grazed pasture ecosystem. Advances
in Agronomy 49, 119-199.
Holzworth DP, Huth NI, de Voil PG (2009) Simplifying environmental model reuse. Environmental
Modelling and Software. (In Press).
Johnson IR, Chapman DF, Snow VO, Eckard RJ, Parsons AJ, Lambert MG, Cullen BR (2008) DairyMod and EcoMod: biophysical pasture simulation models for Australia and New Zealand. Australian Journal
of Experimental Agriculture 48, 621-631.
Keating BA, Carberry PS, et al. (2003) An overview of APSIM, a model designed for farming systems simulation. European Journal of Agronomy 18, 267-288.
Ledgard SF (2001) Nitrogen cycling in low input legume-based agriculture, with emphasis on legume/grass pastures. Plant and Soil 228, 43-59.
Monaghan RM, Wilcock RJ, Smith LC, Tikkisetty B, Thorrold BS, Costall D (2007) Linkages between land management activities and water quality in an intensively farmed catchment in southern New Zealand. Agriculture, Ecosystems and Environment 118, 211-222.
Probert ME, Dimes JP, Keating BA, Dalal RC, Strong WM (1998) APSIM's water and nitrogen modules and simulation of the dynamics of water and nitrogen in fallow systems. Agricultural Systems 56, 1-28.
Ross PJ, Smettem KRJ (1993) Describing soil hydraulic properties with sums of simple functions. Soil
Science Society of America Journal 57, 26-29.

© 2010 19th World Congress of Soil Science, Soil Solutions for a Changing World 37 1 – 6 August 2010, Brisbane, Australia. Published on DVD.
Shepherd M, Welten, B., and Ledgard, S. (2009). (2009) Effectiveness of Dicyanddiamide in reducing nitrogen leaching losses from two contrasting soil types under two rainfall regimes-a lysimeter study. In ‘FLRC Workshop’. (Massey University: Palmerston North).
Singleton PL (1991) Water tables and soil colour as an indicator of saturation in some soils of the Waikato, New Zealand. Australian Journal of Soil Research 29, 467-481.
Verburg K, Ross PJ, Bristow KL (1996) ‘SWIMv2.1 User Manual’. (CSIRO - Divions of Soils).
Wilde RH (2003) ‘Manual for National Soils Database’. (Landcare Research: Palmerston North, New Zealand).

© 2010 19th World Congress of Soil Science, Soil Solutions for a Changing World 38 1 – 6 August 2010, Brisbane, Australia. Published on DVD.
Detecting a landfill leachate plume using a DUALEM-421 and a laterally
constrained inversion model Jessica RoeA, John TriantafilisA and Fernando Monteiro SantosB ASchool of Biological Earth and Environmental Sciences, University of New South Wales, Sydney, NSW, Australia, Email [email protected] bUniversidade de Lisboa, Centro de Geofísica-Instituto Don Luís Laboratório Associado, C8, 1749-016 Lisboa, Portugal Abstract Water-based solutions derived from the decomposition of solid waste products (leachates) pose a serious health risk to the community and environment when they enter the groundwater system. Traditionally, geotechnical investigations such as piezometer installation have been employed to determine the extent of the leachate emanating into water courses. To facilitate rapid data collection, geophysical techniques are increasingly being used to better discern the location and extent of existing leachate plumes. The principle aim of this study is to demonstrate how a DUALEM-421 can be used to detect a leachate plume associated with a series of decommissioned municipal landfill sites located in or adjacent to Astrolabe Park in Daceyville, Southern Sydney. Inversion of the apparent conductivity (σa) measured in the horizontal (HCP) and perpendicular co-planar arrays (PRP) of the DUALEM-421, characterised the Quaternary Aeolian sands and indicate the location and extent of a leachate plume and a shallow groundwater Table across the study area. A 1-D inversion algorithm with 2-D smoothness constraints is employed to invert the DUALEM-421 σa
data, to predict true electrical conductivity (σ).Results compare favourably with the stratigraphy of the Tuggerah soil landscape unit, local hydrology, and results of a previous geophysical survey and water chemistry of the leachate plume. Key Words Leachate plume, electromagnetic (EM) induction, DUALEM-421, inversion.
Introduction The primary problem of waste management is that virtually all solid refuse comprises a complex mixture and is usually subjected to indifferent storage conditions resulting in deterioration (Hamer 2003). Consequently, the production of solid waste poses a serious health risk to the community and environment particularly when it is disposed of inadequately (Soupios et al. 2007). To assess the impacts on public health and local ecology, we require knowledge of waste constituents and an understanding of the regional and local geological setting. Traditional investigations, involving geotechnical methods such as borehole drilling and piezometer installation (Jankowski et al. 1997), have been employed to determine the extent of the leachate emanating into local groundwater systems. However, this type of approach is time consuming and labour intensive (Zume et al. 2006) and has led to the development of instruments and systems which collect data much more rapidly. In this regard geophysical techniques have been used to identify leachate plume including dc-resistivity; Benson et al. (1997), Abu-Zeid et al. (2004) and with EM induction Buselli et al. (1991). The primary advantage of the non-invasive EM induction is the speed and accuracy with which lateral changes of the apparent soil electrical conductivity (σa) can be measured (as well as vertical variations, through extension of intercoil spacings). Many authors have successfully employed such a method to investigate the nature of landfills. This includes the use of an EM31 to determine lateral boundaries and composition of a landfill in Switzerland (Green et al. 1999), to map the Burwood coastal landfill in New Zealand (Nobes et al. 2000) and to characterize the largest waste disposal site on the island of Crete (Soupios et al. 2007). The principle aim of this study is to assess the effectiveness of a DUALEM-421 to identify the presence and location of a leachate plume originating from a decommissioned landfill. Materials and methods The study site is within highly permeable Quaternary Aeolian sands in Daceyville, Sydney. Prior to its use as a local sports field, it was used as a landfill throughout various stages of the 20th century. Of significance to the transect discussed in this study, is the landfill from the World War II era. This particular survey line was chosen as it has been the site of previous research by Jorstad (2006) who used the direct current (dc) resistivity method and cross-borehole tomography to characterise the leachate plume. The present

© 2010 19th World Congress of Soil Science, Soil Solutions for a Changing World 39 1 – 6 August 2010, Brisbane, Australia. Published on DVD.
geophysical survey was conducted using a DUALEM-421, carried at 0.30m above the ground surface. The instrument has been designed in a way that enables σa to be collected at six depths of exploration (DOE) simultaneously; due to the multiple coil spacings (4, 2 and 1 m) and two orientations (i.e. HCP - horizontal co-planar and PRP – perpendicular arrays). The DUALEM-421 σa data is inverted to estimate the true electrical conductivity (σ) using a smooth inversion technique (Monteiro Santos et al. 2009). The method allows the construction of a global image of the subsurface distribution of σ= that can be useful in the interpretation of routine survey σa data. Additionally we compare the σvalues achieved against the known stratigraphy of the Tuggerah soil landscape (Lavitt et al. 1997) unit, local hydrology of Astrolabe Park, and the results of previous geophysical research of the leachate plume. The results are also interpreted using historical water chemistry data.
Previous studies at the site have included the collection of water chemistry data. These can be used to
validate the results achieved using the EM method. Using Archie’s law; σb = σwØm
and known electrical conductivity (EC) values of both contaminated and uncontaminated water at the site, previously determined porosity (Ø of 0.36 and the cementation factor (m) for the formation of 1.51 (Kelly, 1994) it is possible to determine the value of bulk conductivity (σb) of the formation. Using averaged values of EC for the leachate plume and uncontaminated sands it was possible to determine that σb should be in the vacinity of 32 mS/m and 3 mS/m respectively for the inverted DUALEM-421 σ data. Figure 1a. shows the results achieved by Jorstad (2006) using the dc-resistivity method along a small (160 m) transect within the area known to have been used as a municipal waste site during World War II. This was performed through the installation of 64 steel electrodes spaced at 2.5 m intervals in a Wenner array. The electrodes were connected to the ABEM SAS4000 resistance metre and linked to a LUND ES 464 electrode controller. Bulk electrical conductivity is shown in milliseimens per meter (mS/m). The area thought to be contaminated with the leachate plume has a σ value of 36.4 mS/m. Conversely, the area below the plume has a much lower value of < 4 mS/m, this is thought to be the uncontaminated water Table associated with the clean sands. Results of cross-borehole tomography also performed by Jorstad (2006) are shown in Figure 1b. Values obtained for the sands containing the leachate plume are >60 mS/m. The area below the plume, in the clean sands, have σ values of < 4 mS/m. The two methods produce slightly different spatial distribution of σdespite being in the same location. Figure 1b appears to show a plume that diffuses out in the vertical plane, whereas Figure 1a illustrates a plume that is very much restricted to within the top 5 m below ground surface level and changes abruptly below this. This is to be expected given the first method involves the surface insertion of probes whilst the second involves additional data that is collected from probes inserted at depth.
Figure 1. Spatial distribution of true electrical conductivity (σ - mS/m) estimated using an (a) ABEM SAS4000
resistance metre linked with LUND ES 464 electrode controller and (b) Conductivity section produced using
cross-borehole tomography (after Jorstad 2006).
Results Electromagnetic induction
Figure 2a-c show the spatial distribution of σa measured by the DUALEM-421. At a Northing of less than 6244125, two peaks in σa lie within 25 m of each other. Another pair is evident at 6244125 and 6244200. These peaks fall within the WWII landfill area. In addition, this is where the remodeled landscape is lowest along. The same pattern is repeated a short distance further to the north, between 6244225 and 6244275. The peaks in σa delineate the swale of the remodeled mid-1970’s landfill landscape. In addition, measured
a) b)

© 2010 19th World Congress of Soil Science, Soil Solutions for a Changing World 40 1 – 6 August 2010, Brisbane, Australia. Published on DVD.
1mHcon and 2mHcon σa are generally larger than the equivalent Pcon σa. Given the shallower measurements are larger along transect 2, this suggests the true conductivity (σ) is larger in the near-surface than in the subsoil. A 2-dimensional model of σ obtained by inversion of the DUALEM-421 σa has been created (Figure 2d). The results along this transect and between the Northings of 6244125 and 6244175, compare favourably with Figure 1a and b. In particular the values of σ are comparable. As discussed for the DC-resistivity method above, the contaminated sands had σ values of >35 mS/m and the uncontaminated sands had σ values of <4 mS/m. Figure 2d shows the spatial distribution of σ, with clear delineatation and location of the leachate plume. Values of σ in the leachate plume are >30 mS/m. In addition, the uncontaminated groundwater has σ values of <15 mS/m. these results are equivalent to those obtained with the dc-resitivity and bore-hole tomography methods.
Figure 2. Spatial distribution of apparent soil electrical conductivity (σa - mS/m) along transect 2 of DUALEM in
horizontal coplanar (HCP) and perpendicular coplanar (PCP) modes of operation and spacing of (a) 1 m; (b) 2
m; (c) 4 m; and, (d) true electrical conductivity (σ - mS/m) estimated using a 1-D inversion algorithm with 2-D
smoothness constraints using apparent soil electrical conductivity (σa - mS/m) in the horizontal coplanar (HCP)
and perpendicular coplanar (PCP) of a DUALEM-421.
Conclusion A DUALEM-421 was employed to perform a reconnaissance survey and to collect apparent conductivity (σa) along six parallel transects on the western edge of two decomissioned landfills within the Daceyville area, with the aim of characterising the pedological, geological and hydrological features present at the site. With respect to the measured σa it is concluded that the DUALEM 1mHcon and 1mPcon as well as the

© 2010 19th World Congress of Soil Science, Soil Solutions for a Changing World 41 1 – 6 August 2010, Brisbane, Australia. Published on DVD.
2mHcon and 2mPcon provide information which assist in inferring the likely location of a leachate plume and conductive municipal wastes within 0.5-5 m of the surface of the Astrolabe Park landfill. The inferences are made based on larger Hcon σa as compared to the Pcon measurements of equivalent coil spacing, and usually between two peaks in σa readings. Conversely, the 2mHcon, 4mHcon and 4mPcon σa provide us with information which can be used to infer the location and extent of a local groundwater Table at a depth of 6 m-7 m. The development of a cross-sectional model of σ was made possible through the use of the DUALEM-421 σa and a 1-D inversion algorithm with 2-D smoothness constraints (Monteiro Santos et al. 2009). The cross-sections confirmed the likely location of near-surface leachate plumes and shallow local groundwater tables. The results in terms of σ, are favourable with calculations of σb, derived from Archie’s law. Accordingly results are comparable to inverted resistivity data collected by Jorstad (2006) who previously applied dc-resisitivity electrical methods and bore-hole tomography along a small portion of our study transect. Specifically, the estimated value of σ of the highly permeable but uncontaminated groundwater associated with Quaternary Aeolian sand that characterizes the Tuggerah soil landscape is small (i.e. <15 mS/m) and compares favourably with estimated σ achieved by inversion of dc-resistivity and cross-borehole tomography data (i.e. <15 mS/m). Conversely, it is calculated the leachate plume has intermediate (30-45 mS/m) to intermediate-large (45-60 mS/m) σ, which are equivalent to the σ estimated using dc-resisitivity (>23.5 mS/m) and cross-bore hole tomography (>37.5 mS/m).
References Abu-Zeid N, Bianchini G, Santarato G, Vaccaro C (2004) Geochemical characterisation and geophysical
mapping of Landfill leachates: the Marozzo canal case study (NE Italy). Environmental Geology 45, 439-447.
Benson AK, Payne KL, Stubben MA (1997) Mapping groundwater contamination using dc resistivity and VLF geophysical methods - A case study. Geophysics 62, 80-86.
Buselli G, Barber C, Davis GB, Williamson DR (1991) The use of electro-geophyiscal methods for groundwater pollution and soil salinity problems. Exploration Geophysics 22, 59-64.
Green A, Lanz E, Maurer H (1999) A template for geophysical investigations of small landfills. The Leading
Edge (February). Hamer G (2003) Solid waste treatment and disposal: effects on public health and environmental safety.
Biotechnology Advances 22, 71-79. Jankowski J, Beck P, Acworth RI (1997) Vertical heterogeneity in the Botany Sands Aquifer, Sydney,
Australia: Implications for chemical variations and contaminant plume delineation. In ‘Groundwater in the Urban Environment: Processes and Management’ (Eds J Chilton) pp. 445-450. (Include publisher)
Jorstad LB (2006) Analysis of variation in inorganic contaminant concentration and distribution in a landfillleachate plume: Astrolabe Park, Sydney, Australia. PhD thesis. Unpublished. 297 pages.
Jorstad LB, Jankowski J, Acworth RI (2004) Analysis of the distribution of inorganic constituents in a landfill leachate-contaminated aquifer: Astrolabe Park, Sydney, Australia. Environmental Geology 46, 263-272.
Kelly BFJ (1994) Electrical properties of sediments and the geophysical detection of ground water contamination. Ph.D. Thesis, Department of Water Engineering, School of Civil Engineering, University of New South Wales, Australia, 146 pp.
Lavitt N, Acworth RI, Jankowski J (1997) Vertical hydrochemical zonation in a coastal section of the Botany Sands Aquifer, Sydney, Australia. Hydrogeology Journal 5(2), 64-74.
Monteiro Santos FA, Triantafilis J, Bruzgulis KE, Roe JAE (2009) Inversion of DUALEM-421 profiling data using a 1-D laterally constrained algorithm. Vadose Zone Journal 8.
Nobes DC, Armstrong MJ, Close ME (2000) Delineation of a landfill leachate plume and flow channels in coastal sands near Christchurch, New Zealand, using a shallow electromagnetic survey method. Hydrogeology Journal 8, 328-336.
Soupios P, Papadopoulos I, Kouli M, Georgaki I, Vallianatos F, Kokkinou E (2007) Investigation of waste disposal areas using electrical methods: a case study from Chania, Crete, Greece. Environmental Geology 51, 1249-1261.
Zume JT, Tarhule A, Christenson S (2006) Subsurface imaging of an abandoned solid waste landfill site in Norman, Oklahoma. Groundwater Monitoring and Remediation 26, 62-69.
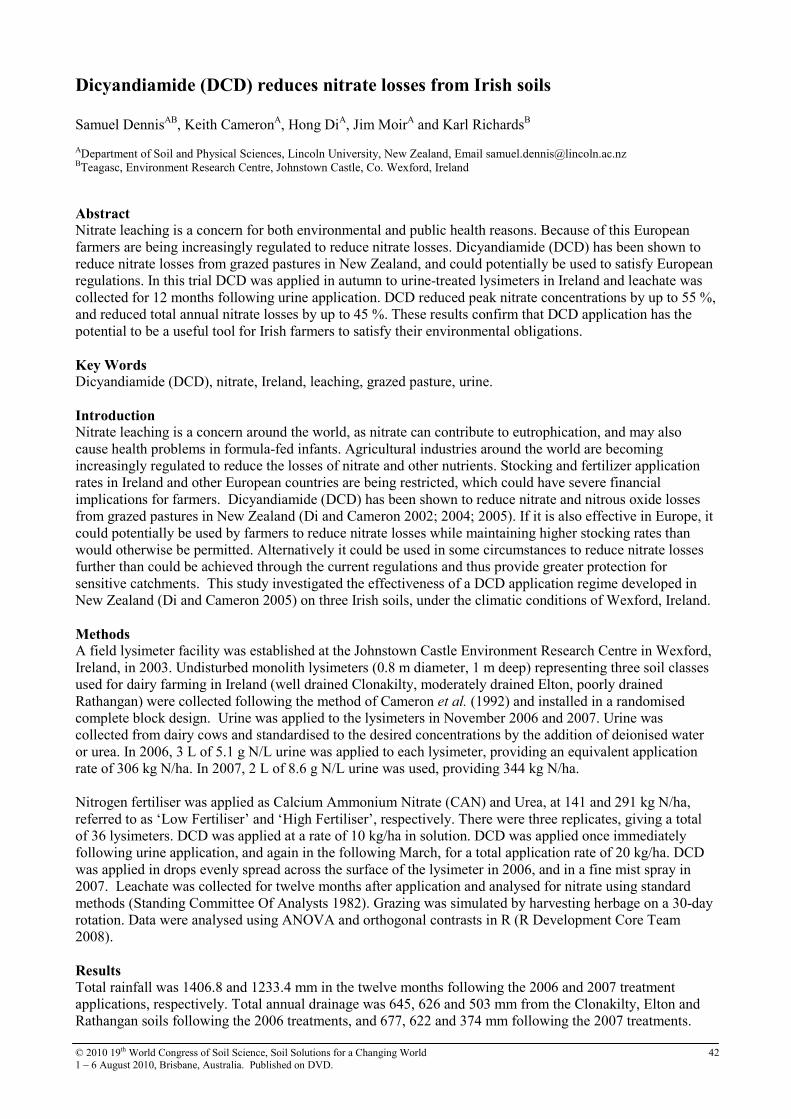
© 2010 19th World Congress of Soil Science, Soil Solutions for a Changing World 42 1 – 6 August 2010, Brisbane, Australia. Published on DVD.
Dicyandiamide (DCD) reduces nitrate losses from Irish soils
Samuel DennisAB, Keith CameronA, Hong DiA, Jim MoirA and Karl RichardsB ADepartment of Soil and Physical Sciences, Lincoln University, New Zealand, Email [email protected] BTeagasc, Environment Research Centre, Johnstown Castle, Co. Wexford, Ireland
Abstract Nitrate leaching is a concern for both environmental and public health reasons. Because of this European farmers are being increasingly regulated to reduce nitrate losses. Dicyandiamide (DCD) has been shown to reduce nitrate losses from grazed pastures in New Zealand, and could potentially be used to satisfy European regulations. In this trial DCD was applied in autumn to urine-treated lysimeters in Ireland and leachate was collected for 12 months following urine application. DCD reduced peak nitrate concentrations by up to 55 %, and reduced total annual nitrate losses by up to 45 %. These results confirm that DCD application has the potential to be a useful tool for Irish farmers to satisfy their environmental obligations. Key Words Dicyandiamide (DCD), nitrate, Ireland, leaching, grazed pasture, urine. Introduction Nitrate leaching is a concern around the world, as nitrate can contribute to eutrophication, and may also cause health problems in formula-fed infants. Agricultural industries around the world are becoming increasingly regulated to reduce the losses of nitrate and other nutrients. Stocking and fertilizer application rates in Ireland and other European countries are being restricted, which could have severe financial implications for farmers. Dicyandiamide (DCD) has been shown to reduce nitrate and nitrous oxide losses from grazed pastures in New Zealand (Di and Cameron 2002; 2004; 2005). If it is also effective in Europe, it could potentially be used by farmers to reduce nitrate losses while maintaining higher stocking rates than would otherwise be permitted. Alternatively it could be used in some circumstances to reduce nitrate losses further than could be achieved through the current regulations and thus provide greater protection for sensitive catchments. This study investigated the effectiveness of a DCD application regime developed in New Zealand (Di and Cameron 2005) on three Irish soils, under the climatic conditions of Wexford, Ireland. Methods A field lysimeter facility was established at the Johnstown Castle Environment Research Centre in Wexford, Ireland, in 2003. Undisturbed monolith lysimeters (0.8 m diameter, 1 m deep) representing three soil classes used for dairy farming in Ireland (well drained Clonakilty, moderately drained Elton, poorly drained Rathangan) were collected following the method of Cameron et al. (1992) and installed in a randomised complete block design. Urine was applied to the lysimeters in November 2006 and 2007. Urine was collected from dairy cows and standardised to the desired concentrations by the addition of deionised water or urea. In 2006, 3 L of 5.1 g N/L urine was applied to each lysimeter, providing an equivalent application rate of 306 kg N/ha. In 2007, 2 L of 8.6 g N/L urine was used, providing 344 kg N/ha. Nitrogen fertiliser was applied as Calcium Ammonium Nitrate (CAN) and Urea, at 141 and 291 kg N/ha, referred to as ‘Low Fertiliser’ and ‘High Fertiliser’, respectively. There were three replicates, giving a total of 36 lysimeters. DCD was applied at a rate of 10 kg/ha in solution. DCD was applied once immediately following urine application, and again in the following March, for a total application rate of 20 kg/ha. DCD was applied in drops evenly spread across the surface of the lysimeter in 2006, and in a fine mist spray in 2007. Leachate was collected for twelve months after application and analysed for nitrate using standard methods (Standing Committee Of Analysts 1982). Grazing was simulated by harvesting herbage on a 30-day rotation. Data were analysed using ANOVA and orthogonal contrasts in R (R Development Core Team 2008). Results Total rainfall was 1406.8 and 1233.4 mm in the twelve months following the 2006 and 2007 treatment applications, respectively. Total annual drainage was 645, 626 and 503 mm from the Clonakilty, Elton and Rathangan soils following the 2006 treatments, and 677, 622 and 374 mm following the 2007 treatments.

© 2010 19th World Congress of Soil Science, Soil Solutions for a Changing World 43 1 – 6 August 2010, Brisbane, Australia. Published on DVD.
The total annual nitrate-N losses with urine and 141 and 291 kg fertiliser N/ha, averaged across both urine and urine + DCD treatments, are shown in Table 1. When losses were averaged across all soils, there were higher losses from the high fertiliser rate than the low in both 2006 (P < 0.05) and 2007 (P < 0.001). When the soils were analysed individually this effect was only visible on the Clonakilty soil in 2006 (P < 0.05), and the Clonakilty (P < 0.001) and Elton (P < 0.01) soils in 2007. Table 1.Total annual nitrate-N losses with urine and fertiliser applied at 141 or 291 kg N/ha. SEM in brackets. Year Treatment NO3
--N loss (kg/ha) Clonakilty Elton Rathangan 2006 Urine + Low Fertiliser 159.0 (33.5) 185.1 (17.2) 66.9 (35.1) Urine + High Fertiliser 210.8 (14.6) 195.2 (24.1) 43.9 (6.6) 2007 Urine + Low Fertiliser 100.9 (24.4) 149.8 (26.2) 44.7 (32.7) Urine + High Fertiliser 148.3 (25.3) 159.3 (8.8) 11.5 (2.5) Graphs of the nitrate-N concentration versus drainage for urine and urine + DCD following the 2007 treatments, averaged across both fertiliser rates, are shown in Figure 1. Similar results were seen following the 2006 treatments. The peak concentration following urine application was higher from the Clonakilty and Elton soils than from the Rathangan. DCD reduced the mean peak nitrate concentration from all soils by 32.8 and 55.2 % in 2006 and 2007, respectively (P < 0.001). In 2007 (Figure 1), DCD reduced peak concentrations by 49.6 and 48.7 % on the Clonakilty and Elton soils respectively (P < 0.05), but the 90.0 % reduction on the Rathangan soil was not significant (P = 0.14).
Figure 1. Nitrate-N concentration over mm drainage from urine with or without DCD in 2007. Error bars = 1
SEM.
The total annual nitrate-N losses with urine and urine + DCD, averaged across both fertiliser rates, are shown in Figure 2. When losses were averaged across all soils, DCD reduced nitrate losses by 21.8 % in 2006, and 45.3 % in 2007 (P < 0.001).

© 2010 19th World Congress of Soil Science, Soil Solutions for a Changing World 44 1 – 6 August 2010, Brisbane, Australia. Published on DVD.
Figure 2. Total annual nitrate-N losses with urine and urine + DCD. Error bars = 1 SEM. When the soils were analysed individually, this reduction in losses was only significant on the Rathangan soil in 2006 (52.8 % reduction, P < 0.01), although reductions in losses from the Clonakilty (13.4 %, P = 0.078) and Elton (18.5 %, P = 0.105) were nearly significant. Following the 2007 treatments, DCD significantly (P < 0.001) reduced losses on the Clonakilty and Elton soils by 41.5 and 38.0 %, respectively, however the apparent 85.6 % reduction in losses from the Rathangan soil was not significant (P = 0.228). Discussion Doubling the N fertiliser rate had a minor effect on N losses from most soils, except the Clonakilty soil. For this reason the fertiliser rate results were combined to test the effects of the DCD treatment. The total nitrate losses of 16 – 233 kg nitrate-N/ha were in most cases higher than the 59.7 kg nitrate-N/ha observed by Di and Cameron (2007) following a similar rate of urine application in New Zealand. This is most likely due to the higher total drainage from this trial (374 – 677 mm as opposed to around 300 mm in Di and Cameron 2007). Peak nitrate concentrations were observed at 200 – 300 mm of drainage, comparable to previous results from New Zealand (Di and Cameron 2004; Fraser et al. 1994). However as the total annual drainage was considerably higher than in New Zealand, these peaks occurred earlier in the drainage season – in January, i.e. in the middle of winter. The majority of the nitrate that was leached was therefore lost before pasture growth picked up in spring, and before the spring DCD application. This could explain not only the higher total losses than in the previous New Zealand work, but may have also contributed to the apparent lower efficacy of DCD in this trial than in the New Zealand work. The overall reductions in loss with DCD (21.8 and 45.3 %) were not as high as the reductions of 68 % or more that have been observed following DCD application in New Zealand (e.g. Di and Cameron 2002; 2004; 2005). However these reductions are still considerable, and show DCD to have potential as a mitigation technology to counter nitrate leaching losses in Europe. Although not all the individual soil reductions with DCD were significant, it appeared to consistently have the greatest effect on the poorly drained Rathangan soil. This may be due to the slower drainage of this soil retaining N in the soil for longer, and allowing the DCD to continue to act for longer. There may also have been lower quantities of DCD lost in drainage from this heavy soil compared the lighter soils. The greater effectiveness of DCD following the 2007 treatments may be due to the improved application regime used that year (fine mist application). Liquid DCD appears to be slightly more effective at reducing N losses than granular DCD (presumably spread less evenly), however this difference was not significant at a rate of 18 kg DCD per hectare (Menneer et al. 2008). Given that the DCD application rate in this trial was lower than that used by Menneer et al. this difference may have been enhanced, and it is possible that the less even spread of DCD in 2006 could have reduced its effectiveness compared to the 2007 results and previous NZ work. The higher rainfall and total N losses in 2006 may also have contributed to this result. The DCD application regime used was that developed under Canterbury, New Zealand drainage conditions (Di and Cameron 2005). It may be necessary to modify the DCD application regime to better suit Irish leaching conditions, by changing the timing of applications, adding extra applications (as Monaghan et al. 2009 suggest), or increasing the DCD application rate. Conclusion DCD significantly reduced both the concentration and total losses of nitrate from three very different Irish soils. Although the results were not as impressive as previous work in New Zealand, considerable reductions in total nitrate loss of up to 45% were observed. These results may be able to be improved by tailoring the application regime to better suit Irish conditions. DCD shows potential as a useful technology to help Irish farmers meet their environmental obligations. Acknowledgements This research was funded through the Teagasc Walsh Fellowship Scheme. References Cameron KC, Smith NP, McLay CDA, Fraser PM, McPherson RJ, Harrison DF, Hardbottle P (1992)
Lysimeters without edge flow: an improved design and sampling procedure. Soil Science Society of
America Journal 56, 1625-1628.
Di HJ, Cameron KC (2002) The use of a nitrification inhibitor, dicyandiamide (DCD), to decrease nitrate

© 2010 19th World Congress of Soil Science, Soil Solutions for a Changing World 45 1 – 6 August 2010, Brisbane, Australia. Published on DVD.
leaching and nitrous oxide emissions in a simulated grazed and irrigated grassland. Soil Use and
Management 18, 395-403.
Di HJ, Cameron KC (2004) Treating grazed pasture soil with a nitrification inhibitor, eco-n, to decrease nitrate leaching in a deep sandy soil under spray irrigation - a lysimeter study. New Zealand Journal of
Agricultural Research 47, 351-361.
Di HJ, Cameron KC (2005) Reducing environmental impacts of agriculture by using a fine particle suspension nitrification inhibitor to decrease nitrate leaching from grazed pastures. Agriculture,
Ecosystems and Environment 109, 202-212.
Di HJ, Cameron KC (2007) Nitrate leaching losses and pasture yields as affected by different rates of animal urine nitrogen returns and application of a nitrification inhibitor - a lysimeter study. Nutrient Cycling in
Agroecosystems 79, 281-290.
Fraser PM, Cameron KC, Sherlock RR (1994) Lysimeter study of the fate of nitrogen in animal urine returns to irrigated pasture. European Journal of Soil Science 45, 439-447.
Menneer JC, Sprosen MS, Ledgard SF (2008) Effect of timing and formulation of dicyandiamide (DCD) application on nitrate leaching and pasture production in a Bay of Plenty pastoral soil. New Zealand
Journal of Agricultural Research 51, 377-385.
Monaghan RM, Smith LC, Ledgard SF (2009) The effectiveness of a granular formulation of dicyandiamide (DCD) in limiting nitrate leaching from a grazed dairy pasture. New Zealand Journal of Agricultural
Research 52, 145-159.
R Development Core Team (2008) 'R: A language and environment for statistical computing.' (R Foundation for Statistical Computing: Vienna, Austria).
Standing Committee Of Analysts (1982) Oxidised Nitrogen in Waters 1981. In 'Methods for the Examination of Waters and Associated Materials (Blue Book)'. (HMSO: London).

© 2010 19th World Congress of Soil Science, Soil Solutions for a Changing World 46 1 – 6 August 2010, Brisbane, Australia. Published on DVD.
Effect of biosolids P removal treatment on P soil test and availability to corn
Richard WolkowskiA ASenior Scientist, Department of Soil Science, University of Wisconsin, Madison, WI, USA, Email [email protected]
Abstract A field research study was conducted in Wisconsin, USA for three years to determine the relative P avail-ability of municipal biosolids. Sewage treatment plants use a variety of methods to sequester P in biosolids so that a very low P effluent can be discharged to surface water. This study compared fertilizer and biosolids that used lime, alum, iron, and biological methods to remove P from sewage and tested their effect on soil test P and availability to corn at two rates of application. Biosolids produced from the use of alum and iron required more total P applied to increase soil test P compared to those using lime and a biological method. Plant P uptake was not affected by material, but was higher at the high rate of application. Corn grain yield was higher in some years where lime and biological biosolids were applied. This research demonstrates that biosolids treatment does affect P availability and should be a component of nutrient management recommendations. Key Words Sewage sludge, nutrient management, P runoff, maize. Introduction Recently approved nutrient management rules (USDA-NRCS Conservation Practice Standard 590 2006) prescribes the application of nutrients based on the P need of crops compared to the traditional N-based strategy. Studies have shown that high soil test P is correlated with elevated soluble P concentration of runoff, causing the reduction of water quality (Sharpley 1995; Hooda et al. 2000). Currently biosolids (municipal sewage sludge) have been granted an exemption from following a P-based strategy, but many believe that such an exemption is short-sighted. Managing the application of biosolids with a P-based strategy will require a more precise understanding of P availability compared to that understood for fertilizer and animal manure. Research has shown that the P availability from biosolids is lower than that found in fertilizer and manure because of strong binding between P and compounds added during sewage treatment that are intended to sequester P in the solids so that a very low P effluent can be discharged to surface water (O'Connor et al. 2004). This binding may continue after materials have been applied to the land, increasing the amount of applied total P needed to increase soil test P. The research discussed in this paper describes a three-year field study designed to estimate the P availability from several municipal biosolids that have been processed by different P removal methods. Methods A small plot study was established at the University of Wisconsin Arlington Agricultural Research Station (43.30, -89.35) in 2005 on a Plano silt loam soil (Typic Argiudoll, fine, silty, mixed, mesic) using corn (Zea
mays, L.) as the test crop. The site selected for the study had a Bray P1 test in the optimum soil test category (Laboski et al. 2006). Small plots of 3 x 9 m, containing four 0.75-m rows were used and all treatments were replicated three times in a randomized factorial treatment arrangement. Treatments included rates of triple super phosphate fertilizer (0-46-0) applied in 2005 to establish soil test P levels ranging from the initial level to an excessively high category near 100 mg/kg. Biosolids were collected from nearby municipalities and included materials that used P removal methods of: 1) lime-amendment; 2) biological treatment; 3) alum treatment; and, 4) iron treatment. Biosolids materials were hand-applied at rates estimated to supply 112 and 224 kg total P/ha to separate plots in 2005 to 2007. The actual P loading was calculated from a sample of the biosolids collected the day of application. All treatments were applied to existing corn stubble in late April each year and were incorporated with two passes with a coulter chisel plow followed by two passes with a field cultivator. A full-season corn hybrid was planted in early May each year at a population of 86,500 seeds/ha. All non-P fertilizers and crop protection chemicals were uniformly applied at University of Wisconsin recommended rates (Laboski et al. 2006). Glyphosate was applied twice post-emergence for weed control.

© 2010 19th World Congress of Soil Science, Soil Solutions for a Changing World 47 1 – 6 August 2010, Brisbane, Australia. Published on DVD.
Measurement taken during the term of the study included: 1. Total P of the biosolid materials. 2. Annual soil test (Bray P1) for individual plots prior to treatment and following grain harvest. 3. Total dry matter accumulation and mineral nutrient uptake at physiological maturity. 4. Corn grain yield reported at 15.5 g/kg moisture. Data were subjected to an analysis of variance for a factorial treatment arrangement using the statistical procedures of SAS (Statistical Analysis System, Cary, North Carolina). Where significance was found at p=0.05 a Fisher’s LSD was calculated. Results The amount of total P supplied by the various materials is shown in Table 1. Rates of application for the biosolids were estimated from historic analysis supplied by the treatment plant operators. The rates used in this study bracket those that are commonly used to supply the N need for corn. The actual rate of application was determined from the analysis of a sample collected at application. The tabular data should be doubled to provide the 224 kg P/ha rate (2X). The 2X rate of fertilizer resulted in the application of 399 kg P/ha. Table1. Actual total P loading to biosolid treated plots in the P availability study at Arlington, Wis., 2005 to 2007.
P source † 2005
(kg P/ha) 2006
(kg P/ha) 2007
(kg P/ha) Fertilizer 133 -- -- Lime biosolids 133 107 160 Biological biosolids 131 121 128 Alum biosolids 58 55 81 Iron biosolids 125 87 121
† Loading represents the rate estimated to supply 112 kg P/ha (1X). Double values for the 2X rate, which is estimated to supply 224 kg P/ha. The 2X amount of fertilizer supplied 399 kg P/ha. A portion of the applied P of any P-containing material is bound by soil minerals in forms that are not plant available according to calibrated soil testing procedures. This phenomenon is known as buffering and for this soil the accepted value is 9 kg P needed to increase the soil test P level 1 mg/kg. If sewage treatment decreases the availability of P in biosolids, then a higher buffering value would be observed. Table 2 shows the buffer value for the various materials in the year of application. These values are not adjusted for crop P removal. The soil test P value of the control was 16 mg/kg. Differences were observed in both 2005 and 2007 relative to source and showed that alum and iron amended biosolids required more applied P to increase soil test compared to lime treatment and the method that used biological sequestration to remove P. In fact, the fertilizer and biological removal method had a similar buffering value suggesting that P from these sources is similar in its reaction in soils. Table 2. Effect of P source and rate on the amount of applied P needed to increase the soil test P 1 mg/kg, Arlington, Wis., 2005 to 2007†.
P source 2005
(kg P/ha) 2006
(kg P/ha) 2007
(kg P/ha) Fertilizer – 1X 4.0 4.3 7.7 Fertilizer – 2X 3.5 5.4 5.1 Lime biosolids – 1X 3.2 4.7 15.1 Lime biosolids – 2X 4.6 6.5 8.7 Biological biosolids – 1X 4.8 4.3 5.4 Biological biosolids – 2X 4.4 5.8 5.8 Alum biosolids – 1X 12.5 6.7 17.1 Alum biosolids – 2X 4.7 13.0 10.2 Iron biosolids – 1X 9.7 8.0 15.1 Iron biosolids – 2X 10.1 10.7 12.7 Pr>F Source <0.01 0.21 0.02 Rate 0.10 0.15 0.09 Source * Rate 0.02 0.82 0.60
† Formula: Total P applied (kg/ha)/(soil test P – 16) (mg/kg).

© 2010 19th World Congress of Soil Science, Soil Solutions for a Changing World 48 1 – 6 August 2010, Brisbane, Australia. Published on DVD.
The effect of treatment on the P uptake and grain yield is shown in Table 3. If sewage treatment sub-stantially reduced the phyto-availability of P in any of the materials then the total uptake and potentially grain yield could be reduced in crops grown on P responsive soils. The soil test P at the experimental site is characterized as moderately responsive by local soil test calibration. Source did not affect the P uptake in any year; however, as expected, the higher rate of material did affect uptake in 2005 and showed a strong trend for the same response in 2007. Although the control treatment was not included in the analysis of variance, the alum and iron treatments showed lower P uptake than the control in a few cases. Grain yield was affected by source in 2007 and showed a trend for response in 2006. In both situations, yield tended to be higher in the lime-amended and biological treatments compared to the alum and iron treatments, as well as the fertilizer treatment. More detailed statistical analysis will be conducted to compare the differences between the control and P sources, and between various biosolids. Table 3. Whole-plant P uptake at physiological maturity and corn grain yield as affect by P source and
rate, Arlington, Wis., 2005 to 2007.
P uptake (kg P/ha) Grain yield (Mg/ha) P source † 2005 2006 2007 2005 2006 2007 Control 32.3 29.7 31.1 11.6 12.1 12.2 Fertilizer – 1X 45.0 29.8 31.5 11.5 12.4 12.5 Fertilizer – 2X 44.3 29.7 36.0 12.2 12.7 11.5 Lime biosolids – 1X 39.1 28.8 32.3 12.4 13.6 13.2 Lime biosolids – 2X 46.0 29.5 36.1 12.1 13.2 13.7 Biological biosolids – 1X 38.7 36.3 33.4 12.4 13.7 13.0 Biological biosolids – 2X 40.4 31.0 38.9 12.4 13.6 13.3 Alum biosolids – 1X 36.7 25.8 32.2 11.6 12.8 12.9 Alum biosolids – 2X 44.5 32.3 32.3 12.1 12.3 12.6 Iron biosolids – 1X 31.6 36.1 31.5 12.9 12.8 12.4 Iron biosolids – 2X 39.9 37.2 32.4 12.6 13.2 13.4 Pr>F Source 0.14 0.10 0.47 0.37 0.07 <0.01 Rate 0.03 0.64 0.07 0.84 0.85 0.69 Source * Rate 0.57 0.55 0.75 0.80 0.78 <0.01 † Control yield value not included in analysis of variance. Conclusion Future nutrient management regulations will require P-based application of organic waste materials such as municipal biosolids. Biosolids have increased P content because their treatment concentrates P in the material; therefore an over-application of P occurs when attempting to supply a significant portion of the crop N requirement. It is important to have an understanding of P availability of various biosolids to account for the variety of sewage treatment methods that sequester P in the biosolids. It is likely that certain methods result in binding in the soil after application in forms that are not plant available, potentially reducing P availability to the crop. This study showed that alum and iron treatment increased the P buffer value such that more total applied P was required to increase the soil test P one mg/kg compared to the lime and biological treatments. This will reduce the rate at which the soil test P will increase with these treatments so that more material must be applied to obtain a similar soil test. Total P uptake by the corn was not affected by material, but uptake was higher at the 2X rate as might be expected. Grain yield was higher in the lime-amended and biological treatments compared to the alum and iron treatments. This research demonstrates that the treatment of sewage by different means to sequester P results in biosolids that have different relative P availability. When applied to the land biosolids created with alum and iron have a higher P buffering value, which in some cases may reduce the plant availability of P. The biosolids treatment method is a factor that should be considered when selecting rates of biosolids application in the development of a nutrient management plan.
References Hooda PS, Rendell AR, Edwards AC, Withers PJA, Aitken MN, Truesdale VW (2000) Relating soil
phosphorus indices to potential phosphorus release to water. J. Environ. Qual. 29, 1166-1171.
Laboski CAM, Peters JB, Bundy LG (2006) Nutrient application guidelines for field, vegetable, and fruit crops in Wisconsin. Publ. A2809. Univ. of Wisconsin extension, Madison.
O’Conner GA, Sarkar D, Brinton SR, Elliot HA, Martin FG (2004) Phytoavailability of biosolids

© 2010 19th World Congress of Soil Science, Soil Solutions for a Changing World 49 1 – 6 August 2010, Brisbane, Australia. Published on DVD.
phosphorus. Journal of Environmental Quality 33, 703-712.
Sharpley AN (1995) Dependence of runoff phosphorus on extractable soil phosphorus. Journal of
Environmental Quality 24, 920-926.
US Department of Agriculture (2006) Natural Resource Conservation Service Conservation Practice Standard Code 590 Nutrient Management. 12 pp.
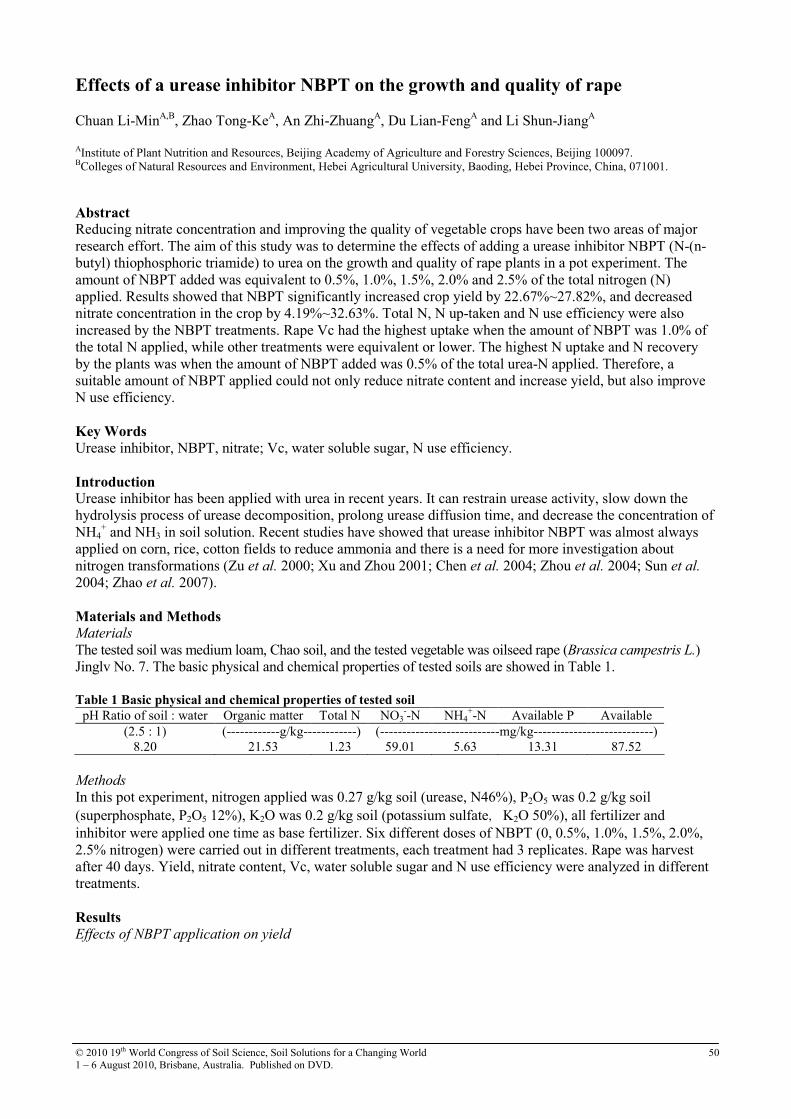
© 2010 19th World Congress of Soil Science, Soil Solutions for a Changing World 50 1 – 6 August 2010, Brisbane, Australia. Published on DVD.
Effects of a urease inhibitor NBPT on the growth and quality of rape Chuan Li-MinA,B, Zhao Tong-KeA, An Zhi-ZhuangA, Du Lian-FengA and Li Shun-JiangA
AInstitute of Plant Nutrition and Resources, Beijing Academy of Agriculture and Forestry Sciences, Beijing 100097. BColleges of Natural Resources and Environment, Hebei Agricultural University, Baoding, Hebei Province, China, 071001. Abstract Reducing nitrate concentration and improving the quality of vegetable crops have been two areas of major research effort. The aim of this study was to determine the effects of adding a urease inhibitor NBPT (N-(n-butyl) thiophosphoric triamide) to urea on the growth and quality of rape plants in a pot experiment. The amount of NBPT added was equivalent to 0.5%, 1.0%, 1.5%, 2.0% and 2.5% of the total nitrogen (N) applied. Results showed that NBPT significantly increased crop yield by 22.67%~27.82%, and decreased nitrate concentration in the crop by 4.19%~32.63%. Total N, N up-taken and N use efficiency were also increased by the NBPT treatments. Rape Vc had the highest uptake when the amount of NBPT was 1.0% of the total N applied, while other treatments were equivalent or lower. The highest N uptake and N recovery by the plants was when the amount of NBPT added was 0.5% of the total urea-N applied. Therefore, a suitable amount of NBPT applied could not only reduce nitrate content and increase yield, but also improve N use efficiency. Key Words Urease inhibitor, NBPT, nitrate; Vc, water soluble sugar, N use efficiency. Introduction Urease inhibitor has been applied with urea in recent years. It can restrain urease activity, slow down the hydrolysis process of urease decomposition, prolong urease diffusion time, and decrease the concentration of NH4
+ and NH3 in soil solution. Recent studies have showed that urease inhibitor NBPT was almost always applied on corn, rice, cotton fields to reduce ammonia and there is a need for more investigation about nitrogen transformations (Zu et al. 2000; Xu and Zhou 2001; Chen et al. 2004; Zhou et al. 2004; Sun et al. 2004; Zhao et al. 2007). Materials and Methods Materials
The tested soil was medium loam, Chao soil, and the tested vegetable was oilseed rape (Brassica campestris L.) Jinglv No. 7. The basic physical and chemical properties of tested soils are showed in Table 1. Table 1 Basic physical and chemical properties of tested soil
pH Ratio of soil : water Organic matter Total N NO3--N NH4
+-N Available P Available (2.5 : 1) (------------g/kg------------) (---------------------------mg/kg---------------------------)
8.20 21.53 1.23 59.01 5.63 13.31 87.52 Methods
In this pot experiment, nitrogen applied was 0.27 g/kg soil (urease, N46%), P2O5 was 0.2 g/kg soil (superphosphate, P2O5 12%), K2O was 0.2 g/kg soil (potassium sulfate,K2O 50%), all fertilizer and inhibitor were applied one time as base fertilizer. Six different doses of NBPT (0, 0.5%, 1.0%, 1.5%, 2.0%, 2.5% nitrogen) were carried out in different treatments, each treatment had 3 replicates. Rape was harvest after 40 days. Yield, nitrate content, Vc, water soluble sugar and N use efficiency were analyzed in different treatments.
Results Effects of NBPT application on yield
© 2010 19th World Congress of Soil Science, Soil Solutions for a Changing World 51 1 – 6 August 2010, Brisbane, Australia. Published on DVD.
274.18b
350.46a 342.20a 336.33a343.46a
336.78a
94.35c
0
50
100
150
200
250
300
350
400
450
CK NPK NBPT
0.5
NBPT
1.0
NBPT
1.5
NBPT
2.0
NBPT
2.5
treatments with different dosage of NBPT
mea
ns o
f yi
elds
(g/
pot)
Figure1. Effects of NBPT application on yield of rape Notes: The values of different treatments are means of three repeats. Different letters in each column mean significant at 5% level, the same below. Effects of NBPT application on NO3
--N content in rape
61.61d
1345.25a
1053.53c
1291.19ab
1078.40c
1242.27b
1014.31c
0
200
400
600
800
1000
1200
1400
1600
CK NPK NBPT0.5
NBPT1.0
NBPT1.5
NBPT2.0
NBPT2.5
treatments with different dosage of NBPT
NO
3- -
N c
onte
nt in
dif
fere
nt
trea
tmen
ts (
mg/
kg)
Figure 2. Effects of NBPT application on NO3
--N content in rape.
Effects of NBPT application on nutrient content
Table 2. Vc and water soluble sugar content in rape treated with different dosage of NBPT
Treatments
Vc content in rape
(mg/100g fresh sample)
Increase(+) or decrease(-) compared to NPK %
Water soluble sugar content in rape %
Increase(+) or decrease(-) compared to NPK %
CK 45.44±4.07a 37.70 1.71±0.14a 111.11 NPK 33.00±5.70b - 0.81±0.15 b - NBPT0.5 32.49±1.48b -1.55 0.74±0.06b -8.04 NBPT1.0 41.00±1.85a 24.24 0.80±0.21b -0.58 NBPT1.5 25.47±1.13c -22.81 0.85±0.19b 5.28 NBPT2.0 28.18±3.97bc -14.60 0.79±0.17b -2.51 NBPT2.5 30.53±3.30bc -7.49 0.77±0.16b -4.17

© 2010 19th World Congress of Soil Science, Soil Solutions for a Changing World 52 1 – 6 August 2010, Brisbane, Australia. Published on DVD.
N use efficiency
Table 3. Effects of total N,,,,N up-taken and nitrogen use efficiency of rape treated with different dosages of
NBPT. Treatments Total N content
in rape (%)
Increase (+)or decrease(-) compared
to NPK (%)
N up taken (g/pot)
Increase (+)or decrease(-)
compared to NPK (%)
N use efficiency (%)
Increase (+)or decrease(-)
compared to NPK % PK 2.19±0.32d -29.00 0.10±0.04 d -73.68 - -
NPK 3.08±0.21c - 0.38±0.03 c - 11.15±0.97c - NBPT0.5 3.69±0.27a 19.91 0.52±0.07 a 37.71 16.80±2.78ab 50.70 NBPT1.0 3.40±0.42abc 10.28 0.52±0.03 ab 36.84 16.72±1.20ab 49.96 NBPT1.5 3.26±0.36abc 5.95 0.40±0.10 c 5.26 11.86±4.02c 6.40 NBPT2.0 3.67±0.22a 19.26 0.53±0.05 a 40.34 17.29±1.84a 55.10 NBPT2.5 3.10±0.30bc 0.65 0.41±0.08 bc 8.76 12.61±3.27bc 13.06
Conclusion NBPT significantly increased crop yield by 22.67%-27.82%, and decreased nitrate concentration in the crop by 4.19%-32.63%. Also it was very strange that there were two NO3
--N peak in the range of 0.5% to 2.5% NBPT. Rape Vc the highest concentration when the amount of NBPT was 1.0%. The highest N uptake and N recovery by the plants was when the amount of NBPT added was at 0.5% of the total urea-N applied, and had no affect on Vc and water soluble sugar content. It is suggested that NBPT 0.5% was the optimum amount in this experiment. References Chen JS, Tang SH, Xu PZ (2004).Study on the nitrogen release dynamics of controlled-release fertilizer and
its effects on quality and yield of leafy vegetables. Chinese Agricultural Science Bulletin 20, 135-137.
Zhou Y, Wang CQ, Chen YX (2004) Effect of different nitrogen fertilizers and fertilizer compounds on the growth and content of nitrate in celery. Soil and Fertilizer 23, 10-13.
Sun AW, Shi YL, Zhang DS (2004) Application of Nitrification-urease Inhibitors in Agriculture. Chinese
Journal of soil science 35, 357-361.
Zhao L, Sun QY, Yu YM (2007) Effect of urease inhibitor nBPT on soil urease activity and urease producing microorganisms. Journal of Dalian Institute of Light Industry 26, 24-27.
Xu XK, Zhou LK (2001) Effect of urease/nitrification inhibitors on the behavior of urea-Nin the soil planted to rice. ACTA ECOLOGICA SINICA 21, 1682-1686.
Xu XK, Zhou LK, Oswald VC (2000) Fate of urea-15N in a soil-wheat system as influenced by urease inhibitor hydroquinone and nitrification inhibitor dicyandiamide. Plant and Soil 220, 261-270.

© 2010 19th World Congress of Soil Science, Soil Solutions for a Changing World 53 1 – 6 August 2010, Brisbane, Australia. Published on DVD.
ESP fly ash application effects on plant biomass and bioconcentration of
micronutrients in nursery seedlings of Populus deltoides
Sudha JalaA and Dinesh GoyalB ACentre for Biodiversity Studies, Baba Ghulam Shah Badshah University, Rajouri – 185131 (J&K) India, Email [email protected] BDepartment of Biotechnology and Environmental Sciences, Thapar University, Patiala - 147004, Punjab, India, Email [email protected]
Abstract Fly ash mixed with soil on a w/w basis at concentrations of 0, 5, 10, 20 and 30 per cent was used for growing nursery seedlings of Populus deltoides to see the effect of fly ash application on biomass production and bioconcentration of Fe, Mn and Zn in stems and leaves. Fly ash application @ 20 % (w/w) fly ash was found to be optimum for preparing potting mix for Populus deltoides. Biomass accumulation in the stems and roots increased with increase in the rate of fly ash application up to 20 per cent whereas the biomass accumulation in leaves as well as total biomass accumulation in the Populus saplings increased with fly ash application up to a level of 10 per cent only. Bio concentration of micronutrients Fe, Mn and Zn in stem and leaves of Populus deltoides displayed higher values up to 10 per cent level of fly ash application, and thereafter declined by a magnitude of 78, 71 and 62 per cent respectively. Fly ash when added to the soil at an optimum level of 20 % benefits biomass production and increase in plant growth which in turn attains significance from the point of view of eco-friendly disposal of fly ash. Key Words Bioconcentration factor, biomass accumulation, metal uptake.
Introduction Fly ash is a repository of nutrients which can benefit plant growth and increase biomass production. Fly ash has been reported to contain low amounts of C and N, medium amounts of available K and high concentration of available P (Sharma and Kalra 2006). Species belonging to genus Populus have a good capability of accumulating metals in the aerial portions due to their fast growth, more water usage and extensive root system (Vose et al. 2000; McLinn et al. 2001). Organisms achieve a chemical equilibrium with respect to a particular medium or route of exposure (Mountouris et al. 2002). Distribution of any element in environment is dependent on continous exchange between air, water, soil/sediment and biota (Agoramoorthy et al. 2008). Based on these two assumptions, bioaccumulation of elements can be quantified using a bioconcentration factor. Bioconcentration Factor (BCF) provides an index of the ability of the plant to accumulate a particular element with respect to its concentration in the soil (McGarth and Zhao 2003). In the present study, fly ash was used as a soil ameliorant for nursery seedlings of Populus deltoides to see its effect on biomass production and bioconcentration of Fe, Mn and Zn in stems and leaves. Materials and methods Electrostatic precipitator (ESP) fly ash collected from Guru Gobind Singh Thermal Power Plant, Ropar, Punjab in Northern India was air-dried prior to analysis. Soil from Thapar Technology Campus, Patiala, Punjab was collected from 0-30 cm depth and spread on polythene sheets, air-dried and sieved through a 2 mm sieve for chemical analysis. The pH of fly ash and soil used in the study was 5.28 and 7.63 and electrical conductivity was 50 x 10-3 and 59 x 10-3 dS/m respectively. The chemical properties of ESP fly ash and soil used in the study are listed in Table 1. Fly ash was mixed with soil on a w/w basis at concentrations of 0, 5, 10, 20 and 30%. The different fly ash-soil mixtures were placed in polythene bags perforated at the bottom. Shoot cuttings for the nursery trial were taken from full grown trees of Populus deltoides and were further segregated for uniform diameter (0.8 cm) and length (15 cm). The cuttings were washed and treated with IBA (4000 ppm) before being planted into the bags with 20 replications per treatment. The bags were placed in a screen house and weeding was carried out regularly. The nursery was grown for a period of four months. After four months the plants of Populus deltoides were gently uprooted and washed with water to remove any adhering soil particles. Thereafter the plants were dried with blotting sheets and weighed for fresh weight. The plants were then kept overnight in an oven at 65 ºC and weighed again for dry weight. To measure the bioconcentration of Fe, Mn and Zn in stems and leaves, the dried leaves and stems were ground

© 2010 19th World Congress of Soil Science, Soil Solutions for a Changing World 54 1 – 6 August 2010, Brisbane, Australia. Published on DVD.
followed by sieving with a 0.2 mm sieve to obtain a fine powder and analyzed for Fe, Mn and Zn using atomic absorption spectrophotometer (Page et al. 1982). Bioconcentration factor for Fe, Mn and Zn was calculated in stems as BCFS= Cstem/Csoil and leaves BCFL = Cleaf/Csoil where C is the concentration of a particular metal in ppm. Table 1. Chemical characterization of ESP fly ash and soil used in nursery trial.
Property ESP fly ash Soil Property ESP fly ash Soil pH 5.82 7.63 Zn (ppm) 210 35.1 EC (x10-3 dS/m) 50 59 Mn (ppm) 530 338 N (%) 0.20 0.41 Mo (ppm) 4.4 3.2 P (%) 0.224 0.03 As (ppm) 6.7 3.9 K (%) 0.0043 0.002 Se (ppm) 4.2 2.4 S (%) 0.069 1.11 Pb (ppm) 28.5 21.7 Ca (%) 0.024 0.04 Ni (ppm) 25.3 25.2 Mg (%) 0.187 0.15 Cd (ppm) <0.009 <0.009 Na (%) 0.0018 0.003 Cr (ppm) 49.4 35.9 Fe (%) 0.219 0.18 Co (ppm) 15.1 11.5 Cu (ppm) 19.9 <0.025
Results and discussion Biomass accumulation in the stems and roots increased with increase in the rate of fly ash application up to 20 per cent level of fly ash application, whereas the biomass accumulation in leaves as well as total biomass accumulation in the Populus saplings increased with fly ash application up to a level of 10 per cent only (Figure 1). Fly ash concentration in the potting mixture accounted for up to 69, 62 and 89 per cent of the variation in biomass accumulation in the stems, leaves and roots respectively when biomass accumulation was fitted as a quadratic function of fly ash concentration (Figure 1). Overall, the concentration of fly ash in the potting mixture accounted for 93 per cent of the variation in total biomass accumulation when biomass accumulation was fitted as a quadratic function of fly ash concentration (Figure 2). Biomass production in Populus is benefited as a result of amelioration with fly ash since combination of surface soil layer and a layer of fly ash underneath can provide a substrate capable of supporting plant growth (Bi et al. 2003). The content of Fe, Mn and Zn in the soil increased substantially from 2180 to 7175, 310 to 555 and 25 to 55.3 ppm respectively with fly ash application up to 30 % (Table 2). In other words, soil was enriched in Fe, Mn and Zn by up to 229, 79 and 121 per cent respectively with fly ash application @ 30 per cent. Bioconcentration of iron, manganese and zinc in stem and leaf without any fly ash application, as measured by bio-concentration factor was 0.52 and 0.62; 0.09 and 0.09; and, 2.69 and 1.31, in the same order. This indicates that the stem and leaves were relatively impoverished in iron and manganese and relatively abundant in zinc as compared to the soil matrix.
y = -0.0013x2 + 0.0153x + 0.924
R2 = 0.62
y = -0.0007x2 + 0.0243x + 0.044
R2 = 0.89
y = -0.0033x2 + 0.1174x + 5.5079
R2 = 0.69
0
1
2
3
4
5
6
7
8
0 5 10 15 20 25 30 35
Fly ash (%)
Stem Biomass (g)
0
0.2
0.4
0.6
0.8
1
1.2
1.4
Leaf or Root Biomass (g)
Stem Leaf Root
Figure 1. Biomass accumulation in various plant parts of nursery seedlings of Populus deltoides as a function of
fly ash addition.

© 2010 19th World Congress of Soil Science, Soil Solutions for a Changing World 55 1 – 6 August 2010, Brisbane, Australia. Published on DVD.
y = -0.0053x2 + 0.157x + 6.4758
R2 = 0.93
6.2
6.4
6.6
6.8
7
7.2
7.4
7.6
7.8
0 5 10 15 20 25 30 35
Fly ash (%)
Biomass (g)
Figure 2. Total biomass accumulation in nursery seedling of Populus deltoides as function of fly as concentration.
A reduced bioconcentration factor of nutrients is attributed to an increased metal concentration in soil (Unnisa et al. 2008). Bioconcentration in the stem and leaves of Populus was least for manganese and maximum for zinc. Bienfait et al. (1982) have reported highest bioconcentration factor for Fe in both stem and leaves with a reasoning that if the pH of soil ranges from 6.74 to 6.92, as was their case, the reduction of ferric to ferrous iron is stimulated leading to iron accumulation in plant parts. The different behaviour in the bioconcentration of different micronutrients in this study is attributed to a greater soil pH (7.63). Considerable proportion of nutrient elements in soil are remobilised according to pH and are potentially available for plant uptake and incorporation in soil solution (Riba et al. 2002). Table 2. Micronutrients Fe, Mn and Zn in fly ash amended soil used in nursery trial of Populus deltoides.
Micro nutrient content (ppm) Fly ash added Fe Mn Zn
0 2180 310 25 5 3500 475 34.6 10 5795 520 43.1 20 6040 540 48.3 30 7175 555 55.3
Bio concentration of micronutrients Fe, Mn and Zn in stem and leaves of Populus deltoides displayed higher values up to 10 per cent level of fly ash application, and thereafter declined (Figure 2).The bioconcentration factor of iron, manganese and zinc averaged for the stems and leaves, decreased by a magnitude of 78, 71 and 62 per cent when the level of fly ash incorporation was increased from 10 to 20 per cent. This could be attributed to a decrease in plant uptake of iron, manganese and zinc by a magnitude of 76, 71 and 51 per cent respectively when the level of fly ash incorporation was increased from 10 to 20 per cent. A clear relationship does not always exist between the nutrient elements (such as Fe, Mn and Zn in this study) of the soil or soil solution and their uptake by plants since it depends upon each step of uptake pathway and pH of soil (Kallis et al.2007). Conclusions Increased biomass accumulation was observed up to 10-20 per cent level of fly ash application in various plant parts of Populus. Fly ash concentration in the potting mixture accounted for up to 69, 62, 89 and 93 per cent of the variation in biomass accumulation in the stems, leaves, roots and on whole plant basis respectively. Fly ash application up to 30 per cent enriched the soil in Fe, Mn and Zn but simultaneously led to a relative impoverishment of the stem and leaves in Fe and Mn and a relative enrichment in Zn as compared to the soil matrix. Thus Populus cultivation may be explored as an environmentally sound and cost effective technology for proper disposal and utilization of solid wastes such as fly ash.

© 2010 19th World Congress of Soil Science, Soil Solutions for a Changing World 56 1 – 6 August 2010, Brisbane, Australia. Published on DVD.
References Agoramoorthy G, Chen Fu-An, Hsu MJ (2008) Threats of heavy metal pollution in halophytic and mangrove
plants of Tamil Nadu, India. Environmental Pollution 155, 320-326.
Bi YL, Li XL, Christie P, Hu ZQ, Wong MH (2003) Growth and nutrient uptake of arbuscular mycorrhizal maize in different depths of soil overlying coal fly ash. Chemosphere 50, 863-869.
Bienfait HF, Duivenvoorden J, Verkerke W (1982) Ferric reduction by roots of chlorotic bean plants: Indications for an enzymatic process. Journal of. Plant Nutrition 5, 451-456.
Kallis EJJ, Temminghoff EJM, Visser A, Riemsdijk WH van (2007). Metal uptake by Lolium perenne in contaminated soils using a four-step approach. Environmental Toxicology and Chemistry 26, 335-345.
McLinn EL, Vondracek JE and Aitchison EA (2001) Monitoring radiation with tumbling leaves: Assessing the effectiveness of a full scale phytoremediation system. In : Phytoremediation, Wetlands and Sediments, pp. 121-127 (Leeson, A.,Foote, E. banks, M.K., Magar, V.S., Eds. ) Columbus, Batelle.
Mountouris A, Voutsas E, Tassios D (2002) Bioconcentrations of heavy metals in aquatic environments: the importance of bioavailability. Marine Pollution Bulletin 44, 1136-1141.
Page AL (1982) Methods of Soil Analysis Part II. Soil Science Society of America, Madison, Wisconsin.
Riba I, DclValls TA, Forja JM, Gomez Parra A (2002) Influence of the Aznalcollar mining spill on the vertical distribution of heavy metals in sediments from Guadalquiver estuary(SW Spain). Marine
Pollution Bulletin 44, 39-47.
Sharma SK, Kalra N (2006) Effect of fly ash incorporation on soil properties and productivity of crops: A review. Journal of Scientific and Industrial Research. 65, 383-390.
Unnisa SA, Seshabala P, Reddy PCS (2008) Synergistic use of transgenic plants to remediate the soil. Pollution Research 2, 269-272.
Vose JM, Swank WT, Harvey GJ, Clinton BD and Sobek C (2000) Leaf water relations and sapflow in eastern cottonwood (Populus deltoids Batr.) trees planted for remediation of ground water pollutant. International Journal of Phytoremediation 2, 53-73.

© 2010 19th World Congress of Soil Science, Soil Solutions for a Changing World 57 1 – 6 August 2010, Brisbane, Australia. Published on DVD.
Evidence of soil microbial population acclimatisation to long-term application of
winery wastewater
Kim P MosseA, B, C, Antonio F PattiA, B and Timothy R CavagnaroC, D ASchool of Applied Sciences and Engineering, Monash University, Churchill, Vic. 3842, Australia BCentre for Green Chemistry, Monash University, Clayton, Vic. 3800, Australia CSchool of Biological Sciences, Monash University, Vic. 3800, Australia DAustralian Centre for Biodiversity, Monash University, Vic. 3800, Australia
Abstract The long-term treatment of soil with winery wastewater (WWW) leads to an acclimatised soil microbial population. The acclimatised soil displays greater biological activity when exposed to further irrigation with winery wastewater. In this study, soil which had been acclimatised to winery wastewater for about 30 years was compared to the same soil, which had not received the same water. Furthermore, many medium to large wineries have their own water treatment plants. The ability to reuse winery wastewater, treated or untreated, requires a fundamental understanding of the potential toxicity of the water at different times of the year, coupled with the effects of the water on soils and plants. Two matched sites on the same soils were both treated with WWW (treated and untreated) and the microbial activity in the soils was monitored over two weeks, by measuring CO2 efflux and a range of other soil parameters. It was found that the acclimatised soil displayed greater microbial activity, particularly with the untreated winery wastewater. Soil ammonium levels showed overlapping effects, however, elevated ammonium levels peaking after 6 days were associated with the acclimatised soil. Key Words Winery wastewater, soil microbial activity, CO2 efflux. Introduction Land disposal of agro-industrial wastewaters is a potentially sustainable management practice, and could be of significant benefit in water-poor winegrowing regions of the world, including South Africa, California and south-eastern Australia. Currently, this practice is limited to designated ‘dumping areas’ and is generally considered to be unsuitable for irrigation of vines or crops; one of the key concerns is the long-term implications such a practice might have on soil health. Winery wastewater arises mostly from cleaning operations and spillage within the winery, and therefore is likely to consist of wine, grape juice and solids (vintage season only) and cleaning agents. The wastewater in most wineries is high in organics , containing predominantly sugars, followed by organic acids (acetic, tartaric, propionic), esters and polyphenols (Malandra et al. 2003). Inorganic ions present are predominantly potassium and sodium, with low levels of calcium and magnesium (Chapman et al. 1995). Whilst the constituents appear to be reasonably consistent across all wineries, the volumes generated and exact values are variable; for example, the Spanish wine industry generates six times the volume of wastewater than Italy or France (Bustamante et al. 2005), therefore meaning that direct comparisons of waste streams are largely insignificant. It is also important to note that the variability in wastewaters applies both spatially and temporally; the wastewater quality within a particular winery has been shown to vary on an hourly basis (Chapman 1995). As mentioned above, a major concern with wastewater reuse is the long term sustainability of such a practice. Whilst the effects of many contaminants are often not evident for a number of years, microbial populations have been shown to be an early warning signal of ecosystem perturbations (Wakelin et al. 2008; Friedel et al. 2000), and therefore of potentially unsustainable practices. Microorganisms play vital roles in nutrient and energy cycling, and are therefore are a critical component of any functioning ecosystem. This study aimed to assess the effects that long-term winery wastewater application upon vineyard soils has on the response to subsequent winery wastewater applications. A selection of preliminary results is presented in this paper.
Methods Field Studies
Field studies were conducted in Coldstream, Victoria, Australia, in May-June 2009. Plots were located in two sites; ‘acclimatised’ soil, which had received winery wastewater and solid waste over a 30 year period, and ‘non-acclimatised’ soil, which had no history of wastewater application. The two sites were adjacent to
© 2010 19th World Congress of Soil Science, Soil Solutions for a Changing World 58 1 – 6 August 2010, Brisbane, Australia. Published on DVD.
each other, separated by a man-made creek/drain. The soils at both sites were grey-brown silty clay loams of uniform texture formed on the Yarra River alluvial plain. The vegetative cover of the soils were predominantly weeds and pasture species. For each water treatment (winery wastewater, WWW; treated winery wastewater, TWWW; pure water dH2O), 8L of water was applied to each of four replicate plots (1.5mx1.5m) over an eight-hour period. This was equivalent to application of 36ML/Ha, and consistent with industrial application rates.
Soil Sampling
From each plot, four soil samples were collected using a Dutch auger to collect the surface soil (0-7 cm), and the samples pooled to provide a replicate sample. Samples were collected 24 hours prior to water application, and 1, 3, 7 and 16 days after water application. Soil respiration was measured at each of these time points using a LiCor 6400 in conjunction with 10cm PVC collars inserted into each plot.
Soil physicochemical analyses
Inorganic N was extracted in the field, using 2M KCl. Extracts (three replicates) were frozen, and later used to determine nitrate (not reported here) and ammonium using the a modification of the methods of Miranda et al. (2001) for NO3- (plus NO2-) and Forster (1995) for NH4
+
All spectrophotometric analyses were performed in Greiner 96 well plates, and analysed using a TeCan Evo Spectrophotometer.
Microbial Respiration and PLFA Analysis
Soil respiration was measured at each sampling time point using a LiCor 6400 in conjunction with 10cm PVC collars inserted into each plot. PLFA analysis is currently being conducted on sub-samples of fresh soil, but the data is not yet available for inclusion in this paper.
Statistical analysis
Results were analysed using a mixed model analysis in SPSS 16.0. Results and discussion Respiration
The application of wastewater resulted in significant increases in soil microbial activity, as shown by an increase in CO2 efflux (Figure 1). This increase in CO2 efflux was particularly evident the day after application, and was most noticeable in the acclimatised soils, with the application of untreated WWW. In general, the microbial response to water addition was greater in the acclimatised soil than the non-acclimatised soil, although the initial CO2 efflux values were quite similar. This suggests that the microbial population in the acclimatised soils has altered, and responds more quickly when WWW is applied. The application of untreated winery wastewater to the acclimatised soil gave the greatest CO2 efflux (~8.3 umol/cm3/sec) effect, one day after the water treatment. In contrast, the non-acclimatised soil also showed a peak in CO2 efflux after one day, but somewhat lower ((~3.3 umol/cm3/sec). The acclimatised soil subjected to TWWW showed a slight increase in CO2 efflux, whereas, the non-acclimatised soil showed little change with TWWW. The distilled water treatment of both acclimatised and non-acclimatised soils did show some difference at day one, with the greater CO2 efflux in the acclimatised soil. In all cases, the CO2 efflux had dropped to “baseline” levels after 7 days. The results indicated that the soil which had a long history of winery wastewater application is likely to have different microbial populations, which have adapted to the water, hence the greatest response. The non-acclimatised soil did respond but to a lesser extent. The treated wastewater contained lower levels of total dissolved carbon and other nutrients, hence the lower responses, but nevertheless, TWWW still showed some response in the acclimatised soil, peaking at day 1. Soil ammonium levels were also significantly affected by WWW addition, although the trends were not as consistent as in the case of respiration (Figure 1). Once again, the largest spike occurred in the combination of WWW and acclimatised soil; there was also a large spike for the combination of TWWW and non-acclimatised soil. Interestingly, the timing of these two spikes is separated by six days. These observations reflect two different effects are operating. The initial spike in ammonium levels observed one day after the addition of different water treatments to the soils may be associated with solubilisation of existing ammonium ions held in the soil. Interestingly, the distilled water treatment of the non-acclimatised soil shows no spike, suggesting pre-existing ammonium ion is negligible or below detection in the non-
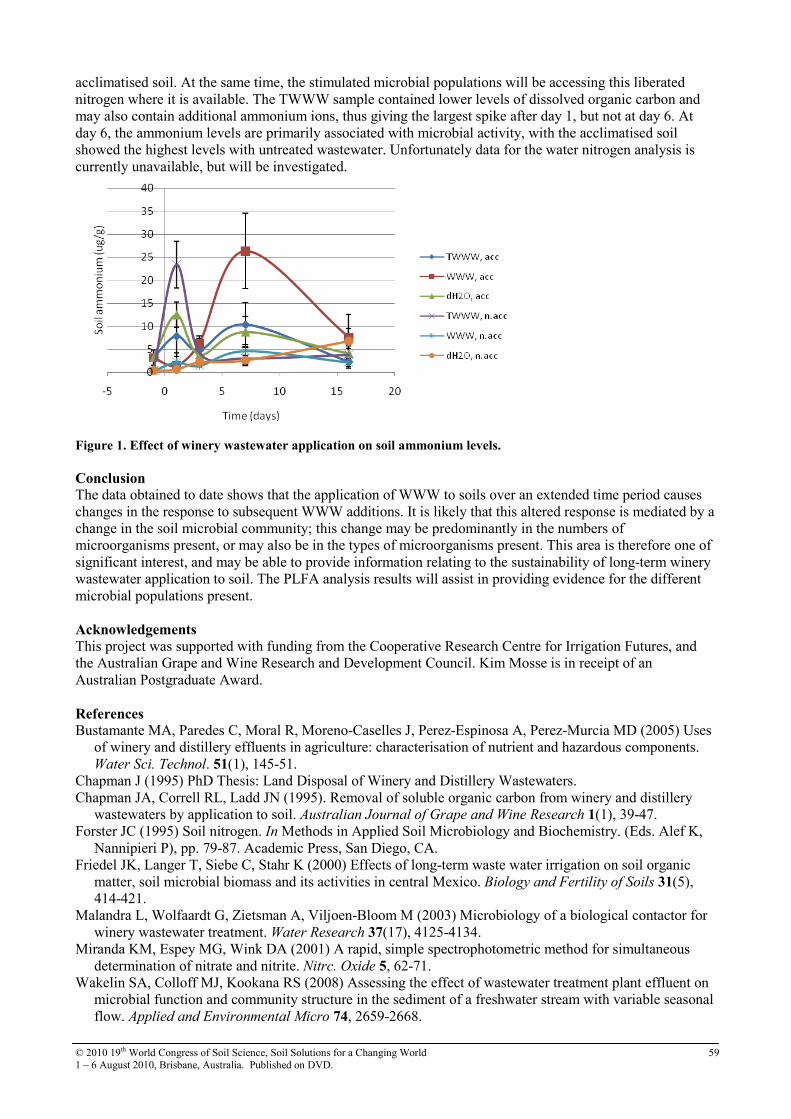
© 2010 19th World Congress of Soil Science, Soil Solutions for a Changing World 59 1 – 6 August 2010, Brisbane, Australia. Published on DVD.
acclimatised soil. At the same time, the stimulated microbial populations will be accessing this liberated nitrogen where it is available. The TWWW sample contained lower levels of dissolved organic carbon and may also contain additional ammonium ions, thus giving the largest spike after day 1, but not at day 6. At day 6, the ammonium levels are primarily associated with microbial activity, with the acclimatised soil showed the highest levels with untreated wastewater. Unfortunately data for the water nitrogen analysis is currently unavailable, but will be investigated.
Figure 1. Effect of winery wastewater application on soil ammonium levels.
Conclusion The data obtained to date shows that the application of WWW to soils over an extended time period causes changes in the response to subsequent WWW additions. It is likely that this altered response is mediated by a change in the soil microbial community; this change may be predominantly in the numbers of microorganisms present, or may also be in the types of microorganisms present. This area is therefore one of significant interest, and may be able to provide information relating to the sustainability of long-term winery wastewater application to soil. The PLFA analysis results will assist in providing evidence for the different microbial populations present.
Acknowledgements This project was supported with funding from the Cooperative Research Centre for Irrigation Futures, and the Australian Grape and Wine Research and Development Council. Kim Mosse is in receipt of an Australian Postgraduate Award.
References Bustamante MA, Paredes C, Moral R, Moreno-Caselles J, Perez-Espinosa A, Perez-Murcia MD (2005) Uses
of winery and distillery effluents in agriculture: characterisation of nutrient and hazardous components. Water Sci. Technol. 51(1), 145-51.
Chapman J (1995) PhD Thesis: Land Disposal of Winery and Distillery Wastewaters. Chapman JA, Correll RL, Ladd JN (1995). Removal of soluble organic carbon from winery and distillery
wastewaters by application to soil. Australian Journal of Grape and Wine Research 1(1), 39-47. Forster JC (1995) Soil nitrogen. In Methods in Applied Soil Microbiology and Biochemistry. (Eds. Alef K,
Nannipieri P), pp. 79-87. Academic Press, San Diego, CA. Friedel JK, Langer T, Siebe C, Stahr K (2000) Effects of long-term waste water irrigation on soil organic
matter, soil microbial biomass and its activities in central Mexico. Biology and Fertility of Soils 31(5), 414-421.
Malandra L, Wolfaardt G, Zietsman A, Viljoen-Bloom M (2003) Microbiology of a biological contactor for winery wastewater treatment. Water Research 37(17), 4125-4134.
Miranda KM, Espey MG, Wink DA (2001) A rapid, simple spectrophotometric method for simultaneous determination of nitrate and nitrite. Nitrc. Oxide 5, 62-71.
Wakelin SA, Colloff MJ, Kookana RS (2008) Assessing the effect of wastewater treatment plant effluent on microbial function and community structure in the sediment of a freshwater stream with variable seasonal flow. Applied and Environmental Micro 74, 2659-2668.

© 2010 19th World Congress of Soil Science, Soil Solutions for a Changing World 60 1 – 6 August 2010, Brisbane, Australia. Published on DVD.
Gully erosion stabilization in a highly erodible Kandiustalf soil Maria Teresa Vilela Nogueira AbdoA, Sidney Rosa VieiraB, Antônio Lúcio Mello MartinsC and Luis Cláudio Patterno SilveiraD
AAPTA, PO Box 24, Zip code:15830-000 Pindorama, SP,Brazil, Email [email protected] BIAC, PO Box 28, Zip code: 13001-970, Campinas, SP, Brazil, Email [email protected] CAPTA, PO Box 24, Zip code:15830-000 Pindorama, SP,Brazil, Email [email protected]
DUFLA, PO Box 3037, Zip Code: 37200-000 Lavras, MG, Brazil, Email [email protected] Abstract The increase in the area of degraded land threatens the productivity of agroindustry and therefore undermines socio-economical development. The rehabilitation of these areas should be done by a multidisciplinary team. The immediate environmental consequences of the soil degradation are loss in water quality and significant loss of biodiversity in natural flora and fauna. Besides compromising the fertile soil layer there are changes in water flow quality and regime. The absence of conservation practices, the natural forest absence or insufficient plant cover result in the process acceleration. This work shows a stabilization of a degraded soil by an erosive process that produced a gully of approximately 700 meters in length and up to 15 meters deep in some places. Four ponds in a toposequence having lateral spillways channels made of concrete generated a slow passage of the water, stabilizing the erosive process. Altogether conservation practices were incorporated in the parallel contribution areas ensuring the system sustainability over the years (Project of Environmental Recovery of the Experimental Station in Pindorama, SP, Brazil -FAPESP project 95/7818-9). Key Words Soil conservation, degraded area recuperation, environmental recuperation, erosion. Introduction Erosion and loss of topsoil are the greatest challenges to agriculture sustainability. The biggest cause of soil erosion is water. Loss of nutrient rich topsoil causes decrease in plant growth and soil productivity because sub-soils are generally less fertile. It can be considered that agriculturally valuable soil stock is finite because topsoils are not renewed as fast as they are degraded and eroded. Agriculture will not be sustainable unless the soil be rehabilitated to reverse the degradation process. From the 1980’s a new economic development concept arose, incorporating social and environmental preservation, and a new ideal emerged: the sustainability, defined as a set of practices that involve the appropriate management of resources to satisfy human needs, whilst maintaining or enhancing the environment quality and conserving the natural resources. In Brazil, although there are no exact data, deforestation followed by agricultural activities are major degradation factors. There is beneficial natural erosion which forms soil through parent material decomposition process through the action of temperature, winds and rains. On the other hand, accelerated erosion is a result of human misuse of land where soil losses are no longer compensated by the geologic substrate or by the alluvial contributions. The water infiltration impossibility generating runoff and so promoting the material drag and deposition of material from various soil horizons, is the erosion fundament. Moreover it should be noticed that 95% of soil erosion is due to the poor water infiltration and accelerated runoff and only 5% due to the land slope. Whatever the agent, erosion occurs in three stages: breakdown, transport and soil material deposition. Some authors divide the water erosion into laminar (superficial) and linear, presenting 3 types: grooves, ravines, and gullies including underground e.g. tunnel gullying. Gullying accounts for much erosion and is hard to control. Gullies can be branched, deep, presenting irregular walls, and presenting “U” transverse profiles. This form of erosion is more complex and more destructive, as is the product of the combined action of superficial and underground runoff leading to a morpho-hydro-pedologic imbalance due to inappropriate use and occupation of the land. In this study we report on the soil erosion problems of the Pindorama municipality (Vieira et al. 1997 and Abdo, 1997). These soils, mostly classified as Kandiustalf, have high erosion susceptibility (Lepsch and Valadares 1976). The São Domingos river basin, where Pólo Apta Centro Norte is located, erosion susceptibility is mostly in the Classes I and II (very high and high). There is 50 years of accumulated data on erosion at Polo Apta Centro Norte, and some soil conservation practices developed in the county to reduce the problem are
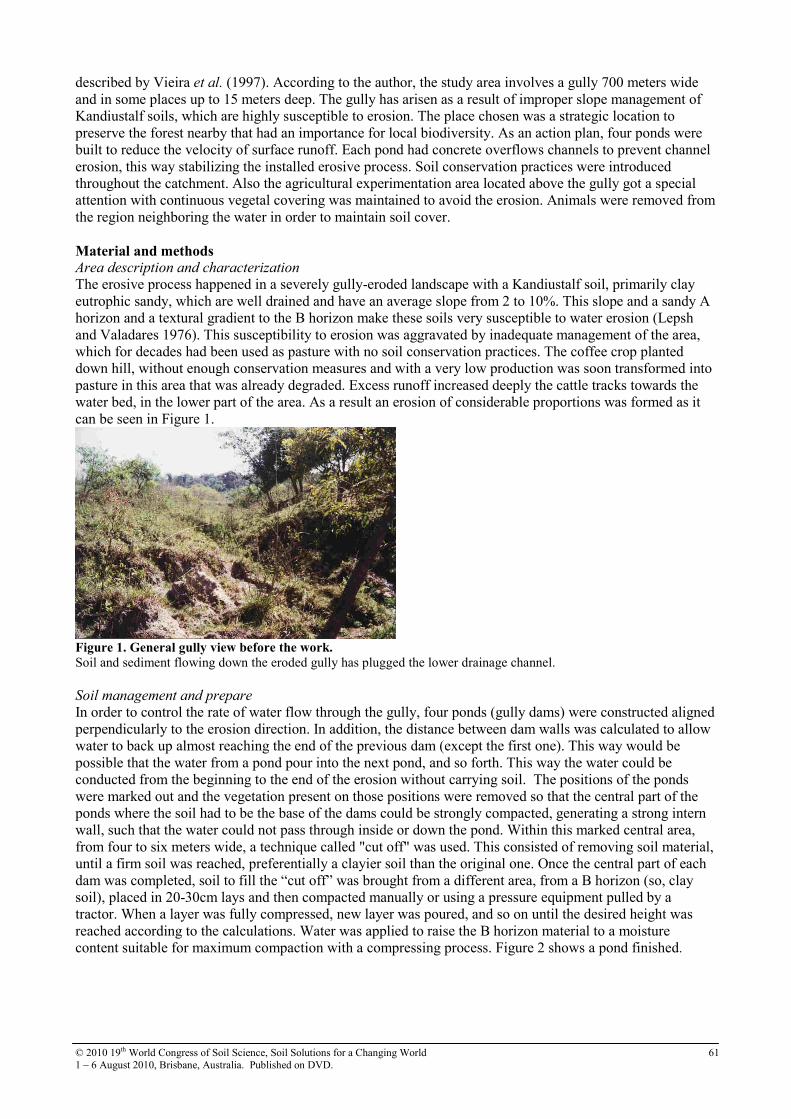
© 2010 19th World Congress of Soil Science, Soil Solutions for a Changing World 61 1 – 6 August 2010, Brisbane, Australia. Published on DVD.
described by Vieira et al. (1997). According to the author, the study area involves a gully 700 meters wide and in some places up to 15 meters deep. The gully has arisen as a result of improper slope management of Kandiustalf soils, which are highly susceptible to erosion. The place chosen was a strategic location to preserve the forest nearby that had an importance for local biodiversity. As an action plan, four ponds were built to reduce the velocity of surface runoff. Each pond had concrete overflows channels to prevent channel erosion, this way stabilizing the installed erosive process. Soil conservation practices were introduced throughout the catchment. Also the agricultural experimentation area located above the gully got a special attention with continuous vegetal covering was maintained to avoid the erosion. Animals were removed from the region neighboring the water in order to maintain soil cover. Material and methods Area description and characterization
The erosive process happened in a severely gully-eroded landscape with a Kandiustalf soil, primarily clay eutrophic sandy, which are well drained and have an average slope from 2 to 10%. This slope and a sandy A horizon and a textural gradient to the B horizon make these soils very susceptible to water erosion (Lepsh and Valadares 1976). This susceptibility to erosion was aggravated by inadequate management of the area, which for decades had been used as pasture with no soil conservation practices. The coffee crop planted down hill, without enough conservation measures and with a very low production was soon transformed into pasture in this area that was already degraded. Excess runoff increased deeply the cattle tracks towards the water bed, in the lower part of the area. As a result an erosion of considerable proportions was formed as it can be seen in Figure 1.
Figure 1. General gully view before the work. Soil and sediment flowing down the eroded gully has plugged the lower drainage channel.
Soil management and prepare
In order to control the rate of water flow through the gully, four ponds (gully dams) were constructed aligned perpendicularly to the erosion direction. In addition, the distance between dam walls was calculated to allow water to back up almost reaching the end of the previous dam (except the first one). This way would be possible that the water from a pond pour into the next pond, and so forth. This way the water could be conducted from the beginning to the end of the erosion without carrying soil. The positions of the ponds were marked out and the vegetation present on those positions were removed so that the central part of the ponds where the soil had to be the base of the dams could be strongly compacted, generating a strong intern wall, such that the water could not pass through inside or down the pond. Within this marked central area, from four to six meters wide, a technique called "cut off" was used. This consisted of removing soil material, until a firm soil was reached, preferentially a clayier soil than the original one. Once the central part of each dam was completed, soil to fill the “cut off” was brought from a different area, from a B horizon (so, clay soil), placed in 20-30cm lays and then compacted manually or using a pressure equipment pulled by a tractor. When a layer was fully compressed, new layer was poured, and so on until the desired height was reached according to the calculations. Water was applied to raise the B horizon material to a moisture content suitable for maximum compaction with a compressing process. Figure 2 shows a pond finished.

© 2010 19th World Congress of Soil Science, Soil Solutions for a Changing World 62 1 – 6 August 2010, Brisbane, Australia. Published on DVD.
Figure 2. Pond construction.
After the construction, the ponds sides were covered with grass. The whole area that was cleaned initially was covered with grass to avoid erosion around the ponds, which could compromise the investments done as well all the work done (Figure 3). To enable the free running of the flow of excess water from rain, concrete drain canals were constructed to minimize dam wall erosion in storm conditions.
Figure 3. Grass planting in the dams.
Figure 4. Present view of the dams.
Results and discussion The gully erosion has been stabilized in the highly erosive Kandiustalf soil by avoiding channel flow and controlling the velocity of surface run-off. Actually, as it has been ten years from the beginning of the project, it can be considered that the stabilization/rehabilitation process offers farmers a solution to the erosion problem, minimizing their loss of soil and returning the land to a productive state (Figure 4). In the example presented, the gully which was formed by previous unsustainable agriculture practices was stabilized avoiding pollution and forest destruction that is just above the eroded area, ensuring the area

© 2010 19th World Congress of Soil Science, Soil Solutions for a Changing World 63 1 – 6 August 2010, Brisbane, Australia. Published on DVD.
stability. The area that was previously used for agriculture was unviable to any activity due the progressing erosion and it is now suitable use again without erosion risk.
Conclusions Within this context it is still worth considering the idea that it is always better to prevent than solve a soil erosion problem already installed because once the soil loses its physical and chemical characteristics it will hardly get them back. It is also important to emphasize that when the erosion problem is detected, the actions taken to reverse the process must be based on a multidisciplinary approach which considers all factors at work in the erosion feature, its surroundings and necessary restorative structures and vegetation. In the context of this study to solve gully erosion, the “drainage divide concept” was able to minimize the local soil losses and to ensure that the work was done for sustainability, restoring a sustainable vegetative cover. References Abdo MTVN (1999) Recuperação de áreas degradadas: o exemplo da voçoroca em Pindorama. Catanduva-
S: FAFICA/UEL, 158p. (Monografia - Curso de Especialização em Geografia e Meio Ambiente).
Costa LM, Shaefer CEGR, Costa OV, Olzevski N, Nacif PGS (2003) Manejo, qualidade do solo e sustentabilidade. In ‘Congresso Brasileiro De Ciência Do Solo’., 29, Artigo. Ribeirão Preto, SP (CD-ROM).
Hernani LC, Freitas PL, Pruski FF, de Maria IC, Castro Filho C, Landers JNA (2002) A erosão e seu impacto. In: (Ed CV Manzato, Freitas E, Peres JR). Uso agrícola dos solos brasileiros. Rio de Janeiro: Embrapa Solos, 2002. Lepsch, IF e Valadares, JMAS 1976. Levantamento pedológico detalhado da Estação Experimental de Pindorama. Bragantia, Campinas, v. 35, n. 40.
Mesquita HA, de Paula MB, Alvarenga MIN (2000) Indicadores de impactos ambientais das atividades agropecuárias. Informe Agropecuário, Belo Horizonte 21, 70-71.
Van RAIJ B (2003) Solo e meio ambiente. In: Congresso Brasileiro de ciência do solo,29. Palestra, Ribeirão Preto, SP (CD-ROM).
Vieira SR, Martins ALM, Silveira LCP (2008) Projeto de Recuperação Ambiental da Estação Experimental de Agronomia de Pindorama, Projeto de infra-estrutura de pesquisa/Fase 2, FAPESP, SP. Pindorama, 1997. 13p Revista Tecnologia and Inovação Agropecuária Junho de
© 2010 19th World Congress of Soil Science, Soil Solutions for a Changing World 64 1 – 6 August 2010, Brisbane, Australia. Published on DVD.
Impact of soil texture and organic matter content on mitc volatilization from soil
columns
Catherine R. SimpsonA, Shad D. NelsonB and Husein A. AjwaC A Instructor of Plant and Soil Science, Department of Agronomy & Resource Sciences, Texas A&M University-Kingsville Citrus Center, MSC 228, Kingsville, TX, USA 78363, Email [email protected] BProfessor of Agronomy, Department of Agronomy & Resource Sciences, Texas A&M University-Kingsville Citrus Center, MSC 228, Kingsville, TX, USA 78363, Email [email protected] CDepartment of Vegetable Crops, University of California-Davis, 1636 E. Alisal St., Salinas, CA, USA 93905
Abstract Metam sodium (MS; sodium N-methyl dithiocarbamate) has emerged as one of the most promising soil fumigants in the US to replace methyl bromide (MeBr). Metam potassium (MK; potassium N-methyl dithiocarbamate) and MS break down into the volatile gas methyl isothiocyanate (MITC) to control soil borne pests. While many studies have focused on MS, MK has not been studied as thoroughly. The objective of this research was to determine the effect of increasing organic matter (OM) treatments (10.9, 17.0, and 32.6% OM) and soil texture (sandy and sandy clay loam) to minimize the off-gassing of MS and MK. Bench-scale soil column studies were performed to simulate organic matter treatments that may decrease the volatilization loss of MITC. Incorporation depth of OM simulated surface tillage (0-15cm) practices. Soil was packed in steel columns and MS or MK was applied at a depth of 15 cm and MITC volatilization was measured using gas chromatography/mass spectroscopy. Volatilization of MITC was found to behave similarly for both MS and MK with MITC movement impacted significantly by soil texture with MITC volatilization lower from a sandy clay loam than a sandy soil type. Surface tillage incorporation of OM did not significantly decrease MITC volatilization. These results suggest that soil texture is the dominant factor reducing the off-gassing of MITC and prolonging the contact time needed to effectively control soil borne pests. Key Words Metam sodium, Metam potassium, Methyl isothiocyanate, Methyl bromide alternatives. Introduction The phase out of MeBr in 2005 due to its contribution to ozone depletion (USEPA 2009) has increased the use of MS to control soil borne pests. However, inconsistencies in pest control from such alternative chemicals have made it difficult to replace MeBr as a soil fumigant.the. Furthermore, these alternatives are still highly volatile and lead to high concentrations of these chemicals off-gassing into the atmosphere. Increased efforts to reduce these emissions are needed in order to improve their efficacy and reduce chemical exposure. Since 2005, MS has emerged as the most widely used soil fumigant for the control of soil borne pests (Kiely et al. 2004). MS and MK degrade readily into the volatile gas MITC shortly after their injection into the soil (Leistra and Smelt 1974). MS and MK are applied in liquid form and through shank injection or chemigation practices. Fumigant volatilization is inhibited by the rate of degradation of the chemical and by the transport within the soil. Fumigants are transported quickly throughout the soil by gas-phase diffusion. This gas-phase diffusion is dependent on the movement towards the soil surface and is affected by the soil bulk density and water content. Many chemical and biological factors can affect the degradation of MITC, however, temperature and organic amendments are thought to have the greatest impact (Gan et al. 1998, 1999). Historically, soil organic amendments have been used to control soil pathogens (Muller and Gooch 1982). While more recently, organic amendments have been used in conjunction with soil fumigants in order to control soil borne pests and potentially reduce fumigant emissions (Gan et al. 1998; Dungan et al. 2001, 2002; Gao et al, 2008). With the addition of organic matter to the soil, MITC degradation can be significantly increased thereby decreasing volatilization loss (Dungan et al. 2003; Gan et al. 1999). The purpose of this study was to better understand the impact of varying soil type and organic matter additions on MITC volatilization after MS and MK application in soil columns, similar to columns used by Zheng et al. 2006.

© 2010 19th World Congress of Soil Science, Soil Solutions for a Changing World 65 1 – 6 August 2010, Brisbane, Australia. Published on DVD.
Methods Experimental design
Two bench-scale studies were set up aimed at understanding different aspects of MITC fate under differing soil properties with varying treatments. The purpose of the first study was to analyze the MITC volatilization of MS and MK from a sandy soil and a sandy clay loam soil. The second study focused on the MITC volatilization from a sandy clay loam soil with varying organic matter amendment rates after MK application. Soil preparation
Two soils were used; one, a sandy soil type containing 2.8% organic matter, 93.5% sand, 2.5 % clay and 4% silt, obtained from the upper 30 cm of a sandy alluviated outwash soil collected at Premont, Jim Wells County, TX, USA (longitude 27º20’, latitude 98º10’). The other an Orelia sandy clay loam (fine-loamy, mixed, hyperthermic Typic Ochraqualf) containing 2.3% organic matter, 55% sand, 33% clay, and 12% silt obtained from the upper 30 cm of farmland in Kingsville, Kleberg County, TX, USA (longitude W 097º 53’, latitude N 27º 33’). Both soils were air dried, sieved to 2-mm and moisture level adjusted to 8% by adding deionized water prior to packing soil into steel soil columns. Soil organic matter was obtained from Brownville, Texas yardwaste compost, screened to 2.0 mm, and autoclaved for sterilization.
Chemical application In all studies MS (Vapam 42% MS [0.121 g MITC equivalent], Dow AgroSciences LLC, Indianapolis, IN) or MK (K-pam HL 54% MK) was injected at a depth of 15 cm from the soil surface to the center of each column at a rate of 356.8 kg Met-Na/ha in a total solution of distilled water (116.3 mL) to simulate a 1.125 cm water application event.
Soil column setup
Steel soil columns (similar to those used in studies done by Gan et al. 1999 and Zheng et al. 2006) were used to model gas flow through the soil profile. Columns were 60 cm high by 12.5 cm inside diameter with side sampling ports located at the 15, 25, 35, 45, and 55-cm depths. A headspace sampling chamber (4 cm high by 12.5 i.d.) was placed on top of the steel columns and sealed with airtight aluminum tape vacuum system was set up to measure the volatilization of MITC from the soil. Charcoal ORBO-32 filters (Supelco, Bellefonte, PA) were attached to a vacuum source set at 10 mm Hg that was pulling air from each of the 6 columns at an average of 1.5 mm Hg per column. Vacuum-side charcoal filters were used to trap any volatile chemical flowing out of the columns headspace chamber. On the inlet side of the column, another charcoal filter was attached to allow air to enter the column without allowing backflow loss of chemical out of the column. In the first study, 7.5 kg of sand and sandy clay loam at 8% moisture was packed in triplicate replicated steel columns (as mentioned above) to a bulk density of 1.36 kg m-3. In the second study, 3 columns were set up at varying OM rates (10.9, 17.0, and 32.6% OM) and packed to a bulk density of 1.35, 1.30, and 1.17 kg/m3, respectively. The columns had OM mixed homogeneously in the upper 15 cm depth of the soil column to simulate surface tillage of the incorporated OM.
Chemical analysis
For all studies, 500 µL air samples were extracted from the center of the columns from the side-ports and injected into the gas chromatograph after 6 hours. Analysis of MITC concentration within the soil-air phase was performed via direct on-column injection of samples taken directly from the soil columns side ports (Figure 1, pg 25). The gas chromatograph used was a SRI 8610C equipped with a flame ionization detector. It was equipped with an Rtx-624 wide bore capillary column (30m x 0.53mm x 3.0µm manufactured by Restek Corp., Bellefonte, PA.). Air samples were taken every 24 hours for a 7 day period. During this period ORBO-32 filters were changed every 4 hours during the day, and backup filters were attached to the vacuum source during the experiment and overnight for a period of 8 hours to ensure that no MITC was lost due to break through off the first filter. ORBO-32 charcoal filters used to collect MITC emissions were collected, end cap sealed and stored in the freezer at -20°C until extraction procedure was done. Methanol solvent was used to extract MITC off of the charcoal filters. Analysis of MITC from charcoal carbon filters and residual soil MITC levels was done using an Agilent 6890N gas chromatograph equipped with a 5973 Network mass selective detector (mass spectrometer). Methanol extraction efficiency was evaluated and found to be approximately 100%.
Statistical analysis
The first study was performed with three replicates per treatment and differences of the means between treatments were subjected to F tests and paired t-tests. All error bars shown are ± standard error of mean.
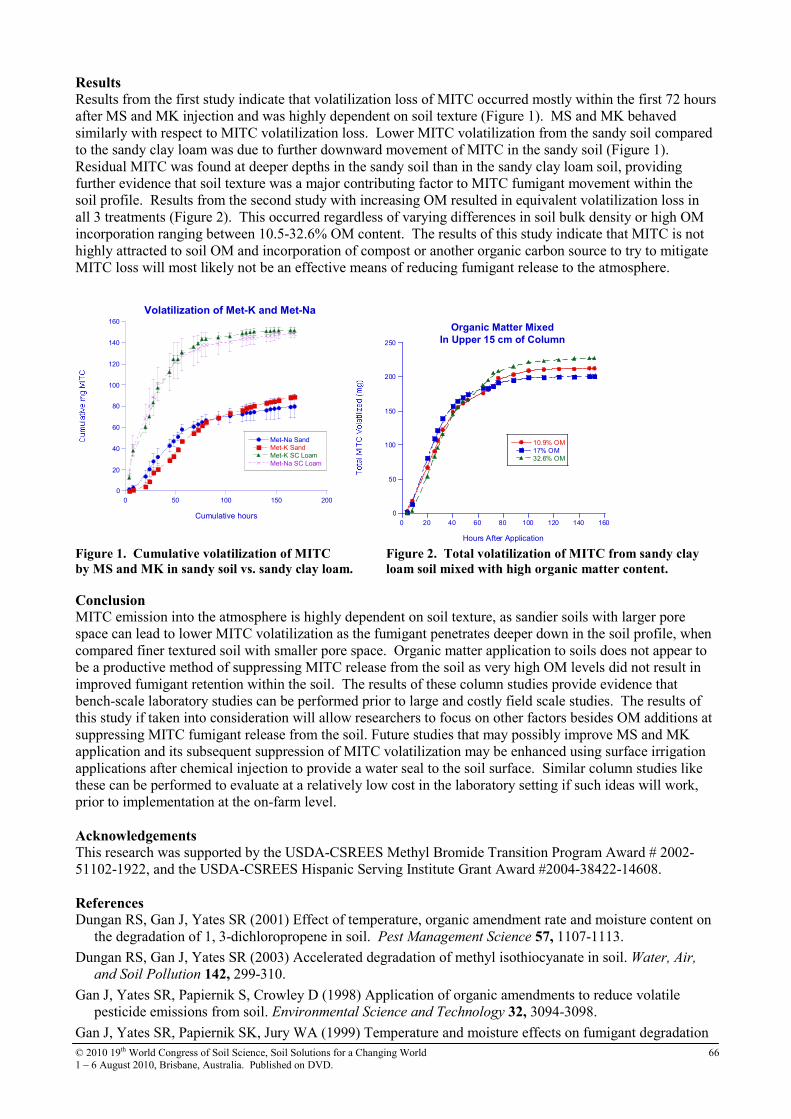
© 2010 19th World Congress of Soil Science, Soil Solutions for a Changing World 66 1 – 6 August 2010, Brisbane, Australia. Published on DVD.
Results Results from the first study indicate that volatilization loss of MITC occurred mostly within the first 72 hours after MS and MK injection and was highly dependent on soil texture (Figure 1). MS and MK behaved similarly with respect to MITC volatilization loss. Lower MITC volatilization from the sandy soil compared to the sandy clay loam was due to further downward movement of MITC in the sandy soil (Figure 1). Residual MITC was found at deeper depths in the sandy soil than in the sandy clay loam soil, providing further evidence that soil texture was a major contributing factor to MITC fumigant movement within the soil profile. Results from the second study with increasing OM resulted in equivalent volatilization loss in all 3 treatments (Figure 2). This occurred regardless of varying differences in soil bulk density or high OM incorporation ranging between 10.5-32.6% OM content. The results of this study indicate that MITC is not highly attracted to soil OM and incorporation of compost or another organic carbon source to try to mitigate MITC loss will most likely not be an effective means of reducing fumigant release to the atmosphere.
0
50
100
150
200
250
0 20 40 60 80 100 120 140 160
Organic Matter Mixed
In Upper 15 cm of Column
10.9% OM
17% OM32.6% OM
Hours After Application Figure 1. Cumulative volatilization of MITC Figure 2. Total volatilization of MITC from sandy clay
by MS and MK in sandy soil vs. sandy clay loam. loam soil mixed with high organic matter content.
Conclusion MITC emission into the atmosphere is highly dependent on soil texture, as sandier soils with larger pore space can lead to lower MITC volatilization as the fumigant penetrates deeper down in the soil profile, when compared finer textured soil with smaller pore space. Organic matter application to soils does not appear to be a productive method of suppressing MITC release from the soil as very high OM levels did not result in improved fumigant retention within the soil. The results of these column studies provide evidence that bench-scale laboratory studies can be performed prior to large and costly field scale studies. The results of this study if taken into consideration will allow researchers to focus on other factors besides OM additions at suppressing MITC fumigant release from the soil. Future studies that may possibly improve MS and MK application and its subsequent suppression of MITC volatilization may be enhanced using surface irrigation applications after chemical injection to provide a water seal to the soil surface. Similar column studies like these can be performed to evaluate at a relatively low cost in the laboratory setting if such ideas will work, prior to implementation at the on-farm level. Acknowledgements This research was supported by the USDA-CSREES Methyl Bromide Transition Program Award # 2002-51102-1922, and the USDA-CSREES Hispanic Serving Institute Grant Award #2004-38422-14608.
References Dungan RS, Gan J, Yates SR (2001) Effect of temperature, organic amendment rate and moisture content on
the degradation of 1, 3-dichloropropene in soil. Pest Management Science 57, 1107-1113.
Dungan RS, Gan J, Yates SR (2003) Accelerated degradation of methyl isothiocyanate in soil. Water, Air,
and Soil Pollution 142, 299-310.
Gan J, Yates SR, Papiernik S, Crowley D (1998) Application of organic amendments to reduce volatile pesticide emissions from soil. Environmental Science and Technology 32, 3094-3098.
Gan J, Yates SR, Papiernik SK, Jury WA (1999) Temperature and moisture effects on fumigant degradation
0 20 40 60 80 100 120 140 160
0 50 100 150 200
Volatilization of Met-K and Met-Na
Met-Na Sand Met-K Sand Met-K SC Loam Met-Na SC Loam
Cumulative hours

© 2010 19th World Congress of Soil Science, Soil Solutions for a Changing World 67 1 – 6 August 2010, Brisbane, Australia. Published on DVD.
in soil. Journal of Environ Quality 28, 1436-1441.
Gao S, Qin R, McDonald JA, Hanson BD, Trout TJ (2008) Field tests of surface seals and soil treatments to reduce fumigant emissions from shank injection of telone C35. Science of the Total Environment 405, 206-214
Jin Y, Jury WA (1995) Methyl bromide diffusion and emission through soil columns under various management techniques. Journal of Environmental Quality 24, 1002-1009.
Kiely T, Donaldson D, Grube AH (2004). Pesticides industry sales and usage: 2000 and 2001 market estimate. US EPA, Office of Prevention, Pesticides and Toxic Substances. Office of Pesticide Programs. Biological and Economic Analysis Division, Washington, DC.
Leistra M, Smelt JH (1974) Optimum soil conditions for fumigation with metam-sodium. Agro-Ecosystems 1, 169-176.
Muller R, Gooch PS (1982) Organic amendments in nematode control. An examination of the literature. Nematropica 12, 319-326.
U.S. Environmental Protection Agency (2009) The phaseout of methyl bromide: the phaseout schedule for methyl bromide. US Environmental Protection Agency, Ozone Depletion Rules and Regulations section. http://www.epa.gov/ozone/mbr [accessed 17 July 2009]
Zheng W, Yates SR, Papiernik SK, Nunez J (2006).Conversion of metam sodium and emission of fumigant from soil columns. Atmospheric Environment 40, 7046-7056.
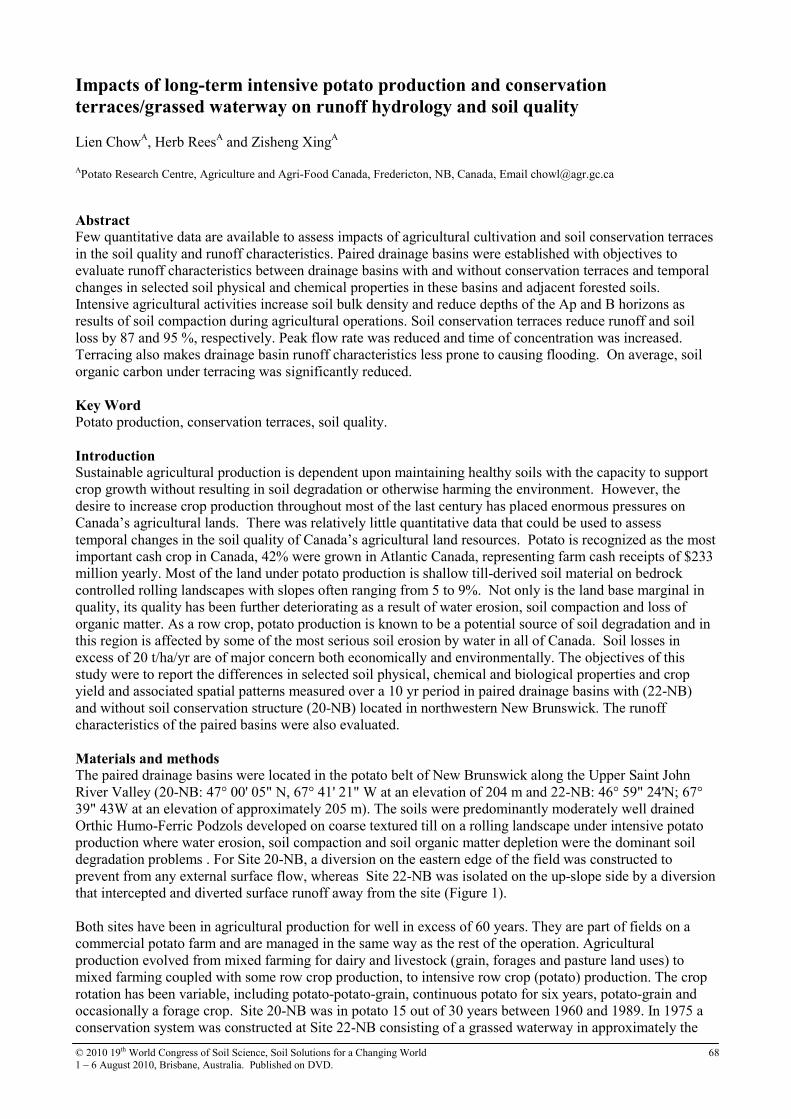
© 2010 19th World Congress of Soil Science, Soil Solutions for a Changing World 68 1 – 6 August 2010, Brisbane, Australia. Published on DVD.
Impacts of long-term intensive potato production and conservation
terraces/grassed waterway on runoff hydrology and soil quality Lien ChowA, Herb ReesA and Zisheng XingA APotato Research Centre, Agriculture and Agri-Food Canada, Fredericton, NB, Canada, Email [email protected]
Abstract Few quantitative data are available to assess impacts of agricultural cultivation and soil conservation terraces in the soil quality and runoff characteristics. Paired drainage basins were established with objectives to evaluate runoff characteristics between drainage basins with and without conservation terraces and temporal changes in selected soil physical and chemical properties in these basins and adjacent forested soils. Intensive agricultural activities increase soil bulk density and reduce depths of the Ap and B horizons as results of soil compaction during agricultural operations. Soil conservation terraces reduce runoff and soil loss by 87 and 95 %, respectively. Peak flow rate was reduced and time of concentration was increased. Terracing also makes drainage basin runoff characteristics less prone to causing flooding. On average, soil organic carbon under terracing was significantly reduced. Key Word Potato production, conservation terraces, soil quality. Introduction Sustainable agricultural production is dependent upon maintaining healthy soils with the capacity to support crop growth without resulting in soil degradation or otherwise harming the environment. However, the desire to increase crop production throughout most of the last century has placed enormous pressures on Canada’s agricultural lands. There was relatively little quantitative data that could be used to assess temporal changes in the soil quality of Canada’s agricultural land resources. Potato is recognized as the most important cash crop in Canada, 42% were grown in Atlantic Canada, representing farm cash receipts of $233 million yearly. Most of the land under potato production is shallow till-derived soil material on bedrock controlled rolling landscapes with slopes often ranging from 5 to 9%. Not only is the land base marginal in quality, its quality has been further deteriorating as a result of water erosion, soil compaction and loss of organic matter. As a row crop, potato production is known to be a potential source of soil degradation and in this region is affected by some of the most serious soil erosion by water in all of Canada. Soil losses in excess of 20 t/ha/yr are of major concern both economically and environmentally. The objectives of this study were to report the differences in selected soil physical, chemical and biological properties and crop yield and associated spatial patterns measured over a 10 yr period in paired drainage basins with (22-NB) and without soil conservation structure (20-NB) located in northwestern New Brunswick. The runoff characteristics of the paired basins were also evaluated.
Materials and methods The paired drainage basins were located in the potato belt of New Brunswick along the Upper Saint John River Valley (20-NB: 47° 00' 05" N, 67° 41' 21" W at an elevation of 204 m and 22-NB: 46° 59" 24'N; 67° 39" 43W at an elevation of approximately 205 m). The soils were predominantly moderately well drained Orthic Humo-Ferric Podzols developed on coarse textured till on a rolling landscape under intensive potato production where water erosion, soil compaction and soil organic matter depletion were the dominant soil degradation problems . For Site 20-NB, a diversion on the eastern edge of the field was constructed to prevent from any external surface flow, whereas Site 22-NB was isolated on the up-slope side by a diversion that intercepted and diverted surface runoff away from the site (Figure 1). Both sites have been in agricultural production for well in excess of 60 years. They are part of fields on a commercial potato farm and are managed in the same way as the rest of the operation. Agricultural production evolved from mixed farming for dairy and livestock (grain, forages and pasture land uses) to mixed farming coupled with some row crop production, to intensive row crop (potato) production. The crop rotation has been variable, including potato-potato-grain, continuous potato for six years, potato-grain and occasionally a forage crop. Site 20-NB was in potato 15 out of 30 years between 1960 and 1989. In 1975 a conservation system was constructed at Site 22-NB consisting of a grassed waterway in approximately the

© 2010 19th World Congress of Soil Science, Soil Solutions for a Changing World 69 1 – 6 August 2010, Brisbane, Australia. Published on DVD.
center of the site, collecting runoff contributed by three equally spaced diversions 62 m apart, on either side of the waterway (Figure 1). These terraces made the cultivation from up-and-down slope to contour planting. Crop grown between 1990 and 1999 for site 20-NB and 1991 to 2000 for site 22-NB is shown in Table 1.
400 m
300 m
200 m
100 m
20
42
82
104
144
166
210
Diversion
Grassed Waterway
Sample Point
Contour Interval 2 m
Flume
Collection Tank
0m 50m 100m 150m 200m
N
Pines
UpperTerrace
MiddleTerrace
LowerTerrace
Drainage BasinTopo Boundary
0 m
(a) (b)
0m 50m 100m 150m 200m
Diversion
Earth Berm
Flume
Collector Tank
Direction of
Cultivation
Contour Interval: 0.5 m
Drainage Basin
Topo Boundary
N
Drainage Basin Topo Boundary
Figure 1. Layout and boundaries with location of runoff sampling instrumentation on the digital elevation model
of the study sites 20-NB (a) and 22-NB (b).
Weather data (i.e., precipitation amount and intensity) from a nearby Agriculture and Agri-Food Canada research site with an automated weather station were used to calculate rainfall erosivity as per Wischmeier and Smith (1978). A topographic survey was conducted with XYZ coordinates measured on a 25 x 25 m grid at 25 m intervals along parallel transects at 10, 35, 60, 85 and 110 m running up and down slope. Locations and elevations of field boundaries, drainage features (diversions, earth berms, etc.), monitoring equipment and all major sampling grid points were established (Figure 1). Soil resources were characterized in a detailed soils map prepared at a scale of 1:1000. The sites were instrumented with a monitoring system consisting of a 3-ft H-flume and series of three above ground collector tanks for runoff monitoring and collection and the detailed are presented in Chow et al. (1990, 1999). Loose soil samples from 20 x 25 grids for chemistry and total carbon were collected from October 1989 and 1999 and October 1990 and 2000 for site 20-NB and 22-NB, respectively. Additional sampling for total C was conducted in 1992 and 1996 for site 20-NB and 1993 and 1996 for site 22-NB. Field-saturated hydraulic conductivity (Kfs) was measured at two depths, 12-22 cm and 27-37 cm, at 66 locations on the 25 m x 25 m grid, and at a depth of 50-60 cm at 17 of the grid points located systematically (every 4th point). A Guelph Permeameter with a 10-cm head was used to measure Kfs, as described by Reynolds (1993). Measurements were taken after crop harvest in October of each year. In years 1997-1999, Kfs measurements at similar depths were made at six sites on a 50 m interval spacing along a transect in the adjacent, undisturbed forested area.
Table 1. Cropping sequences and seasonal runoff and soil loss from site 20-NB (May 01 to Nov. 30, 1990-1999)
and 22-NB (May 01 to Nov. 30, 1991-2000).
Crop Runoff Soil loss (mm) (kg/ha)
Year Rainfall (mm)
Erosivity (MJ mm/ha hr yr
20-NB 22-NB 20-NB 22-NB 20-NB 22-NB 1990 953 2941 Rye grass 25.4 285 1991 788 1728 Potato Potato 202.6 41.9 15604 1678 1992 782 1840 Potato Potato 159.2 19.6 21825 1156 1993 902 696 Barley Barley 33.6 8.1 489 63 1994 750 1585 Potato Potato 182 14 24852 200 1995 695 642 Barley Potato 0.1 6.3 2 12 1996 853 1242 Clover Barley 0 0 0 0 1997 599 856 Potato Potato 16.3 0 704 0 1998 853 1202 Potato Potato 14.1 0.1 1216 1 1999 809 1922 Barley Barley 9.3 2.5 239 0 2000 763 1243 Potato 0 0 Mean 795 1445 64.3 9.3 4339 311 Potato* 754 1442 114.8 15.1 12840 607 Other crops* 853 1287 14.3 3.5 243 12 Normal 804 1276
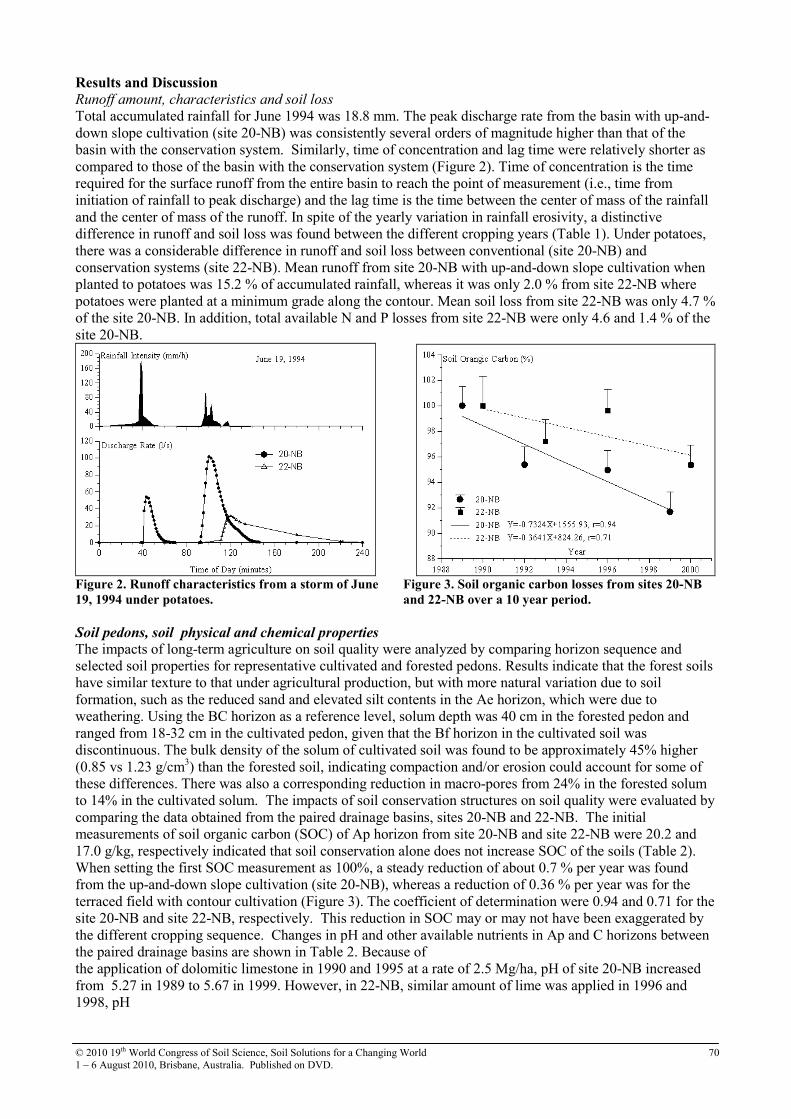
© 2010 19th World Congress of Soil Science, Soil Solutions for a Changing World 70 1 – 6 August 2010, Brisbane, Australia. Published on DVD.
Results and Discussion Runoff amount, characteristics and soil loss
Total accumulated rainfall for June 1994 was 18.8 mm. The peak discharge rate from the basin with up-and-down slope cultivation (site 20-NB) was consistently several orders of magnitude higher than that of the basin with the conservation system. Similarly, time of concentration and lag time were relatively shorter as compared to those of the basin with the conservation system (Figure 2). Time of concentration is the time required for the surface runoff from the entire basin to reach the point of measurement (i.e., time from initiation of rainfall to peak discharge) and the lag time is the time between the center of mass of the rainfall and the center of mass of the runoff. In spite of the yearly variation in rainfall erosivity, a distinctive difference in runoff and soil loss was found between the different cropping years (Table 1). Under potatoes, there was a considerable difference in runoff and soil loss between conventional (site 20-NB) and conservation systems (site 22-NB). Mean runoff from site 20-NB with up-and-down slope cultivation when planted to potatoes was 15.2 % of accumulated rainfall, whereas it was only 2.0 % from site 22-NB where potatoes were planted at a minimum grade along the contour. Mean soil loss from site 22-NB was only 4.7 % of the site 20-NB. In addition, total available N and P losses from site 22-NB were only 4.6 and 1.4 % of the site 20-NB.
Figure 2. Runoff characteristics from a storm of June
19, 1994 under potatoes.
Figure 3. Soil organic carbon losses from sites 20-NB
and 22-NB over a 10 year period.
Soil pedons, soil physical and chemical properties
The impacts of long-term agriculture on soil quality were analyzed by comparing horizon sequence and selected soil properties for representative cultivated and forested pedons. Results indicate that the forest soils have similar texture to that under agricultural production, but with more natural variation due to soil formation, such as the reduced sand and elevated silt contents in the Ae horizon, which were due to weathering. Using the BC horizon as a reference level, solum depth was 40 cm in the forested pedon and ranged from 18-32 cm in the cultivated pedon, given that the Bf horizon in the cultivated soil was discontinuous. The bulk density of the solum of cultivated soil was found to be approximately 45% higher (0.85 vs 1.23 g/cm3) than the forested soil, indicating compaction and/or erosion could account for some of these differences. There was also a corresponding reduction in macro-pores from 24% in the forested solum to 14% in the cultivated solum. The impacts of soil conservation structures on soil quality were evaluated by comparing the data obtained from the paired drainage basins, sites 20-NB and 22-NB. The initial measurements of soil organic carbon (SOC) of Ap horizon from site 20-NB and site 22-NB were 20.2 and 17.0 g/kg, respectively indicated that soil conservation alone does not increase SOC of the soils (Table 2). When setting the first SOC measurement as 100%, a steady reduction of about 0.7 % per year was found from the up-and-down slope cultivation (site 20-NB), whereas a reduction of 0.36 % per year was for the terraced field with contour cultivation (Figure 3). The coefficient of determination were 0.94 and 0.71 for the site 20-NB and site 22-NB, respectively. This reduction in SOC may or may not have been exaggerated by the different cropping sequence. Changes in pH and other available nutrients in Ap and C horizons between the paired drainage basins are shown in Table 2. Because of the application of dolomitic limestone in 1990 and 1995 at a rate of 2.5 Mg/ha, pH of site 20-NB increased from 5.27 in 1989 to 5.67 in 1999. However, in 22-NB, similar amount of lime was applied in 1996 and 1998, pH
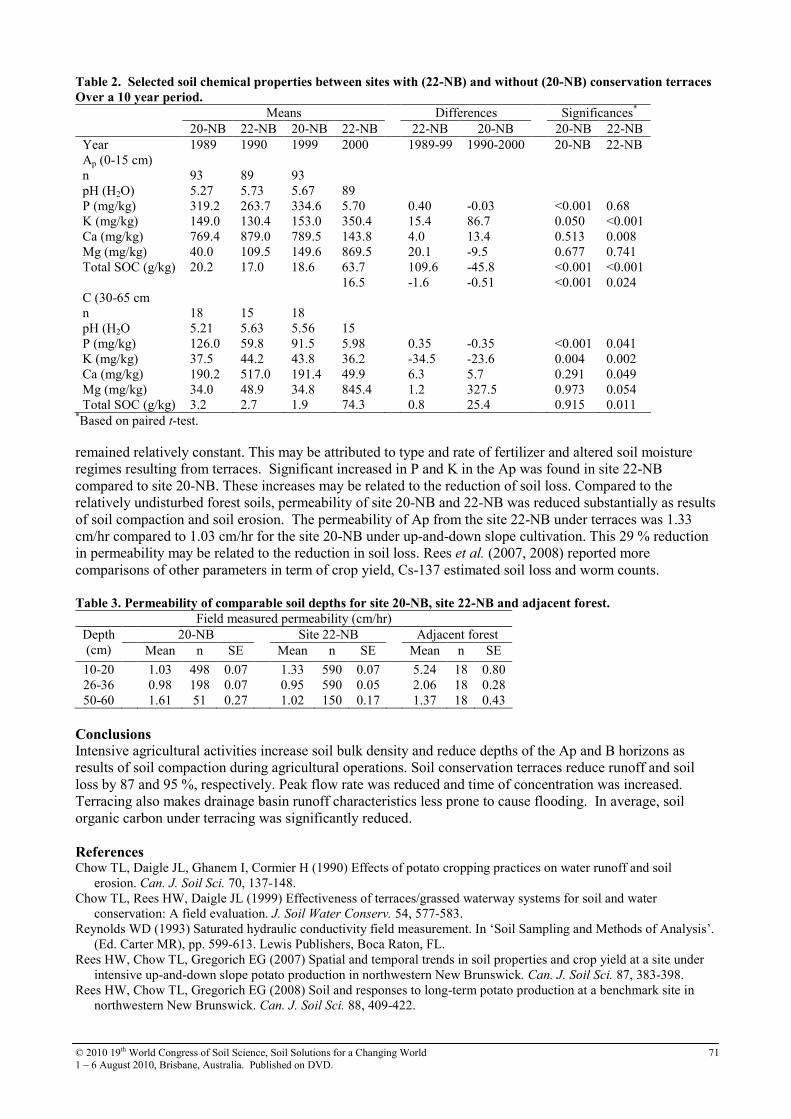
© 2010 19th World Congress of Soil Science, Soil Solutions for a Changing World 71 1 – 6 August 2010, Brisbane, Australia. Published on DVD.
Table 2. Selected soil chemical properties between sites with (22-NB) and without (20-NB) conservation terraces
Over a 10 year period.
Means Differences Significances* 20-NB 22-NB 20-NB 22-NB 22-NB 20-NB 20-NB 22-NB
Year 1989 1990 1999 2000 1989-99 1990-2000 20-NB 22-NB Ap (0-15 cm) n 93 89 93 pH (H2O) 5.27 5.73 5.67 89 P (mg/kg) 319.2 263.7 334.6 5.70 0.40 -0.03 <0.001 0.68 K (mg/kg) 149.0 130.4 153.0 350.4 15.4 86.7 0.050 <0.001 Ca (mg/kg) 769.4 879.0 789.5 143.8 4.0 13.4 0.513 0.008 Mg (mg/kg) 40.0 109.5 149.6 869.5 20.1 -9.5 0.677 0.741 Total SOC (g/kg) 20.2 17.0 18.6 63.7 109.6 -45.8 <0.001 <0.001 16.5 -1.6 -0.51 <0.001 0.024 C (30-65 cm n 18 15 18 pH (H2O 5.21 5.63 5.56 15 P (mg/kg) 126.0 59.8 91.5 5.98 0.35 -0.35 <0.001 0.041 K (mg/kg) 37.5 44.2 43.8 36.2 -34.5 -23.6 0.004 0.002 Ca (mg/kg) 190.2 517.0 191.4 49.9 6.3 5.7 0.291 0.049 Mg (mg/kg) 34.0 48.9 34.8 845.4 1.2 327.5 0.973 0.054 Total SOC (g/kg) 3.2 2.7 1.9 74.3 0.8 25.4 0.915 0.011
*Based on paired t-test.
remained relatively constant. This may be attributed to type and rate of fertilizer and altered soil moisture regimes resulting from terraces. Significant increased in P and K in the Ap was found in site 22-NB compared to site 20-NB. These increases may be related to the reduction of soil loss. Compared to the relatively undisturbed forest soils, permeability of site 20-NB and 22-NB was reduced substantially as results of soil compaction and soil erosion. The permeability of Ap from the site 22-NB under terraces was 1.33 cm/hr compared to 1.03 cm/hr for the site 20-NB under up-and-down slope cultivation. This 29 % reduction in permeability may be related to the reduction in soil loss. Rees et al. (2007, 2008) reported more comparisons of other parameters in term of crop yield, Cs-137 estimated soil loss and worm counts. Table 3. Permeability of comparable soil depths for site 20-NB, site 22-NB and adjacent forest.
Field measured permeability (cm/hr) 20-NB Site 22-NB Adjacent forest Depth
(cm) Mean n SE Mean n SE Mean n SE
10-20 1.03 498 0.07 1.33 590 0.07 5.24 18 0.80 26-36 0.98 198 0.07 0.95 590 0.05 2.06 18 0.28 50-60 1.61 51 0.27 1.02 150 0.17 1.37 18 0.43
Conclusions Intensive agricultural activities increase soil bulk density and reduce depths of the Ap and B horizons as results of soil compaction during agricultural operations. Soil conservation terraces reduce runoff and soil loss by 87 and 95 %, respectively. Peak flow rate was reduced and time of concentration was increased. Terracing also makes drainage basin runoff characteristics less prone to cause flooding. In average, soil organic carbon under terracing was significantly reduced.
References Chow TL, Daigle JL, Ghanem I, Cormier H (1990) Effects of potato cropping practices on water runoff and soil
erosion. Can. J. Soil Sci. 70, 137-148. Chow TL, Rees HW, Daigle JL (1999) Effectiveness of terraces/grassed waterway systems for soil and water
conservation: A field evaluation. J. Soil Water Conserv. 54, 577-583. Reynolds WD (1993) Saturated hydraulic conductivity field measurement. In ‘Soil Sampling and Methods of Analysis’.
(Ed. Carter MR), pp. 599-613. Lewis Publishers, Boca Raton, FL. Rees HW, Chow TL, Gregorich EG (2007) Spatial and temporal trends in soil properties and crop yield at a site under
intensive up-and-down slope potato production in northwestern New Brunswick. Can. J. Soil Sci. 87, 383-398. Rees HW, Chow TL, Gregorich EG (2008) Soil and responses to long-term potato production at a benchmark site in
northwestern New Brunswick. Can. J. Soil Sci. 88, 409-422.

© 2010 19th World Congress of Soil Science, Soil Solutions for a Changing World 72 1 – 6 August 2010, Brisbane, Australia. Published on DVD.
Influence of adding Pb to soil on the growth of wheat seedlings Yan DuA, B, Jiang ChangA and Xue-Feng HuB ACollege of Resources and Environment, Anhui Agricultural University, Hefei 230036, Anhui Province, China. BSchool of Environmental and Chemical Engineering, Shanghai University, Shanghai 200444, China, Email [email protected]
Abstract Pot experiments were carried out to study the influence of soil Pb pollution on the growth of wheat seedlings. The results are as follows: (1) low concentrations of Pb in the soil stimulate seedling growth; high concentrations, however, inhibit their growth. (2) The Pb taken up by the seedlings is mostly accumulated in the roots, and only a little is transported to the shoots. (3) More Pb was accumulated in the seedlings growing on an acid soil due to the higher level of available Pb. Key Words Pb pollution; soil; wheat seedlings. Introduction Heavy metals in soils are mostly anthropogenic in origin, which may come from sewage irrigation, solid waste disposal, pesticides and fertilizers application or atmospheric deposition. Soil heavy metal pollution has become a worldwide environmental concern because of its hidden, non-reversible and long-term adverse effects on human health (Chen 1996). With the development of industrial and agricultural production, the problem of soil heavy metal pollution has increasingly become more serious in China. So far, the area of cultivated soils suffered from heavy metal pollution reaches more than 20 million hm2 nationwide. Due to the large area of soil pollution, China is estimated to produce 12 million ton of heavy metal polluted grain (Li 2005). Soil Pb pollution is one of the most serious problems in agriculture. A high concentration of Pb is harmful to plant growth and development (Wu et al. 2004; Wang and Huang 2008; Cao and Huang 2006). Due to its low solubility, Pb is immobile and often retained in topsoil, which does harm to human health through the food chain (Todd et al. 1996). The uptake of Pb in the soils from Anhui province, southeastern China, by wheat seedlings and its effects on seedling growth were studied through pot experiments described in this paper. Methods Pot experiments
Three soil types in Anhui province, southeastern China, were used in pot experiments, which include a yellow-red soil (Ferralsol) in Xuancheng, a yellow-cinnamon soil (Luvisol) in Hefei and a black soil with lime concretions (Calcisol) in Guoyang county. A wheat variety of No. 19 Yannong was selected for experimental use. A fungicide, PbSO4, was applied to the soils as a supplemental Pb source. A certain amount of PbSO4 was fully mixed with air-dried soils (< 2mm) and then maintained in an incubator within 20 ± 0.2 oC for 10 days. Seven soil treatments with different Pb concentrations were presented in Table 1. Disinfected wheat seeds were put into an incubator and maintained within 20 ± 2 oC for 12-18 hours to accelerate germination. 100 g treated soil, 50 g quartz and a certain amount of KH2PO4 and urea were fully mixed and put into a plastic pot (1l.5cm x 7cm), with a hollow plastic tube (6mm x 65mm) inserted in the middle and another 50 g quartz evenly covered on the surface. 50.0 mL deionized water was added through the tube in each pot. 100 sprouting seeds with similar size were put into each prepared pot, followed by evenly covering 100 g quartz and adding 20 mL deionized water to make soil water content up to 70%. Each test treatment was triplicate. All the pots were randomly put into the incubator, with the constant temperature of 25 ± 1 oC in the day and 20±1 oC at night and 12 hour/day illumination (4000 lax). Water was added each day to keep the soil water content stable in the pots. The wheat seedlings were removed after 14 day’s cultivation, and then washed, oven-dried and crushed into powder for chemical analyses. The pot experiments were conducted in Anhui Agricultural University from 16 August 16, 2008 to December 23, 2008. Chemical analyses
Pb concentration in both soil and plant was determined by the atomic absorption spectrophotometer (AAS) method after the soils were digested with mixed acids HF-HCIO4 –HNO3 and the plants with H2O2-HNO3. The physical-chemical properties of soils were measured according to Bao (2000).

© 2010 19th World Congress of Soil Science, Soil Solutions for a Changing World 73 1 – 6 August 2010, Brisbane, Australia. Published on DVD.
Table 1. Seven treatments with different Pb concentrations in the pot experiments.
Treatments (Pb concentrations, mg/kg) Soil types I Ⅱ III IV V VI VII
Yellow-red soil 0 25 100 200 400 600 800 Yellow-cinnamon soil 0 25 100 250 500 750 900 Black soil with lime concretions 0 25 100 300 600 900 1200
Results Relationships between total Pb and chemically extractable Pb in the soils with Pb addition
The contents of HCl- and DTPA-extractable Pb in the three soils are much higher than those of NH4NO3- and NH4AC-extractable Pb; the four chemically extractable Pb contents are significantly correlated with the total Pb (n=7; r2>0.95). Moreover, the contents of chemically extractable Pb in the yellow-red soil are much higher than those in the other soils, especially in the black soil with lime concretions. Influence of Pb addition on the growth of wheat seedlings
The dry weights of the shoots and roots of wheat seedlings with the different Pb treatments are shown in Table 2. The treatments of low Pb concentrations, which are < 100mg/kg in the yellow-red soils, <50mg/kg in the yellow-cinnamon soil, and < 100mg/kg in the black soil with lime concretion, stimulate the growth of both shoots and roots of the seedlings; these of the high Pb concentrations, which are >200mg/kg in the yellow-red soil, >100mg/kg in the yellow-cinnamon soil and >300mg/kg in the black soil with lime concretion, on the contrary, inhibit seedlings growth. For example, the dry weights of shoots are only 69.23%, 67.67% and 80.43% of the control when treated with 800mg/kg in the yellow-red soil, and 900mg/kg in the yellow-cinnamon soil and 1200mg/kg in the black soil with lime concretions, respectively; these of roots only 51.54%, 72.89% and 52.77% when treated with the same Pb concentrations. This also suggests that the seedling roots are more severely repressed when treated with the high Pb concentrations. Table 2. Percentages of plant dry weights with the different treatments compared with the control
Percents(%) Yellow-red soil Yellow-cinnamon soil Black soil with lime concretions
Treatments
Shoots Roots Shoots Roots Shoots Roots I 100.00 100.00 100.00 100.00 100.00 100.00 II 101.10 106.54 105.17 106.83 105.04 106.93 III 110.38 103.08 90.49 94.96 110.08 104.97 IV 93.41 101.15 76.23 86.350 89.80 79.10 V 88.89 91.15 69.78 67.95 86.01 57.85 VI 77.53 51.54 72.65 72.21 84.03 52.77 VII 69.23 40.38 67.67 72.89 80.43 51.50
Accumulation and distribution of Pb in wheat seedlings
The accumulation of Pb in the wheat seedlings is shown in Table 3. The concentrations of Pb in both the shoots and roots increase with the treated Pb levels increasing. The high transfer factors in the different soils and treatments suggest that the amount of Pb uptaken by the seedlings are mainly retained in the roots rather than quickly transported to the shoots. Pb concentrations in the shoots of seedlings growing on the different test soils with the same Pb treatments are significantly different, so are these in the roots, which follows the sequence of the yellow-red soil > the yellow-cinnamon soil > the black soil with lime concretions. The highest levels of Pb in the seedlings growing on the yellow-red soil are attributed to its highest contents of available Pb due to its low pH and high acidity, which is proved by its highest chemically extractable Pb; likewise, the lowest Pb in the seedlings on the black soil with lime concretions attributed to its lowest contents of available Pb due to its high pH. Conclusions The capability of soil Pb extraction by the four chemical solutions are different, which follows the sequence of HCl (0.1mol/l) > DTPA (0.005mol/l) > NH4NO3 (1.0mol/l) > NH4AC (1.0mol/l). There are significant correlations between total Pb and chemical extractable Pb in the soils. Low concentrations of Pb in the soils stimulate the growth of wheat seedlings, while high concentrations of Pb greatly inhibit seedlings growth. The Pb taken up by the seedlings is mainly accumulated in the roots, and only a little is transported to the shoots. An acid soil condition benefits Pb uptake by the seedlings due to the higher levels of available Pb.

© 2010 19th World Congress of Soil Science, Soil Solutions for a Changing World 74 1 – 6 August 2010, Brisbane, Australia. Published on DVD.
Table 3. Transfer and enrichment factors of Pb in wheat seedlings with the different Pb treatments
Yellow-red soil Yellow-cinnamon soil Black soil with lime concretions Treatments Transfer factor*
Enrichment factor**
Transfer factor
Enrichment factor
Transfer factor
Enrichment factor
I 0.195 0. 34 0.0 0. 850 0.0 0.020 II 39.7 0.400 2.5 0. 555 3.5 0.088 III 25.9 0. 656 3.1 0. 323 4.4 0.082 IV 11.1 1.048 1.6 0. 256 3.1 0. 176 V 6.8 1.700 1.3 0. 289 4.4 0. 179 VI 8.4 2.051 2.1 0. 309 7.0 0. 271 VII 11.4 2.254 2.6 0. 368 7.6 0. 274
*Transfer factor: Ratios of Pb concentrations in roots to these in shoots; **Enrichment factor: Ratio of Pb concentrations in wheat seedlings to these in the soils.
Acknowledgements This work was supported by the 11th Five Years Key Programs for Science and Technology Development of Anhui Province (No.08010302166) and the National Natural Science Foundation of China (No. 40771093). References Bao SD (2000) ‘Analytical Methods on Soil and Agriculture’. 3rd version. (China Agriculture Press:
Beijing).
Cao Y, Huang RD (2006) Cadmium absorption characteristics of Zea mays under combined stress of lead and cadmium. Chinese Journal of Ecology 25, 1425-1427.
Chen HM (1996) ‘Heavy metal pollution in the soil-plant system’ (Science Press: Beijing).
Li ZN (2005) It’s urgent to control agricultural soil pollution in China. Daily of Science and Technology 4,
Todd AC, Wetmur JG, Moline JM (1996) Unraveling the chronic toxicity for environmental health. Environ
Health Perspec. 104, 141-146.
Wang SH, Huang CJ (2008) Cadmium uptake of flue-cured tobacco in different soil types and its distribution. Inner Mongolia Agricultural Science and Technology 3, 40-42.
Wu CH, Chen X, Wang ZQ (2004) Lead absorption by weeds lead-polluted soil. Chinese Journal of Applied
Ecology l5, 1451-1454.
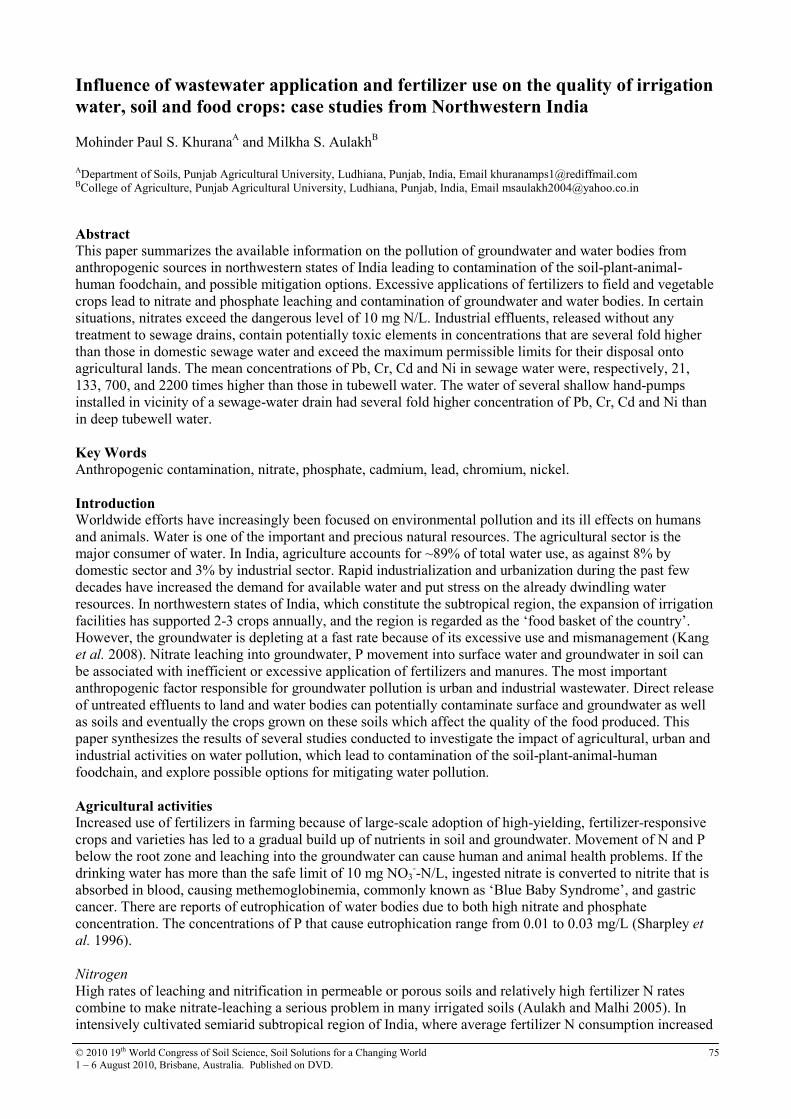
© 2010 19th World Congress of Soil Science, Soil Solutions for a Changing World 75 1 – 6 August 2010, Brisbane, Australia. Published on DVD.
Influence of wastewater application and fertilizer use on the quality of irrigation
water, soil and food crops: case studies from Northwestern India Mohinder Paul S. KhuranaA and Milkha S. AulakhB
ADepartment of Soils, Punjab Agricultural University, Ludhiana, Punjab, India, Email [email protected] BCollege of Agriculture, Punjab Agricultural University, Ludhiana, Punjab, India, Email [email protected]
Abstract This paper summarizes the available information on the pollution of groundwater and water bodies from anthropogenic sources in northwestern states of India leading to contamination of the soil-plant-animal-human foodchain, and possible mitigation options. Excessive applications of fertilizers to field and vegetable crops lead to nitrate and phosphate leaching and contamination of groundwater and water bodies. In certain situations, nitrates exceed the dangerous level of 10 mg N/L. Industrial effluents, released without any treatment to sewage drains, contain potentially toxic elements in concentrations that are several fold higher than those in domestic sewage water and exceed the maximum permissible limits for their disposal onto agricultural lands. The mean concentrations of Pb, Cr, Cd and Ni in sewage water were, respectively, 21, 133, 700, and 2200 times higher than those in tubewell water. The water of several shallow hand-pumps installed in vicinity of a sewage-water drain had several fold higher concentration of Pb, Cr, Cd and Ni than in deep tubewell water. Key Words Anthropogenic contamination, nitrate, phosphate, cadmium, lead, chromium, nickel. Introduction Worldwide efforts have increasingly been focused on environmental pollution and its ill effects on humans and animals. Water is one of the important and precious natural resources. The agricultural sector is the major consumer of water. In India, agriculture accounts for ~89% of total water use, as against 8% by domestic sector and 3% by industrial sector. Rapid industrialization and urbanization during the past few decades have increased the demand for available water and put stress on the already dwindling water resources. In northwestern states of India, which constitute the subtropical region, the expansion of irrigation facilities has supported 2-3 crops annually, and the region is regarded as the ‘food basket of the country’. However, the groundwater is depleting at a fast rate because of its excessive use and mismanagement (Kang et al. 2008). Nitrate leaching into groundwater, P movement into surface water and groundwater in soil can be associated with inefficient or excessive application of fertilizers and manures. The most important anthropogenic factor responsible for groundwater pollution is urban and industrial wastewater. Direct release of untreated effluents to land and water bodies can potentially contaminate surface and groundwater as well as soils and eventually the crops grown on these soils which affect the quality of the food produced. This paper synthesizes the results of several studies conducted to investigate the impact of agricultural, urban and industrial activities on water pollution, which lead to contamination of the soil-plant-animal-human foodchain, and explore possible options for mitigating water pollution. Agricultural activities Increased use of fertilizers in farming because of large-scale adoption of high-yielding, fertilizer-responsive crops and varieties has led to a gradual build up of nutrients in soil and groundwater. Movement of N and P below the root zone and leaching into the groundwater can cause human and animal health problems. If the drinking water has more than the safe limit of 10 mg NO3
--N/L, ingested nitrate is converted to nitrite that is absorbed in blood, causing methemoglobinemia, commonly known as ‘Blue Baby Syndrome’, and gastric cancer. There are reports of eutrophication of water bodies due to both high nitrate and phosphate concentration. The concentrations of P that cause eutrophication range from 0.01 to 0.03 mg/L (Sharpley et
al. 1996).
Nitrogen
High rates of leaching and nitrification in permeable or porous soils and relatively high fertilizer N rates combine to make nitrate-leaching a serious problem in many irrigated soils (Aulakh and Malhi 2005). In intensively cultivated semiarid subtropical region of India, where average fertilizer N consumption increased

© 2010 19th World Congress of Soil Science, Soil Solutions for a Changing World 76 1 – 6 August 2010, Brisbane, Australia. Published on DVD.
from 56 to 188 kg N/ha/y during 1975 to 1988, NO3--N concentration in the shallow-well waters increased
by almost 2 mg/L (Aulakh and Bijay-Singh 1997). In some central districts of Punjab, fertilizer N levels exceed 300 kg N/ha/y and on several farms, fertilizers are poorly managed. The soils in this region are predominantly coarse textured and about 75% of the total rainfall of more than 600 mm is received during the monsoon period (July-September). A survey of groundwater samples from 21-38 meter-deep tubewells located in cultivated fields in various blocks revealed that 78% water samples had less than 5 mg NO3
--N/L and 22% samples had 5-10 mg NO3
--N/L. Sixty percent of water samples from shallow-depth (9-18 m) hand-pumps had 5-10 mg NO3
--N/L and 2% samples had more than 10 mg NO3--N/L. Animal wastes appear to be
the major contributors to high NO3--N in groundwater under village inhabitations and feedlots. In Punjab,
animal wastes are generally dumped near feedlots in the outskirts of villages. The level of NO3--N in the
water samples of 367 hand-pumps used in several villages of four districts and in 45 water samples collected beneath feedlots, was several folds higher than in 236 water samples of tubewells of adjoining areas, clearly illustrating that animal wastes and feedlots act as a point source of nitrates. Vegetation retards NO3
--N leaching from the root zone by absorbing nitrate and water. Rooting habits/patterns of different plants influence NO3
- mobility in the rooting zone. Maximum leaching of NO3--N below the root zone occurs from
heavily fertilized shallow-rooted crops, such as potato, maize and rice as well as heavily manured vegetable crops. In the predominant rice-wheat cropping system of Punjab, NO3
- leaching to 60 cm during the rice crop was used by the subsequent wheat crop, which has a deeper and more extensive root system (Figure 1). Application of 120 kg fertilizer N/ha to each of these two crops for 4 years resulted in 35 kg of residual NO3
-
-N/ha in the 150-cm soil profile, whereas only 17 kg NO3--N/ha remained where 120 kg N/ha was applied
through the consecutive use of 20 t/ha of fresh sesbania green manure and fertilizer N, decreasing potential for groundwater nitrate contamination. Phosphorus
Excessive accumulation of residual P in soil may enhance downward movement of P, which may eventually reach groundwater. Sandy soils have a large number of macropores and thus the resultant by-pass flow can lead to greater and deeper leaching of P in such soils. Besides the potential for groundwater contamination, P lost from agricultural soils through leaching may be intercepted by artificial drainage or subsurface flow, accelerating the risk of P transport to water bodies with serious implications for water quality. Long-term studies, where fertilizer P has been applied at different rates, frequencies and periods, have revealed the possibility of P leaching especially in coarse-textured soils (Aulakh et al. 2007). After 29 years of using groundnut – based cropping systems, 45 to 256 kg of residual fertilizer P accumulated as Olsen-P/ha in 150-cm soil profile (43-58% below 60 cm depth), illustrating enormous movement of fertilizer P to deeper layers in a coarse-textured soil having low absorption and retention capacity for nutrients (Figure 2). Recent studies with different cropping systems have further revealed that interplay between the fertilizer P management, amount of labile P accumulated in soil profile, and soil characteristics (silt, clay and organic C) largely control P leaching in subtropical soils (Garg and Aulakh 2010). Urban and industrial activities Application of sewage sludge to agricultural soils, and irrigation of field crops with sewage water and untreated industrial effluents alone, or in combination with ground/canal water, are common practices, especially in the vicinity of large cities, as these are considered reusable sources of essential plant nutrients and organic C. It is estimated that more than 15000 million liters of sewage water is produced every day in India, which approximately contributes 3.2 million t of N, 1.4 million t of P and 1.9 million t of potassium (K) per annum, with an economic value of about Indian Rs. 2600 million (US$ 52 million). However, some of the elements present in sewage water and untreated industrial effluents could be toxic to plants and pose health hazards to animals and humans. Chemical composition of sewage waters
The concentration of potentially toxic elements was higher in sewage water of industrial towns as compared with less or non-industrial towns. Further, the composition of sewage water varies within a city. The domestic zone sewage contained relatively low amounts of toxic elements whereas the effluents from the electroplating area contained toxic elements, such as chromium (Cr), nickel (Ni) and cyanide (CN), in amounts higher than maximal tolerable limits for disposal on agricultural lands. The chemical analysis of sewage-water samples collected from different locations of an open drain, commonly known as “Budda Nullah,” downstream from entry into Ludhiana city, revealed that the concentration of metals in the drain increases many folds as it passes through Ludhiana city (Table 1). The mean concentrations of Fe, Zn, As,

© 2010 19th World Congress of Soil Science, Soil Solutions for a Changing World 77 1 – 6 August 2010, Brisbane, Australia. Published on DVD.
Pb, Ni, and Cr, in the sewage-water samples collected at the entry point, were 0.03, 0.04, 0.005 0.004, 0.002 and 0.001 mg/L, respectively, which increased to 10.8, 0.78, 2.10, 0.075, 0.28 and 0.26 mg/L, respectively,
in the samples collected from about 15 km downstream of the entry point. This is because the number of industries pouring their untreated effluents increased as the distance downstream increased turning it into a highly polluted sewage channel. A study of leather complex in Jalandhar city, comprising leather-manufacturing factories, revealed that the concentration of both Cr and Al drastically increased in the sewage water after the disposal of effluents from the leather complex (Brar and Khurana 2006). The concentration of both the elements at 200 m downstream of the leather complex increased many fold as compared with that from 500 m upstream, indicating the high pollution potential of these elements. However, the concentration of Cr decreased 2 km downstream of the leather complex because of settling of some of the elements at the base of the drain.
Effects of polluted water on soil
It has well been documented that irrigation with sewage water increases soil electrical conductivity and organic C, decreases soil pH, and could result in the accumulation of heavy metals in the plow layer of agricultural soils. Khurana et al. (2003) found that mean concentrations of DTPA-extractable Pb, Ni, Cd, Zn, Mn and Fe in surface soils (0-15 cm) surrounding the densely industrialized city of Ludhiana, irrigated largely with sewage effluents, were 4.2, 3.6, 0.30, 11.9, 25.4 and 49.2 mg/kg as compared, with 2.8, 0.40, 0.12, 2.1, 8.3, 10.9 mg/kg, respectively, in the soils around a less industrialized city of Sangrur, indicating greater loading of soils of Ludhiana with potentially toxic metals through sewage irrigation. In industrialized cities of Amritsar and Jalandhar, mean concentrations of these metals, except Pb and Zn in Amritsar, were in-between the values for Ludhiana and Sangrur. Effects of polluted water on plants Plant species absorbed higher concentration of potentially toxic metals like Pb, Cu, Co, Cd, Ni, Zn, Mn, and Fe in different plant parts when grown in sewage-irrigated soils, as compared with tubewell-irrigated soils. For example, the concentration of Cd in aboveground parts of maize (Zea mays L.), rapeseed (Brassica
juncea L.) and lady’s finger (Abelmoschus esculentus L.) grown on polluted soils was 2.0–3.5 times the amount of Cd when grown on non-polluted soils. The increase in Ni concentration in various crops with waste-water-irrigated crops was 16 to 136% higher than that in tubewell-irrigated crops (Khurana et al. 2003). The roots of all the crops, with a few exceptions, accumulated higher amounts of potentially toxic elements than aboveground parts. Vegetables like spinach (Spinacea oleracea L.), cauliflower (Brassica
oleracea L. var botrytis) and cabbage (Brassica oleracea L. var capitata) tended to accumulate relatively higher concentrations of potentially toxic elements as compared with cereal crop like maize. Among the four vegetables, spinach accumulated the highest amount of all the metals.
Possible mitigation options for water pollution, and recommendations Contamination of groundwater and water bodies due to agricultural, urban and industrial activities poses a threat to ecosystem of northwestern India. It is evident from several studies that the dangers of groundwater pollution are genuine, and in some cases, the situation is alarming particularly beneath dumps of animal wastes and feedlots. Some crops receive large applications of fertilizers, which lead to nitrate and phosphate leaching. Formulation and adoption of careful strategies for applying appropriate amounts of fertilizers and manures at proper times, using correct methods, should help synchronize nutrient supply with crop need and avoid excessive use in crops, and, in turn, reduce nitrate and phosphate pollution of groundwater and water bodies. Water-pollution potential in industrialized cities like Ludhiana and Amritsar is many-folds higher as compared with non- or less-industrialized cities .Therefore, sewage-water of such cities can only be used safely for irrigation after proper treatment. Local bodies need to install effluent treatment plant and only treated waste water should be allowed to be disposed of in water bodies. Efforts should be made to encourage the industries to install their own plants within some agreed time frame to become zero discharge industries. Since very high cost is involved in the installation of treatment plants, many industries cannot install their own treatment plants. Therefore new industries should be allotted plots in such a way that a cluster of identical industries are grouped together so that common treatment plants could be set up for effective treatment economically. There is an urgent need to effectively enforce regulations for the release of industrial effluents pertaining to primary, secondary and tertiary treatments. Educating farmers and public at large about the consequences of dumping animal wastes near feedlots, pumping out shallow polluted water for drinking and domestic purposes, depleting groundwater resources, etc., is desirable. Farm yard manure, calcium carbonate, phosphate, zinc and zeloites as suitable ameliorants for mitigating pollutant toxicity in

© 2010 19th World Congress of Soil Science, Soil Solutions for a Changing World 78 1 – 6 August 2010, Brisbane, Australia. Published on DVD.
soils and crops needs to be utilised. Crops belonging to brassica species and aromatic grasses accumulate higher amounts in their shoots and roots. The hyper-accumulation capability of these crops could be exploited for phytoremediation of toxic elements from polluted soils. Growth of timber and floriculture crops and use of aquatic macrophytes and constructed wetlands need to tested for the removal of toxic pollutants.
0
20
40
60
No Fertilizer With Fertilizer
Nitra
te in soil pro
file (kg ha-1)
After Rice
After Wheat
0
30
60
90
120
150
0 5 10 15 20 25
Olsen-P(mg P kg-1)
Soil depth(cm)
control
Winter-applied P1
Winter-applied P3
Cummulative-applied P1
Cummulative-applied P3
A B
Figure 1. Nitrate-N in 60 cm soil profile after 2-years of rice and wheat crops (A), and Olsen-P accumulation and
leaching in soil profiles of no-P control and four fertilizer P treatments after 29 years of groundnut – based
cropping systems (B). (Adapted from Aulakh et al. 2007).
Table 1. Concentration of toxic elements (mg/L) and pH of the effluents of open Budda Nullah drain at different
locations in Ludhiana city. (Adapted from Khurana et al. 2003).
Sampling sites pH As Pb Ni Cr Fe Zn
Entry point 8.2 0.05 0.004 0.002 0.001 0.30 0.04 2 km downstream 7.8 1.60 0.060 0.12 0.170 5.8 0.18 15 km downstream 7.2 2.10 0.075 0.28 0.260 10.8 0.78
References Aulakh MS, Bijay-Singh (1997) Nitrogen losses and fertilizer N use efficiency in irrigated porous soils.
Nutrient Recycling and Agroecosystems 47, 197–212.
Aulakh MS, Garg AK, Kabba BS (2007) Phosphorus accumulation and leaching, and residual effects on crop yields from long-term applications in subtropics. Soil Use and Management 23, 417–27.
Aulakh MS, Malhi SS (2005) Interactions of nitrogen with other nutrients and water: Effect on crop yield and quality, nutrient use efficiency, carbon sequestration and environmental pollution. Advance in
Agronomy 86, 341–409.
Garg AK, Aulakh MS (2010) Effect of long term fertilizer management and crop rotations on accumulation and downward movement of phosphorus in semiarid subtropical irrigated soils. Communication in Soil
Science and Plant analysis (in press).
Kang MS, Aulakh MS, Dhiman JS (2008). Agricultural development in Punjab: Problems, possible solution and new initiatives. Alumni Association, College of Agriculture, Punjab Agricultural University, Ludhiana. Agalumnus 38, 26–34.
Sharpley AN, Daniel TC, Sims JT, Pote DH (1996) Determining environmentally sound soil phosphorus levels. Journal of soil and water conservation 51, 160–6.
Khurana MPS, Nayyar VK, Bansal RL, Singh MV (2003) Heavy metal pollution in soils and plants through untreated sewage-water. In ‘Ground Water Pollution’ (Eds. VP Singh, RN Yadava), pp. 487–95. (Allied Publishers Pvt. Limited: New Delhi, India)
Brar MS, Khurana MPS (2006) Heavy metal pollution and its impact on environment in Punjab. In ‘All India Seminar on Our Environment: Status and Challenges Ahead’, pp. 60–70 (Punjab Agricultural University, Ludhiana).
© 2010 19th World Congress of Soil Science, Soil Solutions for a Changing World 79 1 – 6 August 2010, Brisbane, Australia. Published on DVD.
Integrated nutrient management for sustainable crop production, improving
crop quality and soil health, and minimizing environmental pollution Milkha S. AulakhA ACollege of Agriculture, Punjab Agricultural University, Ludhiana 141004, Punjab, India, Email [email protected] Abstract Laboratory, growth chamber and multiyear field studies were conducted with prominent cropping systems of the subtropical northwestern states of India including rice–wheat, rice–mustard, rice–rapeseed, soybean–wheat, soybean–rapeseed, groundnut–wheat, and groundnut–sunflower by including legumes (moongbean, cowpea, sesbania, pigeon pea) to investigate the role of integrated nutrient management (INM) in harnessing economically-viable sustainable production, enhancing nutritive quality of the produce, improving soil health, and minimizing environmental pollution. Besides growing legumes and short-duration pulse crops in crop rotations, the effects of integrated use of organics (farmyard manure, piggery manure, poultry manure, green manures and crop residues) with chemical fertilizers, and impacts of long-term use of INM on enhancing crop productivity were studied. The results clearly demonstrated that INM enhances the yield potential of crops over and above achievable yield with recommended fertilizers, and results in better synchrony of crop N needs due to (a) slower mineralization of organics, (b) reduced N losses via denitrification and nitrate leaching, (c) enhanced nutrient use efficiency and recovery by crops, and (d) improvements in soil health and productivity, and hence could sustain high crop yields in various cropping systems ensuring long-term sustainability of the system. Key Words Food security, nutrient transformations, nitrate and P leaching, greenhouse gases, climate change. Introduction One of the most important challenges facing humanity today is to conserve/sustain natural resources, including soil and water, for increasing food production while protecting the environment. As the world population grows, stress on natural resources increases, making it difficult to maintain food security. Long-term food security requires a balance between increasing crop production, maintaining soil health and environmental sustainability. In India, effective nutrient management has played a major role in accomplishing the enormous increase in foodgrain production from 52 million tons in 1951-52 to 230 million tons during 2007-08. However, application of imbalanced and/or excessive nutrients led to declining nutrient-use efficiency making fertilizer consumption uneconomical and producing adverse effects on atmosphere (Aulakh and Adhya 2005) and groundwater quality (Aulakh et al. 2009) causing health hazards and climate change. On other hand, nutrient mining has occurred in many soils due to lack of affordable fertilizer sources and where fewer or no organic residues are returned to the soils. Arid and semiarid subtropical soils of northwestern states of India, developed under harsh climate, are inherently poor in organic matter, fertility and water-holding capacity. In these soils, N, P and S deficiencies are principal yield-limiting factors for crop production. INM, which entails the maintenance/adjustment of soil fertility to an optimum level for crop productivity to obtain the maximum benefit from all possible sources of plant nutrients – organics as well as inorganics – in an integrated manner (Aulakh and Grant 2008), is an essential step to address the twin concerns of nutrient excess and nutrient depletion. INM is also important for marginal farmers who cannot afford to supply crop nutrients through costly chemical fertilizers. This paper summarizes the results of extensive research work carried out with dominant crop rotations of major field crops grown in the subtropical northwestern states of India to investigate the role of INM in harnessing economically-viable sustainable production of prominent cropping systems, enhancing nutritive quality of the produce, improving soil health, and minimizing environmental pollution. Methods The subtropical regions of northwestern states of India have summer and winter crop-growing seasons where summer is characterized by high temperature and rainfall (i.e. monsoons); the winter is often dry with low temperature, which is suitable for growing field crops under irrigated conditions. The application of organic manures and raising leguminous crops for green manure (GM) are generally followed in summer crops, as

© 2010 19th World Congress of Soil Science, Soil Solutions for a Changing World 80 1 – 6 August 2010, Brisbane, Australia. Published on DVD.
the temperature and moisture conditions are favourable. Several laboratory, growth chamber and field studies were conducted to study the effects of growing legumes and short-duration pulse crops in crop rotations, integrated use of organics – farmyard manure (FYM), piggery manure, poultry manure, GM and crop residue (CR) with chemical fertilizers, and impacts of long-term use of INM on enhancing crop productivity. Dominant crop rotations of major field crops such as rice–wheat, rice–mustard, rice–rapeseed, soybean–wheat, soybean–rapeseed, groundnut–wheat, and groundnut–sunflower were studied. Leguminous crops (sesbania, cowpea, mungbean), which accumulate biomass at a rapid rate, were grown when fields were vacant and incorporated into soil at or near flowering as GM. Crop yields and nutrients uptake, transformations and leaching of nutrients in soil, gaseous N losses and denitrification, leaching of nutrients, biological N fixation (BNF) by legumes estimated using 15N dilution technique, soil quality parameters such as available nutrients, SOC, water soluble C, particulate organic matter C, light fraction organic matter C, microbial biomass C, and conserved soil moisture were measured. Results Nutrient transformations and availability under controlled and field conditions
Studies conducted under controlled conditions in growth chamber and laboratory revealed that (a) mineralization of nutrients from added organics was differentially affected by temperature, soil aeration status, crop residue quality, and soil P status, (b) the nutrient release pattern and mineralization were directly related to N, P and S content of organics and inversely to carbon to nutrient ratios; thereby implying that a crop residue with high nutrient concentration and lower C:Nutrient ratio decomposes easily and releases nutrient at fast rate, (c) high N, P or S concentration in crop residue reduces the competition for soil mineral nutrient by microorganisms and thus enhances the decomposition by supporting higher microbial activity, (d) provided evidence that the C:N, C:P and C:S ratios are reliable and simple to determine for describing crop residue quality, (e) organics enhanced denitrification losses from soils under nearly-saturated and flooded conditions, and (f) CO2 emission from soils, an indicator of C supply to microorganisms, was directly related to denitrification activity. Verification of these findings under field conditions confirmed that (a) sesbania GM that had high N content and narrow C:N ratio mineralized rapidly, which explained the enhanced efficiency of GM, compared to fertilizer N (FN), in supplying N to growing plants and increasing crop yields, N uptake, and N recovery; (b) wide C:N ratio crop residues of wheat, rice and rapeseed caused immobilization of mineral N but with conjoint incorporation of sesbania GM counteracted this deleterious effect, supplied N to rice and increased yields; and (c) incorporation of narrow C:N ratio groundnut residues in conjunction with fertilizer N and P in sunflower crop exhibited fast N and P mineralization even during cool winter; 31 % of groundnut residue-N and 32 % of groundnut residue-P were utilized by the crops, and Olsen-P status of soil increased from initial 12 kg P /ha to 24–43 kg P /ha in INM plots after 4 years of groundnut-sunflower rotation. However, few revelations noted under controlled conditions, where moisture and temperature regimes were kept constant and plants were not grown, were not observed under field conditions. (a) While organics such as GM, FYM and CR increased N2O emissions under laboratory conditions, INM did not affect N2O emissions in rice-wheat rotation under field conditions (Table 1). (b) Application of organics in conjunction with FN enhanced denitrification losses from soils under nearly-saturated and flooded conditions under controlled conditions, whereas INM significantly reduced gaseous N losses as compared to the application of FN alone in rice-wheat system (Table 1). (c) No doubt the increased CO2 production with INM in soils under rice coincided with enhanced rates of denitrification but the total flux of CO2-C from rice-wheat system even with the use of organics was far less than CO2-C consumed by crops for photosynthesis suggesting that high yielding cropping systems are rather sinks than sources of atmospheric CO2-C. This research work further illustrated that (a) INM significantly improves physical, chemical and biological properties of soil; (b) depending upon the ease of mineralization as related to C:N ratio of added organics, 6 % of added C through sesbania GM, 10 % of groundnut residues, 17 % of rice residue and 21 % of wheat residue was sequestered into the soil in a period of 4 years (Table 1); (c) SOC and other labile pools of C and N were significantly improved with INM plots after 4 years of study (Table 2); (d) while FN had no residual effects, residual GM produced significantly greater yields of a succeeding crop due to the supply of N equivalent to 17-90 kg FN /ha in different crop rotations; for example, GM could save up to 60 kg N /ha in rice and 30 kg N /ha in succeeding wheat or 17 kg N /ha in rapeseed; (e) surface retained crop residues in no-till field conserved soil moisture and enhanced the intrinsic biological N-fixing capacity of soybean by 20 % (Figure 1), thus enabling legumes to meet the large proportion of their N requirement; and (f) INM enhanced crop quality by enhancing the acquisition of nutrients, synthesis of protein, oil and fatty acids.

© 2010 19th World Congress of Soil Science, Soil Solutions for a Changing World 81 1 – 6 August 2010, Brisbane, Australia. Published on DVD.
Table 1. Effect of INM on rice yield, denitrification losses, N20 emissions and soil organic C.
Treatment N20 emissions
Rice yield (q /ha)
Denitrification losses (kg /ha) (kg /ha)
Soil organic C (%)
Control 34 18 6.9 0.37 120 kg FN /ha 56 58 12.4 0.37 GM20 + 32 kg FN /ha 59 50 11.8 0.41 CR6 + GM20 + 32 kg FN /ha 59 52 11.8 0.49 LSD (0.05) 2 6 3.4 0.04
FN = 88 kg N /ha through 20 t /ha sesbania green manure; CR = 6 t /ha crop residues Table 2. Effect of INM on soil organic C, potentially mineralizable N (PMN) and microbial biomass N (MBN) in
soybean-wheat rotation under conventional till (CT) and no-till (NT) systems.
Treatments TOC (Mg C /ha) PMN (mg N /kg) MBN (mg N /kg) CT NT CT NT CT NT
Control 2.9 3.5 2.7 3.6 5.9 6.4 N20 + P60 3.2 3.6 2.9 3.9 9.5 10.4 N20 + P60+ 10 t FYM /ha 3.4 3.8 5.1 6.5 16.0 16.8 N25+ P75 3.3 3.6 3.9 5.1 12.7 15.6 Control + CR 3.0 3.7 3.3 4.2 7.0 7.2 N20 + P60 + CR 3.4 3.8 6.9 8.9 12.9 15.4 N20 + P60+ 10 t FYM /ha +CR 4.4 4.8 9.7 12.1 24.3 27.3 N25+ P75 + CR 3.7 3.8 8.4 10.3 17.6 20.5
These studies clearly demonstrated that excessive application of N reduces crop yields and results in leaching of NO3
- to deeper soil layers. Enhanced nitrate accumulation (70 to 74 %) in the 90 to 150 cm depth indicated the possibility of nitrate leaching below 150 cm and into groundwater. While leaching of nitrate beyond plant rooting zone could be substantial in rice fields fertilized with FN in porous soils, INM could minimize potential nitrate leaching as organics act as slow release fertilizers synchronizing N supply with plant need. It is further established that long-term applications of fertilizer P could cause enormous movement of P to deeper layers in a coarse-textured soil having low adsorption and retention capacity for nutrients whereas INM reduces accumulation of labile P in soils as well as downward movement to deeper soil layers.
67 66 77
80 79
94
25
50
75
100
CT (-CR) NT (-CR) NT (+CR)
Ndfa (%) or BNF (kg/ha)
%Ndfa BNF (kg ha-1)
Figure 1. Per cent N derived from atmosphere (% Ndfa) and biological N fixation (BNF) by soybean under
conventional-till (CT) and no-till (NT) with or without wheat crop residue (CR).
Practical implications and benefits of INM
The findings on microbial transformations of organic amendments to plant available N, P and S, and gaseous N forms led to the better understanding of N cycling processes to develop most efficient use of organics for the (a) evaluation of agricultural management effects on soil health and productivity, (b) determining the potential of denitrification and emission of greenhouse gases, and (c) aiding in the selection of nutrient management practices for sustainable agriculture. These findings have several practical implications: (a) Incorporation of narrow C:N ratio organics (poultry and green manures) at sowing of crops could release sufficient mineral N to synchronize N supply with crop needs during early growth period, whereas some initial starter N would be needed when wide C:N ratio organics (cattle manure, pressmud, cereal crop residue) are incorporated. (b) In case of substantially enhanced immobilization of mineral N with the
© 2010 19th World Congress of Soil Science, Soil Solutions for a Changing World 82 1 – 6 August 2010, Brisbane, Australia. Published on DVD.
incorporation of wide C:N ratio crop residues, application of FN would facilitate re-mineralization after about 3-week period. (c) INM has its residual effects producing 9-35 % greater yields of succeeding crops in different cropping systems. (d) Conjoint use of legume GM and FN could alleviate the deleterious effects due to the incorporation of wide C:N ratio cereal crop residues. (f) Incorporation of groundnut crop residues in conjunction with the adequate rates of FN and FP has complementary effects in maximizing the yields, uptake of N and P, and nutrient use-efficiency in groundnut-sunflower rotation. INM enhances the yield potential of crops over and above achievable with recommended fertilizers. For example seed yield of mustard increased significantly up to 100 kg FN /ha + 30 kg P2O5 /ha (which are recommended rates) but decreased thereafter with further increase in FN rate to 150 kg FN /ha due to excessive vegetative growth and resultant lodging. In contrast, all through 4 years, the combined application of GM with 100 kg N /ha further improved the yield potential of mustard by 11 %. Similar increase in the yield potential of rice (10 %) and rapeseed (16 %) in other studies illustrated the benefit that any amount of fertilizers cannot achieve. Development of INM technologies, formulation of strategies and their adoption These research findings led to the development of several sound INM technologies: (a) Green manuring in rice–wheat, rice–mustard, and rice–rapeseed is cost effective and economically viable. (b) Under constrained water resources, GM produced during the mild-rainy season and applied to rapeseed is more beneficial than rice-applied GM. (c) Supply of nutrients through the integrated use of 20 t GM and 60 kg FN /ha provides advantages over the use of 120 kg FN /ha alone, producing greater yields of rice and wheat while reducing the use of FN by >50 % in rice and 25 % in wheat. It significantly reduces denitrification losses and diminishes the accumulation of residual NO3
- in the soil profile, and hence reduces the chances of NO3-
leaching to groundwater providing environmental benefits. (d) INM through GM, crop residues and FN in a rice-based cropping systems, groundnut-sunflower, soybean-based cropping systems has the long-term benefit of C sequestration and improved soil health resulting in high crop yields, help maintain balanced nutrients supply, check multinutrient deficiencies and sustain crop yields at a higher level. Conclusions These studies provided an insight into the practical understanding, and illustrated beyond any doubt, how INM strategy can result in agronomically feasible, economically viable and environmentally sound sustainable crop production systems by enhancing soil fertility and C sequestration, and reducing N losses and emission of greenhouse gases. Formulation and adoption of careful strategies to propagate the long-term usefulness of INM in providing nutrients and improving the soil health, educative extension efforts about the economic and environmental benefits of INM, regulations for prohibiting the burning of crop residues, and some incentives for encouraging the crop residue incorporation as a means of disposal could lead to the adoption of such eco-friendly practices. References Aulakh MS, Adhya TK (2005) Impact of agricultural activities on emission of greenhouse gases – Indian
perspective. In ‘International Conference on Soil, Water and Environmental Quality – Issues and Strategies’, pp. 319-335 (Indian Society of Soil Science: New Delhi).
Aulakh MS, Grant CA (2008) ‘Integrated Nutrient Management for Sustainable Crop Production’. (The Haworth Press, Taylor and Francis Group: New York).
Aulakh MS, Khurana MPS, Singh D (2009). Water pollution related to agricultural, industrial and urban activities, and its effects on food chain: Case studies from Punjab. Journal of New Seeds 10, 112-137.

© 2010 19th World Congress of Soil Science, Soil Solutions for a Changing World 83 1 – 6 August 2010, Brisbane, Australia. Published on DVD.
Investigation of nitrogen-fixing potential in soil bacterial microbiota from
Lapland boreal forest limit Shintaro HaraA , Teemu TahvanainenB and Yasuyuki HashidokoA AFaculty of Agriculture, University of Hokkaido, Sapporo, Hokkaido, Japan, Email mailto:[email protected] BDepartment of Biology, University of Eastern Finland, Joensuu, Finland Abstract In forest ecosystem of high latitude or high elevation, the nitrogen cycle has not been elucidated, although nitrogen-fixing bacteria may play an important role in forest bed soil for nitrogen supply. In this study, bacterial nitrogen fixation in soil of Northern high latitude area in Pallas, Lapland (68˚N, forest limit) was investigated, and effective of incubation conditions for nitrogen fixation such as concentration of carbon source in medium and temperature, were examined. Although these bacterial microflora did not show any nitrogen fixation in a medium containing 1.0% carbon source, a concentration that is widely used for rhizobia and other diazotrophs, the Lapland soil showed nitrogen-fixing abilities at relatively low (0.3-0.02%) concentration of carbon source. DNA was extracted from the soil and from cultured bacteria which were incubated in nitrogen-poor medium under alternative conditions. Using DGGE (denaturing gradient gel electrophoresis) technique, analyses for bacteria community of soil of high latitude forest limit area is undertaken in order to reveal specific features of the nitrogen-fixing bacterial community. Key Words Nitrogen fixation, boreal forest limit, soil bacteria, gellan gum soft gel. Introduction Although the ecology and distribution of boreal forest limit have been studied for a long time, the factors that prevent tree growth and forest establishment at the boreal forest limit are not fully understood. Nitrogen is often considered as one of the most important factors for primary production in terrestrial plants (Vitousek and Howarth 1991), especially in high latitudes, where soils are exposed to cold temperature and are subject to leaching of organic matter during summer season. Previous studies have emphasized that annual nitrogen mineralization failed to account for the annual nitrogen demand of plants in boreal forest ecosystems because of low temperature (Kielland 1994; Schimel and Chapin 1996). Recently, Kielland (1994) suggested that organic nitrogen, particularly dissolved amino acids, constitute a large portion of the nitrogen budget for plants in boreal forest limit ecosystems, but the source of the organic nitrogen itself has not been clarified yet. In boreal Scandinavian spruce forests, rate of decomposition is also low but cyanobacterium inhabiting the ubiquitous feather moss covering the forest bed is thought to be a nitrogen supplier (Delca et al. 2002). In contrast, in studies on nitrogen fixation in high latitude or permafrost area where moss carpet does not develop, the nitrogen cycle has not completely been clarified. In the case of East Siberian forest, soil microbiota and free-living nitrogen-fixing bacteria in the active layer showed relatively high acetylene reduction in soilless medium solidified with gellan gum (Hara et al. 2009). Furthermore, the soil microbiota of East Siberian forest bed also showed higher acetylene reduction under conditions similar to soil environments compared to some conventional methods for rhizobia or tropical diazotrophs (Hara et al. 2010).
In this study, we measured nitrogen-fixing capability of soil bacteria sampled from a boreal forest limit ecosystem in Pallas, Lapland and investigated effects of culture conditions, including molecular species and concentration of carbon sources for nitrogen fixation.
Methods Soil sampling and site description
Spruce forest bed soils were collected in mid-September 2009 from the Pallas, Lapland, northern part of Finland. In the Pallas National Park (68˚02’N, 24˚04’E, alt 710 m), high altitude boreal forest limit area, organic layer (O-horizon), podzol soil (E-horizon) and mineral soil (B-horizon) were sampled in three sites. As a reference, organic layer (O-horizon) and mineral soil (A- and B-horizon) of artificial larch forest established on volcanic sand in Tomakomai, Japan (42˚39’N, 141˚47’E, alt 25 m) were sampled. These soils were kept at 4˚C until use.

© 2010 19th World Congress of Soil Science, Soil Solutions for a Changing World 84 1 – 6 August 2010, Brisbane, Australia. Published on DVD.
Culture medium and bacterial inoculation
Winogradsky’s nitrogen-poor mineral medium was prepared as described in previous study (Hara et al. 2009). In the current study, D-mannitol or a mixture of D-fructose, D-glucose, sucrose, D-mannitol, succinic acid, DL-malic acid, molar ratio of 2: 2: 2: 2: 1: 1, were used as carbon source as mimicking root exudates (Bürgman et al. 2006). pH of the solution was adjusted to 5.0 with 2M H2SO4 approximate soil pH, and the solution was solidified with 3 g/L gellan gum. Incubation and acetylene reduction assay
In the acetylene reduction assay, 300 mg of soils from each horizon were incubated in 10 mL medium in 30-mL gas chromatographic vial. After 7-day pre-incubation, a 10% volume of acetylene gas was injected in headspace and the culture medium was further incubated for more 3 days. Headspace gas containing ethylene gas converted from acetylene was analysed by gas chromatography. WSOC (water-soluble organic carbon) and pH
For WSOC, 2 g of each soil was mixed with 20 mL of MilliQ water and shaken for 1 h at 130 rpm. To measure the organic carbon, extracts were filtered by 0.45 µm filter and content of organic carbon of them were measured. For pH measuring, 3 g of each soil was mixed with 15 mL of deionized water and shaken for 30 min by hand, and pH of suspensions were measured. Results Although all the soils from every B-horizon showed acetylene reduction, those from podozol (E-horizon) showed trace activity. In appropriate carbon source selection, each soil bacterium showed higher activity in 0.05% carbon source mixture than in 0.05% D-mannitol (max of site 2 B2-horizon soil, 0.39 µmol C2H4/d/vial for carbon source mixture cf. 0.058 µmol C2H4/d/vial). Soils from B-horizon of site 2 were tested for acetylene reduction assay at different concentrations (0.01, 0.03, 0.1, 0.32, 1.0%) of the carbon source mixture. Soils from the B-horizon and B2-horizon showed activity at 0.03, 0.1, 0.32% of the carbon source mixture, but did not at 1.0% (Figure 1A). On the other hand, soil of A-horizson from Tomakomai with richer supply of organic matter from litter fall showed the highest activity at 1.0% carbon source in the medium (Figure 1B). In further investigaton, soils of B1-horizon and B2-horizon showed relatively high activity in 0.02% carbon source containing medium (B1-horizon, 0.63 µmol C2H4/d/vial; B2-horizon, 0.46 µmol C2H4/d/vial). Table 1. Characteristics of the soils.
Horizon Depth (cm) WSOC (ppm) pH Pallas site 1 O -20 ~ -10 - 3.86 H -10 ~ 0 - 4.62 E 0 ~ 47.17 4.91 Pallas site 2 O -2 ~ 0 - 4.13 E 0 ~ 5 32.29 4.93 B1 5 ~ 10 10.31 5.12 B2 10 ~ 10.57 5.20 Pallas site 3 O -3 ~ 0 - 4.04 E 0 ~ 8 45.68 4.73 B 8 ~ 43.67 5.01 Tomakomai O -5 ~ 0 - 5.53 A 0 ~ 20 43.31 5.64 B 20 ~ 16.85 6.58
Conclusion As revealed by the incubation method used in this study, soil bacteria from B-horizon in boreal forest limit area showed relative high nitrogen fixation. In this study, the highest performance for the nitrogen fixation was brought at low concentration (0.02-0.3%) of carbon source mixture, which is imitated root exudation. In the Tomakomai larch forest soil, soil bacteria from the A-horizon, which is considered to be relatively nutrient rich due to rich litter production, showed the highest activity in the medium containing 1.0% carbon source mixture, while samples obtained from the B-horizon showed activity only at low concentration of carbon source, similar to those from boreal forest limit. These results indicate the importance of low concentration of carbon source, imitating the local soil conditions. Not only carbon source including its components, but also incubation temperature, medium pH and other physical and chemical conditions are

© 2010 19th World Congress of Soil Science, Soil Solutions for a Changing World 85 1 – 6 August 2010, Brisbane, Australia. Published on DVD.
Figure 1. Acetylene reduction under altered carbon source concentration. Soil bacterial microbiota from B-
horizon of Pallas (Finland) and those from A- and B-horizon of Tomakomai (Japan) were incubated in medium
containing 0.01, 0.03, 0.10, 0.32 or 1.0% concentration of carbon source mixture (n=3, ±SD). (A): site 2 forest
limit in Pallas (Finland), filled circle (-●-) and open triangle (-△△△△-)are B1- and B2-horizon soils respectively. (B):
larch forest in Tomakomai (Japan), open rhombus (-����-) and filled triangle (-▲-) are A- and B-horizon
respectively.
possible environmental factors characteristic of the location and highly affective on nitrogen fixation. Therefore, effect of these conditions on nitrogen fixation should be tested. To clarify the relationship between microbial succession and culture/or soil conditions, bacterial composition should be examined by means of metagenomic analysis using DGGE techniques targeted at bacterial 16S rRNA gene. Sampling should include soil microbiota extracted directly from the soil and from the soil microbiota culture medium for acetylene reduction assay. References DeLuca TH, Zackrisson O, Nilsson MC, Sellstedt A (2002) Quantifying nitrogen-fixation in feather moss
carpets of boreal forests. Nature 419, 917–919.
Hara S, Hashidoko Y, Desyatkin RV, Hatano R (2009) High rate of N2 fixation by East Siberian cryophilic soil bacteria as determined by measuring acetylene reduction in nitrogen-poor medium solidified with gellan gum. Applied and Environmental Microbiology 75, 2811-2819.
Hara S, Hashidoko Y, Desyatkin RV, Morishita T, Hatano R (2010) Clear increases of acetylene reduction by soil bacteria from East Siberian Taiga forest bed under appropriate conditions mimicking the natural soil environments. Soil Science and Plant Nutrition (1st revised submitted)
Kielland K (1994) Amino acid absorption by arctic plants: implications for plant nutrition and nitrogen cycling. Ecology 75, 2373-2383.
Sjögersten S, Wookey PA (2005) The Role of Soil Organic Matter Quality and Physical Environment for nitrogen mineralization at the forest-tundra ecotone in Fennoscandia. Arctic, Antarctic and Alpine
Research 37, 118-126.
Vitousek PM, Howarth RW (1991) Nitrogen limitation on land and in the sea: How can it occur? Biogeochemistry 13, 87–115.
© 2010 19th World Congress of Soil Science, Soil Solutions for a Changing World 86 1 – 6 August 2010, Brisbane, Australia. Published on DVD.
Long-term effects of black carbon on soil properties
Chih-Hsin ChengA*, Johannes LehmannB, James KinyangiC, Dawit SolomonB and Ting-Leuh WuA ASchool of Forestry and Nature Reservation, National Taiwan University, Taipei, Taiwan, Email: [email protected] BCrop and Soil Sciences, Cornell University, Ithaca, NY 14850, USA CInternational Livestock Research Institute, Nairobi, Kenya Abstract Using biomass-derived black carbon (or biochar, BC) as soil amendment has been proposed to be a promising method for enhancing soil carbon (C) sequestration and fertility. However, in addition to the “terra preta” phenomenon, direct and available information about long-term effects of BC on soil properties is still scarce. In this study, we used the BC-containing soils collected from historical charcoal blast furnace sites where BC was deposited in the 19th century to examine the long-term effects of BC. A wide geographical distribution from Quebec to Alabama along the eastern part of the US was selected. Both BC-containing and adjacent soils were collected from soil layers at the depth of 0 to 10 and 10 to 20 cm. Our results showed that soil organic C and BC contents in the BC-containing soils were 9 and 21 times higher than those in the adjacent soils, respectively. Soil physical and chemical properties were significantly different between the BC-containing and adjacent soils, in which soil pH, total N, Mehlich-3 extractable phosphorus, cation exchange capacity, exchangeable cations, and percentage of base saturation were higher in the BC-containing soils. We also measured the chemical properties of BC particles in the size of 1 to 2 mm in order to represent the influences of BC itself and found more concentrated amounts on surface charge, exchangeable cations and available P in this portion. The results suggest that BC could play important roles in affecting long-term soil properties. Thus, BC itself could enhance C content, surface charge and available nutrients of soils through BC’s intrinsic refractory and surficial oxidation. Key Words Black carbon, surface charge, exchangeable cations, nutrients, charcoal blast furnace. Introduction The “terra preta” phenomenon provides a promising way of using biomass-derived black carbon (or biochar, BC) for enhancing soil C sequestration and fertility (Glaser et al. 2001; Lehmann 2007). However, in addition to the “terra preta” phenomenon, direct and available information about long-term effects of BC on soil properties is still scarce. In this study, we used the BC-containing soils collected from historical charcoal blast furnace sites where BC was deposited in the 19th century to examine the long-term effects of BC. Unlike the soils from terra preta, these soils from historical charcoal blast furnace had never been converted to crop production. Thus, this study could focus more on understanding the direct influence of BC itself on soil properties. Since BC is thermally altered, BC can be resistant from microbial decomposition in nature for a long time. Nevertheless, surficial oxidation of BC can occur along its long-term exposure and render BC to develop surface negative charge (Cheng et al. 2008a). We tested three major soil properties of (i) BC contents, (ii) soil surface charge, and (iii) exchangeable cations and available phosphorus contents between BC-containing and adjacent soils to understand the roles of BC towards soil properties. Methods Sampling sites
High BC-containing soils were collected from the historical sites of charcoal blast furnaces. The BC found in soils near these furnace sites was only deposited during a relatively short period around the 1870s, as the rapid depletion of forest resources soon led to the replacement of charcoal furnaces by anthracite furnaces (Warren 1973). In the 19th century, every eastern state in the U.S. (except for Delaware) had at least one furnace. In this study, sixteen historical charcoal furnaces sites, spanning along a climosequence from Quebec (QC) to Alabama (AL), were selected. Dark black soil color and even large BC fragments are conspicuous in these BC-containing soils (Figure 1). Both BC-containing and adjacent soils were collected from soil layers at the depth of 0 to 10 and 10 to 20 cm.
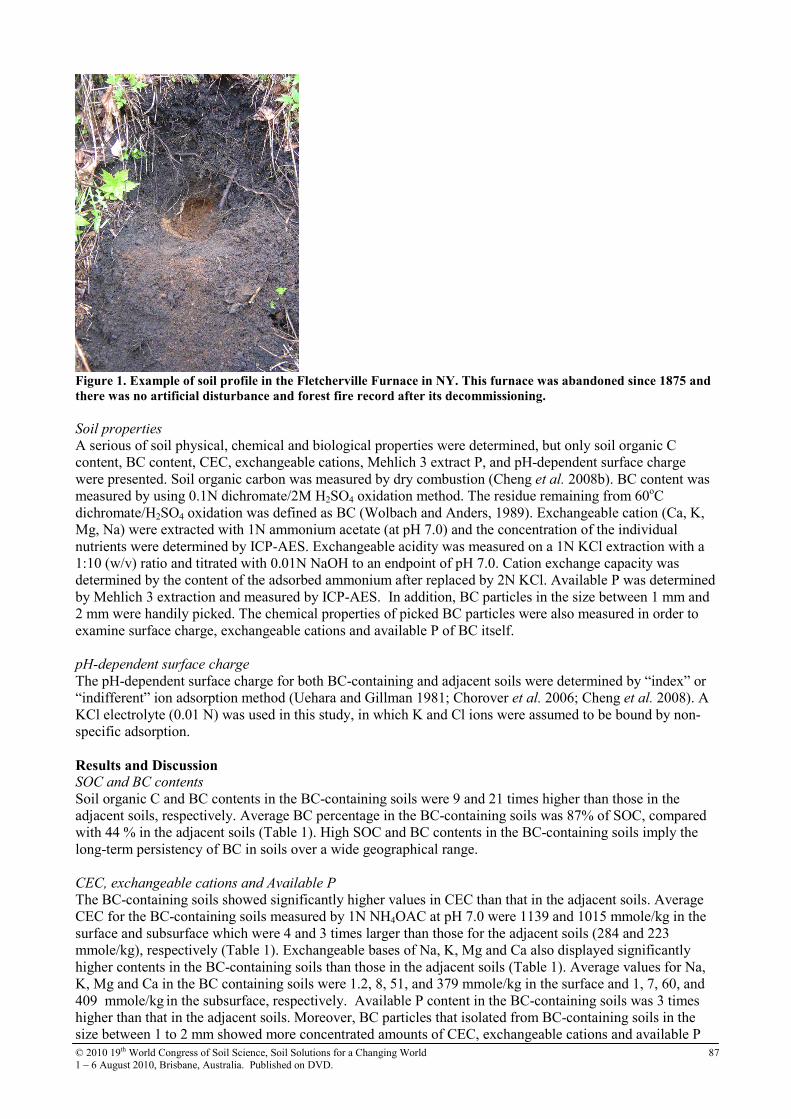
© 2010 19th World Congress of Soil Science, Soil Solutions for a Changing World 87 1 – 6 August 2010, Brisbane, Australia. Published on DVD.
Figure 1. Example of soil profile in the Fletcherville Furnace in NY. This furnace was abandoned since 1875 and
there was no artificial disturbance and forest fire record after its decommissioning.
Soil properties
A serious of soil physical, chemical and biological properties were determined, but only soil organic C content, BC content, CEC, exchangeable cations, Mehlich 3 extract P, and pH-dependent surface charge were presented. Soil organic carbon was measured by dry combustion (Cheng et al. 2008b). BC content was measured by using 0.1N dichromate/2M H2SO4 oxidation method. The residue remaining from 60oC dichromate/H2SO4 oxidation was defined as BC (Wolbach and Anders, 1989). Exchangeable cation (Ca, K, Mg, Na) were extracted with 1N ammonium acetate (at pH 7.0) and the concentration of the individual nutrients were determined by ICP-AES. Exchangeable acidity was measured on a 1N KCl extraction with a 1:10 (w/v) ratio and titrated with 0.01N NaOH to an endpoint of pH 7.0. Cation exchange capacity was determined by the content of the adsorbed ammonium after replaced by 2N KCl. Available P was determined by Mehlich 3 extraction and measured by ICP-AES. In addition, BC particles in the size between 1 mm and 2 mm were handily picked. The chemical properties of picked BC particles were also measured in order to examine surface charge, exchangeable cations and available P of BC itself. pH-dependent surface charge
The pH-dependent surface charge for both BC-containing and adjacent soils were determined by “index” or “indifferent” ion adsorption method (Uehara and Gillman 1981; Chorover et al. 2006; Cheng et al. 2008). A KCl electrolyte (0.01 N) was used in this study, in which K and Cl ions were assumed to be bound by non-specific adsorption. Results and Discussion SOC and BC contents
Soil organic C and BC contents in the BC-containing soils were 9 and 21 times higher than those in the adjacent soils, respectively. Average BC percentage in the BC-containing soils was 87% of SOC, compared with 44 % in the adjacent soils (Table 1). High SOC and BC contents in the BC-containing soils imply the long-term persistency of BC in soils over a wide geographical range. CEC, exchangeable cations and Available P
The BC-containing soils showed significantly higher values in CEC than that in the adjacent soils. Average CEC for the BC-containing soils measured by 1N NH4OAC at pH 7.0 were 1139 and 1015 mmole/kg in the surface and subsurface which were 4 and 3 times larger than those for the adjacent soils (284 and 223 mmole/kg), respectively (Table 1). Exchangeable bases of Na, K, Mg and Ca also displayed significantly higher contents in the BC-containing soils than those in the adjacent soils (Table 1). Average values for Na, K, Mg and Ca in the BC containing soils were 1.2, 8, 51, and 379 mmole/kg in the surface and 1, 7, 60, and 409 mmole/kg in the subsurface, respectively. Available P content in the BC-containing soils was 3 times higher than that in the adjacent soils. Moreover, BC particles that isolated from BC-containing soils in the size between 1 to 2 mm showed more concentrated amounts of CEC, exchangeable cations and available P

© 2010 19th World Congress of Soil Science, Soil Solutions for a Changing World 88 1 – 6 August 2010, Brisbane, Australia. Published on DVD.
compared with the corresponding soils and indicated the crucial contribution of BC itself toward soils properties (Table 1). The enhancements of all exchangeable cations in Na, K, Mg and Ca in the BC-containing soils could imply that these increases are promoted by the improvements of soil properties, not just by specific application of ash or lime (Rolando 1992). We propose ash content, high pH value, and high surface charge of BC would facilitate BC-containing soils to retain exchangeable bases. Phosphate may become repulsive when surface negative charge is increased. However, higher soil pH values in the BC-containing soils can reduce P fixation from adsorption or precipitation with iron or aluminium and lead to have higher available P. Table 1. Soil organic carbon, black carbon, cation exchange capacity, exchangeable cations, base saturation, and
available P contents in the BC-containing and adjacent soils (n=16)
SOC BC PCEC ECEC Exchchangeable (mmol/kg) Exch. BS Avail P g/kg Na K Mg Ca Acidity % mg/kg 0 – 10 cm BC-containing 228 - 1139 447 1.2 8 51 379 7.1 97 - Adjacent 53 - 284 107 0.3 3 13 99 8.7 81 - 10 – 20 cm BC-containing 275 197 1015 495 1.0 7 60 409 7.9 93 38 Adjacent 31 12 223 94 0.1 2 14 68 9.3 68 18 BC particles 1612 1.8 10 77 549 30a an=9 pH-dependent charge
Surface negative charge measured by 0.01N KCl adsorption method showed surface negative charge of both BC-containing and adjacent soils increased with increasing pH (Figure 2). High surface negative charge was also observed in the BC-containing soils. However, negligible positive charge was found for both BC-containing and adjacent soils. Long-term natural oxidation renders BC to develop surface functional groups, such as carboxylic and phenolic groups, and increase surface negative charge or reduce surface positive charge (Cheng et al. 2008a).
3 4 5 6 7 8 9
mmole kg-1
0
200
400
600
800
1000
3 4 5 6 7 8 9
0
20
40
60
80
100
pH pH
(a) BC-containing soil (b) Adjcent soil
Figure 2. The values of surface positive (triangles) and surface negative charge (circles) versus pH of historical
BC samples in NY of (a) BC-containing soil and (b) adjacent soil.
Conclusion Our results suggest that BC plays important roles in affecting long-term soil properties, in which C content, surface charge and available nutrients could be enhanced through BC’s intrinsic refractory and surficial oxidation. Our studies reinforce the promising application of BC for long-term C sequestration and soil fertility improvement.
References Cheng CH, Lehmann J, Engelhard MH (2008a) Natural oxidation of black carbon in soils: changes in
molecular form and surface charge along a climosequence. Geochimica et Cosmochimica Acta 72, 1598-1610.
Cheng CH, Lehmann J, Thies JE, Burdon SE (2008b) Stability of black carbon in soils across a temperature gradient. Journal of Geophyical Research 113, G02027 doi:10.1029/2007JG000642.
Chorover J, Amistadi MK, Chadwick OA (2006) Surface charge evolution of mineral-organic complexes

© 2010 19th World Congress of Soil Science, Soil Solutions for a Changing World 89 1 – 6 August 2010, Brisbane, Australia. Published on DVD.
during pedogenesis in Hawaiian basalt. Geochimica et Cosmochimica Acta 68, 4859-4876. Glaser B, Haumaier L, Guggenberger G, Zech W (2001) The 'Terra Preta' phenomenon: a model for
sustainable agriculture in the humid tropics. Naturwissenschaften 88, 37-41. Lehmann J (2007) Bio-energy in the black. Frontiers in Ecology and the Environment 5, 381-387. Rolando VR (1992) 200 years of soot and sweat: the history and archeology of Vermont’s iron, charcoal, and
lime industries. Vermont Archaeological Society, Machester Center, Vermont. Uehara G, Gillman G. (1981) The mineralogy, chemistry, and physics of tropical soils with variable charge
clays. Westview Press, Inc. CO. Warren K (1973) The American steel industry, 1850-1970: a geographic interpretation. (Oxford University
Press, London). Wolbach WS, Anders E (1989) Elemental carbon in sediments: determination and isotopic analysis in the
presence of kerogen. Geochimica et Cosmochimica Acta 53, 1637-1647.

© 2010 19th World Congress of Soil Science, Soil Solutions for a Changing World 90 1 – 6 August 2010, Brisbane, Australia. Published on DVD.
Long-term tillage effects on bacterial biomass and community structure
distribution within water stable aggregates X.J. JiangA ACollege of Resources and Environment, Southwest University, 2 Tiansheng Road, Beibei, Chongqing, 400715, China, Email [email protected] Abstract This study addresses the tillage effect on the distribution of bacterial biomass and their community structure in a subtropical purple rice soil ecosystem. Similar distribution patterns of soil bacterial biomass within water-stable aggregates (WSA) were observed under different tillage managements. Although the distribution pattern of soil microbial biomass was not changed by tillage practice, soil microbial biomass increased significantly in all size fractions of WSA under combined ridge with no-till (RNT) treatment. While tillage management did not change the distribution patterns of soil microbial biomass, it did change their community structure. Results indicated that the distribution pattern of microbial biomass in WSA was governed by aggregate size, whereas bacterial community structure was significantly affected by tillage management. Key Words Soil structure, no-tillage, microbial community. Introduction Agricultural land management is one of the most significant anthropogenic activities that greatly alter soil characteristics, including physical, chemical, and biological properties and processes. Thus, while agriculture is expected to affect the diversity and structure of soil microbial communities, the specific responses of various bacterial groups to the changing environment in agricultural soils are not well understood (Buckley and Schmidt 2001). The aim of the present study was to evaluate how soil bacterial biomass and their diversity varies with soil aggregation under different tillage management in a sub-tropical purple rice soil.
Material and methods Experimental site
The Sichuan Basin is located in southwestern China (latitude 28-32° N, longitude 103-108° E) with an annual mean temperature of 14-19 oC, and rainfall of 1000-1400 mm. Field experiment has been carried out at Southwest University since 1990. The soil was Gleyi-stagnic Anthrosols. Crops: Rape (Brassica napus L.) in winter and rice (Oryza sativa L.) in summer.
Tillage treatments and soil sample Combines Ridge with no-tillage (RNT): No-till treatment was imposed on the soil that was ridge tilled before the experiment, and the ridges were kept intact from 1989. Crops: Rice + Rape rotation in a year. Conventional Tillage (CT): Rice + Rape rotation in a year. Flooded Paddy Field (FPF): Rice was planted in a flooded field in summer and land remains fallow in winter. Water was kept flooded in the field all year. Surface soil samples (0-15 cm) were collected in April, 2008. Samples were stored at 4oC for analysis. Fractionation of soil aggregates was achieved using a wet-sieving procedure (Elliott and Cambardella 1991; Cambardella and Elliott 1994).
Microbial biomass assay
Soil bacterial biomass content was calculated from muramic acid content according to Appuhn et al. (2004). A direct and an indirect method were used (Tsaiand Olsen, 1991) followed by purification steps (Smallaet al. 1993) with slight modifications. The 16S rRNA genes from soil microbial communities were amplified by PCR by using the primer pair F984CC/R1378 described by Heuer et al. (1999).
Data analysis
All analyses were carried out on the four replicates. Data (measured or calculated) were subjected to ANOVA.

© 2010 19th World Congress of Soil Science, Soil Solutions for a Changing World 91 1 – 6 August 2010, Brisbane, Australia. Published on DVD.
Result Distribution pattern of bacterial biomass within soil WSA under different tillage managements
The distribution pattern of bacterial biomass under CT, RNT, and FPF had a similar trend. Except for the macro-aggregates bigger than 4.76mm, in which bacterial biomass under CT was significantly higher than for RNT and FPF.
Figure 1. Distribution of bacterial biomass within soil aggregates under different tillage managements. Error
bars represent standard error.
Bacterial DNA fingerprint within soil WSA under different tillage managements
Figure 2. Distribution of bacterial DGGE banding patterns within soil aggregates under different tillage
managements (CT, conventional tillage; RNT, combines ridge with no tillage; PFP, flooded paddy field).
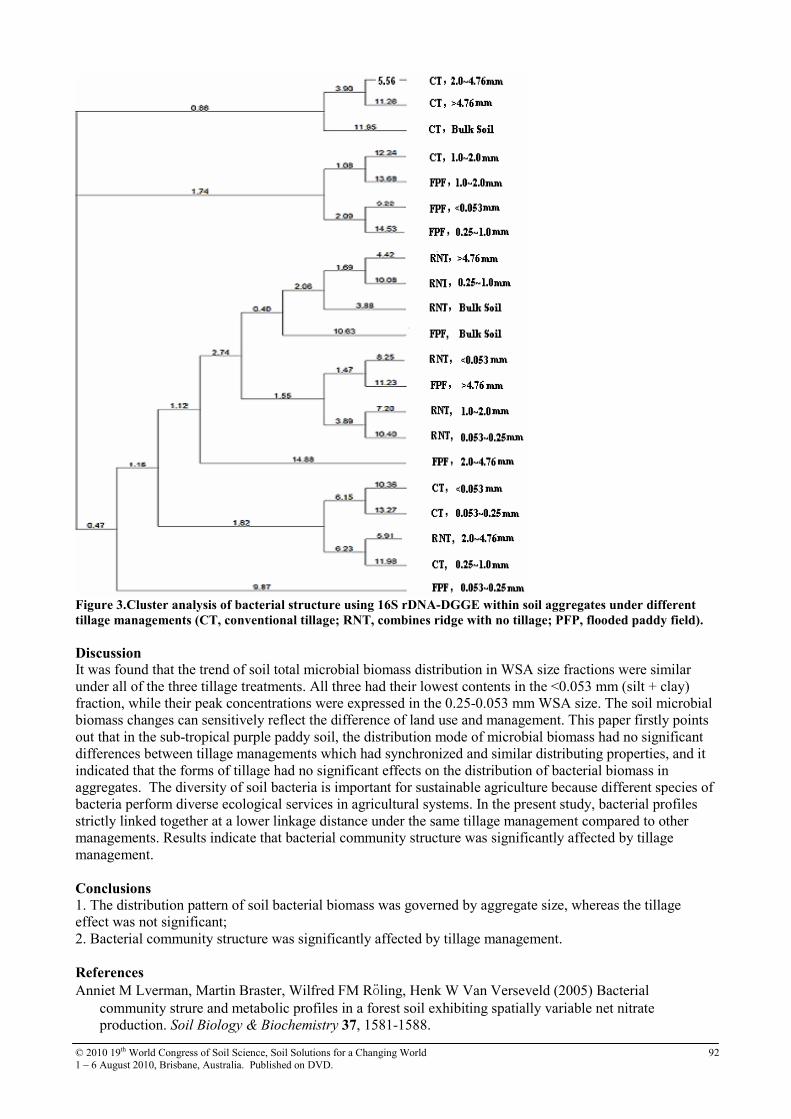
© 2010 19th World Congress of Soil Science, Soil Solutions for a Changing World 92 1 – 6 August 2010, Brisbane, Australia. Published on DVD.
Figure 3.Cluster analysis of bacterial structure using 16S rDNA-DGGE within soil aggregates under different
tillage managements (CT, conventional tillage; RNT, combines ridge with no tillage; PFP, flooded paddy field).
Discussion It was found that the trend of soil total microbial biomass distribution in WSA size fractions were similar under all of the three tillage treatments. All three had their lowest contents in the <0.053 mm (silt + clay) fraction, while their peak concentrations were expressed in the 0.25-0.053 mm WSA size. The soil microbial biomass changes can sensitively reflect the difference of land use and management. This paper firstly points out that in the sub-tropical purple paddy soil, the distribution mode of microbial biomass had no significant differences between tillage managements which had synchronized and similar distributing properties, and it indicated that the forms of tillage had no significant effects on the distribution of bacterial biomass in aggregates. The diversity of soil bacteria is important for sustainable agriculture because different species of bacteria perform diverse ecological services in agricultural systems. In the present study, bacterial profiles strictly linked together at a lower linkage distance under the same tillage management compared to other managements. Results indicate that bacterial community structure was significantly affected by tillage management.
Conclusions 1. The distribution pattern of soil bacterial biomass was governed by aggregate size, whereas the tillage effect was not significant; 2. Bacterial community structure was significantly affected by tillage management.
References
Anniet M Lverman, Martin Braster, Wilfred FM Röling, Henk W Van Verseveld (2005) Bacterial community strure and metabolic profiles in a forest soil exhibiting spatially variable net nitrate production. Soil Biology & Biochemistry 37, 1581-1588.

© 2010 19th World Congress of Soil Science, Soil Solutions for a Changing World 93 1 – 6 August 2010, Brisbane, Australia. Published on DVD.
Bailey VL, Smith JL, Bolton Jr. H (2008) Fungal-to-bacterial ratios in soils investigated for enhanced C sequestration, Soil Biology & Biochemistry 34, 997-1007.
Bausenwein U, Gattinger, Langer U, Embcher A, Hartmann HP, Sommer M, Munch JC, Schloter M (2008) Exploring soil microbial communities and soil organic matter: Variability and interactions in arable soils under minimum tillage practice. Applied Soil Ecology 40, 67-77.
Bittman S, Forge TA, Kowalenko CG (2005) Responses of the bacterial and fungal biomass in a grassland soil to multi-year applications of dairy manure slurry and fertilizer. Soil Biology & Biochemistry 37, 613-623.
Christuan L Lauber, Michael S Strickland, Mark A Brdford, Noah Fierer (2008) The influence of soil properties on the structure of bacterial and fungal communities across land-use types. Soil Biology &
Biochemistry 40, 2407-2415. Frey SD, Elliott ET, Paustian K (1999) Bacterial and fungal abundance and biomass in conventional and no-
tillage agroecosystems along two climatic gradients. Soil Biology & Biochemistry 31, 573-585 Jackson LE, Calderon FJ, Steenwerth KL, Scow KM, Rolston DE (2003) Responses of soil microbial
processes and community structure to tillage events and implications for soil quality. Geoderma 114, 305-317.
Juan P Fuentes, David F Bezdicek, Markus Flury, Stephan Albrecht, Jeffey L Smith (2006) Microbial activity affected by lime in a long-term no-till soil. Soil & Tillage Research 88, 123-131.
Alvear MA Rosas, Rouanet JL, Borie F ( 2005) Effects of three soil tillage systems on some biological activities in an Ultisol from southern Chile. Soil & Tillage Research. 82, 195-202.
Väisänen RK, Robers MS, Garland JL, Frey SD, Dawson LA (2005) Physiological and molecular characterization of microbial communities associated with different water-stable aggregate size classes. Soil Biology & Biochemistry 37, 2007-2016.

© 2010 19th World Congress of Soil Science, Soil Solutions for a Changing World 94 1 – 6 August 2010, Brisbane, Australia. Published on DVD.
Managing forage-based cow-calf operations in subtropics: implication to surface
and ground water quality Gilbert C. SiguaA,B and Samuel W. ColemanA AUnited States Department of Agriculture, Agricultural Research Service, Subtropical Agricultural Research Station, Brooksville, FL USA 34601. BCorresponding author. Email [email protected]
Abstract Recent assessments of water quality status have identified eutrophication as one of the major causes of water quality “impairment” around the world. In most cases, eutrophication has accelerated by increased inputs of phosphorus and/or nitrogen due to intensification of crop and animal production systems since the early 1990’s. As animal-based agriculture has evolved to larger production in subtropical region of United States, the problems associated with manure handling, storage and disposal have grown significantly. Little information exists regarding possible magnitudes of nutrient losses from pastures that are managed for both grazing and hay production and how these might impact adjacent bodies of water. Trends in water quality parameters and trophic state index (TSI) of lakes associated with beef cattle operations are being investigated. Overall, there was no spatial or temporal build up of soil nutrients despite the annual application of fertilizers and daily in-field loading of animal waste. Our results indicate that when nutrients are not applied in excess, cow-calf systems are slight exporters of nutrients through removal of cut hay. Water quality in lakes associated with cattle production was “good” (30-46 TSI) based upon the Florida Water Quality Standard. Our results indicate that current cattle rotation and current fertilizer application offer little potential for negatively impacting the environment. Properly managed livestock operations contribute negligible loads of nitrogen and phosphorus to shallow groundwater and surface water.
Key Words Soil-plant-animal system, bahiagrass, soil management, eutrophication, animal production, trophic state index, nutrient cycling.
Introduction Forage-based animal production systems with grazing have been suggested as one of the major sources of non-point source phosphorus pollution that are contributing to the degradation of water quality in lakes, reservoirs, rivers, and ground water aquifers (Bogges et al. 1995; Edwards et al. 2000). Cattle manure contains appreciable amounts of nitrogen and phosphorus (0.6 and 0.2%, respectively), and portions of these components can be transported into receiving waters during severe rainstorms. Work in other regions of the country has shown that when grazing animals become concentrated near water bodies, or when they have unrestricted long-term access to streams for watering, sediment and nutrient loading can be high. Additionally, there is a heightened likelihood of phosphorus losses from over fertilized pastures through surface water runoff or percolation past the root zone (Gburek and Sharpley 1998). Recent assessments of water quality status have identified eutrophication as one of the major causes of water quality “impairment” not only in the United States, but also around the world. In most cases, eutrophication has accelerated by increased inputs of nutrients, especially phosphorus (P) due to intensification of crop and animal production systems since the early 1990’s. Despite substantial measurements using both laboratory and field techniques, little is known about the spatial and temporal variability of nutrient dynamics across the landscapes, especially in agricultural landscapes with cow-calf operations. Critical to determining environmental balance and accountability is an understanding of nutrients excreted, nutrient removal by plants, and acceptable losses of nutrients within the manure management and crop production systems and export of nutrient off-farm. Further research effort on optimizing forage-based cow-calf operations to improve pasture sustainability and water quality protection therefore is still warranted. Reduction of phosphorus transport to receiving water bodies has been the primary focus of several studies because phosphorus has been found to be the limiting nutrient for eutrophication in many aquatic systems (Sigua and Tweedale 2003; Sigua et al. 2006). Elsewhere, studies of both large and small watersheds have been performed to answer questions regarding the net effect of agricultural practices on water quality with
© 2010 19th World Congress of Soil Science, Soil Solutions for a Changing World 95 1 – 6 August 2010, Brisbane, Australia. Published on DVD.
time or relative to weather, fertility, or cropping practices. We hypothesized that properly managed cow-calf operations would not be major contributors to excess loads of nutrients in surface and ground water. To verify our hypothesis, we examined the comparative concentrations of nitrogen and phosphorus among soils, surface water and groundwater beneath bahiagrass-based pastures with cow-calf operations. Materials and methods Surface water quality assessment
The lakes that we studied were adjacent to or within about 14-km radius from the USDA-ARS, Subtropical Agricultural Research Station (STARS), Brooksville, FL. These lakes are associated with forage-based beef cattle operations. The lakes were: (1) Lake Lindsey (28o37.76’N, 82o21.98’W), adjacent to STARS; (2) Spring Lake (28o29.58’N; 82o17.67’W), about 10 km away from STARS; and (3) Bystre Lake (28o32.62’N; 82o19.57’W), about 14 km away from STARS. Monthly water quality monitoring of lakes associated with beef cattle pastures was begun in 1993 and continued until 2002 by the field staff of the Southwest Florida Water Management District (SWFWMD). Monthly water samples were taken directly from the lakes using a water (Van Dorn) grab sampler. Water quality parameters monitored were Ca, Cl, NO2 + NO3-N, NH4-N, total N, total P, K Mg, Na, Fe, and pH. All sampling, sample preservation and transport, and chain of custody procedures were performed in accordance with an EPA-approved quality assurance plan with existing quality assurance requirements. The SWFWMD Analytical Laboratory, using EPA-approved analytical methods, performed the chemical analyses of water samples from the lakes.
Ground water quality assessment
Two adjacent 8-ha pasture fields with cow-calf operation were instrumented with a pair of shallow wells placed at different landscape positions. The different landscape positions are top slope (TS; 10-20% slope, 2 ha; middle slope (MS; 5-10% slope, 2 ha and bottom slope (BS; 0-5% slope, 2 ha). The wells were constructed of 5 cm schedule 40 PVC pipe and had 15 cm of slotted well screening at the bottom. During installation of wells, sand was placed around the slotted screen, and bentonite clay was used to backfill to the soil surface to prevent surface water or runoff from moving down the outside of the PVC pipe and contaminating groundwater samples. A centralized battery-operated peristaltic pump was used to collect water samples. Wells were completely evacuated during the sampling process to ensure that water for the next sampling would be fresh groundwater. Water samples were collected from the groundwater wells every two weeks. However, there were periods when ground water levels were below the bottom level of the wells and samples could not be obtained. In addition to ground water samples, surface water samples were collected in the pasture bottoms or the seep area when present, by taking composite grab samples on the same schedule. The seep area, which is located at the lower end of BS is a remnant of a sinkhole formation and became a small scale lake with varying levels of surface water. The seep area of about 2 ha in size is where runoff and seepage from higher parts of pasture converge. Water samples were transported to the laboratory following collection and refrigerated at 4oC. Water samples were analyzed for NO3-N and NH4-N using a Flow Injector Analyzer according to standard methods.
Results and discussion Surface water quality impact: florida trophic state index
The Florida TSI was devised to integrate different but related measures of lake productivity or potential productivity, into a single number that ranges from 0 to 100. The measures included in the calculation of TSI are water transparency (Secchi depth), chlorophyll a (measurement of algae content), TN, and TP. The Florida TSI for Lake Lindsey, Spring Lake, and Bystre Lake were 35, 30, and 46, respectively (Figure 1). Based on this, the TSI of these lakes can be classified as “good” according to Florida Water Quality Standard (TSI of 0-59 = “good”; TSI of 60 to 69 = “fair”; and TSI of 70 to 100 = “poor”). Although the TSI levels of the three lakes did not show any significant change from 1993 to 2002, TSI levels increased numerically for all lakes (Figure 1). This is reflected in a change in the trophic status of Bystere Lake. Lake Lindsey with TSI of 31 and 38 in 1993 and 2002, respectively, remained within the mesotrophic classification, while Spring Lake with TSI of 25 and 26 in 1993 and 2002, respectively, remained in the oligotrophic category. Lake Lindsey (mesotrophic lake) would normally have moderate nutrient concentrations with moderate growth of algae and/or aquatic macrophytes and with clear water (visible depth of 2.4 to 3.9 m). Bystere Lake, which was at the upper end of the mesotrophic range in 1993 (TSI of 49), shifted into the slightly eutrophic state in 2002 with a TSI value slightly above 50. Eutrophic lakes normally have green, cloudy water, indicating lots of algal growth in the water. Water clarity of most eutrophic lakes generally

© 2010 19th World Congress of Soil Science, Soil Solutions for a Changing World 96 1 – 6 August 2010, Brisbane, Australia. Published on DVD.
ranges from 0.9 to 2.4 m. Generally, water quality in Lake Lindsey and Spring Lake was consistently good (1993-2002) while water quality of Bystere Lake ranged from good in 1993 to fair in 2002 (Figure 1). Our results indicate that current fertilizationrecommendations for RP-based pastures in Central Florida offer little potential for negatively impacting the environment, and that properly managed livestock operations based on forage-based beef cattlepastures contribute negligible loads of nutrients (especially P) to surface water. In fact, our results suggest current recommendation for P may be too low to adequately maintain RP growth. Periodic applications of additional P and other micronutrients may be necessary to sustain agronomic needs and to offset the export of nutrients due to animal production. Groundwater quality impact
Concentrations of NH4-N, NO3-N, and TIN in SGW did not vary with landscape position (Figure 2). However, concentrations NH4-N, NO3-N, and TIN in the water samples collected from the seep area were significantly (p≤0.05) higher when compared to their average concentrations in water samples collected from the different landscape positions (Figure 2). Averaged across year, concentration of TIN ranged from 0.5 to 1.5 mg/L. The highest TIN concentration occurred (p≤0.05) in the surface water while the concentrations from the SGW wells (BS-0.6 mg/L, MS-0.9 mg/L, and TS-0.6 mg/L) were similar to each other and lower than the seepage area. Average concentrations of NO3-N (0.4 to 0.9 mg/L) among the different sites were well below the maximum, of 10 mg/L, set for drinking water (Figure 2). On the average, the concentrations of NO3-N did not vary significantly (p≤0.05) due to LP, and as with TIN, the levels were significantly lower than surface water from seepage area (Figure 2). The maximum NO3-N concentrations (averaged across landscape position) in SGW for 2004, 2005 and 2006 were also below the drinking water standards for NO3-N. Similar trends in landscape position were found for average concentrations of NH4-N (Figure 2). Again, the concentrations of NH4-N in SGW did not vary (p≤0.05) significantly among TS, MS, and BS wells. These levels of NH4-N were significantly lower (p≤0.05) than that of the surface water (0.5 mg/L).
0
10
20
30
40
50
60
70
80
90
100
LAKE LINDSEY SPRING LAKE BYSTERE LAKE
LAKES ASSOCIATED WITH FORAGE-BASED BEEF CATTLE
TROPHIC STATE INDEX (%)
1993 2002
OLIGOTROPHIC
MESOTROPHIC
EUTROPHIC
HYPEREUTROPHIC
GOOD WATER QUALITY
FAIR WATER QUALITY
POOR WATER QUALITY
a
a
aa
aa
0.0
0.4
0.8
1.2
1.6
2.0
TOP SLOPE MIDDLE SLOPE BOTTOM SLOPE SURFACE WATER
LANDSCAPE POSITION
NH4-N + NO
3-N (mg kg-1)
0.0
0.4
0.8
1.2
1.6
2.0
TOTAL INORGANIC N (mg kg-1)
NH4-N NO3-N TIN
Figure 1. Trophic state index for lakes with forage-based
beef cattle pasture system. Trophic state index is
sginficantly different (p≤0.05) when superscripts located
at top bars are different. Source: Sigua et al. (2006).
Figure 2. Average concentrations of NH4-N and NO3-
N in SGW and total inorganic nitrogen at different
landscape positions. Line above the bars and across
the line represents standard error of the mean.
quality in lakes, reservoirs, rivers, and ground water aquifers, but perennially grass-covered pastures are associated with a number of environmental benefits. Continuous grass cover leads to the accumulation of soil organic matter, sequestering carbon in the soil and thereby reducing the potential CO2 accumulation in the atmosphere. The increase in soil organic matter is also related to soil quality, with improvements in soil structure, aeration and microbial activity. Effective use and cycling of N or P is critical for pasture productivity and environmental stability. In addition to speeding up N or P recycling from the grass, grazing animals also can increase N or P losses in the system by increasing leaching potential due to concentrating N into small volumes of soil under dung and urine patches, redistributing N or P around the landscape, and removal of N or P in the form of animal products. The overall goal efforts to reduce N or P losses from animal-based agriculture should be to balance off-farm P inputs in feed and fertilizer with outputs to the environment. Source and transport control strategies can provide the basis to increase N and P efficiency in agricultural systems.

© 2010 19th World Congress of Soil Science, Soil Solutions for a Changing World 97 1 – 6 August 2010, Brisbane, Australia. Published on DVD.
Overall, • Forage-based animal production systems as suggested by regulators are not the major sources of non-
point source nutrients pollution that are contributing to the degradation of water quality in lakes, reservoirs, rivers, and ground water aquifers; and
• Properly managed cow-calf operations in subtropical agro-ecosystem would not likely be the major contributors to excess loads of N or P in surface water and/or shallow groundwater.
Conclusion Current pasture management including cattle rotation in terms of grazing days and current fertilizer (inorganic + manures + urine) application rates for bahiagrass pastures in subtropical regions of USA offer little potential for negatively impacting the environment. Properly managed livestock operations contribute negligible loads of total P and N to shallow groundwater and surface water. Overall, there was no buildup of soil total P and N in bahiagrass-based pasture. These observations may help to renew the focus on improving fertilizer efficiency in subtropical beef cattle systems, and maintaining a balance of P and/or N removed to P and/or N added to ensure healthy forage growth and minimize P or N runoff. Contrary to early perception, forage-based animal production systems with grazing are not likely one of the major sources of non-point source P pollution that are contributing to the degradation of water
References Bogges CF, Flaig EG, Fluck RC (1995) Phosphorous budget-basin relationships for Lake Okeechobee
tributary basins. Ecological Engineering 5, 143-162.
Edwards DR, Hutchens TK, Rhodes RW, Larson BT, Dunn L (2000) Quality of runoff from plots with simulated grazing. Journal of the American Water Resources Association 36, 1063-1073.
Gburek WJ, Sharpley AN (1998) Hydrologic controls on phosphorus loss from upland agricultural watersheds. Journal of Environmental Quality 27, 267-277.
Sigua GC, Tweedale WA (2003) Watershed scale assessment of nitrogen and phosphorus loadings in the Indian River Lagoon Basin, FL. Journal of Environmental Management 67, 361-370.
Sigua GC, Williams MJ, Coleman SW, Starks R (2006) Nitrogen and phosphorus status of soils and trophic state of lakes associated with forage-based beef cattle operations in Florida. Journal of Environmental
Quality 35, 240-252.

© 2010 19th World Congress of Soil Science, Soil Solutions for a Changing World 98 1 – 6 August 2010, Brisbane, Australia. Published on DVD.
Mapping ‘unsuitability’ for de-rocking in Northwestern Syria Eddy De PauwA and Weicheng WuA
AGeographic Information Systems Unit, International Center for Agricultural Research in the Dry Areas (ICARDA), P.O. Box 5466, Email [email protected], [email protected]
Abstract As part of an ecogeographical survey in the Jebel Wastani and Jebel Zawia hilly lands of NW Syria, a rapid appraisal was conducted to assess potential for de-rocking in currently marginal rocky areas. The study was conducted using a newly developed land use/land cover map and limited field work, which did not include a systematic soil survey. On the basis of these information sources and other secondary data integrated in a GIS system, it was possible to disqualify 85% of the study area as having no potential for de-rocking. The criteria used were existing agricultural use, forest cover, excessive rockiness or slopes, nearby presence of historical and cultural sites, quarries, and potential to serve as a conservation area. The strongest predictor of potential for de-rocking was the land use class ‘rangelands’ on nummulithic limestones.
Key Words Syria, land suitability, land use, remote sensing, lithology.
Introduction Under an agreement with the Syrian Ministry of Agriculture and Agrarian Reform (MAAR), a botanical and ecogeographical survey was undertaken in 2007 in Jebel Wastani and Jebel Zawia in Idleb Governorate, as part of a large Syria Government poverty alleviation project, the “Idleb Rural Development Project” (IRDP). The project is located in Idleb Governorate, in the extreme north-west corner of the country, focusing initially on two major upland areas, Jebel Wastani and Jebel Zawia (Figure 1). A number of poverty and farming systems studies (e.g. IFAD 2001; Szonyi et al. 2005; Wattenbach 2005; Keyzer et al. 2006) have identified this area as one of the main rural poverty hotspots in Syria.
Figure 1. Location of the study area.
Study area Jebel Wastani and Jebel Zawia are upland areas, with higher elevation than the surrounding areas, with a total surface area of about 2,200 km2.The range in elevation is quite high, especially in Jebel Wastani, with a difference between the lowest (82 m) and highest point (841 m) of 759 m over a horizontal distance of a few kilometers only. Jebel Zawia rises less dramatically, although in absolute terms, its highest point (939 m) surpasses Jebel Wastani. Whereas Jebel Wastani has a more rugged, hilly topography, Jebel Zawia is more plain-like in character. The study area has a semi-arid Mediterranean climate characterized by hot, dry summers and mild and rainy winters. Nearly all of the rainfall occurs in the winter and spring. The mean annual precipitation drops from about 700 mm in the west of the study area to 450 mm in the east, but with considerable variation from year to year, as is typical for Mediterranean climates. Despite such variability, the minimum to be expected is sufficiently high to make the growth of most field crops possible, especially

© 2010 19th World Congress of Soil Science, Soil Solutions for a Changing World 99 1 – 6 August 2010, Brisbane, Australia. Published on DVD.
climatically adapted cereals and food legumes, as well as olive and fruit trees. Except at high elevation, there is no serious temperature constraint for agriculture in the project area. The number of days with frost is very low, hence the growing period is, under rainfed conditions, essentially limited only by the precipitation regime. Despite a favourable rainfall, the lack of land with adequate soils for agricultural use, combined with a high population density, creates conditions of low per-capita income from agriculture and high reliance on off-farm income, obtained through either seasonal farm labour in other farming systems or external labour markets (Wattenbach, 2005). Agroecological characterization and farming systems research thus lead to the same conclusion that the main physical constraints for agriculture are shallow soils and steep slopes. The main strategy of Government of Syria (GOS) to tackle poverty in the project area and to increase food production in the country, has been by removing the key constraint, lack of suitable land, through an extensive program of land development involving reclamation of rocky areas by rock removal (‘de-rocking’). While de-rocking marginal land has directly brought many benefits to tens of thousands of small farmer households, there is some evidence that, if unmitigated, this intervention could induce some undesirable environmental impacts. In addition to the apparent reduction in the diversity of the natural vegetation, including the land races of common food crops, a major concern was that heavy earth-moving equipment, as used in the de-rocking operations, could disturb archaeological, historical and cultural sites. Moreover, there was an important economic aspect: to ensure that the rock removal process would not lead to excessive wear-and-tear to the machinery or yield too little soil and result in heavy costs for soil mining and transport. For this reason an activity related to suitability for de-rocking was included in the botanical and eco-geographical surveys.
Materials and methods A two-stage approach to mapping suitability for de-rocking was followed. The first step was a rapid screening process resulting in the identification of areas that are definitely unsuitable (mapping ‘unsuitability’), to be followed later by a second phase of actual suitability mapping, confined to the areas that could not be excluded on the basis of the criteria used during the first mapping phase, and involving detailed and targeted soil characterization. In this paper we discuss mainly the methods and results from this first assessment phase. Secondary data were compiled on climate, geology, soils, land use and farming systems in the project area. On the basis of these and field observations a detailed characterization of the agricultural environment was undertaken in Jebel Zawia and Jebel Wastani. This agroecological characterization of the project area was summarized in a set of raster maps covering climatic themes (precipitation, temperature, length of growing period, frost), topography (elevation, slopes, aspect, drainage, wetness index, watersheds), and geology, all of which were integrated into a map of agroecological units. The geological materials existing in the project area were obtained from the 1:200,000 geological map sheets Hama and Lattakia (Technoexport, 1963). The 17 mapping units of the geological map sheets covering the project area were reclassified into 4 major lithological groups: • Quaternary soft materials, soils and sediments (group A materials) • Pliocene and Upper Miocene basalts (group B materials) • Soft and easily crushed limestones and other calcareous sediments of various ages from Cretaceous to
Pliocene (group C materials) • Hard ‘nummulithic’ limestones of the Middle Eocene (group D materials) In order to guide all field operations and as a background to all thematic mapping, a base map at 1:50,000 scale was compiled from existing 1:50,000 topographical maps, combined with information from satellite imagery (Landsat ETM+, March 2003, and the Quickbird images in Google Earth) and GPS measurements of sites and roads. Areas with slopes exceeding 25% were considered unfeasible for de-rocking by the IRDP. In view of the outdated information on the 1:50,000 topographical maps, it was considered essential to conduct a new assessment of land use/land cover. The land use/land cover survey was undertaken through image classification procedures using relatively recent (23 March 2003) Landsat ETM+ imagery and ENVI software, and covered the entire Idleb Governorate. Ground truthing was obtained during field trips between March and May 2007. Using Google Earth the areas covered with QuickBird images (spatial resolution 1m) were directly used as ground truth data for training area selection, verification and validation of the land

© 2010 19th World Congress of Soil Science, Soil Solutions for a Changing World 100 1 – 6 August 2010, Brisbane, Australia. Published on DVD.
use/land cover map. The mapping process included the following steps: • Field investigations using a GPS to obtain a broad understanding of the main land use/cover types and
their geographical locations in the study area; • Radiometric calibration, geometric correction and resolving displacements with topographical maps • Selection of training areas, covering a total of 5.4% (297 km2) of the Idleb Governorate: 18 classes were
provisionally differentiated. • Separability analysis using the Jeffrey-Matusita Distance measure (Richard and Jia, 1999) • Supervised classification using the Maximum Likelihood classifier • Selection of final classes by aggregation of classes difficult to separate, and reduction of fragmentation
by generalization to a minimum mapping unit size of .81 ha (9 original pixels) • Verification using 265 field points yielded a field observation accuracy of nearly 93%. Combining the information from the base map and the maps of slopes, lithological materials, land use/land cover, and potential conservation areas, it was now possible to differentiate areas where de-rocking was unfeasible for the following reasons, either individually or in combination: • Too many rocks: land cover type is ‘bare rocks’ • Too steep slopes: > 25% • Presence of quarries • Presence of historical ruins within a 100 m buffer zone • Built-up areas and villages • Already under crops (fallow, irrigated crops, orchards, terraces) • Forest cover • Potential to serve as conservation area These areas were delineated in ArcGIS using simple built-in overlay and reclassification functions. Results and discussion Eight final land use/land cover classes were differentiated in the study area: Forests (2.4%), Built-up areas (1.7%), Water bodies and temporary flooding zones (0.7%), Irrigated crops (17.2%), Tree crops and orchards (51.3%), Fallow (4.8%), Bare rocks (2.4%), and Rangelands (19.2%). Settled cropland (73.3%) thus dominates the study area, especially in Jebel Zawia (77.3%), and to a lesser extent in Jebel Wastani (60.7%), indicating that the potential for further de-rocking is limited by the existing land use. From the land use perspective, the only remaining land resources for creating new agricultural land through de-rocking are the rangelands, covering 19.2% of the study area, more in Jebel Wastani (26.4%) and less in Jebel Zawia (16.9%). Within the rangelands another 28% is unsuitable for de-rocking due to additional constraints, mainly related to slopes exceeding 25% (16% of the rangelands), reforestation areas (6.6%), and proposed conservation areas (2.5%), and the remainder due to proposed 100 m buffer zones around historical sites, and the presence of quarries, terraced land, and built-up areas that were not detected from the Landsat imagery but were present on the 1:50,000 topographical maps. On the basis of the criteria presented earlier, in total 85% of the project area could be excluded as unsuitable for de-rocking, and only 15% may have a potential for de-rocking, requiring further investigations. A strong relationship was observed between the different lithological groups and the feasibility (or necessity) for rock removal. The A-materials are located in valleys and almost entirely under agricultural use. B and C materials are also mostly taken into cultivation, because de-rocking has been relatively easy and worthwhile, since the rocks are fairly soft or easy to detach, and have a reasonable reservoir of agricultural soil in between. Materials of lithological groups A and B contribute less than 5% to the area with potential for de-rocking, whereas C-materials may contribute up to 27%. The nummulithic limestones (D-materials) are the largest reserve for soil mining in the area with potential for de-rocking (68%). At the same time they are the hardest materials and bare surfaces with little or no soil (and agricultural use) are common on these materials. On the other hand, here and there pockets of good agricultural soil exist between and even below the rocks. The soils are characterized by reddish or reddish brown colors, clayey texture, strong structure and extremely variable soil depth, depending on the position in the landscape and the erosion that took place in a particular location. In landscape positions where accumulation took place, mostly as a result of erosion uphill, the soil profile is deep, whereas in others the nummulithic limestone emerges and the soil is confined to patches between the rocks. Despite their differences in depth, these soils are fairly homogenous in their physical properties. Once de-rocking has taken place, the soil depth can be increased either by homogenizing the soil from the surface layer, or eventually deeper layers, or by importing soil from an area with deeper
© 2010 19th World Congress of Soil Science, Soil Solutions for a Changing World 101 1 – 6 August 2010, Brisbane, Australia. Published on DVD.
soil. Hence, depending on slope and rock area coverage, the nummulithic limestones are the most relevant geological material to assess the feasibility of de-rocking, since these are within the project area the main remaining free resource for creating new agricultural land.
Conclusions Using the rapid-screening procedure outlined earlier, it was possible to disqualify 85% of the project area as unsuitable for de-rocking. As current land use is the main predictor of de-rocking potential in most of the study area, the new land use/land cover map has been instrumental in avoiding lengthy and expensive soil surveys. Within the remaining 15% (330 km2) with potential for de-rocking, a second-phase assessment, targeting the rangelands and limestone areas, is currently undertaken to evaluate the feasibility of in-situ soil collection. Detailed soil survey focusing on depth properties and soil/rock ratios associated with differences in the lithological materials are major components of the study. References IFAD. 2001. The Syrian Arab Republic: Country Programme Evaluation. Evaluation Report. August 2001.
Report No. 1178-SY
Keyzer, M.A., M. Nubé, G.B. Overbosch, and R.L. Voortman. 2006. Syria, Rural Poverty Assessment and Mapping. In cooperation with Agricultural Extension Directorate and Ministry of Agriculture and Agrarian Reform, Government of Syria, Damascus, project report for IFAD. Amsterdam, SOW-VU, 154 pp
Richards, J.A. and Jia, X., 1999, Remote Sensing Digital Image Analysis – An Introduction (3rd ed.), Springer-Verlag.
Szonyi, J., De Pauw E., Aw-Hassan A, La Rovere R., Nseir, B. 2005. Mapping agricultural income distribution in rural Syria: A case study in linking poverty to resource endowment. International Center for Agricultural Research in the Dry Areas (ICARDA), Aleppo, Syria, viii + 48 pp. ISBN: 92-9127-182-X
V.O. Technoexport. 1963. Geological Map of Syria. 1:200,000 Sheet I-37-I,II and Sheet I-36-XXIV, I-37-XIX.
Wattenbach, H. 2005. Farming Systems of the Syrian Arab Republic. National Agricultural Policy Center, Damascus, Syria
© 2010 19th World Congress of Soil Science, Soil Solutions for a Changing World 102 1 – 6 August 2010, Brisbane, Australia. Published on DVD.
Mediator solution influence on the sorption potential of sulfo-conjugated
estrogenic steroid hormone and its metabolite in New Zealand dairy farm soils Ajit K SarmahA and Frank F ScherrA,B
ASoil Chemical & Biological Interactions, Landcare Research, Private Bag 3127, Hamilton, New Zealand BBayer CropScience AG, Alfred-Nobel-Str. 50, D - 40789 Monheim, Germany. CCorresponding author. Email [email protected] Abstract Estrogenic steroid hormones have been shown to potentially contribute to damage to wildlife and ecosystem health. Understanding their fate and behaviour is important to assess their risk in the environment. We investigated the sorption potential of three dairy farm soils for an estrogenic conjugated steroid hormone and its metabolite employing a complex solvent extraction scheme using CaCl2 and artificial urine as mediator solution. The sorption potential of E1-3S was about one order of magnitude lower than for the free counterpart, and the Kf values significantly changed between the two mediator solutions. The calculation of concentration-dependent effective distribution coefficients (Kd
eff) revealed that for a range of realistic exposure concentrations in grazed dairying environment, the common approach of employing CaCl2 may deliver incorrect inferences for a proper risk assessment. Key Words Estrone, estrone-3-sulfate, concentration-dependent effective distribution coefficient, exposure scenario. Introduction Global concerns exist about the potential ability of estrogenic steroid hormones to interfere with the normal functioning of wildlife and human endocrine systems (Jobling et al. 1998). While in faeces free estrogens dominate, in mammalian urine, estrogens are primarily present in a conjugated and hydrophilic form. Estrone-3-sulfate (E1-3S) appears to be the dominant estrogen conjugate in cattle urine. Deconjugation of estrogen sulfates leads to the formation of estrone (E1), which has been quantified in agricultural soils. New Zealand’s agricultural sector plays an important role in the country’s overall economy, and dairy products, accounting for ~19% of the annual exports in 2007. The dairy cattle population of nearly 5.3 million outnumbers the human population by over a million heads, and most of the livestock continuously graze the pastures throughout the year. Furthermore, land application of dairy effluent has become increasingly popular. Given that approximately 80% of the defecations and urinations in a grazed dairy system occur on the paddock, potential exists for estrogens, and in particular for E1 and E1-3S, to reach receiving waters via surface runoff or leaching. Sorption of estrogens has been extensively studied over the past decade; however, the results are to some extent controversial due to the differences in the experimental protocols and the unique characteristics of the sorbents investigated (Sarmah et al. 2008). Estrogen sorption is also dependent on the mediator solution, but there is a dearth of information on the sorption potential from cow urine and essentially no information exists about the sorption behaviour of E1-3S to soils. Therefore the aim of this work was to conduct batch equilibration studies for E1-3S and E1 sorption onto three agricultural soils representative of the dairying region of North Island of New Zealand using 5 mM CaCl2 and artificial cow urine as mediator solution. Methods Chemicals and soils
Estrone (>99% purity) and estrone-3-sulfate (≥95% purity) were purchased from Sigma-Aldrich, Australia. Three top soils (0–5 cm) were selected from dairy farming region of Waikato with contrasting properties. Equilibrium batch sorption studies
A modified batch-equilibration method previously described by Sarmah et al (2008) was used to measure sorption of E1 and E1-3S to soils from a 5 mM CaCl2 solution (pH 7.2, EC 1.4 dS/m), and an artificial urine solution (AU, pH 8.3, EC 30.7 dS/m) consisting of KHCO3 (22.2 g/l), KCl (3.95 g/l), K2SO4 (6.7 g/l), (NH2)2CO (23.5 g/l), and C2H5NO2 (6.2 g/l). An appropriate amount of stock solution of each compound was added to the mediator solutions to yield 6 initial aqueous solution concentrations ranging from 0.25 to 5 mg/l. Air-dried soils (~2 g) were equilibrated with 30 mL of the two mediator solutions containing the single

© 2010 19th World Congress of Soil Science, Soil Solutions for a Changing World 103 1 – 6 August 2010, Brisbane, Australia. Published on DVD.
hormone at each of the 6 concentrations in 35 mL glass centrifuge tubes sealed with Teflon®-lined screw-caps, covered with aluminium foil and placed on a shaker for 2 h at 22°C (±2) in the dark. After equilibration, the tubes were centrifuged (20 min at 550 x g) and an aliquot of 5 mL supernatant solution was extracted using 5 mL dichloromethane (liquid-liquid), while soil remaining in the tube was also extracted using a combination of dichloromethane and dicyclohexylamine hydrochloride. An aliquot of 2 mL of the solvent from each phase was evaporated to dryness under nitrogen and reconstituted in 0.5 and 1.0 mL of 70% methanol in H2O (20% methanol in H2O for the E1-3S). Samples were analyzed by a high performance liquid chromatography and UV detector. Soil and mediator blanks were run to determine losses to the glassware and to check for interfering peaks during analysis. Isotherm modelling
The sorption isotherms were modelled with the Freundlich sorption model (Cs = Kf CwN) where Cs (mg/kg),
and Cw (mg/l) are the sorbed and solution phase concentrations at equilibrium, respectively, and Kf (mg1-N
LN/kg) and N (unitless) are the Freundlich sorption coefficient and exponent signifying sorption magnitude and nonlinearity (N = 1 represents a linear isotherm). Given the apparent nonlinearity observed in most soil-solute combinations in the present study, we calculated the concentration-dependent effective distribution coefficient (Kd
eff = Kf CwN–1) values, and the corresponding concentration-dependent OC nomalized partition
coefficients (KOC, L/kg OC) for each soil and hormone. Results and discussion Sorption from CaCl2 solution
Figure 1 (A) displays the measured sorption isotherms of E1 and E1-3S using 5 mM CaCl2 solution with the corresponding Freundlich fits for the three soils. The Kd
eff values for E1 were 37.5, 34.2, and 71.7 mg1-N LN /kg, for the Horotiu, Hamilton, and Te Kowhai soils. The matching N values correspond well with previously reported literature values for E1 and imply linear sorption of E1 in the Hamilton soil (N~1), limitless sorption potential in the Horotiu soil (N > 1) and limited sorption potential (N < 1) in the Te Kowhai soils. In general, the sorption of estrogens in agricultural soils appears to be limited, i.e. only a limited amount of specific sorption sites exist, which are dominantly allocated within the organic matter domain of the soils. In contrast, soils with a high specific surface area have been reported to exhibit limitless sorption potential for estrogens. High organic matter (8.2%) and the high content of imogolite (30%), an allophanic clay mineral with hydrophobic features, may explain the limitless sorption of E1 in the Horotiu soil. In contrast to the Horotiu soil, the clay mineralogy of the Hamilton and Te Kowhai soils is dominated by kaolinite and halloysite, with major fractions of amorphous volcanic glass (Te Kowhai) and vermiculite (Hamilton). Kaolinite has been found to only weakly bind E2 and appears to have no sorption potential for E1.
(A) (B)
Cw [mg/L]
0.01 0.1 1 10
Cs [mg/Kg]
1
10
100
estroneisotherms
estrone-3-sulphateisotherms
Hamilton Te Kowhai
Horotiu
Cw [mg/L]
0.01 0.1 1 10
Cs [mg/Kg]
1
10
100estroneisotherms
estrone-3-sulphateisotherms
HamiltonTe Kowhai
Horotiu
Figure 1. Sorption isotherms of estrone and estrone-3-sulfate in three soils from 5 mM CaCl2 (A), and artificial
urine solution (B). Lines indicate Freundlich model fits.
The sorption capacity for E1-3S was about one order of magnitude lower than for E1 (Figure 1 (A) and Table 1). The Kd
eff values accounted for 4.5, 4.9, and 4.0 mg1-N LN/kg, for the Horotiu, Hamilton, and Te Kowhai soils. The equivalent N values indicate more limited sorption of E1-3S as opposed to E1 in the Horotiu

© 2010 19th World Congress of Soil Science, Soil Solutions for a Changing World 104 1 – 6 August 2010, Brisbane, Australia. Published on DVD.
(0.932 vs 1.115) and Hamilton (0.887 vs 1.001) soils, and a slightly higher sorption capacity in the Te Kowhai (0.886 vs 0.837) soil. Given the ionic and rather hydrophilic nature of E1-3S, it is expected to exhibit lower sorption affinity to the organic matter domain of soils than its free counterpart. At a pKa of −3.0, the E1-3S molecule is always negatively charged, and hence electrostatic interaction which governs anion sorption depends on the net charge of the clay minerals and organic matter constituents in the soils. However, under the given conditions with a solution pH of 7.2, the eligible clay minerals present in the soils would not be charged positively thereby excluding the possibility of significant anion retention by the clay minerals. Concentration-dependent log KOC values for E1 based on the lowest equilibrium concentration of 0.25 mg/L ranged from 2.6 to 3.2 (CaCl2) and 2.7 to 3.0 (artificial urine) among the soils. While there were no literature data available to compare our findings on KOC values for E1-3S, log KOC values for E1-3S were ~ 1 log unit lower than E1 in the three soils. Table 1. Freundlich isotherm parameters for E1 and E1-3S from CaCl2 and AU urine solution. Parameters are
illustrated with standard error (SE). Regressions were all significant at p < 0.001. Differences in sorption
parameters were calculated by means of a paired t test (two tailed).
Soil/ Mediator sol
Kdeff
(L/kg) Kf ± SE
(mg1-N LN /kg) N ± SE R2 adj log KOC#
Cw = 0.25 mg/L E1- CaCl2 Horotiu 37.5 44.0 ± 0.7 1.115 ± 0.045 0.995 2.66 Hamilton 34.2 34.2 ± 0.7 1.001 ± 0.043 0.991 2.93 Te Kowhai 71.7 57.2 ± 0.4 0.837 ± 0.013 0.999 3.15 E1-AU Horotiu 46.8 36.0* ± 0.5 0.81* ± 0.023 0.995 2.75 Hamilton Te Kowhai
44.8 39.8
39.8* ± 0.8 34.9* ± 0.6
0.915 ± 0.041 0.905 ± 0.034
0.99 0.993
3.04 2.9
E1-3S-CaCl2 Horotiu 4.5 4.08 ± 0.09 0.932 ± 0.020 0.997 1.73 Hamilton 4.9 4.18 ± 0.15 0.887 ± 0.034 0.992 2.08 Te Kowhai 4 3.42 ± 0.07 0.886 ± 0.019 0.998 1.9 E1-3S-AU Horotiu 3.7 4.13 ± 0.10 1.089* ± 0.021 0.998 1.64 Hamilton 6.4 5.89* ± 0.24 0.943 ± 0.035 0.993 2.2 Te Kowhai 2.4 2.72* ± 0.13 1.094* ± 0.038 0.994 1.67
Kdeff is the concentration-dependent effective distribution sorption coefficient calculated using Kd
eff = Kf CwN-1 at Cw =
0.25 mg /L; the asterisk (*) indicates significant difference (p<0.01) between CaCl2 and artificial urine; # concentration-dependent organic carbon normalized sorption coefficient calculated using KOC = Kf Cw
N-1/foc, where foc is the fraction of organic carbon in soil. Sorption from artificial urine solution
Figure 2 (B) displays the measured sorption isotherms along with the Freundlich fits for E1 and E1-3S sorption from AU for the three soils. The Kd
eff values for E1 increased to 46.8 and 44.8 mg1-N LN/kg in the Horotiu and Hamilton soils, while the value for the Te Kowhai soil decreased to 39.8 mg1-N LN/kg relative to sorption from the CaCl2 solution (Table 1), with a significant change in the N value only noticeable for the Horotiu soil (Table 3). Similarly, the Freundlich sorption parameters changed for E1-3S in the soils with an increase in the Kd
eff for the Hamilton soil. In contrast, the Kdeff for the Horotiu and Te Kowhai soil decreased.
The matching N values slightly increased, indicating a more linear sorption isotherm for the Hamilton and Te Kowhai soils. There was at least one log unit difference in the concentration-dependent log KOC values for E1 and E1-3S under AU (Table 1) similar to the values observed under CaCl2 solution. Since the AU had a higher conductivity than the CaCl2 solution, the increased Kd
ef values for the sorption of E1 from AU in a few instances (Horotiu and Hamilton soil) could therefore result from a salting-out effect. Increased sorption in the presence of increasing soluble ions has also been reported earlier for other hydrophobic organic chemicals (polycylic aromatic hydrocarbons), and was attributed to a combination of the salting-out effect and changes in the net charge of the organic matter rendering its overall charge toward neutral and eventually enhancing the compound sorption. While the aqueous solubility of E1-3S was plausibly decreased in the AU, the higher ionic strength may have facilitated the sorption of the ionic sulfate part of E1-3S, for instance by alteration of clay minerals. The presence of potassium in the AU can cause the contraction of vermiculite to illite, during which temporary stronger intercalation of E1-3S could have occurred resulting in

© 2010 19th World Congress of Soil Science, Soil Solutions for a Changing World 105 1 – 6 August 2010, Brisbane, Australia. Published on DVD.
slightly higher Kdeff values in the Hamilton clay loam. In contrast, the clay mineralogy of the Te Kowhai soil
indicates very low potential for sorption of E1-3S, which lends further support to our assumption that the observed decrease in Kd
eff is a result of conformational changes in the organic matter domain due to the slightly higher pH and the high concentrations of hydrated ions in the AU. Table 2. Isotherm parameters for the sorption of E1 formed during E1-3S from CaCl2 solution. Parameters are
illustrated with standard error (SE). Regressions were all significant at p < 0.001. Differences in sorption
parameters were calculated by means of a paired t test (two tailed).a
Soil/
Kdeff
(L/kg) Kf ± SE
(mg1-N LN /kg) N ± SE R2 adj log KOC#
Cw = 0.25 mg/L Horotiu 37.7 27.3* ± 3.0 0.766* ± 0.031 0.991 2.66 Hamilton 40.7 37.8 ± 4.6 0.946 ± 0.041 0.993 3.01 Te Kowhai 39.9 28.7* ± 3.6 0.762 ± 0.040 0.987 2.9
aThe asterisk (*) indicates significant difference (p < 0.01) to E1 sorption as parent compound; concentration dependent organic carbon normalized sorption coefficient calculated using Koc = kfCw
N-1/foc Sorption of E1 as a metabolite of E1-3S
In the AU treatment the formation of E1 accounted for < 0.1% of the initial mass in all three soils and the data obtained were too scattered to construct feasible isotherms. However, in the CaCl2 treatment E1 was formed with values of 4.6, 4.8, and 6.7% of the initial mass of E1-3S in the Horotiu, Hamilton, and Te Kowhai soils, respectively. Construction of additional metabolite isotherms for E1 was therefore warranted and sorption parameters are summarized in Table 2. The Kd
eff values for the Hamilton and Te Kowhai soils were 6.5 and 31.8 units lower for the metabolite isotherms and no change was observed in the Kd
eff for the Horotiu soil. While the corresponding N values decreased for all soils, a significant (p < 0.01) change was observed only for the Horotiu soil (Table 2). The range of log KOC values for E1 as a metabolite of E1-3S in the three soils was similar to the values obtained when E1 sorption was performed as a parent compound. Sarmah et al. (2008) reported an N value of 0.75 for E1 in a similar soil from Horotiu series from an isotherm constructed using measured sorbed and solution phase concentrations during equilibrium of E2 with the soil. The N value of 0.766 in the present study for the Horotiu soil is thus comparable to the earlier value for a similar concentration range. The parent compound (E2) isotherm gave an N value > 1 for the Horotiu soil in Sarmah et al.’s (2008) study, which is in agreement with the N value for E1 as a parent compound in the present study (Table 2), confirming limitless sorption capacity for both E1 and E2 in the Horotiu soils. The differences in the N values observed in the literature are likely due to the different concentration ranges, since N is sensitive to the experimental concentration range. Environmental implication The common simplification of normalizing partition coefficients to the OC content of soils is not useful for inferring environmental implications and assessing risk assessment for estrogens and estrogen sulfates. Given many risk assessment models often require values for partitioning coefficients, the concentration-dependent effective distribution coefficient (Kd
eff) may serve as an alternative. Based on the exposure scenarios, we calculated the effective distribution coefficient (Kd
eff = Kf CwN-1) for a concentration range of
0.0001 to 10 mg/L for both compounds and treatments. When plots were made for the Kdeff as a function of
the aqueous hormone concentration for E1 and E1-3S, we observed that E1 sorption from AU would be considerably higher than from CaCl2 at aqueous concentrations < 0.1 mg/L for the Hamilton and Horotiu soils, while the opposite applies to the Te Kowhai soil. The difference becomes more distinct at lower Cw, implying that, by using the common CaCl2 isotherm, one would underestimate E1 sorption especially at low exposure concentrations in a grazed system for the Horotiu and Hamilton soils. For the Te Kowhai soil an overestimation is likely to occur by using the CaCl2 isotherm. Differences were also observed for the Kd
eff of E1-3S at possible exposure concentrations, with pronounced effect at lower exposure concentrations, thus emphasizing that CaCl2 isotherm would overestimate E1-3S sorption in the Horotiu and Te Kowhai soils. In contrast, sorption of E1-3S would be higher in the Hamilton soil in the given exposure concentration range. More work is needed to clarify the sorption mechanisms of these compounds under field conditions. References Jobling S, Nolan M, Tyler C, Brighty G, Sumpter J (1998) Widespread sexual disruption in wild fish.
Environmental Science & Technology 32, 2498–2506. Sarmah AK, Northcott GL, Scherr FF (2008) Retention of estrogenic steroid hormones by selected New
Zealand soils. Environment International 34, 749–755.

© 2010 19th World Congress of Soil Science, Soil Solutions for a Changing World 106 1 – 6 August 2010, Brisbane, Australia. Published on DVD.
Mine landform cover design and environmental evaluation
Ian HollingsworthA
, Inakwu OdehB, Elisabeth BuiC and John LudwigD AHORIZON Environmental, Soil Survey & Evaluation, 38 Witherden Street, Nakara, NT, Australia, Email [email protected] BFaculty Agriculture and Natural Resources University of Sydney, Sydney, NSW, Australia CCSIRO Land & Water, GPO Box 1666, Canberra ACT 2601, Australia. DCSIRO Sustainable Ecosystems, PO Box 780, Atherton, Qld 4883 Australia Abstract Water balance processes critical to environmental restoration were measured for a reconstructed soil on a waste rock landform. This cover trial, involving four years of monitoring, identified temporal changes in water balance in the near surface and found that tree roots interacted with a drainage-limiting layer at one metre below the land surface in just over two years leading to altered hydraulic properties of the layer. Water balance simulations found that increasing the depth to, and thickness of, the drainage-limiting layer would reduce drainage flux and limit tree root penetration. A mine landform cover design based on soil profile properties and catchment hydrology of a natural analogue area is recommended to reconstruct the endemic natural ecosystems and restore environmental processes. Key Words Mine rehabilitation, cover design, ecosystem reconstruction, water balance. Introduction The objectives for designing landform cover systems can include control of dust and water erosion, chemical stabilisation of acid-forming mine drainage (through control of oxygen ingress), contaminant release control (through control of infiltration) and providing a growth medium for vegetation establishment (O’Kane and Wels 2003). The last objective is perhaps the most important one for addressing off-site impacts on water quality and catchment hydrology at closure (Croton and Reed 2007) although it is often overlooked. Restoring the capacity of the soil zone to support natural ecosystems is an important aspect of ecosystem reconstruction. Consequently, this paper investigates aspects of landform cover design that are relevant to ecosystem reconstruction. A case study is made of a constructed cover at Ranger uranium mine and potential environmental performance issues at this site. Enhancing cover design by referring to soil profile and landform properties of natural analogue areas are suggested. Objectives
Our objective was to assess the water balance of a waste rock cover that was constructed from barren mine waste at the Ranger uranium mine. The cover was intended to: (i) limit erosion and thereby contain mineralised waste rock; (ii) limit deep drainage through mineralised material; (iii) reduce water quality impact in the receiving environment; and (iv) support native woodland revegetation. Methods Climate and profile monitoring
A continuous logging system was installed to monitor the water balance (2001-2004) in a cover over mineralised waste rock constructed with a subsoil drainage limiting layer and a surface erosion resistant – ecosystem support layer. Two soil profiles were instrumented to measure soil water content (θv) and soil water potential (Ψ). One profile was in a bare area and the other in a revegetated area ten metres distant. The revegetated area had been ripped to 0.3 metres and planted in December 2000 with nursery grown plants. Drainage flux estimate
Long-term drainage flux was predicted using a profile water balance model, SWIMV2.1 (Verburg et al. 1996) and the sensitivity of this parameter to variations in properties of the cover was assessed. Results Monitored rainfall and drainage in bare and vegetated plots are depicted in Figure 1. In the vegetated plot, enhanced infiltration through the land surface in the 2001 wet season and retention of moisture above the

© 2010 19th World Congress of Soil Science, Soil Solutions for a Changing World 107 1 – 6 August 2010, Brisbane, Australia. Published on DVD.
drainage limiting supported the high and sustained drainage flux during the 2002 dry season and into the following wet season. The surface ripping would have initially enhanced infiltration into the vegetated plot. This effect was lost in subsequent wet seasons as a surface crust developed and rainfall ingress decreased and root growth compromised the integrity of the drainage limiting layer. However, plant growth and root water uptake in the vegetated plot appeared to reduce the drainage flux by the 2004 wet season. Further changes in the water balance are likely to occur as plant roots grow to depth and affect the control drainage into the underlying waste rock.
Date
Drainage (mm/day)
Rain (mm/day)
1/01/051/07/041/01/041/07/031/01/031/07/021/01/021/07/011/01/01
8
7
6
5
4
3
2
1
0
160
140
120
100
80
60
40
20
0
Bare Ground
Date
Drainage (mm/day)
Rain (mm/day)
1/01/051/07/041/01/041/07/031/01/031/07/021/01/021/07/011/01/01
8
7
6
5
4
3
2
1
0
160
140
120
100
80
60
40
20
0
Vegetated
Figure 5. Daily drainage flux (black) and daily rainfall (grey) for bare and vegetated waste rock
Annual drainage and drainage as a proportion of rainfall (drainage: rainfall) are shown in Table 1 for bare and vegetated plots. Deep ripping and revegetation enhanced drainage as a proportion of rainfall compared with bare ground. However, the amount of drainage under revegetation declined (relatively) in subsequent years. In prolonged wet seasons, such as that in 2004, drainage as a proportion of rainfall was less in the vegetated plot compared with the bare plot. Evapotranspiration in the vegetated plot would account for this difference. Table 4. Annual drainage as a proportion of rainfall for bare and vegetated plots
Rainfall Rain Vegetated Bare ground year1 (mm) drainage
(mm) drainage: rain (%) drainage
(mm) drainage: rain (%)
2001 3912 281 7.2 20 5.0 2002 1590 300 19 98 6.0 2003 920 12 1.0 24 3.0 2004 1807 68 4.0 422 23 2005 1034 129 1.2 38 4.0
1 measured between September and August

© 2010 19th World Congress of Soil Science, Soil Solutions for a Changing World 108 1 – 6 August 2010, Brisbane, Australia. Published on DVD.
The proportion of rainfall occurring as either runoff or groundwater recharge has important effects on landscape ecology, determining how and where water is available to ecosystems. Evans (2000) used a runoff coefficient of 0.36, based on catchment measurements reported in Duggan (1991) for the natural land surface in the vicinity of Ranger mine to assess site rehabilitation impacts on stream water quality. Differences between bare and revegetated areas were associated with root growth and plant water use. Significant changes in the soil water store of the constructed cover over a four year period were associated with plant water extraction and root growth down to two metres after two years. While better control over the construction of the sub-surface drainage limiting layer could improve drainage control the layer is unlikely to remain intact unless it is installed beyond the influence of tree roots. Similar interactions between tree roots and constructed covers have occurred at other sites (Taylor et al. 2003). Drainage limiting layers may need to be installed to five metres to be beyond the influence of tree roots in this environment (Kelley 2002; Kelley et al. 2007). The design thickness of the drainage limiting layer needs to be increased if it is constructed by mining operations. Increasing the thickness of the drainage limiting layer to two metres could also halve the drainage flux according to water balance modelling estimates derived for the historical rainfall record. However, the effectiveness of the revegetation in establishing transpiring leaf area will be critical to achieving the predicted improvement in drainage control. Without effective evapotranspiration infiltration will still flux down, albeit at a slower rate.
The water balance for the ripped and revegetated monitoring plots showed enhanced drainage initially that declined over three years. Because the cover had not been thoroughly ripped and revegetated the general condition was of low infiltration through a compact and massive surface. Low infiltration through the surface acts as a throttle that limits the water available to plant growth, a critical factor in ecosystem function (Ludwig et al. 2000) particularly in water limited environments (Cook et al. 2002). This constraint over plant water supply will prevent comparable ecosystems becoming established to those in the surrounding natural landscape. Conclusion A basic cover design concept that uses oxidised and barren waste rock material and comprises erosion resistance and water retention for plant growth and drainage limitation could be refined to improve environmental performance. Surface treatment activities such as deep ripping also need to be combined with effective revegetation. Otherwise the stable soil porosity that is associated with biological activity and is essential for ecosystem function will not develop. The design of the plant growth medium needs to demonstrate the capacity to support naturally occurring woodland ecosystems and restore a natural water balance to the mine landscape, as well as resist erosion. These critical issues affect landform integrity and will need to be resolved since the evapotranspiration capacity of the revegetation, and the protection it affords from rainfall erosion significantly influence drainage flux, runoff and long term integrity of the mine landform. Demonstrating similarities in ecosystem support properties between the final landform cover and the soil zone in a natural analogue area will underpin an ecosystem restoration methodology. Long–term monitoring (5 to 10 years) of a final landform trial that is designed according to the environmental properties of the natural analogue area could improve cover design specifications and be used to develop a predictive capacity that ensures on-site and off-site environmental outcomes will be acceptable. The capacity to predict ecosystem patterns and vegetation water use in the reconstructed terrain is needed to demonstrate an ecological design methodology and to assess whether a landform design will support similar vegetation patterns to surrounding natural landscapes. Acknowledgments This work was wholly supported by ERA Ranger Mine and undertaken while the corresponding author was employed by EWL Sciences. The field instrumentation and monitoring work was ably supported by Mr Geoff Cramb and staff from the ERA Environment Department.

© 2010 19th World Congress of Soil Science, Soil Solutions for a Changing World 109 1 – 6 August 2010, Brisbane, Australia. Published on DVD.
References Cook GD, Williams RJ, Hutley LB, O'Grady AP, Liedloff AC (2002) Variation in vegetative water use in
the savannas of the North Australian Tropical Transect. Journal of Vegetation Science 13(3), 413-418.
Croton JT, Reed AJ (2007) Hydrology and bauxite mining on the Darling Plateau. Restoration Ecology 15(4), S40-S47.
Duggan K (1991) 'Mining and erosion in the Alligator Rivers Region of Northern Australia'. Doctor of Philosophy Thesis, Macquarie University, Sydney, 265 pp.
Evans KG (2000) Methods for assessing mine site rehabilitation design for erosion impact. Australian
Journal of Soil Research 38, 231-247.
Kelley G (2002) Tree water use and soil water dynamics in a savanna of northern Australia. PhD Thesis.
Kelley G, O'Grady AP, Hutley LB, Eamus D (2007) A comparison of tree water use in two contiguous vegetation communities of the seasonally dry tropics of northern Australia: the importance of site water budget to tree hydraulics. Australian Journal of Botany 55, 700-708.
Ludwig JA (2000) Monitoring Australian rangeland sites using landscape function indicators and robust ground and remote techniques. Environmental Monitoring and Assessment 64, 167-178.
O’Kane M, Wels C (2003) Mine waste cover system design – linking predicted performance to groundwater and surface water impacts, 6th ICARD Conference Cairns, Queensland, pp. 341-349.
Taylor G, Spain A, Timms G, Kuznetsov V, Bennett J (2003) The medium-term performance of waste rock covers - Rum Jungle as a case study, 6th ICARD Conference, Cairns, Qld, pp. 383-397.

© 2010 19th World Congress of Soil Science, Soil Solutions for a Changing World 110 1 – 6 August 2010, Brisbane, Australia. Published on DVD.
Modeling of sediment yield and bicarbonate concentration in Kordan
watershed, Iran Fereydoon SarmadianA and Ali KeshavarziA ADepartment of Soil Science, Faculty of Soil and Water Engineering, University of Tehran, Karaj, Iran. Email [email protected], [email protected]
Abstract In the present study, the Soil and Water Assessment Tool (SWAT 2000) model was tested on both a monthly and yearly basis and applied to the Kordan Watershed, located in Iran. The main objective of the research was to assess the accuracy of the model in sediment-yield and surface water bicarbonate concentration estimation. The attributes of sub-watersheds, tributary channels and the main channel in each sub-watershed were generated using the Digital Elevation Model (DEM) and Geographical Information System (GIS) Arc View SWAT 2000 interface. The model was calibrated and validated for the period from 1990 until 2004. Calibration results revealed that the model predicted monthly and yearly sediment-yield, but not such good results were obtained for the bicarbonate concentration. Therefore, some efforts were made in order to find a solution for SWAT bicarbonate temporal modeling. Around 70 samples of the Kordan River water quality data were used and, upon doing statistical calculations, the best correlation between the average pH–EC of water and the bicarbonate concentration was obtained. The formula shall be tested at several watersheds, and it can also be defined to SWAT in order that the model is able to calculate bicarbonate concentration according to pH and EC of the river water, which are introduced to SWAT by the user as a stream water quality file (SWQ) . Key Words EC, pH, sedimentation, SWAT. Introduction One of the most important concerns in arid and semi-arid areas is erosion caused by water. Erosion brings about ablation, transmission and sedimentation of soil particles. Soil particle transmission from farm and orchards to other areas causes improvement of fertility in the land. But, if non-fertile soils, particularly those mixed with a high quantity of stones, are transferred to farm land and accumulate, the fertility of such lands decreases gradually. Moreover, sedimentation in water channels clogs the water ways, It may also transfer pollutants into farm lands and dams, which are used for irrigation and drinking purposes. Hence, a study of surface water potential as well as for sediment-yield seems extremely urgent, in order to plan suiTable management actions for the reduction of erosion and sedimentation. Another problem of arid and semi-arid areas is the danger of land alkalinization, which frequently causes soil to crust, swell and disperse and which greatly decreases the hydraulic conductivity. Clay particles disperse and plug soil-water flow channels. Swelling of clay particles also slows down the water flow. Decreased permeability does interfere with the drainage requirements for normal salinity control and with the normal water supply and aeration requirements for plant growth. One of the most important solutions related to the sodium hazard of irrigationwater is bicarbonate concentration. Bicarbonate toxicity generally arises from deficiencies of iron or other micronutrients caused by high pH. The optimum level of bicarbonate is 1.5-8.5 mmol/L, if the concentration of bicarbonate reaches over 8.5 mmol/L, bicarbonate hazard will be seen (FAO 1988). Precipitation of calcium carbonate lowers the concentration of dissolved calcium, increasing SAR, and the exchangeable sodium level of the soil. Ca2++2HCO3
- =CaCO3+H2O+CO2 (1) The quantity of precipitating bicarbonate depends upon the proportion of water percolating through the soil, or the leaching fraction. (Bohn 1985). Methods The Study Area
Kordan Watershed is located in Karaj district, Tehran province, Iran, locating between 35˚52΄54˝ and 36˚06΄56˝N latitude and 50˚39΄30˝ and 51˚05΄24˝E longitude. Elevation of the watershed is around 4100 meters above the mean sea level. The main stream of the watershed joins Shoor River at Nazar Abad plain. Total area of the watershed is 30000 ha. The area is dominated by Andesite, Tuff, Sandstone, Shale, Alluvial
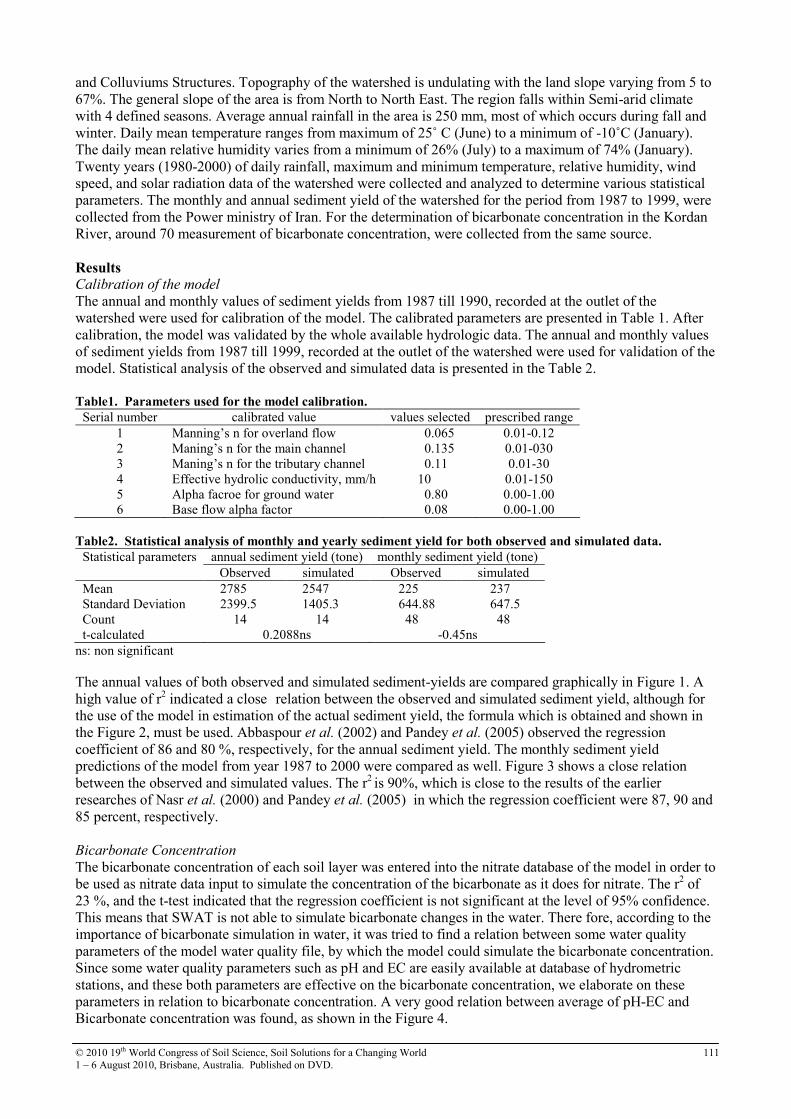
© 2010 19th World Congress of Soil Science, Soil Solutions for a Changing World 111 1 – 6 August 2010, Brisbane, Australia. Published on DVD.
and Colluviums Structures. Topography of the watershed is undulating with the land slope varying from 5 to 67%. The general slope of the area is from North to North East. The region falls within Semi-arid climate with 4 defined seasons. Average annual rainfall in the area is 250 mm, most of which occurs during fall and winter. Daily mean temperature ranges from maximum of 25˚ C (June) to a minimum of -10˚C (January). The daily mean relative humidity varies from a minimum of 26% (July) to a maximum of 74% (January). Twenty years (1980-2000) of daily rainfall, maximum and minimum temperature, relative humidity, wind speed, and solar radiation data of the watershed were collected and analyzed to determine various statistical parameters. The monthly and annual sediment yield of the watershed for the period from 1987 to 1999, were collected from the Power ministry of Iran. For the determination of bicarbonate concentration in the Kordan River, around 70 measurement of bicarbonate concentration, were collected from the same source. Results Calibration of the model
The annual and monthly values of sediment yields from 1987 till 1990, recorded at the outlet of the watershed were used for calibration of the model. The calibrated parameters are presented in Table 1. After calibration, the model was validated by the whole available hydrologic data. The annual and monthly values of sediment yields from 1987 till 1999, recorded at the outlet of the watershed were used for validation of the model. Statistical analysis of the observed and simulated data is presented in the Table 2. Table1. Parameters used for the model calibration.
Serial number calibrated value values selected prescribed range 1 Manning’s n for overland flow 0.065 0.01-0.12 2 Maning’s n for the main channel 0.135 0.01-030 3 Maning’s n for the tributary channel 0.11 0.01-30 4 Effective hydrolic conductivity, mm/h 10 0.01-150 5 Alpha facroe for ground water 0.80 0.00-1.00 6 Base flow alpha factor 0.08 0.00-1.00
Table2. Statistical analysis of monthly and yearly sediment yield for both observed and simulated data.
Statistical parameters annual sediment yield (tone) monthly sediment yield (tone) Observed simulated Observed simulated
Mean 2785 2547 225 237 Standard Deviation 2399.5 1405.3 644.88 647.5 Count 14 14 48 48 t-calculated 0.2088ns -0.45ns
ns: non significant The annual values of both observed and simulated sediment-yields are compared graphically in Figure 1. A high value of r2 indicated a close relation between the observed and simulated sediment yield, although for the use of the model in estimation of the actual sediment yield, the formula which is obtained and shown in the Figure 2, must be used. Abbaspour et al. (2002) and Pandey et al. (2005) observed the regression coefficient of 86 and 80 %, respectively, for the annual sediment yield. The monthly sediment yield predictions of the model from year 1987 to 2000 were compared as well. Figure 3 shows a close relation between the observed and simulated values. The r2 is 90%, which is close to the results of the earlier researches of Nasr et al. (2000) and Pandey et al. (2005) in which the regression coefficient were 87, 90 and 85 percent, respectively.
Bicarbonate Concentration
The bicarbonate concentration of each soil layer was entered into the nitrate database of the model in order to be used as nitrate data input to simulate the concentration of the bicarbonate as it does for nitrate. The r2 of 23 %, and the t-test indicated that the regression coefficient is not significant at the level of 95% confidence. This means that SWAT is not able to simulate bicarbonate changes in the water. There fore, according to the importance of bicarbonate simulation in water, it was tried to find a relation between some water quality parameters of the model water quality file, by which the model could simulate the bicarbonate concentration. Since some water quality parameters such as pH and EC are easily available at database of hydrometric stations, and these both parameters are effective on the bicarbonate concentration, we elaborate on these parameters in relation to bicarbonate concentration. A very good relation between average of pH-EC and Bicarbonate concentration was found, as shown in the Figure 4.

© 2010 19th World Congress of Soil Science, Soil Solutions for a Changing World 112 1 – 6 August 2010, Brisbane, Australia. Published on DVD.
As the Regression test indicates, there is good relationship between the average pH-EC and bicarbonate concentration. Hence, the following relation (formula 2) can be a good estimation for measuring the bicarbonate using pH and EC values.
[HCO3-]=0.016(
2
ECpH +)-0.0504 (2)
Where: [HCO3-] is the bicarbonate concentration in milligrams per liter; EC is the electrical conductivity in
µmhos/cm.
0
1000
2000
3000
4000
5000
6000
7000
8000
9000
87
88
89
90
91
92
93
94
95
96
97
98
99
2000
year
Sediment yield(tones)
observed sediment yield
simulated sediment yield
y = 0,524x + 1087,9
R2 = 0,8006
0
1000
2000
3000
4000
5000
6000
0 1000 2000 3000 4000 5000 6000 7000 8000 9000
observed sediment-yield at the outlet of watershed(tones)
sim
ulated sedim
ent yield at the outlet of
watershed(tones)
Figure 1. Observed and simulated annual
sediment yield for model calibration (1987-2000). Figure 2. Regression comparison between observed and
simulated annual sediment yield for model calibration (1987-
2000).
y = 0.8405x + 33.72
R2 = 0.8878
0
500
1000
1500
2000
2500
3000
3500
4000
0 500 1000 1500 2000 2500 3000 3500 4000
observed sediment yield at outlet of watershed( tones)
sim
ulated sedim
ent yield at watershed outlet(
(tones)
y = 0,016x - 0,0504
R2 = 0,80
0
1
2
3
4
5
0 100 200 300average of pH and Ec
bicarbonate Concentration (mg/l)
Figure 3. Regression comparison between observed
and simulated monthly sediment yield for model
calibration (1987-2000).
Figure 4. Relation between average pH-EC and
bicarbonate concentration (mg/L) of the river water.
Conclusion Based on the analysis of the results obtained from hydrologic modeling studies of the Kordan watershed, it was concluded that the SWAT model is able to simulate both yearly and monthly sediment yield of the watershed. But the monthly simulation was much more accurate (with higher r2) than the yearly one. This conclusion should be tested for other watersheds and for all daily, monthly and yearly values. According to the results, the model is quite efficient and can be used in watersheds where are not gauged and there is no hydrometric station. It is also proposed to use the model for simulating all the missing data of this matter. The model program is defined for the quality factors of nitrate, phosphate, pesticides, BOD, excluding bicarbonates. This disadvantage of the model limits its utility in arid areas. The proposed formula (formula 2), should be tested for several watersheds so that the relation be smoothed and more accurate. If such a relation could be written into the source code of SWAT, then user may define pH and EC of water into the stream water quality file of SWAT. In such a way, SWAT simulates average concentration of bicarbonate which will be used in making decision for irrigation and leaching management.

© 2010 19th World Congress of Soil Science, Soil Solutions for a Changing World 113 1 – 6 August 2010, Brisbane, Australia. Published on DVD.
References Abbaspour KC, Jing Yang I, Rosi MS (2002) Modeling of Hydrology and Water quality in Thur Watershed
Using SWAT. Water Resources 13, 348-358.
Bohn HL, McNeal BL, O'Connor GA (1985) ‘Soil Chemistry’. (John Wiley and Sons Inc.).
Nasr K, Binley A (2000) Simulation of Hydrologic Balance in natural rivers. Water Resources research 13, 303-312.
Pandey VK, Panda SN, Sudhakar S (2005) Modelling of an Agricultural Watershed using Remote Sensing and a Geographical Information System. Biosystem Engineering 90, 331-347.
Santhi C, Arnold JG, Williams JR, Dugas WA, Srinivasan R, Hauck LM (2001) Validation of the SWAT model on a large river basin with point and non-point sources. Journal of American Water Resources
Association 37, 1169-1170.
Srinivasan R, Ramanarayan TS, Arnold JG, Bednarz ST (1998) Large area hydrologic modeling and assessement, part II: model applicaqtion. Journal of American Water Resources Association 34, 91-101.

© 2010 19th World Congress of Soil Science, Soil Solutions for a Changing World 114 1 – 6 August 2010, Brisbane, Australia. Published on DVD.
Modelling of water, sediment and phosphorus runoff: implications for grain
cropping in southwest Australia
Geoff AndersonA,E, Richard BellB, Wen ChenB,C and Ross BrennanD ADepartment of Agriculture and Food, PO Box 64, Three Springs, 6519, WA, Australia, Email [email protected] BMurdoch University, School of Environmental Science, 90 South St, Murdoch, 6150, WA, Australia, Email [email protected] CDepartment of Agriculture and Food, Locked Bag 4, Bentley Delivery Centre 6983, WA Australia, Email [email protected] DDepartment of Agriculture and Food, 444 Albany Highway, Orana, Albany, 6330, WA, Australia, Email [email protected] Epresenting author
Abstract Fertiliser decision support systems are widely used for making phosphorus (P) fertiliser recommendations. However, the current decision support systems do not provide an environmental assessment (e.g. P runoff) of the P fertiliser recommendation. This paper outlines the three modelling components required for fertiliser decision support systems to predict P runoff. The first component considers water runoff and is directed at calculating runoff volume (Qsurf) and peak runoff rate (qpeak). The second component makes predictions of soil erosion, sediment yield (SED), using the modified universal soil loss equation (MUSLE). Runoff volume and peak runoff rate predictions are used in the second component to calculate sediment yield. The third component makes predictions of P runoff by calculating the amount of dissolved and particulate P runoff. Dissolved P runoff is calculated using runoff volume and the water soluble P contents of the soil, fertiliser and manures. Particulate P runoff is calculated using runoff volume, sediment yield and total P content of the soil, fertiliser and manure. Total annual P runoff is the sum of dissolved and particulate P runoff for each individual water runoff event. It is argued that all three components are required for a decision support system to accurately predict P runoff. The implications of this approach are considered for grain cropping areas in the mediterranean climate of southwest Australia. Key Words Phosphorus, water, sediment, runoff, modelling. Introduction When the land was first cleared in the southwest of Australia, the soils were very deficient in P (Wild 1958). Deficiency was corrected by the application of P fertilisers to the extent that most current P fertilisers are applied at a rate which maintain the P supply in soils. Current practices have been achieved by conducting soil test measurements for P and the use of P fertiliser decision support systems for making P recommendations. In general, this approach has resulted in the efficient use of P fertiliser. However, in some coastal agricultural areas of the region, over-use of P fertiliser has resulted in eutrophication of estuarine waters. In a recent review, Mathers et al. (2007) has highlighted the potential for P loss from the adoption of increased frequency of cropping in the high rainfall, greater than 550 mm of annual rainfall, zone of Australia. Minimal tillage with crop residue retention (conservation farming) has been widely adopted within Australia. This practice has the potential to reduce soil bound P loss (Particulate P) but can result in an increase in dissolved P loss due to the surface concentration of nutrients. As a result, agriculture is under increasing pressure to develop management practices which will minimise P loss from agricultural lands. Currently P decision support systems do not have routines for making predictions of P runoff to the environment. Hence, the aim of this paper is to outline the P environmental routines required for fertiliser decision support systems to accurately predict P runoff from grain cropping land in southwest Australia. Model components P runoff from agricultural lands is generally derived from a small part of the landscape during a few relatively large rainfall events when these areas have high soil P or have received a recent application of P fertiliser or manure (Weld and Sharpley 2007). Calculation of P losses to the environment requires the use of three modelling components. First, water runoff is modelled to calculate runoff volume (Qsurf) and peak runoff rate (qpeak). Second, runoff volume and peak runoff rate are used in MUSLE to calculate sediment yield (SED). Third, runoff volume, peak runoff rate and sediment yield (SED) are used by the P runoff

© 2010 19th World Congress of Soil Science, Soil Solutions for a Changing World 115 1 – 6 August 2010, Brisbane, Australia. Published on DVD.
component to calculate daily dissolved and particulate P runoff. Total annual P runoff is then calculated as the sum of dissolved P and particulate P runoff for each individual water runoff event. Runoff volume
Runoff volume (Qsurf) is the total amount of rainfall minus infiltration and interception. It is calculated using the Soil Conservation Service (SCS) curve number (CN) method (SCS 1972). Curve number is a function of the hydrologic soil group, surface cover (crop residues and vegetation) cultural practices of the site and the antecedent soil moisture conditions. The curve number ranges from 1 to 100, with runoff potential increasing with increasing curve number. The curve number method calculates runoff volume using daily rainfall using the following equation:
SR
SRQ
day
day
surf 8.0
)2.0( 2
+
−= (1)
where Rday is daily rainfall (mm) and S is the retention parameter (mm). The retention parameter is defined as follows;
)101000
(4.25 −=CN
S (2)
where, CN is the curve number for the day. Rainfall (Rday) must be greater than 0.2S, referred to as initial abstraction, for the equation to be applicable. Peak runoff
Peak runoff (qpeak), is predicted based on a modification to the rational formula of Hann et al. (1994). The rational formula method is based on the assumption that if a rainfall of intensity, I, begins at time t=0 and continues indefinitely, then the rate of runoff will increase until the time of concentration (tconc) when the entire sub-basin area is contributing to the flow at the outlet. The rational formula is given by the following equation:
conc
surftc
peakt
AreaQq
6.3
α= (3)
where qpeak is the peak runoff rate (m3/s), αtc is the fraction of daily rainfall that occurs during the time of concentration, Qsurf is runoff volume (mm), Area is the sub-basin area (km2), tconc is the time of concentration for the sub-basin (hr) and 3.6 is a unit conversion factor. Sediment runoff
Sediment runoff is modelled using MUSLE (Pandey et al. 2009):
frghrupeaksurf CLSPCKareaqQSED 56.0)(8.11= (4)
where SED is the sediment yield on a given day (t), Qsurf is runoff volume (mm), qpeak is the peak runoff rate (m3/s), areahru is the area of the hydrologic response unit (ha), K is the soil erodibility factor, C is the cover and management factor (dimensionless), P is the erosion control practices factor (dimensionless), LS is the topographic factor (alternatively, L is the slope length factor (dimensionless) and S is the slope steepness factor (dimensionless)), and Cfrg (dimensionless) is the coarse fragment factor. (1) Soil erodibility factor (K), is soil erosion rate of a specified soil under continuous fallow having a 9 %
slope and 22.1 m length. It is calculated by:
)3)(10(29.3)2)(10(28.4)12)(10(77.2 33714.1 −+−+−= −−−permsoilstr ccOMMK (5)
where M is the particle-size parameter, OM is the percent organic matter (%), csoilstr is the soil structure code used in soil classification and cperm is the profile permeability class (Loch et al. 1998).
(2) Cover and management factor (C), is the ratio of soil loss from a field with a specified cropping and management to that from the fallow condition for which K is determined. It is calculated daily using the following equation:
])ln[]15.1exp[)]ln()8.0exp([ln( ,, jmnjmn CCVCC +−−= (6)
where Cmn,j is the minimum value of the crop management factor for crop j and CV is the soil cover (above ground biomass plus residue) in kg/ha.
(3) Support practice factor (P), is defined as the ratio of soil loss with a specific support practice to the

© 2010 19th World Congress of Soil Science, Soil Solutions for a Changing World 116 1 – 6 August 2010, Brisbane, Australia. Published on DVD.
corresponding loss with up-and-down slope culture. Support practices include contour tillage, strip cropping on the contour, and terrace systems. Stabilized waterways for the disposal of excess rainfall are a necessary part of each of these practices.
(4) Topographic factor (LS), is the expected ratio of soil loss per unit area from a field slope to that from a 22.1 m length of uniform 9 % slope under otherwise identical conditions.
(5) Coarse fragment factor (Cfrg), accounts for the percent rock in the first layer (%). Phosphorus runoff
The transfer of soil P to runoff water is controlled by the physical and chemical processes such as desorption, dissolution and diffusion. P originating from the soil can be transported in runoff water either dissolved in solution (dissolved P, DP) or associated with eroded soil particles (particulate P, PP). The portion of total P transported as PP varies widely and depends on soil type, degree of P saturation, particle size and management history (Sharpley 1993). However, recent studies in southwest Australia suggest that throughflow is the major process of water and P lateral flux on hillslopes, especially on duplex profiles (McKergow et al. 2006; Sharma 2009). (1) Dissolved P which includes inorganic (DPi) and organic (DPo) in runoff is directly related to the quantity
and reactivity of P near the soil surface (McDowell and Sharpley 2001). Sharpley et al. (2002) have defined a relationship between P soil test (Mehlich-3) and dissolved P concentration in runoff. In Western Australia, the Colwell (1963) method is used as the soil P test with a sampling depth of 10 cm. Bolland et al. (2003) has shown that Colwell (1963) P soil test is highly correlated to Mehlich-3 P for soil treated with single super phosphate. Hence, the Colwell P soil test values can be directly substituted into the McDowell and Sharpley (2001) relationship. The relationship is described by the following equation.
surfi QPsoilavailabletcoefficienextractionDP ××= (7)
where DPi is dissolved P loss in overland flow (kg P/ha), available soil P or soil test for P is the amount of P in a unit depth of surface soil, usually 5 cm (kg/ha) and extraction coefficient is the fraction of soil test P that can be released to a given runoff volume. Extraction coefficients can be determined as the slope of the linear regression of soil test P and overland flow dissolved P. For Western Australian conditions, the impact of the different soil sampling depths needs to be assessed. Initial results for a range of soils of the Fitzgerald River basin in the south coast region of Western Australia showed that Colwell P was twice as high in the 0-2 cm depth as in the standard 0-10 cm sampling depth (Sharma 2009). Sharma (2009) also showed that the dissolved organic P (DPo) fraction comprised a large proportion of the total DP in runoff, throughflow and leachate.
(2) Particulate P which includes inorganic (PPi) and organic (PPo) P attached to soil particles may be transported by surface runoff. The concentration of P per unit mass of eroded particles is related to the total P concentration of the soil. When compared to the soil, the concentration of total P in eroded soil particles is higher because the erosion process selects the more easily transported soil particles such as clay and low density organic particles (Sharpley 1985). These particles have a higher sorption capacity for P than the bulk soil. The increased P concentration in eroded soil particles relative to the bulk soil is called the P enrichment ratio (PER). Enrichment ratios are used to represent the increase in P concentration of sediment relative to the parent soils.
Menzel (1980) showed that for a wide range of soil vegetative conditions, P enrichment ratio is predicted using a logarithmic relationship.
)(16.000.2)( SEDLnPERLn −= (8) where SED is sediment discharge in kg/ha. Most nonpoint source models have adopted this approach to predict particulate P transport in overland flow. This relationship is based on the well documented observation that particulate P loss increases as erosion increases. P enrichment ratio decreases with increased erosion. As erosion increases, there is less particle size sorting by overland flow, less clay-sized particles are transported in proportion to total soil loss and therefore P enrichment decreases. Once an appropriate P enrichment ratio is obtained from sediment discharge, particulate P loss can be calculated as;
© 2010 19th World Congress of Soil Science, Soil Solutions for a Changing World 117 1 – 6 August 2010, Brisbane, Australia. Published on DVD.
surfQPERSEDTPPP ×××= (9)
where PP is particulate P loss in overland flow (kg/ha), TP is total soil P in a unit depth of surface soil, SED is sediment concentration (g sediment/L) in overland flow and PER is P enrichment ratio calculated using Equation 8, for a given flow event volume (cm).
Conclusion Modelling P runoff is a complex process. It requires the use of three interacting modelling components. These include a water runoff (volume and peak rate) component, a soil erosion or sediment yield component and finally a P runoff component. Work is currently progressing in developing and evaluating these modelling components for predicting P losses from grain cropping land in the southwest of Australia. Preliminary field results suggest that the PP fraction may not be a major form of P loss and that greater understanding of the DPo fraction is needed to predict P losses from grain cropping land in southwest Australia. References Bolland MDA, Allen DG, Walton KS (2003) Soil testing for phosphorus: comparing the Mehlich 3 and
Colwell procedures for soils of south-western Australia. Australian Journal of Soil Research 41, 1185-1200.
Colwell JD (1963) The estimation of phosphorus fertiliser requirements of wheat in southern New South Wales by soil analysis. Australian Journal of Experimental Agriculture 3, 190–197.
Hann CT, Barfield BJ, Hayes JC (1994) Design hydrology and sedimentology for small catchments. (San Diego, C.A: Academic Press.)
Loch RJ, Slater BK, Devoil C (1998) Soil erodibility (Km) values for some Australian soils. Australian
Journal of Soil Research 36, 1045-1055. Mathers NJ, Nash DM, Gangaiya P (2007) Nitrogen and phosphorus exports from high rainfall zone
cropping in Australia: Issues and opportunities for research. Journal of Environmental Quality 36, 1551-1562.
McDowell RW, Sharpley AN (2001) Approximating phosphorus release from soils to surface runoff and subsurface drainage. Journal of Environmental Quality 30, 508-520.
McKergow LA, Prosser IP, Weaver DM, Grayson RB, Reed AEG (2006) Performance of grass and eucalyptus riparian buffers in a pasture catchment, Western Australia, part 1: riparian hydrology. Hydrological Processes 20, 2309-2326.
Menzel RG (1980) Enrichment ratios fro water quality modelling. In ‘CREAMs, A field scale model for chemicals, runoff, and erosion from agricultural management systems’. (Ed WG Knisel) pp. 486-492. (U.S. Department Agriculture Conservation Research Report No. 26)
Pandey A, Chowdary VM, Mal BC (2009) Sediment yield modelling of an agricultural watershed using MUSLE, remote sensing and GIS. Paddy Water Environment 7, 105–113.
Sharma R (2009) Soil and Landscape Factors Affecting Phosphorus Loss from the Fitzgerald River Catchment in South West of Western Australia. PhD Thesis, Murdoch University.
Sharpley AN (1985) The selective erosion of plant nutrients in runoff. Soil Science Society of America
Journal 49, 1527-1534. Sharpley AN (1993) Assessing phosphorus bioavailability in agricultural soils and runoff. Fertilizer
Research 36, 259-272 Sharpley AN, Kleinman PJA, McDowell RW, Gitau M, Bryant RB (2002) Modelling phosphorus transport
in agricultural watersheds: Processes and possibilities. Journal of Soil and Water Conservation 57, 425-439.
Soil Conservation Service (1972) National Engineering Handbook Section 4: Hydrology. (Soil Conservation Service, USDA, Washington.)
Weld J, Sharpley AN (2007) Phosphorus Indices. In ‘Modeling phosphorus in the environment.’ (Eds DE Radcliffe, ML Cabrera) pp. 301-332. (CRC Press, Boca Raton)
Wild A (1958) The phosphorus content of Australian soils. Australian Journal of Agricultural Research 9, 193-204.

© 2010 19th World Congress of Soil Science, Soil Solutions for a Changing World 118 1 – 6 August 2010, Brisbane, Australia. Published on DVD.
Modelling the role of DCD in mitigating nitrogen losses under grazed pastures Iris Vogeler
A, Rogerio CichotaA, Valerie SnowA and Mark ShepherdA AAgResearch, Palmerston North, New Zealand, Email [email protected]
Abstract The simulation model APSIM (Agricultural Production Systems SIMulator) with a submodule accounting for nitrification inhibition by DCD was used to investigate the role of DCD on nitrate leaching under grazed pastures. To account for the degradation of DCD two different approaches were used. In the first approach the exponential degradation of DCD was assumed to be driven by soil temperature, soil moisture content and soil pH, similarly to the nitrification process. In the second approach environmental conditions throughout the degradation process were assumed to remain constant, and the temperature effect on degradation was based on an empirical relationship developed by Kelliher et al. (Kelliher, 2008). The model was parameterised using lysimeter data and then used to evaluate the effect of various environmental conditions (soil conditions, rainfall pattern, temperature) and management options (timing and rate of DCD application) on the effectiveness of DCD in reducing nitrate leaching under grazed pastures. Key Words Nitrate leaching, DCD, APSIM, modelling. Introduction Intensification of dairying is widespread in New Zealand, and although economic benefits are potentially large, this can lead to environmental degradation. Intensive dairying with increasing fertiliser input, especially nitrogen (N), biological fixation of N in these legume-based pastures, and very high concentrations of N under urine patches can generate nitrate (NO3) leaching to the ground water aquifers, and thus create environmental problems. As a solution to mitigate the leaching losses of NO3
- under dairy pastures, the use of nitrification inhibitors such as dicyandiamide (DCD) has been proposed (Di, 2004; Menneer, 2008; Monaghan, 2009). However, the effectiveness of DCD under grazed pastures has not yet been assessed in detail, and best management practices for the application of DCD have yet to be developed. Modelling is increasingly being recognised as a suitable alternative to measurements for assessing best management options because it can be a cost-effective way of assessing multiple options. The objective of this study was to develop a deterministic module for APSIM that can describe the role of nitrification inhibitors on nitrogen transformations and nitrate leaching under grazed pastures. The model was used to evaluate the effect of various environmental conditions (soil conditions, rainfall pattern and temperature) and management options (timing and rate of DCD application) on the effectiveness of DCD in decreasing nitrate leaching. Modelling Simulation models, such as APSIM (Agricultural Production Systems SIMulator) are increasingly being used as a tool for the evaluation of alternative management strategies for improving the economic and environmental performance of agricultural production systems. APSIM is a modelling framework in which a system is configured from component modules, which can be plugged in and pulled out depending on the system considered. For our simulations we combined APSIM with (i) SWIMv2 for describing water movement and nitrate and DCD transport, based on Richards’ equation and the convection dispersion equation, (ii) AgPasture for describing the pasture system, and (iii) Micromet for calculating evapotranspiration based on the Penman-Monteith approach. A schematic picture of the configuration of APSIM with the various modules is shown in Figure 1. Features of the Nitrogen cycle in APSIM relevant to nitrification
The SoilN module describes the dynamics of both carbon and nitrogen in soils. The nitrification of ammonium (NH4) into nitrate (NO3) in SoilN is described using a Michaelis-Menton response to available soil NH4, with the rate of nitrification given by:

© 2010 19th World Congress of Soil Science, Soil Solutions for a Changing World 119 1 – 6 August 2010, Brisbane, Australia. Published on DVD.
[ ][ ] pHwT
NH
fffKNH
NHkk
+=
44
4max
[1]\ where [NH4] is the ammonium concentration in the soil, kmax is the potential nitrification rate (mg N/kg soil/ day), kNH4 is the NH4 concentration for half maximum response to ammonium concentration, fT, fw and fpH are temperature, water and pH response factors, that lie between 0 and 1. The effect of a change in microbial population on the potential nitrification rate is not considered. The fw and fpH are assumed to decrease on either side of an optimum soil moisture and pH range while fT
increases exponential.
Manager
Program ManagementModules
EnvironmentalModules
BiologicalModules
E
N
G
I
N
E
or
Erosion
SoilWat SWIM
Eventlog
AgPasture
OtherCrops
Residue
Climate Operations
Weeds
Soil Nitrogen/DCD
Figure 1. Modular Structure of APSIM
Effect of DCD on nitrification
In soils, DCD is susceptible to biodegradation, which has been shown to be affected by soil temperature, soil moisture content, soil pH, and organic matter content (Di 2004; Singh 2008). We describe the degradation of DCD via a first-order decay process that is affected, in the same way as the process of nitrification, by temperature, water content and pH. Thus, the residual mass of DCD, (MDCD), decreases exponentially with time according to:
( ) ( )tfffMtM pHwTDCDoDCD µ−= exp [3]
where MDCDo is the initial mass of DCD, and µ the first order decay rate constant [h-1]. Nitrification (Eq. [1]) is inhibited by DCD according to:
[ ][ ] DCDpHwT
NH
ffffKNH
NHkk
+=
44
4max
[4]
where fDCD is the factor accounting for the nitrification inhibition by DCD, which is dependent on the concentration on DCD and lies between 0 and 1 at some optimal DCD concentration (MDCDopt [kg/kg soil]), at which all nitrification in the soil is inhibited. The factor fDCD is given by (Vogeler, 2007):
( ) ( )
−=
DCDopt
DCDDCD
M
tMtf 1 [5]
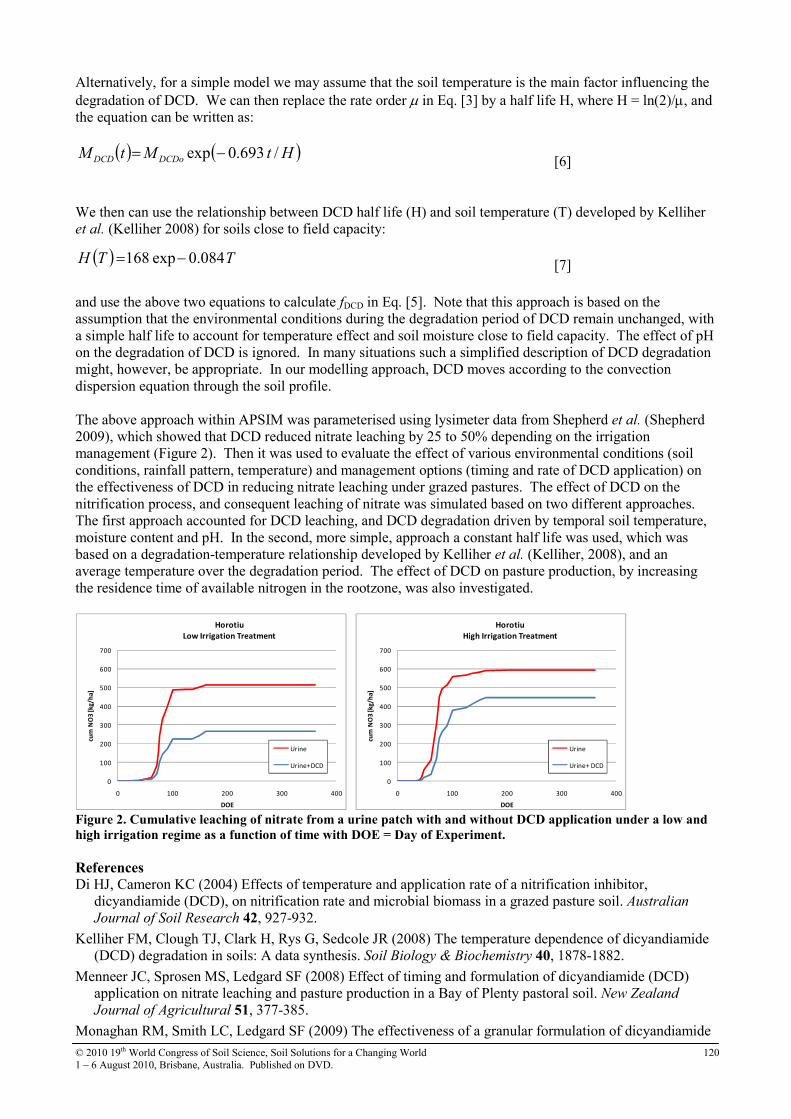
© 2010 19th World Congress of Soil Science, Soil Solutions for a Changing World 120 1 – 6 August 2010, Brisbane, Australia. Published on DVD.
Alternatively, for a simple model we may assume that the soil temperature is the main factor influencing the degradation of DCD. We can then replace the rate order µ in Eq. [3] by a half life H, where H = ln(2)/µ, and the equation can be written as:
( ) ( )HtMtM DCDoDCD /693.0exp −= [6]
We then can use the relationship between DCD half life (H) and soil temperature (T) developed by Kelliher et al. (Kelliher 2008) for soils close to field capacity: ( ) TTH 084.0exp168 −= [7]
and use the above two equations to calculate fDCD in Eq. [5]. Note that this approach is based on the assumption that the environmental conditions during the degradation period of DCD remain unchanged, with a simple half life to account for temperature effect and soil moisture close to field capacity. The effect of pH on the degradation of DCD is ignored. In many situations such a simplified description of DCD degradation might, however, be appropriate. In our modelling approach, DCD moves according to the convection dispersion equation through the soil profile. The above approach within APSIM was parameterised using lysimeter data from Shepherd et al. (Shepherd 2009), which showed that DCD reduced nitrate leaching by 25 to 50% depending on the irrigation management (Figure 2). Then it was used to evaluate the effect of various environmental conditions (soil conditions, rainfall pattern, temperature) and management options (timing and rate of DCD application) on the effectiveness of DCD in reducing nitrate leaching under grazed pastures. The effect of DCD on the nitrification process, and consequent leaching of nitrate was simulated based on two different approaches. The first approach accounted for DCD leaching, and DCD degradation driven by temporal soil temperature, moisture content and pH. In the second, more simple, approach a constant half life was used, which was based on a degradation-temperature relationship developed by Kelliher et al. (Kelliher, 2008), and an average temperature over the degradation period. The effect of DCD on pasture production, by increasing the residence time of available nitrogen in the rootzone, was also investigated.
0
100
200
300
400
500
600
700
0 100 200 300 400
cum
NO
3 [
kg
/ha]
DOE
Horotiu
High Irrigation Treatment
Urine
Urine+ DCD
0
100
200
300
400
500
600
700
0 100 200 300 400
cum
NO
3 [
kg
/ha]
DOE
Horotiu
Low Irrigation Treatment
Urine
Urine+DCD
Figure 2. Cumulative leaching of nitrate from a urine patch with and without DCD application under a low and
high irrigation regime as a function of time with DOE = Day of Experiment.
References Di HJ, Cameron KC (2004) Effects of temperature and application rate of a nitrification inhibitor,
dicyandiamide (DCD), on nitrification rate and microbial biomass in a grazed pasture soil. Australian
Journal of Soil Research 42, 927-932.
Kelliher FM, Clough TJ, Clark H, Rys G, Sedcole JR (2008) The temperature dependence of dicyandiamide (DCD) degradation in soils: A data synthesis. Soil Biology & Biochemistry 40, 1878-1882.
Menneer JC, Sprosen MS, Ledgard SF (2008) Effect of timing and formulation of dicyandiamide (DCD) application on nitrate leaching and pasture production in a Bay of Plenty pastoral soil. New Zealand
Journal of Agricultural 51, 377-385.
Monaghan RM, Smith LC, Ledgard SF (2009) The effectiveness of a granular formulation of dicyandiamide

© 2010 19th World Congress of Soil Science, Soil Solutions for a Changing World 121 1 – 6 August 2010, Brisbane, Australia. Published on DVD.
(DCD) in limiting nitrate leaching from a grazed dairy pasture. New Zealand Journal of Agricultural 52, 145-159.
Shepherd M, Welten B, Ledgard S (2009). (2009) Effectiveness of Dicyanddiamide in reducing nitrogen leaching losses from two contrasting soil types under two rainfall regimes-a lysimeter study. In 'FLRC Workshop'Massey University, Palmerston North).
Singh J, Saggar S, Giltrap DL, Bolan NS (2008) Decomposition of dicyandiamide (DCD) in three contrasting soils and its effect on nitrous oxide emission, soil respiratory activity, and microbial biomass - An incubation study Australian Journal of Soil Research 46, 517-525.
Vogeler I, Blard A, Bolan N. (2007) Modelling DCD effect on nitrate leaching under controlled conditions. Australian Journal of Soil Research 45, 310-317.

© 2010 19th World Congress of Soil Science, Soil Solutions for a Changing World 122 1 – 6 August 2010, Brisbane, Australia. Published on DVD.
National acid sulfate soils identification, assessment and management short
course Scott HendersonA, Crystal MaherA and Leigh SullivanA ASouthern Cross GeoScience, Southern Cross University, Lismore, NSW, Australia, Email [email protected], [email protected], [email protected]
Abstract Acid sulfate soils characteristically underlie many of our nationally significant coastal floodplains and wetlands and must be managed appropriately to avoid severe environmental degradation on site and to receiving waters. When mismanaged acid sulfate soils can severely degrade the quality of coastal water via acidification, deoxygenation, and metal toxicity. Where a development is planned in these landscapes, legislation often requires a management plan be prepared to ensure the environmental impacts are minimised. An acid sulfate soil identification, assessment and management short course has been developed and is specifically designed to ensure that these resources are managed appropriately to protect our nationally significant coastal areas. A Federal Government Community Coastcare grant will fund a project to deliver the course to all Australian states and the Northern Territory.
Key Words Acid sulfate soil, management plan, short course, sustainable land management Introduction A survey of Local Government clearly identified a need for professional development training in the assessment and management of acid sulfate soils. The acid sulfate soil identification, assessment and management short course developed by Southern Cross GeoScience is designed to meet this demand. The training instructs industry professionals in the development, assessment, implementation and monitoring of acid sulfate soil management plans. This instruction ensures professionals at all levels adopt a consistent approach that complies with legislative requirements. The course was developed in collaboration with relevant regulatory authorities. This ensures management plans will be developed in a way that will expedite and simplify the assessment process. This course is designed to address the National Strategy for the Management of Acid Sulfate Soils two aims to: • improve the management and use of coastal acid sulfate soils in Australia to protect and improve water quality in coastal floodplains and embayments, and • assist governments, industry and the community in identifying and undertaking their roles in managing coastal acid sulfate soils. Course structure The 3 day course includes lectures, practical exercises and a field excursion. • Day 1 – Introduction to acid sulfate soils. Topics include definitions, formation and distribution of acid sulfate soils, an introduction to relevant legislation and desk top identification using planning and risk maps. An excursion to a local acid sulfate soil site is included to identify field indicators of acid sulfate soils, examine monosulfidic black ooze and demonstrate appropriate sampling techniques and equipment. • Day 2 - Assessment and management of acid sulfate soils. Assessment includes developing an appropriate sampling regime, conducting detailed laboratory analysis of samples, and understanding, interpreting and presenting results. A practical exercise covers the calculation of an acid base account and the liming requirement. Management of acid sulfate soils examines a range of options to mitigate and control adverse environmental impacts. • Day 3 – Preparation of an acid sulfate soil management plan. This covers the elements of a complete acid sulfate soil management plan including a description of the development, laboratory assessment, detailed management options and a plan for monitoring the site. An example management plan is used to demonstrate how each of the elements should be presented.

© 2010 19th World Congress of Soil Science, Soil Solutions for a Changing World 123 1 – 6 August 2010, Brisbane, Australia. Published on DVD.
Despite the existence of appropriate acid sulfate soil management guidelines the pilot courses have highlighted an urgent national resource management problem. This problem is that despite the existence of appropriate acid sulfate soil management guidelines for each jurisdiction, the general level of skills and competence of experienced consultants and local government officers was severely inadequate. This lack of best management skills for acid sulfate soils is a national issue. Accordingly, a lack of best management skills in this area will impact detrimentally on water quality outcomes, nationally. Southern Cross University was awarded a Federal Government funded Community Coastcare grant to deliver professional development training to all states and the Northern Territory. The project is designed to meet the Community Coastcare Priorities in: • Coastal environments and critical aquatic habitats • Community skills, knowledge and engagement • Biodiversity and natural icons • Natural resource management in remote and northern Australia Conclusion This project will develop and deliver training courses tailored for each state and territory on Acid Sulfate Soil Identification, Assessment and Management to government officers, consultants and regulators. The project will create a solid core of competent consultants and regulatory officers in each jurisdiction by providing them with the skills and knowledge necessary to develop (and assess) appropriate Acid Sulfate Soil Management Plans so as to avoid severe environmental degradation. The courses will provide a substantial contribution to environment and sustainable land management outcomes.
© 2010 19th World Congress of Soil Science, Soil Solutions for a Changing World 124 1 – 6 August 2010, Brisbane, Australia. Published on DVD.
Nitrogen leaching from effluent irrigated pasture, on a vitrand (pumice soil),
taupo, New Zealand – initial results
G. TreweekA, M.R. BalksA and L.A. SchipperA ADepartment of Earth and Ocean Sciences, University of Waikato, New Zealand, Email [email protected].
Abstract Preliminary results from the first two months of an ongoing lysimeter study located on Vitrands (Pumice Soils) in Taupo, New Zealand are presented. Nitrogen leaching and pasture uptake from a ryegrass pasture irrigated with secondary treated municipal effluent has been collected by 48 intact soil monolith lysimeters. Four treatments, nominally 650 kg N/ha/yr, 550 kg N/ha/yr, 450 kg N/ha/yr and 0 kg N/ha/yr were applied to approximately 23 hectares of the irrigation site by centre pivot irrigators. Cumulative N leached was 4.5 kg N/ha from the 650 treatment; 1.2 kg N/ha from the 550 treatment; 1.1 kg N/ha from the 450 treatment; and no nitrogen has been leached from the control over the two month period. These averages were not significantly different. Key Words Wastewater, lysimeter, groundwater, sewage. Introduction The Taupo District Council (TDC) operates a land treatment scheme (LTS) as the final method of treating municipal effluent from a population of about 20 000. Since 1995, TDC has irrigated secondary treated municipal wastewater to land in a cut and carry farming operation (Power and Wheeler 2007). The Taupo LTS is planted with high yielding perennial ryegrass. The ryegrass uses nitrogen and phosphorous contained in the effluent for plant growth and is harvested a minimum of five times annually. To limit the recycling of nutrients, no animal stock are held, and harvested grass is removed from site. Nitrogen has been identified as a limiting nutrient in surface waters of the Taupo region (White & Payne 1977) and as such strict regulations govern the management of nitrogen in the greater Taupo catchment. The resource consent issued for the LTS allows 550 kg N/ha/yr to be applied, however a higher rate of application is sought by TDC. Subsequently, a trial is underway in conjunction with AWT New Zealand Ltd where up to 650 kg N/ha/yr can be applied. The overall purpose of the study was to quantify the nitrogen leached from the soil beneath the Taupo LTS under different effluent loadings. The specific objectives were to measure: • the amount of nitrogen applied to the land surface; • the volume of water draining through the soil profile; • the nitrogen concentration of drainage water; and • the nitrogen uptake by the ryegrass pasture. These data will be used to develop a nitrogen budget to allow TDC to determine the most appropriate effluent application rate to stay within resource consent conditions. The trial was located 10 km north of the Taupo township, on low rolling hills and flat terraces. The soils were Vitrands (USDA Soil Taxonomy), Pumice Soils (NZ Soil Classification) formed in Taupo eruptives, predominantly Atiamuri gritty sandy loam series or Whenuaroa gravelly sandy loam series (Figure 1). Atiamuri soils were derived from flow tephra, covering the steeper slopes, while the Whenuaroa soils originate from alluvial reworked deposits. Both soils were considered well draining and had variably textured subsoils (Orbell 2007). Methods Four effluent application rates (nominally 0, 450, 550, and 650 kg N/ha/yr) were applied beneath two centre pivot irrigators that span approximately 23 hectares. Forty eight intact soil monolith lysimeters (Cameron et
al. 1992) measuring 300mm wide x 450mm deep (Figure 2), were installed with 12 replicate lysimeters in each treatment. The lysimeters feature a leachate collection compartment beneath the undisturbed soil core
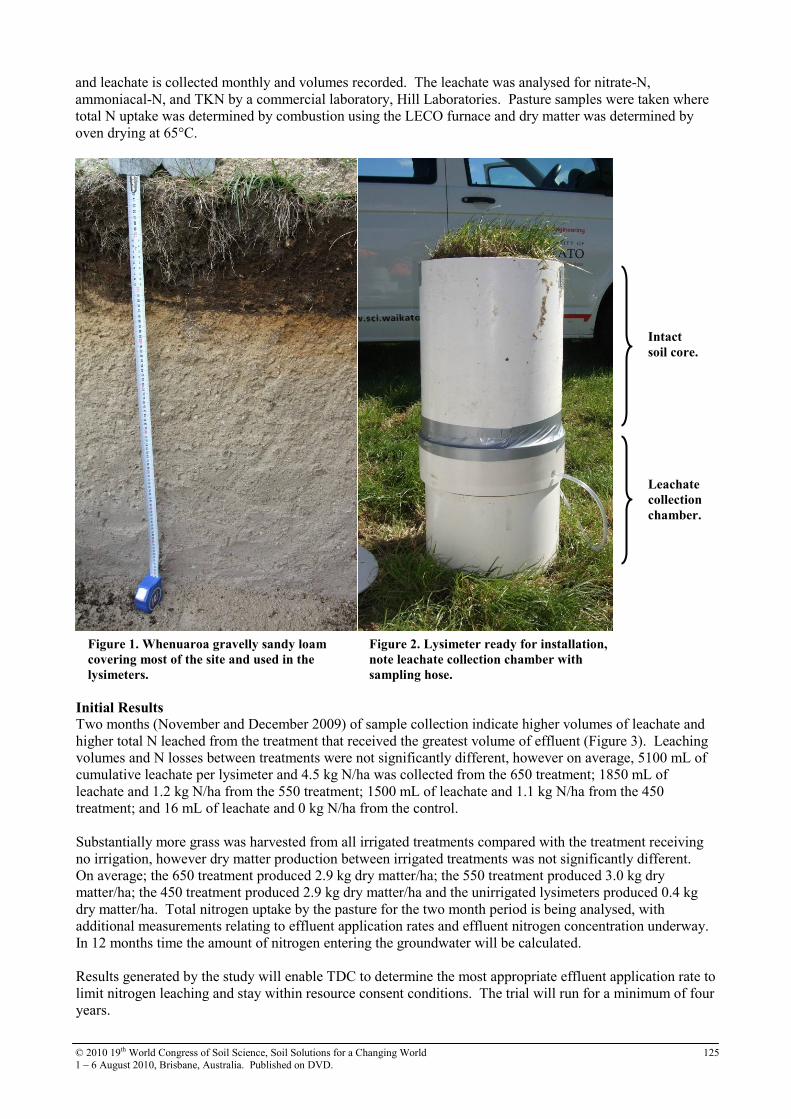
© 2010 19th World Congress of Soil Science, Soil Solutions for a Changing World 125 1 – 6 August 2010, Brisbane, Australia. Published on DVD.
and leachate is collected monthly and volumes recorded. The leachate was analysed for nitrate-N, ammoniacal-N, and TKN by a commercial laboratory, Hill Laboratories. Pasture samples were taken where total N uptake was determined by combustion using the LECO furnace and dry matter was determined by oven drying at 65°C.
Initial Results Two months (November and December 2009) of sample collection indicate higher volumes of leachate and higher total N leached from the treatment that received the greatest volume of effluent (Figure 3). Leaching volumes and N losses between treatments were not significantly different, however on average, 5100 mL of cumulative leachate per lysimeter and 4.5 kg N/ha was collected from the 650 treatment; 1850 mL of leachate and 1.2 kg N/ha from the 550 treatment; 1500 mL of leachate and 1.1 kg N/ha from the 450 treatment; and 16 mL of leachate and 0 kg N/ha from the control. Substantially more grass was harvested from all irrigated treatments compared with the treatment receiving no irrigation, however dry matter production between irrigated treatments was not significantly different. On average; the 650 treatment produced 2.9 kg dry matter/ha; the 550 treatment produced 3.0 kg dry matter/ha; the 450 treatment produced 2.9 kg dry matter/ha and the unirrigated lysimeters produced 0.4 kg dry matter/ha. Total nitrogen uptake by the pasture for the two month period is being analysed, with additional measurements relating to effluent application rates and effluent nitrogen concentration underway. In 12 months time the amount of nitrogen entering the groundwater will be calculated. Results generated by the study will enable TDC to determine the most appropriate effluent application rate to limit nitrogen leaching and stay within resource consent conditions. The trial will run for a minimum of four years.
Intact
soil core.
Leachate
collection
chamber.
Figure 1. Whenuaroa gravelly sandy loam
covering most of the site and used in the
lysimeters.
Figure 2. Lysimeter ready for installation,
note leachate collection chamber with
sampling hose.
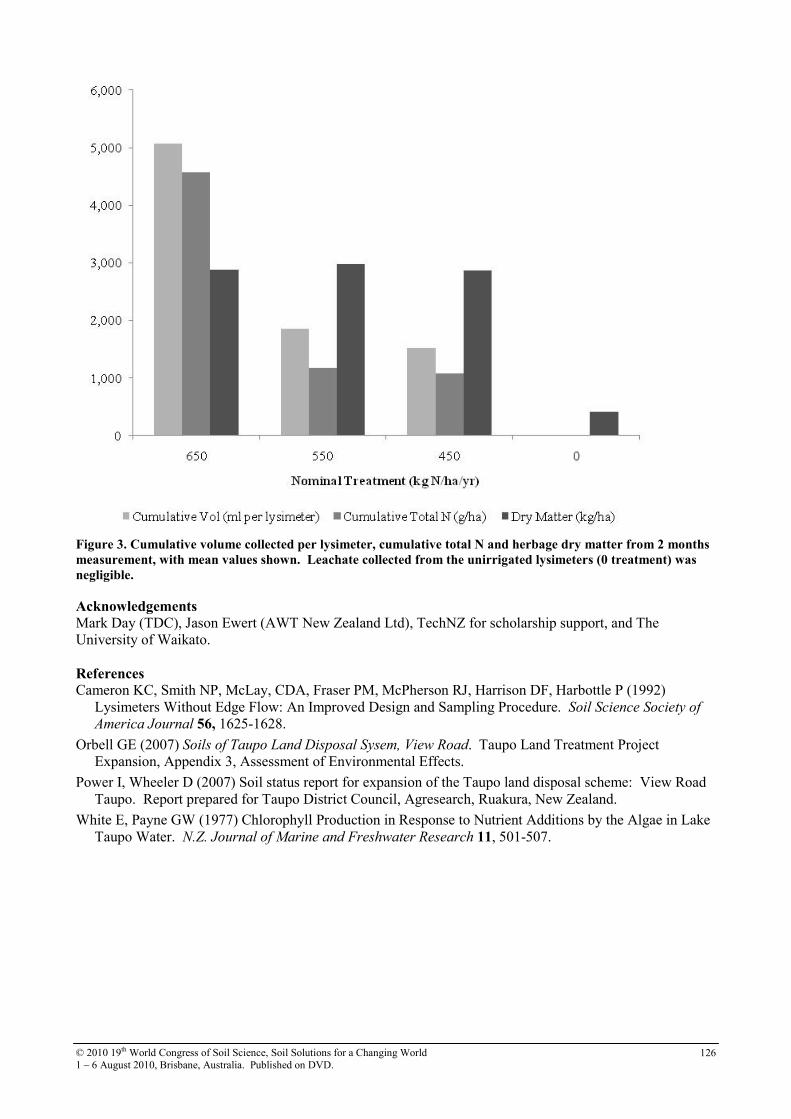
© 2010 19th World Congress of Soil Science, Soil Solutions for a Changing World 1 – 6 August 2010, Brisbane, Australia. Published on DVD.
126
Figure 3. Cumulative volume collected per lysimeter, cumulative total N and herbage dry matter from 2 months
measurement, with mean values shown. Leachate collected from the unirrigated lysimeters (0 treatment) was
negligible.
Acknowledgements Mark Day (TDC), Jason Ewert (AWT New Zealand Ltd), TechNZ for scholarship support, and The University of Waikato. References Cameron KC, Smith NP, McLay, CDA, Fraser PM, McPherson RJ, Harrison DF, Harbottle P (1992)
Lysimeters Without Edge Flow: An Improved Design and Sampling Procedure. Soil Science Society of
America Journal 56, 1625-1628.
Orbell GE (2007) Soils of Taupo Land Disposal Sysem, View Road. Taupo Land Treatment Project Expansion, Appendix 3, Assessment of Environmental Effects.
Power I, Wheeler D (2007) Soil status report for expansion of the Taupo land disposal scheme: View Road Taupo. Report prepared for Taupo District Council, Agresearch, Ruakura, New Zealand.
White E, Payne GW (1977) Chlorophyll Production in Response to Nutrient Additions by the Algae in Lake Taupo Water. N.Z. Journal of Marine and Freshwater Research 11, 501-507.

© 2010 19th World Congress of Soil Science, Soil Solutions for a Changing World 1 – 6 August 2010, Brisbane, Australia. Published on DVD.
127
Nutrient availability from anaerobic baffled reactor effluent for maize growth in
three contrasting soils from KwaZulu-Natal, South Africa Irene Bame
A, Jeffrey Hughes A, Louis Titshall A, Joseph AdjeteyB and Chris Buckley C ASoil Science, School of Environmental Sciences, University of KwaZulu-Natal, Pietermaritzburg, South Africa. Email: [email protected]; [email protected]; [email protected] BCrop Science, School of Agricultural Sciences and Agribusiness, University of KwaZulu-Natal, Pietermaritzburg, South Africa. Email: [email protected] CPollution Research Group, School of Chemical Engineering, University of KwaZulu-Natal, Durban, South Africa. Email: [email protected]
Abstract This study was undertaken to assess the availability to maize of nutrients in effluent from an anaerobic baffled reactor (ABR) for use in peri-urban agriculture. Maize was grown in pots filled with three contrasting soils with fertilizer (N, P and K) applied at the full recommended rate, half the recommended rate and no fertilizer. Plants were watered with either ABR effluent or tap water. After 6 weeks plants were harvested and above-ground dry matter yield and nutrient concentrations were measured. Dry matter yield and nutrient concentrations for effluent-irrigated maize were significantly higher for all fertilizer applications (p<0.05) than the water-irrigated plants. The unfertilized effluent-irrigated plants were not significantly different from the fertilized water-irrigated plants, but performed as well as the water-irrigated plants at half fertilization irrespective of soil type. Phosphorus deficiency was shown in the two heavier textured soils but not in the sandy soil irrespective of fertilizer treatment. Keywords Sewage effluent, plant nutrients, soil type, maize yield, small-scale agriculture Introduction Treated sewage effluent has been successfully used for crop irrigation in several countries (Feigin et al. 1991; Fonseca et al. 2007). The anaerobic baffled reactor (ABR) is a high rate anaerobic digester consisting of alternate hanging and standing baffles designed to treat wastewater (Foxon et al. 2004). Foxon et al. (2005) conducted a small-scale field study on the use of ABR effluent on plant growth and results were comparable with irrigating using a commercial plant nutrient solution. The objectives of this study were 1) to investigate the potential of ABR effluent as a nutrient source for plants (in particular N, P and K) and 2) to assess the potential of the ABR effluent as an irrigation source for small-scale, peri-urban agriculture in South Africa. Materials and methods A pot experiment was carried out in a glasshouse at the University of KwaZulu-Natal (UKZN), Pietermaritzburg with maximum and minimum temperatures of 26oC and 16oC, respectively. Three contrasting soil types were used namely a Cartref E horizon (Cf; Typic Haplaquept), Inanda A (Ia; Rhodic Hapludox) and Sepane A (Se; Aquic Haplustalf) (Soil Classification Working Group 1991; Soil Survey Staff 2003). Soils were air dried, ground to pass a 2 mm sieve and physico-chemical properties determined following methods of The Non Affiliated Soil Analysis Work Committee (1990). Pots (i.d. = 20 cm) were filled with 2 kg soil and N, P and K fertilizer was applied at the full recommended rate for a soil type, half the recommended rate and no fertilizer. Ammonium nitrate, potassium dihydrogen phosphate and potassium nitrate were used to supply the fertilizer nutrients in solution before planting at different rates (0, 100, 200 kg N/ha for all soils; 0, 40, 80 kg P/ha and 0, 50, 100 kg K/ha for the Cf; 0, 10, 20 kg P/ha and 0, 102.5, 205 kg K/ha for Ia; and 0, 30, 60 kg P/ha and 0, 5, 10 kg K/ha for Se). Pots were watered with either ABR effluent or tap water. The ABR effluent was sourced from a pilot plant in the School of Chemical Engineering, UKZN, Durban. Each treatment was run in triplicate (total of 54 pots) and the experiment was laid out in a randomized complete block design. Lime (calcium hydroxide) was applied to all Ia treatments at the rate of 10 t/ha and eight maize seeds (PAN 4P-767BR) were planted per pot and thinned to four plants two weeks after planting. Plants were watered according to evapotranspiration demands and the total volume of solution added was equivalent to 43.3, 82.7 and 52.6 mm of rainfall for the Cf, Ia and Se, respectively.

© 2010 19th World Congress of Soil Science, Soil Solutions for a Changing World 1 – 6 August 2010, Brisbane, Australia. Published on DVD.
128
After six weeks growth, plant height and number of leaves were measured. The plants were harvested at 1 cm above soil level, and dried at 70 oC to determine dry matter yield. Dried samples were ground and stored for plant nutrient analyses. Nitrogen was determined by Kjeldahl digestion (Rowell 1994). Phosphorus and K were determined by inductively coupled plasma optical emission spectrometry after nitric acid digestion. Data were analysed using Genstat 12th edition and the Student Newman Keul range test at 5% was used to determine differences between treatment means. The chemical composition of the ABR effluent was analysed by inductively coupled plasma optical emission spectrometry and the E. coli composition by plating dilutions from the column on eosin methylene blue (EMB) agar plates and counting colonies formed after incubation at 35 oC for 48 hrs. Results and discussion Soil and effluent characterization
The chemical analyses and particle size distribution of the soils are given in Table 1. Table 1. Some chemical properties and particle size distribution of the soils.
Cartref E Inanda A Sepane A
( H20) 6.24 4.44 7.09
(1M KCl) 4.62 3.97 5.61Electrical conductivity (dS/m) 0.017 0.089 0.097Organic C (g/100g) 0.18 7.54 1.92Total N (mg/kg) 352 6234 2087
Ca 1.1 0.6 8.2Mg 0.4 0.2 7.4K 0.1 0.1 0.3
Exchangeable acidity (cmolc/kg) 0.06 4.31 0.08
Mn 3.5 6.5 9.6Cu 0.7 1.9 2.6Zn 0.1 0.8 4.3
Extractable P (mg/kg) 2.1 15.6 5.2Particle size (%)
Sand (0.053-2 mm) 80.2 29.9 21.4Silt (0.002-0.053 mm) 12.9 48.2 42.9Clay (<0.002 mm) 6.9 21.9 35.7
Extractable metal cations (mg/kg)
ParameterSoil form* and horizon
pH
Extractable base cations (cmolc/kg)
* Soil Classification Working Group (1991) The effluent had low heavy metal concentrations (Table 2) which were below the Food and Agricultural Organization critical limits for irrigation (Ayers and Westcott 1985). This was attributed to the fact that the effluent is derived from a domestic source. The low SAR and EC of the effluent places it in a class with no restrictions for use in irrigation (C2S1; United States Salinity Laboratory Staff 1954). The total amount of N, P and K supplied by the effluent and the water during the course of the pot experiment is given in Table 3. Dry matter yield and nutrient accumulation
There was a significant (p<0.05) difference in dry matter yield between plants watered with the different irrigating solutions irrespective of fertilizer applied (Table 4). The only exception was in the unfertilized, effluent-irrigated plants which were not significantly different from the fertilized treatments irrigated with water. This trend also applied irrespective of soil type indicating the potential that the effluent has to enhance plant growth. The Cf at full fertilizer rate and irrigated with effluent had the highest dry matter yield (4900 mg/pot). The maize nutrient content was significantly higher (p<0.05) in the effluent-irrigated soils than in the water-irrigated soils. Comparisons between the fully fertilized plants showed that the effluent-irrigated plants were significantly different from the water-irrigated plants indicating an additional input from the effluent. These results are in agreement with the observations of Bielorai et al. (1984) but contrary to those of Fonseca et al.
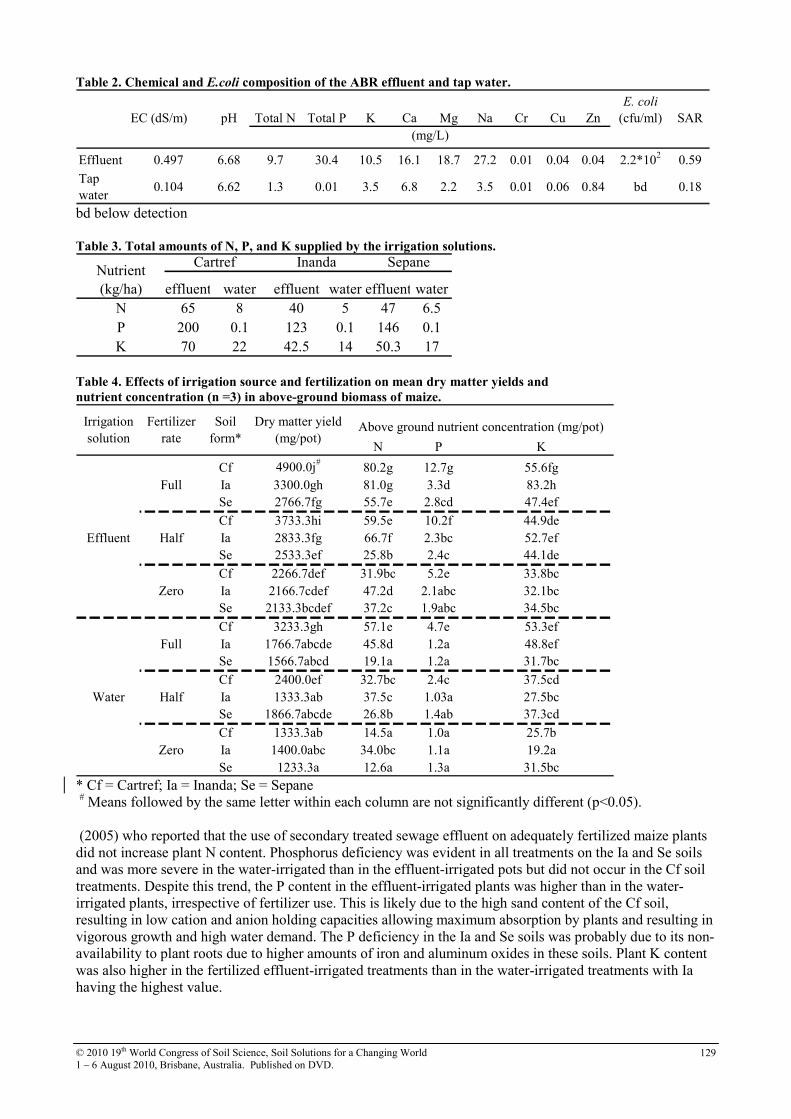
© 2010 19th World Congress of Soil Science, Soil Solutions for a Changing World 1 – 6 August 2010, Brisbane, Australia. Published on DVD.
129
Table 2. Chemical and E.coli composition of the ABR effluent and tap water.
Effluent 0.497 6.68 9.7 30.4 10.5 16.1 18.7 27.2 0.01 0.04 0.04 2.2*102 0.59
Tap water
0.104 6.62 1.3 0.01 3.5 6.8 2.2 3.5 0.01 0.06 0.84 bd 0.18
pH Total N Total PEC (dS/m) SAR(mg/L)
K Ca Mg Na CrE. coli
(cfu/ml)Cu Zn
bd below detection Table 3. Total amounts of N, P, and K supplied by the irrigation solutions.
effluent water effluent water effluent waterN 65 8 40 5 47 6.5P 200 0.1 123 0.1 146 0.1K 70 22 42.5 14 50.3 17
Nutrient (kg/ha)
Cartref Inanda Sepane
Table 4. Effects of irrigation source and fertilization on mean dry matter yields and
nutrient concentration (n =3) in above-ground biomass of maize.
N P K
Cf 4900.0j# 80.2g 12.7g 55.6fgFull Ia 3300.0gh 81.0g 3.3d 83.2h
Se 2766.7fg 55.7e 2.8cd 47.4ef
Cf 3733.3hi 59.5e 10.2f 44.9deEffluent Half Ia 2833.3fg 66.7f 2.3bc 52.7ef
Se 2533.3ef 25.8b 2.4c 44.1de
Cf 2266.7def 31.9bc 5.2e 33.8bcZero Ia 2166.7cdef 47.2d 2.1abc 32.1bc
Se 2133.3bcdef 37.2c 1.9abc 34.5bc
Cf 3233.3gh 57.1e 4.7e 53.3efFull Ia 1766.7abcde 45.8d 1.2a 48.8ef
Se 1566.7abcd 19.1a 1.2a 31.7bc
Cf 2400.0ef 32.7bc 2.4c 37.5cdWater Half Ia 1333.3ab 37.5c 1.03a 27.5bc
Se 1866.7abcde 26.8b 1.4ab 37.3cd
Cf 1333.3ab 14.5a 1.0a 25.7bZero Ia 1400.0abc 34.0bc 1.1a 19.2a
Se 1233.3a 12.6a 1.3a 31.5bc
Above ground nutrient concentration (mg/pot)Irrigation solution
Fertilizer rate
Soil form*
Dry matter yield (mg/pot)
* Cf = Cartref; Ia = Inanda; Se = Sepane
# Means followed by the same letter within each column are not significantly different (p<0.05). (2005) who reported that the use of secondary treated sewage effluent on adequately fertilized maize plants did not increase plant N content. Phosphorus deficiency was evident in all treatments on the Ia and Se soils and was more severe in the water-irrigated than in the effluent-irrigated pots but did not occur in the Cf soil treatments. Despite this trend, the P content in the effluent-irrigated plants was higher than in the water-irrigated plants, irrespective of fertilizer use. This is likely due to the high sand content of the Cf soil, resulting in low cation and anion holding capacities allowing maximum absorption by plants and resulting in vigorous growth and high water demand. The P deficiency in the Ia and Se soils was probably due to its non-availability to plant roots due to higher amounts of iron and aluminum oxides in these soils. Plant K content was also higher in the fertilized effluent-irrigated treatments than in the water-irrigated treatments with Ia having the highest value.
© 2010 19th World Congress of Soil Science, Soil Solutions for a Changing World 1 – 6 August 2010, Brisbane, Australia. Published on DVD.
130
Conclusion The ABR effluent used to irrigate maize improved dry matter yields and nutrient concentrations when compared with similar treatments irrigated with water. However, the unfertilized effluent-irrigated plants were not significantly different from the water-irrigated plants with half the recommended fertilizer rate. This suggests that the effluent can supplement fertilizer use for maize thus reducing costs for small-scale peri-urban farmers. Acknowledgements We are grateful to the eThekwini Municipality, Durban, South Africa for funding this research and the Soil Fertility and Analytical Services Division (KwaZulu-Natal Department of Agriculture, Cedara) for some of the analyses.
References Ayers RS, Westcott DW (1985) Water quality for agriculture. Irrigation and drainage paper. No 29. FAO.
Rome. 174pp.
Bielorai H, Vaisman I, Feigin A (1984) Drip irrigation of cotton with municipal effluents. I. Yield response. Journal of Environmental Quality 13, 231-234.
Feigin A, Ravina I, Shalhevet J (1991) Irrigation with treated sewage effluent. Management for environmental protection. Springer-Verlag: Berlin, Germany.
Fonseca AF, Melfi AJ, Montes CR (2005) Maize growth and changes in sol fertility after irrigation with treated sewage effluent. I. Plant dry matter yield and soil nitrogen and phosphorus availability. Communications in Soil Science and Plant Analysis 36, 1965-1981.
Fonseca AF, Herpin U, Paula AM, Victoria RL, Melfi AJ (2007) Agricultural use of treated sewage effluents: agronomic and environmental implications and perspectives for Brazil. Scientia Agricola 64, 194-209.
Foxon KM, Pillay S, Lalbahadur T, Rodda N, Holder F, Buckley CA (2004) The anaerobic baffled reactor (ABR): An appropriate technology for on-site sanitation. Water South Africa 30, 44-50.
Foxon KM, Buckley CA, Brouckaert CJ, Dama P, Mtembu Z, Rodda N, Smith M, Pillay S, Arjun N, Lalbahadur T, Bux F (2005) Evaluation of the anaerobic baffled reactor for sanitation in dense peri-urban settlements. Water Research Commission Report No 1248/1/06. pp 1-224.
Rowell DL (1994) Soil Science: Methods and Applications. Longman Group, Harlow, UK.
Soil Classification Working Group (1991) Soil Classification. A taxonomic system for South Africa. Memoirs Agric. Natur. Res. of South Africa, No 15, Department of Agriculture and Development. Pretoria.
Soil Survey Staff (2003) Keys to Soil Taxonomy. 9th edition, USDA, Natural Resources Conservation Service, U.S. Government Printing Office, Washington, DC.
The Non-Affiliated Soil Analysis Work Committee (1990) Handbook of Standard Soil Testing Methods for Advisory Purposes. Soil Science Society of South Africa. Pretoria.
United States Salinity Laboratory Staff (1954) Diagnosis and improvement of saline alkali soils. USDA Agricultural Handbook No 60. U.S. Government Printing Office. Washington, DC.
© 2010 19th World Congress of Soil Science, Soil Solutions for a Changing World 1 – 6 August 2010, Brisbane, Australia. Published on DVD.
131
Nutrient distribution in three contrasting soils after anaerobic baffled reactor
effluent application: A soil column study Irene BameA, Jeffrey Hughes
A, Louis TitshallA and Chris BuckleyB
ASoil Science, School of Environmental Sciences, University of KwaZulu-Natal, Pietermaritzburg, South Africa, Email [email protected]; [email protected]; [email protected] BPollution Research Group, School of Chemical Engineering, University of KwaZulu-Natal, Durban, South Africa, Email [email protected] Abstract The increasing need for wastewater reuse resulted in this study to investigate the effects of effluent from an anaerobic baffled reactor (ABR) on some chemical properties of three contrasting soils after effluent leaching and the implications for peri-urban agriculture. Soil columns were leached with ABR effluent or distilled water using 16 pore volumes after which the columns were sectioned into two cm layers. The 0-2 cm, 8-10 cm and 14-16 cm layers were analysed for inorganic-N, P and K. For all soils the nutrient content, especially P, of the 0-2 cm layer was significantly (p<0.05) higher than the middle and bottom sections of the columns. There were significant differences between the effluent and the water-leached soils in terms of P accumulation. The amount of inorganic-N and K in the top layer was not significantly different from the other layers with the exception of the 0-2 cm layer in the Sepane soil leached with effluent.
Key Words Sewage effluent, soluble nutrient movement, laboratory column study, small-scale agriculture.
Introduction In arid and semi-arid regions the demand for freshwater is gradually increasing as good quality water has become scarce. The volume of wastewater produced is likely to increase with the growing population resulting in a need for reuse options. There is potential for the inorganic nutrients present in wastewater to be used for fertigation. The anaerobic baffled reactor (ABR) effluent is an example of such a wastewater that may be used for agricultural purposes thereby reducing the pressure on freshwater sources for irrigation, while also supplying nutrients for plant growth. Soils are often able to serve as a reservoir for wastewater because of their ability to buffer and assimilate the water, nutrients and any contaminants (Bond 1998). The ABR is a high rate anaerobic digester consisting of alternate hanging and standing baffles designed to treat wastewater (Foxon et al. 2004). The objective of this study was to evaluate the distribution of some plant nutrients in soil after leaching with ABR effluent, with a view to its use for irrigation in small-scale, peri-urban agriculture. Materials and methods Columns consisted of polyvinyl chloride tubes, 20 cm long (i.d. = 5.3 cm). The base of each column was fitted with a perforated perspex disc (holes of 0.8 cm diameter) of the same diameter as the column and covered with nylon mesh. Glass-fibre mesh was placed on the disc before filling the column to minimise soil loss from the column during leaching. Soils were air-dried, ground to pass a 2 mm sieve and analysed following methods of The Non-Affiliated Soil Analysis Work Committee (1990). The columns were filled with the respective soils namely Longlands E horizon (Lo; Typic Plinthaquult), Inanda A (Ia; Rhodic Hapludox) and Sepane A (Se; Aquic Haplustalf) (Soil Classification Working Group 1991; Soil Survey Staff 2003) to a height of about 17 cm by uniform tapping on the bench top to achieve a bulk density of 1.48 g/cm3 for the Lo, 0.75 g/cm3 for the Ia and 1.12 g/cm3 for the Se soil. Glass-fibre mesh was placed on the soil surface to minimise soil disturbance during the leaching procedure. The soils were leached with either ABR effluent or distilled water in triplicate (total of 18 columns). Prior to leaching the columns were saturated with distilled water by capillary flooding. With an assumed particle density of 2.65 g/cm3, a pore volume for the Lo, Ia and Se soils was calculated to be 168, 270 and 217 mL, respectively (Rowell 1994). Each leaching event comprised of drip flow from the top onto the columns according to the hydraulic properties of each soil which gave a flow rate of 6.4 - 6.5 cm/hr for the Lo, 5.1 - 5.8 cm/hr for the Ia and 1.0 -1.1 cm/hr for the Se. The columns were leached with 16 pore volumes over a period of 138 days corresponding to 1218 mm, 1957 mm and 1573 mm of water for the Lo, Ia and Se, respectively.

© 2010 19th World Congress of Soil Science, Soil Solutions for a Changing World 1 – 6 August 2010, Brisbane, Australia. Published on DVD.
132
After leaching, the columns were allowed to drain, the soil was pushed out and cut into 2 cm sections. Soil samples from the 0-2, 8-10 and 14-16 cm sections were taken to represent the top, middle and bottom layers of the column and were analysed for nitrate-N and ammonium-N (Tan 1995) and soluble P and K (Rauret et
al. 1999). The chemical composition of the ABR effluent was analysed similarly and the E. coli composition by plating dilutions from the column on eosin methylene blue (EMB) agar plates and counting colonies formed after incubation at 35oC for 48 hrs. Data were analysed using Genstat 12th edition and mean comparisons by Tukey’s test at the 5% level. Results and discussion Soil and effluent properties
The chemical analyses and particle size distribution of the soils are given in Table 1. The ABR effluent contains considerable amounts of plant nutrients and low concentrations of heavy metals with most being below permissible limits (Table 2). As such the effluent meets the criteria for use as an irrigation source (Ayers and Westcott 1985; DWAF 1996). The effluent belongs to salinity class C2S1 (medium salinity water/low sodicity water) and thus can be used with little risk of developing sodic conditions (United States Salinity Laboratory Staff 1954). As expected, the distilled water supplied very little nutrient input to the soil. Table 1. Some chemical properties and particle size distribution of the three soils.
Longlands E Inanda A Sepane A
( H20) 6.05 4.30 5.80
(1M KCl) 4.90 4.00 4.81
Electrical conductivity (dS/m) 0.04 0.05 0.15
Organic C (g/100g) 0.14 9.60 3.65
Total N (mg/kg) 533 5121 3036
Ca 2.06 0.85 10.83
Mg 0.62 0.20 9.13
K 0.10 0.17 0.25
Exchangeable acidity (cmolc/kg) 0.03 4.71 0.09
Mn 23.7 16.0 28.57
Cu 2.23 4.40 2.50
Zn 1.76 2.00 0.09
Extractable P (mg/kg) 4.05 20.0 1.79
Particle size (%)
Sand (0.053-2 mm) 76.6 35.9 24Silt (0.002-0.053 mm) 12.8 42.2 42.0
Clay (<0.002 mm) 10.6 21.9 34.0
ParameterSoil form* and horizon
pH
Extractable base cations (cmolc/kg)
Extractable metal cations (mg/kg)
* Soil Classification Working Group (1991)
Table 2. Chemical and Escherichia coli (E. coli) composition of the ABR effluent and distilled water.
Effluent 0.641 7.6 14.3 bd 25.2 8.6 18.9 26.3 32.5 0.01 bd bd 7.5*104 1.13
Distilledwater
0.003 6.24 bd bd bd 0.14 0.37 bd 0.3 0.01 bd 0.003 bd 0.14
EC (dS/m) pH NH4+
Total PNO3
-Zn
E. coli
(cfu/ml) SAR(mg/L)
K Ca Mg Na Cr Cu
Soil nutrient retention
The N, P and K concentrations in the leaching solutions are given in Table 3. This shows that the effluent added to the content of these elements in soil unlike the distilled water that leached most of the elements, as indicated by the negative values.

© 2010 19th World Congress of Soil Science, Soil Solutions for a Changing World 1 – 6 August 2010, Brisbane, Australia. Published on DVD.
133
There were no significant differences (p<0.05) in the inorganic-N between the soil layers from both the water and effluent-leached columns with levels below detection recorded for all Lo samples and Se (0-2 cm) in the water-leached columns (Table 4). This could be attributed to the high percolation of nitrate–N and the conversion of ammonium-N to nitrate-N as shown by Egiarte et al. (2006) when using an anaerobic municipal sludge in an acid soil. There were marked differences between the P concentrations in the soil layers for the effluent and water-leached columns (Table 4). In all soils, the 0-2 cm layer had a significantly (p<0.05) higher concentration of P than the middle and bottom layers. This build-up, although less in the Lo than in the Ia and Se soils, suggest P is bound in soil by organic and/or inorganic constituents. The specific adsorption capacity of soils to retain P can contribute to prevent its movement in soil. Microbial immobilization could be a further reason for this occurrence, especially in the sandy Lo soil (Janssen et al. 2005). For K, the Ia and the Se (0-2 cm) showed significant differences between the effluent and water-leached columns. The trend in the Lo was similar for K and inorganic-N which may be as a result of the smaller contribution from the effluent when compared with P. Table 3. Quantity of inorganic-N (In-N), P and K retained in the soils from the leaching solutions.
effluent water effluent water effluent waterIn-N 7.9 -17.7* 72.4 -168.2 60.9 -22.6
P 115.2 0.02 367.3 0.17 191.4 0.1K 24 -6.6 18.8 -38.9 72.3 -4.2
Nutrient (mg/kg)
Longlands E Inanda A Sepane A
* negative values indicate amount lost from soil Table 4. Mean values of soluble inorganic-N (In-N), P and K (mg/kg) for column layers after leaching.
Soil form*
In-N P K In-N P K
Lo bd** 5.0a# 22.7a 2.0ab 102.5bc 43.2abcIa 26.1bcd 2.3a 45.5abc 30.0cd 98.4b 164.0ghSe bd 2.7a 70.2bcde 6.7abc 186.5d 172.7h
Lo bd 3.5a 21.9a 1.4a 46.9a 41.5abcIa 28.3cd 2.4a 54.2abc 49.8d 1.9a 130.6fgSe 8.3abc 1.1a 81.8cde 0.6a 12.0a 96.6def
Lo bd 2.6a 22.8a 2.5ab 9.6a 37.4abIa 17.5abc 2.3a 63.2abcd 30.2cd 2.6a 112.2efSe 13.9abc 2.3a 83.6cde 1.6ab 2.6a 99.9def
0-2
Soil depth(cm)
14-16
Leaching solutionDistilled water Effluent
8-10
* Soil Classification Working Group (1991) # Values in each column followed by the same letter are not significantly different (p<0.05) ** bd below detection
Conclusion The accumulation of nutrients especially P in the top soil layer during leaching was influenced by the nutrient loading in the effluent giving an opportunity for uptake by plants and also reducing the risk of downward movement of high risk elements such as P into groundwater. It would appear that the ABR effluent has potential for use in fertigation. There are various mechanisms that control the migration and retention of P in effluent-irrigated soils thus necessitating long-term studies. Inorganic-N and K leaching was not as significant between the soil layers.

© 2010 19th World Congress of Soil Science, Soil Solutions for a Changing World 1 – 6 August 2010, Brisbane, Australia. Published on DVD.
134
Acknowledgements This research is funded by the eThekwini Municipality, Durban, South Africa. Some analyses were carried out by the Soil Fertility and Analytical Services Division (KwaZulu-Natal Department of Agriculture, Cedara).
References Ayers RS, Westcott DW (1985) Water quality for agriculture. Irrigation and drainage paper. No 29. FAO.
Rome. 174pp.
Bond WJ (1998) Effluent irrigation - an environmental challenge for soil science. Australian Journal of Soil
Research 36, 543-555.
DWAF (1996) South African water quality guidelines (second edition). Volume 4: Agricultural water use: Irrigation. Department of Water Affairs and Forestry, Pretoria.
Egiarte G, Arbestain MC, Ruiz-Romera E, Pinto M (2006). Study of the chemistry of an acid soil column and the corresponding leachates after the addition of an anaerobic municipal sludge. Chemosphere 65, 2456-2467.
Foxon KM, Pillay S, Lalbahadur T, Rodda N, Holder F, Buckley CA (2004). The anaerobic baffled reactor (ABR): An appropriate technology for on-site sanitation. Water South Africa 30, 44-50.
Janssen BH, Boesveld H, Justo RM (2005) Some theoretical considerations on evaluating wastewater as a source of N, P and K for crops. Irrigation and Drainage 54, S35-S47.
Rauret G, Lopez-Sanchez JF, Sahuquillo A, Rubio R, Davidson C, Ure A, Quevauviller P (1999) Improvement of the BCR three step sequential extraction procedure prior to the certification of new sediment and soil reference materials. Journal of Environmental Monitoring 1, 57-61
Rowell DL (1994) Soil Science: Methods and Applications: Longman Group, Harlow. 350pp.
Soil Classification Working Group (1991) Soil Classification. A taxonomic system for South Africa. Memoirs Agric. Natur. Res. of South Africa, No 15, Department of Agriculture and Development. Pretoria.
Soil Survey Staff (2003) Keys to Soil Taxonomy. Ninth edition USDA, Natural Resources Conservation Service, U.S. Government Printing Office, Washington, DC.
Tan KH (1995) Soil sampling, preparation, and analysis: Marcel Dekker, New York. 408pp.
The Non-Affiliated Soil Analysis Work Committee (1990) Handbook of Standard Soil Testing Methods for Advisory Purposes. Soil Science Society of South Africa. Pretoria.
United States Salinity Laboratory Staff (1954) Diagnosis and improvement of saline alkali soils. USDA Agricultural Handbook No 60. US Government Printing Office. Washington, DC.

© 2010 19th World Congress of Soil Science, Soil Solutions for a Changing World 1 – 6 August 2010, Brisbane, Australia. Published on DVD.
135
Nutrient transport from various agricultural sources in the Pagsanjan-Lumban
watershed in Laguna de Bay, Philippines
Pearl Sanchez
A, Hernan CastilloA, Rex Victor Cruz B, Rai KookanaC and Danni OliverC AAgricultural Systems Cluster, College of Agriculture, University of the Philippines Los Baños B
College of Forestry and Natural Resources, University of the Philippines Los Baños CCentre for Environmental Contaminants Research, CSIRO Land and Water Urrbrae South Australia Abstract The off-site transport of nutrients can have detrimental effects on waterways hence this study was conducted to monitor the sources and quantify the amount and form of transported nutrients in order to identify strategies that can minimise their impact. Four sites representing various land uses were selected and installed with automated water samplers and Odyssey water level loggers to measure water flow. Total suspended solids (TSS), total Kjeldahl nitrogen (TKN) and total phosphorus (TP) were determined in both unfiltered and filtered (<1.2 µm) samples. Agriculture is the major source of nitrogen (N) and phosphorus (P) transported in the Pagsanjan-Lumban watershed and the dominant land use upstream of the sampling sites greatly influenced the parameters measured. The effluent from the piggery farm had the highest TSS, TKN and TP concentrations. Among the cropped lands, higher concentrations of suspended sediments and nutrients were found in Pagsanjan (rice site). A positive linear relationship between TSS and TKN was noted in Pagsanjan and Lumban (vegetable site). The colloidal fraction dominated the transport process of N and P in the same sites. Nitrogen transport in Cavinti was mostly colloidal (>1.2 µm)-bound, although in some instances the soluble (<1.2 µm) fraction dominated. In Majayjay (piggery site), the soluble fraction dominated P transport. Key Words Diffuse sources, dissolved N, dissolved P, sediment-bound N, sediment-bound P. Introduction Laguna de Bay is one of the five largest lakes in Southeast Asia and is considered a very important natural resource in the Philippines. It occupies a total surface area of 900 km2 with an average depth of 2.5 m and a maximum water holding capacity of about 2.9 billion m3. The catchments in the eastern bay of the lake are mainly agricultural and the water quality is relatively less polluted than the west and central bays. Water will be extracted from the eastern bay as a potable water supply for part of metro Manila so it is important to monitor the impact of agricultural activities on water quality in this part of the lake. Nitrogen (N) and phosphorus (P) are essential nutrients for plant growth and healthy waters. However enrichment of surface waters (e.g. rivers, lakes) with these nutrients can result in excessive algal growth and other potential problems. This study was conducted to monitor the off-site transport of nutrients and sediments in the Pagsanjan-Lumban watershed which is located in the southeastern part of Laguna de Bay and to identify management strategies that will minimise off-site contamination. Methods The study area
The Pagsanjan-Lumban watershed is one of the 22 major watersheds that drain to into Laguna de Bay. Four sites representing the major agricultural activities were selected and installed with automated water samplers (Figure 1). Cavinti is mostly grown to coconut and the autosampler was in Cavinti River which drains into Bonbongan River. Lucban is predominantly grown to vegetable with some rice and the autosampler was installed in Lucban River. Pagsanjan is a rice production area and the autosampler was in Salasad River. Majayjay is a piggery site and represents a point source of contamination. At Majayjay the effluent drains into the Initian creek which eventually drains to Balanac River. Autosamplers were also installed in two rivers (Balanac and Bonbongan) located at the northern end of the watershed and which drain into Laguna de Bay, to monitor nutrient and sediment levels transported into it from the Pagsanjan-Lumban watershed.

© 2010 19th World Congress of Soil Science, Soil Solutions for a Changing World 1 – 6 August 2010, Brisbane, Australia. Published on DVD.
136
Figure 1. Pagsanjan-Lumban watershed map and location of automated water samplers and data loggers.
Sampling and laboratory analysis
Water samples were collected every 6 hours during the day and the 7 samples each week were composited to provide one sample for the week. The daily water samples were stored at 4°C until they were composited and transported to the laboratory for analysis. Collection of water samples started in 2007 in Lucban and Cavinti while in Pagsanjan and Majayjay in 2008 and continued until 2009. Total suspended solids (TSS) were measured by filtering a known volume of water through glass fibre filters (1.2 µm) that been conditioned by wetting with high quality water and drying at 40oC then weighed. The filter was then oven dried at 40oC and re-weighed and the mass of sediment in the known volume of water was determined. Total Kjeldahl nitrogen (TKN) was determined in both unfiltered and filtered (<1.2 µm) samples by digesting a known volume of sample in sulfuric acid with selenium mixture as a catalyst followed by colorimetric determination of ammonium using an autoanalyser. TKN in the filtered sample represented total dissolved nitrogen. The difference between TKN and total dissolved nitrogen was considered to be total colloidal (>1.2 µm) N. Total P (TP) was determined by digesting a known volume of sample with sulfuric acid and ammonium persulfate followed by colorimetric determinations. Total dissolved P and total colloidal P were calculated from P concentrations of the unfiltered and filtered samples. Results and discussion Total suspended solids Cavinti had the lowest mean concentration of TSS (73 mg/L) throughout the monitoring period followed by Lucban (77 mg/L), Pagsanjan (399 mg/L) and Majajay (1716 mg/L) (Table 1). The predominant land use upstream of the sampling sites tended to influence TSS concentration particularly at Pagsanjan, Cavinti and Lucban. Pagsanjan, which is predominantly a rice production area, contributed more suspended solids as compared to Cavinti (coconut) and Lucban (vegetables). The rice areas were puddled and kept flooded most of the time and if proper soil and water management practices are not in place, large amounts of sediments may leave the rice fields with the irrigation water. Very high TSS concentrations were recorded in Majayjay because of the piggery effluents draining straight into Initian Creek.

© 2010 19th World Congress of Soil Science, Soil Solutions for a Changing World 1 – 6 August 2010, Brisbane, Australia. Published on DVD.
137
Table 1. Total suspended sediments, total kjeldahl nitrogen and total P data in all sites.
Site Total suspended solids (mg/L) Total Kjeldahl N (mg/L) Total P (mg/L) Min Max Mean Min Max Mean Min Max Mean Cavinti 6 544 73 0.01 2.43 0.59 0.003 0.693 0.106 Lucban 13 312 77 0.01 3.15 1.01 0.003 2.236 0.292 Majayjay 12 7728 1716 0.33 135.00 67.9 0.180 132.570 23.920 Pagsanjan 81 2936 399 0.25 9.63 1.62 0.020 2.432 0.537 Balanac 2 29 11 0.23 1.53 0.54 0.018 0.345 0.015 Bonbongan 3 124 24 0.01 1.08 0.44 0.016 0.314 0.110
Total Kjeldahl N The trend in TKN is similar to TSS with Cavinti having the lowest mean concentration (0.59 mg/L) and Majayjay, the highest mean concentration (67.9 mg/L) (Table 1). Rice growers in Pagsanjan use higher rates of N fertilizers which resulted in higher TKN concentrations when compared to Lucban (vegetable) and Cavinti (coconut). An additional source of N in Pagsanjan can be domestic waste. In Majayjay, very high TKN concentrations were recorded because of the manure, urine and excess feed in the effluents. The mean TKN concentrations in all the sites were higher than the eutrophication threshold of 0.5 to 1.0 mg/L (Pierzynski et al. 2005). In a summary provided by Zafaralla et al. (2005), a mean TKN concentration of 1.10 mg/L was recorded in the eastern bay of the lake from 1990 to 1999. The mean TKN mean concentrations in Balanac and Bonbongan, which drain into Laguna de Bay, are lower compared to the four sites located further upstream in the watershed suggesting that there is dilution of contaminants. In addition to land use, TKN appeared to be influenced by TSS particularly in Pagsanjan where a linear relationship (r2 = 0.94) was obtained in 2008 and in Lucban (r2 = 0.62) in 2007. In the other sites and at different sampling periods, the relationship between TKN and TSS was not as obvious. In Lucban, Pagsanjan and Majajay, nitrogen moved predominantly off-site in association with the colloidal (>1.2 µm) fraction but in Cavinti, N was transported both as sediment (>1.2 µm)-bound and in the dissolved (<1.2 µm) fraction. Total phosphorus The trend in TP was also similar to TSS and TKN and average concentrations over the sampling period was: Cavinti (0.106 mg/L) > Lucban (0.292 mg/L) >Pagsanjan (0.537 mg/L) >Majayjay (23.92 mg/L) (Table 1). Except in Balanac, mean TP concentrations exceeded eutrophication threshold of 0.02 to 0.1 mg/L (Pierzynski et al. 2005). Assessment of water quality in the eastern bay of the Lake from 1990 to 1999 gave a mean TP concentration of 0.23 mg/L (Zafaralla et al. 2005). Higher P applications in the rice growing areas contributed to higher P concentrations in Pagsanjan. Higher TSS concentration also increased P concentration as a large proportion of total P transported off-site associated with colloids (>1.2 µm). Total P in Lucban, Cavinti and Pagsanjan was dominated by the colloidal (>1.2 µm) fraction while in Majayjay, the soluble (<1.2 µm) fraction dominated off-site transport. Conclusion Higher TSS, TKN and TP concentrations occurred in Pagsanjan, where rice production is the major agricultural activity compared with concentrations in sub-catchments dominated by vegetable (Lucban) or coconut (Cavinti) production. Total suspended solids, TKN and TP concentrations were extremely high in effluents draining from piggery farms and Majayjay is a major point source of contamination in the catchment. The colloidal (>1.2 µm) fraction dominated the transport of N and P in Lucban and Pagsanjan but in Cavinti N transport was dominated by soluble (<1.2 µm) fraction. In Majayjay, the soluble fraction (<1.2 µm) dominated transport of TP. These results suggest that higher nutrient concentrations occur in surface drainage water in areas with greater fertilizer inputs and if proper soil, water and piggery effluent management practices are not implemented, large amounts of sediments and nutrients can be transported off-site into waterways. Acknowledgement This study is part of a joint project between University of the Philippines Los Banos (UPLB), Laguna Lake Development Authority (LLDA) and CSIRO funded by the Australian Centre for International Agricultural Research (ACIAR). The technical assistance of Dr Jim Cox and Mr Nigel Fleming of SARDI in site selection and setting up the autosamplers and data loggers is gratefully acknowledged as is the assistance of Mr Michael Pillas in providing the watershed map.

© 2010 19th World Congress of Soil Science, Soil Solutions for a Changing World 1 – 6 August 2010, Brisbane, Australia. Published on DVD.
138
References Pierzynski GM, Thomas Sims J, Vance GF (2005) ‘Soils and Environmental Quality. 3rd edition’. (CRC
Press: Boca Raton Fl, USA).
Zafaralla MT, Barril CR, Santos-Borja AC, Manalili EV, Dizon, JT, Sta Ana JG, Aguilar NO (2005) Water Resources. In ‘Ecosystems and People, The Philippine Millennium Ecosystem Assessment, Sub-global assessment (Eds RD Lasco, MVO Espaldon) pp. 61-114. (EFP: CFNR, UPLB).

© 2010 19th World Congress of Soil Science, Soil Solutions for a Changing World 1 – 6 August 2010, Brisbane, Australia. Published on DVD.
139
Organic carbon in topsoil from arable land and grazing land of Europe
Vibeke Ernstsen
A, Domenico CicchellaB, Alecos DemetriadesC, Benedetto De VivoD, Enrico DinelliE, Frants von PlatenA, Clemens ReimannF, Timo TarvainenG and the EuroGeoSurveys Geochemistry Expert Group AGeological Survey of Denmark and Greenland (GEUS), Copenhagen, Denmark, Email [email protected] BUniversity of Sannio, Benevento, Italy, Email [email protected] CInstitute of Geology and Mineral Exploration, Acharnae, Hellas, Email [email protected] DUniversità di Napoli Federico II, Napoli, Italy, Email [email protected]
EUniversity of Bologna, Bologna, Italy, Email [email protected] F Geological Survey of Norway (NGU), Trondheim, Norway, Email [email protected] GGeological Survey of Finland, Espoo, Finland, Email [email protected] Abstract Knowledge about soil quality at a European scale is urgently required for e.g., the new European Chemicals Regulation, the pending EU Soil Protection Directive and, the assessment of soil as a repository of organic carbon in a changing climate. A unique data collection on total organic matter (TOC) has been established by the Geological surveys in 33 European countries, covering an area of more than 5 million km 2. The sampling density of each arable land (0-20 cm) and grazing land (0-10 cm) is of 1 site per 2500 km2. The sampling was carried out according to a jointly agreed field protocol. All samples were prepared and analysed in just one laboratory. All samples were sampled during 2008 and early 2009. For both arable land and grazing land the results show a tendency to higher contents of TOC in the northern countries, Ireland and United Kingdom than other countries, even though some local differences are present for most countries. The concentrations of TOC vary between 0.4 and 46 % w/w for arable land and between 0.4 and 49 % w/w for the grazing land. Managing soil organic matter are important for e.g., the ecosystem servicing including soil, air and water quality, fewer pollutants, productivity, and mitigation of climate change. Key Words Soils, total organic carbon, TOC, arable land, grazing land, IS 10694. Introduction The organic fraction of soils often accounts for a small but variable proportion of the total soil mass but nevertheless the organic fraction can exert a profound influence on e.g., soil properties, ecosystem functioning, and the magnitude of various ecosystem processes. The organic matter may influence the physical properties (colour, water retention, and stabilization of structure), the chemical properties (CEC, buffering capacity, pH, chelation of metals and interactions with xenobiotics) and biological properties (reservoir of metabolic energy, source of macronutrients, ecosystem resilience, stimulation and inhibition of enzyme activities) (Sumner 2000; Van-Camp et al. 2004). The need for accurate information on the organic matter content in soils at European, National or Regional level has been increasing steadily over the past few years (Van-Camp et al. 2004). Knowledge about soil quality at European scale is urgently required for e.g., the new European Chemicals Regulation, the pending EU Soil Protection Directive, assessments of soil as a repository of organic carbon in a changing climate, soil degradation and desertification. The content of TOC in one site per 2500 km2 of arable land and grazing land has been measured for soil samples collected during 2008 and early 2009. Local differences in the contents of soil organic matter are not reflected in the study but the sampling density brings about valuable information (a snapshot) about the prevailing status of soil organic matter in topsoils within 33 European countries. Methods Field sampling method and analysis
All soil samples were sampled following a jointly agreed field protocol (EuroGeoSurveys Geochemistry Working Group 2008). For each 2500 km2 one sample were collected from arable land and grazing land. Five subsamples were collected from each corner and the centre of a 10 x 10 m square and composited to provide one large sample (2-2.5 kg) which was directly placed into a Rilsan® bag. All soil samples were air
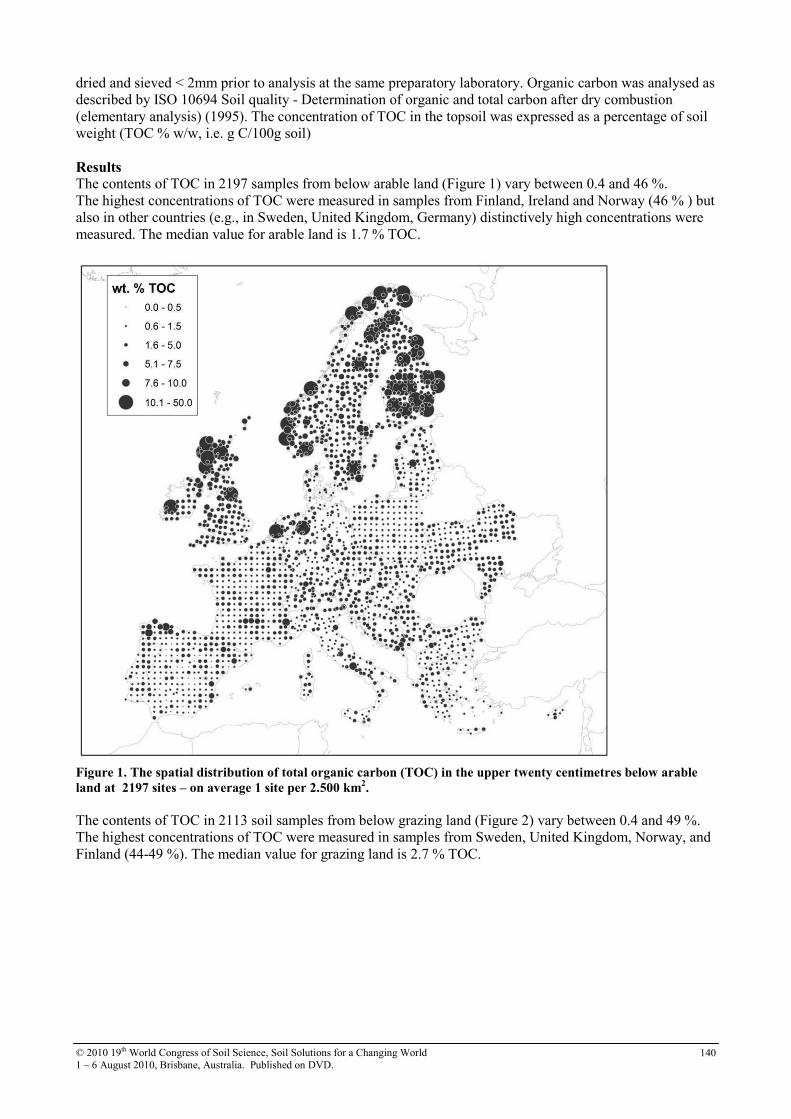
© 2010 19th World Congress of Soil Science, Soil Solutions for a Changing World 1 – 6 August 2010, Brisbane, Australia. Published on DVD.
140
dried and sieved < 2mm prior to analysis at the same preparatory laboratory. Organic carbon was analysed as described by ISO 10694 Soil quality - Determination of organic and total carbon after dry combustion (elementary analysis) (1995). The concentration of TOC in the topsoil was expressed as a percentage of soil weight (TOC % w/w, i.e. g C/100g soil) Results The contents of TOC in 2197 samples from below arable land (Figure 1) vary between 0.4 and 46 %. The highest concentrations of TOC were measured in samples from Finland, Ireland and Norway (46 % ) but also in other countries (e.g., in Sweden, United Kingdom, Germany) distinctively high concentrations were measured. The median value for arable land is 1.7 % TOC.
Figure 1. The spatial distribution of total organic carbon (TOC) in the upper twenty centimetres below arable
land at 2197 sites – on average 1 site per 2.500 km2.
The contents of TOC in 2113 soil samples from below grazing land (Figure 2) vary between 0.4 and 49 %. The highest concentrations of TOC were measured in samples from Sweden, United Kingdom, Norway, and Finland (44-49 %). The median value for grazing land is 2.7 % TOC.

© 2010 19th World Congress of Soil Science, Soil Solutions for a Changing World 1 – 6 August 2010, Brisbane, Australia. Published on DVD.
141
Figure 2. The spatial distribution of organic carbon (TOC) in the upper ten centimetres below grazing land at
2113 sites – on average one site per 2.500 km2.
Conclusion The content and distribution of TOC demonstrates considerable differences within Europe governed by differences in natural factors e.g., temperature, moisture, altitude, topography, soil parent material and human-induced factors e.g., land use and the nature of farming systems. The distribution of soil organic matter indicates large and important regional differences for the ecosystem services.
References Baldock JA, Nelson PN (2000) Soil organic matter. In 'Handbook of Soil Sciences'. (Ed. ME Sumner) pp.
B25-B84. (CRC press: Boca Raton, London, New York, Washington, D.C.).
EuroGeoSurveys Geochemistry Working Group (2008) EuroGeoSurveys Geochemical mapping of agricultural and grazing land soil of Europe (GEMAS) – Field manual. Geological Survey of Norway, Trondheim, Norway, report 2008.038
European Commission (2008) Climate change can soil make a difference? (Conference Soil and Climate Change, Brussels, Belgium, 12th June 2008) (http://ec.europa.eu/environment/soil/pdf/report_conference.pdf
Van-Camp L, Bujarrabal B, Gentile A-R, Jones RJA, Montanarella L, Olazabal C, Selvaradjou S-K (2004) Volume III – Organic matter and biodiversity. Reports of the Technical Working Groups established under the Thematic Strategy for Soil Protection. EUR 21319 EN/3, 872 pp. Office for Official Publications of the European Communities, Luxembourg
© 2010 19th World Congress of Soil Science, Soil Solutions for a Changing World 1 – 6 August 2010, Brisbane, Australia. Published on DVD.
142
Phosphorus export in runoff from a dairy pasture, laneway and watering trough Gina M. Lucci
A,B, Richard W. McDowellA and Leo M. CondronB AAgResearch, Invermay Agricultural Centre, Private Bag 50034 Mosgiel, New Zealand, Email [email protected] BAgriculture and Life Sciences, Lincoln University, P.O. Box 84 Lincoln 7647, New Zealand.
Abstract Laneways and the areas around watering troughs are areas which receive increased inputs of phosphorus (P) in the form of dung because of their frequency of use. The aims of this study were to measure runoff from these two sources with time and compare their P loading with that from the surrounding pasture. Samples were collected from May 29, 2008 until August 28, 2009 from 0.5m2 runoff plots in a dairy farmed catchment. Results show that dissolved reactive phosphorus (DRP), the most immediately available form of P to periphyton, was greatest from the lane (311mg DRP/m2/winter 1; 528mg DRP/m2/winter 2) followed by the trough (146mg/m2/winter 1; 22mg DRP/m2/winter 2) and pasture (0.2mg DRP/m2/winter 1; 0.6mg DRP/m2/winter 2) during the two winter seasons measured. During the summer months there was no significant difference in the DRP export from all sites. In addition, the DRP concentrations in runoff were strongly correlated with runoff volumes in the laneway meaning that more runoff would carry greater concentrations of DRP and a higher risk of DRP loading. We found that DRP export was much greater from both the laneway and trough compared with the pasture and these sources need to be addressed in management decisions. Key Words Phosphorus, runoff, overland flow, pasture, source. Introduction Runoff from agricultural land use is known to be a source of phosphorus (P), which is a limiting nutrient in freshwater ecosystems. Since most point sources have been identified, there has been increasing focus on diffuse sources ((Haygarth et al. 1998; McDowell and Wilcock 2004). However there exist smaller areas within the paddock at the plot scale that may act as point sources that are not well understood or represented in P export calculations, or nutrient modelling simulations. These are areas which receive disproportionately high inputs of P in the form of dung, and risk losing more P by frequent treading by livestock that can promote runoff. Treading also increases soil bulk density (Mulholland and Fullen 1991)prevents pasture growth that may filter-out P loses and leaves the soil surface susceptible to erosion. Runoff from two of these potential sources: around a watering trough and a laneway used for moving stock, have been measured in situ on a dairy catchment in the south island of New Zealand. It is expected that a better understanding of the magnitude of these potential P sources and also the mechanisms involved in P export will be gained. Methods The site used for the experiment was a dairy catchment on Pallic soil (New Zealand Soil Classification: Waitahuna silt loam (Hewitt 1998), USDA Taxonomy: Fragiochrept) on the rolling hills of Hillend, Otago, New Zealand (46° 08'S, 169° 45'E). The median annual rainfall for the area is 1000 mm and the slope ranges from 5-15°. Pastures have received annual maintenance fertilizer inputs (50 kg super P/ha and 250 kg lime/ha) for the past 15 years. Stocking density is 3 cows/ha and grazing rotations range from 3-5 weeks depending on pasture mass and climate. Runoff (or overland flow) was measured at three different areas in the same catchment: pasture, laneway and close to a watering trough. The runoff plots measured from an area 1m x 0.5m and the runoff was collected into covered buckets via garden hose. The plots were replicated three times on the lane, just downslope of a watering trough and in three areas at different hillslope positions. Runoff was collected from the 29 of May 2008 until the 28 of August 2009. The volume of runoff was measured for each plot and then analysed colorimetrically (Watanabe and Olsen 1965) for dissolved (filtered <0.45 µm) reactive P (DRP) and total P (TP) after persulphate digestion. Data analysis was done with GenStat® eleventh edition.

© 2010 19th World Congress of Soil Science, Soil Solutions for a Changing World 1 – 6 August 2010, Brisbane, Australia. Published on DVD.
143
Results and discussion DRP loading
During the first winter season, season 1 (22/5/2008-30/9/2008, Table 1) the average DRP loss was greatest from the lane (7 mg/m2) followed by the trough (4 mg/m2), with little contribution from the pasture sites (Figure 6). The cumulative loads also show that the lane was a much greater contributor to DRP in runoff than the trough even though runoff volume form the trough area was greater (Table 1, Figure 7). During the summer months, September 2008 to March 2009, little runoff occurred although rainfall occurred throughout the year (Table 1), and there was little difference in DRP load between sites.
0.5
1.0
1
1.5
3
2.0
2.5
3.0
l.s.d. (5%) 2
0.0
LN (DRP load +1)
Season
Lane
Pasture
Trough Figure 6. Average natural logarithm (mg /m2 + 1) loading values of DRP per event from the pasture, lane and
trough for three seasons 1: 22/5/2008-30/9/2008; 2: 1/10/2008-31/3/2009; 3: 1/4/2009-28/8/2009.
The second winter season, season 3 (1/4/2009-28/8/2009), was drier than the preceding. There were 10 rainfall events compared with 13 the year before and the average event size was smaller (Table 1). The average soil water deficit for the period was also much greater, decreasing the probability of saturation excess runoff. As a consequence, runoff from around the trough area was less than half of the previous winters, and the average DRP loss from the trough was 2 mg/m2. During the first winter season the trough exported 146 mg DRP/m2/season, while during the second winter season the trough exported only 22 mg DRP/m2/season. In contrast to the trough, the lane exported more DRP (311 to 528 mg/m2 in season 3) despite less runoff. The pasture sites showed little DRP loss (0.84 mg/m2) or variation with season compared with the trough and laneway. It is interesting to note that although the magnitude of DRP lost in runoff differs by three orders magnitude, the export response of the pasture and laneway is very similar while the trough has a different response altogether (Figure 7). Table 1. The rainfall, runoff and events measured during three seasons from May 2008 until August 2009 at
Hillend. The standard error of the mean (S.E.M.) is given in parenthesis below the mean event size and soil
moisture deficit.
Runoff Lane
Runoff Trough
Runoff Pasture
Rain Average event size
Average deficit
Days Events
sum (mm) (mm) (n)
Season 1 22/5/2008-30/9/2008
136 286 10 367 25 (3.3)
12 (0.6)
132 13
Season 2 1/10/2008-31/3/2009
3 29 1 365 15 (2.9)
87 (2.3)
182 9
Season 3 1/4/2009-28/8/2009
104 102 12 275 15 (2.5)
28 (3.2)
153 10
The laneway is in use almost daily and receiving regular P inputs in the form of dung from dairy cattle being taken to the milking shed or moved to different pastures. Meanwhile the pasture and trough only receive such inputs every 3-5 weeks depending on rotation, and as dung dries the potential for P loss decreases (McDowell and Stewart 2005). What this means is that more rainfall and consequently more runoff on the laneway will yield high concentrations of P, because the source is not readily diminished with each event, or is renewed between events. While in the paddock, more runoff will not necessarily lead to more P because

© 2010 19th World Congress of Soil Science, Soil Solutions for a Changing World 1 – 6 August 2010, Brisbane, Australia. Published on DVD.
144
the sources of P are variable and inputs from dung decrease with time until stock is relocated back into the paddock or fertiliser spread. By contrast the TP concentrations had a stronger correlation with runoff volumes at all sites. This is likely due to the contribution of particulate P which is not as transient as DRP in runoff.
0
0.1
0.2
0.3
0.4
0.5
0.6
0.7
0.8
0.9
0
100
200
300
400
500
600
700
800
900
mg
DR
P/m
2(p
ast
ure
)
mg
DP
R/m
2(l
an
e a
nd
tro
ug
h)
DRP loads
lane trough pasture
Figure 7. Cumulative DRP loads (mg/m
2) from the lane, trough and pasture during the whole measurement
period. Please note the different scales on the y-axis.
Conclusions Runoff from the laneway has great potential for P loading during the winter months, and even during drier winter conditions, the laneway exported high concentrations of P. The loading from the trough area was much more variable and subject to weather conditions and consequently exported much less DRP during a drier winter. Nonetheless both these point sources exported much greater loads of DRP than the pasture. More research needs to be done to see how great an effect these loads have on adjacent waterways. References Haygarth PM, Hepworth L, Jarvis SC (1998) Forms of phosphorus transfer in hydrological pathways from
soil under grazed grassland. European Journal of Soil Science 49, 65-72.
Hewitt AE (1998) 'New Zealand soil classification.' (Manaaki Whenua, Landcare Research: Lincoln).
McDowell RW, Stewart I (2005) Phosphorus in fresh and dry dung of grazing dairy cattle, deer, and sheep: sequential fraction and phosphorus-31 nuclear magnetic resonance analyses. J Environ Qual 34, 598-607.
McDowell RW, Wilcock RJ (2004) Particulate phosphorus transport within stream flow of an agricultural catchment. Journal of Environmental Quality 33, 2111-2121.
Mulholland B, Fullen MA (1991) Cattle trampling and soil compaction on loamy sands. Soil Use and
Management 7, 189-193.
Watanabe FS, Olsen SR (1965) Test of an ascorbic acid method for determining phosphorus in water and NaHCO3 extracts from soil. Soil Soc. Am. Proc. 29, 677-678.

© 2010 19th World Congress of Soil Science, Soil Solutions for a Changing World 1 – 6 August 2010, Brisbane, Australia. Published on DVD.
145
Phosphorus inflow into agricultural and urban soil: the perspective from food
production and consumption in China
Gui-Lin LiA,C, Shen YuA, Xuemei BaiB and Yong-Guan ZhuA A Key Lab of Urban Environment and Health,Institute of Urban Environment, Chinese Academy of Sciences, Xiamen, China B CSIRO Sustainable Ecosystems, Canberra, Australia CCorresponding author. Email [email protected] Abstract In this study, phosphorus (P) concentration in 201 types of food consumed daily by urban households was collected to calculate P inflow into urban soil through food consumption over the period of 1985-2006 in China. It indicates that 3.87 million tonnes of dietary P have been accumulated in urban soil over the 1985-2006 period, which accounted for 53.53% of total dietary P inflow. Further analysis shows that it is of low efficiency of P utilization in food chain process from field to Table, including: (1) to produce 1 kg food P (edible part) will cost 9 kg mineral P fertilizer input into agricultural soil; (2) Among this 1kg food P, about 0.6 kg flow into urban area through food consumption, in which 0.3 kg will be disposed and the other o.3 kg will be recycled in urban area, mainly in urban soil, i.e. 50% food P inflow through urban food consumption eventually remained in urban area. Key Words Phosphorus recycling, food consumption, phosphorus utilization efficiency, urban geochemistry. Introduction The migration of large population into cities suggests food consumption is increasingly concentrated in the urban area, implying more phosphorus(P) are being imported into urban area through food consumption. Part of the imported P is then released into peri-urban environments through wastewater discharge and sludge disposal. Other part is enriched in urban soil and aquatics. Currently, global annual consumption of P is approximately 12 Mt, of which 90% is for food production (Smil 2000). Consequently, about 0.27 Mt P from food consumption per year might be imported into urban area globally based on our estimation (UN-DESA 2008; Cordell et al. 2009; Chen et al. 2008; Gao et al. 2009). It appears the amount of P flow into urban area is marginally comparable to P storage in agricultural soil and outflow into ocean. However, the environment consequence can be very significant since urban area occupies only less than 3% of the global terrestrial area (Grimm et al. 2008). The increasing dietary P inflow into urban area could be a very significant factor contributing to the increasing eutrophication in urban soil in China (Zhang et al. 2007; Yuan et al. 2007). In this study, the flow and mass balance of urban dietary P in China were analyzed at national scale (excluding Hong Kong, Macao, and Taiwan). Our purpose was to manifest the spatio-temporal trend of dietary P consumed by urban household and the accumulative amount remained in urban built-up area during the urbanization process.
Methods Data
The key datasets are from first-hand national food consumption survey and related official statistics and reports. The data on urban dietary P flow analysis were obtained from various sources and subjected to rigorous cross checking before analysis.
Method
The dietary P flows into urban system from natural ecosystem through urban household consumption and out of urban system through waste disposal (Figure 1). P flow in food import and export has been considered.

© 2010 19th World Congress of Soil Science, Soil Solutions for a Changing World 1 – 6 August 2010, Brisbane, Australia. Published on DVD.
146
Edibl
e part
Discharge as untreated sewage (TPsewageout)
Sludge discharge
Discharge as treated sewage
Marginally left in human body (ignored)
Reclaimed water discharge
(TPremained)
P flow outside
Inedible
part
Solid waste
Phosphorus inflow into urban system from
agriculture (TPinflow)
Food waste
Pass throughout urban area and to Landfill
P remained in urban area (urban soil)
Non-urban
system
Urban
system
Landfill
Figure 1. Conceptual model of urban dietary P flow into and out of urban area.
According to the conceptual model illustrated in Figure 1, the following formulas were established to determine the amount of urban dietary P flow into and out of urban area:
TPremained = TPinflow - (TPsewageout + TPsludgeout) * f Eqs.(1) Where, TPremained, TPinflow, TPsewageout, and TPsludgeout are illustrated in Figure 1. f (50%) is the fraction of household sewage in municipal sewage drainage system (Yang et al. 2006).
TPinflow = Nup * Pcd * 365 Eqs. (2) Where, Nup is the total urban population (10000 persons), Pcd is the per capita daily dietary P consumed by urban household (g P2O5/d/capita), which is calculated as
Pcd = ∑(Qcd * CPfood) Eqs. (3) Here, Qcd is the per capita daily consumption of a certain group of food by urban household (g edible part/capita/d), and CPfood is the P concentration in edible part of a certain group of food (g P2O5 / g edible part of food).
TPsewageout = D *(1-R)* Cuntreated Eqs. (4) Where, D is the discharge volume of urban household sewage per annum (10000 tonnes), R is the urban household sewage treatment rate per annum (%), and Cuntreated is the P concentration in untreated urban household sewage (mg/L).
TPsludgeout = D * R * (Cuntreated - Callowed) Eqs. (5) Where Callowed is the maximal P concentration allowed in discharged reclaimed water after treatment (mg/L) and Cuntreated is the P concentration in untreated discharge (mg/L). Results Dietary P consumption by urban households
In average, 3.68 g P2O5 was imported into urban area by per urban capita per day through food consumption during 1985-1992. The number slightly decreased to 3.45 g P2O5 per urban capita per day in 1993-2006 (Table 1), which is mainly due to the change in P concentration in food and food consumption structure.
Table 1. P concentration and consumption of each group of food
CPfood (P2O5 g /100g edible part)
Qcd (g/capitaday-1)
Pcd
(P2O5 g/capitaday-1) Qcdin HK
(g/capita/d) (A) 1985-1992 1993-2006 1985-1992 1993-2006 1985-1992 1993-2006 1997 Cereals 0.48 0.33 432.00 356.50 2.07 1.18 303.8 Potato tubers 0.08 0.14 56.00 30.50 0.04 0.04 n.a. (B) Vegetables 0.22 0.10 310.50 259.50 0.68 0.26 206.3 Fruits 0.05 0.05 74.00 73.50 0.04 0.04 292.9 Animal meat 0.47 0.40 61.13 61.50 0.29 0.25 Poultry meat 0.37 0.35 20.38 23.50 0.08 0.08
352.3
Milk products 0.55 0.82 23.00 73.50 0.13 0.60 231.8 Poultry eggs 0.47 0.41 22.50 192.50 0.11 0.79 n.a. Fishes 0.74 0.59 33.00 36.00 0.24 0.21 160.0 Sum 3.68 3.45
(A) calculated according to Warren-Rhodes et al.(2001); (B) n.a. means not available;

© 2010 19th World Congress of Soil Science, Soil Solutions for a Changing World 1 – 6 August 2010, Brisbane, Australia. Published on DVD.
147
Mass balance of dietary P flow in urban area
The annual inflow of P (calculated as P2O5, thereafter) by urban dietary consumption increased from 218.23×10³ tonnes in 1985 to 491.29×10³ tonnes in 2006 for China (Figure 2). In total, 7225 ×103 tonnes of dietary P through urban household consumption has been imported into urban area in China during 1985-2006. About 3873 ×103 tonnes of dietary P, i.e. 53.60% of total dietary P from urban household consumption, have been eventually remained in urban area over the 1985-2006 period.
Figure 2. Annual dietary P import into and
export from urban area and hence the formation
of P-trapping island in urban area in China.
Figure 3. Comparison of per unit area load of urban dietary P
in urban area to that of P fertilizer application in agricultural
land. (A)
Load of urban dietary P inflow on per unit of urban
built-up area; (B)
Load of urban dietary P eventually left on per
unit of urban built-up area; (C)
Load of chemical P fertilizer on
per unit area of cultivated land.
Temporal trends of dietary P inflow intensity
Figure 3 indicates that inflow intensity of urban dietary P was much higher than that of chemical P fertilizer application on agricultural soil in China over the period of 1985-2006, suggesting that urban ecosystem was heavily burdened by the considerable inflow of dietary P. For instance, in 2006, the total dietary P inflow into cities is 0.06 times as much as the P fertilizer consumption, in contrast, the urban built-up area is only 0.02 times as large as the agricultural land area. Low efficiency of P utilization in food chain system
The production efficiency of food P is defined as input amount of fertilizer P to produce per unit food P. From Figure 4, to produce 1 kg food P2O5 will cost 9 kg mineral P fertilizer input, suggesting the food production efficiency of P is only 11% in China’s food production systems. Low efficiency of fertilizer P to produce food suggests to increase the risk of environmental eutrophication by P in food production process. For example, to produce 1 kg food P2O5 will cause the of 1 kg P2O5 released into aquatic environment, 2 kg P2O5 lost (crop discard) into natural environment, and another 5 kg P2O5 reserved in agricultural soil.
Figure 4. Phosphorus flow from chemical fertilizer to food in 2006 in China. note: (1) Unit: kt (kilo ton) P2O5; (2) Dash
line means the source and the fate of flow. Solid line means the flow amount of P; (3) The number in black box means the
relative value to the amount of food P consumption
export (82 kt) 1.1%
Urban consumption (491.3 kt) 6.4%
Import food (edible part) 47 kt
Foreign countries
Out of urban area (256.9 kt) 0.3
Remained in urban area (234.4 kt) 0.3
Rural consumption (289 kt) 3.7% 0.4
Food consumption system
Food (edible part) (815.3 kt) 10.6%
1
Atmosphere (6.5 kt) 0.1%
Industrial use (249 kt) 3.2%
crops
Fertilizer input (7707 kt) 100% 9
Water (889 kt) 11.5% 1
Arable soil sink (3864.5 kt) 50.1% 5
Crops discard (1836 kt) 23.8% 2
Food production system

© 2010 19th World Congress of Soil Science, Soil Solutions for a Changing World 1 – 6 August 2010, Brisbane, Australia. Published on DVD.
148
The recycling efficiency of food P after consumption means the ratio of the amount of food P consumed by urban population and then recycled to agricultural soil as waste to the total inflow of food P into urban area. In China in 2006, about 60% of food P2O5 is consumed in urban area, in which about half was remained in urban area, mainly in urban soil. For instance, about 234.4 kilo tons of P2O5 was remained in urban soil in China in 2006. Therefore, it’s really necessary to find ways to increase utilization efficiency of P in food production process and recycling rate of food P in urban system. Conclusion It’s concluded that the heavy P accumulation in urban area of China, which results in the “P Island” at regional and national scale. The accelerating urbanization in the coming decades means more dietary P will be imported into urban soil, which will exacerbate a series of environmental problems. The key problem is the low efficiency of P use in the whole food chain process from field to Table. The potential solutions are to increase P use efficiency in food production process and develop techniques to increase extracting rate of P from household sewage and make fertilizer products from the extracted P. References Smil V (2000) Phosphorus in the environment: natural flows and human interferences. Annual Review of
Energy and the Environment 25, 53-88. Cordell D, Drangert JO, White S (2009) The story of phosphorus: Global food security and food for thought.
Global Environmental Change 19, 292-305. Zhang GL, Zhao YG, Yang JL, et al.(2007) Urban soil environment issues and research progresses. Acta
Pedologica Sinica 44, 925-933. Yuan DG, Zhang GL, Gong ZT, Burghardt W (2007) Variation of soil phosphorus accumulation in Naning,
China as affected by urban development. Journal of Plant Nutrition and Soil Science 170, 244-249. Chen M., Chen J, Sun F (2008) Agricultural phosphorus flow and its environmental impacts in China.
Science of the Total Environment 405, 140-152. Gould BW, Villarreal HJ (2006) An assessment of the current structure of food demand in urban China.
Agricultural Economics 34, 1-16.

© 2010 19th World Congress of Soil Science, Soil Solutions for a Changing World 1 – 6 August 2010, Brisbane, Australia. Published on DVD.
149
Present use and physical properties relationships in soils under mediterranean
semiarid conditions Roque Ortiz SillaA, Antonio Sánchez NavarroA, María José Delgado IniestaA, Purificación Marín SanleandroA, Arantzazu Blanco BernardeauA and Juana Mari Gil VázquezA ADepartment of Agricultural Chemistry, Geology and Pedology, Faculty of Chemistry, University of Murcia, Murcia, Spain, Email [email protected]
Abstract Physical soil properties have been widely proposed as an indicator of soil quality. The aim of this study was identify the relationships between physical soil properties and present uses. Attending to the high level of soil degradation and the stressful environmental characteristics, the Mazarrón area (S.E. Spain) was selected for this study. Structural stability, bulk density, texture and available water were analysed for forty-one soil samples from the study area. Physical soil parameters were correlated with soil uses and a strong relationship between structural stability and soil uses was observed. Key Words Soil physical properties, soil use, soil quality, semiarid soil. Introduction An appropriate characterisation of physical properties is considered necessary for soil quality evaluation (Singer and Ewing 2000). The physical properties that can be used for the development of soil quality index are those able to modelling the mechanisms of collecting and storage of soil water and its transmission to the plants, in addition to other soil functions as the improvement of root growing and plant shoots and the infiltration or water dynamic within the soil profile, closely correlated with pore size and distribution. Water retention and storage capacity, the structural stability (De Ploey and Poesen 1985) and texture were the physical characteristics selected as soil quality indicators in the study area. An area of Murcia Region prone to soil physical degradation due to environmental conditions and human pressure were selected for this study. In addition, the study area shows a high variability in soil types and mineralogy (Delgado 1998), with soil developed from igneous metamorphic and sedimentary materials. Likewise, soil uses experienced many changes in recent years (Muñoz 1998). The objective of this study was to study the relationships between soil physical properties and present land use. Methods Field methods
From the area in the sheet 976 of the Mazarrón SoilMap 1:50.000, forty-one surface oil samples (0-30 cm.) were taken according to a regular net of 3 x 3 m. Each soil sample was constituted by three mixed sub-samples. For the data processing soils were classified in four groups as present use: natural vegetation, cropland, grassland and urban-industrial. Laboratory methods
Soils were classified following the “World Reference Base for Soil Resources 2006” (FAO-ISRIC-IUSS, 2006). Surface soil samples (0-30 cm) for laboratory analysis were sieved through 2 mm mesh. Additionally, undisturbed soil cores were collected using sample rings (5-cm diameter and 5-cm height). The following physical parameters were determined: Soil texture was analysed following the method described in Soil Survey Report Nr.1 (Soil Conservation Service, 1972). Structural stability was determined through the percentage of (0.2-4 mm) stable aggregates of the soil subjected to a simulated rainfall of 150 mm and 270 J/m2 energy (Lax et al. 1994). Bulk density was determined from the undisturbed soil core samples dried in a oven at 105 ºC and weighed (Henin et al. 1969). Real density was determined through the volume of removed water after submerging a known weight of soil within a gauged glass vessel. Porosity was calculated from bulk and real density values. Water retention capacity was determined by membrane method (Richards, 1941) at 1/3 atm (field capacity) and 15 atm (wilting point). Available Water (AW) was considered the difference between water retained at pF 1/3 and 15 atm.

© 2010 19th World Congress of Soil Science, Soil Solutions for a Changing World 1 – 6 August 2010, Brisbane, Australia. Published on DVD.
150
Statistical methods
Analytical results were processed through a basic descriptive statistic using the SPSS 15.0 program for Windows. Results A strong relationship between structural stability and soil use was observed. In this ay, the non cultivated soils showed 75% of stable aggregates, while in the cropland soils this average decreased to 44% (Table 1). This reduction must be due to continuous destruction of soil structure as a consequence of agricultural practice such as tillage, the use of heavy machinery, the decrease of organic matter, among other factors. Likewise, a decrease of stable aggregates occurred in grassland due to cattle treading which led to soil compaction and structural degradation.
Table 1. Soil use and percentage of stable aggregates.
Soil use Nº samples S.A % Cropland 14 43,9 Natural vegetation 22 74,2 Grasland 3 63,4 Urban /industrial 2 49,5 Total 41
On the contrary, no relationship was observed between bulk density and soil use as it occurred with the porosity (Table 2). So in the soils with natural vegetation the porosity was the highest (30%), while in the cropland and urban soils the porosity was similar (26%). Table 2. Real density, bulk density and porosity according to soil use.
Soil use Nº samples Bulk density (gr cm3) Real density (gr cm3) Porosity (%) Cropland 14 1,26 1,71 26 Natural vegetation 22 1,21 1,75 30 Grasland 3 1,23 1,72 28 Urban/industrial 2 1,26 1,71 26 Total 41
The particle-size distribution did not show differences among the uses, being the particle-size fraction averages very similar in all the uses. Only in urban soils a small increase can be observed in the sand fraction (Table 3). Table 3. Contents granulometric as soil use.
Soil use Nº samples % Sand % Silt % Clay Cropland 14 42,8 39,8 17,3 Natural vegetation 22 49,7 36,2 14,2 Grasland 3 46,2 40,0 13,8 Urban/industrial 2 57,2 30,0 12,8 Total 41
Likewise, no differences were found between water retention capacity and soil use. The pF values both at “field capacity” (pF=1/3atm) and at “wilting point” (pF=15atm) were very similar in all the uses. As a consequence of this, the soil available water was not affected by the soil use (Table 4). Table 4. pF 15, pF 1/3 and available water according to soil use.
Use Nº samples pF 1/3 pF15 A.W (%) Growing 14 24,1 9,4 14,7 Natural 22 23,8 10,9 12,9 Pasturage 3 26,8 11,5 15,4 Urbanized/industrial 2 25,3 10,0 15,3 Total 41

© 2010 19th World Congress of Soil Science, Soil Solutions for a Changing World 1 – 6 August 2010, Brisbane, Australia. Published on DVD.
151
Conclusion Structural stability was the physical property that showed the highest sensitivity as a soil quality index in these soils. The average stable aggregate percentage was higher than 50% and was strongly linked to soil use in the study area. The soils under natural vegetation preserved from anthropic perturbation showed the highest structural stability. Cropland and urban soils were poorly structured and in grassland the structure was acceptable. The water retention capacity and available water did not show differences among the soil uses and can not be used, for this soil as a soil quality indicator. Acknowledgements To the Ministerio de Ciencia and Investigación for making possible the development of the research project "Indicators for Environmental Quality Evaluation in Semiarid Mediterranean Ecosystems. Risks of soil degradation and prevention and regeneration measures” (CGL-2006-11635) inside which the studies of this paper are framed.
References De Ploey J, y Poessen J (1985) Aggregate stability, runoff generation and interrill erosion. In
‘Geomorphology and Soils’. ( Eds KS Richards, RR Arnetty, S. Ellis) pp. 99-120. (Allen and Unwin: Londres).
Delgado Iniesta MJ (1998) Suelos y vegetación de los afloramientos volcánicos neógenos de la zona litoral de sureste peninsular. Tesis Doctoral, Departamento de Biología vegetal y Química Agrícola, Geología y Edafología. Universidad de Murcia. Murcia.
FAO-ISRIC-IUSS (2006) ‘World Reference Base for Soil Resources 2006. World Soil Resource Reports nº 103’. (FAO: Roma).
Hénin S, Gras R, et Monnier G (1969) ‘Le Profil Cultural’. (Masson et Cie: Paris). Lax A, Díaz E, Castillo V, et Albaladejo (1994) Reclamation of physical and chemical properties of a
salinzed soil by organic amendment. Arid Soil and Rehabilition 8, 9-17. Muñoz García MA (1998) Variaciones en las tendencias agronómicas de Mazarrón (Murcia) en los últimos
veinte años. Proyecto fin de carrera. E.T.S. de Ingenieros Agrónomos de Cartagena. Universidad de Murcia.
Richards (1947) Pressure-Membrana apparattus construction and use. Agricultural Engineering 28, 451-54. Singer MJ, y Ewing S (2000) Soil Quality. In ‘Handbook of Soil Science. Chapter 11’ (Ed ME Sumner) pp.
271-298 (CRC Press: Boca Raton, Florida). Soil Conservation Service (1972) ‘Soil Survey Laboratory Methods and Procedures for Collecting Soils
Samples, Soil Survey Report, 1’. (USDA: Washington).

© 2010 19th World Congress of Soil Science, Soil Solutions for a Changing World 1 – 6 August 2010, Brisbane, Australia. Published on DVD.
152
Quantifying the relative contribution of hillslope and channel erosion in water
reservoir catchments of subtropical South East Queensland, Australia Joanne BurtonA, Tim PietschA, Jon OlleyA, James UdyB and Kate SmoldersB AAustralian Rivers Institute, Griffith University, Nathan, Queensland, Email [email protected] BSeqWater, Brisbane, Queensland. Soil erosion in a water reservoir catchment raises a number of issues for reservoir managers including the potential for a reduction in the water storage capacity of the reservoir through sediment deposition and a decline in water quality as a result of increased turbidity and/or the transport of pollutants absorbed to the sediment. In South East Queensland (SEQ) many of the water reservoirs are located in agricultural catchments. Hence erosion can also lead to issues including loss of valuable topsoil and associated nutrients (hillslope erosion) and loss of valuable farming land (channel erosion). Managing erosion of soils and sediments is therefore an important issue for water authorities and land managers in the region. Successful management of soil erosion is dependent on understanding the sources and causes of the erosion. Erosion processes within a catchment can be influenced by factors such as climate, geology, landuse, and land management (Rose 2004). Sediments may originate from the erosion of hillslopes, and from gully and stream bank erosion (channel erosion). At the local level, it is common for either hillslope or channel erosion to clearly be the dominant erosion process. The management of these two erosion types differs. Channel erosion is best managed by preventing stock access to streams, protecting vegetation cover in areas prone to channel erosion, revegetating bare banks, and reducing sub-surface seepage in areas with erodible sub-soils (Rutherfurd et al. 2000). Hillslope erosion is best managed by promoting groundcover, maintaining soil structure, and promoting deposition of eroded sediment before it reaches the stream (Marshall et al. 1996). It is therefore important to be aware of the dominant source of erosion before attempting local or catchment-wide management to control it. Sediment tracing techniques are useful methods to determine erosion sources within the landscape. The fallout radionuclide tracing method can be used to assess the relative contribution of hillslope and channel erosion to stream sediments by measuring differences in activity concentrations and ratios between Caesium-137 (137Cs), which is anthropogenic, and naturally-occurring and excess fallout Lead-210 (210Pbex) (Motha et
al. 2002; Olley et al. 2001; Wallbrink and Murray 1993). Whilst the characteristics of the spatial source of erosion can be determined by measuring major and trace elements using X-ray fluorescence (XRF) (Olley et
al. 2001). The objective of this study is to examine the erosion processes generating sediment in three water reservoir catchments of South East Queensland with different landuses and geologies. Traditionally, the characterisation of sediment delivered to waterways during rainfall events has been conducted on channel lag deposits collected after the event. This study is unique in that suspended sediment samples were collected from streams during the event and therefore changes in the source of sediment throughout the event can be identified. These samples, collected from seven event monitoring stations in three water storage catchments, together with samples of potential source materials are currently being analysed for fallout radionuclides (137Cs and 210Pb) and major trace elements (by X-ray fluorescence (XRF)). The results of this study and their implication for the management of erosion in these catchments will be presented and discussed. References Motha JA, Wallbrink PJ, Hairsine PB, Grayson (2002) Tracer properties of eroded sediment and source
material. Hydrological Processes 16, 1983-2000. Marshall T, Holmes J, Rose CW (1996) 'Soil Physics'. (Cambridge University Press: New York). Olley J, Caitcheon G, Hancock G, Wallbrink P (2001) 'Tracing and Dating Techniques for Sediment and
Associated Substances'. (CSIRO: Land and Water, Canberra). Wallbrink PJ, Murray AS (1993) Use of fallout radionuclides as indicators of erosion processes.
Hydrological Processes 7, 297-304. Rose CW (2004) 'An introduction to the environmental physics of soil, water and watersheds'. (Cambridge
University Press: New York). Rutherfurd I, Jerie K, Marsh N (2000) 'A rehabilitation manual for Australian streams'. (CRC for Catchment
Hydrology: Land and Water Resources Research and Development Corporation).

© 2010 19th World Congress of Soil Science, Soil Solutions for a Changing World 1 – 6 August 2010, Brisbane, Australia. Published on DVD.
153
Reducing nitrate leaching losses by using duration-controlled grazing of dairy
cows Christine L. ChristensenA, James A. HanlyA, Mike J. HedleyA and Dave J. HorneA AFertilizer and Lime Research Centre, Massey University, Private Bag 11222, Palmerston North, New Zealand Abstract Duration-controlled grazing practices, in conjunction with the use of cow housing and/or feed-pad facilities, reduce both the time that cows spend in paddocks and the quantity of excreta deposited in paddocks. Therefore, duration-controlled grazing has the potential to reduce nitrate-N leaching into New Zealand waterways. Excreta is collected from the stand-off facilities and spread evenly back on to paddocks. A large scale, long term field trial is currently being carried out at Massey University’s No. 4 Dairy Farm to investigate the effect of duration-controlled grazing of cows on the concentrations of nitrate-N in drainage water. Other parameters being measured are phosphorus and faecal indicator organism concentrations in surface runoff water, pasture accumulation and estimated cow intakes. After one full year of grazing treatments, a large reduction in nitrate-N concentrations in drainage has been achieved through using duration-controlled grazing practices. Halving the average amount of time that cows spent on pasture, over the 2008/09 lactation season, reduced nitrate leaching by 41% (by 5.2 kg NO3
- -N /ha) compared with the standard grazing treatment (where losses were 12.6 kg NO3
- -N /ha). Duration-controlled grazing during summer and autumn is likely to have the larger influence on reductions in nitrate leaching compared with duration-controlled grazing during winter and spring. This study confirms that duration-controlled grazing is an effective strategy for reducing the transfer of N from dairy farms to surface waters. Key Word Nitrate leaching, duration-controlled grazing practices. Introduction Dairy farming in New Zealand is based predominantly on grazed pastures, resulting in low cost milk production compared with other more intensive feed supply systems (Holmes et al. 2007). However, these pastoral based dairy farms are a major contributor to the contamination of surface waters through nitrogen (N) and phosphorus losses (P) from leaching and surface runoff, respectively (Sharpley and Syers, 1979). The greatest N losses arise from the urine patches that cows deposit when grazing (Ledgard and Menneer, 2005; Silva et al. 1999). The concentrations of N in urine patches are too high (approximately 600-1000 kg N/ha; (Di and Cameron 2002; Haynes and Williams 1993), for plants to utilise the N fully, and the excess is prone to leaching as nitrate when drainage occurs (de Klein, 2001; Di and Cameron, 2002; Ledgard and Menneer, 2005; Silva et al. 1999). One way of reducing the N leaching losses from grazing is by adopting duration-controlled grazing practices, which involve limiting the time cows spend in paddocks between milkings by removing them to housing or a feed-pad to receive supplementary feed (de Klein et al. 2000). This practice decreases the number of dung and urine patches distributed to the paddock, and hence, reduces the potential for N leaching and P runoff. The added effluent collected from the animal shelter can then be stored and returned to paddocks when conditions are favourable (de Klein, 2001). This excreta is spread evenly and at nutrient rates and timings that match plant uptake (Chadwick et al. 2002). Several duration-controlled grazing studies have been conducted in overseas countries, however there have been no long-term experiments performed in New Zealand to confirm the long term impacts of this duration-controlled grazing. Short-term studies and modelling work have been completed in New Zealand surrounding the practice. These studies indicate that N leaching decreases under duration-controlled grazing (de Klein and Ledgard, 2001; de Klein et al. 2006). Therefore, a large-scale, long-term field experiment has been established at Massey University’s No. 4 Dairy Farm, in the Manawatu region of New Zealand, to quantify a range of impacts under duration-controlled grazing practices. These impacts include; N concentrations in drainage, P concentrations and faecal indicator organisms in surface runoff water, and pasture accumulation and subsequent cow intakes. This paper presents the nitrate-N losses in drainage water from the 2009 drainage season (up to early October 2009), after one full year of grazing treatments.
© 2010 19th World Congress of Soil Science, Soil Solutions for a Changing World 1 – 6 August 2010, Brisbane, Australia. Published on DVD.
154
Methods Trial site
A three year field trial has been established on Massey University’s No. 4 Dairy Farm near Palmerston North, Manawatu, New Zealand (NZMS 260, T24, 312867). The trial site is located in a flat landscape (c. <3% slope) which receives an average annual rainfall of approximately 1000 mm. The site supports a mixed pasture sward of perennial ryegrass (Lolium perenne) and white clover (Trifolium repens) on a mole-pipe drained Tokomaru silt loam soil, an Argillic-fragic Perch-gley Pallic Soil (Hewitt, 1998). The research area consists of fourteen plots (average area 850 m2/plot), each with an isolated mole and pipe drain system. Mole channels were installed at 2 m intervals at a depth of 0.45 m. Drainage from the mole channels is intercepted by a pipe drain (0.11 m diameter), which was installed perpendicular to the moles at a depth of 0.60 m. Further description of the topography and soil properties of the site are provided by Houlbrooke et al. (2004).
Experimental design
The trial consists of two treatments; one being a Standard Grazing (SG) treatment which involves a grazing duration of ~6 hours for day grazings and ~12 hours for night grazings. The other treatment is a Duration-controlled Grazing (DCG) treatment which involves a grazing duration of ~ 4 hours for both day and night grazings. Plots for both treatments are grazed on the same day with the same average stocking rate, which is determined by pasture cover estimated using a rising-plate pasture height meter. Grazings are alternated between day and night to create the average grazing duration difference between the two treatments that would occur over a year (~11 grazings/year). The trial was established during the summer of 2008 and the drainage season that year began on 25 June. Grazing treatments commenced on 3 September during the first grazing rotation of the 2008/09 lactation season. The final grazing for that lactation season was on 29 May 2009. In 2009, three drainage events occurred between 13 February 2009 and 2 March 2009, which is not typical for this time of the year in the Manawatu, and the winter drainage began on 15 May 2009. Grazing of the trial area for the 2009/10 lactation season commenced on 8 September 2009. At each grazing, cows are provided a target of 5-6 kg DM/cow as grazed pasture from the treatment plots and another 2-3 kg DM/cow from another source. Prior to each grazing the SG cows are fed 2-3 kg DM/cow as supplementary feed on a feed pad and then grazed on the SG plots to obtain a further 5-6 kg DM/cow. The DCG cows first receive 5-6 kg DM/cow from grazing DCG plots and then after 4 hours are removed to receive the remainder of their feed requirements elsewhere, to simulate their return from grazing to a standoff facility. In 2008, all plots received N fertiliser (urea) at a rate of 30 kg N/ha in mid-September and again in mid-November. Superphosphate was applied to all plots at a rate of 30 kg P/ha in mid-November 2008. In 2009, all plots received N fertiliser at 25 kg N/ha, as urea, in early-August and 30 kg N/ha, as sulphate of ammonium, in mid-September. An application of slurry, sourced from excreta deposited on the farm feed-pad, was applied to DCG plots in mid-December 2008, at an average application depth of ~7.5 mm, which applied on average, 181, 41 and 61 kg/ha of N, P and K, respectively. The slurry was applied to plots to return the approximate amount of manure that would have been collected from standoff facilities from the use of duration-controlled grazing.
Drainage water volume measurements and water analysis
Drainage water from plots is channelled through drainage pipes into tipping-bucket flow meters located in sampling pits nearby. Each tipping-bucket was calibrated dynamically to account for higher tip volumes at higher flow rates. All tipping buckets were instrumented with data loggers to provide continuous measurements of flow rate. During each drainage event a proportion (c. 0.1%) of the drainage water from every second tip of the tipping bucket flow meter was automatically collected to provide a volume-proportioned, mixed sample for water quality analysis. Drainage water samples were filtered through a 0.45 µm filter and the filtrate analysed for nitrate-N (NO3
--N) and ammonium-N (NH4+-N) using colorimetric
methods on a Technicon Auto Analyser (Blakemore et al. 1987).
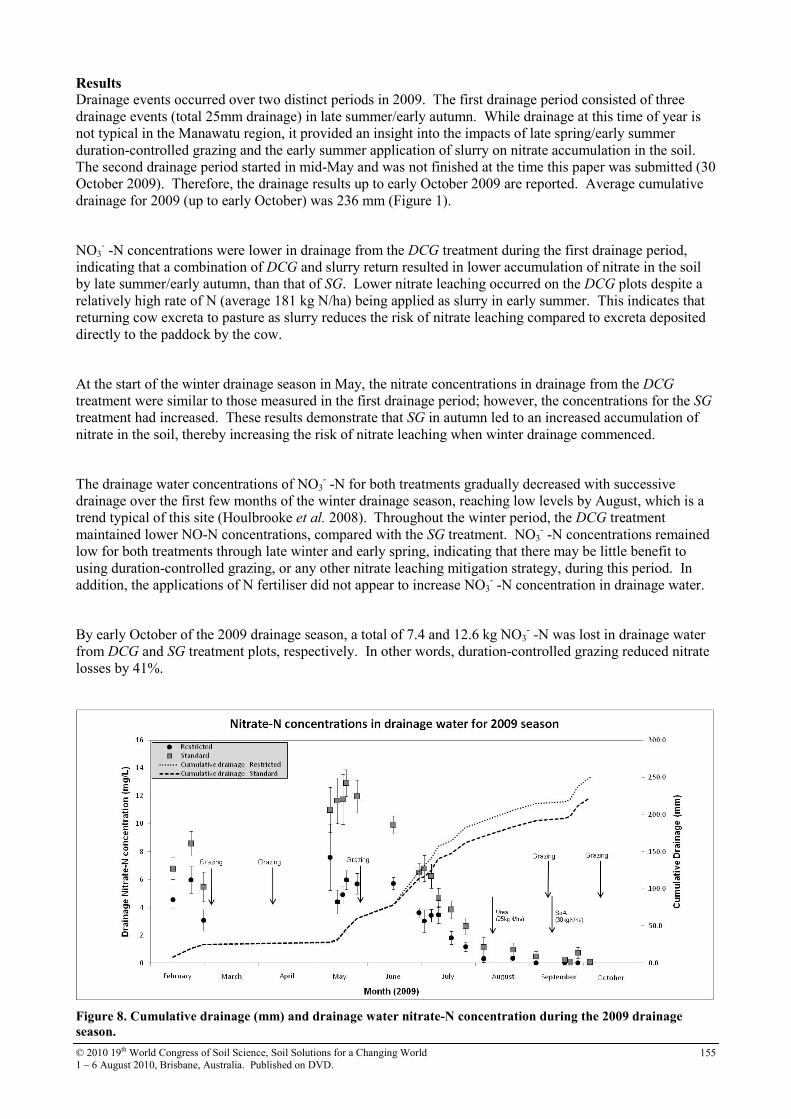
© 2010 19th World Congress of Soil Science, Soil Solutions for a Changing World 1 – 6 August 2010, Brisbane, Australia. Published on DVD.
155
Results Drainage events occurred over two distinct periods in 2009. The first drainage period consisted of three drainage events (total 25mm drainage) in late summer/early autumn. While drainage at this time of year is not typical in the Manawatu region, it provided an insight into the impacts of late spring/early summer duration-controlled grazing and the early summer application of slurry on nitrate accumulation in the soil. The second drainage period started in mid-May and was not finished at the time this paper was submitted (30 October 2009). Therefore, the drainage results up to early October 2009 are reported. Average cumulative drainage for 2009 (up to early October) was 236 mm (Figure 1).
NO3- -N concentrations were lower in drainage from the DCG treatment during the first drainage period,
indicating that a combination of DCG and slurry return resulted in lower accumulation of nitrate in the soil by late summer/early autumn, than that of SG. Lower nitrate leaching occurred on the DCG plots despite a relatively high rate of N (average 181 kg N/ha) being applied as slurry in early summer. This indicates that returning cow excreta to pasture as slurry reduces the risk of nitrate leaching compared to excreta deposited directly to the paddock by the cow.
At the start of the winter drainage season in May, the nitrate concentrations in drainage from the DCG treatment were similar to those measured in the first drainage period; however, the concentrations for the SG
treatment had increased. These results demonstrate that SG in autumn led to an increased accumulation of nitrate in the soil, thereby increasing the risk of nitrate leaching when winter drainage commenced.
The drainage water concentrations of NO3- -N for both treatments gradually decreased with successive
drainage over the first few months of the winter drainage season, reaching low levels by August, which is a trend typical of this site (Houlbrooke et al. 2008). Throughout the winter period, the DCG treatment maintained lower NO-N concentrations, compared with the SG treatment. NO3
- -N concentrations remained low for both treatments through late winter and early spring, indicating that there may be little benefit to using duration-controlled grazing, or any other nitrate leaching mitigation strategy, during this period. In addition, the applications of N fertiliser did not appear to increase NO3
- -N concentration in drainage water.
By early October of the 2009 drainage season, a total of 7.4 and 12.6 kg NO3- -N was lost in drainage water
from DCG and SG treatment plots, respectively. In other words, duration-controlled grazing reduced nitrate losses by 41%.
Figure 8. Cumulative drainage (mm) and drainage water nitrate-N concentration during the 2009 drainage
season.
© 2010 19th World Congress of Soil Science, Soil Solutions for a Changing World 1 – 6 August 2010, Brisbane, Australia. Published on DVD.
156
Conclusion Restricting the time cows spend in the paddock, and therefore reducing urine deposition in the paddock, has markedly decreased NO3
- -N leaching losses from a mole and pipe drained soil. In particular, duration-controlled grazing in the summer and autumn periods had the greatest effect on N leaching losses. It is important to continue the trial to assess the impact of duration-controlled grazing on drainage water quality and soil productivity in the longer term. Acknowledgements This work was funded under Objective 5 of the Pastoral 21 project. Thank you to technical staff for their assistance with field and laboratory work. References Blakemore LC, Searle PL, Daly BK (1987) Methods for chemical analysis of soils. New Zealand Soil
Bureau Scientific Report 80.
Chadwick DR, Ledgard SF, Brown L (2002) Nitrogen Flows and Losses in Dairy Farms in New Zealand and the UK: Effects of Grazing Management. In 'Dairy Farm Soil Management'. Palmerston North. (Eds LD Currie, P Loganathan) pp. 319-332. (Fertiliser and Lime Research Centre, Massey University).
de Klein CAM (2001) An analysis of environmental and economic implications of nil and restricted grazing systems designed to reduce nitrate leaching from New Zealand dairy farms. II. Pasture production and cost/benefit analysis. New Zealand Journal of Agricultural Research 44, 217-235.
de Klein CAM, Ledgard SF (2001) An analysis of environmental and economic implications of nil and restricted grazing systems designed to reduce nitrate leaching from New Zealand dairy farms. I. Nitrogen losses. New Zealand Journal of Agricultural Research 44, 201-215.
de Klein CAM, Paton J, Ledgard SF (2000) An evaluation of a strategic de-stocking regime for dairying to improve nitrogen efficiency and reduce nitrate leaching from dairy farms in nitrate-sensitive areas. In 'New Zealand Grassland Association' pp. 105-110.
de Klein CAM, Smith LC, Monaghan RM (2006) Restricted autumn grazing to reduce nitrous oxide emissions from dairy pastures in Southland, New Zealand. Agriculture, Ecosystems and Environment 112, 192-199.
Di HJ, Cameron KC (2002) Nitrate leaching in temperate agroecosystems: sources, factors and mitigating strategies. Nutrient Cycling in Agroecosystems 46, 237-256.
Haynes RJ, Williams PH (1993) Nutrient cycling and soil fertility in the grazed pasture ecosystem. Advances in Agronomy 49, 119-199.
Hewitt AE (Ed.) (1998) 'NZ Soil Classification.' (Manaaki Whenua - Landcare Research New Zealand Ltd Press: Lincoln).
Holmes CW, Brookes IM, Garrick DJ, MacKenzie DDS, Parkinson TJ, Wilson GF (2007) 'Milk Production from Pasture - Principles and Practices.' (Massey University: Palmerston North).
Houlbrooke DJ, Horne DJ, Hedley MJ, Hanly JA, Scotter DR, Snow VO (2004) Minimising surface water pollution resulting from farm-dairy effluent application to mole-pipe drained soils. I. An evaluation of the deferred irrigation system for sustainable land treatment in the Manawatu. New Zealand Journal of Agricultural Research 47, 405-415.
Houlbrooke DJ, Horne DJ, Hedley MJ, Snow VO, Hanly JA (2008) Land application of farm dairy effluent to a mole and pipe drained soil: implications for nutrient enrichment of winter-spring drainage. Australian Journal of Soil Research 46, 45-52.
Ledgard SF, Menneer JC (2005) Nitrate leaching in grazing systems and management strategies to reduce losses. Fertiliser and Lime Research Centre, Massey University, Palmerston North.
Sharpley AN, Syers JK (1979) Loss of nitrogen and phosphorus in tile drainage as influenced by urea application and grazing animals. New Zealand Journal of Agricultural Research 22, 127-131.
Silva RG, Cameron KC, Di HJ, Hendry T (1999) A lysimeter study of the impact of cow urine, dairy shed effluent, and nitrogen fertiliser on nitrate leaching. Australian Journal of Soil Research 37, 357-369.

© 2010 19th World Congress of Soil Science, Soil Solutions for a Changing World 1 – 6 August 2010, Brisbane, Australia. Published on DVD.
157
Relation of evaporation and transpiration to maintain plant production
Michihiro HaraA, Kensuke NaritaA and Takumi NabatameA AFaculty of Agriculture, Iwate University, Morioka, Iwate, Japan, Email [email protected] Abstract Andisol in a pot was placed in a controlled air condition room and evaporation rate was measured. After that, another similar pot with leaf plants were placed in the same room but with light condition in daytime to measure evapo-transpiration rate. Analysis of the evaporation rate revealed that the rate was well expressed the simple function of time as ArcSinh[t]. Analysis of the evapo-transpiration showed an almost constant daily pattern during first several days but after that the rate decreased. This decrease was almost proportional to the decrease in soil water content. Key Words Evaporation rate, Evapo-transpiration rate, controlled air condition, water supply capability. Introduction To maintain optimal condition for plants to do photosynthesis, maintenance of soil moisture to an appropriate level is essential. At the same time, efficient water use also should be considered. So, we have to know the appropriate soil water content, first, to maintain plants under a good water condition, and secondly, not to lose water excessively through evaporation and deep percolation. We used a leafy plants to identify if there was a critical water content under which the plant could not do sufficient transpiration and so could not photosynthesise. This information of the existence of a critical water content should be very useful for maintaining plant production while preventing excessive water use. Methods Measurement and analysis of the evaporation rate
Andisol filled a test pot of 25 cm in dia. and 50 cm deep. First this pot was saturated with water and drained to remove excess water, and then placed in an air conditioned room. Total weight, TDR and matric potential were measured every minute. Data were processed using equations for water dynamics.
Measurement and analysis of the evapo-transpiration rate
After finishing the previous test it was repeated but this time eggplant and a leafy plants were planted in a same pot and placed in the air conditioned room. Artificial lights were put on to simulate day time conditions. Total weight of the pot was measured every minute to obtain the evapo-transpiration rate.
Results The measured weight was plotted in Figure 1 with dots, while fitted functional values are indicated with a line. Evaporation rate calculated from the fitted function is shown in Figure 2.
Figure 1. Measured weight of the soil pot.
X: Time t in hour, Y: Weight in gram.
Dots are measured and the line is fitted with
Y=21775-919.644*ArcSinh[0.00722948*t]
Figure 2. Evaporation rate calculated from Figure 1.
X: Time t in day, Y: Evaporation rate in mm/day.
Transpiration rates were affected by soil water content, and the critical values were about 0.4 mL/mL as shown in Figures 3 and 4.

© 2010 19th World Congress of Soil Science, Soil Solutions for a Changing World 1 – 6 August 2010, Brisbane, Australia. Published on DVD.
158
y = -417.76x + 1001.5
y = 59806x2 - 34429x + 5069.4
0
100
200
300
400
500
600
700
800
900
1000
0.250.350.45
日蒸
散量
(g/da
y)
(0.397ml/ml 835.38g/day)
y = 4955.3x - 1442.4
y = 196.72x + 491.15
0
100
200
300
400
500
600
700
0.30.40.5
日蒸
散量
(g/da
y)
(0.406ml/ml 571.02g/day)
Figure 3. Daily transpiration rate was affected by
volumetric soil water content (mL/mL), case No.1 for
eggplant.
Figure 4. Daily transpiration rate affected by
volumetric soil water content (mL/mL), case No.2 for
the leafy plant.
Conclusion Weight loss by evaporation is expressed as a simple equation using a mathematical function ArcSinh. Transpiration rate was critically affected by soil water content. The critical soil water contents were about 0.4 for our cases References Nabatame T (2008) Relationship between soil wetness and transpiration from plants. Master Thesis,
Graduate School of Iwate University, 32+5pages.
Narita K (2008) Evaluation of water supply capability of Akadamatsuchi-soil(Andisol). Master Thesis, Graduate School of Iwate University, 56 +14pages.
Daily T
ranspiration Rate [g/d]
Daily T
ranspiration Rate [g/d]

© 2010 19th World Congress of Soil Science, Soil Solutions for a Changing World 1 – 6 August 2010, Brisbane, Australia. Published on DVD.
159
Resistivity imaging across native vegetation and irrigated Vertosols of the
Condamine catchment—a snapshot of changing regolith water storage
Jenny Foley
A, Mark SilburnB and Anna GreveC ADepartment of Environment and Resource Management, Toowoomba, QLD, Australia, Email [email protected] BDepartment of Environment and Resource Management, Toowoomba, QLD, Australia, Email [email protected] CWater Research Laboratory, UNSW, Manly Vale, NSW, Australia, Email [email protected]
Abstract Over use of one of Queensland’s most productive groundwater systems, the Condamine River alluvium, has led to substantial depletion in groundwater levels. Most use is for irrigation (mainly furrow), which is known to increase deep drainage below the root zone. Thus irrigation should create greater groundwater recharge, but this is not generally detected in groundwater levels. The enhanced deep drainage may be filling a moisture deficit in the unsaturated zone and is therefore not yet causing greater recharge. Geophysical 2D resistivity imaging and soil coring was used to look at changes in stored regolith water in the alluvium. Transects were imaged across naturally vegetated landscapes (as a reference) into irrigated paddocks. All soils under native vegetation were found to be very dry (low conductivity) even when only sparsely populated by trees. In contrast, significant long-term migration of water has occurred to deep within the regolith (up to 15 m) in most irrigated paddocks. A wet (close to saturated) zone was found in the upper 6 m of soil in the irrigated paddocks. Deeper regolith (20-60 m) was resistive, both above and below the water Table, due to low salinities in the groundwater and coarser textures. Key Words Deep drainage, groundwater, geophysical survey, recharge, unsaturated zone. Introduction The Condamine River Alluvium and its tributaries is one of the most productive and utilized groundwater resources in Queensland. The main system is over 150 km long, up to 30 km wide, and over 120 m deep in places, with multiple sand and gravel aquifers in a matrix of clayey sediments. An estimated 95 000 ML/yr are used for agriculture (90%) on Vertosols, and some urban purposes. Groundwater levels have fallen substantially because of over use, particularly in the Central Condamine where ~70% of all usage occurs (Murphy, 2008). This decline has been particularly evident over the last decade as the system has been in a virtual ‘recharge drought’. There is also increasing evidence of water quality deterioration, both in shallow groundwater as a result of increased salt leaching, and in deep systems as a result of the migration of poor quality groundwater from adjacent areas and from bedrocks (Murphy, 2008). Irrigation alters the surface water balance. Water not used for plant growth or lost to evaporation, drains below the root zone (deep drainage). Deep drainage of 100-200 mm/yr has typically been measured under furrow irrigation in a large number of sites on Vertosols and Sodosols in Australia (Silburn and Montgomery, 2004; Smith et al. 2005; Gunawardena et al. 2008). There is some evidence, from bore monitoring, of rises in groundwater level in shallower aquifers in the alluvium (DERM groundwater database), likely due to recharge from deep drainage, but many shallower bores have been dry for many years. Diffuse recharge (i.e. through the soil) in the alluvium is considered to be small, with the aquifers mainly recharged by river leakage (Lane, 1979). Thus there is a disparity—deep drainage below the root zone is seen to be high but recharge from this source is thought to be low. This would be explained, in part, if deep drainage was being stored in an unsaturated zone left dry by the previous native vegetation, creating a time lag between deep drainage and recharge. Little is known about the moisture capacity and status of the regolith (unsaturated zone) or how this has changed as a result of changes in the soil water balance. To examine the moisture status of the regolith, electrical resistivity tomography and soil coring was applied to transects in the central alluvium. Soil resistivity is related to soil water content, salinity and clay (content and type). Data can be interpreted qualitatively with the aid of lithology from bore logs and measures of salt and clay content. Contrasts in regolith under native vegetation and under irrigated agriculture were examined, to assess the impacts from land use changes.

© 2010 19th World Congress of Soil Science, Soil Solutions for a Changing World 1 – 6 August 2010, Brisbane, Australia. Published on DVD.
160
Methods Two dimensional resistivity images were taken using an ABEM SAS4000 Terrameter and LUND ES464, across transects (200–600 m long and 60 or 21.5 m deep) in the Central Condamine alluvia, in SE Queensland. Where possible, transects running through native vegetation and adjoining irrigated paddocks were imaged to look at differences in water and salt due to the irrigation. Sites imaged were:
1. Dalby, Black Vertosol—a) 400 m transect down an irrigation furrow with 2.5 m wide spacing of electrodes, measuring to 60 m depth, b) 600 m transect through native vegetation (Acacia harpophylla,
A. homalophylla, Casuarina cristata, Eucalyptus populnea) into irrigated sorghum (stubble present) to 60 m
2. Pampas, Black Vertosol—480 m transect running down a furrow in irrigated paddock to 21.5 m depth 3. Brookstead, Black Vertosol—400 m transect from one irrigated field (sorghum stubble) through native
vegetation (Eucalyptus camaldulensis) and into another irrigated paddock (fallow) to 60 m depth. Soil volumetric water content was sampled with a soil coring rig. Soil samples were collected and analysed for electrical conductivity (EC), chloride (Cl) and dispersed particle sizes, along the transects to assess the influence of salt and clay content on resistivity. Two dimensional resistivity images were inverted using the RES2DINV software. Data was converted to conductivity (reciprocal of resistivity) with high conductivity generally indicating high water contents. Results and discussion All the images are deeper than—or close to, in the case of Pampas—groundwater levels. The saturated zone and the deeper unsaturated zone are generally resistive, due to the low salinity of the groundwater (Pampas and Brookstead 400, Dalby 1200 µS/cm) and sands and sometimes gravels interbedded in the clays. Thus the less resistive deeper material at the Dalby site (Figure 1) is consistent with the higher groundwater salinity.
Figure 1. Dalby transect L to R, furrow irrigated paddock, head ditch (L) to past mid point in paddock.
Figure 2. Pampas transect: L to R, furrow irrigated paddock, head ditch (L) to past mid point in paddock.
The first two transects were measured down typical irrigation furrows at Dalby and Pampas. Images show highly conductive zones of soil (very wet, with medium salinity typical of soils in the region), along the entire length of the transects in the upper 6 m of the profile (Figures 1, 2). Soil volumetric water sampling revealed, on average, these areas had >550 mm of water above that stored under native vegetation and up to 250 mm above drained upper limit in the top 6 m of soil. This is ‘new’ water added by irrigation. Water in this near-saturated layer is not static. It is draining into the deeper regolith at a rate proportional to the hydraulic conductivity of the deeper clay and sand layers. The soil profile changes at around 5–6 m, with increasing sandy, sandy clay and occasionally gravel layers. These often create confining zones. Once saturated clay layers become interspersed with sand layers, the soil will remain saturated in the clay but not

© 2010 19th World Congress of Soil Science, Soil Solutions for a Changing World 1 – 6 August 2010, Brisbane, Australia. Published on DVD.
161
in the sand, due to hydraulic relationships. Water will continue to move deeper in the regolith, but these zones will not show up on the image as having a high conductivity due to the increasing presence of unsaturated sand. Also, salinity will be a mixture of that in the leachate (i.e. higher, due to salt from the soil) and the lower salinity in groundwater discussed above. Groundwater levels were at 10–20 m before 1965, so some of the current unsaturated zone once held groundwater of low salinity. Native veg Sorghum stubble Fallow - irrigated
Figure 3. Dalby transect: L to R, native vegetation into sorghum stubble (irrigated).
0
1
2
3
4
5
6
0.20 0.40 0.60 0.80Soil moisture (v/v)
Dep
th (
m)
Native vegIrr-130mIrr-260mIrr-550mTP
a)
0
1
2
3
4
5
6
0.0 0.4 0.8 1.2EC dS/m
Dep
th (
m)
Native vegIrr-130mIrr-260mIrr-550m
b)
0
1
2
3
4
5
6
20 40 60 80Clay %
Dep
th (
m)
Native vegIrr-130mIrr-260m Irr-260m
c)
Figure 4. Dalby transect a) soil volumetric water contents, b) EC and c) clay contents, taken in native vegetation
and at 130, 260 and 550 m (refers to distances along transect in Figure 3). The image at Dalby (Figure 3) shows a clear increase in conductivity in the upper layers at 120 m, where native vegetation ends and the irrigated paddock starts. Soil under native vegetation had lower conductivity, half that in the irrigated paddock, and was dry (Figure 4a). Soil was extremely wet under irrigation to the depth measured (Figure 4a). Water contents were close to total porosity (TP); the soil was near-saturated and had little air content. EC profiles show a salt bulge higher in the irrigated paddock, consistent with salt added in irrigation water (Figure 4b). However by 3 m depth, EC was reasonably uniform along the entire transect. Similarly, % clay was consistent along the transect to 4 m (Figure 4c). Deeper that this, some sandy layers begin to emerge, creating variability in particle size analysis. Overall, these results indicate changes in conductivity in the upper profile are predominately due to differences in soil water. The depth of the highly conductive zone is shallower at the tail drain (near the native vegetation) than towards the head ditch, consistent with less drainage occurring along furrow irrigated fields (Gunawardena et al. 2008). As with the Dalby transect, a clear delineation is seen when moving from irrigation to native vegetation at Brookstead (Figure 5). The wet zone extends considerably further down (to 15 m), under irrigation. Soil EC and clay contents are very uniform along the transect (Figures 6b, 6c), and so it can be assumed that conductivity changes along the transect (at shallow depths) are due to changes in soil water. Conclusion 2-D resistivity imaging and soil coring showed that irrigated fields in the Condamine alluvium were consistently near-saturated in the upper regolith to depths of about 10 m, whereas under native vegetation the regolith was dry. Thus considerable deep drainage from irrigation has been stored in regolith previously kept dry by native vegetation, preventing it from contributing to recharge. It is not possible to determine

© 2010 19th World Congress of Soil Science, Soil Solutions for a Changing World 1 – 6 August 2010, Brisbane, Australia. Published on DVD.
162
from resistivity imaging whether deeper layers (e.g. >15m) are also wet because they are resistive in the unsaturated zone and below the water Table, due to low salinity of the groundwater. Deeper coring is required to determine the moisture status and confirm the salinity of these deeper materials.
Native veg Sorghum stubble -
irrigated Fallow - irrigated
Figure 5. Brookstead transect: L to R, sorghum stubble (irrigated) into native vegetation, into fallow irrigated.
0
1
2
3
4
0.20 0.40 0.60 0.80Soil moisture (v/v)
Dep
th (
m)
Nat veg206 m223 m243 mTPDUL
a)
0
1
2
3
4
0 0.2 0.4 0.6 0.8 1EC dS/m
Dep
th (
m)
Native vegGrassFurrows
b)
0
1
2
3
4
20 40 60 80Clay %
Dep
th (
m)
Native vegGrassFurrows
c)
Figure 6. Brookstead transect a) soil volumetric water contents, b) EC and c) clay contents taken at 196 m
(native veg), 203 m (grassed) 206 m (furrow start), and 223 and 243 m (refers to distances along transect in
Figure 5).
Acknowledgments Water Research Laboratory (UNSW) for use of resistivity imaging equipment, technical expertise and image analysis. Funds were provided by Cotton Catchment Communities CRC Project 2.1.02 and Condamine Alliance. Kind thanks to Denis Orange, Maria Harris, Ralph de Voil and Tony King for field and laboratory assistance; and to farm owners and managers for access to farm sites. References Lane WB (1979) Progress report on Condamine underground investigation to December 1978. QWRC
Groundwater Branch Report, June 1979. (Queensland Water Resources Commission).
Gunawardena TA, McGarry D, Gardner EA, Stirzaker R (2008) Managing Deep Drainage for Improved WUE: Solute Monitoring and Ground Water Response in the Irrigated Landscape. In “Proceedings of the 14th Australian Cotton Conference.” 12 – 14 August 2008, Broadbeach, Australia.
Murphy G (2008) Management of Groundwater – Condamine River and tributary alluvium: Information paper for groundwater licensees and users (Central Condamine River Alluvium). (Department of Natural Resources and Water: Brisbane).
Silburn DM, Montgomery J (2004) Deep drainage under irrigated cotton in Australia – A review. WATERpak a guide for irrigation management in cotton. Section 2.4. pp. 29-40. (Cotton Research and Development Corporation/Australian Cotton Cooperative Research Centre: Narrabri).
Smith RJ, Raine SR, Minkevich J (2005) Irrigation application efficiency and deep drainage potential under surface irrigated cotton. Agricultural Water Management 71, 117-130.

© 2010 19th World Congress of Soil Science, Soil Solutions for a Changing World 1 – 6 August 2010, Brisbane, Australia. Published on DVD.
163
Reuse of wastewater for irrigation in Saudi Arabia and its effect on soil and
plant
Ali A. AljaloudA ANatural Resources and Environment Research Institute (NRERI), King Abdulaziz City for Science and Technology (KACST), Riyadh Kingdom of Saudi Arabia, Email [email protected]
Abstract This paper addresses the reuse of treated municipal wastewater and its effect on soil and plants. The research study showed that reuse of treated municipal waste water in irrigation provided plants with sufficient levels of nutrients, such as Nitrogen (N), Phosphorus (P) and Potassium (K), and other micro-nutrients. Research results indicated that using treated municipal waste water in crop irrigation saved 45% and 94% in the cost of the fertilization programs for wheat and alfalfa, respectively. Additionally, wheat yield increased by 11% and alfalfa production improved by 23%. Overall profit for wheat and alfalfa were 14% and 28%, respectively, higher than the control. The concentration of heavy metals such as Copper (Cu), Lead (Pb) and Cobalt (Co) in plant tissue was low compared to established standards; these heavy metal concentrations are well below hazardous levels. This study showed that treated municipal waste water can be used safely for irrigation of a selected group of crops. It enriched the soil in minerals, increased plant nutrient uptake, promoted crop yield, and improved the overall profit
Key Words Wastewater reuse, heavy metals accumulation in soil and plants, wastewater, use of municipal wastewater for irrigation.
Introduction Use of waste water as a supplemental source of irrigation is inevitable for increased agricultural production in many arid and semi-arid regions where irrigation supplies are insufficient to meet crop water needs. AI-Shanghiti and Shammas (1985) found that irrigation with waste water reduced soil salinity and met some crop nutrient requirements. Research showed that use of some waste waters for irrigation increased trace metals in soils and plants, especially Zn levels in soils (Johnson et al. 1982, Abdou and El-Nennah, 1980, El-Mashhady and El-Nennah, 1982, Crites, 1984). The information on the use of treated municipal waste water for agriculture in Saudi Arabia is limited with regards to its optimum use to minimize pollution prob-lems. This experiment was conducted to determine the effect of irrigation with treated municipal waste water on crop yield, plant composition and soil properties with special emphasis on accumulation of trace metals. Methods and materials The soil for the experiment was silty-clay (Sand 39%, Silt 39%, Clay 22%).
Table1. Physico-chemical properties of soils.
Parameters Soil – 1aa Soil – 12b
pH 7.7 -8:1 7.6 - 7.8 EC at 25°C 0.9 – 3.3 2.0 - 4.7 Ca+2 meg 2 L-' 1.9 – 20.2 8.1 - 20.4 Mg+2 " 1.9 – 11.9 8.0 - 16.1 Na+ " 4.3 – 11.9 5.3 - 24.6 K+ " 0.3 – 0.9 0.8 - 1.4 SO4
2- " 2.3 – 34.0 6.0 - 50.1 Cl-4 1.7 – 3.1 2.4 - 4.0 HCO3 1.3 – 2.3 0.9 - 1.4 P mg/kg 2.1 – 9.7 1.2 - 8.1 CO3 – eq % 37 – 45 32 - 39 Sand* % 27 – 53 39 - 61 Silt % 29 – 47 25 - 37 Clay % 18 – 26 14 - 24
a Soil irrigated with Treated Municipal Waste Water (TMWW). b Soil irrigated with Fresh Water (FW). * Soil Texture Class = Silty-clay.
© 2010 19th World Congress of Soil Science, Soil Solutions for a Changing World 1 – 6 August 2010, Brisbane, Australia. Published on DVD.
164
Two sources of irrigation water, namely Treated Municipal Waste Water (TMWW) from Riyadh Sewage Treatment Plant and Fresh Water (FW) were used. Water samples were collected on a monthly basis for analysis to monitor any change in chemical composition. Table 2. Mean chemical composition of irrigation waters.
Parameters TMWW FW pH 7.26 7.80 EC dS/M 1.61 0.70 COD mg/L 89 - NH4 –N " 20.7 - PO4-P " 7.0 - K+ " 15.1 2.9 Ca +2 128 61 Mg +2 28 23 Na+2 140 45 SO4+2 " 6.8 3.89 HCO3 " 3.2 1.1 Cl " 4.8 1.9 Fe ug/L 0.24 - Zn " 0.11 - Mn " 0.04 - Cu " 0.01 - Pb " 0.002 - Ni " 0.003 - Cd " 0.0004 - Cr " 0.003 - C0 " 0.002 - TMWW = Treated Municipal Waste Water. FW = Fresh Water
Wheat and Alfalfa were grown as test crops. A composite soil samples were taken from 0-10, 10-20, 20-40, 40-70, 70-100 and 100-140 cm depth of soil at the beginning and after each cropping season. Plant samples of wheat were collected at flag leaf stage each year for analysis. Similarly, twenty branches were randomly collected from freshly cut alfalfa. Results and discussion Chemical composition of crops
Wheat
The mean concentrations for elements for the two waters were N 3.11% (TMWW) and 2.91% (FW), P 4.25 mg/g (TMWW) and 3.45 mg/g
(FW), K 4.10% (TMWW) and 3.75% (FW), Fe 145 mg/kg
(TMWW) and 133 mg/kg (FW), Zn 35.5 mg/kg (TMWW) and 26.5 mg/kg (FW) and Mn 102 mg/kg (TMWW) and 98 mg/kg (FW). The Fe and Zn contents of plants were significantly higher for TMWW plots than FW treatment plots at 5% level of significance. The difference in the element contents of the remaining elements was not significant between TMWW and FW irrigated plots in spite of the fact that crop received the same amount of fertilizer in both irrigation treatments. Alfalfa
The mean concentrations of elements were N 4.10% (TMWW) and 4.20% (FW), P 3.75 mg/g
(TMWW) and 3.35 mg/g (FW), K 3.60% (TMWW) and 3.50% (FW), Fe 359 mg/kg (TMWW) and 325 mg/kg (FW), Zn 27.0 mg/kg (TMWW) and 25.5 mg/kg(FW) and Mn 50 mg/kg (TMWW) and 44.5 mg/kg (FW). There was no significant difference in mineral composition of alfalfa irrigated with different irrigation treatments except Fe which was significantly higher in TMWW than FW irrigated plots. The results showed that irrigation with TMWW did not affect the chemical composition of the alfalfa crop as compared to FW irrigated plots. This might be due to the nitrogen fixing properties of alfalfa masking the effect of nutrients in TMWW treatments. Also fertilizer application might have overshadowed the beneficial effects of nutrients present in treated waste water.
© 2010 19th World Congress of Soil Science, Soil Solutions for a Changing World 1 – 6 August 2010, Brisbane, Australia. Published on DVD.
165
Toxic metals
Wheat
The mean concentrations of toxic metals were for Cu 2.9 mg/kg (TMWW) and 2.4 mg/kg (FW), Pb 1.5 mg/kg (FW) and 2.3 mg./kg (TMWW), Ni 0.8 mg/kg (TMWW) and 0.5 mg/kg (FW), and Co 0.5 mg kg t (TMWW) and 0.5 mg/kg (FW). Toxic metal concentrations showed increasing trend under TMWW irrigation but the difference in the toxic mineral composition of wheat irrigated with TMWW and FW waters was not significant. Alfalfa
The mean concentrations of toxic metals were for Cu 2.1 mg/kg (FW) and 2.9 mg/kg (TMWW), Pb 3.3 mg/kg (FW) and 3.3 mg/kg (TMWW), Ni 0.6 mg/kg = (FW) and 0.7 mg/kg (TMWW), and Co 2.6 mg/kg (TMWW) and 2.3 mg kg (FW). The concentration of all the toxic metals in alfalfa was almost identical for TMWW and FW irrigated plots. In general, the concentration of toxic metals showed increasing trends in TMWW treatment relative to FW but the difference was not significant at 5% level of significance. The results were similar to those of Johnson et al. (1982), Abdou and El-Nennah (1980), El-Mashhady and ElNennah (1982) who observed increased contents of trace metals in plants irrigated with waste waters.
Soil properties
Soil salinity
The soil salinity increased with depth and ranged from 2.0 to 6.5 dS/m in S1, 2.0 to 3.9 dS m - 1 in S2 and 2.6 to 4.1 dS/m in S3 in FW irrigated plots. Soil salinity did not show significant changes with time and ranged between 1.8 to 4.9 dS/m in S1, 2.9 to 4.0 dS/m in S2 and 2.6 to 3.5 dS/m in S3 in TMWW irrigated plots. Soil salinity did not increase to harmful limits with FW and TMWW irrigation (USDA 1954). Al-Shanghiti and Shammas (1985) reported similar results and found a decrease in soil salinity with waste water irrigation
Chemical composition of soils
Nitrogen (N)
The weighted mean N contents of soils were 36.1 mg/kg and 68.5 mg/kg in FW and TMWW irrigated plots respectively. The N contents of soils were significantly low in FW than TMWW irrigated plots (LSD0.50 = 20.2). This showed that N present in TMWW increased the N concentration of soils above the levels in the soil receiving FW water and the same amount of pre-plant inorganic fertilizer. Phosphorus (P)
The weighted mean values of available P in soils were 19.7 mg/g and 24.9 mg/g in FW and TMWW irrigated plots, respectively. The difference in P contents of soils between FW and TMWW treatments was not significant at 5% level of significance (LSD0.05 = 19.6). The results showed that P contents for TMWW did not increase the P contents of soils significantly when compared to FW treatment.
Potassium (K)
The weighted mean values of water soluble K in soils were 40.9 mg/kg and 47.4 mg/kg in FW and TMWW irrigated plots, respectively. The difference in K contents between FW and TMWW treatments was not significant at 5% level of significance (LSD0.05) = 20.4). The slightly higher contents of soil in TMWW treatment than FW treatment could be attributed to higher levels of K in TMWW. Iron (Fe)
The weighted mean values of Fe were 2.27, 2.23 and 3.53 mg/kg in S1, S2 and S3- respectively under FW irrigation. The Fe contents of soils increased significantly with time (LSD0.05 = 0.53). Similarly, the mean values of Fe were 2.27, 2.27 and 3.70 mg kg- 1 in Ap. 89, Nov. 89 and June 1990, respectively under TMWW irrigation. The Fe contents of soils were significantly higher in the last year than the previous two years (LSD0.05 = 0.73). Zinc (Zn)
The weighted mean values of Zn were 2.23 mg/kg in S1, 1.27 mg/kg in S2 and 1.73 mg/kg in S3 in FW irrigated plots. The Zn contents decreased with time and were significantly lower in the second year as compared to the first year. The difference in Zn contents of soils was not significant between the first

© 2010 19th World Congress of Soil Science, Soil Solutions for a Changing World 1 – 6 August 2010, Brisbane, Australia. Published on DVD.
166
and the last year (LSD0.05= 0.76). Overall, the Zn contents were slightly higher in TMWW than FW irrigated plots. This could be attributed to low levels of Zn in FW as compared to TMWW treatment. The weighted mean values of Zn in soils were 2.60 mg/kg in S1, 2.30 mg/kg in S2 and 1.97 mg/kg in S3 in the TMWW irrigated plots. The Zn contents showed decreasing trend with time but the difference was not significant at the 5% level of significance. Although, the TMWW contained appreciably higher amount of Zn than FW the effect on Zn status of soil was not significant.
Copper (Cu)
The weighted mean values of Cu in soils were 0.47 mg/kg in S1, 0.40 mg/kg in S2 and 0.53 mg/kg in S3 in FW irrigated plots. There was no significant difference in Cu contents of soil with time at 5% level of significance. The weighted mean values of Cu in soil were 0.47 mg/kg in S1, 0.30 mg/kg in S2
and 0.67 mg/kg in S3 in TMWW irrigated plots. The Cu contents of soil increased significantly in the last year as compared to the first year. The Cu contents were significantly lower in the second year than in the first year and the last year (LSD0.05 = 0.12). The results showed that Cu present in TMWW increased the Cu content of soil.
Conclusion Nutrients present in treated waste water increased dry matter and grain yield appreciably as compared to yields obtained using fresh water irrigation. Irrigation with TMWW did not influence the chemical composition of soil and plants to hazardous limits. Hence irrigation with TMWW is safe and is a potential source of supplemental irrigation not only to meet growing crop water needs but also for increased agricultural production. References Abdou FM, El-Nennah M (1980) Effect of irrigation loamy sand soil by liquid sewage sludge on its
content of some micronutrients. Plant Soil 56, 53-57.
Al-Shanghiti A, Shammas AT (1985) Results of two years monitoring study on irrigation with treated sewage water. In ‘8th Symposium Saudi Biological.SocietyAbstract’. pp. 257-258.
Cordonnier MJ, Johnston TJ (1983) Effects of waste water irrigation and plant and row spacing on soybean yield and development- Agronomy Journal 75, 908-913.
Crites RW (1984) Land use of waste water and sludge, Environmental Science Technology 18, 140A-147A.
Demirjian YA, Westman TR, Joshi AM, Rope DJ, Buhl RV, Clark WR (1984) Land treatment of contaminated sludge with waste water irrigation. Journal WPCF 56, 370-377.
El-Mashhady A, El-Nennah M (1982) Some quality aspects of the use of sewage effluent in agricul-ture. Ain Shams University, Faculty of Agriculture, Research Bulletin 1903, 1-16.
Johnson RD, Jones RL, Hinesly TD, David DJ (1982) ‘Selected chemical characteristics of soil, forages and drainage water from the sewage farm serving’. Melbourne, Australia. Corps Engineers, Washington, DC. Environmental Protection Agency 43019-75:54.
Saenz R (1987) Use of waste water treated in stabilization ponds for irrigation evaluation of microbiological aspects. Water Quality Bulletin 12, 84-89.
USDA, Salinity Laboratory Staff (1954) ‘Diagnosis and Improvement of Saline and Alkali Soils’. (United States Department of Agriculture Handbook No. 60: Washington D.C.)

© 2010 19th World Congress of Soil Science, Soil Solutions for a Changing World 1 – 6 August 2010, Brisbane, Australia. Published on DVD.
167
Sediment erosion research in the Fitzroy basin central Queensland: an overview
Chris Carroll
A, Cameron DougallB, Mark SilburnC, David WatersC, Bob PackettA and Marian JooD ADepartment of Environment and Resource Management, PO Box 1762 Rockhampton, Queensland, 4700, Australia, Email [email protected]
BDepartment of Environment and Resource Management, PO Box 19 Emerald, Queensland, 4720, Australia. CDepartment of Environment and Resource Management, PO Box 318, Toowoomba, Queensland, 4350, Australia. DDepartment of Environment and Resource Management, 80 Meiers Road, Indooroopilly, Queensland, 4068, Australia. Abstract Erosion research in the Fitzroy basin has consistently shown in dryland cropping, grazing, irrigation and coalmine rehabilitation landscapes that the retention of 40 to 60% surface cover and maintaining a large soil water deficit can reduce erosion rates to negligible levels (<0.5 t/ha), even on very steep slopes. Neighbourhood catchment sub-catchment and basin scale studies have highlighted that dryland cropping contributes the largest sediment concentrations, particularly during large episodic erosion events when crops are unable to be planted and surface cover is low. However, the majority of sediment load from the Fitzroy is generated from grazing due to the large proportion of this land use in the basin. Key Words Fitzroy, erosion, runoff, land use, monitoring, modelling. Introduction The Fitzroy River Basin in Central Queensland is the largest coastal catchment in eastern Australia, covering an area of approximately 142,000 km2, consisting of six sub-catchments: Nogoa, Comet, Mackenzie, Isaac-Connors, Dawson and Lower Fitzroy. The Fitzroy Basin was settled in the 1850s, and in the first 100 years of settlement there was localised clearing, with limited sheep and cattle grazing, cultivation and mining activities. Development increased substantially with the Brigalow Land Development Scheme between 1962 and 1985 with the clearing of 4.5 million hectares of brigalow vegetation. By 1999 58% of the remnant vegetation in the Fitzroy had been significantly altered or cleared ,with the major land uses, grazing (82%), dryland cropping (7%), conservation (4%), irrigation (0.5%), and mining (0.5%). The clearing and development of the Fitzroy basin has led to a diverse and complex range of resource management issues. A mean annual sediment load of 3.1 Mt/yr is estimated to be exported past Rockhampton into the Fitzroy river estuary, with most of this sediment coming from the Nogoa and Comet sub-basins (Joo et al. 2005). A reef consensus statement on water quality in the Great Barrier Reef highlighted that ‘land derived contaminants,
including suspended sediments, nutrients and pesticides are present in the GBR at concentrations likely to
cause environmental harm’ (Brodie et al. 2008). Numerous small scale and catchment scale experiments have been conducted in the basin to quantify and manage the impact of agricultural and mining industry on runoff and erosion (Ciesiolka 1987, Carroll et al 1997, 1995, 2000; Waters 2001, 2004; Thornton et al. 2007; Silburn et al. 2009). More recently, larger catchment scale monitoring and modelling has been undertaken to estimate sediment loads and sources within the basin (Joo et al. 2005; Dougall et al. 2009; Packett et al. 2009; Hughes et al. 2009). An overview of the runoff and erosion research conducted in the Fitzroy is presented in this paper.
Fitzroy Studies Forest, cropping, grazing, irrigation and mining
The Brigalow Catchment Study in the Dawson sub-basin and was established in 1965 in response to the large scale clearing of brigalow vegetation (Acacia harpophylla). An initial pre-clearing calibration stage (1965-82) was conducted on three catchments (12-17ha), with two catchments subsequently cleared for cropping and grazing in 1982 (Thornton et al 2007). A 12 year dryland cropping study commenced at Capella in 1982 on a shallow vertosol soil to determine the effect of crop type, crop rotation and tillage practice on runoff and soil loss from nine contour bay catchments (approximately 13 ha) (Carroll et al. 1997). In the late 1990’s zero tillage was moving towards a control farming systems that would facilitate opportunity cropping, minimise soil compaction and increase farming efficiency. In 1999 experiments were conducted to compare zero tillage with control traffic farming and contour farming on two properties (Moonggoo, Cowendilla) in the Dawson and Nogoa sub-basins.

© 2010 19th World Congress of Soil Science, Soil Solutions for a Changing World 1 – 6 August 2010, Brisbane, Australia. Published on DVD.
168
The first hydrologic experiment on a grazing catchment (9.6 ha) commenced in 1979 on a cattle property (Springvale) in the Nogoa sub-catchment (Ciesiolka 1987). Vegetation was silver-leaf ironbark trees (Eucalyptus melanophloia, dominant pastures Bothriochloa ewartiana, Heteropogon contortus and Themeda
triandra. The catchment was fenced and de-stocked in 1981, and in 1987 runoff plots were installed both inside (ungrazed) and outside (grazed by cattle) the area (Silburn et al. 2009). A further grazing study commenced in 1994 on two properties (Keilambete and Glentulloch) to measure the effects of three pasture utilisation rates, 75, 50 and 0 % on runoff and erosion processes (120 m2 plots) (Waters 2004). Carroll et al. (1995) and Waters (2001) quantified erosion rates from furrow irrigation and rainfall from cotton production systems in the Emerald Irrigation Area (EIA) on Vertosol soils, and considered a range of management practices to minimise erosion and pollutant transport. The final and major land use monitored was open-cut coalmining where landscapes are created with parallel spoil piles, with very steep slopes of approximately 75%. To provide guidelines for mine rehabilitation Carroll et al. (2000) compared erosion rates from three rehabilitated slope gradients (10, 20, 30%), topsoil and spoil materials at three coalmine sites in the Mackenzie and Isaac sub-catchments. Neighbourhood catchments
Two local neighbourhood catchments were established in 1999 at Gordonstone Creek, and Spottswood Creek in the Nogoa and Dawson sub-catchments to quantify the offsite transport of sediment and pollutants at cascading scales. Both neighbourhood catchments are approximately 300 km2, with 20 and 25 properties respectively in each catchment, the Moonggoo and Cowendilla properties and paddock scale experiments were in the respective catchments. Basin monitoring and Modelling
At a basin scale Joo et al. 2005 used measured total suspended solids (TSS) concentrations from the six sub-basins in the Fitzroy to develop sediment rating curves. These rating curves combined with streamflow data were used to estimate long-term mean annual sediment load of the Fitzroy and its main tributaries for a common 30-year period 1974-2003. Packet et al. (2009) used 11 years (spanning 15 years) of flood borne pollution data from the Fitzroy basin to identify a relationship between land use and pollutant generation and transport. SedNet/Annex catchment modelling has quantify the relative contribution of hillslope, gully and streambank erosion and potential land management practices to reduce sediment and nutrient loads within the basin (Dougall et al. 2009). A USLE C-factor was generated from a Ground Cover Index produced for Landsat TM (25m) imagery, with presence and absence of gullies mapped using Quickbird satellite images and aircraft-mounted Light Detection and Ranging (LIDAR). Overview of erosion research The Brigalow Catchment Study has shown that changing from brigalow forest to cropping and grazing has doubled runoff and increased peak runoff rates, with cropping marginally greater than cropping (Thornton et
al. 2007). All plot/paddock scale studies in the Fitzroy have consistently shown the importance of managing both soil water deficit and surface cover on reducing the magnitude of erosion and water pollutants. The Capella study highlighted dryland cropping land is most susceptible to episodic erosion when crops are unable to be sown, and the subsequent long-fallow is conventionally tilled leaving soil exposed to the erosive forces of rainfall and runoff. Such conditions notably occurred in 1982 and 1994. Just 3 storms in 1983 contributed 30% (13.3 t/ha) of the soil loss before zero tillage was established and the soil was bare (Carroll et al 1997). Likewise, Dougall et al. (2009) found a similar episodic nature at the Gordonstone Creek Neighbourhood catchment where just 3 events produced 92% (60,000t) of the sediment export during the study. Overall, the lowest average annual runoff and soil loss is following wheat, when there is generally both a large soil water deficit and mass of crop stubble (90% soil cover). When the vertosol was dry and cracked almost all early summer rainfall infiltrates, this was evident in 1990-91 when following wheat harvest there was just 8 mm runoff from 250 mm of rainfall. Once cracks close, infitration rate, runoff and soil loss is determined by the amount of stubble protecting the soil from rainfall impact and surface runoff. This was illustrated at Moonggoo where an opportunity cropping regime actually grew 3 more crops (13 crops in 11 years) than a more conservative cropping system (10 crops), yet had greater runoff. The 3 extra crops were two winter chickpea, and mungbeans that produce relative low biomass with surface cover often <10% during the subsequent fallow (Neilsen per comm). Many soils in semi-arid grazing lands are susceptible to developing low pasture cover or bare areas (scalds) under heavy grazing and have a low tolerance to soil erosion, due to low total water holding capacity and

© 2010 19th World Congress of Soil Science, Soil Solutions for a Changing World 1 – 6 August 2010, Brisbane, Australia. Published on DVD.
169
concentration of nutrients in the surface (Silburn et al. 2009). In grazing the effect of pasture cover on soil hydraulic properties and surface runoff is greater than in croplands, with a time lag between change in pasture cover and change in hydrologic response, the duration of this time lag is poorly understood, but may be up to 3 years (Waters 2004). At Keilambete on a red duplex soil, there was large erosion rates at low cover levels in comparison to Glentulloch, this was attributed to the low subsoil permeability and shallow A horizon, causing increased runoff and soil loss. Waters (2004) found pasture cover levels of approximately 60% need to be maintained on shallow red duplex poplar box/silver leaf ironbark soils, by maintaining cattle pasture utilisation rates between 25 % and 50 % of standing dry matter. Whereas, for the deeper poplar box duplex soils, >40 % pasture cover maintained erosion rates to acceptable levels. Likewise at the Springvale study runoff was strongly influenced by surface cover and was very high with low cover (200-300 mm/yr or 30-50% of rainfall). Runoff averaged 35 mm/yr or 5.9% of rainfall with >50% cover. All three grazing experiments show that managing grazing pressure and hence pasture dry matter and surface cover dramatically reduces erosion and runoff. In furrow irrigation systems rainstorms caused most of the seasonal soil loss (Carroll et al. 1995), and sediment concentration from both rainfall and irrigation declined when cultivation ceased, furrows consolidated and when the cotton canopy provided surface cover. In addition Waters (2001) found that a wheat-cotton rotation reduced soil erosion by 70% and endosulfan concentrations by 40%, with 80% reduction of sediment loads when PAM was applied to irrigation water, and the use of vegetative strips trapped 65-85% of total endosulfan and 67% of chlorpyrifos in runoff. Coalmining landscapes created the greatest erosion rates from all land use monitored, particularly when there was a large bare surface area (>50%) exposed to the erosive forces of rainfall and overland flow. When soil was bare erosion rates were typically >70 t/ha, however once pasture (Cenchrus ciliaris) colonised erosion rates declined to negligible levels (<0.5 t/ha), even on steep slopes. Where pasture did not establish on spoil material, due to surface crusting, rates remained very large (>200t/ha). At a sub-basin and basin scale Joo et al. (2000) estimated that most of the sediment load in the Fitzroy comes from the Nogoa and Comet sub-catchments, and for a given level of runoff, sediment concentration on average was highest for the Nogoa and Comet sub-catchments, and the lowest for the Isaac. Packett et al. (2008) found the higher the percentage of cropping land in a rainstorm event area, the greater the potential maximum pollutant concentration measured at the end of the Fitzroy. Nevertheless, the majority of the long-term average annual load is from grazing land, due to the large proportion of this land use in the basin. SedNet/ANNEX catchment modelling has identified hillslope erosion as the dominant source of sediment delivered to the stream network (67%), with gully erosion 26% and channel erosion 7%, and hillslope erosion contributed the largest proportion of both particulate phosphorus (63%) and nitrogen (55%). The modelling suggests the majority of the suspended sediment is generated from <30% of the Fitzroy landscape. When the SedNet modelling outputs are compared with Hughes et al. (2009) geochemical and radionuclide tracing work in the Theresa Creek catchment there is a good agreement on the spatial sources of suspended sediment, but large differences in the dominant sources of sediment (Dougall et al. 2009); highlighting the need for further research into tracing major sources of eroded sediment in the basin. References Brodie J, Binney J, Fabricius K, Gordon I, Hoegh-Guldberg O, Hunter H, O’Reagain P, Pearson R, Quirk M,
Thorburn, waterhouse J, Webster I, Wilkinsin S (2008) Synthesis of evidence to support the Scientific Consensus Statement on Water Quality in the Great Barrier Reef. The Queensland Department of Premiers and Cabinet. www.reefplan.qld.gov.au.
Carroll C, Merton L, Burger P (2000) Impact of vegetative cover and slope on runoff, erosion and water quality for field plots on a range of soil and spoil materials on central Queensland coal mines. Australian Journal of
Soil Research 38, 3131-327.
Carroll C, Halpin M, Burger P, Bell K, Sallaway MM, Yule D (1997) The effect of crop type, crop rotation and tillage practice on runoff and soil loss on a vertisol in central Queensland. Australian Journal of Soil
Research 35, 925-39.
Carroll C, Halpin M, Bell K, Mollison J (1995) The effect of furrow length on rain and irrigation induced erosion on a vertisol in Australia. Australian Journal of Soil Research 33, 833-50.
Dougall C, Carroll C, Herring M, Trevithick R, Neilsen, S, Burger P (2009) Enhanced sediment and nutrient modelling and target setting in the Fitzroy basin. Queensland Department of Environment and Resource

© 2010 19th World Congress of Soil Science, Soil Solutions for a Changing World 1 – 6 August 2010, Brisbane, Australia. Published on DVD.
170
Management Technical Report. ISBN:93116621688.
Hughes AO, Olley JM, Croke JC, McKergow LA (2009) Sediment source changes over the last 250 years in a dry-tropical catchment, central Queensland, Australia. Geomorphology 104, 262-275.
Joo M, Yu B, Carroll C, Fentie B (2005) Estimating and modelling suspended sediment loads using rating curves in the Fitzroy river catchment, Austrlaia. In (Eds A Zerger, RM Argent) MODSIM 2005, December 2005. ISBN: 0-9758400-2-9.
Packett R, Dougall C, Rohde K, Noble R (2009) Agricultural lands are hots-spots for annual runoff polluting the southern GBR lagoon. Marine Pollution Bulletin 58, 976-986.
Silburn DM, Carroll C, Ciesiolka CAA, deVoil RC, Burger P (2009) Hillslope runoff and erosion on duplex soils in grazing lands in semi-arid central Queensland I. Influences of cover, slope and soil. Australian
Journal of Soil Research (Submitted).
Thornton CM, Cowie BA, Freebairn DM, Playford CL (2007) The Brigalow Catchment Study: II. Clearing brigalow (Acacia harpophylla) for cropping or pasture increases runoff. Australian Journal of Soil
Research 45, 496-511.
Waters D (2001) ‘Best management practice to minimise pollutant transport from cotton production systems’. Cotton Development Final Report.
Waters D (2004) Grazing management implications on runoff and erosion processes in semi-arid Central Queensland. In ‘13th ISCO Conference. Conserving soil and water for society: sharing solutions: Brisbane, Australia 4 to 8 July 2004’.

© 2010 19th World Congress of Soil Science, Soil Solutions for a Changing World 1 – 6 August 2010, Brisbane, Australia. Published on DVD.
171
Soil carbon management and filtering of organic pesticides
Karin MüllerA, Markus DeurerB, Tehseen AslamB and Brent ClothierB
ASystems Modelling, The New Zealand Institute for Plant & Food Research Limited Ruakura, Hamilton, New Zealand, Email [email protected] BSystems Modelling, The New Zealand Institute for Plant & Food Research Limited, Palmerston North, New Zealand. Abstract Soil organic carbon (SOC) content is known to be sensitive to changes in land-use and management in a particular land-use system. We hypothesized (1) that in aggregated soils the filtering capacity for organic pesticides depends on physical, chemical and biological properties at the aggregate scale, impacting water sorptivity, pesticide sorption and degradation, respectively, and that these are related to the SOC content; and (2) that the filtering capacity is not equivalent to the filtering efficiency during transport. The impact of decreased SOC on soil filtering capacity and efficiency for pesticides was investigated using radiolabelled 2,4-D in laboratory experiments. Substituting space for time, two pairs of sites with the same soil type, texture, land-use and climatic conditions, but with significantly different SOC content within each of the pairs were selected. For the pair of hydrophobic pastoral soils, the SOC loss had a significantly (P ≤ 0.05) negative impact on the soils’ chemical and biological filtering capacity, but a significantly positive impact on the physical filtering capacity for 2,4-D. The physical filtering capacity clearly dominated the filtering efficiency. For the pair of orchard soils, a SOC loss did not significantly (P ≤ 0.05) impact on the filtering efficiency for 2,4-D, even though the physical and biological filtering capacity were significantly changed. The results show that hydrophobicity is a risk to soils’ filtering efficiency in soils with high SOC contents. Key Words Leaching, degradation, sorption, sorptivity, hydrophobicity, 2,4-D. Introduction In areas with regular application of pesticides the intactness of the soil’s filtering capacity for pesticides protects aquifers. Leaching through soils has been identified as a major source of pesticide contamination of aquifers. The ubiquity of pesticide detections in groundwater (Barbash et al. 2001; Gaw et al. 2008) indicates that this filter is overloaded and/or its efficiency decreases. Global pesticide production has increased linearly from 1960 until 2000. If this trend continues the amounts produced in 2020 are predicted to be 1.7 times higher than in 2000 (Tilman et al. 2001). Governments look for guidance what kind of soil properties should be monitored to predict early changes in the generic performance of the soil’s ecosystem service of filtering. The SOC content of the topsoil seems to be an obvious candidate as it is very sensitive to any land-use change or modification of management practices within a particular land-use (Bellamy et al. 2005). The SOC content of topsoils is linked to the filtering of pesticides. We defined the generic filtering capacity of aggregated soils as the capacity of aggregates to take up pesticides from the soil solution (physical filtering), to adsorb and degrade them (chemical and biological filtering). We identified ‘filtering indicators’, i.e. hydrophobicity, SOC, microbial biomass and respiration rates representing the physical, chemical and biological filtering, respectively. Based on two case studies, each consisting of a pair of soils with the same land-use, climate and texture but with significantly different SOC contents, we predicted that a SOC loss decreased the soil’s generic capacity to filter pesticides only as long as no hydrophobicity occurs (Aslam et
al. 2009). The first objective of this study was to verify these predictions with measurements of the soils’ physical, chemical and biological filtering processes for 2,4-D, i.e., water sorptivity, 2,4-D sorption and degradation. We defined a soil’s filtering efficiency for a pesticide as the actual filtering during transport. We hypothesize that the changed filtering capacity of a soil does not necessarily mean a changed filtering efficiency due to potential interactions of filtering processes and non equilibrium conditions during transport. The second objective of this study was to show the effect of SOC loss on the soil’s filtering efficiency for 2,4-D in the two case studies, and to compare the soil’s filtering capacity with its filtering efficiency. Methods Study sites and soil sampling
The first pair of sites was under horticultural production (organic versus integrated apple orchard) in the

© 2010 19th World Congress of Soil Science, Soil Solutions for a Changing World 1 – 6 August 2010, Brisbane, Australia. Published on DVD.
172
Hawke’s Bay region, and the second pair was under long term permanent pasture in the Waikato, NZ. The apple trees in the organic orchard received compost once a year at a rate of 5 to 10 t/ha, and were not irrigated. The tree rows were grassed and regularly mowed as necessary. A 0.5-m wide strip under the trees of the adjacent integrated apple orchard had been kept vegetation free by regular herbicide applications. The apple trees had been drip-irrigated during the vegetative period, and 50 kg N/ha as calcium ammonium nitrate fertiliser had been applied annually. The second pair of sites consisted of ‘camp’ and ‘non-camp’ areas on the same paddock of a permanent pasture that was regularly grazed by sheep. Areas with a slope of about 40° constituted the main grazing area, which was too steep for sheep to rest (‘non-camp’ sites). The remainder had little (<10°) to no slope and was used by sheep to rest at night (‘camp’ sites). Such camp-site areas are known to accumulate sheep manure and have increased SOC (Haynes and Williams 1999). Six undisturbed soil cores (0.3 x 0.2 x 0.1 m) were collected from both systems in February 2007. Each field-moist soil slab was divided into four parts. Two parts of the cores were used for measuring water sorptivity, 2,4-D sorption and degradation. For the transport experiments, three undisturbed soil cores (5.15 cm diameter and 11 cm long) were taken from each site at the end of summer 2008 after a prolonged dry period. The filtering capacity: physical, chemical and biological filtering of 2,4-D
Water sorptivity of the macro-aggregate fractions of the four soils was measured with a modified set-up of an existing method (Gerke and Kohne 2002). Sorption of 2,4-D to the four soils was measured in batch equilibrium experiments (OECD 2000) with intact macro-aggregates. The degradation of 2,4-D was determined in incubation experiments at the aggregate scale, using a modified method of Gonod et al. (2003). All experiments were conducted with [Ring-U-14] 2,4 dichlorophenoxyacetic acid. The filtering efficiency of 2,4-D: soil column leaching experiments
Bromide, a conservative tracer in our soils, suitable to quantify the soil’s physical filtering efficiency, and 2,4-D quantifying the combined effects of the physical, chemical and biological filtering efficiency, were applied in a combined pulse of about 80 mL to the initially dry soil columns with a tension disc infiltrometer. The pulse was leached with 0.01 M CaCl2 using a disc infiltrometer set to –1.5 hPa at the upper boundary of the soil columns. The lower boundary of the soil columns ended in a vacuum box set to the same tension. We took leachate samples in regular intervals and analysed them for both solutes. The residual 2,4-D in the soil columns was determined at the end of the experiments. All experiments were conducted in triplicate. We determined the soils’ filtering efficiency for bromide and 2,4-D at specified pore volumes (PV). The filtering efficiency gives the fraction of the total applied solute mass that remained in the soil at a specific PV. Statistical analysis
The physical, chemical and biological filtering capacity and the filtering efficiency were analyzed with an analysis of variance (GenStat 9.1.0.150). The differences between averages were interpreted to be significant if they were larger than their respective least significant differences (LSD) at the 95% confidence level. The impact of SOC on the soils’ physical, chemical and biological filtering capacity for 2,4-D was analyzed with multiple regressions between the aggregate sizes and their SOC contents and the respective filtering process. Results Physical, chemical and biological filtering capacity
SOC loss led to a decrease in water sorptivities in the orchards surveyed but to an increase in water sorptivities in the pastures surveyed (Table 1). Under pasture the sorptivity increased with decreasing water repellency. In multiple regressions with the macro-aggregate size and their SOC contents as the independent and the water sorptivities as the dependent variable, both, the aggregate size and the SOC contents were significant factors with regression coefficients of 0.92 and 0.8 for the orchard and pasture soils, respectively. SOC was positively related to the sorptivity in the orchard soils, but the opposite was found for the pasture. SOC loss led to a decrease of 2,4-D sorption in both systems. Sorption of 2,4-D was a function of the SOC content (R2 = 0.95). All aggregates showed an exponential mineralisation of 2,4-D with an initial lag phase. The occurrence of a lag phase suggests that the degradation was driven by specialised degrading populations. Co-metabolism can account for up to 30% of 2,4-D mineralisation (Robertson and Alexander 1994). 2,4-D degradation was significantly higher in the ‘low-carbon’ integrated orchard than the ‘high-carbon’ organic orchard (Table 1). The reason for this is hypothesized that 2,4-D specific degrader populations already existed in the integrated orchard while the organic orchard had not received any herbicides for the last 12 years. The camp and non-camp pasture sites had the same herbicide application history. The ‘high-carbon’ camp site pasture degraded 2,4-D significantly faster than the ‘low-carbon’ non-camp site (Table 1).

© 2010 19th World Congress of Soil Science, Soil Solutions for a Changing World 1 – 6 August 2010, Brisbane, Australia. Published on DVD.
173
Validation of the filtering indicators
The effective filtering indicator property values, contact angle, SOC content, microbial biomass and respiration rates are summarised in Table 1 (Aslam et al. 2009). The lack of water repellency successfully indicated that sorptivities in the orchard soils were not limited. The occurrence of water repellency successfully indicated the extremely small sorptivities of the pastoral soils. The SOC content was in principal a useful indicator for 2,4-D sorption to orchard and pasture soils. Basal respiration rate and microbial biomass carbon successfully indicated 2,4-D degradation provided the sites had a similar history of 2,4-D applications. Overall the data on 2,4-D collected here supported the hypothesis that the topsoil’s filtering capacity for pesticides depends on physical, chemical and biological properties of the aggregate structure. Table 1. Effective physical, chemical and biological indicator property values (Aslam et al. 2009) and the
measured physical, chemical and biological filtering of 2,4-D in the orchard and pasture systems.
Physical Chemical Biological Contact
angle Water sorptivity SOC Sorption
coefficient Microbial biomass Respiration rate 2,4-D half-life
(°) (mm/s0.5) (%) (l/kg) (mg C/kg soil) (µg CO2/g soil day) (d) Orchards Integrated <90 0.025 1.8 3.1 402 30 59 Organic <90 0.060 3.9 2.7 1298 63 90 LSD n.s. 0.025 0.3 n.s. 95 9 21 Pastures Non-camp 101 0.010 4.8 8.8 571 57 88 Camp 95 0.003 8,5 18.4 853 80 66 LSD 2 0.005 0.5 3.5 91 8 14 Filtering efficiency during solute transport
We quantified the filtering efficiency of our soils for bromide and 2,4-D in column experiments. The ‘high SOC’ organic orchard soil had a significantly higher filtering efficiency for bromide than the ‘low SOC’ integrated orchard soil (Figure 1a). We observed an unexpected early breakthrough of 2,4-D in the soils possibly due to preferential flow through macro-pores. The physical filtering process, the uptake of water by aggregates obviously did not happen in the early stages of the experiment. After 480 mm of drainage, the organic orchard tended to be the more efficient filter for 2,4-D, but the difference was not significant (Figure 1b). In the pastoral soils, the observed preferential flow of 2,4-D was attributed to macro-pores and water repellency. After 420 mm of drainage the filtering efficiency of the ‘high SOC’ camp site pasture soil was significantly lower 2,4-D than the filtering efficiency of the ‘low SOC’ non-camp site pasture soil (Figure 1c, d). The lack of physical filtering in the camp site soil clearly dominated all other filtering processes.
0
0.1
0.2
0.3
0.4
0.5
0.6
0.7
0.8
0.9
1
0.5 1 2
Pore volumes
Bromide filtering efficiency
Integrated
Organic
0
0.1
0.2
0.3
0.4
0.5
0.6
0.7
0.8
0.9
1
1 4 8
Pore volumes
2,4-D filtering efficiency Integrated
Organic
0
0.1
0.2
0.3
0.4
0.5
0.6
0.7
0.8
0.9
1
0.5 1 2
Pore volumes
Bromide filtering efficiency
Camp
Non-camp
0
0.1
0.2
0.3
0.4
0.5
0.6
0.7
0.8
0.9
1
1 4 8
Pore volumes
2,4-D filtering efficiency Camp
Non-camp
Figure 1. Bromide (a, c) and 2,4-D (b, d) filtering efficiency at specific pore volumes leached (a, b) in the
integrated and organic orchard, and (c, d) in the camp and non-camp pasture. The bars denote one standard
deviation. The amounts of drainage corresponding to 1 PV are 60 and 52 mm for the orchard and pastoral soils,
respectively.

© 2010 19th World Congress of Soil Science, Soil Solutions for a Changing World 1 – 6 August 2010, Brisbane, Australia. Published on DVD.
174
We analysed the impact of SOC loss on the soils’ filtering function by comparing the filtering capacity and the filtering efficiency for bromide and 2,4-D. We concluded that for a conservative solute like bromide a SOC loss decreased the filtering efficiency in the orchard soils and increased the filtering efficiency in the pasture soils, as it is driven solely by the physical filtering capacity of the soil. For a reactive organic solute like 2,4-D, a SOC loss had the tendency to decrease the filtering efficiency in the orchard soils and significantly increased the filtering efficiency in the pasture soils. All soils were dry at the start of the experiment and the pasture soils were hydrophobic. Under these conditions the physical filtering process dominated and the significantly decreased physical filtering capacity was traced to the filtering efficiency. Conclusions The soils’ filtering capacity for a specific solute describes the soils’ potential to filter this solute. We validated our indicator framework for the soils’ physical, chemical and biological filtering capacity for 2,4-D. The degree of water repellency as an indicator for the physical filtering capacity performed well. The SOC content was useful as an indicator for the chemical filtering capacity when SOC was the major sorbent. The SOC content was a useful indicator of the biological filtering capacity as long as the application history of the pesticide differed not too much and then dominated. At this stage it is suggested that the filtering indicators should be further tested with other agrochemicals. In the future the indicator framework might be used to assess the quality of a soil’s filtering function for agrochemicals from the local to the landscape scale. We measured the filtering efficiency of our soils for bromide and 2,4-D. The filtering efficiency is the actual filtering during transport. The prediction of solute transport for the orchard soils was generally good. A problem was the early breakthrough of solutes by preferential flow, most probably through macro-pores. The other problem was that the soils were due to their high SOC contents prone to soil hydrophobicity, which also led to preferential flow in the pasture soils. We addressed the question how a SOC loss influenced soils filtering function. We analysed aggregated soils with silt loam texture under orchard and pastoral land-use with varying SOC contents. The occurrence of soil hydrophobicity was the key to distinguish how the SOC loss influenced the soils filtering capacity. A SOC loss decreased the soils’ filtering capacity if the soils were not prone to hydrophobicity like the orchard soils. A SOC loss increased the soils’ filtering capacity if the soils were prone to hydrophobicity. Usually hydrophobicity occurs in soils with high SOC contents. Research is needed to identify critical thresholds for SOC amounts above which severe hydrophobicity occurs limiting the soils’ filtering function. References Aslam T, Deurer M, Müller K, Clothier BE, Rahman A, Northcott G, Ghani A (2009) Does an increase in
soil organic carbon improve the filtering capacity of aggregates soils for organic pesticides: A Case Study. Geoderma 152, 187-193.
Barbash JE, Thelin GP, Kolpin DW, Gilliom RJ (2001) Major herbicides in ground water: Results from the National Water-Quality Assessment. Journal of Environmental Quality 30, 831-845.
Bellamy PH, Loveland PJ, Bradley RI, Lark RM, Kirk GJD (2005) Carbon losses from all soils across England and Wales 1978-2003. Nature 437, 245-247.
Gaw S, Close ME, Flintoft MJ (2008) Fifth national survey of pesticides in groundwater in New Zealand. New Zealand Journal of Marine and Freshwater Research 42, 397-407.
Gerke HH, Kohne JM (2002) Estimating hydraulic properties of soil aggregate skins from sorptivity and water retention. Soil Science Society of America Journal 66, 26-36.
Gonod LV, Chenu C, Soulas G (2003) Spatial variability of 2,4-dichlorophenoxyacetic acid (2,4-D) mineralisation potential at a millimetre scale in soil. Soil Biology and Biochemistry 35, 373-382.
Haynes RJ, Williams PH (1999) Influence of stock camping behaviour on the soil microbiological and biochemical properties of grazed pastoral soils. Biology and Fertility of Soils 28, 253-258.
OECD (2000) Estimation of the adsorption coefficient (Koc) in soil and sewage sludge using high performance liquid chromatography (HPLC). OECD TG121.
Robertson BK, Alexander M (1994) Growth-linked and cometabolic biodegradation: possible reason for occurrence or absence of cometabolic biodegradation. Pesticide Science 41, 311-318.
Tilman d, Fargione J, et al. (2001) Forecasting agriculturally driven global environmental change. Science 292, 281-284.
© 2010 19th World Congress of Soil Science, Soil Solutions for a Changing World 1 – 6 August 2010, Brisbane, Australia. Published on DVD.
175
Soil management and stream water quality at the agricultural catchment scale
in Ireland
Alice R. MellandA, David WallA, Per-Erik MellanderA, Phil JordanA and Sarah MechanA ATeagasc, Johnstown Castle Environment Research Centre, Wexford, Co. Wexford, Ireland. Email [email protected]
Abstract The effectiveness of the EU Nitrates Directive regulations is being measured in five agricultural catchments in Ireland. The catchments represent a range of typical soil type, geology and climate conditions. A comparison of spatial variation in water chemistry and indicative soil hydrological properties was undertaken to inform phosphorus and nitrogen transport behaviour in the catchments. Morgan soil P was measured for samples collected at 2 ha resolution across three of the catchments. Stream water chemistry was analysed monthly at 8-11 subcatchment locations in four of the catchments. Initial data from the four catchments are presented and indicate that the link between compliant soil nutrient sources and water chemistry is uncertain with flow heterogeneity, source connectivity and sample resolution requiring further investigation at the catchment scale. Key Words Phosphorus, nitrate, nutrient source, baseflow, event flow, nitrates directive. Introduction To evaluate the effectiveness of new Irish farm soil and nutrient management regulations on water quality, an agricultural catchment monitoring program is being undertaken (Fealy et al. 2009). Agricultural catchments ranging in size from 7.5 to 12.1 km2 were selected to represent a range of soil type, geology and landuses in Ireland. Two catchments are more than 30% cropped with wheat and barley (Tillage A and B) and two are grassland (Grassland A and B) sustaining more than 1.6 livestock units per ha on average with between 3 and 5 months of over-winter housing of stock. Average long-term annual rainfall ranges from 900 to 1200 mm. To quantify stream water chemistry relative to statutory guideline levels and to better understand the spatial and temporal links between soil chemical and physical properties and agricultural management on stream water quality, a series of reconnaissance water chemistry surveys and soil sampling surveys were conducted. Longitudinal water chemistry surveys under both baseflow and stormflow conditions can reveal relative inputs of surface and subsurface-derived water, and spatial variations in soil type, geology, diffuse and point sources of phosphorus (P) and nitrogen (N) (Shand et al. 2005; Withers and Hodgkinson 2009). These surveys are part of a wider research programme that includes high resolution time-series sampling of water quality at each catchment outlet and demonstrative studies of surface and subsurface nutrient flux pathways. Methods Water sampling and analysis
Grab water samples were collected from 8-11 stream locations in each of two grassland and two tillage catchments on a monthly basis and extra samples were collected opportunistically during storm flow events. Other than a deliberate sampling immediately downstream of a small sewage outfall (75 PE) in catchment Tillage A, observed farm and urban point sources were avoided. Sampling began in either February (Tillage A) or March (other three catchments) 2009. Samples were stored at 4°C prior to chemical analysis. Total molybdate-reactive P (TRP), total oxidised N and nitrite-N were analysed within 32 hours of sample collection. Nitrate-N (NO3-N) was calculated as the difference between total oxidised N and nitrite-N. Soil sampling and analysis
Each field within a catchment was sampled according to the standard agronomic soil sampling protocol in Ireland; fields were subdivided into approximately 2 ha sampling areas that accounted for topography, nutrient and crop management history. A composite of twenty 10 cm deep soil cores were taken randomly within each sampling area, dried and ground to <2 mm before chemical analysis for Morgan P.

© 2010 19th World Congress of Soil Science, Soil Solutions for a Changing World 1 – 6 August 2010, Brisbane, Australia. Published on DVD.
176
Results and discussion Table 1 shows that mean TRP concentrations in all catchments exceeded the 0.035 mg/L chemical standard set in Ireland, for concentrations measured over a 12 month period, for ‘Good Status’ river water quality. Higher P concentrations in the two less well drained catchments (Grassland B and Tillage B) may reflect higher proportions of surface and near-surface runoff in stream flow where storm events were sampled and/or a significant influence of urban or rural point sources on baseflow water quality. There are currently no standards for NO3-N for rivers in Ireland apart from the 11.3 mg/L maximum EU limit for water abstracted for drinking purposes, which was not exceeded on any of the sampling occasions in any catchment. The gradient of increase in mean NO3-N concentrations across catchments broadly matched the relative abundance of well drained soils, probably reflecting contributions from deeper flows. The influence of subsurface flows is supported by stream hydrograph data that are not presented here. Mean and median soil P concentrations (where measured to date) were lower in the Grassland B catchment than the two tillage catchments and were within or below recommended optimum ranges of 5.1-8 mg/L for grassland soils and 6-10 mg/L for tillage soils. Application of off-farm nutrients to soils above these ranges is prohibited. Data so far indicate that catchments are within the 170 kg organic N/ha regulation for equivalent stocking density. Table 1. Catchment descriptions and mean and median concentrations of selected analytes of field soil and
stream outlet water chemistry.
Catchment Tillage A Grassland A Tillage B Grassland B Land Use (%) Tillage 54 20 33 6 Grassland 39 77 49 84 Geology Ordovician Metasediments Ordovician
volcanics Silurian metasediments & volcanics
Old red sandstone and mudstone
Soil
Description Acid deep brown earths and podzols
Basic deep brown earths and gleys
Acid deep brown earths and gleys
Acid deep brown earths
Drainage Well drained uplands and lowlands. Poorly drained alluvial soils.
Poorly drained lowlands, well drained uplands
Moderately drained lowlands and uplands
Well drained uplands, moderately drained lowlands
No. areas sampled 469 389 299 0 P Morgan (mg/L) 5.9, 4.4 4.5, 4.1 6.7, 4.2 Not available Water No. baseflow or intermediate flow samples
6
6 6 6
No. event flow samples
4 3 0 2
TRP (mg/L) 0.040, 0.028 0.063, 0.040 0.071, 0.086 0.037, 0.036 NO3
- -N (mg/L) 6.24, 6.59 2.92, 2.87 5.25, 4.99 6.04, 6.13 Figures 1 and 2 show trends from headwaters to catchment outlets for mean TRP and NO3-N concentrations during baseflow and event flow samplings for the two tillage catchments and two grassland catchments respectively. A complex pattern of NO3-N concentration trends occurred across and within each catchment. In all catchments, mean event or intermediate flow concentrations were equal to or less than corresponding baseflow concentrations. In Grassland A marked dilution might have been expected due to the propensity for surface flows, however event NO3-N dynamics varied seasonally (data not shown); NO3-N concentrations were high during a spring flush and very low under storm flow in late summer. Higher NO3-N concentration occurred during baseflow in the Tillage catchments. Within each catchment, downstream trends in NO3-N concentrations were generally consistent regardless of flow type; all catchments except Grassland B and the north arm of Tillage A exhibited decreasing NO3-N concentrations downstream. These decreasing trends indicated additions of NO3-poor tributary flows and lower nutrient inputs on downstream farms in Tillage B, a possible direct influence of NO3-poor deep groundwater or lower land-use intensity downstream in Tillage A and denitrification of soil NO3 sources in the heavy lowland soils in Grassland A. In Grassland B, similarity between intermediate and baseflow NO3-N was probably due to the small range of flow types measured. Nitrate-N in the headwater of the main stream in Grassland B was low, reflecting the buffering effect of ungrazed riparian boglands. Thereafter, concentrations were consistent throughout the catchment, indicating uniformly well-drained soils.

© 2010 19th World Congress of Soil Science, Soil Solutions for a Changing World 1 – 6 August 2010, Brisbane, Australia. Published on DVD.
177
Tillage A NO3-N
STP
0
2
4
6
8
10
12
01000200030004000
Distance upstream (m)
N mg/L
Baseflow SouthBaseflow NorthBaseflow North TribEvent SouthEvent NorthEvent North Trib
Tillage A TRP
STP
0
0.02
0.04
0.06
0.08
0.1
0.12
0.14
01000200030004000
Distance upstream (m)
P mg/L
Tillage B NO3-N
0
2
4
6
8
10
12
01000200030004000500060007000
Distance upstream (m)
N mg/L
Baseflow MainBaseflow TribBaseflow LakesIntermediate flow MainIntermediate flow TribsIntermediate flow Lakes
Tillage B TRP
0
0.02
0.04
0.06
0.08
0.1
0.12
0.14
01000200030004000500060007000
Distance upstream (m)
P mg/L
Figure 1. Trends in TRP and nitrate-N concentrations from headwater to outlet in two tillage catchments under
baseflow, intermediate or event flow conditions.
Grassland A NO3-N
0
2
4
6
8
10
12
010002000300040005000600070008000
Distance upstream (m)
N mg/L
Baseflow Main
Baseflow Trib
Event Main
Event Trib
Grassland A TRP
0
0.02
0.04
0.06
0.08
0.1
0.12
0.14
010002000300040005000600070008000
Distance upstream (m)
TRP mg/L
Grassland B NO3-N
0
2
4
6
8
10
12
01000200030004000
Distance upstream (m)
N mg/L
Baseflow Main
Baseflow Trib1
Baseflow Trib2
Intermediate flow Main
Intermediate flow Trib1
Intermediate flow Trib2
Grassland B TRP
0
0.02
0.04
0.06
0.08
0.1
0.12
0.14
01000200030004000
Distance upstream (m)
P mg/L
Figure 2. Trends from in TRP and nitrate-N concentrations headwater to outlet in two grassland catchments
under baseflow, intermediate or event flow conditions.
© 2010 19th World Congress of Soil Science, Soil Solutions for a Changing World 1 – 6 August 2010, Brisbane, Australia. Published on DVD.
178
In all catchments, TRP concentrations during intermediate, or event flow were equal to, or higher, than during baseflow which reflects mobilisation of surface P sources (dissolved and particulate) from hydrological source areas in fields, and direct wash-off from hard surfaces during storms. During events or intermediate flow, TRP concentrations also increased from headwater to catchment outlet in all catchments suggesting a concomitant increase in intensity of diffuse or point P sources. Source contributions may increase with either; increased density and connectivity to the stream network (critical source areas), or increased frequency of stream disturbance activities such as cattle access and earth works. In all but the south arm of Tillage A, point sources and disturbance activities are likely to play an important role given that the trend for a downstream increase in TRP concentrations was also evident during baseflow. Phosphorus inputs from a small sewage outfall probably explain the marked spike at about 2700 km in Tillage A. In both the well drained catchments, a step change decrease in TRP concentration indicated dilution of stream waters by nutrient-poor tributaries. In Tillage B the low TRP concentrations in the tributaries were likely related to lower intensity land use; however, in Grassland A the tributary and stream headwater were fed by P-depleted spring water. The study demonstrated that flow type has variable influences on stream nutrient chemistry; intermediate flows and baseflows reflected the integrated diffuse inputs of nutrients, particularly NO3-N, from soil drainage and discharges from highly connected point-sources whereas event flows revealed the integrated impacts of surface-derived diffuse sources, and rarely-connected or active point sources such as hard surfaces and intermittent earth works. To better qualify and quantify the relative influence of these multiple soil and nutrient sources on stream water quality, baseflow, intermediate and event flows will continue to be sampled at multiple scales. The role of in-stream attenuation and/or mobilisation processes will also be assessed.
Conclusions This study demonstrated that a combination of soil chemistry, agronomic management practice records, soil and catchment hydrological properties as well as point source distribution, connectivity and activity are required to explain trends in stream nutrient concentrations. The study also demonstrates that flow type and frequency of monitoring has variable influences on stream nutrient chemistry and that stream sampling strategies therefore need to be fit for their purpose. This has implications for comparisons of compliance of soil nutrient status (data show these catchments to be satisfactory) with compliance of stream water chemistry (unsatisfactory with regard to P here even at times of disconnection). Guideline water body concentrations should be accompanied by standardised sampling strategies in order for compliance to be monitored in a comparable way across Ireland. Acknowledgements We acknowledge the work of Teagasc technical and advisory staff (David Ryan, John Colgan John Kennedy, Eddie Burgess and Tom O’Connell) and Programme Manager Ger Shortle. This research is funded by the Department of Agriculture, Food and Fisheries, Ireland.
References Fealy RM, Shortle G, Melland AR, Mellander P-E, Mechan S, Buckley C, Wall D, Jordan P (2009) A
catchment approach to evaluate the Nitrates Directive National Action Programme in Ireland. In '16th Nitrogen Workshop: Connecting different scales of nitrogen use in agriculture'. (Eds C Grignani, M Acutis, L Zavattaro, L Bechini, C Bertora, P. Marino Gallina, D Sacco) pp. 475-476 (Turin, Italy).
Shand P, Haria AH, Neal C, Griffiths KJ, Gooddy DC, Dixon AJ, Hill T, Buckley DK, Cunningham JE (2005) Hydrochemical heterogeneity in an upland catchment: further characterisation of the spatial, temporal and depth variations in soils, streams and groundwaters of the Plynlimon forested catchments, Wales. Hydrology and Earth System Sciences 9, 621-644.
Withers PJA, Hodgkinson RA (2009) The effect of farming practices on phosphorus transfer to a headwater stream in England. Agriculture, Ecosystems and Environment 131, 347-355.

© 2010 19th World Congress of Soil Science, Soil Solutions for a Changing World 1 – 6 August 2010, Brisbane, Australia. Published on DVD.
179
Soil physical changes of a coastal mudflat after wave breaker installation
K. Wan RasidahA, I. Mohamad FakhriA, W. C. SuhaimiA, V. JeyannyA, A. RozitaA and A.K. Adi FadzlyA ASoil Management Branch, Forest Research Institute Malaysia, 52109 Kepong, Selangor, Malaysia, Email [email protected] Abstract A physical barrier made of woven geotextile materials and filled with sand was installed at Sungai Haji Dorani coastline to break wave energy and allow for mud stabilization. Four lines of erosion pins were installed to measure soil accreting level in both areas protected and not protected with geotube. Analysis of soil data collected revealed the fragility of this mudflat against wave direction and energy that brought about changes in mud composition and coastline erosion. Mud accretion was higher within the area protected by geotube, but reduced towards mid 2008. However, the area close to geotube facing landward did not experience erosion, most probably due to mud settlement underneath. There was change in soil profile with changing wave current. Key Words Mangrove forest, muddy soil, geotube, soil structure, Avicennia, Rhizophora. Introduction The aftermath of December 2004 tsunami that hit many countries in Asia including the west coast of Peninsular Malaysia, has sparked coastal rehabilitation programme at national and regional levels. The government of Malaysia, through the Ministry of Natural Resources and Environment has embarked on coastal planting programme with suitable tree species along the country coastline. Idle and degraded lands have been planted with suitable tree species aimed at creating a barrier to protect or lessen the impact from natural disaster. This planting programme covers variety of soil types but majority are mud and sand. One of the areas dedicated for research was the Sungai Haji Dorani coastline, within the proximity of Kuala Bernam Forest Reserve. The area was dominated by mud-flat of massive structure, and its shoreline was populated by Avicennia and Brugeira sp. and mixed species shrubs. This study was carried out to evaluate soil profile changes after geotube installation and the effect it has on the growth and survival of Avicennia and Rhizophora seedlings planted using three different techniques. Geotubes have been used in southeast Texas coast as temporary storm-surge protection and erosion-control structures (Gibeaut 2002). Methods Study Site
The experiment was established at a coastal mudflat in Kampung Sungai Haji Dorani (3° 38’ N, 101° 01’ E), adjacent to D’Muara Resort about 5 km from Sungai Besar town in Selangor. Annual rainfall, diurnal temperature and relative humidity are ~130 mm, 24–32°C, and 70–95%, respectively (Jeyanny et al. 2009). Field experimental layout
Four sets of engineering structure made from woven geotextile material filled with sand were installed adjacent to each other in a row at 70 m distance from the shoreline. This structure was termed as geotube, installed to break wave energy hoping that in due course mud will stabilize within the area and newly planted seedlings survive better. Monitoring of changes in soil composition and mud accretion and erosion was carried out after the installation on routine basis. Graduated pins of 2 m length were placed at specified locations with initially 1.4 m submerged in mud and assumed as level 0. Placement of pins was illustrated in Figure 1. Soil accretion and erosion levels were measured on monthly basis, considering accreting when mud level at pin rose above 1.4 m and eroding if the level was below 1.4 m. The area without geotube installation was also measured as control. Avicennia dan Rhizophora seedlings were planted using various innovative planting techniques within the geotube area towards the land at six months after installation.

© 2010 19th World Congress of Soil Science, Soil Solutions for a Changing World 1 – 6 August 2010, Brisbane, Australia. Published on DVD.
180
Figure 1. Location of measuring pins for monthly data collection on soil accretion and reduction. Land area (■)
dominated by Avicennia and Brugeira, and sea area (■) where soils are exposed during low tide.
Data analysis
Data collected were treated individually and converted into graphical form. Results The area protected by geotube, which are presented by L1 & L2, showed an increase in sediment level consisting mixtures of mud, sand and broken shells from Julai 2007 to April 2008 (Figure 2). Highest sediment accretion recorded was 60 cm for Pin 1 at L1. Erosion started to take place gradually at Line 1 but rather drastic at Line 2. Accretion recur again close to the geotube area which were evident from the data collected at Pin 4 in Line 2. This was a good sign, showing the geotube was able to trap and settledown soil in the area and provide better soil environment for plants. At line 1, alternate erosion and accretion were recorded at all pins from May and September 2008. Change in wave energy could have caused wave turbulence at the edge of geotube and settlement of soil might have been disturbed.
Mud Erosion and Accretion for Line 1
-40
-30
-20
-10
0
10
20
30
40
50
60
70
Apr-0
7
May-0
7
Jun-0
7
Jul-0
7
Aug-0
7
Sep-0
7
Oct-0
7
Nov-0
7
Dec-0
7
Jan-08
Feb-0
8
Mar-0
8
Apr-0
8
May-0
8
Jun-0
8
Jul-0
8
Aug-0
8
Sep-0
8
Month
Cm
Pin 1
Pin 2
Pin 3
Pin 4
Mud Erosion and Accretion for Line 2
-30
-20
-10
0
10
20
30
40
50
60
Apr-0
7
May-0
7
Jun-0
7
Jul-0
7
Aug-0
7
Sep-0
7
Oct-0
7
Nov-0
7
Dec-0
7
Jan-0
8
Feb-0
8
Mar-0
8
Apr-0
8
May-0
8
Jun-0
8
Jul-0
8
Aug-0
8
Sep-0
8
Month
Cm
Pin 1
Pin 2
Pin 3
Pin 4
Figure 2. The trend in soil accretion and erosion (cm) within the mudflat area protected by geotube which was
measured from April 2007 to September 2008.
In area without geotube protection measured at Line 3 and Line 4, less sediment accretion was recorded compared to the area with geotube. Only Pin 1 and Pin 2 showed accreting level while seaward area were experiencing decrease in sediment level throughout the measurement period (Figure 3). Highest sediment accretion recorded was 40 cm at Line 4 for Pins 1 dan 2. Severe soil erosion was recorded between Mei to September 2008. More than 40 cm soil was lost from Line 3 but at the same time there an accretion of nearly 40 cm at Line 4 at Pins 1 and 4. Changing wave pattern could have moved sediments in Line 3 to Line 4.
Pin 1
Pin 3
Pin 2
Pin 4
Geotube Geotube Geotube Geotube
L1 L4 L3 L2
With Geotube
Without Geotube
20m
10m
150m 150m 60m
Mud Flat
Pin1
Pin 3
Pin 2
Pin 4
Pin1
Pin 3
Pin 2
Pin 4
Pin1
Pin 3
Pin 2
Pin 4
50m

© 2010 19th World Congress of Soil Science, Soil Solutions for a Changing World 1 – 6 August 2010, Brisbane, Australia. Published on DVD.
181
Mud Erosion and Accretion for Line 3
-50
-40
-30
-20
-10
0
10
20
30
40
Apr-0
7
May-0
7
Jun-07
Jul-0
7
Aug-07
Sep-07
Oct-0
7
Nov-0
7
Dec-07
Jan-08
Feb-08
Mar-0
8
Apr-0
8
May-0
8
Jun-08
Jul-0
8
Aug-08
Sep-08
Month
Cm
Pin 1
Pin 2
Pin 3
Pin 4
Mud Erosion and Accretion for Line 4
-40
-30
-20
-10
0
10
20
30
40
50
Apr-0
7
May-0
7
Jun-0
7
Jul-0
7
Aug-07
Sep-0
7
Oct-0
7
Nov-0
7
Dec-0
7
Jan-0
8
Feb-0
8
Mar-0
8
Apr-0
8
May-0
8
Jun-0
8
Jul-0
8
Aug-08
Sep-0
8
Month
Cm
Pin 1
Pin 2
Pin 3
Pin 4
Figure 3. The trend in soil accretion and erosion (cm) within the mudflat area not protected by geotube which
was measured from April 2007 to September 2008.
0cm
Massive
33
48
Woody + Shell
115
120cm
Massive + Shell
Massive
Figure 4. Soil profile description in mudflat area after wave-mud phenomenon in August 2009. The incidence
caused drastic mud accretion and submerging pneumatophor roots causing death to Avicennia trees.
Alternate sand/shell and mud accretion brought about changes in species survivability. In August 2009, strong wave current brought along massive amount of mud leaving most of the area covered with mud for almost 33 cm (Figure 4). This led to sudden death of healthy Avicennia trees which were planted almost two years before. Avicennia could stand shallow mud level with sand/shell composition as long as its pneumatophor roots were visible (Wan Rasidah et al. 2008), unlike Rhizophora which prefers to sit on thicker mud. After one year of geotube installation, soil structure has yet to form and accretion level was higher at the area protected with geotube. Severe soil erosion occurred along the coast which was not protected by the wave breaker system. This erosion swiped along matured standing mangrove trees which were conserve for protecting the coastal area. Conclusion Geotube installation in fragile mudflat resulted in sedimentation and accreting level of sediment. However, the structure also led to sand movement and deposition which could disturbed growth of Rhizophora. This deposition was brought about by swirling wave after hitting the edge of geotube. Areas without geotube have lower soil accretion level. References Gibeaut JC, Hepner TL, Waldinger R, Andrews JR, Smyth RC, Gutierrez R (2002) A Report of the Texas
Coastal Coordination Council pursuant to National Oceanic and Atmospheric Administration Award No. NA97OZ0179. The University of Texas at Austin.

© 2010 19th World Congress of Soil Science, Soil Solutions for a Changing World 1 – 6 August 2010, Brisbane, Australia. Published on DVD.
182
http://www.beg.utexas.edu/coastal/geotube.htm. Jeyanny V, Suhaimi WC, Wan Rasidah K, Adi F, Azian M (2009) Preliminary analysis of soil properties of
an eroding mangrove shore in Selangor, Malaysia. ISME/GLOMIS Electronic Journal 7(3), 5-6. Wan Rasidah K, Suhaimi WC, Azian M, Jeyanny V (2008) Avicennia response to the change in soil
structure. In ‘Proceedings of Soil Science Conference of Malaysia 2008, Ipoh, Perak’. (Ed W Asma et
al.) (Malaysian Society of Soil Science).

© 2010 19th World Congress of Soil Science, Soil Solutions for a Changing World 1 – 6 August 2010, Brisbane, Australia. Published on DVD.
183
Soil properties affecting pesticide leaching - application in groundwater
vulnerability mapping in the Czech Republic
Radka Kodešová A, Vít KodešB,A, Martin Kočárek A, Ondřej Drábek and Josef Kozák A A Dept. of Soil Science and Soil Protection, Czech University of Life Sciences Prague, Prague, Czech Republic, Email [email protected] BCzech Hydrometeorological Institute, Prague, Czech Republic, Email [email protected] Abstract Various pesticide and soil properties affect pesticide leaching into groundwater. In order to assess the risk of pesticide leaching, specific groundwater vulnerability maps were constructed for selected pesticides based on modified DRASTIC methodology with emphasis on soil cover that plays a key role in pesticide leaching due to adsorption of pesticides on soil particles. The Freundlich equation was used to fit experimental data points of the adsorption isotherms for each pesticide and soil using the average n parameter for each pesticide. The multiple linear regressions were used to define pedotransfer rules for the determination of the KF parameter from the other physical and chemical soil properties. Resulting pedotransfer rules, the soil map of the Czech Republic and the Czech soil information system PUGIS were applied for the estimation of the adsorption properties of soils of the Czech Republic. The adsorption parameters KF represents only one soil factor affecting the contaminant transport through the soil cover. The properties of selected pesticides represent wide range of used pesticides from those with none leaching potential to those with very good leaching potential. Specific groundwater vulnerability maps reflect those properties. Key Words Pesticides, adsorption, pedotransfer rules, groundwater vulnerability. Introduction Application of pesticides as a common farming practice can have an adverse effect on groundwater quality. Assessment of specific groundwater vulnerability can help to protect the groundwater by implementing best management practices in areas with increased groundwater vulnerability. Specific groundwater vulnerability can vary depending on pesticide properties, hydrogeologic settings and soil cover properties unlike the intrinsic groundwater vulnerability that does not account for the properties of a contaminant. Methods In order to assess the risk of pesticide leaching, specific groundwater vulnerability maps were constructed for selected pesticides based on modified DRASTIC methodology (Aller et al. 1987) with emphasis on soil cover that plays a key role in pesticides leaching due to adsorption of pesticides on soil particles. The adsorption isotherms for selected pesticides and 13 representative soils of the Czech Republic (Table 1) were obtained using a standard laboratory procedure. Pesticides were selected based on following properties: water solubility, soil half-life and Koc. The calculation of GUS index (Gustafson 1989) was also used for determination of a leaching potential. The Freundlich equation (relating adsorbed concentration of solute on soil particles, s, and solution concentration, c, s = KF . c
1/n) was used to fit experimental data points of the adsorption isotherms for each pesticide and soil using the average n parameter for each pesticide. The multiple linear regressions were used to define pedotransfer rules (Table 2) for the determination of the KF parameter from the other physical and chemical soil properties such as organic matter content (OM), pHKCl, cation exchange capacity (CEC) and clay content. Resulting pedotransfer rules, the soil map of the Czech Republic (Němeček et al. 2001) and the Czech soil information system PUGIS (Kozák et al. 1996) were applied for the estimation of the adsorption properties of soils of the Czech Republic. Results Here we show only results of adsorption study and pesticide adsorption predictions. Properties of studied soils are given in the Table 1. It is evident that, soil properties of selected soils varied in wide range. Those properties determine adsorption characteristics of each soil. Pedotransfer rules, shown in the Table 2, were used for construction of KF distribution maps for selected pesticides for whole territory of the Czech Republic. The maps for terbuthylazine and chlorotoluron are presented on Figure 1 and 2.

© 2010 19th World Congress of Soil Science, Soil Solutions for a Changing World 1 – 6 August 2010, Brisbane, Australia. Published on DVD.
184
Table 1. Properties of soils
Soil type Location OM (%)
pHKCl (-)
CEC (mmol/kg)
Clay (%)
Stagnic Chernozem Siltic Milčice 5.03 7.43 403.8 15.8 Haplic Chernozem Ivanovice na Hané 3.05 6.28 271.3 11.4 Haplic Chernozem Praha Suchdol 3.47 7.21 263.8 19.3 Chernozem Arenic Velké Chvalovice 1.59 6.94 141.3 6.40 Greyic Phaeozem Čáslav 2.33 6.53 297.5 13.4 Haplic Luvisol Hněvčeves 1.78 5.63 240.0 13.9 Haplic Cambisol Humpolec 2.82 4.37 260.0 9.9 Haplic Cambisol Předbořice 2.95 5.03 228.8 4.8 Haplic Cambisol Jince 2.78 4.99 236.3 20.3 Dystric Cambisol Vysoké nad Jizerou 3.99 4.79 284.2 16.9 Arenozem Epioutric Semice 1.14 5.74 91.3 3.50 Loess Praha Suchdol 0.76 7.40 241.3 24.5 Sand Písková Lhota 0.04 8.11 56.3 3.30
Table 2. Pedotransfer rules
Pesticide Regression equations Terbuthylazine KF = 4.36 + 1.16 OM [%] – 0.38 pHKCl – 0.006 CEC [mmol/kg] Chlorotoluron KF = –0.91 + 2.01 OM [%] Metolachlor KF = 3.76 + 0.79 OM [%] – 0.5 pHKCl Fipronil KF = 2.40 + 1.62 OM [%] – 0.07 clay [%] Trifluralin KF = 839.7 + 80.6 OM [%] – 97.9 pHKCl Metribuzin KF = 1.74 + 0.28 OM [%] – 0.24 pHKCl Hexazinone KF = 0.83 – 0.119 OM [%] + 0.0033 CEC [mmol/kg] – 0.05 clay [%]
Figure 1. KF parameter of the Freundlich equation [cm
3/n µg
1-1/n/g] for terbuthylazine.
Figure 2. KF parameter of the Freundlich equation [cm
3/n µg
1-1/n/g] for chlorotoluron.

© 2010 19th World Congress of Soil Science, Soil Solutions for a Changing World 1 – 6 August 2010, Brisbane, Australia. Published on DVD.
185
Conclusion The maps of the predicted adsorption KF parameters representing adsorption ability of studied soils were evaluated for each pesticide. Regression analysis showed that the KF parameter mainly depends on organic matter content, pHKCL, cation exchange capacity (CEC) and clay content. Application of pedotransfer rules enables effective assessment of soil adsorption parameters specific for individual pesticide allowing better groundwater vulnerability assessment. Resulting specific pesticide groundwater vulnerability varies considerably with soil adsorption parameters. Acknowledgement Authors acknowledge the financial support of the Ministry of Education, Youth and Sports of the Czech Republic (grant No. 2B06095). References Aller L, Bennet T, Leher JH, Petty RJ, Hackett G (1987) DRASTIC: A standardized system for evaluating
groundwater pollution potential using hydrogeologic settings. EPA 600/2-87-035, 622 pp.
Gustafson DI (1989) Groundwater Ubiquity Score: A simple method for assessing pesticide leachability. Environ. Toxicol. Chem. 8, 339-537.
Kozák J, Němeček J, Jetmar M (1996) The database of soil information system – PUGIS. Plant Production 42(12), 529-534.
Němeček J et al. (2001) Soil Map of the Czech Republic 1:250 000. CULS, Prague.

© 2010 19th World Congress of Soil Science, Soil Solutions for a Changing World 1 – 6 August 2010, Brisbane, Australia. Published on DVD.
186
Sorption of sulfamethoxazole, sulfachloropyridazine and sulfamethazine onto
six New Zealand dairy farm soils Prakash SrinivasanA, B, Ajit K SarmahA, Merilyn Manley-HarrisB and Alistair L. WilkinsB ASoil Chemical & Biological Interactions, Landcare Research, Hamilton, New Zealand, Email: [email protected] BChemistry Department, University of Waikato, Private Bag 3105, Hamilton, New Zealand
Abstract We have investigated the sorption potential of three sulfonamides (SAs) in six New Zealand dairy farming soils using a modified batch equilibrium method employing 0.005 M CaCl2 as background solution. Both liquid and solid phases were extracted to analyse for the antibiotic concentrations in order to avoid underestimation that may arise a result of photolysis or biotic degradation. The experimental data were later used to construct Freundlich isotherms to determine the effective distribution coefficients. Low log Koc value for all SAs suggests considerable leaching potential for SAs under conditions that are conducive for leaching. The sorption affinity for all soils followed the trend SCP>SMZ>SMO.
Key Words Partitioning coefficient, sulfonamides, sorption Introduction Veterinary antibiotics (VAs) are used in large amounts for therapeutic, and prophylactic purposes in addition to their application as growth promoters. After administration, however, the majority of the antibiotics (up to 80%) are excreted unchanged or as their metabolites (Tolls, 2001). New Zealand has a rapidly expanding dairy industry, and well established beef, sheep, and pig and poultry production the livestock population excretes about 40 times more waste than the human population (Sarmah et al. 2006). With increases in the intensive use of antibiotics in NZ agriculture and direct land application of waste, there is concern that excreted compounds will migrate to the receiving environment with potential impact on surface and groundwater. Furthermore frequent use of antibiotics can also give rise to antibiotic resistant microbial populations, thereby creating a heightened concern among regulatory bodies and industries. Sulfonamides are a common class of antibiotic that are widely used in livestock operation, and because of their ionic nature they have the ability to leach through the soil and into the groundwater. Currently there are no fate data available for this group of antibiotics under varied pedo-climatic conditions in New Zealand. Therefore the aim of this study was to derive partitioning coefficients of three selected sulfonamides on six dairy farming soils with contrasting properties. Methods Soil
Six top soils (0-5 cm) representative of the dairy farming areas of New Zealand were collected fresh, air-dried, sieved (2mm), and physio-chemical properties determined (Table 1). Table 1. Selected properties of soils used in the study.
Soils pH 1:2.5 CaCl2
OC (%)
CEC (cmolc/kg)
Sand %
Silt %
Clay %
SSA
(m2g-1)
Matawhero silt loam 6.1 2.1 30 11 62 27 --- Te Kowhai silt loam 5.1 5 21.7 9 54 37 19.7 Hamilton clay loam Horotiu silt loam Manawatu sandy loam Gibsons sandy loam
5.1 5.4 5.4 5.2
4 8.2 3.3 1.1
17.2 25 9.7 7.6
19 34 87 45
51 48 11 41
30 17 2 14
22.3 19.7 13.6 ---
Chemicals
Sulfamethoxazole (SMO), Sulfachloropyridazine (SCP) and Sulfamethazine (SMZ) of >99% purity, and calcium chloride dihydrate (CaCl2·2H2O >99% purity) were obtained from Sigma Aldrich Chemical Company, St. Louis, MO. Acetonitrile, methanol (Chrom AR HPLC) and dichloromethane (DCM) were obtained from Mallinckrodt.
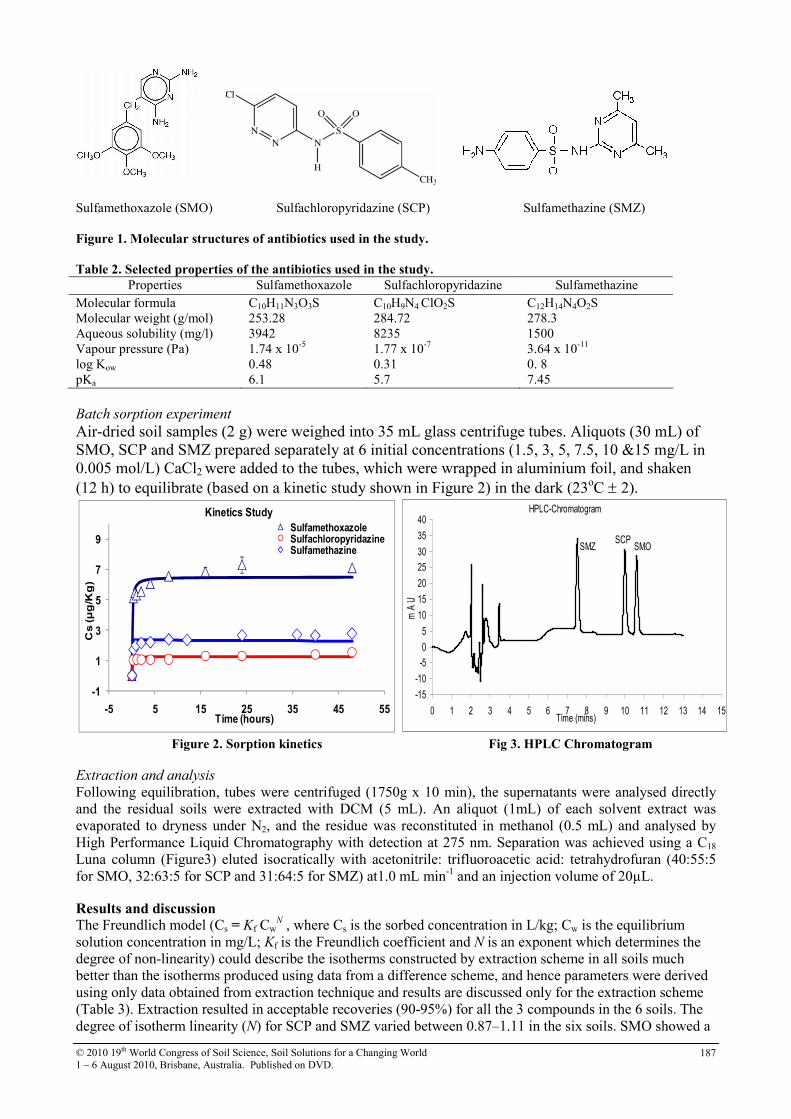
© 2010 19th World Congress of Soil Science, Soil Solutions for a Changing World 1 – 6 August 2010, Brisbane, Australia. Published on DVD.
187
Sulfamethoxazole (SMO) Sulfachloropyridazine (SCP) Sulfamethazine (SMZ) Figure 1. Molecular structures of antibiotics used in the study.
Table 2. Selected properties of the antibiotics used in the study.
Properties Sulfamethoxazole Sulfachloropyridazine Sulfamethazine Molecular formula Molecular weight (g/mol) Aqueous solubility (mg/l)
C10H11N3O3S
253.28 3942
C10H9N4 ClO2S
284.72 8235
C12H14N4O2S
278.3 1500
Vapour pressure (Pa) log Kow
pKa
1.74 x 10⁻⁵ 0.48 6.1
1.77 x 10⁻⁷ 0.31 5.7
3.64 x 10⁻¹¹ 0. 8 7.45
Batch sorption experiment
Air-dried soil samples (2 g) were weighed into 35 mL glass centrifuge tubes. Aliquots (30 mL) of SMO, SCP and SMZ prepared separately at 6 initial concentrations (1.5, 3, 5, 7.5, 10 &15 mg/L in 0.005 mol/L) CaCl2 were added to the tubes, which were wrapped in aluminium foil, and shaken (12 h) to equilibrate (based on a kinetic study shown in Figure 2) in the dark (23oC ± 2).
-1
1
3
5
7
9
-5 5 15 25 35 45 55
Cs (µg/Kg)
Time (hours)
Kinetics Study
SulfamethoxazoleSulfachloropyridazineSulfamethazine
Figure 2. Sorption kinetics Fig 3. HPLC Chromatogram
Extraction and analysis
Following equilibration, tubes were centrifuged (1750g x 10 min), the supernatants were analysed directly and the residual soils were extracted with DCM (5 mL). An aliquot (1mL) of each solvent extract was evaporated to dryness under N2, and the residue was reconstituted in methanol (0.5 mL) and analysed by High Performance Liquid Chromatography with detection at 275 nm. Separation was achieved using a C18 Luna column (Figure3) eluted isocratically with acetonitrile: trifluoroacetic acid: tetrahydrofuran (40:55:5 for SMO, 32:63:5 for SCP and 31:64:5 for SMZ) at1.0 mL min-1 and an injection volume of 20µL. Results and discussion The Freundlich model (Cs = Kf Cw
N , where Cs is the sorbed concentration in L/kg; Cw is the equilibrium
solution concentration in mg/L; Kf is the Freundlich coefficient and N is an exponent which determines the degree of non-linearity) could describe the isotherms constructed by extraction scheme in all soils much better than the isotherms produced using data from a difference scheme, and hence parameters were derived using only data obtained from extraction technique and results are discussed only for the extraction scheme (Table 3). Extraction resulted in acceptable recoveries (90-95%) for all the 3 compounds in the 6 soils. The degree of isotherm linearity (N) for SCP and SMZ varied between 0.87–1.11 in the six soils. SMO showed a
HPLC-Chromatogram
-15
-10
-5
0
5
10
15
20
25
30
35
40
0 1 2 3 4 5 6 7 8 9 10 11 12 13 14 15Time (mins)
mAU
SMZ SMOSCP

© 2010 19th World Congress of Soil Science, Soil Solutions for a Changing World 1 – 6 August 2010, Brisbane, Australia. Published on DVD.
188
highly non linear pattern (N=0.75) in just one soil (Manawatu). For SMO, Te Kowhai gave a linear isotherm (N = 1). Kd
eff values for the three antibiotics (at Cw = 1.5 mg/L) in the soils ranged from 0.37–4.6 L/kg. Matawhero soil (OC=2.1%) gave the smallest log Koc for all the 3 compounds. In general, sorption of sulfonamides was influenced by hydrophobic interactions and sorption increased with increases in OC content, except for Gibsons sandy loam soil. Average log Koc value for all sulfonamides between 1.21-2.38 log units suggested moderate to high leaching potential for SAs under conditions conducive for leaching.
Figure 4. Example of multiple-concentration batch sorption isotherms for SMO, SCP and SMZ using difference
and solvent extraction schemes. Symbols represent measured data, while solid lines represent Freundlich model
fits. Conclusion We have demonstrated that the technique of employing DCM to extract the solid phase provides good recoveries, and values are more robust than those obtained through a difference scheme when used to estimate sorption parameters. Overall sorption affinity for all compounds in six soils followed an order: SCP > SMZ >SMO. Based on their partitioning coefficient values, it can be concluded that these compounds may potentially be a risk to the groundwater under conditions conducive for leaching such as high rainfall. Sorption of these compounds is also likely to be pH dependent, and the compounds can behave like weak acids. Therefore much work is warranted to understand their sorption behaviour under realistic field situation especially in soils amended with manure, as manure pH can be higher than normal field soils.
References Tolls J (2001) Sorption of Veterinary Pharmaceuticals in Soil: A Review, Environmental Science and
Technology 35: 3397-3406 Sarmah, A.K., Meyer, M.J., Boxall, A.B.A. (2006). A global perspective on the use, sales, exposure pathways, occurrence, fate and effects of veterinary antibiotics (VAs) in the environment. Chemosphere 65, (725-759).
SMO-Tekowahi
0
5
10
15
20
25
30
35
0 5 10 15Equilibrium solution concentration (mg/L)
Sorb
ed concentration
(mg/kg)
Difference approach
Freundlich fitted
Extraction approach
Freundlich fitted
SCP-Matawhero
0
5
10
15
20
25
30
35
0 5 10 15
Equilibrium solution concentration (mg/L)
Sorb
ed concentration
(mg/kg)
SMZ-Horotiu
0
10
20
30
40
50
60
70
0 5 10 15Equilibrium solution concentration (mg/L)
Sorbed concentration
(mg/kg)

© 2010 19th World Congress of Soil Science, Soil Solutions for a Changing World 1 – 6 August 2010, Brisbane, Australia. Published on DVD.
189
Table 3. Summary of sorption parameters derived from the multiple-concentration isotherms constructed using
solvent extraction scheme in selected soils. Soils Sulfamethoxazole Sulfachloropyridazine Sulfamethazine
Log Log Log Kdeff Kf N R2
Koc
Kdeff Kf N R2
Koc Kd
eff Kf N R2
Koc
Matawhero silt loam
0.37 0.34 1.21 0.99 1.21 1 0.97 1.08 0.99 1.66 0.82 0.82 0.98 0.97 1.59
Te Kowhai silt loam
1.36 1.35 1.02 0.99 1.43 4.6 4.54 1.03 0.99 1.96 1.14 1.13 1.01 0.96 1.35
Hamilton clay loam
1.9 2 0.88 0.99 1.7 4.57 4.74 0.91 1 2.07 2.88 2.91 0.98 1 1.86
Horotiu silt loam
2.4 2.51 0.9 1 1.49 2.63 2.52 1.11 0.99 1.49 2.12 2.19 0.91 0.99 1.43
Manawatu sandy
1.36 1.51 0.75 0.98 1.87 4.31 4.55 0.87 0.99 2.14 0.77 0.88 0.98 1.44 0.77
Gibsons sandy loam
0.77 0.81 0.86 0.98 1.66 2.62 2.61 1.01 1 2.38 0.27 1.27 1 1.35 0.27
Kdeff is the concentration dependent effective sorption distribution coefficient (Kd
eff = Kf CwN-1) using lowest aqueous equilibrium solution
concentrations of Cw = 1.5 mg/l; concentration Koc is the OC-normalized sorption coefficient calculated using Koc = Kf CwN-1foc-1 at Cw = 0.5 mg/l;
Kdeff in l/kg and Kf in mg 1–N l N /kg
© 2010 19th World Congress of Soil Science, Soil Solutions for a Changing World 1 – 6 August 2010, Brisbane, Australia. Published on DVD.
190
Sources, characteristics, and management of agricultural dust, San Joaquin
Valley, California, USA
Randal J. SouthardA ALand, Air and Water Resources, University of California, Davis, CA 95616, USA, [email protected]
Abstract Crop production systems in California’s San Joaquin Valley (SJV) are significant contributors to atmospheric dust, including PM10 (particulate matter with aerodynamic diameter less than 10 micrometers), and contribute to violation of US air quality standards during most years. Ten years of field studies show that conservation tillage practices in cotton-tomato rotations reduce PM10 by 50% or more, compared to conventional systems. Dust mineralogy is similar to soil clay and silt mineralogy. Follow-up lab studies using a laboratory dust generator show that soil water content, soil texture, and soil aggregation all affect dust production. High dust production occurs on soils with low water content, high silt/clay ratios, and low degree of aggregation. Key Words Air quality, soil management, soil properties. Introduction For much of the past decade, California’s San Joaquin Valley (SJV) has been a United States Environmental Protection Agency serious non-attainment area for PM10 and other dust size fractions. At certain times of the year, PM10 is composed mostly of soil-derived material. The correspondence of air quality violations with intense tillage activities and PM10 composition has focused attention on row crop agriculture as a potential major contributor to PM10. This paper reports on studies of conservation tillage systems as a means to reduce PM10 and related dust fractions in the SJV and follow-up studies based on simulations with a laboratory dust generator to investigate dust production as a function of soil properties.
Methods Conservation tillage field studies
Field plots were established at the University of California West Side Research and Extension Center in Fresno County in 1999. The plots simulated a typical irrigated row crop rotation of cotton and tomato (Mitchell et al. 2008). Standard tillage systems included typical field operations. Conservation tillage systems maintained cropping beds and traffic lanes throughout the field experiment. Dust was collected in the field on Teflon filters connected to battery-operated vacuum pumps. Dust concentrations were calculated from pre- and post-filter weights, pump flow rates, and sampling time (Baker et al. 2005, Madden et al.
2008). Dust was characterized by scanning electron microscopy and X-ray diffraction.
Lab dust generator and lab studies
Field investigations of dust production are complicated by environmental conditions during sampling. We developed a lab dust generator to allow control of experimental conditions and more detailed investigations of the impact of soil properties on dust generation (Domingo et al. in press). Lab dust generation experiments were conducted on a wide array of soils mapped in the San Joaquin Valley. Results Conservation tillage field studies
Conservation tillage (CT) systems reduced the number of in-the-field operations, and reduced total and respirable dust (Figure 1, after Baker et al. 2005). Cover cropped systems produced more dust compared to no-cover-crop treatments and more organic matter in the dust (Figure 2).

© 2010 19th World Congress of Soil Science, Soil Solutions for a Changing World 1 – 6 August 2010, Brisbane, Australia. Published on DVD.
191
Figure 1. Cumulative total (less than 100 micrometers) and respirable dust (less than 4 micrometers) production
from standard and conservation cotton-tomato rotation tillage systems with and without cover crops.
Figure 2. Scanning electron micrograph of mineral and organic particles in respirable dust from planting
operations in a conservation tillage with cover crop treatment.
Lab dust generator and lab studies
Lab experiments with the dust generator (Figure 3) show that soil properties, including soil water content and potential, soil aggregation, and soil texture, in particular the silt to clay ratio (Figure 4, after Madden et al.
2009), have a significant influence on dust generation, and must be taken into account when devising dust mitigation strategies.
Rotating Chamber
Blower
Diffuser
fan
motor
Settling Chamber
Figure 3. Schematic diagram of the laboratory dust generator.

© 2010 19th World Congress of Soil Science, Soil Solutions for a Changing World 1 – 6 August 2010, Brisbane, Australia. Published on DVD.
192
Figure 4. Laboratory generated dust as a function of silt-to-clay ratio.
Conclusions Conservation tillage reduces dust by about 50 to 90% compared to standard tillage. Cover crops increase dust production. Soil water content, aggregation, and texture affect dust production. As soils dry, they reach a dust production threshold that is dependent on the particle size distribution. Soil dust production increases as soils become less aggregated with repeated tillage operations, especially at low water contents. The silt-to-clay ratio was the best predictor of dust production at water contents below the dust production threshold. Soil properties must be taken into account when devising dust mitigation strategies. References Baker JB, Southard RJ, Mitchell JP (2005) Agricultural dust production in standard and conservation tillage
systems in the San Joaquin Valley. Journal of Environmental Quality 34, 1260-1269.
Domingo RA, Southard RJ, Lee K. Laboratory system for dust generation from soils. Journal of
Environmental Quality. In press.
Mitchell JP (2008) Transition to conservation tillage evaluated in San Joaquin Valley cotton and tomato rotations. California Agriculture 62, 74-79.
Madden NM, Southard RJ, Mitchell JP (2009) Conservation tillage reduces PM10 emissions in dairy forage rotations. Atmospheric Environment 42, 3795-3808.
Madden NM, Southard RJ, Mitchell JP (2009) Soil water content and soil disaggregation by disking affects PM10 emissions. Journal of Environmental Quality 38, 36-43.

© 2010 19th World Congress of Soil Science, Soil Solutions for a Changing World 1 – 6 August 2010, Brisbane, Australia. Published on DVD.
193
Space-time monitoring of prescribed burnt soils performance – an effective tool
for forest management
Ana C. Meira CastroA,B,C, J. GóisA and J. P. MeixedoA,B ACIGAR, Faculdade de Engenharia da Universidade do Porto, Rua Dr. Roberto Frias, s/n 4200-465 Porto, Portugal. BLEMA, Instituto Superior de Engenharia do Porto, R. S. Tomé, 4200-072 Porto, Portugal. CCorresponding author. Email [email protected] Abstract Among the most important measures to prevent wild forest fires is the use of prescribed and controlled burning actions in order to reduce the availability of fuel mass. However, the impact of these activities on soil physical and chemical properties varies according to the type of both soil and vegetation and is not fully understood. Therefore, soil monitoring campaigns are often used to measure these impacts. In this paper we have successfully used three statistical data treatments - the Kolmogorov-Smirnov test followed by the ANOVA and the Kruskall-Wallis tests – to investigate the variability among the soil pH, soil moisture, soil organic matter and soil iron variables for different monitoring times and sampling procedures. Key Words Forest soil, prescribed fire, soil properties, forest management. Introduction In Portugal, prescribed fires are often used by forest managers in order to reduce the likelihood of wildfires or to minimize their impact if they occur (Botelho et al. 1999; Fernandes et al. 2004). This forest management strategy of fire prevention has legal support under Portuguese law and is generally implemented between October and April (PNDFCI 2008). Although several studies have shown a direct relation between these controlled actions and the decrease of wildfire occurrences, the overall impact of these preventive actions on Portuguese forestry soil and geosystems is complex and not completely characterized (Rau et al. 2008). In this work we intend to present information about space and time modifications of some forest soil properties, namely pH, soil moisture, organic matter and iron, previously submitted to prescribe burning. The Kolmogorov-Smirnov, ANOVA and Kruskal- Wallis statistical analysis tests were used to examine the variance and relationship among these forest soil properties. The data used for this work focused on monitoring records of a forest soil self-recovery capabilities once subjected to a prescribed fire by AFN (The Portuguese Authority for Forests) in March 2008. The forest soil properties considered were pH, soil moisture, organic matter content and iron content. A sub-layer sampling procedure was considered during a one year span (Castro 2009; Ribeiro 2009). Material and methods Gramelas is located in NW Portugal and is referred in the Portuguese cartographic unit as Ru 1,1. It has as pedological dominant units the thin umbric regosol in shale (RGul.x) and the umbric leptosol in shale (LPu.x). As subdominant pedological units, it has the chromic cambisol humic/umbric in deposits of quartzite and/or shales (CMux.vq), and the dystrict leptosol in shale (LPd.x) (DRAEDM 1995; Serviços Geológicos de Portugal 1961). According to the information available in the Portuguese Soil Map (DRAEDM 1995; Serviços Geológicos de Portugal 1961) this soil has the following characteristics: low capacity of cationic exchange, low degree of base saturation and low capacity of water and nutrient retention. It also possesses the following characteristics: i) very reduced thermal amplitude; ii) available conditions for the radicular development in the soil layer between 30 the 50 cm; iii) low soil fertility; iv) no occurrence of water in the soil throughout most of the year except in very short periods and during intense rainfalls; v) occasional occurrence of a high deficit of water in the soil during July through September; vi) high risk of erosion without aptitude for agriculture and with low aptitude for the forest exploration and/or silviculture-shepherd concerns; vii) soil with less than 50% of coarse elements (rock and gravel) in horizons superficial and subsurface up to 50 cm of depth; viii) without terraces or with wide terraces; ix) dominant slopes varying between 25-30% to 40-45%. The studied area (approximately 1ha) had not been burned for approximately 7 years and was subjected to prescribed fire by the AFN in March 2008.

© 2010 19th World Congress of Soil Science, Soil Solutions for a Changing World 1 – 6 August 2010, Brisbane, Australia. Published on DVD.
194
(a) (b) (c)
Figure 1. Appearance of the area in study: (a) before, (b) during and (c) after the forest fire.
The soil samples were taken during six different phases (before prescribed forest fire, right after the prescribed fire, and 45, 90, 270 and 360 days after the prescribed forest fire) and used to determine soil pH, soil moisture, organic matter and iron. Five distinct points for sampling collection were considered: Point number 1 was located on a level land with low vegetation, close to a water line; Point number 2 was located in level land with lots of vegetation; Point number 3 was located on a strong slope with low vegetation, Point number 4 was located on a strong slope with lots of vegetation; Point number 5 was located on level land with low vegetation. The sub-layers sampling collection procedure consisted of collecting16 sub-samplings on a previously traced circumference with 2 meters of diameter in three different depths (3cm, 6cm and 18cm) using a clean manual auger. The soil samples were transported to the laboratory in air-tight bags which clearly identified the point of the sampling collection and the depth and the date of the collection procedure. The statistical analysis - results and discussion The Kolmogorov-Smirnov test was used as the first statistical analysis approach. This allowed us to draws conclusions about the normality of the variable’s distribution. Considering maxK-S = max |Fo(xi) – Ft(xi)| (1) where, maxK-S = maximum different between theoretical and observation values, the following results were obtained: Table 1. Kolmogorov-Smirnov test output.
Null hypothesis – H0: “normality assumptions about the distribution
of variables” N = 90; α = 0,05 ; K-Scrit. = 0,143 Variables K-S Test pH (max K-S = 0,139) Accept H0 Sm - (soil moisture) (max K-S = 0,104) Accept H0 Om - (orgânic matter) (max K-S = 0,084) Accept H0 Fe - (iron content) (max K-S = 0,148) Rejected H0
According to these results, the normality of the data could not be verified for all variables and therefore two different statistical data treatments were considered – the ANOVA and Kruskall-Wallis tests. The ANOVA test was used to analyze homogeneity of the samples in space and on soil properties values in time where
( ) ( )
R
Aj
jij
i
R
j
j
AV
VF
kkn
xx
Vn
xxk
V =−
−
=−
−
=∑∑∑
;;1
22
(2)
where, VA = samples variance and VR = group variance, the following results were obtained: According to these ANOVA results, and although the homogeneity on all soil properties during the monitoring time was not verified (that is H0: µpH = µpH1 = … =µpH365 is rejected), the soil parameters pH, organic matter and iron show homogeneity in space and/or in depth. That is, the local of sampling collection clearly influences the soil properties values but no significant difference were found at the same sampling local at different depths (0-3cm, 3-6cm and 6-18cm). Attempts were made to draw conclusions about the median behavior of soil properties (variables) with the Kruskall-Wallis test It is a one-way analysis of variance by ranks nonparametric test. As a distribution free test, there is no need to use normality assumptions about the distribution of variables, so it is assumed that the samples drawn from the population are random and the cases of each group are independent. The value of Kruskal- Wallis test given by

© 2010 19th World Congress of Soil Science, Soil Solutions for a Changing World 1 – 6 August 2010, Brisbane, Australia. Published on DVD.
195
( )( )13
1
12
1
2+−
+= ∑
=
NnNN
Kk
jjj R
(3)
where, K = Kruskal- Wallis test value, , the following results were obtained: Table 2. ANOVA test output.
Null hypothesis – H0: “ there are no differences between
means of different groups (times)” α = 0,05 ; Fcrit. = 2,32 Variables ANOVA pH (F = 132,08) Rejected H0 Sm - (soil moisture) (F = 4,674) Rejected H0 Om - (orgânic matter) (F = 20,152) Rejected H0 Fe - (iron content) (F = 10,643) Rejected H0 Null hypothesis – H0: “ there are no differences between
means of different samples (locals)” α = 0,05 ; Fcrit. = 1,826 Variables ANOVA pH (F = 0,093) Accept H0 Sm - (soil moisture) (F = 1,860) Rejected H0 Om - (orgânic matter) (F = 0,728) Accept H0 Fe - (iron content) (F = 0,628) Accept H0
Table 3. Kruskall-Wallis test output.
Null hypothesis – H0: “ samples are from identical populations -
equality of population medians ” α = 0,05 ; =11,07 Variables Kruskall-Wallis Test pH (K = 80,60) Rejected H0 Sm - (soil moisture) (K = 25,24) Rejected H0 Om - (orgânic matter) (K = 57,11) Rejected H0 Fe - (iron content) (K = 38,62) Rejected H0
According to the Kruskall-Wallis test, the ANOVA results have been confirmed, that is, all groups of variables exhibit different median behaviors (e.g. pH, pH1, pH30, pH90, pH270, pH365) and cannot be considered as belonging to the same population. Conclusions There is a great variability among the variables when considering the records at different monitoring times according to the statistical procedures that were used in this study. Thus, it may be said that the time between each sampling campaign is crucial for the values obtained in different variables. On the other hand, each sampling site showed a relative homogeneity. This will allow us to consider the possible replacement of three samples at different depths for a single sample at a single depth (we propose an average depth).
References Anderson MZ, Diniz D (2006) Effects of Prescribed Burning on Humidity, Physical and Chemical
Properties, Organic Matter and Soil Temperature on Grazing Pasture – Efeito da queima sob o teor de umidade, características fisicas e quimicas, materia organica e temperatura no solo sob pastagem. Revista
Electrónica de Veterinaria VII, 04.
Botelho H, Rigolot E, Rego F, Guarneri F, Binggelli F, Vega J, Fernandes P, Prodon R, Molina D, Gouma V, Leone V (1999) FIRE TORCH, Prescribed burning as a tool for the mediterranean region: a management approach. Contrat N° ENV4-CT98-0715. Periodic Tecnical Report; UTMAD Portugal; PIF.
Carter MC, Foster CD (2004) Prescribed burning and productivity in southern pine forests: a review. Forest
Ecology and Management 191, 93–109.
Certini G (2005) Effects of fire on properties of forest soils: a review. Oecologia 143, 1–10.
DeBano LF (1991) ‘The effect of fire on soil properties. Proceedings of Management and Productivity of Western-Montana Forest Soils’. General Technical Report INT-280. (USDA Forest Service: Ogden).
DRAEDM-Agroconsultores and Geometral (1995) Soil and possible land use on Entre Douro and Minho region - Carta de solos e carta de aptidão da terra do Entre Douro e Minho. Escala 1: 100 000.
© 2010 19th World Congress of Soil Science, Soil Solutions for a Changing World 1 – 6 August 2010, Brisbane, Australia. Published on DVD.
196
EUFIRELAB (2006) Methods to study fire impacts on plants (forest stands, shrubs, herbaceous taxa), soil and fauna.
Fernandes P, Botelho H (2004) Analysis of the prescribed burning practice in the pine forest of northwestern Portugal. Journal of Environmental Management 70, 15–26.
Gonzalez-Perez J, Gonzalez-Vila F, Almendros G, Knicker H (2004) The effect of fire on soil organic matter - a review. Environment International 30, 855– 870.
Neff JC, Harden JW, Gleixner G (2005) Fire effects on soil organic matter content, composition, and nutrients in boreal interior Alaska. Canadian Journal of Forest Reseach, 35, 2178–2187.
PNDFCI (2008) ‘Plano Nacional de Defesa da Floresta contra Incêndios’.
Rau BM, Chambers JC, Blank RR, Johnson DW (2008) Prescribed Fire, Soil, and Plants: Burn Effects and Interactions in the Central Great Basin. Rangeland Ecology and Management 61, 169–181.
Rego FC (1986) Effects of prescribed fire on vegetation and soil properties in Pinus pinaster forests of Northern Portugal. PhD thesis, University of Idaho, Moscow.
Serviços Geológicos de Portugal (1961) ‘Carta Geológica de Portugal, Notícia explicativa de Caminha. Lisboa’.
Siegel, Castellan (1988) ‘Nonparametric Statistics for the Behavioral Sciences’. 2nd edition. (New York: McGraw–Hill).

© 2010 19th World Congress of Soil Science, Soil Solutions for a Changing World 1 – 6 August 2010, Brisbane, Australia. Published on DVD.
197
Stakeholders participation in watershed management for sustainable agriculture
M. S. Nataraju and K. V. Madhava Reddy Professor of Agricultural Extension & Head, Communication Centre, 2Ex-PG student (Agril. Extension) University of Agricultural Sciences, GKVK, Bangalore -560 065, India, Email [email protected] Abstract Watershed Development Programme in India is being implemented by both Government and Non- Government Organizations and is incurring lot of expenditure. Realising the importance of people’s participation in Watershed Development Programme, a comparative analysis of people’s participation in WDP implemented by Government and Non- Government Organization was conducted in Eastern Dry Zone of Karnataka State. Two watersheds, one implemented by Government Organization – Kalyanakere Mavathur and other implemented by Non- Government Organization – Kamasamudram (MYRADA) were selected. The sample size constitute 120 beneficiaries, 60 from each watershed spread over four micro-watersheds. The study revealed that majority of the GO Beneficiaries had medium level of participation (36.7 per cent) as against NGO, who had high level of participation (58.4 per cent). A high level of participation was observed in collection of facts, analyzing the situation, identifying the problem, deciding on objectives, developing a plan of work and execution of a plan by NGO beneficiaries. On the contrary, the GO Watershed beneficiaries were found to have a low level of participation in steps viz; collection of facts, identifying the problem, deciding on objectives, developing a plan, execution of plan and evaluation. Majority GO beneficiaries were found to have information, consultation and functional type of participation in different steps of WDP. While most of the NGO beneficiaries were found in functional, information and consultation type of participation. A majority of the beneficiaries expressed a lack of knowledge as the major constraint to participation which suggested conducting an effective educational activities and creating an awareness of the programme.
Key Words Watershed, sustainable agriculture, peoples participation. Introduction Rainfed agriculture is the key to sustainable development of water and food. In India, more than 70 per cent of the cultivated area is rainfed and rainfed agriculture produces about 45 per cent of total food grain production (Swaminathan 1996). The potential for increasing the irrigable area and enhancing productivity from irrigated lands has its limitations. Therefore, if the country has to conserve and develop natural resources in rainfed areas to improve their production and productivity, their development on watershed basis is inevitable. At present, over 8000 watershed projects are being implemented by government and nongovernmental organisations in India.Watershed development encompasses dimensions like equity, sustainability, gender and social and environmental impact assessment. It has become a trusted tool for the overall development of a village and people living within a watershed area. It has been conceived basically as a strategy for protecting the livelihoods of the people inhabiting the fragile ecosystem experiencing soil erosion and moisture stress. It comprises of development of the watershed area with an integrated approach to harmonize the use of natural resources like land, water, vegetation, livestock, fisheries and human resources with the active involvement of the beneficiary community. Thus, it is being used as a rational unit for planning and management of soil, water and other natural resources. These programmes necessarily involve individual, group and community action. In this direction, the present study has been designed to study the extent and type of participation of beneficiaries in watershed development programmes implemented by Government Organization and Non-government Organization besides knowing their problems in participation. Methods The study was conducted in purposely selected Eastern Dry Zone of Karnataka state. For the purpose of comparison two watersheds implemented by Government Organization (Kalyanakere-Mavathur) and Non-government Organization Kamasamudram (MYRADA) were selected for the study. Four micro watersheds were selected in each watershed on a random basis. A proportionate random sampling method was employed to select to 60 beneficiaries in each watershed spread over four micro-watersheds. Thus, the total sample size

© 2010 19th World Congress of Soil Science, Soil Solutions for a Changing World 1 – 6 August 2010, Brisbane, Australia. Published on DVD.
198
constitutes 120 beneficiaries. The data were collected through a personal interview method using a pre-tested structured interview schedule. The obtained data were tabulated, analysed and interpreted using appropriate statistical measures. Results Overall participation of beneficiaries in watershed development programme
Table-1 indicated that the beneficiaries participation in NGO implemented watersheds was found to be more (median value 85 per cent) than for Government organize implemented watersheds (12 per cent). The probable reason for the high participation of farmers in NGO implemented watersheds is that NGO had developed the programme based on felt needs and conducted the educational activities and need based training methods so as to involve farmers in planning and implementation of the programme. Moreover, they conducted participatory approaches with beneficiaries. Table 1. Overall participation of beneficiaries in watershed development programme.
Government Organization
Non-Government Organization
Total Participation Score
Number Per cent Number Per cent Number Per cent
Chi- Square Value
Above median 7 11.7 51 85.0 58 48.4
Below median 53 88.3 9 15.0 62 51.6 61.7 **
Total 60 100.0 60 100.0 120 100.0
Median value 55.5 ** Significant at 0.01 probability level Extent of participation in different stages of watershed development programme
Figure 1. Extent of participation in different stages of watershed development programme.
Figure 1 indicates that more than two-thirds of the NGO beneficiaries (66.7 per cent) had a high level of participation in collection of facts compared to 63.3 percent of GO beneficiaries who had low level of participation. A similar trend was observed with respect to participation of GO and NGO beneficiaries in analyzing the situation, where 58.4 per cent of the GO beneficiaries and 80 per cent of the NGO beneficiaries had low and high levels of participation respectively. In identifying the problem, 86.6 percent of the GO beneficiaries exhibited low to medium level of participation as against 91.7 per cent of NGO beneficiaries, who showed medium to high levels of participation. Regarding deciding on the objectives, a large majority of the GO beneficiaries (70 per cent) had a low level of participation compared to almost similar number of NGO beneficiaries (66.8 per cent) with a high level of participation. More than half of the GO beneficiaries (53.3 per cent) had a low level of participation in developing a plan of work. On the contrary 66.8 per cent of the NGO beneficiaries had a high level of participation in this step. In Execution of the plan, 70 per cent of GO beneficiaries showed a low level of participation compared to 66.8 per cent of NGO beneficiaries.
0
1 0
2 0
3 0
4 0
5 0
6 0
7 0
G O N G O G O N G O G O N G O G O N G O G O N G O G O N G O G O N G O G O N G O
C o l le c t i o n o f
f a c t s
A n a ly s is o f
s i t u a t i o n
Id e n t i f i c a t io n o f
p r o b le m
D e c id in g th e
o b je c t iv e s
D e v e lo p in g p la n
o f w o r k
E x e c u t i o n o f
p la n
D e t e rm in in g th e
p r o g r e s s
E v a lu a t io n a n d
r e c o n s id e r a t io n
S ta g e s in W D P
Extent of participation
H ig h
M e d iu m
L o w
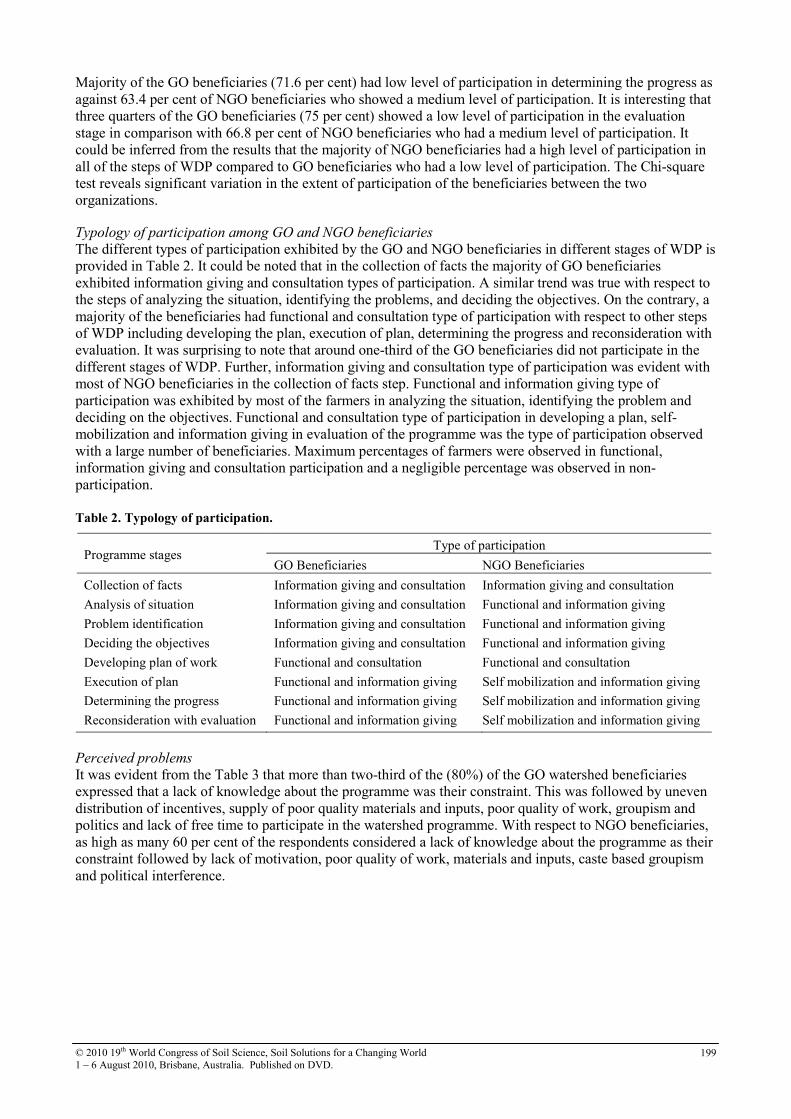
© 2010 19th World Congress of Soil Science, Soil Solutions for a Changing World 1 – 6 August 2010, Brisbane, Australia. Published on DVD.
199
Majority of the GO beneficiaries (71.6 per cent) had low level of participation in determining the progress as against 63.4 per cent of NGO beneficiaries who showed a medium level of participation. It is interesting that three quarters of the GO beneficiaries (75 per cent) showed a low level of participation in the evaluation stage in comparison with 66.8 per cent of NGO beneficiaries who had a medium level of participation. It could be inferred from the results that the majority of NGO beneficiaries had a high level of participation in all of the steps of WDP compared to GO beneficiaries who had a low level of participation. The Chi-square test reveals significant variation in the extent of participation of the beneficiaries between the two organizations. Typology of participation among GO and NGO beneficiaries
The different types of participation exhibited by the GO and NGO beneficiaries in different stages of WDP is provided in Table 2. It could be noted that in the collection of facts the majority of GO beneficiaries exhibited information giving and consultation types of participation. A similar trend was true with respect to the steps of analyzing the situation, identifying the problems, and deciding the objectives. On the contrary, a majority of the beneficiaries had functional and consultation type of participation with respect to other steps of WDP including developing the plan, execution of plan, determining the progress and reconsideration with evaluation. It was surprising to note that around one-third of the GO beneficiaries did not participate in the different stages of WDP. Further, information giving and consultation type of participation was evident with most of NGO beneficiaries in the collection of facts step. Functional and information giving type of participation was exhibited by most of the farmers in analyzing the situation, identifying the problem and deciding on the objectives. Functional and consultation type of participation in developing a plan, self-mobilization and information giving in evaluation of the programme was the type of participation observed with a large number of beneficiaries. Maximum percentages of farmers were observed in functional, information giving and consultation participation and a negligible percentage was observed in non-participation. Table 2. Typology of participation.
Type of participation Programme stages
GO Beneficiaries NGO Beneficiaries
Collection of facts Information giving and consultation Information giving and consultation
Analysis of situation Information giving and consultation Functional and information giving
Problem identification Information giving and consultation Functional and information giving
Deciding the objectives Information giving and consultation Functional and information giving
Developing plan of work Functional and consultation Functional and consultation
Execution of plan Functional and information giving Self mobilization and information giving
Determining the progress Functional and information giving Self mobilization and information giving
Reconsideration with evaluation Functional and information giving Self mobilization and information giving
Perceived problems
It was evident from the Table 3 that more than two-third of the (80%) of the GO watershed beneficiaries expressed that a lack of knowledge about the programme was their constraint. This was followed by uneven distribution of incentives, supply of poor quality materials and inputs, poor quality of work, groupism and politics and lack of free time to participate in the watershed programme. With respect to NGO beneficiaries, as high as many 60 per cent of the respondents considered a lack of knowledge about the programme as their constraint followed by lack of motivation, poor quality of work, materials and inputs, caste based groupism and political interference.

© 2010 19th World Congress of Soil Science, Soil Solutions for a Changing World 1 – 6 August 2010, Brisbane, Australia. Published on DVD.
200
Table 3. Perceived problems of beneficiaries in participation.
GO Watershed NGO Watershed Sl. No.
Problems No. % Rank No. % Rank
1. Lack of knowledge 48 80.0 I 36 60.0 I 2. Uneven distribution of incentives 41 68.3 II 14 23.3 VI 3. Supply of poor quality materials 40 66.6 III 16 26.6 IV 4. Poor quality of work 38 63.3 IV 18 30.0 III 5. Caste based groups & Political
interference 36 60.0 V 15 25.0 V
6. Lack of free time to participate in watershed activities
33 55.0 VI 4 6.6 XIII
7. Unfavourable attitude of extension personnel
31 51.6 VII 10 16.6 IX
8. Lack of resources 28 46.6 VIII 13 21.6 VII 9. Lack of incentives and motivation from
the implementing agencies 26 43.3 IX 8 13.3 X
10. Lack of interest 21 35.0 X 12 20.0 VIII 11. Lack of motivation from the village
leaders 20 33.3 XI 25 41.6 II
12. Improper locations of soil and water conservation structures
17 28.3 XII 6 10.0 XI
13. Not concerned with local needs 15 25.0 XIII 5 8.3 XII Conclusion The study conclusively demonstrated that the majority of beneficiaries of the watershed development programme implemented by a government organisation had a medium level of participation. A majority of the NGO beneficiaries had a high level of participation in all the stages of watershed development programme viz. collection of facts, analysis of situation, identification of problem, deciding on objectives, developing plan of work, execution of plan, determining the progress and reconsideration compared to GO beneficiaries who exhibited a low level of participation. Most of the GO and NGO beneficiaries were found to have information, consultation and functional types of participation in different steps of the WDP. A majority of the farmers expressed a lack of knowledge about watershed development as their major constraints to participation. References Swaminathan MS (1996) Sustainable agriculture towards an evergreen revolution. Konark. Pub. Pvt. Ltd.
New Delhi.
© 2010 19th World Congress of Soil Science, Soil Solutions for a Changing World 1 – 6 August 2010, Brisbane, Australia. Published on DVD.
201
Strategic thinking on soil protection in China Zhao QiguoA, Luo YongmingA and Teng YingA AInstitute of Soil Science, Chinese Academy of Sciences, Nanjing, P.R.China, Email [email protected] Abstract Research on China’s soil protection strategy from state macroscopic and long term perspectives is of great significance for sustainable use and protection of soil resources, improvement of soil environmental quality, and ensuring agricultural production and food safety. Based on analysis of advancement and development trends of soil protection at home and abroad, this paper identifies some shortcomings in soil protection in China and gaps as compared to systems in place in developed countries and raises the key issues in the macro-strategy research on soil resources and the environment. These issues include (1) major problems of current soil protection in China; (2) guiding ideology and theory (namely macro strategy) of soil protection in China, comprising strategic concepts, guidance, objectives, missions and emphasis; (3) countermeasures in the soil protection strategy in China, consisting of management, standards, science and technology, regional soil protection, environmental protection and remediation of major soil types. This paper provides a useful reference for establishing and implementing strategic planning of soil protection in China.
Key Words Soil, environment, protection, strategic thinking.
With the development of industrialization, urbanization, intensive agriculture and global change, the environmental status of Chinese soils has become more and more severe. Therefore, it is imperative to enhance strategic researches on the protection of soil resources and the environment. Aimed at major problems and demands in soil resources, soil fertility, soil ecology and soil environment, the strategic research on soil protection in China from macroscopic and long-term perspectives will have substantial realistic and far-reaching historic value in sustainable use, protection of soil resources, improvement of soil quality, securing agricultural production, food safety, ecological safety, safety of human residence as well as in the establishment of a well-off and eco-friendly society . 1 . Soil problems in China and the urgency of soil protection 1.1 Loss of soil resources and its rapid deterioration
China boasts vast expanse of landscapes, complex natural conditions and plentiful soil resources. The Chinese soil resources can be characterized by diversified soil types, huge absolute quantity, and small per capita soil resources. Currently China has two major problems concerning soil resources: namely loss of soil resources and soil deterioration. China has been facing with a number of soil resource problems including water loss and soil erosion, soil fertility reduction, desertification, soil salinization, rocky desertification as well as soil acidification, which has posed serious threats to ecological safety.
1.2 Acceleration of regional soil pollution
Results of recent soil quality survey revealed obvious pedogeochemical abnormity or pollution at watershed or regional level. Cd, Pb and Hg abnormity have been found in the Yangtze River basin, Pearl River basin and coastal areas, Songhua River basin and Liao River basin. High fluorine, high arsenic, and low iodine was found in the Yellow River basin. Soil mercury abnormity was reported in Chinese cities of different size. Preliminary analysis showed that the pedogeochemical abnormities at watershed level are combined results of high natural geochemical background and anthropogenic pollution. In some watershed with heavy metal abnormity or pollution, soil geochemical status deteriorates rapidly.
1.3 Lack of science & technology for soil protection
Although outstanding progress has been made in China concerning soil pollution survey, physical, chemical and biological remediation, gaps still exist between China and developed countries where soil remediation have been commercialized. China starts late in the research of soil pollution control; technology, material and equipment for soil remediation. Therefore, it is time to initiate studies on innovative remediation technologies and to develop technologies, equipments and management system for contaminated farmland, soil around mining area and soil on industrial sites.

© 2010 19th World Congress of Soil Science, Soil Solutions for a Changing World 1 – 6 August 2010, Brisbane, Australia. Published on DVD.
202
1.4 Weak public awareness and incomplete legislations in soil protection
Public awareness of soil protection is weak with little consciousness and enthusiasm. Government officials do not have adequate knowledge of soil resources, soil quality and soil function and the social value of soils, therefore little was done to raise the awareness of the general public to protect the soil protection. Education concerning soil environment is also inadequate with no specialized authorities or organizations. So far, China has not legislated any law or regulation for soil pollution prevention. Not much research has been done on soil environmental criteria and standards. Until now the soil environmental quality standard is still in revision.
1.5 The urgency of soil and environmental protection
Due to rapid social and economic development and highly intensified human activities in the past 20 years, soil degradation has increased in quantity and expanded, therefore more challenges are to be dealt with in the coming 15 years. The main reasons for soil problems are two fold. On the one hand, the importance of soil protection was not recognized. There is no specialized law, administrative structure, mechanism and supervision system for soil environmental protection. On the other hand, there was lack of investment and research on key scientific, technological, and management problems. And most of all, there is lack of macroscopic thinking of soil and environmental protection strategies. Therefore, it is vital that a macroscopic strategy for soil environmental protection be made by integration of knowledge, technology and management. It should be based on assessment of current situation of soil environmental protection in China and international experience. The aims of the macroscopic strategy is to establish a harmonious, sustainable soil environmental protection system to improve soil quality, agricultural production, food safety, the environment, ecological safety and human health. 2. Macroscopic strategies of soil protection 2.1 Guiding thoughts and strategic principles
2.1.1 Guiding thoughts
Under the guidance of scientific development, a pedosphere research framework which incorporates soil- water- air- biota -human and a soil management framework which incorporates prevention- control-remediation- supervision should be established with the emphasis on dealing with soil problems at basin, regional levels. The goal is to secure national food safety, the environment, ecological safety and public health as well as construction of a well-off society.
2.1.2 Strategic principles
In the face of apparent or hidden problem of soil degradation and soil pollution at present or in the long run, scientific development should be implemented. The following relationships need to be considered: soil resource protection vs social economic development, maintaining soil fertility vs sustainable agriculture, soil ecology vs biodiversity, soil pollution control vs safe residential environment, wise utilization of soil vs global change, investment for soil protection from central and local governments. Soil utilization and soil protection, soil quantity and soil quality should be considered equally important. The importance of soil pollution prevention should be emphasized. Soils should be protected according to different regions and soil types. Enduring efforts are needed to building soil protection system with Chinese characteristics by progress in science and technology, law enforcement, and increasing public awareness of soil protection.
2.2 Strategic goals
The strategic goals are to maintain soil ecological functions, improve soil environmental quality, secure agricultural production, food safety and human health. It is necessary to ascertain soil quantity and quality, to improve soil fertility and self purification function, to prevent and alleviate soil degradation and soil pollution, to actively push forward innovation in soil science and technological development including theories of pedosphere and research tools, technologies for prevention and remediation of degraded or polluted soils. To achieve the overall goals, short term, middle-term, and long-term goals are set as follows: (1) Short-term goals (till 2020): Establish and complete legislation, structure and mechanisms for soil protection, build preliminary national soil protection system, effectively control quantity and quality of soil resources, improve science and technology for soil protection, effectively control the trend of soil pollution and degradation, effectively remediate polluted soils which pose serious threat to food safety, drinking water safety and human health, make progress in protecting soil in ecologically fragile areas and major agricultural zones. (2) Middle-term goals (till 2030): Further improve the national soil protection system, improve soil research and education level; generally control the trend of regional soil degradation and soil pollution, remediate

© 2010 19th World Congress of Soil Science, Soil Solutions for a Changing World 1 – 6 August 2010, Brisbane, Australia. Published on DVD.
203
polluted soil posing unacceptable risks, achieve better soil environmental quality in China. (3) Long-term goals (till 2050): Generally alleviate soil pollution and stabilize the trend of soil degradation, largely improve soil ecological functions and environmental quality, improve the national soil protection system and R&D supporting system, and achieve sustainable use of soil resources and eco-environmental protection which fits the social and economical development level.
2.3 Six strategic tasks
2.3.1 Securing and promotion of agricultural production
National soil quantity and quality survey should be conducted periodically in a comprehensive and systematic way to understand the dynamic change of soil quantity and quality and prominent soil environmental problems. A national soil resources and quality information system should be established and soil environmental quality standard should be formulated on scientific basis. Great efforts should be made to strengthen environmental protection in rural areas including protecting soil in major agricultural areas, strictly control the use of chemical fertilizer, pesticides, sewage sludge and agricultural waste. By doing so, improvement of soil fertility and protection of soil environment can be achieved at the same time.
2.3.2 Protection of human health and ecosystem
Effective measures should be taken to prevent pollutants from entering the soil. To prevent soil acidification, air-borne deposition should be strictly controlled and the development of protected agricultural should be carefully controlled. Risk based approach should be used for assessment and management of soil environmental quality. To secure the safety of agricultural products and food, protect the safety of residential areas and human health, integrated measures need to be planned to remediate polluted urban and rural soils progressively.
2.3.3 Mitigation of degraded soil in ecologically fragile areas
To implement soil protection in ecologically fragile areas, it is important to strengthen control of regional soil erosion, sand storm source area and mitigation of degraded soil and control the trend of soil erosion, grassland degradation, desertification, salination, and rock desertification.
2.3.4 Protection of soil in areas with important functions
It is important to protect soils at key ecological conservation areas and nature reserves such as water source zone, flood conditioning & storage area, windproof and dune-fixing area, water and soil conservation area, and habitat of important species so that soil environmental quality is good enough to protect the biota and water body.
2.3.5 Soil environmental research and development
An innovative soil research and development system should be established which integrates fundamental research, environmental standards, and application of high technology. Long lasting soil scientific research and technological development should aim at soil problems at national or regional levels such as formation of soil obstacles, the rules of soil quality evolution, soil quality criteria and standards. Technologies and equipments are needed for soil monitoring, compressive control of soil erosion, grassland degradation, desertification, salination, rock desertification, soil pollution control and remediation, prevention of secondary salination.
2.3.6 Soil environmental management
Soil protection legislation, structure and mechanisms should be established to form a risk based national soil protection system. Soil protection laws, regulations, policies and standards should be enforced at national and local levels. A strict soil protection liability system, economic compensation and investment mechanism, economic and criminal penalty system and executive accountability system should be established. Soil protection supervision authorities as well as soil monitoring network should be established at national and local levels. A market oriented mechanisms should be sought for soil protection. Soil protection education should be strengthened to raise public awareness of soil protection.
2.4 Strategic focuses
2.4.1 Protection of basic farmland soils in different zones
Protection of basic farmland soil, control of dispersed source pollution and protection of rural ecosystem should be strengthened in major agricultural production areas in northeast, north China, southeast, central China, southeast and southwest China. Comprehensive control and ecological conservation measures need to be taken in areas with serious soil erosion such as the loess plateau, arid zones in northwest, sandstorm source zone in north China, hilly Karst areas in southwest, black soils in northeast, and hilly areas in the south. It is necessary to strengthen control of farmland soil degradation (e.g. desertification, salination and rock desertification), ecological restoration and improvement of soil fertility.
2.4.2 Urban and rural soil pollution prevention and remediation

© 2010 19th World Congress of Soil Science, Soil Solutions for a Changing World 1 – 6 August 2010, Brisbane, Australia. Published on DVD.
204
An action plan should be drawn up for soil pollution prevention and remediation in urban, peri-urban and rural areas, based on the principle of prevention first, integration of prevention with control. A staged plan should be made to dispose or clean up polluted soil at industrial sites, especially in economic booming areas, old industrial base, and around large mining areas. Comprehensive measures should be taken to deal with soil pollution around large lakes, river basins and large hydraulic projects.
2.4.3 Soil quantity and quality supervision
A functional division within the government should be responsible for soil quality supervision. A regional soil quantity and quality monitoring network and information share platform should be established. A risk assessment framework and emergency response plan should be established based on Chinese conditions. It is necessary to establish soil standard system, speed up soil pollution prevention and control legislation, launch soil protection advertisement campaign and education to raise public awareness of soil environmental protection. 3. Strategic countermeasures 3.1 Management
Soil protection authorities should be established with clearly defined responsibilities among different governmental departments. Soil protection planning and action plan should be drawn. It is crucial to establish and improve soil protection legislation and enact practical rules for the implemention. The development of soil environmental protection NGOs and active participation of the general public in soil protection should be encouraged and promoted. It is necessary to establish and improve rules for the use of pesticides, fertilizers, sewage sludge and agricultural wastes, to implement rules for soil pollution prevention and remediation, to implement rules for economic and ecological compensation for soil remediation, to develop emergency treatment techniques for soil pollution and to establish a management pattern that integrates protection of soil, water and air quality and the use of soil resources.
3.2 Soil standards
National soil standard for different land use should be derived based on risk assessment. Local soil standard should also be encouraged. A soil protection standards system should be established. Ecotoxicity of soil pollutants should be studied. Soil background values and geochemical baselines should be derived. Methodologies for conducting soil ecological risk assessment, human health risk assessment and environmental risk assessment should be established. Rules for the management of polluted sites and technical specification of risk assessment should be drawn.
3.3 Soil protection research and technological development
It is necessary to strengthen national soil quantity and quality survey, research on the soil quality index and methods for assessing soil quantity and quality change and its impacts, and establish soil monitoring network and information system for protection and management of soil resources. An integrated treatment patterns that incorporates hydraulic engineering, biological engineering and agricultural technologies will be proposed for soil erosion, desertification control. To prevent soil salination, soil irrigation and drainage techniques should be improved. It is necessary to strengthen research on soil pollution diagnosis, and risk assessment as well as soil monitoring equipments and remediation technologies. Deepen research on the impact of global change on soil processes, biodiversity and their ecological functions, establish soil biogeochemical models, and develop technologies for carbon fixation and emission reduction.
3.4 Soil protection in key regions
Soil protection strategies should reflect the difference in natural environment and soil types. China can be divided into six key regions: (1) Economically developed east coastal areas: Strictly control soil resource reduction, implement soil monitoring and risk based soil management in the region; (2) Major grain producing areas in central China: Establish network to monitor soil quantity and quality, improve soil fertility, secure gain production, ecological safety and the environment; (3) Old industrial base in northeast: Soil remediation technology development, mitigation of degraded black soil, integrated sand control measures that incorporate protection, mitigation and use; (4) North China and inner Mongolia: Prevent over-planting and over-stocking, prevent and mitigate soil desertification and grassland degradation, reduce the frequency and intensity of sandstorm; (5)Ecologically fragile areas in southwest: Wise use of water in loess plateau, protect oasis in northwest arid areas, prevent stone desertification in southwest, establish soil monitoring network; (6) Cold alpine zone: Protect natural grassland, natural secondary forest and shrubs, secure soil ecological safety in alpine.

© 2010 19th World Congress of Soil Science, Soil Solutions for a Changing World 1 – 6 August 2010, Brisbane, Australia. Published on DVD.
205
Technology development of soil fertility management based on understanding
local agricultural systems of the Sahel in Niger, West Africa Keiichi Hayashi A, Naruo Matsumoto A, Satoshi Tobita A, Hitoshi ShinjoB, Ueru Tanaka C Idrissa Boubachar D and Ramadjita Tabo E
AJapan International Research Center for Agricultural Sciences, Tsukuba, Japan, [email protected], [email protected], [email protected] BGraduate school of Agriculture, Kyoto University, Kyoto, Japan, [email protected] CGraduate school of Global Environment, Kyoto University, Kyoto, Japan, [email protected] DINRAN BP 429 Niamey, Niger, [email protected] EICRISAT-Niger BP 12 404, Niamey, Niger, [email protected]
Abstract Local farmers in the Sahel have few choices for arresting soil fertility degradation due to subsistence livelihood for agriculture. However, there are some locally available materials which are not utilized for agricultural production. Through field survey on understanding local agricultural system, underutilized organic resources were identified and crops stumps and millet husk were tested for technology development. According to the obtained results through on-station experiment, crops stumps of millet-hibiscus intercropping system showed an increase of 10 kg/ha of total nitrogen in soil with a height of stumps about 10-20 cm above ground. This implies that negative nutrient balance in extensively managed farmlands can be mitigated from -9 kg-N/ha to -4 kg-N/ha. Results from on-farm trial showed better economic evaluation in developed technology than conventional practice and 95 % of participants of local farmers showed their satisfaction with the results of the technology. Through modifying conventional system based on understanding local situation, changes shown through developed technology were tangible to local farmers and consequently positive evaluation was obtained from participants.
Key Words Millet-hibiscus intercropping system, nutrient flow, small scale farmers, wind erosion, Niger.
Introduction The low level, irregular pattern and fluctuation of inter-annual rainfall as well as low soil fertility and subsistence livelihood are some of the identified causes of the problem that have beset agricultural productivity in the Sahel. Since they are all interconnected, identifying what the real cause could be quite complicated. Suffice it to say, the soil in the Sahel is not fertile enough. Fertility improvement for sustainable agricultural production is therefore, one of the local livelihood’s utmost priorities. Many authors have mentioned the importance of the application of inorganic fertilizer with organic amendment (Bationo et al.1993). However, due to the low amount of fertilizer utilization in Africa, fertility improvement did not seem feasible. Fertilizer in Africa is expensive due to the high importation cost. The inability to allocate cash to purchase fertilizer at the start of the cropping season as well as the shortage of food at local household during this period put too much burden on the part of the local farmers (Hayashi et
al. 2008). As enhancing the utilization of inorganic fertilizer in Africa is a time-consuming process, an effective market orientation and policy making is necessary to enable the farmer to use inorganic fertilizer more frequently compared to the present time. In the meantime, it is necessary to have a best alternative measure that will enable farmers to manage their life while waiting for higher level components to come up and implement an effective working policy. Since organic matter is a locally available input for agriculture, many studies for its judicious use have already been carried out (Schlecht et al. 2004). In Africa, crops residue and animal excrements are among the major sources of locally available organic matter which the farmers use not only in agriculture but also in construction and trade. Despite such extensive use, there are still few studies about its potential for technology development in Africa. The objective of this study is to be able to develop an appropriate technology suitable in Africa by evaluating the potential of organic resources and nutrient flow based mainly on understanding the existing local agricultural systems.
Methods To understand the actual situation of the study site, a field survey was conducted in the three villages of the Fakara region, Dantiandou district of Tillaberi prefecture, Western Niger (Figure 1). The result of the

© 2010 19th World Congress of Soil Science, Soil Solutions for a Changing World 1 – 6 August 2010, Brisbane, Australia. Published on DVD.
206
questionnaire survey provided us a thorough understanding of the actual agricultural system of the local farmers and at the same time enabled us to identify the specific problematic points in agricultural production. One of the identified methods to come up with a potential technology to be developed is on-station field experiment conducted at the research station in ICRISAT-Niger. Millet-hibiscus intercropping system with the use of crop stumps after harvest was considered an identified technology against wind erosion and towards suitable fertility management. Measuring several variables such as productivity, soil fertility improvement, and best conditions were conducted to identify and verify possible functions of this technology for actual practice at farmers’ level. For evaluation and validation of this technology, on-farm field trial participated by the local farmers was conducted in Ko-Dey village of Fakara region. To assess the impact of the developed technology, nutrient flow through estimation of the potential of organic resources in the study site was evaluated. Field measurements and local farmers’ questionnaire survey were done to obtain necessary information for this purpose.
Results and discussion Actual situation of agricultural production system in the study area
According to the results of the field survey, local farmers own three to five areas of farmlands for agricultural production. Adjacent farmlands (AF) which received household waste, human excreta and other domestic waste were distributed around the village. Farmlands for threshing (TF) where female farmers used it for threshing crops and abundant crops husk were distributed round 100 m to 500 m from the village. Farmlands for dumping transported farmyard manure (TMF) where local farmers transported during dry season were distributed around 500 m to 1,000 m from the village. Farmlands for corralling (CRL) where Fulani, a nomadic tribe who was engaged in livestock production stayed for incorporating livestock excreta during dry season were distributed around 1,000 m to 2,000 m from the village. Extensively managed farmlands (EMF) were distributed more than 2,000 m from the village. The areas for EMF comprise the largest, occupying 66 % of the total. EMF are managed through rotation of fallow and cultivation and the period of fallow gets shorter compared to the conventional practice. Without the use of inputs, a 3 year fallow after a 6 year cultivation period was the usual management practice. Results prior to this study revealed that soil fertility in the 2 years of fallow was obviously low compared to the 10 years of fallow. This means that restoration of soil fertility was difficult to attain with just a few year period practice. Mix cropping of millet with cowpea and/or hibiscus was a common practice and combination varied depending on the type of management of the farmlands. For TF and TFM, millet is combined with cowpea. With CRL, millet was mixed with cowpea and hibiscus while for EMF, millet is mixed with hibiscus. But for AF, mono cropping of millet is practiced due to wrecks by domestic fowls and insanitary by human excrement.
Technology development based on the actual situation
As crop residue derived from millet is one of the important materials for domestic and commercial purposes, local farmers collect most of it from their farmlands after the harvest. Thus the surface of the land becomes susceptible to wind erosion during the dry season, a situation which should be taken into consideration in order to arrest soil fertility degradation. Based on the field survey, soil fertility degradation in EMF was identified in their most critical level followed by millet-hibiscus mix cropping system, the main system practiced in this area. Due to inappropriate management practice, farmlands were susceptible to wind erosion during the dry season. Therefore, research focus was put on this system to develop a technology to arrest wind erosion. For soil fertility management purpose, crop stumps of local cropping system was utilized in the technology. Results of on-station experiment indicated significant increase in the surface level of experimental plots during the dry season. With crop stumps, the surface level rose starting at 45 days after first measurement (DAFM) while almost no change was observed on the surface without crops stumps. At 145 DAFM, the mean surface level with crops’ stumps rose up to 2.25 cm. Total nitrogen content (T-N) of surface soils was 10 kg/ha higher in the surface with crops’ stumps than without crops’ stumps and the difference was significant by t-test (p = 0.039). These results were also confirmed with the second-year experiment. Crops stumps cut at ground level (as farmers’ practice) remained the same as bare spots at the end of monitoring period. Stumps of millet and hibiscus cut at 10 cm and 20 cm above ground made the surface higher than that of millet mono cropping cut at both heights. The mean surface level significantly increased in millet and hibiscus intercropping than millet mono cropping with stumps cut at both ground level and at 20 cm heights. No significant difference was observed between the 10 cm and 20 cm height in millet and hibiscus intercropping.

© 2010 19th World Congress of Soil Science, Soil Solutions for a Changing World 1 – 6 August 2010, Brisbane, Australia. Published on DVD.
207
Millet stems have high commercial value for different demands, one of which is construction materials for fence. The study of Baidu-Forson (1995) showed that barely a small quantity of crop residue remained in the field before cropping season which indicates that local farmers tried to obtain much benefit out of their production. Our results showed that the effect of crops’ stumps was not significantly different for either 10 cm or 20 cm heights. This result can serve two purposes of local farmers’ demand in their agricultural fields; one is to keep the commercial value of crop stems and another to increase prevention mechanisms against wind erosion for better soil fertility management. Verification of developed technology
In order to verify the feasibility of the developed technology in the study area, on-farm field experiment was conducted with local farmers’ participation and impact assessment was carried out through evaluation of nutrient flow. On farm field trial was carried out with the active participation of local farmers. Millet-hibiscus intercropping system was designed with two different practices, application of organic amendment and timing of weeding. These are the factors which play important roles in production as the previous study showed (Hayashi et al. 2009). Result of crop yield showed that the millet yield of developed technology was lower than that of local farmers’ practice because of the effect of intercropping (Table 1). Application of millet residue improved the yield compared to the yield without millet residue. However, the yield was reduced with the delay of weeding despite the application of millet residue. Nevertheless, the developed technology obtained the desired grain yield with the production of hibiscus and its by-product which has high value in the local market. According to the result of the questionnaire obtained, 20 out of 21 or 95 % of participants were satisfied with the performance of the technology and most of them showed their satisfaction with the better yield obtained from the production of hibiscus than the low plant density of the conventional system. The economic aspect of the technology was also evaluated using the benefit-cost ratio (BCR). Results showed that the BCR of the conventional practice was 3.9 while developed technology showed a BCR of 4.7. BCR improved with the application of millet residue despite the delay in weeding. BCR became lower than the conventional practice when no millet residue was applied and weeding was delayed.
Impact assessment through nutrient flow between village and farmlands
Millet production of farmlands in each type of management was estimated based on the quantitative measurements of the crops’ yield. Results revealed that most of the production was provided by EMF. This area was also considered important because of the production of wild plants for domestic purposes, i.e. substitute of food, commercial use, livestock feed and livestock grazing. Despite the large quantity of production output from this area, most of the nutrient especially nitrogen was returned to AF and TFM. EMF did not receive any nutrient inputs except the one from harmattan dust brought by the seasonal wind from the Sahara desert during the dry season. According to the estimation, output from EMF was 86 t/year (58 t/year from crops production, 12 t/year from wild plants and 16 t/year from grazing) while input through harmattan dust to this farmlands was 21 t/year (Table 2). The previous results of the on-station experiment showed that the developed technology was able to increase 10 kg/ha of total nitrogen in soil. Thus, a 35 t/year increase in nitrogen as additional input can be estimated when the developed technology is applied to this area. This augmentation of nitrogen implies that the negative nutrient balance in EMF can be modified from -9 kg-N/ha to -4 kg-N/ha. Furthermore, land degradation through inappropriate management shall be mitigated with the developed technology and sustainability of local agricultural production can be enhanced.
Figure 1. Study site of on-station experiment (Niamey) and on-farm trial (Fakara region)
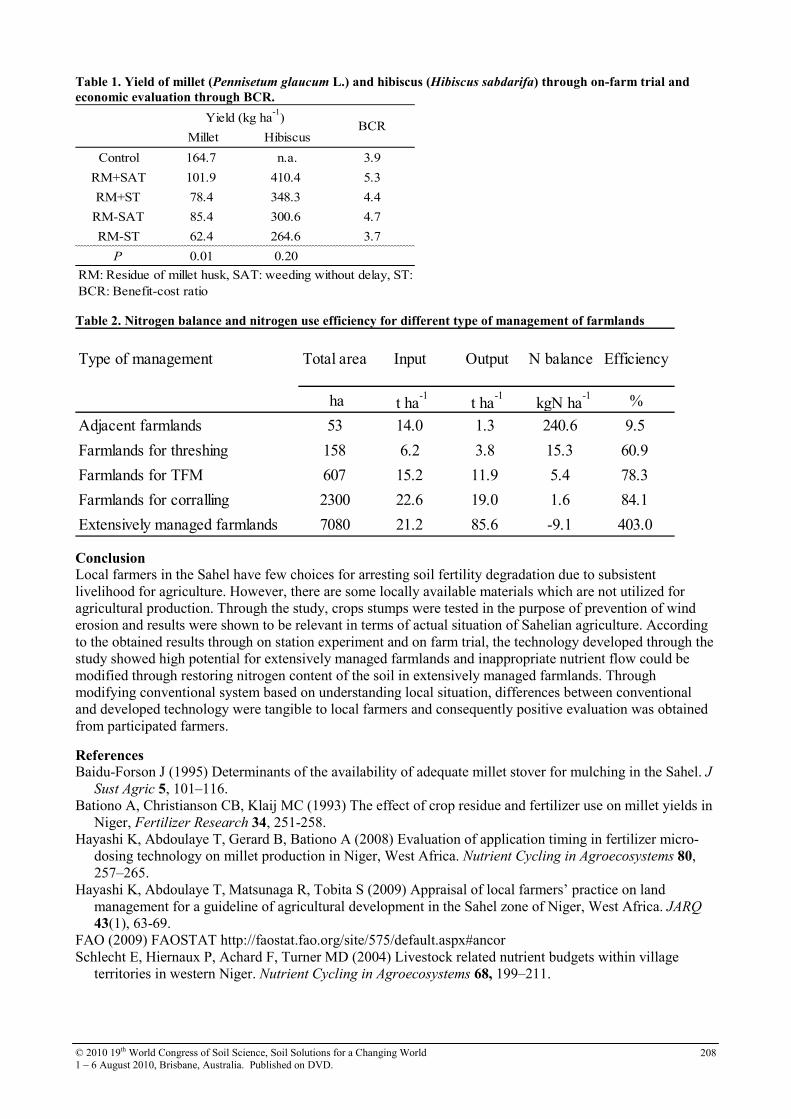
© 2010 19th World Congress of Soil Science, Soil Solutions for a Changing World 1 – 6 August 2010, Brisbane, Australia. Published on DVD.
208
Table 1. Yield of millet (Pennisetum glaucum L.) and hibiscus (Hibiscus sabdarifa) through on-farm trial and
economic evaluation through BCR.
Millet Hibiscus
Control 164.7 n.a. 3.9
RM+SAT 101.9 410.4 5.3
RM+ST 78.4 348.3 4.4
RM-SAT 85.4 300.6 4.7
RM-ST 62.4 264.6 3.7
P 0.01 0.20
BCRYield (kg ha
-1)
RM: Residue of millet husk, SAT: weeding without delay, ST:BCR: Benefit-cost ratio
Table 2. Nitrogen balance and nitrogen use efficiency for different type of management of farmlands
Type of management Total area Input Output N balance Efficiency
ha t ha-1
t ha-1
kgN ha-1 %
Adjacent farmlands 53 14.0 1.3 240.6 9.5
Farmlands for threshing 158 6.2 3.8 15.3 60.9
Farmlands for TFM 607 15.2 11.9 5.4 78.3
Farmlands for corralling 2300 22.6 19.0 1.6 84.1
Extensively managed farmlands 7080 21.2 85.6 -9.1 403.0
Conclusion Local farmers in the Sahel have few choices for arresting soil fertility degradation due to subsistent livelihood for agriculture. However, there are some locally available materials which are not utilized for agricultural production. Through the study, crops stumps were tested in the purpose of prevention of wind erosion and results were shown to be relevant in terms of actual situation of Sahelian agriculture. According to the obtained results through on station experiment and on farm trial, the technology developed through the study showed high potential for extensively managed farmlands and inappropriate nutrient flow could be modified through restoring nitrogen content of the soil in extensively managed farmlands. Through modifying conventional system based on understanding local situation, differences between conventional and developed technology were tangible to local farmers and consequently positive evaluation was obtained from participated farmers.
References Baidu-Forson J (1995) Determinants of the availability of adequate millet stover for mulching in the Sahel. J
Sust Agric 5, 101–116. Bationo A, Christianson CB, Klaij MC (1993) The effect of crop residue and fertilizer use on millet yields in
Niger, Fertilizer Research 34, 251-258. Hayashi K, Abdoulaye T, Gerard B, Bationo A (2008) Evaluation of application timing in fertilizer micro-
dosing technology on millet production in Niger, West Africa. Nutrient Cycling in Agroecosystems 80, 257–265.
Hayashi K, Abdoulaye T, Matsunaga R, Tobita S (2009) Appraisal of local farmers’ practice on land management for a guideline of agricultural development in the Sahel zone of Niger, West Africa. JARQ 43(1), 63-69.
FAO (2009) FAOSTAT http://faostat.fao.org/site/575/default.aspx#ancor Schlecht E, Hiernaux P, Achard F, Turner MD (2004) Livestock related nutrient budgets within village
territories in western Niger. Nutrient Cycling in Agroecosystems 68, 199–211.

© 2010 19th World Congress of Soil Science, Soil Solutions for a Changing World 1 – 6 August 2010, Brisbane, Australia. Published on DVD.
209
The effect of PGPR strain on wheat yield and quality parameters
Metin Turan
A, Medine GulluceB, Ramazan CakmakciC, Taskin OztasA and Fikrettin SahinD
AAtaturk University, Faculty of Agriculture, Department of Soil Science, Erzurum 25240, Turkey, Email [email protected] BAtaturk University, Faculty of Science, Department of Biology, Erzurum 25240, Turkey, Email [email protected] CAtaturk University, Faculty of Agriculture, Department of Field Crops, Erzurum 25240, Turkey, Email [email protected] DYeditepe University, Faculty of Engineering and Architecture, Department of Genetics and Bioengineering, Kayisdagi, Istanbul 34755, Turkey, Email [email protected]
Abstract N2-fixing and P-solubilizing bacteria are important in plant nutrition increasing N and P uptake by the plants, and playing a significant role as plant growth-promoting rhizobacteria (PGPR) in the biofertilization of crops. In 2007 and 2008, a field study was conducted in two different locations (Erzurum and Ispir) in the Eastern part of Turkey for investigating the effects of two N2-fixing and P-solubilizing PGPR strains alone and in combinations on plant yield and nutrient content of wheat in comparison to control and optimum and half doses of N fertilizer application under field condition. All inoculations and fertilizer applications significantly increased grain, total biomass yields, and macro and micro nutrients of wheat over the control. Mixed PGPR inoculations with the strain of OSU-142 + M-13 + Azospirillum sp.245 has significantly increased grain yield of wheat as good as full doses of nitrogen. All bacterial inoculations especially mixed inoculation, significantly increased uptake of macro-nutrients (N, P, K, Ca, Mg and S) and micro-nutrients (Fe, Mn, Zn, and Cu) of grain, leaf, and straw part of the plant. The data suggested that seed inoculation with OSU-142 + M-13 + Azospirillum sp.245 may substitute N and P fertilizers in wheat production. Key words: Inoculation; grain yield, plant growth-promoting rhizobacteria; macro and micro element
Introduction Nitrogen and phosphorus are known to be essential nutrients for plant growth and development. Intensive farming practices that achieve high yield require chemical fertilizers, which are not only costly but may also create environmental problems. The extensive use of chemical fertilizers in agriculture is currently under debate due to environmental concern and fear for consumer health. Consequently, there has recently been a growing level of interest in environmental friendly sustainable agricultural practices. Bio-fertilizer is defined as a substance which contains living organisms which, when applied to seed, plant surface, or soil, colonize the rhizsphere or the interior of plant the plant and promotes growth by increasing the supply or availability of primary nutrients to the host plant (Vessey 2003). Biofertilizers are well recognized as an important component of integrated plant nutrient management for sustainable agriculture and hold a great promise to improve crop yield (Narula et al. 2005; Wu et al. 2005). A group of bio-fertilizers contain termed plant growth promoting rhizobacteria (PGPR) (Kloepper et al. 1980) and among them are strains from genera such as Pseudomonas, Azospirillium, Azotobacter, Bacillus, Burkholderia, Enterobacter, Rhizobium, Erwinia and Flavobacterium (Rodriguez and Fraga 1999). Thus organisms are important for agriculture in order to promote the circulation of plant nutrients and reduce the need from chemical fertilizers. Most of the studies reporting beneficial effects of the above mentioned PGPR were carried out in warm and subtropical climates with favorable ambient temperatures. These bacteria may not be effective in cold temperature conditions. Therefore, a study was conducted in order to investigate the effects of alone and in combinations with N2-fixing and P-solubilising PGPR strains on nodulation, plant growth, nutrient uptake and grain yield of wheat in the cold highland (Erzurum) and low land ( Đspir) plateaus. Material and methods Site selection
In order to investigate the effects of seed inoculation with PGPR on yield and yield components of wheat (Triticum aestivum spp. vulgare var. Kirik) in the field experiments at two sites, 150 km apart from each other. The first (I) field is located in the Coruh valley in Erzurum in eastern Anatolia, 40° 28' N and 40° 58' E with at an altitude of 1120 m, and the second field is in the Erzurum Experimental Farm of the Atatürk Üniversity and in Erzurum in Eastern Anatolia, 29° 55' N and 41° 16' E with an altitude of 1950 m. The soils were classified as Entisol and Aridisols according to the USDA taxonomy (Soil Survey Staff 1992).

© 2010 19th World Congress of Soil Science, Soil Solutions for a Changing World 1 – 6 August 2010, Brisbane, Australia. Published on DVD.
210
Field experiment
The experiments were conducted using a randomized complete block design in a factorial arrangement each having 10 main treatments as control (without inoculation and any fertilizer application), Nitrogen ( 80 kg N/ha), Nitrogen (40 kg N/ha), Bacillus OSU-142, Bacillus M-3, Azospirillum sp. 245, Mixed (OSU-142 + M-13+ Azospirillum sp. 245), Bacillus megaterium RC07, Paenibacillus polymyxa RC05 and Raoultella
terrigena for 2007 and 7 treatment also added in 2008, FS Tur, OSU142 AMP Res, M-3 Amp Res, sp.245 Amp Res, P. polymyxa 2/2, B. megaterium T17, and Mixed + 40 kg N/ha. Wheat was sown in 7 m x 4 m plots having 34 rows so as to give 18 kg seeds da-1 (430 seeds per m2) on 10 and 17 May in 2007, 4 and 2 May in 2008 at site I and site II. Maximum care has been taken not to contaminate and mix bacterial inoculations during sowing.
Statistical analysis
The data were subjected to analysis of variance (ANOVA) using SPSS 13.0 (SPSS Inc., 2004) statistical program. Since “year x treatment” interaction was not significant in many parameters evaluated, data were combined over years, and means were presented. Mean values were separated according to LSD test at P=0.05. Result and discussion Yield and yield parameters
Bacterial inoculations improved the wheat growth and growth parameters. The performance of the plants was better in inoculated treatments in comparison to the control. The results showed that grain yield (GY), straw yield (SY), harvest index (HI) and total yield (TY) of wheat cultivars in each of two locations in both years significantly increased by N2-fixing and P-solubilizing PGPR strains application compared with the control. The lowest GY, SY, TY and HI were recorded in the control treatment and the bacterial inoculations increased GY by 8.6-43.7%, SY by 1.82.-12.9%, TY by 1.93- 19.80% and HI by 1.33-45.7% over the control on 2-year average at two locations, respectively (Table 1, 2). The GY of plant in 2007 was higher than GY of 2008, but the highest TY of wheat was found in 2008 at each location (Table 1, 2). The highest GY (3.68-2.88 Mg/ha), SY (9.73-8.57 Mg/ha), and TY (13.41-11.45 Mg/ha) in both years average at two locations were obtained from 80 kg N/ha , and followed by in combination (OSU-142 + M-13+ Azospirillum sp. 245) treatment at 3.47-2.87 Mg/ha for GY, 8.73-6.75 Mg/ha for straw and 12.20-9.65 Mg/ha for total yields, respectively. In other words, mixed PGPR inoculations with the strain of OSU-142 + M-13 + Azospirillum sp.245 has significantly increased GY, SY, TY and HI of wheat as good as full doses of nitrogen. When it is compared to 40 kg N/ha treatment, bio-fertilizer applicants were more effective to increase the grain yield. On the other hand harvest index (HI) of two years average in two locations was better in inoculation treatments in comparison to the control and mineral fertilizer (80 and 40 kg N/ha) treatments. While the lowest HI values were recorded in the control treatment, the highest value was obtained from the OSU-142 + M-13+ Azospirillum sp. 245 and Bacillus M-3 treatments. In the current system, the results support reduced fertilizer rates down to 50% if PGPR was added because that is the minimum at which results were consistent. This is different from the observations of Canbolat et al. (2006) and Elkoca et al.(2008), who reported no significant difference in root and shoot biomass of barley or seed yield and biomass of roots and shoots of chickpea, respectively, when inoculant alone or fertilizer alone was used.
Effects of bio-fertilizer on plant nutrient element (PNE) contents of different parts of the plant
N2-fixing and P-solubilizing PGPR strains application promoted PNE contents of different parts of the plant. Although the highest leaf, grain, and straw N contents were obtained from mixed inoculation with the OSU-142 + M-13 + Azospirillum sp.245 +40 kg N/ha, which increased N contents of leaf, grain and straw of plant by 52.6%, 83.4%, and 83.0%, respectively, compared with the control treatment. While S contents were obtained from treatment OSU-142 + M-13 + Azospirillum sp.245and increasing rate were 64.9% for grain and 65.0% for straw. P, K, Mn, Fe, and Zn contents were obtained from Bacillus M-3 treatment, and increase rate for leaf, grain and straw of plant were 42.7%, 50.6%, 82.5% for P, 26.3%, 112.0%, 110.0% for K, 49.1%, 121.2%, 120.0% for Mn, 90.1%, 102.6%, 105.2% for Fe, and 49.2%, 75.4%, 75.4% for Zn. Some of the previous studies with the same PGPR strains tested on chickpea, barley, raspberry, apricot and sweet cherry have been reported similar findings confirming our data in the present work. The use of the OSU-142 and M-3 in chickpea (Elkoca et al. 2008), barley (Cakmakci et al. 2007), raspberry (Orhan et al. 2006), apricot (Esitken et al. 2003), sweet cherry (Esitken et al. 2006) and strawberry (Güneş et al. 2009) stimulated macro- and micro-nutrient uptake such as N, P, K, Ca, Mg, Fe, Mn, Zn, Cu.
© 2010 19th World Congress of Soil Science, Soil Solutions for a Changing World 1 – 6 August 2010, Brisbane, Australia. Published on DVD.
211
Conclusions Our results indicated that microbial inoculation of seeds with N2-fixing and P-solubilizing PGPR strains alone and in combination, may substitute costly NP fertilizer in wheat production even in cold highland and low land areas. In view of environmental pollution in case of excessive use of fertilizers and due to high costs in the production of N and P fertilizers, bacteria tested in our study may well be suited alone or in combination to achieve sustainable and ecological agricultural production in the region. An important nutritional problem of developing countries is micro-nutrient malnutrition, also called hidden hunger. Our results also indicated that alone or in combination inoculations with N2-fixing and P-solubilising PGPR strains could increase mineral concentration and accumulations in the grain. This paper supports the view that inoculations with PGPR have some potential to serve as a means to reduce hidden hunger trough enhanced mineral concentration and accumulation in grain.
Acknowledgements We are very grateful to EU FP6-FOOD-CT-2006, STREP Project: RHIBAC for their generous financial support for this study.
References Cakmakci R, Donmez MF, Erdogan U (2007) The effect of plant growth promoting rhizobacteria on barley
seedling growth, nutrient uptake, some soil properties, and bacterial counts. Turkish Journal of
Agriculture and Forestry 31, 189-199.
Canbolat MY, Bilen S, Cakmakci R, Sahin F, Aydin A (2006) Effect of plant growth-promoting bacteria and soil compaction on barley seedling growth, nutrient uptake, soil properties and rhizosphere microflora. Biol Fertil Soils, 42, 350–357
Dobbelaere S, Vanderleyden J, Okon Y (2003) Plant growth-promoting effects of diazotrophs in the rhizosphere. Crit. Rev. Plant Sci. 22, 107–149.
Elkoca E, Kantar F, Sahin F (2008) Influence of Nitrogen Fixing and Phosphorus Solubilizing Bacteria on the Nodulation, Plant Growth, and Yield of Chickpea. Journal of Plant Nutrition 31, 157–171.
Esitken A, Karlidag H, Ercisli S, Turan M, Sahin F (2003) The effect of spraying a growth promoting bacterium on the yield, growth and nutrient element composition of leaves of apricot (Prunus armeniaca
L. cv. Hacihaliloglu). Australian Journal of Agricultural Research 54, 377-380.
Esitken A, Pirlak L, Turan M, Sahin F (2006) Effects of floral and foliar application of plant growth promoting rhizobacteria (PGPR) on yield, growth and nutrition of sweet cherry. Scientia Horticulturae 110, 324-327.
Guneş A, Ataoğlu N, Turan M, Eşitken A, Ketterings QM (2009) Effects of phosphate-solubilizing microorganisms on strawberry yield and nutrient concentrations. Journal of Plant Nutrition and Soil
Science, 172, 385–392
Kloepper JW, Leong J, Teintze M, Schroth MN (1980) Enhanced plant growth by siderophoros produced by plant growth-promoting rhizobacteria, Nature, 286,885-886.
Narula N, Kumar V, Singh B, Bhatia R, Lakshminarayana K (2005) Impact of biofertilizers on grain yield in spring wheat under varying fertility conditions and wheat-cotton rotation. Archives of Agronomy and Soil
Science, 51, 79-89.
Orhan E, Esitken A, Ercisli S, Turan M, Sahin F (2006) Effects of plant growth promoting rhizobacteria (PGPR) on yield, growth and nutrient contents in organically growing raspberry. Scientia Horticulturae 111, 38-43.
Rodriguez H, Fraga R (1999) Phosphate solubilizng bacteria and their role in plant growth promotion. Biotechnology Advances, 17,319-339.
Soil Survey Staff (1992) Keys to Soil Taxonomy. 5th edition. SMSS Technical monograph No:19 Blacksburg Pocahontas Press Inc.
SPSS Inc. (2004) SPSS Inc. SPSS® 13.0 Base User’s Guide, Prentice Hall.
Wu SC, Cao ZH, Li ZG, Cheung KC Wong MH (2005) Effects of biofertilizer containing N-fixer, P and K solubilizers and AM fungi on maize growth: a greenhouse trial. Geoderma, 125,155-166.
Vessey JK (2003) Plant growth promoting rhizobacteria as biofertilizers. Plant and Soil, 255,571-586.

© 2010 19th World Congress of Soil Science, Soil Solutions for a Changing World 1 – 6 August 2010, Brisbane, Australia. Published on DVD.
212
Table 1. Yield and yield components of wheat plant growth at two locations in 2007 (t/ha)
I. Field II. Field
Inoculant Grain Straw Total biomass Grain Straw
Total biomass
Control 3.34 d 6.57 e 9.90 d 2.46 d 8.90 c 11.35 c Nitrogen (80 kg N/ha) 4.02 a 8.82a 12.83 a 3.34 a 10.66a 14.00 a Nitrogen ( 40 kg N/ha) 3.79 a-c 7.87b 11.66 ab 2.27 ab 11.07a 13.33 ab Bacillus OSU-142 3.69 a-d 7.47 bc 11.15 bc 3.02 a-c 9.04 b 12.06 bc Bacillus M-3 3.50 b-d 6.69e 10.18 d 2.85 c 7.98 d 10.83 c Azospirillum sp.245 3.76 a-c 8.07a 11.83 a 3.04 a-c 9.18 b 12.22 bc OSU-142 + M3+ Az.245 3.85 ab 8.04a 11.89 a 3.10 a-c 9.41 b 12.51a-c B. megaterium RC07 3.43 cd 7.39 cd 10.83 c 2.87 c 8.26 c 11.13 c
P. polymyxa RC05 3.72 a-c 7.52 bc 11.24 bc 2.93 bc 8.69 c 11.61 bc
B. licheniformis RC08 3.46 cd 6.65e 10.11 d 2.72 d 8.56 c 11.28 c
Table 2. Yield and yield components of wheat plant growth of two locations in 2008 (t/ha)
I. Field II. Field Inoculants
Grain Straw Total biomass
Grain Straw Total biomass
Control (without inoculation and fertilizer)
2.79 c 7.79d 10.58 c 1.20 g 7.11b 8.31abc
Nitrogen (80 kg N/ha) 4.18 a 8.90 a 13.08a 1.95 a 8.51a 10.46 a
Nitrogen ( 40 kg N/ha) 3.57 a-c 7.46d 11.03bc 1.58 cd 8.25a 9.83 ab
Bacillus OSU-142 3.35 a-c 8.37 a-c 11.72 a-c 1.53 cde 6.18bc 7.72 bcd
Bacillus M-3 3.65 a-c 7.03d 10.68 c 1.50 cde 5.51 d 7.01 cd
Azospirillum sp.245 4.17 a 7.78d 11.95 a-c 1.39 ef 4.70 e 6.09 d
OSU-142 + M-13+ Azospirillum sp.245 3.94 ab 8.68 ab 12.62ab 1.80 b 4.83 e 6.63 cd
Bacillus megaterium RC07 3.28 a-c 8.41 bc 11.69a-c 1.66 bc 6.65 bc 8.31 abcd
Paenibacillus polymyxa RC05 3.81a-c 8.02 bc 11.83a-c 1.39 ef 6.39 bc 7.77 bcd
Raoultella terrigena 3.59 a-c 7.37d 10.96bc 1.39 ef 5.71 d 7.09 cd
FS Tur 2.99 bc 7.47d 10.46 c 1.59 c 7.35b 8.94 abc
OSU142 AMP Res 3.67 a-c 8.23 a-c 11.90a-c 1.49 cde 6.27bc 7.77 bcd
M-3 Amp Res 3.54 a-c 8.19 a-c 11.73 a-c 1.53 cde 6.53 bc 8.06bcd
Sp.245 Amp Res 3.20 a-c 8.52 a-c 11.72 a-c 1.42 def 8.49a 9.90 ab
P. polymyxa 2/2 3.20 a-c 8.92ab 12.12 a-c 1.39 ef 6.25bc 7.64 bcd
B. megaterium T17 3.41 a-c 8.42 a-c 11.83 a-c 1.30 fg 6.63bc 7.93 bcd
OSU-142 + M-13 + Azospirillum sp.245 +40 kg N/ha
3.83 a-c 8.92a 12.75a 1.66 bc 4.47 e 6.12 d

© 2010 19th World Congress of Soil Science, Soil Solutions for a Changing World 1 – 6 August 2010, Brisbane, Australia. Published on DVD.
213
The evolution of soil salinization in the Yellow River Irrigation District of
Ningxia, China during the period of 1958 to 2007
De ZhouA, Liming LiuA,C and Yuanpei ZhangB ADepartment of Land Resources Management, College of Resources and Environment, China Agricultural University, No.2 Yuanmingyuan west Rd, Haidian, Beijing 100193, China. BAgricultural Biotechnology Research Center, Ningxia Academy of Agriculture and Forestry, No.590 Yellow River East Rd, Yinchuan, 750002, Ningxia, China. CCorresponding author. Email [email protected] Abstract Soil salinization is a real threat to agricultural systems, especially in oasis of the arid regions in the world. Hence, it is essential for the management of oasis agriculture to understand the spatial and temporal evolution of soil salinization. The combination of remote sensing image interpretation and the historical soil survey is an effective method for understanding of salt-affected soils. The three stages of soil salinization evolution in the Yellow River Irrigation District were studied during the period from 1958 to 2007. The area of salinized soil is generally decreasing, it reduced from 56.70% in 1958 to 33.52% in 2007. However, the degree of soil salinization in some areas such as downbend, lakes, fish ponds and sites with poor water drainage becomes more severe. Key Words Soil salinization, spatial and temporal evolution, agricultural sustainable development, Yellow River Irrigation district. Introduction Soil salinization is an important worldwide environmental problem, especially in arid and semi-arid regions (Wang et al. 2007). It is important to determine soil salinity as a parameter to environmental land management. Under arid or semi-arid conditions and in regions of poor natural drainage, there is a real hazard of salt accumulation in soils (Navarro et al. 2007). At the same time, soil salinization is one of the main types of land desertification and degradation and can negatively influence soil quality and sustainable agriculture (Eilers et al. 1997). Global total area of the salt-affected soils is about 950 million ha (Wang et al. 1993), accounting for 7.26% of the earth’s land area. The area of the salt-affected soils is about 27 million ha in China. Of these about 6.7 million ha is farmland, accounting for 7% of the total farmland in China which mainly occurs in Xinjiang, Gansu, Ningxia, Inner Mongolia Autonomous Region and eastern coastal areas. The mitigation and control of soil salinity is one of the main challenges in the agriculture of the 21st century, in particular, where Irrigation is applied (Amezketa 2006). The effective management of the salt-affected soils requires understanding of not only the mechanism of soil salinization, but also the laws of space-time evolution. Some scholars have conducted many studies of soil salinization by remote sensing and other methods in arid regions (Metternicht and Zinck 2003; Mougenot et al. 1993; Metternicht 2001; Semih and Cankut 2008; Houk et al. 2006). This study analyses the data of historical soil survey mapping and the remote sensing image, aiming to find the trend of soil salinization and to provide a scientific method for soil improvement in the Yellow River Irrigation District of Ningxia, China. Methods Study area
The Yellow River Irrigation District of Ningxia, China, is located in the temperate arid zone with a continental climate at an average annual temperature of 9 oC (Figure 1). It covers an area of 7,790 km2. The amount of annual rainfall totals is approximately 185 mm, most of which falls during the summer months between June and September. The annual evaporation is 1825 mm, nearly ten times more than the annual precipitation, and the drought index is 6.5. The annual average runoff in the Yellow River is 1030 m3/s and the total volume of annual water flow through the Yinchuan Plain is 3.25×10¹⁰ m3 (Zheng and Wang 2006). Soil salinization is a common feature in arid regions, and is particularly serious in the Yellow River Irrigation District of Ningxia in China. Soil salinization is not only the most important restricting factor for vegetation growth, but also the first barrier in the regional agricultural production. The Irrigation for agricultural purpose in China began since the Qin and Han dynasties, with the history of more than 2,000

© 2010 19th World Congress of Soil Science, Soil Solutions for a Changing World 1 – 6 August 2010, Brisbane, Australia. Published on DVD.
214
years. In the meantime, the Irrigation played an important role in agricultural production year after year. However, the Irrigation water inevitably contains a certain amount of soluble salt, which leads to the rise of salt content in soil. Especially, the excessive Irrigation can usually cause the rise of the groundwater Table and make the soil more saline, which will reduce soil pore space and decrease soil capability for holding air and nutrients (O’Hara 1997). The soluble salt carried by Irrigation water can increase the soil salt content. Without proper drainage, the salts tend to accumulate in the upper part of soil profiles. Therefore, the formation of soil salinization is the result of many natural factors such as climate, hydrology, topography and geology and human activities.
Figure 1. Location of the Yellow River Irrigation District of Ningxia, China.
The historical survey of soil salinization in the study area
In order to understand the developing trend of salt-affected soils, the surveys of soil salinization by the Government of Ningxia Autonomous Region were conducted for five times from 1958 to 2005. The data of the first three stages was based on the soil survey map; that of the last two stages was based on the remote sensing image interpretation. Remote sensing image interpretation
The satellite images were taken on April 24, 2007 by the CBERS-02B satellite and downloaded from the China Centre for Resource Data and Application (CRESED), which are the second level products of CCD camera. Table 1. Classification of soil salinization and the key to interpretation.
Salt-affected soils Contents Non-salt-affected soils Lightly salt-affected
soils Moderately salt-
affected soils Heavily salt-affected
soils Soil total salt (%)
<0.15 1.5-3.0 3.0-6.0 6.0-10
Salt spots ratio <1/10 1/10-1/3 1/3-1/2 >1/2 Groundwater level (m)
>1.5 1.5-1.8 1.2-1.5 >1.0
Salinity (g/L) <2.5 2.5-3.0 3.0-4.0 >4.0 surface features
With dense vegetation, no or few salt crusts on the surface
With dense vegetation, and 1-5cm salt crusts on the surface
With sparse vegetation, and a less than 5cm salt crusts on the surface
With bare vegetation and a 10-20cm salt crust on the surface

© 2010 19th World Congress of Soil Science, Soil Solutions for a Changing World 1 – 6 August 2010, Brisbane, Australia. Published on DVD.
215
They contain four spectral bands with a resolution of 20×20m per pixel for each. The data acquired by CBERS-02B CCD camera has five spectral bands, which are blue band (0.45~0.52µm), green band (0.52~0.59µm), red band (0.63~0.69µm), near infrared band (0.77~0.89µm) and short infrared band (0.51~0.73µm). In this study, the pseudo-colour composite of band 432 is used, and the specific contents of remote sensing image interpretation signs are established for each type of soil salinization (Table 1). Results The results (Figure 2) showed that the evolution of soil salinization has gone through three stages (1958-1962, 1962-1997 and 1997-2007) in the Irrigation district.
0
10
20
30
40
50
60
70
80
1958 1962 1979 1983 1985 1997 2005 2007
Non-salt-affected soils
Salt-affected soils
Lightly salt-affected soils
Moderately salt-affected soils
Heavily salt-affect soils
(Years)
(%)
Figure 2. The evolution of soil salinization of the Yellow River Irrigation District from 1958 to 2007. a. The total value (percent) is a sum of non-salt-affected soils and salt-affected soils; the value (percent) of salt-
affected soils is a sum of lightly salt-affected soils, moderately salt-affected soils and heavily salt-affect soils.
b.The data from 1958 to 1985 is from Ningxia Soil, P410.
c. The data in 1997 is from Ningxia Hui Autonomous Region Eco-Environmental Remote Sensing Investigation
Report, P9 and P31.
d. The data in 2005 is from cultivated land soil survey and salt-tolerant plant breeding in the Yellow River
Irrigation District of Ningxia, Ningxia People's Publishing House. 2006. P74.
e. The data in 2007 is the result of remote sensing image interpretation in this study.
The first stage (1958-1962)
The proportion of salinized soils increased from 56.7% in 1958 to 67.39% in 1962 (Figure 2), with the soil salinization areas of 16.22×10⁴ha and 19.27×10⁴ha, respectively. At this stage, the natural disaster took place for three consecutive years in New China's history. In order to solve the problem of severe food shortage throughout the country, the rapid expansion of rice cultivation area was an inevitable choice in Irrigation district. The quantity of the water diversion from the Yellow River ranged from 4.61×10⁸m3 to 5.26×10⁸m3. The quantities of the water discharge, meanwhile, were 12.3×10⁸m3 and 16.5×10⁸m3, respectively. The activities eventually lead to the hazard of water discharge and the rise of groundwater Table, which intensified soil salinization in the Irrigation district. The second stage (1962-1997)
The local government learned a lesson and built the five major drainage systems including the Red Flag Canal, the Sier Drain Ditch, the Yinxin Drain Ditch and the Yonger Drain Ditch to desalinate the soils by drainage. The establishment of agricultural infrastructure is an effective measure to control and lower groundwater Table in the Irrigation district in the stage. The groundwater depth was maintained between 1.65 to 1.8 meters. At the same time, the government made strict polices control the area of paddy fields in the northern Irrigation district as an additional measure. As a result, the percentage of soil salinization area fell from 67.39% in 1962 to 26.37 % in 1997. However, the distribution of soil salinization within the Irrigation district was imbalance due to the differences in hydrological and geological conditions. The southern areas with excellent drainage conditions accounted for 14.44%; the central areas accounted for 25.69%; the northern areas accounted for 42.37% due to the poor drainage. The third stage (1997-2007)
During the past decade, the overall degree of soil salinization in the Irrigation has been generally low. However, the degree of soil salinization in some areas with higher groundwater Table and poor drainage has been elevated to some extents. In general, the area of the heavily and moderately salinized soils continues to
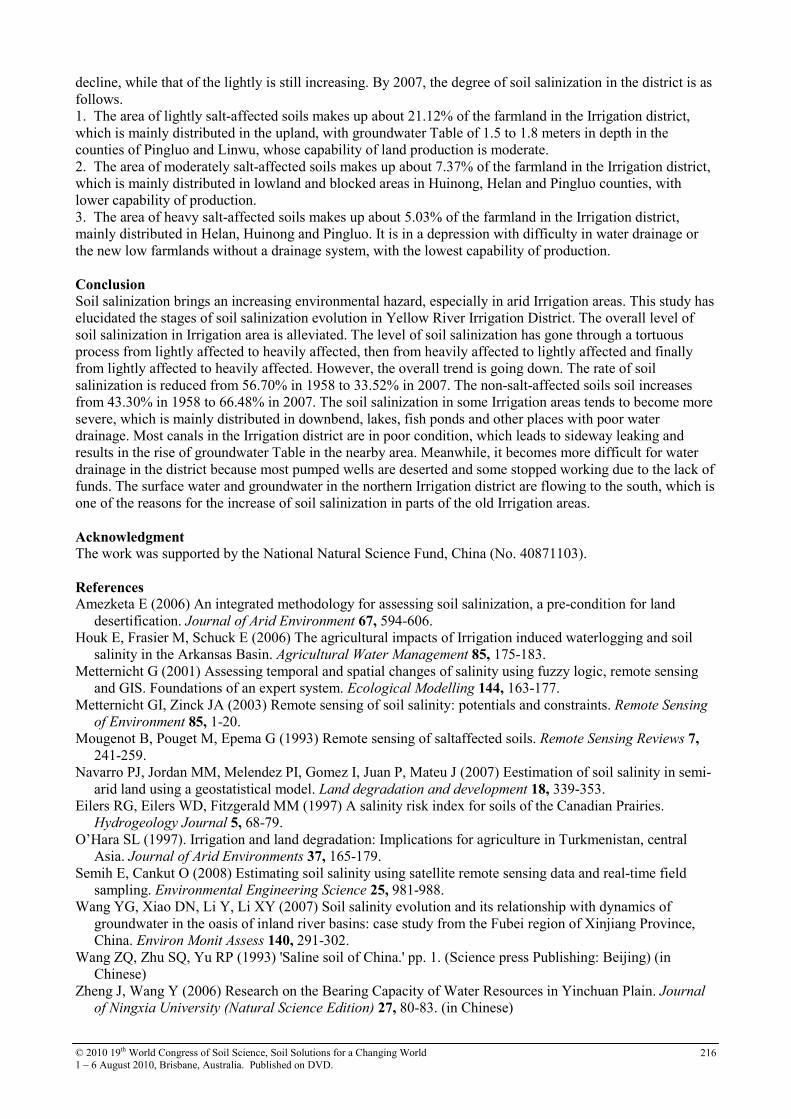
© 2010 19th World Congress of Soil Science, Soil Solutions for a Changing World 1 – 6 August 2010, Brisbane, Australia. Published on DVD.
216
decline, while that of the lightly is still increasing. By 2007, the degree of soil salinization in the district is as follows. 1. The area of lightly salt-affected soils makes up about 21.12% of the farmland in the Irrigation district, which is mainly distributed in the upland, with groundwater Table of 1.5 to 1.8 meters in depth in the counties of Pingluo and Linwu, whose capability of land production is moderate. 2. The area of moderately salt-affected soils makes up about 7.37% of the farmland in the Irrigation district, which is mainly distributed in lowland and blocked areas in Huinong, Helan and Pingluo counties, with lower capability of production. 3. The area of heavy salt-affected soils makes up about 5.03% of the farmland in the Irrigation district, mainly distributed in Helan, Huinong and Pingluo. It is in a depression with difficulty in water drainage or the new low farmlands without a drainage system, with the lowest capability of production.
Conclusion Soil salinization brings an increasing environmental hazard, especially in arid Irrigation areas. This study has elucidated the stages of soil salinization evolution in Yellow River Irrigation District. The overall level of soil salinization in Irrigation area is alleviated. The level of soil salinization has gone through a tortuous process from lightly affected to heavily affected, then from heavily affected to lightly affected and finally from lightly affected to heavily affected. However, the overall trend is going down. The rate of soil salinization is reduced from 56.70% in 1958 to 33.52% in 2007. The non-salt-affected soils soil increases from 43.30% in 1958 to 66.48% in 2007. The soil salinization in some Irrigation areas tends to become more severe, which is mainly distributed in downbend, lakes, fish ponds and other places with poor water drainage. Most canals in the Irrigation district are in poor condition, which leads to sideway leaking and results in the rise of groundwater Table in the nearby area. Meanwhile, it becomes more difficult for water drainage in the district because most pumped wells are deserted and some stopped working due to the lack of funds. The surface water and groundwater in the northern Irrigation district are flowing to the south, which is one of the reasons for the increase of soil salinization in parts of the old Irrigation areas. Acknowledgment The work was supported by the National Natural Science Fund, China (No. 40871103). References Amezketa E (2006) An integrated methodology for assessing soil salinization, a pre-condition for land
desertification. Journal of Arid Environment 67, 594-606. Houk E, Frasier M, Schuck E (2006) The agricultural impacts of Irrigation induced waterlogging and soil
salinity in the Arkansas Basin. Agricultural Water Management 85, 175-183. Metternicht G (2001) Assessing temporal and spatial changes of salinity using fuzzy logic, remote sensing
and GIS. Foundations of an expert system. Ecological Modelling 144, 163-177. Metternicht GI, Zinck JA (2003) Remote sensing of soil salinity: potentials and constraints. Remote Sensing
of Environment 85, 1-20. Mougenot B, Pouget M, Epema G (1993) Remote sensing of saltaffected soils. Remote Sensing Reviews 7,
241-259. Navarro PJ, Jordan MM, Melendez PI, Gomez I, Juan P, Mateu J (2007) Eestimation of soil salinity in semi-
arid land using a geostatistical model. Land degradation and development 18, 339-353. Eilers RG, Eilers WD, Fitzgerald MM (1997) A salinity risk index for soils of the Canadian Prairies.
Hydrogeology Journal 5, 68-79. O’Hara SL (1997). Irrigation and land degradation: Implications for agriculture in Turkmenistan, central
Asia. Journal of Arid Environments 37, 165-179. Semih E, Cankut O (2008) Estimating soil salinity using satellite remote sensing data and real-time field
sampling. Environmental Engineering Science 25, 981-988. Wang YG, Xiao DN, Li Y, Li XY (2007) Soil salinity evolution and its relationship with dynamics of
groundwater in the oasis of inland river basins: case study from the Fubei region of Xinjiang Province, China. Environ Monit Assess 140, 291-302.
Wang ZQ, Zhu SQ, Yu RP (1993) 'Saline soil of China.' pp. 1. (Science press Publishing: Beijing) (in Chinese)
Zheng J, Wang Y (2006) Research on the Bearing Capacity of Water Resources in Yinchuan Plain. Journal
of Ningxia University (Natural Science Edition) 27, 80-83. (in Chinese)

© 2010 19th World Congress of Soil Science, Soil Solutions for a Changing World 1 – 6 August 2010, Brisbane, Australia. Published on DVD.
217
The potential for direct application of papermill sludge to land: a greenhouse
study Matthew NorrisA and Louis Titshall
A ASoil Science, School of Environmental Sciences, University of KwaZulu-Natal, South Africa, Email [email protected] [email protected]
Abstract Primary paper mill sludge (PMS) is a lignocellulosic by-product of the paper manufacturing industry and has traditionally been disposed of too landfill or incinerated. The aims of this study were to investigate the effects of direct land application of PMS on plant growth. In a pot trial, application of PMS to three contrasting soil types at rates of 0, 10, 20 and 40 Mg/ha resulted in an overall decline in ryegrass yield. Poor plant response, which was generally negatively correlated to sludge application rate, was attributed to a high sludge C:N ratio and the resulting microbial sequestration of nitrogen, as well as high electrical conductivity and Na content of the PMS. Concentrations of P, Ca, Mg, Na and K showed variable uptake by the plants with no clear trends evident. While short-term nutrient effects are detrimental, the long-term benefits of improved soil physical conditions and increased soil organic carbon should not be discounted. Keywords Land treatment, lolium perenne, plant nutrients, nitrogen immobilisation, waste disposal
Introduction
The production of pulp for paper manufacture, either from virgin wood or recycled paper, generates large quantities of solid waste (Norrie and Fierro, 1998). These sludges are complex mixtures of chemically modified wood fibers, inorganic solids and chemical additives used in the paper manufacturing process (Charest and Beauchamp, 2002; Monte et al. 2008). In recent years, research to evaluate this disposal alternative has centred primarily on agricultural land application (Phillips et al. 1997; Sellers and Cook, 2003; N’Dayegamiye, 2006) and surface mine reclamation (Fierro et al. 1999; Green and Renault, 2008). Direct land application of raw PMS started in the 1950’s, where land application was considered a means to facilitate filtration and microbial decomposition of the waste residue (Norrie and Fierro, 1998). A papermill plant in KwaZulu-Natal, South Africa, produces approximately 10,800 dry t annum-1 of primary papermill sludge from its kraft manufacturing process. As an alternative to landfill or incineration, it was proposed that the potential for direct land application of the PMS be investigated. Thus the objective of this study was to investigate the response of indicator crop grown in different soil types treated with raw PMS (direct land application). Methods and materials Papermill sludge from a kraft process and three contrasting soils were collected for use in the pot experiment. The soil included the A horizons of a Hutton (Hu, Typic Haplustox) and Shortlands (Sd, Typic Rhodustalf ) and the sandy E horizon of a Longlands soil form (Lo; Typic Haplaquept) (Soil Classification Working Group 1994, Soil Survey Staff 2003). Soils were air dried, ground to pass a 2 mm sieve and chemical properties determined following methods of The Non Affiliated Soil Analysis Work Committee (1990). The pH and electrical conductivity (EC) of the PMS were measured in saturated paste extracts (Leege and Thompson 1997). Readily oxidizable carbon (ROC) was determined using the dichromate digestion method of Walkley (1947). Nitrogen was determined by Kjeldahl digestion (Bremmer and Mulvaney, 1982). Total P, S, Ca, Na, Mg, K were obtained by inductively coupled plasma emission spectroscopy (ICPES) after nitric acid digestion (Slatter, 1998). A pot experiment was used to assess the effect of the papermill sludge on the growth of perennial ryegrass (Lolium perenne) under glasshouse conditions. Sludge (< 4 mm) was applied to each soil at rates equivalent to 10, 20 and 40 Mg/ha (dry mass basis; referred to as M10, M20 and M40, respectively). Soil was thoroughly mixed with air-dried sludge and transferred into 1.1 L plastic pots and about 10 ryegrass seeds were planted in each pot. Three weeks after germination, the seedlings were thinned to three plants per pot. A basal fertiliser (based on fertility recommendations for each soil) was applied to all treatments after the seeds had germinated. The pots were placed in a glasshouse and arranged in a randomised complete block

© 2010 19th World Congress of Soil Science, Soil Solutions for a Changing World 1 – 6 August 2010, Brisbane, Australia. Published on DVD.
218
design with three replicates. Pots were watered as required with distilled water. Aboveground foliage was harvested 9 weeks after sowing by cutting the plants 10 mm above the soil surface. The harvested material was dried at 65 °C in a forced draft oven and plant biomass determined. The plant material was milled and stored in plastic vials. Analysis of total N was by Kjedahl digest (Bremmer and Mulvaney, 1982) and P, S, Ca, Na, Mg and K determined by ICPES after digestion with nitric acid (Slatter, 1998). Overall differences between ryegrass yield and foliage nutrient contents were compared by analysis of variance (ANOVA), using the statistical package Genstat 12th edition. Where overall F-statistics were found to be significant, means were compared by LSD at the 5% level of significance. Results and discussion Sludge and waste characterisation
The raw papermill sludge is alkaline with higher concentrations of Ca and Na relative to the other base cations (Table 1). The high EC reflects the high concentrations of Ca and Na, also indicating that these salts are present in a soluble form. As expected the ROC:N ratio was high, indicating that additional nitrogen would be necessary to obtain an ideal soil C:N ratio of about 12:1. The ROC:N ratio was similar to that of typical primary sludges (Table 2, Norrie and Fierro, 1998). Macronutrient concentrations (N, P, Ca, Mg, P and S) of the PMS are typical of primary sludges, though the Na concentration was markedly higher then reported by Norrie and Fierro (1998) (Table 2). The high Na concentration (and high pH) was attributed to the use of NaOH during the paper manufacturing process. Table 1. Some physical and chemical properties of the primary papermill sludge (PMS) utilised for the
composting experiment.
Property PMS Typicala
pH 9.10 6.4 - 7.6
Electrical conductivity (dS/m) 2.65 0.19 - 0.7
ROCb (g/100g) 39.3 38-44
ROC:N ratio 367 111-478
N (% ) 0.107 0.08-0.4
P (%) 0.278 0.058-1.00
Ca (%) 2.03 2.1-8.1
K (%) 0.060 0.012-0.080
Mg (%) 0.150 0.061-0.032
Na (%) 0.842 0.044 a Typical values for primary papermill sludges (Norrie and Fierro, 1998). b Readily oxidisable carbon (dichromate oxidation). The basic chemical properties of the three soils used in the pot experiment are presented in Table 2. Table 2. Basic chemical properties of the Hutton A (Hu), Longlands E (Lo) and Shortlands A (Sd) soils used in
the pot experiment.
Parameter Hu Lo Sd
H2O 5.34 6.05 6.04 pH
1 M KCl 4.57 4.90 4.94 Electrical conductivity (dS/m) 0.17 0.04 0.09 Organic carbon (g/100g) 3.44 0.14 3.29 Total N (%) 0.210 0.053 0.206 Extractable P (mg/kg) 10.10 4.05 2.91
Ca 6.63 2.06 9.16 Mg 3.04 0.62 4.88
Extractable base cations‡ (cmolc/kg)
K 0.47 0.10 0.37 Cation exchange capacity (cmolc/kg) 12.72 2.54 14.03 Exchangeable acidity (cmolc/kg) 0.21 0.03 0.05
Pot experiment
At the high PMS application rates ryegrass germination was adversely affected. This was attributed to the high EC of the PMS that may have resulted in osmotic imbalance. There was a highly significant (p < 0.001) interaction effect of PMS application rate by soil type on the yield of ryegrass. The individual effects of PMS application rate and soil type also had highly significant effects on ryegrass yield. In the Hu soil, the highest

© 2010 19th World Congress of Soil Science, Soil Solutions for a Changing World 1 – 6 August 2010, Brisbane, Australia. Published on DVD.
219
yields were obtained for the M10 and M20 treatments (Table 3). This soil had a polynomial growth response (R2 = 0.97), indicating an ideal sludge application rate between 10 and 20 Mg/ha for the Hu soil (Table 3). In the Lo soil, the yields decreased linearly (R2 = 0.99) with increasing PMS application rate with the highest yields attained for the M0 treatment (Table 3). In the Sd soil there was a polynomial yield response (R2 = 0.98) to PMS application rate, with an optimal PMS application rate of about 10 Mg/ha (Table 3). The yield of ryegrass grown in the Sd soil was higher than in the Lo and Hu soils regardless of PMS application rate. In all the soils the yields were lowest at the highest PMS application rate. Other studies involving the land application of lignocellulosic wastes have shown similar results (Phillips et al. 1997, Beauchamp et al. 2002, O'Brien et al. 2002). The decreasing yield at high PMS application rates was attributed to nitrogen immobilization due to the carbon-rich PMS. Nitrogen immobilisation was particularly severe in the sandy Lo soil where an initially low soil nitrogen content exacerbated the deficiency created by microbial N assimilation processes. Table 3. Mean (n=3) yield and mean concentrations of N, P, Ca, Na, Mg and K in foliage of ryegrass grown in
either a Hutton A, Longlands E or Shortlands A treated with the equivalent 0, 10, 20 and 40 Mg/ha papermill
sludge (PMS). The adequate and critical concentrations for ryegrass (Miles, 1994) are also given.
Na P Ca Na Mg K Soil
PMS rate (Mg/ha)
Yield (g/pot)a -----------------------------(%)----------------------------
0 0.62fg 5.34a 0.36 0.78 0.22 0.42 3.96 10 1.03de 5.06ab 0.31 0.85 0.20 0.39 3.46 20 1.14de 4.35be 0.32 0.62 0.20 0.33 3.20
Hutton A
40 0.56fg 3.19c 0.34 1.13 0.27 0.29 2.98 0 1.73c 4.86ab 0.78 0.45 0.29 0.31 3.18
10 1.25d 3.16c 0.74 0.46 0.32 0.28 3.12 20 0.80ef 2.05d 0.58 0.48 0.23 0.23 2.26
Longlands E
40 0.37g 1.86d 0.88 0.85 0.47 0.14 2.27 0 2.88ab 5.04ab 0.37 0.49 0.39 0.34 2.35
10 3.20a 4.71ab 0.51 0.46 0.30 0.34 2.89 20 2.65b 3.95ec 0.44 0.46 0.39 0.35 2.81
Shortlands
40 1.85c 3.40c 0.48 0.46 0.32 0.32 2.89 Adequate 3.6-6.0 0.25-0.36 0.26-1.0 - 0.2-0.5 2.5-6.0 Miles
(1994) Critical 3.5 0.24 0.25 - 0.1 2.0-3.0 a Letters that are different indicate significant difference between treatment means (LSD5% = 0.341 and 0.724 for yield and N concentration, respectively). The overall interactive effect of PMS application rate and soil type on plant total N was significant (p = 0.014) and negative relationship between plant N concentrations and PMS application rate was observed for all soils (Table 3). For the Hu and Sd soils the N concentrations of the ryegrass foliage was below the critical limit suggested by Miles (1994) at the highest application rate of PMS (Table 3). In the Lo soil the N concentrations were below the critical limit for all treatments except the control (Table 3). This supports the argument that at high PMS application rates N is immobilised and plant uptake is decreased. There were no clear trends found in the uptake of P, Ca, Na, Mg and K by the ryegrass and no overall significant differences were found between treatment means for any of these nutrients. For all treatments the ryegrass foliage concentrations of P, Ca, Na, Mg and K were within the adequate ranges suggested by Miles (1994). Foliage concentrations of Ca, Mg and K were generally higher in the Hu and Sd soils for any given treatment due to the higher base cation content and cation exchange capacities of these soils. Despite the high Na content of the PMS this did not seem to adversely affect Na concentrations in the plant foliage.
Conclusions Ryegrass growth generally decreased with an increase the application rate of PMS. This was attributed to nitrogen immobilisation, especially in a nutrient poor, sandy soil. The high EC of the PMS also negatively impacted on ryegrass germination at the high application rates. This suggests that land application of PMS may be restricted to lower rates to avoid these problems. However, while short-term nutrient effects may detrimental, the long-term benefits of improved soil physical conditions due to increased soil carbon should not be discounted.

© 2010 19th World Congress of Soil Science, Soil Solutions for a Changing World 1 – 6 August 2010, Brisbane, Australia. Published on DVD.
220
Acknowledgements The authors would like to acknowledge the following people and organisations for their assistance: The Papermill for providing logistic support and funding to conduct this study.
References Beauchamp CJ, Charest MH, Gosselin A (2002) Examination of environmental quality of raw and
composting de-inking paper sludge. Chemosphere 46, 887-895.
Bremmer JM, Mulvaney CS (1982) Nitrogen – total. In `Methods of soil analysis. Part 2. Chemical and microbiological properties`. (Ed. AL Page) pp. 595-624. (ASA, SSSA, Madison).
Charest MH, Beauchamp CJ (2002) Composting of de-inking paper sludge with poultry manure at three nitrogen levels using mechanical turning: behaviour of physico-chemical parameters. Bioresource
Technology 81, 7-17.
Fierro AD, Angers A, Beuchamp CJ (1999) Restoration of ecosystem function in an abandoned sandpit: plant and soil responses to paper de-inking sludge. Journal of Applied Ecology 36, 244-253.
Green S, Renault S (2008) Influence of papermill sludge on growth of Medicago sativa, Festuca rubra and Agropyron trachycaulum in gold mine tailings: a greenhouse study. Environmental Pollution 151, 524-531.
Leege PB, Thompson WH (1997). Test methods for the examination of composting and compost. The U. S. Composting Council. Bethesda.
Miles G (1994) Plant analysis criteria for pastures. KwaZulu-Natal Department of Agriculture, Cedara, Pietermaritzburg, South Africa.
Monte MC, Fuente E, Blanco A, Negro C (2008). Waste management from pulp and paper production in the European Union. Waste Management, University of Madrid.
N’Dayegamiye A (2006) Mixed papermill sludge effects on corn yield, nitrogen efficiency, and soil properties. Agronomy Journal 98, 1471–1478.
Norrie J, Fierro A (1998) Paper sludges as soil conditioners. In `Handbook of soil conditioners`. (Eds A Wallace, RE Terry) pp. 97-115. (Marcel Dekker: New York).
O'Brien TA, Herbert SJ, Barker AV (2002). Growth of corn in varying mixtures of papermill sludge and soil. Communications in Soil Science and Plant Analysis 33, 635-646.
Phillips VR, Kirkpatrick N, Scotford IM, White RP, Burton RGO (1997) The use of papermill sludge on agricultural land. Bioresource Technology. 60, 73-80.
Sellers G, Cook HF (2003) Papermill sludge as a soil amendment: the performance of field beans on a site restored with gault clay. In `Land reclamation: extending the boundaries: proceedings of the Seventh International Conference of the International Affiliation of Land Reclamationists` (Eds HM Moore, P Moore, HR Fox, S Elliott. (Taylor and Francis, Runcorn).
Slatter K (1998) Nickel accumulation and tolerance in Berkheya coddii and its application in phytoremediation. MSc thesis, University of Natal, Pietermaritzburg.
Soil Classification Working Group. 1991. Soil classification: a taxonomic system for South Africa. Department of agricultural development. Pretoria. pp. 241.
Soil Survey Staff (2003) Keys to Soil Taxonomy. 9th edition, USDA, Natural Resources Conservation Service, U.S. Government Printing Office, Washington, DC.
The Non-Affiliated Soil Analysis Work Committee (1990) Handbook of Standard Soil Testing Methods for Advisory Purposes. Soil Science Society of South Africa. Pretoria.
Walkley A (1947) Organic carbon by the Walkley-Black oxidation procedure. Soil Science 63, 251-264.

© 2010 19th World Congress of Soil Science, Soil Solutions for a Changing World 1 – 6 August 2010, Brisbane, Australia. Published on DVD.
221
The residual concentration of regular gasoline in unsaturated soil
Junko NishiwakiA, Yoshishige Kawabe B, Yasuhide SakamotoC and Takeshi KomaiD AInstitute for Geo-Resources and Environment, National Institute of Advanced Industrial Science and Technology (AIST), Tsukuba, Japan, Email [email protected] BInstitute for Geo-Resources and Environment, AIST, Tsukuba, Japan, Email [email protected] CInstitute for Geo-Resources and Environment, AIST, Tsukuba, Japan, Email [email protected] DInstitute for Geo-Resources and Environment, AIST, Tsukuba, Japan, Email [email protected]
Abstract Petroleum hydrocarbons and organic solvents are two of the major contaminants in the groundwater and the soil. Risk and exposure assessments for soil and groundwater are very important for both health and environmental protection, as well as making decisions and remedial goals for engineering goals. To understand the risk levels of toxic chemicals, a risk assessment model has been developed. Although parameters related to the fate of hazardous chemical compounds, such as advection, dispersion, volatilization or sorption are important factors in this system, those parameters for mineral oils have not been investigated enough. In this study, we focused on the residual property and residual concentration of gasoline and gasoline components in unsaturated soil. A set of column experiments was carried out. The residual concentration of the gasoline and gasoline components was different at each depth. Additionally, the components that have different carbon numbers show different rates of movement in soil. Key Words Mineral oils, gasoline, component, soil contaminant, laboratory experiment. Introduction The number of groundwater and soil contamination cases is increasing. In Japan, organic solvents, such as trichloroethylene and tetrachloroethylene, are regulated as specified toxic substances under the Soil Contamination Countermeasures Act established in 2002. However, mineral oils, such as gasoline, light oil and heavy oil, have not been controlled until recently. In 2006, the Ministry of the Environment in Japan published a guideline for treating the contamination of mineral oils. Thus it is becoming important to survey and clean sites that have been contaminated by mineral oils, as well as to assess the risk of mineral oils to human health. We are developing a Geo-environmental Risk Assessment System (GERAS) that will enable us to estimate the amount of exposure to hazardous chemicals (e.g. organic compounds or heavy metals) and the risk to human health (Kawabe et al. 2005; 2003). However, mineral oils are mixtures of more than one hundred different hydrocarbons. As each component has different physical-chemical properties such as volatility and water solubility, it is difficult to predict the fate of mineral oils underground. Furthermore, mineral oils will often change into a different state, e.g. gas, liquid etc. Factors affecting the fate of mineral oils are complex. Furthermore, different components included in mineral oils cause different risks to human health (Edwards et
al. 1997). Thus, it is important to find out the fate and residual properties of mineral oils and those components in the soil. In this study, the residual concentration of gasoline Total Petroleum Hydrocarbons (TPH) and gasoline components in unsaturated soil were investigated by a set of laboratory experiments. The final goal of this study is to clarify the fate of mineral oils in soil and assess the risk of mineral oils to human health. Methods Materials
We used Toyoura sand (d50 = 106 µm, the soil particle density is 2.64 Mg/m3) which is considered to be standard soil in Japan and the physical-chemical properties of it are widely known. The sand was air dried in the laboratory at room temperature for a few weeks prior to use. We chose commercially available regular gasoline (RG) as the mineral oil contaminant. At the time of application, the gasoline contained more than one hundred hydrocarbons, with carbon numbers ranging between C4 and C13. In this study, RG was added to the clean soil to simulate the contaminated soil. Experimental Procedure
A stainless steel column, with an inner diameter of 85 mm and a depth of 500 mm, was used to investigate the residual concentration of RG in unsaturated soil (Figure 1). This column is divided into ten 50 mm deep

© 2010 19th World Congress of Soil Science, Soil Solutions for a Changing World 1 – 6 August 2010, Brisbane, Australia. Published on DVD.
222
short columns. A stainless steel meshed filter was set at the bottom of the column to prevent soil from running off. An inlet port for RG was set at a depth of 175 mm from the top. We conducted a set of experiments in a room with a constant temperature of 15℃. After the column was filled with Toyoura sand (bulk density was 1.60 Mg/m, soil water content was 0.07), ~ 300 mL RG was injected using a pump (10 mL/min). The top of the column was opened to the air and the column was left for a certain period of time. The column was separated into 10 portions at predetermined times (0, 2, 5, 10, 30 days from the beginning of the experiment) and the concentration of RG remaining in each depth was analyzed by GC-FID. Carbon disulfide (CS2) was used as the extraction solvent for residual gasoline and gasoline components from soil.
Figure 1. Photo of experimental equipment. Results Total Petroleum Hydrocarbon (TPH)
TPH concentration remaining in the whole column had decreased 5 days from the beginning of the experiment, after that the remaining TPH concentration was almost constant. Figure 2 shows the variations of the TPH concentrations remaining at each depth. The horizontal axis indicates the ratio of TPH concentration remaining in the soil ((mg-remaining RG/mg-injected RG)/kg-soil), and the vertical axis indicates the depth. It shows that TPH is decreasing from the upper side of the column and that it remains in the deep portion of the column, especially deeper than 325 mm.
0
100
200
300
400
500
0.00 0.05 0.10
conc. (remain/inject)/kg-soil
dep
th (
mm
)
0 day
2 days
5 days
10 days
30 days
0
100
200
300
400
500
0.000 0.002 0.004
conc. (remain/inject)/kg-soil
dep
th (
mm
)
0 day
2 days
5 days
10 days
30 days
Figure 2. Time-dependent change of residual TPH
remaining in each depth.
Figure 3. Time-dependent change of residual iC4
remaining in each depth. Gasoline components
The variations of the concentrations of the RG components remaining at each depth indicated that the hydrocarbons with small carbon numbers were continued to decrease from soil such as Iso-butane (iC4) and iso-pentane (iC5). In contrast, the hydrocarbons with higher carbon numbers, such as benzene (B), ethyle-benzene (EB) and meta-xylene (mX) decreased from the soil early in the experiment and remained in the soil after that. Figures 3 and 4 show the variations of the concentrations of iC4 and EB at each depth, respectively. iC4

© 2010 19th World Congress of Soil Science, Soil Solutions for a Changing World 1 – 6 August 2010, Brisbane, Australia. Published on DVD.
223
continued to decrease from the soil at any depth. EB decreased and almost diminished at depth shallower than 325 mm and remained at depth deeper than 325 mm. Some other components, such as mX or Naphtalene, continued to remain at some deeper depths. The ratios of the components concentration remaining in the soil 30 days after the beginning of the experiment on the value of 0 day, listed in Table 1. It shows that hydrocarbons with small carbon numbers are easily diminished from soil. On the other hand, hydrocarbons with large carbon numbers tend to remain in the soil. The main mechanism for this decrease might be volatilization, due to the initial speed of hydrocarbon depletion followed by a more linear depletion, as show in Figure 5.
0
100
200
300
400
500
0.000 0.010 0.020
conc. (remain/inject)/kg-soil
dep
th (
mm
)
0 day
2 days
5 days
10 days
30 days
0.0
0.2
0.4
0.6
0.8
1.0
0 10 20 30
elapsed time (days)
con
c. (
rem
ain
/in
ject
)/k
g-s
oil
Figure 4. Time-dependent change of residual EB
remaining in each depth. Figure 5. Time-dependent change of residual TPH
remaining in a whole column. Table 1. List of the remaining ratio of each component.
Regular gasoline components remaining ratio (30 days after/initial value)
iso-butane (iC4) 0.07
iso-pentane (iC4) 0.21
Benzene (B) 0.53
Ethyl Benzene (EB) 0.50
meta-Xylene (mX) 0.50
1methyle3ethyl benzene (1MEB) 0.51
Naphthalene (Naph.) 0.49
Conclusion In this study, the property of remaining RG in unsaturated soil was examined. RG decreased only at shallower through the soil layers depth in unsaturated soil. Also, the results indicate that different components move in different ways. Especially, the carbon number of these compounds will directly affect their soil level transmission properties. Mineral oil such as gasoline is composed of various components and each component has different risks to human health. It would be possible to protect human health using risk assessment systems. We intend to collect more data about mineral oil soil dispersion, which will enable us to feed this data into risk analysis systems. This will in turn enable us to better focus on the health issues posed to human, in the near future. References Edwards DA, Andriot MD, Amoruso MA, Tummey AC, Bevan CJ, Tveit A, Hayes LA, Youngren SH,
Nakles DV (1997) Total Petroleum Hydrocarbon Criteria Working Group Series Volume 4, Development of Fraction Specific Reference Doses (RfDs) and Reference Concentration (RfCs) for Total Petroleum

© 2010 19th World Congress of Soil Science, Soil Solutions for a Changing World 1 – 6 August 2010, Brisbane, Australia. Published on DVD.
224
Hydrocarbons (TPH), pp.15-34. (Amherst Scientific Publishers.).
Yoshishige Kawabe, Takeshi Komai and Yasuhide Skamoto (2003) Exposure and Risk Estimation of Inorganic Arsenic in Japan. Journal of the MMIJ 119, 489-49
Yoshishige Kawabe, Takeshi Komai and Yasuhide Skamoto (2005) Exposure Estimation of Organic Compounds in Japan –Risk Analysis by Geo-environmental Risk Assessment Model-. Journal of the
MMIJ 121, 19-27

© 2010 19th World Congress of Soil Science, Soil Solutions for a Changing World 1 – 6 August 2010, Brisbane, Australia. Published on DVD.
225
Variation in soil heavy metal concentrations around and downstream of a
municipal waste landfill
Shirdast MarziehA, H. Mirseyed Hosseini A, F. SarmadiyanA MSc. Student, Assistant professor and Associate professor respectively at the Soil Science Department, Faculty of Agricultural Engineering and Technology, College of Agriculture and Natural Resources , University of Tehran, Karaj, Iran. [email protected]
Abstract Municipal waste landfills are sources of groundwater and soil pollution due to the production of leachate and its movement through refuse. The aim of this study was the determination of soil pollution in the downstream area of the landfill, in relation to changes in soil chemical characteristics and heavy metals concentrations. The landfill was located in the southwest of Babol, North of Iran. Soil samples were taken at three depths (0-30, 30-60, 60-90 cm) from different locations; upstream (control), around and downstream of the landfill, also in two seasons of the year (dry season and wet season). Samples were analyzed by atomic absorption spectrophotometery for Cd, Ni, Pb, Fe and Mn concentrations. Although in the soil vadose zone, heavy metals were found to be in their typical and normal ranges and within the background concentrations, by comparison their concentrations were higher in wet season. Variation in the concentration with depth suggests movement of the heavy metals either from the leachate or from naturally present sources of minerals in the soil. Key Words Soil pollution, heavy metals, municipal waste landfill. Introduction Modern civilization is completely dependent on a large range of metals for all aspect of daily life. There is a long history association between metals and human development. Heavy metal pollution not only affects the production and quality of crops, but also influences the quality of the atmosphere and water bodies, and threatens the health and life of animals and human being (3). Almost any material will produce leachate if water is allowed to percolate trough it. The quality of leachate is determined primarily by the composition and solubility of the waste constituents. If waste is changing in composition, for example due to weathering or biodegradation, then leachate quality will change with time. This is particularly the case in municipal waste landfills containing municipal waste (5). The main routes of human exposure to soil metals are ingestion, inhalation and skin contact. Since soil is the major sink for airbone metals, the measurement of their levels in this media is useful to establish trends in abundance and their consequences because of natural and anthropogenic changes (4). This study was conducted to analyze soil in a municipal waste landfill and its downstream area at Babol, the north of Iran. We collected soil samples in two different seasons of the year(dry season and wet season) to compare the heavy metal concentrations and potential for presentation future pollution. Methods and materials Site description
The landfill and compost company of Babol, lying 40 km southwestern of city center of Babol, Iran on latitudes 65º 21' 63" and longitude 40º 19' 59". Covering an area of 30 ha. This waste facility started operation in 1999 and the compost factory started to produce of compost fertilizer in 2004(received 220 ton/per day for both the landfill and compost factory). Elevation of this area is approximately 650-800m and is located in forestry part. It is 5 km far from the nearest residential area of the village of Hally Khal. Leachate produced from the landfill in east and west directions enters to forest although north direction is directly in contact to ground water. Major agricultural crops in downstream of this area are rice and citrus which use river drills and low depth wells. The source of drinking water in official, commercial and residential parts of downstream substantially is low depth wells. The climate of the area and is characterized by uniform temperature and high rainfall with mean maximum annual temperature varying 14-16 ºC and mean annual rainfall varying 1000-1100 mm.

© 2010 19th World Congress of Soil Science, Soil Solutions for a Changing World 1 – 6 August 2010, Brisbane, Australia. Published on DVD.
226
Sample analysis The soil samples were taken from 5 points in downstream area based on land use : paddy and forest , the soil samples were taken down stream and also one soil sample was taken in landfill(pollution source) and another upstream as a control and the samples were taken from three depth (0-30, 30-60, 60-90) . After preparation of soil samples and extracting by DTPA extractor, leachate was analyzed by (Cd, Ni, Pb, Fe and Mn) using a Perkin- Elmer 403 furnace spectrometer (atomic absorbtion spectrometer analysis) . the calibration of the spectrometer for each metal was performed according to its wavelength and standard solution. For Ni , Pb three standard solutions(1 and 2 ppm and 5ppm) was prepared, for Cd four solutions(0.1 and 0.5 ppm and 1 and 2 ppm),for Mn and Fe four solutions(1 and 2 ppm and 5 and 7 ppm).The spectrometer re-calibrated after each group of 10 successive measurement. The initial solution of samples was 1:2 while samples for Fe and Mn were diluted to 1:11 , in order to fit within the linear region of all the calibration curve . water samples also were analyze in the same way as soils. Table 1: soil samples
Figure 1. location of landfill, soil samples and control.
Result and discussion Fe and Mn concentrations in two sampling times indicated an increase of these metals in 0-30 and 30-60 cm depths in all soil samples. the amount of increase for Fe in 0-30cm was higher than 30-60cm but Mn concentration was also noticeable in 30-60cm depth. The Pb concentrations showed a slight fluctuation in surface depth between two sampling times of except in P4, and these fluctuations were more in 30-60 cm depth. the outcome in all sampling points as compared to landfill and control pointed out that the landfill existence accumulated Ni and Fe in surface depth and the their amount decreased compared to control ; this decrease is also includes the down stream samples. Difference between control and the landfill samples in 30-60 cm depth generally decreased, although there was an increase of concentration in some samples in wet season. The main factor of the variation in the metal concentrations is due to the kind of solid organic compounds in the landfill and their ability for stabilization of metal elements. The amount of rainfall is believed to be the controlling factor in movement of elements through depth specially for Fe and Mn.
Land use Soil sample Forest P1 Forest P2 Paddy P3 Paddy P4 Paddy P5
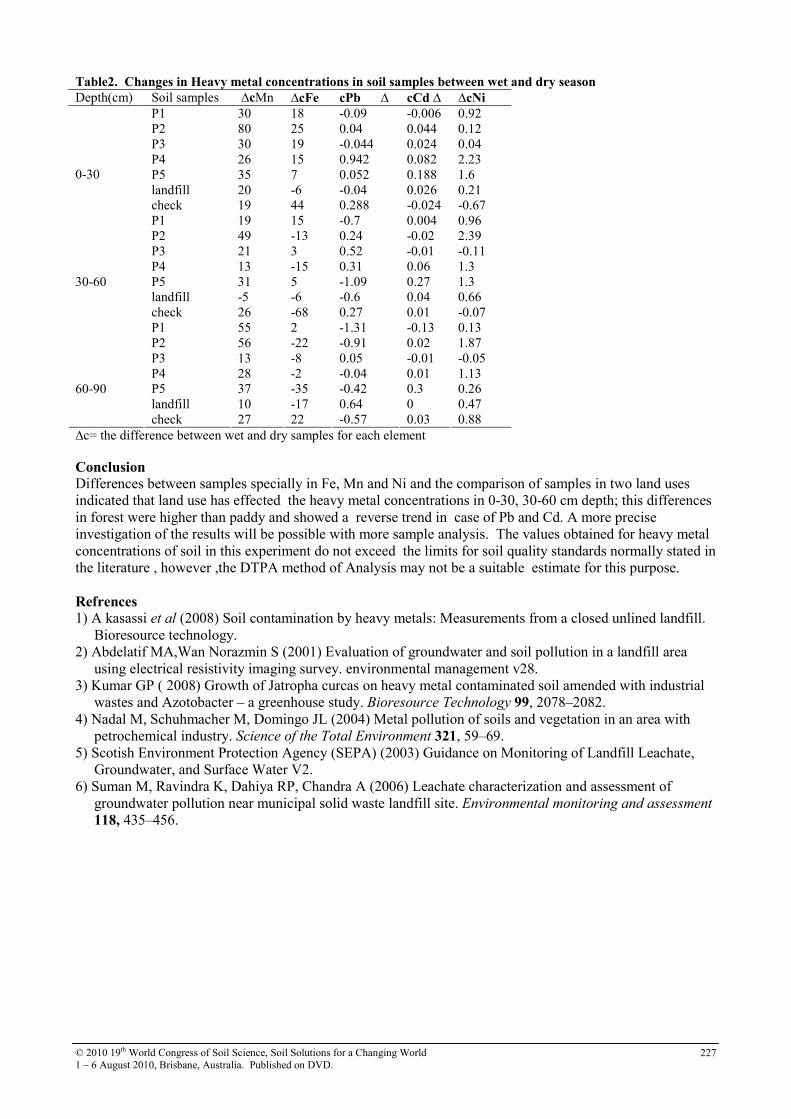
© 2010 19th World Congress of Soil Science, Soil Solutions for a Changing World 1 – 6 August 2010, Brisbane, Australia. Published on DVD.
227
Table2. Changes in Heavy metal concentrations in soil samples between wet and dry season
∆cNi cCd ∆ cPb ∆ ∆cFe ∆cMn Soil samples Depth(cm) 0.92 -0.006 -0.09 18 30 P1 0.12 0.044 0.04 25 80 P2 0.04 0.024 -0.044 19 30 P3 2.23 0.082 0.942 15 26 P4 1.6 0.188 0.052 7 35 P5 0.21 0.026 -0.04 -6 20 landfill -0.67 -0.024 0.288 44 19 check
0-30
0.96 0.004 -0.7 15 19 P1 2.39 -0.02 0.24 -13 49 P2 -0.11 -0.01 0.52 3 21 P3 1.3 0.06 0.31 -15 13 P4 1.3 0.27 -1.09 5 31 P5 0.66 0.04 -0.6 -6 -5 landfill -0.07 0.01 0.27 -68 26 check
30-60
0.13 -0.13 -1.31 2 55 P1 1.87 0.02 -0.91 -22 56 P2 -0.05 -0.01 0.05 -8 13 P3 1.13 0.01 -0.04 -2 28 P4 0.26 0.3 -0.42 -35 37 P5 0.47 0 0.64 -17 10 landfill 0.88 0.03 -0.57 22 27 check
60-90
∆c= the difference between wet and dry samples for each element Conclusion Differences between samples specially in Fe, Mn and Ni and the comparison of samples in two land uses indicated that land use has effected the heavy metal concentrations in 0-30, 30-60 cm depth; this differences in forest were higher than paddy and showed a reverse trend in case of Pb and Cd. A more precise investigation of the results will be possible with more sample analysis. The values obtained for heavy metal concentrations of soil in this experiment do not exceed the limits for soil quality standards normally stated in the literature , however ,the DTPA method of Analysis may not be a suitable estimate for this purpose. Refrences 1) A kasassi et al (2008) Soil contamination by heavy metals: Measurements from a closed unlined landfill.
Bioresource technology. 2) Abdelatif MA,Wan Norazmin S (2001) Evaluation of groundwater and soil pollution in a landfill area
using electrical resistivity imaging survey. environmental management v28. 3) Kumar GP ( 2008) Growth of Jatropha curcas on heavy metal contaminated soil amended with industrial
wastes and Azotobacter – a greenhouse study. Bioresource Technology 99, 2078–2082. 4) Nadal M, Schuhmacher M, Domingo JL (2004) Metal pollution of soils and vegetation in an area with
petrochemical industry. Science of the Total Environment 321, 59–69. 5) Scotish Environment Protection Agency (SEPA) (2003) Guidance on Monitoring of Landfill Leachate,
Groundwater, and Surface Water V2. 6) Suman M, Ravindra K, Dahiya RP, Chandra A (2006) Leachate characterization and assessment of
groundwater pollution near municipal solid waste landfill site. Environmental monitoring and assessment 118, 435–456.

© 2010 19th World Congress of Soil Science, Soil Solutions for a Changing World 1 – 6 August 2010, Brisbane, Australia. Published on DVD.
228
Examining phosphorus contributions from alluvial soils – a comparison of three
Vermont, U.S.A. River corridors Caroline AlvesA and Don RossB ASoil Scientist/GIS Specialist, USDA Natural Resources Conservation Service, Williston, VT, U.S.A, Email [email protected] BFaculty of Plant and Soil Science, University of Vermont, Burlington, VT, U.S.A., Email [email protected]
Abstract The distribution of soils in the floodplain environment is highly complex. The often extreme spatial variability of alluvial soils, in both the vertical and lateral dimensions, creates challenges to adequately capture the range in P values found in the riverine environment. It is important to take samples from a wide range of geographic locations and soil series. Lack of data on phosphorus levels in floodplain soils impede research efforts aimed at reducing the rate of P delivery to Lake Champlain, Vermont, U.S.A. Once estimates for sediment loading rates have been derived, it is crucial to know the P values of the eroded material. Results from soil sampling projects in 2007 and 2008 along the Rock River, Rugg Brook / Mill River and Lewis Creek corridors have greatly expanded the soil database. Profile characterization gives a wealth of chemical and physical data for 28 sites. Preliminary results highlight some important differences between the three study areas. Levels of soluble P, which approximate concentrations of P in the soil solution, the mobile fraction, were higher in the Rock River samples. Across all sites, percent carbon and silt content tend to be correlated with higher P values.
Key Words Phosphorus, sediment pollution, Lake Champlain, benchmark soils, soil series. Introduction Lake Champlain, located in the northeast of the U.S., suffers declining water quality with every year. Target levels for phosphorus inputs to the lake have been set by the two bordering states of Vermont and New York, as well as, the bordering province of Quebec, Canada. Water monitoring efforts reveal that many portions of the lake continue to exceed the Total Maximum Daily Load (TMDL) for phosphorus (LCBP 2008). Eroding soils from stream banks may be one of the largest sources of sediment and phosphorus pollution entering Vermont’s surface water (DeWolfe et al. 2004). Much effort has been expended on water monitoring, yet few systematic studies have focused on the relationship between soil-landscape variability and background or native levels of P in soil (Ross et al. 2008). The intent of this study is to perform a variety of P soil tests in addition to the full range of chemical and physical data from the Natural Resources Conservation Service (NRCS) - Soil Survey Laboratory, to characterize the pedons sampled along three river corridors. The data generated will provide more accurate quantification of P levels in soils from eroding river banks. Moreover, this study will provide insights as to how well alluvial soil map-unit descriptions and generalized data for soil series reflect the actual soil characteristics found at specific sites.
Methods A total of 28 sites have been sampled to a depth of over 120 cm, in most cases. Three river corridors which are spread out geographically across northern Vermont were studied (Figure 1). The majority of samples are from so-called “benchmark soils” which are distributed widely throughout numerous physiographic regions of the northeastern United States. Efforts were made to take samples in areas that were in close proximity to sloughing banks. Many Vermont streams and rivers are incising downward into the streambed, resulting in floodplains that no longer receive sediment when the river is at flood stage (Figure 5). The increased velocity of floodwaters, trapped in the channel, further exacerbates the problem of eroding river banks; thus there are extensive areas from which to take samples. The goal was to find areas that have been largely unmanaged, without fertilizer inputs, in order to gain an understanding of background P levels in relatively unaltered soils. The riparian corridor sampling project has been a joint undertaking of the University of Vermont and USDA-NRCS. Parallel efforts to develop a bank stability / toe erosion model by the USDA Agricultural Research Service, in collaboration with the Vermont Department of Environmental Conservation, will also benefit from the expanding database of P levels in alluvial soils that is being developed from this study. Pedon characterization studies previously conducted over the past decades by NRCS in Vermont did not include data for phosphorus. The Agricultural Testing Laboratory at the University of Vermont has done
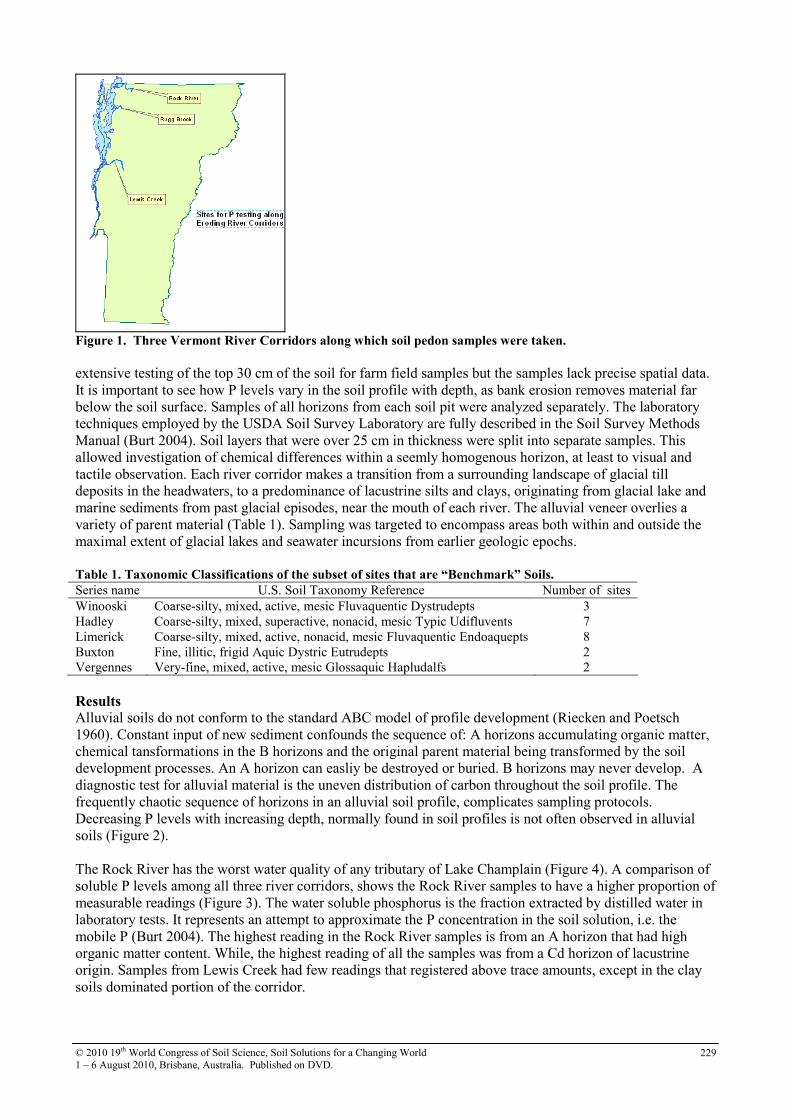
© 2010 19th World Congress of Soil Science, Soil Solutions for a Changing World 1 – 6 August 2010, Brisbane, Australia. Published on DVD.
229
Figure 1. Three Vermont River Corridors along which soil pedon samples were taken.
extensive testing of the top 30 cm of the soil for farm field samples but the samples lack precise spatial data. It is important to see how P levels vary in the soil profile with depth, as bank erosion removes material far below the soil surface. Samples of all horizons from each soil pit were analyzed separately. The laboratory techniques employed by the USDA Soil Survey Laboratory are fully described in the Soil Survey Methods Manual (Burt 2004). Soil layers that were over 25 cm in thickness were split into separate samples. This allowed investigation of chemical differences within a seemly homogenous horizon, at least to visual and tactile observation. Each river corridor makes a transition from a surrounding landscape of glacial till deposits in the headwaters, to a predominance of lacustrine silts and clays, originating from glacial lake and marine sediments from past glacial episodes, near the mouth of each river. The alluvial veneer overlies a variety of parent material (Table 1). Sampling was targeted to encompass areas both within and outside the maximal extent of glacial lakes and seawater incursions from earlier geologic epochs. Table 1. Taxonomic Classifications of the subset of sites that are “Benchmark” Soils.
Series name U.S. Soil Taxonomy Reference Number of sites Winooski Coarse-silty, mixed, active, mesic Fluvaquentic Dystrudepts 3 Hadley Coarse-silty, mixed, superactive, nonacid, mesic Typic Udifluvents 7 Limerick Coarse-silty, mixed, active, nonacid, mesic Fluvaquentic Endoaquepts 8 Buxton Fine, illitic, frigid Aquic Dystric Eutrudepts 2 Vergennes Very-fine, mixed, active, mesic Glossaquic Hapludalfs 2
Results Alluvial soils do not conform to the standard ABC model of profile development (Riecken and Poetsch 1960). Constant input of new sediment confounds the sequence of: A horizons accumulating organic matter, chemical tansformations in the B horizons and the original parent material being transformed by the soil development processes. An A horizon can easliy be destroyed or buried. B horizons may never develop. A diagnostic test for alluvial material is the uneven distribution of carbon throughout the soil profile. The frequently chaotic sequence of horizons in an alluvial soil profile, complicates sampling protocols. Decreasing P levels with increasing depth, normally found in soil profiles is not often observed in alluvial soils (Figure 2). The Rock River has the worst water quality of any tributary of Lake Champlain (Figure 4). A comparison of soluble P levels among all three river corridors, shows the Rock River samples to have a higher proportion of measurable readings (Figure 3). The water soluble phosphorus is the fraction extracted by distilled water in laboratory tests. It represents an attempt to approximate the P concentration in the soil solution, i.e. the mobile P (Burt 2004). The highest reading in the Rock River samples is from an A horizon that had high organic matter content. While, the highest reading of all the samples was from a Cd horizon of lacustrine origin. Samples from Lewis Creek had few readings that registered above trace amounts, except in the clay soils dominated portion of the corridor.

© 2010 19th World Congress of Soil Science, Soil Solutions for a Changing World 1 – 6 August 2010, Brisbane, Australia. Published on DVD.
230
Figure 2. Comparison of P levels using the Bray 1 test between horizons and pedons along Lewis Creek.
Figure 3. Comparison of soluble P levels between all horizons and pedons – along Lewis Creek, Rugg Brook/Mill
River and the Rock River.

© 2010 19th World Congress of Soil Science, Soil Solutions for a Changing World 1 – 6 August 2010, Brisbane, Australia. Published on DVD.
231
Figure 4. Near the mouth of the Rock River – evidencing
severe water quality issues.
Figure 5. Bank erosion along Rugg Brook – within the
past 5 years the streambed has incised 2.5 meters.
Comparisons of soil P levels with soil properties measured in the laboratory and in the field will reveal relationships and the factors that are most influential, as more data become available. P tests have largely been focused on agronomic production; less is known about which test or combination of tests best quantify “algal-available P” - as soil particles move from land to become suspended in water.
Conclusion Preliminary results indicate differences of P levels and dominant soil textures among the three river corridors. The high variability of soil P levels among horizons in the individual site profiles and among different profiles within the same soil series, reinforces the need to develop a database that encompasses the full range of values that might be encountered. Additionally, the soil series as currently delineated on soil maps for these riparian areas often greatly oversimplifies the actual complex pattern of soils. Due to severe geomorphologic processes, data from field samples in alluvial landscapes often fall outside the limits listed in the range of characteristics for soil series in the NRCS Official Series Description (Drohan et al. 2003). Continued characterization studies will provide site specific data and that will allow a more comprehensive evaluation of how floodplain soils are mapped. Rather than using a single soil series, it may be more realistic to use soil complexes, consisting of several soil series in one map-unit. References Burt R (2004) Soil Survey Methods Manual. Number 42 Version 4.0.
DeWolfe, M.N., W.C. Hession, and M.C. Watzin (2004) Sediment and phosphorus loads from streambank erosion in Vermont, USA. Critical Transactions in Water and Environmental Resources Management, G. Sehlke, D.F. Hayes, and D.K. Stevens (eds.), American Society of Civil Engineers, Reston, VA.
Drohan PJ, Ciolkosz EJ, Petersen GW (2003) Soil Survey Accuracy in Forested Field Plots in Northern Pennsylvania. Soil Sci. Am. J. 67,208-214.
LCBP( 2008) State of the Lake. http://www.lcbp.org/lcstate.htm
Riecken FF, Poetsch E (1960) Genesis and classification considerations of some pairie-formed soil profiles from local alluvium in Adair County Iowa. Proceedings of the Iowa Academy of Sciences 67, 268-276
Ross DS, Young EO, Tilley JT, Underwood K (2008) Vermont Water Resources and Lake Studies Center and Vermont Agency of Natural Resources River Management Program Research Collaborative 2006-2008 Final Report. (Ed. W. B. Bowden) pp.32-46.

© 2010 19th World Congress of Soil Science, Soil Solutions for a Changing World 1 – 6 August 2010, Brisbane, Australia. Published on DVD.
232
Getting the soil pH profile right helps with weed control and sustainability
Chris GazeyA and Joel AndrewB ADepartment of Agriculture and Food Western Australia, Northam, WA, Australia, Email [email protected] BPrecision SoilTech, Belmont, WA, Australia, Email [email protected] Abstract Surface application of agricultural lime to treat acidity in the soil profile delivers multiple benefits to the broadacre dryland farming systems in Western Australia. Soil pH measured in 2009 to a depth of 40–50 cm was increased by applications of lime applied in 1991 and 2000. The ameliorated soil pH profile, which meets the Wheatbelt Natural Resource Management 2025 resource targets (Avon Catchment Council 2005) (designed to remove acidity as a constraint to productive agriculture), has provided multiple benefits in terms of increased productivity, increased crop competitiveness, reduced weed burden, reduced risk of soil erosion by wind due to increased biomass cover and potentially reduced off-site effects which result from decreased water use efficiency on profiles with low pH. Current annual losses due to soil acidity for the WA wheatbelt are estimated at between $300–400 million or around 9% of the total crop. The treated soil profile in this trial returned $175/ha benefit from increased wheat yield in 2008 and $225/ha benefit from increased barley grain yield in 2009. Key Words Soil Acidity, pH, lime, wind-erosion, weeds, wheat. Introduction Low soil pH is a significant and widespread constraint to dryland agriculture in Australia (Dolling 2001) and world wide (Sumner and Noble 2003). In the Western Australian wheatbelt it has been exacerbated by dryland agricultural practices, especially because the use of lime has not been common-place. Current estimates indicate that; 78 per cent of topsoil (0–10 cm) is below the soil pHCa targets of 5.5, 25 per cent of the 10–20 cm and 18 per cent of the 20–30 cm layer is below the soil pHCa targets of 4.8 in the agricultural area of the Avon River Basin which covers 8.3 million hectares or about 45 per cent of the WA wheatbelt (see paper by Andrew and Gazey these proceedings). Western Australian farmers consistently highlight the upfront cost of applying agricultural lime as a significant barrier to treating soil acidity (Fisher 2009). A short-term view of returns on investment dominates decision making and this approach is unable to adequately account for either, the long-term losses which accrue from allowing the profile to continue to acidify, the increased costs to ameliorate the degraded soil or, the long-term gains in productivity and other benefits which result from eliminating this economically manageable constraint. Quantification of the impact of soil acidity on agriculture has typically been carried out by applying either high rates of lime, more reactive types of lime or more vigorous incorporation of lime in an attempt to ‘simulate’ the gradual removal of the soil acidity constraint by surface applications and time. Each of these experimental approaches has potential to abruptly change more than just the acidity profile. For example, high rates of lime and more reactive lime may change the availability of nutrients and/or the level of microbial activity. A better approach to determining the long-term benefits or implications of treating soil acidity is to follow the changes in long-term trials that span one or more decades. Conducting and managing such long-term trials is both expensive and resource intensive when carried out by department’s of agriculture and reduced investment in these areas has made such work rare. This paper reports the results from 2008 and 2009 gathered from a large-scale long-term trial initiated and managed by growers David and Alex Leake on their property located 17 km north of the WA wheatbelt town of Kellerberrin. Methods Establishment and management
Limesand, neutralising value of 90 per cent (Table 1) sourced from mobile dunes near the coastal town of Lancelin in WA (340 km away from the farm) was surface applied in 1991 at rates of 1, 2.5 or 5 t/ha to plots 15 m wide and 100 m long using a multi-spreader, a nil lime treatment (control) plot was left untreated in each of three replicates. The soil type is a Tenosol locally know as a yellow sandy earth (Schoknecht 2002).
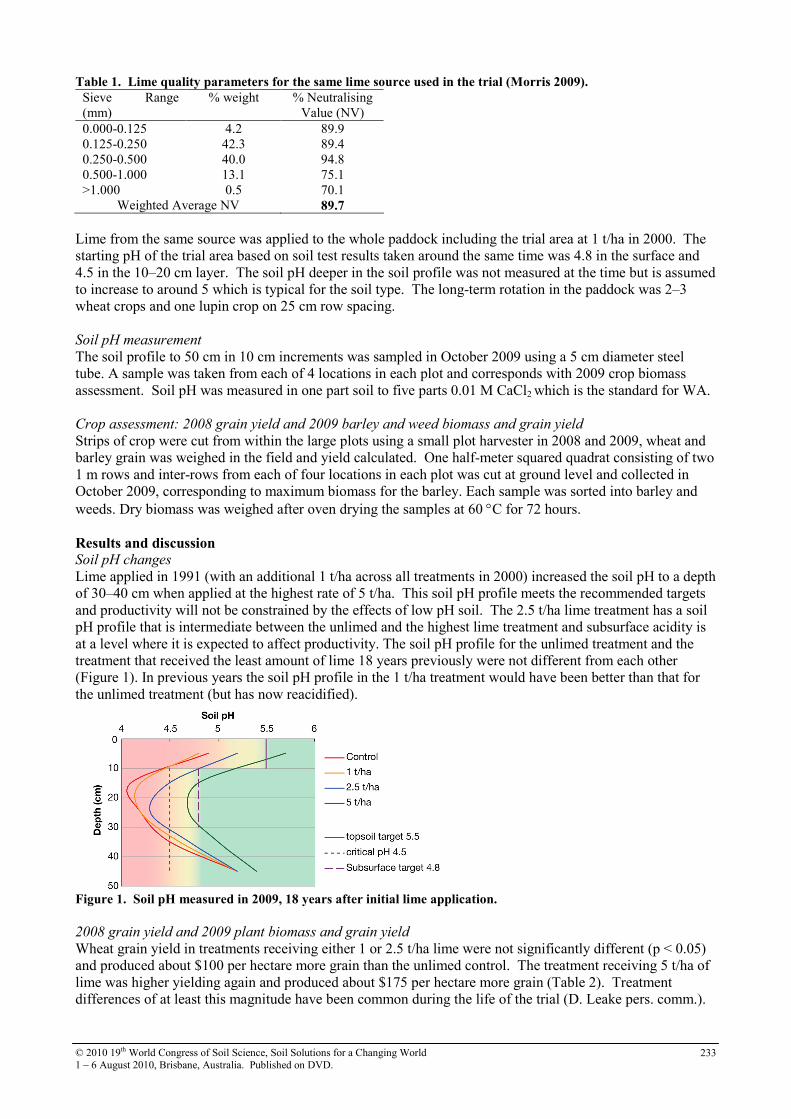
© 2010 19th World Congress of Soil Science, Soil Solutions for a Changing World 1 – 6 August 2010, Brisbane, Australia. Published on DVD.
233
Table 1. Lime quality parameters for the same lime source used in the trial (Morris 2009).
Sieve Range (mm)
% weight % Neutralising Value (NV)
0.000-0.125 4.2 89.9 0.125-0.250 42.3 89.4 0.250-0.500 40.0 94.8 0.500-1.000 13.1 75.1 >1.000 0.5 70.1
Weighted Average NV 89.7
Lime from the same source was applied to the whole paddock including the trial area at 1 t/ha in 2000. The starting pH of the trial area based on soil test results taken around the same time was 4.8 in the surface and 4.5 in the 10–20 cm layer. The soil pH deeper in the soil profile was not measured at the time but is assumed to increase to around 5 which is typical for the soil type. The long-term rotation in the paddock was 2–3 wheat crops and one lupin crop on 25 cm row spacing. Soil pH measurement
The soil profile to 50 cm in 10 cm increments was sampled in October 2009 using a 5 cm diameter steel tube. A sample was taken from each of 4 locations in each plot and corresponds with 2009 crop biomass assessment. Soil pH was measured in one part soil to five parts 0.01 M CaCl2 which is the standard for WA. Crop assessment: 2008 grain yield and 2009 barley and weed biomass and grain yield
Strips of crop were cut from within the large plots using a small plot harvester in 2008 and 2009, wheat and barley grain was weighed in the field and yield calculated. One half-meter squared quadrat consisting of two 1 m rows and inter-rows from each of four locations in each plot was cut at ground level and collected in October 2009, corresponding to maximum biomass for the barley. Each sample was sorted into barley and weeds. Dry biomass was weighed after oven drying the samples at 60 °C for 72 hours. Results and discussion Soil pH changes
Lime applied in 1991 (with an additional 1 t/ha across all treatments in 2000) increased the soil pH to a depth of 30–40 cm when applied at the highest rate of 5 t/ha. This soil pH profile meets the recommended targets and productivity will not be constrained by the effects of low pH soil. The 2.5 t/ha lime treatment has a soil pH profile that is intermediate between the unlimed and the highest lime treatment and subsurface acidity is at a level where it is expected to affect productivity. The soil pH profile for the unlimed treatment and the treatment that received the least amount of lime 18 years previously were not different from each other (Figure 1). In previous years the soil pH profile in the 1 t/ha treatment would have been better than that for the unlimed treatment (but has now reacidified).
Figure 1. Soil pH measured in 2009, 18 years after initial lime application.
2008 grain yield and 2009 plant biomass and grain yield
Wheat grain yield in treatments receiving either 1 or 2.5 t/ha lime were not significantly different (p < 0.05) and produced about $100 per hectare more grain than the unlimed control. The treatment receiving 5 t/ha of lime was higher yielding again and produced about $175 per hectare more grain (Table 2). Treatment differences of at least this magnitude have been common during the life of the trial (D. Leake pers. comm.).

© 2010 19th World Congress of Soil Science, Soil Solutions for a Changing World 1 – 6 August 2010, Brisbane, Australia. Published on DVD.
234
Table 2. Wheat grain yield for lime treatments at Kellerberrin in 2008. Grain yields followed by the same letter
are not significantly different (p < 0.05).
1991 Lime treatment (t/ha)
Wheat grain (t/ha)
Relative to maximum (%)
Yield increase (kg grain/ha)
$ value of extra grain @ $300/t in 2008
0 2.92 a 83 1.0 3.30 b 93 330 $99 2.5 3.20 b 5.0 3.50 c 100 580 $175 LSD (P=0.05) 0.19
A significant wheat grain increase was recorded in the 1 t/ha lime treatment in 2008 despite the soil pH profile being similar to the unlimed control. Although weed numbers were not assessed in 2008 it was observed that the unlimed treatment had the most weeds. It is likely that the wheat did better in the 1 t/ha treatment because there was less competition for water and nutrients from the weeds. In previous years when the soil pH profile was less acidic, the crops would have grown better, more effectively competing with the weeds compared to the unlimed treatment and there would have been less build-up of a weed seed bank. The barley and weed biomass measured in 2009 (Figure 2) support the weed competition theory. Weed biomass decreased and barley biomass increased as the lime rate increased. Where soil acidity had been removed as a constraint to production (5 t/ha lime treatment) the total biomass increased by 1.6 times compared the unlimed acidic profile and the weed biomass was reduced to only three per cent of the total biomass.
Figure 2. Barley and ryegrass biomass from the long-term Kellerberrin lime trial in 2009. Note the barley plant
size as well as total biomass differences (photo).
Barley grain yield in 2009 increased almost linearly with the rate of lime application. Over three times the yield was recorded for the 5 t/ha lime treatment (non-limiting soil pH profile) compared to the unlimed acidic soil profile (Table 3) Table 3. Barley grain yield (feed quality) for lime treatments at Kellerberrin in 2009. Grain yields followed by
the same letter are not significantly different (p < 0.05).
1991 Lime treatment (t/ha)
Barley grain (t/ha)
Relative to maximum (%)
Yield increase (t grain/ha)
$ value of extra grain @ $148/t in 2009
0 0.70 a 32 1.0 1.10 b 49 0.40 $60 2.5 1.76 c 79 1.06 $157 5.0 2.22 d 100 1.52 $225 LSD (P=0.05) 0.37
Conclusion Managing soil acidity can provide multiple benefits to the farming system and the environment. Soil pH is the keystone to many of the so-called ‘soil health’ issues. A soil free of constraints imposed by low pH can support a wider range of rotation choices, increased productivity–both grain and biomass, better weed control, improved nutrient availability and cycling by microbial activity. Reduced soil degradation resulting from further acidification and potentially decreased soil erosion from wind due to increased biomass cover are also additional benefits.

© 2010 19th World Congress of Soil Science, Soil Solutions for a Changing World 1 – 6 August 2010, Brisbane, Australia. Published on DVD.
235
Unfortunately, all too often, very few of these benefits are considered in an economic analysis of managing soil acidity when too much attention is directed towards ‘what will be the short-term return on investment?’ There is a need to improve the economic analysis to include the value of soil-services to adequately account for i) the cost of degrading the soil resource, ii) the cost of ‘loaning’ alkalinity from the resource (by continuing to farm without applying lime) and iii) the value of a maintained or recovered soil pH profile. It is possible to purchase, transport (250 km) and spread 1 t/ha of 90 per cent neutralising value fine lime for $40 in the Western Australian wheatbelt. References Avon Catchment Council (2005). The Avon Natural Resource Management Strategy. The Regional Natural
Resource Management Strategy for the Avon River Basin. (Avon Catchment Council). http://www.avonnrm.org.au/regional_strategy/documents/avon_nrm_strategy_2005.pdf
Dolling P (2001) Soil acidification: an insidious soil degradation issue. In: ‘Australian Agriculture Assessment 2001’. (National Land & Water Resources Audit) http://www.anra.gov.au/topics/soils/acidification/index.html
Fisher J (2009) Soil Acidity and liming focus group workshops 3–5 August 2009. (Désirée Futures Report 2009-01) in press
Morris C (2009) Code of Practice Product Information Sheet AgLime of Australia Lancelin limesand (Lime WA Inc.) http://www.limewa.com.au/Product%20Information%20Sheets/AglimeLancelin.pdf
Schoknecht 2002 Soil groups of Western Australia – a simple guide to the main soils of Western Australia Technical Report 246 Edition 3 (Department of Agriculture and Food Western Australia) http://www.agric.wa.gov.au/PC_92472.html
Sumner ME, Noble AD (2003) Soil acidification: the world story. In ‘Handbook of Soil Acidity’. (Ed. Z Rengel) pp. 1-28. (Marcel Dekker: New York).