19 July 2021 - Shanta Gold
22
19 July 2021 Shanta Gold Limited ("Shanta Gold", “Shanta” or the "Company") Shanta Gold Announces New Five-Year Production Plan Shanta Gold (AIM: SHG), the East Africa-focused gold producer, developer and explorer, is pleased to announce a new five-year plan (the “Plan”) for its gold assets in Tanzania, including New Luika Gold Mine ("NLGM") and Singida Gold Project (“Singida”). Highlights Reserve and resource growth and mine life extension • Group-wide gold reserves as at 30 June 2021 of 666,000 ounces (“oz”) grading 2.99 g/t (JORC compliant); • Gold reserves at NLGM of 423,000 oz grading 2.99 g/t, up from 382,000 oz grading 2.98 g/t as at 31 December 2020 (net of mining depletion); • Group-wide gold resources of 3,215,000 oz grading 3.62 g/t (JORC compliant in Tanzania and NI43-101 in Kenya); o New Luika (Tanzania): 1,129,000 oz grading 2.73 g/t; o Singida (Tanzania): 904,000 oz grading 2.38 g/t; o West Kenya Project (Kenya): 1,182,000 oz grading 12.6 g/t; and, • Reserve-based mine life extended to 2026 at NLGM and 2029 at Singida. Transformational production increases from 2023 with significant upside potential • Group-wide gold production forecast from Tanzanian assets of approximately 499,000 oz for the five-year period from H2 2021 – H1 2026 (the “Plan Period”); • Average annual gold production from Tanzanian assets of 116,000 oz from 2023-2025; • Significant upside through the potential conversion of 7.26 Mt grading 2.37 g/t for 552 koz resources at NLGM and 9.78 Mt grading 2.11 g/t for 664 koz resources at Singida currently sitting outside the Plan; and, • Shanta continues to invest in West Kenya to confirm the viability of a mine, with a construction decision expected before the end of 2023. Rapidly reducing cost base between 2021 and 2025 • Average consolidated Adjusted Operating Costs and All In Sustaining Costs (“AISC”) of US$778 /oz and US$986 /oz respectively over the Plan Period. Potential for further portfolio optimisation • Potential for further optimisation of the mining schedule, with the Company exploring the possible addition of a fourth ball mill, which would increase plant throughput beyond 2,450 tonnes per day and reduce cut-off grades. Gold production (koz) H2 2021 2022 2023 2024 2025 H1 2026 NLGM 33,361 74,713 77,004 79,973 78,619 24,104 Singida - - 34,902 34,439 43,073 18,776 Total 33,361 74,713 111,906 114,412 121,692 42,880 AISC 1 (US$/oz) H2 2021 2022 2023 2024 2025 H1 2026 NLGM 1,272 1,064 1,063 1,021 947 962 Singida - - 891 881 758 796 Total (including 1,272 1,064 1,010 979 880 889
-
Upload
khangminh22 -
Category
Documents
-
view
1 -
download
0
Transcript of 19 July 2021 - Shanta Gold

19 July 2021
Shanta Gold Limited ("Shanta Gold", “Shanta” or the "Company")
Shanta Gold Announces New Five-Year Production Plan
Shanta Gold (AIM: SHG), the East Africa-focused gold producer, developer and explorer, is pleased to announce a new five-year plan (the “Plan”) for its gold assets in Tanzania, including New Luika Gold Mine ("NLGM") and Singida Gold Project (“Singida”). Highlights Reserve and resource growth and mine life extension
• Group-wide gold reserves as at 30 June 2021 of 666,000 ounces (“oz”) grading 2.99 g/t (JORC compliant);
• Gold reserves at NLGM of 423,000 oz grading 2.99 g/t, up from 382,000 oz grading 2.98 g/t as at 31 December 2020 (net of mining depletion);
• Group-wide gold resources of 3,215,000 oz grading 3.62 g/t (JORC compliant in Tanzania and NI43-101 in Kenya);
o New Luika (Tanzania): 1,129,000 oz grading 2.73 g/t; o Singida (Tanzania): 904,000 oz grading 2.38 g/t; o West Kenya Project (Kenya): 1,182,000 oz grading 12.6 g/t; and,
• Reserve-based mine life extended to 2026 at NLGM and 2029 at Singida. Transformational production increases from 2023 with significant upside potential
• Group-wide gold production forecast from Tanzanian assets of approximately 499,000 oz for the five-year period from H2 2021 – H1 2026 (the “Plan Period”);
• Average annual gold production from Tanzanian assets of 116,000 oz from 2023-2025;
• Significant upside through the potential conversion of 7.26 Mt grading 2.37 g/t for 552 koz resources at NLGM and 9.78 Mt grading 2.11 g/t for 664 koz resources at Singida currently sitting outside the Plan; and,
• Shanta continues to invest in West Kenya to confirm the viability of a mine, with a construction decision expected before the end of 2023.
Rapidly reducing cost base between 2021 and 2025
• Average consolidated Adjusted Operating Costs and All In Sustaining Costs (“AISC”) of US$778 /oz and US$986 /oz respectively over the Plan Period.
Potential for further portfolio optimisation
• Potential for further optimisation of the mining schedule, with the Company exploring the possible addition of a fourth ball mill, which would increase plant throughput beyond 2,450 tonnes per day and reduce cut-off grades.
Gold production (koz)
H2 2021 2022 2023 2024 2025 H1 2026
NLGM 33,361 74,713 77,004 79,973 78,619 24,104
Singida - - 34,902 34,439 43,073 18,776
Total 33,361 74,713 111,906 114,412 121,692 42,880
AISC1 (US$/oz) H2 2021 2022 2023 2024 2025 H1 2026
NLGM 1,272 1,064 1,063 1,021 947 962
Singida - - 891 881 758 796
Total (including 1,272 1,064 1,010 979 880 889
Corp OH)
1 AISC includes corporate overheads and development costs and has been calculated in accordance with the World Gold Council definition assuming royalties payable at a spot price of US$1,700/oz
Eric Zurrin, Chief Executive Officer, commented:
“It’s been four years since we presented our last mine plan and we’re proud of having delivered on and exceeded what we set out to do at that time. We feel even more excited about this Five-Year Plan and the transformational journey to becoming a 110,000+ oz gold producer from 2023. Our revised group-wide gold reserves and resources at 666,000 oz and 3,215,000 respectively demonstrate the huge potential in the portfolio, and our extension of the reserve-based mine life to 2026 at New Luika and 2029 at Singida underpins our confidence in the long-term sustainability of both assets. Whilst it’s been a challenging 18 months for the entire world, our focus has remained on protecting our team and communities whilst continuing to grow our business. We have never been in such a strong position – with a healthy balance sheet, limited debt, a growing diversified portfolio and a maiden dividend launched this year. Our robust fundamentals will support our ambition to becoming a leading mid-tier gold producer in Africa.”
Analyst conference call and presentation
Shanta Gold will host an analyst conference call and presentation today, 19 July 2021, at
10:30 BST. Participants can access the call by dialling one of the following numbers below
approximately 10 minutes prior to the start of the call or by clicking on the link below.
UK Toll-Free Number: +44 (0) 800 279 4827 UK Toll Number: +44 (0) 330 336 9401 PIN: 769452
https://events.globalmeet.com/Public/ClickToJoin/ZW5jPU1rMk92R0ZvYUlZQzhNQkpwb0toWWRzaHl1NW5jVGVodEtGUTJ0WFZJNjQwaFJDWjZFOHZLZz09
Participant Passcode: 769452
The presentation will be available for download from the Company’s website:
www.shantagold.com.
A recording of the conference call will subsequently be available on the Company's website.
Investor conference call
Shanta Gold is also hosting a live investor presentation via the Investor Meet Company platform today, 19 July 2021, at 12:00pm BST. The presentation is open to all existing and potential shareholders. Questions can be submitted pre-event via the Investor Meet Company dashboard up until 9:00am the day before the meeting or at any time during the presentation.
Investors can sign up to Investor Meet Company for free and add to meet Shanta Gold via:

https://www.investormeetcompany.com/shanta-gold-limited/register-investor
Investors who already follow Shanta Gold on the Investor Meet Company platform will automatically be invited.
Shanta Gold Limited Eric Zurrin (CEO) +44 (0) 14 8173 2153
Luke Leslie (CFO)
Nominated Adviser and Joint Broker
Liberum Capital Limited
Scott Mathieson / Ed Thomas / Louis Davies / Nikhil Varghese +44 (0) 20 3100 2000
Joint Broker
Tamesis Partners LLP
Charlie Bendon / Richard Greenfield +44 (0) 20 3882 2868
Public Relations
FTI Consulting
Ben Brewerton / Jourdan Webb +44 (0) 20 3727 1426
Disclaimer
The technical information contained in this announcement was reviewed by Juma Kisunda (the Company’s Technical Services Manager) and Jackson Kikota (the Company’s Chief Planning Mining Engineer) who are Members of the Australasian Institute of Mining and Metallurgy (AusIMM).
They have sufficient experience that is relevant to the style of mineralization and type of deposit under consideration and to the activity being undertaken to qualify as a Competent Persons as defined in the 2012 Edition of the 'Australasian Code for Reporting of Exploration Results, Mineral Resources and Ore Reserves' and for the purposes of the AIM Guidance Note on Mining and Oil & Gas Companies dated June 2009, and National Instrument 43-101 (‘’NI 43-101).
The information contained within this announcement is deemed by the Company to constitute inside information as stipulated under the Market Abuse Regulation (EU) No. 596/2014 as amended by The Market Abuse (Amendment) (EU Exit) Regulations 2019.
About Shanta Gold
Shanta Gold is an East Africa-focused responsible gold producer, developer and explorer. The company has an established operational track record, with defined ore resources on the New Luika and Singida projects in Tanzania, with reserves of 666 koz grading 3.0 g/t, and exploration licences covering approximately 1,100 km2 in the country. Alongside New Luika and Singida, Shanta also owns the West Kenya Project in Kenya with defined inferred resources of 1.2 Mt grading 12.6 g/t and licences covering approximately 1,162 km2. With a strong balance sheet, a growing diversified portfolio and a maiden dividend paid in 2021, Shanta offers a resilient investment opportunity for the near and long-term. Shanta is quoted on London’s AIM market (AIM: SHG) and has approximately 1,048 million shares in issue.

Production Schedule – NLGM The Plan provides for a combination of underground mining and open pit mining at NLGM. Key outcomes from NLGM’s updated mining schedule include the following for the Plan Period:
• Gold production of 367,773 oz from NLGM;
• Average annual production of 73,600 oz, with the potential to extend mine life beyond 2026 through conversion of significant known resources currently sitting outside the Plan;
• 4.4 Mt milled, with forecasted throughput reaching 2,450 tonnes per day (“tpd”) from late 2021 onwards, following the ramp up of the third mill commissioned in early 2021;
• Mill feed continues at full capacity beyond 2026, with tonnes from tailings recovery available to supplement mined ore beyond the final year of the Plan if necessary;
• Average anticipated recoveries of 89.1%;
• Underground reserves to contribute 2.8 Mt of mill feed at an average grade of 3.46 g/t, for 311,601 oz contained;
• Open pit reserves will support underground mining activities by contributing 1.4 Mt of mill feed at an average grade of 2.06 g/t, for 94,613 oz; and,
• On-going exploration is expected to further enhance and extend the Plan in the future. The strategy for NLGM is to maximise value and mine life through the inclusion of additional resources and reserves within and around the Company’s mining licenses. All reserves incorporated in the Plan are within existing mining license areas. Throughout the Plan Period, NLGM will blend underground mining of high-grade ores and surface mining of lower grade ores. The Plan provides for total mining extraction of 4.23 Mt for 406,214 oz contained, with 311,601 oz (77%) from underground mining and 94,613 oz (23%) from open pit mining. The balance of process feed ore will draw from stockpiles, gravels and mineralized waste, totalling 4,400 oz contained. At this stage the maiden resource declared at open-pit deposit Porcupine South of 64,000 oz grading 2.08 g/t, near NLGM, is not included in the Plan and presents a clear opportunity for future mine life extension upon issuance of a mining license. Under the Plan, the process plant maintains full capacity utilisation throughout the Plan Period. It is expected that additional resources from the existing portfolio of opportunities within the Company’s mining licenses and surrounding exploration licenses will provide further mine life and optionality for NLGM. Table 1 – NLGM Five-Year Production Schedule by Source1
PRODUCTION H2 2021 2022 2023 2024 2025 H1 2026 Total
Open Pit
Material Mined tonnes 1,215,620 2,579,936 2,339,087 1,877,648 4,129,967 3,059,891 15,202,149
Ore Mined tonnes 78,833 254,285 284,643 253,035 258,290 299,792 1,428,879
Strip Ratio x 14.3 9.1 6.9 6.4 14.8 9.2 9.64
Grade g/t 1.45 2.02 2.30 2.21 1.87 2.06 2.06
Contained Gold koz 3,664 16,512 21,064 17,968 15,530 19,875 94,613

Underground
Ore Mined tonnes 327,325 563,190 607,283 629,498 624,118 49,885 2,801,299
Grade g/t 3.08 3.72 3.31 3.63 3.48 2.32 3.46
Contained Gold koz 32,446 67,311 64,668 73,548 69,901 3,728 311,601
Low grade material
Ore Mined tonnes 3,179 38,829 23,879 34,721 - - 100,608
Grade g/t 1.48 1.36 1.37 1.34 - - 1.32
Contained Gold koz 151 1,697 1,052 1,494 - - 4,394
Total
Ore Mined tonnes 406,158 817,476 891,926 882,533 882,407 349,677 4,230,178
Grade g/t 2.77 3.19 2.99 3.23 3.01 2.10 2.99
Contained Gold koz 36,110 83,823 85,732 91,516 85,431 23,603 406,214
Processing
Tonnes Milled tonnes 445,000 882,500 882,500 885,000 882,500 437,500 4,415,000
Head Grade g/t 2.63 2.95 3.04 3.14 3.10 1.96 2.91
Recovery % 88.5% 89.3% 89.2% 89.4% 89.4% 87.2% 89.1%
Gold Produced koz 33,361 74,713 77,004 79,973 78,619 24,104 367,773
1 Figures may not total exactly due to rounding. Exploration and Future Potential
• Resources presently sitting outside of the Plan amount to 7.26 Mt at 2.37 g/t for 552 koz at NLGM, and 9.8 Mt at 2.11 g/t for 664 koz at Singida;
• These resources, which can potentially benefit from further exploration, have been prioritised for further evaluation. At NLGM these have the advantage that they all sit within proximity to the processing plant. Similarly at Singida, these all sit within proximity to the planned location of the processing plant;
• A new mining license is being sought for the area occupied by Porcupine South, at which the Company recently declared a maiden resource of 64,000 oz. Should this license be granted, the Company expects to be able to incorporate an additional 295 kt of ore into the 2026 mining schedule at 2.16 g/t, for 20.4koz contained, prior to carrying out any further exploration works at the site. This would add an additional 18,200 oz to Mill production from mining activities in 2026;
• NLGM’s underground deposits are open at depth and carry significant inferred resources which the Company plans to explore further;
• Shanta previously released its Revised Mine Plan (“RMP”) in March 2017. In comparison, the Plan has increased average annual production (on a like-for-like five-year projection) by 21% and reserves by 29% from two mines; and,
• Since March 2017, ounces contained within Shanta’s global resources have increased by 168%.
NGLM – Opex and Capex forecasts

A summary of operating costs is provided below:
COSTS H2 2021 2022 2023 2024 2025 H1 2026 Total
Open Pit Mining $/oz 31 35 34 31 39 94 41
Underground Mining $/oz 389 320 378 368 327 55 321
Processing $/oz 204 173 168 161 164 322 186
Mine Overheads $/oz 163 139 133 127 127 248 146
By-product Credit $/oz (11) (10) (10) (10) (10) (10) (10)
Royalty & Selling $/oz 128 128 128 128 128 128 128
UG & OP Development $/oz 157 167 138 136 95 - 122
Other (SIB, Corp, Exploration) $/oz 210 113 94 81 77 125 105
Adjusted Operating Costs1,3 $/oz 905 784 831 805 775 836 812
AISC2,3 $/oz 1,272 1,064 1,063 1,021 947 962 1,038
1 Adjusted Operating Costs are derived as the sum of mining costs, processing costs, mine overheads, by-product credit and royalty & selling costs 2 AISC is derived as the sum of Adjusted Operating Costs, UG & OP development costs and other costs (stay in business (“SIB”) capital expenditure, corporate overheads and sustaining exploration) 3 Figures may not total exactly due to rounding.
Forecasted capital expenditure is summarised below:
Capital Expenditure (US$m) H2 2021 2022 2023 2024 2025 H1 2026 Total
UG Capital Development 4.3 11.4 10.5 9.1 2.8 - 38.0
Open Pit Mines Development 1.0 1.1 0.2 1.8 4.7 - 8.7
TSF 2 expansion/ Power upgrades 2.5 - 4.1 - - - 6.6
Stay in business/ Other 1.9 1.4 0.6 1.9 - - 5.8
Total1,2 9.6 13.8 15.4 12.8 7.5 - 59.1
1Capital expenditure forecasts exclude costs associated with mine closure. 2 Figures may not total exactly due to rounding.
Singida – Production Schedule Project Economics for Singida were announced on 7th October 2020. The construction schedule for the project remains on track and first gold pour is anticipated towards the end of 2022. Highlights from the Project Economics announced previously include the following, which have been incorporated in the Plan:
• Average annual gold production of 32,000 oz for an initial seven-year mine life through to at least 2029;
• Total capital investment of US$26 m over a 24-month construction period, excluding
pre-stripping, with first pour scheduled for late 2022;
• Investment funded from internally generated cash flows;
• All gold resources sit within existing mining licences;
• 91% of contained ounces in the Plan are within 120 metres of surface; and,
• Significant further upside potential from substantial resources (9.8 Mt grading 2.11 g/t for 664,000 oz) currently sitting outside the reserve-based Plan.
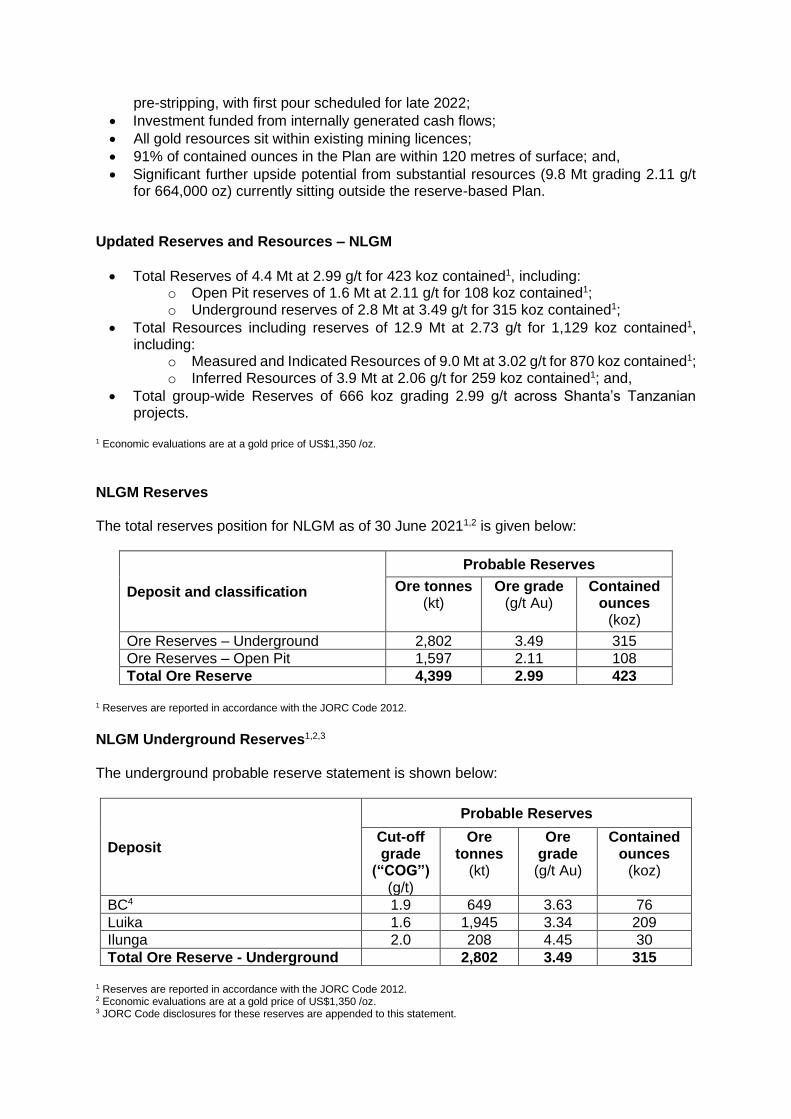
Updated Reserves and Resources – NLGM
• Total Reserves of 4.4 Mt at 2.99 g/t for 423 koz contained1, including: o Open Pit reserves of 1.6 Mt at 2.11 g/t for 108 koz contained1; o Underground reserves of 2.8 Mt at 3.49 g/t for 315 koz contained1;
• Total Resources including reserves of 12.9 Mt at 2.73 g/t for 1,129 koz contained1, including:
o Measured and Indicated Resources of 9.0 Mt at 3.02 g/t for 870 koz contained1; o Inferred Resources of 3.9 Mt at 2.06 g/t for 259 koz contained1; and,
• Total group-wide Reserves of 666 koz grading 2.99 g/t across Shanta’s Tanzanian projects.
1 Economic evaluations are at a gold price of US$1,350 /oz.
NLGM Reserves The total reserves position for NLGM as of 30 June 20211,2 is given below:
Deposit and classification
Probable Reserves
Ore tonnes (kt)
Ore grade (g/t Au)
Contained ounces
(koz)
Ore Reserves – Underground 2,802 3.49 315
Ore Reserves – Open Pit 1,597 2.11 108
Total Ore Reserve 4,399 2.99 423
1 Reserves are reported in accordance with the JORC Code 2012.
NLGM Underground Reserves1,2,3 The underground probable reserve statement is shown below:
Deposit
Probable Reserves
Cut-off grade
(“COG”) (g/t)
Ore tonnes
(kt)
Ore grade (g/t Au)
Contained ounces
(koz)
BC4 1.9 649 3.63 76
Luika 1.6 1,945 3.34 209
Ilunga 2.0 208 4.45 30
Total Ore Reserve - Underground 2,802 3.49 315
1 Reserves are reported in accordance with the JORC Code 2012. 2 Economic evaluations are at a gold price of US$1,350 /oz. 3 JORC Code disclosures for these reserves are appended to this statement.

4 Inclusive of BC and BC North
NLGM Open Pit Ore Reserves1,2,3,4 The open pit probable reserve statement is shown below:
Deposit
Probable Reserves
COG (g/t)
Ore tonnes
(kt)
Ore grade (g/t Au)
Contained ounces
(koz)
Black Tree Hill 0.6 580 2.12 40
Elizabeth Hill 0.6 844 2.15 58
Shamba 0.7 101 1.85 6
BC North 0.6 73 1.96 5
Total Ore Reserve - Open Pit 1,597 2.11 108
1 Reserves are reported in accordance with the JORC Code 2012. 2 Economic evaluations are at a gold price of US$1,350 /oz. 3 JORC Code disclosures for these reserves are appended to this statement. 4 Figures may not total exactly due to rounding.

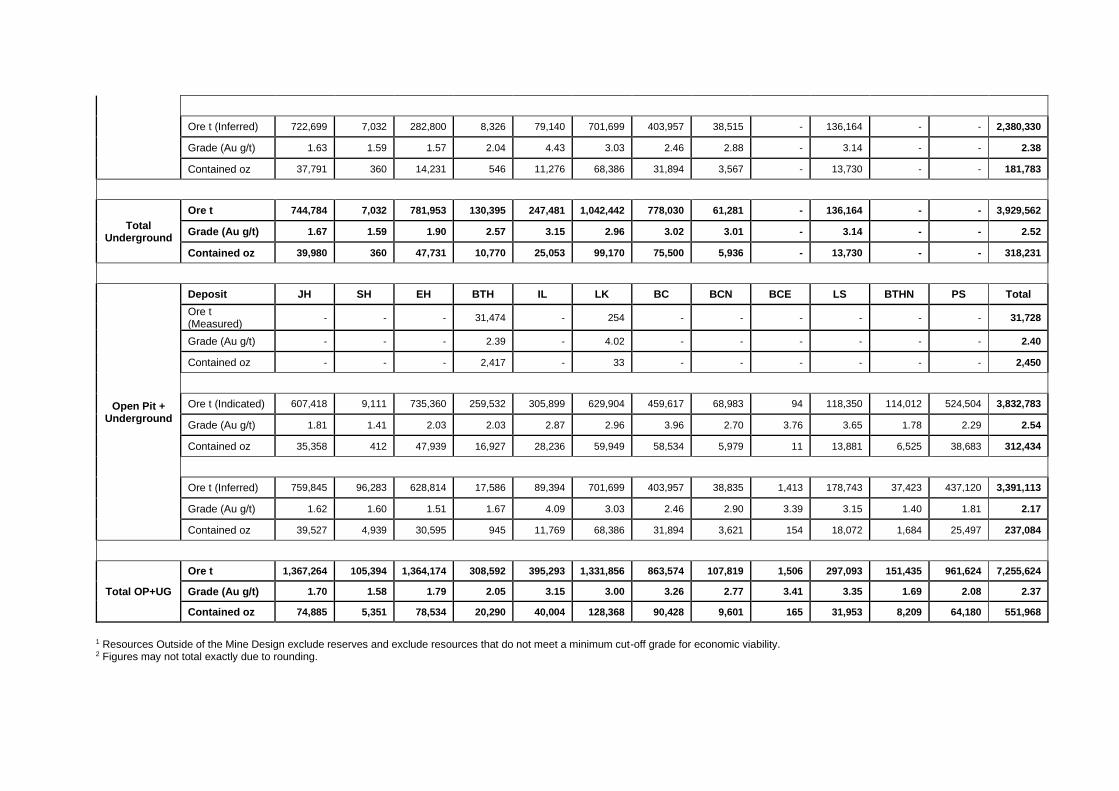
NLGM Deposits - Resources Outside Mine Design1,2 as of 30 June 2021 (1.0 Au g/t COG OP, 1.0 Au g/t COG UG)
Resources are reported in accordance with the JORC Code 2012.
Open Pit
Deposit JH SH EH BTH IL LK BC BCN BCE LS BTHN PS Total
Ore t (Measured)
- - - 12,213 - 162 - - - - - - 12,375
Grade (Au g/t) - - - 1.98 - 2.75 - - - - - - 1.99
Contained oz - - - 776 - 14 - - - - - - 791
Ore t (Indicated) 585,333 9,111 236,207 156,723 137,557 289,252 85,544 46,218 94 118,350 114,012 524,504 2,302,904
Grade (Au g/t) 1.76 1.41 1.90 1.66 3.27 3.14 5.43 2.43 3.76 3.65 1.78 2.29 2.40
Contained oz 33,169 412 14,440 8,345 14,459 29,184 14,928 3,610 11 13,881 6,525 38,683 177,646
Ore t (Inferred) 37,147 89,251 346,014 9,261 10,255 - - 320 1,413 42,579 37,423 437,120 1,010,783
Grade (Au g/t) 1.45 1.60 1.47 1.34 1.49 - - 5.28 3.39 3.17 1.40 1.81 1.70
Contained oz 1,736 4,578 16,363 399 493 - - 54 154 4,342 1,684 25,497 55,301
Total Open Pit
Ore t 622,480 98,362 582,221 178,197 147,812 289,414 85,544 46,538 1,506 160,929 151,435 961,624 3,326,062
Grade (Au g/t) 1.74 1.58 1.65 1.66 3.15 3.14 5.43 2.45 3.41 3.52 1.69 2.08 2.19
Contained oz 34,905 4,990 30,803 9,520 14,951 29,198 14,928 3,665 165 18,223 8,209 64,180 233,737
Underground
Deposit JH SH EH BTH IL LK BC BCN BCE LS BTHN PS Total
Ore t (Measured)
- - - 19,261 - 91 - - - - - - 19,353
Grade (Au g/t) - - - 2.65 - 6.27 - - - - - - 2.67
Contained oz - - - 1,641 - 18 - - - - - - 1,660
Ore t (Indicated) 22,086 - 499,153 102,809 168,341 340,652 374,073 22,766 - - - - 1,529,879
Grade (Au g/t) 3.08 - 2.09 2.60 2.55 2.81 3.63 3.24 - - - - 2.74
Contained oz 2,189 - 33,500 8,582 13,777 30,765 43,606 2,369 - - - - 134,788
Ore t (Inferred) 722,699 7,032 282,800 8,326 79,140 701,699 403,957 38,515 - 136,164 - - 2,380,330
Grade (Au g/t) 1.63 1.59 1.57 2.04 4.43 3.03 2.46 2.88 - 3.14 - - 2.38
Contained oz 37,791 360 14,231 546 11,276 68,386 31,894 3,567 - 13,730 - - 181,783
Total Underground
Ore t 744,784 7,032 781,953 130,395 247,481 1,042,442 778,030 61,281 - 136,164 - - 3,929,562
Grade (Au g/t) 1.67 1.59 1.90 2.57 3.15 2.96 3.02 3.01 - 3.14 - - 2.52
Contained oz 39,980 360 47,731 10,770 25,053 99,170 75,500 5,936 - 13,730 - - 318,231
Open Pit + Underground
Deposit JH SH EH BTH IL LK BC BCN BCE LS BTHN PS Total
Ore t (Measured)
- - - 31,474 - 254 - - - - - - 31,728
Grade (Au g/t) - - - 2.39 - 4.02 - - - - - - 2.40
Contained oz - - - 2,417 - 33 - - - - - - 2,450
Ore t (Indicated) 607,418 9,111 735,360 259,532 305,899 629,904 459,617 68,983 94 118,350 114,012 524,504 3,832,783
Grade (Au g/t) 1.81 1.41 2.03 2.03 2.87 2.96 3.96 2.70 3.76 3.65 1.78 2.29 2.54
Contained oz 35,358 412 47,939 16,927 28,236 59,949 58,534 5,979 11 13,881 6,525 38,683 312,434
Ore t (Inferred) 759,845 96,283 628,814 17,586 89,394 701,699 403,957 38,835 1,413 178,743 37,423 437,120 3,391,113
Grade (Au g/t) 1.62 1.60 1.51 1.67 4.09 3.03 2.46 2.90 3.39 3.15 1.40 1.81 2.17
Contained oz 39,527 4,939 30,595 945 11,769 68,386 31,894 3,621 154 18,072 1,684 25,497 237,084
Total OP+UG
Ore t 1,367,264 105,394 1,364,174 308,592 395,293 1,331,856 863,574 107,819 1,506 297,093 151,435 961,624 7,255,624
Grade (Au g/t) 1.70 1.58 1.79 2.05 3.15 3.00 3.26 2.77 3.41 3.35 1.69 2.08 2.37
Contained oz 74,885 5,351 78,534 20,290 40,004 128,368 90,428 9,601 165 31,953 8,209 64,180 551,968
1 Resources Outside of the Mine Design exclude reserves and exclude resources that do not meet a minimum cut-off grade for economic viability. 2 Figures may not total exactly due to rounding.

Deposit glossary: JH – Jamhuri SH - Shamba EH – Elizabeth Hill BTH – Black Tree Hill IL - Ilunga LK - Luika BC – Bauhinia Creek BCN - Bauhinia Creek North BCE - Bauhinia Creek East LS – Luika South BTHN – Black Tree Hill North PS – Porcupine South
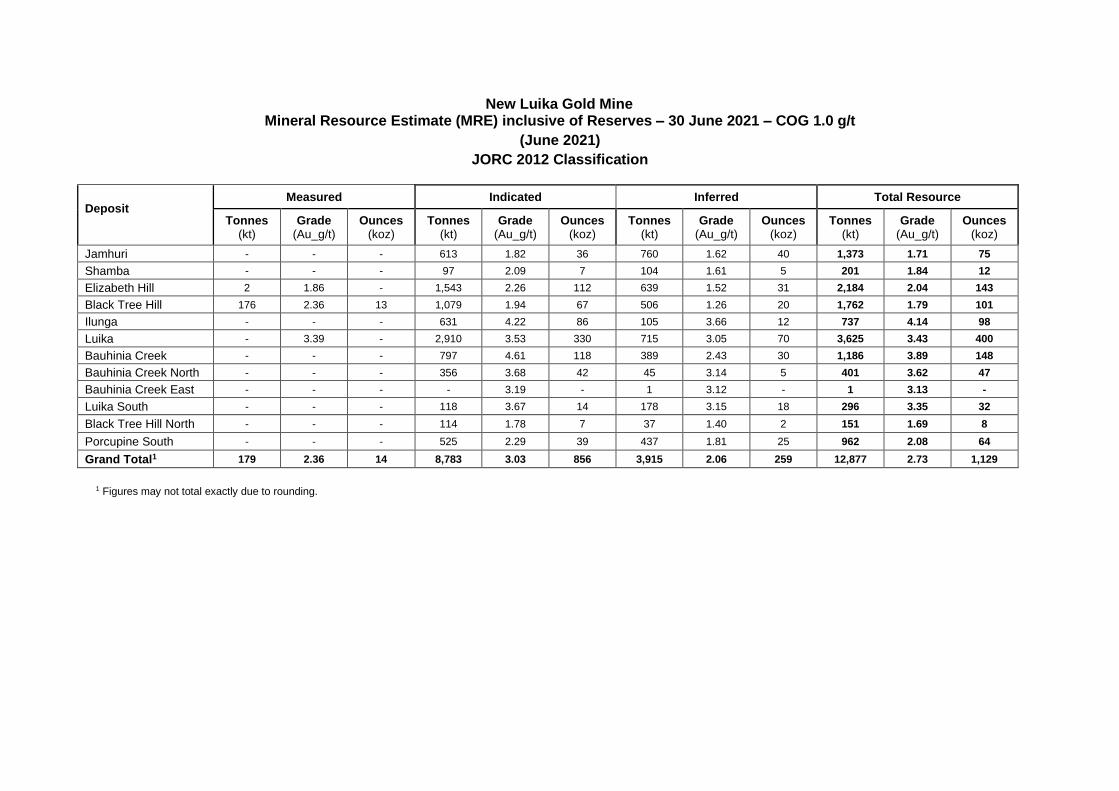
New Luika Gold Mine Mineral Resource Estimate (MRE) inclusive of Reserves – 30 June 2021 – COG 1.0 g/t
(June 2021)
JORC 2012 Classification
Deposit
Measured Indicated Inferred Total Resource
Tonnes (kt)
Grade (Au_g/t)
Ounces (koz)
Tonnes (kt)
Grade (Au_g/t)
Ounces (koz)
Tonnes (kt)
Grade (Au_g/t)
Ounces (koz)
Tonnes (kt)
Grade (Au_g/t)
Ounces (koz)
Jamhuri - - - 613 1.82 36 760 1.62 40 1,373 1.71 75
Shamba - - - 97 2.09 7 104 1.61 5 201 1.84 12
Elizabeth Hill 2 1.86 - 1,543 2.26 112 639 1.52 31 2,184 2.04 143
Black Tree Hill 176 2.36 13 1,079 1.94 67 506 1.26 20 1,762 1.79 101
Ilunga - - - 631 4.22 86 105 3.66 12 737 4.14 98
Luika - 3.39 - 2,910 3.53 330 715 3.05 70 3,625 3.43 400
Bauhinia Creek - - - 797 4.61 118 389 2.43 30 1,186 3.89 148
Bauhinia Creek North - - - 356 3.68 42 45 3.14 5 401 3.62 47
Bauhinia Creek East - - - - 3.19 - 1 3.12 - 1 3.13 -
Luika South - - - 118 3.67 14 178 3.15 18 296 3.35 32
Black Tree Hill North - - - 114 1.78 7 37 1.40 2 151 1.69 8
Porcupine South - - - 525 2.29 39 437 1.81 25 962 2.08 64
Grand Total1 179 2.36 14 8,783 3.03 856 3,915 2.06 259 12,877 2.73 1,129
1 Figures may not total exactly due to rounding.
Glossary
Glossary of Technical Terms
"Au" chemical symbol for gold
"cut off grade" (COG)
the lowest grade value that is included in a resource statement. It must comply with JORC requirement 19: "reasonable prospects for eventual economic extraction" the lowest grade, or quality, of mineralised material that qualifies as economically mineable and available in a given deposit. It may be defined on the basis of economic evaluation, or on physical or chemical attributes that define an acceptable product specification
"g/t" grammes per tonne, equivalent to parts per million
"Inferred Resource"
that part of a Mineral Resource for which tonnage, grade and mineral content can be estimated with a low level of confidence. It is inferred from geological evidence and assumed but not verified geological and/or grade continuity. It is based on information gathered through appropriate techniques from locations such as outcrops, trenches, pits, workings and drill holes which may be limited or of uncertain quality and reliability
"Indicated Resource"
that part of a Mineral Resource for which tonnage, densities, shape, physical characteristics, grade and mineral content can be estimated with a reasonable level of confidence. It is based on exploration, sampling and testing information gathered through appropriate techniques from locations such as outcrops, trenches, pits, workings and drill holes. The locations are too widely or inappropriately spaced to confirm geological and/or grade continuity but are spaced closely enough for continuity to be assumed
"JORC" The Australasian Joint Ore Reserves Committee Code for Reporting of Exploration Results, Mineral Resources and Ore Reserves 2012 (the "JORC Code" or "the Code"). The Code sets out minimum standards, recommendations and guidelines for Public Reporting in Australasia of Exploration Results, Mineral Resources and Ore Reserves
"koz" thousand troy ounces of gold
"Measured Resource"
that part of a Mineral Resource for which tonnage, densities, shape, physical characteristics, grade and mineral content can be estimated with a high level of confidence. It is based on detailed and reliable exploration, sampling and testing information gathered through appropriate techniques from locations such as outcrops, trenches,

pits, workings and drill holes. The locations are spaced closely enough to confirm geological and grade continuity
"Mineral Resource"
a concentration or occurrence of material of intrinsic economic interest in or on the Earth's crust in such form, quality and quantity that there are reasonable prospects for eventual economic extraction. The location, quantity, grade, geological characteristics and continuity of a Mineral Resource are known, estimated or interpreted from specific geological evidence and knowledge. Mineral Resources are sub-divided, in order of increasing geological confidence, into Inferred, Indicated and Measured categories when reporting under JORC
"Mt" million tonnes
"oz" troy ounce (= 31.103477 grammes)
"Reserve" the economically mineable part of a Measured and/or Indicated Mineral Resource
"t" tonne (= 1 million grammes)

APPENDIX 1: SAMPLING TECHNIQUES AND DATA Criteria JORC Code explanation Commentary
Sampling techniques • Nature and quality of sampling (eg cut channels, random chips, or specific specialised industry standard measurement tools appropriate to the minerals under investigation, such as down hole gamma sondes, or handheld XRF instruments, etc). These examples should not be taken as limiting the broad meaning of sampling.
• Include reference to measures taken to ensure sample representivity and the appropriate calibration of any measurement tools or systems used.
• Aspects of the determination of mineralisation that are Material to the Public Report.
• In cases where ‘industry standard’ work has been done this would be relatively simple (eg ‘reverse circulation drilling was used to obtain 1 m samples from which 3 kg was pulverised to produce a 30 g charge for fire assay’). In other cases more explanation may be required, such as where there is coarse gold that has inherent sampling problems. Unusual commodities or mineralisation types (eg submarine nodules) may warrant disclosure of detailed information.
• Diamond drilling 1m samples
• Reverse circulation (RC) drilling was used to obtain 1 m samples from which 3 kg of material was sent for analysis
• Drilling sampled on a maximum of 1 m downhole
• Samples were not composited
• Samples were submitted to the SGS Laboratory in Mwanza for analysis
• At least 3kg sample pulverized and a 50g charge fire assayed with AAS or aqua regia finish for gold
Drilling techniques • Drill type (eg core, reverse circulation, open-hole hammer, rotary air blast, auger, Bangka, sonic, etc) and details (eg core diameter, triple or standard tube, depth of diamond tails, face-sampling bit or other type, whether core is oriented and if so, by what method, etc).
• Diamond core drilling; NQ core size
• RC Drilling
Drill sample recovery • Method of recording and assessing core and chip sample recoveries and results assessed.
• Measures taken to maximise sample recovery and ensure representative nature of the samples.
• Whether a relationship exists between sample recovery and grade and whether sample bias may have occurred due to preferential loss/gain of fine/coarse material.
• Core sample recoveries routinely measured and recorded in spreadsheet database
• Samples split half core perpendicular to strike of mineralized zones
• RC samples recovered from on-site cyclone
Logging • Whether core and chip samples have been geologically and geotechnically logged to a level of detail to support appropriate Mineral Resource estimation, mining studies and metallurgical studies.
• Whether logging is qualitative or quantitative in nature. Core (or costean, channel, etc) photography.
• The total length and percentage of the relevant intersections logged.
• Logging of geology, alteration and geotechnical aspects recorded in drill logs for diamond core drilling
• Logging is qualitative; All drill core is photographed
• Entire intervals that were drilled and/or trenched were logged
Sub-sampling techniques and sample preparation • If core, whether cut or sawn and whether quarter, half or all core taken.
• If non-core, whether riffled, tube sampled, rotary split, etc and
• Half core taken; Sawn
• RC samples riffled and sub-sample; Submitted for analysis
• For trench samples, the entire sample for the respective interval

Criteria JORC Code explanation Commentary
whether sampled wet or dry.
• For all sample types, the nature, quality and appropriateness of the sample preparation technique.
• Quality control procedures adopted for all sub-sampling stages to maximise representivity of samples.
• Measures taken to ensure that the sampling is representative of the in situ material collected, including for instance results for field duplicate/second-half sampling.
• Whether sample sizes are appropriate to the grain size of the material being sampled.
aggregated, not riffled or split
• Aggregated half core; Entire 3kg sample pulverized at laboratory prior to fire assay in order to minimize bias
• Drilling and channels planned orthogonal to the strike of structures/lithologies in order to maximize representivity
• Field duplicates sampled at appropriate intervals
Quality of assay data and laboratory tests • The nature, quality and appropriateness of the assaying and laboratory procedures used and whether the technique is considered partial or total.
• For geophysical tools, spectrometers, handheld XRF instruments, etc, the parameters used in determining the analysis including instrument make and model, reading times, calibrations factors applied and their derivation, etc.
• Nature of quality control procedures adopted (eg standards, blanks, duplicates, external laboratory checks) and whether acceptable levels of accuracy (ie lack of bias) and precision have been established.
• Fire assay is appropriate for the nature of gold mineralization being assayed
• No geophysical tools used to generate exploration results
• Registered reference material inserted at the interval of 20 samples
• Levels of accuracy and precision (detection limit) for gold is 0.01 ppm which is suitable for the level of assays reported
Verification of sampling and assaying • The verification of significant intersections by either independent or alternative company personnel.
• The use of twinned holes.
• Documentation of primary data, data entry procedures, data verification, data storage (physical and electronic) protocols.
• Discuss any adjustment to assay data.
• No twinning of drillholes
• Primary data was logged onto paper and later transferred into database, verified by a Senior Geologist and stored in electronic database that is regularly backed up
• Database is verified and compared with standard assays stored using established company protocols
• No adjustments have been made to assay data
Location of data points • Accuracy and quality of surveys used to locate drill holes (collar and down-hole surveys), trenches, mine workings and other locations used in Mineral Resource estimation.
• Specification of the grid system used.
• Quality and adequacy of topographic control.
• Drillholes and trenches were accurately surveyed using Trimble DGPS survey equipment
• Drillholes and trenches surveyed in UTM Coordinates System Arc 1960
• Topographical surveys were done using Aerial Lidar Survey
Data spacing and distribution • Data spacing for reporting of Exploration Results.
• Whether the data spacing and distribution is sufficient to establish the degree of geological and grade continuity appropriate for the Mineral Resource and Ore Reserve estimation procedure(s) and classifications applied.
• Whether sample compositing has been applied.
• Drillhole spacing was generally at 50m along strike of the targets with a vertical spacing of approximately 40 to 50m
Orientation of data in relation to geological structure • Whether the orientation of sampling achieves unbiased sampling of possible structures and the extent to which this is known,
• Drilling and trenching planned perpendicular to the interpreted strike of lithological units and geological structures

Criteria JORC Code explanation Commentary
considering the deposit type.
• If the relationship between the drilling orientation and the orientation of key mineralised structures is considered to have introduced a sampling bias, this should be assessed and reported if material.
Sample security • The measures taken to ensure sample security. • Samples secured by senior personnel on site and transported directly by company vehicle to the laboratories (Quality Labs in NLGM and SGS in Mwanza)
Audits or reviews • The results of any audits or reviews of sampling techniques and data.
• Internal reviews are regularly completed but no external audits were carried out for the currently reported results
APPENDIX 2: REPORTING OF EXPLORATION RESULTS Criteria JORC Code explanation Commentary
Mineral tenement and land tenure status • Type, reference name/number, location and ownership including agreements or material issues with third parties such as joint ventures, partnerships, overriding royalties, native title interests, historical sites, wilderness or national park and environmental settings.
• The security of the tenure held at the time of reporting along with any known impediments to obtaining a licence to operate in the area.
• ML 408/2010 valid until 20 Sep 2030
• ML 518/2014 valid until 30 Jan 2024
• ML 519/2014 valid until 30 Jan 2024
• ML 456/2012 valid until 19 Jan 2022
• ML 455/2012 valid until 19 Jan 2022
• ML 457/2012 valid until 19 Jan 2022
Exploration done by other parties • Acknowledgment and appraisal of exploration by other parties. • Historical colonial exploration and mining works
Geology • Deposit type, geological setting and style of mineralisation. • Underlain by a complex association of high grade metamorphic- and intrusive lithologies, commonly intruded by dykes of variable composition. Modally, granodioritic and granitic lithologies are most commonly encountered.
• These granodiorites and granites have been interpreted as late-orogenic intrusive phases associated with gold mineralisation in the area. Subordinate diorite, porphyroblastic hornblende gabbro, quartzo-feldspathic felsite and migmatite are also regularly observed.
• Dyke intrusives include dolerite, pegmatite and common aplite and alaskite, seemingly randomly crosscutting major lithologies, and therefore regarded as younger than the country rock.
Drill hole Information • A summary of all information material to the understanding of the exploration results including a tabulation of the following information for all Material drill holes:
• Relevant tables included summarizing drill holes and trenches locations, RL, azimuth, length/depth, and significant intersection intervals

Criteria JORC Code explanation Commentary
o easting and northing of the drill hole collar o elevation or RL (Reduced Level – elevation above sea level in
metres) of the drill hole collar o dip and azimuth of the hole o down hole length and interception depth o hole length.
• If the exclusion of this information is justified on the basis that the information is not Material and this exclusion does not detract from the understanding of the report, the Competent Person should clearly explain why this is the case.
Data aggregation methods • In reporting Exploration Results, weighting averaging techniques, maximum and/or minimum grade truncations (eg cutting of high grades) and cut-off grades are usually Material and should be stated.
• Where aggregate intercepts incorporate short lengths of high grade results and longer lengths of low grade results, the procedure used for such aggregation should be stated and some typical examples of such aggregations should be shown in detail.
• The assumptions used for any reporting of metal equivalent values should be clearly stated.
• Exploration results from drilling and trench sampling have been weighted by interval
• High-grade caps have been applied
• Lower cut-off grade of 0.5 g/t Au has generally been applied to significant intersections
• Aggregate drilling and trenching intervals do not incorporate longer lengths of low-grade results
• No metal equivalent reported
Relationship between mineralisation widths and intercept lengths • These relationships are particularly important in the reporting of Exploration Results.
• If the geometry of the mineralisation with respect to the drill hole angle is known, its nature should be reported.
• If it is not known and only the down hole lengths are reported, there should be a clear statement to this effect (eg ‘down hole length, true width not known’).
• Drill holes and trenches have been drilled/excavated as perpendicular as possible to the general strike of the mineralized zones and structures so that the intersected lengths are close to true widths
Diagrams • Appropriate maps and sections (with scales) and tabulations of intercepts should be included for any significant discovery being reported These should include, but not be limited to a plan view of drill hole collar locations and appropriate sectional views.
• Maps and sections are being generated
Balanced reporting • Where comprehensive reporting of all Exploration Results is not practicable, representative reporting of both low and high grades and/or widths should be practiced to avoid misleading reporting of Exploration Results.
• All significant drilling and trench results have been reported
Other substantive exploration data • Other exploration data, if meaningful and material, should be reported including (but not limited to): geological observations; geophysical survey results; geochemical survey results; bulk samples – size and method of treatment; metallurgical test results; bulk density, groundwater, geotechnical and rock characteristics; potential deleterious or contaminating substances.
• Metallurgical studies of the ore from potential five pits were conducted and completed by SGS in South Africa in 2009. The ore minerology variability is insignificant but relatively coarse gold grain was observed
• The relatively coarse nature of much of the gold provides reason for an upfront gravity circuit to recover coarse gold prior to cyanidation. An overall gold recovery of 90% can be achieved through gold dissolution by direct cyanidation and the gravity

Criteria JORC Code explanation Commentary
concentrator.
Further work • The nature and scale of planned further work (eg tests for lateral extensions or depth extensions or large-scale step-out drilling).
• Diagrams clearly highlighting the areas of possible extensions, including the main geological interpretations and future drilling areas, provided this information is not commercially sensitive.
• Drilling to be continued to test along strike and the down-dip continuity of the delineated mineralization
APPENDIX 3: ESTIMATION AND REPORTING OF MINERAL RESOURCES Criteria JORC Code explanation Commentary
Database integrity • Measures taken to ensure that data has not been corrupted by, for example, transcription or keying errors, between its initial collection and its use for Mineral Resource estimation purposes.
• Data validation procedures used.
• The data capturing Access database is linked to a superseding Access database on the geological server
• Queries allow specially selected information from the captured data and create core data sheets which include Collar, Survey, Lithology and Assay logs. These Logs are finally displayed in the mining software
• An independent validation process is run for each log sheet in Micromine by Shanta. Should there be any queries, a report file is created and exported to excel. The report will be mailed to the personnel responsible for data capturing to correct on the original data
• Once confirmation is given of the updates, all databases are refreshed and the validation process in Micromine repeated with the use of form sets
• Once all data validates, a number for the tear of validation is indicated in the collar file of the superseding database
Site visits • Comment on any site visits undertaken by the Competent Person and the outcome of those visits.
• If no site visits have been undertaken indicate why this is the case.
• Dr Corné Koegelenberg, assisted by Mr Jonathan Gloyn-Jones, visited the property from the 14 – 20th of February 2020 to conduct a drill core investigation of macrostructural and gold mineralization features. Mr Ken Lomberg joined the site visit from the 19 – 20th of February 2020
Geological interpretation • Confidence in (or conversely, the uncertainty of ) the geological interpretation of the mineral deposit.
• Nature of the data used and of any assumptions made.
• The effect, if any, of alternative interpretations on Mineral Resource estimation.
• The use of geology in guiding and controlling Mineral Resource estimation.
• The factors affecting continuity both of grade and geology.
• Diamond drilling was done perpendicular to the strike of the ore body at a dip designed to give a true intersection width of the mineralized body at a spacing less than 42m
• The downhole survey was done at every 15m
• Core meter marking, geological logging, structural interpretation, core sampling, Data validation and QAQC analysis was done by competent and experienced geologists
• Only samples submitted to the accredited laboratory (SGS Mwanza)

Criteria JORC Code explanation Commentary
are used in the estimate
• The limits of the structural features hosting the mineralized zone was interpreted by overlaying the assays against geological logging section by section using section strings
Dimensions • The extent and variability of the Mineral Resource expressed as length (along strike or otherwise), plan width, and depth below surface to the upper and lower limits of the Mineral Resource.
• Drill hole spacing is generally between 25 to 42m along with a vertical spacing of approximately 20 to 38m in the upper to mid-level portions of the mineralized zones. This drilling spacing combined with the surface exposures and trench sampling, along with the geophysical data, permits the assumption that both the mineralized structures are continuous and persistent, and the mineralization within the structures has the continuity necessary to consider these deposits as Mineral Resources
Estimation and modelling techniques • The nature and appropriateness of the estimation technique(s) applied and key assumptions, including treatment of extreme grade values, domaining, interpolation parameters and maximum distance of extrapolation from data points. If a computer assisted estimation method was chosen include a description of computer software and parameters used.
• The availability of check estimates, previous estimates and/or mine production records and whether the Mineral Resource estimate takes appropriate account of such data.
• The assumptions made regarding recovery of by-products.
• Estimation of deleterious elements or other non-grade variables of economic significance (eg sulphur for acid mine drainage characterisation).
• In the case of block model interpolation, the block size in relation to the average sample spacing and the search employed.
• Any assumptions behind modelling of selective mining units.
• Any assumptions about correlation between variables.
• Description of how the geological interpretation was used to control the resource estimates.
• Discussion of basis for using or not using grade cutting or capping.
• The process of validation, the checking process used, the comparison of model data to drill hole data, and use of reconciliation data if available.
• Compositing data into regular composite intervals was performed to moderate the presence of extreme short sample interval grade values in the data, by combining them with adjacent data to form the composite
• A combination of several methods was used to decide what constitutes an appropriate capping value. The spatial position of outlier values, as well as coefficient of variation plots, lognormal probability plots and decile analysis, were used in the determination of capping values
• Scatter plots of the gold grade composites versus location were generated, to assess any potential non-stationarity in the data
• Block models were created to represent the mineralized body contained within the wireframe solids for each target. Cell sizes were chosen based on the average drillhole spacing
• Geostatistics was performed using Micromine software to determine the estimation parameters
• The mineralized targets were modelled for gold grade using Ordinary Kriging, with the shell of the wireframe solid as a hard boundary. Only data within the solid was used in the estimate
• The Estimation process used Micromine software for all block grade estimates
Moisture • Whether the tonnages are estimated on a dry basis or with natural moisture, and the method of determination of the moisture content.
• Tonnages are reported on a dry basis
Cut-off parameters • The basis of the adopted cut-off grade(s) or quality parameters applied.
• A simple financial assessment was undertaken to ascertain whether they fulfil the criteria of “reasonable prospects for eventual economic extraction” using current operating costs
Mining factors or assumptions • Assumptions made regarding possible mining methods, minimum mining dimensions and internal (or, if applicable, external) mining dilution. It is always necessary as part of the process of determining
• The mineral resource was deemed amenable to extraction by open pit mining method and were declared at a cut-off of 1.0g/t
Criteria JORC Code explanation Commentary
reasonable prospects for eventual economic extraction to consider potential mining methods, but the assumptions made regarding mining methods and parameters when estimating Mineral Resources may not always be rigorous. Where this is the case, this should be reported with an explanation of the basis of the mining assumptions made.
Metallurgical factors or assumptions • The basis for assumptions or predictions regarding metallurgical amenability. It is always necessary as part of the process of determining reasonable prospects for eventual economic extraction to consider potential metallurgical methods, but the assumptions regarding metallurgical treatment processes and parameters made when reporting Mineral Resources may not always be rigorous. Where this is the case, this should be reported with an explanation of the basis of the metallurgical assumptions made.
• Shanta commissioned the first of a series of gold deportment and metallurgical studies on mineralized material from potential pits in 2009. Reverse circulation drill chips from five mineralised targets were submitted for gold deportment studies in order to understand the mode of gold occurrence, and to ascertain possible cost effective and practical process routes.
• Further metallurgical studies commissioned on mineralized material from the Gold Tree (Tree Top and Tree Bottom) deposit in 2011 support initial gold deportment findings. A report from Mintek summarized that the ore contains coarse gold which should be recovered prior to the leaching process with an overall gold recovery 90% - Mintek External Report No: 5887 of February 2011).
Environmental factors or assumptions • Assumptions made regarding possible waste and process residue disposal options. It is always necessary as part of the process of determining reasonable prospects for eventual economic extraction to consider the potential environmental impacts of the mining and processing operation. While at this stage the determination of potential environmental impacts, particularly for a greenfields project, may not always be well advanced, the status of early consideration of these potential environmental impacts should be reported. Where these aspects have not been considered this should be reported with an explanation of the environmental assumptions made.
• Shanta Mining Company Limited is fully permitted mining operation under Tanzanian law with the prerequisite Environmental Impact Assessments (EIA) issued in 2019.
Bulk density • Whether assumed or determined. If assumed, the basis for the assumptions. If determined, the method used, whether wet or dry, the frequency of the measurements, the nature, size and representativeness of the samples.
• The bulk density for bulk material must have been measured by methods that adequately account for void spaces (vugs, porosity, etc), moisture and differences between rock and alteration zones within the deposit.
• Discuss assumptions for bulk density estimates used in the evaluation process of the different materials.
• Density determinations have been carried out on the diamond cores.
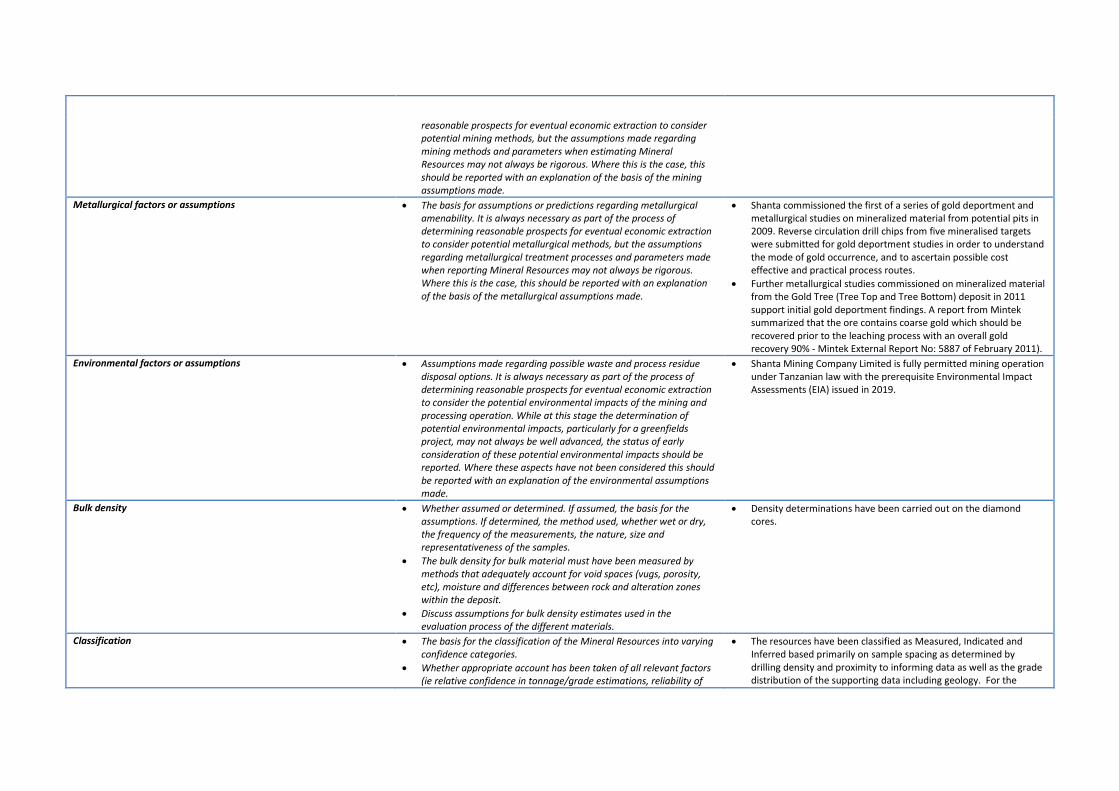
Classification • The basis for the classification of the Mineral Resources into varying confidence categories.
• Whether appropriate account has been taken of all relevant factors (ie relative confidence in tonnage/grade estimations, reliability of
• The resources have been classified as Measured, Indicated and Inferred based primarily on sample spacing as determined by drilling density and proximity to informing data as well as the grade distribution of the supporting data including geology. For the

Criteria JORC Code explanation Commentary
input data, confidence in continuity of geology and metal values, quality, quantity and distribution of the data).
• Whether the result appropriately reflects the Competent Person’s view of the deposit.
resource classification, a solid shape was constructed around the parts of the mineralised body where most estimates were informed by data not more than 30m from the estimated block, are estimated within the primary search volume, and where the estimates have been interpolated rather than extrapolated. All blocks located within these areas were classified as Measured and Indicated resources. All blocks located outside of these areas, around the periphery of the drilling were classified as Inferred resources
Audits or reviews • The results of any audits or reviews of Mineral Resource estimates. • Only internal audit completed
Discussion of relative accuracy/ confidence • Where appropriate a statement of the relative accuracy and confidence level in the Mineral Resource estimate using an approach or procedure deemed appropriate by the Competent Person. For example, the application of statistical or geostatistical procedures to quantify the relative accuracy of the resource within stated confidence limits, or, if such an approach is not deemed appropriate, a qualitative discussion of the factors that could affect the relative accuracy and confidence of the estimate.
• The statement should specify whether it relates to global or local estimates, and, if local, state the relevant tonnages, which should be relevant to technical and economic evaluation. Documentation should include assumptions made and the procedures used.
• These statements of relative accuracy and confidence of the estimate should be compared with production data, where available.
• Refer Estimation and modelling techniques comments above
ENDS