176 EFFECTS OF VEHICLE AND ROUTE OF ADMINISTRATION OF LETROZOLE ON OVARIAN FUNCTION IN CATTLE
10
Effects of a non-steroidal aromatase inhibitor on ovarian function in cattle M. Jimena Yapura A , Reuben J. Mapletoft B , Jaswant Singh A , Roger Pierson C , Jonathan Naile D , John P. Giesy A,D , Hong Chang D , Eric Higley D , Markus Hecker D and Gregg P. Adams A,E A Department of Veterinary Biomedical Sciences, Western College of Veterinary Medicine, University of Saskatchewan, Saskatoon, Saskatchewan S7N 5B4, Canada. B Department of Large Animal Clinical Sciences, Western College of Veterinary Medicine, University of Saskatchewan, Saskatoon, Saskatchewan S7N 5B4, Canada. C Department of Obstetrics, Gynecology and Reproductive Sciences, College of Medicine, University of Saskatchewan, Saskatoon, Saskatchewan S7N 0W8, Canada. D Toxicology Centre, University of Saskatchewan, Saskatoon, Saskatchewan S7N 0W8, Canada. E Corresponding author. Email: [email protected] Abstract. Effects of the non-steroidal aromatase inhibitor letrozole on ovarian function in cattle were determined. The hypothesis that letrozole would arrest growth of the dominant follicle, resulting in emergence of a new follicular wave at a predictable post-treatment interval, was tested. Heifers were assigned randomly to four groups 4 days after follicular ablation (,2½ days after wave emergence) and given intravenous doses of 500 (n ¼ 9), 250 (n ¼ 10), or 125 mg kg 1 (n ¼ 10) letrozole or phosphate-buffered saline (controls; n ¼ 10). Blood was collected and ovarian structures were monitored daily by transrectal ultrasonography. Plasma concentrations of LH and FSH were measured by radioimmuno- assay; plasma concentrations of letrozole were determined by high-performance liquid chromatography tandem mass spectrometry. A single intravenous dose of letrozole did not induce regression of the dominant follicle present at the time of treatment, nor did it directly affect FSH release. Conversely, treatment with letrozole increased endogenous concentrations of LH and extended the lifespan of the dominant follicle, which delayed the next FSH surge and subsequent follicular wave emergence. Letrozole continues to have potential as a non-steroidal treatment for controlling ovarian function in cattle. Additional keywords: bovine reproduction, oestradiol, ovarian synchronisation. Received 20 September 2011, accepted 6 October 2011, published online 25 November 2011 Introduction Of the strategies used to control ovarian function in cattle, treatment with oestrogen in combination with progesterone has been effective for synchronising follicle wave emergence and ovulation (Bo et al. 1995a, 1995b). Steroid-induced wave syn- chronisation is brought about by regression of the dominant follicle, followed by resurgence in circulating FSH and subse- quent emergence of a new follicular wave consistently follow- ing treatment. The degree of synchrony achieved with protocols involving oestradiol (E2) and progesterone has permitted effective use of fixed-time AI in cattle (Bridges et al. 1999; Martinez et al. 2000; Colazo et al. 2004) and more efficient use of time and labour for multiple ovulation and embryo transfer, as well as conventional breeding management (Bo et al. 1995b; Mapletoft et al. 2003). The use of natural or synthetic oestrogens in food-producing animals has been the subject of considerable controversy (for a review, see Umberger 1975). Increasing concern regarding the toxicity of hormonal preparations used as growth promoters in cattle and the potential carcinogenic effects of steroid hormone residues in meat or milk has led to a prohibition of the use of E2 and other steroid hormones as growth promoters in animals designated for human consumption in all member states of the European Union as of 1 January 1989 (Andersson and Skakke- baek 1999; Fritsche and Steinhart 1999; Daxenberger et al. 2001; US Department of Agriculture, Foreign Agricultural Service 2003). Further, the use of E2 and its ester derivatives for purposes of reproductive management was prohibited in the European Union on 14 October 2006 (Official Journal of the European Union 2003). These actions in Europe led to the CSIRO PUBLISHING Reproduction, Fertility and Development, 2012, 24, 631–640 http://dx.doi.org/10.1071/RD11239 Journal compilation Ó CSIRO 2012 www.publish.csiro.au/journals/rfd
-
Upload
independent -
Category
Documents
-
view
0 -
download
0
Transcript of 176 EFFECTS OF VEHICLE AND ROUTE OF ADMINISTRATION OF LETROZOLE ON OVARIAN FUNCTION IN CATTLE

Effects of a non-steroidal aromatase inhibitor on ovarianfunction in cattle
M. Jimena YapuraA, Reuben J. MapletoftB, Jaswant SinghA, Roger PiersonC,
Jonathan NaileD, John P. Giesy A,D, Hong ChangD, Eric HigleyD,
Markus HeckerD and Gregg P. AdamsA,E
ADepartment of Veterinary Biomedical Sciences, Western College of Veterinary Medicine,
University of Saskatchewan, Saskatoon, Saskatchewan S7N 5B4, Canada.BDepartment of Large Animal Clinical Sciences, Western College of Veterinary Medicine,
University of Saskatchewan, Saskatoon, Saskatchewan S7N 5B4, Canada.CDepartment of Obstetrics, Gynecology and Reproductive Sciences, College of Medicine,
University of Saskatchewan, Saskatoon, Saskatchewan S7N 0W8, Canada.DToxicology Centre, University of Saskatchewan, Saskatoon, Saskatchewan S7N 0W8, Canada.ECorresponding author. Email: [email protected]
Abstract. Effects of the non-steroidal aromatase inhibitor letrozole on ovarian function in cattle were determined. Thehypothesis that letrozole would arrest growth of the dominant follicle, resulting in emergence of a new follicular wave at apredictable post-treatment interval, was tested. Heifers were assigned randomly to four groups 4 days after follicular
ablation (,2½ days after wave emergence) and given intravenous doses of 500 (n¼ 9), 250 (n¼ 10), or 125mg kg�1
(n¼ 10) letrozole or phosphate-buffered saline (controls; n¼ 10). Blood was collected and ovarian structures weremonitored daily by transrectal ultrasonography. Plasma concentrations of LH and FSH were measured by radioimmuno-assay; plasma concentrations of letrozole were determined by high-performance liquid chromatography tandem mass
spectrometry. A single intravenous dose of letrozole did not induce regression of the dominant follicle present at the timeof treatment, nor did it directly affect FSH release. Conversely, treatment with letrozole increased endogenousconcentrations of LH and extended the lifespan of the dominant follicle, which delayed the next FSH surge and
subsequent follicular wave emergence. Letrozole continues to have potential as a non-steroidal treatment for controllingovarian function in cattle.
Additional keywords: bovine reproduction, oestradiol, ovarian synchronisation.
Received 20 September 2011, accepted 6 October 2011, published online 25 November 2011
Introduction
Of the strategies used to control ovarian function in cattle,treatment with oestrogen in combination with progesterone hasbeen effective for synchronising follicle wave emergence and
ovulation (Bo et al. 1995a, 1995b). Steroid-induced wave syn-chronisation is brought about by regression of the dominantfollicle, followed by resurgence in circulating FSH and subse-
quent emergence of a new follicular wave consistently follow-ing treatment. The degree of synchrony achieved with protocolsinvolving oestradiol (E2) and progesterone has permitted
effective use of fixed-time AI in cattle (Bridges et al. 1999;Martinez et al. 2000; Colazo et al. 2004) and more efficient useof time and labour formultiple ovulation and embryo transfer, as
well as conventional breeding management (Bo et al. 1995b;Mapletoft et al. 2003).
The use of natural or synthetic oestrogens in food-producinganimals has been the subject of considerable controversy (for areview, see Umberger 1975). Increasing concern regarding thetoxicity of hormonal preparations used as growth promoters in
cattle and the potential carcinogenic effects of steroid hormoneresidues in meat or milk has led to a prohibition of the use of E2and other steroid hormones as growth promoters in animals
designated for human consumption in all member states of theEuropean Union as of 1 January 1989 (Andersson and Skakke-baek 1999; Fritsche and Steinhart 1999; Daxenberger et al.
2001; US Department of Agriculture, Foreign AgriculturalService 2003). Further, the use of E2 and its ester derivativesfor purposes of reproductive management was prohibited in the
European Union on 14 October 2006 (Official Journal ofthe European Union 2003). These actions in Europe led to the
CSIRO PUBLISHING
Reproduction, Fertility and Development, 2012, 24, 631–640
http://dx.doi.org/10.1071/RD11239
Journal compilation � CSIRO 2012 www.publish.csiro.au/journals/rfd

subsequent prohibition of the use of E2 esters in lactating dairyanimals in New Zealand and Australia in 2007 (Lane et al.
2008). Although the use of E2 and zeranol (an oestrogen-likecompound) as growth promoters is still permitted in the US (USFood and Drug Administration 2003) and Canada (Health
Canada Drugs and Health Products 2005), they cannot be usedfor synchronisation of oestrus, except by prescription andcustom compounding. However, veterinary compounding of
pharmaceuticals for food-producing animals has recently comeunder scrutiny in the US and is discouraged (US Food and DrugAdministration 2003; Gibbs 2004). This situation negativelyimpacts implementation of reproductive technologies in cattle
production systems, limiting potential reproductive efficiencyand genetic improvement provided by the use of AI and embryotransfer (Lane et al. 2008). Alternative methods for controlling
ovarian function in cattle that do not have harmful effects onhuman or animal health are needed.
Aromatase inhibitors prevent the body from producing its
own oestrogens. Therefore, we hypothesised that aromataseinhibitors may be an effective alternative to control ovarianfollicular development in cattle. Letrozole (4-[(4-cyanophenyl)-(1,2,4-triazol-1-yl)methyl]benzonitrile), a non-steroidal aroma-
tase inhibitor, inactivates the aromatase enzyme by reversiblybinding to the heme group of the P450 subunit of the aromataseenzyme. Letrozole is used as an adjuvant treatment for hormone-
responsive breast cancer in post-menopausal women (Cohenet al. 2002) and has been used as a fertility treatment for womenundergoing assisted reproduction because of its putative effect
on FSH secretion through removal of the negative feedback ofE2 (Requena et al. 2008). A 5-day regimen of letrozole (2.5mgday�1 from Days 3 to 7; Day 0¼ beginning of menses) has been
used for ovarian stimulation in women (Mitwally and Casper2002a) and larger or increasing doses of letrozole have beenused to induce ovarian superstimulation in women (Al-Fadhliet al. 2006; Mitwally et al. 2008).
Contrary to the proposed hypothesis based on observations inwomen (Requena et al. 2008), letrozole treatment of beef heiferswith single intravenous dose on Day 3 after ovulation or with a
3-day regimen from Day 1 to 3, Day 3 to 5 or Day 5 to 7 afterovulation did not induce follicular atresia or hasten emergenceof a new follicular wave (Yapura et al. 2009). Letrozole
treatment did not induce increases in circulating FSH concen-trations. Rather, letrozole treatment increased mean plasma LHconcentrations, which resulted in a prolonged period of domi-nance of the extant dominant follicle and delayed emergence of
the next follicular wave. Furthermore, a luteotrophic effect ofletrozole treatment was documented by larger corpus luteumdiameters in those heifers treated with letrozole in a 3-day
regimen.The overall objective of the present study was to develop an
effective, safe and steroid-free protocol for controlling ovarian
follicular wave dynamics in cattle. Specific objectives of thestudy were to gain an understanding of the effects of anaromatase inhibitor (letrozole) on bovine ovarian function and
to establish a minimum effective dose of letrozole in cattle. Wetested the hypothesis that letrozole will terminate the growth ofthe extant dominant follicle (i.e. the dominant follicle present atthe time of treatment), resulting in a rise in circulating FSH
concentrations and followed by the emergence of a new wave offollicular growth at a predictable interval after treatment.
Materials and methods
In vitro culture of bovine granulosa cells
Bovine granulosa cells were cultured in serum-free medium asdescribed previously (Zamberlam et al. 2011). Unless stated
otherwise, materials were obtained from Invitrogen Life Tech-nologies (Burlington, ON, Canada). Briefly, bovine ovaries werecollected from adult cows at an abattoir and were transported to
the laboratory in phosphate-buffered saline (PBS) containingpenicillin (100 IUmL�1) and streptomycin (100mgmL�1). Fol-licles between 2 and 5mm in diameter were dissected andgranulosa cells were collected by rinsing the follicle wall with
Dulbecco’s modified Eagle’s medium Nutrient Mixture F-12(DMEM/F12). The granulosa cells were washed twice by cen-trifugation at 980g for 20min each time and suspended in
DMEM/F12 containing HEPES (15mM), sodium bicarbonate(10mM), sodium selenite (4 ngmL�1), bovine serum albumin(BSA; 0.1%; Sigma-Aldrich, Oakville, ON, Canada), penicillin
(100 IUmL�1), streptomycin (100mgmL�1), transferrin(2.5mgmL�1), non-essential amino acid mix (1.1mM), andro-stenedione (A4; 10�7M at the start of culture and 10�6M at each
medium change) and insulin (10 ngmL�1). The number of cellswas counted with a haemocytometer and viable cells wereassessed by 0.4% Trypan blue dye exclusion. Cells were seededinto 24-well tissue culture plates (Sarstedt, Montreal, QC,
Canada) at a density of 1� 106 viable cells per well in 1mLmedium.Culturesweremaintained at 378C in 5%CO2 in air for 6days, with 700mL medium being replaced every 2 days. On Day
2 of culture, cells were treated with 1 ngmL�1 FSH to stimulatearomatase expression and E2 secretion. On Day 4, cells weretreated with medium including FSH alone, with FSH plus
letrozole (15 or 50 ngmL�1) and without FSH for 48 h. Mediumsamples were collected on Day 6 and stored at �208C untilsteroid assay. All series of cultures were performed on at leastthree different pools of cells collected on different occasions.
Cattle
Hereford-cross beef heifers (Bos taurus), 14–20 months of ageand weighing between 295 and 450 kg, were chosen from a herdof 50 heifers maintained in outdoor corrals at the University ofSaskatchewan Goodale Research Farm (528N, 1068W). Heifers
were fed alfalfa and/or grass hay and grain to gain approxi-mately 1.3 kg per head per day and had water availablead libitum during the experimental period from July to October.
Heifers were initially examined by transrectal ultrasonography(7.5MHz linear-array transducer; SSD-900; Aloka, Tokyo,Japan). The presence of a corpus luteum (CL) was used to
confirm that the heifers were postpubertal and cycling (Piersonand Ginther 1987).
Treatments and examinations
Heifers in which a CL was detected during the initial exami-nation were given 500 mg, i.m., cloprostenol (PGF; Estrumate;Schering-Plough Animal Health, Pointe-Claire, QC, Canada)to induce regression of the CL and to synchronise ovulation
632 Reproduction, Fertility and Development M. J. Yapura et al.

(Hafs Louis et al. 1974). Ovulation was confirmed by dailytransrectal ultrasonography and visualisation of follicle coll-
apse. To synchronise wave emergence, transvaginal ultrasound-guided follicular aspiration of follicles $5mm was performed5–8 days after ovulation (Bergfelt et al. 1994). Heifers were
examined daily by transrectal ultrasonography to detect follic-ular wave emergence, which was expected 1–1.5 days afterfollicular ablation (Bergfelt et al. 1994). Four days after follic-
ular ablation (,2.5 days after follicular wave emergence andaround the time of follicular selection; Adams et al. 1993;Ginther et al. 2001), heifers were assigned randomly to one ofthe following treatment groups and given a single intravenous
dose of: (1) 500mg kg�1 letrozole (high dose group; n¼ 9);(2) 250mg kg�1 letrozole (medium dose group; n¼ 10);(3) 125mg kg�1 letrozole (low dose group; n¼ 10); or (4) 20mL
PBS (control group; n¼ 10). The letrozole used in the presentstudy was manufactured by Xian Huayang Biological Scienceand Technology (Xian, China). For practical purposes, the dose
of letrozole was calculated based on an averageweight of 400 kgfor all heifers. The average oral dose used in women (2.5–5mgday�1 for 5 days) was used to estimate a medium dose for cattle(Mitwally andCasper 2002a; Requena et al. 2008). The high and
low doses were set as 200% and 50% of the medium dose,respectively. The day of letrozole treatment was defined asDay 0. For intravenous injection, letrozole was prepared in 95%
ethanol at a final concentration of 5mg mL�1, which resulted inan injection volume of 10–40mL. The letrozole preparation wasadministered slowly via an intravenous catheter to monitor for
any adverse effects of the high volume of ethanol in the animals.The experiment was performed in four replicates (n¼ 2–3 pergroup per replicate). Each heifer was used only once.
Ovarian ultrasonography
Observations from ultrasound examinations were recorded ona sketch sheet in which each ovary and its structures (CL and
follicles $4mm in diameter; Knopf et al. 1989) were repre-sented in size and location. Ovulation was defined as the disap-pearance of any follicle $8mm between two consecutive daily
examinations andwas confirmed by the subsequent developmentof a CL (Pierson and Ginther 1987). Follicular wave emergencewas defined retrospectively as the day the dominant follicle wasfirst identified at a diameter of 4 or 5mm (Adams et al. 1993;
Ginther et al. 1997). The dominant follicle of a wavewas definedas the one that was destined to become the largest, whereas thefirst subordinate folliclewas defined as the second largest follicle
of that wave (Peter et al. 2009). If the dominant follicle was notidentified until it reached 6 or 7mm, the previous day was con-sidered the day of follicular wave emergence (Kastelic et al.
1990). Onset of follicular and/or luteal regression was defined asthe first day of an apparent constant decrease in follicular andluteal diameters, respectively (Adams et al. 1993).
Collection of blood samples
Blood was collected by jugular or coccygeal venipuncture into10-mLheparinised vacuum tubes (Becton Dickinson Vacutai-
ner Systems, Franklin Lakes, NJ, USA). Blood was collected at0, 0.25, 0.5, 1, 1.5, 2, 3, 4, 6, 8, 12, 24, 36 and 48 h after treatment
(Sioufi et al. 1997a) using an indwelling jugular catheter, asdescribed previously (Bergfelt et al. 1997), and daily thereafter
to the first post-treatment ovulation. Blood was centrifuged at1500g for 20min; the plasma was separated and stored in plastictubes at �208C.
Quantification of hormones
Plasma concentrations of LH were determined in duplicateusing a double-antibody radioimmunoassay (RIA; NIDDK-bLH4; Evans et al. 1994; Rawlings et al. 1984). The minimum
and maximum values along the standard curve were 0.06 and8 ngmL�1, respectively. The intra- and interassay CV were10.2% and 8.8%, respectively, for low reference samples (mean0.9 ngmL�1) and 9.4% and 9.1%, respectively, for high refer-
ence samples (mean 2.7 ngmL�1).Plasma concentrations of FSH were determined in duplicate
using a double-antibody RIA using NIDDK-anti-oFSH-1 pri-
mary antibody and expressed as US Department of Agriculturebovine FSH-Il units (Evans et al. 1994; Rawlings et al. 1984).The minimum and maximum values along the standard curve
were 0.12 and 16 ngmL�1, respectively. Intra- and interassayCV were 11.2% and 10.0%, respectively, for low referencesamples (mean 1.7 ngmL�1) and 12.0% and 12.4%, respectively,
for high reference samples (mean 4.4 ngmL�1).Concentrations of E2 in the conditioned culture mediumwere
determined in duplicate by RIA without solvent extraction, asdescribed previously (Belanger et al. 1990). Intra- and interassay
CV were 6% and 9%, respectively. The sensitivity of the assaywas 10 pg per tube, equivalent to 0.3 ng mg�1 protein. Oestradiolconcentrations in the culture medium were corrected for cell
number by expressing the concentration per unit mass of cellprotein. Cells were lysed with 100mL of 1M NaOH for 2 h andneutralised with 100mL of 1M HCl. Total cell protein was
measured by the Bradford protein assay (Bio-Rad, Mississauga,ON, Canada).
Plasma concentrations of oestradiol were determined induplicate by ELISA (Cayman Chemical, Ann Arbor, MI, USA).
Plasma E2 competed with acetylcholinesterase-labelled E2 forthe binding site on polyclonal rabbit anti-steroid antibody. Theantiserum to E2 has been reported (Cayman Chemical) to cross-
react with oestradiol-3-glucoronide (14%), oestrone (12%), andoestriol (0.3%). For all other steroid hormones, cross-reactivityhas been reported to be ,0.1%. The minimum and maximum
values along the standard curve were 6.6 and 4000 pg well�1,respectively. The intra- and interassay CV were 11.7% and12.7%, respectively, for reference samples analysed in duplicate.
A concentration procedure using diethyl ether extraction wasperformed before the assay in all samples to increase E2 tomeasurable concentrations (Valentini et al. 2002). A 3H-labelledsteroid was added to each plasma sample before extraction as an
internal recovery standard. After the extraction procedure, afraction of the final extract was quantified in a liquid scintillationcounter to test for recoveries (Hecker et al. 2005).
Plasma letrozole concentrations
Plasma concentrations of letrozole were determined using high-
performance liquid chromatography tandem mass spectrometry
Aromatase inhibitor and ovarian function in cattle Reproduction, Fertility and Development 633

(LC/MS/MS). Letrozolewas extracted from250mLplasmawith250 mL of 0.1M ammonium acetate followed by the addition of
5mL methyl t-butyl ether (MTBE) and vortexed for 15 s. Theorganic layer was removed and transferred to a fresh 15-mLplastic tube and dried by gentle nitrogen gas flow. The dried
extract was reconstituted in 1mL of 100% ethanol, sonicated for5min and transferred to a labelled vial for further analysis.Separation was accomplished by HPLC (Agilent 1200; Agilent,
Santa Clara, CA, USA) fitted with an analytical column(50� 2.1mm, 3mm particle size; Betasil C18; Thermo Scien-tific, Waltham, MA, USA) operated at 358C. Gradient condi-tions were used at a flow rate of 250mLmin�1, starting at 85%A
(0.1% acetic acid) and 15% B (0.1% acetic acid in acetonitrile).Initial conditions were held for 2min and then ramped to 100%B at 6min, held until 9min, decreased to 0% B at 11min,
returned to initial conditions at 13min and held constant until15min. Mass spectra were collected using a tandem massspectrometer (SCIEX 3000; Applied Bioscience, Foster City,
CA, USA) fitted with an electrospray ionisation source, oper-ated in the negative ionisation mode. Chromatograms wererecorded using multiple reaction monitoring (MRM) mode,where at least two transitions per analyte were monitored. The
following instrument parameters were used: desolvation tem-perature 4508C, desolvation (curtain) gas 6.0 arbitrary units(AU), nebulizer gas flow 4AU, ion spray voltage 4500V, col-
lision gas 12AU, collision energy 46AU, declustering potential30AU and a dwell time of 100 msec. Quantification using thesetransitions was performed using Analyst 1.4.1 software pro-
vided by SCIEX (Applied Bioscience). The minimum andmaximum values along the standard curve were 0.25 and500 mgmL�1, respectively. The limit of quantification used in
this method was 250 ngmL�1 and the mean recovery was 70%.The concentration of letrozole in plasma as a function of time(C–t) data for each heifer were analysed by non-compartmentaltechniques using a computer modelling program (WinNonLin
Standard Edition Version 2.1; Pharsight, Mountain View, CA,USA). Peak letrozole concentration in plasma (Cmax) and timeto peak letrozole concentration (tmax) were determined using
observed values. The apparent terminal rate constant (l) wasdetermined by linear regression of the last six to eight points onthe terminal phase of the logarithmic plasma concentration vs
time curve. The area under the C–t curve until the final plasmasample (AUClast) was determined using the linear trapezoidalrule. The total area under the curve extrapolated to infinity(AUC0–N) was calculated by adding the Clast obs/lþAUClast.
The terminal half-life (T½l) was calculated as ln2/l. The meanresidence time (MRT) was calculated as the area under themoment curve extrapolated to infinity (AUMC0–N)/AUC0–N.
Systemic clearance (ClS) was determined using the dose dividedby AUC0–N. The apparent volume of distribution (Vl/f ) wascalculated by divided clearance by l.
Statistical analyses
Statistical analyses were performed using SASLearning Edition9.1 (SAS Institute, Cary, NC, USA). Time series hormone data,plasma letrozole concentrations and follicular diameter profileswere analysed by repeated measures, using the PROC MIXED
procedure. The main effects were treatment (high, medium andlow dose and control), time and their interactions. When no
differences were detected among doses of letrozole, data werecombined and reanalysed as a single letrozole treatment group.Single point measurements (intervals from ablation to wave
emergence, treatment to wave emergence, treatment to ovula-tion, treatment to onset of follicular regression, and treatment toonset of CL regression) were analysed by one-wayANOVA. For
in vitro data, doses of letrozole were used as themain effects andculture replicate was included in the model as a random effectusing the PROCMIXEDprocedure. Differences betweenmeanswere tested with Tukey’s test. Paired t-tests were used to com-
pare E2 concentrations before and after treatment within atreatment group and a two-sample t-test was used to compare E2concentrations at a single data point between letrozole and
control groups. An F-test was used to analyse whether the var-iability in the interval from treatment to wave emergence dif-fered between letrozole-treated and control heifers. Because of
individual variability in circulating concentrations of LH andFSH among heifers, and because our objective was to determinethe effect of treatmentwithin individuals, LH and FSHdataweretransformed to a percentage of the mean concentration of the
first three samples (i.e. 0, 15 and 30min after treatment) for eachindividual heifer. Residuals from percentage datawere normallydistributed. All values are expressed as the mean� s.e.m.
Animal procedures were performed in accordance with theCanadian Council on Animal Care and were approved byUniversity of Saskatchewan Protocol Review Committee.
Results
In vitro results
Aromatase activity was compared between cells cultured with
FSH alone, FSH combined with two doses of letrozole andmedium without FSH. There were significant effects of treat-ment (P¼ 0.002) on E2 production. Treatment with 1 ngmL�1
FSH stimulated aromatase activity. In the presence of 1 ngmL�1
FSH combined with either 15 or 50 ngmL�1 letrozole, aroma-tase activity was inhibited and E2 levels were comparable with
those observed in cells cultured in absence of FSH (Fig. 1).
Plasma letrozole concentrations
Plasma concentrations of letrozole followed a dose-dependent
pattern (Fig. 2). Throughout the 8-day period, mean letrozoleconcentrations in the high-, medium- and low-dose groups were0.63� 0.04, 0.44� 0.04 and 0.27� 0.04 mgmL�1, respectively
(P, 0.0001). There were also dose-dependent differences inCmax and AUClast (P¼ 0.007 and P, 0.0001, respectively). Nosignificant differences were detected among dose groups termsof T½, Vz/f, ClS or MRT (Table 1).
Ovarian function
The interval from follicular ablation to emergence of the new
follicular wave did not differ among treatment groups (1.7, 1.6,1.7 and 1.6 days for the high-, medium- and low-dose letrozoleand control groups, respectively). Consequently, treatment wasapplied 2.4� 0.1 days after follicular wave emergence, when
634 Reproduction, Fertility and Development M. J. Yapura et al.

the growing dominant follicle was 7.1� 0.3mm. The intervalfrom ablation to treatment, and the diameter of the dominant
follicle at the time of treatment, did not differ among groups.Although the dominant follicle diameter profiles after letro-
zole treatment followed a dose-dependent pattern, differences
among the letrozole dose groups were not significant (P¼ 0.11).Therefore, data from all letrozole dose groups were combinedfor comparison with the control group.
The number of heifers in which the extant dominant follicleovulated did not differ among groups (5/9, 5/10, 7/10 and 4/10heifers in the high-, medium- and low-dose and control groups,respectively). Although dominant follicle profiles did not differ
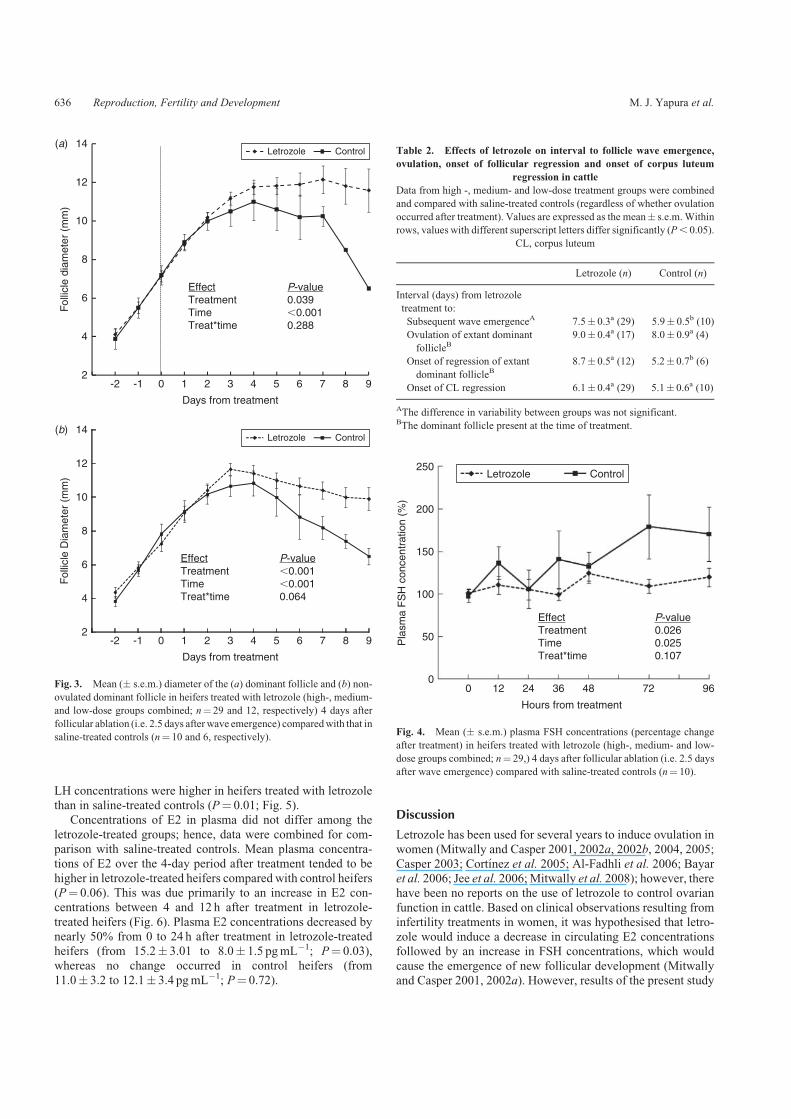
between treated and control heifers inwhich the extant dominantfollicle ovulated (Fig. 3a), the interval from treatment to ovula-tion of the extant dominant follicle tended to be longer in
letrozole-treated heifers (P¼ 0.07; Table 2). In heifers that didnot ovulate, the extant dominant follicle diameter profile inletrozole-treated heifers was larger (P, 0.01) than in control
heifers (Fig. 3b). The intervals from treatment to onset ofdominant follicle regression and to emergence of a new folli-cular wave were also longer in heifers treated with letrozolethan in controls (P, 0.05; Table 2). The variability (degree
of synchrony) in intervals from treatment to wave emergenceor dominant follicle regression was not significantly differentbetween letrozole-treated and control groups (F¼ 2.7;P. 0.05).
Circulating hormone concentrations
During the 4 days after treatment, plasma FSH concentrationsdid not differ among the high-, medium- and low-dose letrozole
groups. Therefore, data were combined for comparison withsaline-treated controls. Plasma FSH concentrations increasedin both letrozole and control groups (time effect P, 0.03), but
proportionately less in letrozole-treated animals (treatmenteffect P, 0.03; Fig. 4).
Plasma LH concentrations did not differ among letrozole-treated groups during the 12-h period after treatment, so data
were combined for comparison with PBS-treated controls.During the first 12 h following treatment, plasma LH concentra-tions in heifers treated with letrozole were higher than in saline-
treated controls (P¼ 0.05; Fig. 5). Similarly, plasma LHconcentrations during the 4-day period after treatment did notdiffer among letrozole-treated groups. After combining the data,
00 0.5 1 2 3 4 5
Hours from treatment
High
EffectTreatmentTimeTreat*time
P-value�0.001�0.001�0.001
Medium Low
6 7 8 9 10 11 12
0.5
1
1.5
2
2.5
3
Pla
sma
letr
ozol
e co
ncen
trat
ion
(µg
mL�
1 )
Fig. 2. Mean (� s.e.m.) plasma letrozole concentrations (determined by
high-pressure liquid chromatography tandem mass spectrometry) in heifers
after administration of a single intravenous dose of 500, 250 or 125 mg kg�1
letrozole (n¼ 4 per group).
Table 1. Pharmacokinetics of letrozole after administration of a single intravenous dose of 500, 250 or 125 lg kg21 letrozole to postpubertal beef
heifers, determined by non-compartmental analysis
Data are themean� s.e.m.Within rows, values with no common superscript differ significantly (P, 0.05). Cmax, maximum concentrationAUClast, area under
the C–t curve until the final plasma sample; Vz/f, volume of distribution; CLS, systemic clearance; MRT, mean residence time
Parameter Letrozole (mg kg�1) Combined
500 (n¼ 9) 250 (n¼ 9) 125 (n¼ 9)
Cmax (mgmL�1) 2.5� 0.4c 1.7� 0.2b 1.2� 0.3a 1.8� 0.3
Half-life (h) 28.5� 1.1a 26.6� 1.2a 26.9� 1.0a 27.3� 0.4
AUClast (hmg mL�1) 28.1� 2.2c 17.3� 2.0b 8.8� 0.7a 18.2� 4.0
Vz/f (mLkg�1) 745.7� 47.4a 592.9� 66.1a 566.2� 44.0a 634.9� 39.5
ClS (mLh�1 kg�1) 18.5� 1.7a 15.5� 1.8a 14.6� 1.1a 16.2� 0.8
MRT (h) 35.8� 1.4a 33.7� 3.0a 31.7� 2.0a 33.7� 0.8
0.0
a
b
b
P-value � 0.002
b
FSH 1 ng mL�1
FSH 1 ng mL�1 � Letrozole 15 ng mL�1
FSH 1 ng mL�1 � Letrozole 50 ng mL�1
FSH 0 ng mL�1
100.0
200.0
300.0
400.0
500.0
E2
secr
etio
n (p
g µg
�1
of p
rote
in)
600.0
Fig. 1. Mean (� s.e.m.) oestradiol concentrations (mean� s.e.m.) in
conditioned media from in vitro cultured bovine granulosa cells after
treatment with 1 ngmL�1 FSH, 1 ngmL�1 FSH plus 15 ngmL�1 letrozole,
1 ngmL�1 FSH plus 50 ngmL�1 letrozole or without FSH. Bars with
different superscript letters differ significantly (P, 0.002).
Aromatase inhibitor and ovarian function in cattle Reproduction, Fertility and Development 635
LH concentrations were higher in heifers treated with letrozolethan in saline-treated controls (P¼ 0.01; Fig. 5).
Concentrations of E2 in plasma did not differ among the
letrozole-treated groups; hence, data were combined for com-parison with saline-treated controls. Mean plasma concentra-tions of E2 over the 4-day period after treatment tended to be
higher in letrozole-treated heifers compared with control heifers(P¼ 0.06). This was due primarily to an increase in E2 con-centrations between 4 and 12 h after treatment in letrozole-
treated heifers (Fig. 6). Plasma E2 concentrations decreased bynearly 50% from 0 to 24 h after treatment in letrozole-treatedheifers (from 15.2� 3.01 to 8.0� 1.5 pgmL�1; P¼ 0.03),whereas no change occurred in control heifers (from
11.0� 3.2 to 12.1� 3.4 pgmL�1; P¼ 0.72).
Discussion
Letrozole has been used for several years to induce ovulation inwomen (Mitwally and Casper 2001, 2002a, 2002b, 2004, 2005;
Casper 2003; Cortınez et al. 2005; Al-Fadhli et al. 2006; Bayaret al. 2006; Jee et al. 2006;Mitwally et al. 2008); however, therehave been no reports on the use of letrozole to control ovarian
function in cattle. Based on clinical observations resulting frominfertility treatments in women, it was hypothesised that letro-zole would induce a decrease in circulating E2 concentrationsfollowed by an increase in FSH concentrations, which would
cause the emergence of new follicular development (Mitwallyand Casper 2001, 2002a). However, results of the present study
2
4
6
8
10
12
14
-2 -1 0 1 2 3 4 5 6 7 8 9
Fol
licle
dia
met
er (
mm
)
Days from treatment
-2 -1 0 1 2 3 4 5 6 7 8 9
Days from treatment
EffectTreatmentTimeTreat*time
P-value0.039�0.0010.288
2
4
6
8
10
12
14
(a)
(b)
Fol
licle
Dia
met
er (
mm
)
EffectTreatmentTimeTreat*time
P-value�0.001�0.0010.064
Letrozole Control
Letrozole Control
Fig. 3. Mean (� s.e.m.) diameter of the (a) dominant follicle and (b) non-
ovulated dominant follicle in heifers treated with letrozole (high-, medium-
and low-dose groups combined; n¼ 29 and 12, respectively) 4 days after
follicular ablation (i.e. 2.5 days after wave emergence) comparedwith that in
saline-treated controls (n¼ 10 and 6, respectively).
Table 2. Effects of letrozole on interval to follicle wave emergence,
ovulation, onset of follicular regression and onset of corpus luteum
regression in cattle
Data from high -, medium- and low-dose treatment groups were combined
and compared with saline-treated controls (regardless of whether ovulation
occurred after treatment). Values are expressed as the mean� s.e.m. Within
rows, values with different superscript letters differ significantly (P, 0.05).
CL, corpus luteum
Letrozole (n) Control (n)
Interval (days) from letrozole
treatment to:
Subsequent wave emergenceA 7.5� 0.3a (29) 5.9� 0.5b (10)
Ovulation of extant dominant
follicleB9.0� 0.4a (17) 8.0� 0.9a (4)
Onset of regression of extant
dominant follicleB8.7� 0.5a (12) 5.2� 0.7b (6)
Onset of CL regression 6.1� 0.4a (29) 5.1� 0.6a (10)
AThe difference in variability between groups was not significant.BThe dominant follicle present at the time of treatment.
00
Hours from treatment
12 24 36 48 72 96
50
100
Letrozole Control
EffectTreatmentTimeTreat*time
P-value0.0260.0250.107
150
Pla
sma
FS
H c
once
ntra
tion
(%)
200
250
Fig. 4. Mean (� s.e.m.) plasma FSH concentrations (percentage change
after treatment) in heifers treated with letrozole (high-, medium- and low-
dose groups combined; n¼ 29,) 4 days after follicular ablation (i.e. 2.5 days
after wave emergence) compared with saline-treated controls (n¼ 10).
636 Reproduction, Fertility and Development M. J. Yapura et al.

in cattle did not support this hypothesis. On the contrary, a singletreatment with letrozole on approximately Day 2.5 after waveemergence in cattle, regardless of the dose, significantly
lengthened the period of dominance of the extant dominantfollicle, which resulted in a prolonged interval to emergence of anew follicular wave. Letrozole treatment was associated with
elevated plasma LH concentrations, but it did not have theexpected effect on FSH concentrations. Further, the meandiameter profile of the dominant follicle was significantly larger
in letrozole-treated heifers.Extended growth and delayed regression of the extant domi-
nant follicle can be attributed to elevated plasma LH concentra-
tions (Adams et al. 1992; Stock and Fortune 1993), possibly
induced by letrozole treatment. Endogenous concentrations ofLH started to rise 2 h after letrozole was administered and
concentrations were elevated for at least 4 days after treatment.Increasing concentrations of LH during this time may also haveelicited the rise in plasma E2 concentrations observed 12 h after
treatment.Contrary to our expectations, plasma FSH concentrations
were lower in letrozole-treated heifers than in controls. Follicu-
lar products other than E2 also suppress FSH and may beresponsible for the observed effect (Miller et al. 1979, 1981;Adams et al. 1992). Inhibin secreted by the dominant andsubordinate follicles, together with E2, has been associated with
the suppressive effects involved in follicular selection anddominance (Bleach et al. 2001; Ginther et al. 2003). However,treatment with letrozole was associated with overdominance
(prolonged growth and maintenance of the dominant follicle) inthe present study, which resulted in an extended period of FSHsuppression and delayed emergence of the next follicular wave.
It is of note that inhibition of E2 synthesis by an aromataseinhibitor did not adversely affect the extant dominant follicle;rather, it indirectly enhanced follicular dominance by permitting
elevated pituitary LH secretion.Mean E2 concentrations in letrozole-treated heifers tended to
be higher than in controls for the first 4 days after treatment, butthis observation was attributed primarily to a significant and
sharp elevation at 12 h after letrozole treatment. The acuteelevation in E2 has not been reported in women, but a similarincrease in LHhas been observed in rats and has been interpreted
to be the result of gonadotrophin release caused by letrozoletreatment (Sinha et al. 1998). Although plasma E2 concentra-tions decreased by nearly 50% by 24 h after letrozole treatment
in the present study, concentrations did not differ significantlyfrom those in controls.
The lack of an apparent suppressive effect of letrozole onoestrogen concentrations in cattle in the present study may have
been the result of insufficient assay sensitivity and/or an
200 1 2 3 4 6 8 12 0
Hours from treatment
12 24 36 48 72 96
40
60
80
100
Letrozole ControlEffectTreatmentTimeTreat*time
P-value0.0540.7030.329
EffectTreatmentTimeTreat*time
P-value0.0130.7900.324
Pla
sma
LH c
once
ntra
tion
(%)
120
140
160
180
200
220
240
Fig. 5. Mean (� s.e.m.) plasma LH concentrations in heifers (percentage change after treatment) during the
first 12 h (left) and for 96 h (right) after a single intravenous dose of letrozole (high-, medium- and low-dose
groups combined; n¼ 29) given 4 days after follicular ablation (i.e. 2.5 days after wave emergence) compared
with saline-treated controls (n¼ 10).
EffectTreatmentTimeTreat*time
P-value0.0570.5160.246
0 1 4 12 24
Hours from treatment
48 96
0
5
10
15
20
25
30
Pla
sma
estr
adio
l (pg
mL�
1 )
P � 0.72
P � 0.03
*
*
Letrozole Control
Fig. 6. Mean (� s.e.m.) plasma oestradiol concentrations in heifers during
the first 96 h after a single intravenous dose of letrozole (high-, medium- and
low-dose groups combined; n¼ 29) given 4 days after follicular ablation
(i.e. 2.5 days after wave emergence) compared with phosphate-buffered
saline (PBS)-treated controls (n¼ 10). Within groups, differences in
oestradiol concentrations between 0 and 24 h after treatment were compared
by paired t-tests. *Values differed between groups (P, 0.03).
Aromatase inhibitor and ovarian function in cattle Reproduction, Fertility and Development 637
inadequate dose of letrozole. This is supported by the results ofthe present study obtained in vitro, where the effectiveness of
letrozole to inhibit aromatase activity in bovine granulosa cellshas been confirmed. In women, basal and maximum circulatingE2 concentrations have been reported to be approximately
20 and 200 pgmL�1, respectively (Baerwald et al. 2003). Inthe heifers examined in the present study, basal plasmaE2 concentrations were below the detection limit of the assay
(3–4 pgmL�1) and, on average, maximum concentrations didnot exceed 25 pgmL�1during the first 8 days after ovulation. Inaddition, the dose and duration of letrozole treatment used in ourexperiment may not have been sufficient to inhibit E2 produc-
tion in cattle compared with other species in which treatmentresulted in a reduction in circulating E2 concentrations of97%–99% in post-menopausal women (Mitwally and Casper
2002a) and 88% in boars (At-Taras et al. 2006).Althoughmost of the studies inwhich letrozole has been used
to treat unexplained infertility in women are based on a 5-day
treatment regimen (total dose 12.5–20mg letrozole), single dosetreatments of 20mg administered orally on the third day of themenstrual cycle have been reported to be equally effective insuppressing circulating oestrogen concentrations. The half-life
of letrozole in humans has been reported to be approximately2 days, which could result in effective suppression of E2production for 4–6 days after a single administration (Mitwally
and Casper 2005). Although the pharmacokinetic parametersreported in the present study are preliminary, it was estimatedthat the half-life of letrozole in heifers was 27 h (cf. 48 h in
women (Sioufi et al. 1997a, 1997b). The MRT (average dura-tion of persistence in the body) was estimated to be 34 h (cf. 59 hin women; Sioufi et al. 1997a) and the volume of distribution
was estimated to be 635mLkg�1 (cf. 1870mLkg�1 in women;Sioufi et al. 1997b). Together, these results are consistent withthe conclusion that cattle require a higher dose and a longerperiod of exposure to achieve effective concentrations of letro-
zole in target tissues. This hypothesis is further supported by astudy in which albendazole (another imidazole derivative usedas an anthelminthic) significantly reduced follicular fluid E2
concentrations in ewes when given orally at 11.5mg kg�1
bodyweight (Mamali et al. 2008), which is 46-fold higher thanthe medium dose used in the present study.
In summary, letrozole treatment in heifers was associatedwith elevated circulating LH concentrations and an extendedperiod of dominance of the dominant follicle present at the timeof treatment, regardless of dose. Consequently, circulating
concentrations of FSH remained suppressed and emergence ofthe next wave was delayed. These results were unexpected andprovide impetus for additional studies to elucidate the differ-
ences in pharmacokinetics of letrozole between the bovine andhuman and to explore the potential of aromatase inhibitors as anon-steroidal approach to the control of ovarian function in
cattle.
Acknowledgements
The authors thank Alan Chicoine for help in interpreting plasma letrozole
concentrations and Gustavo Zamberlam and Christopher Price from the
University of Montreal for their help in generating in vitro data. The authors
also thank Brad Blackmore and the staff at Goodale Research Farm for
assistance with handling and managing the cattle and our summer student,
Matthew Van Steelandt, for help with data collection. This research was
supported by Discovery Grants from the Natural Sciences and Engineering
Research Council of Canada (122236–08 and 326415–07) and a grant from
the Western Economic Diversification Canada (project no. 6578 and 6807).
The authors acknowledge the support of a Research Tools and Instruments
grant from the Natural Sciences and Engineering Research Council of
Canada (375327–09) and an infrastructure grant from the Canada Founda-
tion for Innovation. JPG was supported by the Canada Research Chair
program and an at-large Chair in Marine Pollution at the Department of
Biology and Chemistry, State Key Laboratory, City University of Hong
Kong. RAP supported by the Canadian Institutes for Health Research.
References
Adams, G. P., Matteri, R. L., and Ginther, O. J. (1992). Effect of progester-
one on ovarian follicles, emergence of follicular waves and circulating
follicle-stimulating hormone in heifers. J. Reprod. Fertil. 96, 627–640.
doi:10.1530/JRF.0.0960627
Adams, P., Kot, K., Smith, C., and Ginther, O. (1993). Selection of a
dominant follicle and suppression of follicular growth in heifers. Anim.
Reprod. Sci. 30, 259–271. doi:10.1016/0378-4320(93)90076-4
Al-Fadhli, R., Sylvestre, C., Buckett, W., Tan, S. L., and Tulandi, T. (2006).
A randomized trial of superovulation with two different doses of
letrozole. Fertil. Steril. 85, 161–164. doi:10.1016/J.FERTNSTERT.
2005.07.1283
Andersson, A., and Skakkebaek, N. (1999). Exposure to exogenous estro-
gens in food: possible impact on human development and health. Eur. J.
Endocrinol. 140, 477–485. doi:10.1530/EJE.0.1400477
At-Taras, E. E., Conley, A. J., Berger, T., and Roser, J. F. (2006). Reducing
estrogen synthesis does not affect gonadotropin secretion in the devel-
oping boar. Biol. Reprod. 74, 58–66. doi:10.1095/BIOLREPROD.105.
043760
Baerwald, A., Adams, G., and Pierson, R. (2003). Characterization
of ovarian follicular wave dynamics in women. Biol. Reprod. 69,
1023–1031. doi:10.1095/BIOLREPROD.103.017772
Bayar, U., TanrIverdi, H. A., Barut, A., Ayoglu, F., Ozcan, O., and Kaya, E.
(2006). Letrozole vs. clomiphene citrate in patients with ovulatory
infertility. Fertil. Steril. 85, 1045–1048. doi:10.1016/J.FERTNSTERT.
2005.09.045
Belanger, A., Couture, J., Caron, S., and Roy, R. (1990). Determination of
nonconjugated and conjugated steroid levels in plasma and prostate
after separation on C-18 columns. Ann. N. Y. Acad. Sci. 595, 251–259.
doi:10.1111/J.1749-6632.1990.TB34299.X
Bergfelt, D. R., Lightfoot, K. C., and Adams, G. P. (1994). Ovarian
synchronization following ultrasound-guided transvaginal follicle abla-
tion in heifers. Theriogenology 42, 895–907. doi:10.1016/0093-691X
(94)90113-W
Bergfelt, D. R., Smith, C. A., Adams, G. P., and Ginther, O. J. (1997). Surges
of FSH during the follicular and early luteal phases of the estrous cycle in
heifers. Theriogenology 48, 757–768. doi:10.1016/S0093-691X(97)
00299-9
Bleach, E. C. L., Glencross, R. G., Feist, S. A., Groome, N. P., andKnight, P.
G. (2001). Plasma inhibin A in heifers: relationship with follicle
dynamics, gonadotropins, and steroids during the estrous cycle and
after treatment with bovine follicular fluid. Biol. Reprod. 64, 743–752.
doi:10.1095/BIOLREPROD64.3.743
Bo, G. A., Adams, G. P., Caccia, M., Martinez, M., Pierson, R. A., and
Mapletoft, R. J. (1995a). Ovarian follicular wave emergence after
treatment with progestogen and estradiol in cattle. Anim. Reprod. Sci.
39, 193–204. doi:10.1016/0378-4320(95)01389-H
Bo, G. A., Adams, G. P., Pierson, R. A., and Mapletoft, R. J. (1995b).
Exogenous control of follicular wave emergence in cattle. Theriogenol-
ogy 43, 31–40. doi:10.1016/0093-691X(94)00010-R
638 Reproduction, Fertility and Development M. J. Yapura et al.

Bridges, P. J., Lewis, P. E., Wagner, W. R., and Inskeep, E. K. (1999).
Follicular growth, estrus and pregnancy after fixed-time insemination in
beef cows treated with intravaginal progesterone inserts and estradiol
benzoate. Theriogenology 52, 573–583. doi:10.1016/S0093-691X(99)
00153-3
Casper, R. F. (2003). Letrozole: ovulation or superovulation? Fertil. Steril.
80, 1335–1337. doi:10.1016/J.FERTNSTERT.2003.05.004
Cohen, M. H., Johnson, J. R., Li, N., Chen, G., and Pazdur, R. (2002).
Approval summary: letrozole in the treatment of postmenopausal
women with advanced breast cancer. Clin. Cancer Res. 8, 665–669.
Colazo, M. G., Kastelic, J. P., Martınez, M. F., Whittaker, P. R., Wilde, R.,
Ambrose, J. D., Corbett, R., and Mapletoft, R. J. (2004). Fertility
following fixed-time AI in CIDR-treated beef heifers given GnRH or
estradiol cypionate and fed diets supplemented with flax seed or
sunflower seed. Theriogenology 61, 1115–1124. doi:10.1016/J.THER
IOGENOLOGY.2003.06.005
Cortınez, A., De Carvalho, I., Vantman, D., Gabler, F., Iniguez, G., and
Vega, M. (2005). Hormonal profile and endometrial morphology in
letrozole-controlled ovarian hyperstimulation in ovulatory infertile
patients. Fertil. Steril. 83, 110–115. doi:10.1016/J.FERTNSTERT.
2004.05.099
Daxenberger, A., Ibarreta, D., and Meyer, H. H. D. (2001). Possible health
impact of animal oestrogens in food. Hum. Reprod. Update 7, 340–355.
doi:10.1093/HUMUPD/7.3.340
Evans, A. C. O., Adams, G. P., and Rawlings, N. C. (1994). Endocrine and
ovarian follicular changes leading up to the first ovulation in prepubertal
heifers. J. Reprod. Fertil. 100, 187–194. doi:10.1530/JRF.0.1000187
Fritsche, S., and Steinhart, H. (1999). Occurrence of hormonally active
compounds in food: a review. Eur. Food Res. Technol. 209, 153–179.
doi:10.1007/S002170050475
Gibbs, J. N. (2004). Is veterinary compounding illegal under federal law?
IJPC 8, 449–451.
Ginther, O. J., Kot, K., Kulick, L. J., andWiltbank,M. C. (1997). Emergence
and deviation of follicles during the development of follicular waves
in cattle. Theriogenology 48, 75–87. doi:10.1016/S0093-691X(97)
00192-1
Ginther, O. J., Bergfelt, D. R., Beg, M. A., and Kot, K. (2001). Follicle
selection in cattle: relationships between growth rate, diameter ranking,
and capacity for dominance. Biol. Reprod. 65, 345–350. doi:10.1095/
BIOLREPROD65.2.345
Ginther, O. J., Beg, M. A., Donadeu, F. X., and Bergfelt, D. R. (2003).
Mechanism of follicle deviation in monovular farm species. Anim.
Reprod. Sci. 78, 239–257. doi:10.1016/S0378-4320(03)00093-9
Hafs, H. D., Louis, T. M., Noden, P. A., and Oxender,W. D. (1974). Control
of the estrous cycle with prostaglandin F2{alpha} in cattle and horses.
J. Anim. Sci. 38, 10–21.
Health Canada Drugs and Health Products (2005). ‘Veterinary Products.
Questions and Answer: Hormonal Growth Promoters.’ (Veterinary
Drugs Directorate, Health Products and Food Branch, Health Canada:
Ottawa, ON.) Available at http://www.hc-sc.gc.ca/dhp-mps/vet/faq/
growth_hormones_promoters_croissance_hormonaux_stimulateurs-eng.
php[Verified 25 January 2009].
Hecker, M., Park, J.-W., et al. (2005). Effects of atrazine on CYP19 gene
expression and aromatase activity in testes and on plasma sex steroid
concentrations of male African clawed frogs (Xenopus laevis). Toxicol.
Sci. 86, 273–280. doi:10.1093/TOXSCI/KFI203
Jee, B. C., Ku, S. Y., Suh, C. S., Kim, K. C., Lee, W. D., and Kim, S. H.
(2006). Use of letrozole versus clomiphene citrate combined with
gonadotropins in intrauterine insemination cycles: a pilot study. Fertil.
Steril. 85, 1774–1777. doi:10.1016/J.FERTNSTERT.2006.02.070
Kastelic, J. P., Knopf, L., and Ginther, O. J. (1990). Effect of day of
prostaglandin F2[alpha] treatment on selection and development
of the ovulatory follicle in heifers. Anim. Reprod. Sci. 23, 169–180.
doi:10.1016/0378-4320(90)90001-V
Knopf, L., Kastelic, J. P., Schallenberger, E., and Ginther, O. J. (1989).
Ovarian follicular dynamics in heifers: test of two-wave hypothesis by
ultrasonically monitoring individual follicles. Domest. Anim. Endocri-
nol. 6, 111–119. doi:10.1016/0739-7240(89)90040-4
Lane, E. A., Austin, E. J., and Crowe, M. A. (2008). Oestrous synchronisa-
tion in cattle: current options following the EU regulations restricting use
of oestrogenic compounds in food-producing animals. A review. Anim.
Reprod. Sci. 109, 1–16. doi:10.1016/J.ANIREPROSCI.2008.08.009
Mamali, P., Samartzi, F., Batzias, G. C., Theodosiadou, E., Vainas, E.,
Goulas, P., Belibasaki, S., and Saratsis, F. (2008). The effect of
albendazole administration on the concentration of ovarian steroids in
the follicular fluid and the maturation of oocytes in the ewe. Reprod.
Domest. Anim. 43, 192.
Mapletoft, R. J., Martinez, M. F., Colazo, M. G., and Kastelic, J. P. (2003).
The use of controlled internal drug release devices for the regulation of
bovine reproduction. J. Anim. Sci. 81, E28–E36.
Martinez,M. F., Adams, G. P., Kastelic, J. P., Bergfelt, D. R., andMapletoft,
R. J. (2000). Induction of follicular wave emergence for estrus synchro-
nization and artificial insemination in heifers. Theriogenology 54,
757–769. doi:10.1016/S0093-691X(00)00388-5
Miller, K. F., Critser, J. K., Rowe, R. F., and Ginther, O. J. (1979). Ovarian
effects of bovine follicular fluid treatment in sheep and cattle. Biol.
Reprod. 21, 537–544. doi:10.1095/BIOLREPROD21.3.537
Miller, K. F.,Wesson, J. A., andGinther,O. J. (1981). Interaction of estradiol
and a nonsteroidal follicular fluid substance in the regulation of gonado-
tropin secretion in the mare. Biol. Reprod. 24, 354–358. doi:10.1095/
BIOLREPROD24.2.354
Mitwally, M. F., and Casper, R. F. (2001). Use of aromatase inhibitor for
induction of ovulation in patients with an inadequate response to
clomiphene citrate. Fertil. Steril. 75, 305–309. doi:10.1016/S0015-
0282(00)01705-2
Mitwally,M. F., and Casper, R. F. (2002a). Aromatase inhibition for ovarian
stimulation: future avenues for infertility management. Curr. Opin.
Obstet. Gynecol. 14, 255–263. doi:10.1097/00001703-200206000-
00003
Mitwally, M. F., and Casper, R. F. (2002b). Aromatase inhibition improves
ovarian response to follicle-stimulating hormone in poor responders.
Fertil. Steril. 77, 776–780. doi:10.1016/S0015-0282(01)03280-0
Mitwally, M. F. M., and Casper, R. F. (2004). Aromatase inhibition reduces
the dose of gonadotropin required for controlled ovarian hyperstimu-
lation. J. Soc. Gynecol. Invest. 11, 406–415. doi:10.1016/J.JSGI.
2004.03.006
Mitwally, M. F. M., and Casper, R. F. (2005). Single-dose administration
of an aromatase inhibitor for ovarian stimulation. Fertil. Steril. 83,
229–231. doi:10.1016/J.FERTNSTERT.2004.07.952
Mitwally, M. F., Said, T., Galal, A., Chan, S., Cohen, M., Casper, R. F., and
Magarelli, P. C. (2008). Letrozole step-up protocol: a successful super-
ovulation protocol. Fertil. Steril. 89, S23–S24. doi:10.1016/J.FERTN
STERT.2008.02.071
Official Journal of the European Union. (2003). ‘L 262, 14/10/2003.
Directive 2003/74/EC of the European Parliament and of the Council
on 22 September 2003 amending Council Directive 96/22/EC concern-
ing the prohibition on the use in stockfarming of certain substances
having a hormonal or thyristatic action and of beta-agonist.’ (EUR-Lex:
Brussels.) Available at http://www.fve.org/veterinary/pdf/food/directive_
2003_74.pdf.
Peter, A. T., Levine, H., Drost, M., and Bergfelt, D. R. (2009). Compilation
of classical and contemporary terminology used to describe morpho-
logical aspects of ovarian dynamics in cattle. Theriogenology 71,
1343–1357. doi:10.1016/J.THERIOGENOLOGY.2008.12.026
Pierson, R. A., and Ginther, O. J. (1987). Reliability of diagnostic ultraso-
nography for identification and measurement of follicles and detecting
the corpus luteum in heifers. Theriogenology 28, 929–936. doi:10.1016/
0093-691X(87)90043-4
Aromatase inhibitor and ovarian function in cattle Reproduction, Fertility and Development 639

Rawlings, N. C., Jeffcoate, I. A., and Rieger, D. L. (1984). The influence of
estradiol-17[beta] and progesterone on peripheral serum concentrations
of luteinizing hormone and follicle stimulating hormone in the ovariec-
tomized ewe.Theriogenology 22, 473–488. doi:10.1016/0093-691X(84)
90047-5
Requena, A., Herrero, J., Landeras, J., Navarro, E., Neyro, J. L., Salvador,
C., Tur, R., Callejo, J., Checa,M. A., Farre,M., Espinos, J. J., Fabregues,
F., and Grana-Barcia, M. (2008). Use of letrozole in assisted reproduc-
tion: A systematic review and meta-analysis. Hum. Reprod. Update 14,
571–582. doi:10.1093/HUMUPD/DMN033
Sinha, S., Kaseta, J., Santner, S. J., Demers, L. M., Bremmer, W. J., and
Santen, R. J. (1998). Effect of CGS 20267 on ovarian aromatase and
gonadotropin levels in the rat. Breast Cancer Res. Treat. 48, 45–51.
doi:10.1023/A:1005937900788
Sioufi, A., Gauducheau, N., Pineau, V., Marfil, F., Jaouen, A., Cardot, J. M.,
Godbillon, J., Czendlik, C., Howald, H., Pfister, C. H., and Vreeland, F.
(1997a). Absolute bioavailability of letrozole in healthy postmenopausal
women.Biopharm. DrugDispos. 18, 779–789. doi:10.1002/(SICI)1099-
081X(199712)18:9,779::AID-BDD64.3.0.CO;2-5
Sioufi, A., Sandrenan, N., Godbillon, J., Trunet, P., Czendlik, C., Howald, H.,
Pfister, C., and Ezzet, F. (1997b). Comparative bioavailability of letrozole
under fed and fasting conditions in12healthy subjects after a 2.5mgsingle
oral administration. Biopharm. Drug Dispos. 18, 489–497. doi:10.1002/
(SICI)1099-081X(199708)18:6,489::AID-BDD36.3.0.CO;2-P
Stock, A. E., and Fortune, J. E. (1993). Ovarian follicular dominance in
cattle: relationship between prolonged growth of the ovulatory follicle
and endocrine parameters.Endocrinology 132, 1108–1114. doi:10.1210/
EN.132.3.1108
Umberger, E. J. (1975). Products marketed to promote growth in food-
producing animals: steroid and hormone products. Toxicology 3, 3–21.
doi:10.1016/0300-483X(75)90003-7
US Department of Agriculture. Foreign Agricultural Service (2003). ‘His-
toric Overview and Chronology of EU’s Hormone Ban. GAIN Report
E23206.’ (USDA: Washington, DC.) Available at http://www.fas.usda.
gov/scriptsw/attacherep/gain_display_report.asp?Rep_ID=145986773
[Verified 3 November 2011].
US Food and Drug Administration (2003). ‘Compliance Policy Guides
Manual, Sec. 608.400. Compounding of Drugs for Use in Animals.’
(Department of Health and Human Services: Silver Spring, MD.)
Available at http://www.fda.gov/ora/compliance_ref/cpg/cpgvet/cpg608-
400compounding.pdf [Verified 25 August 2011].
Valentini, F., Compagnoneb, D., Gentilic, A., and Palleschia, G. (2002). An
electrochemical ELISA procedure for the screening of 17-estradiol in
urban waste waters. Analyst 127, 1333–1337. doi:10.1039/B204826B
Yapura, M. J., Mapletoft, R. J., Singh, J., Pierson, R. A., and Adams, G. P.
(2009). Effects of a single dose of a nonsteroidal aromatase inhibitor on
ovarian function in cattle. Reprod. Fertil. Dev. 22, 271. doi:10.1071/
RDV22N1AB227
Zamberlam, G., Portela, V., de Oliveira, J. F. C., Goncalves, P. B. D., and
Price, C. A. (2011). Regulation of inducible nitric oxide synthase
expression in bovine ovarian granulosa cells. Mol. Cell. Endocrinol.
335, 189–194. doi:10.1016/J.MCE.2011.01.013
www.publish.csiro.au/journals/rfd
640 Reproduction, Fertility and Development M. J. Yapura et al.