1617 SOME TECHNICAL AND ECONOMIC ...
84
1617 SOME TECHNICAL AND ECONOMIC CONSIDERATIONS ON THE USE OF DIRECT REDUCTION OF IRON ORES IN VENEZUELA by Carlos A. Martinez V. 12^05
-
Upload
khangminh22 -
Category
Documents
-
view
2 -
download
0
Transcript of 1617 SOME TECHNICAL AND ECONOMIC ...

1617
SOME TECHNICAL AND ECONOMIC CONSIDERATIONS ON THE USE OF DIRECT REDUCTION
OF IRON ORES IN VENEZUELA
byCarlos A. Martinez V.
1 2 ^ 0 5

ProQuest Number: 10781888
All rights reserved
INFORMATION TO ALL USERS The quality of this reproduction is dependent upon the quality of the copy submitted.
In the unlikely event that the author did not send a com p le te manuscript and there are missing pages, these will be noted. Also, if material had to be removed,
a note will indicate the deletion.
uestProQuest 10781888
Published by ProQuest LLC(2018). Copyright of the Dissertation is held by the Author.
All rights reserved.This work is protected against unauthorized copying under Title 17, United States C ode
Microform Edition © ProQuest LLC.
ProQuest LLC.789 East Eisenhower Parkway
P.O. Box 1346 Ann Arbor, Ml 48106- 1346

T-1617
A Thesis submitted to the Faculty and the Board of Trustees of the Colorado School of Mines in partial fulfillment of the requirements for the degree of Master of Science, Mineral Economics.
Signed: Martinez v.
Golden, CoJLorado
Date: C 2 j( / , 1975
Approved iDr i t/Alfred“ Petrick, Jr Thesis Advisor
^ r / Jean Paul Mather (j£nairman, Department of
Mineral Economics
Golden, Colorado Date: 1975 .
C n fH ™ LAKBS LIBRARY COLORADO SCHOOL oi MINFP
GOLDEN. COLORADO 8S f
11

T-1617
ABSTRACT
This study points out the most ciritcal technical characteristics that affect the economics of a direct reduction process of iron ores.
Two of the now available industrial processes, the Hojalata y Lamina and the Midrex, are compared technically and economically. The required characteristics and quality of the end product are related to its further use of the electric furnace.
Aifrter making an economical selection between the two methods, the selected one is studied in detail using the discounted cash flow analysis and the concept of production function.
The whole situation applies to the present plans of the Venezuelan government to increase raw iron and steel production.
COmR EAKES LKHARyGOT npm SCi l )L oI MINES COLDEN, COLORADO 80401
1X1

T-1617
TABLE OF CONTENTS
' c o i n S , la KES LIBRARYcom™°^SGHOOL of mines GOLDEN, COLORADO 80401
PageAbstract —-------- — --------------- IITable of Contents ----------------------------------------IIIIntroduction -------------------------- 1.The Quality and Availability of the InputMaterials -------- -------------------------- -------------- 6
Iron Ore — ------- — -------- ■---- 7Scrap ---— ----- *---- ----*— *— --- 9Coal —--------------*— ---- *------ - 9Natural gas ------ 9Electricity -------------------------------------- — 13Other materials ------------------------------------ 13
Present Status of Iron Ore Mining and Processing-------- 14The plans to increase capacity----------------------17
Technical Factors that Affect the Selection of aD.R. Process ------------------------------------------- 19
Iron ore and end product characteristics ----------20The Ho j a lata Lamina D.R. process ---- ------------- 24The Midrex D.R. process ---------------------------- 29
iv

T-1617
PageThe Economical Parameters --— -------- 32
Price calculation--------------- 33Operating and investment costs----- 36
Economic Selection Between the HyL and Midrex Processes 46
Economic analysis of the Midrex D.R. process 48The financial analysis----------------------- 48The DCFROR analysis ---- *----58The production theory analysis --------------61
Conclusions *--- 68Bibliography 74
V

T-1617
LIST OF TABLES
PageTable I. Venezuelan Iron Ore Proven Reserves-----------8
II. Average Chemical Composition ofVenezuelan Iron Ore -------------------------- 8
III. Reserves of Natural Gas in Venezuela-------- 10IV. Gas Produced by Areas------------------------ 11V. Distribution of Gas by A r e a s ---------- 11
VI. Average Chemical Composition of VenezuelanNatural Gas --- — _— ------------- .-- 12
VII. Iron Ore Companies Operating in Venezuela 16VIII. Indexes of Reduction or Metallization of
Pure Iron ----------------------------------- 21IX. HyL Plant Construction ------------------- 24X. Iron Ore and Sponge at the Puebla Operation— 27
XI. HyL Sponge Iron in Steelmaking------------28XII. Malmberget Pellets - before and after-------- 30
XIII. Operating Costs of the HyL Process ---- 38XIV. Investment Costs for the HyL Process-------- 40. -XV. Operating Costs for the Midrex Process------ 42XVI. Investment Costs for the Midrex Process----- 44
XVII. Screening Between HyL and Midrex------------ 47

T-1617
PageTable XVIII. Investment and Fixed Cost for 350,000
Mt/yr (Midrex)------- *----------- — ------ 49XIX. Sales and Income Forecasts ------ 52XX. Manufacturing Costs ---- *-------- 53
XXI. Capital Requirements ----------------------- 54XXII. Depreciation ------------- — ---------- 55
XXIII. Income Statement ------------- 56XXIV. Cash Flow —-------------------------- 57XXV. D.C.F.R.O.R. ---- — ----- — 59
XXVI. Variable Costs at 70 Percent (Midrex)-------- 62XXVII. Production Analysis ----------- — ----------- 63
ARTHUR LAKES LIBRARY COLORADO SCHOOL of MINES
GOLDEN, COLORADO 80401
vii

T-1617
FIGURES
PageFigure 1. Characterization of Iron Ore and
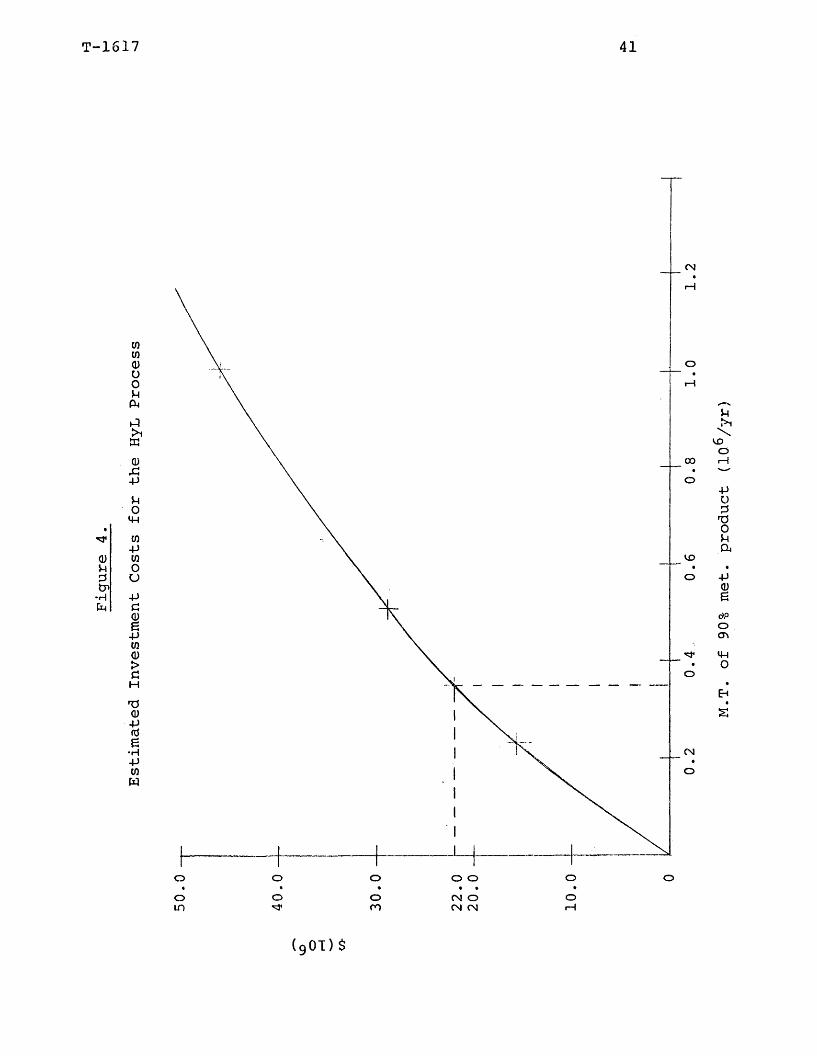
D.R. Process ------------- *------------ 222a. HyL Schematic Diagram -----------------;-----262b. Midrex Schematic Diagram ------------- 263. Fixed Costs of the HyL Process------------- 394. Investment Costs of the HyL Process-------- 415. Fixed Costs of the Midrex Process --------436. Investment Costs of the Midrex Process ----- 457. D.C.F.R.O.R. Graphic Representation ---------60
viii

T-1617
INTRODUCTION
The Venezuelan government is presently engaged in in- creasing the steel production and also improving the quality of the iron ore sold in international markets. To accomplish these two purposes, it has been decided to use direct reduction methods, utilizing natural gas as the source of the reducing agent hydrogen.
Presently several plants that use the direct reduction methodsare under construction in Venezuela. Two of these plants are being built by the Venezuelan government. One of the plants operate with the Hojalata y Lamina Mexican process, and the other one is the Midrex, a German-American process. The reason for building two plants with two different methods of operation is to test which method is the best suited for the existing conditions in Venezuela.
The research done in this work sets off the technical and economical basis on which a selection must be made between the two processes. The scope of the investigation is limited to the two processes under consideration by the Venezuelan government.
1 MTHUR LAKES LIBRARY‘COLORADO SCHOOL of MINES
GOLDEN, COLORADO 80401

T-1617 2
Specifically, the objective is to assemble data from several sources describing the technical aspects of the methods that have a direct bearing on their economics and also to evaluate existing cost and investment data to determine the relative profitability of each process.
The first part of the study describes the availability of raw materials and the reasons why it is better advised to proceed with the method of direct reduction instead of ^
CsS'r/rfAi'
the conventional blast furnace. This part of the study a general presentation of the availability of iron ore, scrap, coal, natural gas, electricity, and other materials such as limestone and dolomite. The reserves and chemical composition of natural gas and iron ore are presented, because the economics .of the direct reduction method are sensitive to changes in the quality of these two inputs.
The following part includes a description of the present iron ore mining and future process developments. This description includes the background and present operating conditions of the two American companies now operating there, the competing processes that are now under construction or at the start-up stages around the same area, and a brief description of the plans to increase capacity.
Several technical factors must be defined next, because they link the technical and economic conditions of the methods

T-1617 3
under study. The operating characteristics of the methods and the chemical and physical characteristics of the end products are presented. Then, it is specified how the latter characteristics affect the operating conditions of the electric furnace.
The next chapter deals with the technical description and comparison of the two methods selected. Subjects such as background, present operating conditions, brief mechanical description, and quality of the end products are dealt with in this chapter.
The price of iron ore is calculated next. The units are $ per metric ton and $ per unit of iron content. What follows are quotations of the operating and investment costs of the HyL and Midrex processes. The quotations were taken from the five years Metallurgical Planfmade up jointly by the Venezuelan government and foreign technicians.
It must be noted at this point that these data have been revised since first calculated. The purpose of this study is not to-calculate investment and operating costs, but to use them to construct the discounted cash flow rate of return and the production function models. The cost information used here by the author was made available to him by the government engineers and other technical personnel.The purpose here is to summarize the technological conditions

T-1617 4
facing the selected method by computing its production function, which gives the functional relationship between rates of input of factors of production and rates of output per time period.
The other study that exists on the economic evaluation of the direct reduction processes to be used in Venezuela is that contained within the Metallurgical Plan. The method of "comprehensive operating cost" is used to calculate a constant capital recovery factor. This factor is then multiplied by the capital cost of the particular project and finally added to the annual operating costs. That is the way in which the processes are compared. Note that the factor used is the same one for all the situations.
Essentially, then, this study is of value because of the following reasons:
a) Other existing technical works are mostly descriptive. Here, technically, the objective is to correlate the most critical technical factors for the selection of a particular process and the quantitative effect of these factors onthe economics of the projects.
b) To present a method with an actual selectivity value, that helps in the economical selection of a specific process among several of the same kind. The basis for the selection is the profitability of the process. This part of the study also contributes to develop the production model that shows the relationship between the ongoing selling price in the iron market and the level of maximum profit where marginalcost equals marginal revenue.

T-1617 5
This study will utilize available data. Where specific data are missing, information from similar plants and different processes will be correlated and related to the specific process under study.
Due to the confidential nature of more recent information, no updating was attempted in the data presented in tables. The existing trends and costs existed through 1974.

T-1617
THE QUALITY AND AVAILABILITY OF THE INPUT MATERIALS
The end-product specifications of directly reduced iron ore in an electric furnace are much more sensitive to changes in the available raw materials as compared to end products obtained from any other classical method of iron ore treatment. This sensitivity must be evaluated starting with the original conditions (i.e. chemical and physical composition) of the raw materials used. For instance, the amount of gangue content in the raw iron ore will go unchanged through all the direct reduction treatment up to the melting of the briquette in the electric furnace.
Theoretical costs calculation can always be made in preinvestment cost analysis using average value. The costs thus obtained do not represent the actual costs of the process when in actual operation. The reasons for that are the existing variations in the chemical and physical characteristics of the input materials which are directly related to the quality of the end product and consequently with the costs of the operation.
6

T-1617 7
CG o f ^ S o o f t ^-■ fir,
The input materials of the direct reduction process are metallized pellets and natural gas. These two inputs make up 88 percent of total operating costs. If we exclude the costs of the iron pellets, natural gas amounts to 34 percent of the operating costs.
The next sections include summaries of the quantitative and qualitative data of Venezuelan iron ore, natural gas, and electricity.
Also included in this section are two short comments about the availability of coal and scrap in Venezuela.
Iron OreThe iron ore reserves of Venezuela are estimated at
2,536 million tons. All of the iron deposits are located at the south-west region of the country officially called the Bolivar State. Some of the areas were given as concessions by the government to American companies and some are classified as national reserves. Table I shows the amounts of reserves and the status of each one of them.
In general the deposits are of a sedimentary origin, mainly hematitic, and to a lesser extent composed of magnetite, limonite, and goethite. Impurities are present in low proportion. Table II shows the average composition of the ore in the main deposits.

1617 8
TABLE IVenezuelan Iron Ore Proved Reserves
Group Name Concessionary Mill. TonsRio Aro National Reserves 150Cerro Bolivar Orinoco Mining Co. 803San Isidro Siderurgica del
Orinoco 821Maria Luisa National Reserves 258El Pao Iron Mines Co. 379Imataca National Reserves 125
Source: Metallurgical Plan, p, 3 8 (adapted)TABLE II
Average Chemical Composition of the VenezuelanIron Ore
Element % Cerro Bolivar El Pao San Isidro*Fe nat 58.91 61.91 62.69Si02 2.13 3.29 2.10Al2 03 1.43 2.64 N.A.P 0.1 0.05 0.15S 0.02 0.01 0.08Ignition loss* 4.98 3.20 5.78Humidity* 7.94 3.45 4.06
Source: Company Reports: Jan-June, 1975* Metallurgical Plan, p. 39.

T-1617 9
ScrapThe production of scrap in Venezuela is limited. The
available scrap comes from the oil and auto incustries. At present the steel industry is consuming an average of 140,000 tons per year. Scrap is sold at about 83 U.S. $ per ton (oral communication, 1974). Therefore, scrap represents a cash outlay of approximately 11,620,000 U.S. $ per year to steel producers. In Venezuela, like elsewhere, scrap prices are subject to heavy fluctuations. A stabilizing effect is therefore to be expected from the use of pre-reduced products for the production of steel.
CoalVenezuelan coals belong to the tertiary period. They
are classified as sub-bituminous to lignite and they are not coking coals. These coals can only be used in the steel industry in combination with higher quality imported coals.
Natural GasSince the beginning of the Venezuelan oil industry in
1912, 17.3 trillion cu. ft. of natural gas had been flared or otherwise vented to the atmostphere in Venezuela. This amount of wasted gas represents 55 percent of the accumulated gross production of natural gas and about 50 percent of the present reserves in the country. In 1971, the proven reserves

T-1617 10
of natural gas amounted to 31.6 trillion cu. ft., and adding the probable reserves, the total amounts to 36.4 trillion cu. ft. Table III shows the classification of the Venezuelan natural gas.
TABLE IIIReserves of Natural Gas in Venezuela
(As of December 31, 1971; mill, cu ft.)Associated Gas (92.09% oftotal proven) 29,383,062Non-associated Gas (7.09% oftotal proven) 2,242,113Total proven 31,625,175Total probable 4,790,825Total Gross 36,426,000
Source: La Salvia, 1972
Also, in 1971, 0.75 trillion cu. ft. of natural gas or 34 percent of a total production of 1.68 trillion cu. ft. were wasted; this is equivalent to 103.2 million barrels of oil or 8 percent of the total oil produced in Venezuela.
By the year 2000, it is estimated that a total of 22 trillion cu. ft. will be consumed in the industrial and domestic markets of the country. Since the reserves amount to a total of 36.4 trillion cu. ft. this leaves a balance of14.4 trillion cu. ft. that presently have no future commercial and/or industrial use.

T-1617 11
c oloeado scnoo,mARYGOLDen c o^ rS o° &
80401
The gas available at Puerto Ordaz, the location of the future steel works, comes by pipelines from the Barcelona and Maturin fields. The relationship among the producing areas is shown in Table IV, which shows the gas produced in 1970 and 1971.
TABLE IVGas Produced by Areas (mill. cu. ft.)
Area Total Gross Produced % of Total1970 1971 1970 1971
Maracaibo 1,015,553 965,406 59.38 57.45Barcelona 611,020 624,687 35.73 37.18Maturin 82,884 89,523 4.85 5.33Barinas 742 636 0.04 0.04Venezuela 1,710,199 1,680,252 100.00 100.00
Source: La Salvia, 1972
The percentages of associated and non-associated natural gas for each region is shown in Table V.
TABLE VDistribution of Gas by Areas (Percent)
AreaMaracaiboBarcelonaMaturinTotal
Associated Gas 67.3 27.7 6.0
100.0
Non-Assoc. Gas 4.0
83.013.0
100.0Source: Tiratsoo, 1967, p. 221.

T-1617 12
Most of the gases are sweet with high contents of methane, ethane, and heavier hydrocarbons, containing occasional substantial proportions of CO2 , but little if any hydrogen sulphide. Table VI shows the chemical composition of the gases available at Puerto Ordaz and that available at Maracaibo.
TABLE VIAverage Chemical Composition of Venezuelan
Natural Gas (Components in percent)
Components Methane Ethane Propane I-Butane N-Butane I-Pentane N-Pentane Hexand Plus HeptanesC02 11.34Specific Gravity 0.734Calorific Value (btu/cu ft) 1005
Source: Metallurgical Plan, p. 46.
Puerto Ordaz 80.22 5.04 2.03 0.34 0.48 0.16 0.13 0,.26
Maracaibo70.6813.126.611.221.890.600.490.220.134.370.802
1275

T-1617 13
ElectricityIn 1972, the installed generating capacity of elec
tricity in Venezuela reached 3,377.8 MW, out of which 1.438.0 MW are generated in steam plants, 907.4 MW as hydropower,756.9 MW in gas plants, and 275.5 MW in diesel plants.
Several new projects have been developed to increase the generating capacity in iron ore regions. All the electricity of the area is and will be generated as hydropower.The new generating capacity of this area will be in the order of 10,705 MW, distributed as follows:
Macagua 1,315 MWCaruachi 1,760 MWTocoma 1,080 MWGuri 6,550 MW
Source: The Metallurgical Plan.
Other MaterialsThe other materials commonly used in the preparation
of steel are limestone, dolomite, and silicon. These minerals are found all over the country in adequate quantities to assure that steel production will not be obstructed.
All iron alloys needed for the production of pig iron have been imported in the past, but there are several projects for the construction of plants to produce these materials in the country. Only five percent of the 60,000 tons per year of refractory material has been imported.

T-1617
PRESENT STATUS OF IRON ORE MINING AND PROCESSING IN VENEZUELA
There are three iron mining companies in Venezuela. One company, Iron Mines Company of Venezuela (I.M.C.O.V.), is a subsidiary of the Bethlehem Steel Corporation, and the other one is Orinoco Mining Company (O.M.C.), a subsidiary of the U.S. Steel Corporation. The third company is Siderurgica del Orinoco.
I.M.C.O.V. started operations in 1950 and all of its output is exported to the parent company's mills in the U.S. The mine is located near El Pao. The installations of the mine consist of a primary, secondary, and a small capacity tertiary crusher. The ore is transported by train (50 Km) to the harbor of Palua on the shores of the Orinoco River.The company is constructing a washing and screening plant at Palua, because the physical and chemical requirements of the ore are becoming more strict.
O.M.C. started operations at Cerro Bolivar in 1954, and it sends about 25 percent of its output to Europe and the rest to the parent company's facilities in the U.S.This company does not have any processing facilities at
14
T-1617 15
the mine site. The ore is transported by train (140 Km) to the port at Puerto Ordaz. In the port area the company has crushing, screening, and drying facilities. In 1973 it started operations of a briquetting plant for the production of one million tons per year (nominal capacity) of86.5 percent metallized briquettes. This plant was constructed under the terms of a joint venture between the owners of the patent, the U.S. Steel Corp., and the Venezuelan government which has the option to buy 25 percent of the plant after two years of operations. The method of production is called the High Iron Briquettes (H.I.B.), and so far the plant has been producing at only 30 percent of its nominal capacity due to technical problems. Both companies, O.M.C. and I.M.C.O.V., use the open pit method of mining.
The third iron ore concession, located at San Isidro, belongs to Siderurgica del Orinoco (Sidor), a subsidiary of a government corporation called Corporation Venezolana de Guayana (C.V.G.y. Also owned by Sidor are the most important steel works of the nation. The steel production of Sidor (approximately 1,160,000 tons per year) represents about 85 percent of the nation's total production. The ore mined at San Isidro is transported by truck (150 Km) to Cuidad Guayana where the steel works are located. During

T-1617 16
the year 1972, one million tons of ore were mined at San Isidro. All of the briquettes so far produced by H.I.B. have been used by Sidor.
Table VII shows the relative importance of these three companies, listing output, domestic sales and exports:
IMCOV OMC GOV TOTAL IMCOV OMC TOTAL IMCOV OMC TOTAL19.0 80.5 0.6 285 20.0 80.0 276 26.0 74.0 10
Sources: Companies reports.
In 1973 a completely independent private concern authorized Arthur G. McGee and Company to begin with the engineering studies to construct a 400,000 metric tons per year (up to 92.5 percent metallized iron ore) plant. The process used is called the Fluidized Iron Ore Reduction (F.I.O.R.), which was developed by the Esso Research Engineering Company.No details have-been published about the progress of the construction of this plant. Similar plants were planned to operate three years after the construction started, and in some cases it took two or three years longer to operate at half capacity. The F.I.O.R. process was tested in a demonstration plant build in Darmouth, Nova Scotia. The capacity
TABLE VIIIron Ore Companies Operating in Venezuela
(Cum. data is up to 1971 in %. Totals in million tons)Production Exports Sales in Ven.

T-1617 17
of the plant was 300 tons/day, and during four years of operation it produced 50,000 metric tons, or 12.6 percent of the operation at full capacity (McGee, A.G., 1973).
The Plans to Increase CapacityThe long range plans to increase the steel production
in Venezuela have been divided in two equal periods of five years each. The first phase of the program comprises from 1975 to 1979, and the second phase from 1980 to 1984.
There are two main ways to increase steel production in a given industry: the blast furnace-basic oxygen furnace(B.F. and B.O.F.) and the direct reduction-electric arc furnace (D.R. and E.A.F.). The goal of the first phase of the program is to increase the total steel production by1,200,000 metric tons per year. Due to the favorable existing conditions with respect to the availability of iron ore, electricity, and natural gas, it has been decided to use the D.R. and E.A.F. processes to increase steel production. It also has been determined that it is more economical to use in Venezuela the B.F. and B.O.F. way, whenever the producion increase exceeds the 5,000,000 metric tons per year level (oral communication, 1974).
In order to accomplish the production increase the following plants will be constructed: a pelletizing plant that

T-1617 18
consists of 2 units of 3,000,000 tons per year each, and 11 direct reduction units for a total of 3,840,000 metric tons per year of sponge iron. The task here is to point out the relevant technical, and to a greater extent, the economic differences between the two direct reduction processes chosen by Sidor, the HyL and Midrex.

T-1617
TECHNICAL FACTORS THAT AFFECT THE SELECTION OF A D.R. PROCESS
The end product of direct reduction is the briquette.In Venezuela the briquettes are going to be used in the electric arc furnaces already in operation, planned, or under construction. The efficiency by which the electric furnace uses the electricity to melt the briquettes is related to the briquette chemical composition. The gangue content requires electricity for its fusion. Also, if some reduction (oxygen removal) must be made, extra electricity must be used in the electric furnace.
Therefore, the methods that produce the briquettes with the highest degree of metallization (lowest oxygen content), has the economic advantage.
The purpose of this section is to summarize the different types of* direct reduction processes, the characterization of the metallized pellets, and the metallized end products— the briquettes.
Also summarized in this section are the reasons why the degree of metallization should be the deciding technical factor in the selection of a specific method in contrast with any other factors.
19

T-1617 20
Table VIII shows how the different terras are defined and used to characterize the metallized products of direct reduction.
The total iron content determines the selling price of the briquette. This content is shown in Table VIII, and it is the basis for the production analysis in the last chapter.
Direct reduction processes can be classified on the basis of the type of iron ore feed, the kind of reducing agent used, the equipment, and the physical and chemical characteristics of the end product. Fig. 1 shows how the iron ore feed, the processes themselves, and the end products are characterized.
Iron Ore and Metallized End Product CharacteristicsFor the conversion of iron ore to crude steel there
are three essential tasks:1. The separation of the iron from oxygen,2 . fusion of the iron and the gangue, and3. separating out the contaminant elements.In the conventional process, combination blast furnace-
basic oxygen steel plant, the blast furnace performs the first two tasks.
In the process combination direct reduction-electric furnace, the direct reduction only takes over the first task.

T-1617 21
TABLE VIIIIndex of Reduction or Metallization of Pure Iron Oxide
Degree of metallization= Fe metal
Fe total 75 80 85 90 95 1 0 0
Degree of reduction= 0 removed
0 max assoc with Fe 83.33 8 6 . 6 6 90.00 93.33 96.66 100
Degree of oxidation= 1 0 0 - deg. red. 16.66 13.33 1 0 . 0 0 6 . 6 6 3.33 0
Composition ofiron-iron-oxidephasesFe total % 93.33 94.5.9 95.89 97.22 98.59 100
Fe metal % 70.00 75.67 81.50 87.50 93.66 100
Fe++ % 23.33 18.92 14.39 9.72 4.93 0
0 % 6 . 6 6 5.41 4.11 2.78 1.41 0
Index 0 % Fe
7.14 5.72 4.29 2 . 8 6 1.43 0
Source: Astier, J.E. , 1973

T-1617 22
FIGURE ICharacterization of iron ores and direct
Reduction Processes
Iron Ore (natural concentrate
or pellets)Characterization
1) Fe2) Gangue
(S i 0 2 , A I 2 O 3 ,3) Contaminants
Sized Ore or pellets
^<SL-RN Krupp)— <HyL Midrex Purofer Armco; (FI OR
------- — Gaseous Reducing Agent
(P, S, Cn,... ...FinesizedoresHIB>-
\ Solid RedAgent
1) Fe1)a) 0 residual
Deg. Red. Deg. Oxi. Deg. Met
2) Gangue3) Contaminants
Characterization Pellets or Metallized „ Ores
(Briquette
Rotary KilnStatic Bed -j- Shaft Furnace Fluidized Bed
Source: Adapted from Astier, J. E., and others.
\w /

T-1617 23
The melting of the iron and the gangue is carred out by the electric furnace, which requires electrical energy for this purpose instead of coke. Also, if some reduction of iron oxide is required this is, of course, possible, but it will lead to the use of carbon as reduction agent and increased consumption of electrical energy (about 35 Kw-hr per 0.010 per metric ton 0 2 )* Otherwise the iron oxide will be slagged off, decreasing the iron yield. A difference of 5% in the degree of metallization represents an increase of
/
35 KWH x 4795 M.T. of 0 x 0.01$ = $167,825.000.010 MT of 0 KWH
in the operating costs of the electric furnace.Gangue content is a direct consequence of the analysis
of the raw materials, and there is no increase or decrease during the prereduction process. Therefore, one of the technical deciding factors that contributes to reach a decision for a particular D.R. method is the oxygen residual or degree of metallization attained by the method.
Summarizing, the prereduction materials to be used in electric arc furnaces will tend to approach residual oxygen in the range of 2.86 index (0/Fe/ton) or less. This means

T-1617 24
as far as possible, degrees of metallization over 90 percent, degrees of reduction over 93 percent, (from Astier, J.E.)
The Hojalata y Lamina Direct Reduction ProcessHyL is a process with more than 15 years of commercial
operating experience. A historical profile of HyL plant construction is shown in Table IX.
TABLE IXHyL Plant Construction (Mexico)
Nominal Cap. Actual % AboveLocation Year (mt/yr) Status Prod. CapacityMonterrey 1955 9,900 1 1 1
Monterrey 1957 75,000 Operating 95,000 25Monterrey 1960 190,000 Operating 260,000 37
Veracruz 1967 190,000 Operating 220,000 15Puebla 1970 250,000 Operating 315,000 26
Bahia(Brazil) 1974 225,000 Under Const. -Monterrey 1972 420,000 Under Const. - -
ImprovementsMade
PilotFlexibilityCold and carburized
Thermalefficiency
Source: Sada, C. G., 1974.

T-1617 25
Co* ^ c* x e s n 0Cor r cnf^OL o ^
Ore reduction occurs in four reactor vessels, which are coupled to gas preheaters and quench towers (see fig. 2a ) Conveyors move the ore from storage bins to charge hoppers.A complete reducing cycle for each reactor requires 12 hours and the stages for conversion are as follows: (1 ) preheatingraw ore with partially spent reducing gas (secondary gas) - 3 hours; (2) reducing the preheated ore to sponge (exposure to primary gas-3 hours; (3) cooling the sponge with fresh, cool reducing gas, 3 hours; (4) unloading the cooled sponge iron and reloading with raw ore, 3 hours.
The quenched gas is heated to above 1600°F when entering the reactor. The reaction temperature may be varied between about 1600° and 1900°F, depending upon ore reduci- bility; therefore, the product is not subject to reoxidation to an appreciable degree.
Since the charge remains stationary throughout the reduction cycle, the degree of reduction within each reaction chamber is not completely uniform at the end of the operation Typically, the final degree of reduction varies from 96 percent at the top to 73 percent at the bottom of the ore bed in the retort. The average degree of reduction varies between 85 and 90 percent. The normal operation of the steelworks at Monterrey had its economic optimum at about 83 percent metallization. Due to the varying degrees of

T-1617 26
r~~~Burner)
( Quench)| PreheatedGas "'s Gas
Reformer
Natural Gas
Iron Oxide Feed
16 00 °F
TypicalReactor160°F
Tofollowingreactor
Gas^QuenciT)- Preheat]— )
FuelGas
Product Metallized Iron
Figure 2a. in the HyL process, the charge remains stationary in'the reactors through the reduction cycle.
Iron Oxide Slurry
Pelletizing Plant
Shaft Indurating Furnace
I
OxidePellets_
fShaft Furnace 1000°F
120°F
Off gas
-Hot Reducing Gas
Product Metallized Iron
Inert gas
\Qoolery
Figure 2b. The Midrex process normally uses an oxide pellet charge which passes downward through a shaft - type furnace.
Source: Both figures from Bertram, J.M., pp. 36 and 37.

T-1617 27
reduction, it is desirable to blend the sponge iron before it is used in steelmaking.
Table X shows the chemical analysis of the iron ore used and the resulting analysis of the reduced pellets at two reduction levels. The 85.1 percent metallization column represents the present operating average of the Puebla plant and the 90 percent metallization column gives the results obtained during periods in which it has been operated at that level.
TABLE XAnalysis of Iron Ore and Sponge Iron at Pueblo Operation
Iron Ore Sponge IronMetallization - 85.1 90.0Total Iron 67.0 87.2 8 8 . 1
Gangue 3.3 4.3 4.4Lime (added) 1.5 1.9 2 . 0
Carbon - 2 . 2 2.2
Oxygen 28.7 2.9 2.0
Source: Sada, C. G., p. 6 .
Table XI shows typical results obtained with HyL sponge iron charge in a 17 ft. dia. electric arc furnace, producing low carbon steel. This performance data reveal a considerable operational improvement over the initial days of sponge iron usage in electric arc furnaces. The Table shows two different charge ratios of sponge iron to scrap, Cases I and

T-1617 28
TABLE XIThe HyL Sponge Iron in Steelmaking
1967___________ 1969________ 1974Case I Case II Case I Case II Case I
Furnace Charge:Scrap, % 45 15 40 15 40Sponge Iron, % 55 85 60 85 60Ingot Yield, % 88 83 91.4 93 92.4Tap-to-tap time, min 320 350 304 320 172Lining life, heats 100 80 120 115 164Roof life, heats 40 30 43 43 55
Consumption per MT of Ingot Produced:Elec. power, Kwh 740 860 680 790 625Electrodes, Kg 7.85 9.65 8.0 9.7 5.Lime, Kg 82 98 82 100 7Dolomite, Kg 10 14 10.5 115 N.A.Magnesite, Kg 5 6 5.2 6.6 N . A.Refractories, Hg 10 12 1 0 . 0 10.4 N.A.Ferro-Alloys, Kg 5.8 5.8 5.8 5.8 N.A.Lab. and Sup., man-hrs. 1.9 2 . 1 1.9 2.0 N.A.
Jource: 1967: Kobrin, 19 69: HyL, Am. 1974: Sada, C.
C.L., p. 75. Correspondent, G., p. 7.
p . 1.2 3 .

T-1617 29
The Midrex Direct Reduction ProcessTwo 4,000,000-ton per year plants are now operating in
the U.S. One is located at Portland, Oregon, and the other one at Georgetown, North Carolina. A third plant with the same capacity is now operating at Hamburg, West Germany. Another plant of this size is being tested in Contrecoeur, Canada. Two 800,000-ton per year plants are under construction: one at Baton Rouge, Louisiana, and the other one atOsaka, Japan (Mashlanka, W.). A seventh plant is under construction in Kostamuska, Finland; its capacity is unknown.
The Midrex process normally uses an oxide pellet charge which passes downward through a shaft-type furnace. The second step in the process is the metallizing of the oxide pellets. The reduction occurs in the upper section of the furnace. As the pellets descend through;-, the metallizing section they pass hydraulically-operated cylinders, using a slow stroke of one-half hour to break up any clustering that may have developed (see fig. 2b).
Hot reformed gas passes counterflow to the bed of pellets which is descending through the upper section of the furnace. The counterflow principle is of particular importance in order to achieve an optimized chemical and thermal utilization of the reducing gas. By means of the hot gas the pellets get heated up and metallized within the range of 6.5 hours while passing through the furnace.

T-1617 30
Until today, the Hamburgh reduction plant has exclusively processed Swedish Malmberget pellets (Mashlanka, W., pp. 17-19). Due to their analysis and their chemical and physical properties, the pellets produced in the shaft furnace from a magnetite concentrate are qualified especially for direct reduction or as metallized iron ore for further processing in the electric arc furnace. Some of the characterizations of Malberget pellets are shown in Table XII.
TABLE XIIMalmberget Pellets-Before and After Direct Reduction (%)
Malmberget MetallizedPellets Product
Fe Total 57.78 92-96Fe met - 91Deg. of met - 95Si02 1.55 2 . 0 0
AI2 O3 0.48 0.70P 0.022 0.025S 0.002 0.010
Source: Mashlanka, W., p. 17, 18.
The chemical composition of the metallized iron ore when using Malmberget pellets appears relatively consistent as indicated by the values shown in Table XII. Typically, the degree of metallization varies from 9 2 to 99 percent

T-1617 31
(94 to 99 percent degree of reduction). After having started with trial operations in October 1971, continuous operation of the Hamburg plant actually began in March 1972. By November 1972, approximately 170,000 tons of metallized pellets were produced.
The carbon content of the metallized product varies between the following ranges.
Campaign A 'aim 0.8% n = 57Campaign Baim 1 .0% n = 88
Campaign Caim 1.2% n = 148Campaign D n = 66aim 1 .6%
Source: Maschlanka, W., and others, p. 20.
The data above and in Table XII show that the chemicalcomposition of the metallized iron ore using Malmberget pellets appears relatively consistent. To mill workers engaged in metallized pellet processing it is of advantage to obtain the carbon required for certain steel grades already continaed in the charged materials (Maschlanka,1972).

T-1617
THE ECONOMIC PARAMETERS
The basic variables needed to make a discounted cash flow rate of return model are: inputs and outputs, sellingprices, fixed and variable costs of production, investment costs, economic life of the project, and income tax rate.
The situation of the iron industry in Venezuela is that of a price taker. The selling price of the briquettes must therefore be competitive in the international markets. The international trade of metallized pellets and briquettes is a fairly new one, and statistical data are nonexistent. Technically, one of the main objectives of briquette production is for it to be a substitute for scrap.
A rational way to calculate the market price internationally will be to compare the amount of scrap substituted by the briquettes and multiply it by the scrap value. This opportunity cost is the first calculation made in this section.
The second part of this section deals with the calculation (by interpolation)of the investment and fixed costs for the two processes under study here.
32

T-1617 33
The costing was made for the Metallurgical Plan by a group of Venezuelan and international engineers. The basis for the calculation were the published data in specialized magazines, brochures of the processes, and other sources of information.
Price CalculationIn order to calculate the selling price of the pellets
for prereduction (oxidized pellets) and the briquettes (metal lized pellets), a method similar to the one used by O.M.C. (O.M.C. Oct., 1973) to calculate the selling price of the 86.5 percent Fe briquettes, will be used here. The calculation is as follows:
{1) Average selling price of Scrap No. 1 in Philadelphia according to the quotations of the "American Metal Market," during the first five days of each quarter ($/gross ton).
(2) The above average times the amount of scrap replaced by one gross ton of pellets.
Amount = (Pellets Fe Cont.) x (Yield in the elec. furnace)(98% Fe in Scrap) x (94% yield in elec. furnace)
Result: Value of the replaced scrap by one gross ton ofpellets ($/gross ton).
(3) Subtract the additional cost incurred in the melting of a gross ton of pellets in place of the cost of melting a gross ton of scrap. [This amount always fluctuates

T-1617 34
according to the performance (e.g. carbon content) of the metallized products in the furnace].Result: Value of the pellets that replace the scrap.
(4) Subtract the ocean freight between Puerto Ordaz and Philadelphia, including the ship unloading charges.
(5) Divide by the percentage of iron content of pellets. Result: Value of pellets (f.o.b. ship) in Puerto Ordaz,
including the Orinoco river toll, that replaces the scrap in Philadelphia ($ per Fe unit per gross and metric ton respectively).
The only available published data for the calculation of step (3) above are the yield of the HyL process: 92.4percent (see Table XI). There are no published data for the calculation of step number 4. Therefore, some appropriate assumptions will be made.
The O.M.C. briquettes (86.5 percent Fe) have an additional cost of $1 0 . 6 6 per gross ton, as compared with the melting of an equal amount of scrap. These briquettes have an ingot yield of 90.7 percent.
The cost data of Tables XIII through XVI (the Metallurgical Plan), were calculated on an equal basis: 90 percentmetallization, a pellet yield of 93 percent, and an efficiency of 90 percent (330 days of continuous operation).

T-1617 35
The iron content of the oxidized pellets will be assumed to be 65 percent, which is the degree of metallization claimed by one of the bidding corporations (Marubeny and Kobe Steel Ltd.) for the construction of the oxidized pellet plan.t.
On this basis, the following assumption will be usedto calculate the selling price of the oxidized pellets andbriquettes:
Ingot yield for the oxidized pellets: 80 percent.Ingot yield for the metallized pellets: 92 percent.Additional cost for the oxidized pellets: $15.00.Additional cost for the metallized pellets: $9.00.Accordingly, the estimated oxidized pellets selling
prices are as follows:(1) Estimated average selling price of Scrap No. 1
for the first quarter of 1974, according to the prices ofthe first five days of October 1973 (Am. Met. Market) $62.90/GT
(2) ($62.90/GTx(65% Fe)(80%) = $3 5 .5l/GT ... (98% Fe) (94%)
(3) ($35 . 51,/GT) - ($15 . 00GT) = $20.51/GT(4) ($20.51/GT)-($4.70/GT) = $15.81/GT(5) $15.81/GT:65% Fe = $0.243/UGT
= $0.247/UMT

T-1617 36
The calculation of metallized pellets selling price is as follows:
(1) Estimated average selling price of Scrap No. 1 for the first quarter of 1974, according to the prices of the first five days of October 1973 (Am. Met. Market): $62.90/GT.
(2) ($62.90/GT)x(90% Fe) (92%) = $56.54/GT(98% Fe) (94%)
(3) ($ 56.54/GT)-($9. 00/GT) = $47.54/GT(4) ($47. 54/GT)-($4.7 0/GT) = $42.84/GT(5) $42.84/GT: 90% Fe = $0.476/UGT
= $0.484/UMT
Operating and Investment CostsThe operating requirements and projected operating costs
for the HyL and Midrex processes are shown in Tables XIII and XV, respectively. These tables were quoted from the Metallurgical Plan and converted to U.S. dollars at an exchange rate of Bs 4.30 per dollar. Also included in these two tables are the fixed annual costs for the two processes. Tables XIV and XVI contain the estimated investment costs.
The quoted investment cost belongs to the production levels of 234,000, 504,000, 1,008,000 M.T. per year. Therefore, it was necessary to make diagrams in order to interpolate the fixed and investment costs for the 350,000 tons per year of production level which is the size of the eleven units to be constructed (See dotted lines in figs. 3 to' 6 ) .

T-1617 37
Fixed Costs for the Midrex process (@ 350,000 tons/yr)=$217,000/yr.
They are:Fixed costs for the HyL process (@ 350,000 tons/yr)
=$280,000/yr.
Investment cost for the HyL process (@ 350,000 tons/yr)=$22,000,000
Investment cost for the Midrex process (@ 350,000 tons/yr)
In the fixed annual costs it is estimated that there is no change in the number of employees*as the production level increases. Labor*and maintenance do increase. According to the authors of the cost estimates, the other fixed cost items (e.g. overhead) are included within the items listed in the tables. At this point it must also be noted that the Venezuelan mining laws do not consider depletion allowance.
The investment cost includes natural gas reforming plant, mineral reduction, control houses, instruments, compressors, raw material handling equipment, end product delivery equipment, and internal mineral transportation equipment .
In figure 5 two extra interpolations are made, but they are related to calculations contained in the following chapter.
*The term employees is used for salaried individuals, while labor is hourly workers.
=$17,000,000

T-1617 38
TABLE XIIIEstimated Operating Costs for the HyL Process
Fixed Annual Costs ($/yr)Prod. Level (tons/yr) 234,000 504,000 1,008,000Employees 55,535 55,535 55,535Labor 140,651 200,930 301,395Maintenance 48,324 69,388 97,049Total 244,510 325,853 453,979
Variable Costs ($/tons of product)
Cost Requirement CostItem Unit $/Unit per MT Fe $/mt :Oxidized Pellets MT 16.08 1.396 22.42Natural Gas m^xlO^ 4.83 0.5886 2.84Electric Power Kwh 0 . 0 1 9.16 0.09Water m^xlO^ 5.81 0.00386 0 . 0 2
Materials $/t. of prod. - - 1.49Catalyst and Chemicals $/t. of prod. - - 0.17
License $/t. Fe met 1 . 0 2 0.824 0.84Total 27.87
Source: The Metallurgical Plan

Estimated
Fixed
Costs
for
the HyL
Process
T-1616 39
o o o o o O
00
o o O 00 o O •in CO CM CN o(e0T)
.35
M.T.
of 90%
met. product
(106/yr)

T-1617 40
TABLE XIVEstimated Investment Costs for the HyL Process
(In mill. U.S. dollars)Prod. Level (tons/yr) 234,000 504,000 1,008,000Equip, and parts 9.30 16.51 27.51C.I.F. 0.70 1.23 2.07Installation and startup 1.16 2.07 3.44Sub-total 11.16 19.81 33.02Mechanical Services 0.93 1.65 2.74Electric Services 0.23 0.42 0.70Buildings and structures 1.16 2.07 3.44Infrastructures 1.40 2.49 4.14Engineering 0.70 1.23 2.07Sub-total 4.42 7.86 13.09
Total 15.58 27.67 46.11
Source: The Metallurgical Plan
Estimated
Investment Costs
for
the
HyL
Process
T-1617 41
(90T)$
M.T. of
90% met. product
(10b/yr)

T-1617 42
TABLE XVEstimated Operating Costs for the Midrex Process
Fixed Annual Costs ($/yr)Prod. Level (tons/yr) 234,000 504,000 1,008,000Employees 55,535 55,535 55,535Labor 80,372 120,558 160,744Maintenance 48,324 69,388 97,049
Totals 184,231 245,480 313,328
Items
Variable Costs ($/tons of products)
UnitOxidized pelletsNatural gasElectric powerWaterMaterialsCatalyst and ChemicalsLicense
Cost Requirement Cost $/unit per MT Fe $/MT Fe
MTm3xl0 3Kwh
m3xl0 3$/t. of prod.
$/t. of prod. $/t. Fe met.
16.084.830.015.81
1.3960.352140
0.01
1.02 0.824
22.421.700.810.061.49
0.100.84
Total 27.42
Source: The Metallurgical Plan

T-1617 43
(£0I) iVS
M.T.
of 90%
Met. Product
(106/yr)

T-1617 44
TABLE XVIEstimated Investment Costs for the Midrex Process
(in million U.S. dollars)
Prod. Level (tons/yr) 234,000 504,000 1,008,Equipment and parts(59.68) 7.95 14.12 23.C.I.F. (4.50) 0.60 1.07 1.Installation andstartup (7.51) 1.00 1.77 2.Sub-total (71.70) 9.55 16.96 28.Mechanical services(5.93) 0.79 1.42 2.Electrical services(1.43) 0.19 0.35 0.Buildings & structures(7.51K 1 . 0 0 1.77 2 .Infrastructures (8.93) 1.19 2.12 3.Engineering (4.50) 0.60 1.07 1.Sub-total (28.30) 3.77 6.73 11.
Total 13.32 23.69 39.
Source: The Metallurgical PlanNote: Numbers in parenthesis indicate percent of total.
See Table XVIII for 350,000 MT/yr.
000
5377
9323
35
58
93537716
39

Estimated
Investment Costs
for
the Midrex
Process
T-1617 45
CM
O
00O
ADO
O
O
OOo o o o O oo o o o • 'CO CN 1—1 o
(gOT)$
M.T.
of 90%
Met. Product
(106/yr)

T-1617 46
ECONOMIC SELECTION BETWEEN THE HyL AND MIDREX PROCESSES
At this point we can make a preliminary selection between the two processes,using the economic parameters studied so far. From the tables and diagrams of the previous section, we can observe that the Midrex method has several accounting advantages. The following differences are in favor of the Midrex process: $63,000/yr in fixed costs, $5,000,000in investment costs, and $157,500 ($0.45/ton) in variable costs. Table XVII shows a summary of these economic varia- bles. The economic life of the project is assumed to be 13 years. For these types of projects, the Venezuelan government requires a 58 percent income tax rate. The depreciation is calculated on a straight line basis as a percent per year on net investment.
Lines 8 through 12 in the screening program consist of the calculations necessary to determine the capital recovery rate (line 13), which can be translated directly into a percentage ROI by reference to the graph in the book by Park, W.R. p. 65. The graph is entered on the vertical axis at the computed capital recovery rate, and the ROI is read on the

T-1617 47
TABLE XVIIScreening between the HyL and Midrex
[350,000 M.T. (yr)]
Item Units SourceLine ___________________ _____1 Average yr/sales $/yr Input2 Direct prod, costs $/yr Input3 Ind. & overhead
costs $/yr Input4 Net investment $ Input5 Economic project
life years Input6 Income tax rate % Input7 Average depre
ciation $/yr 4/58 Total deductions $/yr 2+3+79 Net profits before
tax $ 1-8
10 Income taxes $ 6x911 Net profit after
tax $ 9-1012 Net cash flow $ 11+7 •13 Capital recov.
rate Ratio 12/414 ROI % Graph*
HyL15,246,0007,700,000
280,00022,000,000
1358
1.692.3089.672.308
5,573,6923,232,741
2,340,9514,033,259
0.18315.5
* Park, W.R., p. 65.Source: Line 1: Price (43.56) x Prod. Level.
Line 2: Tables XIII and XV.Line 3: Figures 3 and 5 Line 4: Figures 4 and 6
Midrex15,246,0005,950,000
217,00017,000,000
1358
1.307.6927.474.692
7,771,3084,507,359
3,263,9494,571,641
0.26925.5

T-1617 48
horizontal scale for the appropriate project life. A difference of 10 percent in ROI also favors Midrex. Table XVIII shows a detailed estimate of the fixed and investment costs that will be used in the economic analysis of the Midrex process that follows in the next section (see Figure 6 and Table XVI).
Economic Analysis of the Midrex Direct Reduction ProcessThe selection of the Midrex process, based on the rate
of investment (ROI) calculations done in the previous section is an approximate method to economically evaluate a project.The ROI obtained reinforces the advantages in costs (fixed, variable, and investment) of the Midrex process. It seems to be the more economic method under the conditions assumed by the group that made the calculations in the Metallurgical Plan.
In this chapter a more accurate rate will be obtained by making a detailed financial and discounted cash flow rate of return analysis.
The Financial Analysis: The financial model used (Park,W.R., pp. 238-246) is shown in Table XIX through XIV (Schedules A-F). In every analysis of this type several assumptions must be made. The actual conditions of the project will be known only when it is underway, when the assumed conditions on this preinvestment analysis must be adjusted.

T-1617 49
TABLE XVIIIEstimated Fixed Costs for the Midrex Process
(350,000 ton/yr capacity; U.S. Dollars)*
CostsEmployees 55,535Labor 100,000Maintenance 61,465
Estimated Investment Costs for the Midrex Process (350,000 M.T./yr; in mill U.S. Dollars)**CostsEquip and parts 10.15C.I.F. 0.77Inst, and startup 1.28Sub-total 12.19Mechanical Serv. 1.01Electrical Serv. 0.24Building and structures 1.28Infrastructures 1.52Engineering 0.77Sub-total 4.81
Total ($xl06) 17.00
Sources:* Figure 5** Table XVI and figure 6

T-1617 50
Schedule A (Table XIX) shows that after the plant construction and startup (3 years) continuous operation for 13 years will follow. For the first and second year of operation the production level is assumed to be at 7 0 and 90 percent, respectively, and at 100 percent thereafter. The product's selling price, initially $0,484/1% Fe/MT, increases $0.01 during the sixth, nineth, and fourteenth years since the start of the project. Selling costs are estimated to be10.0 percent of net sales.
Schedule B (Table XX) shows the manufacturing costs.All unit costs, except license, increase 10 percent during the nineth and fourteenth years. The period costs (or time- related charges) stay at $217,000 per year throughout the project's operating life.
Schedule C (Table XXI) shows the capital requirements by years for the project. Year One represents the start of the building construction and equipment assemblage (10 percent of both), also includes 20 percent of the engineering research and development work; Year Two includes most of the actual plant construction, along with additional engineering work; and Year Three sees the completion of the plant, followed by startup and initial production. Working capital requirements in the example are estimated at 10 percent of total manufacturing cost for inventories and at 10 percent of net

T-1617 51
sales for accounts receivable. The capital requirements for years four to fifteen represent only the additional working capital required each year to keep up with increases in sales and manufacturing costs.
Schedule D (Table XXII) shows the depreciation charges for the project. Buildings are depreciated over a 15-year period, and equipment over 10 years. Depreciation charges are computed on a straight-line basis. The rate applied to buildings is 7 percent, and to equipment 10 percent. Buildings have a salvage value of $746,667 at the end of the project.
Schedules E and F (Tables XXIII and XXIV) bring together the data from the previous schedules to provide for the computation of net profit after taxes (in schedule E) and cash flow (in schedule F). Income taxes are estimated at 58 percent of the net profit before taxes. In schedule F, in year 16, the inflow shown represents the return of working capital (year 15), and the undepreciated balance of the building account, upon completion of the project. All other figures are self explanatory.

T-1617 52
xHXwPICQ<Eh
o o00 voV)i—1 ov CM<D fd KrH G o*fd G I Ow G vo CO< ki V.
g O'*CMO rHuUa P0)•H£ GO D o OO CM CMG U • •H (U O'*O'*CM CO CO</> -P• <L>p w £ inw • pfdD ino 0<uT5 u o o
u G CM0 fd tr> CM 1—1Ua G •>. s.
in •H r- CMQ) G rH vo r-g 0 rH o COO Eh <D V *O W rH rHG UH *Hu O oTJ p in o O
g <u Q) CMidS i—ifd CM rHm w r" CM<Di— vo r-rH td P kcd-P CD o COw •H a rH 1—1CM• • id< u pQ) •HrH 4-* G VO inG •H D inTJ G •CD t?1 U co COXJ W Q)U CM -W o\°OO TJi—1 «H'— 0CO o oo o01 o op » >K
•rl in inG rHD CM CO
Pfd(U inin
O O o o ct\ cr>
o o o o
*» *»
i—i i—i
o o o o oo o o o o<y» ^ ^
S, »k ^ K soo oo oo ooO 00 00 00 00O CM CM CM CM
o o o o o oH 1 O'* O'**h ^ ^00 i—I i—Ioo r» r- CM in ID
"5t >5 H rl i—I rH r—I ^i— I i— I rH
CM CO CO00 vo VO• • •o 1— 1rHH 1 H 1
o o oo o o o o o o^ "nJ* *3*
o o o o o o o o o oo o o o o o o o o oHHUJIDIDIO^OHHiovor r''r-r'-r-a'*o* inininiDiDcooocoHH
i—I i—I rl i—I i—I i—I i—I i—I i—I
O O O O O OO O O O O OO O O O O OV >> K SH H ID ID VOo vo r- r-' r-
in in in oo oo oo
rH i— I r—I r—I i— I i— I i— I
O O O O O O O O OO o oS S V ^
VO VO i— I i— Ir- o o00 00 rH rH^ ^ kin in vo voi— I rH rH rH
o o o o o o o o oo o o
O o o o o o oO o o o o o oO o o o o o o
•* ** *» *»> *.
o O o o o o oin m in in in in inCO CO CO CO co CO co
ARTHUR L,COLORADO SCHGi
GOLDEN, COLORADO 80401
S LILRaR* u b oi MINES
o rH cm co ini—I rH rH rH rH i—I

T-1617 53
r-J k k k k, v k k ■ k k k0 rj* 'S ' in in in in in r- r~W G CO LO r—1 rH rH H' VO vo■P G CTi 00CO0000i-* r~ r»W G V k V <k k k. k «. k. k k0 C VO00CTi <T> <T\ o o o o o rH rHU rH iH rH rH rH fH rH
nj • -p -p
o o o o o o o o o o o oo o o o o o o o o o o oO v r O O O O O O O O O O O
r H r H H ' H ’ H ’ O O O O O C N C NrOfHooor r'-r~r"r>-ioioc o o o c o r o o o o o o o o n MNNNMNnnnroronm
XXw pI CQ < Eh
rH
00
0
0 k■Po rHEh IN
(0 0 -P i O inW I G voO G 0 sj*U -H G k
0 0 rH*G S -P voO
•H r0W P 0 in■P 0 *0 0 COW ft 0 G mO x p kU •H 0 in
fe > intn o iHG
•HP rH (NG 0 H*-P -p •O o0 Eh <N«wG •G O0 • *HS 6 H CO
0•• x: Hs •CQ u CN0rH pG W 0
•G ■p p -p0 W 0 0 r -
£ O £ £ 00O U O •W fe H) o
■p•HG •D W
rH CNP rH
S -P •0 0fe g CN
'G0 OW O O
■P G O•H r0 kG 0 inD P
fe CN
P00
C N C N C N C N C N C N C N C N C N C N C N C N
r r t-'-ioioioioioininO O O O O O O O O r H r H
o o o o o o o o o o o o o o o o o o o o
o o o o o o o o o
H H H i—I rH i—I
4->g0g0o0rHft0u
-M • G0gft•HD10uo4-10 O G 0 £ 0 i—I
r—I 0G0CO0G
rHOGH
0■P021

T-1617 54
01■pG o O O o O o O o O01 o O O rH VO co O o O
rH g o o O f t 00 cn vo ft 00rH as 01 •. fe fe fe fe fe fe feCO•P p vo CO vo o VO CTi co in-P •H •H f t CO in vo CT\ f t o 0 2 0 0 0 0 3 0 rHO a p ftH O h ' f CN rH rH 00Eh co tr «. fe fe
u 01 rH CN CO rH cnPS rH rH
HxXwPIw<E*
tHPO-PGa)>grH H
<d •P •Ha w aro u h atr> <oG >
•rl •H 000
AS 01P OO 01& PS01
■PG 0ai 0g a 001 p fep •p 0 0 0•H p 00P cd CNCf •p -p fe<11 G C/3 rHPS 01
grH -P Qid 01 13-P 01 PS■rH >& G cncd H GU •H O O O
•P p O O O•• 01 01 O O Ou 01 01 fe fe fe
G G «5}< CN •N*01 01 •H O rH OrH CU Cn •N* CN *3*p X G fe'O w W rHai4:0 -P O O Ow • G O O O
•p 01 O O O01 g fe fe fe01 f t CN VO CN> •H cn cn cnG P 0 f t 0
H f t fe fe feW rH 00 rH
01rH43 01 O O Ocd f t O O O
•H G O O OO •H fe fe fe01 ra O O Op rH in ^ 00Qt*H CN CN CN01 P feQ P3 CN
Pcd01 1 2 3
0 0 O 0 0 0 0 0 0 0 0 O 0cn cn O 0 0 0 0 0 0 0 0 O CN•N* in in in in in f t ft 0fe fe fe fe fe fe fe •> fe fe fe fe fe
cn m rH rH rH ■N* vr *3* vo vo cncn 00 CO 00 00 ft f t f t f t f t f t f t *3*vo CO cn cn <n 0 O 0 O O rH rH CNfe fe fe fe fe fe fe
rH rH rH iH rH rH rH CNH
0 0 0 0 0 O O 0 O 0 0 0 OCN 0 0 0 O O 0 O 0 0 0 voCN »—t 1—1rH rH VO VO vo VO vo rH rH 00v fe fe fe fe fe fe ■ fe fe •> fe fe fe
f t CN vo VO VO ft ft ft ft ft cn cn COvo f t in in in CO 00 00 00 00 rH 1—l 000 CO in in in in in in in in VO vo CNfe fe fe fe fe fe fe fe fe
r l r l r l r l r - I H H r l 00rHOOOfeoCOCN
r H r H r H r H r H r H
OoooCNO
OOOOCNcn
OOOfeoo00feCN
aS■POEn

TABLE
XXII
T-1617 55
rH0-POEH
VDkDVDVDVDkDVD DVDVDVflVDIDVDVDIDVDVDVDIDVDVDVDVDO O O O C O C O O O O O C O C O C O O O D V D r r r r't 'r r r'i r cxjco C N C N I C s l C N C N C V i C N C N C N C N J i —I i—I
i—I H H H i—I H i—I i—I rH rH
VDVD
•»VDH1
W0oPfd£or—I
r H <po
•H■p<d-Hu0ua'0Q
0 I—I 2 TS 0 ,P O W
■PP— Pw o u £
orH'—-PP0 0£ Oa P•H 0P rHD1 0W PQ
w -Pu P>1 p0uo P
rH
w&>p•HrH 0•H OP PPQ 0
rH0PQ
o o o o o o o o o oo o o o o o o o o oo o o o o o o o o oC N C N C N C N f M C N C N C N C N C N O O O O O O O O O O Io o o o o o o o o oi—I H i—I i—If—I H i—I H i—li—I
O O O O O O O O O Oo o o o o o o o o oo o o o o o o o o oO C O ' D H , C N ) O C O ' D H < C NCNOJCO’tnVOVDt-'-OOOChCOhVDin^rONHOOOoocor^vom'srcocNrirH
r r tv'r r'r r r'tsr r r'V O V D V O V D V D V D V D V D V D V O V O V DV O V O V D V D V D V D V D V D V O V O V D V O
V D V D V O V D V D V D V D V D V D V D V D V DoooooooooooocooooooooocorH rH rH i—I i—I I—I i—I i—I i—I i—I i—I i—1
o co r- o coO CO VD O COO CO VD O COk %. •. «»O CO VD O COo h o ^ in00 VD CM O
^ O CO C* O CO IsVD O CO VD O CO VDVD O CO VD O CO VD
VD O CO VD O CO VD VD CO CT\ O ( N CO •H1 COVO^COHOV^
(NClfNCNfNHHHHH
U00 ^UHDhCDOVOHtMCO^in
iH rH rH rH rH rH

T-1617 56
HXXwPI<&
■pg0b0-P(0•PW0BOOG
w0rHGnS0s:ow
■p•H O o O CN cn 00 00 00 00 00 00 00 00 00 00VW o o O 00 cn cn cn 00 00 00 00 00 m in0 p to o o O cn 00 rH rH rH rH rH rH rH rH vo voP 0 0 k k «. v k * «. k. *Cu •p X "a* CN rr cn o cn cn cn rH i— i rH rH rH CTl cn
rd o rH 00 00 m CN CN CN in in in in in cn cn•P < El CN vo in cn CN CN CN cn cn cn cn cn o o0 **— k k V %2: rH rH rH rH rH rH rH
'
rH in in in in in in in in in in min cn cn cn H ’ r-' C"
0 (0 h - O o o in in in m in in mB 0 ». k •t V •» k. «kO X 1 1 1vo m cn cn <n cn cn cn cn cn 00 00O (0 o 00 00 00 00 rH rH i— i rH rH rH rHG 00 CN vo vo vo cn cn m cn cn in inH k * V k * k k •I*
rH rH rH rH rH t— 1 rH rH rH rH rH
-p ,_„•H o o o cn cn cn cn cn cn cn cn cn cn cn cn<H 0 o o o cn cn cn cn cn cn cn cn cn cn cn cn0 P 0 o o o h * (N CN CN CN p- p~ r - r- CN CNP 0 0 k k k «. *. *. k k k k v kP* m X CN o VOCN CN CN H* sj< 00 000 d o rH oo cn rH rH i—f rH VO vo VD VO VO rH rH■P CQ irt CN vo cn CN cn cn cn CN CN CN CN CN VO VOa) '— k k v. *. k V. k k k V v «. kk2 rH rH rH CN CN CN CN CN CN CN CN CN CN CNk—' — --
-PG o o o
'd 0 o o o0 B o o ow -P k. k kG CO CN O o o O O O O O o o O O0 0 O rH 00Pu > ■r cn voX G k kW H rH i—1
r-~ cn p-~ f" p- p- p~ p~ p- P~ r>vo vo vo vo vo VO VO vo vo VO VO vo1 G vo vo VO VO vo vo vo vo vo vo VO vo0 O V k k k V k k kk k.
P •H o O o 00 00 00 00 00 00 00 00 CO 00 vo voa - P p~ p- p" f" p" p- p- P' 00 cn0 0 CN CN CN CN CN CN CN CN CN CN 1— i I—tQ ■H k k k k k k
O rH rH rH rH rH rH rH rH rH rH
O' O o O O o o o o o o o oG 0 O vo o o o o o o o o o o•H B rH cn cn cn cn • r CTl o
•P -P O v «• * » k k •• •k v. V k.0 0 o o O o cn o o o cn cn cn cn cn2; p G vo cn cn cn cn h*H* H* O O0 H vo rH rH i— Iin in in in in 00 0004 •> k * •k k k v »o 2 3 4 4 cn cn cn cn cn CN CN
tn o o o O O o o o o o o oG o o o o o o o o o o o o•H W cn cn o o o o o o o o o o-P -P k. k. k. k. k k k k k k k knj w O O O ■H* H* in in in in in p-P 0 cn in rH rH rH H* H1 VO VO0 U cn 00 00 00 00 r~ r- r- p" p- p04 kk k. *k k k kk k k k k k kO vo oo cn cn cn
10 10 orH 10 10 11 110 COB 0 o o o o o o o O o o o oO rH , o vo o o o o o o o o o oO 0 o cn cn cn cn n* H* ■VJ*N* •vr cn cnG W «k ^ k k k k k k k k kH o O O H* cn h * H* 00 CO OO 00 00 I—1 rHB O H* O O O 00 00 00 CO CO P~ P~+J O VO cn o o o CN CN CN CN CN tr, in0 P •- V V kk k *. k. k. kk k k k2 Mh cn (NN'N'vrkj'kfNiki'-rji^k#
H H H H H H H H H r H HPcd0JH H C N c n N ' i n v o p c o m o H c N c n N ' i n rH rH rH rH rH H

TABLE
XXIV
T-1617 57
0 > £ o o o rH VO i—1 VO rH vo rH vo o* O'* H 1 rH•H 0 o o o VOo cn CN CN vo rH ino*in r->o p "-P rH o o o O inp- o* vo 00O'* 00r- cn p- rH0 Cm k k k k k V. k k k v k •» «* VrH • vo H’ o 00 in cn rH O* O'* OP rP VO CN 1—1o 00 00 p - p" H1i—i i—1 00 VD iH£ w r^ O'* O O'* CN av o*00 VO 00 O CN VO CNP 0 •» k k k s. •» k k k - k v> K.U U rH CO p- vo m CN o in cn rH cn in rH
1—1rH rH rH rH rH - '—' v—' ' i—1
s o O O O'* in in in in m in in in in in in p-0 o O O cn in r-'- o o in 00 in in in CN CN vorH o o O O'* vo 00 00 00 CN 00 00 00 00 vo cn-P Eh *k k v k> k kk k k* kk I** kk kk V •k
0 vo 00 vo 1— 1CN rH 1-1 rH in O'* O'* O'* O'* 00 CN2 £ p- 00 in o i— 1 CN o O o CN CN CN CN p"
W p-* rH o rH p~ CN in in *— iCN CN CN CN CN cn in0 k k fe. kk k k. kk kk kk k* *. k kkU rH CN cn I—1CN CN CN CN CN CN CN CN CN CN cn
O o o o O O O O£ O O o i—iVO cn O O
£ in £ O O o t-" 00 O'* VO r-~O 0 0 kk V k K k*— 1 U rH VO 00 vo o vo O'* o O O O O o cn O OEh MH p- CO in VD CT\ p- CN cn•P -P p~1— 1o P" CN rH *—I.P 0 P k. V kk kW s o rH CN cn 1-10 i—1O
EhCT* in in in in in in in m in in in p-0 -p H 1 *— i o o o in in in in in cn CN vo
rH in VO in 00 00 00 00 00 00 00 00 cn cnP 0 £ k k k k k k k ' k k kCJ 0 O o o CN O'* *— i i— I rH cr> CT* CP* O'* O'* 00 00 CN
0 rH VO o o o o CN CN CN CN CN p- p« H 1£ •P MH 00 CN in in in CN CN CN CN CN m cn ino 0 P k k k k. k V k k w *•w S H rH CN CN CN CN CN CN CN CN CN CN CN cn
PO*H-P0•Ho0uQa0Q
'JDVOkDVOVDVOVDkOy)AD O Dl O V D V O l O V D l O l O l O l O l O V D V O
O O O O O C O O O O O C O O O O O O O O O C O V O V O Or-r r r-r r-r-r-r-r-oocoC N C N C N C N C N C N C N C N C N C N r H r H
I—li—I r H r H r H i—lr—li—I i—I I—I
m fd O EH U Pi u 0■p kp0 MM53 <
OOOCMOOOOOOOOOOOOOOOOOOOOOO.o o o o o ^ r o n n c o c o o o o o o o L n mO O O O'* OO i—I rH rH i—I i—I i—I rH i—1 VO VC
^ N ^ r o o r o r o n H H H H H m ^ oOrHoooorofNCNCNinLnminma'icn^CNU)lf)0*(NfM(Na*(r*0*C^(T*00^ k k k k
rH rH i H rH rH rH i—I
U00>H H(NnH,inu)hooa*oHfNro^m*flrH rH i—I f —I rH rH rH

T-1617 58
Discounted Cash Flow Rate of Return Analysis: Theprofitability index (or DCFROR) of the project is calculated as shown in Table XXV and figure 7. The present worth of the net cash flow is calculated at 6.5 and 6.0 percent discount rates. In order to avoid a trial and error calculation the following equation has been deduced by straight triangles from figure 7.
b-a = x-a y+z y
from which,x = a + y (b-a)
y+zand substituting,
x = 6 + 270,935 (0.5) = 6.24%270,935+293,531
This interest rate represents the highest rate at which the required capital can be borrowed and paid off from the cash earnings generated by the project over its economic life The balance of $4855.00 can be regarded as small as compared with the yearly cash flows.

T-1617 59
Year12345678 9
10111213141516
Balance
TABLE XXVDiscounted Cash Flow Rate of Return
Discounted at Discounted at Discounted at_____6.5% 6.24% 6.0%______
(1,671,687)(1,667,606)(10,745,663)(2,529,907)
79,2401,250,0341,522,7271,609,9271,511,6691,194,4231,187,9021,115,4011,047,325
983,403929,500924,756
1,293,338
-293,531
(10,798,323)(2,548,527)
80,0181,265,4051,545,2231,637,7101,541,5191,220,9901,217,2961,145,7981,078,4991,015,154961,858959,291
1,344,921
-4,855
(1,675,472)(10,847,277)(2,565,877)
80,7451,279,7961,566,3341,663,8431,569,6631,246,0971,245,1391,174,6601,108,1701,045,443
992,800992,392
1,394,479
270,935

Graph
to Obtain
DCFR
OR
T-1617 60
(s0TX$) luasajd
Discount
Rate

T-1617 61
The Production Theory Analysis: The financial and rateof return analyses consider the development of the project through time. The production analysis determines the efficiency by which the input factors (natural gas, chemicals, and so on) are being used within the process. This analysis results also in an optimum economic level of maximum profit, according to the existing market conditions or selling price of the end product.
Only two data points are available for the calculations. One is at 90° and the other at 70° of metallization. Moreover, the 70° of metallization data corresponds to a different model of plant than the one at 90°. Although not a realistic data, it is the only information available to develop the model that shows the relationships among the costs of production, market selling prices, profits, and the technical efficiency attained by the factory under study here. Table XXVI shows the variable costs for an operation at 70° metallization.
The following column references are addressed to the Table XXVIIT entitled production analysis.
The natural gas consumption was estimated from tables XIII, XV, and XXVI , column 1.
The iron ore used by the direct reduction plants comes in the forms of oxidized pellets, with an average degree of metallization of 65 or an approximate iron content of

T-1617 62
TABLE XXVI Variable Costs for the Midrex Process (70% metallization and 350,000 MT/yr)
Cost Requirement CostsItems Unit $/Unit Per MT Fe $/MT F<Oxidized pellets MT 16.08 1.327 21.34Natural Gas m^xlO^ 4.83 0.251 1.21Electric Power Kwh 0.058 100.0 0.58Water m^xlO^ 5.81 0.010 0.058Materials $/t. of prod. 1.49Catalysis & Chemicals $/t. of prod. 0.07License $/t. Fe met. 1.02 0.609 0.62
Total 25.37
Source: The Metallurgical Plan.

TABLE
XXVI
I Producti
on
Anal
ysis
T-1617 63
<— U • l» IHOS — SH W W •— </>•<3
cn cn t 0 0 CN o 00 o 0 o\ co VO 0rH ID o\ cn CN CO 00 0 0 id CO cn 0 00 o m H. • . . . . . A . • . . • • . . r .CN cn 0 co Of o CN CO in r» 03 o CN 0 10 00 o
0 0 0 0 in in in in in in vo V0 10 10 VO
0< </>
— \o\ — Eh' " P < n a w
<s
— U cn Eh00 > — S— <.jlv \
0CO
ov CN VO CN CN rH t-HCO CN CN fH »H O cn 0\ 00CN CN CN CN CN CN rH rH rHO O O O O O O O o. . * • . . . . e .o o o o O o o o o
o •0 CTV <0 o in rH VO 0000 <0 10 \0 in in 0 CNfH rH rH rH rH rH rH rH OO O O O O O O O O» . . • • . . . .o o o • O o O O O o
o CN in 01 0 ON 10 0 cnIs- rH in ON 0 CO cn 00 cn. . . . . . . • .ON O o o rH fH CN CN cntH CN CN CN CN CN CN CN CN
CN cn in 00 CN t" 0 rH oCO cn ON CO ON 0 O 10 CN. . . • . . . . •cn 0 0 in in 10 t". 00CN CN CN CN CN CN CN CN CN
o o o o o O o o o o o o o o o o O Oo 0 o CO 00 cn CN 00 i0 0 vo in V0 0 0 00 CN O0 o vo CN o 0 rH 0 vo r- ON 0 cn 00 o 0 VO 0fe fe fe fe fe fe fe fe - fe *• * *■ *- A.
— U in 00 ON io rH cn ON VO o CN ON f" 0 ON CN in ON ON CN10 Eh r-~ OO o cn 10 ON 0 o VO CN o ON CO ON o CN in O•— CO + ■CO- cn in CO o CN 0 o CN in 00 o CO V0 o CO VO O
% % fe fe fe fe fe fe fe * * A. fe0 in in in io 10 vo vo r» f* r>- r~ 00 00 00 ON ON ON o
rH_^ o o o o O o o o o o o o o o O O O OrH o o o o o o o o o o o o o o O O O O
— co o o o o o o o o o o o o o o O O O Orn cj * fe fe tfe fe fe fe fe * A-
X co r* r> r~ r>- t'* : r~ r~ r r-~ r-rH fH rH rH fH rH fH rH rH rH rH tH tH f—i f—i tH rH H
CN CN CN CN CN CN CN CN CN' CN CN CN CN CN CN CN CN CN CN
O o O O O o O O O O O O o O O O O oO 0 O CO 00 cn CN 00 VO 0 VO in V0 0 0 00 CN o0 o 10 CN o 0 rH 0 V0 ON 0 CO OO O 0 VO 0
fe fe fe fe fe fe fe fe fe * * A- *•*—fe rH CN ON 0 10 CN ON cn in CN o r~ CN in 00 CN CN in0 U 10 t- 00 rH 0 00 CN 00 0 rH ON 00 rH 0 COv-r > co- rH cn in 00 o CN in r'- o cn in 00 rH 0 f" rH 0
fe fe fe fe fe fe fe fe * * A- * %in in in in 10 VO 10 id r- r« CO 00 00 ON ON ON
1 O O o Oo O O o O0 c • O O o Ocn & ro 0 EH * * «.o •H • CN CNU 4J 2 VO vo04 CN CN CN CN
o O O O O O o oo o O O O O o oo o o O O o o ofe fe fe fe fe *• A.
CN C" CN [''■ CN CN00 00 ON ON O o rH rHCN CN CN CN CO cn cn cn
o o o o o oo o o o o oo o o o o Qfe fe fe fe v feCN I" CN tH- CN I-HCN CN cn cn 0 0cn cn cn cn cn cn
CN X A 4J W<0 crt e 6 <u
o O O O O O O O O O O O O O O O O Oo O O O O O O O O o O O O O O O O Oo O o O O O O o O o O O O O O O O Ofe fe fe fe fe fe 'fe fe fe fe fe fe fe fe fe %
r~ fn r~ r** (H fn t-* l-H [-H tH r- [H- rnrH rH rH rH tH rH rH rH tH rH rH rH rH rH tH rH rH rHCN CN CN CN CN CN CN CN CN CN CN CN CN CN CN CN CN CN
0 0)X -P den flj o e 2:rH o o 0 vo ovCN in r~ o\ CN vo cnCN CN CN CN cn cn 0
217,000
349,500
9k960,750
217,000
10,177,750
0.0351
28.50

T-1617 64
rHflj•P0)
— £ *-*o OPCN . kr— Cn
Q)QVU*
rk fH ,-fe© n) OPpH 4J k-rw 0
£h
© r- 10 O kP r~ rH kp CO CO t—i in CO CM 10 on CM CM in© cn n* CM 10 o in cn cn r~ CM 10 o in cn cn CM cn• 9 t • . • • • • • • • • • • • • • • •
kp o in rH 10 CM tk CM CO cn on kp o in o io rH r> oirH rH CM CM m cn ip kp in in io 00 CO cn cn cn
10 cn iH |k o m 10 cn rH kp r» o cn 10 ON rH kp voCO CM h* rH in o kp CO CM r-' rH in o kp CO CM |k rH 00• • • • 9 • • • • 9 9 9 • 9 9 • •
co t'- ON o CM cn kP vo tk cn o CM cn kp vo r~ <n cnr- n> n* tk CO 00 CO CO 00 00 00 ON ON cn cn ON ON ON ON
u>©9
CO cn in cn © © CM © CM 'S' CM © © © CM fk © O ©00 10 kp o © pH CM CM © pH rH © CM in © pH © O O ©w e » to- 9 9 9 9 9 9 9 9 9 • • k • • 9 • 9 9kp £ II VO m cn CM pH © tk © in CM rH © r~ © © CM o pH
04 CM CM CM CM CM rH pH pH H pH pH 1
o © o o O O o o o o O o © o o O O O O10 CM © CM ON <3 * © o HP © CO © © © © 'S' o CM r-kin cn kP m © CM HP © hp rH o © CM © CM © © ©
9 * fe % * fe fe k k k k k k k k k k k k00 kp 10 rH ON O tk cn rH CM © CM © © © © © r-k ©VO CO rH kp © t" tk © *3* i—1 TO cn © CM © r'- CO © ©
r- co in CO © o rH CM cn sr ID © © © r~ tk tk I-k r-~ r-krH K ll 00- *. *. * % fe k k k k k k k k k k k k kkp 04 CM CM CM CM cn cn cn cn cn cn cn cn © cn © © © © ©
•d<u pH pH rH pH pH pH pH pH pH pH pH rH pH pH pH pH pH pH pH3 to O © O O O O O O O o o O O o O O O o OC ‘H VO CM CM CM CM CM CM CM CM CM CM CM CM CM CM CM CM CM CM CM•H W in t" in cn pH © r" © cn pH © r-~ in cn rH © r-k © © r-k■P tH 9 fe fe k k k k k k k k k k k k kC rH CO CM in © rH © © © CM © n- o cn © © pH r^ o rHO «5 V0 VO o cn cn r~ rH © O 'S' © cn rH © o 'S' © ©U VO to cn cn © ON cn © o cn r- o cn r- o hP rH 'S' r-k ©
< rH 02 ll to- * fe t. k k k k k k k k k k k k k k-—■£-1 Or r~ © © © © © o o o pH rH rH CM CM CM © © © ©
HH Co rH rH rH rH pH pH CM CM CM CM CM CM CM CM CM CM CM CM CM> -HX -M VOX O
3 CO '3' CM 'S' 00 © |k* o ©w 'd M 1 pH © in CM © HP © rH ©l3 0 in kp cn in r*» rH pH © pH © © 9 • • • • • • • •ff> V-l r l C W - to- cn © '3* © CO © HP © © rH CM Hp © tk o pH '3* ©04 — * £ II . 9 9 9 9 9 9 9 9 9 rH pH pH i—1 i—1 CM CM CM CMEh 04 CM o o pH CM kp © r^ © 1 1 1 1 1 1 1 1 1
© o O O O O O O O O O O O O O O O O O O'S' CM © CM © kp © O kP © © © © © TO kp O CM CM
pH r~ © pH © © CM pH CM kS* © © tk © © © CM O'S' fe fe fe fe fe fe k k k k k k k k k k
Pk kS* o pH © kP kp O © kP kP © © © © © © © © © rHkS* </> r-k © © m © © O © pH © © CM kP © © kp CM ©rH II </> CM CM © CM CM CM CM CM pH pH o © © © tk © © ©kP 0, fe k fe k fe k k k k k k k k k k k
© © © © © © © © © © © © © © © © © © ©_ o O O o o O o O O O o o o o O o o o o© CM CM © CM CN CM CM CM CM CM CM CM CM CM CM CM CM CM {kkP © © rH '3' rk O © © © CM © TO pH kP tk O © © Ik9 «9_ * fe fe fe k fe k k k k k k k k k k k
kP © O © © t" o CM kp © © rH © © © O © © tk ©r-k kp kP r-k © rH © © © O CM k3> |k © rH © © CO o CM ©© to- © TO O © © Ik © CM kP © CO o © © Ik © CM kp ©.rH P5 II </> v fe 9 fe fe k fe k k k k k k k k k k kk-r fH 0| pH pH CM CM CM CM CM © © © © kp kp kP kP kp © © ©
rH rH rH pH pH pH rH rH rH rH _ pH pH rH pH rH pH rH rH pH
© © © fk rH © O fk © © © kp © © CM © © © CM© © © |k CM © rH © O © O © O © rH © CM CO pH
9 9 9 9 9 9 9 9 9 • 9 9 9 • • • • • 9
o o rH pH CM CM © © kP kp © © © © tk fk © © ©CM CM CM CM CM CM CM CM CM CM CM CM CM CM CM CM CM •CM CM
©^ E-.r-l U *1* £\in </>■a
© © © © o © © rH © tk © © kP kp kp kp © © .HCM pH © © tk © kp © rH O © ro tk © © kp © CM CM© © tk rk tk Ik |k |k tk tk © . ^ © © © © © © ©
9 9 9 9 9 9 9 9 9 • 9 9 9 9 9 9 9 9 9
o o o o o o o o o o o © o o o o o o o
C 0 L 'C ZABC- r 5ES° 0 “ ^ ® S S o « « ® S

T-1617 65
91 percent. Therefore all the calculations below 64.65 degrees of metallization (90.57 Fe total) were estimated, (columns 19 and 20). The relationship between degree of metallization and total iron content was assumed to follow a straight line relationship. The following straight line equation was obtained with a coefficient of correlation of 0.9997. The values for the equation were taken from Table VIII:
y = 3.80 x -279.62 where x represents the total iron content and y corresponds to the degree of metallization attained by the end product.An exponential relationship was assumed between the degree of metallization and the variable costs. The following exponential equation was obtained with a correlation coefficientof 1.0000. Values from Table XV and XXVI are:
y = 19.33e°•°039xwhere x represents the degree of metallization and y theaverage variable cost, (column 8 ) .
In order to construct the general model, a short run analytical period in which at least one factor of production cannot be varied was assumed.
Columns 2 through 6 are self explanatory. The intervals in column 3 were chosen to be constant, so as to make the comparison realistic on a per unit basis.

T-1617 66
Column 7 is the average productivity of the variable factors, or how many iron units are produced by each dollar of the variable inputs. The average variable costs (8) increases as the average productivity decreases. An analogous relation exists between the marginal productivity (9) and the marginal costs (10).
Therefore, what we have here is a case of decreasing returns to the variable inputs. The reason for it is because the input factors are the only variable here at an assumed fixed price per unit of output. So that when the average productivity falls, the cost per unit of output (AVC) must increase. Likewise, when the marginal productivity of inputs decline, the extra costs per unit of output (SMC) must rise.
Fixed costs being constant, AFC (column 11) continuously declines as output is increased.
Column (12) represents the cost per unit of output, and it equals AVC + AFC.
Columns 13 through 18 show the method of obtaining the price levels at which the final end product must be sold for profit maximization. Columns 13, 14, and 15 are based on the going market price of $44.46/1%/Fe. Columns 16, 17, and 18 are based on the profit maximization price of $68.56/1%/Fe.

T-1617 67
Column^ 13 and 16 of total revenues represent relevant price times quantity. This will appear graphically as a straight line from the origin with slope (MR) equal to price.
Columns 14 and 17 show the profits (TR-STC) obtained at the two mentioned prices. The maximum profits correspond to those points where P = MC = MR. That is, where the slopes of the total costs and profit curves are equal. This can be clearly seen by the tendency of the values and also at the zero values obtained in columns 15 and 18, respectively. Beyond the zero marginal profit the slope of the curve becomes negative, indicating that the maximum point has already been reached. .

T-1617
CONCLUSIONS
The required raw materials for direct reduction are plentiful and easily available in Venezuela. The three iron ore mines that are presently under exploitation have proved reserves of 1182 million tons. At the present rate of extraction of 25 million ton/year, these reserves will last for 48 more years. Several tests had been run in different direct reduction plants under different processing conditions. The results have proven the suitability of the Venezuelan ore for this type of processing. However, these tests were run with the ore now available (see Table V), which is of prime quality. The variations in the chemical, mineralogical, and physical characteristics of the mineral must be closely controlled. This control will determine what magnitude of variations in the properties can the process under consideration tolerate without totally failing to produce quality product.
The HyL and Midrex processes use an average of 400 cubic meters of gas per ton of product. The plans of the Venezuelan government call for an increased capacity to 3.8 million
68

T-1617 69
tons per year of reduced iron. Thus, the higher capacity will utilize approximately 5 percent of the available natural gas with no apparent future use. The gas available also has the advantage of not being associated with oil production, since it will come from the Barcelona region where83.0 percent of the gas produced is non-associated. If we omit the cost of the iron pellets, natural gas represents 60 percent of the variable costs of production. The economics of the entire process is thus essentially determined by the reducing gas. Therefore, a strict quality control must be applied with the reforming natural gas continually. This control will assure stoichiometric ratios of oxidation agents and hydrocarbons to be converted so that no wastingoccurs due to improper mixing of reagents.
The two competing processes considered here, the HyL and Midrex, show noticeable differences in their historical background and present status of operation. The HyL process has a well established scaling-up trend since 1955. These plants that are not in operation, with a combined capacity of 705,000 MT per year are all operating at above-capacity levels. HyL plants under construction presently represent a capacity of 645,000 MT per year and they will increaseoverall total to 1,350,000 MT per year. The pilot plant andscaling up consideration for the Midrex method are less

T-1617 70
easily available. The plants currently operating under the Midrex patent have a combined capacity of 1,200,000 MT per year. No statement was made, however, of their actual production or duration of operating. Midrex plants under construction or in the stage of testing have an added capacity of 2,000,000 MT per year, and another plant of unknown capacity is under construction at Finland. The overall Midrex capacity will total at least 3,200,000 MT per year or approximately 150 percent above HyL capacity.
The pilot plant operating conditions must be known to determine the confidence level when evaluating the performance of the plant proposals at industrial production levels. Not all the problems are noticeable in a small-scale pilot plant, unless it is run for a sufficiently long duration on a continuous basis.
The final end product is to be utilized in the electric arc furnace. The economic utilization of the electric furnace is highly sensitive to the chemical and physical characteristics of the metallized products. Both direct reduction methods produce a solid product and also do not reduce the gangue content. The contaminant elements such as phosphorous sulphur, copper, etc., continue to be present even after the product goes through the furnace. The difference of the end product quality exists in the oxygen residual

T-1617 71
and the’carbon content. A low oxygen residual will require less carbon for reduction and thus decrease the electrical energy consumption.
The Midrex direct reduction process has a higher average degree of reduction, or conversely, a lower degree of oxidation average. The carbon that must be added for steelmaking is shown on Table X and p. 31 for the Hyl and Midrex processes, respectively. The product quality is more consistent and better controlled with the Midrex method. In fact, due to the varying degrees of reduction in the HyL method, the product must first go through a blending procedure in order to achieve the required uniformity. This is due to the stationary status of the material during reduction with HyL, as compared to the continuously downward movement of the charge with the Midrex process. However, relatively few publications are available on the behavior of the Midrex product in steelmaking as compared with the several published reports of the HyL product (e.g. the ones in Table XI) .
The basic chemical and thermodynamic principles are essentially the same for both methods. Both methods use reformed natural gas converted to hydrogen for the reduction process. Both methods have provisions for the recycling of the hydrogen, because it is not possible to utilize all the hydrogen introduced in the reactor the first time through.

T-1617 72
The HyL, method operates between 1600 and 1900° F, and the Midrex method operates above 1000° F (not specified). The discharge temperatures are 150° and 120° F for the HyL and Midrex, respectively. A complete reducing cycle within an HyL reactor requires 12 hours as opposed to 6 . 5 hours with the Midrex method. Processes in which the reactions and transfer rates are slow will always cost more to build and to operate than those in which the reaction and transfer rates can be speeded up. These increased expenses are reflected in the investment and operating figures shown for HyL in Tables XIII and XIV.
The screening program in Table XVIII shows a definite economic advantage of the Midrex over the HyL process. The two methods' direct and indirect costs, and the net investment are compared on an equal basis of yearly annual sales, project life, and income tax rates. The calculation of items seven through twelve result in a higher capital recovery rate and rate of return on investment for the Midrex process.
The financial, rate of return, and profit maximization analyses result in a very low rate of return and a relatively low operation level with respect to the maximum profit conditions .
The average variable costs per unit of output (AVC) increase due to the decreasing productivity of the inputs.

T-1617 73
Likewise, the rate of change of total cost with respect to changes in output (SMC) is also increasing due to the decreasing marginal productivity of the inputs. Where the marginal productivity of the inputs equals zero total productivity of the inputs is at a maximum.
After this point, further utilization of the inputs factors becomes redundant. In our case, this point is between 97.22 and 99.96 degrees of metallization. This will be the optimum technical position, although practically it cannot ever be achieved. The exponential equation used in the text will still give theoretically valid values at 100° of metallization. With more data available, the actual shape of the curve could be better determined.
The economic optimum at an assumed selling price of $68.56 is between the 91.79 and 97.22 levels of metallization. According to the difference between the profits at these two levels of metallization, which is only $20.00, it is safe to assume that profit maximum is at the midpoint, or at 94.5° of metallization.
The going market price shows a hypothetical optimum of below a 10 percent degree of metallization. Below the 65 percent level, the behavior of the input factors and the quality of the end products is estimated, and they are presented here in order to compare the two situations.

T-1617
BIBLIOGRAPHY
Agarwal, J.C., (no date), Use of process analysis for evaluation of production of metals: Ledgemont Laboratory,Kennecott Copper Corporation, p. 249-261.
American Correspondent, 1969, Direct reduction of iron ore by the HyL process: Steel Times, v. 197, p. 121-124.
Astier, J.E., 1973, Prereduction: is it the total answer:Journal of Metals, v. 25, p. 62-66.
Bertram, J.M., 1972, What-how-who-where direct reduction:Iron and Steel Engineer, v. 49, p. 391-400.
Chase, P.W., and McBride, D.L., 1963, Present and futureof direct reduction processes in Latin America: BlastFurnace and Steel Plant, v. 51, p. 868-897.
Kalla, U., and others, 1971, The direct reduction processes for iron ores with regard to their sources of supply:Stahl and Eisen, v. 91. Germany, Henry Brutcher translation, 16 p.
Kobrin, C.L., 1967, New life for the HyL process: The IronAge, v. 199, p. 74-76.
La Salvia, H.P., 1972, La situacion nacional del gas natural (National situation of the natural gas): Ministerio deMinas e Hidrocarburos, Carta Semanal, February, Caracas, Venezuela.
Levenson, A.M., and Solon, B.S., 1971, Essential Price Theory: New York, Holt, Rinehart and Winston, Inc., 344 p.
Mackenzie, J., 1969, The future role of directly reduced iron:Journal of the Iron and Steel Institute, V.207 , p. 765-771.
Maschlanks, W., and others, 1972, Sponge iron production and use by Hamburger Stahlwerke GMBH: A summary of thepapers presented at the International Symposium on "Direct reduction of iron ore", Bucharest, Romania, 37 p.
74

T-1617 75
McKee, A.G., 1973, Prereduced iron ore by the ESSO-FIORprocess: Illustrated brochure, Cleveland, Ohio, 9 p.
Meadowcroft, T.R., 1973, Silica: The hidden cost: Journalof Metals, V. 25, p. 67-68.
Midrex Corporation, 1975, Midrex direct reduction process: Illustrated brochure, Charlotte, N.C., 16 p.
Oficina Central de Coordinacion y Planification, 1973, Informe No. 10. Procesos de reduccion directa o metalizacion (Direct reduction or metallization projects. Report No. 10), The Siderurgical Plan, 1970-1985, Caracas, Venezuela, 71 p.
Orinoco Mining Company, 1972, Written communication.Parish, A.R., and others, 1971, Factors affecting the future
location of iron and steelworks: Journal of the Ironand Steel Institute, Vol. 209, No. 6, pp. 420-442.
Park, W.R., 1973, Cost engineering analysis: New York,John Wiley & Sons, 308 p.
Pollock, N.C., 1969, Management sciences in the iron and steel industry: Journal of the Iron and SteelInstitute, Vol. 207, No. 6, pp. 720-724.
Sada, C.G., 1974, The HyL direct iron ore reduction process: Skillings' Mining Review, V. 63, p. 1-7.
Scorticci, A., and Polazzi, A., 1960, Non-traditional processes for iron-ore reduction: Journal of the Ironand Steel Institute, Vol. 198, No. 7, pp. 267-278.
Tiratzoo, E.N., -1972, Natural gas: A study: BeaconsfieldScientific Press, 400 p.
Unknown, 1969, First full-scale iron-ore pellet plant isnow producing 9 5 percent metallized product: Engineeringand Mining Journal, V. 170, p. 68-71.