TECHNICAL BOOKLET
40
TASTING GUIDE: Tools to integrate organoleptic quality criteria into breeding programmes Authors : Camille VINDRAS Nicolas SINOIR Frédéric REY Aude COULOMBEL Bruno TAUPIER-LETAGE TECHNICAL BOOKLET 11 FACTSHEETS Recommended tests How to prepare the samples How to analyze the results
-
Upload
khangminh22 -
Category
Documents
-
view
2 -
download
0
Transcript of TECHNICAL BOOKLET

TASTING GUIDE:
Tools to integrate organoleptic quality
criteria into breeding programmes
Authors : Camille VINDRAS Nicolas SINOIR Frédéric REY Aude COULOMBEL
Bruno TAUPIER-LETAGE
TECHNICAL BOOKLET 11 FACTSHEETS
Recommended tests
How to prepare the samples
How to analyze the results

TABLE OF CONTENTS
CO
N
T
E
N
T
S
1. Initiation to sensory analysis 3 2. Integrate the sensory criteria in the breeding process 4 3. Integration of implicit knowledge: an example on bread 7
TECHNICAL SHEETS
4. Characterize a product: the Ranking test 9 5. Understand and check consumers’ preferences 12 6. Characterize a product: sensory profile 15 7. Factor impact study: the Napping test 17
PRODUCT SHEETS
8. Uncooked products: TOMATO (example) 19 9. Cooked products: BROCCOLI (example) 23 10. Processed products: BREAD (example) 28
11. Installation and use of the R software: SensomineR and FactomineR packages 32
ANNEXES
Glossary 34 Barometers and descriptors 36

1
■ How to use this guide This tasting guide provides tools to implement sensory evaluation in order to complete the organoleptic quality objectives as required by DIVERSIFOOD. To achieve this, a set of experiments will be carried out to meet specific objectives. Four set of sensory evaluation tests are proposed: the first aims to identify and understand the consumers’ expectations. The seconds set of sensory test is used to describe the objective sensory quality of products. The third test should be used to integrate the sensory criteria in the breeding process and the fourth set of tools evaluate the impact of agronomic practices on the organoleptic characters of a product to understand the mechanisms for working on quality. Moreover, two alternative method are proposed to gather specific sensory attribute and understand farmer’s breeding strategies to integrate empirical knowledge in participatory research.
The final objective of this guide is to provide a common methodological basis for all DIVERSIFOOD partners involved in WP2 and 3 to enable them to justify their choice. It contains:
• An introductory chapter: Introduces the methods for sensory analyses. • Five technical booklets detailing recommended tests: you will be guided from the implementation
of your gustatory tests through to the analysis of the data. All the tools you need to perform the various tests will be found here. These booklets contain screen captures from the open-source software, ‘R’. Installation instructions for R are explained in the last sheet.
• Three products booklets describing how to prepare samples : these sheets focus on the product
specificity from sensory descriptors through sample preparation
• A glossary: Defines the specific terminology used in the tasting guide (e.g. sensory analysis terms, sensory attributes, and statistical terms).
■ A useful tool to reach DIVERSIFOOD objectives
Participatory research implied several requirements to be adopted and implement by all partners from the farmers to the technicians.
Methodologies should offers a compromise between robustness and efficiency (ability to change practices). More than generalizable results, participatory research need to be anchored in people lived experience. Observations assume greater robustness through the exchange within a community of practices. Methodologies should be easy to implement and cheap in order to assure their adoption on ground.
This guide proposed a common experimental framework that permit to compare data among partners from different country and flexible enough to be adapted to their specific objectives. To do so, a decision tree is proposed in the following page and refer to the pages where technical details are listed.
DIVERSIFOOD Objectives The objectives of WP2 and WP3 is to create new diversity by choosing the most interesting resources based on agronomic and quality criteria in order to embed crop diversity and networking for local high quality food system. It suggest that all plants (vegetables as cereals) express its typicality in a unique combination of soil-terroir-climate-human.

2
Different analyses are required for different steps of the breeding process. The figures on the following page illustrate how to select the appropriate test depending on the specific objective. The first question is the type of quality you want to measure: hedonic (consumer preferences) or objective (sensory characteristics). Then a bibliographic study may give you a picture of the products knowledge (if there is a lot of study on consumer preferences or sensory characteristics) and will guide you to a more precise research question. The key point in the case of participatory research is whether there is already a breeding process that integrate sensory criteria (undergone by farmers or advisers…) and if there is a need to understand the process quality of the product (factor impact study). In this case, process sheet proposed a set of sensory test to implement throughout the breeding process.
Sensory test Type of quality
Type of data
Min. nb of
tasters
Max. nb of
products
Taster’s expertise
Estimated time Disadvantages
Ranking test Sensory Rank sums 12 6 No trained 1h No more than 3 descriptors
Hedonic test Hedonic Ranks or quantitative 60 7 No trained 7h Need for many taster
Sensory brainstorming Sensory Qualitative 10 - No trained
but expert1 2/3h Only qualitative data
Sensory profile Sensory Quantitative 10 6/sessions Trained
1h (+7h training session)
Time and money consuming
Napping Sensory Sensory distance
+qualitative 10 12 No trained
but expert 1h No possibility to
compare between sessions
1 Product’s professional as baker for the bread or breeder/producer for tomato
DECISION TREE FOR ADAPTED SENSORY TEST

3
■ From sensory perception to sensory analysis Sensory perception results from the integration of information from multiple sensory organs:
Perception Example
Vision Shape, colour, appearance. Olfaction Odour (sweet, pungent, floral). Gustation Sweet/salt, sharp/bitter, flavours (savour, perfume in mouth). Hearing Crunchy,. Sense of touch Texture (smooth, rough), temperature, firmness. Trigeminal perception Fresh/hot sensations, astringency
The gustatory chain begins with the taste buds, located on the tongue. Taste buds are grouped in specific areas corresponding to the detection of different flavours (Fig 3). There are four kinds of taste buds: • Caliciforms, located at the back of the tongue • Fungiforms (mushroom-shaped), located on the tip and sides of the tongue • Filliforms (the most numerous type), responsible for tactile sensation (temperature and texture), but are not directly involved in taste perception. Tactile sensation completes the gustatory message. • Foliate papillae (leaf-shaped), located on the tongue’s edge.
■ Quality measurement: specificity of the sensory quality
The concept of quality can be broken down into agronomic, commercial, nutritional and gustatory components. Most of these can be measured objectively, for example, colour, firmness, juiciness, soluble dry matter, acidity analyses of nutritional compounds. The existence of automates able to make 4 or 5 of the measures at the same time highlights the instrumental technical advancement for the quality measurement. Some criteria are, however, purely subjective in nature, such as the mealiness of tomatoes or the toughness of a grapefruit skin. These require sensory analysis methods. It is necessary to pay close attention to the selection of samples, in order to ensure the reliability and replicability of the experiment. The sample has to be representative of the batch (homogenous) and clearly described, with information on species, variety, origin, agronomic practice, harvest date, post-harvest storage conditions and physical-chemical characteristics. To compare varieties, it is of vital importance that all samples are at the same stage of maturity. They can be graded according to the appearance, the colour or the intrinsic characteristics of the product (IR, firmness, acidity).
Table 1: Different types of sensation in sensory perception
Figure 1: The gustatory perception

4
■ Vegetables The Napping method should be applied at the beginning and the end of the breeding process to compare sample among us and characterize in a more accurate way the stakeholder‘s expectations and or the sample’s sensory characteristics. At the beginning of the process, Napping may help the choice of genotype of interest. At the end of the process, it may help to check if new products are different from the parent. To ease the integration of sensory criteria during breeding process, a simple brainstorming, which can be achieved by mean of weekly meeting, will bring taste references to judges and contribute to their training. In a commercialization perspective, hedonic test should be performed to check the acceptability of the new products.
2. Sensory criteria in the
breeding process
Figure 2: proposition to take into account the sensory quality of vegetable in the breeding process

5
■ Cereals
Experiments in previous project put in light two levels in breeding strategy adapted by farmers. This two approaches claims for specific sensory tools and specific constraints. The two approach are explained by the difficulty to choose among numerous genotype the few ones that best fit with their agricultural and baking practices. The napping should be used in the two cases, because it allows the integration of baker’s expertise for an objective sensory evaluation (for a panel composed of bakers) but it could take into account the consumer’s expectation (for a panel composed of consumer). The specific constraints of control sample occurred when studying genotype by environment interaction at a collective level. Special attention had to be paid for the choice of sample so as to answer to the specific experiment’s objectives.
■ Brainstorming: a usefull tool to define a sensory descriptors list
Brainstorming is a process for generating ideas and solutions through intensive and freewheeling group discussion. Every participant is encouraged to think and suggest as many idea as possible. Brainstorming should be useful to integrate sensory criteria in the breeding process:
• To familiarize tasters to a sensory space products • To gain taste references and develop the “know-how” to taste • To create a sensory descriptor list adapted to a specific space product
Some parameters should be specified to favour the smooth running of the test.
Figure 3: sensory tests to take into account the sensory quality of cereals in the breeding process

6
■ Implementation
For each products, participants are asked to taste in an individual way the sample and then to write three sensory descriptors on three post-it note (one descriptor for one post-it note). Once each participant has generate its three words, the facilitator ask to one taster about its three descriptors and ask to all participants if there are similar words. Facilitator grouped sensory descriptor according to their similarity and ensure that all tasters have put its words on the wall. To conclude, Facilitator synthetize the sensory descriptors specific to the products and another cycle should run with a new product. To fixed the list of sensory descriptors, choice should be made on
• Redundancy: descriptors that turn around the same idea should be reduce to one • Objectivity : descriptors that qualify hedonic quality should be removed • Common trait: descriptor that have been perceived in all product should be selected (in contrary, if
a descriptor describe only one product, it should be removed)
• Equipment needed A white wall to stick the taster’s individual post-it note
For each taster
• A glass of water, • A Felt-pen (to write product number and sensory descriptors on tablecloth) • Post-it note
• Judges Judges don’t need to be trained. A panel of fifteen is large enough to offers a large gathering of sensory descriptors.

7
In some cases, farmers have already begun a breeding process taking into account sensory criteria. To identify and validate farmers’ knowledge and integrate such results in research processes as hypotheses or experimental guidelines, several tools should be used. These process sheet give an example of integration of tacit knowledge in the case of the quality bread improvement. Morphological and sensory characterizations of farmers’ “wheat mix for bread”, identified by semi-structured interviews, were applied to help identify genotypes of sensory interest on morphological characteristics.
■ Specification of farmer criteria
A set of 11 farmer-bakers and/or grain farmers was interviewed on their breeding practices. The sample comprised both young and experienced farmers. Interviews were conducted in five French regions (Rhône Alps, Brittany, Pays de la Loire, Aquitaine and Languedoc Roussillon) in order to cover a large variety of socio-cultural and pedo-climatic contexts. All of them grow their own “mix for bread”. This point is of major importance because the objective was to identify potential breeding criteria linked to end-use quality, as the integrated sector covers all process stages. In order to identify breeding criteria related to end-use quality, semi-structured interviews were carried out. Questionnaire was designed not to force farmers to reflect on their breeding practices but to identify the overall approaches they adopted. Open questions were therefore used to favor the externalization of hidden knowledge. The first question was on bread and wheat ideotype and the questionnaire then focused on real life observations of genotype and bread quality. The following questions dealt with the changes that had been necessary to meet consumer expectations. Human values are of prime importance and were investigated as they could be a justification for a farmer’s choices.
A grid characterizing the genotype of morphological traits was applied to six mixes of wheat bred by six of the eleven farmers interviewed. The grid aimed to characterize the morphological diversity and was based on previous works on Breton landraces. The focus on diversity reflects the overall hypothesis according to which diversity should help stabilize quantitative and qualitative performance.
3. Integration of implicit knowledge
Figure 4: farmer’s breeding criteria highlighted through interviews (0: criteria not taking into account, 1: important criteria for farmer

8
■ Breeding strategy integrating sensory quality
The goal of this research was to identify breeding strategies oriented to end-use quality for use by 11 farmer-bakers and farmer-breeders. Three breeding strategies were identified:
• Genetic diversity to stabilize agronomic and sensory characteristics
From an agronomic point of view, these farmers focused on adaptation to pedoclimatic conditions. They relied on
genetic diversity for agronomic adaptation and organoleptic quality. They were not sure of the genotypes that compose
their mix but were used to enrich it by adding modern or ancient varieties.
• Typicality strategy, growing genotypes with specific sensory qualities
These strategies relied on certain genotypes that showed specific sensory characteristics when breeding for quality. By
this means, the farmers tried to manage bread quality and differentiated their product from others. The small number of
genotypes facilitated management of the wheat mix as genotypes that needed to be reintegrated were easily identified. In
these strategies, the genotypes could be mixed in the field stage (producing one flour from different wheat) and/or in the
bakery stage (by mixing several different types of flour).
• Genetic adaptation by growing landraces
Others farmers proposed local products and they hypothesized that landraces (ancient wheat that used to be grown in
the region) were the best adapted to their environments. These strategies revealed an attachment to the ancestral land and
emphasized the social link with organic farming practices.
■ Sensory characterization of farmer’s products
In order to validate farmer knowledge and confront their strategies, descriptive sensory tests (see sheet n° ) were conducted on the “mixes for bread” made by four of the eleven farmers interviewed, one landrace and one pure line.
From a technical point of view, since each mix for bread and landrace showed particular sensory characteristics, study confirmed that breeding for sensory quality should be of interest. The sensory profile established with the expertise of bakers appeared to be an efficient tool to discriminate bread types according to their sensory properties. These properties should be linked to morphological traits, such as grain colour. The breeding strategies identified by interviews were consistent with field observations. Efforts to qualify more genotypes should be maintained to improve our understanding of the quality process.
The validation of implicit knowledge was a key point of such processes and an appropriate observation system must be implemented alongside the gathering of knowledge. Moreover, new farmers could benefit from this gathering of farmers’ knowledge as this information could be transferred via the network.
Figure 5: PCA model of the sensory evaluation of sourdough wheat bread from diverse genotype

9
This protocol has been developed within the framework of SOLIBAM to deal with the objectives of the organoleptic task, and is applicable to all partners and products.
■ Approach Before implementing the test, a survey on the product concerned should be undertaken in order to understand factors such as market segmentation (food preferences studies…) and consumers’ expectations. Institutes such as CTIFL in France can provide this kind of information.
■ Ranking test A panel of assessors compares several products simultaneously and ranks them according to the perceived magnitude of a given sensory characteristic (e.g. acidity, fibrousness). This method has the advantage of being easy to implement. The jury ideally comprises 12 semi-naive assessors (consumers initiated to sensory analyses, see below) according to the ISO 8587 standard2, although it is possible to highlight significant differences with a smaller number of assessors. Key Characteristics:
- Products are presented simultaneously This requires that the whole set of samples to be tested is available at the same time. Some vegetable species show marked difference in precocity (e.g. broccoli), and therefore care should be taken to ensure that samples of the same precocity are compared.
- The assessors can taste as much as they need - When they answer, assessors cannot put any two products at the same rank, i.e. all ranks assigned
must be unique.
2 ISO 8587:2006 is a standard from International Organisation for Standardisation which describes a method for sensory evaluation with the aim of placing a series of test samples in rank order.
Type of test Discrimination test
Type of data Sensory characteristics
Subject Semi-naïve
Cost/difficulty €/*= cheap/easy, €€/ **= quite expensive/ average difficulty, €€€/***= expensive/ great difficulties.
€ / *
The test aims to integrate gustatory and agronomic characteristics in the breeding process. Easy to implement, it provides a product ranking on a given sensory attribute (for example the tomato’s tenderness).
Table 1: Characteristics of the ranking test
4. Characterize a product:
Ranking test

10
It is advised not to exceed 6 samples per session. For sample preparation, refer to the product sheets n°1 to n°5.
■ Results and analysis methods
Table 2: Example of ranking test results For example, Table 3 presents the results of a ranking test: 7 assessors have classified four varieties of tomato (A-D) according to their perceived tenderness.
Table 3: Example of a frequency distribution This table shows frequency of occurrence of each rank assigned by the seven assessors, for each variety. It is derived from Table 3.
o Step 1 : Rank the varieties according to the intensity of the given sensory characteristics Null hypothesis (H0): all varieties have exactly the same tenderness (rank means are equal) Friedman’s test (non parametric test on k independent samples) leads to the rejection or acceptance of this hypothesis, based on α value (<0.05).
Assessors/varieties A B C D
1 1 2 3 4
2 2 1 3 4
3 2 1 4 3
4 1 4 2 3
5 1 3 4 2
6 1 2 4 3
7 1 4 3 2
Mean value 1.3 2.4 3.3 3.0
R a n k s / v a r i e t i e s A B C D
1 5 2 0 0
2 2 2 1 2
3 0 1 3 3
4 0 2 3 2
Analysis:
Friedman’s test
How to initiate a jury?
- The first step is to familiarise the jury with the techniques and concepts of sensory analysis: the first sheet will provide the background information necessary.
- The second step is to train the jury using one or two simple test like Napping or brainstorming (see
sheet n° ). This should help the choice of the sensory descriptors for the ranking test.

11
The four variables (varieties) are selected in the dialogue box. The screenshot on the left gives an example of the results which can be obtained using R software command (see Sheet n°9). In this example, The Friedman’s test results show that the varieties differ with respect to their perceived tenderness (p-value=0.019 < α =0.05): differences between variety means cannot be ascribed to random effects. It also indicates that the assessor panel performed reasonably well as a whole, with acceptable homogeneity. Variety A is the most tender followed by variety B. It is not possible, however, to differentiate between varieties C and D. This may be due to an insufficient number of assessors (the ISO 85 87 norm recommends 12 assessors). Through this analysis, the varieties that best fit the targeted consumers’ expectations can be selected. o Step 2 : Check the homogeneity of the panel of assessors This test can be used to evaluate the assessors: each highlighted cluster can be considered as the expression of a consensus. In order to improve the ranking, the HAC technique indicates the presence of outliers: these individuals may not have understood the taste assessment instructions. The test can be repeated following further explanation of the instructions to ascertain if this resolves the problem. To perform HAC, the “Ward method” parameters should be chosen for the classification method and “Euclidian” for the distance measure in the dialogue box. The four variables should then be selected. This results in the following graph: The HAC indicates two clusters within the assessor panel. Subjects 1, 2, 3 and 6 agree for the rank of the two first and two last samples. Subject 5, 4 and 7 differ with respect to the rank of the last three varieties.
Analysis : Hierarchical Ascendant
Classification (HAC)
12
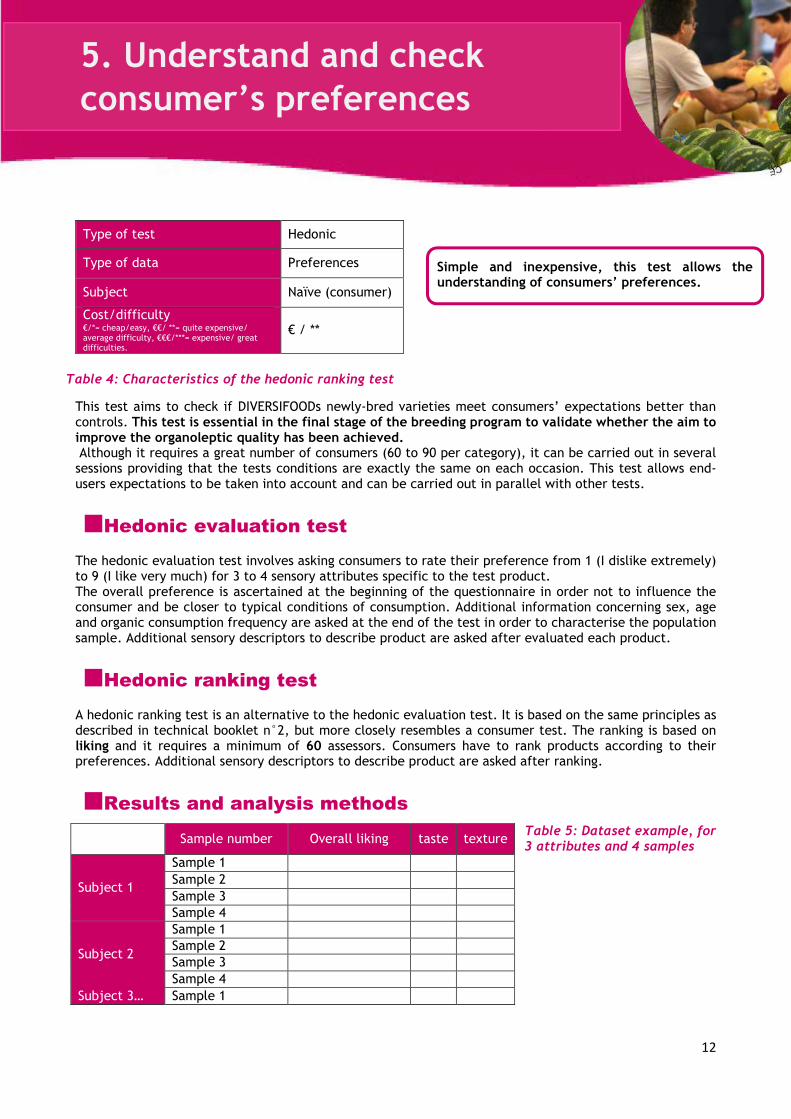
This test aims to check if DIVERSIFOODs newly-bred varieties meet consumers’ expectations better than controls. This test is essential in the final stage of the breeding program to validate whether the aim to improve the organoleptic quality has been achieved. Although it requires a great number of consumers (60 to 90 per category), it can be carried out in several sessions providing that the tests conditions are exactly the same on each occasion. This test allows end-users expectations to be taken into account and can be carried out in parallel with other tests.
■ Hedonic evaluation test The hedonic evaluation test involves asking consumers to rate their preference from 1 (I dislike extremely) to 9 (I like very much) for 3 to 4 sensory attributes specific to the test product. The overall preference is ascertained at the beginning of the questionnaire in order not to influence the consumer and be closer to typical conditions of consumption. Additional information concerning sex, age and organic consumption frequency are asked at the end of the test in order to characterise the population sample. Additional sensory descriptors to describe product are asked after evaluated each product.
■ Hedonic ranking test A hedonic ranking test is an alternative to the hedonic evaluation test. It is based on the same principles as described in technical booklet n°2, but more closely resembles a consumer test. The ranking is based on liking and it requires a minimum of 60 assessors. Consumers have to rank products according to their preferences. Additional sensory descriptors to describe product are asked after ranking.
■ Results and analysis methods Table 5: Dataset example, for 3 attributes and 4 samples
Type of test Hedonic
Type of data Preferences
Subject Naïve (consumer)
Cost/difficulty €/*= cheap/easy, €€/ **= quite expensive/ average difficulty, €€€/***= expensive/ great difficulties.
€ / **
Sample number Overall liking taste texture
Subject 1
Sample 1 Sample 2 Sample 3 Sample 4
Subject 2
Sample 1 Sample 2 Sample 3 Sample 4
Subject 3… Sample 1
Simple and inexpensive, this test allows the understanding of consumers’ preferences.
Table 4: Characteristics of the hedonic ranking test
5. Understand and check
consumer’s preferences

13
Table 6: Ranks assigned for variety 1 and 2 for the attribute ‘texture’ This dataset shows results from a hedonic test carried out on tomatoes in 2006 by a French organic association (BioCIVAM 11).
One of the main objectives of hedonic test is to determine differences of appreciation for a given attribute between a set of samples (in this example differences between variety 1 and 2 for the attribute ‘texture’). o Step 1 : Check the data distribution in order to choose the most appropriate statistical tests Null hypothesis (H0): the data follow a normal distribution The data distribution determines the type of tests that should be used to analyze the data set. If the distribution is Normal, one-way analysis of variance (ANOVA) can be performed, the source of variance being the sample, followed by multiple comparison of mean data values from each assessor.: The aim is to obtain a final ranking based on consumers’ preferences. In this example, the p-value is lower than 0.05 (p=2.257e-05) which means that the data is Normally distributed. The one way ANOVA can thus be used to compare the means. Firstly, it is necessary to recode variables: samples initially called ‘variables’ become a factor named ‘var’.
Subject Variety1 Variety 2 …
S1 1 3
S2 3 3
… 3 2
Analysis: Test Normality with
Shapiro-Wilk

14
o Step 2: Assess the consumers’ preferences Null hypothesis (H0): Means are equal (there are no differences in preference between varieties) The ‘var’ factors are selected in ‘Groupes’ and the response variables are the assessor’s evaluation scores for the ‘taste’ attribute.
The output window on the right indicates that the test is significant (p-value=0.01589). Varieties are therefore perceived differently by the different assessors. Finally, examination of the average values indicates that variety 2 is preferred to variety 1. If the data set doesn’t follow a Normal distribution, a Friedman test on the rank should be used to indicate if the varieties are perceived differently by assessors. o Step 3: Check the homogeneity of the panel of assessors The HAC (see Technical booklet n°2) clearly highlights two clusters of response for the ‘texture’ attribute. In this example, the two clusters refer to consumers who prefer tender or firm tomatoes.
Analysis :
One-way ANOVA

15
This test is expensive: it requires a qualified panel (ideally 10 assessors), trained for each specific product. The test has to take place in a sensory analysis laboratory with controlled conditions (temperature, humidity, red light). Moreover, it needs to comply with the European standards (ISO 11035, ISO 13299:2003).
■ Integrated approach The descriptive analysis is part of the second stage of the sensory analysis and aims to validate the first step (see technical booklet n°2). It is carried out at the end of the breeding process, and only if the discrimination test has highlighted significant differences between products. This test is difficult to conduct as the training process is lengthy, including a basic training of about 5 to 10 hours followed by product specific training (generation and selection of sensory attributes, and guidance on how to use scales) of about thirty hours.
■ The sensory profile In this test, the expert panel quantifies the perceived intensity of sensory descriptors on a graded scale. Each descriptor results from a consensus among the experts and the intensity measurements are then visualized on polar graph and histogram.
The final purpose of this stage is to precisely define the product’s sensory characteristics, in order to develop a reliable sensory description which can be understood by all.
Type of test Descriptive analyses
Type of data Sensory characteristic
Subject Qualified
Cost/difficulty €/*= cheap/easy, €€/ **= quite expensive/ average difficulty, €€€/***= expensive/ great difficulties.
€€€ / ***
This analysis aims to delineate the difference between varieties and provides a sensory description of the product.
Figure 6: Cabbage organoleptic profile
Figure 7: Intensity descriptors for 4 products and 5 sensory attributes
Table 7: Characteristics of the descriptive analysis
6. Characterize a product:
sensory profile

16
Table 8: ANOVA for the attribute ‘bitterness’ Table 9: Friedman Test for the attribute ‘bitterness’
■ Analysis of Results The data output is similar to that of the hedonic tests (see technical booklet n°3). Statistical evaluation is performed using multifactorial analysis of variance (sample, assessor, replicate), for each descriptor, to determine if the average ranks of each sample are significantly different or may have occurred at random. o Step 1: assess the panel performance, on three criteria Table 11 shows the output of the ANOVA. The 3 following points refer to different lines in the table, colour-coded for clarity. The parts in grey are not essential to interpret the results. • Discrimination among the sample: This is the ability to perceive differences between samples. The
main objective of a sensory profile is to determine differences in attribute intensity among samples on a specific sensory characteristic. If the product attribute has a significant effect on the variability (P-value < 0.05) it should be included in the assessment list. If the P-value is >0.05 this sensory attribute may be removed.
In the example above, the analysis of variance shows a good discrimination power for ‘bitterness’ (p<0.0001). • Panel agreement: another important aspect of panel performance is the homogeneity among assessors
in the evaluation of a sample, which can be estimated from the interaction “assessors” x “samples”. When assessors differ in their scoring path (i.e. different assessors’ responses for the same sample and descriptor) the probability associated with the interaction effect “assessors” x “sample” is significant (<0.05).
In table 11, we can see there is a problem of homogeneity in the assessment for the given example. In this case, a Friedman test (table 12) will give indications as to the reasons for this lack of homogeneity: if it is significant, the panel needs further training on how to use the notation scale. If it is not significant, then the assessors are in complete disagreement and training must restart from the beginning.
In this example, the Friedman test confirms heterogeneity in the scale used. • Assessment replicability:
Precision is an important aspect of the performance of the assessors, and relates to the variability of the evaluation scores given to replicates of the same sample. The probability for the interaction “sample” x "replicates” must be greater than 0.05 to conclude that there is good replicability.
df SME F (Fisher) Probability
Product factor(P) 25 65.61 27.56 <0.0001
Assessors‘ factor (A) 12 64.58 27.12 <0.0001
Replicates’ factor (R) 2 9.07 3.81 0.0227
Interaction S*A 300 4.69 197 <0.0001
Interaction S*R 50 1.65 0.69 0.946
o Step 2: Summarise Once performance has been evaluated, average values can be compared for each descriptor scored. A multivariate analysis (HAC, or PCA) will allow the product results to be displayed relative to each other. This figure shows an example of sensory profile results (box-plot).
∑(∑(ranks))² 8110526,5 F (Fisher) 395,9097 p-value <0.0001
Figure 8: average of toasted aroma for three wheat bread
varieties

17
This suggested discrimination test should be performed as the first and final step in the breeding process as a means to rough out the subject but also to validate the breeding methodology. The Napping let you look for sensory differences between products. Differences are on global sensory characteristics and should be complemented with a verbalisation task to ease the understanding of the differences. It offers greater flexibility, as no trained panel is needed.
■ Napping
The sorting task: each taster are asked to position the whole set of products on a sheet of blank paper (a tablecloth) accordingly to their similarity/dissimilarities. Thus, two products are closed if perceived as similar or, on the contrary, are far-off one another if perceived as different. Each taster uses his/her own criteria. The verbalisation task: After performing the napping task, the panellists are asked to describe the products by writing one or two sensory descriptors that characterized each group of product on the map.
■ Implementation
• Equipment needed This test requires a spacious room in order that each judge should arrange tablecloth and the set of sample in front of him. For the whole jury
• A chopping board and a knife • Indelible odourless felt tip to identify the samples
For each taster
• White paper tablecloth of size 40cm x 60 cm • A glass of water, • A Felt-pen (to write product number and sensory descriptors on tablecloth)
• As much as post-it note as products number to identify sample
Type of test Discriminative analyses
Type of data Sensory distances
Subject Semi-naïve
Cost/difficulty €/*= cheap/easy, €€/ **= quite expensive/ average difficulty, €€€/***= expensive/ great difficulties.
€ / **
In DIVERSIFOOD, this test may be used to determine whether breeding and crop management practices influence organoleptic quality of the varieties or not. It could be used to describe the sensory quality of a set of product but in a less detailed manner than
sensory profile
Table 10: Characteristics of the Napping test
7. Factor impact study:
The Napping test

18
• Judges Panel should be composed from 12 to 25 tasters according to the judge’s experience with the product and to the objective of the experiment. For example ten farmers-bakers should be enough to have reliable results as they used to eat and taste bread. If consumers, a panel of twenty should be more adapted.
• Sample preparation and presentation For cereals, bread making process should be adapted according to the objective. If the test is focused on genotype, for example to do a sensory screening on several genotype grown in a unique environment, the breeding process has to optimise the cereals expression in the bread (degree of hydration, fermentation time…). If the experiment try to evaluate the effect of different factors, bread making process should be standardize. For vegetables, attention had to be paid on the homogeneity of the sampling, especially when evaluate heterogeneous varietal structure. To do so, a varietal “ideotype” should be defined (colour for maturity, shape…) before to ease the sampling. No more than ten products should be evaluate simultaneously. A random, three-digit code should be assigned to each sample. Sample are presented simultaneously and assessor can taste as much as they need.
■ Analysis and results Napping data lead to a quantitative table. The rows are the products. This table present the number of panellist (i) set (one set for each panellist) of two columns corresponding to the horizontal and vertical coordinate (X, Y). Two columns correspond to each subject j: the X-coordinate (Xj) and the Y-coordinate (Yj) for each product. Sensory descriptors are coded through a products x words frequency table. First a contingency table counting the number that each descriptors has been used to describe each product is created. Then this contingency table is transform on frequency so that the “word frequency” is a qualitative variables with the number of words cited as modalities. To analyse this kind of data, a Multiple Factor Analyses should be performed. Each subject constitute a group of two un-standardised variables. The MFA led to a synthesis of the panellist’s tablecloth. Two products are closed if all judges consider them close on the napping. The more the two first components of MFA explain the original variability, the more the judges are in agreement. The frequency table crossing products and word frequency is considered as a set of supplementary variable: they do not intervene in the axes construction but their correlation with the factors of MFA are calculated and represented as in usual PCA. The figure bellow is an example of representation obtain with MFA analyses. Products coded with the farm, the genotype and the baker are distributed on the two dimension. The factor map for the contingency table show sensory descriptor used to describe the product. when superposing the two map, it is possible to linked sensory distances with sensory descriptors.
Figure 9: organization of the data.

19
■ Tomato barometer (France) Consumers’ preferences are divided into two axes. The first axis concerns flavour, aroma and juiciness and shows consumer segmentation on acidity. The second axis deals with texture and shows two different preference profiles for those tasters who preferred softness and those who preferred firmness and crispiness. Although tomato consumption in France has stabilized at 12 kg per habitant, the taste satisfaction has decreased since 1998, with 1/3 of consumers unsatisfied with “tasteless tomatoes” (Baros, Journée ctifl-Inra_4/02/2010).
■ Equipment needed For the whole jury
• A chopping board and a knife • Indelible odourless felt tip to identify the
samples For each workshop
• As many plates as varieties • 2 tomatoes per variety, maximum 8
varieties
For each taster
• A fork • A napkin • A glass of water, unsalted crackers or
bread to cleanse the palate between samples
• The questionnaire linked to the test
■ Preparation mode Tomatoes are tasted four days after harvest; in the meantime they are stored for 48 h at 12 °C and then for 48 h at room temperature (25/30 °c). Fruits showing irregularity and/or defects such as green colour on the upper side are excluded from the taste experiment. If the quantity is limited, however, these irregular fruits may be used providing that the defects have been removed. After verification of the maturity and homogeneity, fruits are cut into homogeneous pieces including skin.
■ List of sensory attributes (non-exhaustive)
o Odour: Tomato aroma
o Appearance: Colour Grooved skin surface
o Taste : Salty taste Sweet taste Overall acidity
o Texture : Skin consistency Mealiness Softness Crispness Juiciness Firmness
Table 11: Sensory descriptors for tomato
Figure 10: Type of representation obtains
8. Raw products:
TOMATO (example)

20
■ Ranking test o Sample presentation The samples (halved tomatoes) are presented simultaneously and each is allocated a number (blind trial). Depending of the panel size, tasters are organised into groups composed of 3/4 assessors per workplace and silence is maintained at all times.
o Questionnaire The assessor must taste samples and then rank them according to the perceived intensity of a given sensory characteristic (rank 1 is the most intense). It is important that assessors do not talk to each other to prevent biasing the results. It is found that the greater the number of attributes tested is, the more difficult it is to detect significant differences. In order to minimize this problem, those descriptors that can be instrumentally measured are omitted. The questionnaire proposed below (Fig 6) is an example; the attribute list in Table 13 can be used to select relevant descriptors depending on the information required.
■ Hedonic ranking test o Sample presentation Samples are presented one by one in a precise order so that rank effect3 is limited. SensomineR packages include special functions which take this parameter into account. Varieties are arranged on a plate (one variety per plate) identified by the sample number. o Questionnaire The questionnaire response scale ranges from 1 (“I dislike extremely”) to 9(“I like extremely”) for the overall preference of the sensory attributes.
3 The rank effect is the evaluation bias attributed to the product presentation order. For example, a subject can overestimate the cocoa aroma of the chocolate sample presented first.
Please taste the samples, and rank them according to the perceived intensity of the descriptors “sweet taste” and “firmness”. Indicate this by entering the sample number below the appropriate rank number.
Rank number 1 2 3 4 5 6
Sweet taste Firmness
Crédit photo : Frédéric Rey
Crédit photo : Frédéric Rey
Figure 11: Questionnaire for tomato (ranking test)

21
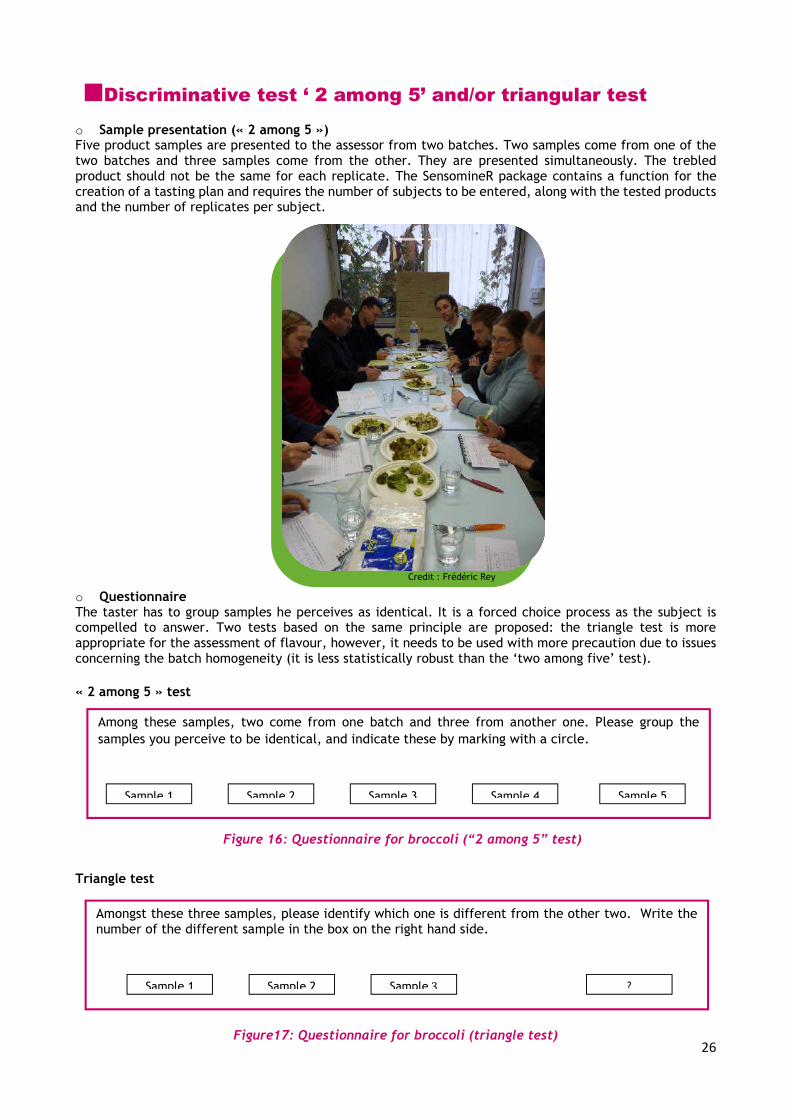
■ Discriminative test ‘ 2 among 5’ and/or triangular test o Sample presentation ( ‘2 among 5’) Five product samples are presented to the assessor from two batches. Two samples come from one of the two batches and three samples come from the other. They are presented simultaneously. The trebled product should not be the same for each replicate. The SensomineR package contains a function for the creation of a tasting plan and requires the number of assessors to be entered, along with the tested products and the number of replicates per subject. o Questionnaire The taster has to group samples he perceives as identical. It is a forced choice process as the subject is compelled to answer. Two tests based on the same principle are proposed: the triangle test is more appropriate for the assessment of flavour, however, it needs to be used with more precaution due to issues concerning the batch homogeneity (it is less statistically robust than the ‘two among five’ test).
As part of the European project …, we are testing tomatoes to gain a better understanding of consumer expectations. We ask that you taste … different tomatoes, and give us your opinion on their gustatory quality. Please pay close attention to the order of the samples, and fill the scale from 1 (I dislike extremely) to 9 (I like very much).
Figure 12: Questionnaire for tomato (hedonic ranking test)
Please specify: Gender: Male Female Age: Less than 30 yrs 30 to 40 yrs 40 to 50 yrs Over 50 yrs I buy organic products: At least once a week At least once a month Never

22
‘ 2 among 5’ test
Triangle test
■ Descriptive test o Sample presentation This test is designed around a well-balanced experimental plan in order to limit rank effects. The SensomineR package contains a set of functions to create such plans and evaluate the panel performance. o The questionnaire In this test, a panel of experts has to quantify the intensity of a set of given attributes on a graded scale. The final scores awarded must be the result of a consensus between experts.
Amongst these three samples, please identify which one is different from the other two. Write the number of the different sample in the box on the right hand side.
Sample 1 Sample 2 Sample 3 ?
Among these samples, two come from one batch and three from another one. Please group the samples you perceive to be identical, and indicate these by marking with a circle.
Sample 1 Sample 2 Sample 3 Sample 4 Sample 5
Figure 14: Questionnaire for tomato (triangle test)
Figure 13: Questionnaire for tomato (‘2 among 5’ test)

23
■ Broccoli barometer (France) After some production issues during the five years from 1990-1995), the French broccoli market continues to increase (info-Ctifl/September 2003). Nevertheless, the penetration rate remains quite low at 27%, according to the Sécodip panel for all households. Clearly it is less commonly consumed in France than many other vegetables, perhaps because less is known about its origin, provenance and history, and there is a perception of broccoli as a novelty product that is ‘fast and easy to cook’. It is also considered by many to be an ‘acquired taste’ and this is a restraint to purchase. Other constraints include a lack of product freshness and too high a price (A&D, 04/2005-n°83).
■ Equipment needed For the sample preparation
• A steamer • A chopping board and a knife • A balance • Salt 4 • Water (for cooking) • Indelible odourless felt tip to identify the
samples
Per workshop
• A small pot for each sample • 35g of broccoli per variety, no more than 6
varieties Per subject
• A fork • A napkin • A glass of water, unsalted crackers or bread
to cleanse the palate between tasting • The associated questionnaire
■ List of sensory attributes (non-exhaustive) o Odour :
Weed-like Cooked cabbage Iodized Nutty Earthy
o Texture : Spongy Tender Firm Crisp
o Taste : Cooked cabbage Sweet Bitterness
o Appearance : Colour (green, brown) Compactness
■ Preparation method Cooked products must be prepared in a standardised, replicable manner. The cooking method is important to ensure the samples are comparable between tasting sessions and in some cases cooking tests are necessary to determine the most appropriate method for the tasted product. In addition to broccoli, cabbage and bean cooking methods are detailed in this sheet: 4 It is important to use the same salt for all the samples in order to standardize the tasting.
Table 12 : Sensory descriptors for broccoli
9. Cooked products:
BROCCOLI (example)

24
o Broccoli Broccoli heads are detached and any damaged parts are removed. The heads are then cut into uniform pieces. Depending on the experimental aims, the broccoli may be tasted raw or steamed. If it is the latter, the heads are steamed for about 15 minutes, taking care to check during cooking. o Cabbage Undamaged leaves are taken evenly from the centre and the periphery of the plant and cut into pieces 2 cm wide and 15 cm long. Depending of the aim of the experiment, cabbage can be tasted raw or cooked. If cooked, the leaves are steamed for about 25 min. o Dried bean For a jury of 12 assessors, 250 g of dried beans are dipped into fresh water (3 times their volume), and boiled. They are then rinsed and impurities or damaged beans are removed. The beans are then cooked in boiled water in a pressure cooker for a period of 50 min after the valve starts rotating. The cooking time varies with variety, and it is necessary to test the cooking time for each sample. After that, the beans are rinsed in a colander and salted with a standardised amount of salt to approximate the typical conditions of consumption (5g salt for 500g beans). For cooked products, samples must still be hot when served to the tasters (40-70°C). Salt addition (1g per 100g of product) is recommended as the experience is then closer to typical conditions of consumption, making the tasting more pleasant. For the boiled products, it is advised to avoid tap water, which can vary in taste. Spring water should be used for cooking if possible.
■ Ranking test o Sample presentation Samples weighing 35 g each are placed in pots marked with the sample number, and are presented to the tasters simultaneously. Depending of the panel size, tasters are organised into groups composed of 3/4 assessors per workplace and silence is maintained at all times.
o Questionnaire The assessor must taste samples and then rank them according to the perceived intensity of a given sensory characteristic (rank 1 is the most intense). It is important that assessors do not talk to each other to prevent biasing the results. It is found that the greater the number of attributes tested is, the more difficult it is to detect significant differences. In order to minimize this problem, those descriptors that can be instrumentally measured are omitted. The questionnaire proposed below (Fig 10) is an example; the attribute list (Table 14) can be used to select relevant descriptors depending on the information required.
Please taste the samples and rank them according to the perceived intensity of the descriptors “bitterness” and “tender texture”. Indicate this by entering the sample number below the appropriate rank number.
Rank n° 1 2 3 4 5 6
Bitterness Tender texture
Credit : Frédéric Rey Credit : Frédéric Rey
Table 13: Questionnaire for broccoli (ranking test)

25
Please specify: Gender: Male Female Age: Less than 30 yrs 30 to 40 yrs 40 to 50 yrs Over 50 yrs I buy organic products: At least once a week At least once a month Never
■ Hedonic ranking test o Sample presentation Samples are presented one by one in a precise order so that rank effect5 is limited. SensomineR packages include special functions which take this parameter into account. Varieties are presented in small pots (one variety per pot) identified by the sample number. o Questionnaire The questionnaire response scale ranges from 1 (“I dislike extremely”) to 9(“I like extremely”) for the overall preference of the sensory attributes.
5 The rank effect is the evaluation bias attributed to the product presentation order. For example, a subject can overestimate the cocoa aroma of the chocolate sample presented first.
As part of the European project …, we are testing broccolis to gain a better understanding of consumer expectations. We ask that you taste … different broccolis, and give us your opinion on their gustatory quality. Please pay close attention to the order of the samples, and fill the scale from 1 (I dislike extremely) to 9 (I like very much).
Figure 15: Questionnaire for broccoli (hedonic ranking test)
26
■ Discriminative test ‘ 2 among 5’ and/or triangular test o Sample presentation (« 2 among 5 ») Five product samples are presented to the assessor from two batches. Two samples come from one of the two batches and three samples come from the other. They are presented simultaneously. The trebled product should not be the same for each replicate. The SensomineR package contains a function for the creation of a tasting plan and requires the number of subjects to be entered, along with the tested products and the number of replicates per subject. o Questionnaire The taster has to group samples he perceives as identical. It is a forced choice process as the subject is compelled to answer. Two tests based on the same principle are proposed: the triangle test is more appropriate for the assessment of flavour, however, it needs to be used with more precaution due to issues concerning the batch homogeneity (it is less statistically robust than the ‘two among five’ test). « 2 among 5 » test
Triangle test
Amongst these three samples, please identify which one is different from the other two. Write the number of the different sample in the box on the right hand side.
Sample 1 Sample 2 Sample 3 ?
Among these samples, two come from one batch and three from another one. Please group the samples you perceive to be identical, and indicate these by marking with a circle.
Sample 1 Sample 2 Sample 3 Sample 4 Sample 5
Credit : Frédéric Rey
Figure 16: Questionnaire for broccoli (“2 among 5” test)
Figure17: Questionnaire for broccoli (triangle test)

27
■ Descriptive test o Sample presentation This test goes on a well-balanced experimentation plan in order to limit the rank effect. The SensomineR package contains a set of functions to create experimentation plans and evaluate the panel performance. o The questionnaire In this test, a panel of experts has to quantify the intensity of a set of given attributes on a graduate scale. Those descriptors are the result of a consensus between experts. They have to be defined during the specific panel training.
Credit : Frédéric Rey
Credit : Frédéric Rey

28
■ Organic bread barometer (France) Bread is seen as an emblematic food of French culture. When it is organically produced, it is thought to be a natural product, nourishing and healthy (Allessandrin et al., 20076) and is produced traditionally, as opposed to industrial processing techniques embodied by the white baguette sold at low prices in supermarkets. On the other hand, criticisms of organically produced bread include concerns regarding the taste (too sour), the shelf-life and price (too high).
■ Equipment needed Product preparation
• A chopping board and a knife • Indelible felt tip to identify the samples • A whole loaf of bread per sample.
Per sample
• A plate per sample • Two pieces per sample Per subject
• A napkin • A glass of water • The questionnaire
■ Preparation mode Ideally, all tested breads are cooked in the same way at the tasting site. It is important to reduce sources of variation and centralising production such as this is a practical way to standardise preparation. List of sensory attributes o Appearance :
Crust Browning Shininess Thickness
Crumb Colour Alveolus regularity Alveolus average size Alveolus density/crumb airing
o Taste : Salty Sweet Bitterness Acidity
o Aroma: Bread Roasting
o Texture : Crispiness Tenderness Elasticity
6 Allessandrin, A., Desmont, M.H. (2007) Qualités des blés biologiques et qualités nutritionnelles et organoleptique des pains biologiques, Final report of the project « Organic Bread » (ACTA, ITAB, INRA, Intercéréales).
Table 14: Sensory descriptors for bread
10. Processed products:
BREAD (example)

29
■ Ranking test o Sample presentation Depending on the sensory attributes that have been selected, bread will be presented either as a whole loaf (global appearance) or sliced (texture, alveolus description, taste criteria). Breads should be sliced (slices 13 mm thick) ten minute before tasting. Each slice should be cut into 5 pieces with each piece including both crust and crumb in order to evaluate the overall sensory characteristics
o Questionnaire The assessor must taste samples and then rank them according to the perceived intensity of a given sensory characteristic (rank 1 is the most intense). It is important that assessors do not talk to each other to prevent biasing the results. It is found that the greater the number of attributes tested is, the more difficult it is to detect significant differences. In order to minimize this problem, those descriptors that can be instrumentally measured are omitted. The questionnaire proposed below (Fig 14) is an example; the attribute list in Table 15 can be used to select relevant descriptors depending on the information required.
■ Hedonic ranking test o Sample presentation Samples are presented one by one in a precise tasting rank so that rank effect7 is limited (well-balanced experimentation plan). SensomineR packages show special functions which take this parameter into account. o Questionnaire The questionnaire response scale ranges from 1 (“I dislike extremely”) to 9(“I like extremely”) for the overall preference of the sensory attributes.
7 The rank effect is the evaluation bias attributed to the product presentation rank. For example, subject can overestimate the cocoa aroma for the chocolate at the first position.
Please taste the sample, and rank them according to the perceived intensity of the descriptors “Cumb airing” and “Acidity”. To do so, fill the number associated to the sample in the right chosen rank.
Rank n° 1 2 3 4 5 6
Crumb airing acidity
Figure 18: Questionnaire for bread (ranking test)

30
Please specify: Gender: Male Female Age: Less than 30 yrs 30 to 40 yrs 40 to 50 yrs Over 50 yrs I buy organic products: At least once a week At least once a month Never
■ Discriminative test ‘ 2 among 5’ and/or triangular test o Sample presentation All the samples must have the same shape (round, baguette,...). Five product samples (a sample = a slice) are presented to the assessor from two batches. Two samples come from one of the two batches and three samples come from the other. They are presented simultaneously. The trebled product should not be the same for each replicate. The SensomineR package contains a function for the creation of a tasting plan and requires the number of subjects to be entered, along with the tested products and the number of replicates per subject.
As part of the European project SOLIBAM, we are testing breads to gain a better understanding of consumer expectations. We ask that you taste … different breads, and give us your opinion on their gustatory quality. Please pay close attention to the order of the samples, and fill the scale from 1 (I dislike extremely) to 9 (I like very much).
Figure19: Questionnaire for bread (hedonic ranking test)

31
Among these samples, two come from one batch and three from another one. Please group the samples you perceive to be identical, and indicate these by marking with a circle.
o Questionnaire The taster has to group samples he perceives as identical. It is a forced choice process as the subject is compelled to answer. Two tests based on the same principle are proposed: the triangle test is more appropriate for the assessment of flavour, however, it needs to be used with more precaution due to issues concerning the batch homogeneity (it is less statistically robust than the ‘two among five’ test). « 2 among 5 » test
Triangle test
■ Descriptive test o Sample presentation This test is designed around a well-balanced experimental plan in order to limit rank effects. The SensomineR package contains a set of functions to create such plans and evaluate the panel performance. o The questionnaire In this test, a panel of experts has to quantify the intensity of a set of given attributes on a graded scale. The final scores awarded must be the result of a consensus between experts. They have to be defined during the specific panel training.
Amongst these three samples, please identify which one is different from the other two. Write the number of the different sample in the box on the right hand side.
Sample 1 Sample 2 Sample 3 ?
Sample 1 Sample 2 Sample 3 Sample 4 Sample 5
Credit : European Commission
Figure 20: Questionnaire for bread ( “2 among 5” test)
Figure 21: Questionnaire for bread (triangle test)
32
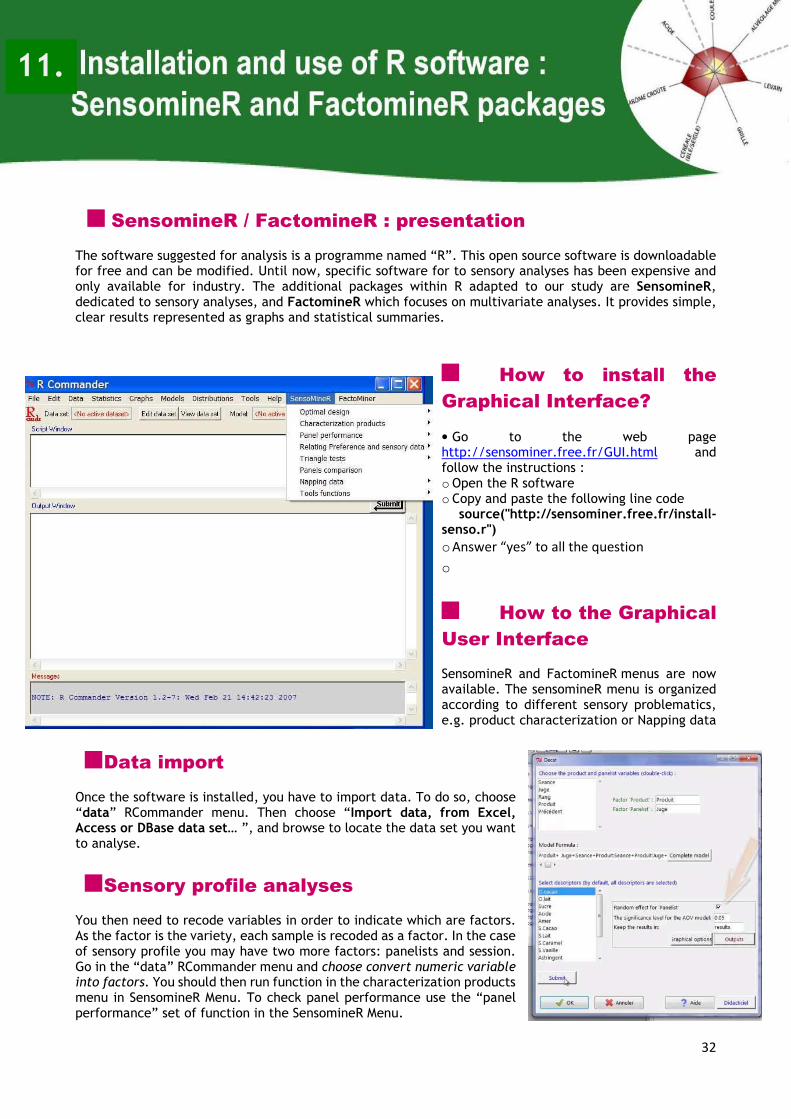
■ SensomineR / FactomineR : presentation The software suggested for analysis is a programme named “R”. This open source software is downloadable for free and can be modified. Until now, specific software for to sensory analyses has been expensive and only available for industry. The additional packages within R adapted to our study are SensomineR, dedicated to sensory analyses, and FactomineR which focuses on multivariate analyses. It provides simple, clear results represented as graphs and statistical summaries.
■ How to install the Graphical Interface? • Go to the web page http://sensominer.free.fr/GUI.html and follow the instructions : o Open the R software o Copy and paste the following line code
source("http://sensominer.free.fr/install-senso.r")
o Answer “yes” to all the question o ■ How to the Graphical User Interface SensomineR and FactomineR menus are now available. The sensomineR menu is organized according to different sensory problematics, e.g. product characterization or Napping data
■ Data import Once the software is installed, you have to import data. To do so, choose “data” RCommander menu. Then choose “Import data, from Excel, Access or DBase data set… ”, and browse to locate the data set you want to analyse.
■ Sensory profile analyses You then need to recode variables in order to indicate which are factors. As the factor is the variety, each sample is recoded as a factor. In the case of sensory profile you may have two more factors: panelists and session. Go in the “data” RCommander menu and choose convert numeric variable into factors. You should then run function in the characterization products menu in SensomineR Menu. To check panel performance use the “panel performance” set of function in the SensomineR Menu.
11.

33
■ Napping analyses Organization of data is a very important point to run analyses. Napping data lead to a quantitative table. The rows are the products. This table present the number of panellist (i) set (one set for each panellist) of two columns corresponding to the horizontal and vertical coordinate (X, Y). Two columns correspond to each subject j: the X-coordinate (Xj) and the Y-coordinate (Yj) for each product. Sensory descriptors are coded through a products x words frequency table. After importing data you may specify the name of the individuals. To do so, go on the data menu of Rcommander. Then you could run a Multiple Factor Analyses with judge’s coordinate as active variables and word frequency as supplementary variables.

34
■ Sensory Analysis
o Vocabulary specific to the analysis
Aroma: the sensation perceived by retro-olfaction when eating. Customer acceptance: the degree of compliance with customer quality’s expectations of a product. Expert (subject): a qualified subject who has excellent sensory acuity and who has been trained to use sensory evaluation tests. Their reliability has been assured. Flavour: Flavour is the sensory impression of a food or other substance, and is determined mainly by the chemical senses of taste and smell. The "trigeminal senses", which detect chemical irritants in the mouth and throat as well as temperature and texture, are also very important to the overall flavour perception. Hedonic: of, related to, or marked by pleasure. Naive (subject): Untrained subject (synonymous with the consumer). Organoleptic characteristic: this term includes all of the product properties that can be perceived by sensory organs. Retro-olfaction: the aroma perceived by the retro-nasal function (retro-olfaction - passing internally from the mouth cavity to the nasal passages).We differentiate between this and the odour perceived by direct nasal function (i.e. by breathing in through the nostrils). Semi naive (subject): person who has already taken part in a discriminatory sensory test. One previous testing experience is the minimum training required for a discrimination test. Sensory attribute: Sensory properties specific to a product. Trigeminal perception: this term includes sensations such as irritation, tickling, burning, cooling etc o Description attributes sensory
Tomato
- Firmness : resistance to mastication - Juiciness: juice perception when chewing the product - Skin persistence: this characteristic is linked to the skin thickness and indicates the
persistence of the skin in the mouth after ingestion - Crispiness: sound perceived when eating the product
Broccoli Compactness: compact nature of the broccoli heads. Cabbage
- Fibrousness: fibrous properties of the leaves - Fruitiness: sweet taste with a fruity note - Long finish: persistence of sensation in the mouth after eating - Tickling sensation: this term includes the flash effect after ‘hot’ or ‘spicy’ food (e.g. wasabi) and
the after taste effect. Bean
- Taste: defines the taste of which the bean is reminiscent (e.g. sweet chestnuts, nutty, milk concentrate)
- Viscosity: relating to the thickness and stickiness of a substance

35
Bread: Crust - Shininess: reflectiveness of surface - Tanning: intensity of the crust colour - Thickness: Depth of the peripheral part which has a more tanned colour compared to the crumb.
Bread: Crumb
- Alveolus (alveoli pl): air sac(s) within the bread - Alveolus regularity: uniformity of the alveolus size - Alveolus average size: average diameter of alveoli - Alveolus density: number of visible alveoli per unit area - Colour: sensory perception linked to the eyes reception of a light beam reflected by a body - Elasticity: extent to which bread recovers its initial shape after light and even pressure - Tenderness: softness upon touch.
■ Statistical analysis
Parametric test: parametric tests make assumptions about the spread of data and are used when it follows a Normal distribution, which can be described with parameters such as average and standard deviation. Non parametric test: non-parametric tests make few or no assumptions about the distribution of data and are used when comparing discrete variables or when the sample size (n) of a data set is low (e.g. less than 60). In this case, the average and standard deviation parameters cannot be used to describe the data and its distribution is not Normal. Hypothesis test: A hypothesis test is carried out to determine whether an asserted hypothesis can be accepted or rejected based on statistical probability. The null hypothesis states that there is no difference between the two groups under consideration (i.e. parameters such as average and standard deviation are equal). Variance analyses: Analysis of variance (ANOVA) is a statistical test which compares means from two or more sets of data. It indicates how much of the observed variation is due to ‘true’ population differences and how much is due to random effects. ANOVA tests the null hypothesis that all samples come from the same population. There are two assumptions that must be fulfilled: observations must be independent both within and between samples and the data must be Normally distributed. Principal Component Analyses (PCA): PCA is also known as factor analysis. It is a multivariate statistical test which weights variables in order to maximise the differences between individuals. The assumption behind this test is that individuals must have two or more observations assigned to them and should be measured on a continuous scale. Hierarchical Ascendant Classification (HAC): this is a multivariate technique which consists of progressively grouping observation or assessors according to their similarity, as measured by a similarity index. Aggregation criteria must be defined for use as a similarity measurement.

36
For each product concerned in this aspect of SOLIBAM (tomato, cabbage, broccoli, beans and bread), a bibliographic study has been carried out concerning consumer preferences. This will help to choose the sensory attributes upon which to focus in taste tests. The following section includes all the information found for all species concerned and expands upon the examples contained within the earlier sections of this guide.
■ Cabbage o Barometer The main criticism about cabbage from consumers is the smell released when cooking. In a CTIFL study carried out in 1997, 34% of consumers questioned claimed that they would eat more cabbage if it produced fewer odours during cooking. Therefore, consumer preferences should be explained by the descriptor such as “cabbage odour”, “potato flavoured”, “rancid aroma”, “pungent flavour”. Most consumers preferred cabbage with high notes of cabbage and potato flavours and with few pungent and rancid notes (A&D, 01/2004-n°78). o List of sensory attributes
Raw cabbage
o Odour: Onion Sewage/gas Cresson/nasturtium/mustard Earthy/wasabi Green apples/blackberry Fresh nuts/pumpkin Marine odour Cucumber Fruity/citrus Weed-like
o Taste : Sweet Bitter Pungent
o Texture : Juiciness Crispness Fibrousness Long finish Firmness Elasticity
Cooked cabbage o Odour:
Cabbage Potatoes Rancid
o Taste : Sweet Bitter Pungent
o Texture : Fibrousness Tender
When evaluating the protocol, three composite descriptors were identified as essential to differentiate and characterise the raw and cooked samples. These are ‘fruity taste, crispness, pungent sensation’ and ‘cabbage taste, fruity taste, crispness’.
Table 16: Sensory descriptors for cabbage (raw / cooked)
37
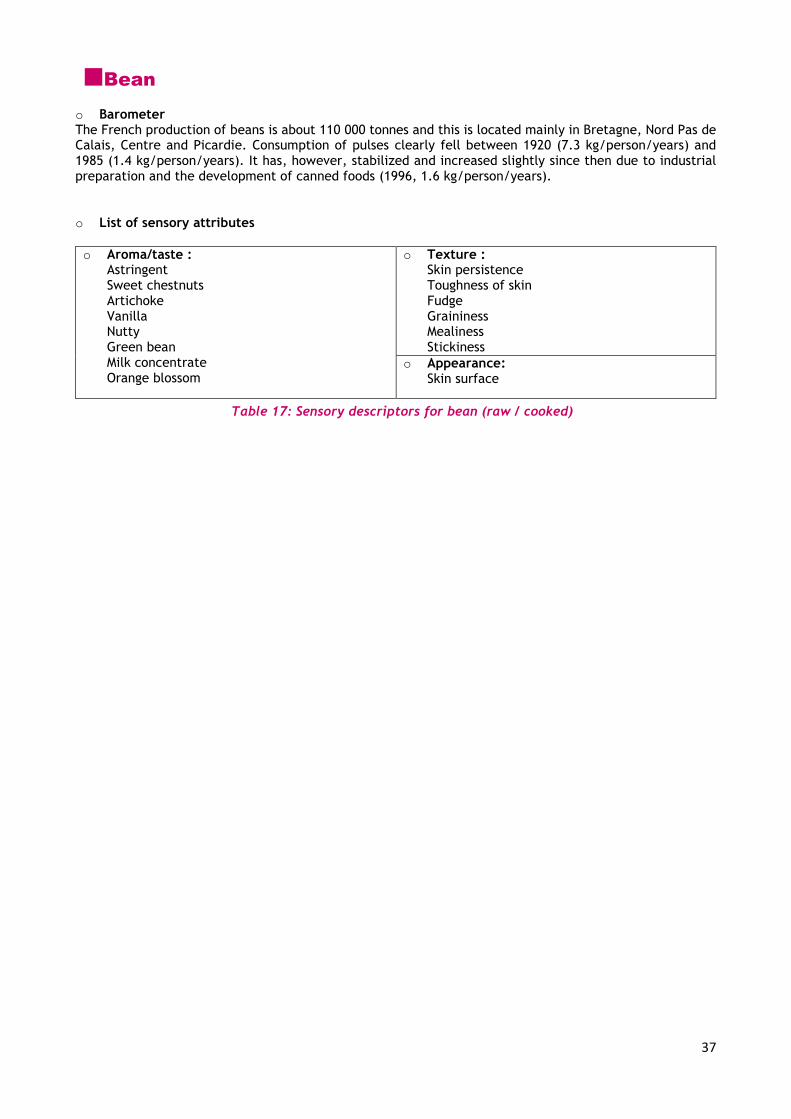
■ Bean o Barometer The French production of beans is about 110 000 tonnes and this is located mainly in Bretagne, Nord Pas de Calais, Centre and Picardie. Consumption of pulses clearly fell between 1920 (7.3 kg/person/years) and 1985 (1.4 kg/person/years). It has, however, stabilized and increased slightly since then due to industrial preparation and the development of canned foods (1996, 1.6 kg/person/years).
o List of sensory attributes
o Aroma/taste :
Astringent Sweet chestnuts Artichoke Vanilla Nutty Green bean Milk concentrate Orange blossom
o Texture : Skin persistence Toughness of skin Fudge Graininess Mealiness Stickiness
o Appearance: Skin surface
Table 17: Sensory descriptors for bean (raw / cooked)

Summary: This technical booklet provides methodologies and guidance to implement sensory
evaluations for organoleptic quality assessment in multi-actors projects for organic agriculture. It
presents five detailed tests that can be used in sensory evaluation, methodologies on how to prepare
the samples and a glossary. This booklet has been developed under Solibam project and updated
during Diversifood project.
How to cite this document: Vindras C., Sinoir N., Coulombel A., Taupier-Letage B., Rey F. ITAB.
2018. Tasting guide: Tools to integrate organoleptic quality criteria into breeding programs. Technical
booklet. Diversifood Project.
Editor: Frédéric Rey (ITAB)
Design: Aude Coulombel, Nicolas Sinoir (ITAB)
Contact: [email protected]
This project has received funding from the European Union’s Horizon 2020 research and innovation programme under grant agreement No 633571 and FP7- KBBE-245058
www.diversifood.eu
www.solibam.eu