144-145-INCOIS-Special-2020.pdf - Geography and You
92
GEOGRAPHY and YOU A DEVELOPMENT AND ENVIRONMENT FORTNIGHTLY PRICE `150 VOL. 20, ISSUE 6-7, NO. 144-145, 2020 FOCUS ON THE SCIENTIFIC SERVICES OF INCOIS FOR ENHANCING LIVES AND LIVELIHOOD IMPACT OF OCEAN SERVICES ON THE SOCIETY ELEMENTS OF NUMERICAL OC EAN MODELLING INDIAN TSUNAMI EARLY WAR NING SYSTEM OCEAN DATA AND INFORMATIO N SYSTEM OCEAN STATE FORECAST SERV ICES EMPOWERING SEAFARERS OF INDIA SEAS OF THE SPECIAL ISSUE SENTINELS
-
Upload
khangminh22 -
Category
Documents
-
view
1 -
download
0
Transcript of 144-145-INCOIS-Special-2020.pdf - Geography and You

GeoG
raph
yand
you
A De v e l op m e n t A n D e n v i ron m e n t f ort n i g h t lypr
ice `
150
Vol.
20, is
sue 6
-7, No
. 144-1
45, 2
020
Focus on the scientiFic
services oF incois For
enhancing lives and livelihood
Impact of ocean ServIceS on the SocIety elementS of numerIcal ocean modellIng IndIan tSunamI early WarnIng SyStem ocean data and InformatIon SyStem ocean State forecaSt ServIceS empoWerIng SeafarerS of IndIa
SEASoF the
SPECIAL ISSUE
SEntInElS

Guest editor’s opinion
4 Ocean Science to Services shailesh nayak
director’s opinion
6 Impact of Ocean Services on the Society satheesh c shenoi
incois | parameterisinG
8 Ocean Observations: Contributions ofESSO-INCOIS
V p thangaprakash, m s Girishkumar, n suresh Kumar, ajaykumar, a nherakkol and e pattabhi rama rao
ESSO-INCOIS has been maintaining in-situ observation networks in the Indian Ocean under the Ocean Observation Network (OON) to understand the health of marine habitats.
18 Ocean State Forecast Services for theMaritime Community
t m Balakrishnan nair, r Harikumar, K srinivas, m anuradha, m Kaviyazhahu, r Kumari & Y Grover
India is the only country in the northern Indian Ocean having an operational ocean state forecast services housed in ESSO-INCOIS, supported by in situ and satellite observations.
26 Elements of Numerical Ocean Modelling Francis p a Taking a close look at the core elements of the numerical ocean
modelling that serves as a virtual diving gear, this article delves into the unfathomable depths of the marine world.
32 Ocean data and information system | ODIS r Venkat shesu, t V s udaya Bhaskar, e pattabhi
rama rao & ssc shenoi
36 Digital Ocean e pattabhi rama rao, t V s uday Bhaskar, r V shesu, s Kumar, n srinivasa rao & ssc shenoi This article presents the development of a digital ocean, a single
platform that efficiently integrates the heterogeneous ocean data and provides advanced visualisation.
incois | disaster manaGement 40 Indian Tsunami Early Warning System: Future
Developments e pattabhi rama rao, ch patanjali Kumar, B ajay Kumar, mV
sunanda, r s mahendra, pLn murty, J padmanabham, d saikia & ssc shenoi
This article describes components of the Indian Tsunami Early Warning System(ITEWS) that was established after the 2004 tsunami, including the decision support system and bulletins.
GeoGraphy and youVOL. 20 ISSUE 6-7 No. 144-145 2020
G’nY SINCE 2001GEoGraphYaNdYou.Com
a dEvElopmENt aNd ENvIroNmENt fortNIGhtlY
48 Forecasting Tropical Cyclones in the Indian Ocean: A HYCOM-HWRF Coupled System
sudheer Joseph, a srivastava, a K das, a sharma, a mehra, Hyun-sook Kim, d iredell, s Gopalkrishnan, K J ramesh, m mohapatra, s s c shenoi & m rajeevan
Forecasting cyclones rising in the Indian Ocean is discussed. ESSO-INCOIS and ESSO-IMD and National Oceanic and Atmospheric Administration (NOAA) work in collaboration.
54 Coastal Vulnerability and Risk Assessment r s mahendra, p c mohanty, e shiva Kumar
& e pattabhi rama rao This article presents ESSO-INCOIS’ use of remote sensing data
combined with GIS technology that assesses the flooding concerns of India’s coasts and predicts its vulnerability.
62 Monitoring of Algal Blooms in the Indian Seas s K Baliarsingh, a samanta & a Lotliker The world is experiencing frequent episodes of algal bloom events
in different oceanic regions. This article presents algal bloom monitoring service of ESSO-INCOIS for the Indian waters.
incois | For peopLe 68 Fish-finding from Space: The Indian Journey nagaraja Kumar & nimit K The PFZ technology for marine advisory and forecast services has
resulted in a remarkable betterment of lives and livelihoods of the fishing community across the Indian coast.
72 Empowering Seafarers of India r Harikumar, m nagarajakumar & t m Balakrishnan nair ESSO-INCOIS provides a host of economic and environmental
benefits to the coastal populace through a wide variety of services. Surveys find out the efficacy of the services.
80 International Training Centre for Operational Oceanography
tVsu Bhaskar, L rose, B rohit, rK Jha, m preetham & ssc shenoi In 2012 an International Training Centre for Operational
Oceanography (ITCOocean) was set up at ESSO-INCOIS.
In BrIef2 Letters; 3 Editor’s Note; 86 Reaching Out; 88 Books & Website
Expert PanelRasik RavindraGeologist and Secretary General, 36 IGC, New Delhi.
Sachidanand SinhaProfessor, CSRD,Jawaharlal NehruUniversity, New Delhi.
B MeenakumariFormer Chairperson,National Biodiversity Authority, Chennai.
Ajit TyagiAir Vice Marshal (Retd) Former DG, IMD,New Delhi.
Saraswati RajuFormer Professor, CSRD,Jawaharlal NehruUniversity, New Delhi.
K J RameshFormer Director General, IMD, New Delhi.
Prithvish NagFormer Vice Chancellor,MG Kashi Vidyapeeth,Varanasi.
B SenguptaFormer Member Secretary, Central Pollution Control Board, New Delhi.
Write Editorial Office: LIGHTS, 501 & 504, Bhikaji Cama Bhawan, Bhikaji Cama Place, New Delhi - 110066. Letters may be edited for clarity and length. Include name, address and telephone. Phone 011-46014233, 26186350 e-mail [email protected] http://goo.gl/eIeaH, linkedin http://in.linkedin.com/pub/geography-and-you/5a/b32/b24 Website www.geographyandyou.com. subscriPtions For institutional subscriptions of print copies you may write to [email protected] contribute an article: Kindly send the abstract of your article in not more than 200 words to [email protected] abstract will be reviewed by our peers. Once selected we shall respond for the procurement of full article. The length of the final article may range from 1000 to 1500 words. Please visit our web site for publication and peer review policy.The Editorial Advisor.
GeoGraphy and you
Guest editorSHaILESH NayaK
editor SuLaGNa CHaTTOPaDHyay
leGal advisor KrISHNENDu DaTTa
esso-incois editorial team S S C Shenoi
haSibur rahaman CelSa almeida
cover Photo
FISHErmaN aT COCHIN By PraSaD
corresPondence/ editorial oFFice
504, BHIKajI Cama BHawaN, BHIKajI Cama PLaCE, NEw DELHI - 110066
PHONE: +91-11-46014233; +91-11-26186350
FOr NEw SuBSCrIPTIONS, rENEwaLS, ENquIrIES
PLEaSE CONTaCT CIrCuLaTION maNaGEr
E-maIL: [email protected]
PLEaSE vISIT Our SITE aT www.geographyandyou.com
FOr FurTHEr INFOrmaTION.
©GeoGraPhy and youaLL rIGHTS rESErvED
THrOuGHOuT THE wOrLD. rEPrODuCTION IN aNy maNNEr, ParT Or wHOLE, IS PrOHIBITED.
Printed, Published and oWned by dr narmadeshWar
Prasad.
Printed at INDIa GraPHIC SySTEmS PvT. LTD. F-23, OKHLa INDuSTrIaL
arEa, PHaSE-1, NEw DELHI - 110020.
Published FromLEarNING IN GEOGraPHy,
HumaNITIES, TECHNOLOGy aND SCIENCE (LIGHTS)
504, BHIKajI Cama BHawaN, BHIKajI Cama PLaCE, NEw DELHI - 110066.
GEOGraPHy aND yOu DOES NOT TaKE aNy rESPONSIBILITy FOr rETurNING uNSOLICITED PuBLICaTION maTErIaL.
aLL DISPuTES arE SuBjECTED TO THE ExCLuSIvE jurISDICTION OF COmPETENT
COurTS aND FOrumS IN DELHI/NEw DELHI ONLy.
For more details log on to our website www.geographyandyou.com
Vol. 20, Issue 4-5, No. 142-143, 2020 | G’nY is of contemporary relevance and is based on empirical observations. Nevertheless, the article ‘On the margin in God’s own city’ for the city of Varanasi could have been enriched with the addition of a nuanced map. I particularly enjoyed Deepak K Mishra’s article. It presented the inter-related aspects of social groups, financial power and socio-economic status. More coverage on the middle class, agriculture, health and nutrition should be made a part of G’nY. Also an issue on ‘regional planning in India’ with a focus on environment, sustainable development and other regional development programmes would be good.—JAYesh YADAV, Via Consumer Feedback
& cultural heterogeneity among Muslim of India” also bestow many interesting facts. In one of the upcoming issues I would urge the team to incorporate content on “halal certification, its relevance & why ‘non meat industry’ approaches for halal certification.—Atul ANAND,Via Consumer Feedback.
readinG G’ny has alWays been an enriching experience. I find the rare availability of print magazines and mobile compatibility of e-magazine a problem. In the last issue titled Caste Class in India, I found the article, ‘understanding caste and class: categories and measurement ‘ the most informative., It has covered both the modern and ancient perspectives of divisions. Mutating and futuristic scenario of caste and class should have been discussed in the way forward though. I would like to read a magazine on ‘human geography ‘ topics like Geographical
as a subscriber oF G’ny, I am fully satisfied with your articles. the latest issue Caste Class in India provided me with a newer perspective on the socio economic problems of our country. the approach was straight forward and provided with suitable examples. Being a uPsC aspirant with Geography as my optional, the Caste Class in India has given me content for case studies. In the future editions, I would like to read development oriented topics and their consequences on environment like - sanctuaries, bullet train proposed passing through protected areas or coal mining approval in wildlife sanctuary in Arunachal.— ROhAN ChAuDhARY, Via Consumer Feedback
in the last issue titled Caste Class in India, the article “understanding caste and class” by R B Bhagat was most useful. It gave some depth on the most debatable topic in India. “social diversity, hierarchy,
thoughts especially from the perspective of Indian geographers.—sANJeet KuMAR sINGh,Via Consumer Feedback.
i enjoyed readinG the Jan 1-15, 2019 issue of “Ocean tech”. I am impressed by the thoroughly researched and well documented article on “Recent Developments in shore Protection for India’s Coasts” by MV Ramanamurthy et al. the article is well supported with extensive illustrations, which helps in visualizing the read.—surajit Das, Via Consumer Feedback.
understandinG caste and Class: Categories and Measurement in the last issue was beautifully written and illustrated with charts and data sheets along with certain steps to be taken towards the same. I would request GnY to pay more attention to the concluding section so as to create a neutral mindset over the uPsC aspirants following this magazine. —PRAshANt DAsh, Via Consumer Feedback.
2 2020 GeoGraphy and you vol 20, issue 6-7 no. 144-145
The secrets of the seas Seafarers inhabit two diverse realms, the proverbial chalk and cheese, land and ocean. In their fearless hearts lie a calling so unique that the deep blue instills a need to explore, to seek and to mark the rolling waves with myriad instruments that ferret the secrets of the seas. The Earth System Science Organisation’s premier institution Indian National Centre for Ocean Information Services (INCOIS), located in Hyderabad sets out to engage in the most arduous of all tasks, making sense of the vast seas and oceans around the Indian subcontinent. There are three sets of players in this great scheme. The first is at sea, a diverse network of buoys deployed with care in far flung locations. Some of these buoys are anchored, while others float below the water, automatically adjusting its buoyancy to reach varied depths. They collect a whole range of information, ranging from temperature and salinity to even wave heights. Second, are the satellites orbiting in space, that link the data emanating from the oceanic buoys and relay it in real time to a dedicated array of computers housed in the institute. And finally, the data computing laboratories that present the big picture, coalescing findings from the tiny secrets that the watery depths throw up. The people of ESSO-INCOIS stand tall, guiding seafarers and the coastal community towards reaping the benevolence of the deep, as also protecting them from its intermittent maleficity. This issue is thus dedicated to the sentinels of the seas—the scientists of India’s pride, the ESSO-INCOIS. Happy reading.
Sulagna ChattopadhyayFounder-Editor,
Geography and You,New Delhi
editor@ geographyandyou.com
Editor’s note
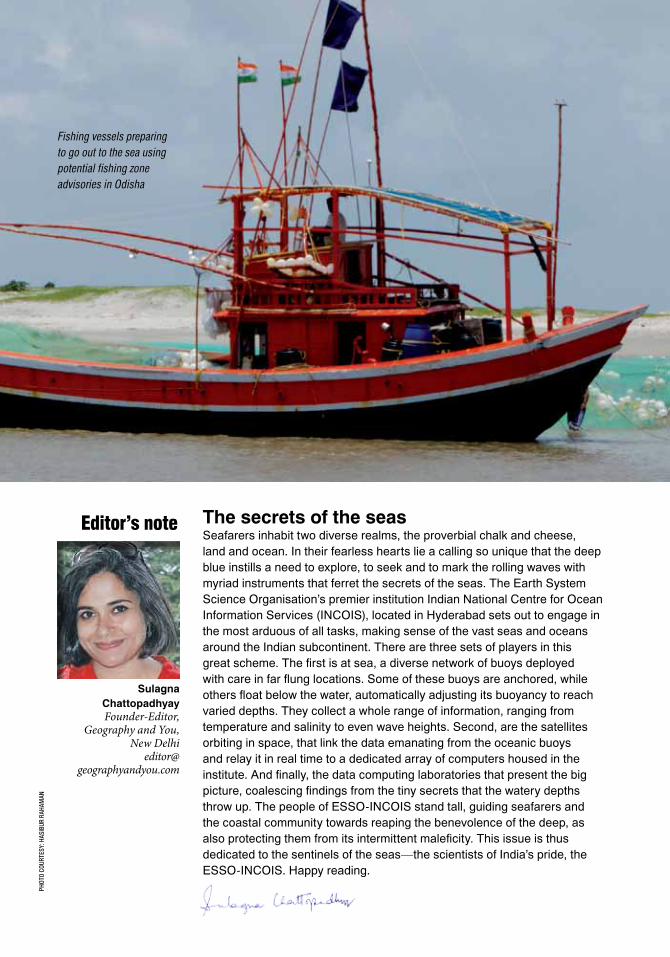
Fishing vessels preparing to go out to the sea using potential fishing zone advisories in Odisha
Phot
o Co
urte
sy: h
asib
ur r
aham
an

4 2020 GeoGraphy and you vol 20, issue 6-7 no. 144-145
ShaileSh NayakDirector, National Institute of Advanced Studies, Former Secretary, Ministry of Earth [email protected]
Ocean is one of the most important components of the earth system as it provides us with living and mineral resources, energy and an ecosystem that is instrumental for our survival. In view of the importance of oceans, the United Nations has declared 2021-2030 as the ‘Decade of Oceans.’ This
period coincides with the 2030 Agenda for Sustainable Development, especially the Sustainable Development Goal (SDG) 14. The SDG 14 expressed a commitment to ‘Conserve and sustainably use the oceans, seas and marine resources for sustainable development’. In view of these developments, the special issue of G’nY is timely. The scientific research on oceans has identified a complex array of biophysical goods and services that marine and coastal environments provide to people. Economic and social research has showcased multiple values of these environments and measured their contributions to human health, well-being and development.
The ocean biological resources, especially fin fish, shellfish and seaweeds are being exploited to meet protein requirements. Satellite-based information on ocean colour, sea surface temperature and sea surface wind are being used to generate information on potential fishing zones (PFZ). Daily advisories on PFZ and sea state conditions are provided to fishermen since the last twenty-five years. The multilingual advisories, now in a mobile App, have helped fishers reduce the time for search, save in fuel cost and lower the catch per unit effort. At present, 90 per cent of fishers are utilising this service. Ocean colour products for the Indian Ocean are generated to answer questions such as how much phytoplankton the oceans contain, where they are located, how distribution is changing with time and how much photosynthesis they perform. One of the important services is about initiation, growth and decay of the algal blooms along the Indian coast, a knowledge vital for fishers and pollution control authorities. Corals are likely to be affected by warming of seas. A Coral Bleaching Alert System (CABS), providing bimonthly status of four major coral environments of India—Andaman and Nicobar Islands, Lakshdweep Islands, Gulf of Mannar and Gulf of Kachchh has been set up. This service provides early signs of the coral degradation that undergo thermal stress and possible bleaching.
The information on sea state—sea surface temperature, currents, mixed layer depth, waves and tides) is required for economic activities such as shipping, fishing, oil and gas production. Ocean general circulation model and regional ocean modelling system are being used to develop the Indian Ocean forecasting system. Numerical models have been customised to forecast waves, ocean currents and sea surface temperature among others, on a daily basis for the entire Indian coast at various spatial scales.
Tsunami is a system of ocean waves formed as a result of large scale disturbances of the ocean floor. A state-of-the-art tsunami warning system, capable of receiving and analysing seismic and sea level in near real time from the Indian and global stations was set up in 2007. It provides advisories about travel time and run up height of a tsunami at 1800 coastal
Gue s t e d i t or ’ s op in i on
Ocean Science to Services

GeoGraphy and you 2020 5
forecast points within 10 minutes of the occurrence of an earthquake, to India and the Indian Ocean rim countries. The system has provided useful advisories in the last thirteen years and is recognised as the Regional Tsunami Service Provider for the Indian Ocean, ensuring leadership position of India in the Indian Ocean. The recent successes of prediction of location of centre, track, landfall point of cyclones and associated surge have been largely due to improved ocean observations including satellite scatterometer data and their assimilation into models. The recent use of the Hybrid Coordinate Ocean Model (HYCOM) has assisted in the accurate, reliable and timely predictions of cyclones, leading to very efficient response from the local, state and central administration. The loss of lives which was in thousands in the last century has now come down to 10-20. Coastal vulnerability maps—cyclone, tsunami, and sea level rise, for the entire Indian coast, based on projected long-term rise in sea level and climatological data along with geomorphological setting have been produced. The vulnerability has been defined as an index indicating likelihood of physical changes that may occur and the natural ability of the coastal system to change environmental conditions. Such maps provide base level information for coastal management and are widely used by local administration.
The Indian Ocean has been poorly observed compared to the Pacific and Atlantic Oceans. The first expedition to the Indian Ocean in the early sixties provided insight into
the role played by the Indian Ocean in modulating the global system. The setting up of the Indian Ocean Global Ocean Observation System (IOGOOS) in 2001 gave a major boost. Recently, the Inter-governmental Oceanographic Commission (IOC), UNESCO in collaboration with Scientific Committee on Oceanographic Research (SCOR) and IOGOOS have launched the second International Indian Ocean Expedition (IIOE-2) to focus on the role of oceans on climate change. IIOE-2 has provided a great opportunity to scientists of this region to participate and contribute to increase the understanding of the ocean. India has committed to provide logistics research vessels, scientific and technical manpower and financial resources to IIOE-2.
The large volume of data of the Indian Ocean collected in the last fifty years or so, have been organised around a geographic information system (GIS) framework as the Ocean Data and Information System (ODIS). It provides data on physical, chemical and biological parameters of oceans and coasts on various spatial and temporal domains that are vital for research and operational oceanography. This end-to-end system has matured as a prime vehicle, providing advisory services such as potential fishing zones,
ocean state forecast, tsunami, coral reef alert and ocean data. The implementation of the ‘Digital Ocean’ will improve the integration of various oceanographic parameters for the understanding of ocean processes.
Operational oceanography in India has got a tremendous boost in recent years due to rapid advances in satellite observations and modeling as well as computing, navigation and communication technologies, along with GIS which facilitated web and location-based services. To address the need for education and capacity building in the Indian Ocean region on operational oceanography, an International Centre on Operational Oceanography (ITCOcean) has been set up in ESSO-INCOIS. This Centre has been recognised as a Category II institute by UNESCO. ESSO-INCOIS has built effective communication with various stakeholders including policy makers. The usefulness and benefits of ocean information at local to national level has been demonstrated and thus the support of governments has been ensured for various activities. During the last two decades, the increased investments in ocean research for discovery of new phenomena, understanding of oceanic processes and their interaction with anthropogenic activities have led to the generation of new and strategic knowledge. Such knowledge has been innovatively used for the sustainability of oceans and building services for humanity.
The Indian Ocean has been poorly observed compared to the Pacific and Atlantic Oceans. The first expedition to the Indian Ocean in the early sixties provided insight into the role played by the Indian Ocean in modulating the global system.

6 2020 GeoGraphy and you vol 20, issue 6-7 no. 144-145
SatheeSh C ShenoiDirector, Earth System Science Organisation-Indian National Centre for Ocean Information Services (ESSO-INCOIS)[email protected]
Impact of Ocean Services on the Society
One of the ‘seven social sins’ identified by Mahatma Gandhi includes ‘science without humanity’. That is, the science not useful for humanity is a sin. This gives us the message that science that is happening in laboratories should be put to use by the common man. The Indian government decided to establish the Indian
National Centre for Ocean Information Services (INCOIS) in February 1999 with a mission to translate knowledge, data and information in marine sciences to advisories, warnings and information in a usable and understandable form so that the general populace can apply it to reap benefits. Accordingly, ESSO-INCOIS concentrated on ‘translational application of the research outcomes/knowledge in marine sciences’ to formulate simple products for the use of fishers, navigators, port and harbours, Indian Navy, Indian Coast Guard and the maritime industry. Providing such services on a day-to-day basis required continuous real time data availability, both from satellites and in situ platforms deployed in the ocean, formidable numerical models and computing and information technology infrastructure. Over the past 20 years, ESSO-INCOIS has evolved as a world class ocean information and services centre, recognised and well accepted world over.
When we think of the oceans, fishing is the first activity that comes to mind. Millions of fisherfolk depend on fishing for their livelihood, roughing it out at sea looking for shoals of fish to cast their net. Though their experience and traditional knowledge come in handy, they often fail to find abundant fish. On many occasions, they spend a great deal of time and fuel in the oceans only to return with low or almost no catch. Keeping this in mind, the first service that was put out by ESSO-INCOIS was the potential fishing zone (PFZ) advisory. This made use of the relation between the sharp gradients in sea surface temperature (SST) formed due to the formation of transient fronts (due to the juxtaposition of warmer and cooler waters) and the associated higher concentrations of chlorophyll, the primary food in the ocean. Fish were found to be aggregating in these regions. The relationship was identified by the Space Application Centre (SAC), Ahmedabad, an ISRO Centre, when they analysed the daily data obtained using the satellite-based sensors. Today, the daily advisories on potential fishing advisories provided in the languages spoken in nine coastal states of India are directly used by 0.68 million (6.76 lakh) fisherfolk through their mobiles. The total number of fishers who venture out into the sea is estimated to be 0.9 million (9 lakhs). The number of fishers who receive advisories through other means such as the 100 odd electronic display boards installed by ESSO-INCOIS at fishing harbours and fish landing centres and through third party (NGOs and mobile apps) services are unknown. Several studies, conducted by ESSO-INCOIS as well as by independent agencies such as the National Centre for Applied Economic Research (NCAER) and the National Agricultural
D i r ec t or ’s oP in i on
O

GeoGraphy and you 2020 7
Innovation Project, ICAR, have shown that the use of PFZ advisories helped the fisherfolk in multiplying their profits three times over.
The other major services provided by ESSO-INCOIS include ocean state forecasts (OSF), tsunami early warnings (TEW), storm surge early warnings and the generation of ocean initial conditions for the atmospheric models used for the prediction of weather and climate. The OSF provides daily forecasts of ocean weather—waves, currents and SST, for five days in advance to all types of users from low technology fishers to high technology oil and natural gas companies. The specialised services that make use of the forecasted winds, waves and currents help the Indian Coast Guard and Maritime Police in locating and rescuing missing objects such as missing fishermen and fishing boats at sea and in predicting the movement of oil spills.
The Tsunami Early Warning System (TEWS) was established at ESSO-INCOIS in October 2007 on the directions of the Indian government after the devastating tsunami in the Indian Ocean on December 26, 2004. The end-to-end system consists of seismic sensors to monitor large earthquakes on the seaf loor, sea level gauges and tsunami buoys to detect
the tsunami waves (if generated), processing software for real time processing of seismic and sea level data, decision support and auto dissemination systems, numerical models to assess the time of arrival and expected height of tsunami waves on the coast at different locations. TEWS is supported with modern communication systems including satellite communication for real time reception of data from various sensors deployed at remote locations on land and sea. The system disseminates early warnings in the quickest possible time and is the first warning system to achieve the target of providing location specific early warnings on tsunamis. The approach eliminated the possibility of false warnings that can arise for the basin wide early warnings provided only on the strength or magnitude of an earthquake. Considering the consistent performance of TEWS, the Intergovernmental Oceanographic Commission (IOC) of UNESCO designated it as the Regional Tsunami Service Provider for the entire Indian
Ocean region. Accordingly, since October 2012, TEWS is also providing early warnings and advisories to 25 countries on the Indian Ocean rim. Though no major tsunami occurred in the Indian Ocean since December 2004, the advisories and early warnings issued at the times of large earthquakes in the Indian Ocean helped the government as well as the coastal population and sensitive installations not to panic and evacuate. The study conducted by NCAER in 2015 adds that the panic evacuation of millions from coastal areas would have cost at least INR 30000 to 40000 million in the wake of the 8.2 magnitude earthquake that occurred on the seabed west of Northern Sumatra, Indonesia on April 11, 2012.
Though ocean services provided to the society have been impactful and are here to stay, a lot more can be done for the safety, sustainability and gainful living of all stakeholders. Perhaps limitations in our capacity to think far and the requisite resources required are impediments. In that perspective, it would be pertinent to end with a quote from Mahatma Gandhi’s 1925 speech to college students in Thiruvananthapuram, “In my humble opinion, there are limitations even to scientific search and the limitations that I place upon scientific search are the limitations that humanity imposes upon us”.
Ocean services provided to the society have been impactful and beneficial, but a lot more can be done for the safety, sustainability and gainful living of all stakeholders.

8 2020 GeoGraphy and you vol 20, issue 6-7 no. 144-145
The authors are scientists at the Earth System Science Organisation-Indian National Centre for Ocean Information Services, Hyderabad, Ministry of Earth Sciences (MoES), India. [email protected].
The article should be cited as Thangaprakash V. P., M.S. Girishkumar, N.S. Kumar, A. Kumar, N. Nherakkol and E. P. R. Rao, 2020. ESSO-INCOIS contribution to Ocean Observations, Geography and You, 20(6-7): 8-17
By V P Thangaprakash, M S Girishkumar, N Suresh Kumar, Ajaykumar, A Nherakkol and E Pattabhi Rama Rao
OceanO b s e r v a t i O n s
Contributions of Esso-inCoisThe ocean plays a vital role in determining weather and climate. The physical and chemical state of the ocean is key to determine marine
habitats and the health of marine lives. Hence, it is imperative to understand the causes of variability in the ocean state across different
time scales through data collected by in-situ ocean observation platforms. Further, the knowledge acquired through in-situ observation
networks act as building blocks in the development of ocean state forecasting systems. Considering these aspects, ESSO-INCOIS has been
maintaining various in-situ observation platforms in the Indian Ocean under the Ocean Observation Network (OON) programme. A synopsis of
these networks is summarised in this article.
I N CO I S | Pa r a me t er I S I Ng
GeoGraphy and you 2020 9
Phot
o Co
urtE
sy: D
EEP
sEAr
Ch20
17, n
oAA-
oEr/
boEM
/usG
s
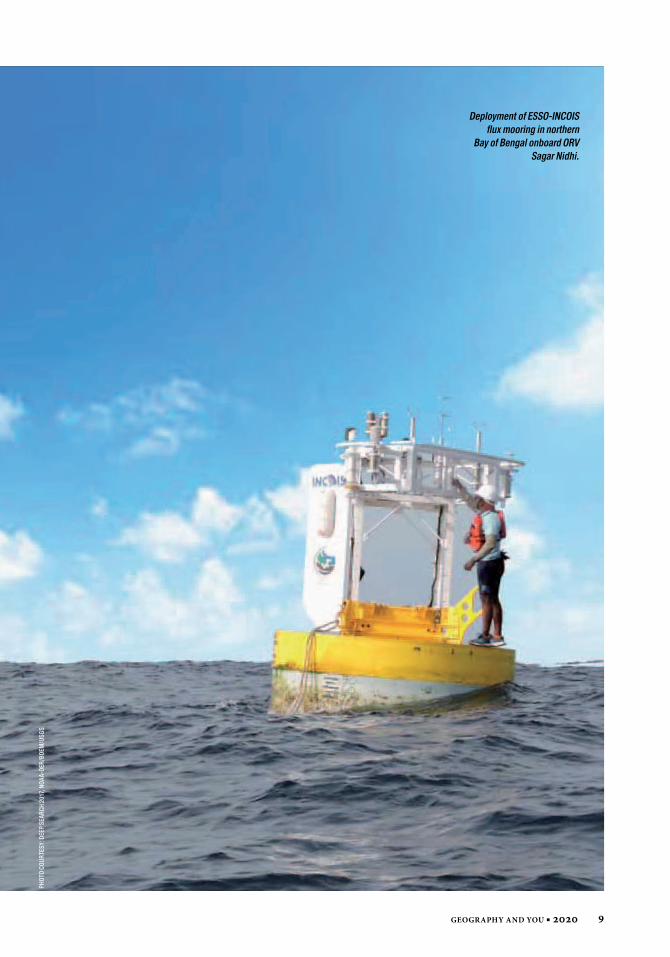
Deployment of ESSO-INCOIS flux mooring in northern
Bay of Bengal onboard ORV Sagar Nidhi.

10 2020 GeoGraphy and you vol 20, issue 6-7 no. 144-145
A composite network of in-situ ocean observations act as an integral part of all operational ocean forecast systems. Information obtained through these networks enables the
understanding of ocean state and its underlying physics, which then facilitates its evaluation with numerical models. Further, ocean observations provide vital information about past and present climate that assists researchers in the estimation of future climate systems. Policy makers, social and environmental conservationists can consequently use the estimations for better preparedness to help mitigate its impacts on the ecosystems and the society. Before the 20th century the Indian Ocean was under-sampled. Efforts were scaled up by the Ministry of Earth Sciences (MoES) with the initiation of various observational systems under the Ocean Observation Network (OON) programme. The ESSO-INCOIS and ESSO-NIOT in collaboration with other institutes were entrusted with the implementation of OON. Broadly classified into coastal observing systems, large-scale observing systems and mesoscale and sub-mesoscale ocean observing systems, OON includes systems that cater for disaster management too (Fig. 1). This article presents the ocean in-situ observational network maintained by INCOIS and its contribution to the society.
Coastal ocean observing systemsA coastal ocean observing system comprises many platforms which gather information on the continental slope and shelf regions along the Indian coast and islands. Such platforms include the Wave Monitoring Along Near-shore (WAMAN) buoy networks that use the Wave Rider Buoy (WRB), coastal Acoustic Doppler Current Profilers (ADCPs) and tide gauge networks. The WAMAN project was initiated in 2008 and currently 15 WRBs are active along the Indian coasts (Fig. 2). WRBs measure wave height and wave direction, surface current and temperature. The near real-time data received through INSAT communication from the WAMAN network is extensively used to refine model wave forecasts. It also allows an opportunity for long-term monitoring of wave characteristics along the coasts, especially during extreme weather events such as cyclones. ESSO-INCOIS also maintains a WRB off Seychelles to
ESSO-INCOIS in collaboration with CSIR-NIO, is maintaining a vast amount of
in-situ observation platforms to support the development of ocean state forecast
system.

GeoGraphy and you 2020 11
monitor the northward propagation of Southern Ocean swells, which significantly impact India’s coasts.
To document coastal current variability at seasonal, intraseasonal and interannual time-scales, ESSO-INCOIS in collaboration with CSIR-National Institute of Oceanography (NIO), maintains 17 coastal ADCP sub-surface moorings network along the coasts (Fig. 3) where 13 moorings are just beyond the continental slope—one in each coastal state and 4 shelf moorings off the east coast with inter-mooring space of 2.5 to 3o. Data from this network also provides an opportunity for validation of current fields simulated by the general ocean circulation models.
In order to monitor the progress of tsunami waves, ESSO-INCOIS maintains 36 tide gauge stations in collaboration with Survey of India (SoI), Dehradun from 2010 onwards (Fig. 4). These data are used to understand long-term sea level trends, as well as to validate storm surge model outputs. Out of 36 stations, 21 stations are equipped with radar, pressure and shaft encoder sensors with INSAT communication since 2010-2011 while 15 stations have been equipped with only radar sensors with GPRS since 2015-2016. Both are received at ESSO-INCOIS in real-time.
large scale observing systemThe large-scale ocean observing system consists
Fig. 1: Representation of observational activities at temporal and spatial scales
of many platforms—tsunami buoys, Lagrangian-based Argo floats, drifters, automatic weather stations (AWS), eulerian-based flux and current moorings and expendable bathythermograph (XBT)/ expendable conductivity temperature and depth (XCTD). The primary objective of tsunami buoys are to provide support for the Indian Tsunami Early Warning Centre (ITEWC) where early warnings of tsunami service are provided 24x7 by ESSO-INCOIS. The ITEWC monitors and detects the propagation of tsunami waves by gathering inputs from the real-time network of seismic stations (to detect earthquakes) and tsunami buoy systems with bottom pressure recorders (BPRs) and tide gauges. Further, to enhance the inputs to ITEWC, ESSO-INCOIS deployed four tsunami buoys in 2010, which together with three other tsunami buoys maintained by ESSO-NIOT from 2007 onwards, relay data in real time (Fig. 4). These high-precision buoy-BPR systems can detect even minor 1 cm vertical changes in the water level. In addition, real-time data from nearly 50 other buoys in the Pacific and Indian Ocean operated by other countries are also received at ITEWC and made available online to assist decision-making.
The Argo programme is a partnership between more than 30 nations under the Global Ocean Observing System (GOOS) to provide a three-dimensional view of ocean temperature and
Centuries
Decadal
Inter-annual
Seasonal
Daily
Hourly 1 sq km Regional/106 sq km Ocean basin GlobeSpace
Tim
e
Coastal Regional Global
FishermanVessel
Ferry box
High frequency radars
Subsea observation
Gliders
Voluntary observing ship data
Remote sensing
MooredTime SeriesIn network
RegionShipTime
Series
Repeat Trans-Basin Sections

12 2020 GeoGraphy and you vol 20, issue 6-7 no. 144-145
Fig. 3: Locations of coastal acoustic doppler current
profiler (ADCP) network and equatorial ADCP moorings
along the Indian coast
Fig. 4: Locations of the network of tsunami
buoys and tide gauges network
Fig. 2: Locations of Wave Rider Buoy
(WRBs) deployment along coast of India
Port blair
Veraval
Versova
Ratnagiri
Karwar
Kozhikode
AgattiKottam Colachel
Okha
Mumbai
Jaigarh
Goa
Udupi
Cuddalore
Kollam
Kanyakumari
Nellore
Visakhapatnam
Gopalpur
Digha
Kakinada
Puduchery
Krishnapatnam
Vizag
Gopalpur
Digha
Seychelles
Tide gauge
Tsunami buoy
Subduction zone
Shelf moorings
Slope moorings
Equatorial moorings

GeoGraphy and you 2020 13
salinity structure. India joined this programme in 2002, currently deploying 40 floats per year in the Indian Ocean, with one-third of the floats having the capability of measuring biogeochemical parameters, such as, dissolved oxygen, chlorophyll and optical backscatter. Argo data provides an opportunity to examine basin-scale evolution of seasonal, intra-seasonal and inter-annual variability (Ravichandran et al. 2012) and also to document the ocean response during extreme weather events such as tropical cyclones, where ship-based measurements are not feasible (Girishkumar et al. 2019). Long-term Argo data are used to understand the effects of ocean on climate and also used to validate satellite measurements. As of November 2019, the Indian contribution stands at 482 floats including 53 bio-Argo floats (Fig. 5). Argo datasets help us understand the variability of biogeochemical parameters such as oxygen minimum zone, chlorophyll, phytoplankton community composition, carbon and nutrient export and modulation of these parameters with respect to physical and dynamical forcing. At present, Argo temperature and salinity profiles are extensively used for providing initial conditions to coupled models for monsoon prediction.
In collaboration with CSIR-NIO, ESSO-INCOIS is maintaining three XBT/XCTD transects along Chennai-Port Blair, Port Blair-Kolkata and Kochi-Lakshadweep in the northern part of the Indian Ocean (Fig. 6). The data from XBT/XCTD matches significantly with satellite measurements and is also used to estimate climatology of geostrophic currents.
A large amount of freshwater flux due to precipitation and river discharge in the northern Bay of Bengal (BoB) drives the near surface hydrographic structure and makes it unique. To understand the factors that modulate the evolution of sea surface temperature (SST) and its underlying dynamics, ESSO-INCOIS placed a cone-head mooring with high vertical resolution around 18oN, 89oE during 2009-2013. This was however, lost in 2013 due to fishing vandalism. In 2019, ESSO-INCOIS deployed a flux mooring with a direct covariance flux system (DCFS) near 18oN, 89oE, which is the first of its kind in the northern BoB. The INCOIS-flux mooring is also equipped with near-surface meteorological sensors and sub-surface temperature, salinity and current sensors to capture the vertical hydrographic structure Ph
oto
Cour
tEsy
: Aut
hor
The microstructure profiler is an instrument designed to measure velocity shear and temperature variability on vertical scales of less than a millimetre and simul-taneously record other physical parameters of the ocean. The profiler is constructed to descend to depths as far as 2000 m.

14 2020 GeoGraphy and you vol 20, issue 6-7 no. 144-145
Fig. 5: Spatial distribution of core Argo (red) and bio Argo (green) profiles in the Indian Ocean
Fig. 6: Spatial distribution of XBT (red), XCTD (blue) and coastal Sea Surface Salinity (black) profiles collected during the reporting period under XBT
programme
Fig. 7: AWSs installed onboard MFV Blue Fin, Directorate of Fisheries, Lakshadweep
(left) and RV Ratnakar, Geological Survey of India (right); Fig. 8: Schematic diagram of (left) Vertical Microstructure Profiler (VMP);
(right) underway CTD (uCTD). ESSO-INCOIS conducted various cruises to record the
vertical distribution of small-scale turbulent mixing in the Bay of Bengal and Arabian Sea.
with high vertical resolution. The data from DCFS will provide an opportunity to examine the existing parameterisation algorithm which used to estimate latent, sensible heat and momentum fluxes in the BoB region. Thus, continuous time-series mooring measurements are used to understand air-sea interaction processes that modulates SST (Thangaprakash et al. 2016).
In order to understand the dynamics of equatorial current system and its variability at different time scales (Sengupta et al. 2001), ESSO-INCOIS in collaboration with CSIR-NIO maintains equatorial current meter-mooring network, which consisted of seven ADCP moorings initially, later reduced to two due to logistical issues. The two equatorial current meter moorings and one coastal ADCP mooring along 77oE provides an opportunity to document heat and salt exchange between the Arabian Sea (AS) and the BoB. Each mooring consists of two 75 kHz ADCPs to measure currents between 50-850 m depths.
ESSO-INCOIS in collaboration with CSIR-NIO deployed many surface drifters, which measure SST and surface atmospheric pressure in a targeted coverage of one buoy per 5o grid in the Indian Ocean. Drifter’s data are used for the validation of satellite measurements and also used to document large scale surface current patterns. Moreover, long-term data (1991-till now) are used to study the variability of the upper ocean currents and their relationship to meteorological forcing. Drifters with barometric pressure sensors can provide reasonable coverage of mean sea level pressure in the global ocean and can be assimilated in numerical weather prediction (NWP) models.
Similar to land-based AWS to measure meteorological variables, ESSO-INCOIS installed 34 AWS’s onboard research and survey ships of various Indian institutes and organisations. The AWS systems on these ships provide meteorological measurements wherever they travel, both in the open ocean and along the coast. These data are also helpful for validation of various model outputs and satellite parameters (Fig. 7).
Mesoscale and sub-Mesoscale observing systemsIn-situ observational networks provide useful data to understand synoptic scale variability, but have
low capability of resolving small-scale physical processes such as sub-mesoscale processes (typical length scale 0.1 to 10 km) and small scale vertical mixing processes (in cm scale). These small-scale processes play a significant role to determine the hydrographic structure of the ocean and need to be better understood. These small-scale processes are incorporated in the ocean models as
Coastal stationsExpendable bathythermograph (XBT) Expendable conductivity temperature and depth (XCTD)

GeoGraphy and you 2020 15
7
8
The Lagrangian float, named after the famous French mathematician Lagrange, is a type of autonomous underwater vehicle. Lagrangian The floats can be programmed to record and transmit various kinds of data.
Start payout
Stop payoutStop winch
500m
1000m
2000m
Recover
Upload
Dept
h

16 2020 GeoGraphy and you vol 20, issue 6-7 no. 144-145
a parameterisation scheme—based on the sparse data collected in different parts of the global ocean at different timescales. In order to understand these processes and to validate the performance of small scale mixing parameterisation schemes, ESSO-INCOIS uses advanced technological sophisticated instruments such as seagliders, underway CTD (uCTD), Lagrangian float and vertical microstructure profiler (VMP). This aids the understanding of small-scale processes and
interactions with large scale oceanic systems (Fig. 8).
The seaglider is an autonomous underwater vehicle (AUV) that can perform a hydrographic survey in a pre-prescribed path in the ocean. It moves in a saw-tooth pattern by changing its buoyancy and provides spatial and temporal physical (temperature, salinity, PAR) and biological (chlorophyll, backscatter, dissolved oxygen, coloured dissolved organic matter)
Two-way communication
Deep dive
Temperature and salinity
profiling
10m
Parking depth
Ocean current measurement
Fig. 9: Schematic diagram of (left)
Lagrangian float; (right) seaglider
measurements of ocean
The seaglider is an autonomous underwater
vehicle (AUV) that can perform a hydrographic
survey in a pre-prescribed path in the ocean.
Temperature and salinity
profiling 300m
700m
1000m

GeoGraphy and you 2020 17
parameter measurements while being piloted from ESSO-INCOIS (Fig. 9). These AUV’s are helpful even during extreme weather conditions and provide subsurface data that are useful for ocean data assimilation and validation of models. The combination of mooring and seaglider experiments can provide more insights into the evolution of SST and SSS and helps the understanding of different processes that control the variability of mixed layer heat and salt budgets with reasonable accuracy. The Lagrangian float is another type of AUV which can measure both physical and biological variables by accurately following the 3D motion of water parcels within desired water column depth (Fig. 8). uCTDs are advanced instruments used to measure ocean parameters while the ship is in motion and are cost effective compared to regular CTD measurements using rosettes, which need the ship to remain stationary (Fig. 9).
The key process in the global ocean circulations is the vertical turbulent mixing processes which affect the transport of heat, salt and biogeochemical substances such as carbon and nutrients. The basic understanding of the variation of vertical turbulent mixing with different background stratification is fundamental to document oceanic mixing characteristics. ESSO-INCOIS conducted various such cruises to record the vertical distribution of small-scale turbulent mixing in the BoB and the AS. The higher vertical resolution of temperature, salinity and shear (~512 Hz) from VMP can provide an excellent opportunity to document the differences in the mixing characteristics between these two basins.
Way ForwardIn addition to the operational needs, the data collected from the OON network also enhances our knowledge of the role of the Indian Ocean in global weather and climate. Moreover, long-term observations from these systems can provide an opportunity to understand the evaluation of oceanographic parameters in the global warming scenario and its impact on regional and global weather. It is thus proposed to establish a GPS (GNSS) enabled 15 tide gauges in future which can provide information about land displacement and accurate estimation of magnitude of the earthquakes. At present, XBT data collected is available in delayed mode
and efforts are underway to transmit these data in real time to INCOIS. Besides, it is also proposed to expand the WAMAN network to nearby Regional Integrated Multi-Hazard Early Warning System (RIMES) countries and equip the areas with a few more wave sensors in the open ocean mooring. Further, it is proposed to increase the number of deployment of Argo floats to 50 in a year. Thus significant efforts are being made by ESSO-INCOIS to scale up and sustain and enhance networks in the upcoming decades to support operational ocean state forecasts and services.
Acknowledgements: We sincerely thank Secretary, MoES, Government of India and Director, INCOIS for their constant support and encouragement towards the development of OON. We also thank our collaborating institutes—ESSO-NIOT, CSIR-NIO, SoI and all our INCOIS colleagues for their consistent support and cooperation for the development and successful establishment of OON.
referencesGirishkumar M. S., V. P. Thangaprakash, T. V. S.
U. Bhaskar, K. Suprit and N. SureshKumar. 2019. Quantifying Tropical Cyclone's Effect on The Biogeochemical Processes Using Profiling Float Observations in The Bay of Bengal, JGR Oceans, 124: 1945-1963. Available at: https://doi.org/10.1029/2017JC013629
Ravichandran M., M. S. Girishkumar and S. Riser. 2012. Observed Variability of Chlorophyll‐a Using Argo Profiling Floats in The Southeastern Arabian Sea, Deep Sea Research Part I: Oceanographic Research Papers, 65: 15–25. Available at: https://doi.org/10.1016/j.dsr.2012.03.003
Sengupta D., R. Senan and B. N. Goswami. 2001. Origin of Intraseasonal Variability of Circulation in The Tropical Central Indian Ocean, Geophysical Research Letters, 28: 1267-1270. Available at: https://agupubs.onlinelibrary.wiley.com/doi/pdf/10.1029/2000GL012251
Thangaprakash V. P., K. Suprit, N. S. Kumar, D. Chaudhuri and K. Dinesh. 2016. What Controls Seasonal Evolution of Sea Surface Temperature in The Bay of Bengal? Mixed Layer Heat Budget Analysis Using Moored Buoy Observations Along 90°E, Oceanography, 29(2): 202–213. Available at: https://tos.org/oceanography/article/what-controls-seasonal-evolution-of-sea-surface-temperature-in-the-bay-of-b
18 2020 GeoGraphy and you vol 20, issue 6-7 no. 144-145
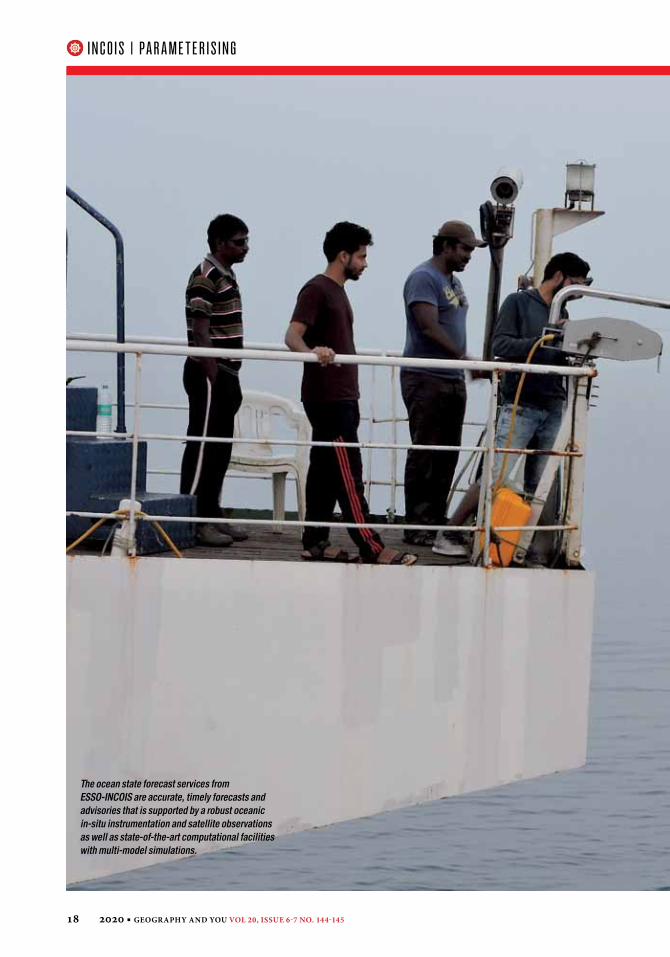
The ocean state forecast services from ESSO-INCOIS are accurate, timely forecasts and advisories that is supported by a robust oceanic in-situ instrumentation and satellite observations as well as state-of-the-art computational facilities with multi-model simulations.
I N CO I S | Pa r a me t er I S I Ng

GeoGraphy and you 2020 19
Phot
o Co
urte
sy: A
utho
r
The authors are Group Head, Scientist in charge (Ocean State Forecast Services), Scientist in charge (Ocean State Forecast Lab), Project Scientist, Project Assistant, Scientific
Assistant and Project Assistant, respectively, at the Ocean Information and Forecast Service Group (ISG), ESSO-INCOIS, Hyderabad. [email protected]. The article should be cited as Nair T.M. Balakrishnan, Harikumar R. Srinivas K,. Anuradha M., Kaviyazhahu
K., Kumari Rakhi and Grover Y., 2020. Ocean State Forecast Services for the Maritime Community, Geography and You, 20(6-7): 18-25
By T M Balakrishnan Nair, R Harikumar, K Srinivas, M Anuradha, K Kaviyazhahu, R Kumari & Y Grover
Maritime
Ocean StateForecast
Services for the
Community

20 2020 GeoGraphy and you vol 20, issue 6-7 no. 144-145
India is endowed with a long coastline of over 7500 km, including the Andaman, Nicobar and Lakshadweep Islands. The nation's marine activities are diverse and include artisanal/mechanised fishing,
shipping activities, coastal tourism, oil/natural gas/mineral exploration, defence interests and marine research. Prior information on the sea state is vital not only for those who venture out to sea but also for those at the seashore. Users can take informed decisions based on forecasts, alerts, warnings and issued advisories. Economic benefits too are accrued to users which helps strengthen India's goals towards achieving the blue economy. User feedback and evaluations suggest that the forecasts are 80 per cent accurate and that they also reach most end users on time, which is crucial for saving life and property. The quality management system of the OSF services of ESSO-INCOIS has been conferred with the ISO 9001:2008 certification in 2014.
India has been providing ocean state forecasts to users since 2007 and has subsequently extended these services to other countries. Numerous articles on these multiple models as well as their validations have been published (Sabique et al. 2012; Nair et al. 2013; Nair et al. 2014). However, there is a consensus that it is no longer sufficient to provide just an accurate and timely weather forecast/warning—rather there is now a demand for ‘impact-based’ information (WMO 2015). As per the World Meteorological Organisation's (WMO) manual, all weather forecasting centres
of its member countries are advised to convert/upgrade their general forecast and warning services to multi-hazard impact-based ones. The latest update of WMO manual (WMO 2018) puts forward a guideline that ‘warning should be provided for…unusual and hazardous sea-ice conditions and dangerous sea states’. In this context and considering that India's tropical coasts are prone to a multitude of hazards, INCOIS is transforming its forecasts to 'identify dangerous seas' and capture future high sea conditions through short-term forecasts and specialised warnings/alerts (Table 1 and 2).
The usersESSO-INCOIS service users include fishing and coastal populations, maritime boards, the Indian Navy and Coast Guard, shipping and energy sectors, hydrocarbon industries, port authorities, pollution control boards, disaster management agencies, NGOs and research organisations. During recent times, the demand for these services has greatly increased (Fig. 1). Fishing Sector: The fishing sector is the primary user and in the backdrop of their marginalised socio-economic condition, ocean information services benefit them immensely. They are provided with potential fishing zone advisories that assist them in locating an identified zone and obtaining a good catch. This is a regular service except for the fishing ban periods, around 60 days in a year. Also, in case of adverse ocean conditions the OSF wing issues a joint bulletin with the India
India is the only country in the northern Indian ocean that has a fully operational ocean state forecast (osF) services. this supports millions of users for smooth operations at sea,
for both offshore and nearshore activities. the osF services from esso-INCoIs are of a high global standard with accurate, timely forecasts and advisories. they are supported by a robust in-situ and satellite observations as well as state-of-the-art computational
facilities with multi-model simulations. the services incorporate the latest information and communication technology (ICt) tools for building a well-defined dissemination system.
esso-INCoIs has modulated its general forecasts to build impact-based forecasts based on user feedback. Its recent service caters to fishing boats far out at sea with systems enabled
through NAVigation with Indian Constellation (NAVIC) and the Gagan enabled Mariner's Instrument for Navigation and Information (GeMINI). esso-INCoIs also plays an active role
in supporting the rising needs of ushering in the blue economy of the region.

GeoGraphy and you 2020 21
Table 1: The wave, OGCM, oil spill, SARAT and tidal models being run operationally
Numerical ModelsSpatial Resolution (in degrees)
Wave Models
Spectral Wave Model 1.000o to 0.070o
Multi-grid WAVEWATCH III model (MWW3)
1.000o to 0.050o
Simulating WAves Nearshore model (SWAN)
0.002o x 0.002o
Ocean General Circulation Models (OGCM)
Regional Ocean Modeling System (ROMS)
0.125o x 0.125o
Global Ocean Data Assimilation System (GODAS)
up to maximum 0.25o
HYbrid Coordinate Ocean Model (HYCOM)
up to maximum 0.06o
Online Oil Spill Advisory (OOSA)
General NOAA Oil Modeling Environment (GNOME)
---
Search And Rescue Aid Tool (SARAT)
Leeway Model ---
Tide
Tidal Analysis Software Kit 2000 (TASK) - 2000
---
Meteorological Department (IMD) that warns fisherfolk, requesting them to avoid fishing at sea.Shipping Sector: Numerous ports, both major and minor, near large coastal cities contribute greatly to its economic growth. For the efficient operation of these ports, a critical factor is to advance information on sea state parameters—locally generated wind waves, remotely forced swell waves, currents, winds and tides and warnings on cyclones and other extreme weather events. The smooth entry and exit of vessels of all sizes at a port may be ensured in advance by the use of this information. Also, since many ports cannot handle huge oil tankers, offshore port activities like single point mooring operations—a loading buoy anchored offshore that serves as an interconnect point for large tankers to load or offload products to shore-based facilities—are important. OSF services support these operations by forecasting sea conditions at these point locations. Furthermore, daily OSF updates along with meteorological data and warnings are provided on standard shipping routes usually used by passenger ships—Chennai-Port Blair and Kolkata-Port Blair.
Unlike fishing operations that are suspended for short periods, shipping and port activities are continuous even during periods of foul weather (southwest monsoon season—June to September). Safe transit during such times remains important considering that coastal shipping remains a preferable route for cargo traffic as modes like air and road cannot handle the volumes involved. The turnaround time of ships in ports may decrease with OSF services and added to modernised ports through India’s ambitious Sagar Mala project, will result in a leap forward. Hydrocarbon and Mineral Exploration: The coastal seas around India are being actively explored for oil and natural gas. Installations of new platforms and deployment of rigs at planned locations require long term observational and forecasted data on extreme values of winds, waves, currents and storm surge related factors. For oil rig operations, critical parameters are the surface and subsurface currents, which if intense can cause hardship while deploying risers and flow lines that carry hydrocarbons to the surface from well heads. Earlier, such issues caused financial losses for rig operators along the east coast, where eddies are common. At present, however, with user-customised OSFs, Oil and Natural Gas
Corporation (ONGC ) is now better geared to plan logistics and marine operations. Defence Sector: The Indian Navy, Indian Coast Guard and the Coastal Security Police patrol waters to guard against unlawful and enemy activity within the exclusive economic zone (EEZ). They require OSF for smooth operations of their fleets, with ships of varying dimensions including subsurface vehicles and specialised beach landing craft and hovercraft. The Indian
Fig. 1. Number of users (in thousands) availing ocean state forecast services from ESSO- INCOIS
2012-13 2013-14 2014-15 2015-16 2016-17 2017-18 2018-19Jan 2019
679
402
309
223
1178274
Active fishermen: 900 thousand (approx)

22 2020 GeoGraphy and you vol 20, issue 6-7 no. 144-145
Regular Forecast Services Early Warning Services Customised Products for Blue Economy sector
Coastal forecast High wave/swell alert/warning Search and Rescue Aid Tool (SARAT)*
Location specific forecast INCOIS-IMD Joint bulletins during depression/cyclones
Online Oil spill Advisory system (OOSA)*
Tropical Cyclone Heat Potential Kallakadal warning—coastal flooding due to swell surge
Port and Harbour Information System
Predicted astronomical tide Kondalkattu warning—Location specific forecast on high wind waves
Forecast along ship routes
Regional forecast Tidal flood advisory—Perigean/Proxigean
Webmap Services
Forecast for the Islands Small Craft Advisory# Navy Specific Forecasts
Forecast for neighbouring and other countries —Sri Lanka, Seychelles, Maldives, Mozambique, Madagascar and Comoros
Inland Vessel Limits (IVL), Forecast for Maritime Boards
Global forecast products Oil industry specific forecast and analysis products
* These also come under emergency services; #These are eventually operationalised
Table 2: Services of the ocean state forecast wing
Coast Guard is additionally responsible for marine search and rescue operations, in case of any untoward incident. They are also mandated to operate the gear that helps control oil spill during ship accidents. Keeping the specifics in mind, ESSO-INCOIS has developed two customised services—Search and Rescue Aid Tool (SARAT) and the Online Oil-Spill Advisory (OOSA) system. SARAT provides a probable search area for missing persons/objects at sea. The ESSO-INCOIS has been actively disseminating advisories that track oil spill trajectories since 2014 to the Indian Coast Guard, port authorities, maritime boards and the pollution control boards. The OOSA system was operationalised in 2014 using the General NOAA Oil Modeling Environment (GNOME).
The parameters ForecastedThe OSF system at ESSO-INCOIS is capable of predicting surface and subsurface features of the Indian Ocean reasonably well—5 to 7 days in advance presently, at 3-6 hour intervals. For these forecasts, ocean general circulation models are interfaced by atmospheric parameters—surface wind speed, specific humidity, surface air temperature, precipitation and shortwave and long wave radiation and bathymetry. Parameters routinely forecasted are listed below:
● Height, direction and period—both wind and swell waves; ● Wind speed and direction; ● Sea surface currents; ● Sea surface temperature; ● Mixed layer depth of the well mixed upper layer of the sea; ● Depth of the 20o C isotherm;● Astronomical tides; ● OOSA parameters, and ● SARAT parameters.
operational Models used for osF Forecasts are generated by a suite of state-of-the-art numerical models (Table 1), which are set up and finetuned to simulate and predict accurately. Atmospheric estimations from different meteorological forecasting agencies—ESSO-National Centre for Medium Range Weather Forecasting and European Centre for Medium-Range Weather Forecasts—are used too. Global and regional forecasts differ mainly in their model domains, spatial and temporal resolution and the extent of validations carried out. Wave models are set up using 'multiple grids' with a fine resolution for a specified coastal area and a coarse resolution in the open ocean region.
osF services by esso-inCoisCategorised as regular and general services, the OSF provides customised services, impact-based forecast, advisory and warning services and experimental forecast services (Table 2). Forecasts

GeoGraphy and you 2020 23
Fig. 2: Validation of the wave heights along the west coast of IndiaSi
gnifi
cant
wav
e he
ight
(m)
SimulationObservation43210
J J A S O
2016
N D J
Bias = 0.11 mRMSE = 0.25 mSI = 22 per centR = 0.90N = 1500
(a) Versova
2014Bias = 0.06 mRMSE = 0.27 mSI = 23 per centR = 0.95N = 2699
(b) Ratnagiri43210
J F M A M J J A S O N D
2014 Bias = 0.02 mRMSE = 0.45 mSI = 26 per centR = 0.95N = 2748
(c) AD06 (AS met-ocean buoy)86420
J F M A M J J A S O N D
are available separately for the Arabian Sea, Bay of Bengal, North Indian Ocean, South Indian Ocean, Red Sea, Persian Gulf and South China Sea. Further, ESSO- INCOIS provides detailed information for specific locations such as the fish landing centres, small fishing harbours and commercial ports.
verification of Forecasts and advisoriesFor testing the accuracy and reliability of the products, satellite data and in-situ measurements, such as near shore wave rider buoys, deep sea buoys, ship borne wave height meters, automatic weather stations and other deep sea met-ocean buoys are used for routine and extreme-event validation. To further enhance the quality of forecasting, ESSO-INCOIS plans to expand the wave rider buoy network ensuring that a minimum of two such buoys are deployed along each Indian coastal state, including the island territories. It also proposes to increase deployments of ship-mounted automatic weather stations to collect data that can be assimilated real time into the numerical models. Validation of the simulated significant wave height at few west coast locations is presented in figure 2 which shows significant agreement between observed and forecasted wave heights. The wave model simulated sizeable wave heights during the Fani
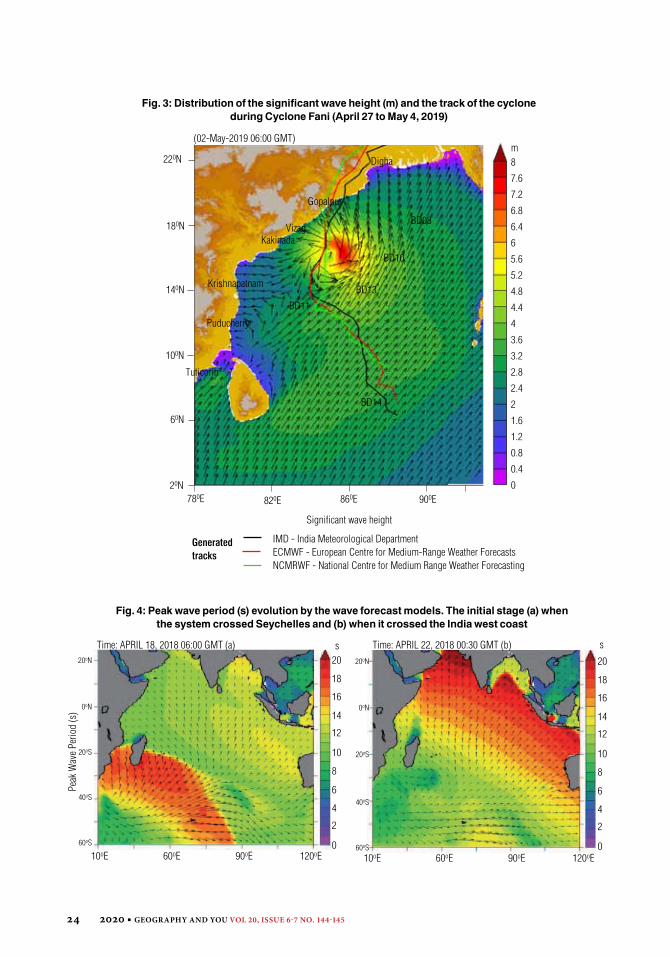
cyclone—April 27 to May 4, 2019 and its track is shown figure 3.
The Indian coast often experiences large wave heights due to the swell generated in the South Indian Ocean. ESSO-INCOIS successfully forecasted one such swell surge event during April 21-22, 2018 along the west coast of India and Lakshadweep. Swell heights between 2 to 3 m were experienced during this major event that impacted from Kerala to the Maharashtra coast (Fig 4).
The disseminationThe primary dissemination mode for the OSF is the ESSO-INCOIS website along with email, mobile phones and apps, TV, radio, social media and electronic display boards based on sophisticated information and communications technology (ICT) tools. Further, strong collaborations with NGOs and coastal research centres as well as universities, aid dissemination. In areas with no or poor electricity connectivity, dissemination through manual display boards (Sundarban region) and simple black boards at smaller fish landing centres is enabled.
One significant achievement during recent times is the transmission of warning messages through satellite communication to fishers far out at sea. This is being done by collaborating with Indian Space Research Organisation (ISRO) for
Bias - Statistical bias, difference between expected value and true value of the parameter being estimated.
RMSE - Root mean square error.
SI - Scatter Index. A smaller scatter index value means better forecasts.
R - Correlation coefficient. N - Number of data sets used
24 2020 GeoGraphy and you vol 20, issue 6-7 no. 144-145
Fig. 4: Peak wave period (s) evolution by the wave forecast models. The initial stage (a) when the system crossed Seychelles and (b) when it crossed the India west coast
Fig. 3: Distribution of the significant wave height (m) and the track of the cyclone during Cyclone Fani (April 27 to May 4, 2019)
Significant wave height
820E780E20N
60N
100N
140N
180N
220N
860E 900E
8
7.6
7.2
6.8
6.4
6
5.6
5.2
4.8
4.4
4
3.6
3.2
2.8
2.4
2
1.6
1.2
0.8
0.4
0
Time: APRIL 18, 2018 06:00 GMT (a)20oN
20oS
40oS
60oS
10oE 60oE 90oE 120oE
20
18
16
14
12
10
8
6
4
2
0
0oN
20oN
20oS
40oS
60oS10oE 60oE 90oE
20
18
16
14
12
10
8
6
4
2
0120oE
0oN
Time: APRIL 22, 2018 00:30 GMT (b)
(02-May-2019 06:00 GMT)
Gopalpur
Digha
VizagKakinada
Krishnapatnam
Puducherry
Tuticorin
BD13
BD14
BD11
BD10
BD08
m
s s
Peak
Wav
e Pe
riod
(s)
Generated tracks
IMD - India Meteorological DepartmentECMWF - European Centre for Medium-Range Weather ForecastsNCMRWF - National Centre for Medium Range Weather Forecasting

GeoGraphy and you 2020 25
NAVigation with Indian Constellation (NAVIC) and and Airports Authority of India (AAI) for Gagan Enabled Mariner's Instrument for Navigation and Information (GEMINI). The latter has a wider range and can transmit messages to Africa and even to Australia more frequently than NAVIC. This is indeed a significant achievement as transmitting warnings on cyclones, tsunamis and potential fishing zones even 7 km away from the coast was challenging.
Feedback and Training Training workshops are frequently conducted at INCOIS for a range of users. Feedbacks are collected routinely through user interaction meetings, workshops or during exhibitions held at coastal locations. Active steps are taken to improve the quality of forecast and dissemination using a need based approach, as user feedback is critical to ensure the last mile connectivity.
Way ForwardOSF services are continually being improved based on the need for a high level of accuracy. New services are to be generated to cater to specific user-types. ESSO-INCOIS is providing highly specialised consultancy services to the shipping industry and energy sector which along with its comprehensive suite of services will boost the region’s blue economy.
referencesNair T. M. B., P. Sirisha, K. G. Sandhya, K. Srinivas
and V. S. Kumar. 2013. Performance of the Ocean State Forecast System at Indian National Centre for Ocean Information Services, Current Science, 105(2): 175-181. Available at: https://bit.ly/3eYcDXZ
Nair T. M. B., P. G. Remya, R. Harikumar, K. G. Sandhya and P. Sirisha. 2014. Wave Forecasting and Monitoring During Very Severe Cyclone Phailin in The Bay of Bengal, Current Science, 106(8): 1121-1125. Available at: https://bit.ly/2SbiQGd
Sabique L., K. Annapurnaiah, T. M. B. Nair and K. Srinivas. 2012. Contribution of Southern Indian Ocean Swells on The Wave Heights in The Northern Indian Ocean - A modeling Study, Ocean Engineering, 43: 113-120. Available at: https://bit.ly/3aFICJf
World Meteorological Organisation (WMO). 2015. WMO Guidelines on Multi-hazard Impact-based Forecast and Warning Services: World Meteorological Organisation, Geneva: Switzerland. Available at: https://bit.ly/2xQCBfD
World Meteorological Organisation (WMO). 2018. Manual on Marine Meteorological Services: Volume I-Global Aspects: Annex VI to The WMO Technical Regulations: World Meteorological Organisation, Geneva: Switzerland. Available at: https://bit.ly/3aKfPDy
The ocean state forecast (OSF) laboratory at ESSO-INCOIS provides customised forecast services. Forecasts are available separately for the Arabian Sea, Bay of Bengal, North Indian Ocean, South Indian Ocean, Red Sea, Persian Gulf and South China Sea.

26 2020 GeoGraphy and you vol 20, issue 6-7 no. 144-145
The Ocean State Forecast Service, which is one of the flagship services of ESSO-INCOIS, uses a suite of state-of-the art numerical ocean circulation and wind-wave models to generate necessary forecasts and advisories on the state of the oceans for the benefit of a large spectrum of users.
I N CO I S | Pa r a me t er I S I Ng

GeoGraphy and you 2020 27
Numerical ocean models are essentially the mathematical representation of the physical processes that govern the state of
the ocean. They are extensively used in the field of oceanography to analyse and predict the behaviour of the ocean. Powerful computers are used to integrate these models to get the values of the ‘state variables’
at desired spatial/temporal intervals. This article takes a close look at the core elements of the numerical ocean modelling that serves as a virtual diving gear to delve into the unfathomable depths of the enigmatic marine world that has captured the imagination of man
since time immemorial.
PhoT
o Co
urTe
sy: P
ixab
ay
The author is Scientist F and Head, Ocean Modelling and Data Assimilation Group at Earth System Sciences Organisation-Indian National Centre for Ocean Information Services (ESSO-INCOIS). [email protected].
in. The article should be cited as Francis P. A., 2020. Elements of Numerical Ocean Modelling, Geography and You, 20(6-7): 26-31
Francis P ABy
Elements of
NumericalOcean Modelling

28 2020 GeoGraphy and you vol 20, issue 6-7 no. 144-145
Fig. 1: The cross-shore structure of along-shore currents (left) and the pattern of surface currents off the coast of Cuddalore, Tamil Nadu on December 3, 2013 as simulated by the HOOFS configuration (right)
Oceans, which cover about two third of the globe, play an important role in regulating the climate and weather of the earth, making the planet habitable for all life forms.
In keeping with the world’s dependence on the oceans for food, commerce, transport of goods, energy, minerals and medicines, ocean processes and their predictions have become areas of intense research for ‘the ease of doing business’ in the maritime environment. Important processes that we observe in the oceans include wind-driven surface waves or swells, tides, storm surges, currents and variability in temperature, salinity and surface elevation. One of the most important developments in the field of ocean sciences in the last century was the discovery of El Nino and Southern Oscillation (ENSO)—underscoring the variation in sea surface temperature (SST) and associated atmospheric pressure in the eastern and western tropical Pacific Ocean. Later found to have a significant influence not only on the tropical climate, but also on the variation in the weather and climate in the extra tropics, ENSO alone explains about 30 per cent of the variability of the mighty Indian summer monsoon rainfall, which is the lifeline of billions who live in south and southeast Asia (Surendran et al. 2015). The discovery of the Indian Ocean Dipole in the late 90s revived the oceanographic research in
the Indian Ocean (Saji et al. 1999; Webster et al. 1999). While many ocean processes, including the temperature distribution and variation in ocean currents, were discovered by the careful analysis of relatively sparse observations of different oceanographic parameters, prediction of these features were not possible until the physics that drives these processes was understood and was represented in mathematical forms. Efforts in this direction led to the development of numerical ocean models.
Numerical ocean modelling is a relatively new, but fast emerging branch of oceanography. In such modelling, the laws which govern the state of the ocean are expressed in mathematical form after applying certain approximations and assumptions and solved numerically, most often using powerful computers. Scientists, Kirk Bryan and Michael D Cox from Princeton University laid the foundation of ocean modelling (Bryan and Cox 1967). The Cox model is considered to be the first numerical ocean modelling of the Indian Ocean (Cox 1970). M A Cane and his collaborators successfully used a numerical ocean model developed by them to predict the evolution of the El Nino event of 1986-1987 (Cane et al. 1986). The present day models are complex enough to account for most of the observed features such as the variation in currents, waves, temperature and salinity with fairly good accuracy. Depending on
Velocity (cm-1)-40 40-30 30-20 20-10 0 10
14.0oN
13.0oN
12.0oN
11.0oN
10.0oN
400
400
800
1200
1600
2000
2400
2800
Dept
h (m
)
10 30 50 70 90 110 130 150 79.0oE 80.0oE 81.0oE 82.0oE 83.0oE
14.0oN

GeoGraphy and you 2020 29
the type of ocean models, they can be used either to understand certain oceanographic processes or to predict the future state of the ocean. Popular numerical ocean models used presently include Princeton Ocean Model (POM); Modular Ocean Model (MOM); Regional Ocean Modelling System (ROMS); MIT Ocean General Circulation Model (MITgcm); Hybrid Coordinate Ocean Model (HYCOM), and Nucleus of European Modelling of Ocean (NEMO). While all these models describe more or less the same physical processes in the oceans, they differ mainly in the way they are descretised in horizontal and vertical directions. There are also variations in the way the models take care of certain unaccounted physical processes. A good understanding of these physical processes in the ocean is essential for designing a suitable numerical ocean model.
Interaction between the atmosphere and the underlying ocean takes place close to the ocean surface. In general, the atmosphere over the ocean provides momentum, heat and freshwater to the ocean, while ocean supplies moisture and heat back into the atmosphere. These processes, commonly known as the air-sea interactions, are continuous, but vary considerably in terms of time and space. Apart from these external processes, other forces impacting the ocean such as pressure gradient, coriolis force, friction/viscous forces, and gravitational force also influence the movement of water and hence the distribution of oceanographic parameters. For simplicity, some processes which are not important are neglected while modelling the ocean circulation.
Mathematical representation of the physical processes are called the governing equations. In an numerical ocean model, the simplified form of the governing equations are represented in an appropriate coordinate system, before solving them. In general, the ocean under consideration is divided into ‘three dimensional grids’ of suitable sizes. The governing equations, after applying suitable approximations/assumptions and transformed into a suitable coordinate system are called the ‘primitive equations’. Most of the numerical ocean models resolve a set of primitive equations to estimate the ‘ocean state variables’
One of the major challenges in ocean modelling is the representation of certain processes which cannot be resolved explicitly in the model. While theoretically, it is possible
to design models with any grid resolution, practical implementation of such extremely high resolution models for simulating the general circulation features of even the Indian Ocean (much smaller than the Atlantic or the Pacific) is a challenge due to numerical and computational limitations. Hence, one way to represent these unaccounted for processes in the ocean models is by explicitly incorporating the effects of such processes by way of physical parameterisation. This is achieved by deriving empirical relationships between the ‘quantities or the processes’ to be parameterised and the known environmental factors which influence these processes. The empirical relationships are derived with a set of observations collected through specially designed campaigns. One of the most important processes that is parameterised in most of the ocean circulation models is the vertical mixing of properties (Large et al. 1994).
The momentum and the heat received by the ocean surface gets further transferred into its subsurface layers through various processes with scale ranging from a few centimetres to hundreds of kilometres. The upper few tens of meters of water, generally known as the surface mixed layer, is the most dynamic part of any ocean as it interacts directly with the overlying atmosphere. Physical properties of the water remain more or less homogeneous within the coalesced layer due to the intermingling that takes place if the water in the upper ocean is denser than that below it and also if there is vertical shear in the horizontal flow. Several other processes such as entrainment, horizontal and vertical advection of water with different properties, can also result in this natural phenomenon. While some of these processes are implicitly resolved in the ocean models, processes such as diffusion, vertical shear or mixing associated with the internal waves are not well represented in the models. Mixing parameterisation schemes are used in ocean models to account for these ‘unresolved’ processes.
The quality of the solutions from an ocean model depends on the initial conditions provided to force the model such as the initial values of parameters like temperature, salinity, currents, and sea level anomaly and the boundary conditions (the values of the important oceanographic parameters at lateral sides which

30 2020 GeoGraphy and you vol 20, issue 6-7 no. 144-145
are provided to the ocean model from the simulations of atmospheric models or from the objectively analysed observations. Surface wind data derived from ‘scatterometer sensors’ on a few satellites, are nowadays used to formulate ocean models. Once an ocean model is initialised, depending upon the region of interest and dimension of the model domain, the model may take a few days to hundreds of years to stabilise or come to a steady state. The time required for a particular model setup to stabilise and provide reliable simulations is commonly referred to as ‘spin up time’. Subsequently, the model can be integrated with realistic atmospheric forcing or boundary conditions to produce accurate simulations or forecasts.
Unlike the ocean observations, which are relatively sparse and not evenly distributed, numerical ocean circulation models can provide the values of state variables at uniform intervals in space and time. Hence the simulations from ocean models are very useful for studying the ocean processes such as the vertical or horizontal movement of oceanic water or its properties, mixing of these properties, evolution of El Nino or La Nina or Indian Ocean dipole in data void regions or for the studies in which data at regular intervals are required. For instance, the simulation of coastal currents by a very high-resolution model for the Bay of Bengal, shown in Figure 1 was used to describe the structure and dynamics of undercurrents off the coast of Cuddalore (Francis et al. 2020). In addition, the ocean models can be used to study the changes in certain ‘ocean/atmosphere parameters by carrying out specific experiments (‘sensitivity experiments’). Since the primitive equations on which the models are based on are ‘prognostic’, these can also be used for making predictions of the state variables.
Indian National Centre for Ocean Information Services (INCOIS), one of the premier institutes in the world in the field of operational oceanography, makes extensive use of numerical ocean models for generating ocean analysis/reanalysis and forecasts. Major products based on numerical ocean models provided by its flagship programme ‘Ocean State Forecast’ include the short term forecasts of waves, currents, tides and other oceanographic parameters such as SST, and mixed layer depth. Some value added services provided
are open to other oceans). A common method to prepare accurate initial/boundary conditions is by blending the relatively sparse and uneven ocean observations with the numerical models. This is how oceanographers undertake data assimilation—the process of injecting data into an numerical ocean model to minimise the difference between the observed state and the model state without violating the dynamic balance between the variables. Ultimately, this assimilation produces ‘ocean analysis’, which is extensively used in oceanographic research as well as for initialising ocean forecast models. A large fraction of surface observations getting assimilated into ocean models comes from the satellite based observations of SST and sea surface height anomalies.
The source of data of the subsurface layers of ocean is the Argo floats, which are autonomous instruments capable of diving to a predefined depth in the ocean and coming back to near surface by changing their buoyancy. These floats measure important oceanographic parameters such as temperature, salinity, and biogeochemical parameters, during their endeavour. In addition to Argo floats, moored ocean buoys, fitted with sensors to measure oceanographic parameters, surface drifters, and expendable bathythermographs (XBTs), also provide valuable data for assimilating into the ocean models. Most of these observation platforms transmit data to the receiving stations (ground stations) through satellites in near real time, so that they get integrated into the ocean models.
The ocean-atmosphere interface at the surface of the ocean is constantly influenced by the atmosphere above it. Hence, the accuracy of the ocean model simulations, particularly in the upper few tens of meters, heavily depends on these ‘atmospheric forcings’ or surface boundary conditions. The most important surface boundary condition is the stress caused by surface winds. Parameters such as air temperature and humidity along with the net shortwave and longwave radiation determine the exchange of heat fluxes between ocean surface and the overlying atmosphere (Fairall et al. 1996). Similarly, evaporation and precipitation determine the amount of freshwater flux which goes into the oceans. In general, these ‘atmospheric’ forcing fields

GeoGraphy and you 2020 31
by ESSO-INCOIS, such as oil spill trajectory prediction system, search and rescue aid tool, and experimental forecasts of potential fishing zones, also make use of the forecasts of oceanographic parameters from the High-resolution Operational Ocean Forecast and reanalysis System (HOOFS) developed in-house. HOOFS comprises a hierarchy of data assimilated configurations of the ocean model called Regional Ocean Modelling System (ROMS). The ocean analysis generated by ESSO-INCOIS, based on the modular ocean model with data assimilation, known as INCOIS-GODAS, is being utilised by the India Meteorological Department (IMD) for the seasonal and extended range forecasts of Indian summer monsoon rainfall.
Way Forward Some of the challenges in improving the accuracy of numerical ocean models are the improvements needed in the parameterisations of the unaccounted physical processes and the availability of accurate atmospheric parameters (Kemper et al. 2019). Hence, oceanographers are increasing the field observations to understand and quantify the turbulent mixing processes in interior oceans and the air-sea fluxes in the outer interfaces so that they can be represented better in the ocean models. At the same time, oceanographers are also attempting to reduce the computational resources by converting the conventional models based on central processing unit (CPU) to graphics processing unit (GPU). The usage of artificial intelligence and machine learning techniques are also being explored to improve the predictions of different ocean-atmosphere parameters (Bolton and Zanna 2019).
References Bolton T. and L. Zanna. 2019. Applications of
Deep Learning to Ocean Data Inference and Subgrid Parameterization, Journal of Advances in Modelling Earth Systems. Available at: https://doi.org/10.1029/2018MS001472
Bryan K. and M. D. Cox. 1967. A Numerical Investigation of Ocean General Circulation, Tellus, 19: 54-80. Available at: https://onlinelibrary.wiley.com/doi/abs/10.1111/j.2153-3490.1967.tb01459.x
Cane M.A., S.E. Zebiak and S.C. Dolan. 1986.
Experimental Forecasts of El Niño, Nature, 115(10): 2262-2278. Available at: https://www.nature.com/articles/321827a0
Cox M. D. 1970. A Mathematical Model of The Indian Ocean, Deep Sea Research and Oceanographic Abstracts, 17(1): 47-75. Available at: https://www.sciencedirect.com/science/article/abs/pii/0011747170900872
Fairall C.W., E.F. Bradley, D.P. Rogers, J.B. Edson and G.S. Young. 1996. Bulk Parameterization of Air-Sea Fluxes for Tropical Ocean Global Atmosphere Coupled-Ocean Atmosphere Response Experiment, Journal of Geophysical Research, 101(C2): 3747–3764. Available at: https://agupubs.onlinelibrary.wiley.com/doi/pdf/10.1029/95JC03205
Francis P.A., A.K. Jithin, A. Chatterjee, A. Mukherjee, D. Shankar et al. 2020. Structure and Dynamics of Undercurrents in The Western Boundary Current of The Bay of Bengal, Ocean Dynamics, 70: 387–404. Available at:https://link.springer.com/article/10.1007%2Fs10236-019-01340-9
Kemper B. F. A. Adcroft, C. W. Boning, E. P. Chassignet and E. Curchitser. 2019. Challenges and Prospects in Ocean Circulation Models, Frontiers in Marine Science. Available at: https://doi.org/10.3389/fmars.2019.00065
Large W. G., J. C. McWilliams, S. C. Doney. 1994. Oceanic Vertical Mixing: A Review and A Model with A Nonlocal Boundary Layer Parameterization, Reviews of Geophysics, 32:363–403. Available at: https://agupubs.onlinelibrary.wiley.com/doi/abs/10.1029/94RG01872
Saji N. H., B. N. Goswami, P. N. Vinayachandran and T. Yamagata. 1999. A Dipole Mode in The Tropical Indian Ocean, Nature, 401: 360–363. Available at: https://doi.org/10.1038/43854
Surendran S., S. Gadgil, P. A. Francis, M. Rajeevan. 2015. Prediction of Indian Rainfall During The Summer Monsoon Season on The Basis of Links with Equatorial Pacific and Indian Ocean Climate Indices. Environmental Research Letters, 10(9): 1-13. Available at: https://iopscience.iop.org/article/10.1088/1748-9326/10/9/094004/pdf
Webster P. J., A. M. Moore, J. P. Loschnigg and R. R. Leben. 1999. Coupled Oceanic-Atmospheric Dynamics in The Indian Ocean During 1997– 98, Nature, 401: 356-360. Available at: https://www.nature.com/articles/43848

32 2020 GeoGraphy and you vol 20, issue 6-7 no. 144-145
I N CO I S | Pa r a me t er I S I Ng
The ocean data and information system
(odis) was conceived at esso-inCois to
overcome the difficul-ties in handling the
heterogeneous data and its dissemination.

GeoGraphy and you 2020 33
Phot
o Co
urte
sy: P
atri
Ck_w
orld
wid
e
The authors are Scientist E, Ocean Observations and Data Management Group (ODG); Senior Scientist and Head, Training and Programme Planning and Management Group (TPG); Senior Scientist and Head, ODG; and, Director; respectively at INCOIS. [email protected]. The article should be cited as Shesu R.V., T.V.S.U. Bhaskar, E.P.R. Rao
and S.S.C. Shenoi, 2020. Ocean Data and Information System, Geography and You, 20(6-7): 32-35
in successfully planning and executing ocean monitoring activities like the Bay of Bengal Monsoon Experiment (BoB-MEX) and the Arabian Sea Monsoon Experiment (AR-MEX). The Ministry of Earth Sciences (MoES) had designated the ESSO-Indian National Centre for Ocean Information Services (INCOIS) as the nodal agency and the central repository of ocean data in India. ESSO-INCOIS receives voluminous data from the ocean observation systems both in real time, near real time and offline from various heterogeneous in-situ platforms—moored buoys,
By R Venkat Shesu, T V S Udaya Bhaskar,E Pattabhi Rama Rao & S S C Shenoi
a geographic information system (Gis) based application ocean data and information systems (odis) was designed, developed and implemented at
esso-iNCois for easy dissemination of data and data products. it is an open source platform for publishing spatial data with interactive mapping applications
on the web. MysQl serves as the backend database. this article presents storage, organisation details and data visualisations pertaining to oceanographic
data. odis is set as an end-to-end system comprising acquisition of data from heterogeneous oceanographic platforms, processing and integration, quality
controlling and disseminating for research and development.
It is well known that oceans play an integral role in the earth system including climate and weather. Ocean needs to be monitored continuously as it is vital for sustainable exploitation and utilisation of oceanic
resources. Accordingly, large amounts of data pertaining to the surface and subsurface are continuously measured by various autonomous instruments. Ocean monitoring activities have increased enormously owing to advancements in the technology and progress of ocean observing programmes. India had taken lead
OCEAN DATA& INFORMATION SYSTEM

34 2020 GeoGraphy and you vol 20, issue 6-7 no. 144-145
Fig. 1: The flow of heterogeneous in-situ data from different observational networks into the centralised database established at ESSO-INCOIS
Fig. 2: Snapshot of the main web GIS interface through which a user can visualise, query and extract the information of choice
Ocean ObservatiOn systems
Drifting buoys Wave rider buoys Ship-mounted automatic weather
stations
Moored buoys Tide gauges
IntegratedDatabase
NetCDF, hdf, ASCII, Binary
INSAT, VSAT, FTP, E-mail, Offline
Realtime Automatic Weather Stations
Moored Buoy
Moored BuoyDrifting BuoyDrifting Buoy TrackAutomatic Weather StationAutomatic Weather Station TrackXBT's Open OceanXBT's Indian EEZCurrent Meter ArraysWave Rider BuoysGraticule
OverlaysIndian Ocean
Base Layer
Drifting Buoy
Wave Rider BuoyCoastal HF RadarEquatorial Current Meter ArrayXBTArgo DataTide Gauge DataBPR DataAll Insitu Data
Remote Sensing DataLive Access Server (LAC)QC Manuals
Ocean Data and Information System
Language Switcher Search
Login FormMain Menu
In-situ Data
Search...
User Name
Password
Remember Me
Change your password? ORForgot your password?Forgot your username?
Log in
Home
English
You are here: In-situ Data All Insitu Data

GeoGraphy and you 2020 35
drifting buoys, expendable bathythermographs (XBT), automatic weather stations (AWS) and current meter arrays, among others (Fig. 1). The nature of acquisition such as different sampling intervals, sensor types, formats, fixed or drifting nature of platforms, time series at a single point, vertical profiles at different locations, spectral, dynamic and static variability makes these data heterogeneous. The data needs to be well organised, quality controlled and distributed in real time to researchers from various scientific organisations and students from universities.
The Ocean Data and Information System (ODIS) was conceived at ESSO-INCOIS to overcome the difficulties in handling the heterogeneous data and its dissemination. It was designed with capabilities for archiving, on the fly visualisation and seamless sharing of data from a single source.
odis FrameworkWith the advancement in technology the traditional use of GIS was also found to be changing. Oceanographers over the years had their own specialised system for analysing and displaying data. However, GIS possesses all in-built capabilities to provide various functions to support the complete management of spatio-temporal data. ODIS adopted a client-server architecture which can run either on a single computer or distributed on multiple sets of computers. The system built at ESSO-INCOIS is composed of five major components—UMN MapServer, Apache HTTP Server + Apache Tomcat, MySQL, Web Browser, ChartDirector™. All these components are run in a Java programming environment, on a Linux platform. The University of Minnesota (UMN) MapServer is an open source platform that serves the purpose of displaying and querying dynamic data spatially. The UMN MapServer supports many Open Geospatial Consortium (OGC) web specifications, including the Web Map Service (WMS), non-transactional Web Feature Service (WFS) and Geography Markup Language (GML). For achieving greater flexibility, all the components of ODIS are loosely coupled, which enable the developers to do experimental changes to the ODIS system. The MapServer and a web
browser are sufficient to implement a simple web GIS, but MySQL is included to store and organise data received from heterogeneous platforms. The data is stored in database tables in a simple vector form, which can be directly loaded by the GIS engine. A snapshot of ODIS set up at ESSO-INCOIS is shown in figure 2.
integrated database management systemAs per the data flow into and out of the system, the MySQL database for ODIS is configured. Data acquisition, data processing, quality checks and data archival are the main processes in database management systems. ODIS is configured to push the data to FTP or send the data email based on the size of the data requested by the user. In-situ data is implemented in the Relational Database Management System (RDBMS), which includes both data as well as metadata and is updated on an operational basis which is immediately available to the end users. This real time updation helps in monitoring various in-situ platforms—ship tracking and moored buoys drifting from their position, through ODIS. A wide variety of functions for input, query, data retrieval, visual quality control and reporting are built into the RDBMS. The ODIS database design is flexible and capable of extending to new platforms as and when the need arises. The database is based on client/server architecture such that MySQL, located on a server PC and other applications are located on different client PCs. Backup database server is used to maintain replicas of the original data and the master database is continuously updated onto the MySQL as and when it is ingested with new data. Also the raw data acquired from different heterogeneous platforms are pushed to the backup FTP server.
Way ForwardODIS has successfully served all types of users—operational and R&D, since July 2010. It overcame many problems faced with the traditional method of handling flat files. ODIS fulfilled the goal of effective data management and set a benchmark for providing powerful mapping and visualisation for oceanographic data. The system has achieved its performance requirements in meeting the demands of the ocean data user community.

36 2020 GeoGraphy and you vol 20, issue 6-7 no. 144-145
Phot
o Co
urte
sy: G
erd
Altm
Ann
I N CO I S | Pa r a me t er I S I Ng
The digital ocean framework is supported by integrating data from diverse ocean observing
systems. The data is converted into actionable insights using
massive computational and visualisation power.

GeoGraphy and you 2020 37
We are living in the digital era and data driven decisions with advanced analytics and visualisation features are becoming an integral part of all walks of life. In ocean sciences abundant marine meteorological and oceanographic data from a variety of ocean observing systems are fed into models to improve
the quality of weather and ocean state forecasts. Well-organised data in an integrated environment will support the usage and help in better understanding of oceanographic processes. This article presents the development of Digital Ocean, a single platform that efficiently integrates heterogeneous ocean data and provides advanced visualisation and analysis to facilitate the improved
understanding of oceans through a multi-disciplinary approach.
The authors are Senior Scientist and Head of Ocean Observations and Data Management Group (ODG); Senior Scientist and Head, Training, Programme Planning and Management Group; Scientist E-ODG; Scientist C-ODG, Scientist D-ODG; and, Director, respectively at Indian National Centre for Ocean Information Services (INCOIS).
[email protected]. The article should be cited as Rao E.P.R., T.V.S.U. Bhaskar, R.V. Shesu, S. Kumar, N.S. Rao and S.S.C. Shenoi, 2020. Digital Ocean, Geography and You, 20(6-7): 36-39
By E Pattabhi Rama Rao, T V S Udaya Bhaskar,RV Shesu, S Kumar, N Srinivasa Rao & SSC Shenoi
Digital

38 2020 GeoGraphy and you vol 20, issue 6-7 no. 144-145
Fig. 1: Digital Ocean showing the in-situ ocean observing system
ESSO-INCOIS has been providing ocean data services through the Ocean Data and Information System (ODIS) developed using open source technologies comprising a set of
web-interfaces to search, visualise and fetch data generated from different observational programmes in the Indian Ocean. However, ODIS has several limitations in integrating the data from diverse ocean observing systems (both in-situ and remote sensing) and ocean models, serving the data in multiple formats, inter-comparison or validation of similar data in space and time, multi-parameter and multi-dimensional visualisation and animations. Thus Digital Ocean was developed to integrate all data from a variety of instruments and sensors on a single platform and to provide a web based analytical and visualisation facility for quick evaluation.
digital ocean FrameworkDigital Ocean framework is a set of applications developed to organise and present heterogeneous oceanographic data interactively, by adopting rapid advancements in geospatial technology. It facilitates an environment for integration of disparate data—in-situ, remote sensing and model data, providing a single interface to fetch and visualise the data interactively (Fig. 1). Digital Ocean supports the Open Geospatial Consortium (OGC) standards such as Web Coverage Services (WCS), Web Mapping Services (WMS) and Sensor Things API. The Digital Ocean components are described below.
Data Integration: The Digital Ocean platform is fed by data generated by various programmes using diverse platforms and sensors. The data received from in-situ platforms—Argo floats, automatic weather stations, moored and drifting buoys, coastal high frequency (HF) radars, tide gauges, wave rider buoys, expendable bathythermograph (XBT), expendable conductivity temperature depth (XCTD) are integrated into a single database. Remote sensing data from National Oceanic and Atmospheric Administration (NOAA) and meteorological operational (METOP) satellites and the data generated from the ocean models run at ESSO-INCOIS are also integrated into this module. Data from new platforms/sensors is also integrated as and where available. However, data from the exclusive economic zone are restricted on this platform and are served separately as per the data sharing guidelines. User Interface: The Digital Ocean environment provides a default workspace with all active platforms from the Indian ocean. Users, once registered, can create a workspace to query, fetch selective data, interactively using visualisation tools built within the application to arrive at a unique analysis. During events like cyclones the administrator can create special workspaces to fetch all relevant data and provide instantaneous views of various oceanographic and marine meteorological parameters evolving during such events, making the workspace readily available to the scientific community, avoiding multiple data requests by users.Data Visualisation: Digital Ocean facilitates data
Data Store Info
Model Data
Save
Filter
Remote Sensing
Wave Rider BuoyTide GaugeMoored BuoyIRAWSHF RadarDrifting BuoyArgo
In-situ
Search

GeoGraphy and you 2020 39
visualisation data in different graphical formats— multi parameter, scatter, section, anomaly, vector, stick, HovmÖller, curtain and waterfall plots, temperature/salinity and rose diagrams, inter-comparison or validation of different data, data fusion from different platforms and create 3D and 4D animations (Fig. 2&3). In addition, remote sensing data visualisation includes pseudo colour with time animation, base raster, multiband visualisation and time series, spatial and spectral plot.Data Fusion: Digital Ocean offers an important feature for fusing similar data from diverse platforms. When a query is passed to the Digital Ocean it will provide/display the data either at one level or at multiple levels, individually or in combination as required, by fusing similar sensor data from different platforms. Similarly, the Digital Ocean platform also allows the display and analysis of data on multiple parameters in space and time simultaneously as they co-evolve.Data Formats and Downloads: Users can query and fetch the data in different formats—csv, txt, netCDF and also the plots from visualisation interface in GeoTiff, PNG, JPEG formats. It also supports instantaneous download of selected data through a ftp process for bulk data.
User Management: The administrative module is developed for user management, authentication of users, their roles and privileges of access to different data sets, categorisation of data as per the data sharing guidelines, metadata management, mail management, usage statistics, system statistics, monitoring of the observing network and the addition of new data streams.
Way ForwardIn a nutshell, the Digital Ocean is the representation of a variety of data on a geo-referenced ocean. In addition, the Digital Ocean built on the real relief of the ocean floor characterised by abyssal plains, ridges, trenches, continental slopes, continental shelf and coasts help in viewing the evolution of oceanographic features. Digital Ocean versatility provides a view of the data on a global framework. In addition, it acts as the data warehouse and data archive for efficient management of data. It can therefore play a strategic role in the sustainable development of the marine world to address the challenges faced by humankind in the exploration of natural resources and management of marine environment particularly in the backdrop of global climate change.
Fig. 2: Curtain plot of water temperature along the track of Cyclone Phailin
Fig. 3: Sea surface temperature plot generated by fusing the data from all available platforms
Fig. 4: 3D visualisaton of temperature data from model output

40 2020 GeoGraphy and you vol 20, issue 6-7 no. 144-145
By E Pattabhi Rama Rao, Ch Patanjali Kumar, B Ajay Kumar, M V Sunanda,R S Mahendra, P L N Murty,
J Padmanabham, D Saikia & SSC Shenoi
The authors are Senior Scientist and Head, Tsunami and Storm Surge Early Warning Services Group
(TWG); Scientist E -TWG; Scientist C-TWG; Scientist D-TWG; Scientist E-TWG; Scientist C-TWG;
Scientist D-TWG; Scientist D-TWG; and, Director respectively of ESSO-Indian National Centre for
Ocean Information Services (INCOIS), Hyderabad. [email protected]. The article should be cited as Rao E.P.R., C.P. Kumar, B.A. Kumar, M.V. Sunanda
and R.S. Mahendra, 2020. Indian Tsunami Early Warning System Future Developments, Geography
and You, 20(6-7): 40-47
Future Developments
IndIan
SyStemearly WarnIng
tsunami
I N CO I S | D I S a S t er M a N a geMeN t

GeoGraphy and you 2020 41
Phot
o Co
urte
sy: A
utho
r
Deep-ocean tsunami detection buoys are a type of instrument used to confirm the arrival of tsunami
waves generated by undersea earthquakes. A typical tsunami buoy system comprises two components;
the pressure sensor anchored to the sea floor and the surface buoy. The sensor on the sea floor measures the change in height of the water column above by
measuring associated changes in the water pressure. India has deployed a total of seven tsunami buoys.

42 2020 GeoGraphy and you vol 20, issue 6-7 no. 144-145
India's coastline stretches more than 7500 km with 30 per cent of the nation’s population living along the coasts. The coastal population, ecosystem and infrastructure in the coastal zone are
becoming increasingly vulnerable to oceanogenic disasters such as tsunamis and storm surges. These events not only destroy life and coastal ecosystems, but also affect economic sectors like agriculture, housing and tourism along with nuclear and conventional power plants and coastal transportation networks (including ports and harbours). Though, tsunamis are rare, unlike storm surges in the Indian Ocean, they create widespread damage along the coast on a basin-wide scale within a very short span of time.
An earthquake of magnitude Mw 9.3 (along with the longest rupture time ever recorded of around 10 to 12 minutes) occurred off the coast of Banda Aceh, Indonesia on December 26, 2004 and triggered a tsunami. The Indian Ocean tsunami was the most destructive ever recorded, killing over 2,30,000 people and displacing more than one million people along the coasts of the Indian Ocean. In the wake of this disastrous event, the Indian Government established the state-of-the-art Indian Tsunami Early Warning System (ITEWS). ITEWS is a one of a kind multi-institutional framework that was established in record time. The Indian Tsunami Early Warning Centre (ITEWC) was set up at the ESSO-Indian National Centre for Ocean Information Services (INCOIS), Hyderabad and made operational on October, 2007 (Gupta 2005). ITEWC is equipped with expert resources and sophisticated computational and communication facilities to receive data in near-real time, process this data and then disseminate tsunami
advisories to different stakeholders. The warning centre operates round the clock to monitor tsunami development in the Indian Ocean and provides timely advisories. ITEWC is recognised as Tsunami Service Provider (TSP) for the Indian Ocean region by the Intergovernmental Coordination Group for the Indian Ocean Tsunami Warning and Mitigation System (ICG/IOTWMS) of Intergovernmental Oceanographic Commission (IOC-UNESCO) along with TSP Indonesia and TSP Australia to provide tsunami early warnings to 25 countries bordering the Indian Ocean.
ITEWC has four components to address the tsunami risk in the Indian Ocean. First, detection of large earthquakes occurring in subduction zones of Indian Ocean—Andaman Sumatra and Makran Subduction Zone. Second, confirmation of tsunami generation by observing significant water level changes through tsunami buoys near epicentre regions. Third, pin pointed identification of the areas under risk using numerical model outputs and finally, monitoring the progress of tsunami waves by coastal tide gauges and high frequency coastal radars.
observation networkSeismic network to monitor earthquakes:ITEWC uses data received in real time from the seismic network to auto detect earthquakes of magnitude >5 from anywhere on the globe. The seismic network comprises approximately 400 seismic stations from national [Real Time Seismic Monitoring Network (RTSMN)] and international networks [Incorporated Research Institutions for Seismology (IRIS), Global Seismographic Network (GSN) and GeoForschungsNetz (GEOFON)]. The system is capable of monitoring
the Indian ocean tsunami, triggered by the sumatra-Andaman earthquake on December 26, 2004, caused approximately 2,30,000 casualties and widespread damage to infrastructure
in several Indian ocean rim countries. In fact, the 2004 tsunami was one of the strongest and deadliest ever recorded in terms of magnitude, which put into perspective the need to set up
an early warning system for tsunamis in India. Following the 2004 tsunami, the Indian tsunami early Warning system (IteWs) was established to provide early warnings on impending
tsunamis triggered due to earthquakes in the Indian ocean. this article describes various components of IteWs, the decision support system and the bulletins. It also discusses issues,
challenges and future developments.

GeoGraphy and you 2020 43
and reporting in the least possible time, the occurrence of earthquakes capable of generating tsunamis in the Indian Ocean region.Based on the earthquake information provided by the seismic network and other ocean related observations, ITEWC evaluates the tsunamigenic potential of undersea earthquakes and issues preliminary qualitative assessment, as per standard operating procedure.Sea level network for confirmation of tsunamis: A very crucial component of the tsunami warning system that helps confirm the generation of a tsunami is the sea-level network that comprises tsunami buoys and tide gauges to detect and monitor tsunamis. Tsunami buoys are deployed close to the tsunamigenic source regions in the Bay of Bengal and the Arabian Sea to detect the propagation of tsunami waves in the open ocean and tidal gauge stations are established along strategic locations of the
Indian coastline to monitor the progress of the tsunami waves, as well as for validation of the model results. The deployment and maintenance of these buoys are carried out by ESSO-INCOIS and ESSO-National Institute of Ocean Technology (NIOT), Chennai and the tide gauge network by ESSO-INCOIS and Survey of India (SoI). The tide gauges station uses three different sensors—radar (RAD), pressure (PRS) and shaft encoder (ENC) gauges. In addition to the sea level network installed by India, ITEWC also receives data in real time from the international sea level network of about 60 tsunami buoys as part of Deep-ocean Assessment and Reporting of Tsunamis (DART) and 300 tide gauges of other international agencies as part of the IOC-Sea level Monitoring Facility.
Since its establishment, ITEWC has till date monitored 549 tsunamigenic earthquakes of
The ITEWC had successfully detected a 8.6 magnitude earthquake off the western coast of Aceh, northern Sumatra in 2012 and accurately analysed that it would not generate tsunami waves, while other advisories issued tsunami warning, triggering panic.
Phot
o Co
urte
sy: A
utho
r

44 2020 GeoGraphy and you vol 20, issue 6-7 no. 144-145
magnitude M ≥ 6.5 and has issued timely tsunami advisories to communities under risk.
numerical Modelling for Forecasting TsunamiWith a view to estimate the tsunami travel time and run-up heights, ITEWC set up the TUNAMI N2 [Tohoku University’s Numerical Analysis Model for Investigation of near-field tsunamis, No.2, (Imamura 1997)] and customised it for inundation studies for the Indian coastal region. The numerical modelling of tsunami generation, propagation and inundation cannot be run in real time as each model run requires substantial computing. Also, since the specific earthquake focal mechanism and rupture parameters (including resulting displacement with area of rupture) needed to model the tsunami wave propagation and inundation are not immediately available, real time modelling is difficult. The mechanism and parameters are not known until well after an earthquake event, if at all. To address this challenge an Open Ocean Propagation Scenario Database (OOPSDB) for the Indian Ocean was generated for different earthquake scenarios on 1000 segments (each segment represents a 7.5 Mw earthquake rupture length and width of 100 x 50 km with slip of 1 m) covering Andaman-Sumatra-Java and Makran subduction zones, to provide information on expected arrival time and amplitude of tsunami
wave at different segments of the coast (Nayak and Kumar 2008). The idea behind creating a pre-computed OOPSDB was to have a ready reference to quickly identify the coastal areas under risk and provide expected tsunami arrival times (ETA) and expected tsunami wave amplitudes (EWA) quickly.
For assessing the impact of tsunamis originating from ‘far-source’ earthquakes occurring in the Pacific and South Atlantic Ocean regions, the Tsunami Model-Numerical simulation of Far-Field tsunamis using TUNAMI-FF was made operational to run model simulations in real time.
The spatial dataset of Coastal Forecast Zones (CFZs), generated using the geographic information system (GIS), forms the basis for translating the model simulation results into an actionable advisory covering a geographical section of the coastline. Each coastal forecast zone is associated with quantitative information extracted from numerical model simulations based on which action could be initiated by local administrators.
Further, finite element based ADvancedCIRCulation (ADCIRC) model developed by the joint efforts of the US Navy Corps and University of Notre Dame is customised to compute the tsunami propagation and inundation along the Indian coasts in real time (Luettich and Westerink 2004). The
Fig. 1: Global network of seismic broadband stations including Indian stations used for real-time earthquake monitoring
National seismic stations (RTSMN)
International seismic stations (IRIS & GeofoN)
100oW 140oe 140oW 90o
70oN
30oN
10oS
50oS
100o20oW 20oe 60oe 100oe60oW
Fig. 2: Sea level network—tsunami buoys and tide gauges established by India
Tide gauge
Tsunami buoy
Subduction zone Map
not
scal
e

GeoGraphy and you 2020 45
model was successfully run experimentally and the results are in good agreement with the observations. The model will be made operational soon.
standard operating procedure and decision support systemConsidering the critical importance of the warning dissemination, ITEWC has developed a standard operating procedure (SOP) for generating and issuing tsunami information to national and international warning centres (Nayak and Kumar 2011). ITEWC services for an earthquake event commence whenever earthquakes are recorded with magnitudes ≥6.5 within the Indian Ocean and magnitudes ≥8.0 outside the Indian Ocean. Upon detecting a tsunamigenic earthquake, scientists on duty begin their analysis immediately, which includes automatic and interactive processes for determining the earthquake’s epicentre, depth, and origin time, as well as its magnitude. The criteria for the generation of different threat types—warning, alert or watch, for a particular region of the coast are based on the available warning time—time taken by the tsunami wave to reach the particular coast. The threat criteria are based on the premise that coastal areas falling within 60 minutes travel time from a tsunamigenic earthquake source need to be warned based solely on earthquake information,
since enough time will not be available to confirm water levels from tsunami buoys and tide gauges. Those coastal areas falling outside the 60 minutes’ travel time from a tsunamigenic earthquake source could be put under the alert or watch status and upgraded to warning only upon confirmation from the water-level data.
A Decision Support System (DSS) that was developed inhouse to capture the real time earthquake information from multiple sources, makes decisions based on situational analysis (using the model results) and observational analysis (using the sea level data) and issues timely tsunami bulletins that include earthquake information and threat-level information if an earthquake has a potential to generate a tsunami (Nayak and Kumar 2011).The DSS disseminates bulletins under the tsunami management guidelines issued by the National Disaster Management Authority (NDMA) in 2010. These bulletins are sent to the Ministry of Home Affairs (MHA) control room, Ministry of Earth Sciences (MoES), NDMA as well as the Andaman and Nicobar Administration. Considering that Andaman and Nicobar islands are close to the tsunamigenic zones, priority is accorded to it in disseminating tsunami bulletins during an event through a fail-safe satellite-based communication system VSAT aided emergency communication system (VECS). Earthquake information, tsunami bulletins as well as real-time sea level observations
Fig. 3: Open Ocean Propagation Scenario Data Base (OOPS-DB) for the Indian Ocean
60oS
60oe30oe 90oe 120oe 150oe
30oS
0oS
Subduction zoneModel domainUnit sources
Indian oceanPacific andSouth Atlantic oceans
ooPS-DB Predicted deep water tsunami wave amplitude
High : 0.74 Low : 0
30oN
Fig. 4 : Real time numerical model outputs for March 11, 2011 tsunami triggered by a M 9.1 earthquake in the east coast of Honshu, Japan
00.02-0.050.05-0.10.1-0.20.2-0.250.25-0.30.3-0.350.35-0.40.4-0.50.5-0.60.6-.750.75-1.01.0-1.51.5-2.02.0-40epicentre
Tsunami travel time
Predicted deep water tsunami wave amplitude (m)

46 2020 GeoGraphy and you vol 20, issue 6-7 no. 144-145
Fig. 5: Standard Operating Procedure and Bulletin Timelines (as per NDMA guidelines) of ITEWC
Mag≥6.5Depth<100 km
ocean
To
B1: To + 10 min
B2: To + 20 min
B2-Supple : As and when revised eQ para available
B3: As and when first real-time observation becomes available
B3-Supple : As and when more real-time observations become available
final: No significant change in WL(or) last exceedance of threat threshold at last Indian coast+120 minutes
earthquake
pre-run model scenario database
expected tsunami arrival times ≤ 60 mins expected tsunami arrival times > 60 mins
expected tsunami wave amplitudes (M)
Threat status expected tsunami wave amplitudes (M)
Threat status
> 2 WARNING > 2 ALeRT
0.5 to 2 ALeRT 0.5 to 2 WATCH
0.2 to 0.5 WATCH 0.2 to 0.5 WATCH
estimated threat status
expected tsunami wave amplitudes (M)
Threat status
> 2 ALeRT
0.5 to 2 WATCH
0.2 to 0.5 WATCH
no significant change threat passed
no SIgnIfIcant changeS In Water level
signiFicant changes in water level
are also made available on a dedicated website for officials, public and media. Users can register on the website to receive earthquake alerts and tsunami bulletins. MHA and NDMA pass on the tsunami bulletins to National Crisis Management Committee (NCMC), National Disaster Response Force (NDRF), State Emergency Operation Centres (SEOCs) and the District Emergency
Operations Centres (DEOCs). ESSO-INCOIS directly disseminates bulletins as well.
Community awareness and preparednessTsunami impact can be mitigated through public education, community awareness and preparedness. ITEWC has been organising regular workshops, training and seminars to
Real-time water-level observations BPRs/Tide gauges
To - Time zeroB1 - Bulletin -1
B2 - Bulletin -2B3 - Bulletin -3
WL - Water Level BPR - Bottom Pressure Recorders
Updated threat status
expected tsunami wave amplitudes (M)
Threat status
> 2 WARNING
0.5 to 2 WATCH
0.2 to 0.5 WATCH
GeoGraphy and you 2020 47
The recent Palu and Krakatau tsunami events triggered by atypical sources such as submarine landslides and volcanic collapses pose a challenge to the existing tsunami early warning systems. It is imperative to identify such regions in the Indian Ocean to assess the potential for such atypical tsunamis, address the gaps and strengthen the upstream and downstream parts of early warning chains. Considering the immediate need to address these challenges, ICG/IOTWMS initiated development of a Probabilistic Tsunami Hazard Assessment (PTHA) for the poorly understood Makran region and its impact on the neighbouring countries as well as strengthening tsunami early warning chain through a regional cooperation. ITEWC is an active collaborator in these initiatives in the North Western Indian Ocean region. Further, ITEWC is engaged in strengthening the downstream part of the early warning chain in coordination with the disaster management agencies at the national and state levels and involving the locals in building tsunami resilient coastal communities.
referencesGupta H. 2005. Mega-tsunami of 26 December 2004:
Indian initiative for Early Warning System and Mitigation of Oceanogenic Hazards, 28(1): 2-5. Available at: https://bit.ly/2RSmXal
Imamura F. 1997. TSUNAMI Modelling Manual (TUNAMI model): UNESCO, Paris: France. Available at: http://www.tsunami.civil.tohoku.ac.jp/hokusai3/J/projects/manual-ver-3.1.pdf
Indian Ocean Tsunami Information Centre (IOTIC). 2017. Guidelines for Indian Ocean Tsunami Ready (IOTR) Programme: Indicators, Checklist, National Recognition and Pilot Implementation Plan. Available at: www.ioc-tsunami.org/IOTRguidelines
Luettich R., and J. Westerink. 2004. Formulation and Numerical Implementation of The 2D/3D ADCIRC Finite Element Model Version 44.XX. Available at: https://bit.ly/34QvEHb
Nayak S. and T. S. Kumar. 2008. Addressing The Risk of The Tsunami in The Indian Ocean, Journal of South Asia Disaster Studies, 1: 45–57. Available at: https://www.researchgate.net/publication/265323682_Addressing_the_Risk_of_Tsunami_in_the_Indian_Ocean
Nayak S. and T. S. Kumar. 2011. Tsunami Watch and Warning Centers, In Gupta H. K. (ed.) Encyclopedia of Solid Earth Geophysics, Dordrecht: Springer, Dordrecht.
create awareness among disaster management officers and other stakeholders. Further, ITEWC tests the efficiency of communication links twice a year to evaluate the readiness to handle emergency situations. The communication (COMMs) tests are conducted in coordination with ICG/IOTWMS of IOC-UNESCO ensuring the participation of all countries on the Indian Ocean rim (IOR).
ITEWC conducts tsunami mock drills at the national and the regional level (IOWave Exercises) under the aegis of IOTWMS every alternate year to evaluate and improve the effectiveness of SOPs of TWC and disaster management officers, in responding to a potentially destructive tsunami. The recent tsunami mock exercise of IOWave18 involving all countries on the IOR in 2018 and multi-state exercise for the east coast of India conducted jointly with MHA and NDMA in 2017 are great examples to build a tsunami resilient community. More than 1,00,000 coastal communities participated in these tsunami mock exercises.
ITEWC also initiated the implementation of the pilot Indian Ocean Tsunami Ready (IOTR) programme of ICG/IOTWMS at a community level. The IOTR (IOTIC 2017) is a voluntary community-based programme that facilitates tsunami preparedness as an active collaboration of the public, community leaders, local and national emergency management agencies. The main objective of IOTR is to improve coastal preparedness for tsunami emergencies and to minimise the loss of life and property. In India, Odisha tested IOTR in six villages on pilot basis during the IOWAVE18.
Way ForwardThe past decade has witnessed substantial developments in the detection of tsunamigenic earthquakes, tsunami forecast, delivery of timely and accurate tsunami early warnings mainly due to rapid advances in the observational systems, tsunami modelling and robust communication and computational systems. Further, concerted efforts internationally in the development of interoperable systems by harmonising the methods and standards for issuance of tsunami advisories, capacity building through community awareness and preparedness have significantly contributed to save lives and minimise losses due to tsunamis.

48 2020 GeoGraphy and you vol 20, issue 6-7 no. 144-145
Tropical storm forecast models conventionally use static sea surface temperature (SST), assuming its temporal changes are not significant in forecast. However, oceanic processes such as upwelling, currents and eddies, significantly modulate SST even at short time scales. Such changes have the potential to influence the planetary boundary
layer. Eminent climate scientists, Morris A Bender and Issac Ginis have shown that inclusion of initial conditions with oceanic mesoscale features can improve hurricane/
cyclone intensity forecasts. Scientific evidence thus supports better forecasts with coupled forecast systems and several forecast centres across the globe depend on such systems. In line with the international efforts, Ministry of Earth Sciences (MoES) and two of its institutes, ESSO-INCOIS and ESSO-IMD, established a state-of-the-art coupled
forecasting system for cyclones arising in the Indian Ocean in collaboration with National Oceanic and Atmospheric Administration (NOAA) of USA. In the present article, we
explore the relevance of the system and its performance in achieving this goal.
By Sudheer Joseph, A Srivastava, A K Das, A Sharma, A Mehra, Hyun-Sook Kim, D Iredell, S Gopalkrishnan,
K J Ramesh, M Mohapatra, S S C Shenoi & M Rajeevan
IndIan Ocean
The authors are Head, Ocean-Atmosphere Coupled System Group (CSG), ESSO-INCOIS; Scientists, India Meteorological Department (IMD), Senior Scientists, National Oceanic and Atmospheric Administration, Former Director General, IMD, Director General, IMD; Director ESSO-INCOIS and Secretary, Ministry of Earth Sciences.
[email protected]. The article should be cited as Joseph S., A. Srivastava, A.K. Das, A. Sharma, A. Mehra et al., 2020. Forecasting Tropical Cyclones in the Indian Ocean, Geography and You, 20(6-7): 48-53
FOrecastIng trOpIcal cyclOnes
In the
a hycOM-hWrF cOupled systeM
I N CO I S | D I S a S t er M a N a geMeN t

GeoGraphy and you 2020 49GeoGraphy and you 2020 49
Phot
o Co
urte
sy: N
AsA
ESSO-IMD made the first operational forecast using the HWRF-HYCOM coupled system together with other models during April 2019 for tropical cyclone Fani, which made landfall in Odisha on May 3, 2019.

50 2020 GeoGraphy and you vol 20, issue 6-7 no. 144-145
Fig. 1: Bar chart of accumulated cyclone energy (ACE) for north Indian ocean from 1972 to 2019. Red dashed line indicates mean value for period between 1972 and 2018
80
60
40
20
0
ACE
1972
1974
1976
1978
1980
1982
1984
1986
1988
1990
1992
1994
1996
1998
2000
2002
2004
2006
2008
2010
2012
2014
2016
2018
2019
Tropical cyclones (TCs) are one of the most destructive weather phenomena often resulting in casualties and extensive damage to property. In a climate change scenario, its effect
can be more than a simple rise in temperatures, like changing patterns of natural tropical storms. Increased intensity of cyclones in recent years has been attributed to climate change by many researchers (Mohapatra et al. 2017; Balaguru et al. 2016; Webster et al. 2005; Emanuel 2005; Mann and Emanuel 2006; Elsner, Kossin and Jagger 2008; Knutson et al. 2010).
Climatologically cyclonic activity in the north Indian Ocean shows two maxima—April-May and October-December (Pattanaik et al. 2017). The cyclone season of 2019 was unique in many aspects in the history of the Indian Ocean. The season showcased eight storms, with six of them developing to a very severe cyclonic stage and one developing as a super cyclone—christened Kyarr. Accumulated cyclone energy (ACE) for the 2019 season is 85.5 as of October 2019, which is ~4.4 times higher than the mean value (19.4) for a period from 1972 to 2018 (Fig. 1).
Given the high potential for damage by TC, forecasting centres across the globe are working towards continuous improvements and accurate forecasts. India Meteorological Department (IMD) too works towards reducing forecast errors in tandem with the international efforts. During the 2010-2013 period (Das et al. 2015), IMD used the atmosphere alone model for operational forecasts. However, researchers showed evidence of better performance for Hurricane Weather
Research and Forecasting (HWRF) model when coupled with an ocean model (Kim et al. 2014). Oceanic processes such as upwelling, currents, eddies, significantly modulate the sea surface temperature (SST) even at short time scales. Such changes have the potential to influence the planetary boundary layer (Warner et al. 1990). Scientists have also shown that inclusion of initial conditions with oceanic features can improve hurricane/cyclone intensity forecasts (Bender and Ginis 2000). As the primary source of energy for tropical cyclones comes from the ocean, the coupled model solution is closer to the natural environment. Sources of oceanic energy are—ocean and atmosphere heat exchange, its steep momentum due to higher heat capacity compared to the atmosphere and the closure of thermodynamic feedback between the atmosphere and the ocean.
The HWRF system is different in many aspects compared to the conventional modelling systems. It has unique moving nested grids for the atmospheric model which provides the highest resolution near to the location of the storm. In addition, it is supported with an advanced data assimilation system which includes an option for cycling the initial vortex. The HWRF physics packages are advanced on the basis of observation. In the configuration adapted at ESSO-IMD and ESSO-INCOIS, the HWRF has a parent domain covering the north Indian Ocean at 18 km horizontal resolution nesting a middle and innermost domain with 6 km and 2 km resolution, respectively, that follow the storm as it evolves (Fig. 2).
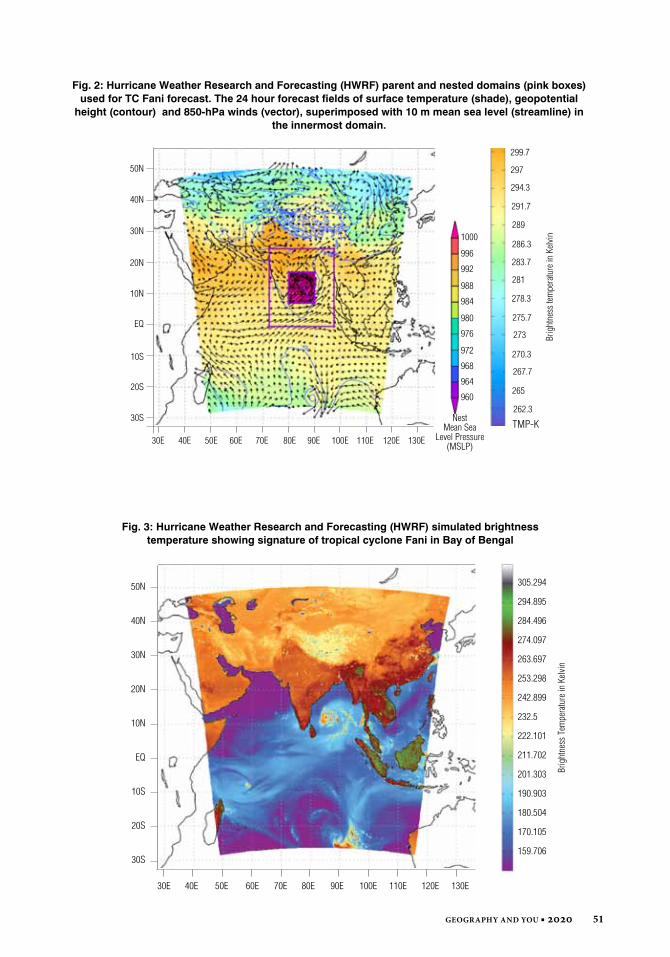
GeoGraphy and you 2020 51
Fig. 2: Hurricane Weather Research and Forecasting (HWRF) parent and nested domains (pink boxes) used for TC Fani forecast. The 24 hour forecast fields of surface temperature (shade), geopotential
height (contour) and 850-hPa winds (vector), superimposed with 10 m mean sea level (streamline) in the innermost domain.
50N
40N
30N
20N
10N
EQ
10S
20S
30S
30E 40E 50E 60E 70E 80E 90E 100E 110E 120E 130E
NestMean Sea
Level Pressure (MSLP)
1000
299.7
297
294.3
291.7
289
286.3
283.7
281
278.3
275.7
273
270.3
267.7
265
262.3
TMP-K
996
992
988
984
980
976
972
968
964
960
Fig. 3: Hurricane Weather Research and Forecasting (HWRF) simulated brightness temperature showing signature of tropical cyclone Fani in Bay of Bengal
305.294
294.895
284.496
274.097
263.697
253.298
242.899
232.5
222.101
211.702
201.303
190.903
180.504
170.105
159.706
50N
40N
30N
20N
10N
EQ
10S
20S
30S
30E 40E 50E 60E 70E 80E 90E 100E 110E 120E 130E
Brig
htne
ss te
mpe
ratu
re in
Kel
vin
Brig
htne
ss T
empe
ratu
re in
Kel
vin

52 2020 GeoGraphy and you vol 20, issue 6-7 no. 144-145
Fig. 4: Comparison of absolute mean track errors of HWRF coupled between POM and HYCOM of IMD and NCEP. Error bars represent standard deviation at different forecast lead hours
0 6 12 18 24 30 36 42 48 54 60 66 72 78 84 90 96 102 108 114 120 126
500
400
300
200
100
0
TrACK_Err_iNCoiS_HyCoM_iMDTrACK_Err_PoM_iMDTrACK_Err_Err_NCEP_HyCoM
Dire
ct p
ositi
on e
rrors
(km
)
Forecast hours
The simulation from the existing operational HYCOM model at ESSO-INCOIS was modified to suit the grid requirement of the HWRF coupled system. ESSO-IMD made the first operational forecast for Cyclone Fani using the HWRF-HYCOM coupled system together with other models during April 2019.
In the operational set-up of the HWRF-HYCOM coupled system, the model runs four times a day at 00, 06,12 and 18 UTC assimilating the observations available at the time of a run.
Each cycle produces 126 hour forecasts. Brightness temperature forecast by the model for April 29, 2019 at 00 hours, showing the influence of TC Fani is presented in figure 3. The scientists at INCOIS and IMD assesses the quality of the forecast for a cyclone as the average distance between forecast track at each hour and the track officially declared as ‘best track’ by ESSO-IMD. Similarly, they also estimated the intensity of error as the difference between maximum sustained forecast wind or minimum pressure between the best track estimate and the forecast track.
The results showed that the newly established system performed well in comparison with forecasts issued by NCEP and also the Princeton Ocean Model (POM) coupled forecast of ESSO-IMD (Fig. 4). After the TC Fani system, successful forecasts include that of
Vayu, Hikaa, Kyarr, Maha and Bulbul.
Way ForwardDespite the accomplishment of a working coupled forecast system for tropical cyclones for the nation, there remain several elements which can better the forecast. For instance real time observations at storm centres and assimilating such data can considerably improve the accuracy of the forecast. For such observations, specialised storm resistant aircrafts need to be used, which may be taken up as the next step for improving the presently established system.
referencesBalaguru K., G. R. Foltz, L. R. Leung and K. A.
Emanuel. 2016. Global Warming-Induced Upper-Ocean Freshening and The Intensification of Super Typhoons, Nature communications, 7(1): 1–8. Available at: https://www.nature.com/articles/ncomms13670
Bender M. A. and I. Ginis. 2000. Real-Case Simulations of Hurricane–Ocean Interaction Using A High-resolution Coupled Model: Effects on Hurricane Intensity, Monthly Weather Review, 128(4): 917—946. Available at: https://bit.ly/2Y0VBT6
Das A. K., Y. V. R. Rao, V. S. Tallapragada , Z Zhang and S. K. R. Bhowmik. 2015. Evaluation of the Hurricane Weather Research and Forecasting
HyCoM - Hybrid coordinate modeL; PoM - Princeton ocean model; NCEP - National centre for environmental prediction;HWrF - Hurricane weather research and forecasting model

GeoGraphy and you 2020 53
(HWRF) Model for Tropical Cyclone Forecasts Over The North Indian Ocean (NIO), Natural Hazards, 75:1205–1221. Available at: https://bit.ly/3eRrVhs
Kim H. S., C. Lozano, V. Tallapragada, D. Iredell and D. Sheinin. 2014. Performance of Ocean Simulations in the Coupled HWRF–HYCOM Model, Journal of Atmospheric and Oceanic Technology. Available at: https://bit.ly/3cKr1Be
Pattanaik D. R., O. P. Sreejith, D. S. Pai and M. Musale. 2017. Seasonal Forecast of Tropical Cyclogenesis Over Bay of Bengal During Post-monsoon Season, in Mohapatra M., B. K. Bandyopadhyay and L. S. Rathore (ed.) Tropical Cyclone Activity over the North Indian Ocean, New Delhi: Springer International Publishing.
Emanuel K. 2005. Increasing Destructiveness of Tropical Cyclones Over The Past 30 year', Nature, 436: 686–688. Available at: https://www.nature.com/articles/nature03906
Mann M. E. and K. A. Emanuel. 2006. Atlantic Hurricane Trends Linked to Climate Change, Advancing Earth and Space Science, 87(24): 233– 241. Available at: https://bit.ly/2yDX9Yz
Mohapatra M., A. K. Srivastava, S. Balachandran and B. Geetha. 2017. Inter-annual Variation and Trends in Tropical Cyclones and Monsoon Depressions Over the North Indian Ocean, in Rajeevan M. N. and S. Nayak (ed.) Observed Climate Variability and Change over the Indian Region, Singapore: Springer.
Elsner J. B., J. P. Kossin and T. H. Jagger. 2008. The Increasing Intensity of The Strongest Tropical Cyclone, Nature, 455(7209): 92-95. Available at: https://fla.st/2VVOmcl
Knutson T. R., J. L. McBride, J. Chan, K. Emanuel and G. Holland. 2010. Tropical Cyclones and Climate Change, Nature geoscience, 3: 157-163. Available at: https://www.nature.com/articles/ngeo779
Warner T. T., M. N. Lakhtakia, J. D. Doyle and R. A. Pearson. 1990. Marine Atmospheric Boundary Layer Circulations Forced by Gulf Stream Sea Surface Temperature Gradients, Monthly weather review, 118(2): 309—323. Available at: https://bit.ly/2S7sMRk
Webster P. J., G. J. Holland, J. A. Curry and H. R. Chang. 2005. Changes in Tropical Cyclone Number, Duration, and Intensity in a Warming Environment, Science, 309(5742): 1844–1846. Available at: https://science.sciencemag.org/content/309/5742/1844
Now read G'nY
e-articles on our website...
L i g h t s
For more information please contact our Subscription Cell. Address of correspondence:
Iris Publication Pvt. Ltd., 504, Bhikaji Cama Bhawan, R.K. Puram, New Delhi - 110066,
Ph.: +91-11-26186350, 46014233 Email: [email protected]
Visit us at: www.geographyandyou.com/shop
Log on to www.geographyandyou.
com/shop/categories/listing/11

54 2020 GeoGraphy and you vol 20, issue 6-7 no. 144-145
The authors are Scientist E, in-charge of CGAM Team; Project Scientists B; and, Head of Tsunami and Storm Surge Early Warning Services Group, respectively, Indian National Centre for Ocean Information Services (INCOIS), Hyderabad, respectively. [email protected]. The article should be cited as Mahendra R.S., P.C. Mohanty, H. Shiva Kumar and E. Pattabhi Rama Rao. 2020. Coastal Vulnerability and Risk Assessment, Geography and You, 20(6-7): 54-61
By R S Mahendra, P C Mohanty, H Shiva Kumar & E Pattabhi Rama Rao
and Risk assessmentCoastal VulneRability
Dense population along the Indian coast impacts the coral ecosystems making them susceptible to natural and man-made hazards. This work assesses the physical vulnerability and socio-economic risks due to oceanogenic disasters at the regional as well as micro level. The study also encompasses the impact of sea surface temperature (SST) on coral ecosystems that leads to coral bleaching. The assessment of remote sensing data combined with geographical information system (GIS) technology provides meaningful information on coastal vulnerability and risk associated with oceanogenic disasters along the Indian coast holding immense relevance for disaster management.
I N CO I S | D I S a S t er M a N a geMeN t

GeoGraphy and you 2020 55
PhoT
o Co
urTe
Sy: T
orIa
ezu-
TabI
.Com
India has a vast coastline of 7516.6 km, touches nine states and four union territories, posing unique challenges in identifying vulnerabilities to its coastal settlements and communities.

56 2020 GeoGraphy and you vol 20, issue 6-7 no. 144-145
Vulnerability is a degree to which a system is susceptible, or unable to cope with, adverse effects of climate change, including climate variability and extremes (IPCC
2001). In the coastal perspective, vulnerability is a measure of the propensity of coastal elements/resources to hazards such as tsunami, storm surge, coastal erosion and sea level rise. The risk entails potential loss, damage or destruction of coastal elements. As densely populated coastal zones are exposed to uncertain natural environment, scientific assessment of their vulnerability and risk becomes imperative. There are several approaches adopted by researchers to assess the coastal vulnerability (Kumar et al. 2010; INCOIS 2012; Ganesh et al. 2016; Ahammed et al. 2016; Mohanty et al. 2017).
Coastal vulnerability index (CVI) is one such procedure to estimate physical fragility. CVI is calculated using the parameters such as shoreline change rate, coastal slope, coastal elevation, coastal geomorphology, tidal range, sea level change rate, geomorphology, significant wave height and historical rate of relative sea level change. CVI estimates indices for each coastal stretch that indicates the implications of future sea level rise. Besides, multi-hazard vulnerability mapping (MHVM) is an assessment of coastal flooding due to oceanogenic disasters such as tsunami, storm surge, coastal flooding, erosion and sea level rise (Mahendra et al 2010; Mahendra et al 2011; Saxena et al. 2012). MHVM is a single cumulative map representing multiple oceanogenic hazards that cause coastal inundation. Coral bleaching representing the risk due to elevated temperatures is also assessed based on the sea surface temperature (SST) parameters using National Oceanic and Atmospheric Administration’s Advanced Very High Resolution Radiometer (NOAA- AVHRR) satellite data. MHVM uses a different method, carried out using the parameters of extreme water levels extracted from continuous hourly tide gauge data, sea level rise, coastal erosion, high resolution topographic data unlike the CVI. All activities mentioned in this article are initiatives of the ESSO-Indian National Centre for Ocean Information Services (INCOIS).
A systematic and scientific assessment of coastal vulnerability and risk can be undertaken through geospatial technologies that comprise
There are several challenges in the
vulnerability findings, which can be further improved by using
high resolution multi-temporal data derived from remote sensing platforms,
simulations and other observational
platforms.

GeoGraphy and you 2020 57
GIS, remote sensing (RS) and global positioning system (GPS). Remote sensing can provide vital inputs such as synoptic and detailed data required for emergency and post disaster responses for the correct vulnerability and impact analysis. Inputs such as digital elevation models (DEM) generated using high resolution remote sensing, and aerial platforms provide critical inputs in the simulation of the disaster scenario in real time. The recent advancements in automation and digital interpretation methods in the field of geospatial technology have facilitated in making disaster warning and mitigation process faster and simpler. Further, web GIS interfaces and Web Map Service (WMS) have become handier for disaster managers, policy makers and users to get the information interactively. Geospatial aids such as mobile/web-based solutions are being extensively deployed in emergency responses and relief operations.
Airborne Lidar Terrain Mapping (ALTM) can produce high resolution topographic data representing coastal DEM that provides accurate coastal topography yields in terms of estimation of highly accurate coastal inundation by simulating tsunami scenarios and vulnerability assessments. An example of high resolution DEM overlaid with elevation contour is shown as figure 1.
Cvi MappingCarried out on a scale of 1:1,00,000, the aim of the coastal vulnerability assessment is to objectively determine the risks due to future sea-level rise based on the physical and geological parameters for the Indian coast. The CVI takes into account the relative risk of physical changes that will occur as sea level rises and combines a coastal system’s susceptibility to change with its natural ability to adapt to changing environmental conditions. The CVI then yields a relative measure of the system’s natural vulnerability to the effects of sea level rise. These CVI maps are useful in long term resource management such as threats to resources and provides insight into the relative potential of coastal change due to future sea level rise. The maps and data in figure 2 can be viewed in at least two ways—first as a base for developing a more complete inventory of variables influencing the coastal vulnerability to future sea level rise to which other elements can be added as they become available; and second as an example of the potential for assessing coastal vulnerability to
Fig. 3: Areas of MHVM (orange) along parts of Visag area, Andhra Pradesh
Fig. 2: Map of CVI and input risk parameters of the Andhra Pradesh coast
Maharashtra
Chhattisgarh
Odisha
SCR
CVI
Elev
atio
nSl
ope
Sea
leve
l cha
nge
Geom
orph
olog
yTi
dal r
ange
SWH
Telangana
Andhra Pradesh
Risk rating CVi
Very high
High
Medium
Low
5
4
3
2
1
Fig. 1: High resolution DEM data derived using digital camera and elevation contours of the Visag region
Note: Orange depicts extent of flooding

58 2020 GeoGraphy and you vol 20, issue 6-7 no. 144-145
future sea level rise using an objective criteria.Multi-hazard Vulnerability Mapping (MHVM): The purpose of MHVM is to identify the most vulnerable and high risk areas on a priority basis. The multi-hazard mapping is carried out using multiple parameters which are then synthesised to derive a composite hazard line.
The hazard and vulnerability maps at the scale of 1:25,000, reflect coastal inundation caused due to oceanogenic disasters and can be used for coastal zone planning, for disaster preparedness, management and risk assessment, as well as for the planning of future developmental projects. A sample map overlaid on DEM is provided in figure 3.
3d Gis Mapping Projecting settlement utilities and socio-economic details on to the desktop, 3D GIS mapping surpasses all existing photogrammetric
Fig. 4: Tsunami inundation level at each building (top) and building level riskdue to tsunami (bottom) is estimated along the Cuddalore coast
building riskVery highHighModerateLow
inundation depth3m2m 1m
techniques. These techniques do not meet the accuracy demands of risk mapping in estimating vertical relief and only provide what is known as 2.5D information in GIS parlance. 3D GIS on the other hand is able to effectively visualise and communicate the inundation risk at building level and plan for evacuation routes.
A 3D GIS mapping was undertaken along the Cuddalore coast and realistic 3D models of the buildings along with the attributed details of the owner, address and other socio-demographic details was generated. The base level information of the buildings/ settlements was extracted from the aerial and high resolution satellite data, while the socio-demographic details were collected through field surveys. Video mapping using 360 degree cameras was carried out to procure a high resolution view of the buildings and the terrain. A tsunami inundation scenario was generated using the numerical models. Based on the inundation depth and the socio-economic data—such as population and building

GeoGraphy and you 2020 59
PhoT
o Co
urTe
Sy: S
ebaS
TIan
Sur
mIa
k
The Andaman and Nicobar Islands are home to some of the country’s most beautiful coral reefs and host 89 per cent of India’s coral diversity. The island's reefs suffered from a series of bleaching events place 1998 and 2016, triggered by natural catastrophes such as cyclones, tsunamis and warm underwater currents. Lately marine development near Port Blair and invasive tourism are further threatening the reefs.

60 2020 GeoGraphy and you vol 20, issue 6-7 no. 144-145
type, a graded risk index was calculated (Fig. 4). The scenario-based risk assessment enhances the efficacy of tsunami advisories and will be vital for disaster management offices to prioritise their disaster action plans.
Coral Bleaching alert system (CBas) Coral reefs are one of the most biologically diverse marine ecosystems on earth. They play an important role in marine ecosystems and support myriad habitats in the sea. Ecologically, coral reefs are important because they are the counterpart to the tropical rain forest in terms of species diversity and biological productivity in the ocean. However, the vast diversity of animal and plant species that contribute to the endurance and perpetuity of the genetic heritage that coral reefs represent is increasingly at risk over the past few decades. Corals are very sensitive and undergo thermal stress due to elevated temperatures in the oceanic waters. Satellite derived SST data provides useful insights in calculating probabilities of coral bleaching due to elevated temperature. The
coral bleaching alert system (CBAS) service was initiated by ESSO-INCOIS with the objective of assessing the probable extent and intensity of coral bleaching along the Indian coast.
The main SST parameters derived are the three day hot spot (HS)—positive anomaly and degree of heating weeks (DHWs)—the sum of SST above the threshold in the past three months. Based on HS detection, the DHWs is categorised into—warning (corals under thermal stress), alert level-1 (corals are under thermal stress and partial bleaching expected) and alert level-2 (corals are under serious thermal stress and widespread bleaching expected). The early signs of the intensity and spatial extents of coral bleaching can therefore be understood. This methodology is adapted from the NOAA reef watch and tested for the earlier bleaching events of Indian coral environs (Mohanty et al. 2013; Mohanty et al. 2017; Krishnan et al. 2018). Validation of coral bleaching event recorded during summer months of 2016 was presented in figure 5. Though coral bleaching cannot be prevented, the
Fig. 5: Time-series SST anomaly in Indian coral environs (top) and composites of HotSpot (bottom left), Degree of heating weeks (bottom centre) and field photos (bottom right) of
bleaching event recorded during Summer months of 2016
A bleaching event was recorded during the April-May 2016 at Andaman validated with field data
4321
-5-4-3-2-10
Jan/
10
Sep/
16
Sep/
11
May
/13
May
/18
Jan/
15
Tem
pera
ture
ano
mal
y
(deg
ree
cent
igra
de)
Date (ddmmyy)
Bleaching threshold
AndamanNicobarGulf of MannarLakshadweepGulf of Kutch
Marc
h 28,2
016
Marc
h 31,2
016
April
03,20
16
April
06,20
16
Marc
h 28,2
016
Marc
h 31,2
016
April
03,20
16
April
06,20
16
April
09,20
16Ap
ril 21
,2016
April
12,20
16Ap
ril 24
,2016
April
15,20
16Ap
ril 27
,2016
April
18,20
16Ap
ril 30
,2016
April
09,20
16
April
12,20
16
April
15,20
16
April
18,20
16
April
21,20
16
April
24,20
16
April
27,20
16
April
30,20
16
No stress (< 0) Watch (0 to 1) Warning (>1) Warning Alert level-1 Alert level-2

GeoGraphy and you 2020 61
study can enable policy makers and researchers to assess the extent of damage, facilitating the adoption of appropriate coral rehabilitation and preventive measures. The advisories can also be used by the eco-tourism industry to inform tourists about such events, sensitising them for the need to conserve.
Way ForwardThere are several challenges in the vulnerability findings, which can be further improved by using high resolution multi-temporal data derived from remote sensing platforms, simulations and other observational platforms. The data needs constant updation to bolster the risk assessment. The building level risk assessment can be extended to the entire coast of India. Further strengthening in terms of the adaptive capacity and sensitivity of the vulnerable elements needs impactful policy interventions that will help improve resilience.
The coral bleaching studies can be further enhanced by carrying out location specific impact studies using in-situ observations. Finally, all the information, data and maps need to be disseminated to the end users in the form of an atlas and WMS/website for the appropriate use of stakeholders.
referencesAhammed Basheer K.K., R.S. Mahendra and A.C.
Pandey. 2016. Coastal Vulnerability Assessment for Eastern Coast of India, Andhra Pradesh by Using Geo-Spatial Technique, Geoinformatics & Geostatistics: An Overview, 4(3). Available at: https://bit.ly/3bMFGfb
Ganesh V., R. S. Mahendra, P. C. Mohanty, T. S. Kumar and S. Nanda. 2016. Coastal Vulnerability Assessment for North East Coast of Andhra Pradesh, India, IJRSG, 5(2): 1-7. Available at: https://bit.ly/35nJvFv
Indian National Centre for Ocean Information Services (INCOIS). 2012. Coastal Vulnerability Atlas of India: INCOIS, Hyderabad: India. Available at: ISBN 978-81-923474-0-0.
Intergovernmental Panel on Climate Change (IPCC). 2001. Climate Change 2001: Impacts, Adaptation and Vulnerability: Cambridge University Press, Cambridge: United Kingdom. Available at: https://bit.ly/2KFtfpN
Krishnan P., P.S. Ananthan, P. Ramachandran.,
J. J. Jeevamani and J. A. Infantina. 2018. Framework for mapping the drivers of vulnerability and spatial decision making for climate change adaptation in coastal India: A Case study from Maharashtra, India, Ambio, 48(2): 192-212. Available at: https://bit.ly/3aQMMyd
Kumar T. S., R. S. Mahendra, S. Nayak, K. Radhakrishnan, K. C. Sahu. 2010. Coastal Vulnerability Assessment for Orissa State, East Coast of India, Journal of Coastal Research, 26(3): 523-534. Available at: https://bit.ly/2KGeZgn
Mahendra R.S., P. Mohanty, T. S. Kumar and S. C. Shenoi and S. Nayak. 2010. Coastal Multi-hazard Vulnerability Mapping: A Case Study Along The Coast of Nellore District, East Coast of India, European Journal of Remote Sensing, 42(3): 67-76. Available at: https://bit.ly/2KDl6C4
Mahendra R. S., P. C. Mohanty, H. Bisoyi, T. S. V. Kumar and S. Nayak. 2011. Assessment and Management of Coastal Multi-hazard Vulnerability Along The Cuddalore-Villupuram, East Coast of India Using Geospatial Techniques, Ocean and Coastal Management, 54(4): 302-311. Available at: https://bit.ly/2KCAQFo
Mohanty P. C., R. S. Mahendra, H. Bisoyi, S. K. Tummula and G. Grinson. 2013. Assessment of The Coral Bleaching During 2005 to Decipher The Thermal Stress in The Coral Environs of The Andaman Islands Using Remote Sensing, European Journal of Remote Sensing, 46: 417-430. Available at: https://bit.ly/2W3fZ3v
Mohanty P. C., R. S. Mahendra, R. K. Nayak and T. S. Kumar. 2017. Impact of Sea Level Rise and Coastal Slope on Shoreline Change Along the Indian Coast, Natural Hazards, 89(3): 1227–1238. Available at: https://bit.ly/35eQr7r
Mohanty P. C., P. Venkateshwaran, R. S Mahendra, H. S. Kumar and T. S. Kumar. 2017. Coral Bleaching Along Andaman Coast Due to Thermal Stress During Summer Months of 2016: A Geospatial Assessment, American Journal of Environmental Protection, 6(1): 1-6. Available at: https://bit.ly/2zyeaUp
Saxena S., P. Ramachandran, G. M. D. Suganya and R. Ramachandran. 2012. Coastal Hazard Mapping in The Cuddalore Region, South India, Natural hazards, 66: 1519-1536. Available at: https://bit.ly/2VIVUAh

62 2020 GeoGraphy and you vol 20, issue 6-7 no. 144-145
Chlorophyll concentration (mg/m3)
0.05 0.1 0.3 1 3 10 30 50
Chlorophyll-a, the dominant photosynthetic pigment of phytoplankton—an index of phytoplankton biomass, is used as the primary parameter for the remote detection of algal blooms.
I N CO I S | D I S a S t er M a N a geMeN t

GeoGraphy and you 2020 63
of AlgAl Blooms in them o n i t o r i n g
By SK Baliarsingh, A Samanta & A Lotliker
SeaSindiAn
Phot
o Co
urte
sy: N
AsA
the present century is experiencing frequent widespread occurrences of algal bloom events in different regions of the world’s oceans. the bloom events more often deteriorate the functions of the ecosystem.
therefore, fishermen, fishery resource managers, researchers, ecologists, pollution monitoring agencies and environmentalists
demand continuous monitoring of bloom episodes. this article presents the satellite based algal bloom detection and monitoring service of
esso-INCoIs for the Indian waters.
The authors are Project Scientist B, Scientist C and Scientist E respectively with Earth System Sciences Organisation-Indian National Centre for Ocean Information Services (ESSO-INCOIS) and are part
of the Ocean Information and Forecast Service Group (ISG). [email protected]. The article should be cited as Baliarsingh S.K., A. Samanta and A. Lotliker, 2020. Monitoring of Algal Blooms in the Indian Seas,
Geography and You, 20(6-7): 62-67

64 2020 GeoGraphy and you vol 20, issue 6-7 no. 144-145
Phytoplankton or algae are microscopic photosynthetic plants residing in the oceans. On the onset of favourable environmental conditions, the phytoplankton species grows by
several folds and the scenario is termed as an ‘algal bloom’ (Anderson 1994; Hallegraeff 1995). The algal blooms often exert deleterious effects on the aquatic biota and deteriorate the ambient water quality making it inhabitable for resident organisms (Glibert et al. 2005, Gowen et al. 2012). The prevalence of increased phytoplankton cells generate a large quantum of organic matter that subsequently depletes the aquatic oxygen and disturbs the food chain dynamics (Baliarsingh et al. 2016). In several scenarios, the algal bloom episodes result in mass mortality of fish and the bio-magnification of organic toxins reach the topmost level of the food chain (Ferrante et al. 2013). In general, the algal bloom events exerting a harmful impact on the ecosystem are infamously acronymed HAB—Harmful Algal Bloom. Anthropogenic impacts and multitude of natural phenomena are frequently triggering algal blooms in different regions of the world’s oceans. Increasing frequency of algal bloom is a major concern for fishermen, fishery resource managers, researchers, ecologists, pollution control boards and environmentalists.
The Indian coastal and open ocean waters have also been experiencing multiple events of algal blooms (D’ Silva et al. 2012, Baliarsingh et al. 2016, Lotliker et al. 2018). Bloom of dominant phytoplankton taxonomic groups such as diatoms, dinoflagellates and cyanobacteria have been reported in the Indian waters. Among different phytoplankton groups, the frequent bloom forming species are Asterionellopsis
glacialis, Noctiluca scintillans and Trichodesmium erythraeum.
In the backdrop of short term as well as long term harmful effects of algal blooms, it is imperative to monitor such events. In addition, it is necessary to understand the conducive factors, spreading mechanism and the consequences of algal blooms. In this context, ocean colour satellite remote sensing technology enables for synoptic imaging and monitoring of algal blooms. Although, in-situ observations are most accurate, remotely sensed measurements are cost effective and are able to detect the bloom quickly, providing a synoptic scenario on a wide spatio-temporal scale (Dwivedi et al. 2015, Baliarsingh et al. 2017). Specific bio-optical algorithms are required to retrieve algal bloom information from ocean colour satellites and several such schemes have been developed.
ESSO-Indian National Centre for Ocean Information Services (INCOIS), an autonomous body under the Indian ministry for earth sciences has initiated the Algal Bloom Information Service (ABIS) using ocean colour remote sensing technology with a suite of appropriate bio-optical algorithms (Fig. 1). The ABIS, launched February 24, 2020 disseminates composite maps of bloom, its proxies and ancillary products on a daily basis. In addition, four hot spots—coastal waters off Kerala and Gopalpur in Odisha, Gulf of Mannar and open ocean waters of Northeastern Arabian Sea are closely monitored.
The ABIS uses a set of environmental proxies for detection and monitoring of algal bloom events. Among such proxies, chlorophyll-a, the dominant photosynthetic pigment of phytoplankton—an index of phytoplankton biomass, is used as the primary parameter. The second most important

GeoGraphy and you 2020 65
Fig. 1: Schematic of algal bloom information service
19 Feb 2020
19 Feb 2020
sea surface temperature in oC
Bloom Index
Chlorophyll-a Concentration
Chlorophyll-a Concentration Anomaly sea surface temperature Anomaly
Nano Plankton AbundancePico Plankton AbundancePhytoplankton Class/species
Mico Plankton Abundance Bloom PixelBloom Non Bloom
Green Noctiluca red Noctiluca Diatoms
Chlorophyll-a Concentration ABI algorithm
19 Feb 2020
19 Feb 2020
19 Feb 2020
19 Feb 2020
19 Feb 2020
19 Feb 2020
19 Feb 2020
19 Feb 2020
19 Feb 2020
Warning (Bloom Pixels)> 75% Normal (Bloom Pixels)> 50%Status Colour Watch (Bloom Pixels >50% & <75% No Data
eSSo - india national Centre for ocean information Services(An Autonomous Body under the Ministry of earth Sciences, Govt. of india)
organisation services
services
Data & Information
homeInformationInformation
Algal Bloom Information services ABIs
BloomAlgal
service (ABIs)
ABIs overview
Latest Bloom Information
hotspot statistics
Data Products
recent occurrences
technical Document
Case studies
Case study-I
Case study-II
ABIs Products
Latest Bloom Information
19 Feb 2020
Bloom Non Bloom
Last updated : 19 Feb 2020
hindi home Annual reports Vacancies tenders Library Feedback sitemap Contact us
ocean observations Modelling & research satellite oceanography ItCo ocean
29,680 sqKm spread of green Noctiluca in North eastern Arabian sea(NeAs), No Information for green NNo Information for red Noctiluca in North eastern Arabian sea(NeAs), No Information for Noctiluca in90,640 sqKm spread of Diatoms North easter Arabian sea(NeAs), No Information spread of Diatoms
Subscription
Data download module
Start and initialise Processing module
(L1A>L1B>L2)Binning module
(L2 LAC > L3 GAC)
L3 Binnedarchive
Standard mapped image generation module
L3 binned GAC>SMi
Roll products module
Bloomindex
moduleBloom indexSStChl-a Chl-a (ABi)
Decision making
SMi generation for bloom
information
ABisChl-a Anomaly SSt Anomaly
Phyto classPhyto class
module
30 day anomaly
generation module
Picoplankton
Phyto size class module
MicroplanktonAncillary
information
Sector wise statistics
Disseminationmodule
ABIS uses satellite images of various algal bloom species, combines it with the ocean colour remote sensing technology under a suite of appropriate bio-optical algorithms, to detect widespread events.
indexSMi = Standard Mapped
imageGAC = Global Area
CoverageLAC = Local Area Coverage L1A = Level 1A processingL1B = Level 1B processingL2 = Level 2 processing
(using suitable atmospheric correction scheme and bio-optical algorithm)
L3 = Level 3 processing (space binning)
nanoplankton
Parameter Description (unit) north eastern Arabian Sea (neAS)
Kerala Coast (KRL)
Gulf of Mannar (GoM)
Gopalpur Coast (GPLPR)
Average Biomass Concentration (mg/m3)
5.663 0.1105 0.5688 0.2483
Standard Deviation of Biomass Concentration (mg/m3)
9.254 0.04266 0.6849 0.09404
Average Sea Surface temperature (oC)
24.73 28.83 28.23 26.58
Standard Deviation of Sea Surface temperature (oC)
0.7545 0.9924 1.074 0.7565
Average Bloom index -0.01062 -0.6519 -0.7401 -0.7105
Standard Deviation of Bloom index 0.3815 0.1143 0.1074 0.05468
Average Biomass Concentration Anomaly (mg/m3)
1.239 -0.0576 -0.0793 -0.1029
Parameter Description (unit) north eastern Arabian Sea (neAS)
Kerala Coast (KRL)
Gulf of Mannar (GoM)
Gopalpur Coast (GPLPR)
Average Sea Surface temperature Anomaly (oC)
0.359 -0.3554 0.1684 0.4625
Spread of Green Noctiluca (sq km) 29680 -999 112 -999
Spread of Red Noctiluca (sq km) -999 -999 -999 -999
Spread of Diatoms (sq km) 90640 -999 496 16
Picophytoplankton Abundance (%) 23.33 46.14 40.83 44.13
nanophytoplankton Abundance (%) 17 34.36 30.25 32.79
Microphytoplankton Abundance(%) 59.67 19.51 28.92 23.07
Status

66 2020 GeoGraphy and you vol 20, issue 6-7 no. 144-145
ABIS data is shared on the ESSO-INCOIS and widely used by various stakeholder groups such as fisheries institutes, pollution monitoring agencies, fishermen associations, oceanographic research organizations and coastal aquaculture industries.
Fig. 2: ABIS dissemination web page for February 19, 2020 bloom event
eSSo - india national Centre for ocean information Services eSSo - india national Centre for ocean information Services(An Autonomous Body under the Ministry of earth Sciences, Govt. of india) (An Autonomous Body under the Ministry of earth Sciences, Govt. of india)
organisation services
services services
Data & Information
home homeInformationInformation Information
Algal Bloom Information services ABIs Algal Bloom Information services ABIs
Bloom BloomAlgal Algal
service (ABIs)
ABIs overview
Latest Bloom Information
hotspot statistics
Data Products
recent occurrences
technical Document
Case studies
Case study-I
Case study-II
ABIs overview
Latest Bloom Information
hotspot statistics
Data Products
recent occurrences
technical Document
Case studies
Case study-I
Case study-II
service (ABIs)
ABIs Products ABIs Products
Latest Bloom Information
hotspot statistics
19 Feb 202019 Feb 2020
19 Feb 2020
sea surface temperature in oC
Bloom Index
Chlorophyll-a Concentration
Chlorophyll-a Concentration Anomaly sea surface temperature Anomaly
Nano Plankton AbundancePico Plankton AbundancePhytoplankton Class/species
Mico Plankton Abundance
Insufficient/No Data Normal
NeAs
GPLPr
GoM
KrL
Watch Warning
Copyright @ esso - India National Centre for ocean Information services (INCoIs), Govt of India. All rights researved.
Download Data (19 Feb 2020)
recent occurrences
Bloom Pixel
Bloom
Bloom
29,680 sq km spread of green Noctiluca in North eastern Arabian sea(NeAs), No Information for green NNo Information for red Noctiluca in North eastern Arabian sea (NeAs), No Information for Noctiluca in90,640 sq km spread of diatoms North easter Arabian sea(NeAs), No Information spread of diatoms
Non Bloom
Non Bloom
Green Noctiluca red Noctiluca Diatoms
Chlorophyll-a Concentration ABI algorithm
19 Feb 2020
19 Feb 2020
19 Feb 2020
19 Feb 2020
19 Feb 2020
19 Feb 2020
19 Feb 2020
19 Feb 2020
19 Feb 2020
Last updated : 19 Feb 2020 Data Products
hindi hindihome homeAnnual reports Annual reportsVacancies Vacanciestenders tendersLibrary LibraryFeedback Feedbacksitemap sitemapContact us Contact us
ocean observations Modelling & research satellite oceanography ItCo ocean
19-J
an-2
020
-Jan
-20
21-J
an-2
022
-Jan
-20
23-J
an-2
024
-Jan
-20
25-J
an-2
026
-Jan
-20
27-J
an-2
028
-Jan
-20
29-J
an-2
030
-Jan
-20
31-J
an-2
01-
Feb-
202-
Feb-
203-
Feb-
204-
Feb-
205-
Feb-
206-
Feb-
207-
Feb-
20
9-Fe
b-20
8-Fe
b-20
10-F
eb-2
011
-Feb
-20
12-F
eb-2
013
-Feb
-20
13-F
eb-2
015
-Feb
-20
16-F
eb-2
017
-Feb
-20
18-F
eb-2
019
-Feb
-20
physical indicator is the sea surface temperature (SST). In general, cooler SST is associated with upwelling or convective mixing of the water column. Phytoplankton growth promoting nutrients from the subsurface layers are injected into the upper, well lit zone of the ocean through these mixing processes. Therefore, SST in combination with chlorophyll-a is a suitable proxy for bloom detection (Wei et al. 2008). In addition, ABIS uses a bloom index (BI) which is helpful in determining the bloom/non-bloom condition especially in optically complex waters (Ahn and Shanmugam 2006). Subsequent to detection of bloom, ABIS also provides information on the causative group/species of phytoplankton and is equipped with a scheme for detection of ubiquitous phytoplankton group ‘diatom’. HAB
enlisted frequent bloom forming in the Indian waters include the species Noctiluca scintillans. These occur as two colour variants or ecotypes which the ABIS is capable of identifying as well as discriminating. ABIS also provides information on phytoplankton size classes (PSC) exhibiting significant variability during non-bloom and bloom conditions (Sahay et al. 2017).
In addition, 30 day anomalies of the chlorophyll-a manifests in a contrast in the phytoplankton biomass production between bloom and non-bloom conditions. Similarly, the SST anomaly also exhibits distinguishable variation in magnitude conducive to mixing during bloom events. ABIS uses MODISA Level-1 data and processes it all the way up to Level-3 standard mapped image (SMI) for Chl-a, Chl-a
Warning (Bloom Pixels)> 75% Normal (Bloom Pixels)> 50%Status Colour Watch (Bloom Pixels >50% & <75% No Data
Parameter Description (unit) north eastern Arabian Sea (neAS)
Kerala Coast (KRL)
Gulf of Mannar (GoM)
Gopalpur Coast (GPLPR)
Average Biomass Concentration (mg/m3) 5.663 0.1105 0.5688 0.2483
Standard Deviation of Biomass Concentration (mg/m3)
9.254 0.04266 0.6849 0.09404
Average Sea Surface temperature (oC) 24.73 28.83 28.23 26.58
Standard Deviation of Sea Surface temperature (oC)
0.7545 0.9924 1.074 0.7565
Average Bloom index -0.01062 -0.6519 -0.7401 -0.7105
Standard Deviation of Bloom index 0.3815 0.1143 0.1074 0.05468
Average Biomass Concentration Anomaly (mg/m3)
1.239 -0.0576 -0.0793 -0.1029
Parameter Description (unit) north eastern Arabian Sea (neAS)
Kerala Coast (KRL)
Gulf of Mannar (GoM)
Gopalpur Coast (GPLPR)
Average Sea Surface temperature Anomaly (oC)
0.359 -0.3554 0.1684 0.4625
Spread of Green Noctiluca (sq km) 29680 -999 112 -999
Spread of Red Noctiluca (sq km) -999 -999 -999 -999
Spread of Diatoms (sq km) 90640 -999 496 16
Picophytoplankton Abundance (%) 23.33 46.14 40.83 44.13
nanophytoplankton Abundance (%) 17 34.36 30.25 32.79
Microphytoplankton Abundance(%) 59.67 19.51 28.92 23.07
Status
neAS - north eastern Arabian SeaKRL - Kerala coastGoM - Gulf of MannarGPLPR - Gopalpur coast

GeoGraphy and you 2020 67
ABI, SST as well as at Level-4 SMI for Bloom Index, Phyto Class, PSC and anomaly products. ABIS products are disseminated through the ESSO-INCOIS website for various stakeholders including the targeted user agencies of fisheries institutes, pollution monitoring agencies, fishermen associations, oceanographic research organisations and coastal aquaculture industries (Fig. 2). Genesis, background, operational scheme and web dissemination of ABIS are detailed in the technical document by A Samanta and his colleagues (Samanta 2019).
Way ForwardAs a future course of action, ESSO-INCOIS plans to incorporate sea surface current and wind in the physical proxy of ABIS to track down bloom movement. In addition, inclusion of different modelling components such as hydrodynamic, optical and ecological parameters are being planned to build a robust decision support system. Species specific bloom detection is also envisioned in the ABIS to deliver bloom advisories.
referencesAhn Y. H. and P. Shanmugam. 2006. Detecting The
Red Tide Algal Blooms From Satellite Ocean Color Observations in Optically Complex Northeast-Asia Coastal waters, Remote Sensing of Environment, 103(4): 419-437. Available at: https://bit.ly/3aI584m
Anderson D. M. 1994. Red tides. Scientific American, 271: 52-58. Available at: https://www.scientificamerican.com/article/red-tides/
Baliarsingh, S.K., A.A. Lotliker, V.L. Trainer, M.L. Wells, C. Parida. 2016. Environmental Dynamics of Red Noctiluca scintillans Bloom in Tropical Coastal Waters, Marine Pollution Bulletin, 111(1–2): 277–286. Available at: https://bit.ly/2Ybu0ib
Baliarsingh S. K., R. M. Dwivedi, A. A. Lotliker, K. C. Sahu and T. S. Kumar. 2017. An Optical Remote Sensing Approach for Ecological Monitoring of Red and Green Noctiluca Scintillans, Environmental Monitoring and Assessment, 189(7): 330. Available at: https://bit.ly/2xfktM3
D’Silva M. S., A. C. Anil, R. K. Naik, P. M. D’Costa. 2012. Algal Blooms: A Perspective From The Coasts of India, Natural Hazards, 63: 1225-1253. Available at: https://bit.ly/2VL9OlM
Dwivedi R., M. Rafeeq, B. R. Smitha, K. B. Padmakumar and L. C. Thomas, L. C. 2015. Species Identification of Mixed Algal Bloom in The Northern Arabian Sea Using Remote Sensing Techniques, Environmental Monitoring and Assessment, 187(2): 51. Available at: https://bit.ly/2SffD8O
Ferrante M., O. C. Gea, M. Fiore, V. Rapisarda and C. Ledda. 2013. Harmful Algal Blooms in The Mediterranean Sea: Effects on Human Health, Euromediterranean Biomedical Journal, 8(6): 25-34. Available at: https://bit.ly/2KHsg8i
Glibert P. M., S. Seitzinger, C. A. Heil, J. M. Burkholder and M. W. Parrow. 2005. The Role of Eutrophication and The Global Proliferation of Harmful Algal Blooms: New Perspectives and New Approaches, Oceanography, 18(2): 198–209. Available at: https://bit.ly/2Y8bMhD
Gowen R. J., P. Tett, E. Bresnan, K. Davidson and A. McKinney. 2012. Anthropogenic Nutrient Enrichment and Blooms of Harmful Phytoplankton, Oceanography and Marine Biology: An Annual Review, 50: 65–126. Available at: https://bit.ly/2yS35x3
Hallegraeff G. M. 1995. Harmful algal blooms: a global overview, in Hallegraeff G. M., D. M. Anderson, A. D. Cembella and H. O. Enevoldsen (ed.) Manual on Harmful Marine Microalgae, Paris: UNESCO.
Lotliker A. A., S. K. Baliarsingh, V. L. Trainer, M. L. Wells and C. Wilson. 2018. Characterization of Oceanic Noctiluca Blooms Not Associated With Hypoxia in The Northeastern Arabian Sea, Harmful Algae, 74: 46-57. Available at: https://www.ncbi.nlm.nih.gov/pubmed/29724342
Samanta A., A. A. Lotliker, S. K. Baliarsingh, Nair Balakrishnan T.M. 2019. Algal Bloom Information Service, Hyderabad: ESSO-INCOIS.
Sahay A., S. M. Ali, A. Gupta and J. I. Goes. 2017. Ocean Color Satellite Determinations of Phytoplankton Size Class in The Arabian Sea During The Winter Monsoon, Remote Sensing of Environment, 198: 286-296. Available at: https://bit.ly/2ySq4sc
Wei G., D. Tang and S. Wang. 2008. Distribution of Chlorophyll and Harmful Algal Blooms (HABs): A Review on Space Based Studies in The Coastal Environments of Chinese Marginal Seas, Advances in Space Research, 41(1): 12-19. Available at: https://bit.ly/3bOdmsU

68 2020 GeoGraphy and you vol 20, issue 6-7 no. 144-145
By Nagaraja Kumar & Nimit Kumar
Fish-finding I N CO I S | S er v I C e S
A concerted effort towards developing species-specific advisories for some important species that are commercially valuable but under exploited are being made by ESSO-INCOIS.

GeoGraphy and you 2020 69
Phot
o Co
urte
sy: r
oozb
eh-e
slam
i
The authors are Scientist E , in-charge of Marine Fishery Advisory Services (MFAS) Programme; and, Project Scientist, MFAS Programme respectively, at ESSO-INCOIS. [email protected]. The article should be cited as Kumar
N. and Nimit K., 2020. Fish-finding From Space : The Indian Journey, Geography and You, 20 (6-7): 68-75
the Potential Fishing zones (PFz) advisory provided by hyderabad based esso-iNCois has made a remarkable difference in the lives and livelihoods of the fishing community across the indian coast. it has resulted in significant savings in terms of time, effort and fuel spent in looking for fish shoals, thus improving profitability and the socio-economic status of fisherpersons. this advisory is useful in the reduction of Co2 emissions too, indirectly contributing towards protection of the environment. this article provides an overview of the pathbreaking pfz technology that has set a milestone in the reliability of marine advisory and forecast services.
Fish-finding F r o m S p a c e
The IndIan Journey

70 2020 GeoGraphy and you vol 20, issue 6-7 no. 144-145
Today space technology has evolved to a level that man made satellites, buzzing in orbits around the earth, easily pinpoint every tiny detail. These satellites provide scientists a
peek into the myriad mysteries of the universe, leading to gradual evolution of technologies that make a remarkable impact on everyday life. In our own country, the Hyderabad based Indian National Centre for Ocean Information Services (INCOIS), a unit of the Earth System Science Organisation (ESSO) under the Ministry of Earth Sciences (MoES), has made a transformative effect on the lives of fishing community by providing Potential Fishing Zones advisory services across the Indian coast. The service is operational 365 days a year except during the ‘marine fishing ban’ imposed by respective governments or when fishing is found to be unsafe, due to high waves in the ocean.
The pfz advisories, generated mainly on satellite data, are released in real time. Initially developed by Space Applications Centre (SAC), Ahmedabad, this technology was transferred to INCOIS that implemented it on operational mode with improved data processing techniques and automation using geographic information system (GIS) and image processing tools. The Marine Fishery Advisory Services (MFAS) programme of ESSO-INCOIS uses remotely sensed sea surface temperature (SST) and chlorophyll concentration to identify productive areas in the ocean. SST, which indicates the conducive environment for fish, is retrieved from the Advanced Very High Resolution Radiometer (AVHRR) sensor onboard the USA’s NOAA series satellites and from the MetOp series satellites of the European Space Agency (ESA). The chlorophyll concentration, indicating the availability of food for fish, is identified with the help of the Indian remote sensing satellite, Oceansat-2, the Aqua satellite from Moderate resolution Imaging Spectrometer (MODIS) series of National Aeronautics and Space Administration (NASA), USA and Visible Infrared Imaging Radiometer Suite (VIIRS) sensor onboard the Suomi National Polar-orbiting Partnership (Suomi NPP).
Keeping in view the linguistic diversity of the country, these advisories are made available in all coastal languages and coastal measurement units. The Indian coast is divided into 14 sectors—Gujarat, Maharashtra, Goa, Karnataka,
The importance of potential fishing zones lies not in terms of getting more fish, but in
conducting efficient fishing operations in an environment
friendly way.

GeoGraphy and you 2020 71
Fig. 1: PFZ Advisory issued on April 29, 2020
Kerala, South Tamil Nadu, North Tamil Nadu, South Andhra Pradesh, North Andhra Pradesh, Odisha, West Bengal, Andaman-Nicobar and Lakshadweep islands for the purpose of providing the advisories.
A pfz advisory, provided in the form of a map and text, is disseminated to the users through an array of channels ranging from fax to Android based mobile applications (Fig.1). A pfz map contains information about major landing centres, bathymetry, latitude and longitude grids in addition to the identified fishing zones. Due to the dynamic nature of the ocean, the predicted fishing zones keep shifting from their original locations. In order to predict their possible shifting, surface current speed and direction data is overlaid on the map and fishermen are advised accordingly. As fishing communities are less literate, pfz text is provided in a multi-lingual format—Gujarati, Marathi, Kannada, Malayalam, Tamil, Telugu, Oriya, Bengali along with Hindi and English, that gives information about the latitude, longitude values, depth of the ocean at pfz locations, as well as angle, direction and distance from the landing centres/lighthouses.
In what way is the organisation adding value to the traditional skills of fisherfolk?About nine million people living along the Indian coastline, spanning over 8100 km, depend on fishing for their livelihood. Often, the search for fish consumes considerable time and resources, increasing the cost and leading to low profitability for the fishing community. Generally, fishermen rely on the power of their intuition and traditional knowledge, to locate the fish. They search for fish
shoals based on bird congregation over the sea, difference in the colour of the ocean, reflection in the night, bubbles breaking on the surface, muddy and oily water and calm sea and specific smells. However, the main challenge in using their traditional knowledge is to physically venture into the sea, without knowing where exactly these indicators can actually be used. So, fisherpersons may end up with less or no catch, while following this method. Hence, a reliable and timely advisory/forecast on the potential zones of fish aggregation becomes essential. Such
Advisory validity: One day from April 29, 2020PFZ advisory for Gujarat
Fish landing centres
PFZ linesCurrent(m/s)India EEZ
Pakistan EEZ
Indian EEZIndia coastDistricts
Bathymetry
Legend

72 2020 GeoGraphy and you vol 20, issue 6-7 no. 144-145
advisory/forecast has multiple benefits for the fishing community such as reduction in time, efforts and fuel spent in looking for fish shoals, thus improving profitability and consequently, the socio-economic status of fisherpersons. Also, this advisory is useful in the reduction of CO2
emissions that are caused by burning of fossil fuel.The pfz advisory is a cumulative outcome of the concerted efforts of specialists from earth, space and fishery sciences in collaboration with the stakeholders of coastal states. Utilising the remotely sensed data available from various satellites, this service enlightens the fisherpersons on a daily basis (in their respective local languages) about most probable locations of fish aggregation with specific references to 1223 fish landing centres along the Indian coast.
How is vital information disseminated to the fishing community?Earlier disseminated using just telephone or fax, pfz advisory now utilises various modes of communication such as the Internet/website, email and Web-GIS. Web-GIS is an advanced tool provided by ESSO-INCOIS since 2002, enabling the users to access their advisories of interest. Later, ESSO-INCOIS designed and installed electronic display boards (EDBs) at major fishing harbours which have made a significant impact in the delivery chain. These EDBs have been steadily updated and their latest version facilitates dissemination of information about ocean state,
disaster warnings and alerts, not only in text but also accompanied by satellite images, animations and short films.
Nowadays, mobile services play a major role as most fishermen have access to them. In fact, the mobile phone has become an effective tool for dissemination of pfz advisories directly to the user. ESSO-INCOIS, in collaboration with
Fish landing centerTuna PFZSSHa(cm)Current(m/s)India EEZ
India coastNon Tuna zoneIndia Districts
Maximum fishing depth (m)
123 115 108 100 93 85 77 70
Bathymetry
Legend
Fig. 2: Tuna PFZ Advisory issued on March 15, 2020
Yellowfin Tuna advisory validity: One day from March 15, 2020Maharashtra

GeoGraphy and you 2020 73
various partners (NGOs, industry, government and private firms) has initiated various mobile based dissemination mechanisms such as Interactive Voice Response System (IVRS), mobile applications—Fisher Friend Mobile App (FFMA), mKRISHI, voice messages/audio advisories/MMS and SMS in local languages. In addition to this, the advisories are disseminated through local cable TV networks, Doordarshan, All India Radio, community radio stations, FM radio stations, and local newspapers. Presently, INCOIS is providing pfz and Ocean State Forecast (OSF) services through SMS to about 0.7 million (6.8 lakh) marine fishermen in India.
With a view to educate the fishermen about the effective use of these advisories, ESSO-INCOIS has partnered with village knowledge centres/resource centres and other NGOs for value addition to the technology. This partnership further facilitates downstream dissemination of information to the massive fishing community.
In partnership with the industry and NGOs, a helpline system has also been put in place in some states to help the fishing community benefit from the ocean information and advisory services being generated and disseminated by ESSO-INCOIS. The helpline system is available on a 24x7 basis to provide necessary support to the users in terms of clarification on services such as pfz advisories, OSF, tsunami early warnings, high-wave alerts, cyclone information, GPS utilisation, fish processing techniques, market related information and government schemes. An expert consortium is also linked to this helpline system to address any specific queries raised by the users. On an average about 100 queries are answered through the helpline system. Enthused by its success, fishermen have voiced their demand to make the helpline numbers toll free and extend it to all the coastal states.
While motorised fishing vessels, with an average of 10-15 people onboard, venture into deeper seas, their non-motorised counterparts operate up to 12 nautical miles (nm) from the shore. In both cases, dissipating mobile signal strength puts important livelihood and life saving information beyond the reach of fisherfolk. In order to disseminate relevant information to all users out at sea, ESSO-INCOIS in partnership with Indian Space Research Organisation (ISRO) and Airports Authority of India (AAI) is working on satellite-based dissemination through NAVIC
and GAGAN systems. The GAGAN-based dissemination system has more advantages in terms of Indian Ocean wide footprint and is thus believed to be the best solution.
Do the fishermen engage with scientists to apprise them about their specific needs?Feedback from the fisherpersons received during awareness campaigns has led to many milestones in the journey of the pfz advisory services. INCOIS has made several improvements based on user demand and requirements. For instance, users’ feedback pointed out that though pfz advisory provides information on the availability of fish, it gives fisherpersons no information on the species of fish available at the particular location. The lack of information about all species and their aggregation zones in the seas, constrains fisherpersons in selecting appropriate method to conduct targeted fishing for a particular sized species. In terms of sustainability as well, it is essential to guide fishermen on the type of species so that adequate sized nets and gear can be used. The feedback led to a focus on developing species-specific advisories for some important species that are commercially valuable but under exploited.
The first species-specific pfz advisory service was developed to identify Yellowfin tuna (Thunnus albacares) (Fig. 2). The challenging task in the development of this service was the lack of available details on habitat preferences of Yellowfin tuna and the lack of fishing data. ESSO-INCOIS conducted hindcast experiments using the geo-referenced tuna catch details and the related remote sensing data. The organisation used these parameters to initiate and provide tuna advisories to the fishing community at Visakhapatnam and the Marine Products Exports and Development Authority (MPEDA) on an experimental basis. Subsequently, based on their feedback and the preliminary validation results, these advisories were made operational November 2010 onwards.
What has been the overall impact of these services?The impact of ESSO-INCOIS services on improving the lives and livelihoods of the fishing community is manifold. Fisherpersons widely use the pfz service for successful fishing operations. Gilakaladindi village in the Krishna district of Andhra Pradesh is a case in point as

74 2020 GeoGraphy and you vol 20, issue 6-7 no. 144-145
On an average, the utilisation of pfz advisories has reduced the time spent on fishing by 30-70 per cent, resulting in a significant positive impact on the bottom lines and earnings of the beneficiary fishing communities.
Phot
o Co
urte
sy: J
udam
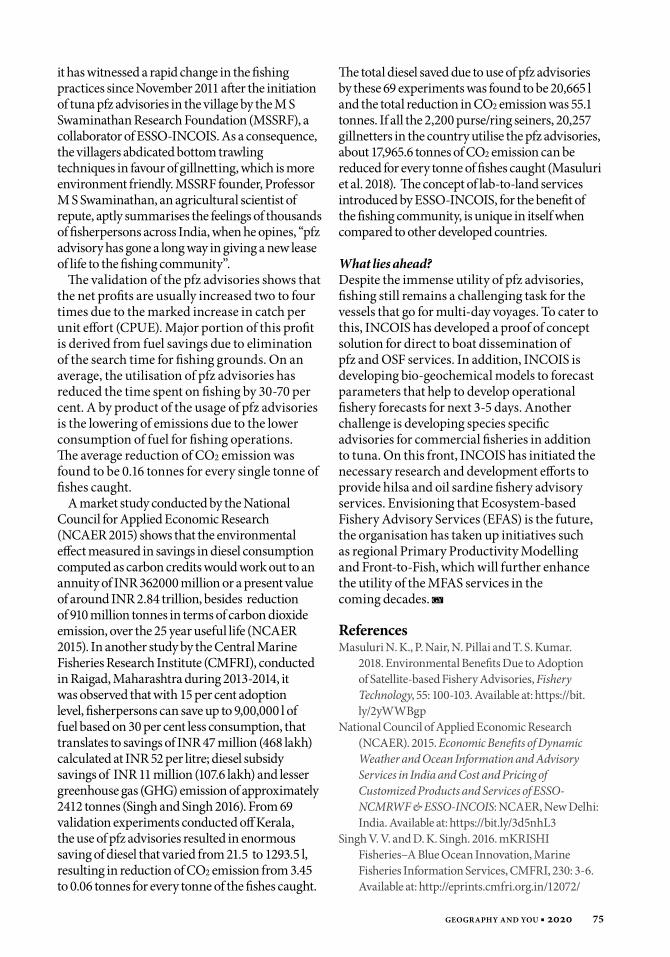
GeoGraphy and you 2020 75
it has witnessed a rapid change in the fishing practices since November 2011 after the initiation of tuna pfz advisories in the village by the M S Swaminathan Research Foundation (MSSRF), a collaborator of ESSO-INCOIS. As a consequence, the villagers abdicated bottom trawling techniques in favour of gillnetting, which is more environment friendly. MSSRF founder, Professor M S Swaminathan, an agricultural scientist of repute, aptly summarises the feelings of thousands of fisherpersons across India, when he opines, “pfz advisory has gone a long way in giving a new lease of life to the fishing community”.
The validation of the pfz advisories shows that the net profits are usually increased two to four times due to the marked increase in catch per unit effort (CPUE). Major portion of this profit is derived from fuel savings due to elimination of the search time for fishing grounds. On an average, the utilisation of pfz advisories has reduced the time spent on fishing by 30-70 per cent. A by product of the usage of pfz advisories is the lowering of emissions due to the lower consumption of fuel for fishing operations. The average reduction of CO2 emission was found to be 0.16 tonnes for every single tonne of fishes caught.
A market study conducted by the National Council for Applied Economic Research (NCAER 2015) shows that the environmental effect measured in savings in diesel consumption computed as carbon credits would work out to an annuity of INR 362000 million or a present value of around INR 2.84 trillion, besides reduction of 910 million tonnes in terms of carbon dioxide emission, over the 25 year useful life (NCAER 2015). In another study by the Central Marine Fisheries Research Institute (CMFRI), conducted in Raigad, Maharashtra during 2013-2014, it was observed that with 15 per cent adoption level, fisherpersons can save up to 9,00,000 l of fuel based on 30 per cent less consumption, that translates to savings of INR 47 million (468 lakh) calculated at INR 52 per litre; diesel subsidy savings of INR 11 million (107.6 lakh) and lesser greenhouse gas (GHG) emission of approximately 2412 tonnes (Singh and Singh 2016). From 69 validation experiments conducted off Kerala, the use of pfz advisories resulted in enormous saving of diesel that varied from 21.5 to 1293.5 l, resulting in reduction of CO2 emission from 3.45 to 0.06 tonnes for every tonne of the fishes caught.
The total diesel saved due to use of pfz advisories by these 69 experiments was found to be 20,665 l and the total reduction in CO2 emission was 55.1 tonnes. If all the 2,200 purse/ring seiners, 20,257 gillnetters in the country utilise the pfz advisories, about 17,965.6 tonnes of CO2 emission can be reduced for every tonne of fishes caught (Masuluri et al. 2018). The concept of lab-to-land services introduced by ESSO-INCOIS, for the benefit of the fishing community, is unique in itself when compared to other developed countries.
What lies ahead?Despite the immense utility of pfz advisories, fishing still remains a challenging task for the vessels that go for multi-day voyages. To cater to this, INCOIS has developed a proof of concept solution for direct to boat dissemination of pfz and OSF services. In addition, INCOIS is developing bio-geochemical models to forecast parameters that help to develop operational fishery forecasts for next 3-5 days. Another challenge is developing species specific advisories for commercial fisheries in addition to tuna. On this front, INCOIS has initiated the necessary research and development efforts to provide hilsa and oil sardine fishery advisory services. Envisioning that Ecosystem-based Fishery Advisory Services (EFAS) is the future, the organisation has taken up initiatives such as regional Primary Productivity Modelling and Front-to-Fish, which will further enhance the utility of the MFAS services in the coming decades.
referencesMasuluri N. K., P. Nair, N. Pillai and T. S. Kumar.
2018. Environmental Benefits Due to Adoption of Satellite-based Fishery Advisories, Fishery Technology, 55: 100-103. Available at: https://bit.ly/2yWWBgp
National Council of Applied Economic Research (NCAER). 2015. Economic Benefits of Dynamic Weather and Ocean Information and Advisory Services in India and Cost and Pricing of Customized Products and Services of ESSO-NCMRWF & ESSO-INCOIS: NCAER, New Delhi: India. Available at: https://bit.ly/3d5nhL3
Singh V. V. and D. K. Singh. 2016. mKRISHI Fisheries–A Blue Ocean Innovation, Marine Fisheries Information Services, CMFRI, 230: 3-6. Available at: http://eprints.cmfri.org.in/12072/
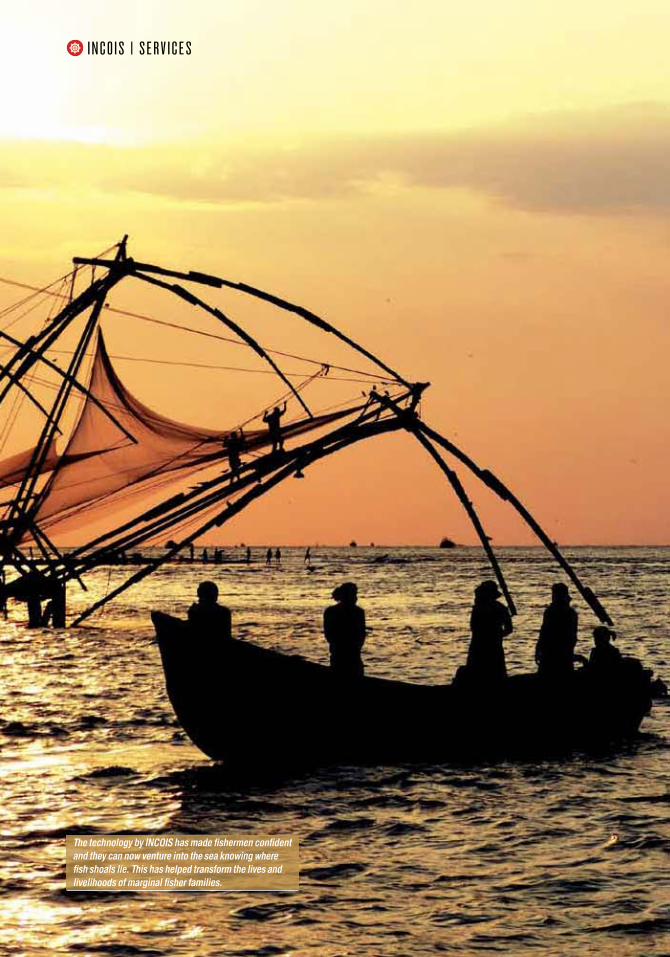
76 2020 GeoGraphy and you vol 20, issue 6-7 no. 144-145
I N CO I S | S er v I C e S
The technology by INCOIS has made fishermen confident and they can now venture into the sea knowing where fish shoals lie. This has helped transform the lives and livelihoods of marginal fisher families.

GeoGraphy and you 2020 77
Phot
o Co
urte
sy: P
atri
Ck_w
orld
wid
e
The authors are Scientist D in-charge, Ocean State Forecast Services (OSF); Scientist E, in-Charge, Marine Fishery Advisory Services (MFAS); and, Scientist G, Head, respectively in the Ocean Information and Forecast Service Group (ISG) of ESSO-Indian National Centre for Ocean Information Services (ESSO-INCOIS). harikumar@
incois.gov.in. The article should be cited as Harikumar R., M. Nagarajakumar and T. M.B.Nair, 2020. Empowering Seafarers of India, Geography and You, 20(6-7): 76-79
Indian National Centre for Ocean Information Services (INCOIS) is an autonomous organisation of the Indian government, under the Ministry of Earth Science. It provides ocean information and
advisory services to coastal communities, industry, government agencies and scientific bodies such as ocean state forecasts and potential fishing zone advisories for better operational planning and safe navigation at sea for better fish catch. Some recent surveys, conducted by various agencies among the beneficiaries throw light on the economic, environmental and safety benefits of the services provided by ESSO-INCOIS in both quantitative and qualitative terms. This article shares some of the findings of these surveys.
The benefits of ocean state forecast (osF)Forecasts of wave height, swell height, current
speed, wind speed and their directions play a major role in aiding fisherfolk to make effective decisions that help prevent loss of life and property. Significantly, a majority of fisherfolk admitted that timely decisions taken with the aid of osf information helped in minimising losses. As on April 28, about 0.7 million exclusive registered mobile users receive osf and potential fishing zones (PFZ) services in their own local language. There are also many users, who depend on ESSO-INCOIS’ website, mobile apps, WhatsApp, Facebook, Twitter, e-mail, Radio, TV and Electronic Display Boards deployed at coasts to receive these services.
Speaking about the efficacy of ESSO-INCOIS services, Antony, 28, a fisherman from Colachel, Tamil Nadu said, “The helpline facility for delivering osf, channelised through Reliance Foundation (RF), plays a significant role in our
By R Harikumar, M Nagarajakumar & T M Balakrishnan Nair
E m p o w E r i n g
esso-the indian National Centre for ocean information services (esso-iNCois)provides a host of economic and environmental benefits to the coastal populace
through a wide variety of services—ocean state forecast, potential fishing zone and the tsunami early warning system. Ground surveys conducted by various agencies
among the beneficiaries corroborate the efficacy of esso-iNCois’ services.
of iNdiaseafarers

78 2020 GeoGraphy and you vol 20, issue 6-7 no. 144-145
lives. My team can now proceed for any fishing activity without any fear.”
Kishor Bhoinkar, a progressive fisherman of Bharadkhed in the Raigad District, Maharashtra, agreed, “I never venture into the sea when the wind speed is above 35 km per hour. Earlier, we used to waste considerable money venturing and returning empty handed because of unexpected rough sea conditions. But now the information through osf has helped us to substantially save in terms of diesel, ice for storing fish and manpower expenses every month.”
Boat owners too are a happy lot. Says N Dharma Rao, General Secretary, Kakinada Mechanised Fishing Boat Owners Welfare Association, “Thanks to the advisory provided by ESSO-INCOIS during cyclones, we are able to save hundreds of lives in addition to properties worth millions of rupees. We wish the services were there when the Kakinada area faced a severe cyclone, causing massive losses in November 6, 1996.”
Corporate too find osf useful. “The osf data/images are very accurate which keep us updated during sailing. The ESSO-INCOIS reports are very important for our passenger vessels sailing in low pressure areas such as the Andaman Sea,” said Master of MV Swarajdweep of Shipping Corporation of India.
The Indian Navy too has a word of praise for the osf. “It has been seen during recent operations that the forecasts provided by INCOIS have closely matched with the sea condition. It has been well appreciated by our operation coordinators,” observed Navy Commander Mangal Kakkad
The benefits of potential fishing zones advisoriesFishing based on the pfz advisory along with gillnetting has significantly contributed in improving the socio-economic conditions of fishers. Majority of the fishers, who hitherto have been practising the bottom trawling method of fishing, have upgraded their fishing technique based on pfz advisory and shifted to gillnetting. A case study carried out in the Gilakaladindi Village in Krishna District, Andhra Pradesh, points out that fishermen can now access high yielding fishing grounds by upscaling their fishing practice to gillnetting. Advantages include locating large fish shoals without involving waste of time and human energy and more importantly, the technology brings down the expenses of fishing
operations by saving on fuel. Fishers’ efficiency and capacity have increased manifold and so have the incomes of boat owners and the wages of fishing crew members.
Pertinently, the surveys mirror the findings, corroborated/validated by the academia in collaborative studies. Some of such endeavours were undertaken by Jadavpur, Andhra, Annamalai, Anna, Karnataka and Dr Babasaheb Ambedkar Marathwada University, in collaboration with research institutions such as Central Institute of Fisheries Education, Central Marine Fisheries Research Institute (CMFRI), Central Agriculture Research Institute (CARI), Kerala State Remote Sensing and Environment Centre (KSREC) and National Institute of Oceanography. Specific validation experiments comprising engagement of two boats, one going for fishing in the notified area and the other going for fishing elsewhere, have consistently shown that the beneficiaries’ net profits increased by two to five times due to the marked increase in catch per unit effort (CPUE). Major portion of the profits comes from savings on the cost of fuel due to the avoidance of multiple searches for fishing grounds. On an average, pfz advisories also reduced the time spent on fishing by 30 to 70 per cent.
In 2012, M S Swaminathan Research Foundation (MSSRF) conducted a study on "Impact of INCOIS Scientific Forecast Services on Improving Lives and Livelihoods of Fishing Communities across Tamil Nadu and Puducherry". The study underscores that the majority of fisherfolk have registered an increase in net income ranging between INR 1000 and 50000 due to the use of pfz services. Among the beneficiaries, 40 per cent are small craft fisherfolk who have experienced an average (weighted) increase of income worth INR 16,000. Overall, the findings suggest that pfz service is actively being used by small craft fisherfolk as a means to improve their livelihood.
As M S Swaminathan, founder, MSSRF, Chennai, aptly puts it, “The technology developed by the osf Division of ESSO-INCOIS has made the fishermen confident of wave heights at different distances from the shoreline. They now venture into the sea with great confidence and also approximately know where the fish shoals lie. This has helped transform the lives and livelihoods of small-scale fisher families and has led to the spread of science and technology for artisanal fisheries movement.”

GeoGraphy and you 2020 79
A similar view was expressed by Karnan, Salangarai of a fishing village in the Cuddalore district, Tamil Nadu, one of the beneficiaries using the species-specific advisories issued by ESSO-INCOIS, “I was surprised when I got 50 kg of tuna fish in just one trip from the location suggested by the pfz advisory. This motivated me to regularly follow their helpline and now I do not venture into the sea unless I check the advisories.”
Said Sudevan, a marine fisherman from Alappuzha, Kerala, “By dialling the helpline I got the update about pfz while fishing in the sea up to 25 km, which aided me in making a big catch of two tonnes of fish in a single trip.”
“I registered on RF’s services and started receiving voice messages on pfz and osf from the ESSO-INCOIS. This has empowered me and my fellow fishers in making fishing a profitable business. We now return home with
considerable catch from every effort and the GPS gives us the right directions to reach the targeted fishing zones,” said Chokka Harish, 21, a fisherman from YSR Colony of Manginapudi village, Krishna district, Andhra Pradesh, recounting a similar experience.
On the whole, the surveys underline that osf and pfz advisories of ESSO-INCOIS have greatly helped the fishermen community in improvement of their livelihood through enhanced economic benefits as well as safety. The organisation has also helped them adopt new technologies such as smartphones, making them digitally empowered. Another benefit of the usage of the advisories is the reduction in carbon emissions due to lowering of fishing effort in searching for fish aggregating areas. All this has brought about a refreshing, positive impact on the environment of the coastal region.
Sketches of the beneficiaries of INCOIS' services
I have been receiving information on osf, pfz, high wave alerts from ESSO-INCOIS since May 2016 through RF mobile voice SMS platform. The advisory helps me to decide as the information is, generally, quite accurate—Kasinath Das, 35, fisherman, Chaumukh, Balasore, Odisha
I trust the OSF advisories. They not only help me in making the right decisions, but also save the input costs otherwise incurred for diesel, ice, ration and labour, and most importantly, safeguard the lives of the marine community.—Sashikanta Nayak, 48, traditional fisherman, Chudamani, Bhadrak, Odisha.
In the second week of September 2016, just before venturing into the sea from Mirkarwada Jetty near Ratnagiri, I checked my phone for the OSF. A voice message alerted fishers not to venture into the sea due to bad weather. But, many fishers were readying for the voyage. I rushed to alert them saved lives, damage of boats and fuel. —Ashish Vasave, 30, Sakhari Agar, Ratnagiri, Maharashtra
I get OSF and PFZ updates from INCOIS. The information has helped me earn more than INR 50,000 in just one trip—Ch. Bujj, 28, fisherman, Chandrabhaga Nolia Sahi, Puri, Odisha

80 2020 GeoGraphy and you vol 20, issue 6-7 no. 144-145
T V S Udaya Bhaskar, L Rose, B Rohit, R K Jha, M Preetham & S S C Shenoi
By
InternatIonal
The authors are head, Training and Programme Planning and Management Group (TPG), scientist C (TPG), scientists B (TPG) and Director, respectively, Indian National Centre for Ocean Information Services (INCOIS). [email protected]. The article should be cited as Bhaskar T.V.S.U., L. Rose, B. Rohit, R.K. Jha and M. Preetham,
2020. International Training Centre for Operational Oceanography, Geography and You, 20(6-7): 80-85
Trainingfor operaTional
Centre
oceanography
I N CO I S | S er v I C e S

GeoGraphy and you 2020 81
ESSO-Indian National Centre for Ocean Information Services (ESSO-INCOIS) has for a while been providing innovative services such as fishing zone advisories, ocean state forecast and tsunami early warning. Further in 2012, to build capacity in the field of ocean
services and operational oceanography, the Ministry of Earth Sciences set-up an International Training Centre for Operational Oceanography (ITCOocean) at INCOIS. The benefits were also envisaged to reach
the Indian Ocean rim countries and other developing nations. In 2015, ITCOocean was recognised as a Regional Training Centre (RTC)
by the Ocean Teacher Global Academy (OTGA) of the International Oceanographic Data and Information Exchange (IODE). The centre
has state-of-the-art infrastructure, academic curriculum, administrative units, international hostel facility and expert faculty from the field of oceanography. The initiative was appreciated by Intergovernmental
Oceanographic Commission which lead to its recognition as Category 2 Center (C2C) in 2017 under the UNESCO. It is therefore now a pioneer institute in the field of operational oceanography, offering various certificate programmes ranging from days to weeks and will eventually look to provide diploma programme in the field of
operational oceanography.

82 2020 GeoGraphy and you vol 20, issue 6-7 no. 144-145
Since decades, the science of oceans has progressively evolved from a basic understanding of different aspects of oceans to predicting their behaviour. This can be attributed
to the advancement in ocean observations, enhancement in understanding theoretical aspects of the oceans and progress in ocean modelling capabilities. This transition was also motivated by an increasing demand from a variety of ocean users. Accordingly, the modern day ocean science has changed and ‘operational oceanography’ is now an integral part of ocean science and management. Operational oceanography has evolved by integrating scientific knowledge encompassing different disciplines of science and technology. This involves skills
in observing the ocean using instruments and remote sensing platforms and also assimilating these into ocean models. The end products of such synthesis that reach the stakeholders broadly include natural hazards warning (tsunami, ocean state, cyclone landfall and harmful algal blooms), identifying potential fishing zones, optimal and safe navigation route advisories, monitoring of hazardous oil spills and forecasting the climate change. The primary takers for such information are the fishers, port and shipping agencies, marine industries and administrative authorities who make optimal use of operational oceanography services for planning, implementation and mitigation.
Since its inception, the ESSO-Indian National Centre for Ocean Information Services
The sprawling campus of the International Training Centre for Operational Oceanography (ITCOocean) at ESSO-INCOIS is equipped with state-of-the-art instructional and infrastructural facilities.

GeoGraphy and you 2020 83
(ESSO-INCOIS) has been providing innovative ocean services. Further to these established oceanographic services, ESSO-INCOIS also promotes capacity building activities, to train and generate skilled manpower in the field of ocean services and operational oceanography. This plan resonated with the call by the Intergovernmental Oceanographic Commission (IOC) to undertake capacity building activities and resulted in the establishment of a centre in 2012, which became operational in 2013 at INCOIS. The Indian Ministry of Earth Sciences (MoES) consequently set up an International Training Centre for Operational Oceanography (ITCOocean) at the ESSO-INCOIS to extend the benefits of operational oceanography to the developing nations and the countries falling
within Indian Ocean Rim (IOR). INCOIS is one of the very few centres involved in generating and disseminating value added services, wide ranging ocean service products to variety of users starting from fisher folk to marine industries. ESSO-INCOIS focuses on tsunami early warning, marine fishery advisory, ocean state forecast during severe weather events, coral bleaching alerts, coastal geospatial applications and updates on climate indices. As the institute is abreast with advancements in satellite oceanography, ocean modelling capabilities and data from vast in-situ observation networks deployed and maintained by it, ESSO-INCOIS’ manpower is skilled in assimilating observations into models to produce accurate ocean information services to end users.
Phot
o Co
urte
sy:

84 2020 GeoGraphy and you vol 20, issue 6-7 no. 144-145
The Genesis of iTCooceanRecognising the skill levels of ESSO-INCOIS, UNESCO's IOC endorsed the operational oceanography training centre, ITCOocean by signing a Memorandum of Agreement (MoA) with ESSO-INCOIS in 2013 during the 27th session of the IOC Assembly in Paris. This was later followed up by signing a Letter of Intent (LoI) between MoES and UNESCO in November 2014 stating that ITCOocean was “to be developed into a UNESCO Category 2 Centre” under the auspicious of UNESCO, interalia, for promoting effective exchange of data and information on natural hazards, develop courses for early warning systems for disaster risk reduction and generate scientific methods for capacity development programmes in geographic information system (GIS) and remote sensing. In 2015, the Ocean Teacher Global Academy (OTGA) of the International Oceanographic Data and Information Exchange (IODE) recognised ITCOocean as a Regional Training Centre (RTC) to offer training for the benefit of IOR Countries. Following this, in December 2017, the Union Cabinet of the Indian government approved the establishment of the International Training Centre for Operational Oceanography as a Category-2 Centre (C2C) of UNESCO in the INCOIS premises. The benefits of operational oceanography and of the new methods of capacity development was thereafter agreed to be shared with the IOR, as well as African countries bordering the Atlantic Ocean and small island countries to cope with the emerging challenges.
objectives of iTCoocean● Provide advanced training in operational
oceanography for young scientists, technical persons and decision makers/officials from the IOR countries, Africa, small island countries and Europe on a regular basis, with a calendar of events prepared well in advance and notified on the ITCOocean website.
● Define regional and global problems and priorities, the solution of which requires multi-level cooperation, assisting the identification of training, education and mutual needs, particularly those related to the IOC programmes.
● Provide training on generation of data emanating from in-situ and satellite platforms
Various courses conceived under the ITCOocean
targets university students who
would like to pursue their career in (operational)
oceanography.

GeoGraphy and you 2020 85
and its transmission to operational centres, data reception and data processors in real time. Training is also provided for data usage in models and forecasts and its dissemination to end users within the shortest possible time.
● Promote excellence in integrated multidisciplinary oceanography to improve the understanding and management of natural resources.
● Help scientists in preparedness for nowcasting and forecasting the ocean behaviour, addressing the role of ocean science in delivering critical information to safety, commerce and environmental protection.
● Promote activities of the centre, of IOC’s role in marine and coastal matters, raise public awareness concerning the need for sustainable management of the sea and coastal areas and introduce the benefits of national and regional cooperation approach.
● Organise assistance in mobilising human, financial and material resources to respond to the needs of coastal countries of the region in dealing with emergency situations triggered by marine natural hazards.
● Make recommendations to the governing bodies of the region on policy matters related to the mandate of the centre and formulate proposals for the protection and sustainable development of the Indian Ocean and its coasts.By adhering to the above mentioned objectives,
the ITCOocean centre will contribute to the capacity building activities of many IOC programmes—climate change, Indian Ocean Global Ocean Observing System (IOGOOS), Second International Indian Ocean Expedition (IIOE-2), implementing Intergovernmental Oceanographic Commission (IOC) Regional Committee for Central Indian Ocean (IOCINDIO) decisions, natural hazard warning and mitigation pertaining to marine areas. Further the centre will also support the establishment of the marine protected areas and enable multi-agency participation in the World Ocean Day (June 8) thereby raising awareness about the oceans.
So far, over 1177 scientists including 914 from India and 263 from 48 other countries have been trained at the centre in various aspects of operational oceanography. A list of courses conducted, persons trained and future courses
planned can be viewed at https://incois.gov.in/ITCOocean/index.jsp.
A state-of-the-art e-class room with a capacity of 48 participants has also been established. The e-class room provides high quality local training, immersive tele-presence, distance learning and distance teaching experience. Up to nine similar class rooms can be connected simultaneously in high definition. Up to 50 class room users or desktop/ smart phones/ IPad users can be joined to the ongoing training sessions of the classroom through real presence desktop (RPD) software (available in Windows and Mac) and real presence mobile (RPM) app (available in android and IOS). At present, infrastructural facilities such as administrative units, classrooms and international hostels are available for the participants.
Various courses conceived under the ITCOocean targets university students who would like to pursue their career in (operational) oceanography. Priority is to be given to students mainly from Indian Ocean rim countries, staff of operational oceanographic centres and related facilities, staff of government departments involved with oceanographic services and marine activities and decision makers who seek familiarisation with oceanographic data and data services. People involved in ocean state forecasting, hazard related warnings, and coastal planners, as also staff of other operational oceanographic centres, are to be prioritised. The ITCOocean centre is currently offering short term courses, spanning from 1 to 4 weeks. A ‘certificate of participation’ is offered on completion that is jointly issued by INCOIS and UNESCO/IOC.
Way ForwardIn addition to the planned courses in collaboration with UNESCO/IOC, ITCOocean is in the process of signing an Memorandum of Understanding (MoU) with various state and central universities for providing courses. As on date the centre has successfully signed a MoU with Swami Ramanand Teerth Marathwada University (SRTMU), Nanded, Maharashtra for conducting a certificate course in ‘operational oceanography’ which is set to begin its first batch from August, 2020. The goal is to make this a centre of excellence in the field of operational oceanography, making it the first choice for future oceanographers.

86 2020 GeoGraphy and you vol 20, issue 6 no. 144
By Celsa AlmeidaProject Scientist, ESSO-INCOIS
Reac
hing
In addition to capacity building efforts and user trainings ESSO-INCOIS also organises activities to increase public awareness and attract potential users through interactive displays at exhibitions, social media, open house programmes and special visiting slots.
I N CO I S | P hO t O f e at ur e
Out

GeoGraphy and you 2020 87
PhOt
OCO
urtE
Sy:
ESSO-INCOIS participates in several public exhibitions each year independently and through the Ministry of Earth Sciences (MoES). At expos through interactions with scientists, videos, instruments, models, posters, flyers, mementos and live demos, people can see the progress of operational oceanography, its societal benefits and how it may positively influence their lives directly or indirectly.
Visitors to ESSO-INCOISThe organisation accommodates a substantial number of visitors that mostly comprise of government employees/officials and students. Each year government employees from India and abroad arrange field visits to ESSO-INCOIS. These visitors include disaster management officers, professors, defence and police cadre and
rural development officers. For students, in addition to visiting slots organised every month, special ‘Open House’ programmes are held on specific days—ESSO-INCOIS Foundation Day on February 3, MoES Foundation Day on July 27, International Tsunami Awareness Day on November 5 and as a precursor to the annual India Interna-tional Science Festival around September/October.
The Visitor ExperienceScientists at ESSO-INCOIS conduct highly interactive tailor-made audio-visual cum demo sessions based on the age and educational background of the visitors. There are separate briefings on satellite data, ocean state forecasts and potential fishing zone advisories and the internationally recognised state-of-the-art Tsunami Centre.
@INCOISofficial Hyderabad@ESSO_INCOIS @INCOISofficial

88 2020 GeoGraphy and you vol 20, issue 6-7 no. 144-145
harmful algal Blooms: a Compendium desk referenceBy sandra e. shumway, Joann M. Burkholder,
steven l. Morton Cover: HardcoverisBn: 978-1118994658published: 2018| Pages: 696price: USD 109.46
physical oceanography and ClimateBy Kris KarnauskasCover: HardcoverisBn:
978-1108423861published: 2020pages: 350price: USD 64.99
Coastalresources economics and ecosystem valuationBy J. Walter Milon and sergio alvarez
Cover: PaperbackisBn: 978-3-03928-016-2published: 2019pages: 104price: USD 48.02
Fundamentalsof estuarine physical oceanographyBy luiz Bruner de Miranda et al. Cover: Hardcover
isBn-13: 978-9811030406published: 2017pages: 480price: USD 85.72 (e-copy)
heaving, stretching and spicing Modes: Climate variability in the ocean (springer oceanography)By rui Xin huangCover: HardcoverisBn-13: 978-9811529405published: 2020pages: 393price: USD 14849.40
The book focuses on the ocean climate variability
and its fundamentals. The author discusses ‘the vertical movement of isopycnal (isothermal) layers’—heaving and stretching. Isopycnals are usually represented graphically to help envision the different layers of water in the ocean or gases in the atmosphere in ‘a similar manner to how contour lines are used in topographic maps to help visualise topography’. A huge part of ocean climate variability is
heaving in nature. The author tries to explain that though analysis of isopycnals has been widely used in the domain of climate study, it is much more accurate to study the isopycnal layers. This is because ‘climate signals are examined in terms of changes of layer depth, layer thickness, layer temperature/salinity, spicity and others’. The book is important for all oceanography researchers and for those with an interest in ocean physics.
Website B o o k S
national oceanic and atmospheric administrationwww.noaa.gov/National Oceanic and Atmospheric Administration is a scientific agency under the United States Department of Commerce. NOAA focuses on daily weather forecasts, monitoring climate, severe storm warnings, coastal restoration, management of fisheries and supporting marine commerce—providing the government, citizens and emergency planners with reliable information.
argowww.argo.ucsd.edu/Argo provides a quantitative description of the upper ocean and its changes, the ocean climate variability patterns from months to decades, including freshwater storage and transport and heat. The documentation of ‘decadal climate variability’ is the primary goal of Argo.
The intergovernmental oceanographic Commission of unesCo www.ioc-unesco.org/The IOC-UNESCO, established in 1960 is the only competent organisation for ocean and marine science within the United Nations (UN) system. IOC-UNESCO provides a focus for other agencies and organisations within the UN, regarding ocean science, global tsunami warning systems and observations and data exchange.

[1]
BY MANIPULATING THE GLOBAL CARBON CYCLE
MITIGATING THE IMPACTS OF CLIMATE CHANGE SUBSCRIBE NOW
Terms & Conditions :1. G'nY and Bhugol Aur Aap E-Magazine is Available on Flipbook and it is not downloadable
4. You can send money by NEFT/RTGS. Accounts details are given below. Organization: LIGHTS, Bank name: Andhra Bank,
Branch address: B-1/3, Safdarjung Enclave, New Delhi-110029 Account number: 107811011000322, IFSC Code: ANDB 0001597
5. You can take purchase online, please visit our website : www.geographyandyou.com6. If you pay money by NEFT/RTGS please intimate us through
e-mail : [email protected]/[email protected]
#You save `100
Note : Please purchase or subscribe e-magazine of G'nY and Bhugol Aur Aap as printing and delivery of physical copies is not possible due to Covid-19 lockdown.
Digital copySpecialOfferG’nY Subscription (English)
12 Issues `1100#
6 Issues `600 Bhugol Aur Aap Subscription (Hindi)
12 Issues `1100
6 Issues `600
One copy price INR 100
One copy price INR 100
https://www.geographyandyou.com/shop/subscription

RNI No. DELENG/2001/5002