Elementary Linear Algebra: Applications Version, 11th Edition
Upload
khangminh22Category
view
0download
0
Conference Proceedings
11th Esri Eastern Africa User Conference2 - 4 November, 2016
Acacia Premier Hotel, Kisumu, Kenya
i
Table of Contents Foreword ....................................................................................................................................................... 7
Natural Resources ......................................................................................................................................... 8
GIS Utilization in Petroleum Data Management, A Case Study of National Data Centre (NDC) in
National Oil Corporation of Kenya ............................................................................................................... 9
Abstract ..................................................................................................................................................... 9
Introduction ............................................................................................................................................ 10
Examples of structured and unstructured .......................................................................................... 10
National Data Center (NDC) .................................................................................................................... 10
NDC System ............................................................................................................................................. 11
NDC Architecture .................................................................................................................................... 12
NDC Functionality ............................................................................................................................... 12
ArcGIS System. ........................................................................................................................................ 12
Conclusion ............................................................................................................................................... 17
Refrences ................................................................................................................................................ 17
Improved Analysis of Cheetah - (Acinonyx jubatus) Occupancy and Gene Flow in Kenya Using GIS
Tools ........................................................................................................................................................... 18
Abstracts: ................................................................................................................................................ 18
Problem Definition/ Background ............................................................................................................ 19
Methods/Methodology........................................................................................................................... 19
Expected outcomes (Results and major findings) ................................................................................... 21
Biological references ............................................................................................................................... 21
Biographical Notes .................................................................................................................................. 22
Contacts .................................................................................................................................................. 22
Impact of Climate Change on Desertification in Arid Areas of Kenya ...................................................... 23
Abstract ................................................................................................................................................... 23
Introduction ............................................................................................................................................ 24
Aridity .................................................................................................................................................. 24
Climate change. ................................................................................................................................... 24
Desertification. .................................................................................................................................... 25
Droughts causes and desert spread. ................................................................................................... 25
Magnitude of Desertification in Africa ................................................................................................ 26
Causes of Desertification. ................................................................................................................... 26
ii
Objectives of Study ............................................................................................................................. 26
Methodology ........................................................................................................................................... 27
Description of study site ..................................................................................................................... 27
Results and Findings ................................................................................................................................ 32
Findings ............................................................................................................................................... 33
Interventions to Avert Future Occurrences ........................................................................................ 33
Acknowledgement .................................................................................................................................. 34
References .............................................................................................................................................. 34
Contacts .................................................................................................................................................. 36
Local Government ....................................................................................................................................... 37
A Village Level GIS-Based County Government and Environmental Risk Management Decision Support
System ......................................................................................................................................................... 38
Abstract ................................................................................................................................................... 38
Introduction ............................................................................................................................................ 39
Methodology ........................................................................................................................................... 40
Area of study ....................................................................................................................................... 40
Geodatabase Construction ................................................................................................................. 40
Chlorine gas plume footprint modeling and analysis ......................................................................... 42
Results and Discussion ............................................................................................................................ 44
Household Proximity to infrastructure ............................................................................................... 44
Environmental Risk Analysis and Management .................................................................................. 45
Conclusion and Recommendations ........................................................................................................ 47
Reference ................................................................................................................................................ 47
GIS Based Modeling to Assess Pollution Vulnerability to Groundwater in the Vicinity of Solid Waste
Disposal Site: A Case Study of Pugu Kinyamwezi Dumpsite in Dar Es Salaam, Tanzania....................... 48
Abstract ................................................................................................................................................... 48
Introduction ............................................................................................................................................ 49
Mapping and Site Characterizations of Existing Situation ...................................................................... 49
Location .............................................................................................................................................. 49
Description of Pugu dumpsite ............................................................................................................. 49
Water supply ....................................................................................................................................... 50
Social services ..................................................................................................................................... 50
Existing land use patterns ................................................................................................................... 50
Economic Activities ............................................................................................................................ 50

iii
Hydrological conditions ...................................................................................................................... 50
Solid waste existing practice ............................................................................................................... 51
Material and Method .............................................................................................................................. 52
Result and Discussions ............................................................................................................................ 52
Pugu Dump Site Pollution Modeling, Risk Analysis and Water Demand ................................................ 53
Pollution modeling .............................................................................................................................. 53
Groundwater flow predictions ............................................................................................................ 53
Modeling analysis and assumptions .................................................................................................... 54
Modeling development, assumption and Output ................................................................................ 54
Output of the model ............................................................................................................................ 55
Sensitivity of the model ...................................................................................................................... 58
Conclusion and Recommendations ........................................................................................................ 59
Conclusion .......................................................................................................................................... 59
Recommendations ............................................................................................................................... 59
Reference ................................................................................................................................................ 59
Comparing two geospatial approaches for delineating crop ecologies in Tanzania ................................... 62
Abstract ................................................................................................................................................... 62
Introduction ............................................................................................................................................ 63
Methods .................................................................................................................................................. 63
Study area ............................................................................................................................................ 63
Statistical analysis ............................................................................................................................... 64
Study area and the data ...................................................................................................................... 64
Data exploration and analysis ............................................................................................................. 66
Results ..................................................................................................................................................... 67
Selecting the best performing integrated technology .......................................................................... 67
Top-down approach ............................................................................................................................ 68
Bottom-up approach ............................................................................................................................ 69
Discussion................................................................................................................................................ 72
Differences in approaches ................................................................................................................... 72
Relevance ............................................................................................................................................ 73
Limitations .......................................................................................................................................... 73
References .............................................................................................................................................. 74
Contacts .................................................................................................................................................. 74
iv
Analysis of Urban Growth and Agricultural Land Use of Kuta in Shiroro L.G.A, Niger State, North-
Central Nigeria ............................................................................................................................................ 75
Abstract ................................................................................................................................................... 75
Introduction ............................................................................................................................................ 76
Study Area .......................................................................................................................................... 76
Research Methodology ........................................................................................................................... 79
Data Acquisition ................................................................................................................................. 79
Image Geometric Correction ............................................................................................................... 80
Data Analysis. ..................................................................................................................................... 80
Conclusion ............................................................................................................................................... 84
References .............................................................................................................................................. 85
Contacts .................................................................................................................................................. 85
National Government ................................................................................................................................. 86
A Geographic information System driven integrated land management System ....................................... 87
Abstract ................................................................................................................................................... 87
Introduction ............................................................................................................................................ 88
Problem Statement ................................................................................................................................. 89
Integrated Conceptual Framework ......................................................................................................... 90
Implementation Strategy ........................................................................................................................ 90
Implementation progress ..................................................................................................................... 91
GIS Integration .................................................................................................................................... 93
Conclusion ............................................................................................................................................... 93
Reference ................................................................................................................................................ 94
Challenges of Developing Land Information Management Systems (LIMS) for County Governments in
Kenya .......................................................................................................................................................... 95
Abstract ................................................................................................................................................... 95
Introduction ............................................................................................................................................ 96
Methodology ........................................................................................................................................... 96
Results and Findings ................................................................................................................................ 97
Legal challenge ................................................................................................................................... 97
Social challenges ................................................................................................................................. 98
Political challenges ............................................................................................................................. 98
Technical challenges ........................................................................................................................... 98
Economic challenges........................................................................................................................... 99
v
Conclusion ............................................................................................................................................. 100
References ............................................................................................................................................ 100
Biographical Details .............................................................................................................................. 102
Contacts ................................................................................................................................................ 102
Utilities & Transportation ......................................................................................................................... 103
Ves Sites Selection Model for Ground Water Analysis and Mapping ...................................................... 104
Abstract ................................................................................................................................................. 104
Introduction .......................................................................................................................................... 105
Study Area ........................................................................................................................................ 105
Datasets and Methodology ................................................................................................................... 107
Datasets ............................................................................................................................................. 107
Methods............................................................................................................................................. 107
Results and Discussions ........................................................................................................................ 111
Conclusions. .......................................................................................................................................... 115
Acknowledgment. ................................................................................................................................. 116
References ............................................................................................................................................ 116
Biographical Notes ................................................................................................................................ 117
Contacts ................................................................................................................................................ 117
Cross-Cutting Issues .................................................................................................................................. 118
GI-diversity – Taking the activities in the Kakamega-Nandi forests area as example ............................. 119
Abstract ................................................................................................................................................. 119
Introduction .......................................................................................................................................... 120
More Recent Activities .......................................................................................................................... 121
A Web GIS-based viewing tool on forest use history ....................................................................... 121
Developing environmental education tools ....................................................................................... 123
Streamlining GIS teaching across universities .................................................................................. 124
Conclusions ........................................................................................................................................... 126
References ............................................................................................................................................ 126
Acknowledgements ............................................................................................................................... 128
Biographical Notes ................................................................................................................................ 128
Contacts ................................................................................................................................................ 128
Use of GIS and SDI in Promoting Coffee Quality in Maraba Sector, South Province of Rwanda .......... 129
Abstract ................................................................................................................................................. 129
vi
Introduction .......................................................................................................................................... 130
Methodologies ...................................................................................................................................... 130
Methodology Using Site Selection (Environment) and GIS ............................................................. 130
Methodology Using SD .................................................................................................................... 138
Results: Geoportal Creation .................................................................................................................. 139
Conclusion ............................................................................................................................................. 140
References: ........................................................................................................................................... 140
Biographical notes: ............................................................................................................................... 141
Contacts: ............................................................................................................................................... 141
Use smart maps and spatial analysis to better manage the earth's natural resources. Increase production, optimize workflows, and mitigate risk.
Natural Resources

Natural Resources Track
Diana Matee
GIS Utilization in Petroleum Data Management, A Case Study of National Data Centre (NDC) in National Oil
Corporation of Kenya
11th Esri Eastern Africa User Conference (EAUC)
2 – 4 November 2016|Acacia Premier Hotel, Kisumu, Kenya
9/141
GIS Utilization in Petroleum Data Management, A Case Study of National
Data Centre (NDC) in National Oil Corporation of Kenya
Diana Matee, Kenya
Abstract The petroleum industry is an information led business in which the market capitalization of any oil
companies is mainly dependent on an expectation of the value of future production. This number depends
entirely on interpretation and understanding of datasets about resources that are both hidden far below
earth’s surface and are often also in remote inaccessible locations. Oil companies are not unique on how
much they rely on information, but E&P is one of the activities where the financial impact of data is
highest. Therefore, data and information management is crucial for the success of any oil company.
National Oil Corporation of Kenya as a custodian of all the oil and gas data, it embarked on a process of
implementing a National Data Center (NDC). NDC is a centralized dynamic system that manages and
preserves a country’s petroleum data assets with diverse set of data management tools such as automated,
quality assured workflows and services that help to encourages external investment. Most of the data in
NDC has spatial component to them such as well coordinates, seismic line location or a regional span survey
the design of NDC utilizes GIS as the defector spatial tool.

Natural Resources Track Diana Matee GIS Utilization in Petroleum Data Management, A Case Study of National Data Centre (NDC) in National Oil Corporation of Kenya 11th Esri Eastern Africa User Conference (EAUC) 2 – 4 November 2016|Acacia Premier Hotel, Kisumu, Kenya
10/141
Introduction Petroleum industry just like most of research based industries is an information led business .In order to capitalize on the market, companies mainly depend on an expectation of the value of future production. This value depends entirely on the interpretation of data about resources that are location based. The data can be categorized into-structured and unstructured data. Structured data which is organized geoscientific data e.g. seismic, well logs, gravity and magnetic data just to mention a few, whereas unstructured data entails mostly support reports for the geoscientific data. Examples of structured and unstructured
To manage this National Oil Corporation of Kenya with the Ministry of Energy deployed a National Data Center. National Data Center (NDC) A National Data Center (NDC) is a platform that enables archival and retrieval of regional, national, or governmental exploration and production data. It manages a country’s petroleum resources by preserving data resources through centralizing the data. Moreover it assists in promoting more investments to and from the data by having a safe and secure platform where investors can view and buy data. In addition to increasing collaboration among government bodies, international oil companies (IOC) together with research centers. The country’s NDC works flow is dynamic such that is caters for the different data formats ranging from
physical to softcopy. The below diagram shows the work flow of the NDC
• Geological - surface & sub-surface geology maps
• Geophysical - Seismic, gravity, magnetic, navigation data
• Petro physical -logs, cores, cuttings
• Geochemical -fluid samples
Structured data
• Reports e.g. geological reports, seismic sections images,core images e.t.c
Unstructured data
Natural Resources Track Diana Matee GIS Utilization in Petroleum Data Management, A Case Study of National Data Centre (NDC) in National Oil Corporation of Kenya 11th Esri Eastern Africa User Conference (EAUC) 2 – 4 November 2016|Acacia Premier Hotel, Kisumu, Kenya
11/141
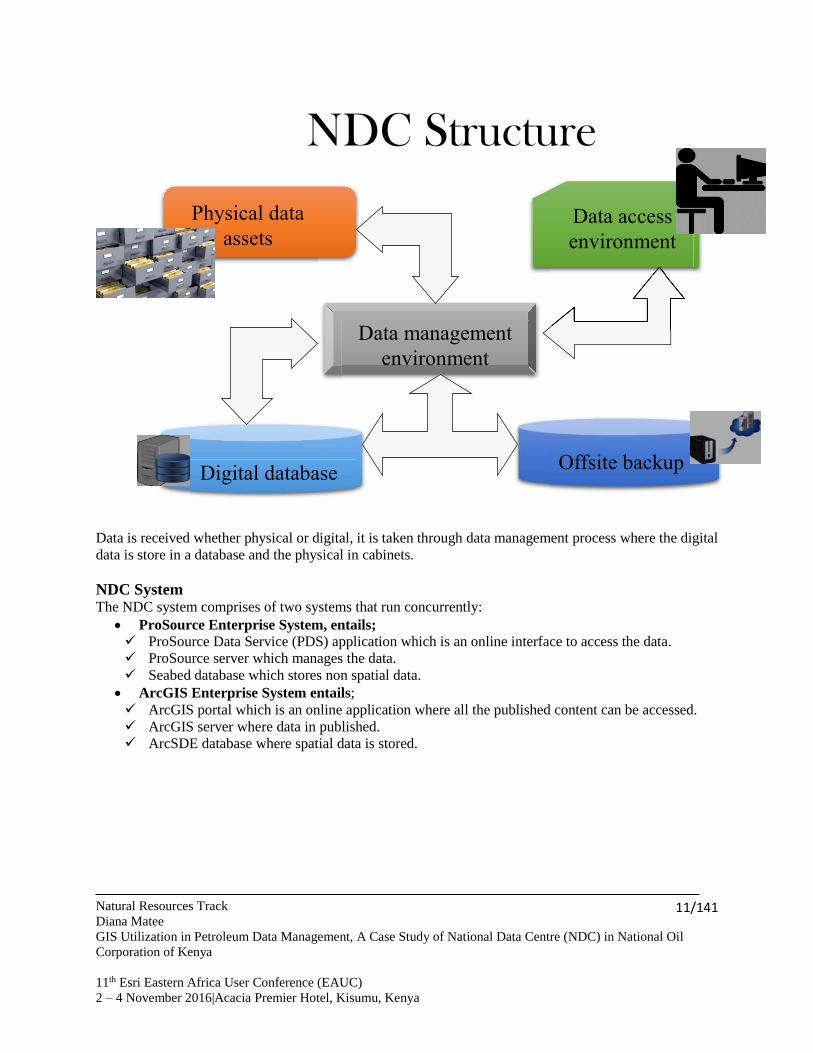
Data is received whether physical or digital, it is taken through data management process where the digital data is store in a database and the physical in cabinets. NDC System The NDC system comprises of two systems that run concurrently:
ProSource Enterprise System, entails; ProSource Data Service (PDS) application which is an online interface to access the data. ProSource server which manages the data. Seabed database which stores non spatial data.
ArcGIS Enterprise System entails; ArcGIS portal which is an online application where all the published content can be accessed. ArcGIS server where data in published. ArcSDE database where spatial data is stored.
NDC Structure
Digital database
Data management
environment
Offsite backup
Data access
environment
Physical data
assets
Natural Resources Track Diana Matee GIS Utilization in Petroleum Data Management, A Case Study of National Data Centre (NDC) in National Oil Corporation of Kenya 11th Esri Eastern Africa User Conference (EAUC) 2 – 4 November 2016|Acacia Premier Hotel, Kisumu, Kenya
12/141
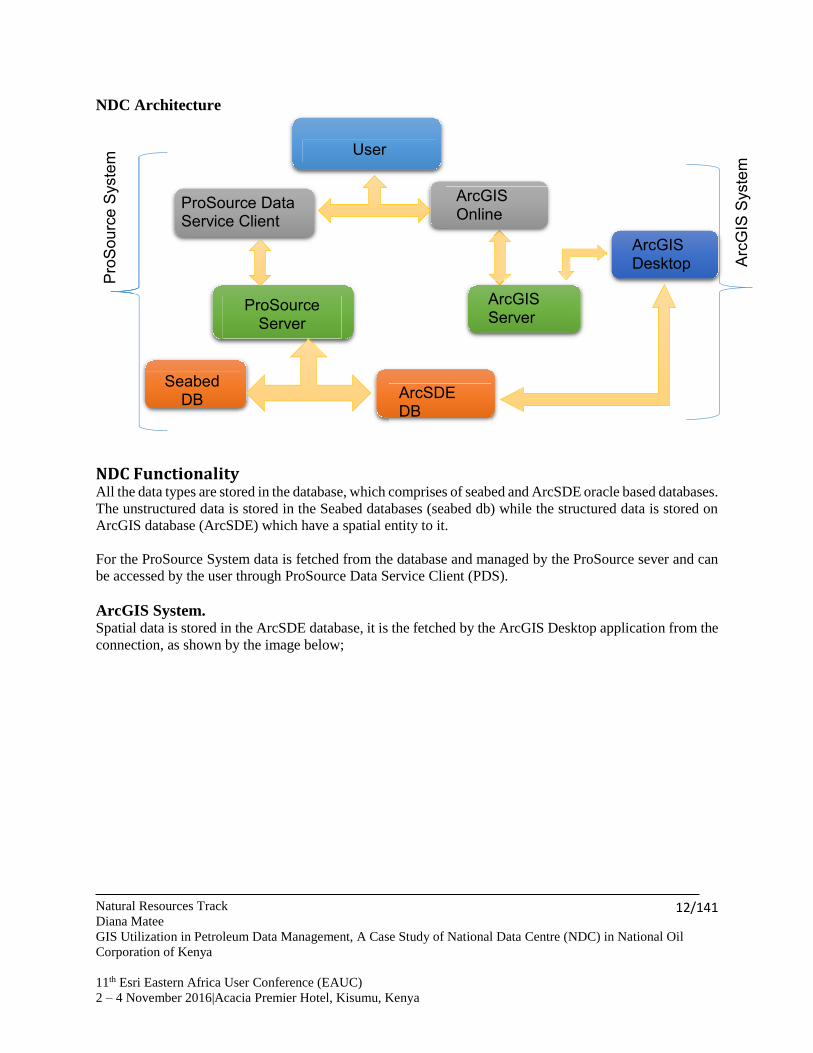
NDC Architecture
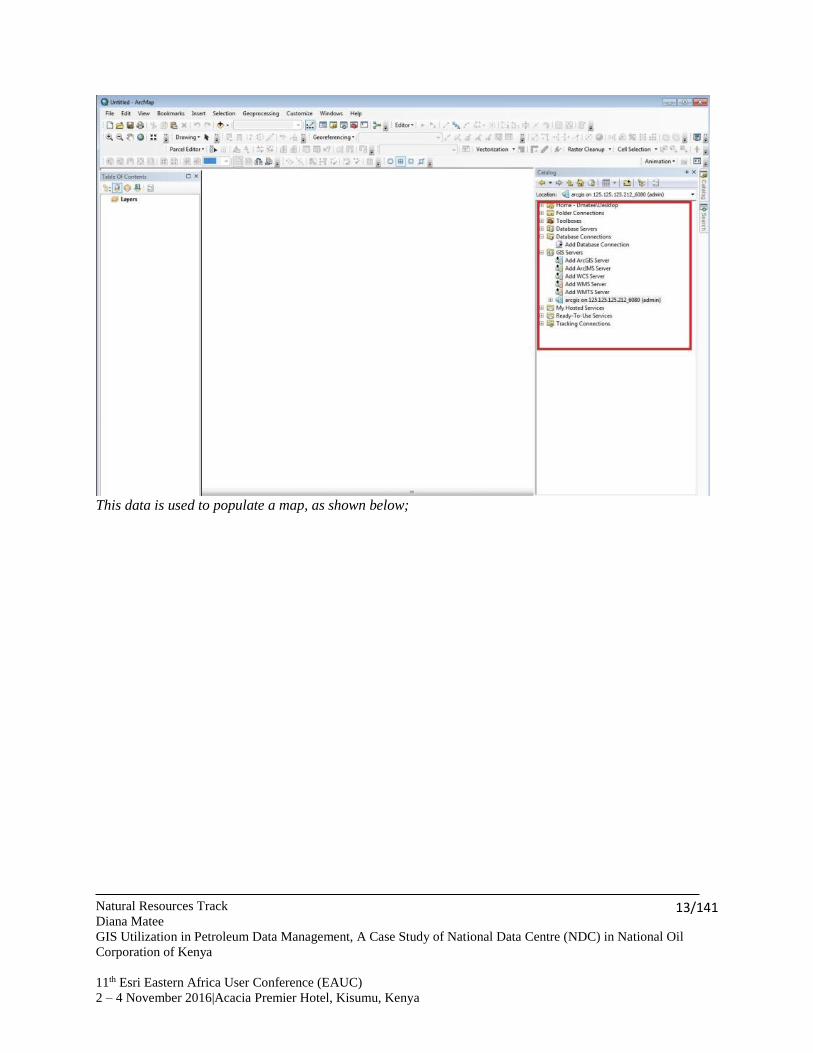
NDC Functionality All the data types are stored in the database, which comprises of seabed and ArcSDE oracle based databases. The unstructured data is stored in the Seabed databases (seabed db) while the structured data is stored on ArcGIS database (ArcSDE) which have a spatial entity to it. For the ProSource System data is fetched from the database and managed by the ProSource sever and can be accessed by the user through ProSource Data Service Client (PDS). ArcGIS System. Spatial data is stored in the ArcSDE database, it is the fetched by the ArcGIS Desktop application from the connection, as shown by the image below;
Pro
So
urc
e S
yste
m
Arc
GIS
Syste
m
ProSource Data Service Client
ArcGIS Server
ArcGIS Desktop
ProSource Server
Seabed DB ArcSDE
DB
ArcGIS Online
User
Natural Resources Track
Diana Matee
GIS Utilization in Petroleum Data Management, A Case Study of National Data Centre (NDC) in National Oil
Corporation of Kenya
11th Esri Eastern Africa User Conference (EAUC)
2 – 4 November 2016|Acacia Premier Hotel, Kisumu, Kenya
13/141
This data is used to populate a map, as shown below;

Natural Resources Track
Diana Matee
GIS Utilization in Petroleum Data Management, A Case Study of National Data Centre (NDC) in National Oil
Corporation of Kenya
11th Esri Eastern Africa User Conference (EAUC)
2 – 4 November 2016|Acacia Premier Hotel, Kisumu, Kenya
14/141
The map is then published to the ArcGIS server;

Natural Resources Track
Diana Matee
GIS Utilization in Petroleum Data Management, A Case Study of National Data Centre (NDC) in National Oil
Corporation of Kenya
11th Esri Eastern Africa User Conference (EAUC)
2 – 4 November 2016|Acacia Premier Hotel, Kisumu, Kenya
15/141
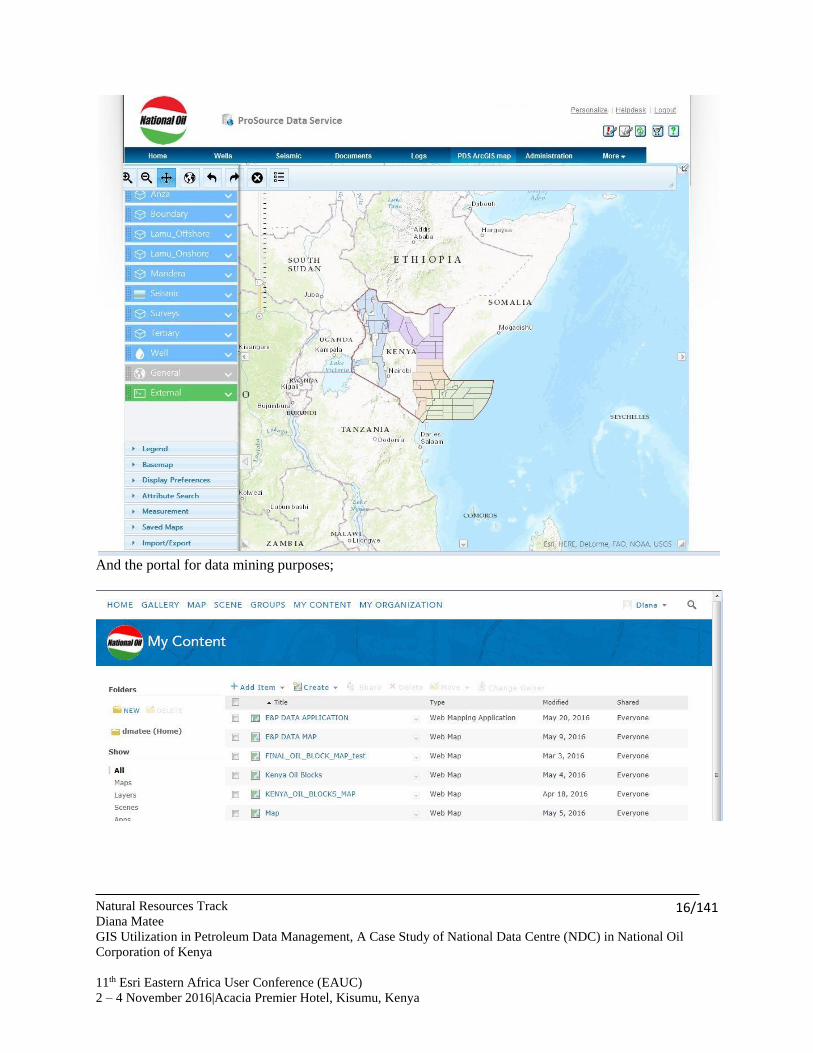
Then the link is redirected to the ProSource Data Service client for view and also the ArcGIS Portal;
Natural Resources Track
Diana Matee
GIS Utilization in Petroleum Data Management, A Case Study of National Data Centre (NDC) in National Oil
Corporation of Kenya
11th Esri Eastern Africa User Conference (EAUC)
2 – 4 November 2016|Acacia Premier Hotel, Kisumu, Kenya
16/141
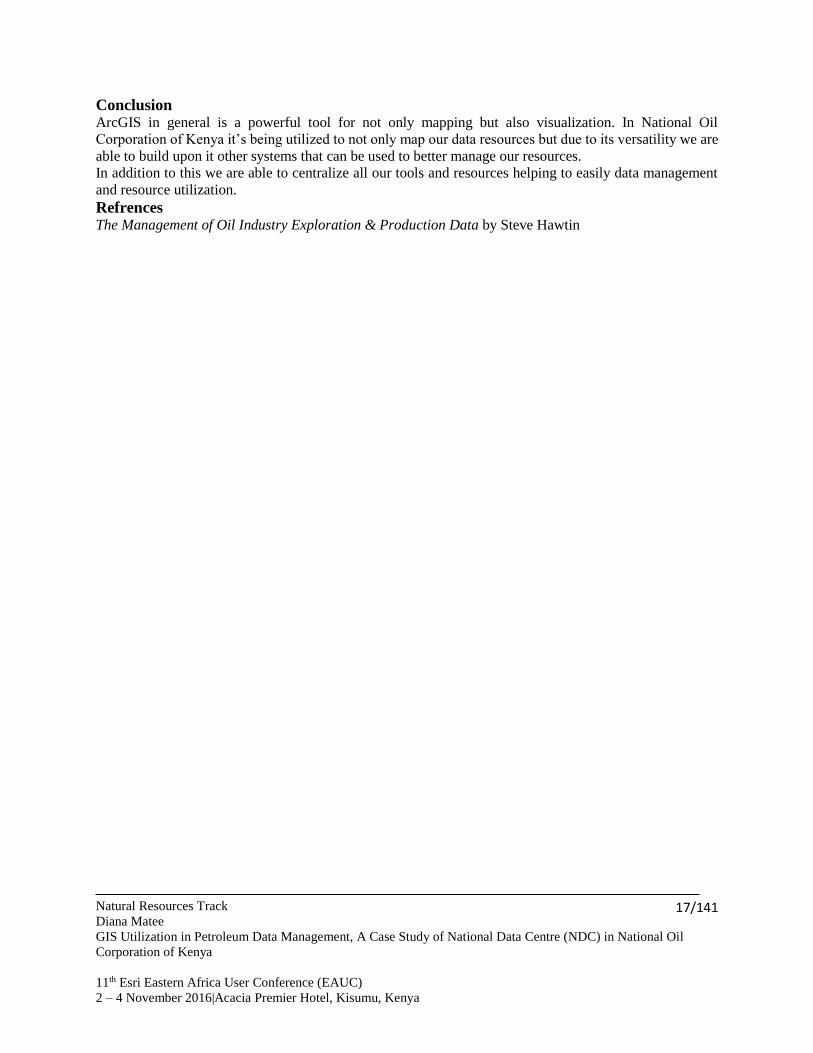
And the portal for data mining purposes;
Natural Resources Track
Diana Matee
GIS Utilization in Petroleum Data Management, A Case Study of National Data Centre (NDC) in National Oil
Corporation of Kenya
11th Esri Eastern Africa User Conference (EAUC)
2 – 4 November 2016|Acacia Premier Hotel, Kisumu, Kenya
17/141
Conclusion ArcGIS in general is a powerful tool for not only mapping but also visualization. In National Oil
Corporation of Kenya it’s being utilized to not only map our data resources but due to its versatility we are
able to build upon it other systems that can be used to better manage our resources.
In addition to this we are able to centralize all our tools and resources helping to easily data management
and resource utilization.
Refrences The Management of Oil Industry Exploration & Production Data by Steve Hawtin
Natural Resources Track
Noreen Mutoro, Gertrud Schaab, Mary Wykstra
Improved Analysis of Cheetah - (Acinonyx jubatus) Occupancy and Gene Flow in Kenya Using GIS Tools
11th Esri Eastern Africa User Conference (EAUC)
2 – 4 November 2016|Acacia Premier Hotel, Kisumu, Kenya
18/141
Improved Analysis of Cheetah - (Acinonyx jubatus) Occupancy and Gene Flow
in Kenya Using GIS Tools
Noreen MUTORO1, Kenya; Gertrud SCHAAB2, Germany; Mary WYKSTRA1, Kenya 1 Carnivores, Livelihoods and Landscapes; Acton for Cheetahs in Kenya (ACK), 2 Karlsruhe University of Applied Sciences, Karlsruhe
Keywords: Gene flow, Range wide Planning, Remote Sensing, Species Occupancy, Species
Distribution
Abstracts:
Action for Cheetahs in Kenya (ACK) is the only range-wide cheetah conservation organization in
Kenya. ACK conducted the first Kenya national cheetah survey in collaboration with the Kenya
Wildlife Service, Cheetah Conservation Fund and East African Wildlife Society between 2004 and
2007. We were the first to create a range-wide map of cheetahs based on actual site visitation
across the entire country. Results of the survey formed the baseline for national and regional
strategic planning. Methodology for the second survey will include land cover and anthropogenic
influences mapped in ArcGIS with cheetah occupancy from field surveys, detection dog scat
collection and gene flow analysis. This presentation will highlight the changes being made from
the first survey in order to assure improved knowledge to influence cheetah conservation
strategies. Occupancy modelling and genetic mapping will be used to map and analyse trends in
cheetah status and genetic flow between populations. Detection dogs will locate scat to evaluate
prey selection, cheetah health and genetic variability. Remote sensing technology will test
assumptions on land use change affecting cheetah habitat. Results of pilot studies conducted
between December 2015 and August 2016 form the framework for completing the range-wide
GIS-based evaluation.
Natural Resources Track
Noreen Mutoro, Gertrud Schaab, Mary Wykstra
Improved Analysis of Cheetah - (Acinonyx jubatus) Occupancy and Gene Flow in Kenya Using GIS Tools
11th Esri Eastern Africa User Conference (EAUC)
2 – 4 November 2016|Acacia Premier Hotel, Kisumu, Kenya
19/141
Problem Definition/ Background
Of all the large carnivores, the cheetah (Acinonyx jubatus) is one of the most vulnerable to
environmental degradation(Bashir et al. 2004). Kenya supports globally important cheetah
populations which are currently experiencing dramatic declines in their ranges and size due to
habitat loss and fragmentation (KWS 2010). Informed conservation management of the cheetah
requires reliable status assessments and inferences on their ability to utilize human-influenced
landscapes. Cheetah conservation activity in the country is hindered by the species’ massive area
requirements and insufficient knowledge on the effects of anthropogenic activities on their
population and habitat (KWS 2010).There are few quantitative studies on cheetah population status
or distribution for use in conservation planning.
Previous nationwide surveys in Kenya on cheetahs were conducted to determine cheetah status
and distribution after speculations that their populations were dramatically declining in the country
(Isaboke et al. 2005). These surveys which provided insightful information on the species’
distribution, status population estimates and threats relied on sighting reports, limited researcher
sightings and interview based surveys (Graham and Parker 1965 ,Gros 1998,Hamilton and Miller
1986). Although nationwide (large-scale) surveys that are based on questionnaires, static range
maps and other forms of expert opinion as basic data provide foundational information about a
species’ ecology and adaptation, they are usually inaccurate and biased because such surveys are
commonly affected by the problem of species being present at some locations but going
unreported. In addition, this data does not highlight the relationship between animal presence and
habitat covariates.
Action for Cheetahs in Kenya (ACK) is the only range-wide cheetah conservation organization in
Kenya. ACK conducted the first Kenya national cheetah survey in collaboration with Kenya
Wildlife Service, Cheetah Conservation Fund and East African Wildlife Society between 2004 and
2007. Results from this survey informed national and regional strategic planning for cheetah
conservation and also created the first range-wide map of cheetahs based on actual site visitation
across the entire country.
In the next national survey, ArcGIS tools will be used to analyze how land cover and anthropogenic
activity influence cheetah occupancy and gene flow based on field survey and genetic analysis.
Information on the relationship between ecological and social determinants that influence cheetah
distribution and survival will be determined on a landscape level. In addition, landscape
connectivity that facilitates cheetah dispersal, especially those living in small isolated population
and the genetic viability of isolated populations inside and outside protected areas across their
ranges, will also be assessed.
Methods/Methodology
Sampling approach for a national-wide survey
A grid sampling approach will be used to sample cheetah geographical ranges in Kenya. The
country will be divided into 20-km x 20-km sampling units using ArcGIS to identify the survey
route. Baseline data from previous cheetah surveys in Kenya on status and distribution will be
Natural Resources Track
Noreen Mutoro, Gertrud Schaab, Mary Wykstra
Improved Analysis of Cheetah - (Acinonyx jubatus) Occupancy and Gene Flow in Kenya Using GIS Tools
11th Esri Eastern Africa User Conference (EAUC)
2 – 4 November 2016|Acacia Premier Hotel, Kisumu, Kenya
20/141
included to identify areas where cheetah occurrence is biogeographically and ecologically possible
and exclude areas where the species was historically absent.
Monitoring Cheetah distribution in Kenya
Occupancy surveys will be used to determine cheetah distribution and quantify their status using
presence-only data. A stratification process will be used to eliminate areas and vegetation types
where the probability of cheetahs is very low (Hebblewhite et al. 2011). Fixed transect surveys
will be used to detect cheetah presence/ occupancy in each grid cell. Driving transects will be
conducted along the roads but in areas where there is limited road network, transects will be
conducted along game trails on foot. ArcGIS Online mobile applications will be used to collect
data digitally in the field and store data online to reduce the need to carry paper forms and the time
in entering data.
Scat detection dogs will also be used to augment occupancy surveys by determining the proportion
of landscape occupied by cheetahs based on detection of cheetah scats. Survey routes will be
positioned to maximize the probability of encountering cheetah tracks both on roads, trails and at
random through the study area. Detections will be represented by unambiguously identified
cheetah tracks, scat or sighting reports.
A questionnaire will also be developed to gather detection/non-detection data on cheetah presence
from area residents. Each respondent will be asked to report all cheetah sightings they can clearly
remember and the location name and the name of surrounding landmarks. Locations where the
respondent knows of the presence of the cheetah without being able to remember the precise
sightings will also be recorded. For each reported sighting, the respondent will be asked to specify
the date of observation or approximate dates by referring to important events in the life of the
community; total number of cheetah observed and age, sex of cheetahs that were sighted.
Interviewees will be ranked for confidence and results will compliment field survey and scat data.
Predicting heterogeneity in cheetah occupancy
Occupancy and species distribution modeling is are an innovative methods for assessing species
status, mapping species distribution and investigating determinants of species occurrence
(Andresen et al. 2014). The formula developed in pilot studies based on detection and non-
detection of species over several sampling occasions provide a model that can be used rapidly on
larger scale .We will use aspects of distribution and occupancy methods where weighting the
detection, density and search effort will provide us with the best possible formula for predicting
trends in cheetah population over time. Landscape-scale occupancy surveys can also be used to
identify meta-populations, which if combined with ecological (prey occurrence models) and
anthropogenic information can allow the delineation of important corridors and suitable locations
for reintroductions (Andresen et al. 2014).
Heterogeneity in cheetah occupancy will be determined by hierarchical ranking of predictor
variables (covariates) and how they influence cheetah distribution and resource selection. A
combination of environmental (climate, elevation, landscape structure and land cover/ habitat),
Natural Resources Track
Noreen Mutoro, Gertrud Schaab, Mary Wykstra
Improved Analysis of Cheetah - (Acinonyx jubatus) Occupancy and Gene Flow in Kenya Using GIS Tools
11th Esri Eastern Africa User Conference (EAUC)
2 – 4 November 2016|Acacia Premier Hotel, Kisumu, Kenya
21/141
anthropogenic (land use, human population densities and proximity to agro-pastoralist settlement,
proximity to protected areas) and biotic (occurrence probability of main prey species) spatial
covariates will be used to understand cheetah occupancy across their geographical ranges (Karanth
et al. 2009). A spatial vegetation community land cover model that describes vegetation
community associations available in Kenya will be developed using Landsat-8/Sentinel-2 images
in combination with already existing, often outdated geo-data sets. Remotely sensed data will be
complemented with field based assessments on a range-wide scale to minimize errors resulting
from misclassification and resolution issues, and also to put into consideration changes that may
have taken place at the ground level since GIS data was collected. Geo-data on settlement, human
population densities and proximity to settlements, water and protected areas will determine levels
of resistance or augmentation of cheetah distribution in the area. Only covariates considered
having a significant influence on cheetah distribution and habitat use in a sampling unit will be
used in cheetah models.
Determining landscape connectivity
GIS-based landscape layers will be combined to produce a movement cost surface quantifying the
matrix between cheetah populations in terms of difficulty of movement. Least cost corridors will
then be modeled across this cost surface between known cheetah populations identified in previous
range wide surveys. A range-wide least cost connectivity analysis between known cheetah
populations will be used to determine where potential and/or actual cheetah corridors exist.
Genetic analysis from fecal samples will be used to measure the degree of maternal connections
across populations and to further measure the population flow across their range. These corridors
are probable connections between cheetah populations that maintain genetic viability and health
in the population (Zeller et al. 2011). Field based assessments will confirm the use of the corridor
by the cheetah and contribute to the remote data in ArcGIS to examine corridor boundaries for
conservation planning.
Expected outcomes (Results and major findings)
- Spatial distribution maps and predictive maps on cheetahs’ geographic range and status in
Kenya.
- Identification of habitat covariates/ resource selection functions that influence cheetah
habitat occupancy in Kenya.
- Identification of cheetah population patches across current geographic ranges and their
genetic viability.
- Identification of existing and potential corridors which will help promote corridor
conservation and inform management decisions based on scientific data.
- Classification of site specific threats to cheetah populations, habitats and corridors which
can be used to inform management and conservation decisions.
Biological references
Andresen L, K Everatt, MJ Somers. 2014. Use of site occupancy models for targeted monitoring
of the cheetah. Journal of Zoology 292: 212-220.
Natural Resources Track
Noreen Mutoro, Gertrud Schaab, Mary Wykstra
Improved Analysis of Cheetah - (Acinonyx jubatus) Occupancy and Gene Flow in Kenya Using GIS Tools
11th Esri Eastern Africa User Conference (EAUC)
2 – 4 November 2016|Acacia Premier Hotel, Kisumu, Kenya
22/141
Bashir S, B Daly, SM Durant, H Förster, J Grisham, L Marker et al. 2004. Global cheetah
(acinonyx jubatus) monitoring workshop report. . Conservation Breeding Specialist Group
(SSC/ IUCN), Pretoria.
Graham AD, ISC Parker. 1965 East african wildlife society cheetah survey Nairobi.
Gros PM. 1998. The status if the cheetah acinonyx jubatus in kenya: A field-interview assessment.
Biological Conservation 85: 137-149.
Hamilton P, SD Miller. 1986. Status of cheetah in kenya, with reference to sub-saharan africa.
In: D. Everett (ed.) Cats of the world: Biology, conservation and management. Natl
Wildlife Federation, Washington, D.C.
Hebblewhite M, D Miquelle, A Murzin, V Aramilev, D Pikunov. 2011. Predicting potential
habitat and population size for reintroduction of the far eastern leopards in the russian far
east historic range of far eastern leopards. Biological Conservation, 10: 2403-2413
Isaboke W, M Kahiu, CM Wambua, M Wykstra. 2005. Cheetah census in kenya, priority 1: South
western kenya (2004-2005) - report submitted to east african wildlife society, stichting-
netherlands., Action for Cheetahs in Kenya.
Karanth KK, JD Nichols, JE Hines, KU Karanth, NL Christensen. 2009. Patterns and
determinants of mammal species occurrence in india. Journal of Applied Ecology 46:
1189-1200.
KWS. 2010. Kenya national strategy for the conservation of cheetahs and wild dogs. In: Research
(ed.). Kenya Wildlife Service, Nairobi.
Zeller AK, S Nijihawan, R Salmon-Peréz, HS Postome, EJ Hines. 2011. Integrating occupancy
modelling and interview data for corridor identification: A case study of jaguars in
nicaragua. Biology Conservation: 892-901.
Biographical Notes
Noreen Mutoro completed her Master’s through the University of Nairobi and Action for Cheetahs
in Kenya in affiliation with the Kenya Wildlife Service and the Cheetah Conservation Fund. She
is now a PhD candidate with Technische Universität München under supervision with Jany
Christian Habel and Gertrud Schaab. She is a research assistant with Action for Cheetahs and
works closely with Mary Wykstra, MEM, on development of the second national cheetah survey
conducted with this institution
Contacts 1 Carnivores, Livelihoods and Landscapes; Acton for Cheetahs in Kenya (ACK), Nairobi, Kenya,
2 Karlsruhe University of Applied Sciences, Karlsruhe, Germany, [email protected]
Natural Resources Track
Solomon M. Mwenda, Alex Mugambi, James Nyaga
Impact of Climate Change on Desertification in Arid Areas of Kenya
11th Esri Eastern Africa User Conference (EAUC)
2 – 4 November 2016|Acacia Premier Hotel, Kisumu, Kenya
23/141
Impact of Climate Change on Desertification in Arid Areas of Kenya
Mr. Solomon M. Mwenda, Mr. Alex Mugambi, Mr. James Nyaga
Kenyatta University, Regional Centre for Mapping of Resources for Development.
Key words: Desertification, Climate Change, Arid Areas, GIS.
Abstract Climate change and a deteriorating environment is a key challenge to sustainability, bio-diversity,
food security and stability across Africa. Pollution, deteriorating soil quality, desertification and
poor air quality are threatening the lives and future of all the continent's people.According to
previous studies, the impacts of climate change in Africa will be severe, and are already ongoing
in many places. Desertification, along with climate change and the loss of biodiversity are the
greatest challenges to sustainable development identified during the 1992 Rio Earth Summit.
UNCCD links environment and development to sustainable land management. The Convention
addresses specifically the arid, semi-arid and dry sub-humid areas, known as the dry lands, where
some of the most vulnerable ecosystems and peoples can be found. UNCCD strategy (2008-2018)
adopted in 2007 aims: "to forge a global partnership to reverse and prevent desertification/land
degradation and to mitigate the effects of drought in affected areas in order to support poverty
reduction and environmental sustainability". In pursuit of this goal, GIS modeling was used for
global-aridity using the data available from the World Clim Global Climate Data as input
parameters. Monthly average PET was spatially characterized and then tested using four different
temperature-based methods applied to the WorldClim Global Climate Data to determine their
prediction accuracy. Desertification is intensifying and spreading in Kenya, threatening millions
of inhabitants’ and severely reducing productivity of the land due to a growing imbalance between
population, resources, development and environment. This paper analyzed the impact of these
factors on the arid areas of Kenya and mitigating measures and interventions to avert future
occurrences using Geographic Information Systems.
Natural Resources Track
Solomon M. Mwenda, Alex Mugambi, James Nyaga
Impact of Climate Change on Desertification in Arid Areas of Kenya
11th Esri Eastern Africa User Conference (EAUC)
2 – 4 November 2016|Acacia Premier Hotel, Kisumu, Kenya
24/141
Introduction
According to a United Nations report (UNCCD, 2004) more than one billion people worldwide,
most of them among the poorest in the world are affected by drought and desertification. These
people, occupying approximately one quarter of the planet, are facing major problems which
include soil degradation and vegetation loss, leading todeterioration of arable land and eventually
to chronic food insecurity. Desertification of the arid lands of the world has been proceeding
rapidly for more than a thousand years. The Arid and Semi-Arid lands (ASAL) constitute about
80% (467,200 sq. km) of Kenya’s total landmass and is grouped into geographical zones including
the Savannah covering most of the North eastern and South-eastern parts, the Coastal region, the
North Rift Valley, the Highlands and the Lake Victoria Basin. The ASAL hosts about 35% of
Kenya’s population (13 million people) and over 60% of its inhabitants live below the poverty
line, subsisting on less than one US dollar per day. (UNEP 2013).
Aridity Thompson (1975) explained that aridity and lack of moisture could be caused by climatic
processes: off-shore cold currents, topography and dynamic anti-cyclonic subsidence, and high
pressure systems. Desserts are found where one or more of these processes operate over a
significant area for sufficient time. The arid lands are characterized by high ambient temperatures
with a wide diurnal range. In most areas, evapotranspiration rates are more than twice the annual
rainfall. These areas receive low anderratic bimodal rainfall that is highly variable both inspace
and time. In most cases, rain falls as short highintensity storms that produce considerable runoff
and soil erosion. Average annual rainfall in the arid lands ranges from 150-450mm. The soils are
shallow, highly variable, and of light to medium texture. The soils are also of low fertility and are
subject to compaction, capping and erosion. A few areas have volcanic soils and alluvial deposits
which are suitable for crop production. Heavy clays are found in these areas also, but cultivation
is difficult on them due to their poor workability as well as salinity problems. Water availability
and accessibility is highly variable and is a considerable constraint to agricultural production.Arid
lands are mainly inhabited by pastoralists and agro- pastoralists. Large areas are suitable only for
nomadic livestock production.
Climate change. Climate change is a change in the statistical distribution of weather patterns when that change lasts
for an extended period of time. Climate change may also refer to a change in average weather
conditions, or in the time variation of weather around longer-term average conditions. Climate
change is caused by factors such as biotic processes, variations in solar radiation received by Earth,
plate tectonics, and volcanic eruptions. Certain human activities have also been identified as
significant causes of recent climate change, often referred to as "global warming". Some of the
general adverse effects of climate change experienced in Kenya include; Variations in weather
patterns (reduced rainfall and failed seasons), frequent and prolonged droughts and diminishing
water resources, Floods/flash floods and landslides, environmental degradation and habitat
destruction, resurgence of pests and diseases, loss of biodiversity, severe famine and hunger
causing food insecurity and resource use conflicts.
Natural Resources Track
Solomon M. Mwenda, Alex Mugambi, James Nyaga
Impact of Climate Change on Desertification in Arid Areas of Kenya
11th Esri Eastern Africa User Conference (EAUC)
2 – 4 November 2016|Acacia Premier Hotel, Kisumu, Kenya
25/141
Desertification. Desertification is the impoverishment of terrestrial ecosystems under the impact of man. It is the
process of deterioration in these ecosystems that can be measured by reduced productivity of
desirable plants, undesirable alterations in the biomass and the diversity of the micro and macro
fauna and flora, accelerated soil deterioration, and increased hazards for human occupancy.
In the International Agreement on Combating Desertification that was held in Paris in 1994,
desertification was defined as the reduction or loss of biological or economic productivity resulting
from land use or from human activities and habitation patterns. A number of factors have increased
land degradation and the vulnerability of the African arid regions to desertification. Most of them
have had similar effects in Asia and Latin America. They can be grouped in three categories:
Increased human and animal population, improved health services and injudicious use of
technology.
Due to the increased sedentary population, pressures on cultivated land led to a shortening of the
fallow period in the shifting cultivation cycle and the extension of cropping into the more
precarious drier regions. Crop harvests became less reliable and more variable as the desert edge
was approached. Concurrently, nomadic pastoralists were deprived of some of their best grazing
lands as the cultivators moved in (Delwaulle, 1977). At the same time the rangeland area was
contracting, populations of pastoralists and their livestock were increasing and the provision of
improved veterinary services and the lack of a viable marketing system helped assure that animal
numbers would grow rapidly (Widstrand, 1975). The result was inevitable: overgrazing and
accelerated desertification. Overgrazing inadvertently was made worse, particularly in the Sahel,
by the drilling of additional wells that provided drinking water for livestock throughout the year.
Without the rest period that intermittent water supplies previously assured, forage conditions
deteriorated around the wells where water was no longer a limiting factor in livestock survival.
Local authorities did not or could not impose a control system that would allow forage plants to
recover from heavy grazing. Destruction of woody vegetation has been hastened by the ever-
increasing need for firewood to meet the demands of the larger population. The destruction is
especially noticeable around the rapidly growing urban centers, where the circle of deforested
lands gets larger every year (Delwaulle, 1973). While desertification was a long-standing problem
even in the absence of droughts, the gradually increasing vulnerability of the land made the impact
of the inevitable droughts worse than ever (Dahl and Hjort, 1979). The factors responsible for that
vulnerability are still operating, desertification continues, and future droughts will have ever-
greater damaging effects.
Droughts causes and desert spread. A common misapprehension about desertification is that it spreads from a desert core, like a ripple
on a pond. Land degradation can and does occur far from any climatic desert; the presence or
absence of a nearby desert has no direct relation to desertification. Desertification usually begins
as a spot on the land-scape where land abuse has become excessive. From that spot, which might
be around a watering point or in a cultivated field, land degradation spreads outward if the abuse
continues. A second misconception is that droughts are responsible for desertification. Droughts
do increase the likelihood that the rate of degradation will increase on non-irrigated land if the

Natural Resources Track
Solomon M. Mwenda, Alex Mugambi, James Nyaga
Impact of Climate Change on Desertification in Arid Areas of Kenya
11th Esri Eastern Africa User Conference (EAUC)
2 – 4 November 2016|Acacia Premier Hotel, Kisumu, Kenya
26/141
carrying capacity is exceeded. However, well-managed land will recover from droughts with
minimal adverse effects when the rains return. The deadly combination is land abuse during good
periods and its continuation during periods of deficient rainfall.
Magnitude of Desertification in Africa About 18 percent of the arid region of Africa is severely desertified, and most of that represented
by grazing lands and rain-fed cropping lands on the south side of the Sahara, the mountain slopes
and the plains of North Africa. Moderate to high salinity affects about 30 percent of the irrigated
land in Egypt (Aboukhaled et al., 1975).
Wind erosion is dominant in the drier regions and water erosion on the wetter sloping lands.
Ethiopia, Kenya, and the Maghreb countries of Algeria, Morocco, and Tunisia have been subjected
to especially serious water erosion, whereas wind erosion has been most damaging in sub-Saharan
West Africa. While good data on the effect of land degradation on crop and livestock yields are
not available, it seems likely that soil fertility losses, alone, have reduced dry land crop yields by
25 to 50 percent in the severely desertified areas. Animal productivity may well have declined by
at least 50 percent nearly everywhere that domestic livestock are raised. In many areas south of
the Sahara, rangeland forage production probably is less than 25 percent of the potential.
Causes of Desertification. Factors leading to desertification can in general be divided into two categories: climatic variability
and human activities.
Climatic variability: Dry lands have limited water supplies (annual rainfall is less than 100mm).
Rainfall can vary greatly during the year, while wider fluctuations occur over years and decades.
This leads directly to drought, which is often associated with land degradation and hence a vital
factor behind desertification.
Human activities: The human activities that lead to desertification can be outlined as
overgrazing: This is described as the major cause of desertification worldwide and Overexploiting
land: This can happen due to various reasons. It can happen due to expand in human population
and hence the need for more crops, international economic forces that can lead to short-term
exploitation of local resources for export.
Objectives of Study 1. To access the magnitude of desertification in Kenya’s arid areas
2. To access impact of climate change in Kenya’s arid areas
3. To analyze the impact of growing imbalance between population, resources, development and
environment on the arid areas of Kenya
4. To propose mitigating measures and interventions to avert future occurrences.
Natural Resources Track
Solomon M. Mwenda, Alex Mugambi, James Nyaga
Impact of Climate Change on Desertification in Arid Areas of Kenya
11th Esri Eastern Africa User Conference (EAUC)
2 – 4 November 2016|Acacia Premier Hotel, Kisumu, Kenya
27/141
Methodology
Description of study site The study area in Kenya falls partly in the arid zones covering of the Rift Valley. It covers Turkana,
Wajir, Mandera, Marsabit, Isiolo, Garissa, Samburu, Baringo, Tana River counties which consist
of a population of 4,620,199 which is 12% of the national population. (Vision 2030 Development
Strategy for Northern Kenya and other Arid Lands (2011).

Natural Resources Track
Solomon M. Mwenda, Alex Mugambi, James Nyaga
Impact of Climate Change on Desertification in Arid Areas of Kenya
11th Esri Eastern Africa User Conference (EAUC)
2 – 4 November 2016|Acacia Premier Hotel, Kisumu, Kenya
28/141
Figure 1.1: Map of Arid Areas in Kenya
Natural Resources Track
Solomon M. Mwenda, Alex Mugambi, James Nyaga
Impact of Climate Change on Desertification in Arid Areas of Kenya
11th Esri Eastern Africa User Conference (EAUC)
2 – 4 November 2016|Acacia Premier Hotel, Kisumu, Kenya
29/141
Global Potential Evapo-Transpiration (Global-PET) and Global-Aridity Geospatial Datasets were
used. Potential Evapo-Transpiration (PET) is a measure of the ability of the atmosphere to remove
water through Evapo-Transpiration (ET) processes. The FAO introduced the definition of PET as
the ET of a reference crop under optimal conditions, having the characteristics of well watered
grass with an assumed height of 12 centimeters, a fixed surface resistance of 70 seconds per meter
and an albedo of 0.23 (Allen et al. 1998).
The Global-PET and Global-Aridity were both modeled using the data available from the World
Clim Global Climate Data (Hijmans et al. 2005) as input parameters. The World Clim, based on a
high number of climate observations and SRTM topographical data, is a high-resolution global
geo-database (30 arc seconds or ~ 1km at equator) of monthly average data (1950-2000) for the
following climatic parameters: precipitation, mean, minimum and maximum temperature. This set
of parameters is insufficient to fully parameterize physical radiation-based PET equations (i.e. the
FAO-PM), though can parameterize simpler temperature-based PET equations.
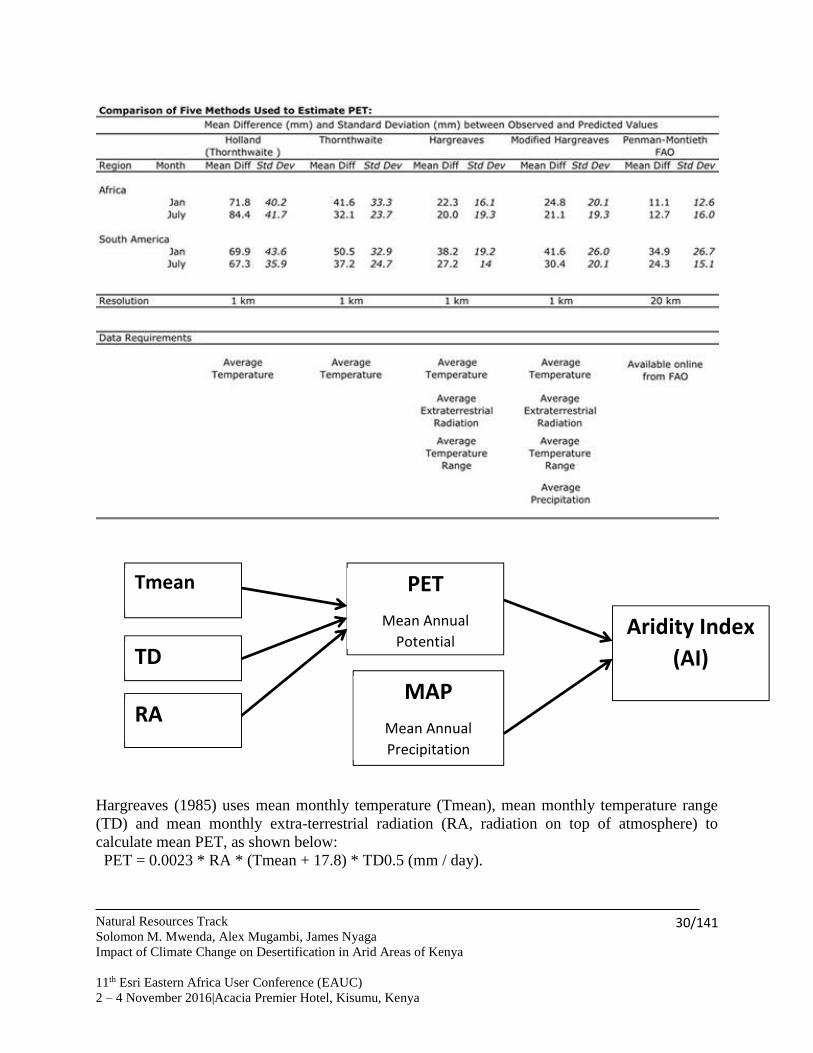
Monthly average PET was spatially characterized and then tested using four different temperature-
based methods applied to the WorldClim Global Climate Data to determine their prediction
accuracy. The modes that were used and tested are Thornthwaite (1948), Thornthwaite modified
by Holland (1978), Hargreaves et al. (1985), Hargreaves modified by Droogers and Allen (2002).
The monthly average values using these high resolution temperature PET layers, together with
existing medium resolution (10’) FAO-PM monthly average (1950-2000) PET layers (FAO 2004),
were compared to Penman-Monteith PET values estimated at climate stations in South America
and Africa (n = 2288). The PET measurements used in the validation are calculated using the more
complex Penman-Monteith model applied on direct observations of the various climatic
parameters, and were obtained from the FAOCLIM 2 climate station dataset (Allen et al., 1998),
available online from FAO. Based on the results of the comparative validation, the Hargreaves
model was chosen as the most suitable to model PET globally. (Hargreaves and Allen 2003).
Natural Resources Track Solomon M. Mwenda, Alex Mugambi, James Nyaga Impact of Climate Change on Desertification in Arid Areas of Kenya 11th Esri Eastern Africa User Conference (EAUC) 2 – 4 November 2016|Acacia Premier Hotel, Kisumu, Kenya
30/141
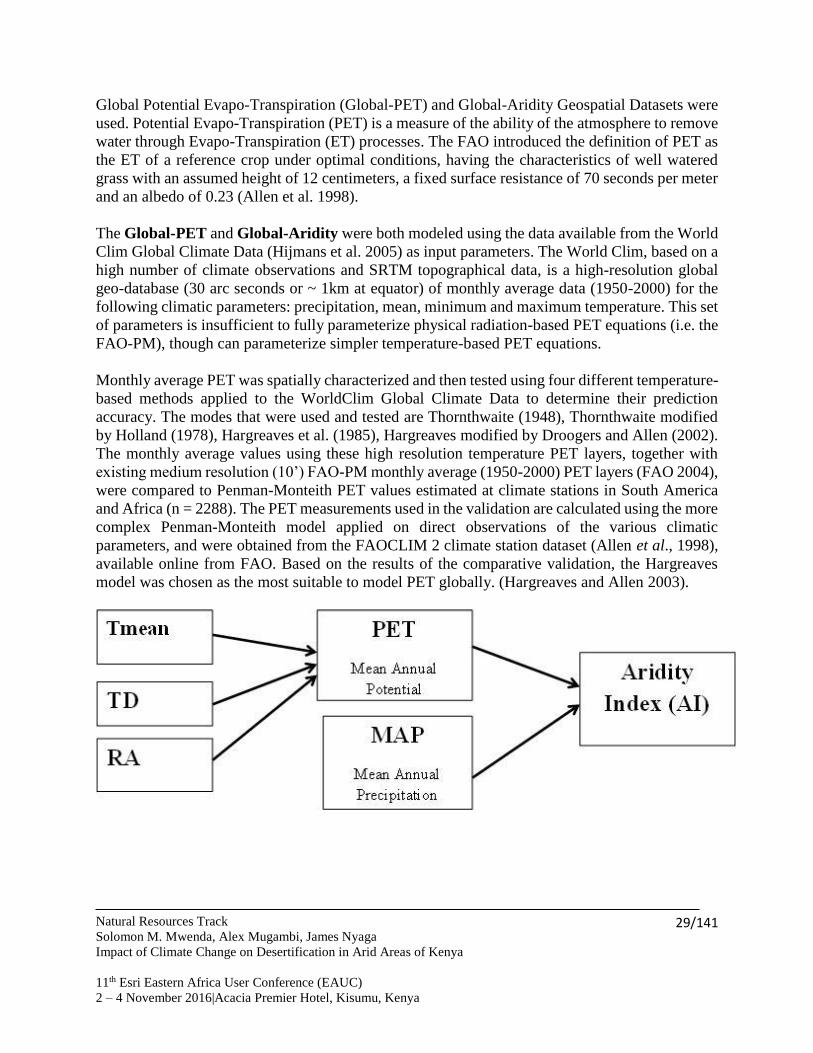
Hargreaves (1985) uses mean monthly temperature (Tmean), mean monthly temperature range (TD) and mean monthly extra-terrestrial radiation (RA, radiation on top of atmosphere) to calculate mean PET, as shown below: PET = 0.0023 * RA * (Tmean + 17.8) * TD0.5 (mm / day).
Tmean
TD
RA
PET
Mean Annual
Potential
Evapotranspiration
MAP
Mean Annual
Precipitation
Aridity Index
(AI)

Natural Resources Track
Solomon M. Mwenda, Alex Mugambi, James Nyaga
Impact of Climate Change on Desertification in Arid Areas of Kenya
11th Esri Eastern Africa User Conference (EAUC)
2 – 4 November 2016|Acacia Premier Hotel, Kisumu, Kenya
31/141
Average monthly and annual PET (mm) layers at spatial resolution of 30 arc-seconds (~ 1km at
tropics) for the 1950-2000 period are calculated using the Hargreaves method with available layers
of monthly average temperature parameters, available from WorldClim database, and extra-
terrestrial radiation, calculated for specific months using a methodology presented by Allen et al.,
(1998). Temperature range (TD) is an effective proxy to describe the effect of cloud cover on the
quantity of extra-terrestrial radiation reaching the land surface and, as such, it describes more
complex physical processes with easily available climate data at high resolution.
Aridity is usually expressed as a generalized function of precipitation, temperature, and potential
evapotranspiration (PET). An Aridity Index (UNEP, 1997) can be used to quantify precipitation
availability over atmospheric water demand.
Global mapping of mean Aridity Index from the 1950-2000 period at 30 arc second spatial
resolution is calculated as:
Aridity Index (AI) = MAP / MAE where:
MAP = Mean Annual Precipitation
MAE = Mean Annual Potential Evapotranspiration
In the Global-Aridity dataset, which uses this formulation, Aridity Index values increase for more
humid conditions, and decrease with more arid conditions. Mean annual precipitation (MAP)
values were obtained from the WorldClim Global Climate Data (Hijmans et al. 2005), for years
1950-2000, while PET layers estimated on a monthly average basis by the GPET (i.e. modeled
using the Hargreaves method, as described above) were aggregated to mean annual values (MAE).
The Global-Aridity surface shows moisture availability for potential growth of reference
vegetation excluding the impact of soil mediating water runoff events. UNEP (UNEP 1997) breaks
up Aridity Index, in the traditional classification scheme presented in Table 2.
Value Climate Class
< 0.03 Hyper Arid
0.03 – 0.2 Arid
0.2 – 0.5 Semi-Arid
0.5 – 0.65 Dry sub-humid
> 0.65 Humid
Natural Resources Track
Solomon M. Mwenda, Alex Mugambi, James Nyaga
Impact of Climate Change on Desertification in Arid Areas of Kenya
11th Esri Eastern Africa User Conference (EAUC)
2 – 4 November 2016|Acacia Premier Hotel, Kisumu, Kenya
32/141
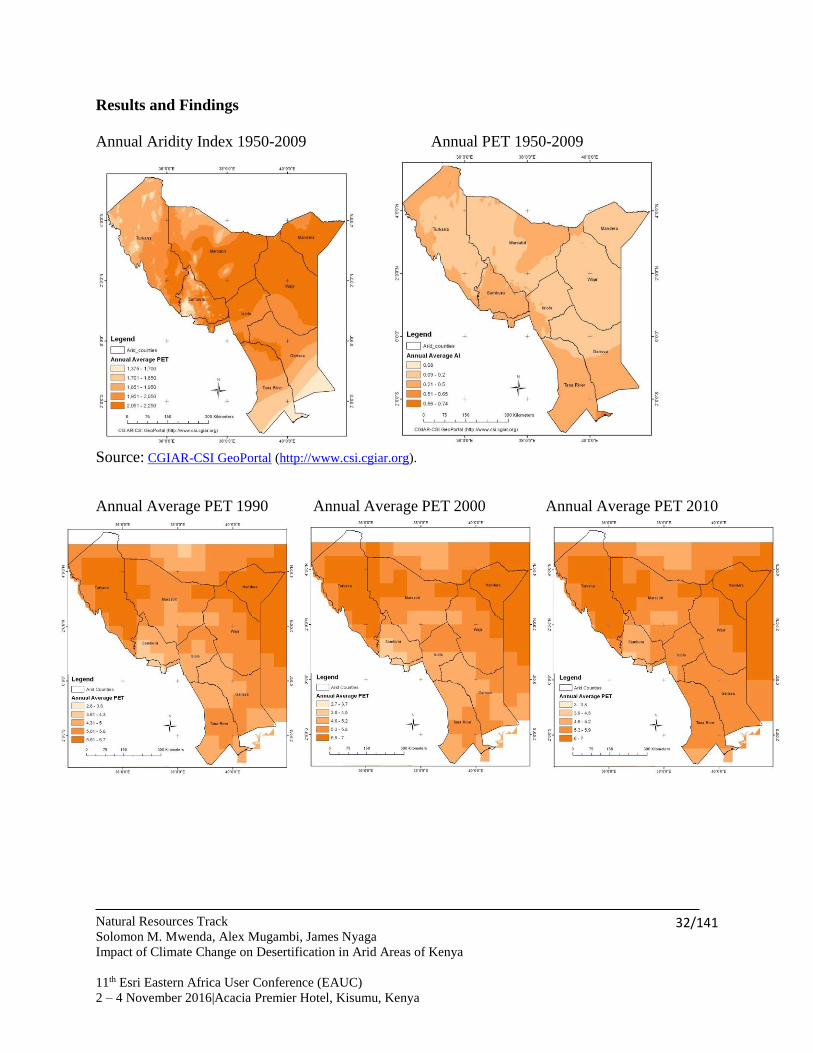
Results and Findings
Annual Aridity Index 1950-2009 Annual PET 1950-2009
Source: CGIAR-CSI GeoPortal (http://www.csi.cgiar.org).
Annual Average PET 1990 Annual Average PET 2000 Annual Average PET 2010
Natural Resources Track
Solomon M. Mwenda, Alex Mugambi, James Nyaga
Impact of Climate Change on Desertification in Arid Areas of Kenya
11th Esri Eastern Africa User Conference (EAUC)
2 – 4 November 2016|Acacia Premier Hotel, Kisumu, Kenya
33/141
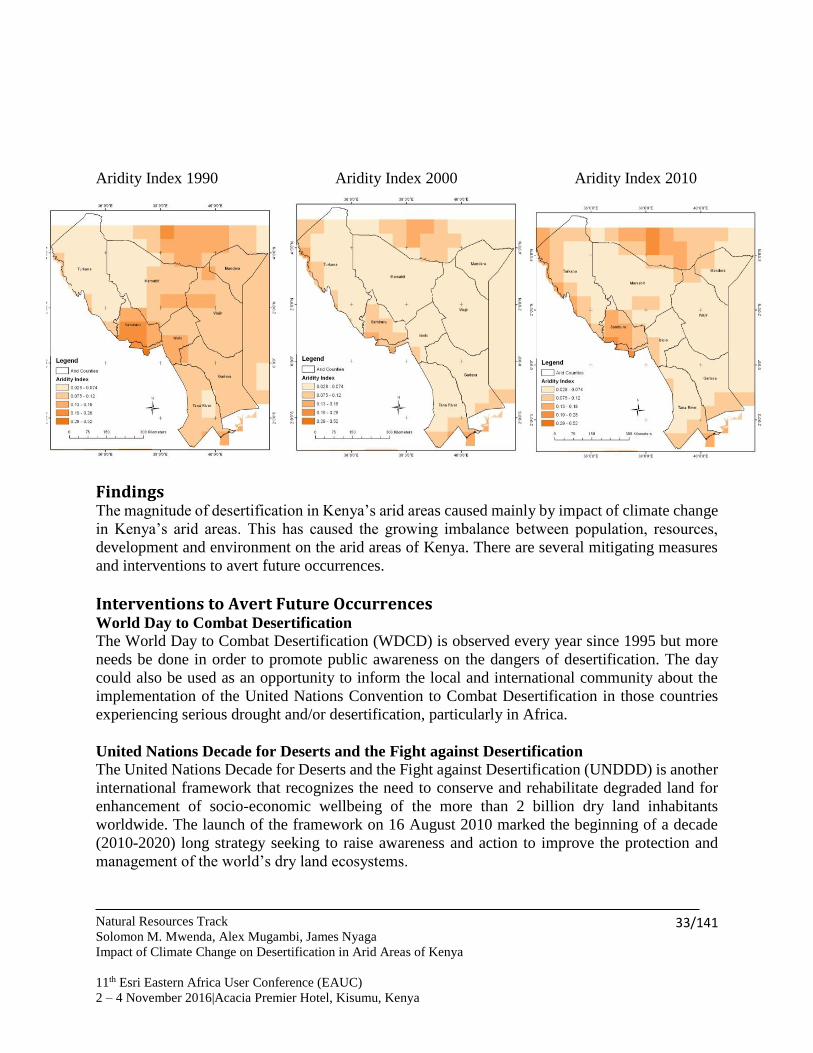
Aridity Index 1990 Aridity Index 2000 Aridity Index 2010
Findings The magnitude of desertification in Kenya’s arid areas caused mainly by impact of climate change
in Kenya’s arid areas. This has caused the growing imbalance between population, resources,
development and environment on the arid areas of Kenya. There are several mitigating measures
and interventions to avert future occurrences.
Interventions to Avert Future Occurrences World Day to Combat Desertification
The World Day to Combat Desertification (WDCD) is observed every year since 1995 but more
needs be done in order to promote public awareness on the dangers of desertification. The day
could also be used as an opportunity to inform the local and international community about the
implementation of the United Nations Convention to Combat Desertification in those countries
experiencing serious drought and/or desertification, particularly in Africa.
United Nations Decade for Deserts and the Fight against Desertification
The United Nations Decade for Deserts and the Fight against Desertification (UNDDD) is another
international framework that recognizes the need to conserve and rehabilitate degraded land for
enhancement of socio-economic wellbeing of the more than 2 billion dry land inhabitants
worldwide. The launch of the framework on 16 August 2010 marked the beginning of a decade
(2010-2020) long strategy seeking to raise awareness and action to improve the protection and
management of the world’s dry land ecosystems.
Natural Resources Track
Solomon M. Mwenda, Alex Mugambi, James Nyaga
Impact of Climate Change on Desertification in Arid Areas of Kenya
11th Esri Eastern Africa User Conference (EAUC)
2 – 4 November 2016|Acacia Premier Hotel, Kisumu, Kenya
34/141
Kenya National Action Programme – A framework for combating desertification
Kenya ratified the United Nations Convention to Combat Desertification (UNCCD) on 24 June
1997. UNCCD, adopted on 17 June 1994, is an international legal agreement for action to combat
desertification and mitigate the effect of drought in arid, semi-arid and dry sub-humid zones. One
of the main commitments of the affected and developing country Parties to the Convention is to
develop national action programmes (NAPs), security, and environmental conservation. Therefore
Kenya national action program should:
- Strengthen the knowledge base and developing information and monitoring systems
for regions prone to desertification and drought, including the economic and social aspects of
these ecosystems;
- Combating land degradation through, inter alia, intensified soil conservation, a forestation and
reforestation activities;
- Developing and strengthening integrated development programmes for the eradication of
poverty and promotion of alternative livelihood systems in areas prone to desertification;
- Developing comprehensive anti-desertification programmes and integrating them into
national development plans and national environmental planning;
- Developing comprehensive drought preparedness and drought-relief schemes, such as
early warning systems, for drought-prone areas and designing programmes to cope with
environmental refugees;
- Encouraging and promoting popular participation and environmental education, focusing on
desertification control and management of the effects of climate change.
The WDCD initiative in ASALs of Kenya should support the local communities to adapt and build
resilience by seeking to:
- Increase food security through enhancing the drought resilience of local agricultural practices
- Reduce poverty through diversification of enterprises to improve livelihoods
- Facilitate the integration of adaptation to drought into Kenya’s sustainable development plans
and policies
- Undertake measures to reduce the vulnerability of inhabitants of ASALs to vagaries of drought
- Illustrate how national policies through NAP may be influenced and modified based on lessons
from the field.
Acknowledgement
The authors acknowledge the support from Antonio Trabucco, The Consortium for Spatial
Information (CGIAR-CSI), CEDA and Mr. John Kapoi for their immense contribution towards
achieving this in providing data methodology and input of ideas and support.
References
Dregne, H. E. 1986. Desertification of arid lands. In Physics of desertification, ed. F. El-Baz and
M. H. A. Hassan. Dordrecht, The Netherlands: Martinus, Nijhoff.
Aboukhaled, A., Arar, A., Balba. A.M., Bishay, B.G., Kadry, L.T. Rijtema, P.E., and Taher, A.
(1975) Research on Crop Water Use, Salt Affected Soils and Drainage in the Arab Republic
of Egypt. Near East Regional Office, FAO, Cairo, 92 p.

Natural Resources Track
Solomon M. Mwenda, Alex Mugambi, James Nyaga
Impact of Climate Change on Desertification in Arid Areas of Kenya
11th Esri Eastern Africa User Conference (EAUC)
2 – 4 November 2016|Acacia Premier Hotel, Kisumu, Kenya
35/141
Albareda, J.M. (1955) Influence des changements de la vegetation dans les sols arides. In: Plant
Ecology, Arid Zone Research v, UNESCO, Paris, p. 84-88.
Aubreville, A. (1949) Climats, Forest, et Desertification de l'Afrique Tropicale. Societe de
Editions Geographiques, Maritime et Coloniales, Paris, 255 p.
Ayers, A.D., Vasquez, A., de la Rublia, J., Blasco, F., and Samplon S. (1960) Saline and Sodic
Soils of Spain. Soil Science, v. 90, p. 133-138.
Banco do Nordeste do Brasil (1964) O Nordeste e as Lavouras Xerofilas. Banco do Nordeste do
Brasil, S.A., Departmento de Estudos Economicos do Nordeste, Fortaleza, Ceara, 238 p.
Boggess, W., McGrann, J., Boehlje, M., and Heady, E.O. (1979) Farm Level Impacts of
Alternative Soil Loss Control Practices. Jour. Soil and Water Conservation, v. 34, p. 177-
183.
Cloudsley-Thompson, J.L. (1974) The Expanding Sahara. Environmental Conservation, 1: 5-13.
Comite Peruano de Zonas Aridas (1963) Informe Nacional sobre las Zonas Aridas. Republica del
Peru, Ministerio de Agricultura, Lima, 105 p.
Condon, R.W. (1978) Land Tenure and Desertification in Australia's Arid Lands. Search, v. 9, p.
261-264.
Cooke, R.H. and Reeves, R.W. (1976) Arroyos and Environmental Change in the American
Southwest. Clarendon Press, Oxford, England, 213 p.
de Crespigny, R.R.C. (1971) China. St. Martin's Press, New York, N.Y., 235 p.
Dahl, G. and Hjort, A. (1979) Pastoral Change and the Role of Drought. Swedish Agency for
Research Cooperation with Developing Countries Report R2: 1979, Stockholm, Sweden,
50 p.
Delwaulle, J.C. (1973) Desertification de l'Afrique au sud du Sahara. Bois et Forets des Tropiques,
v. 149, p. 3-20.
Delwaulle, J.C. (1977) La situation forestiere dans le Sahel. Bois et Forests des Tropiques, v. 173,
p. 3-22.
Dougrameji, J.S. and Clor, M.A. (1977) Case Study on Desertification. Greater Mussayeb Project.
Iraq. United Nations Conference on Desertification A/CONF., 74/10, 102 p.
Dregne, H.E. (in press) Historical Perspective of Accelerated Erosion and Effort on World
Cultivation. American Society of Agronomy, Madison, Wisconsin.
General Accounting Office (1977) To Protect Tomorrow's Food Supply Soil Conservation Needs
Priority Attention. Report to the Congress, CED-77-30, Washington, D.C., 59 p.
Jacobsen, T. and Adams, R.M. (1958) Salt and silt in Ancient Mesopotamian agriculture. Science,
v. 128, p. 1251-1258.
Mabbutt, J.A. (1978) Desertification in Australia. Water Research Foundation of Australia Report
No. 54, Kingsford, N.S.W., Australia 132 p.
Matrinez Beltran, J. (1978) Drainage and Reclamation of Salt Affected Soils in the Bardenas area,
Spain. International Institute for Land Reclamation and Improvement Publication No. 24,
Wageningen, The Netherlands, 321 p.
Matheson, W.E. (1978) Soil Loss Made South Australia Come Down to Earth. Journal of Soil
Conservation Service of N.S.W., v. 34, p. 88-100.

Natural Resources Track
Solomon M. Mwenda, Alex Mugambi, James Nyaga
Impact of Climate Change on Desertification in Arid Areas of Kenya
11th Esri Eastern Africa User Conference (EAUC)
2 – 4 November 2016|Acacia Premier Hotel, Kisumu, Kenya
36/141
Newman, J.C. and Condon, R.W. (1969) Land Use and Present Condition. In: R.O. Slayter and
R.A. Perry (Editors), Arid Lands of Australia, Australian National University Press,
Canberra, Australia, p. 105-132.
Northcote, K.H. and Skene, J.K.M. (1972) Australian Soils with Saline and Sodic Properties.
C.S.I.R.O. Soil Publication No. 27, Melbourne, Australia, 62 p.
Office of Environmental Planning and Coordination (1977) Country Report: India. Department of
Science and Technology, Government of India, New Delhi, 71 p.
Pearse, C.K. (1971) Grazing in the Middle East: Past, Present, and Future. Journal of Range
Management, v. 24, p. 13-16.
Pels, S. (1978) Waterlogging and Salinization in Irrigated Semi-arid Regions of NSW. Search, v.
9, p. 273-276.
Prego, A.J., Ruggiero, R.A., Alberti, F.R., and Prohaska, F.J. (1971) Stabilization of Sand Dunes
in the Semiarid Argentine Pampas. In: William J. McGinnies, Bram J. Goldman, and
Patricia Paylore (Editors), Food, Fiber and the Arid Lands, University of Arizona Press,
Tucson, p. 369-392.
Rapp, Anders (1974) A review of Desertification in Africa-- Water, Report No. 1, Stockholm,
Sweden, 77 p.
Soil Research Laboratory Staff (1949) Soil Moisture, Wind Erosion and Fertility of Some
Canadian Prairie Soils. Department of Agriculture Publication 819, Ottawa, Canada, 78 p.
Stebbing, E.P. (1937a) The Encroaching Sahara: The Threat to the West African Colonies. The
Geographical Journal, 86: 506-519.
Stebbing, E.P. (1937b) The Threat of the Sahara. Journal of the Royal African Society. Extra
Supplement to vol. 36, 35 p., May 25, 1937.
Stebbing, E.P. (1938) The Advance of the Desert. The Geographical Journal 91: 356-359.
UNESCO (1977) World Distribution of Arid Regions. Map Scale: 1/25,000,000, UNESCO, Paris.
United Nations (1978) United Nations Conference on Desertification. Round-up, Plan of Action,
and Resolutions, United Nations, New York, 43 p.
Vander Pluym, H.S.A. (1978) Extent, Causes and Control of Dryland Saline Seepage in the
Northern Great Plains Region of North America. In: H.S.A. Vander Pluym (Editor),
Dryland-Saline-Seep Control, Agriculture Center, Lethbridge, Alberta, v. 1, p. 48-58.
Wagner, R. (1978) Soil Conservation in New South Wales, 1938-1978. Journal Soil Conservation
Service of N.S.W., v. 34, p. 124-132.
Weaver, J.E., and Albertson, F.W. (1940) Deterioration of Midwestern Ranges. Ecology, v. 21, p.
216-236.
Widstrand, C.G. (1975) The Rationale of Nomad Economy. Ambio, v. 4, p. 146-153.
United Nations Development Programme (2013) Combating Desertification in Kenya: Emerging
Lessons from Empowering Local Communities. Nairobi
Contacts
[email protected], James Nyaga [email protected] or [email protected].

ArcGIS for Local Government includes a set of free maps, apps, and best practices developed especially for your local government. As an ArcGIS user, you can deploy this ready-to-use solution to improve government operations and enhance citizen services.
ArcGIS forLocal Government

Local Government Track
Charles Kigen, Philip Kisoyan, James Chelang’a
A Village Level GIS-Based County Government and Environmental Risk Management Decision Support System
11th Esri Eastern Africa User Conference (EAUC)
2 – 4 November 2016|Acacia Premier Hotel, Kisumu, Kenya
38/141
A Village Level GIS-Based County Government and Environmental Risk
Management Decision Support System
1*Charles Kigen and 2Philip Kisoyan and 3James Chelang’a 1,3Moi University, Department of Natural Resources, P. O. Box 3900-30100, Eldoret
Email: [email protected]; [email protected] 2Egerton University, P. O. Box 536-20115, Egerton
Email: [email protected] *Corresponding author
Key words: Village-level, geodatabase, decision-making, ALOHA, ArcGIS
Abstract
Kenya’s devolved system of governance lead to devolution of resources and prudent decision
making is key in promoting sustainable development. Resource allocation, risk and environmental
management are some decisions made at the county level with limited information. This paper
seeks to support the decision making process by development of a village level geodatabase
containing infrastructure, and potential hazards within a given area. An area in Western Kenya
was used in the study, data was sourced from google earth and threat levels from chlorine gas
pollution modeled using ALOHA software. The geodatabase was constructed and spatial analyses
run in ArcGIS. These processes were digitization, buffering, distance generation, distance
extraction, intersection and land size estimation. The results generated the number of households
and their proximity to roads, schools, piped water networks, rivers and electricity grid. Further,
the number of households and size of land under different pollution threat levels were generated.
The integration of this information in the decision making process is invaluable in guiding
infrastructure development, classifying the population and land under different levels of threats by
chlorine gas pollution and eases the process of identification of affected individuals and land.

Local Government Track
Charles Kigen, Philip Kisoyan, James Chelang’a
A Village Level GIS-Based County Government and Environmental Risk Management Decision Support System
11th Esri Eastern Africa User Conference (EAUC)
2 – 4 November 2016|Acacia Premier Hotel, Kisumu, Kenya
39/141
Introduction
Decision making is a process of making assessments and conclusions based on certain factors
under consideration among them being limited resources and hazards. The achievement of
sustainable development goals (SDGs) and Kenya’s Vision 2030 is dependent on prudent decision
making. Decisions have been made in many cases using political support leading to uneven
development. Judicious decisions are made if data and the factors to be taken into consideration
are given attention. The advent of Kenya’s decentralized system of governance presented many
uncertainties in carrying out development projects. The county governments have implemented
many projects and established risk management plans for certain emergencies. However, the
projects and prioritization can be improved by collecting baseline information which constitutes
population distribution, infrastructure and potential hazards. This paper examines the potentials of
application of GIS technology to aid decision making at village-level about project prioritization
in terms of available resources but also about the siting and also for emergency planning and
management.
The GIS spatial analysis requires establishment of a geodatabase containing the entire
infrastructure, the potential hazard and their locations. An area in western Kenya, part of Webuye
town was used in the study. The area was picked due to the presence of a pulp paper factor and the
study assumed a scenario where chlorine gas escaped accidentally. The data of interest in the area
included road networks, piped water network, power lines, public schools and the potential risks
of accidental release of chlorine gas modeled using Areal Locations of Hazardous Atmospheres
(ALOHA). ALOHA was used in the Chlorine gas emission modeling because of its compatibility
with ArGIS (Chakraborty and Armstrong, 1994). ALOHA is a free software developed by United
States Environment Protection Agency (EPA) and National Oceanic and Atmospheric
Administration (NOAA). It contains about 1000 database of chemicals that can be released into
the atmosphere through tank explosion, leaking pipes and open containers (EPA and NOAA,
2007). It predicts the direction of these chemicals based on the prevailing weather conditions which
are required to generate the direction and concentrations of any given chemical at a given point in
the area of interest. The ALOHA’s use in the modeling is because it enables chemical plumes
footprints to be exported into ArcGIS platform ((EPA and NOAA, 2007); Chakraborty and
Armstrong, 1994) for integration with other data and further analysis.
Spatial analysis of the data was done against the population distribution of the area. The results
showed the population distribution of the area, the proximity of each household to the
infrastructure and river network, the location and number of households, the size of land under the
different chlorine gas acute exposure guideline levels (AEGLs). Moreover, the population to be
compensated and the size of land to be rehabilitated can be quickly and easily estimated. With
such information and powerful spatial analysis tools, a decision support system can be established
at a village-level to foster even sustainable development for a given area using the open source
software.
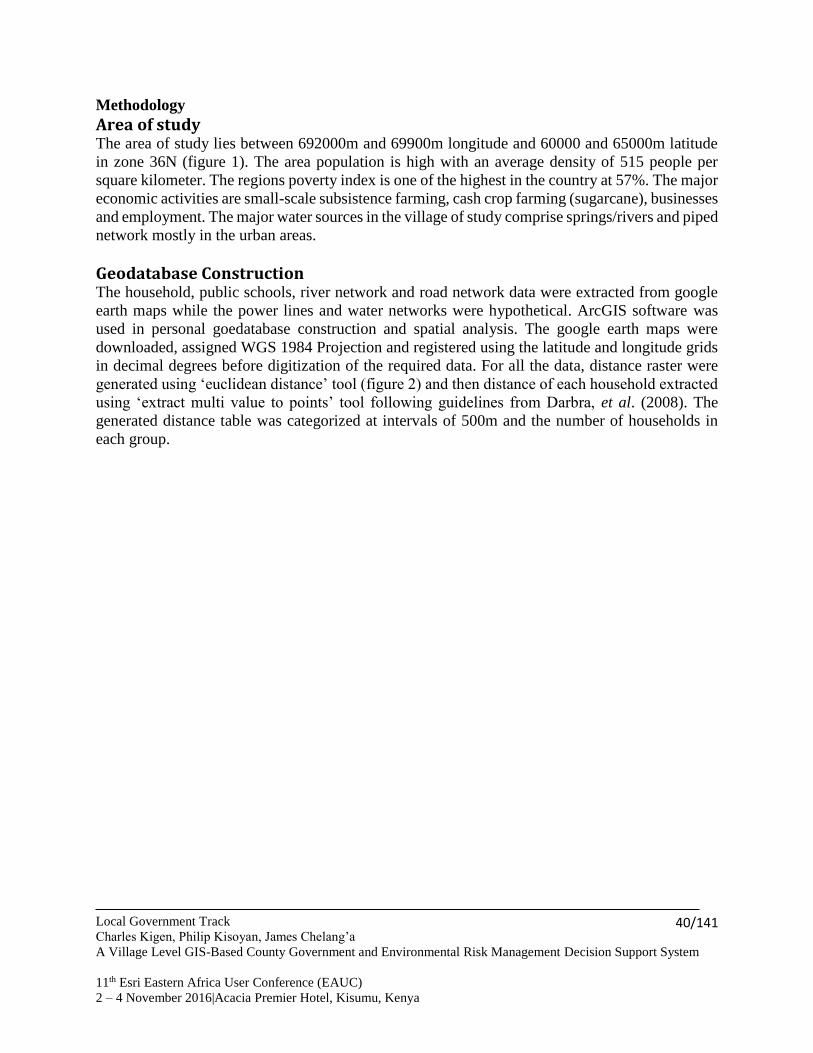
Local Government Track
Charles Kigen, Philip Kisoyan, James Chelang’a
A Village Level GIS-Based County Government and Environmental Risk Management Decision Support System
11th Esri Eastern Africa User Conference (EAUC)
2 – 4 November 2016|Acacia Premier Hotel, Kisumu, Kenya
40/141
Methodology
Area of study The area of study lies between 692000m and 69900m longitude and 60000 and 65000m latitude
in zone 36N (figure 1). The area population is high with an average density of 515 people per
square kilometer. The regions poverty index is one of the highest in the country at 57%. The major
economic activities are small-scale subsistence farming, cash crop farming (sugarcane), businesses
and employment. The major water sources in the village of study comprise springs/rivers and piped
network mostly in the urban areas.
Geodatabase Construction The household, public schools, river network and road network data were extracted from google
earth maps while the power lines and water networks were hypothetical. ArcGIS software was
used in personal goedatabase construction and spatial analysis. The google earth maps were
downloaded, assigned WGS 1984 Projection and registered using the latitude and longitude grids
in decimal degrees before digitization of the required data. For all the data, distance raster were
generated using ‘euclidean distance’ tool (figure 2) and then distance of each household extracted
using ‘extract multi value to points’ tool following guidelines from Darbra, et al. (2008). The
generated distance table was categorized at intervals of 500m and the number of households in
each group.

Local Government Track
Charles Kigen, Philip Kisoyan, James Chelang’a
A Village Level GIS-Based County Government and Environmental Risk Management Decision Support System
11th Esri Eastern Africa User Conference (EAUC)
2 – 4 November 2016|Acacia Premier Hotel, Kisumu, Kenya
41/141
Figure 1: The villages of study close to the Pan paper pulp factory
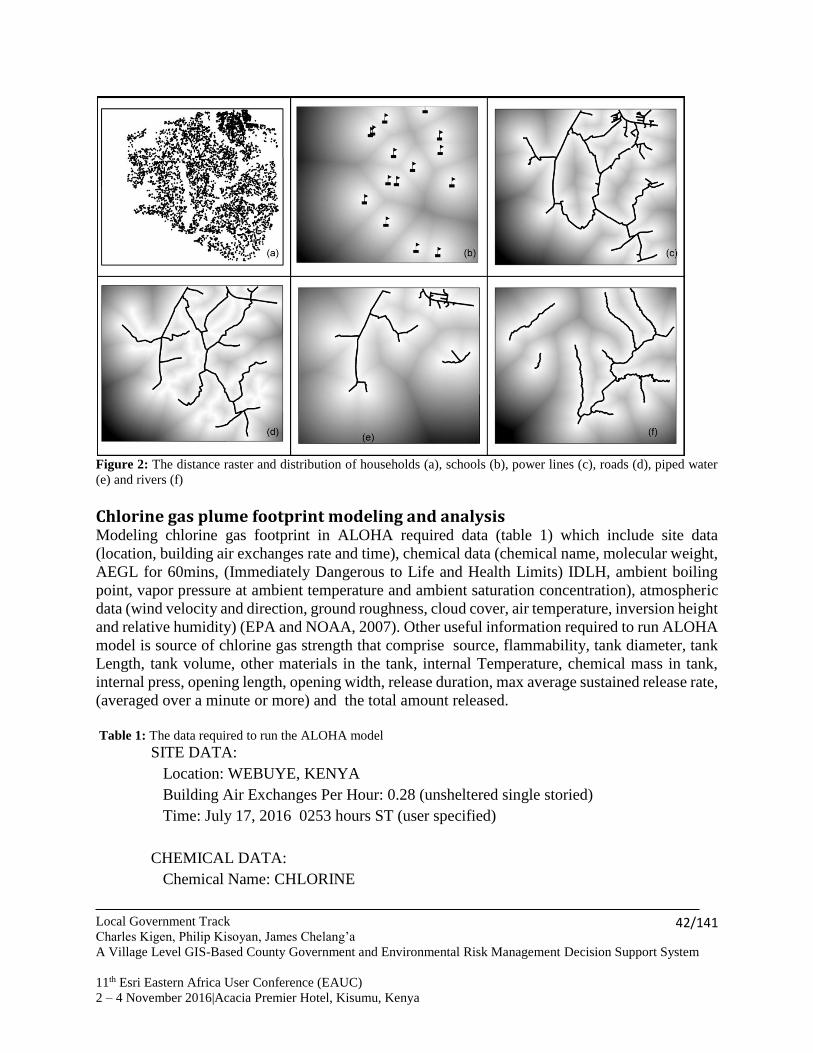
Local Government Track
Charles Kigen, Philip Kisoyan, James Chelang’a
A Village Level GIS-Based County Government and Environmental Risk Management Decision Support System
11th Esri Eastern Africa User Conference (EAUC)
2 – 4 November 2016|Acacia Premier Hotel, Kisumu, Kenya
42/141
Figure 2: The distance raster and distribution of households (a), schools (b), power lines (c), roads (d), piped water
(e) and rivers (f)
Chlorine gas plume footprint modeling and analysis Modeling chlorine gas footprint in ALOHA required data (table 1) which include site data
(location, building air exchanges rate and time), chemical data (chemical name, molecular weight,
AEGL for 60mins, (Immediately Dangerous to Life and Health Limits) IDLH, ambient boiling
point, vapor pressure at ambient temperature and ambient saturation concentration), atmospheric
data (wind velocity and direction, ground roughness, cloud cover, air temperature, inversion height
and relative humidity) (EPA and NOAA, 2007). Other useful information required to run ALOHA
model is source of chlorine gas strength that comprise source, flammability, tank diameter, tank
Length, tank volume, other materials in the tank, internal Temperature, chemical mass in tank,
internal press, opening length, opening width, release duration, max average sustained release rate,
(averaged over a minute or more) and the total amount released.
Table 1: The data required to run the ALOHA model
SITE DATA:
Location: WEBUYE, KENYA
Building Air Exchanges Per Hour: 0.28 (unsheltered single storied)
Time: July 17, 2016 0253 hours ST (user specified)
CHEMICAL DATA:
Chemical Name: CHLORINE
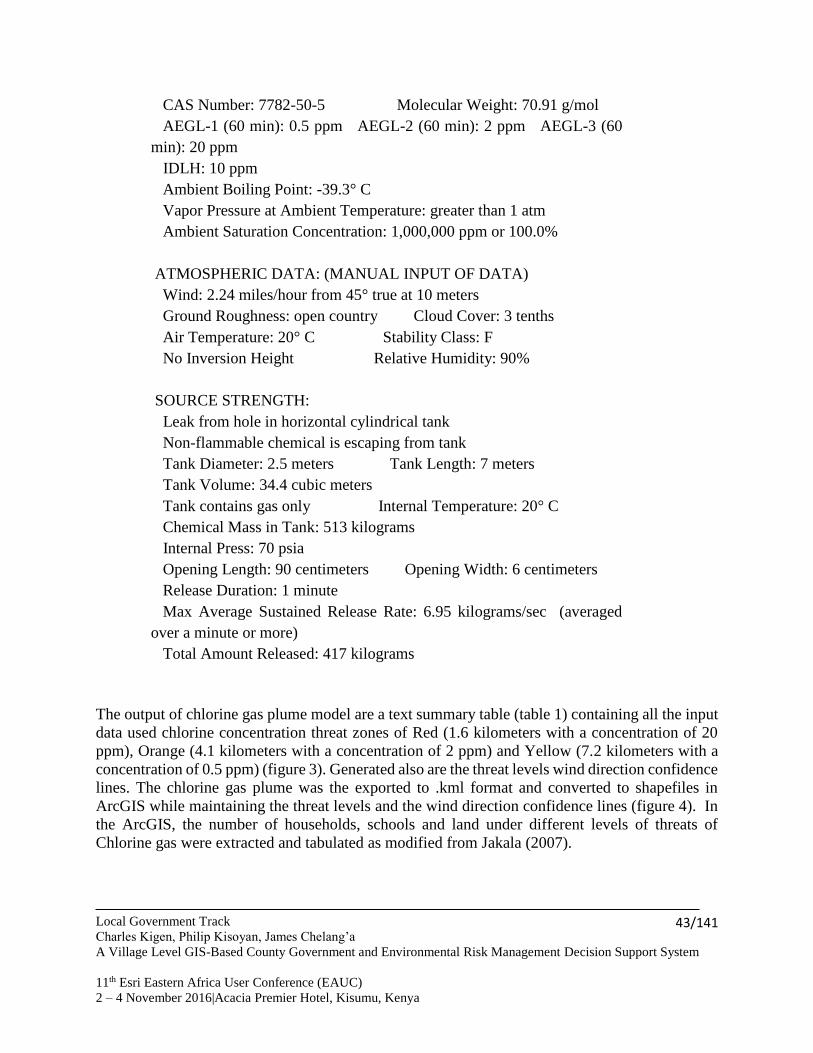
Local Government Track
Charles Kigen, Philip Kisoyan, James Chelang’a
A Village Level GIS-Based County Government and Environmental Risk Management Decision Support System
11th Esri Eastern Africa User Conference (EAUC)
2 – 4 November 2016|Acacia Premier Hotel, Kisumu, Kenya
43/141
CAS Number: 7782-50-5 Molecular Weight: 70.91 g/mol
AEGL-1 (60 min): 0.5 ppm AEGL-2 (60 min): 2 ppm AEGL-3 (60
min): 20 ppm
IDLH: 10 ppm
Ambient Boiling Point: -39.3° C
Vapor Pressure at Ambient Temperature: greater than 1 atm
Ambient Saturation Concentration: 1,000,000 ppm or 100.0%
ATMOSPHERIC DATA: (MANUAL INPUT OF DATA)
Wind: 2.24 miles/hour from 45° true at 10 meters
Ground Roughness: open country Cloud Cover: 3 tenths
Air Temperature: 20° C Stability Class: F
No Inversion Height Relative Humidity: 90%
SOURCE STRENGTH:
Leak from hole in horizontal cylindrical tank
Non-flammable chemical is escaping from tank
Tank Diameter: 2.5 meters Tank Length: 7 meters
Tank Volume: 34.4 cubic meters
Tank contains gas only Internal Temperature: 20° C
Chemical Mass in Tank: 513 kilograms
Internal Press: 70 psia
Opening Length: 90 centimeters Opening Width: 6 centimeters
Release Duration: 1 minute
Max Average Sustained Release Rate: 6.95 kilograms/sec (averaged
over a minute or more)
Total Amount Released: 417 kilograms
The output of chlorine gas plume model are a text summary table (table 1) containing all the input
data used chlorine concentration threat zones of Red (1.6 kilometers with a concentration of 20
ppm), Orange (4.1 kilometers with a concentration of 2 ppm) and Yellow (7.2 kilometers with a
concentration of 0.5 ppm) (figure 3). Generated also are the threat levels wind direction confidence
lines. The chlorine gas plume was the exported to .kml format and converted to shapefiles in
ArcGIS while maintaining the threat levels and the wind direction confidence lines (figure 4). In
the ArcGIS, the number of households, schools and land under different levels of threats of
Chlorine gas were extracted and tabulated as modified from Jakala (2007).

Local Government Track
Charles Kigen, Philip Kisoyan, James Chelang’a
A Village Level GIS-Based County Government and Environmental Risk Management Decision Support System
11th Esri Eastern Africa User Conference (EAUC)
2 – 4 November 2016|Acacia Premier Hotel, Kisumu, Kenya
44/141
Figure 3: Chlorine gas plume ALOHA footprint
Figure 4: Exported ALOHA chlorine gas plume to ArcGIS
Results and Discussion
Household Proximity to infrastructure A total of 5355 households were in the study village distributed as in figure 2 (a). The household
are concentrated more in the northwest section a peri-urban area and decrease away low
concentration in the other areas. The village infrastructure distribution and coverage is not uniform
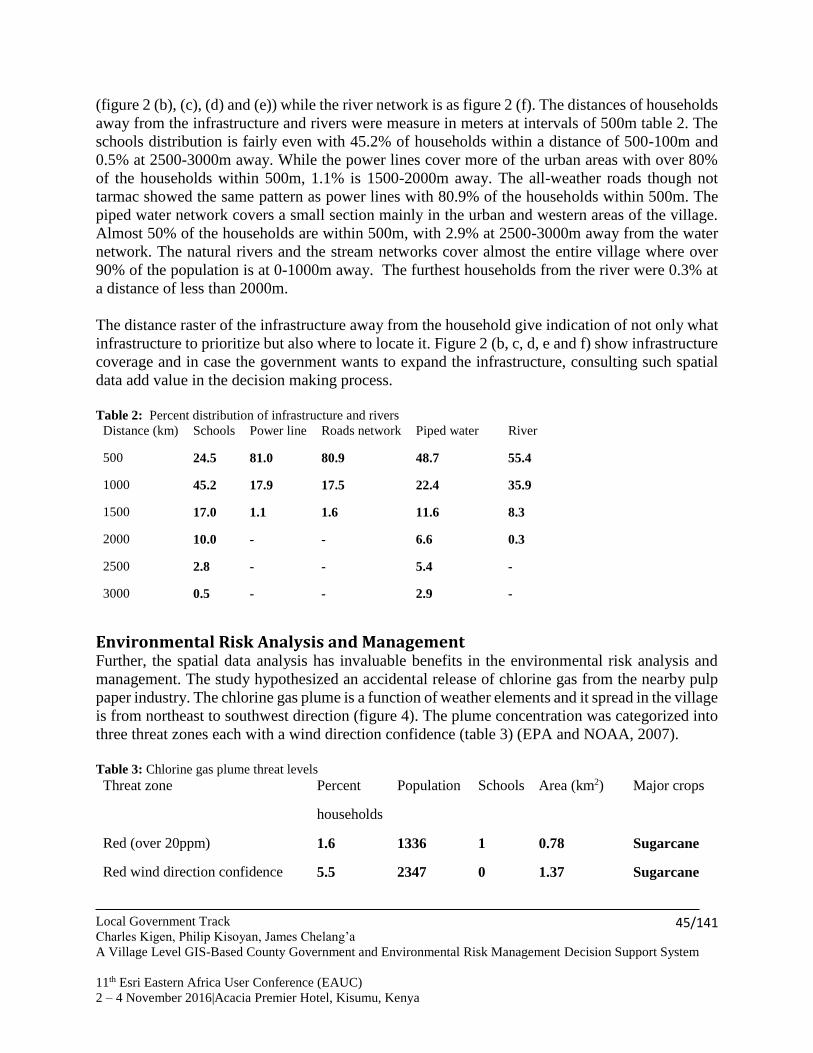
Local Government Track
Charles Kigen, Philip Kisoyan, James Chelang’a
A Village Level GIS-Based County Government and Environmental Risk Management Decision Support System
11th Esri Eastern Africa User Conference (EAUC)
2 – 4 November 2016|Acacia Premier Hotel, Kisumu, Kenya
45/141
(figure 2 (b), (c), (d) and (e)) while the river network is as figure 2 (f). The distances of households
away from the infrastructure and rivers were measure in meters at intervals of 500m table 2. The
schools distribution is fairly even with 45.2% of households within a distance of 500-100m and
0.5% at 2500-3000m away. While the power lines cover more of the urban areas with over 80%
of the households within 500m, 1.1% is 1500-2000m away. The all-weather roads though not
tarmac showed the same pattern as power lines with 80.9% of the households within 500m. The
piped water network covers a small section mainly in the urban and western areas of the village.
Almost 50% of the households are within 500m, with 2.9% at 2500-3000m away from the water
network. The natural rivers and the stream networks cover almost the entire village where over
90% of the population is at 0-1000m away. The furthest households from the river were 0.3% at
a distance of less than 2000m.
The distance raster of the infrastructure away from the household give indication of not only what
infrastructure to prioritize but also where to locate it. Figure 2 (b, c, d, e and f) show infrastructure
coverage and in case the government wants to expand the infrastructure, consulting such spatial
data add value in the decision making process.
Table 2: Percent distribution of infrastructure and rivers
Distance (km) Schools Power line Roads network Piped water River
500 24.5 81.0 80.9 48.7 55.4
1000 45.2 17.9 17.5 22.4 35.9
1500 17.0 1.1 1.6 11.6 8.3
2000 10.0 - - 6.6 0.3
2500 2.8 - - 5.4 -
3000 0.5 - - 2.9 -
Environmental Risk Analysis and Management Further, the spatial data analysis has invaluable benefits in the environmental risk analysis and
management. The study hypothesized an accidental release of chlorine gas from the nearby pulp
paper industry. The chlorine gas plume is a function of weather elements and it spread in the village
is from northeast to southwest direction (figure 4). The plume concentration was categorized into
three threat zones each with a wind direction confidence (table 3) (EPA and NOAA, 2007).
Table 3: Chlorine gas plume threat levels
Threat zone Percent
households
Population
Schools
Area (km2) Major crops
Red (over 20ppm) 1.6 1336 1 0.78 Sugarcane
Red wind direction confidence 5.5 2347 0 1.37 Sugarcane
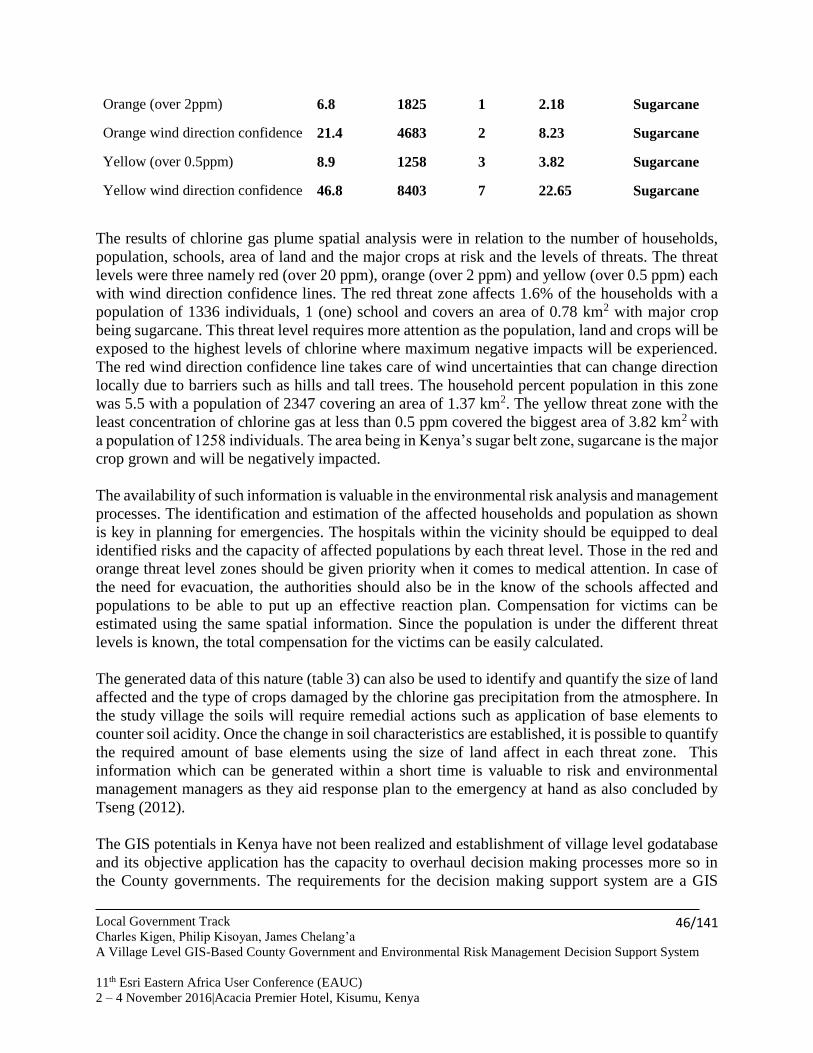
Local Government Track
Charles Kigen, Philip Kisoyan, James Chelang’a
A Village Level GIS-Based County Government and Environmental Risk Management Decision Support System
11th Esri Eastern Africa User Conference (EAUC)
2 – 4 November 2016|Acacia Premier Hotel, Kisumu, Kenya
46/141
Orange (over 2ppm) 6.8 1825 1 2.18 Sugarcane
Orange wind direction confidence 21.4 4683 2 8.23 Sugarcane
Yellow (over 0.5ppm) 8.9 1258 3 3.82 Sugarcane
Yellow wind direction confidence 46.8 8403 7 22.65 Sugarcane
The results of chlorine gas plume spatial analysis were in relation to the number of households,
population, schools, area of land and the major crops at risk and the levels of threats. The threat
levels were three namely red (over 20 ppm), orange (over 2 ppm) and yellow (over 0.5 ppm) each
with wind direction confidence lines. The red threat zone affects 1.6% of the households with a
population of 1336 individuals, 1 (one) school and covers an area of 0.78 km2 with major crop
being sugarcane. This threat level requires more attention as the population, land and crops will be
exposed to the highest levels of chlorine where maximum negative impacts will be experienced.
The red wind direction confidence line takes care of wind uncertainties that can change direction
locally due to barriers such as hills and tall trees. The household percent population in this zone
was 5.5 with a population of 2347 covering an area of 1.37 km2. The yellow threat zone with the
least concentration of chlorine gas at less than 0.5 ppm covered the biggest area of 3.82 km2 with
a population of 1258 individuals. The area being in Kenya’s sugar belt zone, sugarcane is the major
crop grown and will be negatively impacted.
The availability of such information is valuable in the environmental risk analysis and management
processes. The identification and estimation of the affected households and population as shown
is key in planning for emergencies. The hospitals within the vicinity should be equipped to deal
identified risks and the capacity of affected populations by each threat level. Those in the red and
orange threat level zones should be given priority when it comes to medical attention. In case of
the need for evacuation, the authorities should also be in the know of the schools affected and
populations to be able to put up an effective reaction plan. Compensation for victims can be
estimated using the same spatial information. Since the population is under the different threat
levels is known, the total compensation for the victims can be easily calculated.
The generated data of this nature (table 3) can also be used to identify and quantify the size of land
affected and the type of crops damaged by the chlorine gas precipitation from the atmosphere. In
the study village the soils will require remedial actions such as application of base elements to
counter soil acidity. Once the change in soil characteristics are established, it is possible to quantify
the required amount of base elements using the size of land affect in each threat zone. This
information which can be generated within a short time is valuable to risk and environmental
management managers as they aid response plan to the emergency at hand as also concluded by
Tseng (2012).
The GIS potentials in Kenya have not been realized and establishment of village level godatabase
and its objective application has the capacity to overhaul decision making processes more so in
the County governments. The requirements for the decision making support system are a GIS
Local Government Track
Charles Kigen, Philip Kisoyan, James Chelang’a
A Village Level GIS-Based County Government and Environmental Risk Management Decision Support System
11th Esri Eastern Africa User Conference (EAUC)
2 – 4 November 2016|Acacia Premier Hotel, Kisumu, Kenya
47/141
platform, air pollution modeling software which are freely available for use and skilled person in
GIS.
Conclusion and Recommendations
Spatial planners and environmental risk and management planners are yet to realize the benefits
of using Geographic Information Systems for visualization of information and as an important
planning tool. The establishment and use of a geodatabase in combination air pollution modeling
software will be an invaluable resource for planning and responding air pollution scenarios. The
tools can also be used in impact analysis stage in the environmental impact assessment process
and guide on the expected scope of the impacts. However, there are issues with model validation
that needs to be addressed especially in hilly areas and when the wind velocity is very low. The
study has demonstrated usefulness of a village level goedatabse and recommends its establishment
by the county governments.
Reference
Chakraborty, J. and Armstrong, M. 1994. Estimating the Population Characteristics of Areas
Affected by Hazardous Materials Accidents. GIS- LIS. Pp. 154-163. Retrieved February
10, 2007 from EBSCO database.
Darbra, R.M., Demichela, M. and Murè, S., (2008). Preliminary risk assessment of ecotoxic
substances accidental releases in major risk installations through fuzzy logic. Process Saf.
Environ. Prot., 86, pp. 103-111.
Environmental Protection Agency and National Oceanic and Atmospheric Administration (2007)
ALOHA User’s Manual. Washington D.C. Seattle, WA.
Jakala, S. D. (2007). A GIS Enabled Air Dispersion Modeling Tool for Emergency Management.
Volume 9, Papers in Resource Analysis. 20pp. Saint Mary’s University of Minnesota
Central Services Press. Winona, MN. Retrieved on 4th September 2016 from
http:/www.gis.smumn.edu
Tseng, J.M., T.S. Su, C.Y. Kuo (2012) Consequence Evaluation of Toxic Chemical Releases by
ALOHA. International Symposium on Safety Science and Technology Procedia
Engineering 2012, Vol.45:384–389, doi:10.1016/j.proeng.2012.08.175,
Local Government Track
Mike Yedgo
GIS Based Modeling to Assess Pollution Vulnerability to Groundwater in the Vicinity of Solid Waste Disposal Site:
A Case Study of Pugu Kinyamwezi Dumpsite in Dar Es Salaam, Tanzania
11th Esri Eastern Africa User Conference (EAUC)
2 – 4 November 2016|Acacia Premier Hotel, Kisumu, Kenya
48/141
GIS Based Modeling to Assess Pollution Vulnerability to Groundwater in the
Vicinity of Solid Waste Disposal Site: A Case Study of Pugu Kinyamwezi
Dumpsite in Dar Es Salaam, Tanzania
Mike Yedgo, Tanzania
Abstract The study uses GIS based modeling in assessing pollution vulnerability of groundwater in the vicinity of
solid waste disposal sites. Heavy Metal contamination of the groundwater inside and around the Pugu
Kinyamwezi dumpsite was assessed; pollution modeling using shallow water wells, and populations at risk
were assessed, as was future water demand. Water from about 12 shallow wells was taken for testing.
According to the WHO, the Maximum Contaminant Levels (MCL) for Copper, Lead, chromium Zinc and
Cadmium were 1.5, 0.01, 0.08, 3 and 0.003mg/L respectively.
Results obtained from the laboratory were used as a benchmark in finalizing the model. Pollution modeling
was carried out through the construction of a water table contour map. In this case, a shallow well was
measured in height using ropes during morning hours, instead of digging a shallow well to reach the point
of water seep. Therefore measurements were taken before any disturbance of the shallow well. In modeling
of spatial distribution of pollutants in the case study, a water table contour, which is useful in predicting
groundwater flow, was used ARCGIS 9.3 in developing water table contour. The output flow direction
indicated groundwater flows were east and south east of the case study area. Leachate
distribution/movement underground was successfully presented using ArchiCAD 15.
The model developed paves the way for effective action before conditions worsen. Continuous consumption
of shallow well water for drinking purposes results in waterborne related health problems and other
problems due to heavy metal contamination.
Heavy saturation of the soil in the disposal site would also increase transportation of groundwater
pollutants. Bacterial contribution, present in the moisture in the disposal site, would increase leachate
production that would be transported by the groundwater in the modeled site.
Local Government Track
Mike Yedgo
GIS Based Modeling to Assess Pollution Vulnerability to Groundwater in the Vicinity of Solid Waste Disposal Site:
A Case Study of Pugu Kinyamwezi Dumpsite in Dar Es Salaam, Tanzania
11th Esri Eastern Africa User Conference (EAUC)
2 – 4 November 2016|Acacia Premier Hotel, Kisumu, Kenya
49/141
Introduction Dar es Salaam city consists of three municipal authorities: Temeke, Ilala and Kinondoni. Each disposes of
waste at the Pugu Kinyamwezi dumping site. Observation shows that the equipment used includes truck
loaders, tractors and others.
In Dar es Salaam today, groundwater has become one source of water supply because the government is
unable to meet the ever increasing water demand. Thus, inhabitants have had to look for alternative
groundwater sources such as shallow wells and boreholes. The quality of these groundwater sources is
affected by the characteristics of the media through which the water passes on its way to the groundwater
zone of saturation; thus, the heavy metals discharged by industries, traffic, municipal wastes, hazardous
waste sites, as well as from fertilizers for agricultural purposes and accidental oil spillages from tankers,
can result in a steady rise in contamination of ground water (Igwilo et al., 2006).
Open dumping and non-engineered disposal sites in Pugu ward portray negative attitude for the population
in the area. Leachate development and seepage to groundwater is inevitable in the site, which experiences
average annual rainfall of 1300 mm. Moreover, groundwater movement is inevitable, thus actual
transportation of pollutants is also inevitable in the soil and groundwater. Emphasis should be placed on
raising awareness to prevent people from contracting illnesses associated with contaminated water.
The quality of water is affected by the quality of groundwater entering the system of water supply in the
borehole (Shwille, 2000). This is because the water table elevation is approximately the same as the gaining
borehole surface elevation; both elevations may be used to construct water table maps (contour) and to
predict groundwater flow direction.
Mapping and Site Characterizations of Existing Situation
Location Pugu Kinyamwezi dumpsite, located in Pugu ward, Ilala Municipality (see Figure 1), is the current main
dumping site for most solid wastes in Dar es Salaam city. The rapid population increase is influenced by
both natural causes and immigration (birth rates and net immigration rates respectively). Pugu ward has an
estimated population of 49,422, of which 24,159 are males and 25,263 are females. The Average Household
Size is 4.2, according to the national census of 2012.
Description of Pugu dumpsite Pugu ward experiences a modified type of equatorial climate. It is generally hot and humid throughout the
year, with an average temperature of 28oC. The hottest season is from October to March, while it is
relatively cool between May and August.
Currently, the Pugu dumpsite operates as an open dumpsite, receiving waste from different areas of Dar es
Salaam city, namely, Temeke, Ilala and Kinondoni municipalities, with extreme lack of: designed cells; full
leachate management; full landfill gas management; daily soil cover; a final soil cover and a compaction
process; a fence with a gate; daily record of volume, type, and source of waste; and a waste scavenging
plan.
The dumpsite is approximately 20 km from the city centre and lies at latitude 6° 51' 41" S and longitude
39° 07' 02" E. It covers an area of approximately 75 hectares. The site was previously used as a sand quarry
and then afterward turned into waste disposal site, which has been in operation since 2007 after the closure
of another dumpsite, namely Mtoni.( ERC, 2004).

Local Government Track
Mike Yedgo
GIS Based Modeling to Assess Pollution Vulnerability to Groundwater in the Vicinity of Solid Waste Disposal Site:
A Case Study of Pugu Kinyamwezi Dumpsite in Dar Es Salaam, Tanzania
11th Esri Eastern Africa User Conference (EAUC)
2 – 4 November 2016|Acacia Premier Hotel, Kisumu, Kenya
50/141
The site receives solid wastes containing both industrial, agricultural, domestic, commercial, institutional,
medical and other special wastes (yard wastes, batteries and electronic). Since the site indicates no control
of waste moisture content, waste decomposition in the site is inevitable (Valencia et al. 2009).
The temperature is around 23ºC. There are two rain seasons: the short rains from October to December and
the long rain season between March and May. The average annual rainfall is 1300 mm.
Water supply The source of water supply in Pugu ward is groundwater – shallow wells, deep wells (boreholes), and both
individual and government owned water wells. Fresh water from shallow wells observed in the case study
is used for drinking purposes and for other domestic use.
Social services Social services include education, safe and clean water, health (health centers both private and public owned
by individuals) and energy distribution (different sources of energy, such as electricity, kerosene, charcoal,
firewood, solar, etc.), transportation infrastructure such as main roads, railways, etc.
Existing land use patterns Land units in Pugu ward hamlets are characterized by weathered slopes and are well drained with
unconsolidated clay-bond sands. An occasional outcrop of raised coral limestone also occurs inthe area.
Furthermore the dumpsite is characterized by formation of leachate that seeps in the soil. This also plays a
significant role in altering the geographical condition of the surrounding area for residents of Pugu.
Economic Activities Trade and agriculture are the most important economic activities in the area. Trade is mainly limited to
small scale petty traders in the informal sectors of the ward’s population. Small shops and market stands
are a common sight and ensure the distribution of consumer goods to all the sub-villages in the area.
Hydrological conditions The uppermost water-bearing unit in the study area is the unconfined aquifer, which consists primarily of
unconsolidated materials. The unconfined aquifer is shallow in the south-western part with an average
thickness of 10 m and deep in the eastern part of the study area, with a thickness of up to 50 m. The lower
aquifer system is under semi-confined conditions in unconsolidated sediments. It is considered as a
Pleistocene to Recent deposit and has an average thickness of 100 m. The semi-confined aquifer overlays
the base of the groundwater reservoir, formed by an aquifer of a thickness of about 1000 m in the Mio-
Pliocene clay-bound sands. The figure below presents the features of the hydrological condition of Pugu
areas (Mjemah, 2012b).
The compacted layers of aquitards (clay, silt or rock) in the case study play significant roles in retarding
water flow underground; that is, they act as a barrier for groundwater - they form a body of material with
very low permeability. Aquitards separate aquifers and partially disconnect the flow of water underground.
The space is mainly dominated by a seasonal water table. During the dry season, some of the existing
shallow wells become dry, between 10 and 15 m deep. Deep water in the Pugu ward exists at not less than
80 m. The water at this depth is mainly dominated by saline and is used for domestic purposes such as
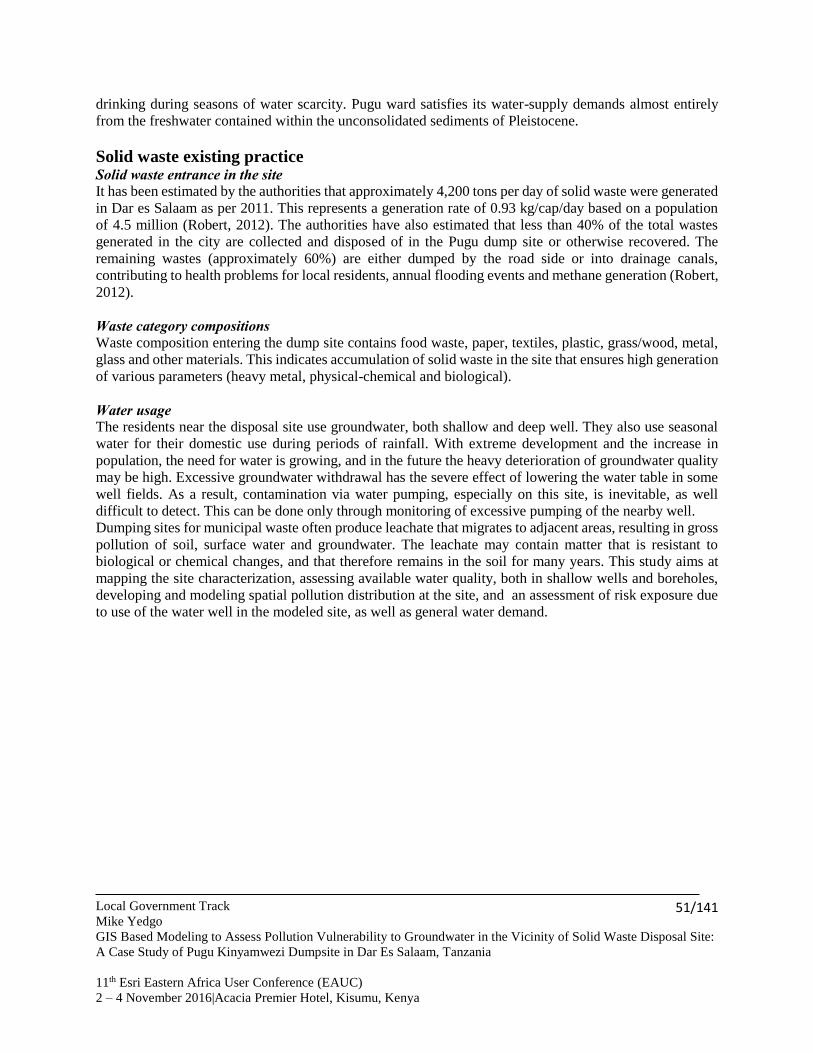
Local Government Track
Mike Yedgo
GIS Based Modeling to Assess Pollution Vulnerability to Groundwater in the Vicinity of Solid Waste Disposal Site:
A Case Study of Pugu Kinyamwezi Dumpsite in Dar Es Salaam, Tanzania
11th Esri Eastern Africa User Conference (EAUC)
2 – 4 November 2016|Acacia Premier Hotel, Kisumu, Kenya
51/141
drinking during seasons of water scarcity. Pugu ward satisfies its water-supply demands almost entirely
from the freshwater contained within the unconsolidated sediments of Pleistocene.
Solid waste existing practice Solid waste entrance in the site It has been estimated by the authorities that approximately 4,200 tons per day of solid waste were generated
in Dar es Salaam as per 2011. This represents a generation rate of 0.93 kg/cap/day based on a population
of 4.5 million (Robert, 2012). The authorities have also estimated that less than 40% of the total wastes
generated in the city are collected and disposed of in the Pugu dump site or otherwise recovered. The
remaining wastes (approximately 60%) are either dumped by the road side or into drainage canals,
contributing to health problems for local residents, annual flooding events and methane generation (Robert,
2012).
Waste category compositions Waste composition entering the dump site contains food waste, paper, textiles, plastic, grass/wood, metal,
glass and other materials. This indicates accumulation of solid waste in the site that ensures high generation
of various parameters (heavy metal, physical-chemical and biological).
Water usage The residents near the disposal site use groundwater, both shallow and deep well. They also use seasonal
water for their domestic use during periods of rainfall. With extreme development and the increase in
population, the need for water is growing, and in the future the heavy deterioration of groundwater quality
may be high. Excessive groundwater withdrawal has the severe effect of lowering the water table in some
well fields. As a result, contamination via water pumping, especially on this site, is inevitable, as well
difficult to detect. This can be done only through monitoring of excessive pumping of the nearby well.
Dumping sites for municipal waste often produce leachate that migrates to adjacent areas, resulting in gross
pollution of soil, surface water and groundwater. The leachate may contain matter that is resistant to
biological or chemical changes, and that therefore remains in the soil for many years. This study aims at
mapping the site characterization, assessing available water quality, both in shallow wells and boreholes,
developing and modeling spatial pollution distribution at the site, and an assessment of risk exposure due
to use of the water well in the modeled site, as well as general water demand.
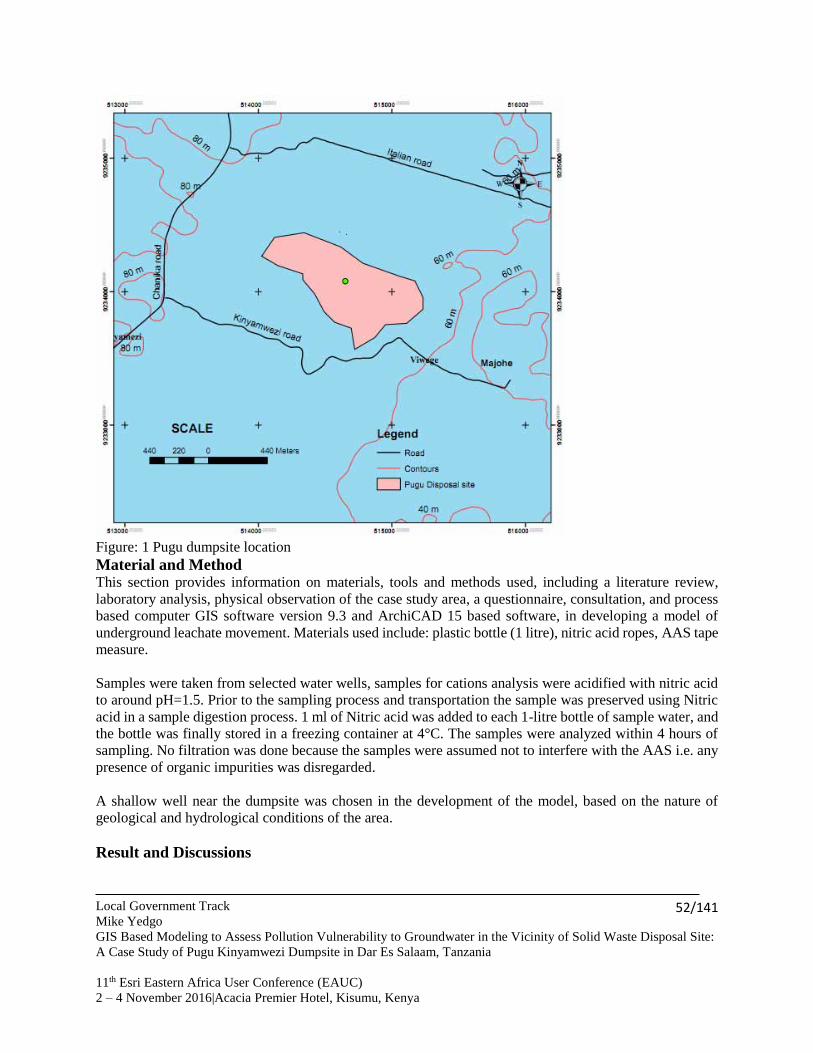
Local Government Track
Mike Yedgo
GIS Based Modeling to Assess Pollution Vulnerability to Groundwater in the Vicinity of Solid Waste Disposal Site:
A Case Study of Pugu Kinyamwezi Dumpsite in Dar Es Salaam, Tanzania
11th Esri Eastern Africa User Conference (EAUC)
2 – 4 November 2016|Acacia Premier Hotel, Kisumu, Kenya
52/141
Figure: 1 Pugu dumpsite location
Material and Method This section provides information on materials, tools and methods used, including a literature review,
laboratory analysis, physical observation of the case study area, a questionnaire, consultation, and process
based computer GIS software version 9.3 and ArchiCAD 15 based software, in developing a model of
underground leachate movement. Materials used include: plastic bottle (1 litre), nitric acid ropes, AAS tape
measure.
Samples were taken from selected water wells, samples for cations analysis were acidified with nitric acid
to around pH=1.5. Prior to the sampling process and transportation the sample was preserved using Nitric
acid in a sample digestion process. 1 ml of Nitric acid was added to each 1-litre bottle of sample water, and
the bottle was finally stored in a freezing container at 4°C. The samples were analyzed within 4 hours of
sampling. No filtration was done because the samples were assumed not to interfere with the AAS i.e. any
presence of organic impurities was disregarded.
A shallow well near the dumpsite was chosen in the development of the model, based on the nature of
geological and hydrological conditions of the area.
Result and Discussions
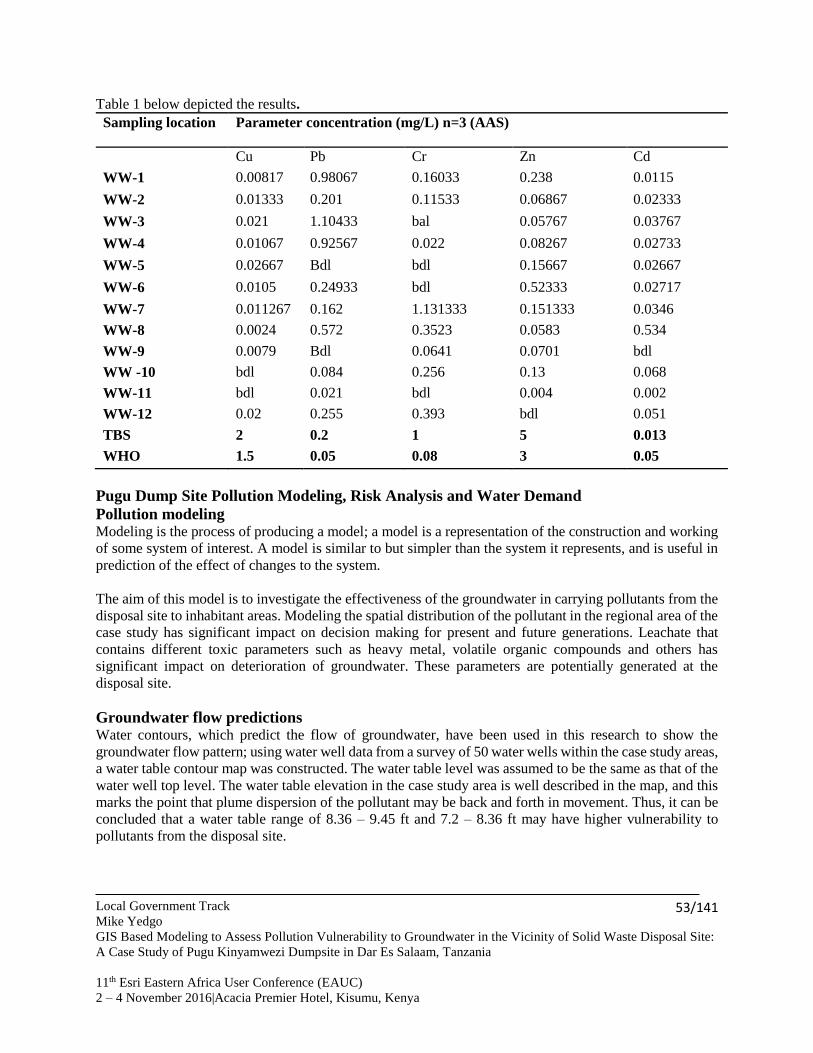
Local Government Track
Mike Yedgo
GIS Based Modeling to Assess Pollution Vulnerability to Groundwater in the Vicinity of Solid Waste Disposal Site:
A Case Study of Pugu Kinyamwezi Dumpsite in Dar Es Salaam, Tanzania
11th Esri Eastern Africa User Conference (EAUC)
2 – 4 November 2016|Acacia Premier Hotel, Kisumu, Kenya
53/141
Table 1 below depicted the results.
Sampling location Parameter concentration (mg/L) n=3 (AAS)
Cu Pb Cr Zn Cd
WW-1 0.00817 0.98067 0.16033 0.238 0.0115
WW-2 0.01333 0.201 0.11533 0.06867 0.02333
WW-3 0.021 1.10433 bal 0.05767 0.03767
WW-4 0.01067 0.92567 0.022 0.08267 0.02733
WW-5 0.02667 Bdl bdl 0.15667 0.02667
WW-6 0.0105 0.24933 bdl 0.52333 0.02717
WW-7 0.011267 0.162 1.131333 0.151333 0.0346
WW-8 0.0024 0.572 0.3523 0.0583 0.534
WW-9 0.0079 Bdl 0.0641 0.0701 bdl
WW -10 bdl 0.084 0.256 0.13 0.068
WW-11 bdl 0.021 bdl 0.004 0.002
WW-12 0.02 0.255 0.393 bdl 0.051
TBS 2 0.2 1 5 0.013
WHO 1.5 0.05 0.08 3 0.05
Pugu Dump Site Pollution Modeling, Risk Analysis and Water Demand
Pollution modeling Modeling is the process of producing a model; a model is a representation of the construction and working
of some system of interest. A model is similar to but simpler than the system it represents, and is useful in
prediction of the effect of changes to the system.
The aim of this model is to investigate the effectiveness of the groundwater in carrying pollutants from the
disposal site to inhabitant areas. Modeling the spatial distribution of the pollutant in the regional area of the
case study has significant impact on decision making for present and future generations. Leachate that
contains different toxic parameters such as heavy metal, volatile organic compounds and others has
significant impact on deterioration of groundwater. These parameters are potentially generated at the
disposal site.
Groundwater flow predictions Water contours, which predict the flow of groundwater, have been used in this research to show the
groundwater flow pattern; using water well data from a survey of 50 water wells within the case study areas,
a water table contour map was constructed. The water table level was assumed to be the same as that of the
water well top level. The water table elevation in the case study area is well described in the map, and this
marks the point that plume dispersion of the pollutant may be back and forth in movement. Thus, it can be
concluded that a water table range of 8.36 – 9.45 ft and 7.2 – 8.36 ft may have higher vulnerability to
pollutants from the disposal site.
Local Government Track
Mike Yedgo
GIS Based Modeling to Assess Pollution Vulnerability to Groundwater in the Vicinity of Solid Waste Disposal Site:
A Case Study of Pugu Kinyamwezi Dumpsite in Dar Es Salaam, Tanzania
11th Esri Eastern Africa User Conference (EAUC)
2 – 4 November 2016|Acacia Premier Hotel, Kisumu, Kenya
54/141
Modeling analysis and assumptions A large portion of the areas surrounding the disposal site was found to be dominated by sand soil. Different
studies indicate that the average groundwater flow in sand soil is 0.24384 to 0.70104 m/day. Based on
analysis performed on heavy metal in the case study, with reference to the operational phase of the disposal
site (2007- 2014), maximum concentration of the water well in the sampling point was a result of 7 years.
Modeling of pollutants for the next seven years (2014-2021) was important to knowing the safeness of the
water for the future generation. Future distance dispersion was computed using an average flow velocity of
0.24384 m/day for groundwater in sand soil.
The estimated rate of ground-water flow through the sand and gravel is 0.8 to 2.3 ft/d. This estimate was
obtained from Darcy’s law (LeBlanc and Guswa, 1977)
V= K(dh/dl) / n
Where
v = average velocity, K = hydraulic conductivity, dh/dl = hydraulic gradient (change in water-table altitude
with distance), and n = effective porosity
Using the values of hydraulic conductivity and the water-table slope given above, and assuming an effective
porosity of 0.20 to 0.40 for sand and gravel,
V= (200 to 300 ft/d)(8 ft/5280 ft) = 0.8 to 2 .3 ft/d .
0.20 to 0.40
The average velocity of groundwater in the fine to very fine sand and silt, and the sandy till is lower
than the velocity in the sand and gravel because the hydraulic conductivity of the fine-grained sediments
is much lower than the hydraulic conductivity of the sand and gravel.
Modeling development, assumption and Output Under certain environmental conditions, disposal sites are susceptible to pollutant dispersion in many ways,
as the result of extreme continuous decomposition of solid waste. At the Pugu Kinyamwezi disposal site,
which is an open and uncontrolled dumping system, different receptors such as air, surface water, soil and
groundwater are exoposed to various output products. Interaction with both surface water and ground water
results in deterioration of groundwater quality, in hand with water exploitation through water pumping.
Modeling made different factors constant in order to successfully display pollutant migration in the
groundwater in the sand soil, which was found to be the most significant in posing environmental problems.
An estimation of pollutant migration from Pugu dumpsite towards residential areas was developed under
the following assumptions
Initial concentration of pollutants in the case study before disposal of solid waste disposal site was
assumed to be below detection limit
Only the advection process will take place in this model (groundwater will be moving relative with the
pollutant from the disposal site), and other factors are minor
Laboratory analysis performed from various sampling points in the case study was used as the initial
concentration for developing model table 4.1
Water and pollutant movement in the subsurface behave with the same properties of flow, with an
average velocity of 0.24384 m/day for sand soil, which is the predominant type in the case study.
The existence of a very low steep slope, with relative uniform structure in the region, comprised of sand
soil, while the layer beneath the sand soil was assumed to contain material of aquitard which does not
easily allow water flow. Thus down seepage of leachate in the area was disregarded.
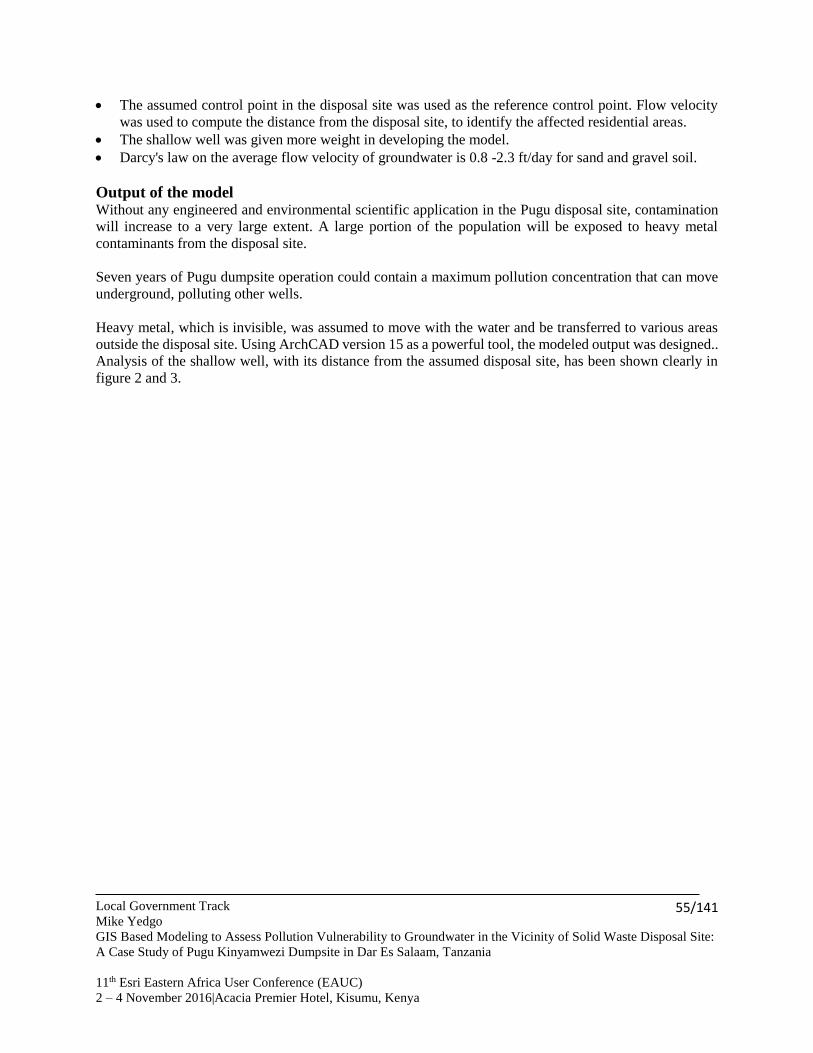
Local Government Track
Mike Yedgo
GIS Based Modeling to Assess Pollution Vulnerability to Groundwater in the Vicinity of Solid Waste Disposal Site:
A Case Study of Pugu Kinyamwezi Dumpsite in Dar Es Salaam, Tanzania
11th Esri Eastern Africa User Conference (EAUC)
2 – 4 November 2016|Acacia Premier Hotel, Kisumu, Kenya
55/141
The assumed control point in the disposal site was used as the reference control point. Flow velocity
was used to compute the distance from the disposal site, to identify the affected residential areas.
The shallow well was given more weight in developing the model.
Darcy's law on the average flow velocity of groundwater is 0.8 -2.3 ft/day for sand and gravel soil.
Output of the model Without any engineered and environmental scientific application in the Pugu disposal site, contamination
will increase to a very large extent. A large portion of the population will be exposed to heavy metal
contaminants from the disposal site.
Seven years of Pugu dumpsite operation could contain a maximum pollution concentration that can move
underground, polluting other wells.
Heavy metal, which is invisible, was assumed to move with the water and be transferred to various areas
outside the disposal site. Using ArchCAD version 15 as a powerful tool, the modeled output was designed..
Analysis of the shallow well, with its distance from the assumed disposal site, has been shown clearly in
figure 2 and 3.
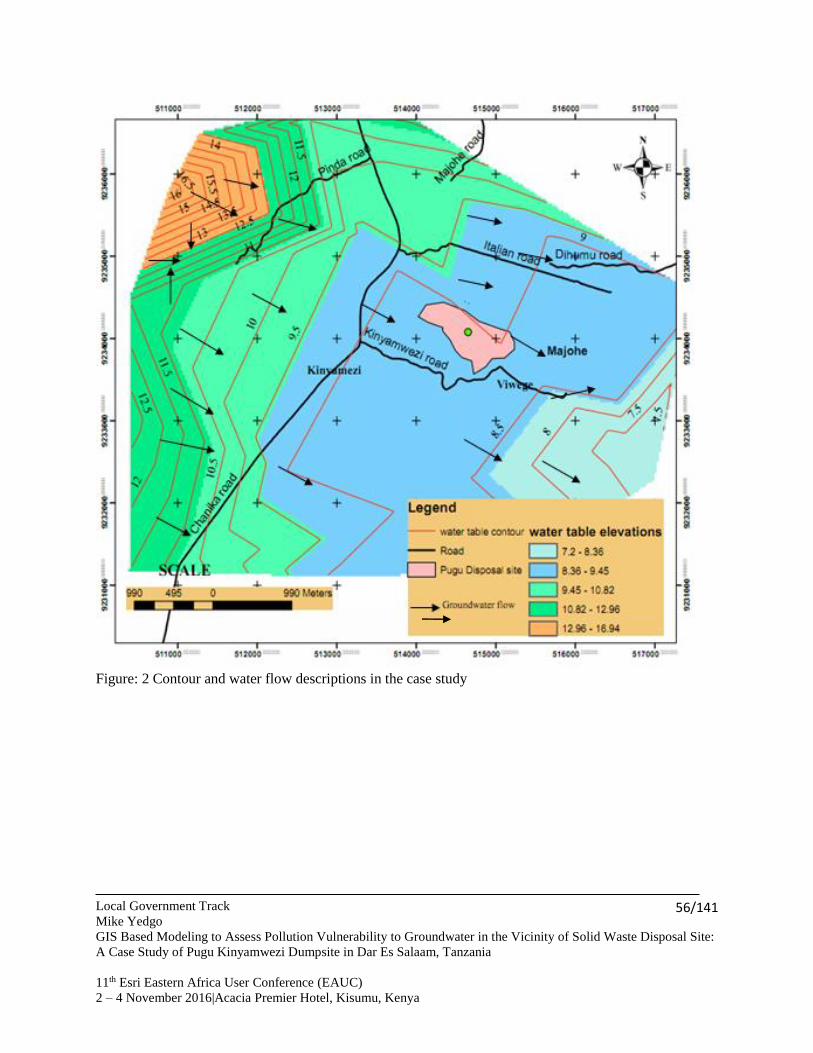
Local Government Track
Mike Yedgo
GIS Based Modeling to Assess Pollution Vulnerability to Groundwater in the Vicinity of Solid Waste Disposal Site:
A Case Study of Pugu Kinyamwezi Dumpsite in Dar Es Salaam, Tanzania
11th Esri Eastern Africa User Conference (EAUC)
2 – 4 November 2016|Acacia Premier Hotel, Kisumu, Kenya
56/141
Figure: 2 Contour and water flow descriptions in the case study
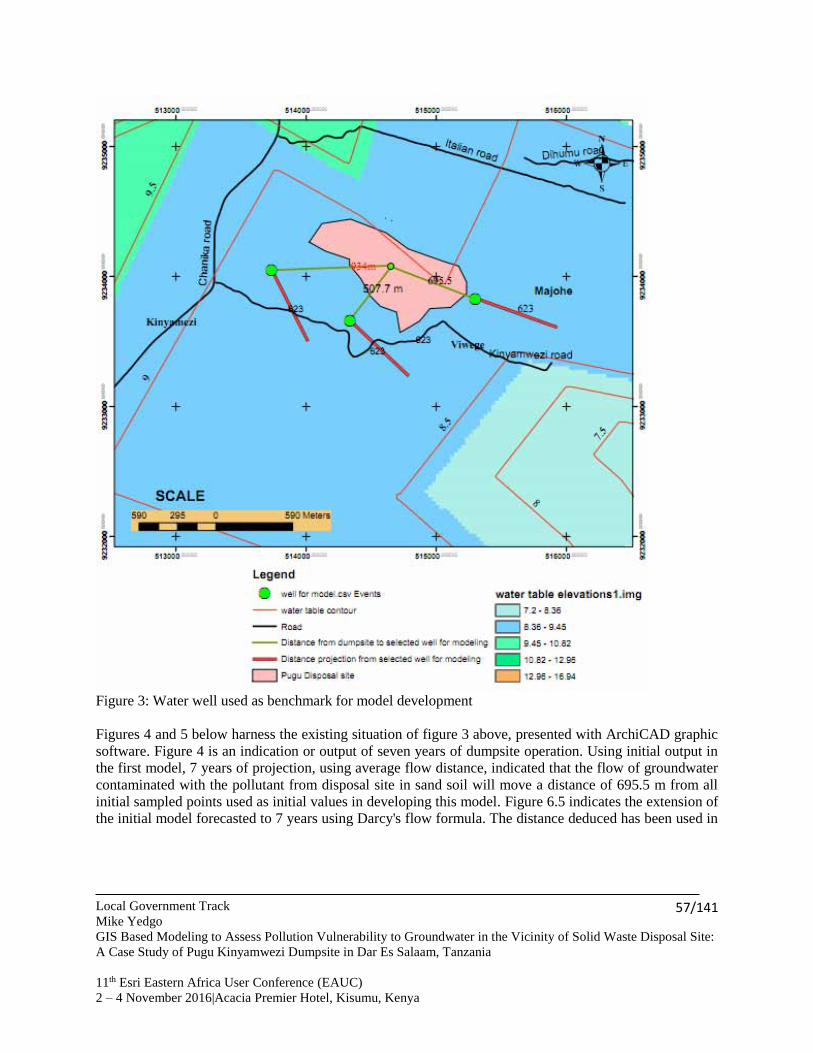
Local Government Track
Mike Yedgo
GIS Based Modeling to Assess Pollution Vulnerability to Groundwater in the Vicinity of Solid Waste Disposal Site:
A Case Study of Pugu Kinyamwezi Dumpsite in Dar Es Salaam, Tanzania
11th Esri Eastern Africa User Conference (EAUC)
2 – 4 November 2016|Acacia Premier Hotel, Kisumu, Kenya
57/141
Figure 3: Water well used as benchmark for model development
Figures 4 and 5 below harness the existing situation of figure 3 above, presented with ArchiCAD graphic
software. Figure 4 is an indication or output of seven years of dumpsite operation. Using initial output in
the first model, 7 years of projection, using average flow distance, indicated that the flow of groundwater
contaminated with the pollutant from disposal site in sand soil will move a distance of 695.5 m from all
initial sampled points used as initial values in developing this model. Figure 6.5 indicates the extension of
the initial model forecasted to 7 years using Darcy's flow formula. The distance deduced has been used in
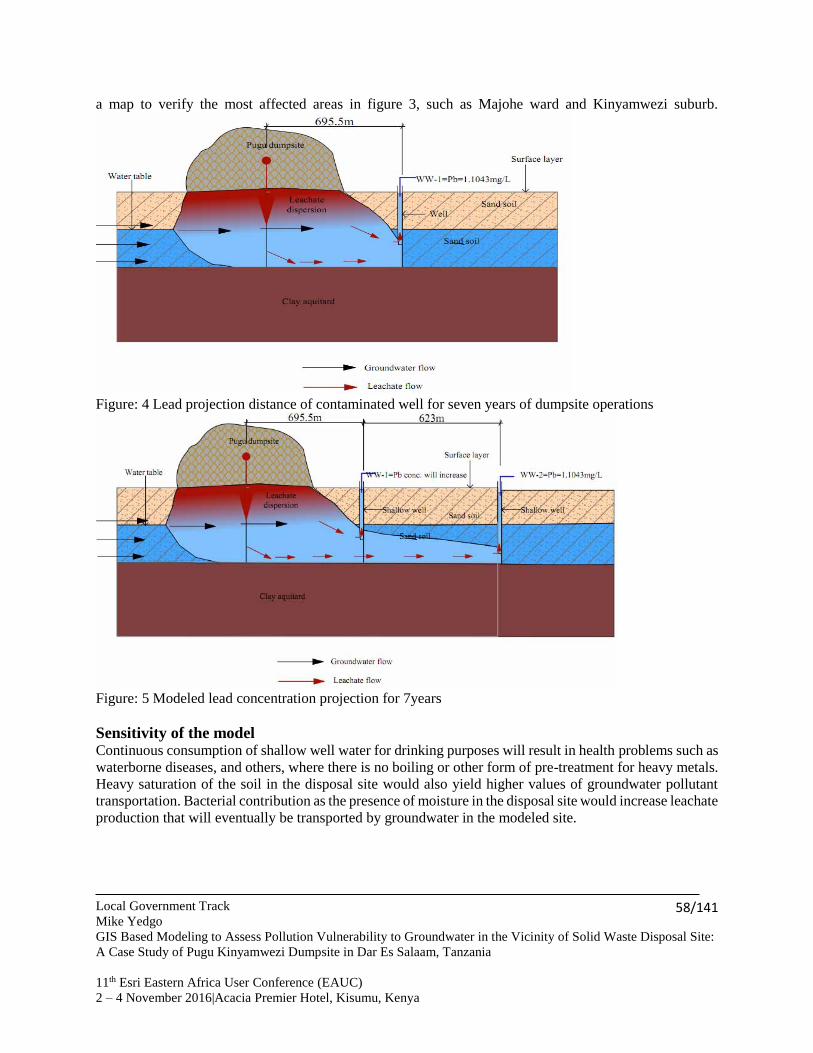
Local Government Track
Mike Yedgo
GIS Based Modeling to Assess Pollution Vulnerability to Groundwater in the Vicinity of Solid Waste Disposal Site:
A Case Study of Pugu Kinyamwezi Dumpsite in Dar Es Salaam, Tanzania
11th Esri Eastern Africa User Conference (EAUC)
2 – 4 November 2016|Acacia Premier Hotel, Kisumu, Kenya
58/141
a map to verify the most affected areas in figure 3, such as Majohe ward and Kinyamwezi suburb.
Figure: 4 Lead projection distance of contaminated well for seven years of dumpsite operations
Figure: 5 Modeled lead concentration projection for 7years
Sensitivity of the model Continuous consumption of shallow well water for drinking purposes will result in health problems such as
waterborne diseases, and others, where there is no boiling or other form of pre-treatment for heavy metals.
Heavy saturation of the soil in the disposal site would also yield higher values of groundwater pollutant
transportation. Bacterial contribution as the presence of moisture in the disposal site would increase leachate
production that will eventually be transported by groundwater in the modeled site.
Local Government Track
Mike Yedgo
GIS Based Modeling to Assess Pollution Vulnerability to Groundwater in the Vicinity of Solid Waste Disposal Site:
A Case Study of Pugu Kinyamwezi Dumpsite in Dar Es Salaam, Tanzania
11th Esri Eastern Africa User Conference (EAUC)
2 – 4 November 2016|Acacia Premier Hotel, Kisumu, Kenya
59/141
Growth rates in the development of new pollutants will affect the groundwater quality. The model did not
take this into account, but the distribution of pollutants in the future will resemble the heavy metal
concentration obtained with 7 years of operation.
It assumed that the modeled site will be affected by the same pollution towards the end of a projected point
of10 years.
Conclusion and Recommendations
Conclusion A GIS based simulation model was successfully designed through characterization and mapping of the
existing situation, analysis of groundwater samples. GIS simulation modeling through water table contour
mapping played a greater role in prediction of groundwater flow, hence successfully showing the flow
direction of pollutants from the disposal site to different existing residential habitats. Mapping and
characterization of the existing situation, through field surveys, observation and other methods, showed that
the dug wells are contained in unconfined aquifers, which are mainly sand soil. During the rain period the
water table rises. On the other hand, the wells are more vulnerable to groundwater contamination since the
nature of the soil is sand soil, which is easily saturated, hence allowing for easy movement of water
contaminants. The water table contour map revealed that the direction of groundwater flow was toward the
eastern and south eastern part of the dump site. Our analysis indicated that the people of Majohe,
Kinyamwezi, in the eastern part, are susceptible and vulnerable to heavy metal pollutants from the disposal
site.
Recommendations Disposal practice in Pugu Kinyamwezi does not reflect a scientific well planned sanitary landfill. It is
therefore recommended that dumpsites should be modified in order to accommodate the desirable standard
for better management of solid waste. Based on the flow pattern of the aquifer system in the case study,
groundwater contamination in resident water wells is inevitable, hence leading to human exposure to heavy
metal as the result of continuous use of groundwater for domestic purposes.
Based on the findings and analysis of the results presented in this paper, and the model developed, it is
concluded that water from water sources around the eastern side of the dumpsite is not safe for drinking.
Thus it is recommended that dumpsites should be modified in order to accommodate the desirable standard
for better management of solid waste.
Transforming disposal i.e. well-designed landfills with provision of capping, lining; effective
arrangement of the site for evaporation and leachate treatment could reduce pollutant
migration/movement from the disposal site via groundwater.
Capping of the site and gas capturing from the disposal site could also reduce volatile organic and
inorganic components, some of which are suspected to cause cancer in case of inhalation. Dermal
contact of solid waste and distribution of heavy metal would be minimized at large scale.
Reference Adelekan B.A.; (2010), International Journal of Water Resources and Environmental Engineering, 2 (6):
137-147.
Adepoju-Bello, A.A. and O.M. Alabi, 2005. Heavy metals: A review. The Nig. J. Pharm., 37: 41-45.
Local Government Track
Mike Yedgo
GIS Based Modeling to Assess Pollution Vulnerability to Groundwater in the Vicinity of Solid Waste Disposal Site:
A Case Study of Pugu Kinyamwezi Dumpsite in Dar Es Salaam, Tanzania
11th Esri Eastern Africa User Conference (EAUC)
2 – 4 November 2016|Acacia Premier Hotel, Kisumu, Kenya
60/141
Bakare-Odunola M. T., (2005) Determination of some metallic impurities present in soft drinks marketed
in Nigeria. Nig. J. Of Pharm. Res.4 (1) 51-54.
Berti, W. R., and D. Jacobs, 1998. Distribution of trace elements in soil from repeated sewage sludge
applications. J. Environ. Qual. 27:1280–1286
Borgmann, U. (1983). Metal Speciation and Toxicity of Free Metal Ions to Aquatic Biota. In: Nriagu J.O.
(ed.) Aquatic Toxicity. Advances in Environmental Science and Technology. Vol. 13 John Wiley
& Sons. New York. Pp. 47 – 73.
Conant, B., Cherry, J. A., and Gillham, R. W.: A PCE groundwater plume discharging to a river: 10
influence of the streambed and near-river zone on contaminant distributions, J. Contam. Hydrol.,
73(1–4), 249–279, 2004.
Davis, A.P., Shokouhian, M., Sharma, H., Minami, C. and Winogradoff, D., (2003). Water quality
improvement through bioretention: Lead, copper, and zinc removal. Water Environment Research,
75(1): 73-82.
ECDG. 2002. European Commission DG ENV. E3 Project ENV. E.3/ETU/0058. Heavy metals in waste.
Final report.
ElingeCM.;Itodo AU.;Birni-Yauri UA.; and Mbongo A.N.;(2011) Advances in Applied ScienceResearch,
2(4): 279-282.
Freeze R.A. and Cherry J.A. (2002). “Groundwater” Prentice-Hall, Englewood cliffs New Jersey, PP 604.
Igwilo, I.O., O.J. Afonne, U.J. Maduabuchi and O.E. Orisakwe, 2006. Toxicological study of the Anam
River in Otuocha, Anambra State, Nigeria. Arch. Environ. Occup. Health, 61(5): 205-208.
Johansen, P., Muir, D., Asmund, G., Riget, F., 2004. Human exposure to contaminants in the traditional
Greenland diet. Science of the Total Environment 331, 189e206.
Mjemah, I.C Mtoni, Y., Bakundukize, C., Van Camp, M., Martens, K. and Walraevens, K.(2012b).
Saltwater intrusion and nitrate pollution in the coastal aquifer of Dar esSalaam,Tanzania. Springer,
Environmental Earth Sciences (DOI: 10.1007/s12665-012-2197-7).
Oliver N.M and Ismaila Y;.(2011)Advances in Applied Science Research, , 2(3): 191-197
Oman C. and Rosqvist H., (1999) Transport fate of organic compounds with water through landfills. Water
Research, 33, 2247– 2254.
Oseji, J. O; Asokhia, M. B and Okolie, E. C. (2006): “Determination of Groundwater Potential in Obiaruku
and Environs Using Surface Geoelectric Sounding”. The Environmentalist, Springer Science +
Business Media, DO1 10.10669-006-0159-x Vol. 26 Pp (301 – 308), Netherlands.
Pellerin C, Booker S.M (2000) Reflections on hexavalent chromium. Environ Health Persp 108:402–407
Rao K J and Shantaram M .V. (2003) Workshop on sustainable land fill management, channel, India, , 27-
27.
Shwille, F. (2000). “Groundwater Pollution in Porous Media by Fluids Immiscible with water” Quality of
Groundwater, Proceedings of an International Symposium. Langley R.B. “Why is the GPS Signal
so Complex” GPS world Vol. 1 No. 3, May/June PP. 56-59
U.S. EPA. (2002c). A Review of the Reference Dose and Reference Concentration Processes. Risk
Assessment Forum, Washington, DC, EPA/630/P-
02/002F.http://cfpub.epa.gov/ncea/raf/recordisplay.cfm?deid=55365
US EPA, (2005) Guidelines for Carcinogen Risk Assessment Risk Assessment Forum U.S. Environmental
Protection Agency; EPA /630/P-03/001BMarch 2005 Washington, DC
US EPA, 1986 Guidelines for Carcinogen Risk Assessment Published on September 24, Federal Register
51(185):33992-34003
WHO, (2004) Guidelines for Drinking Water Quality. 3rd Edn.Vol. 1 Recommendation, Geneva, 2004,
515.
Local Government Track
Mike Yedgo
GIS Based Modeling to Assess Pollution Vulnerability to Groundwater in the Vicinity of Solid Waste Disposal Site:
A Case Study of Pugu Kinyamwezi Dumpsite in Dar Es Salaam, Tanzania
11th Esri Eastern Africa User Conference (EAUC)
2 – 4 November 2016|Acacia Premier Hotel, Kisumu, Kenya
61/141
World Health Organization, (2006): National water quality guidelines for domestic consumption.
Zietz, B.P., J. Lap and R. Suchenwirth, (2007). Assessment and management of tap water Lead
contamination in Lower Saxon, Germany. Int. J. Environ. Health Res., 17(6): 407-418.

Local Government Track
Francis Kamau Muthoni
Comparing two geospatial approaches for delineating crop ecologies in Tanzania
11th Esri Eastern Africa User Conference (EAUC)
2 – 4 November 2016|Acacia Premier Hotel, Kisumu, Kenya
62/141
Comparing two geospatial approaches for delineating crop ecologies in
Tanzania
Francis Kamau, MUTHONI, Tanzania
International Institute of Tropical Agriculture (IITA)
Key words: Arcgisbinding package, Extrapolation detection tool, Improved varieties, Fertilizers,
Spatial targeting
Abstract
Mapping distribution of suitable environmental conditions for agronomic technologies guides
spatial targeting to enhance adoption. This paper compares a bottom-up and a top-down geospatial
approach for delineating suitable ecologies for a technology package comprising of improved
maize varieties and fertilizers. Bioclimatic variables for the Feed the Future zone in Tanzania were
utilised. Maize yields data from trial sites were used to identify the variety and fertilizer treatment
with the best performance. For top-down approach, GIS overlay operations were conducted to
delineate suitable zone for best performing technology. For bottom-up approach, the extrapolation
detection tool was used to generate maps on two types of dissimilarities between the bioclimatic
conditions at reference site and outlying projection domain and a map of the most limiting variable.
SC719 maize variety grown with YaramilaCereal and Sulfan fertilizers was the best performing
treatment in trials. The top-down approach delineated 15% of FtF zone as suitable. The bottom-up
approach revealed the magnitude of deviation from univariate range and novel combinations of
environmental covariates between the reference site and the projection domain. Precipitation was
most limiting factor. Although the top-down approach is more insightful, its applicability in Africa
is limited by sparse crop trial data.
Local Government Track
Francis Kamau Muthoni
Comparing two geospatial approaches for delineating crop ecologies in Tanzania
11th Esri Eastern Africa User Conference (EAUC)
2 – 4 November 2016|Acacia Premier Hotel, Kisumu, Kenya
63/141
Introduction Food insecurity is a prevalent problem in sub-Sahara Africa and the situation is worsened by
increasing population. Adoption of improved crop varieties that are high yielding and tolerant to
drought, pests and diseases is one panacea to increase food production. These varieties are
disseminated together with related good agronomic practices (GAPs) as technology packages to
increase yields and conservation of natural resource capital [1]. The potential impact and the rates
of adoption of these agronomic practices can be accentuated if they are disseminated in their
suitable biophysical environments [2]. To a large extent the (dis)similarity in environmental
conditions is a proxy for differences in crop suitability [3]. Therefore delineation of zones with
similar environments will guide spatial targeting of agronomic technologies to areas with the
highest potential. Geographical Information Systems (GIS) and remote sensing tools are used to
delineate suitability indices at landscape, regional and global scales [4].
This paper compares the utility of a top-down and bottom-up geospatial approaches for mapping
suitability of integrated agronomic technologies in the Feed the Future (FtF) zone in Tanzania. The
paper evaluates the suitability of improved maize varieties treated with different fertilizers. Input
variables include selected gridded biophysical layers that are known to limit crop growth and
efficiency of inorganic fertilizers. Results demonstrate the differences between the two approaches
followed by a discussion on advantages and the context in which each method is most suitable.
Methods
Study area
The study area covers the FtF zone in Tanzania (Figure 1). Figure 2 summarizes the implemented
workflow for comparing a top-down and bottom-up approaches for delineating suitable zones for
scaling integrated agronomic practices comprising of improved maize varieties and inorganic
fertilizers. The environmental layers used in both methods are shown in table 2.
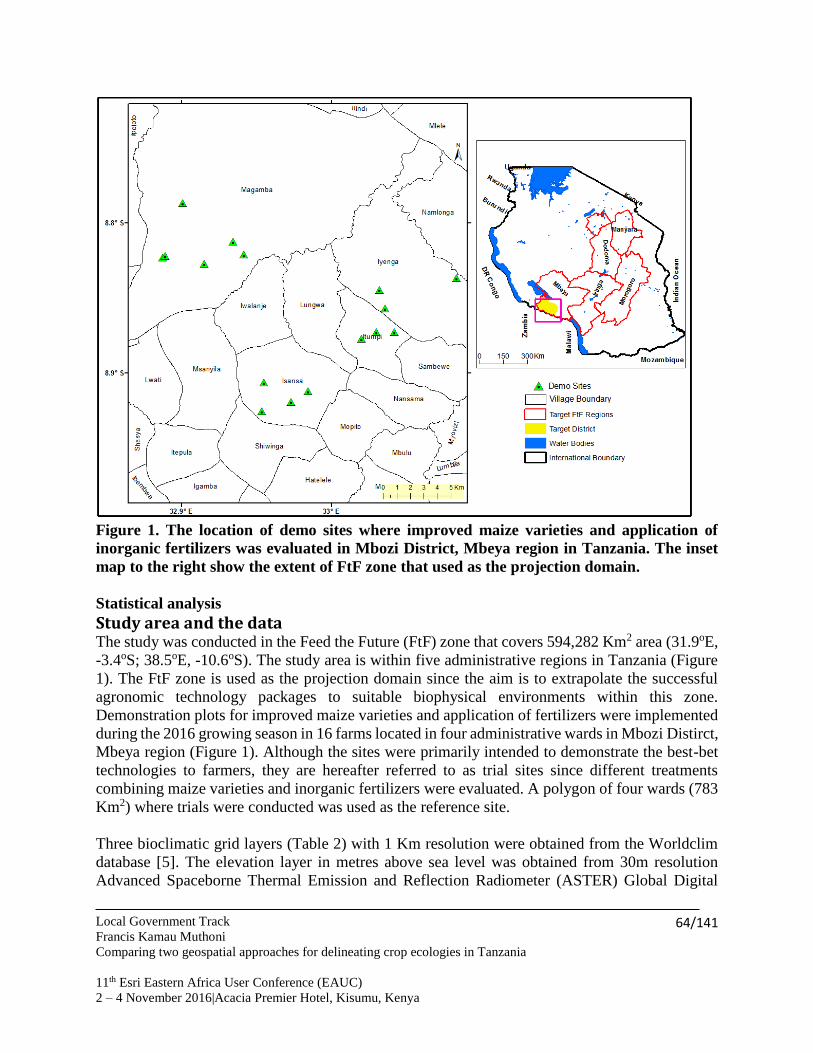
Local Government Track
Francis Kamau Muthoni
Comparing two geospatial approaches for delineating crop ecologies in Tanzania
11th Esri Eastern Africa User Conference (EAUC)
2 – 4 November 2016|Acacia Premier Hotel, Kisumu, Kenya
64/141
Figure 1. The location of demo sites where improved maize varieties and application of
inorganic fertilizers was evaluated in Mbozi District, Mbeya region in Tanzania. The inset
map to the right show the extent of FtF zone that used as the projection domain.
Statistical analysis
Study area and the data The study was conducted in the Feed the Future (FtF) zone that covers 594,282 Km2 area (31.9oE,
-3.4oS; 38.5oE, -10.6oS). The study area is within five administrative regions in Tanzania (Figure
1). The FtF zone is used as the projection domain since the aim is to extrapolate the successful
agronomic technology packages to suitable biophysical environments within this zone.
Demonstration plots for improved maize varieties and application of fertilizers were implemented
during the 2016 growing season in 16 farms located in four administrative wards in Mbozi Distirct,
Mbeya region (Figure 1). Although the sites were primarily intended to demonstrate the best-bet
technologies to farmers, they are hereafter referred to as trial sites since different treatments
combining maize varieties and inorganic fertilizers were evaluated. A polygon of four wards (783
Km2) where trials were conducted was used as the reference site.
Three bioclimatic grid layers (Table 2) with 1 Km resolution were obtained from the Worldclim
database [5]. The elevation layer in metres above sea level was obtained from 30m resolution
Advanced Spaceborne Thermal Emission and Reflection Radiometer (ASTER) Global Digital

Local Government Track
Francis Kamau Muthoni
Comparing two geospatial approaches for delineating crop ecologies in Tanzania
11th Esri Eastern Africa User Conference (EAUC)
2 – 4 November 2016|Acacia Premier Hotel, Kisumu, Kenya
65/141
Elevation Model Version 2 [GDEM-V2; 6]. The elevation layer was resampled to 1 Km resolution.
The four layers (Table 2) were selected based on variety release reports and expert knowledge of
maize breeders that pointed to their relevance in determining the suitability of maize varieties.
Table 1. Characteristics of maize varieties and fertilizers treatments evaluated in plot trials
in Mbozi District.
Variety
Attainable
Grain
yield (t/ha)
Optimal biophysical range
Fertilizer type
Treatment
ID
Altitud
e (a.s.l.)
Rainfal
l (mm)
Maturit
y (days)
HB 614 7 >1500
800-
1500 180-190
DAP+ Urea Ver1Fer1
YaramilaCereal +
Sulfan Ver1Fer2
MERU
513 11
800-
1200
700-
1500 100-110
DAP+ Urea Ver2Fer1
YaramilaCereal +
Sulfan Ver2Fer2
PAN
691 7 >1500
800-
1500 103
DAP+ Urea Ver3Fer1
YaramilaCereal +
Sulfan Ver3Fer2
SC 719 4.5-5.0
800-
1500
800-
1200 145-153
DAP+ Urea Ver4Fer1
YaramilaCereal +
Sulfan Ver4Fer2
UH 615 8.0-9.0
1200-
1800
800-
1200 85-92
DAP+ Urea Ver5Fer1
YaramilaCereal +
Sulfan Ver5Fer2
UH
6303 9.0-10.0
1200-
1800
800-
1500 92
DAP+ Urea Ver6Fer1
YaramilaCereal +
Sulfan Ver6Fer2
Table 2. The geospatial layers used in analysis. All grid layers were resampled to 1Km
resolution. The letter z in bracket was used to distinguish the layers for the reference area in
Mbozi District from that of entire FtF zone.
Code Variable name Resolution Source
DEM(z)ftf Elevation 1 Km ASTER DEM [6]
pptcv(z)ftf Precipitation seasonality
(coefficient of variation)
1 Km Bioclim [5]
ppt(z)ftf Annual precipitation 1 Km “
Tempcv(z)ftf Temperature seasonality 1 Km “
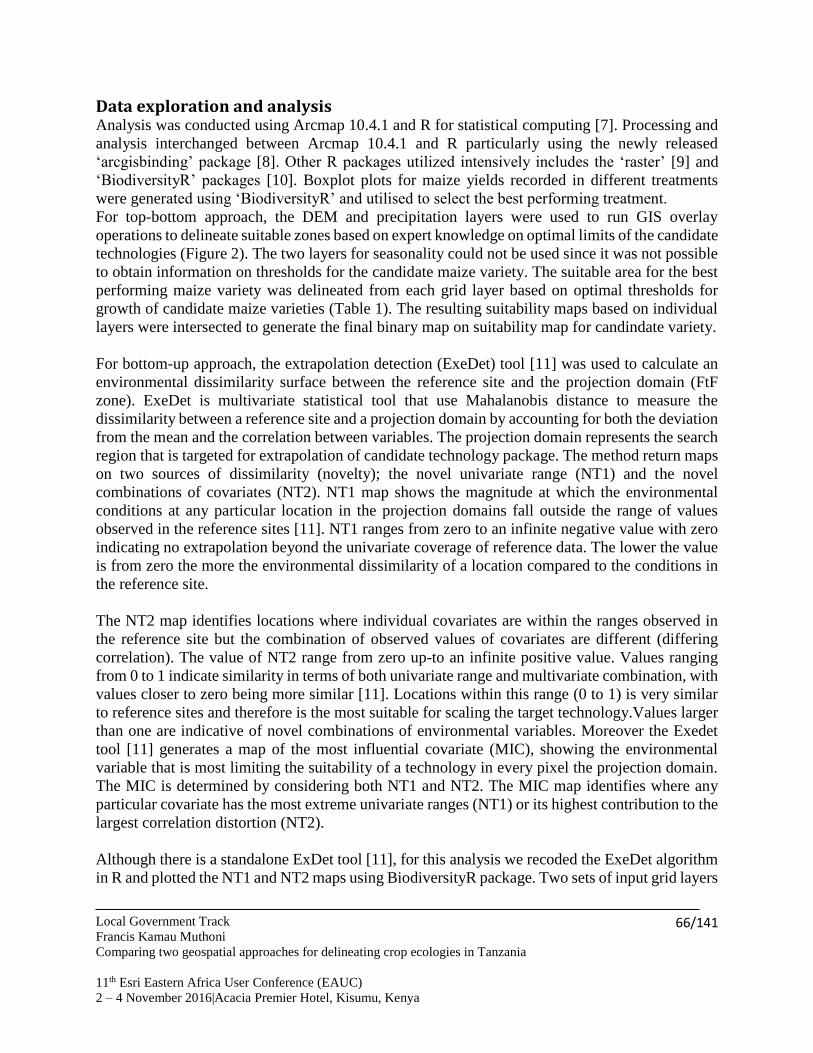
Local Government Track
Francis Kamau Muthoni
Comparing two geospatial approaches for delineating crop ecologies in Tanzania
11th Esri Eastern Africa User Conference (EAUC)
2 – 4 November 2016|Acacia Premier Hotel, Kisumu, Kenya
66/141
Data exploration and analysis Analysis was conducted using Arcmap 10.4.1 and R for statistical computing [7]. Processing and
analysis interchanged between Arcmap 10.4.1 and R particularly using the newly released
‘arcgisbinding’ package [8]. Other R packages utilized intensively includes the ‘raster’ [9] and
‘BiodiversityR’ packages [10]. Boxplot plots for maize yields recorded in different treatments
were generated using ‘BiodiversityR’ and utilised to select the best performing treatment.
For top-bottom approach, the DEM and precipitation layers were used to run GIS overlay
operations to delineate suitable zones based on expert knowledge on optimal limits of the candidate
technologies (Figure 2). The two layers for seasonality could not be used since it was not possible
to obtain information on thresholds for the candidate maize variety. The suitable area for the best
performing maize variety was delineated from each grid layer based on optimal thresholds for
growth of candidate maize varieties (Table 1). The resulting suitability maps based on individual
layers were intersected to generate the final binary map on suitability map for candindate variety.
For bottom-up approach, the extrapolation detection (ExeDet) tool [11] was used to calculate an
environmental dissimilarity surface between the reference site and the projection domain (FtF
zone). ExeDet is multivariate statistical tool that use Mahalanobis distance to measure the
dissimilarity between a reference site and a projection domain by accounting for both the deviation
from the mean and the correlation between variables. The projection domain represents the search
region that is targeted for extrapolation of candidate technology package. The method return maps
on two sources of dissimilarity (novelty); the novel univariate range (NT1) and the novel
combinations of covariates (NT2). NT1 map shows the magnitude at which the environmental
conditions at any particular location in the projection domains fall outside the range of values
observed in the reference sites [11]. NT1 ranges from zero to an infinite negative value with zero
indicating no extrapolation beyond the univariate coverage of reference data. The lower the value
is from zero the more the environmental dissimilarity of a location compared to the conditions in
the reference site.
The NT2 map identifies locations where individual covariates are within the ranges observed in
the reference site but the combination of observed values of covariates are different (differing
correlation). The value of NT2 range from zero up-to an infinite positive value. Values ranging
from 0 to 1 indicate similarity in terms of both univariate range and multivariate combination, with
values closer to zero being more similar [11]. Locations within this range (0 to 1) is very similar
to reference sites and therefore is the most suitable for scaling the target technology.Values larger
than one are indicative of novel combinations of environmental variables. Moreover the Exedet
tool [11] generates a map of the most influential covariate (MIC), showing the environmental
variable that is most limiting the suitability of a technology in every pixel the projection domain.
The MIC is determined by considering both NT1 and NT2. The MIC map identifies where any
particular covariate has the most extreme univariate ranges (NT1) or its highest contribution to the
largest correlation distortion (NT2).
Although there is a standalone ExDet tool [11], for this analysis we recoded the ExeDet algorithm
in R and plotted the NT1 and NT2 maps using BiodiversityR package. Two sets of input grid layers
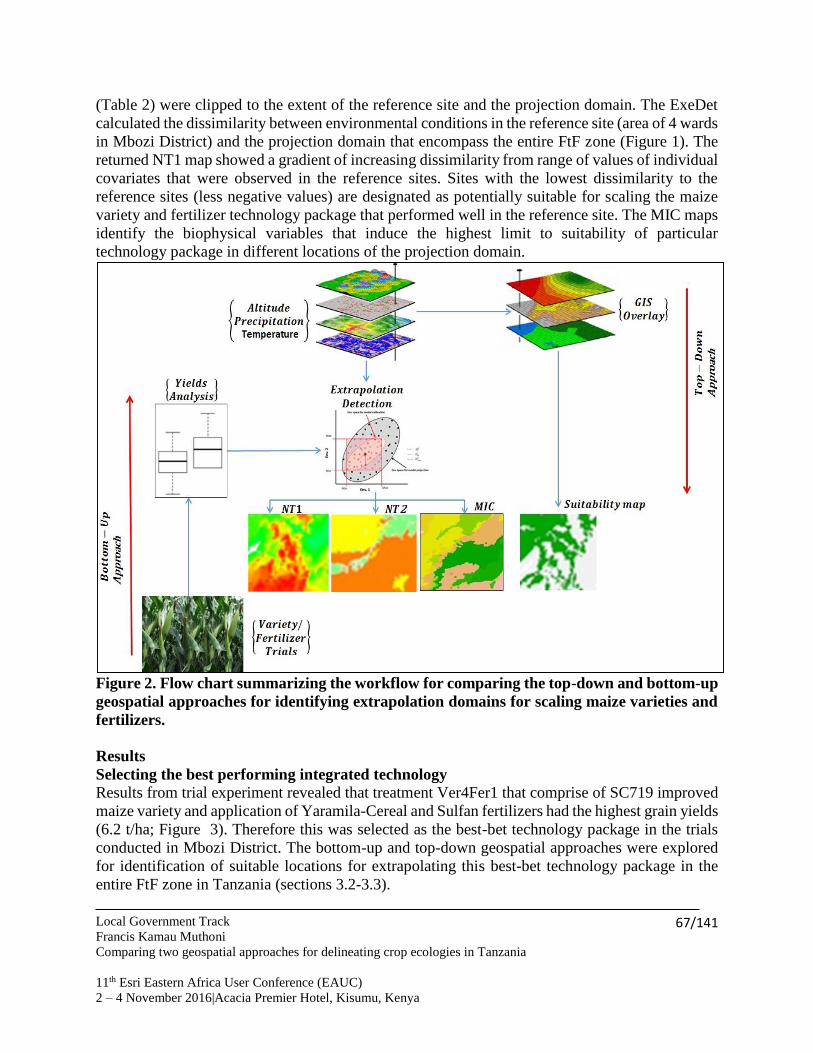
Local Government Track
Francis Kamau Muthoni
Comparing two geospatial approaches for delineating crop ecologies in Tanzania
11th Esri Eastern Africa User Conference (EAUC)
2 – 4 November 2016|Acacia Premier Hotel, Kisumu, Kenya
67/141
(Table 2) were clipped to the extent of the reference site and the projection domain. The ExeDet
calculated the dissimilarity between environmental conditions in the reference site (area of 4 wards
in Mbozi District) and the projection domain that encompass the entire FtF zone (Figure 1). The
returned NT1 map showed a gradient of increasing dissimilarity from range of values of individual
covariates that were observed in the reference sites. Sites with the lowest dissimilarity to the
reference sites (less negative values) are designated as potentially suitable for scaling the maize
variety and fertilizer technology package that performed well in the reference site. The MIC maps
identify the biophysical variables that induce the highest limit to suitability of particular
technology package in different locations of the projection domain.
Figure 2. Flow chart summarizing the workflow for comparing the top-down and bottom-up
geospatial approaches for identifying extrapolation domains for scaling maize varieties and
fertilizers.
Results
Selecting the best performing integrated technology
Results from trial experiment revealed that treatment Ver4Fer1 that comprise of SC719 improved
maize variety and application of Yaramila-Cereal and Sulfan fertilizers had the highest grain yields
(6.2 t/ha; Figure 3). Therefore this was selected as the best-bet technology package in the trials
conducted in Mbozi District. The bottom-up and top-down geospatial approaches were explored
for identification of suitable locations for extrapolating this best-bet technology package in the
entire FtF zone in Tanzania (sections 3.2-3.3).
Local Government Track
Francis Kamau Muthoni
Comparing two geospatial approaches for delineating crop ecologies in Tanzania
11th Esri Eastern Africa User Conference (EAUC)
2 – 4 November 2016|Acacia Premier Hotel, Kisumu, Kenya
68/141
Figure 3. The grain yields recorded from the experimental treatments with 6 different improved
maize varieties and 2 fertilizers in Mbozi district. Varieties treated with fertilizer 2 had higher
grain yields except for variety 6 (UH 6303). Treatment Ver4Fer1 recorded the highest yield (6.2
t/ha).
Top-down approach
Results obtained after GIS overlay operations revealed that an area covering 156,817 Km2 in the
Ftf zone had suitable altitudinal range for growth of SC719 maize variety (Figure 4). However
after intersecting with the area with suitable precipitation range, only 89,782 Km2 (15% of FtF
zone) was finally earmarked as suitable (Figure 4).
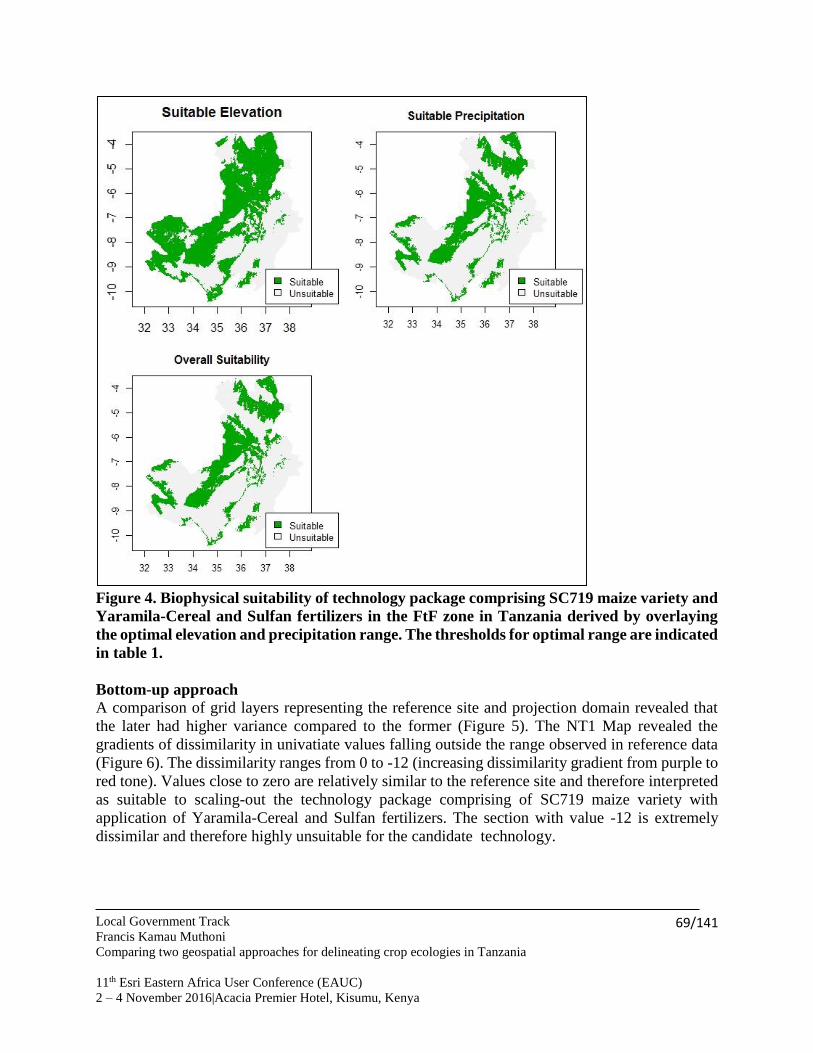
Local Government Track
Francis Kamau Muthoni
Comparing two geospatial approaches for delineating crop ecologies in Tanzania
11th Esri Eastern Africa User Conference (EAUC)
2 – 4 November 2016|Acacia Premier Hotel, Kisumu, Kenya
69/141
Figure 4. Biophysical suitability of technology package comprising SC719 maize variety and
Yaramila-Cereal and Sulfan fertilizers in the FtF zone in Tanzania derived by overlaying
the optimal elevation and precipitation range. The thresholds for optimal range are indicated
in table 1.
Bottom-up approach
A comparison of grid layers representing the reference site and projection domain revealed that
the later had higher variance compared to the former (Figure 5). The NT1 Map revealed the
gradients of dissimilarity in univatiate values falling outside the range observed in reference data
(Figure 6). The dissimilarity ranges from 0 to -12 (increasing dissimilarity gradient from purple to
red tone). Values close to zero are relatively similar to the reference site and therefore interpreted
as suitable to scaling-out the technology package comprising of SC719 maize variety with
application of Yaramila-Cereal and Sulfan fertilizers. The section with value -12 is extremely
dissimilar and therefore highly unsuitable for the candidate technology.
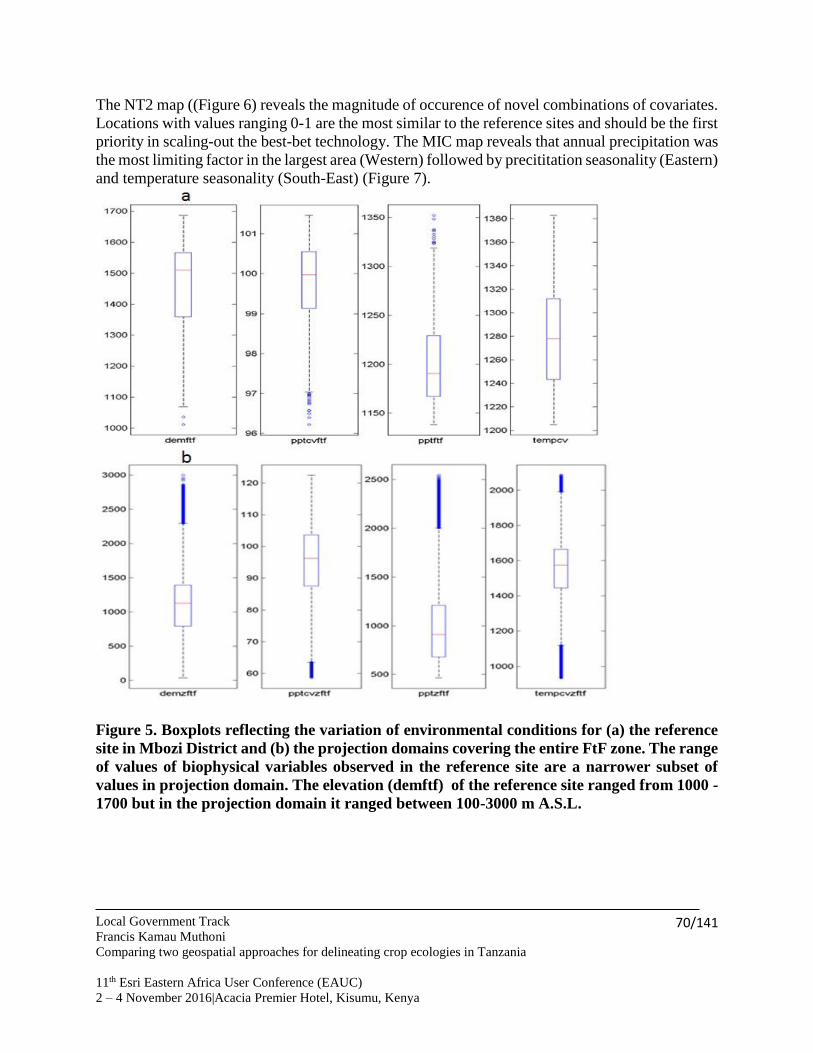
Local Government Track
Francis Kamau Muthoni
Comparing two geospatial approaches for delineating crop ecologies in Tanzania
11th Esri Eastern Africa User Conference (EAUC)
2 – 4 November 2016|Acacia Premier Hotel, Kisumu, Kenya
70/141
The NT2 map ((Figure 6) reveals the magnitude of occurence of novel combinations of covariates.
Locations with values ranging 0-1 are the most similar to the reference sites and should be the first
priority in scaling-out the best-bet technology. The MIC map reveals that annual precipitation was
the most limiting factor in the largest area (Western) followed by precititation seasonality (Eastern)
and temperature seasonality (South-East) (Figure 7).
Figure 5. Boxplots reflecting the variation of environmental conditions for (a) the reference
site in Mbozi District and (b) the projection domains covering the entire FtF zone. The range
of values of biophysical variables observed in the reference site are a narrower subset of
values in projection domain. The elevation (demftf) of the reference site ranged from 1000 -
1700 but in the projection domain it ranged between 100-3000 m A.S.L.
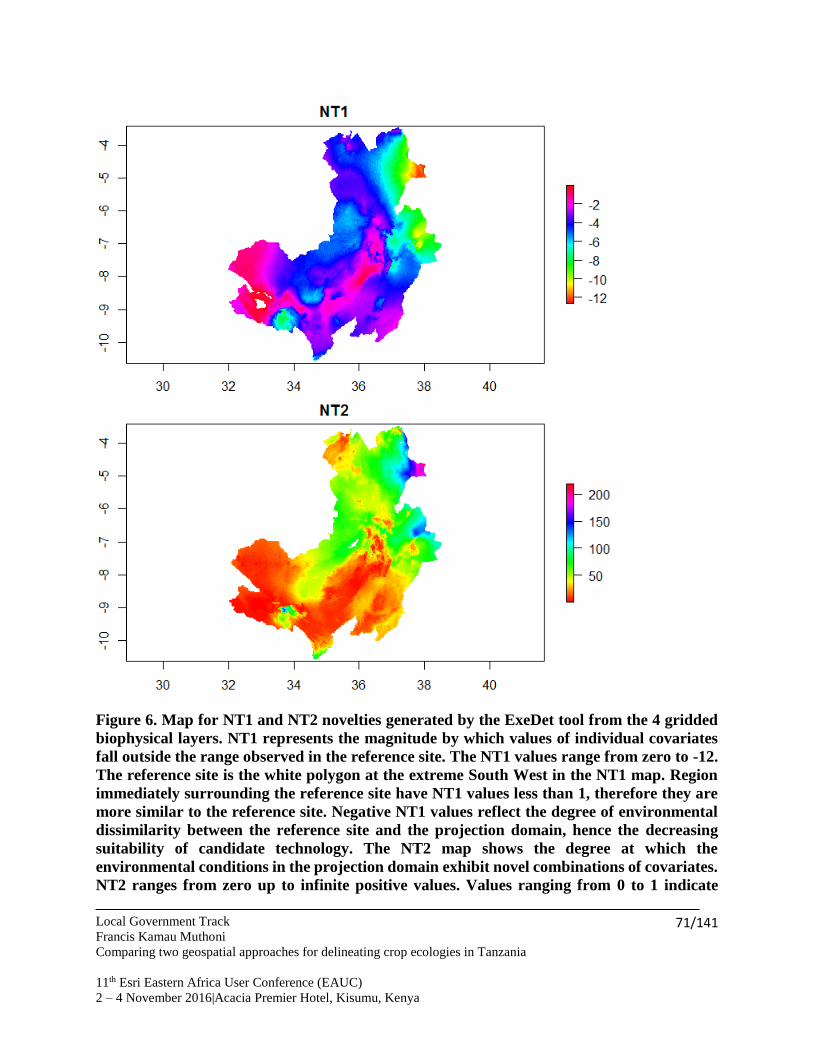
Local Government Track
Francis Kamau Muthoni
Comparing two geospatial approaches for delineating crop ecologies in Tanzania
11th Esri Eastern Africa User Conference (EAUC)
2 – 4 November 2016|Acacia Premier Hotel, Kisumu, Kenya
71/141
Figure 6. Map for NT1 and NT2 novelties generated by the ExeDet tool from the 4 gridded
biophysical layers. NT1 represents the magnitude by which values of individual covariates
fall outside the range observed in the reference site. The NT1 values range from zero to -12.
The reference site is the white polygon at the extreme South West in the NT1 map. Region
immediately surrounding the reference site have NT1 values less than 1, therefore they are
more similar to the reference site. Negative NT1 values reflect the degree of environmental
dissimilarity between the reference site and the projection domain, hence the decreasing
suitability of candidate technology. The NT2 map shows the degree at which the
environmental conditions in the projection domain exhibit novel combinations of covariates.
NT2 ranges from zero up to infinite positive values. Values ranging from 0 to 1 indicate
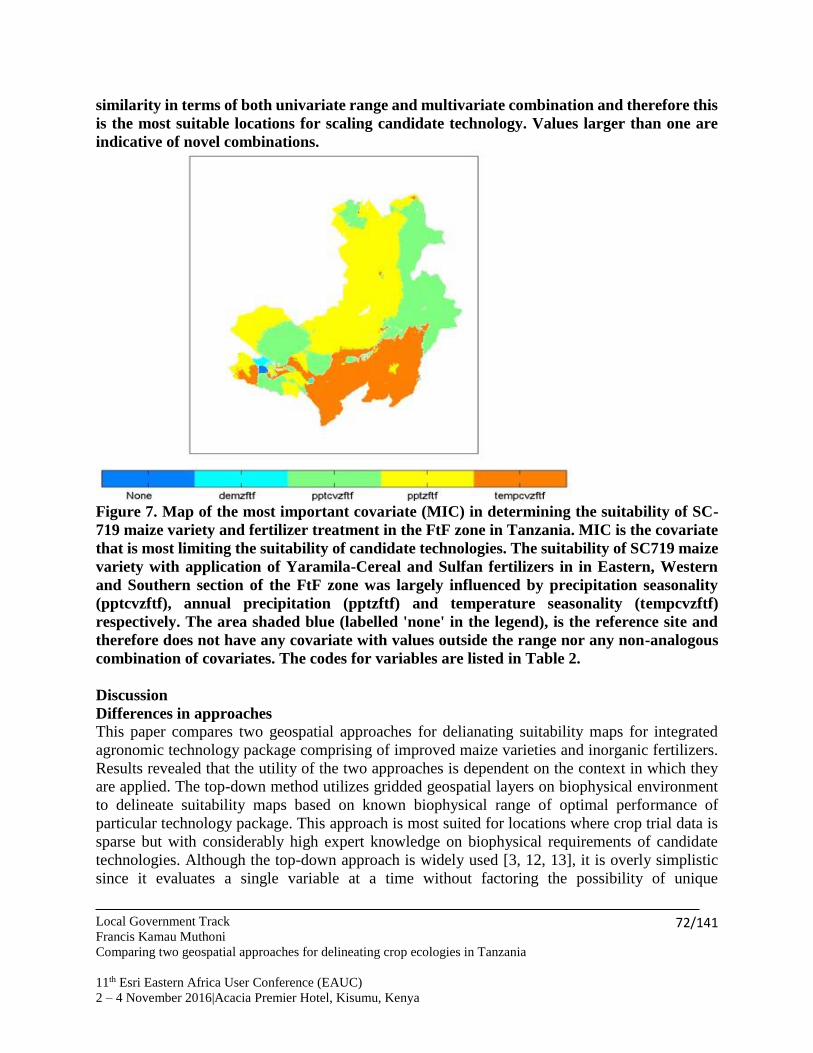
Local Government Track
Francis Kamau Muthoni
Comparing two geospatial approaches for delineating crop ecologies in Tanzania
11th Esri Eastern Africa User Conference (EAUC)
2 – 4 November 2016|Acacia Premier Hotel, Kisumu, Kenya
72/141
similarity in terms of both univariate range and multivariate combination and therefore this
is the most suitable locations for scaling candidate technology. Values larger than one are
indicative of novel combinations.
Figure 7. Map of the most important covariate (MIC) in determining the suitability of SC-
719 maize variety and fertilizer treatment in the FtF zone in Tanzania. MIC is the covariate
that is most limiting the suitability of candidate technologies. The suitability of SC719 maize
variety with application of Yaramila-Cereal and Sulfan fertilizers in in Eastern, Western
and Southern section of the FtF zone was largely influenced by precipitation seasonality
(pptcvzftf), annual precipitation (pptzftf) and temperature seasonality (tempcvzftf)
respectively. The area shaded blue (labelled 'none' in the legend), is the reference site and
therefore does not have any covariate with values outside the range nor any non-analogous
combination of covariates. The codes for variables are listed in Table 2.
Discussion
Differences in approaches
This paper compares two geospatial approaches for delianating suitability maps for integrated
agronomic technology package comprising of improved maize varieties and inorganic fertilizers.
Results revealed that the utility of the two approaches is dependent on the context in which they
are applied. The top-down method utilizes gridded geospatial layers on biophysical environment
to delineate suitability maps based on known biophysical range of optimal performance of
particular technology package. This approach is most suited for locations where crop trial data is
sparse but with considerably high expert knowledge on biophysical requirements of candidate
technologies. Although the top-down approach is widely used [3, 12, 13], it is overly simplistic
since it evaluates a single variable at a time without factoring the possibility of unique
Local Government Track
Francis Kamau Muthoni
Comparing two geospatial approaches for delineating crop ecologies in Tanzania
11th Esri Eastern Africa User Conference (EAUC)
2 – 4 November 2016|Acacia Premier Hotel, Kisumu, Kenya
73/141
combinations of environmental variables across sites that may significantly affect suitability of a
particular crop variety [11].
The bottom-up approach is suitable for localities with long-term crop trials data. Information
obtained from long-term trials are utilized to identify the combinations of agronomic technologies
with the best results based on selected attributes such as crop yields or stover biomass. The long-
term trials increase confidence in identification of agronomic technologies with the best
perfomance at particular locations. These locations are consequently used as reference sites when
deriving the extrapolation domains. Results obtained from the bottom-up approach is more
intuitive beacause the ExeDet tool utilise all the the input environmental layers to generate the
dissimilaity gradients compared to the GIS overlays that use each layer at a time. The NT2
dissimilarity is generated by considering unique combinations of values rather than a binary
approach in the top-down approach that only check if the values are within the optimal range or
not. Some locations delianated as suitable by the top-down method solely because values of
individual covariates layers were within the suitable range for particular technology can be
earmarked to be unsuitable if the combinations of the environmental variables are different.
Relevance
The two approaches facilitate identification of suitability gradients of integrated agronomic
technology packages that guide extension agencies and development programs when selecting
sites for scaling-out. The higher variance of environmental conditions in the projection domain
compared to the search domain highlights the fact that scaling of agronomic technologies has
significant uncertainty. This emanated from extrapolation beyond the environmental space
observed in trial sites since performance of varieties in the novel conditions in unknown. The
results generated by ExeDet tool showing the magnitude of deviation from the univariate range of
environment in the trial sites would assist extension agents in reducing risks associated with the
failure of a technology when introduced in unsuitable environments. Moreover the map showing
the spatial distribution of the most limiting factor for particular technology across the projection
domain would be useful for extension agencies when recommending remedial solutions for
increasing yields at different locations. For example, irrigation schemes could be recommended in
locations where low precipitation is the most limiting factor. The suitability maps are also
important to crop breeder’s interested in establishing multi-locational trials to develop cultivars
with specific environmental adaptation [4].
Limitations
In this study, the trials to identify the best performing technology package were conducted in one
growing season. The confidence in the performance of particular technology could be enhanced
by using long-term experimental trials, expert knowledge on performance of candidate agronomic
technologies in different agro-ecologies and simulation models. Moreover only biophysical
variables are included in the analysis although suitability of crop varieties is influenced by variety
of factors such access to market and consumer preferences. Incorporating these socio-economic
variables in the analysis is limited by availability of reliable spatial data at appropriate scale.
Local Government Track
Francis Kamau Muthoni
Comparing two geospatial approaches for delineating crop ecologies in Tanzania
11th Esri Eastern Africa User Conference (EAUC)
2 – 4 November 2016|Acacia Premier Hotel, Kisumu, Kenya
74/141
References Vanlauwe, B., et al., Sustainable intensification and the African smallholder farmer. Current Opinion in
Environmental Sustainability, 2014. 8: p. 15-22.
Jolly, C.M., The use of action variables in determining recommendation domains: Grouping senegalese
farmers for research and extension. Agricultural Administration and Extension, 1988. 30(4): p.
253-267.
Nijbroek, R.P. and S.J. Andelman, Regional suitability for agricultural intensification: a spatial analysis
of the Southern Agricultural Growth Corridor of Tanzania. International Journal of Agricultural
Sustainability, 2015: p. 1-17.
Hyman, G., D. Hodson, and P. Jones, Spatial analysis to support geographic targeting of genetypes to
environments. Frontiers in Physiology, 2013. 4.
Hijmans, R.J., et al., Very high resolution interpolated climate surfaces for global land areas. International
Journal of Climatology, 2005. 25(15): p. 1965-1978.
METI and NASA. ASTER Global Digital Elevation Model (ASTER GDEM) version 2. 2011 [cited 2015
29/10]; Available from: http://www.jspacesystems.or.jp/ersdac/GDEM/E/4.html.
R Core Team. R: A language and environment for statistical computing. 2016 [cited 2015 10/29]; Available
from: https://www.R-project.org/.
ESRI Arcgisbinding package. 2016. 16.
Hijmans, R.J. Raster: Geographic Data Analysis and Modeling R package version 2.5-2 2015 [cited 2015
10/10]; Available from: https://CRAN.R-project.org/package=raster.
Kindt, R. and R. Coe, Tree diversity analysis. A manual and software for common statistical methods for
ecological and biodiversity studies. Vol. ISBN 92-9059-179-X. 2005, Nairobi: World Agroforestry
Centre (ICRAF), Nairobi.
Mesgaran, M.B., R.D. Cousens, and B.L. Webber, Here be dragons: A tool for quantifying novelty due to
covariate range and correlation change when projecting species distribution models. Diversity and
Distributions, 2014. 20(10): p. 1147-1159.
Notenbaert, A., et al., Identifying recommendation domains for targeting dual-purpose maize-based
interventions in crop-livestock systems in East Africa. Land Use Policy, 2013. 30(1): p. 834-846.
Tesfaye, K., et al., Identifying Potential Recommendation Domains for Conservation Agriculture in
Ethiopia, Kenya, and Malawi. Environmental Management, 2015. 55(2): p. 330-346.
Contacts
Dr. Francis Kamau Muthoni
Postdoctoral Fellow – GIS Specialist - Africa RISING Project
International Institute of Tropical Agriculture (IITA)
c/o, The World Vegetable Center, P.O. Box 10, Duluti,
Arusha, TANZANIA
Tel: +255 272 553051 | Mobile no: +255 785252 986
Email: [email protected]
www.iita.org or http://africa-rising.wikispaces.com/
Local Government Track
Mohammed Abdulkadir and Amina Yusuf
Analysis of Urban Growth and Agricultural Land Use of Kuta in Shiroro L.G.A, Niger State, North-Central Nigeria
11th Esri Eastern Africa User Conference (EAUC)
2 – 4 November 2016|Acacia Premier Hotel, Kisumu, Kenya
75/141
Analysis of Urban Growth and Agricultural Land Use of Kuta in Shiroro
L.G.A, Niger State, North-Central Nigeria
Mohammed Abdulkadir and Amina Yusuf
Department of Geography and Faculty of Natural Sciences,Ibrahim Badamasi Babangida
University, Lapai, Niger State, Nigeria.
KEY WORDS: Urban Growth, Land use/ change and Agricultural
Abstract The study explores the urban growth analysis on agricultural landuse in Kuta and its environs. The
objectives of the research is to examine the implication of urban growth encroachment on
agricultural land, between 1990, 2001 and 2013 respectively. Land-sat imageries of Kuta and its
environs for 1990, 2001 and 2013 were acquired, processed and classified using GIS techniques.
The methods adopted in this research were maximum likelihood classification and area calculation
in hectares for the various land use/land cover for each study year. The result shows that, in the
year 1990 the built-up area was 1481.662 hectares and farmland was 36165.98 hectares, this
indicates that urban area was very small and agricultural activity was at the peak in 1990. In the
year 2001, the built-up area increased to 2584.641 hectares and agricultural land decreased to
20323.35 hectares. This indicates that urban growth was gradually taking place at the expense of
agricultural land. In the year 2013, built-up area increased to 10074.373 hectares and agricultural
land decreased to 16530.98 hectares. This shows that there was a significant change from 2001 to
2013 as urban area grows four times of its size, diminishing agricultural land. Result also shows
that between 1990 and 2013, the rate of urban growth encroachment on agricultural land was
9.61%. It was found out that urban growth has more negative effects than positive effects on
agricultural land. It was recommended that Government by way of policy should be strict in
preserving farmland from illegal occupation, in order to reduce the monitor reduction of farmlands
by human activities in Kuta and its environs, Shiroro Local Government of Niger State, Nigeria.
Local Government Track
Mohammed Abdulkadir and Amina Yusuf
Analysis of Urban Growth and Agricultural Land Use of Kuta in Shiroro L.G.A, Niger State, North-Central Nigeria
11th Esri Eastern Africa User Conference (EAUC)
2 – 4 November 2016|Acacia Premier Hotel, Kisumu, Kenya
76/141
Introduction
Urban growth had become a global phenomenon affecting all countries of the world, rich or poor.
This phenomenon became a challenge to most countries of the world, especially developing ones.
The high rates of population increases and consequently, the depletion of farmlands around rural,
and urban areas. In recent years, understanding the dynamics of urban growth, quantifying them
and subsequently predicting the same for a future period has attracted significant interest of
research. Growth of urban centers consumes farmland. This has resulted in low food productivity
(Groot et al. 2002, Curran and de Sherbinin 2004)
Nigeria being a developing nation has most of it population dwelling in rural areas, this is because
they mainly engage in primary activities, and their dependences much on the natural environment
for their livelihood. Among these primary activities, is agriculture, which has being the most vital
and predominant activity. The rapid increase in population has placed great demands on the
available living space. As the population increases, there is need to provide residence and
infrastructural facilities (i.e. road, water supply, electricity, sewerage and drainage) for the entire
populace, leading to the conversion of agricultural land to build-up areas at an incredible rate and
decreasing the size of lands for agriculture (Nuissl et al. (2008).
Urban growth has been criticized for eliminating agricultural lands, spoiling water quality, and
causing air pollution (Allen and Lu, 2003). As population increases, so does the need for new
housing, schools, transportation and other civic amenities increases at the expense of agricultural
land (Wilson et al 2003).
The technologies of Geographical Information Systems (GIS) and Remote Sensing have been
combined to detect changes in urban growth and project the rate of urban encroachment in a way
which is easier and faster than the traditional methods of surveying the urban environment. In this
study, 1990, 2001and 2013years period land-use changes in Kuta and its environs were examined.
To access the effects of urban growth on agricultural land in Kuta town and its environs and
analyze change detection on Farmland using multi-temporal Remote Sensing data and GIS based
techniques, to identify Land use land cover (LULC. The main LULC types identified were the bare
ground, built-up, water body, vegetation and farmland.
Study Area
Kuta is the Headquarter of Shiroro Local Government of Niger State. The study area lies between
latitude 9°50̍25̎and 10°04̍18̎ North and longitude 6°51̍16̎ and 6°82̍82̎ East, on a geological base of
undifferentiated basement complex of mainly gneiss and magnetite. It is bounded by Gurmana and
Erena to the north, Zumba (Shiroro hydro-electric power station) to the northeast, Shata to the
southwest and Gijuwa to the west respectively.
It is located in a tropical climatic zone, experiencing distinct wet and dry season with annual
rainfall varying from between 110mm and 1600mm. The rainfall characteristics of the study area
are from March to Octobe. In April, rainfall is at 70mm or more, covering the central part of the
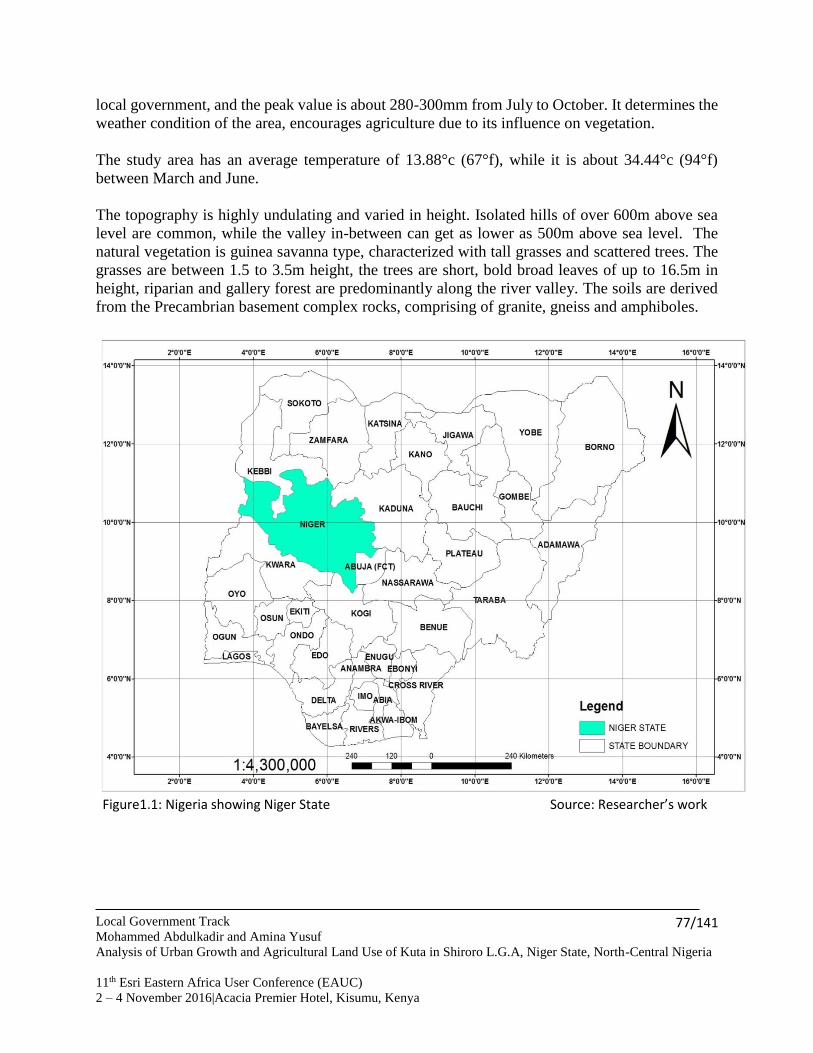
Local Government Track
Mohammed Abdulkadir and Amina Yusuf
Analysis of Urban Growth and Agricultural Land Use of Kuta in Shiroro L.G.A, Niger State, North-Central Nigeria
11th Esri Eastern Africa User Conference (EAUC)
2 – 4 November 2016|Acacia Premier Hotel, Kisumu, Kenya
77/141
local government, and the peak value is about 280-300mm from July to October. It determines the
weather condition of the area, encourages agriculture due to its influence on vegetation.
The study area has an average temperature of 13.88°c (67°f), while it is about 34.44°c (94°f)
between March and June.
The topography is highly undulating and varied in height. Isolated hills of over 600m above sea
level are common, while the valley in-between can get as lower as 500m above sea level. The
natural vegetation is guinea savanna type, characterized with tall grasses and scattered trees. The
grasses are between 1.5 to 3.5m height, the trees are short, bold broad leaves of up to 16.5m in
height, riparian and gallery forest are predominantly along the river valley. The soils are derived
from the Precambrian basement complex rocks, comprising of granite, gneiss and amphiboles.
Figure1.1: Nigeria showing Niger State Source: Researcher’s work
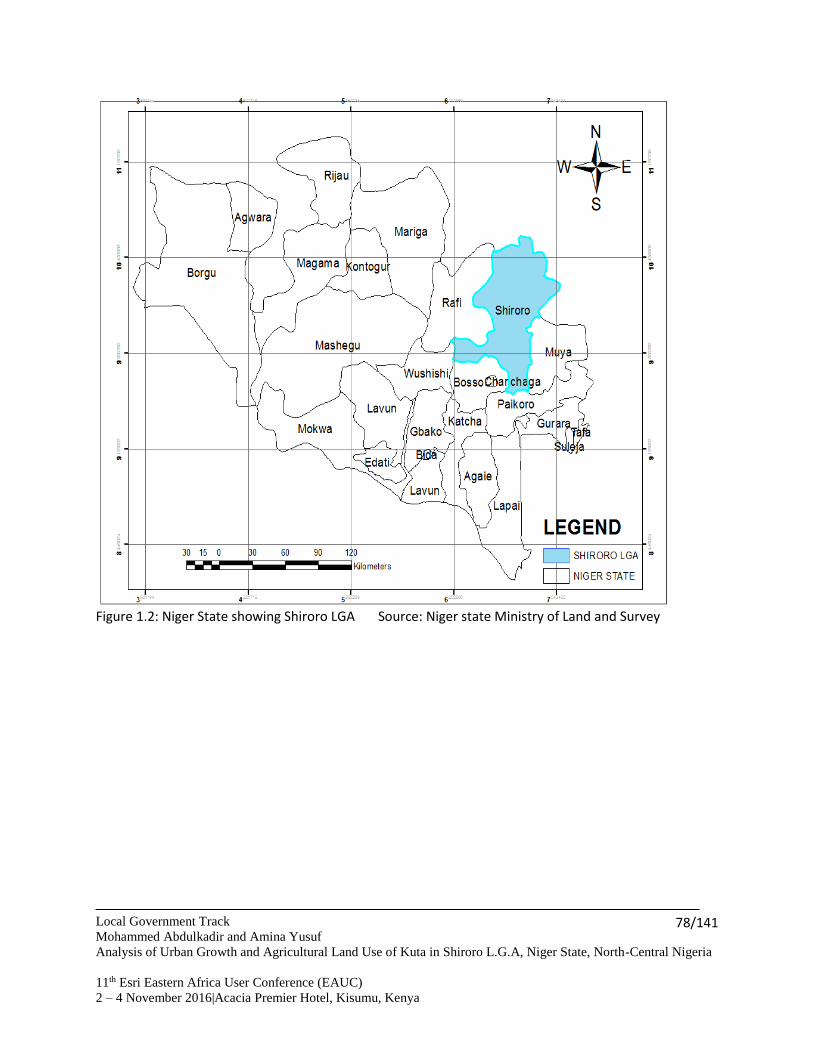
Local Government Track
Mohammed Abdulkadir and Amina Yusuf
Analysis of Urban Growth and Agricultural Land Use of Kuta in Shiroro L.G.A, Niger State, North-Central Nigeria
11th Esri Eastern Africa User Conference (EAUC)
2 – 4 November 2016|Acacia Premier Hotel, Kisumu, Kenya
78/141
Figure 1.2: Niger State showing Shiroro LGA Source: Niger state Ministry of Land and Survey
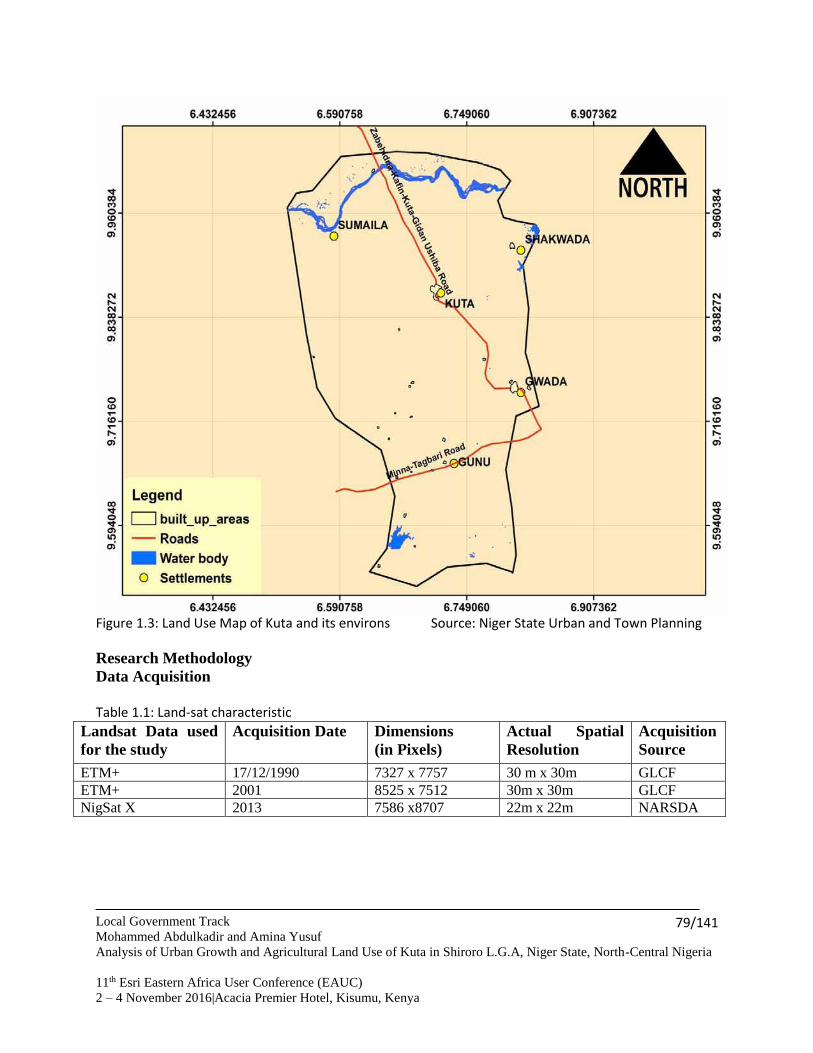
Local Government Track
Mohammed Abdulkadir and Amina Yusuf
Analysis of Urban Growth and Agricultural Land Use of Kuta in Shiroro L.G.A, Niger State, North-Central Nigeria
11th Esri Eastern Africa User Conference (EAUC)
2 – 4 November 2016|Acacia Premier Hotel, Kisumu, Kenya
79/141
Figure 1.3: Land Use Map of Kuta and its environs Source: Niger State Urban and Town Planning
Research Methodology
Data Acquisition Table 1.1: Land-sat characteristic
Landsat Data used
for the study
Acquisition Date Dimensions
(in Pixels)
Actual Spatial
Resolution
Acquisition
Source
ETM+ 17/12/1990 7327 x 7757 30 m x 30m GLCF
ETM+ 2001 8525 x 7512 30m x 30m GLCF
NigSat X 2013 7586 x8707 22m x 22m NARSDA
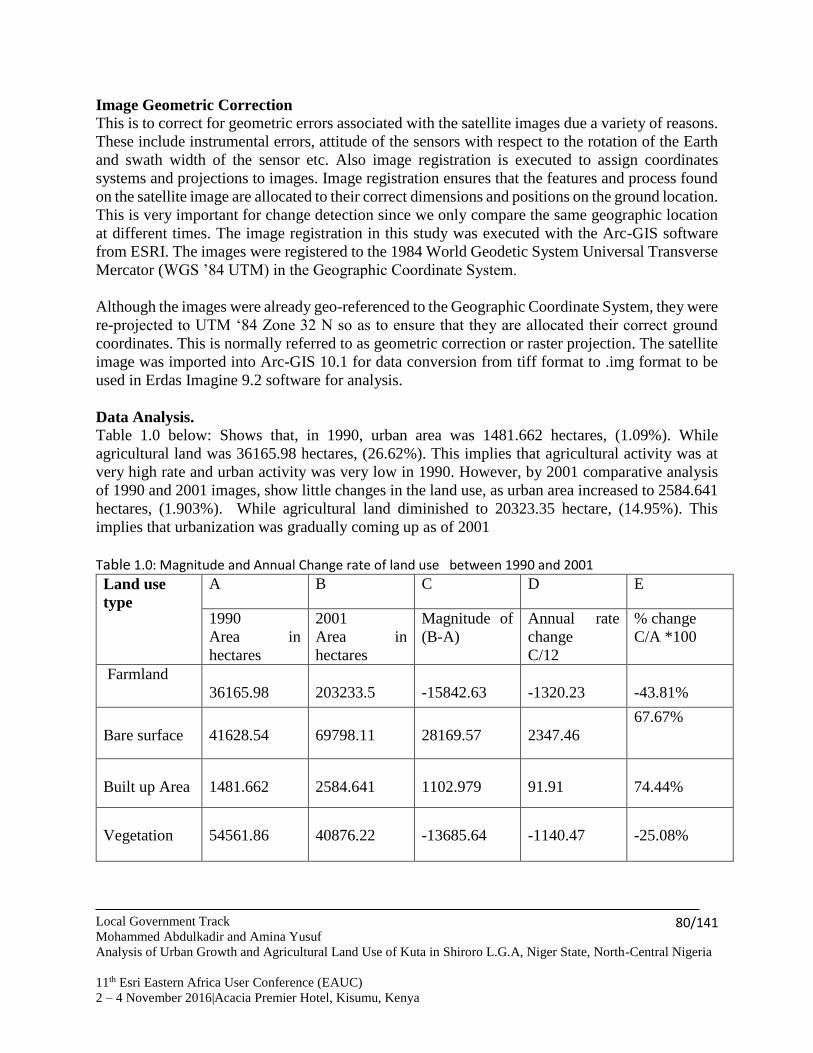
Local Government Track
Mohammed Abdulkadir and Amina Yusuf
Analysis of Urban Growth and Agricultural Land Use of Kuta in Shiroro L.G.A, Niger State, North-Central Nigeria
11th Esri Eastern Africa User Conference (EAUC)
2 – 4 November 2016|Acacia Premier Hotel, Kisumu, Kenya
80/141
Image Geometric Correction
This is to correct for geometric errors associated with the satellite images due a variety of reasons.
These include instrumental errors, attitude of the sensors with respect to the rotation of the Earth
and swath width of the sensor etc. Also image registration is executed to assign coordinates
systems and projections to images. Image registration ensures that the features and process found
on the satellite image are allocated to their correct dimensions and positions on the ground location.
This is very important for change detection since we only compare the same geographic location
at different times. The image registration in this study was executed with the Arc-GIS software
from ESRI. The images were registered to the 1984 World Geodetic System Universal Transverse
Mercator (WGS ’84 UTM) in the Geographic Coordinate System.
Although the images were already geo-referenced to the Geographic Coordinate System, they were
re-projected to UTM ‘84 Zone 32 N so as to ensure that they are allocated their correct ground
coordinates. This is normally referred to as geometric correction or raster projection. The satellite
image was imported into Arc-GIS 10.1 for data conversion from tiff format to .img format to be
used in Erdas Imagine 9.2 software for analysis.
Data Analysis.
Table 1.0 below: Shows that, in 1990, urban area was 1481.662 hectares, (1.09%). While
agricultural land was 36165.98 hectares, (26.62%). This implies that agricultural activity was at
very high rate and urban activity was very low in 1990. However, by 2001 comparative analysis
of 1990 and 2001 images, show little changes in the land use, as urban area increased to 2584.641
hectares, (1.903%). While agricultural land diminished to 20323.35 hectare, (14.95%). This
implies that urbanization was gradually coming up as of 2001
Table 1.0: Magnitude and Annual Change rate of land use between 1990 and 2001 Land use
type
A B C D E
1990
Area in
hectares
2001
Area in
hectares
Magnitude of
(B-A)
Annual rate
change
C/12
% change
C/A *100
Farmland
36165.98
203233.5
-15842.63
-1320.23
-43.81%
Bare surface
41628.54
69798.11
28169.57
2347.46
67.67%
Built up Area
1481.662
2584.641
1102.979
91.91
74.44%
Vegetation
54561.86
40876.22
-13685.64
-1140.47
-25.08%
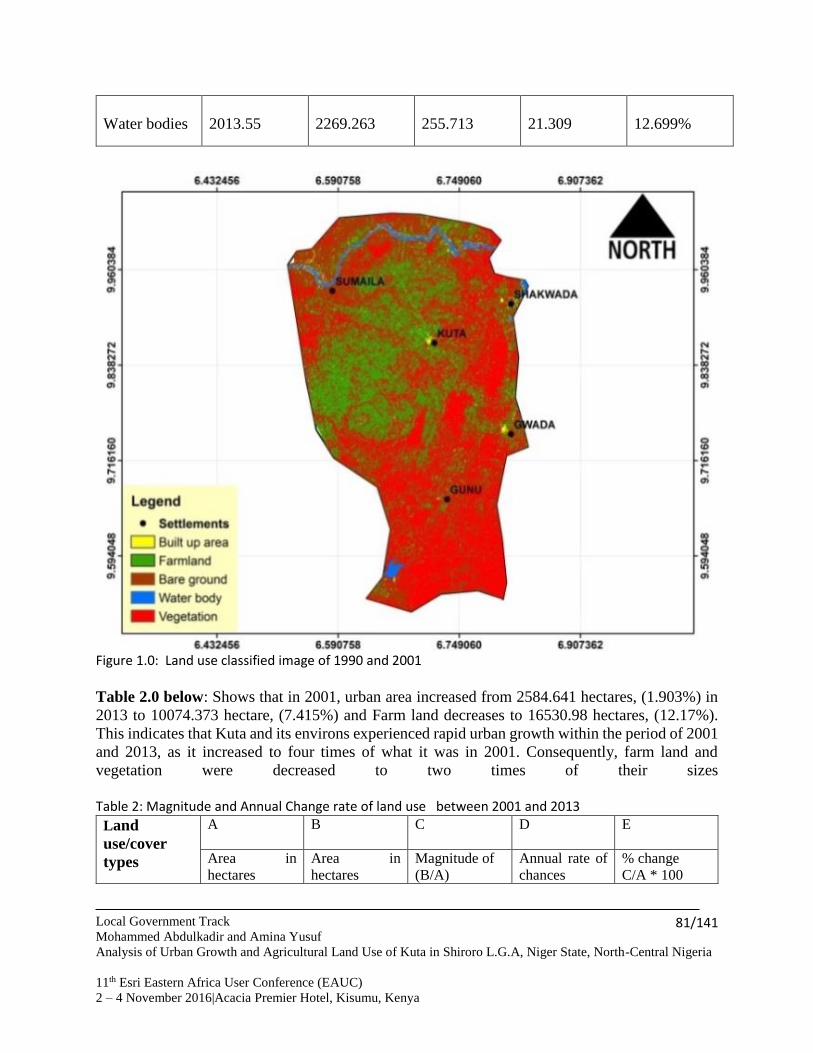
Local Government Track
Mohammed Abdulkadir and Amina Yusuf
Analysis of Urban Growth and Agricultural Land Use of Kuta in Shiroro L.G.A, Niger State, North-Central Nigeria
11th Esri Eastern Africa User Conference (EAUC)
2 – 4 November 2016|Acacia Premier Hotel, Kisumu, Kenya
81/141
Figure 1.0: Land use classified image of 1990 and 2001
Table 2.0 below: Shows that in 2001, urban area increased from 2584.641 hectares, (1.903%) in
2013 to 10074.373 hectare, (7.415%) and Farm land decreases to 16530.98 hectares, (12.17%).
This indicates that Kuta and its environs experienced rapid urban growth within the period of 2001
and 2013, as it increased to four times of what it was in 2001. Consequently, farm land and
vegetation were decreased to two times of their sizes
Table 2: Magnitude and Annual Change rate of land use between 2001 and 2013
Land
use/cover
types
A B C D E
Area in
hectares
Area in
hectares
Magnitude of
(B/A)
Annual rate of
chances
% change
C/A * 100
Water bodies
2013.55
2269.263
255.713
21.309
12.699%

Local Government Track
Mohammed Abdulkadir and Amina Yusuf
Analysis of Urban Growth and Agricultural Land Use of Kuta in Shiroro L.G.A, Niger State, North-Central Nigeria
11th Esri Eastern Africa User Conference (EAUC)
2 – 4 November 2016|Acacia Premier Hotel, Kisumu, Kenya
82/141
2001 2013
Farm land
20323.35
16530.98
-3792.37
-316.03
-18.66%
Bare surface
69298.11
77436.26
7638.1
636.51
10.94%
Built up Area
2584.641
10074.373
7489.732
624.14
289.78%
Vegetation
40876.22
29496.6
-11379.62
-948.30
-27.84%
Water bodies
2269.263
2313.42
44.157
3.68
1.95%

Local Government Track
Mohammed Abdulkadir and Amina Yusuf
Analysis of Urban Growth and Agricultural Land Use of Kuta in Shiroro L.G.A, Niger State, North-Central Nigeria
11th Esri Eastern Africa User Conference (EAUC)
2 – 4 November 2016|Acacia Premier Hotel, Kisumu, Kenya
83/141
Figure 2.0.: Extent of Land use image classification between 2001 and 2013
Table 3 below: Shows that in the year 1990, water body covered an area of 2013.55 hectares,
(1.482%); built-up area covered an area of 1481.662 hectares, (1.090%); farmland covered an area
of 36165.98 hectares, (26.62%); bare ground covered an area of 41628.54 hectares, (30.46%) and
vegetation covered an area of 54561.86 hectares, (40.16%).In the year 2001, water body increased
to 2269.263 hectares, (1.67%); built-up area increased to 2584.641 hectares, (1.903%); farmland
decreased to 20323.35 hectares, (14.95%); bare ground increased to 69798.11 hectares, (51.37%)
and vegetation also decreased to 40876.22 hectares, (30.08%). While in the year 2013, water body
increased from what it was in 2001 to 2313.42 hectares, (1.702%); built-up area drastically
increased to 10074.37 hectares, (7.415%); farmland decreased to 16530.98 hectares, (12.17%);
bare ground increased to 77436.21 hectares, (57%) and finally the vegetation decreased to 29496.6
hectares, (21.71%) as illustrated in 3. Table 3: Magnitude and Annual Change rate of land use between 1990 and 2013
Land use/cover
Types
Area
(Hectare)
(%)
Area
( Hectare )
(%)
Area
( Hectare )
(%)
1990 2001 2013
Water body 2013.55 1.482 2269.263 1.670 2313.42 1.702
Built up area 1481.662 1.090 2584.641 1.903 10074.373 7.415
Farmland 36165.98 26.62 20323.35 14.95 16530.98 12.17
Bare ground 41628.54 30.64 69798.11 51.37 77436.21 57.00
Vegetation 54561.86 40.16 40876.22 30.08 29496.6 21.71
TOTAL AREA 135851.582 100 135851.582 100 135851.582 100
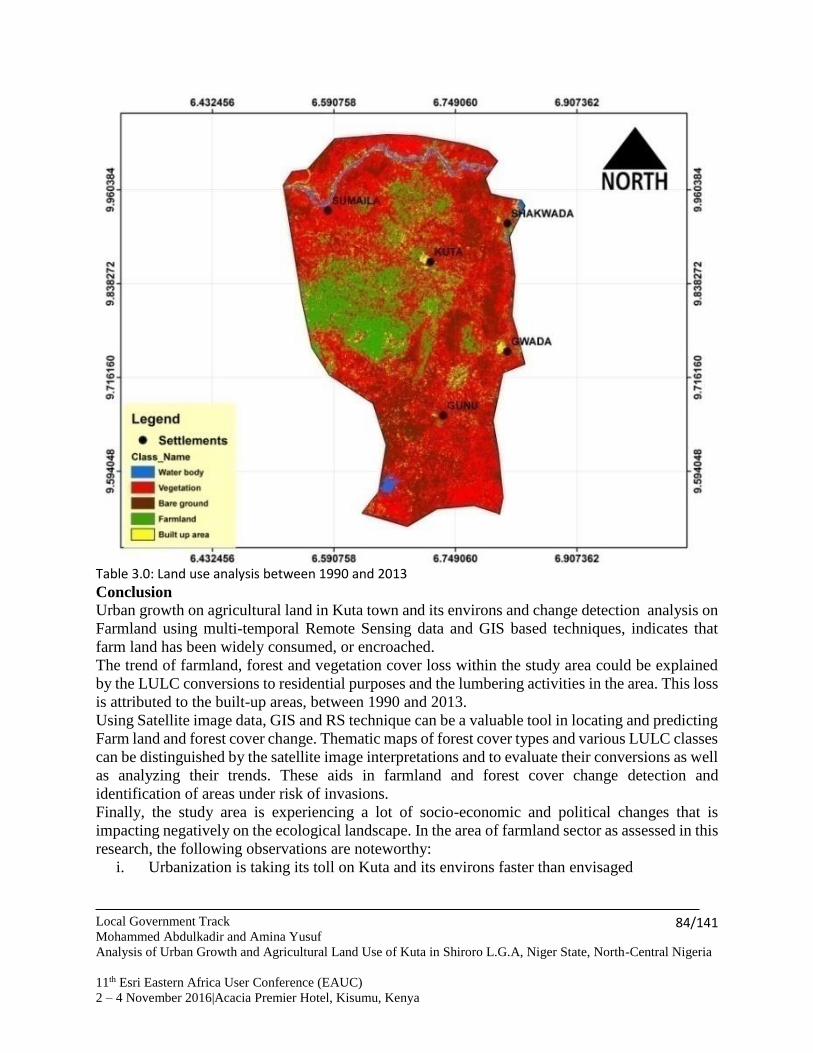
Local Government Track
Mohammed Abdulkadir and Amina Yusuf
Analysis of Urban Growth and Agricultural Land Use of Kuta in Shiroro L.G.A, Niger State, North-Central Nigeria
11th Esri Eastern Africa User Conference (EAUC)
2 – 4 November 2016|Acacia Premier Hotel, Kisumu, Kenya
84/141
Table 3.0: Land use analysis between 1990 and 2013
Conclusion
Urban growth on agricultural land in Kuta town and its environs and change detection analysis on
Farmland using multi-temporal Remote Sensing data and GIS based techniques, indicates that
farm land has been widely consumed, or encroached.
The trend of farmland, forest and vegetation cover loss within the study area could be explained
by the LULC conversions to residential purposes and the lumbering activities in the area. This loss
is attributed to the built-up areas, between 1990 and 2013.
Using Satellite image data, GIS and RS technique can be a valuable tool in locating and predicting
Farm land and forest cover change. Thematic maps of forest cover types and various LULC classes
can be distinguished by the satellite image interpretations and to evaluate their conversions as well
as analyzing their trends. These aids in farmland and forest cover change detection and
identification of areas under risk of invasions.
Finally, the study area is experiencing a lot of socio-economic and political changes that is
impacting negatively on the ecological landscape. In the area of farmland sector as assessed in this
research, the following observations are noteworthy:
i. Urbanization is taking its toll on Kuta and its environs faster than envisaged
Local Government Track
Mohammed Abdulkadir and Amina Yusuf
Analysis of Urban Growth and Agricultural Land Use of Kuta in Shiroro L.G.A, Niger State, North-Central Nigeria
11th Esri Eastern Africa User Conference (EAUC)
2 – 4 November 2016|Acacia Premier Hotel, Kisumu, Kenya
85/141
ii. The urbanization growth rate of the area is increasing significantly from 1.090 to 7.415
hectare between l990 to 2013.
iii. A total of 19635 Ha of farmlands had been lost to urban growth within 23 years period
under study, which has led to food insecurity.
References Allen, J., Lu K. 2003. Modeling and Prediction of Future Urban Growth in the Charleston Region of South
Carolina: GIS-based Integrated Approach. Conservation Ecology 8 (2): 2.
Batty M. (2008), The size, scale and shape of cities, Science 319-771.
Bhatta, Basudeb, 2010, Analysis of urban growth and sprawl from sensing data. Springer
Curran S. R. and De Sherbinin A. (2004), Completing the Picture: The Challenges of Bringing
“Consumption” into Population, Environment Equation, Population and Environment, 26 (2): 107-131.
De Groot R. S., Wilson M. A. and Boumans R. M. J. (2002), A typology for the classification, description
and valuation of ecosystem functions, goods and services, Ecological Economics, 41 (3): 393-408.
Nelson AC (1999). Analysis based on indicators with policy implications. Land Use Policy, 16: 121-127.
Wilson, E.H., Hurd, J.D., Civco, D.L., Prisloe, M.P., Arnold, C. 2003. Development of a geospatial model
to quantify describe and map urban growth. Remote Sensing of Environment 86: 275-285.
Contacts
Email:[email protected]
Email: [email protected]
National Government
Enhancing quality of life is the goal. Proven location-based technology is the key to achieving it.

National Government Track
Mary Wandia
A Geographic information System driven integrated land management System
11th Esri Eastern Africa User Conference (EAUC)
2 – 4 November 2016|Acacia Premier Hotel, Kisumu, Kenya
87/141
A Geographic information System driven integrated land management
System
Mary Wandia, Kenya
National Lands Commission
Key words: GIS, NLIMS, workflows, integrated system
Abstract The National Land Commission is currently developing a National Land Information Management System
(NLIMS). This is a parcel-centric based Geographic Information System (GIS) solution geared towards
automating land processes and procedures. The system is to be implemented using a five-phase strategy.
So far, phase 1 has been implemented with the setting up of infrastructure, system design and development,
integration of GIS with other systems and automation of land processes which include land administration,
valuation, settlement and adjudication. Once finalized, the system will support all components in land
administration using an integrated approach. The integrated system is based on Microsoft SQL server,
Dynamics NAV, SharePoint and ArcGIS solutions. In retrospect, it will enhance provision of land
management services and provide a platform for citizen interaction through an online portal featuring free
services and for pay services.

National Government Track Mary Wandia A Geographic information System driven integrated land management System 11th Esri Eastern Africa User Conference (EAUC) 2 – 4 November 2016|Acacia Premier Hotel, Kisumu, Kenya
88/141
Introduction The National Land Commission has been mandated to manage public land on behalf of the national & county governments as outlined in the National Land Commission Act, 2012 Section 5 (2) (d) (GoK, 2009: Gunk, 2012). This implementation shall be at both national and county level. Currently, the Commission is in the process of implementing a National Land Information Management System (NLIMS) to streamline, harmonize and improve service delivery to stakeholders in land matters and the general public. Theoretically, NLIMS is a system that comprises of sub-systems to support processes of the components of land administration1 in Kenya (See Error! Reference source not found. below). In this context, system efinition comprises (i) software, (ii) data, (iii) workflows (procedures & processes), (iv) network infrastructure and (v) staff. The system is designed to create, process, analyze and publish parcel-based data such as parcel information, location, zoning, land-use, ownership and any other general property information.
Figure 2 Components of land administration and management in Kenya Prior to the establishment of the Commission, the line Ministry in charge of lands had in place an NLIMS strategy. NLIMS was conceptualized in Project for Improving Land Administration (PILAK) whose mandate was: safeguarding land paper records, developing business and IT architecture, modernizing the geodetic framework, parcel identification reform, develop land rent collection system, systematic conversion to RLA titles, develop other land administration systems and create public awareness. The basic building block in any land information system is the land parcel as identified in the cadaster. According to the International Federation of Surveyors (FIG) (1995), a cadaster is a parcel based, and up-to-date land information system containing a record of interests in land (e.g. rights, restrictions, responsibilities and risks). It usually includes a geometric description of land parcels (cadastral maps) linked to other records describing the nature of the interests, the ownership or control of those interests, and often the value of the parcel and its improvements. It may be established for fiscal purposes (e.g. valuation and equitable taxation), legal purposes (conveyancing), to assist in the management of land and land use (e.g. for planning and other administrative purposes), and enables sustainable development and environmental
1 The term ‘land administration’ as used here is based on a definition adopted by the United Nations Economic Commission for Europe (UN ECE). It refers to the processes of recording and disseminating information about the ownership, value, and use of land and its associated resources. This includes the determination of rights and other attributes of the land, the survey and description of land, its detailed documentation, and any other relevant information in support of land
National Government Track
Mary Wandia
A Geographic information System driven integrated land management System
11th Esri Eastern Africa User Conference (EAUC)
2 – 4 November 2016|Acacia Premier Hotel, Kisumu, Kenya
89/141
protection. From this viewpoint it is clear that while NLC is charged with implementing and maintaining
this system, there needs to be synergies and harmony in operations between the Commission, the land
registries, national mapping agency, county governments, and treasury as they all need portions of the
parcel based NLIMS.
From this view, NLIMS is an all-encompassing system. Some of the initial offerings that can be packaged
through the system include the ability by Kenyans, on the payment of applicable fees (using online or
mobile solutions) to perform searches of land parcels, ability to make applications online for various
services offered by the Commission and the Ministry, access to respective land data by professionals
registered in the system and ability for persons to visualize spatial locations of various parcels and some of
the information (attributes) held in the registry about the parcels. Additional functions to be implemented
should include support for various workflows allowing the update of registry information, survey data and
other transactions. Any system is as good as the data held in it and especially for a spatially supported one,
as the NLIMS will be, the quality of data is paramount. A lot of this data is in analog (hard copy) format
and it takes time to convert data. The conversion process should have in place various quality control and
quality assurance measures. The most costly part will be this conversion process, but it requires to be hosted
on capable and secure infrastructure.
Problem Statement Over the years, land administration in Kenya has been marred with a myriad of problems in what has been
largely associated with a lack of an efficient, computer-based Land Information Management System
(LIMS) (Kuria et al., 2016). The manual land administration system has led to missing land records (files),
inadequate space for records, multiple allocation of plots, forgeries and altering of land allocation,
encroachment, overlapping surveys, inefficient revenue generation and loss, rampant sub-division,
amendments and falsification survey information on land titles.
The country continues to experience growth in all its sectors of development including land which is
considered to be an important factor of production. For a long time land administration in Kenya has been
a relatively stable paper- based system which has accumulated millions of records and is now deemed
incompatible and ambiguous with the increased complex and high demand use of land. The paper-based
system is cumbersome with complete human effort required. Updating of records for land transactions, sub-
divisions, mortgages and other transfers depend on the tedious manual system which is painfully slow.
Land records are sometimes not easy to find because there are hardly back-up copies created in the manual
system. Updating of land records particularly spatial data is quite a challenge. Technical experts are forced
to edit manually on the map that have rendered them illegible, hard to derive specific information, torn and
dilapidated. Incidentally, there are no back up data of the sad maps.
Similarly, the manual system is time consuming where land records have to be shared from one department
to the other to facilitate whatever request required by a client. The paper-based files move slowly to and fro
the red tape structure. This decreases the productivity of land information handlers that has a lasting
negative in the public eye. It can also take a long period of time to search for a particular record. Security
is also not guaranteed to a certain level as the system allows ease in either copying, mishandling crucial
information or loosing data. Therefore, it is about time that the paper-based system be replaced by an
automated system which has proven to be efficient in land administration operations worldwide. This will
also facilitate timeliness and ease in accessing land information in a transparent and reliable manner that
will lead to securing more investments to meet the needs of the growing population.
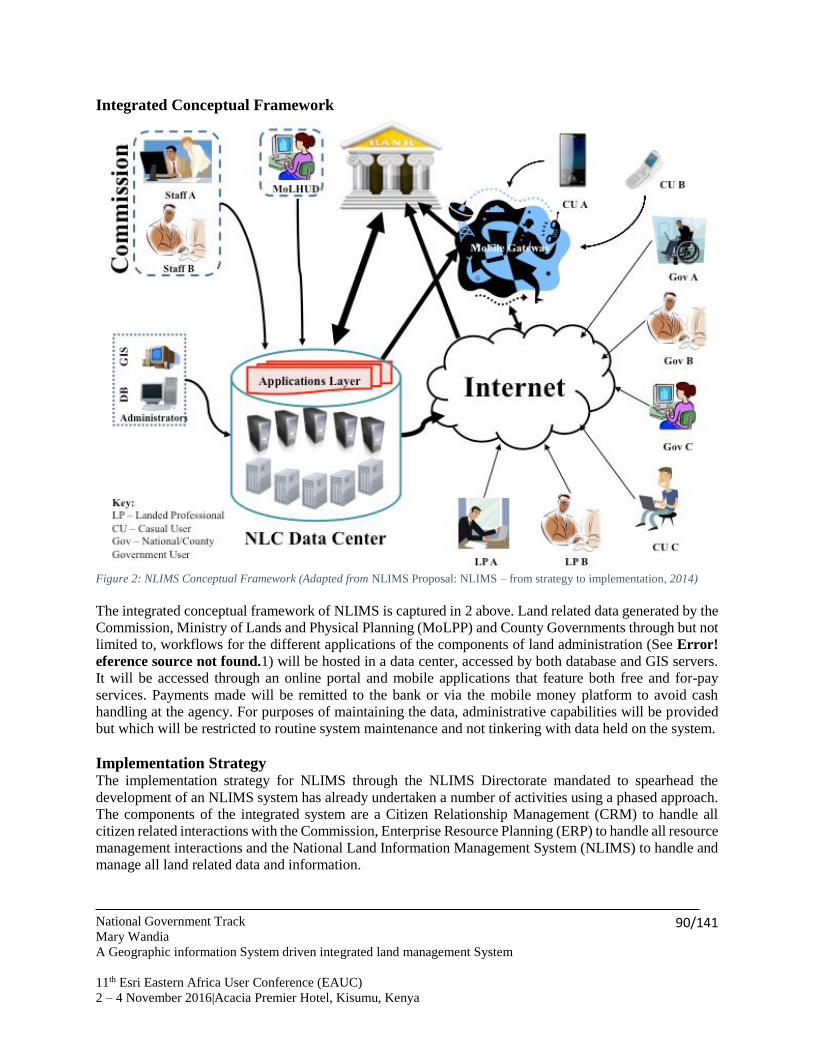
National Government Track
Mary Wandia
A Geographic information System driven integrated land management System
11th Esri Eastern Africa User Conference (EAUC)
2 – 4 November 2016|Acacia Premier Hotel, Kisumu, Kenya
90/141
Integrated Conceptual Framework
Figure 2: NLIMS Conceptual Framework (Adapted from NLIMS Proposal: NLIMS – from strategy to implementation, 2014)
The integrated conceptual framework of NLIMS is captured in 2 above. Land related data generated by the
Commission, Ministry of Lands and Physical Planning (MoLPP) and County Governments through but not
limited to, workflows for the different applications of the components of land administration (See Error!
eference source not found.1) will be hosted in a data center, accessed by both database and GIS servers.
It will be accessed through an online portal and mobile applications that feature both free and for-pay
services. Payments made will be remitted to the bank or via the mobile money platform to avoid cash
handling at the agency. For purposes of maintaining the data, administrative capabilities will be provided
but which will be restricted to routine system maintenance and not tinkering with data held on the system.
Implementation Strategy The implementation strategy for NLIMS through the NLIMS Directorate mandated to spearhead the
development of an NLIMS system has already undertaken a number of activities using a phased approach.
The components of the integrated system are a Citizen Relationship Management (CRM) to handle all
citizen related interactions with the Commission, Enterprise Resource Planning (ERP) to handle all resource
management interactions and the National Land Information Management System (NLIMS) to handle and
manage all land related data and information.
National Government Track
Mary Wandia
A Geographic information System driven integrated land management System
11th Esri Eastern Africa User Conference (EAUC)
2 – 4 November 2016|Acacia Premier Hotel, Kisumu, Kenya
91/141
Due to the sensitive nature of the land subject in Kenya, high availability and secure system guaranteeing
an all-round system availability is mandatory. This means that capable servers and network infrastructure,
secure data repositories and backup mechanisms, which have to be accessed from the headquarters and also
from the counties, have to be procured and commissioned. Given that most of the survey data and land
records data are still in paper form, there needs to be concerted efforts in conversion to forms ready for
digital consumption and dissemination.
This conversion goes beyond the mere scanning of documents and archiving of the same, but includes
extraction of information held in these documents and their storage in a well-designed database (Nkote,
2015). The extraction of the information varies depending on the type of documents: for non-spatial records,
these can be extracted by either manually reading off and entering the data in the database or by using
Optical Character Recognition (OCR) technology to read, decode and store the information; for spatial
records, these will be geo-referenced first and the spatial information captured by onscreen digitization or
tablet digitization thereafter. In both of the cases, the elaborate quality control and quality assurance
mechanisms alluded earlier will be enforced. Each parcel in existence has a history from when it was created
to its current state and each stage has documentation supporting the various transactions.
From this it can be seen that to have the system fully implemented, procurement of the system is the first
step (which is itself costly) acquisition and conversion of the data forms the main body of the system. It is
anticipated that the initial procurement of the system, development of some custom applications, some data
acquisition and conversion could well get into the region of 4 Billion Kenya Shillings spread over a three
– four year period, with the overall costs easily going to upwards of 20 Billion Kenya Shillings by 2030
when all records and graphical (survey and planning) data will have been converted and entered into the
system.
This project has come a long way, encompassing automation of all the land administration and management
business processes into digital workflows that have been diligently built into the Integrated National Land
Information Management System implementation featuring Land registration systems, Cadastral
Framework, and CRM. This system is a noble effort to make access to land administration service more
feasible and easy for Kenyan citizen and corruption free (however, this is debatable as to whether the
technology will bet the vice). Key components of the system are web based and has a greater beauty of tight
integration between the various components from Electronic Document Management System (eDMS),
workflow engine to cadastral framework and the CRM side. No more pools of technologies at different
departmental or organizational level. The systems leverage powerful and modern technologies to deliver
the end solution such as Microsoft (MS) SharePoint, ArcGIS System (JavaScript API for Web and the Land
Records Solutions), Custom built Document Management System (DMS), MS Dynamics CRM among
other technologies. Also, it’s important to note that every enterprise solution must ride on a well modeled
Information and for this, NLIMS is built on top of an adaptation of the Land Administration Domain Model
(LADM) (Lemmen, 2012), the ISO standard for Land administration.
Implementation progress A number of activities have already been put in place to propel the realization of the NLIMS strategy. These
are:
i) Enhancement of the capacity to implement NLIMS
The NLC was constituted slightly 3 year ago and it is thus, still a nascent organization with a huge mandate.
It embarked on a fairly ambitious goal of establishing its various units through a vigorous human resource
National Government Track
Mary Wandia
A Geographic information System driven integrated land management System
11th Esri Eastern Africa User Conference (EAUC)
2 – 4 November 2016|Acacia Premier Hotel, Kisumu, Kenya
92/141
recruitment exercise. Among the biggest beneficiaries of this effort was the NLIMS directorate, which now
has a core team of 13 specialists in Spatial Information Management as GIS developers and Spatial
Database experts. The model being considered by the Commission is where these core staff serve as Quality
Control officers in assuring quality of outsourced works and helping secure the data and systems given the
sensitivity of land information.
ii) Development of integrated systems
The NLIMS directorate developed system requirements (for phase one implementation) in conjunction with
the ICT directorate. Recognizing the integrated way in which the NLIMS and the other systems of the
Commission and the wider Government work, a tender for the supply of integrated systems solution was
published.
The successful bidder was awarded the contract at the beginning of the year 2015 and has already developed
and rolled out the ERP component of the integrated solution. The CRM part is steadily nearing completion
as all the Functional Requirement Documents (FRDs) have been agreed upon and customization of the
electronic Document Management Systems and CRM is well defined. The NLIMS component being
specific to Kenya requires more work as the various workflows driving land administration and
management processes in Kenya are largely unique, and the new legal dispensation in addition has modified
some processes with respect to the actors, meaning that some of the processes have changed radically. Most
of these workflows have been identified, the data model developed in line with the Land Administration
Domain Model (picking relevant pieces that apply to the Kenyan context) and bearing in mind the principles
of Cadastre 2014 (Kaufmann & Steudler, 1998), and programming and customization work is now in
progress.
iii) Establishment of a Spatial Data Conversion Laboratory
The engine of NLIMS is a data collection, reparation, collation and conversion unit, from which maps,
plans and other documents will be converted from. A tender for the supply of the equipment and software
to run in the unit, christened the NLIMS Laboratory, was awarded and established. This Laboratory is now
fully operational, with scanning and digitization work steadily going on. Some of the equipment in this
laboratory includes; scanners, plotters, GIS workstations and barcode scanners.
Given the nature of spatial referencing in Kenya, where we have 3 main types of spatial reference systems,
namely Universal Transverse Mercator (UTM), Cassini-Solder system and local coordinate systems, the
Directorate in conjunction with the National Mapping Agency (Survey of Kenya) is developing a
transformation scheme that will allow wall-to-wall seamless coverage of parcels countrywide.
iv) Development of NLIMS Standards and Guidelines
NLC is cooperating with counties in the development of specific components of LIMS at the county level
and other agencies dealing with parcel data. The NLC realizing the need to allow various agencies to get
along with implementing their own specific LIMS solutions, initiated the development of NLIMS standards
and guidelines with input and contributions from stakeholders in the land sector. These standards and
guidelines are to be used by data producers and stakeholders as they implement their versions of LIMS.
This approach allows the various agencies to focus on delivering on their mandates that may include
developing specific aspects of LIMS and allows the LIMS so developed to integrate with the NLIMS. The
standards and guidelines have already been gazetted.
National Government Track
Mary Wandia
A Geographic information System driven integrated land management System
11th Esri Eastern Africa User Conference (EAUC)
2 – 4 November 2016|Acacia Premier Hotel, Kisumu, Kenya
93/141
GIS Integration The GIS Module in the Integrated NLIMS has been built using the ArcGIS System and the cadastral
framework leverages the Parcel Fabric solution. The Parcel Information Management system is based on
the Parcel Fabric data model enabled with NLIMS Data Model. The NLIMS Data Model is a local
adaptation of the Land Administration Domain Model (LADM) to fit the Kenyan land administration
system. The Parcel Fabric specific attribute and properties have also been customized to fit in the local
cadastral framework. In the developed data model for NLIMS three primary classes have been created that
is the Parcel Feature Class (Managed exclusively through Parcel Fabric feature class to control quality as
far as accuracy and topological correctness is concerned, RRR (Rights, Restrictions and Responsibilities)
table as the possible interests that can be registered on a Land Parcel and Party table to represent the records
of the various entities that can have recorded interests of a particular land parcel These core classes are
related to other tables that hold critical secondary information that pertains to various element in the core
classes. The cadastral and parcel Information System for NLIMS are built to be managed primarily in the
ArcGIS Workspace featuring an Enterprise Geodatabase running on SQL Database Server hosted at the
NLC Data Center, ArcGIS Server for managing the Services consumed by other applications and the Map
Viewers, and ArcGIS Desktop leveraging the Parcel Fabric Solution from Esri Land Records Solutions.
Of key necessity to the Commission is the ability to record and maintain the chain of evidence of the
transitions on Parcel boundaries and attributes. Using Parcel Fabric solution for ArcGIS, the Integrated
NLIMS has been built to keep the chain of evidence of the transitions on parcels of land in the database as
Historic Parcels for the purpose of tracking the historic changes that occur in the parcel objects. Kenya as
a country that guarantees Titles as the legal document for land ownership, the validity of the titles or rights
on a parcel of land are based on the chain of evidence of previous survey and documents. The maintenance
of the chain of boundary delineation and record changes over time is essential. New survey on land parcels
cannot be conducted without surveyors accessing the evidence of the previous boundary delineation and
the records.
The Cadaster and LIS have been integrated with other applications to allow consumption of the Parcel
Information within these other applications used by other departments and institutions. Land
Administration business processes have been digitized into workflows that have been implemented on
SharePoint Foundation Server to deliver a public facing portal for accessing the processes as online services
and an internal portal for administrative operation on the business processes. On the other hand customer
service portal built using the Dynamics CRM for exposing query management services to the public has
been delivered as a component of the integrated system. These key components of NLIMS have been
integrated with the LIS/Cadastral component via Web Services to allow for consumption of the GIS Server
services through them. With the integration Parcel Information can be accessed from any of the three
components.
Conclusion NLIMS is an integrating solution, allowing various data providers to manage their data generation and
maintenance on the platform, and allowing linking of all land related data, and the subsequent merging and
sharing of these information from a unified platform. This allows data producers to manage their
components according to the uniqueness and complexity of their workflows and structuring of their data.
Adherence to the Standards and Guidelines will help in strengthening the integration of system components.
Cooperation, collaboration and consultation are key to successful integration of all the units. Without
genuine partnership driven by a common interest in reforming land information management, it will be
difficult to integrate the individual elements. Mutual mistrust and unnecessary competition is detrimental

National Government Track
Mary Wandia
A Geographic information System driven integrated land management System
11th Esri Eastern Africa User Conference (EAUC)
2 – 4 November 2016|Acacia Premier Hotel, Kisumu, Kenya
94/141
to realizing an integrated solution. This development has to have all the players speaking the same language
and working to leverage the strengths that each of the unit possesses.
Digitization of all paper records is very important, but automation of all workflows is crucial to sustainable
system. Automation of workflows is critical to ensuring sustainability of the system. In this way, data
remains current as data is updated and maintained through the automated workflows.
Decentralizing of the implementation allows breaking of the huge system into smaller more manageable
components. This allows for the disaggregation of financing, efficient allocation of project management
efforts and ease of monitoring since smaller components would be in consideration.
Change management is critical to the successful usage of the system across the country. Rolling out of the
system will in some cases require a transition from a paper based system to a digital system. This calls for
the reassurance of officers that they will not be affected negatively, but rather that, these systems will
enhance service delivery and increase their productivity. In addition, fitting training programs will help in
easing absorption and usage of the system developed.
Reference FIG (1995). FIG Commission 7 Statement on the Cadastre. Retrieved from
www.fig.net/commission7/reports/cadastre/statement_on_cadastre.html
GoK (2012). The National Land Commission Act. Government Press, Nairobi
GoK (2009). The National Land Policy. Government Press, Nairobi
Kaufmann, J. & Steudler, D. (1998). Cadastre 2014: A vision for a future Cadastral System. Paper
presented at the 1st Congress on cadaster in the European Union. Granada, Spain
Kuria, D., Ngigi, M., Gikwa, C., Mundia C., Kibui S., Omondi, S., Thaa, B., & Macharia M. (2016).
Improving the State of Land Administration on developing countries: a Case of LADM for Kenya
– Opportunities & Challenges. Paper presented at the World Bank Conference of Land and Poverty
Washington DC, 2016.
Kuria, D. (2014). NLIMS Proposal: NLIMS – from strategy to implementation. NLC Press, Nairobi
Lemmen, C. (2012). A Domain Model for Land Administration. University of Twente, Enschede
Kote, N.I. (2015). Land Administration and Automation in Uganda Makerere University Business School,
Kampala. Retrieved fromhttp://cdn.intechopen.com/pdfs-wm/37998.pdf
National Government Track
Robert Wayumba, Ntonjira Lizahmy
Challenges of Developing Land Information Management Systems (LIMS) for County Governments in Kenya
11th Esri Eastern Africa User Conference (EAUC)
2 – 4 November 2016|Acacia Premier Hotel, Kisumu, Kenya
95/141
Challenges of Developing Land Information Management Systems (LIMS) for
County Governments in Kenya
ROBERT Wayumba and Ntonjira LIZAHMY
Technical University of Kenya
Key Words: Land Information Systems, Counties
Abstract
This paper describes the challenges of developing a Land Information Management Systems
(LIMS) for County Governments in Kenya. In most developing countries land information is still
held in paper format, which can be destroyed through wear and tear and can also be difficult to
retrieve. In order to improve land administration services, there is a need to develop digital LIMS.
In addition, according to the County Government Act, 2012 in Kenya, all County Governments
are supposed to develop digital Geographic Information Systems (GIS) based Spatial Plans that
should include land information. Despite the need for LIMS, there are multiple challenges that
face implementation of the systems. In this regard, there is a need to study the challenges, as a
means of averting them in future LIMS initiatives. This paper uses case study methodology to
document challenges that were encountered in developing part of a LIMS for Kerugoya County.
The results show the legal, social, political, technical and economic challenges that were
encountered in the project. The conclusion is that there is a need to establish means of resolving
the challenges if effective LIMS are to be implemented not only in County Governments in Kenya,
but also in other developing countries.
National Government Track
Robert Wayumba, Ntonjira Lizahmy
Challenges of Developing Land Information Management Systems (LIMS) for County Governments in Kenya
11th Esri Eastern Africa User Conference (EAUC)
2 – 4 November 2016|Acacia Premier Hotel, Kisumu, Kenya
96/141
Introduction
Implementation of Land Information Management Systems (LIMS) can contribute towards
economic growth and development in a country. In this case, a LIMS can be described as a
computerized system for managing land records, which usually consist of property boundaries and
related attribute data (Dale & McLaughlin, 2000). The LIMS can contribute towards development
by: enhancing land ownership security, increasing access to credit, enabling development of land
markets, reducing land disputes, enabling land taxation and land reforms among other possible
benefits (Williamson, Enemark, Wallace, & Rajabifard, 2010).
Despite the possible benefits of LIMS, many developing countries continue to hold paper based
land records. In essence, land records usually consist of maps and records related to the land. The
maps are usually developed by cadastral surveyors and include the spatial extent of the land and
its area (Larsson, 1991). The attributes related to the land normally include the proprietor’s name,
any encumbrances on the land, size of the land and legal system in which the land is registered
among other aspects (Simpson, 1976). These records are usually held in paper files which are
susceptible to wear and tear and which can also get lost (Kuria, Ngigi, Gikwa, Mundia, &
Macharia, 2016). If the paper records get lost or destroyed, very valuable information on land
ownership and any encumbrances on the land may be lost forever.
Implementation of LIMS is also hindered by the low extent of formal land registration in
developing countries. In general, land registration describes the method through which matters
concerning ownership or other rights to land are recorded (Zevenbergen, 2002). The type of
registration can be based on a deeds system, a title system or an improved deeds system (Simpson,
1976). According to a World Bank report that was released in 2003, in Sub-Saharan Africa
countries, only about 10 percent of the land has been formally registered (Deininger & others,
2003). In 2013, a more optimistic outlook was provided for all developing countries in the World,
in which only about 30 percent of the land has been registered (Zevenbergen, Augustinus, Antonio,
& Bennett, 2013). Nonetheless, the figure is still very low. Hence, one of the reasons why most
countries in Sub-Sahara Africa continue to be poor has been attributed to the lack of extensive
coverage of land registration and lack of LIMS (De Soto, 2000). Therefore, there is a need to
explain challenges that hinder implementation of LIMS, as a means of enabling solutions to be
established, to allow for economic growth and development.
Methodology
In order to explain the challenges associated with implementation of LIMS, case study
methodology was selected as the main form of inquiry for this paper. The methodology was
selected because it is suitable when a phenomenon under investigation is not easily distinguished
from its context and it allows the use of qualitative analysis (Eisenhardt & Graebner, 2007). The
methodology was also selected because it is a recommended form of inquiry for research on land
administration issues (Çağdaş & Stubkjaer, 2009).
The case study that was selected is part of a project on implementation of LIMS for Kerugoya
County in Kenya. In Kenya, according to the County Government Act, 2012, all County
National Government Track
Robert Wayumba, Ntonjira Lizahmy
Challenges of Developing Land Information Management Systems (LIMS) for County Governments in Kenya
11th Esri Eastern Africa User Conference (EAUC)
2 – 4 November 2016|Acacia Premier Hotel, Kisumu, Kenya
97/141
Governments are supposed to have Geographic Information Systems (GIS) based spatial plans. As
a result, The Technical University of Kenya, carried out a pilot project on how part of the GIS,
which deals with land records i.e. the LIMS, can be implemented. Thus, this paper provides some
of the challenges that were encountered in the project. The main aim is to enable better
implementation of LIMS, not only in the County, but also in other parts of Kenya and other
developing countries. The following section shows the legal, political, social, technical and
economic challenges that were faced in the project.
Results and Findings
Legal challenge There were some legal challenges during the initial stages of the project. The first legal challenge
was associated with contractual agreements between the university and the county. At the
inception stage, there was a need for the two institutions to sign a Memorandum of Understanding
(MoU). There was a need to agree on dispute resolution mechanisms, extension of time if the
consultant did not deliver the project in time, and a need to resolve perceived loss of power by
some institutions in the county. A major part of these challenges were resolved, and the two
institutions were able to sign a MoU.
A key legal challenge was lack of a clear legal roadmap on how to implement the system. At the
moment, there are no formal guidelines on how LIMS should be implemented in Kenya. As a
result, there is no Act of Parliament that describes how the computerized land records would be
managed as opposed to the existing manual records. In the manual system, the mandate of various
actors in producing formal land records is clear. As an example, the Director of Surveys is
responsible for authenticating cadastral maps, while the land registry is responsible for producing
title deeds (Njuki, 2001). In the project, it was not clear how the digital records would be handled
be handled by the various institutions, which created some hesitation on the project. At the
moment, the National Land Commission (NLC) is in the process of developing Standards and
Guidelines that will most likely be used to implement LIMS at both the National and County levels
in Kenya (Kuria, Kasaine, Khalif, & Kinoti, 2016).
Another legal challenge is that there were many unresolved land disputes, which made it difficult
to identify legitimate land owners. In the process of developing a LIMS, there is a need to capture
land ownership records (Dale & McLaughlin, 2000). In the study area, identification of land
owners was first carried out by the colonial and post-independence Governments of Kenya. At
around 1960, the British Colonial government initiated a process of land adjudication in parts of
Kenya (Sorrenson & others, 1967). The aim of the adjudication exercise was to identify the people
who held rights to land and confer upon them ownership of land through formal registration. In
1963, The Republic of Kenya obtained independence from the British, and the independent
government continued with the process of land registration in the country (Sorrenson & others,
1967). A major challenge is that after the first registration was conducted, succession has not
occurred in most areas, hence current owners are not known. To this extent, there is a need for
succession to be completed in the counties as a means of enabling LIMS that will be implemented
to have accurate ownership information.

National Government Track
Robert Wayumba, Ntonjira Lizahmy
Challenges of Developing Land Information Management Systems (LIMS) for County Governments in Kenya
11th Esri Eastern Africa User Conference (EAUC)
2 – 4 November 2016|Acacia Premier Hotel, Kisumu, Kenya
98/141
Social challenges
In the implementation of information systems, social challenges are related to human factors that
can hinder planning, development and utilization of the systems (Laudon & Laudon, 2004). As a
result, implementation of LIMS requires an adequate assessment of user needs requirements
(Goodchild, 2009). In Kerugoya, the views of the users and stakeholders were many and
diversified. Thus, the consultant could not incorporate all the user needs within the limited time
frame of the project.
A few of the users were uneasy with the changes that would be introduced by the digital LIMS.
As stated earlier, in Kenya, various actors know their role in the process of developing and using
paper based land records. A proportion of the employees in the government were uneasy that the
digital system would make them redundant or require them to go through lengthy and expensive
training, which they could not afford. Thus, in order for LIMS to be properly implemented in any
jurisdiction, there is a need to allay the fears of existing staff members on the effects of
computerization.
Political challenges
Political challenges were also observed in the project. As much as these challenges could be
categorized as social, they are isolated because politicians play a major role in determining
development in their jurisdiction. According to Rakai, (1995), land information is a resource that
can be used for political gain. On the one hand, politicians can use the ignorance of people on land
information for political gain, to the detriment of the people. On the other hand, the information
can be used positively for the benefit of the people (Rakai & Willlamson, 1995).
In the study area, some politicians were against implementation of the system because it was too
expensive for the county to finance. Indeed, one of the major challenges that face introduction of
LIMS in most developing countries is that they are expensive to implement (Williamson et al.,
2010). However, on the other hand, the systems can contribute significantly to collection of
revenue, hence, justifying implementation costs (Williamson et al., 2010).
A number of the politicians were concerned that the system would have detrimental effects on
their political control. In this regard, the consultant had to carry out extensive sensitization of the
potential benefits of the system, as opposed to the fears of the people. Eventually, the political
challenges were overcome, and the project commenced. Nonetheless, the continued success of
implementation still requires goodwill from the politicians.
Technical challenges
There were also several technical challenges encountered in the project. The first technical
challenge was associated with very low extents of fixed boundary surveys in the county. In Kenya,
land registration is either based on Registry Index Maps (RIMS) or Deed Plans (Siriba, Voss, &
Mulaku, 2011). In the areas where registration has been introduced, approximately 80 percent is
covered by RIMS, which do not have any mathematical boundaries. The development of most of
National Government Track
Robert Wayumba, Ntonjira Lizahmy
Challenges of Developing Land Information Management Systems (LIMS) for County Governments in Kenya
11th Esri Eastern Africa User Conference (EAUC)
2 – 4 November 2016|Acacia Premier Hotel, Kisumu, Kenya
99/141
the RIMS was based on unrectified aerial photographs, which were not mathematically defined
(Siriba et al., 2011). In contrast, a few parts of the country are surveyed and boundaries depicted
on deed plans which have mathematical coordinates. A very large portion of Kerugoya County,
like many parts of Kenya, is covered with RIMS, which are not mathematically defined. In this
regard, it was very difficult to include the boundaries in an LIS, which requires mathematical
coordinates.
Another technical challenge is that RIMS are not updated. According to the law in Kenya, every
cadastral survey on land should be legally documented by updating survey plans or RIMS. In most
parts of Kenya, the original registered land owners have subsequently passed on the land to their
offspring or sold it off to other people. During the process of inheritance the land is usually divided
to the offspring and during a sale, a portion of the land can be divided to the seller. The inheritance
and sales are secured through informal agreements, or custom, as opposed to the formal system
(Cotula & Chauveau, 2007). As a result, the spatial changes on the ground are not reflected in the
RIMS. To this extent, when the consultant tried to input existing RIM data into the LIMS, there
were many discrepancies with existing boundaries on the ground, which have not been mapped.
There was also a challenge in the numbering system of the parcels on the map. At the initial stages
of the project, an assumption was made that the parcels would be sequentially numbered on the
RIMs. However, when the work started, it was realized that there was no systematic numbering
system in some parts of the county. In addition, some parcels on the ground did not have a known
number. In this regard, there is a need to develop a unique and legally recognized numbering
system for the parcels of land. Indeed, as stated by De Soto (2000), one of the reasons why
“Capitalism” fails in developing countries, is because most business are operated without a legal
description on where they can be found, hence cannot be taxed adequately (De Soto, 2000). To
remedy the situation, the National and County Governments need to develop a unique geocoding
system that can be used to identify each land parcel.
Another technical challenge was that at the time of implementation, no staff member in the county
had been trained on how to operate the LIMS. A major source of failure of information systems is
lack of adequately trained personnel (Laudon & Laudon, 2004). Thus, if the LIMS is to work, the
County government must invest in training staff members on how to use a LIMS. The training can
be in the form of short term or long term courses. In this regard, county officials who already have
a background in spatial sciences can be taken for short courses on the use of Geographic
Information Systems for land records management. If the county is able, it can also sponsor some
people on long term courses on LIMS.
Economic challenges
There were also economic challenges encountered in the project. In the process of capacity
building on land administration, there is a requirement that people should invest in what they can
manage (Williamson et al., 2010). Lack of adequate finances can hinder implementation of
necessary projects such as LIMS. Implementation of an effective LIMS is a big financial
undertaking for any country (Larsson, 1991). In the County, the finances were not enough to

National Government Track
Robert Wayumba, Ntonjira Lizahmy
Challenges of Developing Land Information Management Systems (LIMS) for County Governments in Kenya
11th Esri Eastern Africa User Conference (EAUC)
2 – 4 November 2016|Acacia Premier Hotel, Kisumu, Kenya
100/141
implement a fully functional LIMS. As a result, the project was a pilot of what could be done if
finances were fully available.
During the project, there were project overheads that had not been budgeted for. The project on
LIMS was one of the first attempts at introducing LIMS in the counties and was very innovative.
As stated earlier, it is also a legal requirement for the counties to implement GIS based spatial
plans. However, because these projects are being implemented for the first time, and without
standards and guidelines, there were bound to be some oversights. Thus, in the initial budget, the
number of personnel and equipment for implementing the project was underestimated. As an
example, during the user needs requirements, the finances budgeted for, were not adequate to
administer the questionnaire to all users that were supposed to be sampled.
The process of releasing project funds was also very slow. A major recommendation on how to re-
engineer land administration systems is related to reducing the number of steps required to obtain
legal documents (Williamson et al., 2010). In the project, there were many officials required to
sign documents before the release of funds. On the one hand, this was positive, because the number
of people would discourage misuse of funds. On the other hand, too many bureaucratic processes
slowed down the project.
Conclusion
The main conclusion from this paper is that the challenges facing implementation of LIMS should
be resolved if effective systems are to be implemented. The legal challenges should be resolved
by developing adequate standards and guidelines on how to implement and manage LIMS at both
National and County levels. In addition, the standards and guidelines should be translated into a
law that can be legally enforced. The social and legal challenges can be resolved by adequate
sensitization on the possible benefits of computerization. The technical challenges can be reduced
by improving on the existing cadastral maps. In essence, there is a need to update all cadastral
maps not only in the County but also in Kenya as a whole. Finally, the economic challenges can
be resolved through proper project planning and management. In this regard, if the finances are
limited, a systematic approach can be used for computerization, in which small portions of the
County are digitized, as opposed to tackling the whole county as a whole.
The authors hope that this paper will contribute towards implementation of effective Land
Information Management Systems (LIMS) that will contribute towards economic growth and
development in Kenya. The authors also recognize that further quantitative and qualitative studies
should be carried out to find out more details on the challenges that hinder implementation of
LIMS and how the challenges can be resolved.
References
Çağdaş, V., & Stubkjaer, E. (2009). Doctoral research on cadastral development. Land Use Policy,
26(4), 869–889.
Cotula, L., & Chauveau, J.-P. (2007). Changes in customary land tenure systems in Africa. Iied.
Retrieved from https://books.google.com/books?hl=en&lr=&id=-
National Government Track
Robert Wayumba, Ntonjira Lizahmy
Challenges of Developing Land Information Management Systems (LIMS) for County Governments in Kenya
11th Esri Eastern Africa User Conference (EAUC)
2 – 4 November 2016|Acacia Premier Hotel, Kisumu, Kenya
101/141
u8ka6Mu6SoC&oi=fnd&pg=PA1&dq=Changes+in+Customary+Land+Tenure&ots=AU
XiQ2DLep&sig=532iqTBUJayKDdL0hCXRHr0JQBM
Dale, P., & McLaughlin, J. (2000). Land administration. OUP Catalogue. Retrieved from
http://ideas.repec.org/b/oxp/obooks/9780198233909.html
De Soto, H. (2000). The mystery of capital: Why capitalism triumphs in the West and fails
everywhere else. Basic books.
Deininger, K. W., & others. (2003). Land policies for growth and poverty reduction. World Bank
Publications. Retrieved from https://books.google.com/books?hl=en&lr=&id=-
3HWZigoZDMC&oi=fnd&pg=PR9&dq=Deininger+Klaus+2003&ots=3Pq_iW4Bte&sig
=oXWHow4y9RJ4loF-MMIMLwUjWv8
Eisenhardt, K. M., & Graebner, M. E. (2007). Theory building from cases: opportunities and
challenges. Academy of Management Journal, 50(1), 25–32.
Goodchild, M. F. (2009). Geographic information system. In Encyclopedia of Database Systems
(pp. 1231–1236). Springer. Retrieved from http://link.springer.com/10.1007/978-0-387-
39940-9_178
Kuria, D., Kasaine, A., Khalif, A., & Kinoti, S. (2016). Developing A National Land Information
Management System – The Kenyan Strategy. Presented at the 2016 World Bank
Conference on Land And Poverty, Washington: World Bank.
Kuria, D., Ngigi, M., Gikwa, C., Mundia, C., & Macharia, M. (2016). A Web-Based Pilot
Implementation of the Africanized Land Administration Domain Model for Kenya—A
Case Study of Nyeri County. Journal of Geographic Information System, 8(2), 171.
Larsson, G. (1991). Land Registration and Cadastral Systems: Tools for land information and
management. Addison-Wesley Longman Publishing Co., Inc. Retrieved from
http://dl.acm.org/citation.cfm?id=532788
Laudon, K. C., & Laudon, J. P. (2004). Management information systems: managing the digital
firm. New Jersey, 8. Retrieved from
http://www.academia.edu/download/6946733/10.1.1.130.4393.pdf#page=103
Njuki, A. K. (2001). Cadastral systems and their impact on land administration in Kenya. In
International Conference on Spatial Information for Sustainable Development, Nairobi
(Kenya) (pp. 2–5).
Rakai, M. E., & Willlamson, I. P. (1995). Implications of incorporating customary land tenure data
into a land information system. Australian Surveyor, 40(4), 29–38.
Simpson, S. R. (1976). Land law and registration (Vol. 14). Cambridge University Press
Cambridge. Retrieved from http://library.wur.nl/WebQuery/clc/186306
Siriba, D. N., Voss, W., & Mulaku, G. C. (2011). The Kenyan Cadastre and Modern Land
Administration. Zeitschrift Fur Vermessungswesen, 136, 177–186.
Sorrenson, M. P. K., & others. (1967). Land reform in the Kikuyu country. Land Reform in the
Kikuyu Country.
Williamson, I. P., Enemark, S., Wallace, J., & Rajabifard, A. (2010). Land administration for
sustainable development. ESRI Press Academic Redlands, CA.
Zevenbergen, J. (2002). Systems of land registration aspects and effects. TU Delft, Delft
University of Technology. Retrieved from

National Government Track
Robert Wayumba, Ntonjira Lizahmy
Challenges of Developing Land Information Management Systems (LIMS) for County Governments in Kenya
11th Esri Eastern Africa User Conference (EAUC)
2 – 4 November 2016|Acacia Premier Hotel, Kisumu, Kenya
102/141
http://repository.tudelft.nl/assets/uuid:44e404e9-c1e9-4c20-b1e1-
977ee9c11570/ceg_zevenbergen_20021111.pdf
Zevenbergen, J., Augustinus, C., Antonio, D., & Bennett, R. (2013). Pro-poor land administration:
principles for recording the land rights of the underrepresented. Land Use Policy, 31, 595–
604.
Biographical Details
Dr. Robert Wayumba is a lecturer at the Technical University of Kenya. He holds a Doctor of
Philosophy (PhD) from the University of Otago in New Zealand. He also holds a Master of Science
in Land Management, from the Royal Institute of Technology, Stockholm, Sweden and a Bachelor
of Science in Surveying, University of Nairobi.
Ms. Ntonjira Lizahmy is a final year student at the Technical University of Kenya, Department
of Land Administration and Information.
Contacts
Dr. Robert Wayumba
Department of Land Administration and Information
Technical University of Kenya
Email: [email protected]
Ms. Ntonjira Lizahmy
Department of Land Administration and Information
Technical University of Kenya
Email: [email protected]

Utilities &
Transportation
Utilities & Transportation Track
John Esther, Njenga Wainaina, Maxwell Barasa
VES Sites Selection Model for Ground Water Analysis and Mapping
11th Esri Eastern Africa User Conference (EAUC)
2 – 4 November 2016 | Acacia Premier Hotel, Kisumu, Kenya
104/141
Ves Sites Selection Model for Ground Water Analysis and Mapping
John ESTHER and Njenga WAINAINA, Maxwell BARASA, Kenya
Rural Focus Ltd.
Keywords: Groundwater, VES, Aquifer, Geospatial analysis, Suitability analysis.
Abstract
Turkana is an arid area experiencing severe water shortages. The government of Kenya in
collaboration with international donors speculated that there was an abundant supply of ground
water that can sustain the whole country for the next 70 years and contracted a company to do
ground water analysis and mapping. The process involved analyzing digital geological data,
remote sensing imagery analysis, and creation of 3D basement formation model from structural
contours and selection of most suitable sites for Vertical Electric Sounding (VES) survey to
determine the availability and depth of aquifers.
A customized geospatial tool combining expertise from key hydrogeologists and geospatial
analysts was designed in ArcGIS to perform site suitability analysis for the VES survey process.
The tool was able to create analytical maps indicating areas with high ground-water potential.
On performing the VES survey, over 90% of the sites analyzed in Turkana County within the
zones indicated by the tool, shows availability of ground water within a depth of 500 meters
from the surface.

Utilities & Transportation Track
John Esther, Njenga Wainaina, Maxwell Barasa
VES Sites Selection Model for Ground Water Analysis and Mapping
11th Esri Eastern Africa User Conference (EAUC)
2 – 4 November 2016 | Acacia Premier Hotel, Kisumu, Kenya
105/141
Introduction
The problem of bulk water in arid and semi-arid areas has plagued most parts of Kenya for over
half a decade. Some of the areas such as Turkana which is in the arid areas has had some of the
worst effects of lack of water. In the years it has experienced severe droughts as river beds dry,
this has presented the need to look for water underground. According to UNESCO the water
problem is so severe that Turkana is one of the hottest, driest and poorest parts of Kenya and
has been hit by devastating water shortage. In recent times various research groups including
the government have done a number of studies in this county to try and alleviate the water
deficit problem in Turkana County. The most notable work was the work done by RTI under
UNESCO funding. RTI identified an aquifer in the Lotikipi where previous drilling had come
up dry until the study showed drilling needed to be a bit deeper to get to the aquifer. The study
showed that the aquifer could sustain the country in the next 70 years.
Study Area
Turkana County is one of Kenya’s 47 counties with a population of 855,399 (KNBS 2009)
covering an area of 77000 sqkm (approximately 13% Kenya’s surface area). The county is
bordered by Marsabit County to the east, West Pokot and Baringo counties to the south-west,
Samburu County to the south-east, Uganda to the west, South Sudan to the north-west and
Ethiopia to the north-east. (Turkana County Government, 2013-2017).
Turkana County being a part of the rift valley has varied complex physiographic properties
which comprise escarpments, mountain ranges, plains and swamps, and the lakes. Most of the
mountain ranges are volcanic in nature and include Muruanachock hills, Lobur hills,
Lokwanamoru hills, Sogot hills, Moggila hills and the Muruasigar hills mostly capped with
rhyolites and olivine basalts. The plains are usually dry during the dry season but once the rain
falls they become swampy. The biggest swamp is the Lotikipi swamp which stays soggy for
the better part of the year. The plains are composed mainly of recent superficial deposits and
silts. Turkana has the two lakes; Lake Turkana (formerly Lake Rudolf) is the largest permanent
desert lake and the largest alkaline lake. It gets water from the Omo River flowing from the
Ethiopian highlands, Turkwel River and Kerio River from Kenyan highlands. It is also fed by
various seasonal rivers from Marsabit county of Kenya. The other lake is Lake Logipi which is
a very shallow tiny lake to the south west of Lake Turkana (Turkana County Government, 2013-
2017). It is separated from Lake Turkana by a barrier volcanic complex which is composed of
young volcanic e.g. ashes and phonolites. The expansive Uganda escarpment to the west of the
county is a fault scrap composed of a basement system gneisses and pockets of tertiary volcanic
(Walsh, Dodson, 1969).
Turkana County is classified as an arid and semi-arid area experiencing a maximum
temperature of 37oC and a minimum of 21oC. It experiences a bimodal rainfall regime that
doesn’t amount to much since the average annual rainfall ranges between 300 mm to 400 mm
with rainfall averages hitting as low as 150mm. Even if the regime is classified as bimodal the
pattern is at best unpredictable with some areas staying for a whole year without rainfall. The
County is very windy (creating a modified hot and dry climate to be somewhat cooler)
especially along the lake leading to even the development of Turkana Wind power plant. As an
arid and semi-arid area, the county experiences clear skies most of the time all year round with
scorching sun.
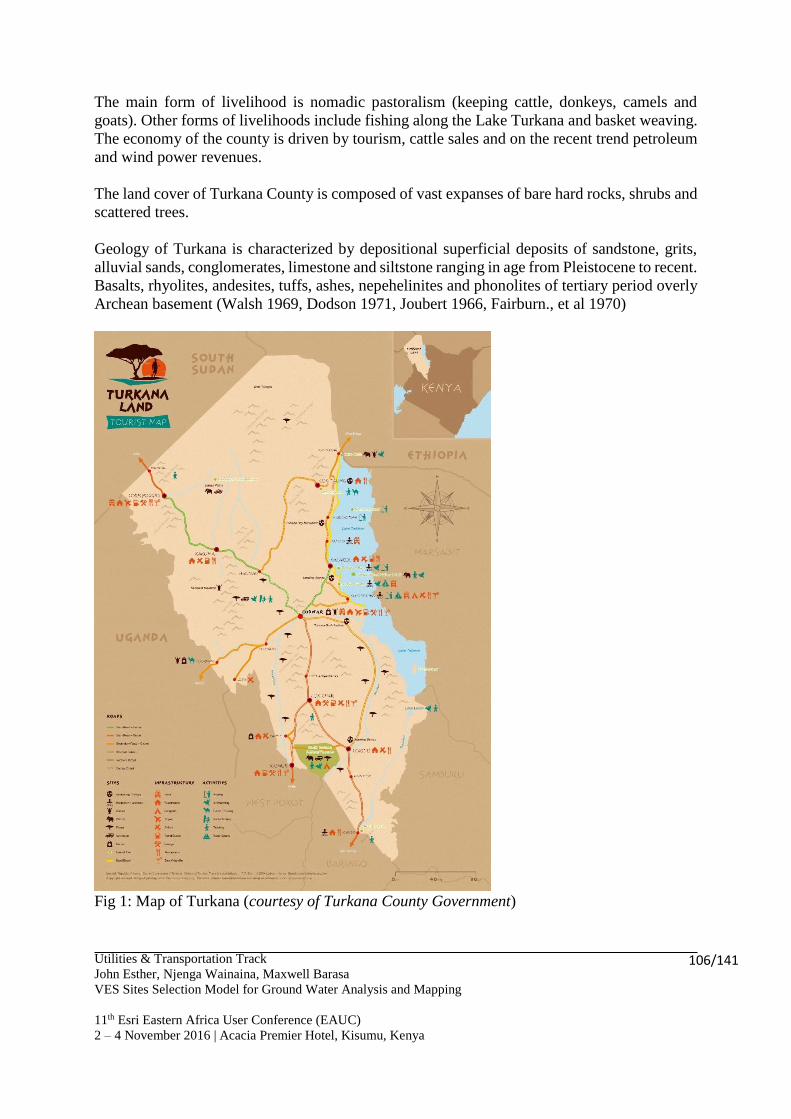
Utilities & Transportation Track
John Esther, Njenga Wainaina, Maxwell Barasa
VES Sites Selection Model for Ground Water Analysis and Mapping
11th Esri Eastern Africa User Conference (EAUC)
2 – 4 November 2016 | Acacia Premier Hotel, Kisumu, Kenya
106/141
The main form of livelihood is nomadic pastoralism (keeping cattle, donkeys, camels and
goats). Other forms of livelihoods include fishing along the Lake Turkana and basket weaving.
The economy of the county is driven by tourism, cattle sales and on the recent trend petroleum
and wind power revenues.
The land cover of Turkana County is composed of vast expanses of bare hard rocks, shrubs and
scattered trees.
Geology of Turkana is characterized by depositional superficial deposits of sandstone, grits,
alluvial sands, conglomerates, limestone and siltstone ranging in age from Pleistocene to recent.
Basalts, rhyolites, andesites, tuffs, ashes, nepehelinites and phonolites of tertiary period overly
Archean basement (Walsh 1969, Dodson 1971, Joubert 1966, Fairburn., et al 1970)
Fig 1: Map of Turkana (courtesy of Turkana County Government)

Utilities & Transportation Track
John Esther, Njenga Wainaina, Maxwell Barasa
VES Sites Selection Model for Ground Water Analysis and Mapping
11th Esri Eastern Africa User Conference (EAUC)
2 – 4 November 2016 | Acacia Premier Hotel, Kisumu, Kenya
107/141
Datasets and Methodology
Datasets
The data used in the analysis includes digital (pdf) geological maps at various scales from the
Ministry of Mining created from 1960 to 1988, Geological Map of Kenya with Structural
Contours, topographical maps of Kenya at a scale of 1:250000 and Aster 30m resolution Digital
elevation model data. The data was prepared, digitized and analyzed via ArcGIS software
algorithms and scripts to perform overlay analysis.
Methods
There are various approaches (both scientific and non-scientific) to determine the availability
of ground water. This include; water dowsing, preliminary surveys, topography analysis and
hydro geophysics.
(A) Preliminary survey involves visiting the area of study and doing a through desk study of
the area. In this survey aspects of the area like where the springs have been or are located, where
boreholes have been drilled and whether they were dry or successful and their yields, where the
vegetation has always been green even on dry season and consulting local dowsing specialists
if available. In this period, various datasets are collected including satellite imagery, aerial
photos, seismic profiles, geological maps, elevation data, vegetation data and climate data.
(B) Analyzing topography. Various physical features are analyzed in this step to give an
indication of where the aquifers maybe located. Vegetation is analyzed using satellite imagery
and/or aerial images in remote sensing software environment to determine; where vegetation is
permanent and green during driest seasons, the dipping, outcrops and outlines of geological
formations, lineation and faulting of the area and the elevation profiles of the area. (Kumar,
2014).
(C) Hydro-geophysics. This method involves measuring the electrical resistivity (capacity of a
material to resist flow of electric current). It encompasses various methods which are selected
depending on the geological context of the area, the depth of the aquifers needed to be identified
and budgets available (Loke, 2001). The geophysical methods include:
Measuring resistivity using a direct current. In this method a direct electric current is sent into
the geological structure being investigated using two electrodes and measuring the resistivity
of the structure as the current penetrates to a specified depth (McNeill, 1992). This method is
preferable for determining moderately deep aquifers in areas which are relatively flat and free
of buildings. (Christensen et al, 1998)
Measuring reactivity by magnetic means. These methods measure the reactivity of soils to
electromagnetic excitation by measuring electromagnetic signals due to magnetic induction
phenomena. These methods cannot be used for all types of grounds or on aquifers that’s are
more than 20m below the surface. These methods include isotope tracing method and proton
magnetic resonance method.
After the examination of the task at hand, most of the methods concepts and ideas were used
with additional geospatial analysis and techniques to determine ground water availability and
the best places to perform geophysical investigations without excessive failed test points.
Utilities & Transportation Track
John Esther, Njenga Wainaina, Maxwell Barasa
VES Sites Selection Model for Ground Water Analysis and Mapping
11th Esri Eastern Africa User Conference (EAUC)
2 – 4 November 2016 | Acacia Premier Hotel, Kisumu, Kenya
108/141
The method adopted in this analysis was for identifying areas with potential for ground water
availability on the basis of proximity of the basement system that creates pockets for water to
be trapped and favorable geologies to store the water infiltrating.
Data Preprocessing First, all the maps were converted from .pdf to .tiff. This .tiff files were without any spatial
reference information on them.
Second, the geological maps were georeferenced to their specific projection they were initially
created in which Arc 1960 Datum is based on Clarke 1880 reference ellipsoid, Universal
Transverse Mercator projection. Map geo-referencing as accurate as possible is needed to
accurately trace the needed data and create digital vector data (Ellwood et al., 2016). For each
map the points used as control points were all the cross points of the various gridlines. Due to
inaccuracy of hand drawn maps, further control points were added by comparing the maps with
current accurate data of various physical features like rivers and base of mountains to improve
the overall accuracy.
Third, all the maps were projected to a reference system which was Geographic Coordinate
system WGS 84 using the transformation of Arc_1960_To_WGS_1984_2 which is the
recommended transformation for Kenya. The datasets were then projected to World Mercator
Projected Coordinate system so as to conform to the raster datasets projections used to create
outputs like hill shades.
Fourth, a Mosaic was created combining the various geological maps into one extended image.
This mosaic aided in identifying the gaps in geology that were needed to be filled. These gaps
include the upper part of the county (Kibish) which was updated via a geological map of The
Sudan. The other gaps were left empty.
Fifth, a geodatabase schema was created to hold the anticipated geological formations from the
maps. After the schema heads-up digitization of the mosaic commenced creating a wide range
of geological formations in vector format. In the same way, the structural contours from the
map were digitized. The structural contours in this map shows smoothened depth to the
basement in kilometers.
Sixth, after the digitization was finished, all the gaps in the data were identified and filled up
with the geological map of Kenya lithological dataset and the output clipped to fit to Turkana
County borders. The geological data obtained was left with the naming of the original maps
first and then after wards the datasets were merged where the geologists felt they were one and
the same geological formation. For structural contours the digitization also included the
addition of the depth field to act as an indicator of how deep the contour was below the surface.
The structural contours were extended to reach the adjacent counties.
Surface Elevation Model Processing The 30m AsterGDEM V2 data was used in this project. The choice for this was based on the
fact that it is the one of the high resolution open source elevation model existing for the whole
world today. The elevation model was then taken through a low pass filter analysis so that it
Utilities & Transportation Track
John Esther, Njenga Wainaina, Maxwell Barasa
VES Sites Selection Model for Ground Water Analysis and Mapping
11th Esri Eastern Africa User Conference (EAUC)
2 – 4 November 2016 | Acacia Premier Hotel, Kisumu, Kenya
109/141
becomes more accurate for morphometric analyses and physiography analysis (Tachikawa et
al, 2011). Existing AsterGDEM data was downloaded from USGS website, mosaicked and
clipped to fit to Turkana County. The raster was projected to World Mercator Projected
Coordinate System. County hillshade was then created to depict hills and plains. The hillshade
is used to limit the areas which are too steep to use the electrical sounding tool.
Creation of a Basement Depth Raster Conventionally elevation models are mostly used for depicting only surface topography. This
elevation models can be created from point elevation data or contours using various
interpolation techniques e.g. Inverse Distance Weighing and Triangulated Irregular Network.
These methods use near neighbor idea where it is assumed points that are closer are more related
than those far away (Fisher et al, 1987). In order to create a higher accuracy elevation model,
some interpolation techniques that uses both local and global interpolation methods is needed.
One of the best interpolation methods used today is the ANUDEM program that calculates
regular grid elevation models with sensible shape and drainage structure from arbitrary large
topographic data sets (Hutchinson 2008, Hutchinson and Gallant 1999, 2000). The inputs for
the ANUDEM algorithms can be point elevations, elevation contours, streamlines, sink data
points, cliff lines, boundary polygons, lake boundaries and data mask polygons which have a
value field indicating the elevation of a surface from an arbitrary surface e.g. the sea level.
The ANUDEM uses algorithms that apply drainage enforcements and elevation tolerance
constrains to adjust the accuracy of the elevation model in relation to the accuracy and density
of the input elevation data (Hutchinson 1989).
Since the ANUDEM algorithms create very high accuracy DEM, it was adopted as the main
method to use in this analysis as opposed to other interpolation methods. This method was used
in an ArcGIS platform as a tool named Topo to Raster. The Topo to Raster tool is an
interpolation method specifically designed for the creation of hydrologically correct digital
elevation models (DEMs) adopted from the ANUDEM program. It takes all the data formats
compatible with the ANUDEM algorithms and performs environmental modelling as discussed
by Hutchinson (2000, 2008, 2009, 2011). As a tool the Topo to Raster interpolates elevation
values from a raster while imposing constrains to ensure a correct representation of ridges,
streams and sinks from contour data. The tool uses an iterative finite difference technique by
having the computational efficiency of local interpolation methods e.g. IDW but without losing
the surface continuity of global interpolation methods e.g. Kriging. Currently the method was
adopted as the best to depict the structure of the basement from contours.
After each of the structural contours was digitized, a value was added that shows the depth of
each contour below the surface. The Geological Map of Kenya with structural contours has data
that depicts a smoothened depth to the basement for Kenya in kilometers (Government of
Kenya, 1987). The kilometer value was converted to meters and used in the topo to raster tool.
Since the tool enforces drainage on the resultant elevation model and removes inconsistent
sinks, the tool was made to avoid enforcing since there are breaks in the basement caused by
volcanism that should not be filled up. The final result of the process was clipped to fit to
Turkana County from the bigger interpolated surface which was extending to other couties and
countries.
Utilities & Transportation Track
John Esther, Njenga Wainaina, Maxwell Barasa
VES Sites Selection Model for Ground Water Analysis and Mapping
11th Esri Eastern Africa User Conference (EAUC)
2 – 4 November 2016 | Acacia Premier Hotel, Kisumu, Kenya
110/141
Raster Difference Raster difference is used to calculate the difference of the surface contour to the basement
contour to form the basement elevation model based on the height above sea level. The
basement elevation model represents an elevation above or below sea level. In this model to be
able to determine the depth to the basement from the surface we need a way of creating that
difference data. Since all the raster datasets are in the same resolution and alignment, the raster
map algebra algorithms were used to create a raster showing the elevation of the basement
above or below sea level. Map Algebra is a simple and powerful algebra with which you can
execute all Spatial Analyst tools, operators, and functions to perform geographic analysis (Esri,
2015). In this case the formula used was:
ASTER DEM –DEPTH RASTER = BASEMENT DEM.
Geological Reclassification Groundwater flow in aquifer is dependent on permeability and porosity of the water bearing
material that utilizes Darcy’s law, permeability is a measure of ability of a material to transmit
water. For instance, sandstones may vary in permeability from less than one to over 50,000
millidarcys (md), permeability is more commonly in the range of tens to hundreds of
millidarcies. A rock with 25% porosity and a permeability of 1 md will not yield a significant
flow of water. Such “tight” rocks are usually basement and other granitic rocks (Bear.,et al
1972). In Turkana, aquifers are found in alluvial, sandstone, grits and basaltic formation.
Turkana geological formations were classified according to their permeability and porosity.
This generated a raster showing suitability of various geological formations to contain ground
water.
Previous groundwater mapping done in this area (RTI 2013) classified alluvial aquifers as the
best yielding aquifers in the region. This study also prioritizes alluvial and sandstone aquifers
as best yielding aquifers due to their porosity and permeability, however sandstone porosity
decreases with increasing clay content. Turkana Grits which consists of sandstones, limestone,
conglomerates, Kalapata beds is rated high in terms of groundwater occurrence and movement
(Walsh 1969)
Weighted Overlay Analysis. Overlay analysis is a technique for applying a common scale of values to diverse and dissimilar
inputs to create an integrated analysis (Esri, 2015). It combines various spatial analytics
algorithms, models, datasets and techniques to create favorable outputs of a given phenomenon
on the earth surface. The analysis follows a general order of process which is; define a problem,
break the problem into sub models, determine the significant datasets, transform the datasets to
fit into the analysis process, weight the input datasets depending on their influence to the
phenomena, combine the datasets and finally perform analysis. (Mayfield C.J, 2015). Weighted
overlay analysis assigns high values to favorable conditions for the phenomena being analyzed.
The method employed in the study to identify the suitability of aquifer potential was employed
based on the available data and time. The model builds on the fact that for an aquifer to be
present it is largely a factor of geology and recharge. The geology plays a very major role since
it is the one that retains water where it is favorable. This method employs geology as the major
contributor with some geologies retain water while others retaining none. The other factor
Utilities & Transportation Track
John Esther, Njenga Wainaina, Maxwell Barasa
VES Sites Selection Model for Ground Water Analysis and Mapping
11th Esri Eastern Africa User Conference (EAUC)
2 – 4 November 2016 | Acacia Premier Hotel, Kisumu, Kenya
111/141
employed is structural contours that describe the profile of the basements which are
impermeable which thus retains water in pockets when the overlaying geology is permeable
and has high water retention capacity.
The method adopts a raster analysis process which overlays and adds weight to different
geologies and depth of the basements. The method builds up on key knowledge of
hydrogeologists who described how they deduct the potential for aquifers and geospatial
analysis expertise to combine the geological explanations of the hydrogeologists to create a
model for determining the aquifer availability on a larger scale. In essence the method has been
verified and is based on technical hydrogeological knowledge.
The process starts with calculating the influence of the various geological formations to ground
water occurrence in the area (Jones, 1985). From the preliminary survey period weights were
assigned to the geologies based on the available springs and boreholes. These weights were on
a range from 1 to 10 which shows the order with which water has been known to occur in this
areas.
10 shows the areas with the highest potential for storing ground water while 1 shows the least
favorable geologies for retaining water. E.g. Turkana grits and sandstones take the highest
priority since majority of the boreholes with high yield in the area are drilled into them.
The geologies are converted to a raster using the priority field as the value. This gives a raster
with 10 values which are then reclassified to nine classes to fit into the weighing model.
After the reclassification process then the two datasets are ready to be weighted together. From
consensus of the hydrogeologists, the basement was given a weight of 15% and the geology a
weight of 85%. This is because the geological formations are the aquifer bearing materials with
the basement as the benchmark where all overburden materials are categorized as aquifers.
(Hussein.,et al 2016).
Results and Discussions
The main objective of the process is to identify areas with high potential for underground water
availability at a depth of not more than 600m from the surface. The suitability output is then to
be used as a guide to perform Vertical Electrical Sounding to determine the availability of the
aquifers. Hydro-geologically, groundwater occurrence is controlled by geological conditions
including lithology and structures (Ismael. et al 2016). From the analysis a scale of 1 to 9 was
generated to represent areas with high potential depending on the proximity of the geologies to
the impermeable basement rock. Nine represents the most probable area to perform electrical
sounding while 1 represent areas where potential for underground water is very low.
The basement elevation model is shown in fig. 2 from the model we can be able to conceptualize
and view the profile of the basement system in Turkana County. The profile is a good indicator
of the basins with water.
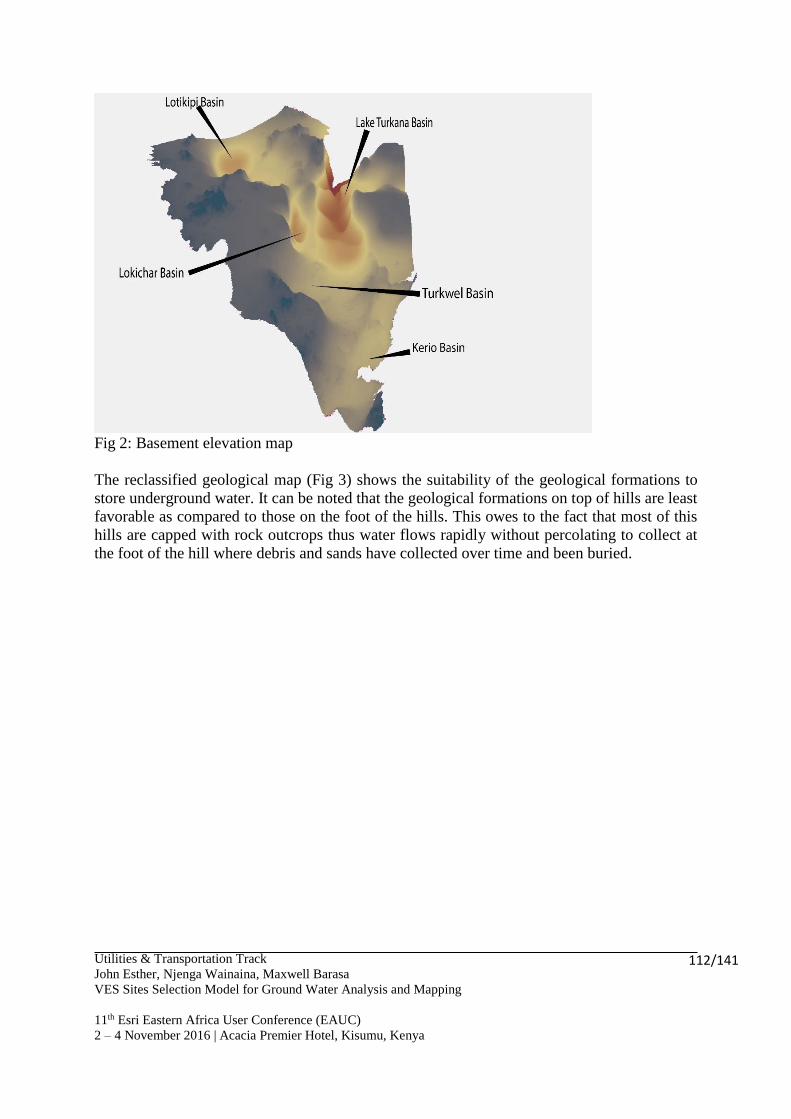
Utilities & Transportation Track
John Esther, Njenga Wainaina, Maxwell Barasa
VES Sites Selection Model for Ground Water Analysis and Mapping
11th Esri Eastern Africa User Conference (EAUC)
2 – 4 November 2016 | Acacia Premier Hotel, Kisumu, Kenya
112/141
Fig 2: Basement elevation map
The reclassified geological map (Fig 3) shows the suitability of the geological formations to
store underground water. It can be noted that the geological formations on top of hills are least
favorable as compared to those on the foot of the hills. This owes to the fact that most of this
hills are capped with rock outcrops thus water flows rapidly without percolating to collect at
the foot of the hill where debris and sands have collected over time and been buried.

Utilities & Transportation Track
John Esther, Njenga Wainaina, Maxwell Barasa
VES Sites Selection Model for Ground Water Analysis and Mapping
11th Esri Eastern Africa User Conference (EAUC)
2 – 4 November 2016 | Acacia Premier Hotel, Kisumu, Kenya
113/141
Fig 3: Classified geology map
The output of the suitability model was then compared to geology before commencing to select
the areas to perform Electrical sounding analysis. Further analysis meant that a buffer of 1.5
kilometers was created around all the sandstones, conglomerates and Grits since they have a
tendency of dipping and expanding below the other recent geologies for more than two
kilometers from where they are observed on the surface. (Dodson, 1971). Furthermore, the hilly
areas were noted by creating a hill shade to depict the hills (Fig 4).
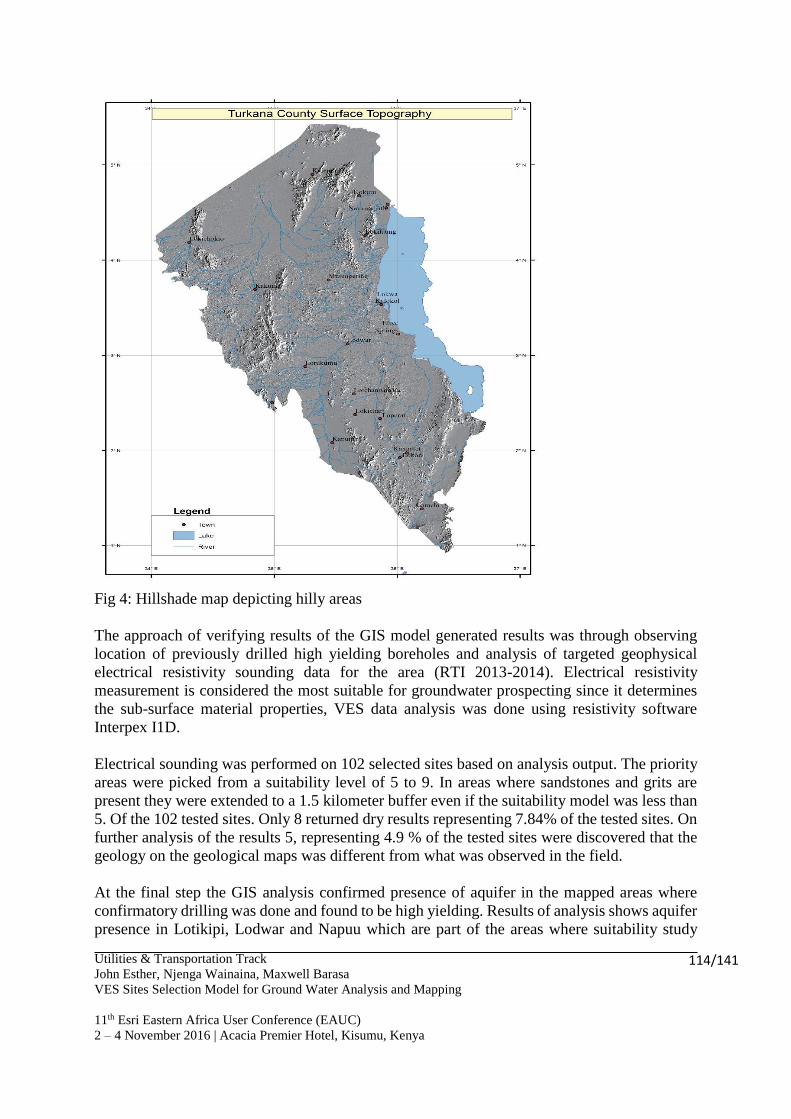
Utilities & Transportation Track
John Esther, Njenga Wainaina, Maxwell Barasa
VES Sites Selection Model for Ground Water Analysis and Mapping
11th Esri Eastern Africa User Conference (EAUC)
2 – 4 November 2016 | Acacia Premier Hotel, Kisumu, Kenya
114/141
Fig 4: Hillshade map depicting hilly areas
The approach of verifying results of the GIS model generated results was through observing
location of previously drilled high yielding boreholes and analysis of targeted geophysical
electrical resistivity sounding data for the area (RTI 2013-2014). Electrical resistivity
measurement is considered the most suitable for groundwater prospecting since it determines
the sub-surface material properties, VES data analysis was done using resistivity software
Interpex I1D.
Electrical sounding was performed on 102 selected sites based on analysis output. The priority
areas were picked from a suitability level of 5 to 9. In areas where sandstones and grits are
present they were extended to a 1.5 kilometer buffer even if the suitability model was less than
5. Of the 102 tested sites. Only 8 returned dry results representing 7.84% of the tested sites. On
further analysis of the results 5, representing 4.9 % of the tested sites were discovered that the
geology on the geological maps was different from what was observed in the field.
At the final step the GIS analysis confirmed presence of aquifer in the mapped areas where
confirmatory drilling was done and found to be high yielding. Results of analysis shows aquifer
presence in Lotikipi, Lodwar and Napuu which are part of the areas where suitability study

Utilities & Transportation Track
John Esther, Njenga Wainaina, Maxwell Barasa
VES Sites Selection Model for Ground Water Analysis and Mapping
11th Esri Eastern Africa User Conference (EAUC)
2 – 4 November 2016 | Acacia Premier Hotel, Kisumu, Kenya
115/141
indicated presence of groundwater (Fig 5). The analysis showed unconsolidated sands and
gravel which are basin filed aquifers provided best areas for aquifer occurrence where the semi
permeable basement acted as the ‘basin’.
Fig 5: Suitability map depicting suitable areas to perform VES analysis
Conclusions.
In conclusion, the suitability model presents a blueprint for future groundwater exploration
using GIS analysis that yield best targeted geophysical survey areas as compared to carrying
out blanket geophysical investigations. Limitations of this study was the other factors that
control groundwater occurrence and movement such as porosity, fracturing, fault zones grain
Utilities & Transportation Track
John Esther, Njenga Wainaina, Maxwell Barasa
VES Sites Selection Model for Ground Water Analysis and Mapping
11th Esri Eastern Africa User Conference (EAUC)
2 – 4 November 2016 | Acacia Premier Hotel, Kisumu, Kenya
116/141
size and sorting of particles that were not included. Further modification can thus improve its
overall accuracy if inclusion of this factors is adopted.
Acknowledgment.
Authors are grateful to Ministry of Mining, Govt. of Kenya, County Govt. of Turkana and
WRMA for providing necessary support during the study. Authors also acknowledge ESRI
Eastern Africa for support on the use of their software and literatures.
References
Christensen, B.N. and Sorensen, K., 1998. Surface and borehole electric and electromagnetic
methods for hydrological investigation. Eur. J. Environ. Eng. Geophysics. 3, 75-90.
Dodson R.G, 1971, Geology of Northern Turkana Degree sheet 18, Geological Survey of
Kenya, Report No.87, Ministry of Natural Resources, Republic of Kenya
Ellwood, E.R. et al., (2016). Mapping Life – Quality Assessment of Novice vs. Expert
Georeferencers. Citizen Science: Theory and Practice. 1(1), p.4. DOI:
http://doi.org/10.5334/cstp.30
ESRI 2015. ArcGIS Desktop: Release 10.3. Redlands, CA: Environmental Systems Research
Institute.
Fisher, N. I., T. Lewis, and B. J. J. Embleton, 1987, Statistical Analysis of Spherical Data,
Cambridge University Press.
Hussien M. Hussien , Alan E. Kehew a, Tarek Aggour, Ezat Korany , Abotalib Z. Abotalib ,
Abdelmohsen Hassanein , Samah Morsy (2016) An integrated approach for
identification of potential aquifer zones in structurally controlled terrain: Wadi Qena
basin, Egypt, published in Catena Journal 2016
Jones M.J. , 1985, The weathered zone aquifers of the basement complex areas of Africa,
Quarterly Journal of Engineering Geology and Hydrogeology, v. 18:35-46, Geological
Society of London.
Kumar C. P., 2014, Groundwater Data Requirement and Analysis, Munich, GRIN Verlag,
http://www.grin.com/en/e-book/281602/groundwater-data-requirement-and-analysis
Loke, M.H., 2001. Tutorial: 2-D and 3-D electrical imaging surveys. Course Notes for USGS
Workshop "2-D and 3-D Inversion and Modeling of Surface and Borehole Resistivity
Data", Torrs, CT.
Malczewski, J (2006). GIS-based Multicriteria decision analysis: a survey of the literature.
International Journal of Geographical Information Science, 20, 703 – 726.
Mayfield, C. J. (2015). Automating the Classification of Thematic Rasters for Weighted
Overlay Analysis in GeoPlanner for ArcGIS (Master's thesis, University of Redlands).
Opeyemi J. Akinrinade , Rasheed B. Adesina,(2016) Hydro geophysical investigation of
groundwater potential and aquifer vulnerability prediction in basement complex terrain
– A case study from Akure, Southwestern Nigeria.
RTI. 2014, Taking stock of groundwater Discovery In Turkana (Kenya): The socio-economic
impact of WATEX exploration one year later (September 2013-2014).
T. Tachikawa, M. Hato, M. Kaku and A. Iwasaki, 2011, "Characteristics of ASTER GDEM
version 2," Geoscience and Remote Sensing Symposium (IGARSS), 2011 IEEE
International, Vancouver, BC, 2011, pp. 3657-3660. Doi:
10.1109/IGARSS.2011.6050017

Utilities & Transportation Track
John Esther, Njenga Wainaina, Maxwell Barasa
VES Sites Selection Model for Ground Water Analysis and Mapping
11th Esri Eastern Africa User Conference (EAUC)
2 – 4 November 2016 | Acacia Premier Hotel, Kisumu, Kenya
117/141
Walsh J., Dodson R.G, 1969, Geology of Northern Turkana Degree sheet 1, 2, 9 and 10,
Geological Survey of Kenya, Report No.82, Ministry of Natural Resources, Republic
of Kenya
Biographical Notes
John Esther received his BSc Degree in Geography from Egerton University in 2014. He did
short Courses in GIS at ESRI Eastern Africa late 2014 and has been working since 2015 in
Rural Focus Ltd as GIS Analyst.
Njenga Wainaina has a BSc. Degree in Geomatic Engineering and Geospatial Information
Systems from Jomo Kenyatta University in 2013. He is currently pursuing MSc. Geospatial
Information Systems and Remote Sensing. He is currently working at Rural Focus Ltd as a
Surveyor/GIS officer.
Maxwell Barasa received a BSC Degree in Geology from the University of Nairobi in 2008, he
did a certificate course in GIS and Remote sensing at Regional Centre for Mapping of
Resources for Development. He also has a postgraduate Diploma in Hydrology from the
University of Nairobi. Maxwell has 7 years’ experience in hydrogeology and has worked with
Rural Focus for 5 years as an assistant hydrogeologist. He is currently pursuing Msc. Applied
Geophysics.
Contacts
John Esther
Rural Focus Ltd
P.O.BOX 1011
Nanyuki, Kenya
www.ruralfocus.com

Apply Geography to Your Work
and Make Better Decisions
Adding a location aspect to your
projects gives you more insight into your
data, improves planning, and helps you
work more efficiently.
Cross-Cutting Issues Track
GI-diversity – Taking the activities in the Kakamega-Nandi forests area as example
Gertrud Schaab
11th Esri Eastern Africa User Conference (EAUC)
2 – 4 November 2016 | Acacia Premier Hotel, Kisumu, Kenya
119/141
GI-diversity – Taking the activities in the Kakamega-Nandi forests area as
example
Gertrud Schaab, Germany
Karlsruhe University of Applied Sciences (HsKA),
Faculty of Information Management and Media (IMM)
Key words: forest conservation, interactive visualization, environmental education, capacity
building
Abstract Fifteen years of engagement for and in Eastern Africa has resulted in a myriad of activities,
either research driven or related to capacity building. Geodata processing offers here versatile
opportunities for cooperation, as the spatial reference enables inter- and transdisciplinary
approaches. The paper provides an overview on the past achievements resulting from close
collaboration with Kenyan and Ugandan counterparts. However, the focus is on more recent
examples from the Kakamega-Nandi forests area in Western Kenya. While the processing of
data from disparate sources was achieved by means of ArcGIS and remote sensing approaches,
an open source software-based Web GIS tool now combines the spatially related scientific
findings on the forest use history for visualization and exploration by anyone. The participatory
development of environmental education tools, engaging many stakeholders from the local
communities, resulted in various playful means. Some help to make a start in passing on
abilities in regard to map reading, some to sensitize and steer discussions on the need of forest
conservation. Finally, a university cooperation targeted a streamlined GIS teaching across the
various university departments by jointly developing teaching material which includes geodata
of regional relevance.

Cross-Cutting Issues Track
GI-diversity – Taking the activities in the Kakamega-Nandi forests area as example
Gertrud Schaab
11th Esri Eastern Africa User Conference (EAUC)
2 – 4 November 2016 | Acacia Premier Hotel, Kisumu, Kenya
120/141
Introduction
Fifteen years of engagement for and in Eastern Africa has fostered many activities, either
research driven or related to capacity building. The more than 50 written publications which
have resulted so far are proof of this engagement. Geodata processing has offered here versatile
opportunities for cooperation, as the spatial reference enables inter- and transdisciplinary
approaches. The paper provides an overview on the past achievements resulting from close
collaboration with Kenyan and Ugandan counterparts. However, the focus is on more recent
examples from the Kakamega-Nandi forests area in Western Kenya.
It all started with the BIOTA East Africa project, funded by BMBF (German Federal Ministry
of Education and Research) from 2001 to 2010. About 10 project groups investigated the
impact of fragmentation and human use on the biodiversity of Eastafrican rainforests. The
overall goal had been to come up with recommendations for a sustainable use of biodiversity.
By considering three upland rain forest areas in Kenya and Uganda, comparisons were possible
(see www.biota-africa.de/reg_east_intro_ba.php?Page_ID=L800
_04_01). Kakamega Forest in western Kenya served as focus study site. Kakamega Forest is
known for its high biodiversity. Together with the Nandi Forests it once formed one continuous
forest block. But 60% of natural forest cover got lost over the past 100 years. Being placed in
one of the most densely populated rural areas of Kenya, the forests experience severe pressure.
There is thus need to create awareness for forest conservation, also as many people depend on
the forest’s resources (Mitchell et al., 2009).
Within the research framework, subproject E02 provided support by means of GIS and remote
sensing. Our research questions were linked to investigating longterm forest cover change (e.g.
Lung & Schaab, 2010) and forest use history (Mitchell, 2011). The findings helped to study
their impact on biodiversity via spatial extrapolation of biological field data (e.g. Lung et al.,
2012) and scenario simulation demonstrating if e.g. tree plantations could compensate forest
loss (Farwig et al., 2014). As today’s forest is heavily shaped by man, research moved also into
the surrounding agricultural landscape. Here, we derived information on farmland use and run
livelihood scenarios (Lübker, 2014). In regard to activities related to capacity building (Schaab
et al., 2009b), we got actively involved in forest management planning assuring that the
scientific findings of the BIOTA East Africa project would be of use for implementations on
the ground. A couple of GIS and geodata use courses had been offered to the counterparts or
local stakeholders. BIOTA-East became especially known for its training of PhD and Masters
Students. As a major measure to sustain the started activities, the Biodiversity Information
Centre (BIC, www.iaf.hs-karlsruhe.de/gvisr/bic/) was set up in Kakamega Town. It
encompasses a GIS unit with all the many geodatasets processed during BIOTA times.
The processing and application of geodata enabled the integrated analysis of diverse field data,
their extrapolation in space and over time, as well as recommendations for a sustainable use
and conservation of Kakamega Forest. About 500 geodatasets are available at the BIC, of which
about 300 are related to the Kakamega Forest or Kakamega-Nandi forests area. The information
centre is meant to support and empower local stakeholders. We are aware that handling of
geodata requires expertise. Therefore, with the progressing of the BIOTA project visualizations
for the communication of the often also interdisciplinary results gained increasing importance
(Schaab et al., 2009a). A major impact had the publication and dissemination of The BIOTA
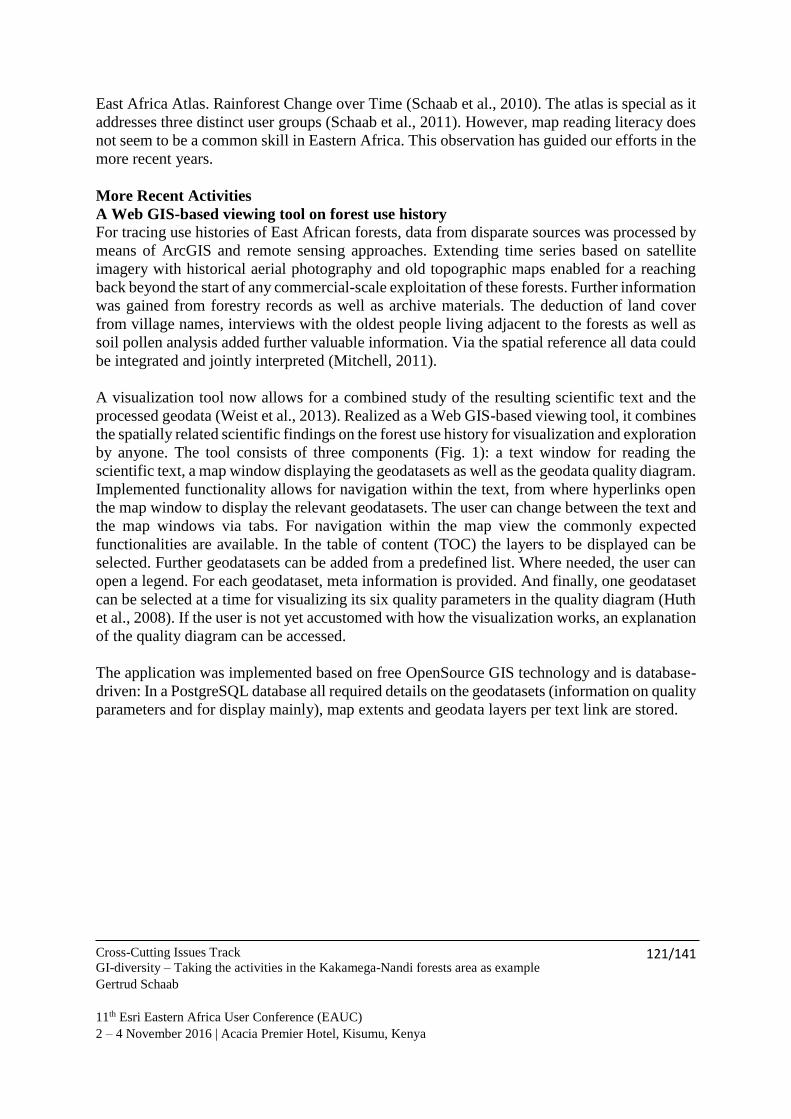
Cross-Cutting Issues Track
GI-diversity – Taking the activities in the Kakamega-Nandi forests area as example
Gertrud Schaab
11th Esri Eastern Africa User Conference (EAUC)
2 – 4 November 2016 | Acacia Premier Hotel, Kisumu, Kenya
121/141
East Africa Atlas. Rainforest Change over Time (Schaab et al., 2010). The atlas is special as it
addresses three distinct user groups (Schaab et al., 2011). However, map reading literacy does
not seem to be a common skill in Eastern Africa. This observation has guided our efforts in the
more recent years.
More Recent Activities
A Web GIS-based viewing tool on forest use history For tracing use histories of East African forests, data from disparate sources was processed by
means of ArcGIS and remote sensing approaches. Extending time series based on satellite
imagery with historical aerial photography and old topographic maps enabled for a reaching
back beyond the start of any commercial-scale exploitation of these forests. Further information
was gained from forestry records as well as archive materials. The deduction of land cover
from village names, interviews with the oldest people living adjacent to the forests as well as
soil pollen analysis added further valuable information. Via the spatial reference all data could
be integrated and jointly interpreted (Mitchell, 2011).
A visualization tool now allows for a combined study of the resulting scientific text and the
processed geodata (Weist et al., 2013). Realized as a Web GIS-based viewing tool, it combines
the spatially related scientific findings on the forest use history for visualization and exploration
by anyone. The tool consists of three components (Fig. 1): a text window for reading the
scientific text, a map window displaying the geodatasets as well as the geodata quality diagram.
Implemented functionality allows for navigation within the text, from where hyperlinks open
the map window to display the relevant geodatasets. The user can change between the text and
the map windows via tabs. For navigation within the map view the commonly expected
functionalities are available. In the table of content (TOC) the layers to be displayed can be
selected. Further geodatasets can be added from a predefined list. Where needed, the user can
open a legend. For each geodataset, meta information is provided. And finally, one geodataset
can be selected at a time for visualizing its six quality parameters in the quality diagram (Huth
et al., 2008). If the user is not yet accustomed with how the visualization works, an explanation
of the quality diagram can be accessed.
The application was implemented based on free OpenSource GIS technology and is database-
driven: In a PostgreSQL database all required details on the geodatasets (information on quality
parameters and for display mainly), map extents and geodata layers per text link are stored.
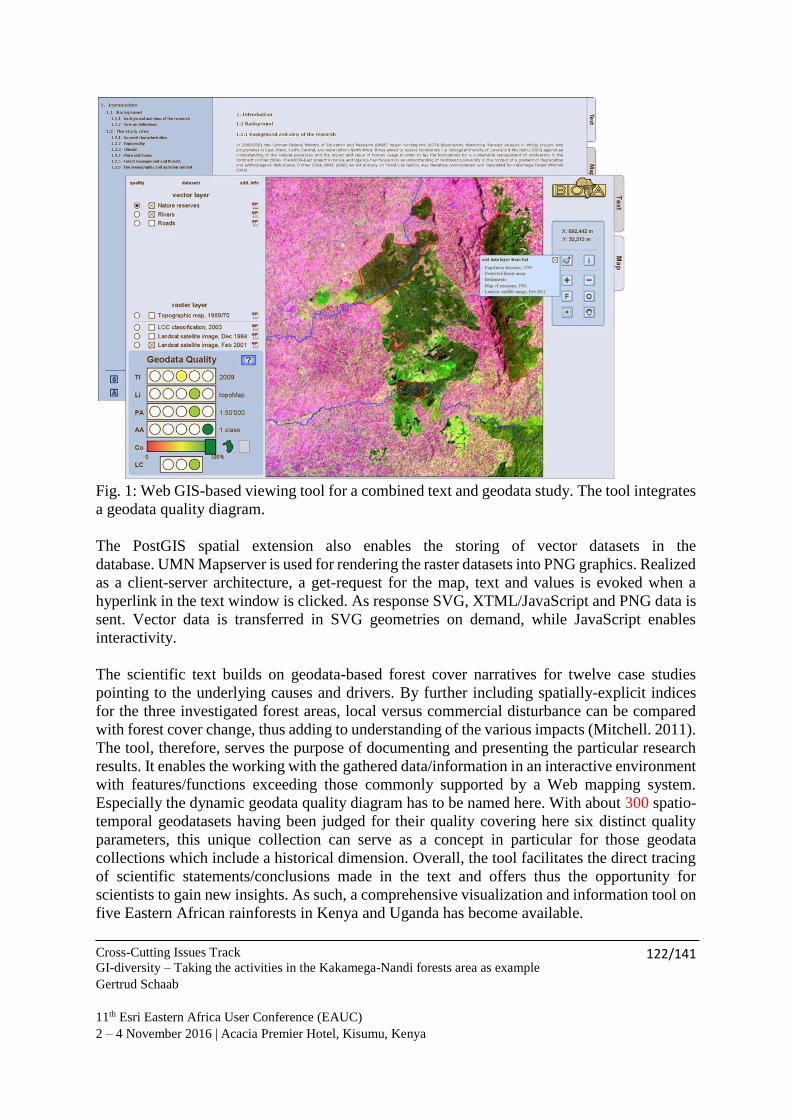
Cross-Cutting Issues Track
GI-diversity – Taking the activities in the Kakamega-Nandi forests area as example
Gertrud Schaab
11th Esri Eastern Africa User Conference (EAUC)
2 – 4 November 2016 | Acacia Premier Hotel, Kisumu, Kenya
122/141
Fig. 1: Web GIS-based viewing tool for a combined text and geodata study. The tool integrates
a geodata quality diagram.
The PostGIS spatial extension also enables the storing of vector datasets in the
database. UMN Mapserver is used for rendering the raster datasets into PNG graphics. Realized
as a client-server architecture, a get-request for the map, text and values is evoked when a
hyperlink in the text window is clicked. As response SVG, XTML/JavaScript and PNG data is
sent. Vector data is transferred in SVG geometries on demand, while JavaScript enables
interactivity.
The scientific text builds on geodata-based forest cover narratives for twelve case studies
pointing to the underlying causes and drivers. By further including spatially-explicit indices
for the three investigated forest areas, local versus commercial disturbance can be compared
with forest cover change, thus adding to understanding of the various impacts (Mitchell. 2011).
The tool, therefore, serves the purpose of documenting and presenting the particular research
results. It enables the working with the gathered data/information in an interactive environment
with features/functions exceeding those commonly supported by a Web mapping system.
Especially the dynamic geodata quality diagram has to be named here. With about 300 spatio-
temporal geodatasets having been judged for their quality covering here six distinct quality
parameters, this unique collection can serve as a concept in particular for those geodata
collections which include a historical dimension. Overall, the tool facilitates the direct tracing
of scientific statements/conclusions made in the text and offers thus the opportunity for
scientists to gain new insights. As such, a comprehensive visualization and information tool on
five Eastern African rainforests in Kenya and Uganda has become available.
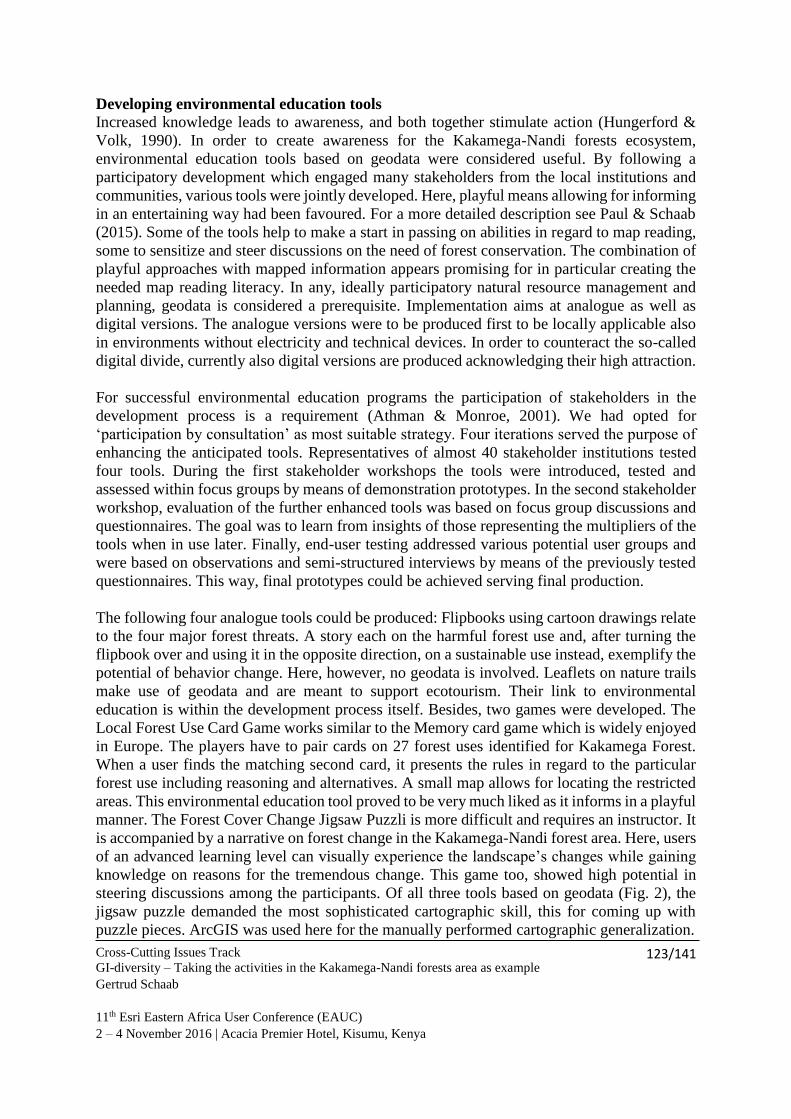
Cross-Cutting Issues Track
GI-diversity – Taking the activities in the Kakamega-Nandi forests area as example
Gertrud Schaab
11th Esri Eastern Africa User Conference (EAUC)
2 – 4 November 2016 | Acacia Premier Hotel, Kisumu, Kenya
123/141
Developing environmental education tools
Increased knowledge leads to awareness, and both together stimulate action (Hungerford &
Volk, 1990). In order to create awareness for the Kakamega-Nandi forests ecosystem,
environmental education tools based on geodata were considered useful. By following a
participatory development which engaged many stakeholders from the local institutions and
communities, various tools were jointly developed. Here, playful means allowing for informing
in an entertaining way had been favoured. For a more detailed description see Paul & Schaab
(2015). Some of the tools help to make a start in passing on abilities in regard to map reading,
some to sensitize and steer discussions on the need of forest conservation. The combination of
playful approaches with mapped information appears promising for in particular creating the
needed map reading literacy. In any, ideally participatory natural resource management and
planning, geodata is considered a prerequisite. Implementation aims at analogue as well as
digital versions. The analogue versions were to be produced first to be locally applicable also
in environments without electricity and technical devices. In order to counteract the so-called
digital divide, currently also digital versions are produced acknowledging their high attraction.
For successful environmental education programs the participation of stakeholders in the
development process is a requirement (Athman & Monroe, 2001). We had opted for
‘participation by consultation’ as most suitable strategy. Four iterations served the purpose of
enhancing the anticipated tools. Representatives of almost 40 stakeholder institutions tested
four tools. During the first stakeholder workshops the tools were introduced, tested and
assessed within focus groups by means of demonstration prototypes. In the second stakeholder
workshop, evaluation of the further enhanced tools was based on focus group discussions and
questionnaires. The goal was to learn from insights of those representing the multipliers of the
tools when in use later. Finally, end-user testing addressed various potential user groups and
were based on observations and semi-structured interviews by means of the previously tested
questionnaires. This way, final prototypes could be achieved serving final production.
The following four analogue tools could be produced: Flipbooks using cartoon drawings relate
to the four major forest threats. A story each on the harmful forest use and, after turning the
flipbook over and using it in the opposite direction, on a sustainable use instead, exemplify the
potential of behavior change. Here, however, no geodata is involved. Leaflets on nature trails
make use of geodata and are meant to support ecotourism. Their link to environmental
education is within the development process itself. Besides, two games were developed. The
Local Forest Use Card Game works similar to the Memory card game which is widely enjoyed
in Europe. The players have to pair cards on 27 forest uses identified for Kakamega Forest.
When a user finds the matching second card, it presents the rules in regard to the particular
forest use including reasoning and alternatives. A small map allows for locating the restricted
areas. This environmental education tool proved to be very much liked as it informs in a playful
manner. The Forest Cover Change Jigsaw Puzzli is more difficult and requires an instructor. It
is accompanied by a narrative on forest change in the Kakamega-Nandi forest area. Here, users
of an advanced learning level can visually experience the landscape’s changes while gaining
knowledge on reasons for the tremendous change. This game too, showed high potential in
steering discussions among the participants. Of all three tools based on geodata (Fig. 2), the
jigsaw puzzle demanded the most sophisticated cartographic skill, this for coming up with
puzzle pieces. ArcGIS was used here for the manually performed cartographic generalization.
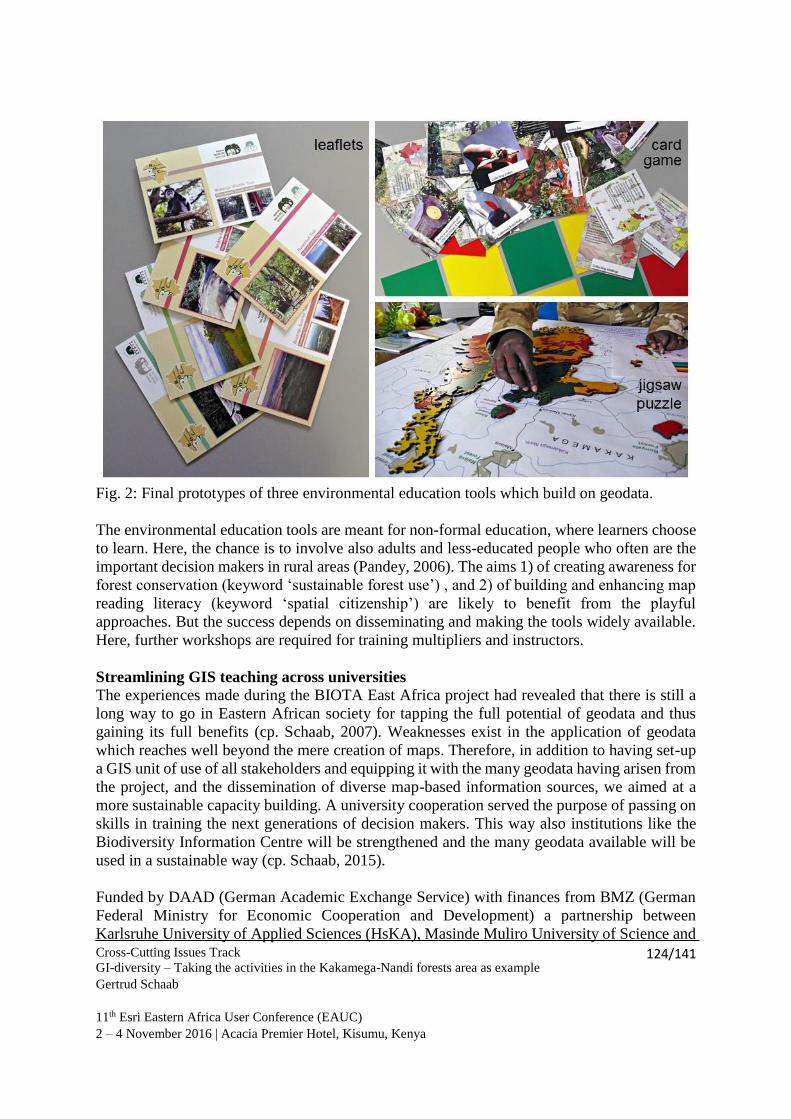
Cross-Cutting Issues Track
GI-diversity – Taking the activities in the Kakamega-Nandi forests area as example
Gertrud Schaab
11th Esri Eastern Africa User Conference (EAUC)
2 – 4 November 2016 | Acacia Premier Hotel, Kisumu, Kenya
124/141
Fig. 2: Final prototypes of three environmental education tools which build on geodata.
The environmental education tools are meant for non-formal education, where learners choose
to learn. Here, the chance is to involve also adults and less-educated people who often are the
important decision makers in rural areas (Pandey, 2006). The aims 1) of creating awareness for
forest conservation (keyword ‘sustainable forest use’) , and 2) of building and enhancing map
reading literacy (keyword ‘spatial citizenship’) are likely to benefit from the playful
approaches. But the success depends on disseminating and making the tools widely available.
Here, further workshops are required for training multipliers and instructors.
Streamlining GIS teaching across universities
The experiences made during the BIOTA East Africa project had revealed that there is still a
long way to go in Eastern African society for tapping the full potential of geodata and thus
gaining its full benefits (cp. Schaab, 2007). Weaknesses exist in the application of geodata
which reaches well beyond the mere creation of maps. Therefore, in addition to having set-up
a GIS unit of use of all stakeholders and equipping it with the many geodata having arisen from
the project, and the dissemination of diverse map-based information sources, we aimed at a
more sustainable capacity building. A university cooperation served the purpose of passing on
skills in training the next generations of decision makers. This way also institutions like the
Biodiversity Information Centre will be strengthened and the many geodata available will be
used in a sustainable way (cp. Schaab, 2015).
Funded by DAAD (German Academic Exchange Service) with finances from BMZ (German
Federal Ministry for Economic Cooperation and Development) a partnership between
Karlsruhe University of Applied Sciences (HsKA), Masinde Muliro University of Science and
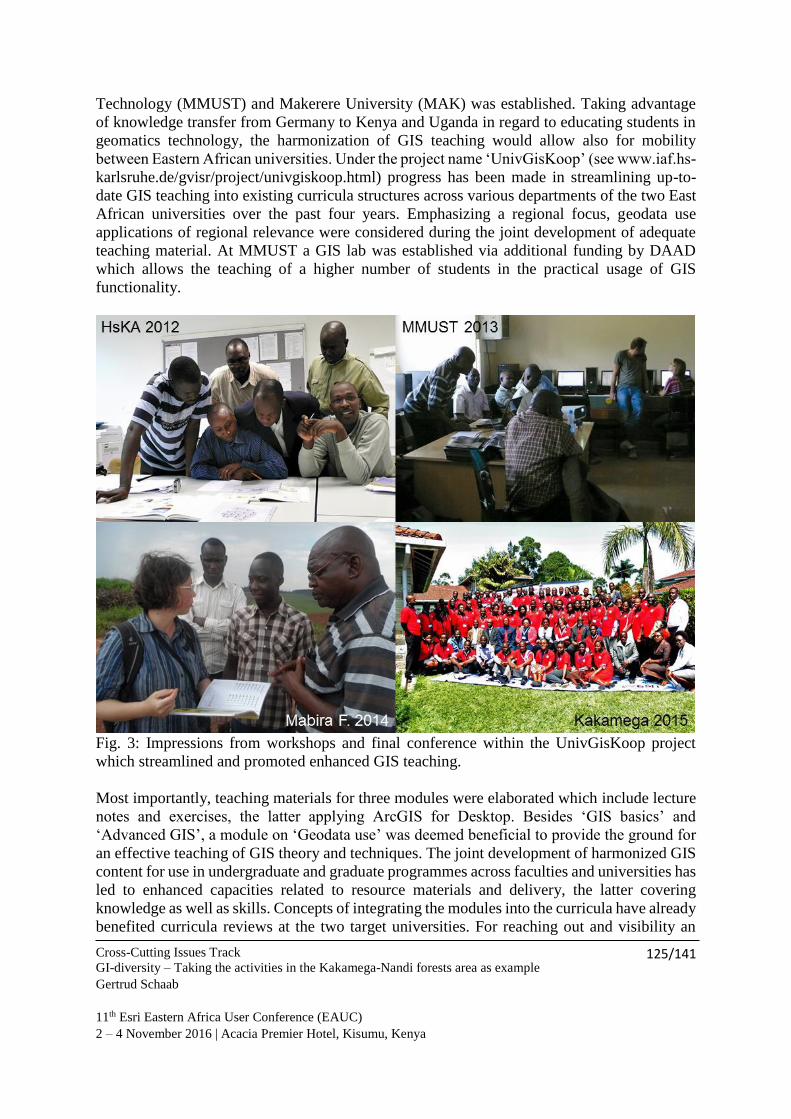
Cross-Cutting Issues Track
GI-diversity – Taking the activities in the Kakamega-Nandi forests area as example
Gertrud Schaab
11th Esri Eastern Africa User Conference (EAUC)
2 – 4 November 2016 | Acacia Premier Hotel, Kisumu, Kenya
125/141
Technology (MMUST) and Makerere University (MAK) was established. Taking advantage
of knowledge transfer from Germany to Kenya and Uganda in regard to educating students in
geomatics technology, the harmonization of GIS teaching would allow also for mobility
between Eastern African universities. Under the project name ‘UnivGisKoop’ (see www.iaf.hs-
karlsruhe.de/gvisr/project/univgiskoop.html) progress has been made in streamlining up-to-
date GIS teaching into existing curricula structures across various departments of the two East
African universities over the past four years. Emphasizing a regional focus, geodata use
applications of regional relevance were considered during the joint development of adequate
teaching material. At MMUST a GIS lab was established via additional funding by DAAD
which allows the teaching of a higher number of students in the practical usage of GIS
functionality.
Fig. 3: Impressions from workshops and final conference within the UnivGisKoop project
which streamlined and promoted enhanced GIS teaching.
Most importantly, teaching materials for three modules were elaborated which include lecture
notes and exercises, the latter applying ArcGIS for Desktop. Besides ‘GIS basics’ and
‘Advanced GIS’, a module on ‘Geodata use’ was deemed beneficial to provide the ground for
an effective teaching of GIS theory and techniques. The joint development of harmonized GIS
content for use in undergraduate and graduate programmes across faculties and universities has
led to enhanced capacities related to resource materials and delivery, the latter covering
knowledge as well as skills. Concepts of integrating the modules into the curricula have already
benefited curricula reviews at the two target universities. For reaching out and visibility an
Cross-Cutting Issues Track
GI-diversity – Taking the activities in the Kakamega-Nandi forests area as example
Gertrud Schaab
11th Esri Eastern Africa User Conference (EAUC)
2 – 4 November 2016 | Acacia Premier Hotel, Kisumu, Kenya
126/141
international conference on GIS was organized in 2015. Although funding ended, the project
partners agreed that the established partnership can further serve as springboard for more
cooperation. Fig. 3 provides impressions from the project workshops and the conference.
The project allowed supporting those responsible for educating a large pool of young people.
Integrating GIS teaching into various university curricula offers the chance for enhanced,
modern study programs fostering integrated interdisciplinary approaches based on state-of-the-
art techniques. However, computer labs dedicated to and suitably equipped for professional
geodata processing require the full institutional backing. Applying geodata of regional
relevance provide a closer link to the regions the universities are placed in and their specific
environmental challenges. Thus, geomatics can serve as empowerment tool for a sustainable
development of the region.
Conclusions
By providing an overview plus referring to three efforts in more detail, the intention has been
to demonstrate that geographic information (GI) allows for far more than creating pretty maps
which make reports look more beautiful. GI-diversity encompasses a versatility of different
data sources, offers a myriad of application possibilities, and thus benefits plenty of real-life
situations or questions. However, of major importance is to adequately address the potential
users. Here we have provided one example of addressing scientists by providing easy access
and a working environment for exploration of geodata which is available but less known and
had resulted from laborious data gathering and compilation. The Web GIS application is meant
to stimulate the use of this data. In the second example, the ordinary people are the addressees,
but in their role as stakeholders of the protected forest resources or as representatives of local
institutions/organizations. As map reading literacy cannot be taken for granted, playful
environmental education tools building on geodata have been developed, which are meant to
create ‘spatial citizenship’ for participating in informed decision making for natural resource
planning. The third effort described is aiming at a much broader impact in regard to both people
reached in the longterm as well as coverage of methods for geodata processing and
interpretation. Hands-on how to train the next generations in benefitting from making use of
the spatial reference and GI-technology will contribute to empowering many more people. As
such, since the BIOTA project ended, a start has been made in reaching out for a more effective
capacity building on geodata usage to enable the tapping of the full potential arising from
geodata, which is increasingly becoming available but is under-used. More specifically, our
work aims to contribute to the conservation and sustainable use of forests in Eastern Africa.
The example of the Kakamgea-Nandi forests can serve here as an example for demonstrating
how the spatial reference enables inter- and transdisciplinary approaches and facilitates science
to feed into implementations. But as pointed out, geodata processing per se offers far more
versatile opportunities for cooperation.
References
Athman, J.A. & M.C. Monroe (2001): Elements of effective environmental education
programs. In: A. Fedler (Ed.), Defining Best Practices in Boating, Fishing, and Stewardship
Education, Recreational Boating and Fishing Foundation, Washington D.C., 37– 48,
http://www.d.umn.edu/~kgilbert/educ5165-
731/Readings/Elements%20of%20Effective%20EE.pdf (25 October 2014).

Cross-Cutting Issues Track
GI-diversity – Taking the activities in the Kakamega-Nandi forests area as example
Gertrud Schaab
11th Esri Eastern Africa User Conference (EAUC)
2 – 4 November 2016 | Acacia Premier Hotel, Kisumu, Kenya
127/141
Farwig, N., T. Lung, G. Schaab & K. Böhning-Gaese (2014): Linking land use scenarios,
remote sensing and monitoring to project impact of management decisions. In: Biotropica,
46(3), 357–366 (doi: 10.1111/btp.12105).
Hungerford, H.R. & T.L. Volk (1990): Changing learner behavior through environmental
education. In: The Journal of Environmental Education, 21(3), 8 –22.
Huth, K., N. Mitchell & G. Schaab (2008): Judging and visualising the quality of spatio-
temporal data on the Kakamega-Nandi forest area in west Kenya. In: A. Stein, J. Shi & W.
Bijker (Eds.), Quality Aspects in Spatial Data Mining, London, Boca-Raton, 297-314.
Lübker, T. (2014): Object-based remote sensing for modelling scenarios of rural livelihoods in
the highly structured farmland surrounding Kakamega Forest, western Kenya. PhD thesis,
Technical University Dresden, Institute for Cartography, http://nbn-
resolving.de/urn:nbn:de:bsz:14-qucosa-150628.
Lung, T., M.K. Peters, N. Farwig, K. Böhning-Gaese & G. Schaab (2012): Combining long-
term land cover time series and field observations for spatially explicit predictions on
changes in tropical forest biodiversity. In: International Journal of Remote Sensing, 33(1),
13-40 (doi: 10.1080/01431161.2010.527867).
Lung, T. & G. Schaab (2010): A comparative assessment of land cover dynamics of three
protected forest areas in tropical eastern Africa. In: Environmental Monitoring and
Assessment, 161(1), 531-548 (doi: 10.1007/s10661-009-0766-3).
Mitchell, N. (2011): Rainforest change analysis in Eastern Africa: A new multi-sourced, semi-
quantitative approach to investigating more than 100 years of forest cover disturbance. PhD
thesis, University Bonn, Department of Geography, http://nbn-resolving.de/urn:nbn:de:
hbz: 5N-26793.
Mitchell, N., G. Schaab & J.W. Wägele (Eds.) (2009): Kakamega Forest ecosystem: An
introduction to the natural history and the human context. In: Karlsruher
Geowissenschaftliche Schriften (KGS), Reihe A, Bd. 17, ed. by G. Schaab.
Pandey, V.C. (2006): Environmental Education. Delhi.
Paul, L. & G. Schaab (2015): Developing environmental education tools based on geodata to
create awareness for the Kakamega-Nandi Forests ecosystem. In: Kartographische
Nachrichten. Journal of Cartography and Geographic Information, 5/2015, 296-303
(http://www.dgfk.net/index.php?do=pub&do2=kna&do3=oa).
Schaab, G. (2015): Die Bedeutung von DAAD-Hochschulkooperation für die angewandte
Forschung in Entwicklungsländern: Geodatennutzung in Ostafrika. In: Hochschule
Karlsruhe – Technik und Wirtschaft, Forschung aktuell 2015, 23-25.
Schaab, G. (2007): Capacity development within the BIOTA East Africa project - Promoting
the use of spatial information in biodiversity research and management. In: P. Zeil & S.
Kienberger (Eds.), Geoinformation for Development. Bridging the Divide through
Partnerships, Heidelberg, 44-49.
Schaab, G., B. Asser, K. Busch, P. Dammann, N. Ojha & H. Zimmer (2009a): Interaktive
Visualisierungen zur Unterstützung von Biodiversitätsforschung und -management in
einem Entwicklungsland – Erfahrungen und Herausforderungen. In: Kartographische
Nachrichten. Fachzeitschrift für Geoinformation und Visualisierung, 5/2009, 264-272.
Schaab, G., B. Khayota, G. Eilu & J.W. Wägele (Eds.) (2010): The BIOTA East Africa atlas.
Rainforest change over time. Karlsruhe.
Schaab, G., T. Lübker, T. Lung & N. Mitchell (2009b): Remotely sensed data for sustainable
biodiversity management. The case model of Kakamega Forest in western Kenya. In:
Cross-Cutting Issues Track
GI-diversity – Taking the activities in the Kakamega-Nandi forests area as example
Gertrud Schaab
11th Esri Eastern Africa User Conference (EAUC)
2 – 4 November 2016 | Acacia Premier Hotel, Kisumu, Kenya
128/141
Proceedings (digital) of the 33nd International Symposium on Remote Sensing of
Environment “Sustaining the Millennium Development Goals”, 4-8 May 2009, Stresa,
Lago Maggiore (Italy), ref. 479.
Schaab, G., T. Lübker & S. Schwarz (2011): The challenge of targeting different user groups
with The BIOTA East Africa Atlas. In: Proceedings (digital) of the 25th International
Cartographic Conference (ICC 2011) ‘Enlightened View on Cartography and GIS’, 3-8
July 2011, Paris (France), ID CO-296.
Weist, C., K. Busch, N. Mitchell & G. Schaab (2013): Investigating East African Forest Use
Histories: a Visualisation Tool for a Combined Text and Geodata Study. http://www.iaf.hs-
karlsruhe.de/ gvisr/projects/tools/vis_tool/text/title.htm.
Acknowledgements
Special thanks goes to former coworkers (by name Nick Mitchell, Cornelia Weist, Dorothea
Heim, Nirmal Ojha), the former student Lisa Paul, project colleagues (including Alex Khaemba
and Gerald Eilu) and many more cooperation partners in Kenya (e.g. at MMUST, Nature
Kenya, KWS, KFS, NMK) and Uganda (e.g. at Makerere University).
Biographical Notes
Gertrud Schaab teaches at Karlsruhe University of Applied Sciences within the Bachelor study
programmes on Geo-Information Management and Geodesy & Navigation as well as within
the International Geomatics Master programme. Her lectures cover cartography, GIS and
remote sensing. These fields she is also following with her research, currently focusing on
Eastern Africa.
Contacts
Prof. Dr. Gertrud Schaab
Karlsruhe University of Applied Sciences
Faculty of Information Management and Media
Moltkestr. 30
D-76133 Karlsruhe
GERMANY
Tel.: +49 /(0)721/925-2923
Fax: +49 /(0)721/925-2597
Email: [email protected]
Web site: www.iaf.hs-karlsruhe.de/gvisr/

Cross-Cutting Issues Track
Use of GIS and SDI in Promoting Coffee Quality in Maraba Sector, South Province of Rwanda
Hitimana Jean Pierre
11th Esri Eastern Africa User Conference (EAUC)
2 – 4 November 2016 | Acacia Premier Hotel, Kisumu, Kenya
129/141
Use of GIS and SDI in Promoting Coffee Quality in Maraba Sector, South
Province of Rwanda
Hitimana Jean Pierre, Rwanda
Key words: GPS, GIS and SDI, environmental restoration, metadata, Geodata, Webmapping,
Geo-portal
Abstract In these last recent years farmers in the sector of Maraba in South Province of Rwanda had face
challenges to keep producing good quality coffee and to be the 1st place in competition of cup of
Excellence. We conducted this research in order to show how the use of Geographic Information
Systems (GIS) and Spatial Data Infrastructure (SDI) models as the research method growing and
producing good quality coffee in taking into consideration environmental factors like: Elevation and
temperature, Rainfall and water supply, Soil, Aspect and slopes.
The findings in this research about the selection of zones of coffee plantation and relation relationship
to coffee quality will be published on Geo-Portal where maps and metadata created or collected will be
available to the public and particularly to Maraba sector community. The results of this research will
be presented to Maraba sector community in a workshop so that they can gain knowledge of the land
and the good quality of Maraba coffee.
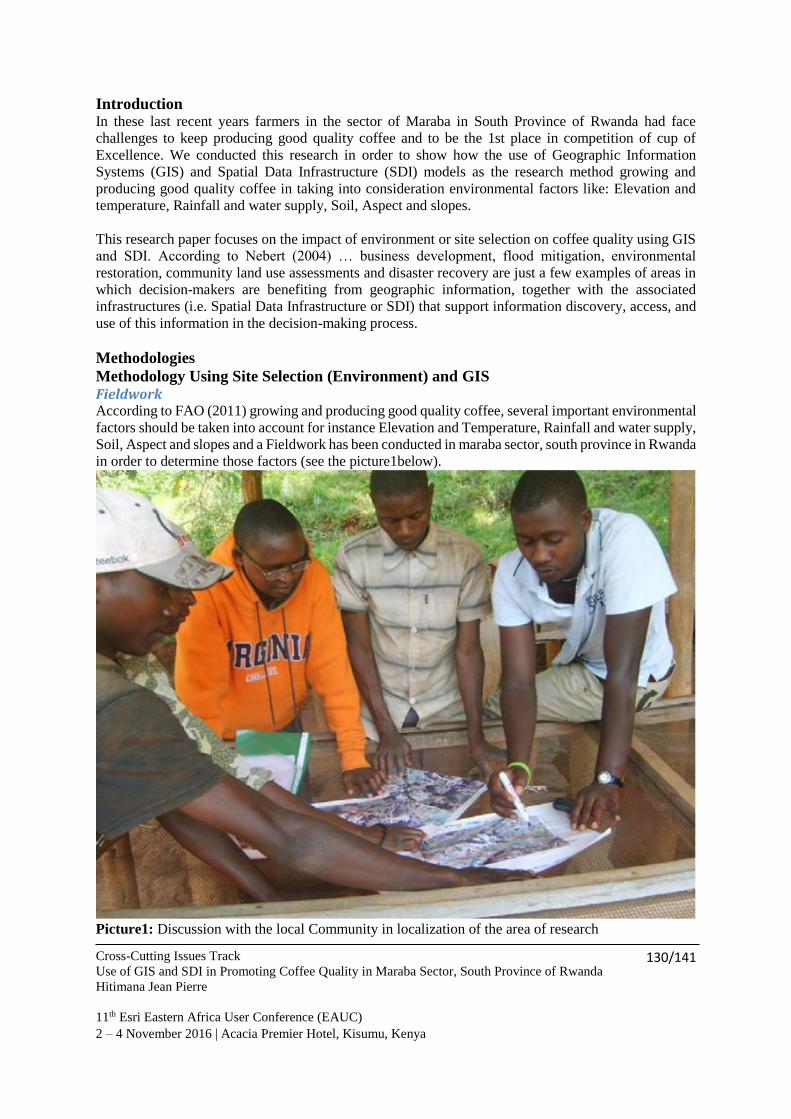
Cross-Cutting Issues Track
Use of GIS and SDI in Promoting Coffee Quality in Maraba Sector, South Province of Rwanda
Hitimana Jean Pierre
11th Esri Eastern Africa User Conference (EAUC)
2 – 4 November 2016 | Acacia Premier Hotel, Kisumu, Kenya
130/141
Introduction In these last recent years farmers in the sector of Maraba in South Province of Rwanda had face
challenges to keep producing good quality coffee and to be the 1st place in competition of cup of
Excellence. We conducted this research in order to show how the use of Geographic Information
Systems (GIS) and Spatial Data Infrastructure (SDI) models as the research method growing and
producing good quality coffee in taking into consideration environmental factors like: Elevation and
temperature, Rainfall and water supply, Soil, Aspect and slopes.
This research paper focuses on the impact of environment or site selection on coffee quality using GIS
and SDI. According to Nebert (2004) … business development, flood mitigation, environmental
restoration, community land use assessments and disaster recovery are just a few examples of areas in
which decision-makers are benefiting from geographic information, together with the associated
infrastructures (i.e. Spatial Data Infrastructure or SDI) that support information discovery, access, and
use of this information in the decision-making process.
Methodologies
Methodology Using Site Selection (Environment) and GIS Fieldwork According to FAO (2011) growing and producing good quality coffee, several important environmental
factors should be taken into account for instance Elevation and Temperature, Rainfall and water supply,
Soil, Aspect and slopes and a Fieldwork has been conducted in maraba sector, south province in Rwanda
in order to determine those factors (see the picture1below).
Picture1: Discussion with the local Community in localization of the area of research

Cross-Cutting Issues Track
Use of GIS and SDI in Promoting Coffee Quality in Maraba Sector, South Province of Rwanda
Hitimana Jean Pierre
11th Esri Eastern Africa User Conference (EAUC)
2 – 4 November 2016 | Acacia Premier Hotel, Kisumu, Kenya
131/141
The Maraba sector, south province in Rwanda has got 3 Zones of coffee fields and each Zones has got
its particular flavor of coffee.
Map1: Maraba sector, South Rwanda
Elevation The influence of geography on the flavor of a coffee bean is profound. All coffee grows in the tropics,
but the altitude at which it is grown contributes significantly to a coffee’s taste profile. Mountainous
regions of the Coffee Belt, a tropical band extending approximately 30º north and south of the equator,
produce the world’s truly great arabica coffees and Rwanda is included in that zone.
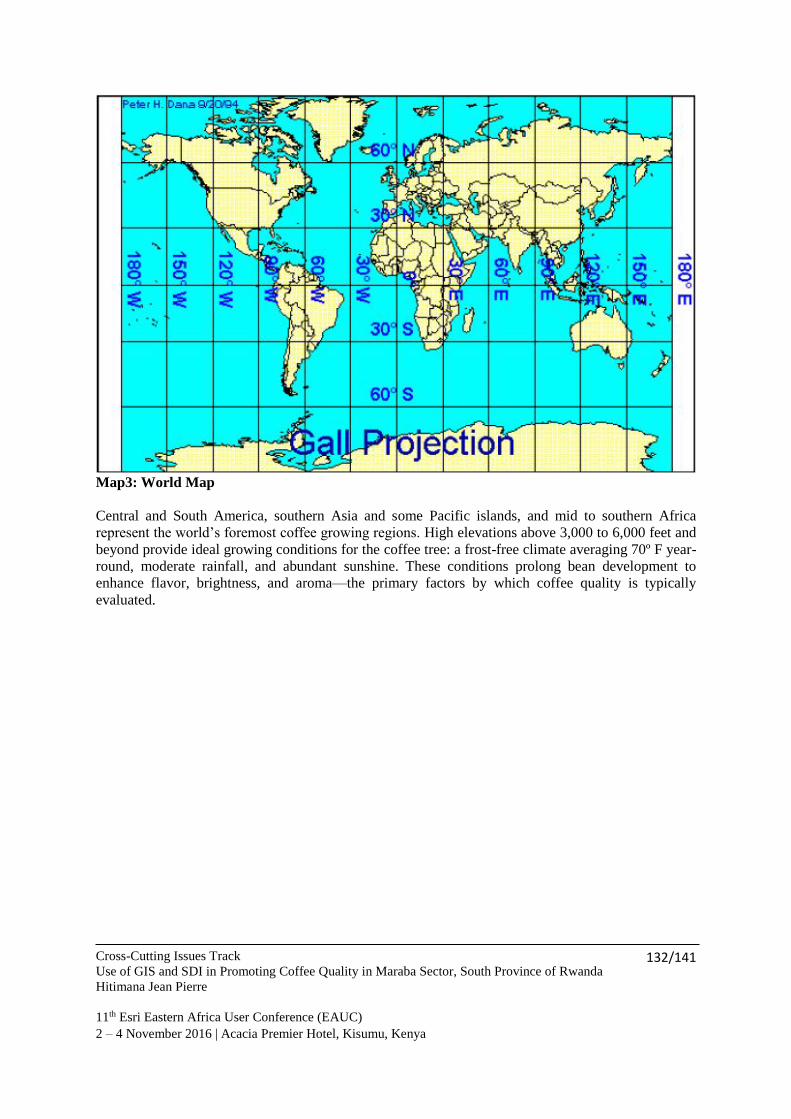
Cross-Cutting Issues Track
Use of GIS and SDI in Promoting Coffee Quality in Maraba Sector, South Province of Rwanda
Hitimana Jean Pierre
11th Esri Eastern Africa User Conference (EAUC)
2 – 4 November 2016 | Acacia Premier Hotel, Kisumu, Kenya
132/141
Map3: World Map
Central and South America, southern Asia and some Pacific islands, and mid to southern Africa
represent the world’s foremost coffee growing regions. High elevations above 3,000 to 6,000 feet and
beyond provide ideal growing conditions for the coffee tree: a frost-free climate averaging 70º F year-
round, moderate rainfall, and abundant sunshine. These conditions prolong bean development to
enhance flavor, brightness, and aroma—the primary factors by which coffee quality is typically
evaluated.
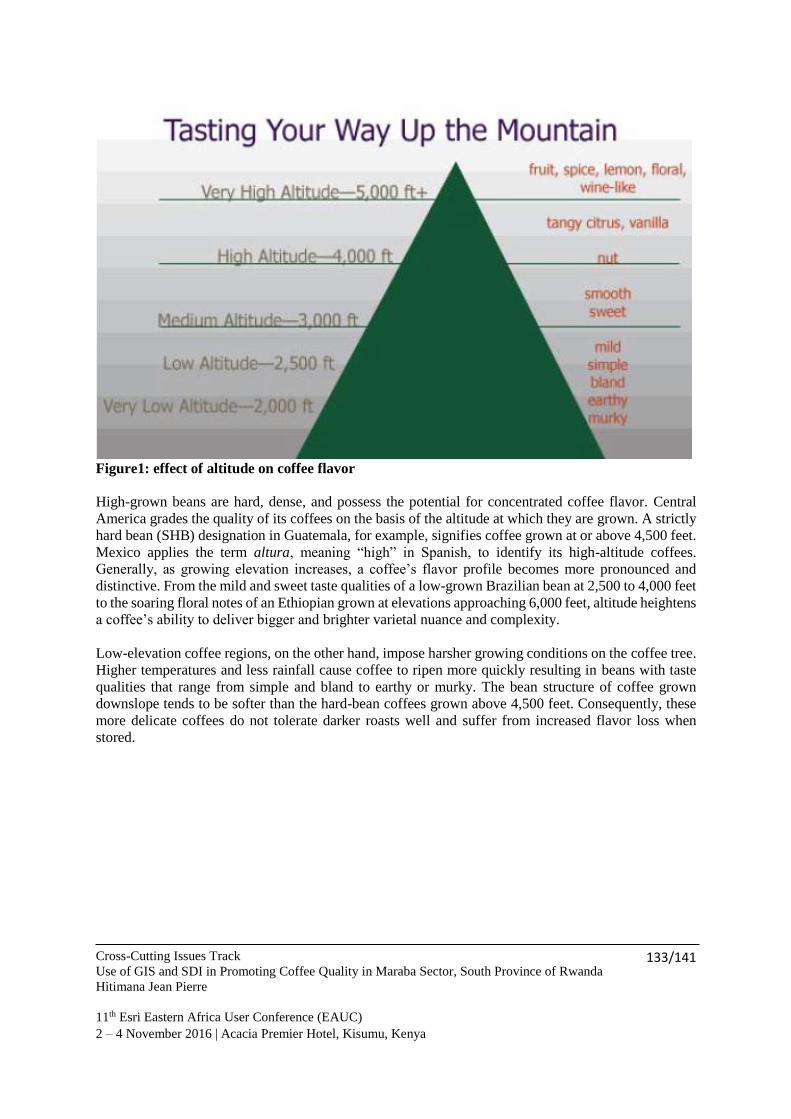
Cross-Cutting Issues Track
Use of GIS and SDI in Promoting Coffee Quality in Maraba Sector, South Province of Rwanda
Hitimana Jean Pierre
11th Esri Eastern Africa User Conference (EAUC)
2 – 4 November 2016 | Acacia Premier Hotel, Kisumu, Kenya
133/141
Figure1: effect of altitude on coffee flavor
High-grown beans are hard, dense, and possess the potential for concentrated coffee flavor. Central
America grades the quality of its coffees on the basis of the altitude at which they are grown. A strictly
hard bean (SHB) designation in Guatemala, for example, signifies coffee grown at or above 4,500 feet.
Mexico applies the term altura, meaning “high” in Spanish, to identify its high-altitude coffees.
Generally, as growing elevation increases, a coffee’s flavor profile becomes more pronounced and
distinctive. From the mild and sweet taste qualities of a low-grown Brazilian bean at 2,500 to 4,000 feet
to the soaring floral notes of an Ethiopian grown at elevations approaching 6,000 feet, altitude heightens
a coffee’s ability to deliver bigger and brighter varietal nuance and complexity.
Low-elevation coffee regions, on the other hand, impose harsher growing conditions on the coffee tree.
Higher temperatures and less rainfall cause coffee to ripen more quickly resulting in beans with taste
qualities that range from simple and bland to earthy or murky. The bean structure of coffee grown
downslope tends to be softer than the hard-bean coffees grown above 4,500 feet. Consequently, these
more delicate coffees do not tolerate darker roasts well and suffer from increased flavor loss when
stored.
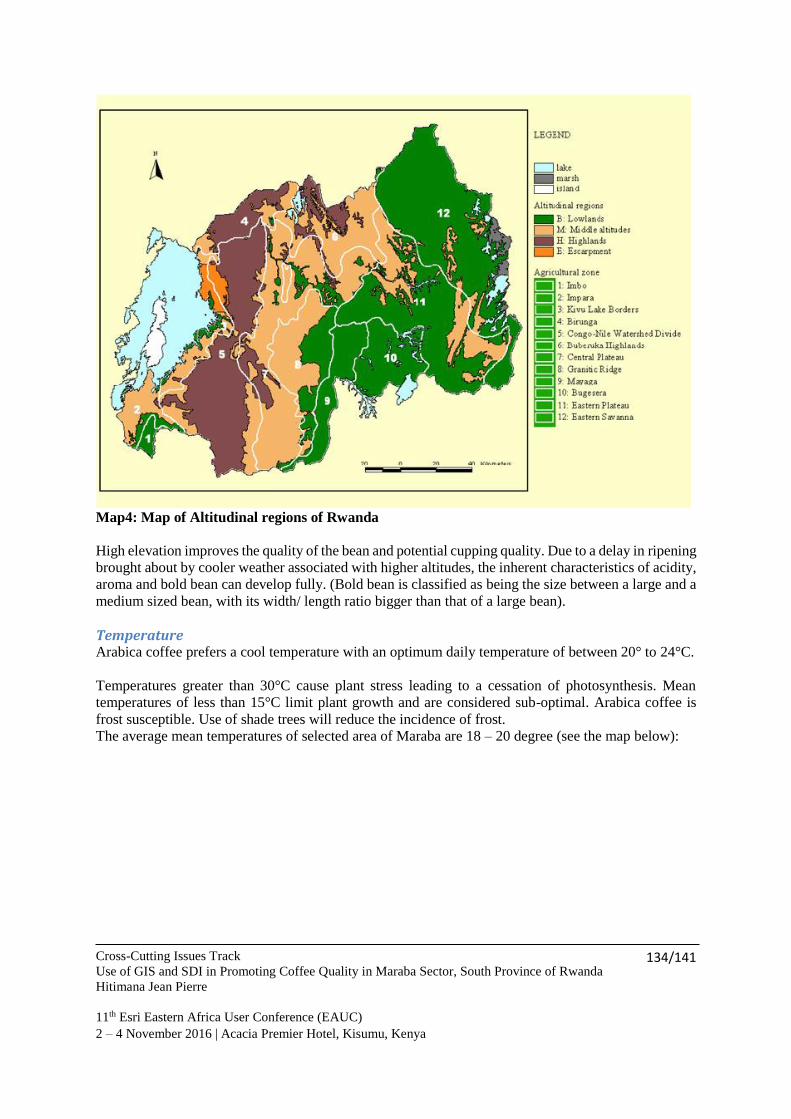
Cross-Cutting Issues Track
Use of GIS and SDI in Promoting Coffee Quality in Maraba Sector, South Province of Rwanda
Hitimana Jean Pierre
11th Esri Eastern Africa User Conference (EAUC)
2 – 4 November 2016 | Acacia Premier Hotel, Kisumu, Kenya
134/141
Map4: Map of Altitudinal regions of Rwanda
High elevation improves the quality of the bean and potential cupping quality. Due to a delay in ripening
brought about by cooler weather associated with higher altitudes, the inherent characteristics of acidity,
aroma and bold bean can develop fully. (Bold bean is classified as being the size between a large and a
medium sized bean, with its width/ length ratio bigger than that of a large bean).
Temperature Arabica coffee prefers a cool temperature with an optimum daily temperature of between 20° to 24°C.
Temperatures greater than 30°C cause plant stress leading to a cessation of photosynthesis. Mean
temperatures of less than 15°C limit plant growth and are considered sub-optimal. Arabica coffee is
frost susceptible. Use of shade trees will reduce the incidence of frost.
The average mean temperatures of selected area of Maraba are 18 – 20 degree (see the map below):
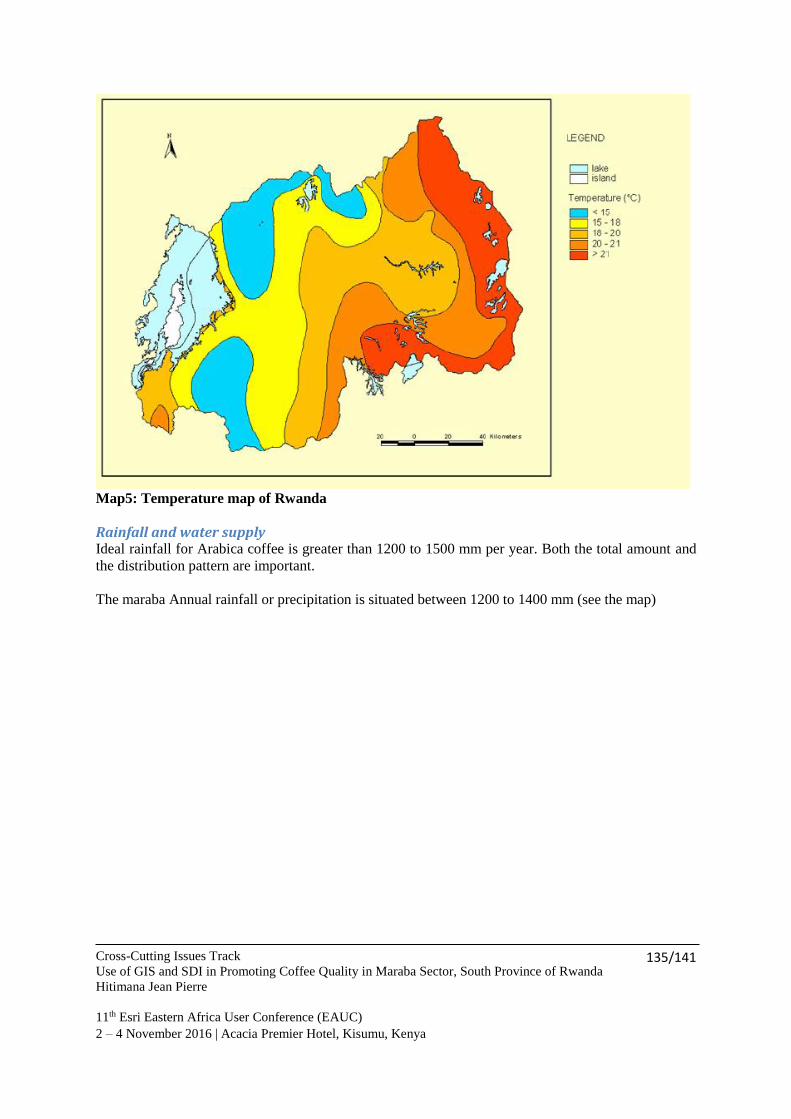
Cross-Cutting Issues Track
Use of GIS and SDI in Promoting Coffee Quality in Maraba Sector, South Province of Rwanda
Hitimana Jean Pierre
11th Esri Eastern Africa User Conference (EAUC)
2 – 4 November 2016 | Acacia Premier Hotel, Kisumu, Kenya
135/141
Map5: Temperature map of Rwanda
Rainfall and water supply Ideal rainfall for Arabica coffee is greater than 1200 to 1500 mm per year. Both the total amount and
the distribution pattern are important.
The maraba Annual rainfall or precipitation is situated between 1200 to 1400 mm (see the map)
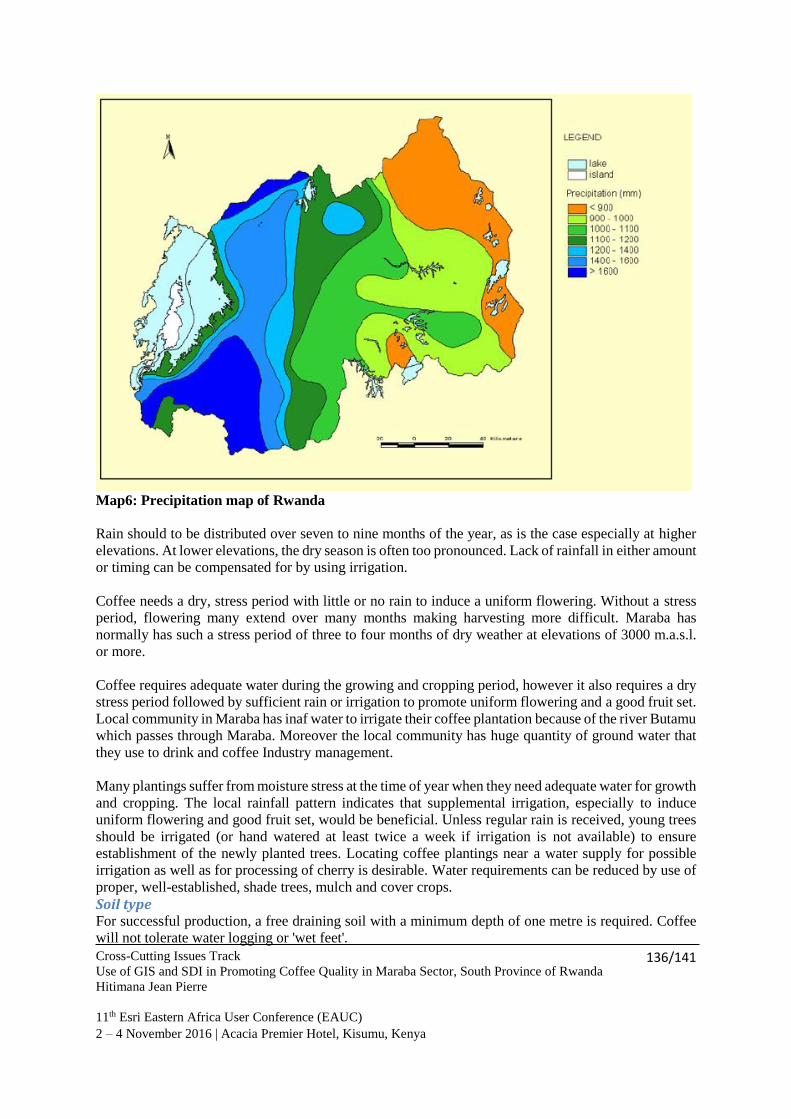
Cross-Cutting Issues Track
Use of GIS and SDI in Promoting Coffee Quality in Maraba Sector, South Province of Rwanda
Hitimana Jean Pierre
11th Esri Eastern Africa User Conference (EAUC)
2 – 4 November 2016 | Acacia Premier Hotel, Kisumu, Kenya
136/141
Map6: Precipitation map of Rwanda
Rain should to be distributed over seven to nine months of the year, as is the case especially at higher
elevations. At lower elevations, the dry season is often too pronounced. Lack of rainfall in either amount
or timing can be compensated for by using irrigation.
Coffee needs a dry, stress period with little or no rain to induce a uniform flowering. Without a stress
period, flowering many extend over many months making harvesting more difficult. Maraba has
normally has such a stress period of three to four months of dry weather at elevations of 3000 m.a.s.l.
or more.
Coffee requires adequate water during the growing and cropping period, however it also requires a dry
stress period followed by sufficient rain or irrigation to promote uniform flowering and a good fruit set.
Local community in Maraba has inaf water to irrigate their coffee plantation because of the river Butamu
which passes through Maraba. Moreover the local community has huge quantity of ground water that
they use to drink and coffee Industry management.
Many plantings suffer from moisture stress at the time of year when they need adequate water for growth
and cropping. The local rainfall pattern indicates that supplemental irrigation, especially to induce
uniform flowering and good fruit set, would be beneficial. Unless regular rain is received, young trees
should be irrigated (or hand watered at least twice a week if irrigation is not available) to ensure
establishment of the newly planted trees. Locating coffee plantings near a water supply for possible
irrigation as well as for processing of cherry is desirable. Water requirements can be reduced by use of
proper, well-established, shade trees, mulch and cover crops.
Soil type For successful production, a free draining soil with a minimum depth of one metre is required. Coffee
will not tolerate water logging or 'wet feet'.
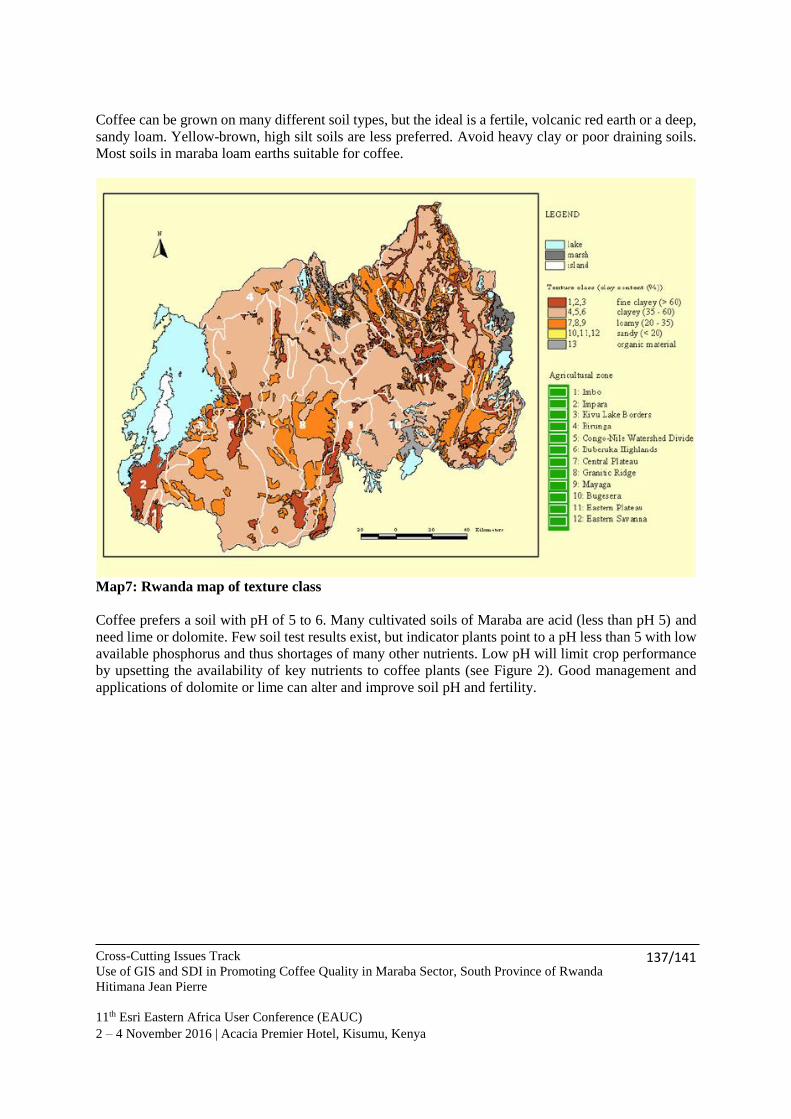
Cross-Cutting Issues Track
Use of GIS and SDI in Promoting Coffee Quality in Maraba Sector, South Province of Rwanda
Hitimana Jean Pierre
11th Esri Eastern Africa User Conference (EAUC)
2 – 4 November 2016 | Acacia Premier Hotel, Kisumu, Kenya
137/141
Coffee can be grown on many different soil types, but the ideal is a fertile, volcanic red earth or a deep,
sandy loam. Yellow-brown, high silt soils are less preferred. Avoid heavy clay or poor draining soils.
Most soils in maraba loam earths suitable for coffee.
Map7: Rwanda map of texture class
Coffee prefers a soil with pH of 5 to 6. Many cultivated soils of Maraba are acid (less than pH 5) and
need lime or dolomite. Few soil test results exist, but indicator plants point to a pH less than 5 with low
available phosphorus and thus shortages of many other nutrients. Low pH will limit crop performance
by upsetting the availability of key nutrients to coffee plants (see Figure 2). Good management and
applications of dolomite or lime can alter and improve soil pH and fertility.
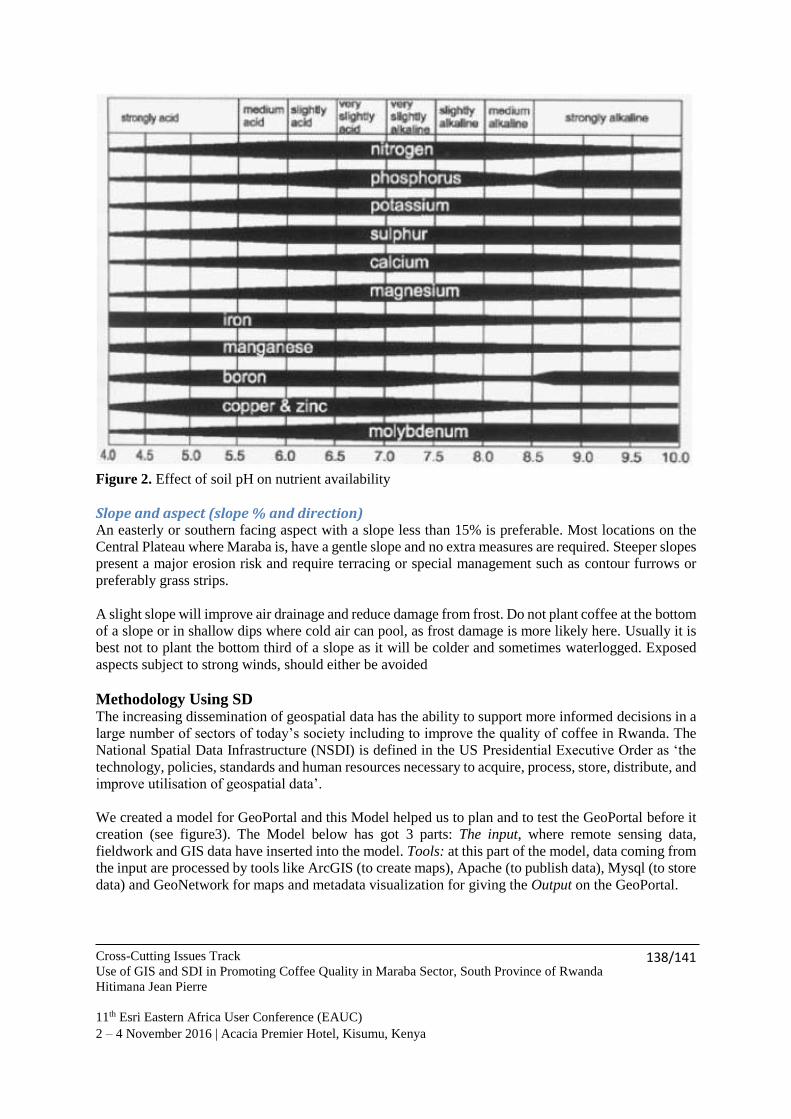
Cross-Cutting Issues Track
Use of GIS and SDI in Promoting Coffee Quality in Maraba Sector, South Province of Rwanda
Hitimana Jean Pierre
11th Esri Eastern Africa User Conference (EAUC)
2 – 4 November 2016 | Acacia Premier Hotel, Kisumu, Kenya
138/141
Figure 2. Effect of soil pH on nutrient availability
Slope and aspect (slope % and direction) An easterly or southern facing aspect with a slope less than 15% is preferable. Most locations on the
Central Plateau where Maraba is, have a gentle slope and no extra measures are required. Steeper slopes
present a major erosion risk and require terracing or special management such as contour furrows or
preferably grass strips.
A slight slope will improve air drainage and reduce damage from frost. Do not plant coffee at the bottom
of a slope or in shallow dips where cold air can pool, as frost damage is more likely here. Usually it is
best not to plant the bottom third of a slope as it will be colder and sometimes waterlogged. Exposed
aspects subject to strong winds, should either be avoided
Methodology Using SD The increasing dissemination of geospatial data has the ability to support more informed decisions in a
large number of sectors of today’s society including to improve the quality of coffee in Rwanda. The
National Spatial Data Infrastructure (NSDI) is defined in the US Presidential Executive Order as ‘the
technology, policies, standards and human resources necessary to acquire, process, store, distribute, and
improve utilisation of geospatial data’.
We created a model for GeoPortal and this Model helped us to plan and to test the GeoPortal before it
creation (see figure3). The Model below has got 3 parts: The input, where remote sensing data,
fieldwork and GIS data have inserted into the model. Tools: at this part of the model, data coming from
the input are processed by tools like ArcGIS (to create maps), Apache (to publish data), Mysql (to store
data) and GeoNetwork for maps and metadata visualization for giving the Output on the GeoPortal.
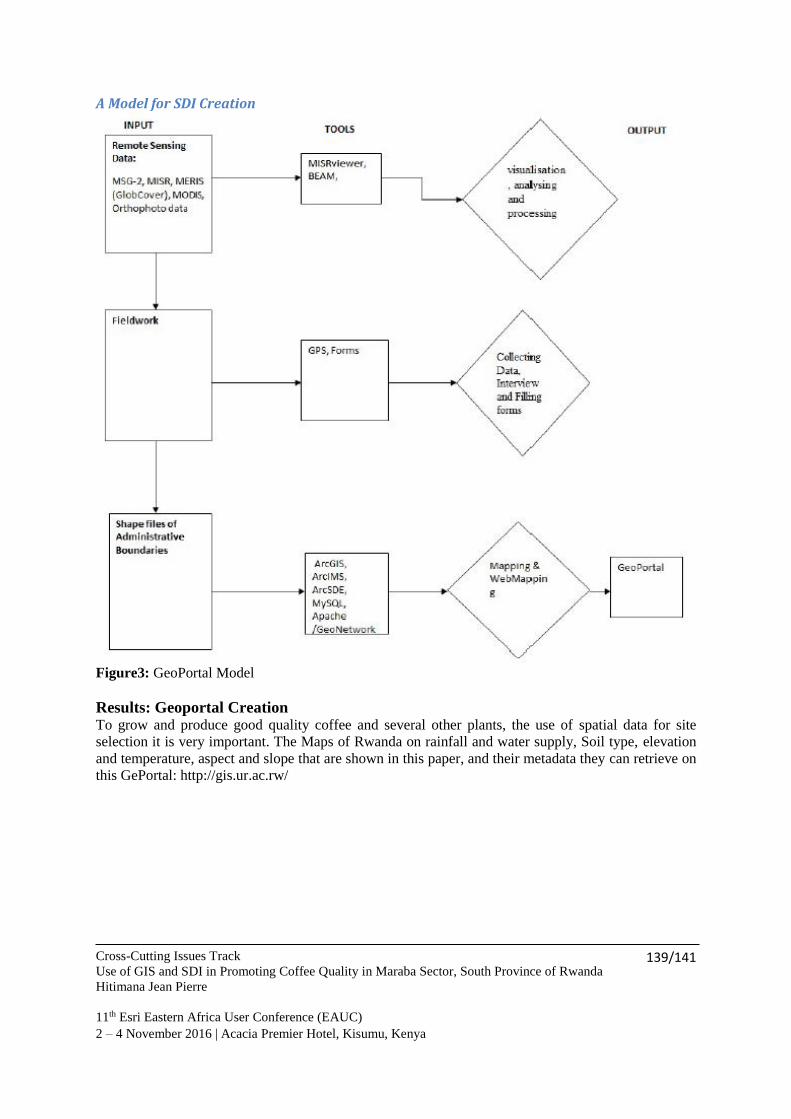
Cross-Cutting Issues Track
Use of GIS and SDI in Promoting Coffee Quality in Maraba Sector, South Province of Rwanda
Hitimana Jean Pierre
11th Esri Eastern Africa User Conference (EAUC)
2 – 4 November 2016 | Acacia Premier Hotel, Kisumu, Kenya
139/141
A Model for SDI Creation
Figure3: GeoPortal Model
Results: Geoportal Creation To grow and produce good quality coffee and several other plants, the use of spatial data for site
selection it is very important. The Maps of Rwanda on rainfall and water supply, Soil type, elevation
and temperature, aspect and slope that are shown in this paper, and their metadata they can retrieve on
this GePortal: http://gis.ur.ac.rw/
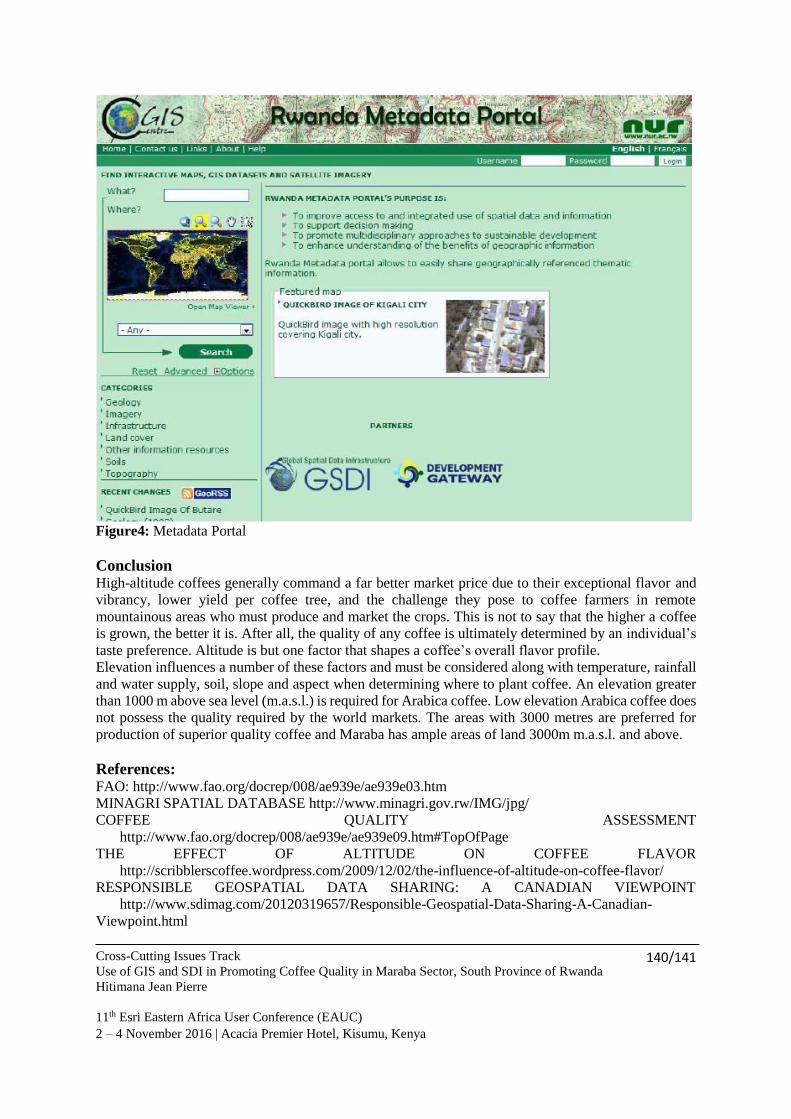
Cross-Cutting Issues Track
Use of GIS and SDI in Promoting Coffee Quality in Maraba Sector, South Province of Rwanda
Hitimana Jean Pierre
11th Esri Eastern Africa User Conference (EAUC)
2 – 4 November 2016 | Acacia Premier Hotel, Kisumu, Kenya
140/141
Figure4: Metadata Portal
Conclusion High-altitude coffees generally command a far better market price due to their exceptional flavor and
vibrancy, lower yield per coffee tree, and the challenge they pose to coffee farmers in remote
mountainous areas who must produce and market the crops. This is not to say that the higher a coffee
is grown, the better it is. After all, the quality of any coffee is ultimately determined by an individual’s
taste preference. Altitude is but one factor that shapes a coffee’s overall flavor profile.
Elevation influences a number of these factors and must be considered along with temperature, rainfall
and water supply, soil, slope and aspect when determining where to plant coffee. An elevation greater
than 1000 m above sea level (m.a.s.l.) is required for Arabica coffee. Low elevation Arabica coffee does
not possess the quality required by the world markets. The areas with 3000 metres are preferred for
production of superior quality coffee and Maraba has ample areas of land 3000m m.a.s.l. and above.
References: FAO: http://www.fao.org/docrep/008/ae939e/ae939e03.htm
MINAGRI SPATIAL DATABASE http://www.minagri.gov.rw/IMG/jpg/
COFFEE QUALITY ASSESSMENT
http://www.fao.org/docrep/008/ae939e/ae939e09.htm#TopOfPage
THE EFFECT OF ALTITUDE ON COFFEE FLAVOR
http://scribblerscoffee.wordpress.com/2009/12/02/the-influence-of-altitude-on-coffee-flavor/
RESPONSIBLE GEOSPATIAL DATA SHARING: A CANADIAN VIEWPOINT
http://www.sdimag.com/20120319657/Responsible-Geospatial-Data-Sharing-A-Canadian-
Viewpoint.html

Cross-Cutting Issues Track
Use of GIS and SDI in Promoting Coffee Quality in Maraba Sector, South Province of Rwanda
Hitimana Jean Pierre
11th Esri Eastern Africa User Conference (EAUC)
2 – 4 November 2016 | Acacia Premier Hotel, Kisumu, Kenya
141/141
SPATIAL DATA INFRASTRUCTURE: INTERNATIONAL SCENARIO
http://geospatialworld.net/index.php?option=com_content&view=article&id=19898&Itemid=96
Biographical notes: Hitimana Jean Pierre is a GIS Officer at University Rwanda in the Center of GIS. He holds a Bachelor’s
Degree in Computer Engineering and Information Technology from Kigali Institute of Science and
Technology in Rwanda. He holds a Master in ICT Policy and Regulation.
He has got 4 Certificates in Cisco Systems (CCNA), one Certificate in Spatial Data Infrastructure (SDI)
and He has got skills in Geographic Information Systems. The research interest of Jean Pierre lies on
the application of Geographic Information Science and Remote Sensing to development related issues
and Spatial Data Infrastructure (SDI), Web Mapping, poverty reduction, land use/land cover mapping
and Climate Change analysis, Natural resource management and Sustainable Development. Database
Systems, Analysis of Algorithms, Web Technologies, Software Engineering, Networking, Specification
and design of Graphical User Interface, Spatial Data Infrastructure (SDI), I gained all those skills and
knowledge in the field of Computer Science.
Contacts: Institution: University of Rwanda
Address: P.O.Box: 56 Huye-Rwanda
Tel: +250781139420
E-mail: [email protected]
Website: www.ur.ac.rw
www.cgis.ur.ac.rw

Esri Eastern Africa
3rd Floor KUSCCO Center, Upper Hill P.O.Box 57783-00200, Nairobi, Kenya
Tel: 254-20) 2713630/1/2, (0) 722 521341Email: [email protected]
Copyright © 2022 FDOKUMEN