
District Primary Education Programme-Ill District: Farrukhabad
Upload
khangminh22Category
view
4download
0
Addendum StartPage: 0
1111 Ill I1 1111ll Ill II
11ll Ill Ill Ill Ill1 I1 Control Number: 2881 3
Item Number: 1395
I
SOAH DOCKET NO. 473-04-3554 PUC DOCKET NO. 28813
PETITION TO INQUIRE INTO THE 6 BEFORE THE STATE OFFICE REASONABLENESS OF THE RATES 0 AND SERVICES OF CAP ROCK § OF
APPLICATION TO CHANGE RATES 0 ADMINISTRATIVE HEARINGS ENERGY CORPORATION AND §
DIRECT TESTIMONY
OF
CAROL SZERSZEN
ON BEHALF OF THE OFFICE OF PUBLIC UTILITY COUNSEL
*.. I , 3
X
REDACTED VERSION
AUGUST 30,2004

Direct Testimony of Carol Szerszen SOAH Docket No. 473-04-3554; PUC Docket No. 28813
Page 2 of 165
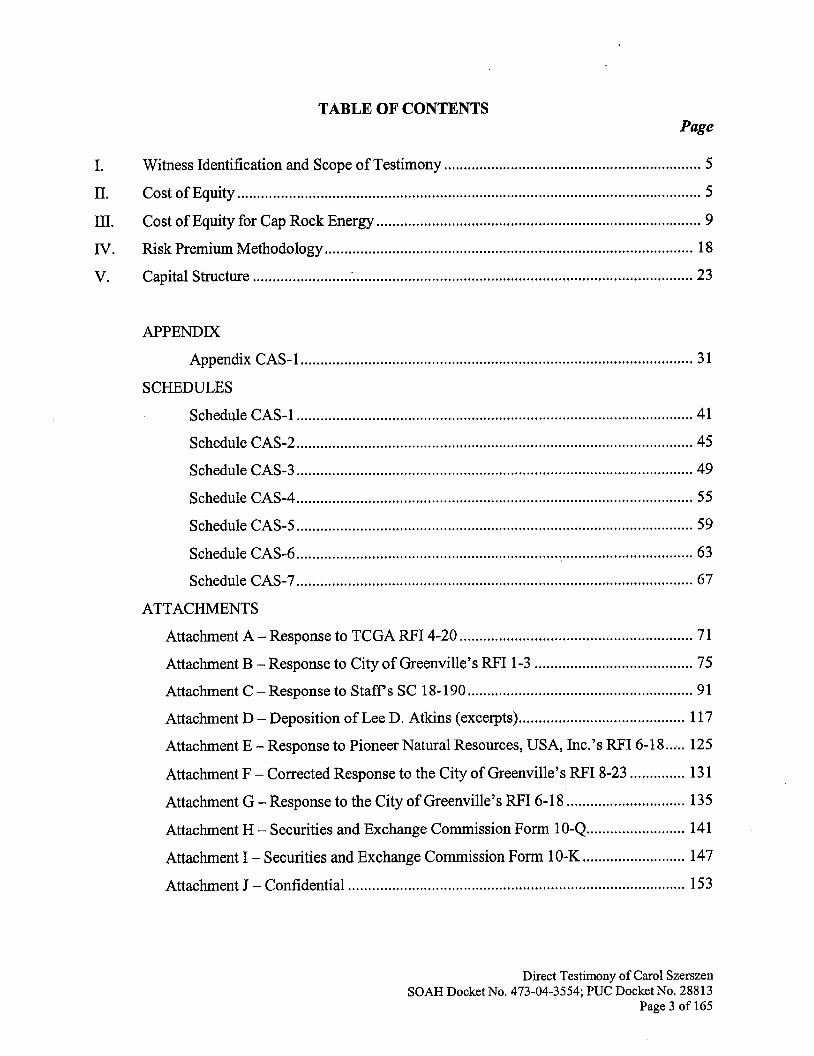
TABLE OF CONTENTS Page
I . I1 . I11 . IV . V .
Witness Identification and Scope of Testimony ................................................................. 5
Cost of Equity ........................................... : ......................................................................... 5
Cost of Equity for Cap Rock Energy .................................................................................. 9
Risk Premium Methodology ............................................................................................. 18
Capital Structure ........................ : ...................................................................................... 23
APPENDIX
Appendix CAS-1 ................................................................................................... 31
SCHEDULES
Schedule CAS-1 .................................................................................................... 41
Schedule CAS-2 .................................................................................................... 45 Schedule CAS-3 .................................................................................................... 49
Schedule CAS-4 .................................................................................................... 55
Schedule CAS-5 .................................................................................................... 59
Schedule CAS-6 .................................................................................................... 63
Schedule CAS-7 .................................................................................................... 67
Attachment A - Response to TCGA RFI 4-20 ........................................................... 71
Attachment B - Response to City of Greenville’s RFI 1-3 ........................................ 75
Attachment D - Deposition of Lee D . Atkins (excerpts) .......................................... 117
Attachment F - Corrected Response to the City of Greenville’s W I 8-23 .............. 131
Attachment G - Response to the City of Greenville’s RFI 6-1 8 .............................. 135
Attachment H - Securities and Exchange Commission Form 10-Q ......................... 141
Attachment I - Securities and Exchange Commission Form 10-K .......................... 147
Attachment J - Confidential ..................................................................................... 153
ATTACHMENTS
Attachment C - Response to Staffs SC 18-190 ......................................................... 91
Attachment E - Response to Pioneer Natural Resources, USA, Inc.’s RFI 6- 1 8 ...... 125
Direct Testimony of Carol Szerszen SOAH Docket No . 473-04-3554; PUC Docket No . 28813
Page 3 of 165

Direct Testimony of Carol Szerszen SOAH Docket No. 473-04-3554; PUC Docket No. 28813
Page 4 of 165
1
2
3
4
5
6
7
8
9
10
11
12
13
14
15
16
17
18
19
20
21
22
23
24
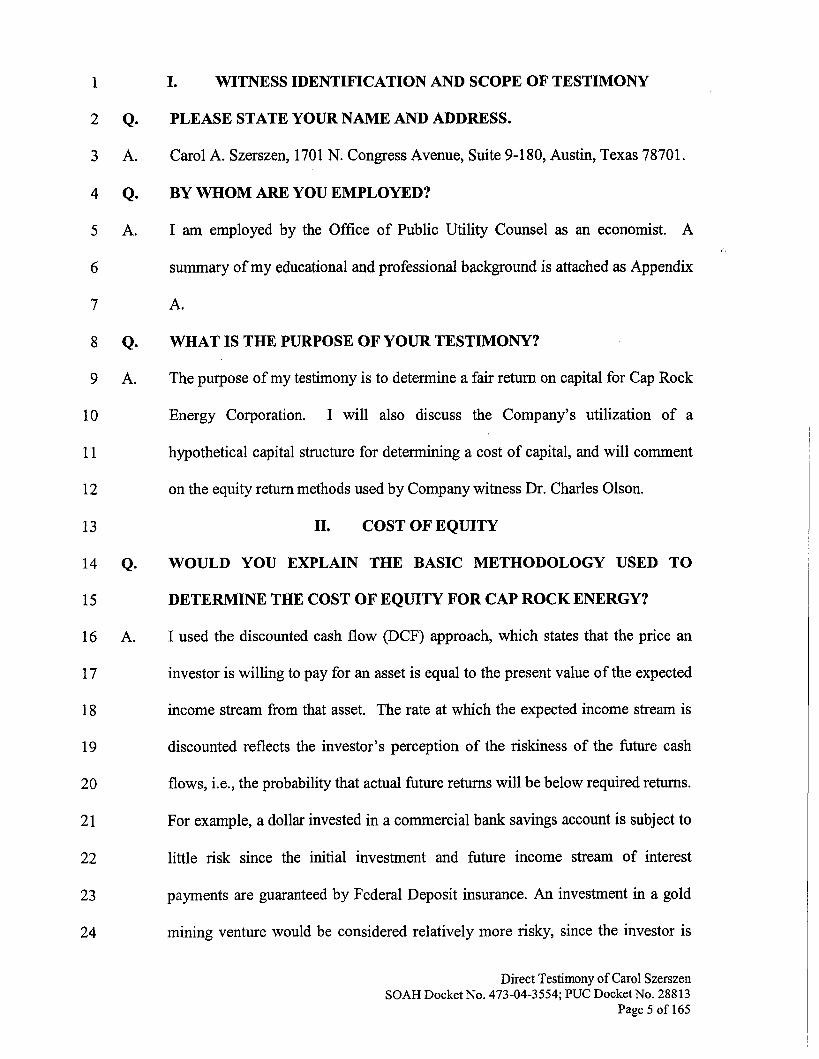
I.
PLEASE STATE YOUR NAME AND ADDRESS.
Carol A. Szerszen, 1701 N. Congress Avenue, Suite 9-180, Austin, Texas 78701.
WITNESS IDENTIFICATION AND SCOPE OF TESTIMONY
Q.
A.
Q. BY WHOM ARE YOU EMPLOYED?
A. I am employed by the Office of Public Utility Counsel as an economist. A
summary of my educational and professional background is attached as Appendix
A.
WHAT IS THE PURPOSE OF YOUR TESTIMONY? Q.
A. The purpose of my testimony is to determine a fair return on capital for Cap Rock
Energy Corporation. I will also discuss the Company’s utilization of a
hypothetical capital structure for determining a cost of capital, and will comment
on the equity return methods used by Company witness Dr. Charles Olson.
11. COST OF EQUITY
Q. WOULD YOU EXPLAIN THE BASIC METHODOLOGY USED TO
DETERMINE THE COST OF EQUITY FOR CAP ROCK ENERGY?
A. I used the discounted cash flow (DCF) approach, which states that the price an
investor is willing to pay for an asset is equal to the present value of the expected
income stream from that asset. The rate at which the expected income stream is
discounted reflects the investor’s perception of the riskiness of the fbture cash
flows, Le., the probability that actual future returns will be below required returns.
For example, a dollar invested in a commercial bank savings account is subject to
little risk since the initial investment and future income stream of interest
payments are guaranteed by Federal Deposit insurance. An investment in a gold
mining venture would be considered relatively more risky, since the investor is
Direct Testimony of Carol Szerszen SOAH Docket No. 473-04-3554; PUC Docket No. 288 13
Page 5 of 165
1
2
3
4
5
6
7
8
9
10
11 12 13 14
15
16 17 18
19
20
21
22
23
24
not assured an income flow or even the return of his initial investment. From the
investor’s point of view, the discount rate is the rate of return which he expects to
receive from his investment.
Q. HOW IS THE DCF METHOD USED TO DETERMINE THE
APPROPRIATE RATE OF RETURN ON COMMON EQUITY?
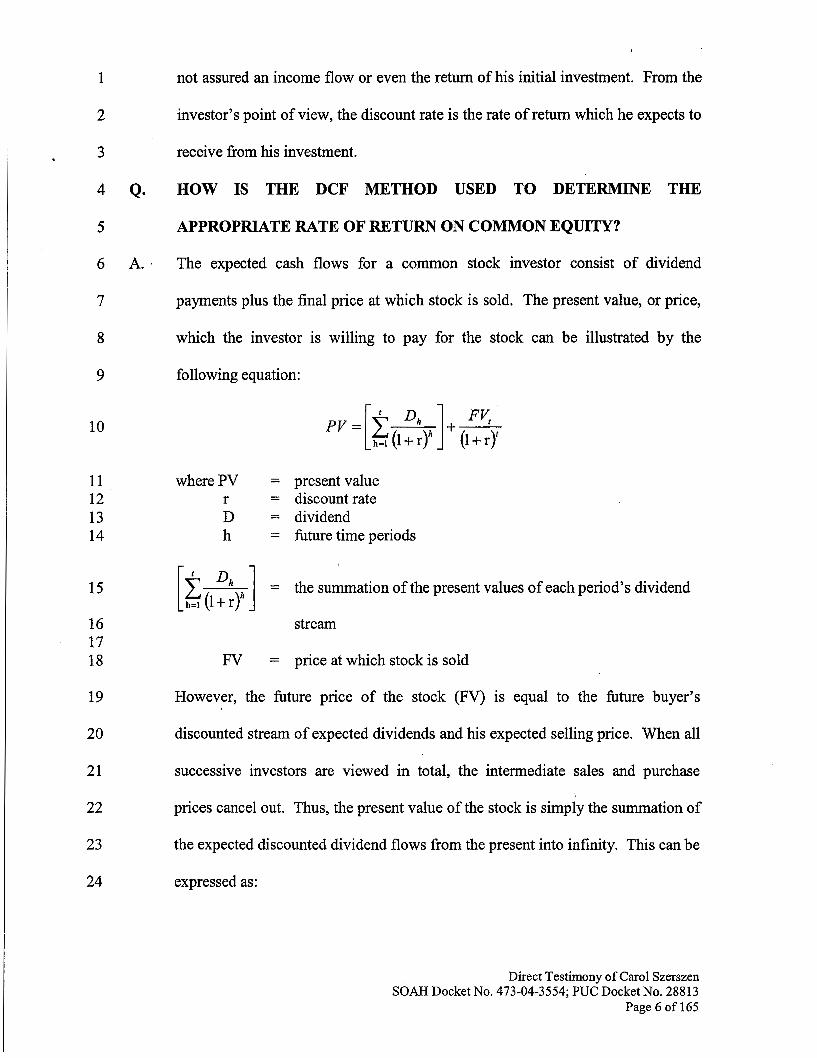
A. The expected cash flows for a common stock investor consist of dividend
payments plus the final price at which stock is sold. The present value, or price,
which the investor is willing to pay for the stock can be illustrated by the
following equation:
where PV = present value r = discount rate D = dividend h = future time periods
= the summation of the present values of each period’s dividend [$&I stream
FV = price at which stock is sold
However, the future price of the stock (FV) is equal to the future buyer’s
discounted stream of expected dividends and his expected selling price. When all
successive investors are viewed in total, the intermediate sales and purchase
prices cancel out. Thus, the present value of the stock is simply the summation of
the expected discounted dividend flows from the present into infinity. This can be
expressed as:
Direct Testimony of Carol Szerszen SOAH Docket No. 473-04-3554; PUC Docket No. 28813
Page 6 of 165
2
3
4
5
6 7
9
10 A.
11
12
13
14
15
16
17
18
19
20
21
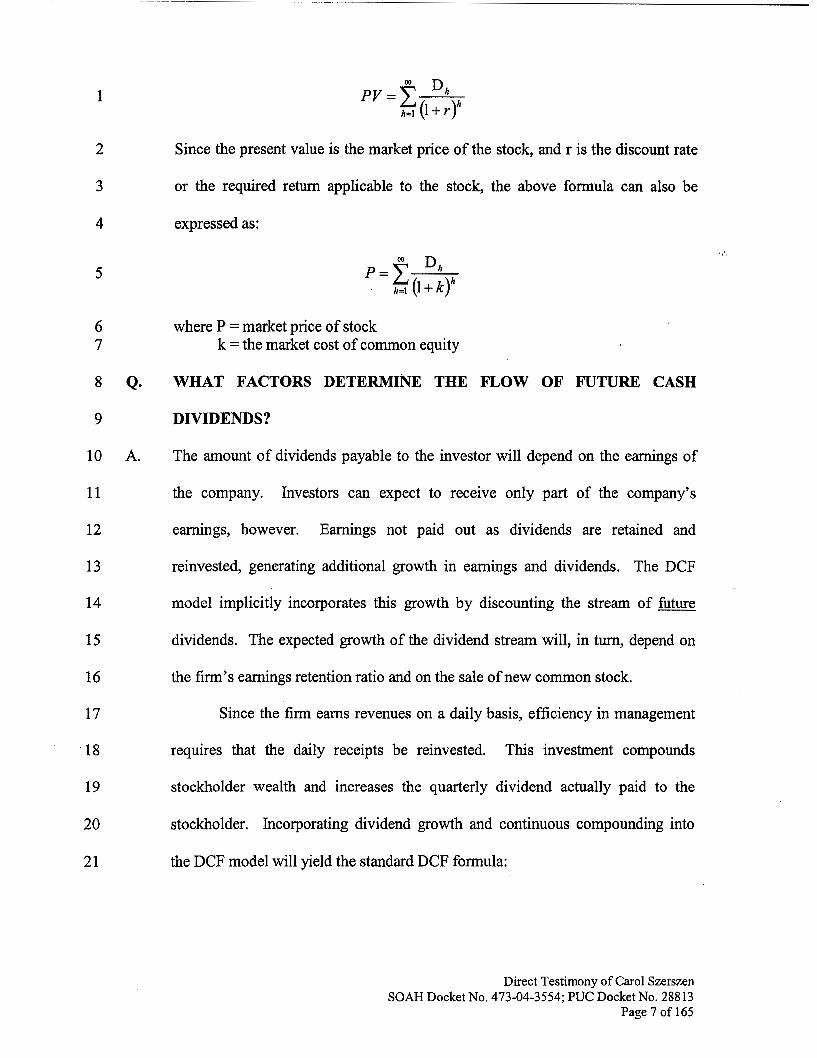
Since the present value is the market price of the stock, and r is the discount rate
or the required return applicable to the stock, the above formula can also be
expressed as:
where P = market price of stock k = the market cost of common equity
WHAT FACTORS DETERMINE THE FLOW OF FUTURE CASH
DIVIDENDS?
The amount of dividends payable to the investor will depend on the earnings of
the company. Investors can expect to receive only part of the company's
earnings, however. Earnings not paid out as dividends are retained and
reinvested, generating additional growth in earnings and dividends. The DCF
model implicitly incorporates this growth by discounting the stream of fbture
dividends. The expected growth of the dividend stream will, in turn, depend on
the firm's earnings retention ratio and on the sale of new common stock.
Since the firm earns revenues on a daily basis, efficiency in management
requires that the daily receipts be reinvested. This investment compounds
stockholder wealth and increases the quarterly dividend actually paid to the
stockholder. Incorporating dividend growth and continuous compounding into
the DCF model will yield the standard DCF formula:
Direct Testimony of Carol Szerszen SOAH Docket No. 473-04-3554; PUC Docket No. 28813
Page 7 of 165
1
7 A.
8
9
10
11
12
13
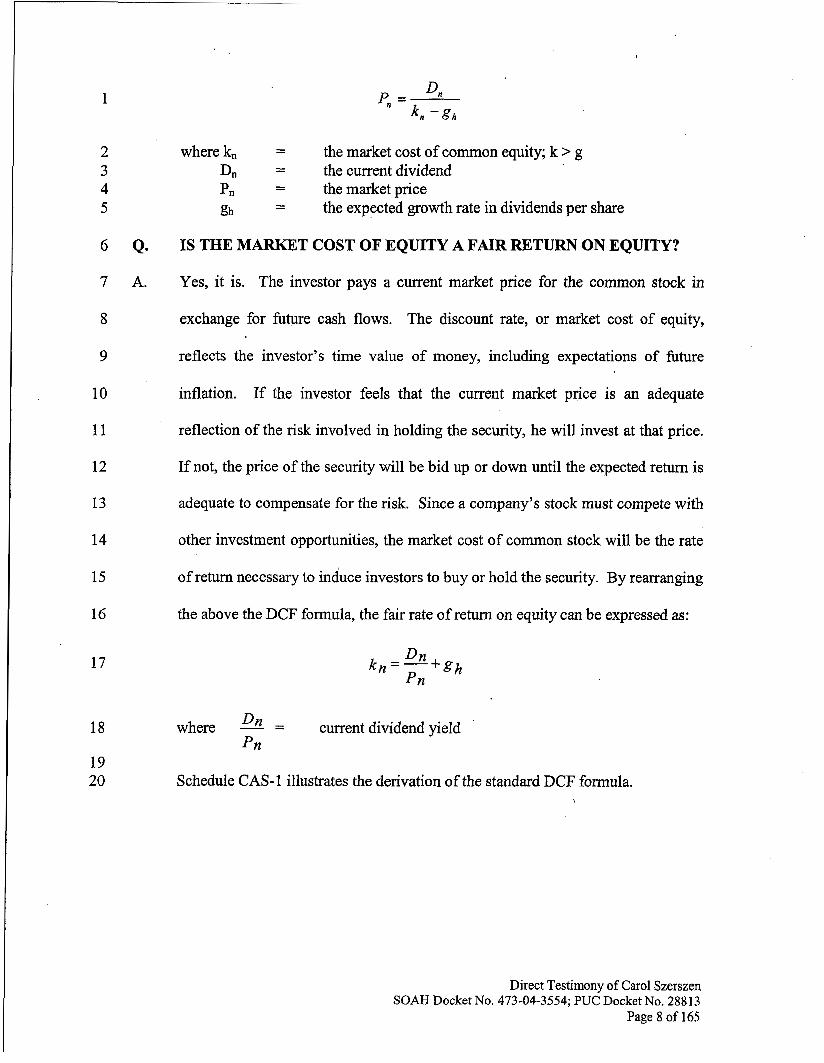
where kn = the market cost of common equity; k > g the current dividend - - Dn
pn = the market price gh = the expected growth rate in dividends per share
IS THE MARKET COST OF EQUITY A FAIR RETURN ON EQUITY?
Yes, it is. The investor pays a current market price for the common stock in
exchange for future cash flows. The discount rate, or market cost of equity,
reflects the investor’s time value of money, including expectations of future
inflation. If the investor feels that the current market price is an adequate
reflection of the risk involved in holding the security, he will invest at that price.
If not, the price of the security will be bid up or down until the expected return is
adequate to compensate for the risk. Since a company’s stock must compete with
14
15
16
other investment opportunities, the market cost of common stock will be the rate
of return necessary to induce investors to buy or hold the security. By rearranging
the above the DCF formula, the fair rate of return on equity can be expressed as:
17
18 where - Dn = current dividend yield Pn
19 20 Schedule CAS-1 illustrates the derivation of the standard DCF formula.
Direct Testimony of Carol Szerszen SOAH Docket No. 473-04-3554; PUC Docket No. 28813
Page 8 of 165
1 111. COST OF EQUITY FOR CAP ROCK ENERGY
2 Q. ARE THERE ANY SPECIAL PROBLEMS INVOLVED IN ESTIMATING
3 CAP ROCK’S COST OF EQUITY?
4 A. Yes there are. One of the most critical problems is selecting a group of utilities
5
6
with comparable risk to Cap Rock’s transmission and distribution operations.
Another problem is that Cap Rock is a very small publicly traded investor-owned
7 company, with approximately 34,000 customers and 2003 operating revenues of
8 about $83 million. Because there are no investor owned stand-alone transmission
9 and distribution utilities with revenues under $100 million, the selection of a
10 comparable group must encompass a wider universe of utility companies. The
11 cost of equity for Cap Rock can be estimated based on the comparable group
12 results after consideration of risk factor differences that may exist between Cap
13 Rock and the comparables.
14 Q. THE COMPANY’S COST OF EQUITY WITNESS, DR. CHARLES
15 OLSON, UTILIZES A GROUP OF ELECTRIC UTILITIES IN SETTING
16 A DCF RATE FOR CAP ROCK. WHAT ARE THE SELECTION
17 CRITERIA USED BY DR. OLSON?
18 A. Dr. Olson’s proxy companies all have 2002 revenues between $.8 and $10 billion,
19 and have no or limited electric generations facilities. The proxy companies are
20 listed as electric utilities by Value Time Investment Survey and derive the bulk of
21 their income from electric operations. Additionally, Dr. Olson notes that all his
22 proxy companies have gas distribution operations and some have merchant
23 generation facilities. For the most part, however, the only smaller sized company
24 in Dr. Olson’s group is CH Energy, with 2003 revenues of about $806 million.
Direct Testimony of Carol Szerszen SOAH Docket No. 473-04-3554; PUC Docket No. 28813
Page 9 of 165
1
2
3
4
5
6
7
8
9
10
11
12
13
14
15
16
17
18
19
20
21
22
23
24
The remainder of the group had revenues in the $2.5 to $10 billion range.
Although it is apparent that Dr. Olson strived to find utilities that had limited
generation facilities, this was not the case for all seven companies in his
comparable group. For instance, Northeast Utilities owns 152 generating plants,
with a total generating capacity of 5,184,034 KW. There is no indication in
Northeast Utilities’ 2003 10K that the company derives most of its revenues fi-om
transmission and distribution operations. Puget Energy purchases over 26% of its
power from company owned generating resources. As a percent of firm energy,
the percentage of power purchased from company-owned plants is 39%. Two
Energy East electric utility affiliates own over 1092 MW of generating facilities,
and again there is no indication that the company derives most of its income from
transmission and distribution operations. The other four companies in Dr.
Olson’s group, NSTAR, Pepco Holdings Consolidated Ed and CH Energy appear
to be primarily transmission and distribution companies, based on information in
their respective 2003 10-Ks.
DO YOU AGREE THAT DR. OLSON’S PROXY GROUP CAN BE USED
TO SET AN APPROPRIATE RATE OF RETURN ON EQUITY?
Dr. Olson totally rejects the results of his comparable group DCF analysis in favor
of a risk-premium derived DCF analysis. This is obvious because the cost of
equity estimated from the comparables is only 8.23% to 8.74%, the risk premium
Q.
A.
derived DCF rate is 12.6%, and the recommended DCF rate is 11.75%.
Therefore, the question of comparability is not very important. The major
problem with Dr. Olson’s comparable group is that in the interest of limiting the
sample to companies with less generating capacity and more transmission and
Direct Testimony of Carol Szerszen SOAH Docket No. 473-04-3554; PUC Docket No. 28813
Page 10 of 165
1 distribution operations, he has also selected companies that are not comparable in
2 size to Cap Rock Energy. For instance, Consolidated Edison is one of the largest
3 utilities in the US., with a market capitalization of $8.8 billion and revenues of
4 almost $10 billion. Pepco Holdings has a market capitalization of over $3.1
5
6
billion and revenues of over $7 billion. Northeast Utilities’ market capitalization
is $2.4 billion, with revenues exceeding $6 billion. Cap Rock’s market * , e 1
7 capitalization is currently only about $37 million. In terms of market
8 capitalization, Con Ed is 238 times larger than Cap Rock.
9
10
11
12
13
14
15 Q.
16
17 A.
18
19
20
21 Q.
22
23 A.
24
I believe it would be more appropriate to select comparable utilities based
primarily on size, rather than on the predominance of transmission and
distribution operations. Smaller sized utilities are more likely to be riskier than
larger ones. Utilizing smaller capitalization companies not only allows for the
selection of a larger group of cornparables, but also controls for additional risk
factors associated with smaller sized electric operations.
AREN’T COMBINATION GENERATION AND T&D UTILITIES
CONSIDERED RISKIER THAN T&D ONLY COMPANIES?
Yes. However, I don’t consider this fact to be of crucial importance in estimating
a cost of equity for Cap Rock. The inclusion of riskier utilities in a comparable
group will result in a very conservative cost of equity that can be adjusted
downward if necessary to account for the lower risk inherent in T&D operations.
WHAT COMPARABLE RISK GROUP DID YOU UTILIZE TO
MEASURE CAP ROCK’S COST OF EQUITY?
My sample of utility companies includes all the electric companies with revenues
less than $1 billion that are covered in the Value Line Investment Survey. Each
Direct Testimony of Carol Szerszen SOAH Docket No. 473-04-3554; PUC Docket No. 28813
Page 1 1 of 165
1
2
3
4
5
6 Q9
7
8 A.
9
10
11
12
13
14
15
16
17
18
19
20
21
22 Q.
23
Company’s 2004 market capitalization, along with the respective 2003 revenues,
are shown in my Schedule CAS-4. Eleven of the companies are combination
electric generation and T&D utilities. CH Energy Group, which is also included
in Dr. Olson’s proxy group, is primarily engaged in electric transmission and
distribution.
HOW DID YOU ESTIMATE A DIVIDEND YIELD FOR YOUR
COMPARABLE GROUP?
In order to minimize distortions in the dividend yield that can occur during short
periods of time, I utilized the average 2004 high and low stock prices as reported
in the Vahe Line Investment Suwey. For the dividend amount, I utilized both the
2004 projected dividend and the 2005 projected dividend. As can be seen from
Schedule CAS-5, page 1, there is a very small difference between the 2004 and
2005 projected dividends for each company. I have utilized the 2005 dividend
payment projection as a reasonable expectation of the dividend investors expect
over the ensuing twelve months. The more correct procedure would be to
combine the last two quarters of the 2004 projected dividend with the first two
quarters of the projected 2005 dividend. However, the numerical difference
between the two is small, so the projected full year 2005 dividend was utilized in
estimating an average dividend yield for the comparable group. The calculated
dividend yields for each company are shown in Schedule CAS-5, page 1. The
average dividend yield for the group is 4.85%.
HOW DID YOU CALCULATE AN EXPECTED DIVIDEND GROWTH
RATE FOR THE COMPARABLE GROUP?
Direct Testimony of Carol Szerszen SOAH Docket No. 473-04-3554; PUC Docket No. 28813
Page 12 of 165
1
2
3
4
5
6
7
8
9
10
11
12
13
14
15
16
17
18
19
20
21
22
23
A.
Q*
A.
The only appropriate growth rate for use in the DCF model is the expected
sustainable long-run dividend growth. I utilize several different methods to
estimate this growth rate. The first is a determination of growth in book value per
share for the comparable companies, and the second method is a determination of
a sustainable retained earnings growth rate. The sustainable retained earnings
growth rate is calculated by taking the expected retention ratio and multiplying by
the expected rate of return on book value common equity. The retained earnings
, , t ,
growth rate is commonly referred to as the BR growth rate, where B equals the
retention ratio and R equals the return on common equity.
In estimating a long-term expected dividend growth rate for the utility
group, I will also review the five year growth projections made by Value Line.
WHY IS IT MORE APPROPRIATE TO RELY ON BOOK VALUE
GROWTH IN ESTIMATING A LONG-TERM DIVIDEND GROWTH
RATE RATHER THAN ON DIVIDEND AND EARNINGS GROWTH?
Growth in dividends and earnings generally do not provide reliable estimates of
growth, particularly since year to year changes in earnings and dividends can be
unduly influenced by changes in earned returns andor dividend payout ratios. On
the other hand, book value growth is less affected by changes in earned returns
and retention ratios and yields more accurate growth estimates. Investors know
that in the long run, growth in book value is the basic source of sustainable
earnings growth. Earnings growth, in turn, provides the basis for increased future
dividends. Schedule CAS-2 contains a mathematical demonstration that expected
book value growth will equal expected dividend growth.
Direct Testimony of Carol Szerszen SOAH Docket No. 473-04-3554; PUC Docket No. 28813
Page 13 of 165
1 Q. WOULD YOU PROVIDE AN EXAMPLE OF HOW CHANGES IN
2 EARNED RETURNS AND RETENTION RATIOS AFFECT THE
3
4 A.
GROWTH RATES OF DIVIDENDS, EARNINGS AND BOOK VALUE?
In Schedule CAS-3, I have exhibited three different possible combinations of
5
6
7
8
9
10
11
12
13
14
15
16
17
18
19
20
changes in earned returns and changes in the retention ratio. Page 1 of the
Schedule illustrates the effects on dividend, earnings and book value growth when
earned returns are increasing and the retention ratio remains constant. The growth
rates for dividends and earnings are much larger than either the growth in book
value or the implied internal growth rate (Le., retained earnings growth). In order
for the dividend or earnings growth to be sustainable in the long run, investors
would have to assume that earned returns on common equity will continually
increase. This implies that regulatory commissions would eventually allow
earned returns on common equity in excess of loo%, and finally infinite returns.
On page 2 of the ,Schedule, the growth rate in dividends is larger than both
earnings and book value growth. This is possible only through an increase in the
payout ratio. Obviously, when the payout ratio reaches loo%, growth will cease.
On page 3 of the Schedule, dividends and earnings both grow at a higher
rate than book value. The growth rates in dividends and earnings can only be
maintained if the earned return increases forever and the retention ratio decreases
forever. Obviously, this is not a viable assumption for the investor.
21 Q. PLEASE EXPLAIN THE SECOND METHOD YOU USED TO ESTIMATE
22 GROWTH RATE FOR THE COMPARABLE GROUP.
23 A. As I mentioned previously in my testimony, the proper growth rate to use in the
24 DCF model is the long-run dividend growth. Conceptually, this growth rate is
Direct Testimony of Carol Szerszen SOAH Docket No. 473-04-3554; PUC Docket No. 288 13
Page 14 of 165
4
8
9
10 Q.
11
12 A.
13
14
15
16
17
18
19
20
21
22
23
24
equal to the expected long-run retention ratio (b) times the expected rate of return
(r), assuming no new stock is issued or that new stock is issued at book value.
The long-term expected growth rates are typically derived from an examination of
historical retention ratios as well as historical earned returns on book common
equity. These historical data are easily understandable and accessible to the
investor, and it is reasonable to assume that past events are important in
formulating expectations of the future. Past performance is particularly relevant
for regulated utilities because the regulatory process minimizes yearly
fluctuations in earnings, dividends, and cash flows.
WOULD YOU DISCUSS THE UTILITY COMPANY GROUP’S PAST
AND PROJECTED GROWTH RATES?
In Schedule CAS-6, I show historical growth statistics for the comparable electric
utilities. In Schedule CAS-5, page 1, I show projected statistics growth for the
comparable group. All data was obtained fiom the May 14, June 4, and July 2,
2004 editions of Value Line. The average historical growth rate in earnings,
dividends and book value for the electric utilities ranges from -18.5% to 17.5%.
The average five historical growth rate in earnings for the group is .45%.
Historical dividend growth is -1.57% and historical book value growth is 2.71%.
The rather low historical growth statistics can be largely explained by events
related to the introduction of competition in various parts of the country. For
instance, Duquesne Light Holdings sold all its generating assets in 2000, resulting
in a large drop in book value, and a five year book value growth rate of -16.5%.
If Duquesne’s book value growth rate was excluded from the group, the average
growth rate for the comparables would be about 4.9%. Projected earnings,
Direct Testimony of Carol Szerszen SOAH Docket No. 473-04-3554; PUC Docket No. 288 13
Page 15 of 165
1
2
3
4
5
6
7
8
9 .
10
11
12
13
14
15
16
17
18
19
20
21
22
Q-
A.
Q*
A.
dividend and book value growth range from 0% to 11%. The average projected
earnings growth rate for the group is 4.36%, the average projected dividend
growth is 1.25% and the average book value growth projection is 3.68%.
WHAT ARE THE PROJECTED BR GROWTH RATES FOR THE
ELECTRIC GROUP?
The projected five year growth rates range from -.4% to 9.23%. The average
projected BR growth rate is 4.03%.
DID YOU REVIEW ANY ADDITIONAL PROJECTED GROWTH
RATES?
I reviewed the five year projected earnings growth rate for each company from
First Call, which is a consensus growth rate estimate publicly available from
Yahoo Finance. Dr. Olson also relies on First Call estimates in his DCF analysis.
Unfortunately, projected earnings growth was only available for five of the
companies. This is not surprising, since almost all the companies in the group are
considered small capitalization stocks, which generally do not have as extensive
analyst coverage as larger capitalization stocks. The average earnings growth
projection for the five companies is 5%. However, this average has limited value
since it is based on only 5 of the 11 comparable companies. First Call does
provide a five year projected earnings growth for the electric industry as a whole.
The projection for the industry is 4.82%, which is 46 basis points higher than the
4.36% Value Line five year average earnings growth estimate for my comparable
companies.
Direct Testimony of Carol Szerszen SOAH Docket No. 473-04-3554; PUC Docket No. 28813
Page 16 of 165
1 Q*
2
3
4 A.
5
6
7
8
9
10
11 Q.
12
13
14 A.
15
16
17
18
19
20 Q.
21
22
23
BASED ON THE DIVIDEND YIELD AND GROWTH STATISTICS,
WHAT DCF RATE DO YOU FIND FOR THE COMPARABLE
COMPANIES?
Based on my review of the comparable company historical and projected Value
Line growth estimates, a reasonable growth expectation would range from 4.03%
to 4.36%. This range is based on the five year average BR projected growth rate
and the five year average projected earnings growth rate shown in my Schedule
CAS-5. Adding the 4.85% average dividend yield for the group to the growth
rates results in a DCF cost range ranging from 8.88% to 9.21%. The midpoint
cost of equity is 9%.
HAVE YOU PERFORMED A COST OF EQUITY ANALYSIS USING
MORE RECENT STOCK PRICES FOR THE COMPARABLE
COMPANIES?
Yes I have. Utilizing mid-February to mid-August average weekly closing prices
for the comparable group results in an average dividend yield of 4.878%. Since
the stock market has been trending downward over the past couple of months,
utilizing more recent stock prices would cause the group's average dividend yield
to increase. The cost of equity estimate range utilizing the higher dividend yield
is 8.91% to 9.24%. A midpoint cost of equity estimate would be 9.1%.
ONE OF THE COMPARABLE COMPANIES, UNISOURCE ENERGY, IS
IN THE PROCESS OF BEING ACQUIRED BY A PRIVATE INVESTOR.
DOES THIS EVENT AFFECT THE RESULTS OF YOUR DCF
ANALYSIS?
Direct Testimony of Carol Szerszen SOAH Docket No. 473-04-3554; PUC Docket No. 28813
Page 17 of 165
1 A.
2
3
4
5
6
7 Q*
8
9
10 A.
11
12
13
14
15
16
17
18
19
20
No. I calculated the same financial information found in Schedule CAS-5, page
1, excluding UniSource Energy. Page 2 of the schedule shows the comparable
group average dividend yields as well as the historical and projected growth rates
without UniSource Energy. The exclusion of UniSowce Energy does not
materially change my DCF findings.
IV. RISK PREMIUM METHODOLOGY
DR. OLSON CALCULATED A RISK PREMIUM DERIVED DCF RATE
FOR CAP ROCK. WOULD YOU EXPLAIN THE METHODOLOGY
UTILIZED BY DR. OLSON?
Yes I will. The risk premium method attempts to calculate a cost of equity based
on the hypothesis that investors always require a greater return on equity
investments than debt investments. This is because common equity is exposed to
greater investment risk than debt capital. Actual historical differences between
equity returns and debt seturns have not, however, always shown that common
investors necessarily will earn a higher return on equity capital than on debt
capital. However, the risk premium method is based on the assumption that
equity investors will always require a higher return. In Dr. Olson’s risk premium
analysis, he finds that the average yield (or return) on Moody’s Baa rated
corporate bonds for November - December 2003 to be 6.6%. However, the actual
equity risk premium utilized by Dr. Olson is derived from historical data
21 presented in Roger G. Ibbotson’s Stocks, Bonds, BiZZs, and Inflation: 2003
22 Yearbook. Since the Ibbotson study provides data that can support a very high
23 risk premium calculation, it is widely used by utility company rate of return
24 witnesses. Dr. Olson states that Ibbotson has shown that common stocks have
Direct Testimony of Carol Szerszen SOAH Docket No. 473-04-3554; PUC Docket No. 28813
Page 18 of 165
1
2
3
4 Q*
5
6
7 A.
8
9
10
11
12
13
14
15
16
17
18
19
20
21
22
23
produced returns that average 6.0 percentage points more than corporate bonds.
Adding this 6% to the 6.6% average Baa bond yield results in a 12.6% risk-
premium derived DCF rate.
DO YOU AGREE THAT DR. OLSON’S METHODOLOGY IS A PROPER
ONE TO UTILIZE FOR CALCULATING A RISK-PREMIUM DERIVED ,‘I
DCF RATE?
No. As I mentioned above, the Ibbotson study will support a large variety of risk
premium results. Dr. Olson does not specifically state which combination of data
years and data results he utilizes in deriving the 6% risk premium, but I assume
that it is the entire 1928-2003 series calculated by Ibbotson. The risk premiums
calculated from Ibbotson can be dramatically different depending on whether a
geometric mean, median or arithmetic mean average risk premium is calculated.
For instance, the geometric mean risk premium between public utility stocks and
public utility bonds for the 1928-2003 period is 2.86%, whereas the arithmetic
mean is 4.99%, and the median is 6.71%. This range of estimates is too variable
and reduces the usefulness of the study in deriving a DCF rate. Utilizing the
2.86% geometric mean, a risk premium derived DCF rate of 9.46% (6.6% +
2.86%) is just as computationally valid as the 12.6% rate calculated by Dr. Olson.
The risk premiums from Ibbotson can also widely differ depending on the
combination of years chosen. For instance, the geometric mean risk premium for
the 1952-2003 period is 4.19%, for the 1974-2003 period is 3.05% and for the
1979-2003 period is 3.06% Since it can be reasonably argued that more recent
time periods are reflective of modem capital market conditions, the 1979-2003
Direct Testimony of Carol Szerszen SOAH Docket No. 473-04-3554; PUC Docket No. 28813
Page 19 of 165
1
2
3
4
5
6
7
8
9
10
11
12
13
14
15
16
17
18
19
20
21
22
23
24
Q*
A.
Q.
A.
calculated average risk premium would be a ‘better estimate of an investor
expected risk premium.
DOES THE UTILIZATION OF HISTORICAL DATA PROVIDE A
RELIABLE MEASURE OF CURRENT INVESTOR EXPECTED DEBT-
EQUITY RISK PREMIUMS?
No. A proper and relevant risk premium study requires the calculation of current
expected returns from the stock market and current expected returns from utility
bonds. Furthermore, a risk premium study that is relevant to the utility industry
investor would calculate the differential between current expected utility bond
returns and current expected required market returns on utility stocks. Dr.
Olson’s risk premium method does not attempt to determine “expected” market
returns, but instead concentrate on actual earned market returns. Past realized
market returns, particularly those derived over extremely long time periods, are
not representative of the ,“cost of capital,” or the “cost of equity”. In other words,
“ex post” market returns cannot be regarded ds appropriate measures of current
required returns for either a bond investment or a common equity investment.
HAVE YOU CALCULATED A RISK PREMIUM FOR UTILITY
COMMON STOCK INVESTORS?
Yes I have. While I do not believe that actual earned returns provide a
particularly good measure of investor expected risk premiums, I realize that both
the staff and the Commission have relied on such data in the past to derive risk \
premiums. If the Commission believes that valid risk premiums can be derived
from historical data, then it should rely on data that is more relevant to investor’s
actual experiences in the regulated electric markets. The historical differential
Direct Testimony of Carol Szerszen SOAH Docket No. 473-04-3554; PUC Docket No. 28813
Page 20 of 165
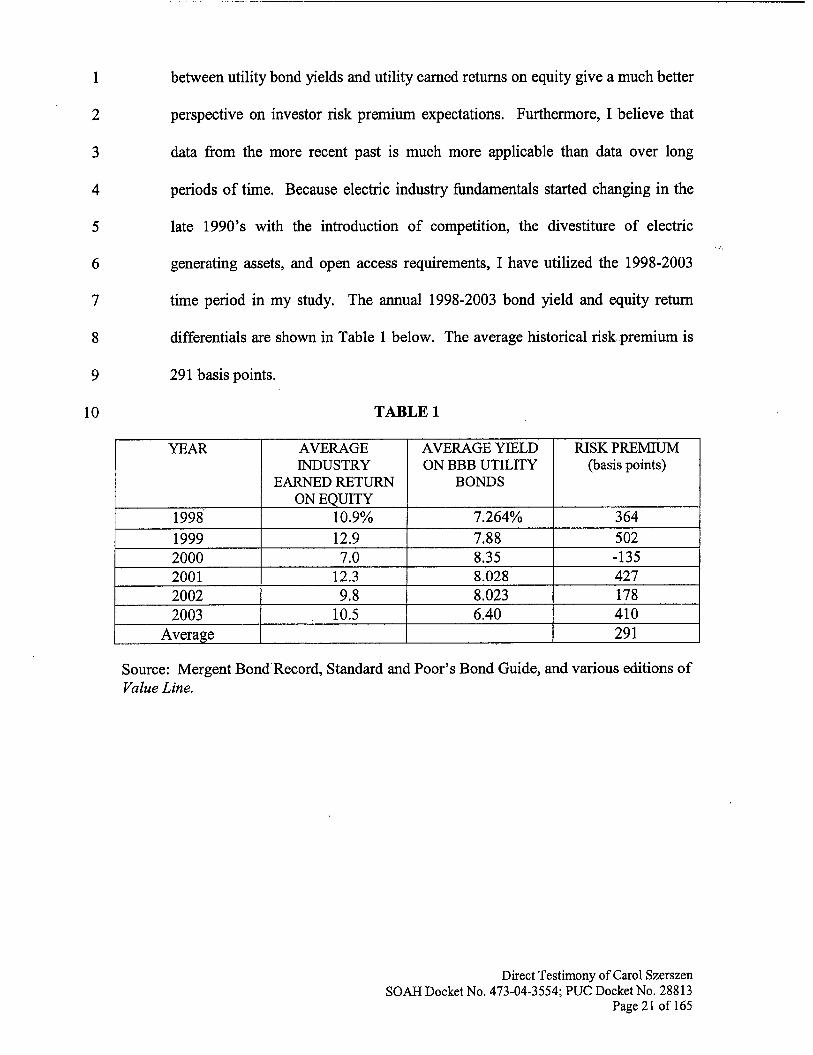
1 between utility bond yields and utility earned returns on equity give a much better
2 perspective on investor risk premium expectations. Furthermore, I believe that
3 data fiom the more recent past is much more applicable than data over long
4 periods of time. Because electric industry fundamentals started changing in the
5
6
late 1990’s with the introduction of competition, the divestiture of electric
generating assets, and open access requirements, I have utilized the 1998-2003
7 time period in my study. The annual 1998-2003 bond yield and equity return
8 differentials are shown in Table 1 below. The average historical risk premium is
9 291 basis points.
10 TABLE 1
Source: Mergent Bond Record, Standard and Poor’s Bond Guide, and various editions of Value Line.
Direct Testimony of Carol Szerszen SOAH Docket No. 473-04-3554; PUC Docket No. 28813
Page 21 of 165
1 Q*
2 A.
3
4
5 Q6
6
7 A.
8
9
10 Q.
1 1
12 A.
13
14
15
16
17
18
19
20
WHAT CAN BE CONCLUDED FROM TABLE l?
Combining the 6.6% average yield.on triple B utility bonds with the 2.9% r,;k
premium provides a 9.5 1% cost of equity.' This result is very consistent with the
8.88% - 9.24% cost of equity I calculated using the DCF method.
WHAT IS YOUR RECOMMENDED COST OF EQUITY FOR CAP
ROCK?
I will recommend a 9.5% cost of equity for Cap Rock. This cost of equity is
derived from my risk premium study, and is 30 - 40 basis points higher than my
cost of equity midpoint estimates using the DCF formula.
IS 9.5% A REASONABLE RETURN ON EQUITY FOR CAP ROCK'S
TRANSMISSION AND DISTRIBUTION OPERATIONS?
Yes. For the past couple of years, capital costs have been very low and several
regulatory bodies have awarded electric and gas utility companies equity returns
in the single digits. This includes the New York Public Service Commission
(Rochester Gas & Electric, 9.96%; St. Lawrence Gas Company, 9.5%; and
Fisher's Island Electric, 9.0%), the New Jersey Board of Public Utilities (Jersey
Central Power & Light, 9.5% and Rockland Electric Company, 9.75%), the
Arkansas Public Service Commission (Arkansas Western Gas Company, 9.9%),
the Wyoming Public Service Commission (Wyoming Lower Valley Electric,
9.21%), and the Connecticut Department of Public Utility Control (Connecticut
' The average yield on triple B utility bonds in June, 2004 was approximately 6.5 1%.
Direct Testimony of Carol Szerszen SOAH Docket No. 473-04-3554; PUC Docket No. 28813
Page 22 of 165
1
2
3
4 Q*
5
6 A.
7
8
9
10
11 Q.
12
13 A.
14
15
16
17
18
19
20 Q.
21
22 A.
23
Light & Power, 9.85%).2 Therefore, a single-digit DCF return is not out of the
range of reasonableness given current capital market conditions.
V. CAPITAL STRUCTURE
WHAT CAPITAL STRUCTURE IS CAP ROCK REQUESTING BE USED
IN SETTING A WEIGHTED COST OF CAPITAL?
Cap Rock is requesting that a 40% equity ratio and a 60% debt ratio be used in
setting a weighted cost of capital. Based on information in RFP Schedule K, the
Company’s unconsolidated actual September 30,2003 capital structure consists of
16.56% common equity and 83.44% debt. The September 2003 consolidated
v,
capital structure consists of 12.11% common equity and 87.89% debt.
WHY IS CAP ROCK REQUESTING A HYPOTHETICAL CAPITAL
STRUCTURE?
Company witness Mr. Atkins states that Cap Rock needs access to the equity
market in order to obtain sufficient capital to pay down its long-term. debt. Mr.
Atkins asserts that in order to raise additional equity, the Company will have to
pay an annual dividend, and the only way to accomplish these goals is to raise
rates. Dr. Olson notes that the “Commission has previously ruled that TDUs in
Texas should have common equity ratios of 40%,” and that lower long-term debt
ratios are necessary to protect bond ratings and maintain financial flexibility.
ARE THESE VALID REASONS FOR THE UTILIZING A
HYPOTHETICAL CAPITAL STRUCTURE?
No.
distribution company to have a 60/40 debt-equity ratio.
First, the Texas Commission does not require any transmission and
Rather, 40% was
* NY PUC Lexis 140,427, and 497; NJ PUC Lexis 248; NJ PUC Lexis 248 and 249; Arkansas PUC Lexis 397; Wyoming PUC Lexis, 128; Connecticut Department of P.U. Control, Docket No. 03-07-02.
Direct Testimony of Carol Szerszen SOAH Docket No. 473-04-3554; PUC Docket No. 28813
Page 23 of 165
1
2
3
4
5
6
7
8
9
10
11
12
13 ’
14
15
16
17
18
19
20
21
22
considered to be the maximum equity ratio that ‘could be incurred by the T&D
companies. The Commission’s findings regarding an appropriate debt-equity
ratio were made as a result of the Texas electric deregulation legislation, which
required IOU’s to legally and structurally separate their generation, transmission
and distribution, and retail assets. The Commission recognized that transmission
and distribution assets incurred less financial and operating risk than the
generation function, and wanted to ensure that the newly separated utility
companies were capitalized in a manner consistent with their risk profiles. For all
practical purposes, a T&D utility company would not be “required” to have a 60%
debt ratio if the company’s risk profile allowed a higher debt ratio, or if the
company’s debt ratio went above 60% for other reasons, such as the acquisition
of another utility.
Second, Dr. Olson and Mr. Atkins seem to ignore the fact that it was Cap
Rock’s decision to convert to an investor owned utility. Furthermore, the primary
reason for the conversion was to allow the Company an opportunity to acquire
additional electric distribution businesses. As noted in the Company’s 2002
presentation to the American Stock Exchange, the changing nature of the electric
utility industry makes it more difficult for small companies to survive. If the
Company converted to an IOU, expansion would be more feasible because access
to public capital markets would be possible. As a cooperative member-owned \
company, Cap Rock had limited expansion flexibility because of its cooperative
s t a t ~ s . ~
Cap Rock Energy’s Response to Staffs Eighteenth Request for Information, SC-190, attached as 3
Attachment C.
Direct Testimony of Carol Szerszen SOAH Docket No. 473-04-3554; PUC Docket No. 28813
Page 24 of 165
1 Q. WHAT IS THE IMPLICATION OF THE COMPANY’S ACQUISITION
2 STRATEGY FOR RATEPAYERS?
A. If the Commission allows Cap Rock to utilize a hypothetical capital structure, the 3
4 Company’s expansion strategy will effectively be funded by ratepayers and not
shareholders. The Company does not need a hypothetical capital structure to
provide reliable or enhanced service to its current ratepayers. The Company’s v r
5
6
projected future capital needs are modest, and can be entirely financed through 7
internal cash flow.4 Rather, a higher equity ratio is a means to enhance future 8
shareholder returns. While the Company’s specific groyth strategy is certainly 9
10 within the realm of managerial discretion, the Company should not expect to
obtain Commission approval for a costly hypothetical capital structure that 11
12 provides no apparent or measurable benefits to ratepayers.
Q. WHAT IS THE REVENUE IMPACT OF THE COMPANY’S REQUEST 13
14 FOR A 60/40 HYPOTHETICAL CAPITAL STRUCTURE?
15
16
A. The revenue impact utilizing the Company’s requested ROE, effective tax rate,
and requested rate base is $4,741,576. This is the difference between the
17 Company’s pre-tax revenue requirement utilizing a hypothetical 60% debt ratio
and the Company’s actual test year 16.56% debt ratio. If my recommended 9.5% 18
cost of equity is used, the revenue impact increases to $5,574,329. 19
Q. WAS THE COMPANY AWARE OF THE FINANCIAL IMPLICATIONS 20
21 OF ITS LOW EQUITY RATIO WHEN THE CONVERSION TO AN
INVESTOR-OWNED UTILITY OCCURRED? 22
See Cap Rock Energy’s Response to Pioneer’s Sixth RFI, No. 6-18, attached as Attachment E. The Company’s CWIP balance is projected to be between $5.2 - $5.5 million in the 2004-2006 time period. The Company’s 2003 10K also states that the Company has no major construction projects planned.
Direct Testimony of Carol Szerszen SOAH Docket No. 473-04-3554; PUC Docket No. 28813
Page 25 of 165
1 A.
2
3
4
5
6
7
8
9
10
11
12
13
14 Q.
15
16 A.
17 Q.
18
19 A.
20
21
22 23 24 25
Yes. The evidence shows that the Company was very much aware of how its
equity ratio would be affected by the conversion. Mr. Atkins testifies that as a
stand-alone entity, Cap Rock started out with approximately $6 million of equity
after the conversion. This equated to a 96:4 long-term debt to equity ratio. This
low rate was brought about by the way cooperatives are traditionally financed,
mainly by debt, and because the Company returned approximately $1 1.7 million
in cash to former members. Additionally, Cap Rock’s retained earnings have
been diminished because the Company paid out $6.7 million of revenue credits to
its member customers. This aggregates to $18.5 million that has been returned to
customers in cash or cash equivalents due to the conversion to an IOU. As
confirmed by Mr. Atkins during his July 30, 2004 deposition, the Company’s
capital structure was a little bit “out of whack” and needed improving because of
the money returned to former co-op member^.^
WHAT WOULD THE ,COMPANY’S TEST YEAR EQUITY RATIO HAVE
BEEN WITHOUT THE CONVERSION?
The Company’s September 30,2003 equity ratio would have been 25%.
ARE THERE OTHER REASONS FOR THE COMPANY’S LOW EQUITY
RATIO?
Yes. During his deposition, Mr. Atkins was asked whether the $27 million of
losses associated with Cap Rock’s failed attempts to acquire new companies over
the past five years had affected the equity ratio.
\
Q. So regardless of how they’re accounted for, if that 27 million and change was available in cash, you don’t think that affected the debt- equity structure?
Deposition of Mr. Lee D. Atkins, at page 158 (July 30,2004), attached as Attachment D.
Direct Testimony of Carol Szerszen SOAH Docket No. 473-04-3554; PUC Docket No. 28813
Page 26 of 165
1 2 3 4 Q*
A. If the 27 million was still available to the company, I’m sure it would help the company.
ARE THERE OTHER FACTORS THAT INHIBIT THE ABILITY OF CAP
ROCK TO SELL NEW COMMON EQUITY? 5
Yes. One of the major problems with Cap Rock’s common stock is that it is 6 A.
‘ 7 thinly traded, and thus very illiquid, and there are no independent analysts . , .
covering the stock. The only entity providing any type of investment analysis is 8
9 J..M. Dutton & Associates. Dutton & Associates is compensated by Cap Rock for
its investment coverage, so this investment advice would not be considered to be 10
arm’s length by the investment community. Mr. Atkins also pointed out in his 11
deposition that the Company did not engage an investment banker during the 12
conversion process, and currently does not have an active investors relation 13
14
15 Q. WERE THESE FACTORS KNOWN TO THE COMPANY WHEN IT
DECIDED TO CONVERT TO AN IOU? 16
Prudent management would have been aware that an illiquid, thinly traded stock 17 A.
with no independent analyst coverage and no active investor relations program 18
would not have been particularly appealing to stock market investors. This 19
situation will not necessarily change if the Company is allowed to utilize a 20
21
22
23
24
hypothetical capital structure in setting rates. Even if Cap Rock should have an
initial public offering of common stock, this won’t fundamentally improve
investor perceptions of the company. Cap Rock will still be a thinly traded,
illiquid stock with little or no investment analyst coverage.
Id at 159.
’ I d at 43.
Direct Testimony of Carol Szerszen SOAH Docket No. 473-04-3554; PUC Docket No. 28813
Page 27 of 165
1 Q*
2
3 A.
4
5
6
7
8
9
10
11 Q.
12
13
14 A.
15
16
17
18
19
20
21
22
23
CAN THE COMPANY INCREASE ITS EQUITY RATIO THROUGH ANY
MEANS OTHER THAN A COMMON STOCK OFFERING?
Yes. As noted by Mr. Atkins, Cap Rock was able to increase its stand-alone
initial conversion equity amount fi-om $6 million to $28.7 million by having
profitable operations as an investor owned utility. This increase occurred over a
period of 21 months. Therefore, it is possible for the Company to rather rapidly
increase its equity ratio by continuing to retain all its earnings in the near future.
In my assessment, this is the only proper method for the Company to increase its
equity ratio, since the necessary funds are obtained from withholding dividend
payments to shareholders, rather than through costly rate increases for ratepayers.
WILL CAP ROCK’S FINANCIAL INTEGRITY BE HARMED OR
DIMINSHED IF AN ACTUAL CAPITAL STRUCTURE IS USED IN
SETTING RATES?
Absolutely not. The Company’s 2004 Business Plan shows that even without a
More significantly, the Company’s cash flow for the year will be
high enough to increase the Company’s year ending cash balance to
This is an increase of mZ0:
it is highly doubtful that the Company needs a
$10 million rate increase. Instead, the Company should use million of the
cash reserves to retire some of its CFC debt obligations. If this were done, the
Company’s equity ratio would increase to about by the end of 2004 or the
Direct Testimony of Carol Szerszen SOAH Docket No. 473-04-3554; PUC Docket No. 28813
Page 28 of 165
1
2
3 Q*
4
5
6 A.
7
8
9
10 Q.
11
12
13
14 A.
15
16
17
18
19
20
21
22
beginning of 2005. This ratio would be somewhat higher depending on the
Company’s after-tax equity earnings for the year.
DOES IT APPEAR THAT CAP ROCK’S 2004 CASH FLOW AND NET
INCOME RESULTS WILL EXCEED THE AMOUNTS PROJECTED IN
THE BUSINESS PLAN?
Yes. As of June 30,2004, the Company had $21,965,000 of cash on hand and a ‘11,
net income after taxes of $3.029 million8 The Company has, at mid-year, already
its new income projection for 2004. The Company is most likely to
its 2004 cash flow projection also.
COMPANY WITNESS MR. ATKINS ASSERTS THAT A HIGHLY
LEVERAGED COMPANY IS AT RISK IF UNEXPECTED EXPENSES
PREVENT IT FROM MAKING ITS DEBT PAYMENTS. DO YOU
AGREE WITH THIS STATEMENT?
A highly leveraged company with ample cash flow would not necessarily be
negatively viewed by investors or the investment community. While investors
utilize a variety of measurements in evaluating the credit worthiness of a
company, cash flow analyses and cash flow interest coverage analyses are the two
primary indicators used to assess credit quality. The reason for this is that the risk
of default is dependent on cash flow levels, and not net income levels. Because of
accounting requirements and various accounting adjustments, a company’s net
income may be minimal, but cash flow may be more than ample to meet all O&M
expenses, interest and principle payment, dividend payments, and taxes.
Cap Rock Energy C o p , SEC 10K, at 3 and 4 (June 30,2004), attached as Attachment I. 8
Direct Testimony of Carol Szerszen SOAH Docket No. 473-04-3554; PUC Docket No. 28813
Page 29 of 165
~~~
1
2
3 Q*
4
5 A.
6
7
8
9
10
11
12
13
14
15 Q.
16
17 A.
18
19
20 Q.
21 A.
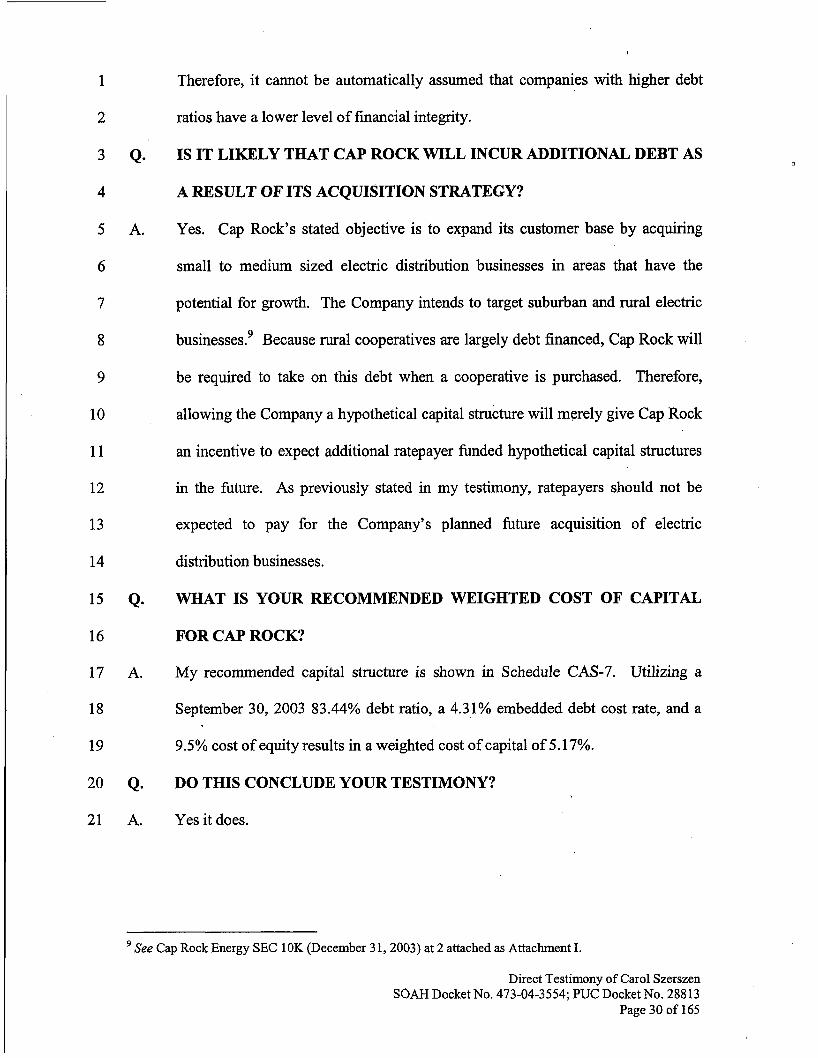
Therefore, it cannot be automatically assumed that companies with higher debt
ratios have a lower level of financial integrity.
IS IT LIKELY THAT CAP ROCK WILL INCUR ADDITIONAL DEBT AS
A RESULT OF ITS ACQUISITION STRATEGY?
Yes. Cap Rock’s stated objective is to expand its customer base by acquiring
small to medium sized electric distribution businesses in areas that have the
potential for growth. The Company intends to target suburban and rural electric
businesses.’ Because rural cooperatives are largely debt financed, Cap Rock will
be required to take on this debt when a cooperative is purchased. Therefore,
allowing the Company a hypothetical capital structure will merely give Cap Rock
an incentive to expect additional ratepayer funded hypothetical capital structures
in the future. As previously stated in my testimony, ratepayers should not be
expected to pay for the Company’s planned fbture acquisition of electric
distribution businesses. ,
WHAT IS YOUR RECOMMENDED WEIGHTED COST OF CAPITAL
FOR CAP ROCK?
My recommended capital structure is shown in Schedule CAS-7. Utilizing a
September 30, 2003 83.44% debt ratio, a 4.31% embedded debt cost rate, and a
9.5% cost of equity results in a weighted cost of capital of 5.17%.
DO THIS CONCLUDE YOUR TESTIMONY?
Yes it does.
\
n
See Cap Rock Energy SEC 10K (December 31,2003) at 2 attached as Attachment I.
Direct Testimony of Carol Szerszen SOAH Docket No. 473-04-3554; PUC Docket No. 28813
Page 30 of 165
APPENDIX CAS4
31

32
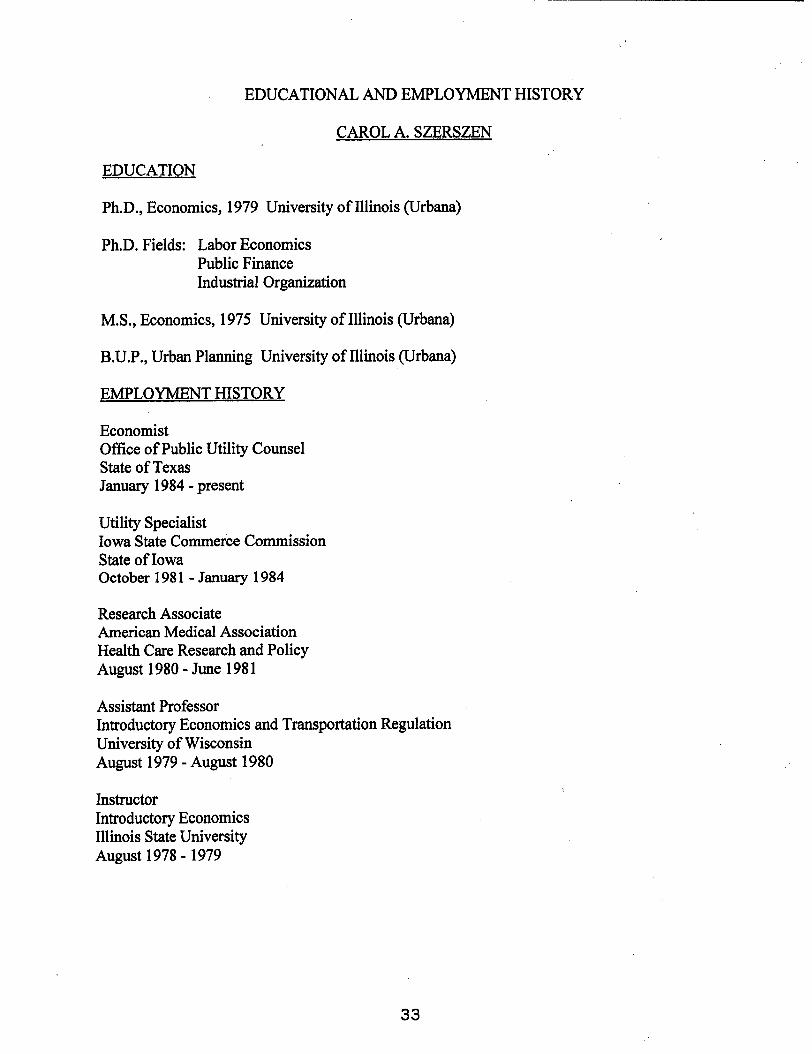
EDUCATIONAL AND EMPLOYMENT HISTORY
CAROL A. SZERSZEN
EDUCATION
Ph.D., Economics, 1979 University of Illinois (Urbana)
Ph.D. Fields: Labor Economics Public Finance Industrial Organization
M.S., Economics, 1975 University of Illinois (Urbana)
B.U.P., Urban Planning University of Illinois (Urbana)
EMPLOYMENT HISTORY
Economist Office of Public Utility Counsel State of Texas January 1984 - present
Utility Specialist Iowa State Commerce Commission State of Iowa October 1981 - January 1984
Research Associate American Medical Association Health Care Research and Policy August 1980 - June 198 1
Assistant Professor Introductory Economics and Transportation Regulation University of Wisconsin August 1979 - August 1980
Instructor Introductory Economics Illinois State University August 1978 - 1979
33
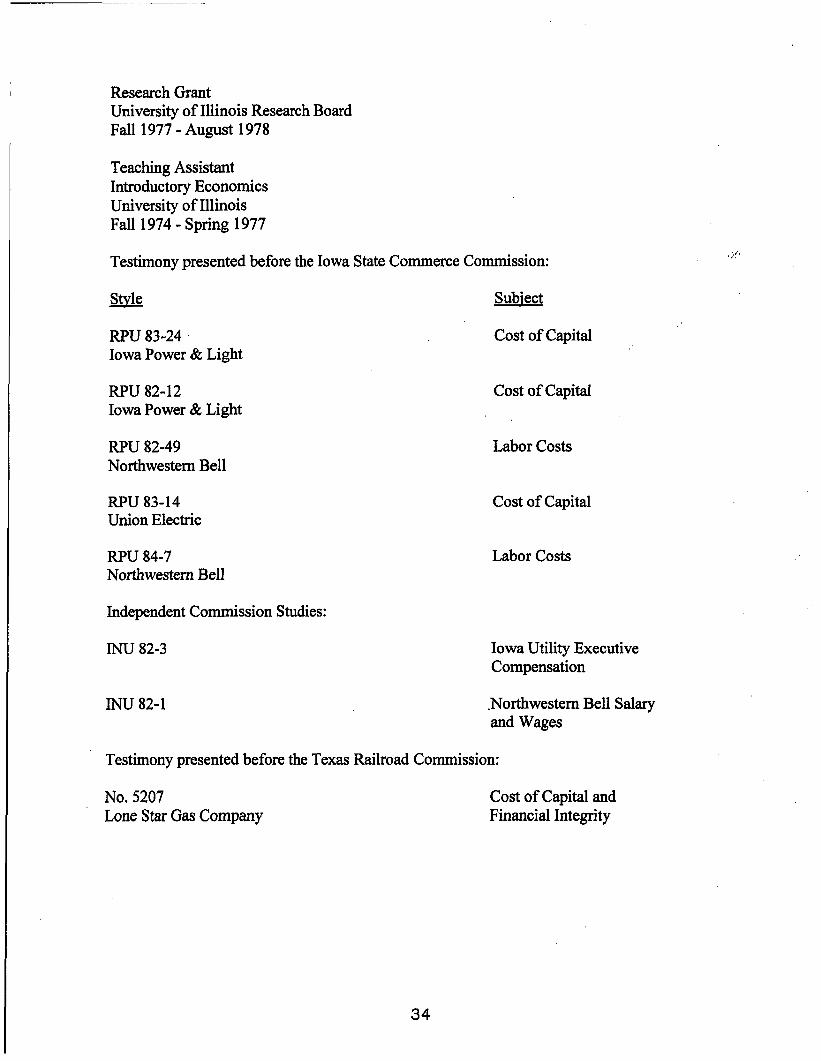
Research Grant University of Illinois Research Board Fall 1977 - August 1978
Teaching Assistant Introductory Economics University of Illinois Fall 1974 - Spring 1977
Testimony presented before the Iowa State Commerce Commission:
Style Subject
RPU 83-24 Iowa Power & Light
RPU 82- 12 Iowa Power & Light
RPU 82-49 Northwestern Bell
RPU 83-14 Union Electric
RPU 84-7 Northwestern Bell
Independent Commission Studies:
INU 82-3
INU 82-1
Cost of Capital
Cost of Capital
Labor Costs
Cost of Capital
Labor Costs
Iowa Utility Executive Compensation
.Northwestern Bell Salary and Wages
Testimony presented before the Texas Railroad Commission:
No. 5207 Lone Star Gas Company
Cost of Capital and Financial Integrity
34
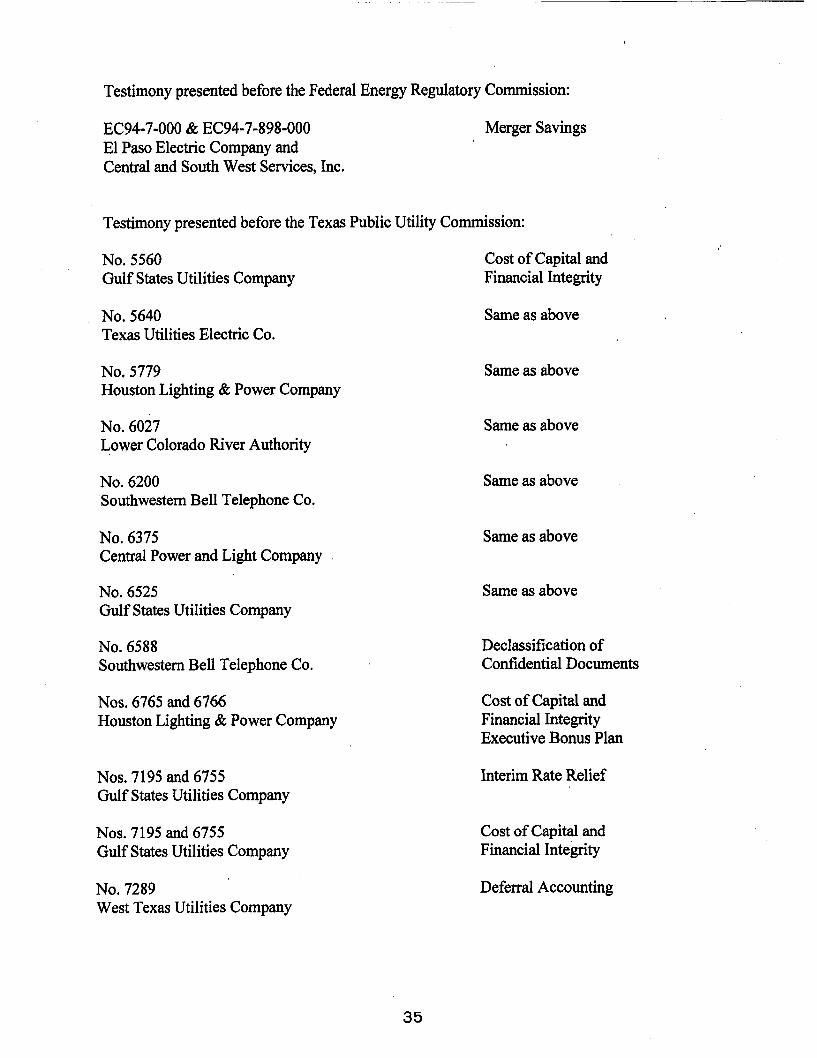
Testimony presented before the Federal Energy Regulatory Commission:
EC94-7-000 & EC94-7-898-000 El Paso Electric Company and Central and South West Services, Inc.
Merger Savings
Testimony presented before the Texas Public Utility Commission:
No. 5560 Gulf States Utilities Company
No. 5640 Texas Utilities Electric Co.
No. 5779 Houston Lighting & Power Company
No. 6027 Lower Colorado River Authority
No. 6200 Southwestern Bell Telephone Co.
No. 6375 Central Power and Light Company ,
No. 6525 Gulf States Utilities Company
No. 6588 Southwestern Bell Telephone Co.
Nos. 6765 and 6766 Houston Lighting & Power Company
Cost of Capital and Financial Integrity
Same as above
Same as above
Same as above
Same as above
Same as above
Same as above
Declassification of Confidential Documents
Cost of Capital and Financial Integrity Executive Bonus Plan
Nos. 7195 and 6755 Gulf States Utilities Company
Interim Rate Relief
Nos. 7195 and 6755 Gulf States Utilities Company
No. 7289 West Texas Utilities Company
Cost of Capital and Financial Integrity
Deferral Accounting
35
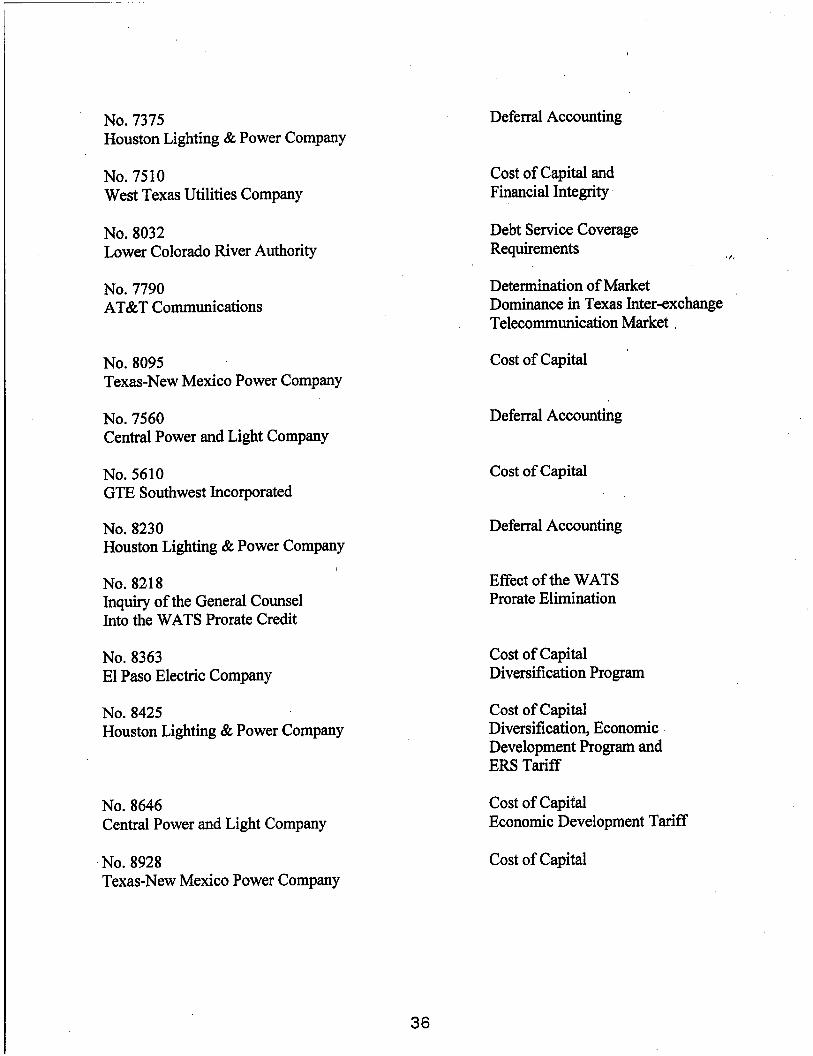
No. 7375 Houston Lighting & Power Company
No. 7510 West Texas Utilities Company
No. 8032 Lower Colorado River Authority
No. 7790 AT&T Communications
No. 8095 Texas-New Mexico Power Company
No. 7560 Central Power and Light Company
No. 5610 GTE Southwest Incorporated
No. 8230 Houston Lighting & Power Company
No. 82.18 Inquiry of the General Counsel Into the WATS Prorate Credit
No. 8363 El Paso Electric Company
No. 8425 Houston Lighting & Power Company
No. 8646 Central Power and Light Company
No. 8928 Texas-New Mexico Power Company
Deferral Accounting
Cost of Capital and Financial Integrity
Debt Service Coverage Requirements e , + ,
Determination of Market Dominance in Texas Inter-exchange Telecommunication Market ,
Cost of Capital
Deferral Accounting
Cost of Capital
Deferral Accounting
Effect of the WATS Prorate Elimination
Cost of Capital Diversification Program
Cost of Capital Diversification, Economic Development Program and ERS Tariff
Cost of Capital Economic Development Tariff
Cost of Capital
36
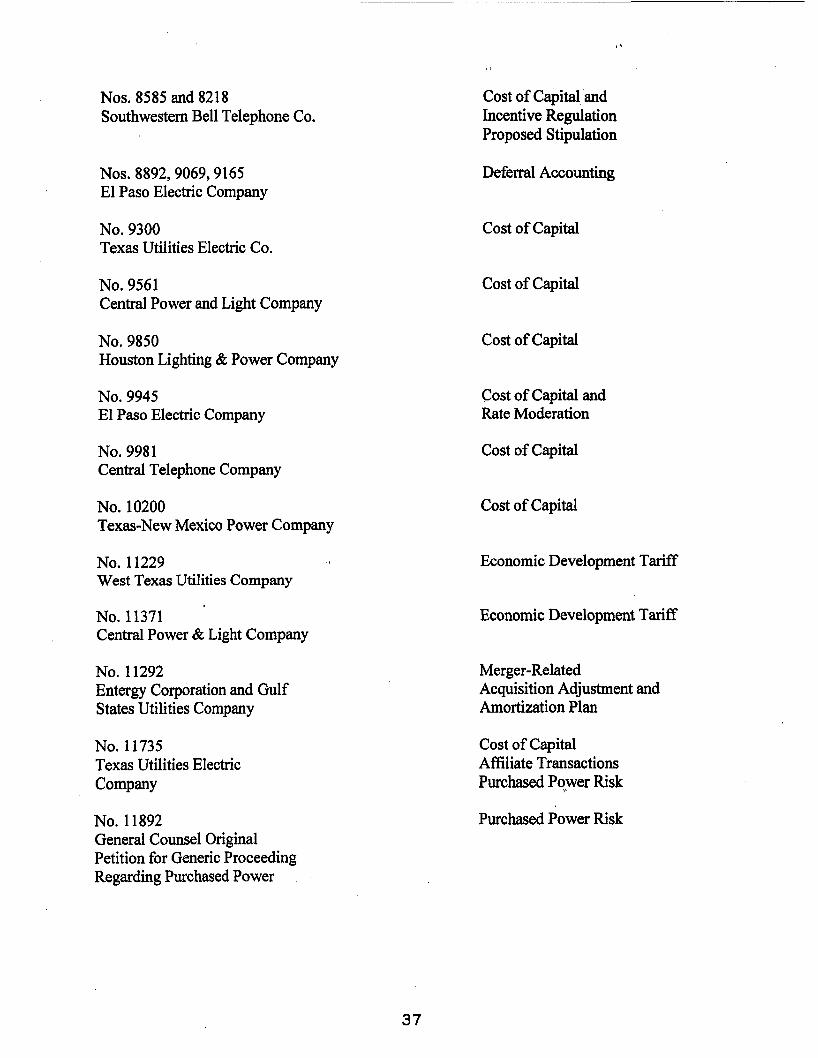
Nos. 8585 and 82 18 Southwestern Bell Telephone Co.
Nos. 8892,9069,9165 El Paso Electric Company
No. 9300 Texas Utilities Electric Co.
No. 9561 Central Power and Light Company
No. 9850 Houston Lighting & Power Compky
No. 9945 El Paso Electric Company
No. 9981 Central Telephone Company
No. 10200 Texas-New Mexico Power Company
No. 11229 4 1
West Texas Utilities Company
No. 11371 Central Power & Light Company
No. 1 1292 Entergy Corporation and Gulf States Utilities Company
No. 11735 Texas Utilities Electric Company
No. 11892 General Counsel Original Petition for Generic Proceeding Regarding Purchased Power
Cost of Capital and Incentive Regulation Proposed Stipulation
Deferral Accounting
Cost of Capital
Cost of Capital
Cost of Capital
Cost of Capital and Rate Moderation
Cost of Capital
Cost of Capital
Economic Development Tariff
Economic Development Tariff
Merger-Related Acquisition Adjustment and Amortization Plan
Cost of Capital Affiliate Transactions Purchased Power Risk
Purchased Power Risk
37
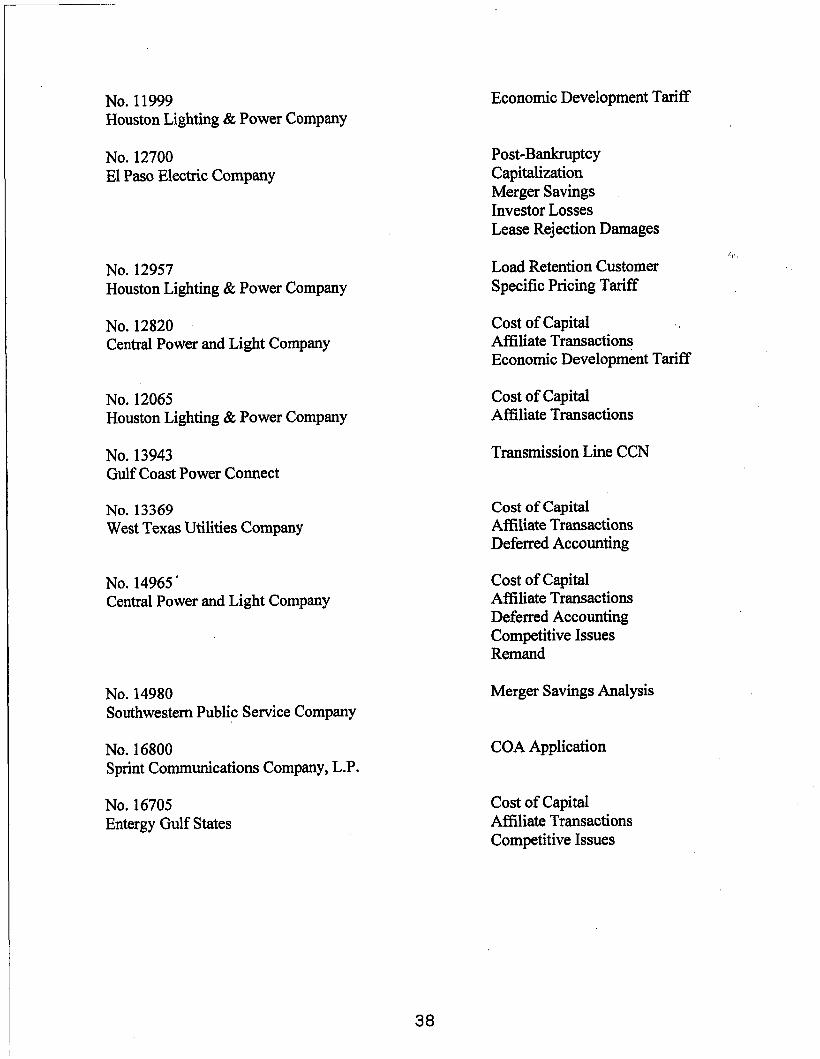
No. 11999 Houston Lighting & Power Company
No. 12700 El Paso Electric Company
No. 12957 Houston Lighting & Power Company
No. 12820 Central Power and Light Company
No. 12065 Houston Lighting & Power Company
No. 13943 Gulf Coast Power Connect
No. 13369 West Texas Utilities Company
No. 14965’ Central Power and Light Company
No. 14980 Southwestern Public Service Company
No. 16800 Sprint Communications Company, L.P.
No. 16705 Entergy Gulf States
Economic Development Tariff
Post-Bankruptcy Capitalization Merger Savings Investor Losses Lease Rejection Damages
Load Retention Customer Specific Pricing Tariff
Cost of Capital Affiliate Transactions Economic Development Tariff
Cost of Capital Affiliate Transactions
Transmission Line CCN
Cost of Capital Affiliate Transactions Deferred Accounting
Cost of Capital Affiliate Transactions Deferred Accounting Competitive Issues Remand
Merger Savings Analysis
COA Application
Cost of Capital Affiliate Transactions Competitive Issues
38
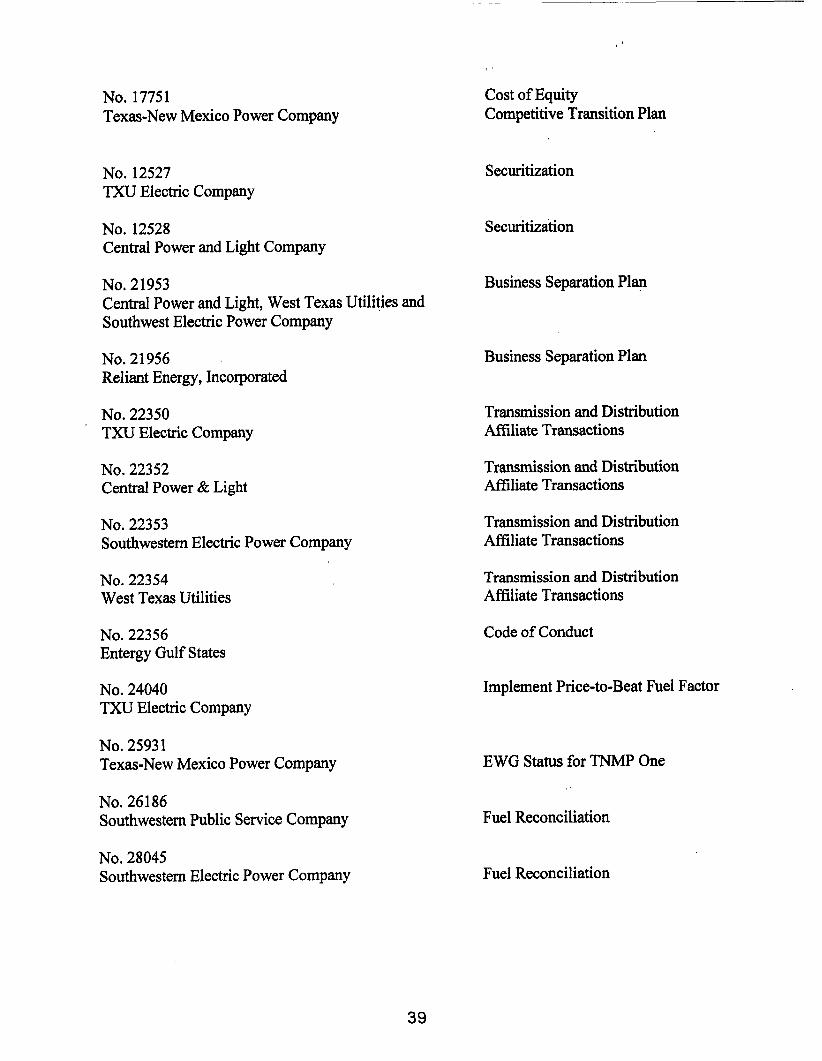
No. 17751 Texas-New Mexico Power Company
No. 12527 TXU Electric Company
No. 12528 Central Power and Light Company
No. 21953 Central Power and Light, West Texas Utilities and Southwest Electric Power Company
No. 21956 Reliant Energy, Incorporated
No. 22350 ' TXU Electric Company
No. 22352 Central Power & Light
No. 22353 Southwestern Electric Power Company
No. 22354 West Texas Utilities
No. 22356 Entergy Gulf States
No. 24040 TXU Electric Company
No. 25931 Texas-New Mexico Power Company
No. 26186 Southwestern Public Service Company
No. 28045 Southwestern Electric Power Company
Cost of Equity Competitive Transition Plan
Securitization
Securitization
Business Separation Plan
Business Separation Plan
Transmission and Distribution Affiliate Transactions
Transmission and Distribution Affiliate Transactions
Transmission and Distribution Affiliate Transactions
Transmission and Distribution Affiliate Transactions
Code of Conduct
Implement Price-to-Beat Fuel Factor
EWG Status for TNMP One
Fuel Reconciliation
Fuel Reconciliation
39
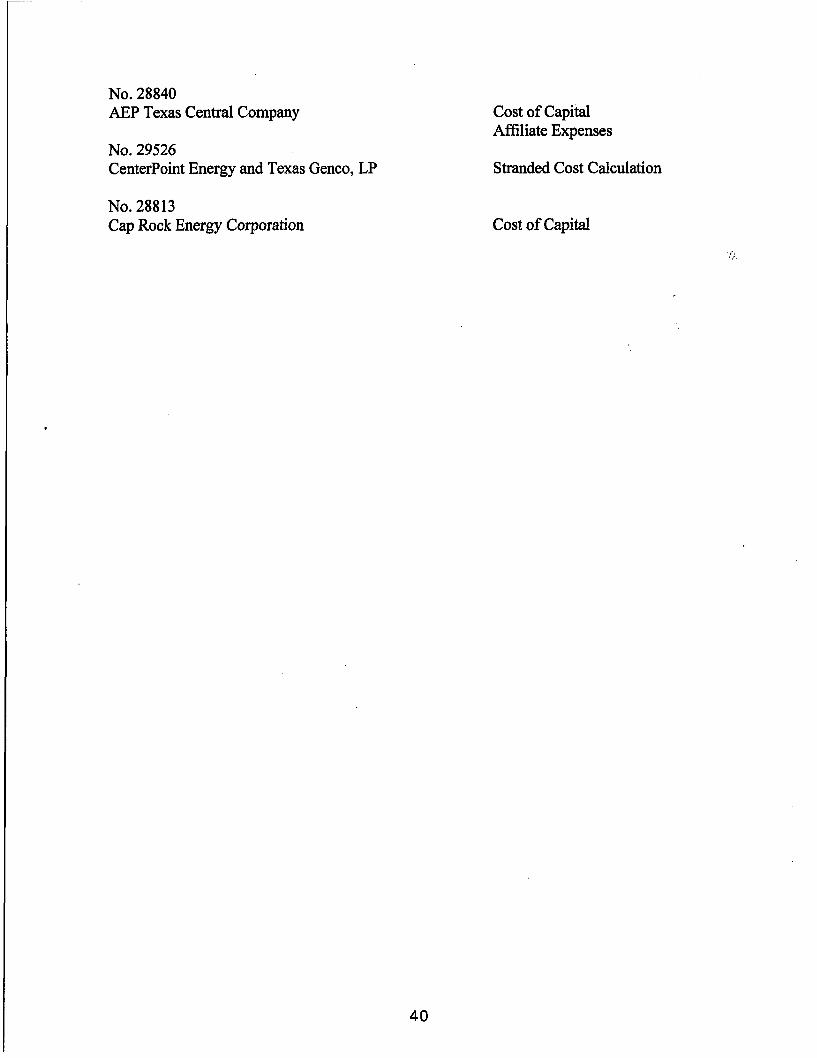
No. 28840 AEP Texas Central Company
No. 29526 Centerpoint Energy and Texas Genco, LP
No. 288 13 Cap Rock Energy Corporation
Cost of Capital Affiliate Expenses
Stranded Cost Calculation
Cost of Capital
40
' I " ,
SCHEDULE CAS-1 Derivation of the Standard DCF Formula
41

42
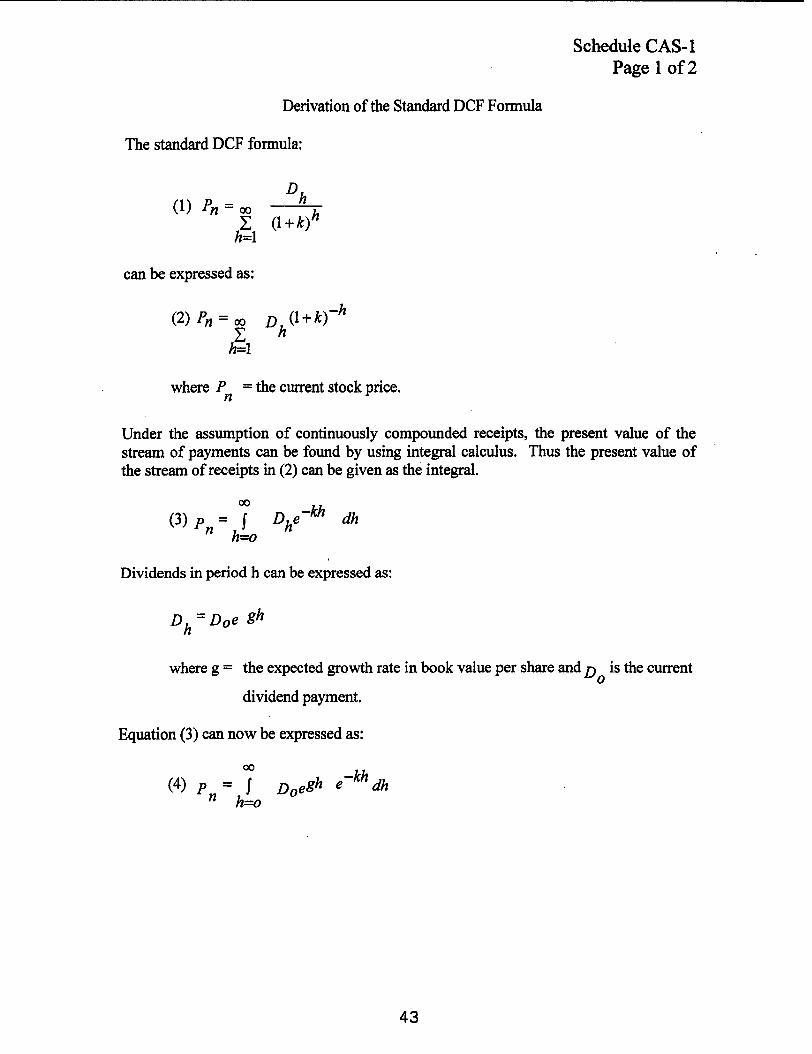
Schedule CAS- 1 Page 1 of2
Derivation of the Standard DCF Formula
The standard DCF formula:
can be expressed as:
where Pn = the current stock price.
Under the assumption of continuously compounded receipts, the present value of the stream of payments can be found by using integral calculus. Thus the present value of the stream of receipts in (2) can be given as the integral.
Dividends in period h can be expressed as:
where g = the expected growth rate in book value per share and D is the current 0
dividend payment.
Equation (3) can now be expressed as:
43

Schedule CAS- 1 Page 2 of 2
Factoring out the constant term D and combining exponents gives us: 0
( 5 ) P, = D gh -kh dh , or
h = o
h = o
Integration of equation (5) yields the integral:
Equation (6) evaluated at h = zero and h = 00 yields:
( 7 ) p , =- Do , or by rearranging terms k - g
(8) k = p + g DO
n
44
SCHEDULE CAS2 Demonstration That Expected Book Value
Growth is Equal to Expected Dividend Growth
45

46
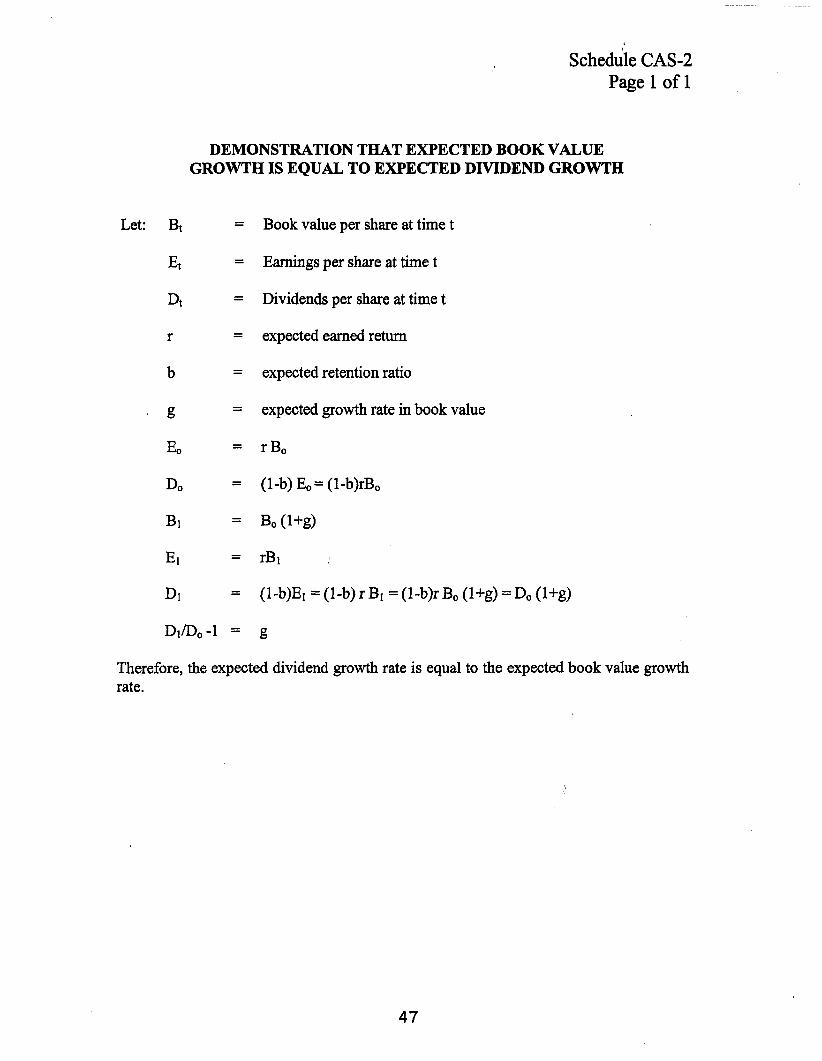
Schedule CAS-2 Page 1 of 1
DEMONSTRATION THAT EXPECTED BOOK VALUE GROWTH IS EQUAL TO EXPECTED DIVIDEND GROWTH
Let: Bt = Book value per share at time t
Et = Earnings per share at time t
Dt = Dividends per share at time t
r = expected earned return
b = expected retention ratio
g = expected growth rate in book value
E O = rBo
DO = (1-b) Eo= (1-b)rBo
D1 = (1 -b)E1 = (1 -b) r B1 = (1 -b)r Bo (1 +g) = Do (l+g)
Therefore, the expected dividend growth rate is equal to the expected book value growth rate.
47

48
SCHEDULE CAS-3 Book Value Growth With
Increasing Earned Returns on Equity
49
Copyright © 2022 FDOKUMEN