10. SimDrug: A Multi-Agent System Tackling the Complexity of Illicit Drug Markets in Australia
23
SimDrug: Exploring the Complexity of Illicit Drug Markets Pascal Perez 1 *, Anne Dray 2 A. Ritter 3 ,P. Dietze 4 , T. Moore 5 , L. Mazerolle 6 1 CIRAD, Montpellier, France,[email protected] 2 Australian National University, Canberra, Australia, [email protected] 3 Australian National University, Canberra, Australia, [email protected] 4 Turning Point Alcohol and Drug Centre , Melbourne, Australia, [email protected] 5 Turning Point Alcohol and Drug Centre , Melbourne, Australia,[email protected] 6 Griffith University, Brisbane, Australia,[email protected] * Correspondence can be directed to this author, as the primary contact. Introduction Complexity of Illicit Drug Use and Markets Ritter (2005), in her comprehensive review of illicit drug markets, provide meaningful examples of their inherent complexity. First, she mentions work from Dorn, Murji, and South (1992) who describe a qualitative research study of drug markets in the UK. They found that the drug markets are constantly fluid and changing. Some of the variables that may drive this diverse and ‘messy’ phenomenon include social background, resources and cultures. The researchers describe people weaving in and out of the trade, with constant interactions with law enforcement resulting in market changes. In the USA, South (2004) describes two case studies of heavy recreational drug users. In this context of small-scale dealers, selling drugs becomes a norm with its inherent rules. The author emphasizes the fact that better understanding the epistemology of these markets challenges existing notions of drug dealers. May and Hough (2004) describe trends in the American drug market over 10- 15 years. They note the change in the market from an open street-based market to a closed market, and associate this with the widespread introduction of mobile phones, coupled with community concern about public space. The authors insist on the dynamical influence of both technology development and law enforcement onto the type of market and its operation. From an economic perspective, Caulkins and Reuter (2005) describe a model where dealers operate under limited rationality, providing one explanation for the fall in heroin and cocaine prices in the US despite increases in law enforcement intensity. They draw an important distinction between the initial decision to sell drugs, and the decision to continue selling drugs. Using prospect theory, they demonstrate the differences in risks and benefits. From a criminology perspective, Mazerolle et al (2004)use cluster analytic techniques to identify types of drug-dealing places. The six different types were characterized by environmental features such as police calls for
Transcript of 10. SimDrug: A Multi-Agent System Tackling the Complexity of Illicit Drug Markets in Australia

SimDrug: Exploring the Complexity of Illicit Drug Markets
Pascal Perez1*, Anne Dray2 A. Ritter3,P. Dietze4, T. Moore5, L.
Mazerolle6 1 CIRAD, Montpellier, France,[email protected]
2 Australian National University, Canberra, Australia, [email protected]
3 Australian National University, Canberra, Australia, [email protected] 4 Turning Point Alcohol and Drug Centre , Melbourne, Australia,
[email protected] 5 Turning Point Alcohol and Drug Centre , Melbourne,
Australia,[email protected] 6 Griffith University, Brisbane, Australia,[email protected]
*Correspondence can be directed to this author, as the primary contact.
Introduction
Complexity of Illicit Drug Use and Markets Ritter (2005), in her comprehensive review of illicit drug markets, provide meaningful examples of their inherent complexity. First, she mentions work from Dorn, Murji, and South (1992) who describe a qualitative research study of drug markets in the UK. They found that the drug markets are constantly fluid and changing. Some of the variables that may drive this diverse and ‘messy’ phenomenon include social background, resources and cultures. The researchers describe people weaving in and out of the trade, with constant interactions with law enforcement resulting in market changes. In the USA, South (2004) describes two case studies of heavy recreational drug users. In this context of small-scale dealers, selling drugs becomes a norm with its inherent rules. The author emphasizes the fact that better understanding the epistemology of these markets challenges existing notions of drug dealers. May and Hough (2004) describe trends in the American drug market over 10-15 years. They note the change in the market from an open street-based market to a closed market, and associate this with the widespread introduction of mobile phones, coupled with community concern about public space. The authors insist on the dynamical influence of both technology development and law enforcement onto the type of market and its operation.
From an economic perspective, Caulkins and Reuter (2005) describe a model where dealers operate under limited rationality, providing one explanation for the fall in heroin and cocaine prices in the US despite increases in law enforcement intensity. They draw an important distinction between the initial decision to sell drugs, and the decision to continue selling drugs. Using prospect theory, they demonstrate the differences in risks and benefits. From a criminology perspective, Mazerolle et al (2004)use cluster analytic techniques to identify types of drug-dealing places. The six different types were characterized by environmental features such as police calls for

service, degree of commercial or residential activity, length of the street block, civil activity and civil disorder.
The main sources of information in relation to the structure of the heroin market(s) in Australia come from law enforcement reports that describe the high-levels of the market (importers and wholesalers), from ethnographic research that has largely focused on the retail levels of the market and from routine epidemiological monitoring, such as the Illicit Drug Reporting Scheme (IDRS). Up until the mid-late 1990’s the transnational criminal organisations involved in drug smuggling to Australia had been seen as large international syndicates, with established infrastructure within Australia(ACPR, 2003). It is now clearer that this is no longer the case. The current predominate model is “transactional crime”. The drug trafficking is done by groups of relatively independent criminals who come together for specific transactions (but are not part of the one organization). ACPR (2003) describe the current operations as fluid syndicates, with members that come and go, “constantly forming, disbanding and reforming in response to the nature of the crime that they are committing” (page 4).
Ethnographic research is particularly valuable in understanding local drug markets. Maher (1996) reports findings in relation to the nature of the sample of users, the emergence of street-based injecting culture and the apparent ‘resilience’ of the local drug market to law enforcement pressures. The author describes the street level market uncharacterized by freelance operations, with the heroin distributed by individuals or in units of small entrepreneurs, mostly user-dealers. Participation in the market by a user is “easy to accomplish but often short-lived and sporadic” (Maher, 1996).
Complexity of illicit drug markets mirrors the complexity of illicit drug use itself. Unger and colleagues (2004) clearly summarize the challenges we face when trying to understand, describe, and eventually simulate users’ behavior: “Drug use is a result of a complex, dynamic interplay of posited risk and protective factors that operate at multiple levels of analysis. At the individual level, biological predispositions, personality traits, and cognitive mechanisms can increase or decrease the likelihood that adolescents will experiment with drugs, as well as the likelihood that they will become physically or psychologically dependent on drugs. At the interpersonal level, social influences from peers, family members, and other role models or networks can influence individuals’ perceptions of the social norms surrounding drug use, which then can influence their own use of drugs” (Unger et al., 2004). According to Rhodes(2002), a harm reduction praxis founded on a risk environment framework encompasses social contexts that influence health and vulnerability in general as well as drug-related harms in particular. This inevitably leads to a consideration of non-drug and non-health specific factors in harm reduction, and in turn, points to the importance of what might be described as ‘non health oriented interventions’ in harm reduction.
The Australian heroin drought In Australia, the advent of what is known as the heroin ‘drought’ provides a paramount example of the complex interactions at stake and the conflicting analysis drawn by experts coming from different disciplines. According to Dietze and colleagues (Dietze et al.,2003), the supply of heroin in Victoria suffered a dramatic decline between late 2000 and early 2001, after a strong increase in heroin use and

related harms in the late 1990s. This change in heroin supply was clearly reflected in reports of evolution of heroin overdoses. Relying on different sources of information, the authors argue that the drought was shadowed by a dramatic increase in amphetamine, benzodiazepine, and prescribed opioid use, resulting in a fairly constant number of injecting drug users in Victoria.
What happened in Australia from late 2000 was unique to that country. Despite a worldwide growth in the availability of stimulants – notably methamphetamine – no other country experienced a comparable shortage of heroin, or the extensive use of stimulants as an alternative to heroin. The Australian heroin drought is held up by the Australian Government as an example of law enforcement having a significant impact on the supply of drugs. As a matter of fact, the Australian Federal Police had seized 606 kg of heroin and dismantled a major drug trafficking syndicate, few months before the drought. But Bush and colleagues (Bush et al.,2004) argue that this explanation does not stand up to more detailed scrutiny as other factors were more influential. According to the authors, the most plausible explanation for both the heroin drought and the increase in the availability of stimulants is the strategic decisions and actions of the crime syndicates that supply the Australian market. Interestingly, Agar and Reisinger(2002) develop an equivalent rationale about the heroin drought that occurred in the USA during the mid-1970s. They counter-balance the impact of the “FrenchConnection” breaking up with the raise of Methadone-based replacement programs. The authors insist on the complex adaptive properties of the illicit drug use issues.
In order to have a dispassionate look at the question, one must first gather information coming from law enforcement, intelligence, treatment, and harm reduction sources. Then, this heterogeneous information must be critically analyzed before being used to confront and explore the different plausible scenarios. In a broader context of substance misuse, Fuqua and colleagues (2004) rightfully claim that the whole process needs a transdisciplinary approach to describe such complex systems from more than one vantage point. This claim is particularly relevant in the case of illicit drug use.
Hence, it is not surprising that complexity theory has attracted an increasing number of scientists working in the domain of population health and epidemiology. For example, August and colleagues(2004) describe the complexity of prevention program implementation. The authors outline the challenges faced by developers of prevention programs in transporting scientifically proven or evidence-based programs (efficacy) into natural community practice systems (effectiveness). The intricacy of multiple interactions between individuals, the various time lines linked to different aspects of harm reduction, and contrasted social rationalities observed among field practitioners (prevention, law enforcement, harm reduction) contribute to the creation of a complex and unpredictable systems.
Complexity Theory and Illicit Drug Use In the broad context of health geography, Gatrell (2005) considers the primary characteristics of Complexity Theory, with particular emphasis given to networks, non-linearity, and emergence. The author acknowledges its capacity to move away from reductionist accounts and to propose new perspectives on sociality and connectedness. Research on health inequalities, spatial diffusion, and resurgent infections, have much to learn from Complexity Theory provided that modeling
results are inferred from “good empirical work”. Gatrell rightfully underlines the fact that:
“Metaphorsand some of the methods used in complexity theory are essentially visual. Despite the disappearance of the graphical […] from much of the research literature, the ‘seeing eye’ and the ability to detect and describe patternremains at the forefront of many research methods, including health geography” (Gatrell, 2005).
Agar and Reisinger (2003) have developed over the years an empirical theory of illicit drug epidemic, called ‘TrendTheory’. They first look for a rapid increase in incidence. The assumption is that this rapidly increasing curve is an emergent property of systems that are themselves undergoing rapid change. Thus, they look at relevant segments of a society (clusters) where major ongoing changes may be linked to the drug. They also assume that changes are underway in the system of production for the illicit drug. Finally, they assume that change is also ongoing in the networks that link the production system with the population. Trends are dynamic and must be understood over time as they develop. Agar and Reisinger admit that:
“The most difficult part of trend theory work is that each ‘data point’, if you will, represents a complicated research effort. A massive amount of different material must be gathered, where most of it does not directly ask or answer the questions that we have. […] With any luck, the effort to build a trend theory will help in some way as the drug field continues to struggle with that key epidemiological question: why these people in this place at that time?” (Agar and Reisinger, 2003)
In a previous paper, the same authors recognize that complexity underlies Trend Theory (Agar and Reisinger, 2002). As a matter of fact, complex adaptive systems as consisting of different actors indifferent sub-systems, all in continual change over time as they evolve with their environment. Complexity theory also indicates that measures of the system as a whole – like epidemiological indicators of heroin addiction – are often emergent processes. Agar and Reisinger believe that explanation of a phenomenon of interest is not available in the location where that phenomenon takes place. Instead, events – most of them at remote social locations – unfold and interact over time, and the local phenomenon is only one of a number of factors involved. An explanation of a trend calls for a model of how that system works. A heroin trend increases when distant systems, by both chance and design, enter into interlocking feedback loops.
Epidemiologists have pioneered the use of Complexity Theory in Population Health. Outbreaks have been simulated through percolation processes into artificial networks or by means of emerging properties of artificial societies composed of interacting agents. For example, recent work form Meyers and colleagues (2005) demonstrates how contact network epidemiology better explain the heterogeneity of SARS outbreaks worldwide, compared with traditional compartmental modeling. Likewise, Valente and colleagues (2004) use network level measures (centralization, density, transitivity) to explore the impact of social networks onto drug use among adolescents. In this case, network analysis provides a technique to map specifically who has adopted evidence-based programs and where they are in the network. Hence, the network map provides important monitoring information indicating how well the practice is spreading.
Agar and Wilson(2002) provide a compelling example of Multi-Agent Based Simulation in a context of youthful heroin experimenters in the Baltimore metropolitan area. The model is used to explore the impact of circulating stories of

drug reputation on individual attitudes towards the drug. Based on ethnographic work, the model demonstrates a dampening effect of increased social connections, contrary to epidemiologic expectations. As described by the authors:
“To summarize, […] five hundred agents begin with normal, randomly distributed risk and a shared attitude set to some number with a parameter. The agents move around and, if they encounter heroin, they compare attitude to risk. If attitude is higher than T-risk, they try the heroin. And, if they try it, they have good or bad experiences, with some probability, and those experiences, should they occur, change their attitude by some amount. Agents also change their attitude, depending on the “buzz” around the drug that they pick up as they move around the world. After a tick of the model, any adjacent agent might influence their attitude. The chances they do so, and the amount of the influence, will depend on the combined effect of both agents’ experiences. Chances and amount also depend on whether the two agents are strangers or friends” (Agar and Wilson,2002).
Mason and colleagues (2004) describe as lightly different approach to describe environmental impact on urban youth drug use. The approach incorporates individual, social, and geographical parameters to systematically understand the ecology of risk and protection for urban youth. Geographic Information Systems (GIS) derive spatial relation ship sand analyses between the specific locations where the teenagers are active, their subjective ratings of these locations, and objective environmental risk data. These social network and GIS data are merged to form a detailed description and analysis of the social ecology of urban adolescent substance use.
Even Chou and colleagues (2004), despite a strong empathy for statistical methods – a shared language between experts involved in drug use trans-disciplinary research – recognize that:
“While the statistical models discussed later are based on assumptions of linear associations, nonlinear association can also be handled by some of these models. It should be noted that to understand and appreciate the dimensions of the process or phenomenon being studied, data-driven selection of either a linear model or a nonlinear model is critical. Using linear tools to study non-linear processes can yield misleading conclusions that impact the planning, implementation, and assessment of intervention programs” (Chou et al., 2004).
Finally, Agar (2005) building on his previous work, recently argues for ‘emic’ models, models grounded in what matters in the world of those being modeled. But most models are ‘etic’, in the sense that they are built on an outsider's view of the people and the world being modeled. In a pure positivist stand, etic models represent how the modeler thinks the world works; emic, how people who live in such worlds think things are. In a very inductive and post-normal move, Agar equips his artificial agents with rules of decisions coming from individual responses to ethnographic surveys. By doing so, he tries to explore and better understand the reasons for an early experimenter to become an addict, based on socialties. The author recognizes that despite his commitment, some etic-based knowledge pervaded his model but he emphasizes the importance of a strong empirical experience to back up such complex modeling. This is the only current example of post-normal modeling in the domain of population health, unlike environmental studies where participatory modeling experiences are rapidly developing (Bousquet et al., 2003).

SIMDRUG – Model Description
Background As part of the Drug Policy ModellingProject (DPMP), our team was contracted to address a demand for new integrative approaches to support decision-makers and practitioners in implementing illicit drug policies. Our specific task was to present advantages and limitations of using a Complexity-based approach for modelling illicit drug use and markets. Two key issues shaped the boundaries and content of the present project:
•Finding a case study that would contain –a priori – as much complexity as possible and would provide the information needed to build a consistent model.
•Fitting into the actual structure of theDPMP project in order to interact efficiently with relevant experts and to avoid undesirable overlapping with other on-going research.
Advocating for a Multi-Agents Systems Considering the three main scientific streams shaping complexity science, our team had to choose between NetworkTheory and Multi-Agent System for our initial approach, Dynamical Systems being already used by the other DPMP teams. Looking at the Australian illicit drug markets through a cross-scale approach, it seemed that urban districts constituting a ‘drug scene’ involved most of the actors (with exception of importing syndicates and production cartels) while displaying a maximal complexity. As a matter of fact, this intermediate scale fits in between statistical accounts at the State or National levels, and ethnographic accounts of street-based interpersonal interactions and individual motivations. Social heterogeneity, spatial mobility, and abrupt changes characterize drug scenes. Global patterns and trends emerge from multiple interactions both distant and local.
Rapidly, the ‘Melbournehero in scene’ was perceived as the best option because of the following features:
•A well documented history of heroin use in Melbourne CBD and surrounding suburbs (hot spots) showing the cultural dimension of the local heroin scene.
•A trans-disciplinary team (sociology, epidemiology, and economics) already working on the case study and having developed a comprehensive database.
•A legitimate questioning of local authorities on balancing between law enforcement and harm reduction programs.
•A retrospective view upon the conflicting explanations that arose after the so-called ‘heroin drought’.
As far as most of the potential agents in the system were clearly identified but various aspects of their interdependent links were ill-defined, we decided to opt for a Multi-Agent System approach rather than a Network Theory one. Beside, the trans-disciplinary communication needed advocated for rather intuitive approach of modeling. The ‘buildingblocks’ methodology attached to Multi-Agent Systems, and the visual paradigms(UML design) used to describe the modeling components, appeared to be highly relevant. The trans-disciplinary expert panel involved experts

coming from ABM design and modeling, sociology, epidemiology, economics and criminology.
Model Description The model is created with the Cormas©platform (Bousquet et al., 1998), developed from the VisualWorks© commercial software. Cormas© provides a SmallTalk©-based environment to the developer where spatial visualization, graphic results, and sensitivity analysis tools are already encapsulated. Hence, the modeler can concentrate on the development of the application only, without bothering with peripheral but time consuming tasks.
Time scale
We have decided to work on a daily basis, meaning that one modeling time step is equivalent to a 24h-day in reality. A first compromise among the group of experts was established around a fortnightly structure, but later developments showed that injecting behaviors needed more accurate time steps. Each simulation is run over a 5-year period. As a matter of fact, even if the ‘heroin drought’ period is our main target, we assume that different processes (with different response times) were at stake. Thus we take 1998-2002 as a period of reference. In terms of validation, this time bracket gives us the opportunity to test the robustness of the model by comparing a series of micro (agent level) and macro (system level) indicators with corresponding observed data. The model must be able to consistently reproduce pre-drought, crisis, and post-drought dynamics of the system.
Spatial environment
We have decided to work on an archetypal representation of Melbourne’s CBD based on a regular 50*50 square mesh. The size of the grid has been chosen accordingly to the number of users (3000) and dealers (150) to be modeled and located in the environment. At this stage, there is no need to work on a real GIS-based representation since we mainly focus on social behaviors and interactions. Each cell - elementary spatial unit - corresponds to a street block. A suburb is defined as an aggregation of neighboring cells. Five suburbs are created with different sizes and shapes, regardless of realistic features. In fact, the environmental mesh is a Cellular Automata able to process a large amount of information at the level of each cell. Two special cells represent the Police Station and the Treatment Center.
Street Block
The main characteristics (or attributes) of a street block are: the number of overdoses, fatal overdoses and crimes locally recorded. Each street block has also a wealth value, interpreted as a synthetic parameter indicating the social and material capital of the place. Initial values of wealth are randomly attributed and range between $100 and $500. Each time a crime is committed in a street block, its wealth value decreases by 5%.Conversely, after a 10-day period without crime, the wealth value increases by3%. Wealth values are limited to a maximal value of $500. The initial wealth values come from ethnographic surveys of arrested offenders and correspond to the average money they can get from receivers. The increase and decrease rates are not calibrated yet. The concept of risk environment is encapsulated into the risk attribute. An empirical linear equation is used to calculate risk values at each time step:
risk = (10 * nb of crimes) + (10 * nb ofoverdoses) + nb of users on the street block

Risk values are used to calculate social dissatisfaction at the level of the suburb (see below), and to calculate the conductivity of a given street block to drug dealing. The following rules apply:
•One street block becomes conducive (i) if there is a dealer or (ii) if risk > 20 or(iii) if there are at least 4 conducive street blocks around.
•One street block becomes non-conducive if there is no dealer and (i) if the risk = 0 or(ii) if there is at least 4 non-conducive street blocks around.
Suburb
Each suburb is able to calculate an average risk over its belonging street blocks. This overall risk is interpreted as a measurement of the social dissatisfaction of the local residents. When the corresponding value reaches a score of 5 or above the police station needs to intervene (see below).
Police Station
There is only one Police Station for the whole system. Constables without identified mission return to the Police Station. Likewise, arrested users, dealers, and wholesalers are transferred to the Police Station before being retrieved from the system. At each time step, the Police Station sends constables to suburbs with suburbProtest values higher than 5.
Treatment Center
For this initial prototype model, we created only one Treatment Center that receives users who decide to undergo a treatment a program. The overall capacity of the Center corresponds to 1000 patients. Three programs are available, differentiated by their duration and estimated success rates. Detoxification and Therapuetic Community programs are residential while users on Methadone Maintenance are still on the street and can still inject heroin.
Social entities
SimDrug includes different types of social agents: users, dealers, wholesalers, constables, and outreach workers. Obviously, these computer entities do not accurately mimic individual behaviors of their real life counterparts. In fact, each type represents a minimum set of characteristics and dynamics that allows the whole artificial population to display most of the properties observed in real societies. The trans-disciplinary work plays a paramount role in defining a consensual set of simplified rules for the corresponding agent to ‘behave’ realistically.
Another issue deals with the creation of a closed or open system. In a closed system, the initial set of agents remains in the system during the whole simulation, with the exception of individual shaving to die in the meantime. The only way to increase the population is to implement reproduction mechanisms at the level of the agents. This is a widely used solution among agent-based modelers as it helps keeping system dynamics partly under control. An open system allows the entry into and exit from the system of a given number of agents at any point in time. It becomes much more complicated to track back any single individual trajectory, but these systems suit much better bar-like problems (bar attendance, airport lounge flows, market place encounters).
We chose to implement an open system that sustains a constant number of users, dealers, and wholesalers (constables and outreach workers remain the same). At each

time step, for a given number of users who die from overdose, or escape addiction through treatment, or finish in jail, the equivalent number of new users will be created at the next time step. Likewise, a given number of arrested dealers or wholesalers will be automatically replaced. This strong assumption is based on the fact that no evidence supports the eventual change of users’ or dealers’ population sizes in Melbourne, beyond limited fluctuations.
User
Estimations for Melbourne give a range of 30,000 to 35,000 drug users considered as regular addicts (Dietze et al., 2003). In order to keep computing time into reasonable limits, we have decided to create a 1/10th model of the reality: 3 000 users are created in SimDrug. They are randomly located on the grid at the beginning of the simulation.
Welfare payments provide a $200 fortnightly regular income to the users. This amount represents between 50% and 80% of real payments and takes into account withdrawal for other primary needs. Individual cash is increased with the profit made from crimes (burglary, shoplifting) or drug dealing.
The model does not include user agents changing their individual trajectory (or risk of developing greater dependency). Individual drugNeed is a constant value that indicates the agent’s degree of addiction. We opted for the creation of three initial cohorts of users, based on ethnographic survey and clinical research:
•Light addiction: 0.02 g/day for 30% of users, equivalent to 1 fix/day
•Moderate addiction: 0.04-0.06 g/day for 54% of users, equivalent to 2-3fix/day
•Severe addiction: 0.08 or 0.1 g/day for16% of users, equivalent to 4-5 fix/day
At this stage, a user can buy and use only one type of drug at a time from his/her dealer. Each user is affiliated to one dealer’s location and goes to the same hot spot as long as the dealer is selling drugs. As soon as the dealer disappears, all the affiliated users have to find another provider by walking around or contacting friends. Information regarding the drug bought is stored into the attribute myDrug. In this prototype, we consider a street market with only two drugs available: “heroin” and “other” (being a generic term for amphetamines, cocaine, etc…).
A user will have a 0.5% chance to declare an overdose when injecting heroin if one of the following conditions is fulfilled: (i) the previous drug injected was not heroin, increasing the risk of overdose, or (ii) variation in quantity from previous injection > 0.02 g, or (iii) variation in purity from previous injection > 15%, or (iv) exiting from an unsuccessful treatment period. A user declaring an overdose has a 90% chance to be rescued if there is another user around to call for an ambulance. The two chance parameters are partially calibrated against global figures of fatal and non-fatal overdoses in Melbourne during the pre-drought period (reference year: 1999).
The attitude of users towards treatment programs is summarized within the attribute called readinessForTreatment. The initial individual values are randomly picked between 10 and 50. A decrementing process – borrowed from literature on diffusion of innovation – slowly raises the motivation of the user each time he is targeted by an Outreach Worker(decrement: -1) or each time he is witnessing or experiencing an overdose(decrement: -1). The value of the attribute is reset at 20 each time a user comes out from an unsuccessful treatment period. The initial range of values is partially calibrated against the observed average chance for a real user to enter a treatment program over a one-year period. When the value of readinessForTreatment

has reached zero, the corresponding user has 20% chance to enter a Detox program, 10% to enter a TC program, and 70% to enter aMethadone program. The actual implementation depends on the TreatmentCenter’s capacity to undertake the treatment. Detox and TC are residential treatments while Methadone program sallow the user to continue to interact with others in the system. In the latter case, a user has a 7% chance at each time step to consume illicit drugs as well. This percentage is coming from clinical research (2 days /month).
Dealer
The real number of dealers in Melbourneis a very well kept secret. Hence, the expert panel decided to adapt estimated figures coming from the USA where population ratio between users and dealers range from 1/10 to 1/30. We decided for a 1/20 ratio, which partly corroborates corresponding ratios coming from Australian Higher and Magistrate’s Courts. Thus, 150 dealers are initially created. At this stage, dealers can buy only one type of drug at a time from their wholesaler and then sell it to users. Initial cash amounts range randomly from $5,000 to $10,000. The question of the different mark-ups between wholesaler, dealer, user-dealer, and user has embarrassed the expert panel for a while. Drawing from heterogeneous data and information, we have agreed on the following:
•Wholesaler’s mark-up: x6.0
•Dealer’s mark-up with user: x2.0
•Dealer’s mark-up with user-dealer: x 1.3
•User-Dealer’s mark-up with user: x 2.0
Initially dealers are assumed to deal on the street market only. But they are able to assess the risk created by the presence of constables in their surroundings. As a consequence, they can choose to freeze temporarily their activities (readyToSell: no) or eventually to change their dealType from street market to hidden sale, according to a 20% probability. This chance parameter has not been calibrated yet.
Wholesaler
Reliable figures from Australian Higher and Magistrate’s Courts indicate a ratio of 1/48 between defendants considered as wholesalers or importers, and small dealers. We decided to apply a very conservative ratio of 1/15 in SimDrug in order to take into account the eventual under-representation of ‘big fish’ in the Court’s figures. Hence, we created 10 wholesalers in the system.
Wholesalers are in charge of buying the two types of drug available on the market (heroin or other) and to supply the different dealers with one or the other. Initial cash amounts range from$50,000 to $100,000. They have to reset their stocks every 30 time steps while dealers come to buy more whenever they need. The availability of one drug or the other is given by the ratio between both. This ratio is considered as an externality of the model (depending on successful importation) and it is filled in from an external data file containing daily values of quantities, market prices, and purities. Wholesalers keep track of their usual clients. Hence, when Police succeeds in arresting a one of them, all the corresponding dealers fall with him.
Constable
Initially, 10 constables are created and located at the Police Station. They can move randomly around the grid or target a specific street in response to a protest from the

suburbs. In this case, they are tracking down dealers and user-dealers. They have 10% chance to arrest a dealer, and 40% to arrest user-dealers in the neighborhood. These figures are estimated from existing criminological studies.
The Police Station will send constables to a given location on a dealer chase if the average protest of the corresponding suburb reaches a value of 5. In the reality, operations against wholesalers are often initiated by special units (drug squads) and rely on external intelligence or insider’s information. Hence, we decided that the PoliceStation has a 0.25% chance to get reliable information, to send constables to the corresponding address and to operate a successful crack on wholesaler. As mentioned above, the dealers linked to an arrested wholesaler are also retrieved from the system.
Outreach Worker
10 outreach workers are created and initially located at the Treatment Center. Their aim is to convince users to undertake treatment programs. The Treatment Center will send outreach workers tothe street blocks displaying the highest overdose rates. As mentioned above, outreach workers have a purely mechanical effect: they decrease by 1 the value of the attribute readinessForTreatment for all the users located on the same street block.
UML Structure Several authors mentioned in the first chapters assert that research on illicit drug use needs a trans-disciplinary approach. Such an integrative approach requires itself a common language in order to first communicate, and then to build a consensual ontology. In the world of Complexity Theory – more specifically among the atomists – a common language is available. The Universal Modeling Language (UML) is developed around a series of visual paradigms (diagrams) that enable developers to share their knowledge with other experts and to encapsulate new knowledge into their project. Three main diagrams are usually used to describe the functionalities of a given model:
•The class diagram: it describes the entities of the modeled system (classes) with their internal characteristics(attributes and methods) and external links with other classes. It corresponds to the casting of the model.
•The sequence diagram: it describes the successive actions conducted independently by different classes or interactions between several classes. It corresponds to the storyboard of the model.
•The activity diagram: it describes the intimate actions embedded into a given method. The exhaustive list of all the activity diagrams corresponds to the script of the model.
Class diagram
Figure 1 represents the Class Diagram designed with VisualParadigm©, system components are described through computer agents characterized by attributes and methods.

Figure 1: SimDrug Class Diagram (designedwith VisualParadigm©)
Modelling sequence
SimDrug is divided into six successive main stages:
•(i) resetting and updating population,
•(ii) updating drug supply on the market;
•(iii) activating users decision making process,
•(iv) updating treatment center performances,
•(v) updating street blocks status,
•(vi) activating police station and constables crackdowns.
Stage (i) aims at updating the population of agents, based on the changes triggered during the previous time step. All detainees are retrieved from the system and new users, dealers and wholesalers are created accordingly. Outreach workers are moved back to the treatment center and dealers who were at their wholesaler’s place go back to their street location. Stage (ii) entails the methods for wholesalers and dealer’s interactions towards drug supply. Wholesalers are given the opportunity to refill their supply once a month while dealers can visit their wholesaler as soon as their drug stock is sold out. Stage (iii) focuses on the users’ interactions with their environment and other agents. They start by assessing their need looking at their available cash and drug and decide whether they need to commit a crime. They, then, find their usual dealer (or alternatively a new dealer) and buy some drug. They useit at once and might declare an overdose. Stage (iv) allows the Treatment Center to manage new users entering treatments and on-going treated users reaching the end of their treatment duration. Stage (v) consists in updating the street blocks risk and conductivity status and calculating the new suburbs’ protest values accordingly.
Finally, Stage (vi) allows the police station to adapt its strategy by reallocating constables on the grid and eventually performing successful crackdowns.
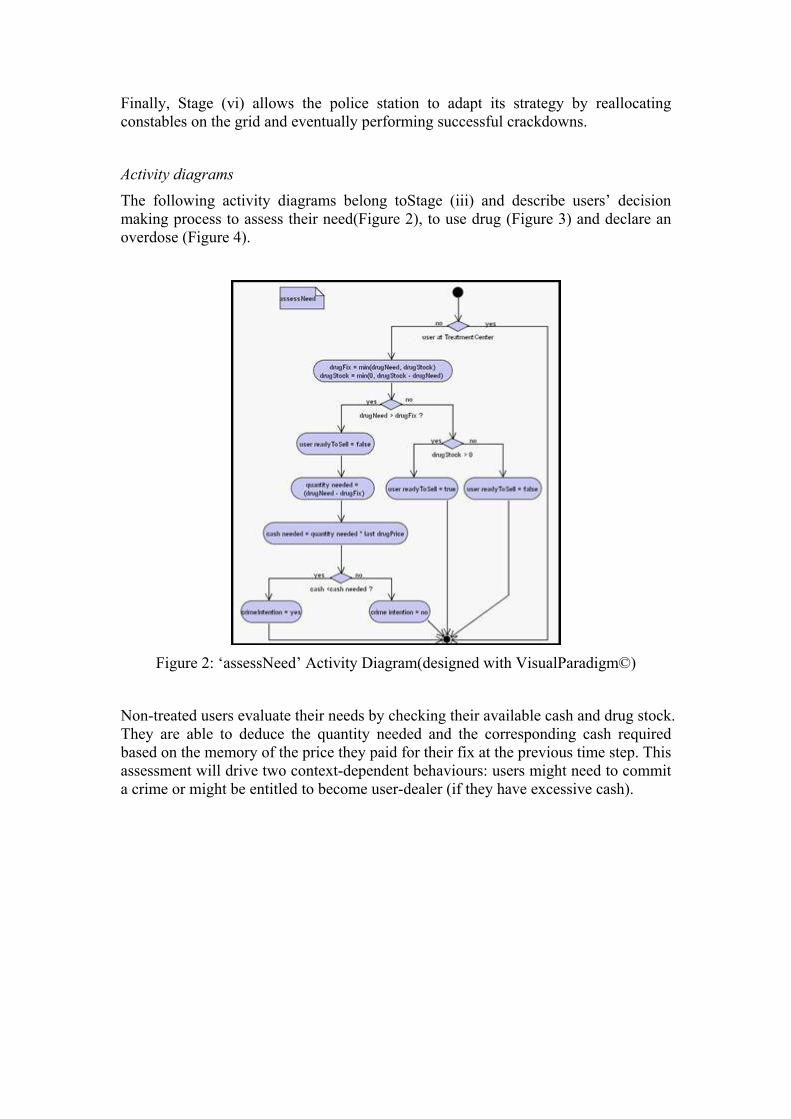
Activity diagrams
The following activity diagrams belong toStage (iii) and describe users’ decision making process to assess their need(Figure 2), to use drug (Figure 3) and declare an overdose (Figure 4).
Figure 2: ‘assessNeed’ Activity Diagram(designed with VisualParadigm©)
Non-treated users evaluate their needs by checking their available cash and drug stock. They are able to deduce the quantity needed and the corresponding cash required based on the memory of the price they paid for their fix at the previous time step. This assessment will drive two context-dependent behaviours: users might need to commit a crime or might be entitled to become user-dealer (if they have excessive cash).

Figure 3: ‘useDrug’ Activity Diagram(designed with VisualParadigm©)
Users have a 0.5% to declare an overdose when injecting heroin if they fulfill one of the following condition:
•the previous drug injected was not heroin,
•or variation in quantity from previous injection > 0.02 g,
•or variation in purity from previous injection > 15%,
•or exiting from unsuccessful treatment period

Figure 4: ‘declareOverdose’ ActivityDiagram (designed with VisualParadigm©)
Users declaring an overdose and close to another user able to call for an ambulance have a 90% chance to be rescued.
SIMDRUG - Preliminary Results The Cormas© platform encapsulates sensitivity analysis tools and provides output data directly into Excel format files. Each scenario is run 10 times and Cormas© allows for the recording of output variables such as: the total number of crimes per time step, the cumulative number of non-fatal and fatal overdoses, the number of users injecting heroin or another drug per time step, the number of users under each type of treatment, the number of successfully treated users, the police station efficiency as regards crackdowns, the proportion of users-dealers, and more.
The base scenario has been set up with the parameters and values described in the previous section. It contains 3000Users, 150 Dealers and 10 Wholesalers. These figures are not subject to sensitivity analysis so far and remain unchanged for all the scenarios. The base scenario is used as a reference to derive sensitivity analysis on a chosen set of parameters summarized below:
•nb of Constables: 10
•nb of Outreach Workers: 10
•chance for a user to declare an OD: 0.5%
•chance for a user declaring an OD to be rescued: 90%

•wealth decreased by 5% when a crime is committed on a given street block
•wealth increased by 3% after a 10-dayperiod with no crime
•crackdown on dealers occurs for suburbs with a protest value > 5
•chance for a user-dealer to be arrested during a “crackdown on dealer” mission: 40%
•chance for a dealer to be arrested during a “crackdown on dealer” mission: 10%
•chance for the police station to arrest a wholesaler at each time step: 0.25%
•treatment capacity at the TreatmentCenter: 1000
As for the input data featuring drugs’ characteristics, we have agreed on a very simplified set of values. Both drugs, “heroin” and “other”, are equally available on the market. Hence, wholesalers spend half of their money on heroin and the other half on “other”. Both drugs have the same purity (30%)which remains constant through the simulation. Wholesalers buy heroin for$150/g and “other” for $125/g. Hence, for the base scenario, we have decided to discard the impact of drug availability, quality and price in order to calibrate and analyze the remaining parameters.
Results Overdoses
The proposed rules to declare an overdose are consistent with real data regarding overdoses and fatal overdoses. On an average, 1100 overdoses occur over a 4-year period, amongst which 150 are fatal(Figure 5). On an average, these figures correspond to a 9.2% p.a. rate of overdose, and a 1.2% p.a. rate of fatal overdose over the entire population of users. Statistics for Victoria in1998-1999 provide an estimated 10% and 1% for the observed values.
Figure 5: Simulated Total and Fatal Overdoses over the 4-year period

Treatment
After 3 years - on average - 800 users are under treatment at any given time step: 750 are under methadone (amongst which 50still inject heroin), 40 are under TC and only 10 are under Detox. Statistics from treatment programs in Victoria indicate that 70% of real users are involved in a treatment program over a period of 12 months. Our 26% rate is much more conservative but corresponds to a proportion of users who take on a program until its date of completion, unlike official statistics. At the end of the simulation, 1000 users have been successfully treated (800 thanks to methadone, 170 thanks to TC and 30 thanks to detox). According to the simulations, Methadone treatment happens to be, by far, the most efficient way to withdraw from heroin addiction.
Crime and Hot Spots
Crime rate follows a 15-day periodic pattern driven by the CenterLink-like payment periodicity. Crime rate increases as users’ available cash decreases over the fortnight period and falls again when users receive their next payment. On an average, 800 crimes are committed per time step. This outcome needs to be discussed and validated against real data.
In terms of spatial changes, locations of ‘hot spots’ on the grid evolve over time as a result of the constables patrolling the grid in response to suburban protests. This spatial mobility of hot spots can be viewed as an emerging property of the system as no rules have been set up at the local level (street blocks) to define hot spots’ patterns. Figure 6 shows the position of hot spots at the beginning of the simulation(left) and the extension and displacement and of hot spots at the end of the simulation (right).
Figure 6: Evolution of hot spots’ location over time from initial condition (left) to
final state
Dealer’s cash
At the end of the simulation, dealer cash ranges between $40,000 and $800,000. On an average, one dealer earns$2,400/week. These figures are close enough to the ones coming from police records ($3,500 to $4,000 / week) if we take into account that a significant number of new dealers in the model ‘fail’ to establish a profitable business.
User-dealer

At the end of the simulation, 300 users are also user-dealers, corresponding to 10% of the population of users. This result is consistent with current estimates provided by the expert panel.
Sensitivity Analysis For each parameter, several scenarios were tested in order to evaluate the sensitivity of the model to different values of the parameter. Thus, each scenario corresponds to a change in only one parameter in order to avoid overlapping effects. Complete results from the sensitivity analysis are available in Perez and Dray (2006). The following selected outcomes provide meaningful insights into the complex interactions between law enforcement, treatment, and prevention programs.
Outreach workers
The number of outreach workers influences strongly the overdose rates and the number of users undergoing treatment programs. This influence seems to take off beyond 20 agents located on the grid (Figure 7). This impact on the amount of treated users is a direct consequence of the ability of the OW agents to modify individual readiness for treatment. The clear impact on overdose rates is more interesting as any user quitting an unsuccessful treatment increases his chances of overdose due to the withdrawal period. Clearly, non-linearity between tested values and variables opens a window of opportunity to run cost-efficiency analysis amongst mixed strategies.
Figure 7: Influence of outreach workers on overdose rates (left) and treated user rates
(right)
Constables
Increasing from 10 to 100 the number of constables has a clear and expected positive influence on the number of arrested dealers (Figure 8). However, looking at dealers’ maximum income, it is more surprising to notice the lack of major impact when comparing the scenarios with 50 and 100 constables. A plausible explanation lies in the ratio between constables and dealers that does not generate great difference for ratios above1 constable for 3 dealers. But again, cost-efficiency needs to be assessed for such large ratios that would probably stretch law enforcement capacities beyond limits.

Figure 8: Influence of outreach workers on overdoses rates (left) and treated users
rates (right)
Non drug-related variables
Interestingly, the way wealth attributes of the StreetBlocks are updated influences significantly most of the output variables. Obviously, the amount of wealth available on StreetBlocks drives users’ revenues from crimes. It constrains the possibility to fullfill one’s drug needs, and it impacts on the number of user-dealers. Consequently the number of arrested users is also affected. Beside, it affects the number oftreated users by reducing the chance for users to reach the required stage of readiness without being caught by the constables beforehand (Figure 9). This outcome seems to validate some experts’ claims about the necessity to better take into account non-drug-related environmental factors in order to understand these markets.
Figure 9: Number of users under treatment according to increasing values for wealth
updating rate

Simulating the heroin drought The striking figures linked with the so-called ‘heroin drought’ concern the number of fatal and non-fatal overdoses reported in Victoria at that time. Within a few months, fatalities fell from an average 300 p.a. to an equivalent of 40 p.a. during the drought peak, resulting in a 52% permanent decrease in the number of casualties from the drought onset (Dietze et al.,2003). Despite all our efforts, it was impossible to set up a scenario for SimDrug to display such a dramatic response without pushing some parameters to highly unrealistic values. Hence, the expert panel analyzed our initial assumptions again. It was decided to successively modify two essential features:
•Transforming SimDrug into a closed system rather than an open one. Thus, removed agents are not replaced in the system.
•Modifying the input data files in order to take into account the observed availability of heroin during the simulated period.
A closed system design succeeded indeed in creating a sharp fall in the number of overdoses, due to the simple fact that a decreasing number of users populated the system. But the system never recovers after the simulated drought, the market simply collapses. Beside, there is no evidence so far that the overall population of injecting users in Victoria significantly changed between 1998 and 2002. Nevertheless, it is probable that pre-drought conditions influencing individual decision to inject heroin hadsome effect. Hence, SimDrug’s degree of openness should be reviewed according to some pioneering work by Agar (2005).
Given the fact that modelling an illicit drug market based on two equally available drugs does not depict the reality of the heroin trade in Melbourne, we have decided to use heroin’s purity, quantity, and price data derived from Dietze et al. (2003). The ‘other’ drug’s availability was calculated in order to secure a constant overall availability of drugs on the market. The authors acknowledge that this first-pass assumption needs to be validated against further evidence. Figure 10 compares simulated fatal overdoses from this new scenario with the ones coming from the base scenario. While the base scenario –assuming that heroin covers 50% of the market at any time – provides a nearly steady rate of 35 casualties p.a.; the new scenario shows a sharp decrease -around time step 800 - which corresponds to the heroin drought period, from 60casualties p.a. before the drought onset, to a mere 30 casualties p.a. afterwards. Though this 50% decrease is consistent with findings from Dietzeand colleagues (2003), it has to be noticed that if our 1/10th scale were to be correct, the pre-drought simulated figures double the ones reported in reality. The same analysis and conclusions can be derived from results on total overdoses.

Figure 10: Number of fatal overdosesderived from the base-scenario and from real
data
Conclusion This chapter presents our attempt to build a first agent-based model dedicated to study the illegal drug market in Melbourne during the ‘heroin drought’ period. As described by Gorman and colleagues(Gorman et al., 2004), drug use-related problems are heterogeneously distributed with respect to population and geography and they require to be considered as essentially based on local interactions. SimDrug has been conceptualized and implemented in order to capture the primary community structures and relationships that support drug use and related outcomes. Geography and local interactions are embedded within the structure of the spatial grid divided into 5 archetypal suburbs. Using the propriety of the cellular-automata, SimDrug allows for diffusion processes –such has hot spots displacement – to occur. Interactions amongst agents could be increased by creating converging sites where massive connections arise such as shopping malls or central stations. Moreover, as argued by Gorman et al.:
“Models that capture the behavior of […]complicated community systems and control strategies that modify them must, therefore, combine available data, statistics,
and spatiotemporal dynamics” (Gorman et al., 2004).
One of the main advantages of SimDrug is its ability to gather and blend, within the same tool, data (second-hand mainly) coming from very diverse sources. The structure is already flexibleenough to integrate more information, as the prototype will evolve.
The next stage will focus on transforming this data-collecting oriented platform into a discussion-oriented tool by improving the economical components. Integrating cost-efficiency analysis will help explore combined strategies by adjusting the allocated resources between treatment (outreach workers and treatment center) and repression (police station and constables). We can also incorporate harm reduction programs (through new rules for outreach workers regarding needle syringe distribution). SimDrug encompasses great expectations to be used as a tool to confront and

generate discussions amongst stakeholders and policy-makers. However, as pointed out by Gorman et al. (2004), such an approach will never provide an optimal solution but rather numerous possible context-specific solutions with potential outcomes being highly uncertain. In fact, the best global solution may be a collection of local solutions tailored to local circumstances and needs. Obviously, such an approach needs to be carefully explained and tools need to be genuinely tailored in order to appeal to policymakers, who would normally favor large scale standardized interventions that promise to deliver assured, definite, and extensive outcomes.
Acknowledgements The authors wish to thank the Colonial Foundation Trust for funding the Drug Policy Modelling Project (DPMP). They also need to thank Gabriele Bammer, Jonathan Caulkins, and Peter Reuter for their helpful comments.
References AGAR M. (2005). Agents in Living Color:Towards Emic Agent-Based Models.
Journal of Artificial Societies and Social Simulation, vol. 8, no. 1. AGAR M. AND REISINGER H.S. (2002). A Heroin Epidemic at the Intersection of
Histories: The 1960s epidemic among African Americans in Baltimore. Medical Anthropology, 21(2): 115-156.
AGAR M. AND WILSON(2002). DrugMart: Heroin Epidemics as Complex Adaptive Systems. Complexity,Vol.7, No. 5, pp.44-52.
AUGUST G..J., WINTERS K.C., REALMUTO G.M.,TARTER R., PERRY C. AND HEKTNER J.M. (2004). Moving evidence-based drug abuse prevention programs from basic science to practice: ‘‘Bridging the efficacy-effectiveness interface’’. Substance use and misuse. Vol. 39, Nos.10–12, pp. 2017–2053.
BOUSQUET F., BARRETEAU O., D'AQUINO P.,ETIENNE M., BOISSAU S., AUBER S., LE PAGE C., BABIN D. AND CASTELLA J. C.(2003). Multi-agent systems and role games: An approach for ecosystem comanagement. In: M. A. Janssen, ed. Multi-Agent Approaches for Ecosystem Management.
BRADBURY R.H., GREEN D.G. AND SNOAD N.(2000). Are ecosystems complex systems? In: T. Bossomaier & D. Green (eds),Complex systems. Cambridge University Press, Cambridge, pp 339 - 365.
BUSH W., ROBERTS M. AND TRACE M. (2004).Upheavals in the Australian drug market: heroin drought, stimulant flood. The Beckley Foundation Drug Policy Programme, Drugscope Briefing Paper No. 4.
CAULKINS J. AND REUTER P. (2005). Analyzing illicit drug markets when dealers act with limited rationality. In: F. Parisi& V.L. Smith (Eds) The Law and Economics of Irrational Behaviour. CA:Standford Uni Press
CHOU C.-P., SPRUIJT-METZ D. AND AZEN S. P.(2004). How can statistical approaches enhance transdisciplinary study of drug misuse prevention?. Substance use and misuse. Vol. 39, Nos. 10–12, pp.1867–1906.
DIETZE P., MILLER P., CLEMENS S., MATTHEWSS., GILMOUR S. AND COLLINS L. (2003). The Course and Consequences of the Heroin Shortage in Victoria. NDLERF Monograph no. 6. Adelaide: Australasian Centre for Policing Research.
DORN, N., MURJI, K. & SOUTH, N. (1992).Traffickers: drug markets and law enforcement. London: Routledge.

FUQUA J., STOKOLS D., GRESS J., PHILLIPS K.AND HARVEY R. (2004). Transdisciplinary collaboration as a basis for enhancing the science and prevention of substance use and abuse. Substance Use and Misuse. Vol. 39, Nos. 10–12
GATRELL A.C. (2005). Complexity Theory and Geographies of Health: A Critical Assessment. Social Science & Medicine.60(12):2661-2671.
GORMAN D. M., GRUENEWALD P. J., HANLON P.J., MEZIC I., WALLER L.A., CASTILLO-CHAVEZ C., BRADLEY E. AND MEZIC J. (2004).Implications of systems dynamic models and control theory for environmental approaches to the prevention of alcohol- and other drug use-related problems. Substance Use and Misuse.. Vol. 39, Nos. 10–12, pp. 1713–1750.
MAHER, L. (1996) Illicit drug reporting system trial: ethnographic monitoring component. NDARC Technical Report No. 36.Sydney: NDARC
MASON M., CHEUNG I. AND WALKER L. (2004).Substance use, social networks, and the geography of urban adolescents. Substance Use and Misuse. Vol. 39, Nos. 10–12, pp. 1751–1777, 2004
MAY T. AND HOUGH M. (2004). Drug Markets and Distribution Systems. Addiction Research and Theory Vol 12, No 6, pp.549-563
MAZEROLLE L., KADLECK C. AND ROEHL J.(2004). Differential police control at drug-dealing places. Security Journal,17(1), 61-69.
RHODES T. (2002).The ‘risk environment’: a framework for understanding and reducing drug-relatedharm.. International Journal of Drug Policy, 13, 85 94.
RITTER A. (2005). Australian illicit drug markets: a review of the existing literature and data sources. DPMP Monograph, Turning Point, Melbourne (Inpress).
SOUTH N. (2004). Managing work, hedonismand the borderline between the legal and illegal markets: two case studies ofrecreational drug users. Addiction Research & Theory, 12(6), 525-538.
UNGER J., BAEZCONDE-GARBANATI L., PALMER P.H., NEZAMI E. AND MORA J. (2004). What are the implications ofstructural/cultural theory for drug abuse prevention? Substance Use and Misuse.Vol. 39, Nos. 10–12 United Nations Office on Drugs and Crime (UNODC) World DrugReport 2004: Volumes I and II. (2004) UNODC.
VALENTE T.W., GALLAHER P. AND MOUTTAPA M.(2004). Using social networks to understand and prevent substance use: atransdisciplinary perspective. Substance use and misuse. Vol. 39, Nos. 10–12,pp. 1685–1712.