10 Be distribution in soils from Merced River terraces, California
9
Geockimica el Cosmochimrca Acta Vol. 50.pp. 1727-1735 0 Pergamon Journals Ltd. 1986. Printed in U.S.A. 0016-7037/86/$3.00 + .oO “Be distribution in soils from Merced River terraces, California MILAN J. PAVICH’, LOUIS BROWN’, JENNIFERHARDENS, JEFFREYKLEIN“ and ROY MIDDLETO~~ ‘U.S. Geological Survey, Reston, VA 22092, U.S.A. 2Department of Terrestrial Magnetism, Carnegie Institution, Washington, DC. 20015, U.S.A. ‘U.S. Geological Survey, Menlo Park, CA 94025, U.S.A. 4Tandem Accelerator Laboratory, University of Pennsylvania, Philadelphia, PA 19104, U.S.A. (Received November 14, 1985; accepted in revised form May 13, 1986) Abstract-The distribution and residence time of cosmogenic “‘Be in clay-rich soil horizons is fundamental to understanding and modelling the migration of ‘@Be on terrestrial sediments and in groundwater solutions. We have analyzed seven profiles of clay-rich soils developed from terrace sediments of the Merced River, California. The terraces and soils of increasing age are used to compare the “‘Be inventory with a simple model of accumulation, decay and erosion. The data show that the distribution of “Be varies with soil horizon clay content, that the residence time of ‘OBe in these horizons exceeds 10’ years, and that to a rough approximation the inventory of “Be in a thoroughly sampled soil profile fits the equation: N = (q - Em)( 1 _ e@)/X where q is delivery rate, E is erosion rate, M is the concentration of “‘Be in the eroding surface layer, X is the decay constant, and t is the age of the depositional unit from which the soil has developed. The general applicability of this model is uncertain and warrants further testing in well-calibrated terrace sequences. 1.0 INTRODUCTION 1.1 Soils of the study area THE DELIVERY OF “Be from the atmosphere to the Earth’s surface initiates a terrestrial geochemical cycle. Numerous measurements of cosmogenic “Be in sed- iments, volcanic rocks, rain, tektites, petroleum, and soils have been made since the introduction of accel- erator mass spectrometry as an analytical tool. The long half life of “Be (1.5 X lo6 yr) and its high affinity for solid phases in soils and fresh-water sediments makes it a potentially useful geochemical tracer (BROWN, 1984). Soils of the Merced River terraces are classed as non-calcic brown soils, or Alfisols and Ultisols (ARKLEY, 1962). They characteristically exhibit sandy, leached A horizons overlying argillic B horizons, and they exhibit time-related changes in horizon thickness, texture, color, and other properties (HARDEN, 1982). “Be data have been obtained from modem alluvium and soil samples from eight sites on five river terraces along the Merced River. The soils on these terraces were described and sampled by HARDEN (1986), following soil mapping by ARK- LEY ( 1962). A generalized geologic map of the Merced River drainage is shown on Fig. 1. In addition to its usefulness as a tracer for sedimen- tary and geophysical processes (BROWN ef al., 1981) ‘“Be is potentially useful for dating soils, but its reli- ability as a chronometer requires better understanding of how “Be enters soil profiles and, after entry, how mobile it is. The retention of “Be introduced during pedogenesis is an expected result based on calculations of isotope mobility based on experimentally deter- mined distribution coefficients. Previous studies by PAVICH et al. ( 1982, 1984, 1985) and MONAGHANet al. (1982, 1983) resulted in different conclusions about the mobility of “Be in soils. The calculations by MON- AGHAN et al. yield a mean-residence time of roughly lo4 years for “Be in some A and upper B horizons of Spodosols from the California coast. In contrast, PAV- ICH et al. (1984, 1985) found evidence for residence times greater than lo5 years in Ultisols from Virginia. Soil development on each terrace presumably began im- mediately after alluvial deposition. The soils are developed in glaciogenic, granitic alluvium which was derived from the Sierra Nevada to the east and was deposited by the Merced River. Periods of Quatemary alluvial sedimentation and ter- race construction probably correspond to late stages of glacial episodes (MARCHAND and ALLWARDT, 1981; HARDEN, 1986). As an independent check on the question of mo- bility, “Be analyses were performed on soils from a well-studied soil chronosequence (HARDEN and MARCHAND, 1977; HARDEN, 1982) developed on the fluvial terraces of the Merced River, California (Fig. 1). Comparison of the results of the study supported here with previous geochemical and chronometric studies (ROSHOLT, 1980) indicate that a very large fraction of the “Be delivered to the soil surface in rain is incorporated into the soil. The relative positions of the sampled terraces and the units upon which they are developed are shown on the protile on Fig. 2. The terraces generally occupy higher positions with increasing distance from the river. The ages of the terrace sediments have been approximated by various radiometric methods (MARCHAND and ALLWARDT, 1981; HARDEN, 1986). The terrace developed in the Modesto Formation has been dated by uranium trend to be about 40 ka (ROSHOLT, 1980), but other estimates range from 20 to 70 ka (HARDEN, 1986). Ages determined by uranium-trend analysis by ROSH- OLT (1980) for the terrace developed in the Riverbank For- mation are about 140 ka (R9) and 260 ka (RlO). There is, however, field evidence that these two terraces could be the same age (HARDEN, 1986). The age of the terrace cut in the Turlock Lake Formation is well constrained at about 600 ka by a K/Ar date on an ash within the Turlock Lake Formation (DALRYMPLE, 1980) and is corroborated by Rosholt’s ura- nium-trend method (MARCHAND and ALLWARDT, 198 1).The terrace developed on the China Hat Gravel Member of the Laguna Formation is estimated to be > 1.8 Ma and <3 Ma old on the basis of paleontology and correlation with gravels in the Sacramento area (MARCHAND and ALLWARDT, 198 I ; BUSACCA, 1982; BUSACCA et al., 1986). The stream terraces that comprise the chronosequence are preserved to varying degrees. The Modesto Formation and Riverbank Formation terraces show little geomorphic mod- 1721
-
Upload
unitedstatesgeologicalsurvey -
Category
Documents
-
view
2 -
download
0
Transcript of 10 Be distribution in soils from Merced River terraces, California

Geockimica el Cosmochimrca Acta Vol. 50. pp. 1727-1735 0 Pergamon Journals Ltd. 1986. Printed in U.S.A.
0016-7037/86/$3.00 + .oO
“Be distribution in soils from Merced River terraces, California
MILAN J. PAVICH’, LOUIS BROWN’, JENNIFER HARDENS, JEFFREY KLEIN“ and ROY MIDDLETO~~ ‘U.S. Geological Survey, Reston, VA 22092, U.S.A.
2Department of Terrestrial Magnetism, Carnegie Institution, Washington, DC. 20015, U.S.A. ‘U.S. Geological Survey, Menlo Park, CA 94025, U.S.A.
4Tandem Accelerator Laboratory, University of Pennsylvania, Philadelphia, PA 19104, U.S.A.
(Received November 14, 1985; accepted in revised form May 13, 1986)
Abstract-The distribution and residence time of cosmogenic “‘Be in clay-rich soil horizons is fundamental to understanding and modelling the migration of ‘@Be on terrestrial sediments and in groundwater solutions. We have analyzed seven profiles of clay-rich soils developed from terrace sediments of the Merced River, California. The terraces and soils of increasing age are used to compare the “‘Be inventory with a simple model of accumulation, decay and erosion. The data show that the distribution of “Be varies with soil horizon clay content, that the residence time of ‘OBe in these horizons exceeds 10’ years, and that to a rough approximation the inventory of “Be in a thoroughly sampled soil profile fits the equation: N = (q - Em)( 1 _ e@)/X where q is delivery rate, E is erosion rate, M is the concentration of “‘Be in the eroding surface layer, X is the decay constant, and t is the age of the depositional unit from which the soil has developed. The general applicability of this model is uncertain and warrants further testing in well-calibrated terrace sequences.
1.0 INTRODUCTION 1.1 Soils of the study area
THE DELIVERY OF “Be from the atmosphere to the
Earth’s surface initiates a terrestrial geochemical cycle. Numerous measurements of cosmogenic “Be in sed- iments, volcanic rocks, rain, tektites, petroleum, and soils have been made since the introduction of accel- erator mass spectrometry as an analytical tool. The long half life of “Be (1.5 X lo6 yr) and its high affinity for solid phases in soils and fresh-water sediments makes it a potentially useful geochemical tracer (BROWN, 1984).
Soils of the Merced River terraces are classed as non-calcic brown soils, or Alfisols and Ultisols (ARKLEY, 1962). They characteristically exhibit sandy, leached A horizons overlying argillic B horizons, and they exhibit time-related changes in horizon thickness, texture, color, and other properties (HARDEN, 1982).
“Be data have been obtained from modem alluvium and soil samples from eight sites on five river terraces along the Merced River. The soils on these terraces were described and sampled by HARDEN (1986), following soil mapping by ARK- LEY ( 1962). A generalized geologic map of the Merced River drainage is shown on Fig. 1.
In addition to its usefulness as a tracer for sedimen- tary and geophysical processes (BROWN ef al., 1981) ‘“Be is potentially useful for dating soils, but its reli- ability as a chronometer requires better understanding of how “Be enters soil profiles and, after entry, how mobile it is. The retention of “Be introduced during pedogenesis is an expected result based on calculations of isotope mobility based on experimentally deter- mined distribution coefficients. Previous studies by PAVICH et al. ( 1982, 1984, 1985) and MONAGHAN et al. (1982, 1983) resulted in different conclusions about the mobility of “Be in soils. The calculations by MON- AGHAN et al. yield a mean-residence time of roughly lo4 years for “Be in some A and upper B horizons of Spodosols from the California coast. In contrast, PAV- ICH et al. (1984, 1985) found evidence for residence times greater than lo5 years in Ultisols from Virginia.
Soil development on each terrace presumably began im- mediately after alluvial deposition. The soils are developed in glaciogenic, granitic alluvium which was derived from the Sierra Nevada to the east and was deposited by the Merced River. Periods of Quatemary alluvial sedimentation and ter- race construction probably correspond to late stages of glacial episodes (MARCHAND and ALLWARDT, 198 1; HARDEN, 1986).
As an independent check on the question of mo- bility, “Be analyses were performed on soils from a well-studied soil chronosequence (HARDEN and MARCHAND, 1977; HARDEN, 1982) developed on the fluvial terraces of the Merced River, California (Fig. 1). Comparison of the results of the study supported here with previous geochemical and chronometric studies (ROSHOLT, 1980) indicate that a very large fraction of the “Be delivered to the soil surface in rain is incorporated into the soil.
The relative positions of the sampled terraces and the units upon which they are developed are shown on the protile on Fig. 2. The terraces generally occupy higher positions with increasing distance from the river. The ages of the terrace sediments have been approximated by various radiometric methods (MARCHAND and ALLWARDT, 1981; HARDEN, 1986). The terrace developed in the Modesto Formation has been dated by uranium trend to be about 40 ka (ROSHOLT, 1980), but other estimates range from 20 to 70 ka (HARDEN, 1986). Ages determined by uranium-trend analysis by ROSH- OLT (1980) for the terrace developed in the Riverbank For- mation are about 140 ka (R9) and 260 ka (RlO). There is, however, field evidence that these two terraces could be the same age (HARDEN, 1986). The age of the terrace cut in the Turlock Lake Formation is well constrained at about 600 ka by a K/Ar date on an ash within the Turlock Lake Formation (DALRYMPLE, 1980) and is corroborated by Rosholt’s ura- nium-trend method (MARCHAND and ALLWARDT, 198 1). The terrace developed on the China Hat Gravel Member of the Laguna Formation is estimated to be > 1.8 Ma and <3 Ma old on the basis of paleontology and correlation with gravels in the Sacramento area (MARCHAND and ALLWARDT, 198 I ; BUSACCA, 1982; BUSACCA et al., 1986).
The stream terraces that comprise the chronosequence are preserved to varying degrees. The Modesto Formation and Riverbank Formation terraces show little geomorphic mod-
1721
1728 M. J. Pavich et al.
Post-Modesto deposits Wfolocenel E
__-$_I Turlock Lake Formation --- --- (Pleistocene1
Modesto Rormation (PleistoceneJ - E‘
&“..& : North Merced Gravel Consists of: . -.....: (Pleistocene or Pliocene1
Upper Member- Divided into:
Alluvial deposits
Eolian deposits
Lower fvfamber- Divided into:
Laauna Formation (Poliocenel- Consists of:
China Hat Gravel Member
Lower Part
Alluvial deposits
Eolian deposits
Mehrten Formation (Pliocene and Miocene)
Sedimentary and Volcanic rocks,
Riverbank Formation (Pleistocene)
undivided (Tertiary)
* Samolinn cites _ _ _... r ~ _.-__
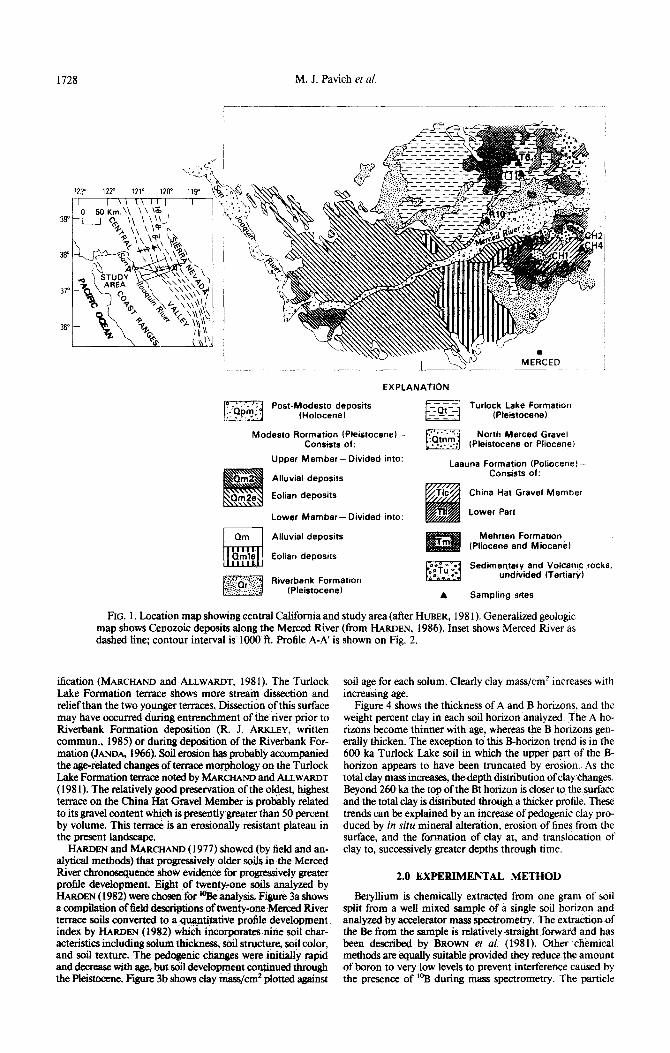
FIG. 1. Location map showing central California and study area (after HUBER, 198 1). Generalized geologic map shows Cenozoic deposits along the Merced River (from HARDEN, 1986). Inset shows Merced River as dashed line; contour interval is 1000 ft. Profile A-A’ is shown on Fig. 2.
ification (MARCHAND and ALLWARDT, I98 1). The Turlock Lake Formation terrace shows more stream dissection and relief than the two younger terraces. Dissection of this surface may have occurred during entrenchment of the river prior to Riverbank Formation deposition (R. J. ARKLEY, written commun., 1985) or during deposition of the Riverbank For- mation (JANDA, 1966). Soil erosion has probably accompanied the age-related changes of terrace morphology on the Turlock Lake Formation termce noted by MARCHAND and AUWARDT (198 1). The relatively good preservation of the oldest, highest terrace. on the China Hat Gravel Member is probably related to its gravel content which is presently greater than 50 percent by volume. This terrace is an erosionally resistant plateau in the present landscape.
HARDEN and MARCHAND ( 1977) showed (by field and an- alytical methods) that progressively older soils in the Merced River chronosequence show evidence for progressively greater profile development. Eight of twenty-one soils analyzed by HARDEN (1982) were chosen for ‘Bee analysis, Figure 3a shows a compilation of 6eld descriptions of twenty-one Merced River terrace soils converted to a quantitative profde development index by HARDEN ( 1982) which incorporates nine soil char- acteristics including solum thickness, soil structure, soil color, and soil texture. The pedogenic changes were initially rapid and decrease with age, but soil development continued through the Pleistocene. &ure 3b shows clay mass/cm* plotted against
soil age for each solum. Clearly clay mass/cm* increases with increasing age.
Figure 4 shows the thickness of A and B horizons, and the weight percent clay in each soil horizon analyzed. The A ho- rizons become thinner with age, whereas the B horizons gen- erally thicken. The exception to this B-horizon trend is in the 600 ka Turlock Lake soil in which the upper part of the B- horizon appears to have been truncated by erosion. As the total clay mass increases, the depth distribution ofclay changes. Beyond 260 ka the top of the Bt horizon is closer to the surface and the total clay is distributed through a thicker profile. These trends can be explained by an increase of pedogenic clay pro- duced by in situ mineral alteration, erosion of fines from the surface, and the formation of clay at, and translocation of clay to, successively greater depths through time.
2.0 EXPERIMENTAL METHOD
Beryllium is chemically extracted from one gram of soil split from a well mixed sample of a single soil horizon and analyzed by accelerator mass spectrometry. The extraction of the Be from the sample is relatively straight forward and has been described by BROWN et al. (1981). Other chemical methods are equally suitable provided they reduce the amount of boron to very low levels to prevent interference caused by the presence of “‘B during mass spectrometry. The particle

‘*Be in California soils 1729
A’
MEACED RIVER RESIDUAL UPLANDS FLOOD PLAIN
EXPLANATION
Alluvium, sandy 1: : 1 : 1 Sandstone (Eocene)
Terrace Gravels Slates and Meta-sandstones
Sedimental Rocks Wiocene) Basic metaigneous rocks
FIG. 2. Diagrammatic profile showing locations and elevations of terrace surfaces on the Modesto Formation, Riverbank Formation, Turlock Lake Formation, and China Hat Gravel Member of the Laguna Formation, modified from ARKLEY (1962).
detector for the accelerator mass spectrometer can detect a few counts per minute of ‘*Be reliably in a beam containing 10’ ions per second of “‘B. At higher concentrations of “B, ‘%e is not counted reliably. For details see KLJZIN et al. (I 982).
The concentrations of %e in the samples of soils and sed- iments have been determined using the method of isotope dilution, performed here by adding an accurately measured amount of 9Be to the sample at the time of its dissolution. The ratio ‘“Be/%e of the extracted Be is measured by the mass spectrometer. In this case the amount of ‘Be naturally present in the sample is negligible compared to the amount added in the spike for the accuracies of the spectrometer, about 8%. The ratios measured are of the order of 1O-‘2.
of any of the soil horizons, as one expects for slightly weathered rock that has had little time to capture cos- mogenic ‘*Be.
3.1 Measured vs. calculated inventories
3.0 RESULTS
The hypothesis of high ‘@Be retention in clay-rich soil is tested by comparing the measured inventories of the isotope for a site, i.e. the integrated number of atoms cm-* in the profile, with calculated values. The measured inventory is the integral of con~n~tion times soil density to the depth to which the profile was sampled. We calculate the expected inventory for a given age terrace, 2, using the equation:
Table 1 presents the results of the “Be analyses in atoms/gm for each of the analyzed soil horizons. Aiso presented are horizon depths, densities, and clay per- centages determined by HARDEN (1982, 1986). Figure 4 shows the ~ncentration of “‘Be in millions of atoms per gram plotted against horizon depth and percent clay. The distribution of “& with depth in each profile closely follows the clay ~st~bution (Fig. 4), a depen- dence also observed in eastern soils (PAVICH et al., 1984). The soil on the China Hat surface shows a much hi8her “Be concentration than any of the younger soils. The maximum ‘OBe correlates with the maximum clay percentage and maximum age.
N = q(l - eeX’)/X (1)
where X is the ‘@ESe decay rate of 4.62 X lo-’ yr-‘, and
q is the deposition rate in atoms cm-” yr-‘. Table 2 gives for each terrace the age, surface concentration, the measured inventory, a corrected inventory assum- ing inheritance of ‘OBe at the concentration of modem alluvium, a calculated inventory corrected for inherited ‘OBe with no erosion, a calculated inventory corrected for inherited ‘*Be and erosion, and the thickness of the eroded layer. For the corrected inventory, the concen- tration of ‘Qe in the modem alluvium minus loss by decay is subtracted from the concentration measured in each horizon.
These data support the assertion by PAWCH et al. Previous calculations of inventories have used along- (1984, 1985) that cosmogenic ‘(& is retained within term average deposition rate of ‘*Re, q, of 1.3 X lo6 the upper 3 to 4 meters of regolith containing a clay- atoms cmV2 yr-’ (PAVICH et al., 1984, 1985) This rich solum. Concentrations of ‘*Be deeper in regolith quantity is not well known but the value used is based (e.g. saprolite, weathered sediments) and in recent river on an average for temperate latitudes with 100 cmjyr alluvium (Table 1) exhibit much lower “Be concen- rainfall. We use a value here for q of 0.52 X lo6 atoms trations than clay-rich soil horizons. The ‘*Be content cm-’ yr-‘, the value used by MONAGHAN et al. (1983) of the modem alluvium (Table I) is lower than that for California. This is consistent with the average an-

1730 M. J. Pavich et al.
320
5
r” 240
k : an 20 160 clz c l *
I . .
80 . ’ .
0 2iL_...L 1 20
3.0 4.0 50 60
SOIL AGE, loglo yeas
. . . l
.
.
: .
.- 6
10
. i
.
1 .
i
FIG. 3a. Shows the protile development index of HARDEN
(1982) for soils on Merced River Terraces. The profile devel- opment index of HARDEN (1982) incorporates several em- pirical characteristics (e.g. color, texture, structure. etc.) into a numerical representation of field data.
FIG. 3b. Shows cumulative clay mass in pedons plotted as functions of log years. The clay mass is calculated from the weight percent of clay in a soil horizon multiplied by bulk density (gm/cm3) and thickness (cm) of the horizon and sum- ming the result for all horizons of a single sotum.
nual rainfall of 28 to 38 cm/yr over the study area (ARKLEY, 1962) and with ~60 cm/yr rainfall through the Quaternary based on AXELROD’S ( 1980) estimated precipitation for wetter areas to the northwest of the study area. The results of this calculation are presented on Table 2 in the column headed (3) Calculated In- ventory, (Eqn. 1).
4.0 DISCUSSION
The low inventory of the Turlock Lake profiles cor- relates with the independent observations of the degrees of dissection and erosion of that surface ( MARCHAN) and ALLWARDT, 198 1). The Turlock Lake soil inven- tories cannot be reproduced with erosion rates of 3 X 1 0e4 gm cm-* yr-’ (requiring rates of the order of 2 X 10m3 gm/cm-* yr-‘). Erosional removal of “Be on clays from Turlock Lake soils is plausible. In contrast, the inventories of the China Hat soils are nearly a factor of three greater than in the Turlock Lake soils. The erosional resistance of the China Hat material is prob- ably greater than that of the Turlock Lake soil because of its higher gravel content.
Comparing the corrected inventory and inventory This erosion rate of 3 X 1O-.4 gm cm -’ yr ’ is the calculated from Eqn. 1 shows closer correspondence maximum required to fit observed and calculated in- for the younger sites than for the older sites. For 250 ventories for three of the four terrace ages at the as- ka and younger, the measured inventory is larger than sumed value of deposition rate (q). Using lower values the calculated, indicating that “Be is retained within for the erosion rate (E) results in a closer correspon- the solum for that length of time. We cannot differ- dence for young sites and poorer correspondence for entiate the measured inventories of sites R9, RIO, T6 older sites. In Fig. 5, solutions for two linear rates of and Tl 1. The Turlock Lake and China Hat protiles E in Eqn. 2 are plotted against the corrected measured are deficient relative to their inventories calculated inventories. The solution of N (Eqn. 2) using the max- from Eqn. 1. This deficiency suggests that some mech- imum value of E requires that a significant amount of anism of loss or removal of “Be is taking place from soil be eroded from the oldest surfaces. The erosion of the older sites, but relatively more loss from the 600 up to 4.5 m for the oldest soil is questionable. owing
ka Turlock Lake profile than from the 1.8 to 3 Ma China Hat profiles. In addition to variation of the de- position rate, the loss of “Be evidenced by lower than expected inventories for the Turlock Lake and China Hat sites could be due to loss by erosion, loss by clay translocation, loss in solution, or some other process. These hypotheses are discussed separately.
4.1 Erosional loss of ‘OBr
To evaluate the erosion hypothesis, we assume that material is eroded from the surface at a constant rate E. E is assumed to be 3 X lO--4 gm cm-* yr’ to fit the measured and calculated the China Hat inventories (2 X IV4 cm/yr at a bulk density of 1.6 gm/cm’). These assumptions yield a predicted inventory. ;I‘,
IV = (q -- Em)(l - f’ “‘)/h (2)
where X is the “Be decay rate of 4.62 X 10 yr ‘. ru is the measured concentration of the isotope in the top (eroding) horizon in atom/g, and t is the age assigned to the terrace. Inventories calculated from Eqn. 2 are presented in Table 2 under (4) Calculated Inventory. The last column, (5) T, presents the total thickness removed by erosion at an erosion rate. E. of 3 X 10 ’ gm cmM2 yr-‘.
The corrected measured inventory and inventory calculated from Eqn. 2 are similar for soils of the Mo- desto, Riverbank, and China Hat terraces using the erosion rate of 3 X 1O-4 gm cm--* yr ‘. The two Turlock Lake sites show the largest divergence from the cal- culated inventory. Despite the fact that the values of q, E, and m surely vary somewhat independently through time for specific sites, the observed trends argue for some uniformity in their long-term average values.

“Be in California soils 1731
Ml2 Soil on Modesto Fm. 140Kal
% CLAY “Be ATOM/gm x 10’
0 10 20 loo 200 300 400
R9 Soil on Riverbank Fm. (140-260 Ka)
% CLAY “Be ATOMSigm x lo6
0 10 20 100 200 300 400 500
Tll Soil on Turlock Lake Fm. (600Ka)
% CLAY “Be ATOMSlgm x ld
0 10 20 100200300400500 0 .:...., , I It&l I
RlO Soil on Riverbank Fm. 1140-260 Kal
% CLAY “Be ATOMS/gm x 104
0 10 20 loo 200 300 400
CH2 Soil on China Hat Gravel Member (1.8-3 Ma1
% CLAY “Be ATOMS/gm x ld
10 20 30 40 50 o;, , , ,
log 200 300 400 500 6M) 7w Boo 900 loo0
I I I l-t I I I I 1
:: r ’ r” I z
E 2 -
$
3
EXPLANATION
m A horizon
I 6 horizon
C horizon
FIG. 4. Distribution of loBe with depth in five of the study sites. Weight percent clay is plotted for each soil horizon. loBe concentrations are expressed in lo6 atom/g.
to the observation that soils are well developed on the terrace. Various other explanations could be offered for variation of input to, or for the loss of “Be from, these soils over time.
4.2 Variation of the average deposition rate of “Be (4)
Some variation of q could result from documented paleo-rainfall variation. Climate through the late Ter- tiary and Quaternary has varied in the San Joaquin Valley and on the western slope of the Sierra Nevada (AXELROD, 1980). Baaed on AXELROD’S ( 1980) recon- struction, long-term rainfall has decreased over the last 3 Ma in West-Central California. Conversely, an in- crease of precipitation toward the present is suggested by WINOGRAD et al. (1985), who attribute aridity of the southern Great Basin to an orographic effect of
Sierra Nevada uplift. The western slope of the Sierra may have received more rainfall while the southern Great Basin was drying out. Long-term variation of rainfall is uncertain, and variation at a specific site cannot be assessed. Data presented by AXELROD (1980) for the Quatemary, however, indicate that precipitation has not varied by more than 30%. This variation in precipitation cannot be used alone to explain the low inventories in the Turlock Lake terrace soils, since the measured inventories in the younger sites are close to the calculated inventories and the inventories in the older China Hat soils are much greater than those in the Turlock Lake profiles. It is more likely that the Turlock Lake soil inventory was severely eroded during an arid period some time between 600,000 and 250,000 years B.P. during which the China Hat surface was more resistant to erosion than the Turlock Lake sur- face.

1732 M. J. Pavich et al.
Table 1 Bu k density. percent clap and concentration of 16 Be in alluvium and soil horizons.
SITE
L&l
MRA- I
(0)
MRA-4
(0)
MI.? (40 ka)
KY (140 to
260 ka)
KIO (140 to
260 ka)
Th (600 ka)
1’11 (600 ka)
Clil (1.X to
3 Ma)
CHZ (I.8 to
3 Ma)
CH4 (1.8 to
3 @ia)
SOIL HORIZON
BULK DEPTH DENSIT (cm)
r &m/cm 1
PERCENT CLAY
10
lOBe (atom x IOh) -----
I 1 0
I 0 IX
AI 2 l5- XI 1.7 5.6 IIR 2l321t 81-102 1.7 10.3 139 3B22t 102-I 70 , 9 18.0 316 483 170-20 1 1.9 6.3 168 4c LUI-231 __ 3.3 83
Alip u- 70 I.8 7.2 Al Lp 30- hll I.8 7.3 B1 bO-LO5 1.8 12.6 8% I IU5-180 1.9 2U.H 831 180-235 I.8 13.7 B?L 235-350 1.9 13.0 x: 350-4110 6.8
195 251 306 5u5 234 22Y 100
A O-46 1.9 i.3 269 Bi 46-70 1.9 13.1 407 B2lt 7u-14n 1.9 13.6 3711 n22t 140-210 1.9 12.2 253 i33r 210-386 1.9 Il.6 169
Al 1 O-211 4.3 Al2 20-40 5.3 92 I t 40-90 9.3 82 Lt 90-I 90 27. I B + c 190-370 20.7
r 37C.t I 0
109 119 177 528 231
46
Al Lp O- 5 1.5 5.4 Al :p 5- ,I 1.Y 7. I AB II- 20 1.9 2u.9 Bit LO- 33 1.9 28.9 B2t 33- xu 2 . 0 26.0 ls31t 80-191 1.9 20.” 832‘ 191-25h 1.8 IX.3 B+C 256-2Y2 1.x 13.9 Cloxe 292-375 (1.7) 14.2 C20X 375+ (1.7) 1 I.8
79 200 307 366 425 266 258 224 198 151
A! A” 2B2lr 2822t 2u31t Z”?.‘f
hl Al A+B 2B2 1 2HLJ 282 $ LB24 LB, HtC
o- 12 1.6 12- 53 1.6 53-140 (1.8)
140-234 (1.8) 234-310 1.8 3 io-350 1.9
li- R I.6 R- 30 1.6
30- 50 1.7 50- ,,o 1.8
/IO- 1711 1.8 170- 200 i 8 2OO- LYO 1.x LYU- 3511 1.Y 750-,““ii 1.9
16.5 484 22.7 h26 43.3 991 55.8 761 42.9 300 55.2 280
IL.5 486 i4.G 512 30.7 585 52 9 1181 46.9 528 39.2 465 45.9 2x1 44.x 311
2BJ I 3x-75u 1.7 26.5 4CI r,x 7 5O- 1 OO(1 1.6 18.9
192
148
Another possible factor affecting y at a specific site would be decrease of soil permeability or infiltration capacity through time. Development of a near surface argiiiic horizon, such as those observed in the Turiock Lake Formation and China Hat Gravel Member (Fig. 4), could impede infiltration of rainwater and of “Be in solution into the upland soium. Surface runoff would then carry dissolved or complexed “‘Be downslope. We have no measurements of downslope soil profiles or surface runoff from which we can evaluate this possi- bility, but it is possible that surface transport in solution prior to infiltration into the soil would decrease q at a specific site and, therefore, the measured inventory.
4.3 Clay translocation
Removal of “Be from the sampled solum by clay transiocation is also possible. Clay translocation ap- pears to be an important process in the soils older than 100 ka. For example, on the China Hat terrace clay maxima are less distinct in those soils and the clay is distributed through thicker profiles than in the younger soils. Figure 6 shows “Be plotted against percent clay/ horizon depth. The correlation shown by these plots suggests that “Be distribution may have a first order dependence on clay transiocation. However, total clay mass/volume increases through time. It does not ap-

“Be in California soils
Table 2 Surface concentration measur d and cortected inventories, and calculated inventories of l%B, in terrace soils.
1733
Terrace (1) Surface Measured
Concentration Inventory
(yr)
Ml2 4x 10⁴
R9 1.4 x 10⁵ 2 6 x IO5
RlO 1.4 x 10⁵ 2.6 x lo5
T6 6 x IO5
Tll 6 x lo5
cli1+ 1.8 x b 06 CH4 3 x 10
cw+ 1.8 x O6 CH4 3 x 10 b
( 106mg-l ) (10’1 cm-2)
118 0.74
195 2.04
269 I.81
109 2.05
79 1.86
484 5.87
486 5.25
(2) Corrected Inventory
(IO” cm-2)
0:31 b
0.44
1.27 1.49 1.31 1.52
1.05 1.27 1.09 1.30
1.48 1.65
1.35 1 51
5.04 5.28 5.39 5.53
4.43 4.67 4.78 4.92
(3) Calculated (4) Calculated (5) T Inventory Inventory (cm)
0.21 0.19
0.71 0.63 1.27 1.13
0.71 0.60 1.27 1.08
2.72 2.55
2 72 2.60
6.35 4.58 a.44 6.08
6.35 4.57 8.44 6 07
a
35
35
122
122
450
Explanation _
450
(1)
(2)
(3)
(4)
(5)
This is the cO”ce”tratiO” of lo Be in the uppermost horizon n& each of the sola. This value. m, is used in equarion (2) to calculate the mass/area-time of Be removed from the soil by erosion.
This inventory is calculated by subtracting the concentration of “Be in modern alluvium (ML,, Table I) in atom/gm from each horizon a” re-calculating the sum. Column 2 uses 110 x lo6 atom/g in modern alluvium, column a uses 78 x 10 % atom/p in modern alluvium.
This inventory is calculated from eq. (1)
This inventory is calculated from eq. (2) assuming a” erosion rate. E, of 3 x lO-4 gm/cm-2 yr-‘, and surface concentrations m give” in this table
This is the calculated thickness of erosion from the surface assuming 3 x 1O-4 wlcm-2 yr-’ and a bulk density of 1.6 for the eroding horizon.
pear, therefore, that most of the clay produced in the solum is being lost at a significant rate by translocation below the sampled depth. Unless a significant fraction of clay is lost from the profiles by translocation, this is probably not an important mechanism of loss of “Be in the older profiles.
71
I EXPLANATION
6 + Corrected observed inventory form T&la II
5 l Calculated inventory from eq. 2. E-3 x10⁴gmcm-2yr.’
4!- o Calculated inventory from eq. 2, E=l x1040mcm-2vr~i
3
2
1
0 104 105
TERRACE AGE, YEARS
FIG. 5. Graph showing comparison of corrected measured inventory (crosses) with inventory calculated from Eqn. 2 (open and solid circles). Data are presented in Table 2. N, the inventory in atoms X 10” cme2, is plotted against terrace ages in years.
4.4 Solution loss of “Be
The plausibility of erosion reducing the inventories as calculated in Eqn. 2 can be questioned for two rea- sons: a) an erosion rate is picked to fit the oldest site, and b) the geomorphology of the China Hat surface suggests little erosion. Thus, a possible explanation for the low measured inventory in the soils of the Turlock Lake Formation and China Hat Gravel Member based on Eqn. 1 is that some “Be has passed through the solum in solution. However, a simple calculation sug-
All horizorqe
. Tll 0 I I 0 0.1 0.2 0.3 0.4
CLAY MASS (gm/cm2) PER HORIZON
HORIZON DEPTH (cm)
FIG. 6. Distribution of loBe vs. (clay mass @m/cm’) per soil horizon/horizon depth) for sites R9 and T 11. Except for the Al 1 horizons of each pedon, the data points fall close to linear trends.

1734 M. J. Pavich et al.
gests little “Be loss in soh~tion based on the high soil to water distribution coefficients, K = 105, measur&d by ROBBINS and EADIE (1982) and NYFFELER et al.
( 1984) in various soil-like materials. If we assume that rainfall passes through the soil
with no loss by evapotranspiration, then for 50 cm/yr rainfall, 3 X 10’ cm3 of solution will pass through the 300 cm column in the 600 ka residence time of the Turlock Lake Formation. Without evapotranspiration this leads to a maximum volume ratio of solution to soil of 1 OS. Given a soil to water distribution coefficient of 105, all of the “Be obtained from the rain should be found in the column.
One can also estimate the velocity at which “Be descends the soil column and the time required to ob- serve breakthrough of the solute. Assuming a constant value of K, we use an equation from FREEZE and CHERRY (1979, their Eqn. 9.14):
v/v, = 1 + Kpftt (3)
where v is the average velocity of the water, v, the ve- locity of the “Be concentration half-value point, p the bulk density, and n the porosity. Given a typical density and porosity, p/n can be taken as approximately 5. For o of 1 m/yr this gives V, of about 2 X 10d6 m/yr, a value that does not allow significant removal by so- lution passing downward through the soil column.
Breakthrough of the “%e contained in the soil col- umn is also not needed to explain the China Hat in- ventory, especially if erosion has reduced the China Hat inventory. Making the same assumptions as above, one calculates about the same ratio of solution input to soil volume of 10’. Invoking breakthrough at both the Turlock Lake and China Hat soils requires assum- ing a maximum K of 1 O4 in the Turlock Lake profiles. Although we cannot rule out d&rent K’s at sites of different age, the similar inventories of sites of the same age (e.g. R9-RlO, T6-Tl l) suggest that K’s are similar for different sites of the same age.
5.0 SUMMARY
Our results indicate that “Be is retained in the clay rich soils studied here and that this isotope has a res- idence time of at least 100 ka. These measurements taken together with the earlier results from a 15 m core from the Appalachian Piedmont (PAVICH et al., 1985) and our earlier soil study (PAVICH el al., 1984) suggest that except for loss through erosion most of the “%z that is incident on a clay-rich soil is retained in the top few meters and decays there. The measurements pre- sented here support the hypothesis of high ‘%e reten- tion in clay-rich soils.
Clearly, the interpretation of loBe inventories beyond 200 ka terrace ages is uncertain. However, the agree- ment of the accumulation, decay and erosion model with the data is encouraging when one considers the uncertainties present. By selecting uniform values for the initially inherited “Be, the average deposition rate of “Be and the average erosion rate, we can approxi-
mate the measured inventories for all sites except T6 and Tl 1. Thus, “%e inventories correspond to inde- pendently determined ages of sedimentary parent ma- terials (e.g. terrace sediments) in those sites which are not severely eroded.
For older soils, our erosion estimates are uncertain. These erosion estimates must be evaluated by some independent method. If information about paleocli- matic variation, runoff, and/or overland flow is not available, then sites older than 200 ka cannot be eval- uated. This constrains the method to relatively young sites, but not because of high mobility of Be in soil solution as suggested by MONAGHAN et al. (1983).
We cannot rule out some depletion of the soil in- ventories as some “Be slowly migrates downward on translocated clay and in solution. However, absence or loss of loBe is apparently due primarily to the com- bination of radioactive decay, erosion and possibly runoff. In areas without erosionally resistant soils, the effective use of %e as a chronometer may be restricted to soils younger than 200 ka. Even in younger soils. care must be taken to: select soil orders (e.g. Alfisol or Ultisol) in which clay minerals accumulate; sample to a depth sufficient to inventory the solum and the parent material; and have stratigraphic or other methods for age comparison or estimation.
Acknowledgements-We thank Mark Monaghan, David De- thier, Elliot Spiker and Rod ArkIey for their perceptive and helpful reviews. We also are indebted to Harry White of the Tandem Accelerator Lab for his help with the analyses.
Editorial handling: R. A. Schmitt
REFERENCES
ARKLEY R. J. (1962) Soil survey oj’Merced urea C’alU&rnia: U.S.D.A. SoilSurvey, 1950 (7), 131 p.
AXELROD D. I. (1980) Contributions to the Neogene Paleo- botany of’central Cal$xxiu. Univ. California Publ. Geo- logical Sciences. 121, 212 p.
BROWN L. ( 1984) Application of accelerator mass spectrom- etry. Ann. Rev. Earth Planet. Sci. 12, 39-59.
BROWN L., SACKS I. S., TERA F. and MIDDLETON R. (198 1) Beryllium- 10 in continental sediments. Earth Planet. Sri. Lett. 55,370-376.
BUSACCA A. J. (1982) Geologic history and soil development, northeastern Sacramento Valley, California. Ph.D. disser- tation, University of California, Davis, 348 p.
BLMCCA A. J., SINGER M. J. and VEROSUB K. L. (1986) Late Cenozoic strati8raphy of the Feather and Yuba Rivers Area California. U.S. Geological Survey Bulletin (in press).
DALRYMPLE G. B. (1980) K-Ar ages of the Friant Pumice Member of the Turlock Lake Formation the Bishop Tuff and the tuff of the Reds Meadow, central California. Iso- chron West 28,3-4.
FREEZE R. A. and CHERRY J. A. (1979) Groundwarer. Pren- tice-Hall, 604 p.
HARDEN J. W. ( 1982) A quantitative index of soil development from field descriptions. Examples frem a chronosequence in central C&for&a. Geoderma 28, 1-28.
HARDEN J. W. (1986) Soil devetaped in @&tic alluvium near Me& California. In A Series of Soil Chrunose- quences in th; Western United States. U.S. Geological Sur- vey, Bulletin series 1590, Chapter A (in press).
HARDEN J. W. and MARCMND D. F. (1977) The soil chron- oscquence of the Merced River area. In Soil Development

‘%e in California soils 1735
Geomorphology and Cenozoic History of the Northeastern San Joaquin Valley and Adjacent Areas (ed. M. J. SINGER), DD. 22-38. Guidebook for ioint SCS-GSA Field Tti~.
H&IER N. K. (1981) Amoun; and timing of Late Cenozoic uplift and tilt of the Central Sierra Nevada, Califomia- Evidence from the upper San Joaquin River basin. U.S. Geological Survey Professional Paper 1197, 54 p.
JANDA R. J. (1966) Pleistocene history and hydrology of tbe upper San Joaquin River, California. Ph.D. dissertation, University of California, Berkeley, 425 p.
KLEIN, JEFFREY, MIDDLETON, ROY and TANG, HONGQING (1982) Modifications of an FN Tandem for ouantitative “Be measurement. Nuclear Instruments and Methods 193, 601-616.
MARCHAND D. F. and ALLWARDT A. (198 1) Late Cenozoic Stratigraphic Units in Northeastern San Joaquin Valley, California. U.S. Geological Survev Bulletin 1470. 70 o.
MONAGHAN M. C., KRIS~NASWAMI s. and THOMASJ. (1982) Be- 10 in soil profiles from California (abstr.). EOS 63,324.
MONAGHAN M. C., KRISHNASWAMI S. and THOMAS J. (1983) “Be concentration and long-term fate of particle-reactive nuclides in five soil profiles from California. Earth Planet. Sci. Lett. 65, 5 l-60.
NYF-FELER U. P., LI YUAN-HUI and SANTSCHI P. H. (1984)
A kinetic approach to described trace-element distribution between particles and solution in natural aquatic systems. Geochim. Cosmochim. Acta 48, 15 13-l 522.
PAV~CH M. J., BROWN L., TERA F., MIDDLETON R. and KLEIN J. (1982) Evaluation of “Be as a method for dating late Cenozoic soils (abstr.). Geol. Sot. Amer. Abstr. Prog. 14, 72.
PAV~CH M. J., BROWN L., KLEIN J. and MIDDLETON R. (1984) Beryllium-10 accumulation in a soil cbronosequence. Earth Planet. Sci. Lett. 68, 198-204; 70,445-446.
PAVICH M. J., BROUU L., VALEITE-SILVER J. N., KLEIN J. and MIDDLETON R. (1985) “Be analysis of a Quaternary weathering protile in the Virginia Piedmont. Geology 13. 39-41.
ROBBINS J. A. and EADIE B. J. (1982) Beryllium-7: a tracer of seasonal particle transport processes in Lake Michigan (abstr.). EOS 63, 957.
ROSHOLT J. N. (1980) Uranium trend dating of Quaternary sediments. U.S. Geological Survey Open-file Report 80- 1087, 34 p.
WINOGRAD I. J., SZABO B. J., COPLEN T. B., RIGGS A. C. and KOLESAR P. T. (1985) Two-million-year record of Deuterium depletion in Great Basin Ground Waters. Sci- ence 227, 5 19-522.