1 Variation in the timing of enamel formation in modern human ...
40
1 Variation in the timing of enamel formation in modern human deciduous canines M. Christopher Dean 1,2 , Louise Humphrey 1 , Alix Groom 3 , Brenna Hassett 1,4 1 Department of Earth Sciences, Centre for Human Evolution Research, Natural History Museum, Cromwell Road, London SW7 5BD, UK 2 Department of Cell and Developmental Biology, University College London, Gower Street, London, WC1E 6BT, UK 3 Bristol Bioresource Laboratories/MRC Integrative Epidemiology Unit, Population Health Sciences, Bristol Medical School, University of Bristol, Oakfield House, Oakfield Grove, Bristol, BS8 2BN 4 Institute of Archaeology, University College London, Gordon Square, London, WC1H 0PY, UK Running title: deciduous canine enamel formation Declarations of Interest: none. Author for correspondence: Christopher Dean Email: [email protected] Orcid.org/0000-0003-3783-7296 Abstract Objectives: Deciduous canines are now used increasingly in archaeological and forensic studies to establish the time of birth and as a retrospective source of trace elements incorporated into enamel before and after birth. However, data on the variability of deciduous enamel formation times are scarce. Our objectives were to use daily incremental markings to estimate daily secretion rates, the timing of prenatal, postnatal and total enamel formation and any changes in enamel coverage or prism and stria orientation that occur during enamel formation. Materials and Methods: Longitudinal ground sections of 81 deciduous canines were studied with transmitted light microscopy. High-resolution digital images were imported from an Olympus VS-120 virtual slide scanning system into a geographic information system (ArcGIS, ESRI USA) for quantitative and statistical analyses of linear, angular and area measurements of buccal enamel. Results: Daily rates of enamel secretion close to the EDJ were faster than in permanent enamel (3.23 µm/day, SD=0.54). Prism and stria angles subtended to the EDJ both increased through crown formation. Enamel coverage was low in the cusp and cervix but maximal ~150 days after birth. The mean prenatal enamel formation time was 118 days (range 60-150, SD, 29.2, n=24). The overall mean postnatal enamel formation time was 319 days (range 210-420, SD 50.6, n=67). Conclusions: Daily enamel secretion rates compared well with previous studies of deciduous enamel, however, enamel extension rates in deciduous cuspal enamel
-
Upload
khangminh22 -
Category
Documents
-
view
1 -
download
0
Transcript of 1 Variation in the timing of enamel formation in modern human ...

1
Variation in the timing of enamel formation in modern human deciduous canines M. Christopher Dean1,2, Louise Humphrey1, Alix Groom3, Brenna Hassett1,4
1Department of Earth Sciences, Centre for Human Evolution Research, Natural History Museum, Cromwell Road, London SW7 5BD, UK
2Department of Cell and Developmental Biology, University College London, Gower Street, London, WC1E 6BT, UK 3Bristol Bioresource Laboratories/MRC Integrative Epidemiology Unit, Population Health Sciences, Bristol Medical School, University of Bristol, Oakfield House, Oakfield Grove, Bristol, BS8 2BN 4Institute of Archaeology, University College London, Gordon Square, London, WC1H 0PY, UK Running title: deciduous canine enamel formation
Declarations of Interest: none.
Author for correspondence: Christopher Dean Email: [email protected] Orcid.org/0000-0003-3783-7296 Abstract Objectives: Deciduous canines are now used increasingly in archaeological and forensic studies to establish the time of birth and as a retrospective source of trace elements incorporated into enamel before and after birth. However, data on the variability of deciduous enamel formation times are scarce. Our objectives were to use daily incremental markings to estimate daily secretion rates, the timing of prenatal, postnatal and total enamel formation and any changes in enamel coverage or prism and stria orientation that occur during enamel formation. Materials and Methods: Longitudinal ground sections of 81 deciduous canines were studied with transmitted light microscopy. High-resolution digital images were imported from an Olympus VS-120 virtual slide scanning system into a geographic information system (ArcGIS, ESRI USA) for quantitative and statistical analyses of linear, angular and area measurements of buccal enamel. Results: Daily rates of enamel secretion close to the EDJ were faster than in permanent enamel (3.23 µm/day, SD=0.54). Prism and stria angles subtended to the EDJ both increased through crown formation. Enamel coverage was low in the cusp and cervix but maximal ~150 days after birth. The mean prenatal enamel formation time was 118 days (range 60-150, SD, 29.2, n=24). The overall mean postnatal enamel formation time was 319 days (range 210-420, SD 50.6, n=67). Conclusions: Daily enamel secretion rates compared well with previous studies of deciduous enamel, however, enamel extension rates in deciduous cuspal enamel

2
were notably lower. The variability of both prenatal and postnatal deciduous enamel formation times was greater than previously reported. Keywords: Deciduous canine: ALSPAC: Enamel secretion rate: Enamel extension rate: Prenatal enamel: Deciduous crown formation. Highlights
• Deciduous enamel secretion rates within 100 µm of the EDJ were 3.23 µm/d (SD=0.54)
• Both prism and stria angle to the EDJ increased gradually from cusp to cervix
• Extension rates reduced from ~20 to 10-13 µm/d by 60 days after birth
• Area of enamel formed began slowly, rose to a maximum, then fell back at the
cervix
• Enamel formation time was variable: Prenatal 60-150 days: Postnatal 210-420 days
1. Introduction
The chronology of modern human deciduous tooth development, and the variability of key developmental stages of crown and root growth, are less well represented in the literature than those of permanent teeth. This study was designed to provide additional data for a large sample of deciduous canines. A number of things complicate data collection in infants including detecting the time of prenatal initiation of mineralisation, variation in gestation length and the limited ability, for ethical reasons, to take radiographs of young children of known age. Birch & Dean (2014), in a histological study of deciduous tooth formation, have reviewed some of the issues and difficulties of establishing both a biological age and a chronological age in living individuals, as well as in an archaeological and forensic context.
Interest in the developing deciduous dentition is wide-ranging. Some studies have focussed on normal tooth tissue proportions and developmental gradients of tooth size (Liversidge & Molleson, 1999; Mahoney, 2010, 2013, 2019) or on the effects of pathology on these tissue proportions as determined from histological sections of deciduous teeth (Keinan, Smith & Zilberman, 2006; Keinan, Smith & Zilberman, 2007; Hershkovitz, Shirley, Cohen & Zilberman, 2019). Other studies have presented data for the timing and pattern of deciduous tooth mineralisation before and/or after birth (Logan & Kronfeld, 1933; Lunt & Law, 1974; Sunderland, Smith & Sunderland, 1987; Liversidge & Molleson, 2004; Mahoney, 2011, 2012, 2013, 2015; Birch & Dean, 2014). Many histological studies have explored factors that influence the thickness and morphology of the neonatal line (NNL) that are presumed to be related to the stress and timing of the birth process and/or of the prenatal environment (Jakobsen, 1975; Norén, Grahnen & Magnusson, 1978; Zanolli, Bondioli, Manni, Rossi & Macchiarelli, 2011; Żądzińska, Kurek, Borowska-Struginska, Lorkiewicz, Rosset & Sitek, 2013; Hurnanen, Visnapuu, Sillanpää, Löyttyniemi & Rautava, 2016;

3
Hurnanen, Sillanpää, Mattila, Löyttyniemi, Witzel, & Rautava, 2019; Behie & Miszkiewicz, 2019; Hassett, Dean, Ness, Atkinson, Ring & Humphrey, 2020). In a palaeoanthropological, archaeological and a forensic context, the timing of birth and age at death of individuals is important, so the NNL and the incremental growth markings in enamel have been widely employed to estimate these (Macchiarelli & Bondioli, 2000; FitzGerald & Hillson, 2009; Hillson, 2014; Witzel, 2014; Nava, Frayer & Bondioli, 2019). More recently, the chemistry of modern human deciduous tooth enamel has been recognised as containing an archive of pre- and postnatal events such as nursing history and stress-related events (Humphrey, 2014; Humphrey, Dean & Jeffries, 2007; Humphrey, Dean, Jeffries & Penn, 2008; Müller, Nava, Evans, Rossi, Alt & Bondioli, 2019). This has renewed interest in the chronology of enamel formation in deciduous teeth and has also drawn attention to how little histological data exist for enamel formation times in modern human deciduous teeth compared with permanent teeth. Hassett, Humphrey & Dean (2017), Hurnanen, Sillanpää, Mattila, Löyttyniemi, Witzel & Rautava (2019) and Hassett, Dean, Ness, Atkinson, Ring & Humphrey (2020) have singled out the deciduous canine as a useful and reliable tooth for study as it contains a NNL positioned entirely within the cuspal enamel without emerging at the enamel surface and one that shows the most consistent NNL morphology, perhaps because compared with other deciduous tooth types, it may be least affected by any transient cessation of ameloblast function at birth (Hurnanen, Sillanpää, Mattila, Löyttyniemi, Witzel & Rautava, 2019). Besides this, the deciduous canine has, together with the second deciduous molar, the longest post-natal enamel formation period (Liversidge & Molleson, 2004) and so potentially contains a relatively long chronological record of developmental events. Given the increasing usefulness of the deciduous canine, one aim of this study was to make histological sections of a large sample of canines and to document the variability of enamel formation times using enamel incremental markings. In particular, the spacing of daily enamel growth increments close to the EDJ together with any changes in prism and stria orientation at the EDJ and in extension rate, were used to map the amount/area of buccal enamel formed pre- and postnatally and to provide data for variation in the total pre- and postnatal buccal enamel formation times. Shellis (1984, 1998) has also drawn attention to the pattern of enamel formation in deciduous teeth compared with permanent teeth. The rate at which enamel extends along the enamel dentine junction (EDJ) over the crown (the extension rate) varies considerably both within and between tooth types. Shellis (1998) suggested a gradient in extension rates, from fast rates in the cusp to slower rates cervically, is less marked, or even absent, in some faster growing teeth. Moreover, variation in prism outline, or shape, and the degree to which pattern 3 prisms have an open or closed outline, has been postulated to result from differences in extension rate (Shellis, 1998). This so-called ‘stretch-effect’ may also influence both normal long-period stria of Retzius expression as well as disruptions, or accentuations, in enamel formation that are used as a measure of stress occurring during enamel formation. Extension rates can be estimated in several ways and a second aim of this study was to document sequential changes in each of the major component variables that reflect enamel extension rate. These include prism angle and stria angle to the EDJ as well as the daily rate of enamel formation close to the EDJ.

4
A further aim was to present a practical method whereby the timing of deciduous enamel formation can be estimated histologically even when daily incremental markings are not well preserved. Worn teeth are a particular problem when early enamel formation is lost to different degrees across samples of deciduous teeth available for study. The methods presented here centre on birth and the neonatal line (NNL) and calculate times back into prenatal enamel as far as possible as well as onwards beyond birth into postnatal enamel rather than focusing on the initiation of mineralisation at the dentine horn as representing zero days formation time. This approach was designed to generate data that will be a useful comparator for the kind of data that can be collected from variously worn deciduous canines in a forensic, archaeological and/or palaeoanthropological context. 2. Materials The Avon Longitudinal Study of Parents and Children (ALSPAC), is a prospective observational cohort study that investigates influences on health and development across the life course (Boyd et. al. 2013; Fraser et al. 2013). Parents who enrolled in this study, with expected delivery dates between 1st April 1991 and 31st December 1992, subsequently collected naturally shed deciduous teeth from each child during the period 1997 to 2004. Ethical approval for the study was obtained from the ALSPAC Ethics and Law Committee and the Local Research Ethics Committees. Consent for biological samples was collected in accordance with the Human Tissue Act (2004). While all deciduous tooth types are represented in this collection, canines are represented by a large number of teeth that are generally less worn than other tooth types. They also have a relatively long enamel formation time and have thicker enamel than deciduous incisor teeth and deciduous first molars making it easier to visualise some histological features. Excessively worn, carious or damaged teeth were excluded from this study. From an original sample of 81 deciduous canines representing 71 individuals, all were included for measurements of daily cross striation spacing. Antimeres from the same individual were excluded from subsequent analyses and the remaining sample comprised 35 mandibular and 32 maxillary canines. Enamel was minimally worn in 8 teeth but the dentine horn (and so initiation of mineralisation) was preserved in 24 teeth. Cervical enamel was preserved complete to the end of enamel formation on the buccal aspect in 67 teeth. 3. Methods 3.1 Histological methods Teeth collected during this study were initially stored at -20oC before being released for analysis. Prior to sectioning, a replica of the crown of each tooth was made using a high-resolution addition curing silicone dental impression material (Coltène President) which was then cast in epoxy resin and archived for future reference. Each tooth was also micro-CT scanned for future analysis. A longitudinal plane of section was defined and drawn in pencil on each tooth crown that passed, as far as could be judged from CT scans and external morphology, both through the tip of the dentine horn and the lowest part of the buccal enamel cervical margin. A thin layer of cyanoacrylate cement was applied to the enamel surface along this plane of section, as well as within the pulp chamber, to support any dried, brittle or cracked enamel or

5
dentine during the cutting process. Following application of this cement layer, teeth were left at least 2 days for it to completely dry and harden before sectioning. Teeth were sectioned longitudinally through this buccolingual axial plane with a low speed diamond saw (Buehler IsoMet). The blade was aligned to pass just to one side of the true defined longitudinal buccolingual axial plane by a blade thickness (~300 µm). The cut face containing the dentine horn was then polished using a graded series of abrasive papers and finished with 3 µm aluminium polishing powder and deionised water on a polishing pad. This polished surface was cleaned in an ultrasonic bath, dried and then fixed to a 1 mm thick glass slide with zero-bond epoxy resin (Huntsman Araldite 2020) under pressure for 48 hours. A further cut was then made parallel with the glass slide and tooth block leaving a 300-400 µm thick longitudinal tooth section (containing the tip of the dentine horn) and a small thickness of epoxy bond attached to the slide. Each section was then ground and lapped to between 80-100 µm proud of the glass slide surface and polished. The sections were dehydrated through a graded series of alcohol baths, cleared in xylene and coverslips placed with either glycerine, as a semi-permanent procedure to enable transmitted light microscopy pending future laser ablation analysis of the enamel, or eventually more permanently with DPX (distyrene, phthalate plasticizer and xylene). Routine transmitted light microscopy was performed with an Olympus VS-120 virtual slide scanning system using x2, x20, and x40 objective lenses under polarized light. High-resolution digital images generated by this slide scanning system were then imported with their spatial coordinates intact into a geographic information system, where measurements of cross striations and other histological features were digitised (ArcGIS, ESRI USA). Quantitative and statistical modelling of the linear and angular variables, as well as measurements of area made of the monthly time zones of each chronological enamel map, were carried out in the R base package (R Core Team, 2015) with the spatial database built and subsequent spatial analyses carried out in rgeos (Bivand & Rundel, 2019) and rgdal (Bivand, Keitt & Rowlingson, 2019) packages. 3.2 Histological data collection and cross striation spacings The methods employed here for estimating the timing of deciduous enamel formation follow those first described for deciduous teeth in Birch & Dean (2013, Figure 3 and text), which in turn are derived from previous methods described for permanent enamel (Boyde, 1963; Risnes, 1986; Dean, 1998; Dean 2012; Guatelli Steinberg, Floyd, Dean & Reid, 2012; Dean & Cole, 2013). A zone of buccal enamel 100 µm wide from the enamel dentine junction (EDJ) was identified in each tooth section extending as a ‘band’ from the dentine horn to the enamel cervix. In so doing the total thickness of enamel present in each region of the crown was disregarded. Wherever possible, in each section, between the dentine horn and the cervix, daily enamel cross striations were identified within this 100 µm wide zone. The spacing, or length, across a continuous series of 5 or more daily cross striations was measured and divided by the number of daily increments included in the measurement to give a mean value of the daily enamel secretion rate. Measurements were repeated across the 100 µm zone along the whole length of the crown to ensure an equal distribution of mean rates representative of those close to the EDJ, in the mid-zone region and
6
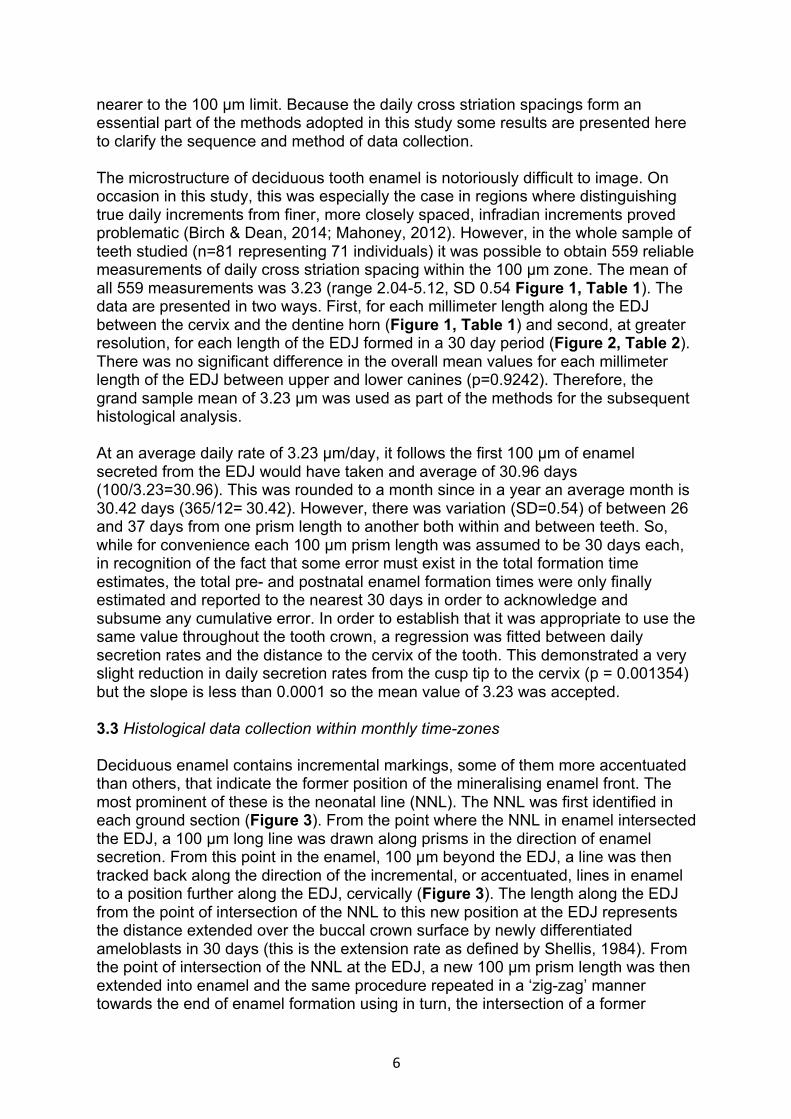
nearer to the 100 µm limit. Because the daily cross striation spacings form an essential part of the methods adopted in this study some results are presented here to clarify the sequence and method of data collection. The microstructure of deciduous tooth enamel is notoriously difficult to image. On occasion in this study, this was especially the case in regions where distinguishing true daily increments from finer, more closely spaced, infradian increments proved problematic (Birch & Dean, 2014; Mahoney, 2012). However, in the whole sample of teeth studied (n=81 representing 71 individuals) it was possible to obtain 559 reliable measurements of daily cross striation spacing within the 100 µm zone. The mean of all 559 measurements was 3.23 (range 2.04-5.12, SD 0.54 Figure 1, Table 1). The data are presented in two ways. First, for each millimeter length along the EDJ between the cervix and the dentine horn (Figure 1, Table 1) and second, at greater resolution, for each length of the EDJ formed in a 30 day period (Figure 2, Table 2). There was no significant difference in the overall mean values for each millimeter length of the EDJ between upper and lower canines (p=0.9242). Therefore, the grand sample mean of 3.23 µm was used as part of the methods for the subsequent histological analysis. At an average daily rate of 3.23 µm/day, it follows the first 100 µm of enamel secreted from the EDJ would have taken and average of 30.96 days (100/3.23=30.96). This was rounded to a month since in a year an average month is 30.42 days (365/12= 30.42). However, there was variation (SD=0.54) of between 26 and 37 days from one prism length to another both within and between teeth. So, while for convenience each 100 µm prism length was assumed to be 30 days each, in recognition of the fact that some error must exist in the total formation time estimates, the total pre- and postnatal enamel formation times were only finally estimated and reported to the nearest 30 days in order to acknowledge and subsume any cumulative error. In order to establish that it was appropriate to use the same value throughout the tooth crown, a regression was fitted between daily secretion rates and the distance to the cervix of the tooth. This demonstrated a very slight reduction in daily secretion rates from the cusp tip to the cervix (p = 0.001354) but the slope is less than 0.0001 so the mean value of 3.23 was accepted. 3.3 Histological data collection within monthly time-zones Deciduous enamel contains incremental markings, some of them more accentuated than others, that indicate the former position of the mineralising enamel front. The most prominent of these is the neonatal line (NNL). The NNL was first identified in each ground section (Figure 3). From the point where the NNL in enamel intersected the EDJ, a 100 µm long line was drawn along prisms in the direction of enamel secretion. From this point in the enamel, 100 µm beyond the EDJ, a line was then tracked back along the direction of the incremental, or accentuated, lines in enamel to a position further along the EDJ, cervically (Figure 3). The length along the EDJ from the point of intersection of the NNL to this new position at the EDJ represents the distance extended over the buccal crown surface by newly differentiated ameloblasts in 30 days (this is the extension rate as defined by Shellis, 1984). From the point of intersection of the NNL at the EDJ, a new 100 µm prism length was then extended into enamel and the same procedure repeated in a ‘zig-zag’ manner towards the end of enamel formation using in turn, the intersection of a former

7
forming front (accentuated marking) at the EDJ and a new 100 µm prism length each time (Figure 3). Finally, this procedure was repeated back along the EDJ into cuspal prenatal enamel away from the NNL towards the cusp, to a position as close to the dentine horn as possible. Figure 3 illustrates this procedure. In this way the NNL always represented birth or zero days. Sequential variables of enamel formation measured before birth were then assigned a negative number of days (e.g. -30 days) and those after birth a positive value (e.g. +30 days). Each of the incremental, or on occasions accentuated, lines or striae associated with the 30 day increments was then traced onwards and outwards through the enamel in turn, as far towards the cuspal enamel as possible (Figure 3). In worn teeth these cuspal increments only reached the worn occlusal edge. In unworn teeth they continued over the dentine horn within the cuspal enamel. In lateral enamel the monthly growth increments intersected, or cropped out, at the enamel surface in the same way perikymata do. In this way the enamel was mapped out into incremental growth bands that correspond to the way buccal enamel was laid down during enamel development (Figure 3). At each 30 day interval along the EDJ seven further measurements and observations were made in order to document variation in each and to track any changes in occurring throughout the period of enamel formation. These include: 1, the average spacing between enamel cross striations, i.e. the daily rate of enamel secretion; 2, the angle prisms make to the EDJ; 3, the angle incremental, or accentuated, striae make to the EDJ during the first 300 µm of enamel formation; 4, the enamel extension rate; 5, the area of enamel covered or formed in each successive 30 day incremental band or zone; 6, the prenatal enamel formation time; and 7, the postnatal enamel formation time. Apart from the measurements of daily cross striations, that were digitized directly from micrographs, all other angular and area measurements were were carried out in the R base package (R Core Team, 2015) with the spatial database built and subsequent spatial analyses carried out in rgeos (Bivand & Rundel, 2019) and rgdal (Bivand, Keitt & Rowlingson, 2019) packages. Angles were measured between a line representing the EDJ drawn 300 µm cuspally along the EDJ, and its intersection with a prism or stria line drawn 300 µm out from the EDJ. This was implemented in the R package LearnGeom (Briz-Redón, & Serrano-Aroca, 2018). Prenatal enamel formation times were equal to the sum of the 30 day prism lengths contained along the EDJ between the dentine horn and the NNL. Postnatal enamel formation times were equal to the sum of the 30 day prism lengths contained between the NNL and the enamel cervix. Total enamel formation times were equal to the sum of pre- and postnatal enamel formation times. The degree of preservation of each of the teeth included in this study was different. In 8 teeth the enamel over the dentine horn was either unworn or minimally worn. In 24 teeth the dentine horn was intact and unworn. In 67 teeth the cervical enamel was intact and the plane of section judged to pass through the lowest point on the cervical margin. Accordingly, the results are presented for different sample sizes of teeth depending on the variable measured and the numbers of teeth that preserve each variable. Only the results for formation times are split by upper and lower deciduous canines.

8
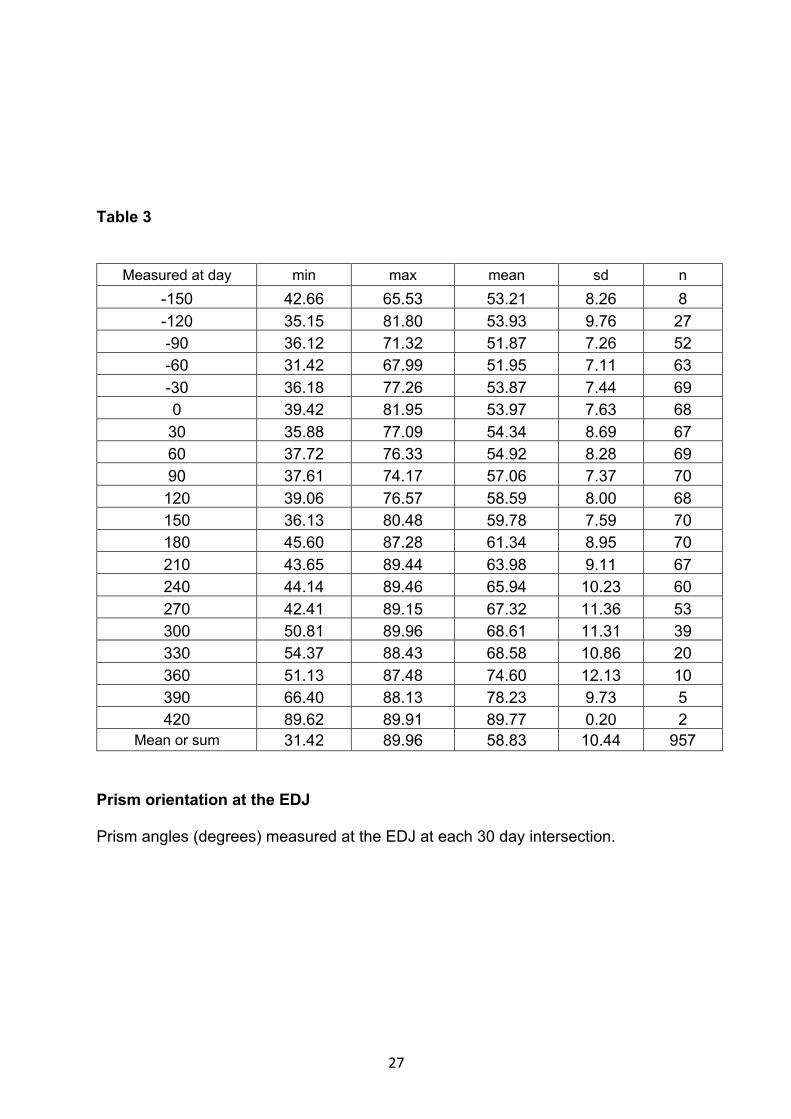
4. Results There were no significant differences (linear regression, p=0.9242) between the mean values for daily enamel cross striation spacings (secretion rates) within 100 µm from the EDJ calculated at 1 mm intervals of EDJ length between upper and lower deciduous canines (Table 1). Data for the mean values of cross striation spacings for each 30 day increment, or segment, of growth extended along the EDJ are presented in Figure 2. The mean of all upper and lower cross striation spacings was 3.23 µm. The sample statistics for daily cross striation spacings within each monthly increment of enamel formation within 100 µm of the EDJ appear in Table 2 and remain more or less constant through crown formation. Figure 4 illustrates the changing prism angle at the EDJ. Table 3 gives the sample statistics for this angle at each monthly increment of enamel growth along the EDJ. Prism angles rose from ~50 degrees in the cuspal region at around -150 days prenatally, to values between 70 and 90 degrees cervically at ages greater than 360 days postnatally. Similarly, Figure 5 and Table 4 illustrate how the stria orientation to the EDJ approximately doubles from ~5-10 degrees in the cuspal region at around -150 days prenatally to between 20 and 25 degrees cervically at ages greater than ~300 days postnatally. Enamel extension rates start higher in the cusp (~20 µm/day) and reduce to lower mean values between 12 and 13 µm/day in the lateral enamel by 60 to 90 days after birth (Figure 6, Table 5). Not all teeth in the sample, however, preserve the cuspal enamel. Neither do all estimates of extension rate made in this study reach precisely as far as the dentine horn tip, even when it is preserved unworn. It follows that extension rate values presented here for ages prior to -60 days prenatally may not all represent the actual maximum values that were present in the cuspal enamel of some teeth. Extension rates define the rate at which newly differentiated secretory ameloblasts begin to form enamel along the EDJ. This rate is fast in the cuspal enamel but then quickly slows. However, it is the rate of enamel secretion that determines the thickness of enamel formed in a given time. Rates of enamel secretion are slower close to the EDJ and faster in later forming enamel so that regular incremental markings usually diverge as they are traced between the EDJ and the enamel surface. In this study the area of enamel secreted in each monthly zone of enamel between the EDJ to the enamel surface was taken as a proxy for the cumulative sum of the secretory output of the ameloblast sheet active during each monthly time zone of enamel formation. Because cuspal enamel was considered a potentially important component of this area measurement, data for both unworn and minimally worn teeth are presented separately and compared. In Table 6, area is presented in µm2
but for clarity, units of area are presented as µm2/100 on the ‘y’ axis of Figures 7 & 8. The larger sample is comprised of all teeth where the dentine horn and cervix are preserved unworn and undamaged and there are no hypoplastic defects affecting enamel area (n = 22; Figure 7). The smaller sample (n=8) consists only of teeth with minimal enamel wear (Figure 8). However, only the sample statistics for the larger sample are given in Table 6. In both box plots (Figures 7, 8) the trend is nonetheless surprisingly similar, suggesting that cuspal enamel wear has little

9
influence on this 2D measure of enamel area formed over time. Low initial values rise to a maximum around 150 days after birth and then fall back to low values towards the end of enamel formation at the cervix. Figures 7 & 8 show that the area of enamel formed between the EDJ and the surface enamel, that peaks when the secretory ameloblast sheet is longest, overwhelms the effect of a high extension rates in the cusp and lower extension rates towards the cervix. In 23 teeth where both the dentine horn and the enamel cervix were complete it was possible to estimate the prenatal, postnatal and total enamel formation time (Table 7). The prenatal enamel formation time equals the time taken to form enamel between the initiation of mineralisation of the tooth and birth indicated by the NNL. Postnatal enamel formation time was that formed between the NNL and the completed buccal enamel cervix. The mean prenatal enamel formation time in n=23 teeth was 116 days (range 60 to 150, SD, 29.04) and the mean postnatal enamel formation time in this sample of 23 teeth was 334 days (range 210 to 420, SD 53.8). The total mean enamel formation time (the sum of pre- and postnatal enamel formation times) in these 23 teeth was 450 days (range 360-510, SD 38.4). For a larger sample of 67 teeth with both the NNL visible and the buccal enamel cervix preserved intact, it was possible to estimate the postnatal enamel formation time (Table 7). The mean time taken to form postnatal enamel in 67 teeth was 319 days (range 210-420, SD 50.6) and so almost identical to that in the smaller sample of 23 unworn teeth (Table 7). Table 8 shows the same data for enamel formation times (prenatally in the sample of 24 teeth and postnatally in the sample of 67) where both the dentine horn and the enamel cervix were complete but split by upper and lower canines, and linear regression did not reveal a marked difference in measures of crown formation. The buccal enamel of the 23 teeth with an unworn dentine horn and complete enamel cervix is illustrated in Figure 9. Prenatal enamel is coloured light blue and the NNL is indicated in red. Alternating bands of dark blue and yellow indicate 3 monthly increments of postnatal enamel formation respectively. Superimposed over the whole buccal enamel are fine dark lines representing the underlying incremental monthly segments or zones. 5. Discussion 5.1 Daily rates of enamel secretion It is now well-established that daily incremental markings in enamel (cross striations) imaged with light microscopy in ground sections of teeth can be used to reconstruct the time taken to form tooth crowns (Boyde, 1963, 1964, 1989, 1997; Bromage, 1991; Antoine, Hillson & Dean, 2009; Lacruz, Hacia, Bromage, Boyde, Lei, Xu, Miller, Paine & Snead, 2012; Zheng, Seon, Mourão, Schnell, Kim, Harada, Papagerakis & Papagerakis, 2013). Schour & Poncher (1937) were the first to present data for daily incremental rates of deciduous enamel growth in humans, which were then reviewed and reused in Massler & Schour (1946). Average daily apposition rates in deciduous enamel were reported to be identical in upper and lower teeth of the same deciduous tooth type

10
and slowed across a gradient from 8.0 µm/day in central incisors to 4.5 µm/day in second deciduous molars. In deciduous canines the average rate was reported to be 6.0 µm/day (Massler and Schour, 1946, Table 1). However, rates as fast as this have never been reported since although Shellis (1984) reported overall enamel cross striation spacings in n=15 deciduous teeth to be 4.5 ± 0.3 µm/day in inner enamel within 30 µm from the EDJ rising by 20% to 5.5 µm/day in outer enamel. FitzGerald & Hillson (2009, Table 2) also measured the overall average daily enamel secretion rate and reported it to be 3.6 µm/day in 66 assorted deciduous teeth. Only one canine was studied in which the overall average rate was 3.9 µm/day. Because a gradient in deciduous enamel formation rate exists between the EDJ and the enamel surface it is more useful to report rates in specific locations (Birch & Dean, 2009; 2013; 2014; Macchiarelli, Bondioli, Debénath, Mazurier, Tournepiche, Birch, & Dean, 2006; Mahoney, 2015). Beynon, Dean, Leakey, Reid & Walker (1998) demonstrated a gradient of occlusal enamel formation rates in a human deciduous second molar from ~4.0 to 5.75 µm/day over a period of 4 months. Nava, Bondioli, Coppa, Dean, Rossi & Zanolli (2017) have also reported a range of rates for deciduous central incisor enamel formation in an archaeological sample (n=76) from 2.7 to 5.8 µm/day with an overall mean value of 4.5 µm/day. Interestingly, they note that both the mean daily enamel secretion rate and the range were greater than in an equivalent modern sample (Birch, 2012), where the mean value was 3.33 µm/day (range 2.94 to 4.13 µm/day, n=54). More pronounced gradients, that more than double from inner to outer enamel, exist in human permanent occlusal enamel of ~2.5 to 6.5 µm/day over 16 to 18 months but with not dissimilar overall average rates to those reported for deciduous enamel of ~4.0 µm/day (Shellis, 1984; Dean, 1998; Macchiarelli, Bondioli, Debénath, Mazurier, Tournepiche, Birch & Dean, 2006). With specific reference to deciduous canine enamel there are few data to compare with this study. For a sample of 15 lower Medieval deciduous canines, Mahoney (2012) reported mean rates for inner, middle and outer thirds in occlusal enamel as 3.31, 4.09 and 4.79 µm/day respectively. The mean rate for inner enamel is slightly higher than but very similar to the mean value of 3.23 µm reported in this study. The equivalent rates in n=15 maxillary deciduous canines were slightly greater in the inner third of the enamel (3.72, 3,85, 4.39 µm/day). However, archaeological teeth may have faster rates of enamel formation than modern teeth (Aris, Mahoney, O’Hara & Deter, 2020) and a grand mean value for one third of the total enamel thickness is a considerable amount, whereas the methods employed in this study focus only on the first formed 100 µm of deciduous enamel where formation rates are slowest and where there has been shown to be least variation in rate along the EDJ (Birch & Dean, 2014; Nava, Bondioli, Coppa, Dean, Rossi & Zanolli, 2017). With this in mind, Mahoney (2015) measured daily enamel secretion rates at 25 µm intervals in a sample of recent Medieval maxillary deciduous canines. In this sample, rates rose from 3.31 to 3.94 µm/day (average 3.74 µm) over the first formed 100 µm of enamel close to the EDJ and 100 µm of enamel thickness took 26.85 days to form. While slightly faster than the grand mean rate recorded in this study it is remarkably close, especially considering a smaller sample size of n=11 teeth with just 12-14 grand mean measurements made in each 25 µm zone. In a single deciduous canine over the first 100 µm of enamel formed at the EDJ, rates of 2.8 to 3.42 µm/day were reported by FitzGerald, Saunders, Macchiarelli &

11
Bondioli (1999, Table 1) and for 10 deciduous canines a mean rate of 3.13 µm/day (range 2.78 to 3.45 µm/day) was reported within a 100 µm zone from the EDJ (Birch & Dean, 2014). Birch & Dean (2014) also made direct counts of daily cross striations through the first 100 µm of enamel in 10 deciduous canines which averaged 32 days (± 95% CIs = 29 to 36 days). In the light of these previous studies, the mean value of 3.23 µm/day reported in this study for all deciduous canines, that includes a greater number of both measurements and teeth, compares well. What does not stand out as clearly in the present study as in previous studies of deciduous occlusal enamel formation (Macchiarelli, Bondioli, Debénath, Mazurier, Tournepiche, Birch, & Dean, 2006; Birch & Dean, 2009) is a reduction in daily enamel secretion rate immediately after birth (Figure 2). A reason for this might be that younger secretory ameloblasts closer to the EDJ, where all the cross striation spacing measurements were made in this study, may be less affected than older ameloblasts further into enamel formation (Witzel, Kierdorf, Schulz & Kierdorf, 2008). Apart from the sudden physiological stress of birth, where many factors are thought to combine to cause NNL formation, there is in addition a postnatal period of weight loss and of metabolic adjustment that includes the need of the neonate to produce amino acids through autophagy, or degradation, of ‘self-proteins’ (Kuma, Hatano, Matsui, Yamomoto, Nakaya, Yoshimori, Ohsumi, Tokuhisa & Mizushima, 2004). Birch (2012) and Birch and Dean (2009) suggested that this, together with other factors, might underlie the reduction in secretory ameloblast output and the postnatal enamel hypoplasia observed during the immediate period after birth (Birch, 2012; Macchiarelli, Bondioli, Debénath, Mazurier, Tournepiche, Birch & Dean, 2006; Birch and Dean, 2009). In this study, the slight drop in mean enamel formation rate close to the EDJ over the first 30 days after birth (from 3.31 to 3.09 µm/day in this sample of deciduous canines), although not negligible, is certainly less pronounced than was reported previously for the occlusal postnatal enamel in a Neanderthal and a modern human dm2 (Macchiarelli, Bondioli, Debénath, Mazurier, Tournepiche, Birch & Dean, 2006; Birch & Dean 2009). In that study the rate fell from a mean value of 3.5 to 2.8 µm/day. This may reflect a real difference in tooth-type sensitivity to stress or alternatively, as discussed, greater resistance to stress by newly differentiated ameloblasts that are still close to the EDJ compared with mid-occlusal ameloblasts (FitzGerald & Saunders, 2005; FitzGerald, Saunders, Bondiolli, & Macchiarelli, 2006). Alternatively, it may simply result from averaging together many measurements made on larger numbers of teeth, some (or all) of which might show little or no evidence of postnatal hypoplasia at all. 5.2 Extension rates along the EDJ Deciduous teeth are known to grow faster in length than permanent teeth but how rates in the crown and root compare is not clear. Vertical growth rates of deciduous teeth estimated from measurements made of tooth germs were reported by Stack (1967) who noted rates as fast as 2 mm/month (~65 µm/day) in incisor roots. Shellis (1984) first quantified enamel extension rates histologically in both deciduous and permanent enamel using the combined slope, or angle, of the prisms to the EDJ (Angle I), the slope of the incremental lines (or striae of Retzius) to the EDJ (Angle D) and the length of a prism formed per day (‘d’). Of these variables, Shellis (1984)

12
noted that the stria angle, (Angle D), strongly influenced extension rate calculations, much more so than the prism angle (Angle I). The same trends along the EDJ towards the cervix of gradually rising prism and stria angles, as Shellis (1984) reported for all teeth, occur in the deciduous canines studied here (Figures 4, 5 and Tables 3, 4). Shellis (1984) calculated the mean value of all the average enamel extension rates in 19 deciduous teeth, including 4 canines, to be 23.8 ± 5.6 µm/day. The average value for n=14 permanent teeth was much lower (4.5 ± 0.8 µm/day), largely because the lower extension rates beyond the cusp continue on for several years. In this study (Table 5) the mean of all extension rates calculated for deciduous canines, that included all measurements made from the intact dentine horn to the intact enamel cervix, was 13.39 µm/day (ranging from a maximum of 31.5 µm/day in cuspal enamel to a minimum of 4.3 µm/day towards the cervical enamel). Shellis (1984) first reported the sudden fall in cuspal extension rates in all human permanent and deciduous teeth. Since then, Mahoney (2015) has documented very high initial extension rates in the cusp that reduce slightly across deciduous tooth types from incisors to second molars from 52.03 µm/day (di1), through 47.01 µm/day (di12), 40.05 (dc) 35.75 (dm1) and 39.97 (dm2). Nava, Bondioli, Coppa, Dean, Rossi & Zanolli, 2017) have also reported prenatal enamel extension rates in deciduous incisors of ~55 µm/day that fell to values closer to ~30 µm/day in a very short period of time. These values for prenatal deciduous central incisor enamel are the highest extension rates reported so far for modern human cuspal enamel of any kind and are in complete contrast to the cuspal extension rates reported here for deciduous canines. Interestingly, they match extension rates reported by Stack (1967) for deciduous incisor roots. It is notable that in the present study there are fewer high values for extension rates in the cuspal enamel greater than 20 µm/day. A likely reason for this is the method employed in this study where estimates of prenatal extension rate were only made every 30 days of enamel formation in increments calculated back from birth towards the dentine horn. In many cases an incomplete cuspal increment was therefore, excluded, which may have formed at the highest extension rate within that tooth. Some support for this explanation comes from comparing the second and third successive extension rate estimates made by Mahoney (2015) for cuspal enamel in 19 deciduous maxillary canines (25.43 and 21.05 µm/day respectively) that match well with the maximum extension rates estimated this study (24.55 to 27.72 µm/day prenatally). 5.3 Area of enamel formed during crown formation One aim of this study was to document the rate and timing of enamel formation in a large sample of normal healthy deciduous canines. By dividing the whole buccal enamel section into 30 day formation zones, it will now in the future be easier to identify and apportion regions of enamel hypoplasia, or clusters of accentuated stress markings, to a specific time-zone. The data presented in this study (Figures 7, 8 and Table 6) are an attempt to quantify the amount of buccal enamel secreted during each month of deciduous canine crown formation. The area of enamel formed in the tooth section during each 30 days (Figure 3, 9) is a proxy for the secretory potential of the ameloblast sheet and is a product of the length of the forming enamel front, the cumulative extension rate and the daily secretion rate. The results of this study show that length of the secretory ameloblast sheet and the rate of enamel

13
formation underlie the regular rise and fall in the quantity of enamel formed in any one zone, whereas fast or slow extension rates appear to have little effect on the overall basic pattern. Surprisingly, wear over the cusp of the tooth appears to have little effect on this pattern because, despite high extension rates, the length of the forming enamel front is quite limited in the cusp (Figures 7, 8, 9). Irrespective of extension rate pattern, the area of enamel formed is low early in crown development, it rises to a maximum at about 150 days into deciduous canine crown formation and then falls back to low values in the cervix. Future studies of stress-related accentuated incremental markings in deciduous canines may now be able to superimpose the frequency or intensity of these markings onto this basic pattern of changing ameloblast output. Massler and Schour (1946) also attempted to estimate the work, or growth, potential of ameloblasts and odontoblasts in deciduous teeth. They measured the daily amount of matrix secretion and calculated the lifespan of ameloblasts and defined growth potential as the product of rate and time. A gradient of ameloblast life span, calculated presumably in the thickest enamel over the dentine horn, ranged from 80 days in deciduous incisors through 120 day for deciduous canines, 200 days for deciduous second molars and 355 days for permanent first molars (Massler & Schour, 1946). The authors then used this concept to interpret ameloblast and odontoblast sensitivity to various pathologies giving rise to different enamel, dentine and pulp chamber morphologies. Since this time, others have suggested ameloblasts may be more or less sensitive to stress events at different times during their secretory lifespan and/or that the relative area of the ameloblast sheet at any one-time during crown formation might influence the severity or intensity of accentuated incremental striae formed within enamel (FitzGerald & Saunders, 2005; FitzGerald, Saunders, Bondiolli, & Macchiarelli, 2006; Witzel, Kierdorf, Schulz & Kierdorf, 2008). This in turn might also influence accentuated line expression between different tooth types in the same individual. Shellis (1984) used the prism angle (Angle I), stria angle (Angle D) and cross striation spacing (‘d’, or daily secretion rate) to calculate the stretch-effect across the ameloblast sheet, or secretory front, as the area of thickening enamel they cover increases the more they move away from the EDJ. Shellis (1984) found that the mean stretch function is most strongly influenced by the prism angle (Angle I) and was found to be significantly less in deciduous teeth than in permanent teeth. As a result, Shellis (1984) pointed out that a predictable consequence of this is that the ameloblast secretory area, or domain, is smaller in deciduous teeth than in permanent teeth. Changes in the stretch function, and ameloblast secretory area, as the ameloblast sheet first increases in size and then reduces again towards the cervix while prism angles steadily increase (Figures 7, 8) may be another factor that contributes to the relative sensitivity or resilience of ameloblasts to accentuated stria formation. 5.4 Prenatal and postnatal enamel formation times From the average rate of enamel formed, Shellis (1984) was able to estimate total enamel formation times, which for 4 deciduous canines was 0.73 ± 0.34 years. FitzGerald, Saunders, Bondiolli, & Macchiarelli (2006, Table 1) calculated the total deciduous canine crown formation time from counts of daily enamel increments as 255 days, 90 days of which was formed prenatally and 165 days postnatally. Birch & Dean (2013, 2014, Table 3), however, calculated longer prenatal enamel formation

14
times than these studies in 10 deciduous canines. Their estimated mean deciduous canine prenatal enamel formation time was 128 days (± 95% CIs, 121 to 135 days) with the total mean enamel formation times taking 430 days (± 95% CIs, 401 to 458 days). Larger histological studies of deciduous canines have reported data for upper (n=17) and lower (n=17) deciduous canines separately (Mahoney, 2012, Table 4) and have reported mean prenatal enamel formation times as 98 days for upper deciduous canines but with a wide range of 76 and 132 days. Mean times for lower deciduous canine prenatal formation times were 88 days, again with a wide range of 74 to 118 days. These larger ranges for prenatal enamel formation times (Mahoney, 2012) span both the previous ranges and estimates of FitzGerald, Saunders, Bondiolli, & Macchiarelli (2006) and Birch & Dean (2013; 2014). In the present study, the range of prenatal enamel formation times for both upper and lower canines combined (n=24) was even wider than reported in previous studies, 60 to 150 days, with a combined mean for upper and lower prenatal enamel formation time of 118 days (Table 7, 8). When split by 9 upper and 15 lower canines the mean lower deciduous canine prenatal enamel formation time was 114 days and the mean upper prenatal enamel formation time 123 days (Table 8), which were not significantly different (t test, p=0.4246). These mean values for prenatal enamel formation times exceed those reported by Mahoney (2012). Postnatal enamel formation times here (not usually reported separately in previous studies) ranged between 210 and 420 days in both the smaller complete EDJ sample of 23 and the larger sample of 67 teeth complete from cusp to cervix. Again, there was no significant difference (t test, p = .02076) in this study between the mean values for postnatal enamel formation times of upper and lower deciduous canines where the mean values were 310 and 327 days respectively. In the present study only 23 deciduous canines preserved both the dentine horn and the enamel cervix making it possible to calculate a total enamel formation time in each of these teeth. The mean total enamel formation time was 450 days (range 360 to 510, SD, 38.4). When the data were split by upper and lower deciduous canines there were no significant differences in the mean values of 437 and 456 days respectively (t test, p = 0.2119; Tables 7, 8).These overall mean values for total enamel formation time in deciduous canines are similar to those reported by Mahoney (2012) but in the present study the range of total formation times, while still considerable, was slightly less (360 to 480 days in upper and 360 to 510 days in lower canines). Mahoney (2012) was also able to split the total enamel formation time between upper and lower deciduous canines and these, in contrast to this study, differed slightly for 17 upper and 17 lower deciduous canines. The mean total formation time for lower canines was reported to be 443 days (range 369 to 531, SD 57) and was slightly longer for upper canines (mean 474 days, range 407 to 570, SD 51). 5.5 Initiation of mineralisation in deciduous canines There are a number of very comprehensive reviews of the extensive literature on the gestational age at initial mineralisation of the deciduous teeth (Lunt & Law, 1974; Sunderland, Smith & Sunderland, 1987; Birch, 2012; Birch and Dean, 2014). Birch and Dean (2014, Table 4) have summarised the reported ranges given in the literature for deciduous canines. These were between 15 to 24 gestational weeks for

15
upper deciduous canine initiation and 16 to 22 for lower canine initiation. The earliest age of mineralisation of the deciduous canine was reported to be 15 weeks gestational age, or ~5 months preterm (Nomata, 1964). Even given the variation that exists in preterm, term and post-term delivery times (see Skinner & Dupras, 1993), it seems unlikely, based on reviews of the literature, that deciduous canine initiation would be earlier than 150 days (5 months) before birth. Nonetheless, as many as 14 canines in the sample studied here clearly had 150 days (5 months) of prenatal enamel formed. Mahoney (2015) has calculated from ground sections of deciduous incisors that initiation was as early as 216 days before birth (mean= 176, range 90-216 days). The earliest initiation time of maxillary deciduous canines in the same study was 132 days (mean 102, range 76-132 days). This raises interesting questions about previous methods used to both age fetal material and to document the first formed mineral in deciduous tooth cusp tips (Birch, 2012) and whether histology of ground sections detects mineralisation earlier. Sunderland, Smith & Sunderland (1987) used fetal material that had been stored in 10% formalin, which may itself demineralise hard tissues, and only every 15th section from their demineralised and haematoxylin-stained serial sections were examined. Moreover, some age groups were missing and/or under-represented from their growth series. Lunt & Law (1974) also noted that deciduous canines may at times be more advanced in the mandible than in the maxilla, although they noted that the usual generalisation is that maxillary deciduous teeth mineralise ahead of mandibular teeth. In this study, no significant differences existed between the mean prenatal enamel formation times of upper and lower deciduous canines, and hence it follows their initiation times, which supports the previous findings of Sunderland, Smith & Sunderland (1987) that no differences could be identified. Certainly, there are innumerable problems in translating prenatal enamel formation times derived from histological studies such as the present study into initiation times expressed as gestational weeks (Birch, 2012). In the future, histologically derived data for dentine formed prenatally, as well as for enamel, may help to improve our understanding of precisely when deciduous teeth first begin to mineralise in utero and what the true range of variation is. What emerges from this study, and retrospectively now from previous studies, is that deciduous canine enamel formation time is extremely variable, more so perhaps than has been generally appreciated. Figure 9 is a composite atlas of the 24 deciduous canines identified in this study with unworn and preserved dentine horns and with complete enamel at the cervix that enabled prenatal and total enamel formation times to be calculated (Table 7, 8). As well as the variation in buccal enamel height and thickness, the range of prenatal and postnatal enamel formation times and the proportion of total enamel they each form can be easily visualised. 6. Conclusions Deciduous teeth contain an incremental record of their growth in the form of daily enamel cross striations. In this study the overall mean cross striation spacing (or daily secretion rate) within 100 µm of the EDJ was 3.23 µm/day. The methods described in this study were based on this appositional chronological incremental record of deciduous enamel formation. They were designed to apportion deciduous canine buccal enamel into near-monthly formation segments, or zones, that extend back into prenatal enamel from birth and onwards beyond birth into postnatal enamel

16
until the end of enamel formation. This approach provides greater temporal resolution of the enamel formation process that in turn enables more precise retrieval of all chronological information preserved within the enamel crown, such as stress events in the form of accentuated or hypoplastic striae and/or records of trace element inclusions. The time taken to form prenatal enamel in a sample of 24 deciduous canines varied from 60 to 150 days with a combined upper and lower mean of 118 days. This implies greater variation in the gestational age at which deciduous canines begin to mineralise than has previously been appreciated. Postnatal enamel formation was also more variable than previously described, completing between 210 and 420 days after birth (mean 321 days or ~11 months of age, n=67). Enamel formation overall, from initial mineralisation to enamel completion in deciduous canines, took in total between 360 and 510 days (mean 450 days). Besides this variation in enamel formation time, both stria angle and prism angle subtended to the EDJ showed clear trends to increase gradually through enamel formation. There was also a clear trend in enamel extension rate to reduce quickly in the cusp and then gradually through crown formation. The pattern of enamel area formed each 30 days was different and rose from small increments of enamel in the cuspal region to larger increments around the middle of enamel formation but then to reduced again towards the cervix. In this 2D study of buccal enamel formation, the ameloblast sheet was, therefore, maximally active with the greatest cumulative output of matrix secretion ~150 days into deciduous canine enamel formation.
Conflict of Interest
The authors declare no conflict of interest. All authors have read and approved the final article.
Ethics statement
Ethical approval for the study was obtained from the ALSPAC Ethics and Law Committee and the Local Research Ethics Committees. Consent for biological samples has been collected in accordance with the Human Tissue Act (2004). All work carried complies with the requirements set out in The Code of Ethics of the World Medical Association (Declaration of Helsinki).
Acknowledgements We are extremely grateful to all the families who took part in this study, the midwives for their help in recruiting them, and the whole ALSPAC team, which includes interviewers, computer and laboratory technicians, clerical workers, research scientists, volunteers, managers, receptionists and nurses. We acknowledge the UK Medical Research Council and Wellcome (Grant ref: 102215/2/13/2) and the University of Bristol for providing core support for ALSPAC. A comprehensive list of grants funding is available on the ALSPAC website (http://www.bristol.ac.uk/alspac/external/documents/grant-acknowledgements.pdf). The research reported in this study was supported by the Calleva Foundation as part of the ‘Tooth Fairy Project’. This publication is the work of the authors, C. Dean, L. Humphrey, A. Groom & B. Hassett, who serve as guarantors for the contents of this

17
paper. We extend our sincere thanks the referees for their helpful comments and suggestions. References Antoine, D., Hillson, S. & Dean, M.C. (2009). The developmental clock of dental enamel: A test for the periodicity of prism cross-striations and an evaluation of the likely sources of error in histological studies of this kind. Journal of Anatomy 214, 45-55. Aris, C., Mahoney, P., O’Hara, M.C & Deter, C. (2020). Enamel thickness and growth rates in modern human permanent first molars over a 2000 year period in Britain. American Journal of Physical Anthropology, 1-17 DOI: 10.1002/ajpa.24026 Briz-Redón Á. & Serrano-Aroca, Á. (2018). Novel pedagogical tool for simultaneous learning of plane geometry and R programming Research Ideas and Outcomes, 4, e25485. URL https://riojournal.com/articles.php?id=25485 Behie, A.M. & Miszkiewicz, J.J. (2019). Enamel neonatal line thickness in deciduous teeth of Australian children from known maternal health and pregnancy conditions. Early Human Development, 137, (2019) 104821. https://doi.org/10.1016/j.earlhumdev.2019.07.004 Beynon, A.D., Dean, M.C., Leakey, M.G., Reid, D.J. & Walker, A. (1998). Comparative dental development and microstructure of Proconsul teeth from Rusinga Island, Kenya. Journal of Human Evolution, 35, 163-209. Birch, W. (2012). Incremental growth of deciduous tooth enamel. PhD Thesis, University College London. Birch, W. & Dean, M.C. (2009). Rates of enamel formation in human deciduous teeth. In; T. Koppe, G. Meyer and K.W. Alt (Eds), Frontiers of Oral Biology, 13, Karger, Basel, pp 116-120. Birch, W. & Dean M.C. (2013). A new method of calculating human deciduous enamel formation times. Bulletin of the International Association of Paleodontology, 7(1), 47-55. http://ojs.sfzg.hr/index.php/IAPO/issue/view/21 Birch, W. & Dean, M.C. (2014). A Method of Calculating Human Deciduous Crown Formation Times and of Estimating the Chronological Ages of Stressful Events Occurring during Deciduous Enamel Formation. Journal of Forensic and Legal Medicine, 22, 127-144. DOI: http://dx.doi.org/10.1016/j.jflm.2013.12.002 Bivand, R. & Rundel, C. (2019). rgeos: Interface to Geometry Engine - Open Source ('GEOS'). R package version 0.5-2. https://CRAN.R-project.org/package=rgeos Bivand, R., Keitt, T. & Rowlingson, B. (2019). rgdal: Bindings for the 'Geospatial' Data Abstraction Library. R package version 1.4-6. https://CRAN.R-project.org/package=rgdal

18
Boyd, A., Golding, J., Macleod, J, Lawlor, D.A., Fraser, A., Henderson, J., Molloy, L., Ness, A., Ring, S. & Davey-Smith, G. (2013.). Cohort Profile: The ‘Children of the 90s’; the index offspring of The Avon Longitudinal Study of Parents and Children (ALSPAC). International Journal of Epidemiology, 42, 111-127. Boyde, A. (1963). Estimation of age at death of young human skeletal remains from incremental lines in dental enamel. In Third Int. Meeting in Forensic Immunology, Medicine, Pathology and Toxicology, 16–24 April, London, UK, Excerpta Medica (Int. Congress Series no. 80), pp. 36–46. Boyde, A. (1964). The structure and development of mammalian enamel. PhD Thesis, London: University of London Boyde, A. (1989). Enamel. In A. Oksche & L. Vollrath (Eds.). Handbook of microscopic anatomy, Vol. 2, Teeth. (pp. 309-473). Berlin: Springer Verlag. Boyde, A. (1997). Microstructure of enamel. In: Chadwick, D. J., Cardew, G. (Eds.). Dental enamel. Proceedings of the Ciba Foundation Symposium 205, (pp. 18–31), Chichester, John Wiley and Sons Inc. Briz-Redón Á. & Serrano-Aroca, Á. (2018). Novel pedagogical tool for simultaneous learning of plane geometry and R programming Research Ideas and Outcomes, 4, e25485. URL https://riojournal.com/articles.php?id=25485 Bromage, T.G. (1991). Enamel incremental periodicity in the pig-tailed macaque; a polychrome fluorescent labelling study of dental hard tissues. American Journal of Physical Anthropology, 86, 205-214. Dean, M.C. (1998). A comparative study of cross striation spacings in cuspal enamel and of four methods of estimating the time taken to grow molar cuspal enamel in Pan, Pongo and Homo. Journal of Human Evolution, 35, 449-462. Dean, M.C. (2012). A histological method that can be used to estimate the time taken to form the crown of a permanent tooth.In, Forensic microscopy for skeletal tissues, Methods and Protocols. Methods in Molecular Biology. 915, 89-100. Humana Press (Springer Science+Business-Media LLC), New York. ISBN 978-1-61779-976-1. Dean, M.C. & Cole, T.J. (2013). Human life history evolution explains dissociation between the timing of tooth eruption and peak rates of root growth. PLoS ONE, 8(1), 1-14, e54534. doi:10.1371/journal.pone.0054534 FitzGerald, C.M. & Hillson, S. (2009). Deciduous tooth growth in an Ancient Greek infant cemetery. In: Koppe, T., Meyer, G. & Alt, K., editors. Comparative dental morphology. Frontiers of Oral Biology, Basel: Karger. p 178–183. FitzGerald, C. M. & Saunders, S. R. (2005). Test of histological methods of determining chronology of accentuated striae in deciduous teeth. American Journal of Physical Anthropology, 127, 277–290.

19
FitzGerald, C. M., Saunders, S., Bondioli, L., Macchiarelli, R. (2006). Health of infants in an Imperial Roman skeletal sample: perspective from dental microstructure. American Journal of Physical Anthropology, 130, 179–189. FitzGerald, C.M., Saunders, S.R., Macchiarelli, R. & Bondioli, L. (1999). Large scale histological assessment of deciduous crown formation. In: Mayhall J.T., editor. Dental morphology 98. Oulu, Finland: University of Oulu Proceedings of the 11th International Symposium on Dental Morphology. p 92–101. Fraser A, Macdonald-Wallis C, Tilling K, Boyd A, Golding J, Davey Smith G, Henderson J, Macleod J, Molloy L, Ness A and others. 2013. Cohort Profile: The Avon Longitudinal Study of Parents and Children: ALSPAC mother’s cohort. International Journal of Epidemiology, 42, 97-110. Guatelli Steinberg, D., Floyd. B. A., Dean, M. C. & Reid, D. J. (2012). Enamel extension rate patterns in modern human teeth: two approaches designed to establish an integrated context for fossil primates. Journal of Human Evolution, 63, 475-486. Hassett, B., Humphrey, L., & Dean, C. (2017). Appearance of the neonatal line depends on gestational rather than delivery variables. Proceedings of the 17th International Symposium on Dental Morphology, Bordeaux, p. 83 (poster 3.9). Hassett, B. R., Dean, M. C., Ness, A. R., Atkinson, C., Ring, S. & Humphrey, L. (2020). Effects of maternal, gestational, and perinatal variables on neonatal line width observed in a modern UK birth cohort. American Journal of Physical Anthropology, (in press). Hershkovitz, F., Shirley, L., Cohen, O. & Zilberman, U. (2019). The effect of cerebral palsy on neonatal line thickness and enamel components. Archives of Oral Biology, 104, 119-122. Hillson, S. (2014). Tooth development in human evolution and bioarchaeology. Cambridge, UK, Cambridge University Press. Humphrey, L. T. (2014). Isotopic and trace element evidence of dietary transitions in early life. Annals of Human Biology, 41(4), 348–57. https://doi:10.3109/03014460.2014.923939. Humphrey, L.T., Dean, M.C, & Jeffries, T.E. (2007). An evaluation of changes in strontium/calcium ratios across the neonatal line in human deciduous teeth. In; (eds. S. E. Bailey & J. J. Hublin) Dental Perspectives on Human Evolution. Vertebrate paleobiology and paleoanthropology series, Max Planck Institute, Leipzig. Springer, New York, pp. 301-317. Humphrey, L.T., Dean, M.C., Jeffries, T.E. & Penn, M. (2008). Unlocking evidence of early diet from tooth enamel. Proceedings of The National Academy of Sciences USA, 105, 6834–9. https://doi:10.1073/pnas.0711513105.

20
Hurnanen, J., Visnapuu, V., Sillanpää, M., Löyttyniemi, E. & Rautava, J. (2016). Deciduous neonatal line: Width is associated with duration of delivery. Forensic Science International, 271, 87-91. Hurnanen, J., Sillanpää, M., Mattila, M-L., Löyttyniemi, E., Witzel, C. & Rautava, J. (2019). Staircase-pattern neonatal line in human deciduous teeth is associated with tooth type. Archives of Oral Biology, 104, 1-6.
Jakobsen, J. (1975). Neonatal lines in human dental enamel. Occurrence in first permanent molars in males and females. Acta Odontologica Scandinavica, 33, 95-105.
Keinan, D., Smith, P. & Zilberman, U. (2006). Microstructure and chemical composition of primary teeth in children with Down syndrome and cerebral palsy. Archives of Oral Biology, 51, 836-843. Keinan, D., Smith P. & Zilberman, U. (2007). Prenatal growth acceleration in maxillary deciduous canines of children with Down syndrome: histological and chemical composition study. Archives of Oral Biology, 52, 961-966. Kuma, A., Hatano, M., Matsui, Yamomoto, A., Nakaya, H., Yoshimori, T., Ohsumi, Y., Tokuhisa, T. & Mizushima, N. (2004). The role of autophagy during the early neonatal starvation period. Nature 432, 1032-1036. Lacruz, R.S., Hacia, J. G., Bromage,T,G., Boyde, A., Lei, Y., Xu, Y., Miller, J.D., Paine, M. L. & Snead, M. L. (2012). The circadian clock modulates enamel development. Journal of Biological Rhythms, 27, 237–245. (doi:10.1177/0748730412442830) Liversidge, H.M., Molleson, T.I. (1999). Developing permanent tooth length as an estimate of age. Journal of Forensic Science, 44, 917–920. Liversidge, H.M. & Molleson, T. (2004). Variation in crown and root formation and eruption of human deciduous teeth. American Journal of Physical Anthropology, 123, 172-180. Logan, W.H.G., & Kronfeld, R. (1933). Development of the human jaws and surrounding structures from birth to the age of fifteen years. Journal of the American Dental Association, 20, 379-427. Lunt, R.C. & Law, D.B. (1974). A review of the chronology of calcification of deciduous teeth. Journal of The American Dental Association, 89, 599-606. Macchiarelli, R. & Bondioli, L. (2000). Multimedia dissemination of the "Isola Sacra" human paleobiological project: reconstructing lives, habits, and deaths of the "ancient Roman people" by means of advanced investigative methods. In A. Guarino (Ed.), Proceedings of 2nd International Congress on Science and Technology for the Safeguard of Cultural Heritage in the Mediterranean Basin, vol. 2, (pp.1075-1080). Paris: Elsevier.

21
Macchiarelli, R., Bondioli, L., Debénath, A., Mazurier, A., Tournepiche, J-F, Birch, W. & Dean, C. (2006) .How Neanderthal molar teeth grew. Nature, 444, 748-751. doi:10.1038/nature5314 Mahoney, P. (2010). Two dimensional patterns of human enamel thickness on deciduous (dm1, dm2) and permanent first (M1) mandibular molars. Archives of Oral Biology, 55, 115–126. Mahoney, P. (2011). Human deciduous mandibular molar incremental enamel development. American Journal of Physical Anthropology, 144, 204–214. Mahoney, P. (2012). Incremental enamel development in modern human deciduous anterior teeth. American Journal of Physical Anthropology, 147, 637-651. https://doi.org/10.1002/ajpa.22029 PMID: 22331636 Mahoney, P. (2013). Testing functional and morphological interpretations of enamel thickness along the deciduous tooth row in human children. American Journal of Physical Anthropology, 151, 518–525. Mahoney, P. (2015). Dental fast track: prenatal enamel growth, incisor eruption and weaning in human infants. American Journal of Physical Anthropology, 156, 407-421. https://doi.org/10.1002/ajpa.22666 PMID: 25388809 Mahoney, P. (2019). Root growth and dental eruption in modern human deciduous teeth with preliminary observations on great apes. Journal of Human Evolution, 129, 46-53. Massler, M. & Schour, I. (1946). The appositional life span of the enamel and dentin forming cells. Journal of Dental Research, 25, 145–156. Müller, W., Nava, A., Evans, D., Rossi, P.F., Alt, K.W. & Bondioli, L. (2019). Enamel mineralization and compositional time-resolution in human teeth evaluated via histologically-defined LA-ICPMS profiles. Geochimica et Cosmochimica Acta, 255, 105-126. https://doi.org/10.1016/j.gca.2019.03.005. Nava, A., Bondiolli, L., Coppa, A., Dean, C., Rossi, P.A. & Zanolli, C. (2017). New regression formula to estimate the prenatal crown formation time of human deciduous central incisors derived from a Roman Imperial sample (Velia, Salerno, Italy, I-II cent. CE). PLoS ONE 12(7): e0180104. https://doi. org/10.1371/journal.pone.0180104 Nava, A., Frayer, D.W. & Bondioli, L. (2019). Longitudinal analysis of the microscopic dental enamel defects of children in the Imperial Roman community of Portus Romae (necropolis of Isola Sacra, 2nd to 4th century CE, Italy). Journal of Archaeological Science: reports, 23, 406-415. https://doi.org/10.1016/j.jasrep.2018.11.007 Nomata, N. (1964). Chronological study on the crown formation of the human deciduous dentition. Bulletin of the Tokyo Medical and Dental University, 11, 55-76.

22
Norén, J.G., Grahnen, H., & Magnusson, B.O. (1978). Maternal diabetes and changes in the hard tissues of primary teeth. III. A histologic and microradiographic study. Acta Odontologica Scandinavica, 36(3), 127-135. R Core Team. (2015). R: A language and environment for statistical computing. Vienna, Austria: R Foundation for Statistical Computing. Risnes, S. (1986). Enamel apposition rate and the prism periodicity in human teeth. Scandinavian Journal of Dental Research, 94, 394–404. Schour, I. & Poncher, H.G. (1937). Rate of apposition of enamel and dentine, measured by the effect of acute fluorosis. American Journal of Diseases of Children, 54, 757–776. Shellis, R. P. (1984). Variations in growth of the enamel crown in human teeth and a possible relationship between growth and enamel structure. Archives of Oral Biology, 29, 69-705. Shellis, R.P. (1998). Utilization of periodic markings in enamel to obtain information on tooth growth. Journal of Human Evolution, 35, 387-400. Skinner, M., & Dupras, T. (1993). Variation in birth timing and location of the neonatal line in human enamel. Journal of Forensic Sciences, 38(6), 1388-1390. Stack, M.V. (1967). Vertical growth rates of the deciduous teeth. Journal of Dental Research, 46, 879-882. Sunderland, E.P., Smith, C.J. & Sunderland, R. (1987). A histological study of the chronology of initial mineralization in the human deciduous dentition. Archives of Oral Biology, 32(3), 167-174. Witzel, C. (2014). Echoes from birth – Mutual benefits for physical and forensic anthropology by applying increment counts in enamel of deciduous teeth for ageing. Anthropologischer Anzeiger, 71, 87–103. Witzel, C., Kierdorf, U., Schultz, M. & Kierdorf, H. (2008). Insights from the inside: Histological analysis of abnormal enamel microstructure associated with hypoplastic enamel defects in human teeth. American Journal of Physical Anthropology, 136(4), 400-414. http://dx.doi.org/10.1002/ajpa.20822 Zanolli, C., Bondioli, L., Manni, F., Rossi, P. & Macchiarelli, R. (2011). Gestation length, mode of delivery and neonatal line thickness variation. Human Biology, 83(6), 695-713. Żądzińska, E., Kurek, M., Borowska-Struginska, B., Lorkiewicz, W., Rosset, I. & Sitek, A. (2013). The effect of the season of birth and of selected maternal factors on linear enamel thickness in modern human deciduous incisors. Archives of Oral Biology, 58, 951-963.

23
Zheng, L., Seon, Y.J., Mourão, M. A., Schnell, S., Kim, D., Harada H., Papagerakis, S. & Papagerakis, P. (2013). Circadian rhythms regulate amelogenesis. Bone, 55, 158–165. (doi:10.1016/j.bone.2013.02.011) Figure legends Figure 1 Cross striation spacings (µm) made within 100 µm from the EDJ and grouped into 1 mm divisions of EDJ length from the cervix. These are plotted in the way the tooth grows from the cusp tip (left) to the cervix (right). Figure 2 Box plots of the same cross striation spacings (µm) represented in Figure 1 (measured within a 100 µm zone from the EDJ) but shown here split by each 30 day time zone. Figure 3 The middle image shows a transmitted light micrograph of a deciduous canine with the neonatal line (NNL) indicated by a continuous line (red) within the cuspal enamel. This curves over the dentine horn. Short light (yellow) 30 day formation segments, each 100 µm long, follow the prism direction at sequential positions along the EDJ. From these short lines, longer light (also yellow) lines track back to the EDJ. At each intersection of these light (yellow) lines at the EDJ, the number of days formation is indicated with birth at zero days, prenatal formation times a negative values and postnatal times as positive values. The magnified panel (black border) to the left indicates the prism angle and the stria angle to the EDJ. The right-hand image shows each of the 30 day formation segments, or zones, projected onwards and outwards through the enamel to either pass over the dentine horn within cuspal enamel or crop out at the surface in the lateral enamel. Figure 4 Box plots of the prism orientation (prism angle in degrees) measured at the EDJ at each 30 day time zone. Figure 5 Box plots of the stria orientation (stria angle in degrees) measured at the EDJ at each 30 day time zone. Figure 6

24
Box plots of the extension rates (µm/day) measured at the EDJ at each 30 day time zone. These were calculated as the length of the EDJ between each segment divided by 30 days. Figure 7
The area of enamel (µm2/100) formed within each 30 day segment, or time zone, measured in 22 teeth with an intact, unworn, dentine horn and with no evidence of enamel hypoplasia (this sample includes some teeth with worn cuspal enamel that are also plotted separately in Fig. 8). Figure 8 The area of enamel (µm2/100 formed within each 30 day segment, or time zone, measured in just 8 teeth showing either no wear or only minimally wear of cuspal enamel. Figure 9 Thumbnail images of the buccal enamel of 24 deciduous canines. The first 9 (6 in top row and first 3 in second row) are maxillary and the remainder mandibular deciduous canines. Prenatal enamel is shaded light (light blue) and postnatal enamel is divided into alternating 3 monthly segments, or zones, and shaded alternatively dark (dark blue) and light (yellow). Individual grid-lines (thin black continuous lines) indicate each 30 day segment, or zone, of enamel formed and are overlaid across the whole buccal enamel outline.

25
Table 1 mm from CEJ min max mean sd n 6-7 2.37 4.72 3.25 0.65 21 Upper 5-6 2.50 4.47 3.33 0.56 55 deciduous 4-5 2.46 4.38 3.37 0.50 41 canines 3-4 2.23 4.47 3.14 0.53 26 2-3 2.41 4.20 3.32 0.53 33 n = 39 1-2 2.42 3.86 3.07 0.44 44 0-1 2.28 3.97 3.07 0.37 43 Uppers overall 2.23 4.72 3.22 0.51 263 mm from CEJ min max mean sd n 6-7 2.68 5.12 3.47 0.75 14 Lower 5-6 2.41 4.89 3.36 0.63 48 deciduous 4-5 2.43 4.60 3.32 0.62 56 canines 3-4 2.48 4.27 3.33 0.49 37 2-3 2.11 4.14 3.07 0.51 51 n = 42 1-2 2.26 4.27 3.19 0.54 42 0-1 2.04 4.27 3.10 0.48 48 Lowers overall 2.04 5.12 3.24 0.57 296 Grand mean 2.04 5.12 3.23 0.54 559
Cross striation spacings within 100 µm of EDJ. Cross-striation spacings (µm) made within 100 µm of the EDJ at 1 mm intervals away from the cement dentine junction (CDJ) in upper and lower deciduous canines. The grand mean, range and SD of all spacings (N.B. not of the individual mm categories) for all upper and lower deciduous canine data combined appear on the bottom row.

26
Table 2
Interval (days) min max mean sd n -150 to -120 2.41 3.90 2.97 0.49 10 -120 to 90 2.54 4.72 3.40 0.68 12 -90 to -60 2.43 4.51 3.33 0.55 43 -60 to -30 2.37 5.12 3.52 0.64 56
-30 to birth (0) 2.43 4.89 3.28 0.58 53 birth (0) to 30 2.46 4.67 3.31 0.58 58
30 to 60 2.43 4.27 3.09 0.52 21 60 to 90 2.48 4.47 3.32 0.54 21
90 to 120 2.23 4.14 3.22 0.50 25 120 to 150 2.42 4.07 3.10 0.51 21 150 to 180 2.58 4.11 3.24 0.45 27 180 to 210 2.26 4.03 3.16 0.50 26 210 to 240 2.31 4.20 3.20 0.50 29 240 to 270 2.11 3.86 3.13 0.47 38 270 to 300 2.26 4.27 2.98 0.48 35 300 to 330 2.47 4.27 3.14 0.48 23 330 to 360 2.50 4.27 3.39 0.43 31 360 to 390 2.41 3.50 2.86 0.32 20 390 to 420 2.58 3.67 3.13 0.77 2 420 plus 2.04 3.48 2.96 0.50 8
Mean or sum 2.04 5.12 3.24 0.54 559 Cross-striation spacing within 100 µm of EDJ Cross-striation spacings (µm) made within 100 µm of the EDJ. These are divided into 30 day time intervals, or zones, from cusp to cervix spanning -150 to -120 days before birth to 420 days plus any time less than 1 month postnatally.
27
Table 3
Measured at day min max mean sd n -150 42.66 65.53 53.21 8.26 8 -120 35.15 81.80 53.93 9.76 27 -90 36.12 71.32 51.87 7.26 52 -60 31.42 67.99 51.95 7.11 63 -30 36.18 77.26 53.87 7.44 69 0 39.42 81.95 53.97 7.63 68
30 35.88 77.09 54.34 8.69 67 60 37.72 76.33 54.92 8.28 69 90 37.61 74.17 57.06 7.37 70
120 39.06 76.57 58.59 8.00 68 150 36.13 80.48 59.78 7.59 70 180 45.60 87.28 61.34 8.95 70 210 43.65 89.44 63.98 9.11 67 240 44.14 89.46 65.94 10.23 60 270 42.41 89.15 67.32 11.36 53 300 50.81 89.96 68.61 11.31 39 330 54.37 88.43 68.58 10.86 20 360 51.13 87.48 74.60 12.13 10 390 66.40 88.13 78.23 9.73 5 420 89.62 89.91 89.77 0.20 2
Mean or sum 31.42 89.96 58.83 10.44 957 Prism orientation at the EDJ Prism angles (degrees) measured at the EDJ at each 30 day intersection.

28
Table 4 Measured at day min max mean sd n
-150 1.73 8.31 5.22 2.09 8 -120 0.90 14.40 6.81 3.13 25 -90 1.44 19.69 7.91 2.93 48 -60 1.44 20.53 7.99 2.79 60 -30 1.03 19.43 8.55 2.92 66 0 0.85 26.13 8.96 3.91 67
30 0.72 20.95 10.10 4.00 67 60 0.86 21.68 10.59 4.02 67 90 1.23 23.65 11.97 3.97 67
120 0.51 31.44 12.36 4.68 67 150 3.38 38.08 13.21 5.34 67 180 0.19 45.65 13.81 6.83 67 210 2.39 43.33 14.90 7.80 67 240 0.17 44.78 15.33 8.52 64 270 2.05 39.63 15.64 8.09 59 300 0.48 41.71 17.62 9.50 53 330 4.40 43.51 20.75 11.38 37 360 5.97 50.12 22.57 13.85 20 390 8.90 49.76 25.55 14.53 6 420 14.22 36.60 26.63 11.16 5
Mean or sum 0.17 50.12 12.57 7.45 987 Stria orientation at the EDJ Stria angles (degrees) measured at the EDJ at each 30 day intersection.

29
Table 5
Measured at day min max mean sd n -120 16.86 27.72 21.00 4.15 6 -90 8.66 23.89 17.09 4.52 17 -60 12.19 24.55 17.43 3.62 20 -30 10.17 23.99 16.02 4.40 23 0 9.60 30.64 16.65 4.74 23
30 9.00 31.50 15.26 4.76 23 60 8.85 20.34 13.40 3.14 23 90 8.61 17.40 12.62 2.68 23
120 6.32 15.90 12.08 2.42 23 150 5.43 18.20 11.47 2.89 23 180 7.20 20.17 11.39 3.23 23 210 7.09 16.23 10.22 2.18 23 240 6.07 23.07 11.96 3.73 21 270 7.77 15.21 11.85 2.10 21 300 7.04 22.33 11.91 3.26 20 330 4.64 16.00 11.40 3.04 16 360 4.30 16.44 11.03 2.92 12 390 8.49 14.89 11.04 3.39 3 420 9.30 17.94 13.62 6.11 2
Mean or sum 4.30 31.50 13.39 4.21 345 Enamel extension rates (µm/day) in teeth with intact dentine horns. Enamel extension rates (µm/day) in teeth with intact unworn dentine horns measured at the EDJ at each 30 day intersection.

30
Table 6
Interval (days) min max mean sd n -150 to -120 3852 86026 28232 31658 6 -120 to 90 2587 170803 44369 43343 16 -90 to -60 6210 222145 83037 53181 19 -60 to -30 3816 234598 108492 59926 22
-30 to birth (0) 39460 264670 148726 60584 22 birth (0) to 30 81730 289101 183186 58331 22
30 to 60 118888 365477 209802 59777 22 60 to 90 148108 384931 239760 65351 22
90 to 120 177250 431555 269315 61977 22 120 to 150 156134 479434 276335 68924 22 150 to 180 134042 406693 289416 71747 22 180 to 210 98405 420744 280756 86442 22 210 to 240 74273 403250 228342 94682 22 240 to 270 103938 437579 214888 94132 20 270 to 300 72736 351903 170970 77173 20 300 to 330 45124 235909 137967 53796 19 330 to 360 55165 209598 124485 44297 15 360 to 390 58530 200041 103247 42083 11 390 to 420 11774 103387 68336 49450 3 420 plus 63126 91034 77080 19734 2
Mean or sum 2587 479434 177654 102436 351 Area of enamel formed (µm2) in teeth with intact dentine horns Area of enamel formed (µm2) within each 30 day interval, or zone, in teeth with intact unworn dentine horns.

31
Table 7
Pre- and Postnatal EFT in complete crowns (n = 23) Postnatal EFT only (n=67) EFT (days) Prenatal Postnatal Total EFT Postnatal
min 60 210 360 210 max 150 420 510 420
mean 116 334 450 319 sd 29.04 54.75 38.38 50.55
Enamel formation times Prenatal, postnatal and total enamel formation times (EFT) are given (in days) for the sample of 23 teeth with complete crowns preserving both the dentine horn and buccal enamel cervix. Postnatal EFT is also given for the 67 worn teeth but which preserve both the neonatal line (NNL) and buccal enamel cervix. Table 8
Prenatal EFT Postnatal EFT Total EFT EFT (days) maxillary mandibular maxillary mandibular maxillary mandibular
n=9 n=15 n=32 n=35 n=9 n=14 min 90 60 210 210 360 360 max 150 150 420 420 480 510
mean 123 114 310 327 437 456 sd 23.45 32.47 46.11 53.56 33.91 39.61
Enamel formation times split by upper and lower canines Enamel formation times (EFT) in days, split by maxillary and mandibular deciduous canines.