1 TOE STABILITY OF RUBBLE MOUND BREAKWATERS ...
10
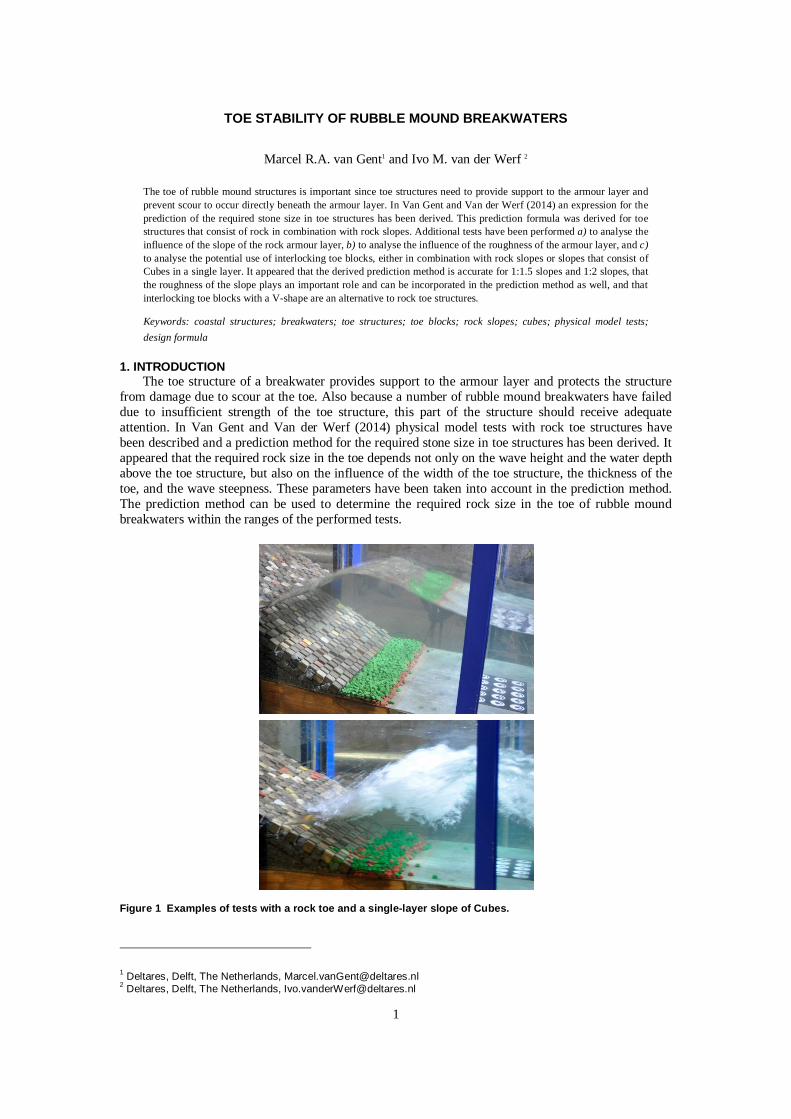
1 TOE STABILITY OF RUBBLE MOUND BREAKWATERS Marcel R.A. van Gent 1 and Ivo M. van der Werf 2 The toe of rubble mound structures is important since toe structures need to provide support to the armour layer and prevent scour to occur directly beneath the armour layer. In Van Gent and Van der Werf (2014) an expression for the prediction of the required stone size in toe structures has been derived. This prediction formula was derived for toe structures that consist of rock in combination with rock slopes. Additional tests have been performed a) to analyse the influence of the slope of the rock armour layer, b) to analyse the influence of the roughness of the armour layer, and c) to analyse the potential use of interlocking toe blocks, either in combination with rock slopes or slopes that consist of Cubes in a single layer. It appeared that the derived prediction method is accurate for 1:1.5 slopes and 1:2 slopes, that the roughness of the slope plays an important role and can be incorporated in the prediction method as well, and that interlocking toe blocks with a V-shape are an alternative to rock toe structures. Keywords: coastal structures; breakwaters; toe structures; toe blocks; rock slopes; cubes; physical model tests; design formula 1. INTRODUCTION The toe structure of a breakwater provides support to the armour layer and protects the structure from damage due to scour at the toe. Also because a number of rubble mound breakwaters have failed due to insufficient strength of the toe structure, this part of the structure should receive adequate attention. In Van Gent and Van der Werf (2014) physical model tests with rock toe structures have been described and a prediction method for the required stone size in toe structures has been derived. It appeared that the required rock size in the toe depends not only on the wave height and the water depth above the toe structure, but also on the influence of the width of the toe structure, the thickness of the toe, and the wave steepness. These parameters have been taken into account in the prediction method. The prediction method can be used to determine the required rock size in the toe of rubble mound breakwaters within the ranges of the performed tests. Figure 1 Examples of tests with a rock toe and a single-layer slope of Cubes. 1 Deltares, Delft, The Netherlands, [email protected] 2 Deltares, Delft, The Netherlands, [email protected]
-
Upload
khangminh22 -
Category
Documents
-
view
2 -
download
0
Transcript of 1 TOE STABILITY OF RUBBLE MOUND BREAKWATERS ...
1
TOE STABILITY OF RUBBLE MOUND BREAKWATERS
Marcel R.A. van Gent1 and Ivo M. van der Werf 2
The toe of rubble mound structures is important since toe structures need to provide support to the armour layer andprevent scour to occur directly beneath the armour layer. In Van Gent and Van der Werf (2014) an expression for theprediction of the required stone size in toe structures has been derived. This prediction formula was derived for toestructures that consist of rock in combination with rock slopes. Additional tests have been performed a) to analyse theinfluence of the slope of the rock armour layer, b) to analyse the influence of the roughness of the armour layer, and c)to analyse the potential use of interlocking toe blocks, either in combination with rock slopes or slopes that consist ofCubes in a single layer. It appeared that the derived prediction method is accurate for 1:1.5 slopes and 1:2 slopes, thatthe roughness of the slope plays an important role and can be incorporated in the prediction method as well, and thatinterlocking toe blocks with a V-shape are an alternative to rock toe structures.
Keywords: coastal structures; breakwaters; toe structures; toe blocks; rock slopes; cubes; physical model tests;design formula
1. INTRODUCTIONThe toe structure of a breakwater provides support to the armour layer and protects the structure
from damage due to scour at the toe. Also because a number of rubble mound breakwaters have faileddue to insufficient strength of the toe structure, this part of the structure should receive adequateattention. In Van Gent and Van der Werf (2014) physical model tests with rock toe structures havebeen described and a prediction method for the required stone size in toe structures has been derived. Itappeared that the required rock size in the toe depends not only on the wave height and the water depthabove the toe structure, but also on the influence of the width of the toe structure, the thickness of thetoe, and the wave steepness. These parameters have been taken into account in the prediction method.The prediction method can be used to determine the required rock size in the toe of rubble moundbreakwaters within the ranges of the performed tests.
Figure 1 Examples of tests with a rock toe and a single-layer slope of Cubes.
1 Deltares, Delft, The Netherlands, [email protected] Deltares, Delft, The Netherlands, [email protected]
COASTAL ENGINEERING 20142
To verify the applicability of the prediction method outside its range of validity additional physicalmodel tests have been performed. These additional physical model tests are focussed on:
Slope anglesTests by Van Gent and Van der Werf (2014) were performed with 1:2 rock slopes. Additional testswith 1:1.5 slopes and 1:4 slopes were performed.
Roughness of slopeTests by Van Gent and Van der Werf (2014) were performed with rock in the armour slope.Because the roughness of the slope may affect the stability of the material in the toe structure,additional tests have been performed with a smoother slope, namely a single layer of Cubes.
Interlocking concrete toe blocksTests by Van Gent and Van der Werf (2014) were mainly performed with rock in the toe structure.As an alternative to rock, interlocking concrete toe blocks have been used in additional tests. Theseinterlocking toe blocks were applied in combination with rock slopes and in combination with asingle layer of Cubes.
With these additional tests a data-set is obtained where each of the four combinations of rockslopes or concrete armour slopes, with rock toe structure or concrete toe blocks is present (i.e. slope-toe: a) rock-rock; b) concrete-rock; c) rock-concrete; d) concrete-concrete).
For the additional tests the same wave facility, test set-up, material and measurement equipmenthas been used. Since these are all based on Van Gent and Van der Werf (2014), the following chapterprovides a summary of those basic model tests.
2. BASIC PHYSICAL MODEL TESTS
Test set-up and test programmePhysical model tests were performed in a wave flume (width 1 m, height 1.2 m, length 110 m of
which 55 m was used here) at Deltares, Delft. Wave conditions were measured at deep water and infront of the toe structure. The analysis was based on the incident waves at the toe. The spectralsignificant wave height Hs (Hs = Hm0 = 4(m0)0.5) and the wave period Tm-1,0 (Tm-1,0 = m-1/m0) wereobtained from the measured wave energy spectra. In Van Gent (2001) the wave period Tm-1,0 was foundto appropriately describe the influence of wave energy spectra on wave run-up, while in later studiesthis wave period was found to be the most appropriate wave period for wave overtopping, wavereflection, dune erosion, and the stability of rock slopes (e.g. Van Gent et al, 2003). In all tests aJonswap wave spectrum has been applied. Each configuration was tested with two values for the wavesteepness: sp=0.015 and sp=0.04 with sp=2 Hs/gTp
2. This corresponds to sm-1,0 =0.018 and sm-1,0 =0.048respectively (sm-1,0=2 Hs / gTm-1,0
2).
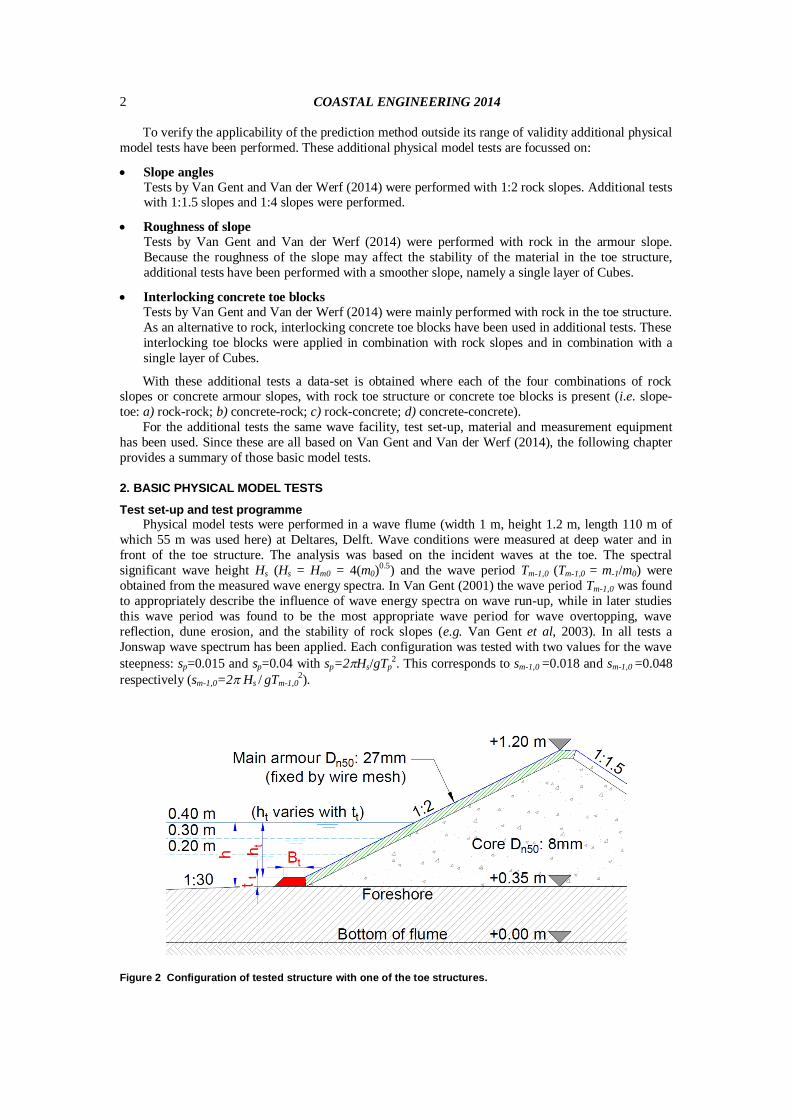
Figure 2 Configuration of tested structure with one of the toe structures.
COASTAL ENGINEERING 2014 3
The basic configuration consists of a non-overtopped 1:2 rock armour layer (Dn50 = 27 mm) on topof a permeable core (Dn50 = 8 mm), see Figure 2. In all tests the foreshore slope was 1:30. Theforeshore was fixed (no mobile bed) such that no toe scour could occur.
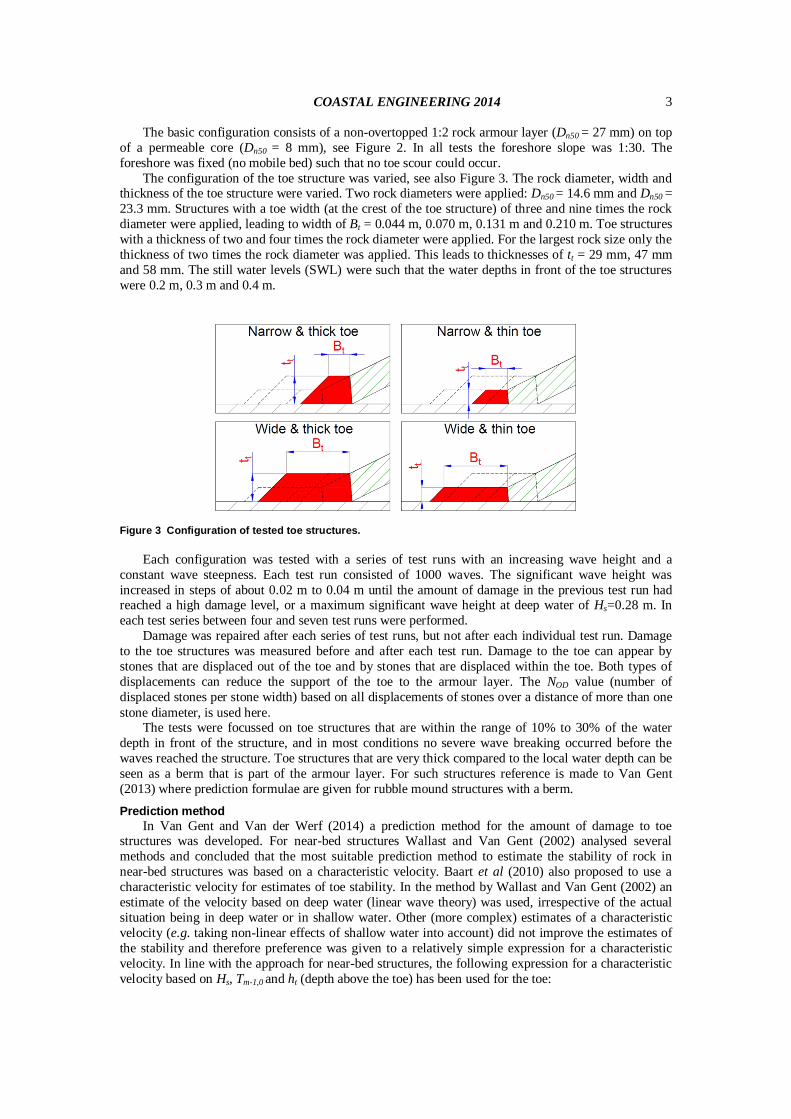
The configuration of the toe structure was varied, see also Figure 3. The rock diameter, width andthickness of the toe structure were varied. Two rock diameters were applied: Dn50 = 14.6 mm and Dn50 =23.3 mm. Structures with a toe width (at the crest of the toe structure) of three and nine times the rockdiameter were applied, leading to width of Bt = 0.044 m, 0.070 m, 0.131 m and 0.210 m. Toe structureswith a thickness of two and four times the rock diameter were applied. For the largest rock size only thethickness of two times the rock diameter was applied. This leads to thicknesses of tt = 29 mm, 47 mmand 58 mm. The still water levels (SWL) were such that the water depths in front of the toe structureswere 0.2 m, 0.3 m and 0.4 m.
Figure 3 Configuration of tested toe structures.
Each configuration was tested with a series of test runs with an increasing wave height and aconstant wave steepness. Each test run consisted of 1000 waves. The significant wave height wasincreased in steps of about 0.02 m to 0.04 m until the amount of damage in the previous test run hadreached a high damage level, or a maximum significant wave height at deep water of Hs=0.28 m. Ineach test series between four and seven test runs were performed.
Damage was repaired after each series of test runs, but not after each individual test run. Damageto the toe structures was measured before and after each test run. Damage to the toe can appear bystones that are displaced out of the toe and by stones that are displaced within the toe. Both types ofdisplacements can reduce the support of the toe to the armour layer. The NOD value (number ofdisplaced stones per stone width) based on all displacements of stones over a distance of more than onestone diameter, is used here.
The tests were focussed on toe structures that are within the range of 10% to 30% of the waterdepth in front of the structure, and in most conditions no severe wave breaking occurred before thewaves reached the structure. Toe structures that are very thick compared to the local water depth can beseen as a berm that is part of the armour layer. For such structures reference is made to Van Gent(2013) where prediction formulae are given for rubble mound structures with a berm.
Prediction methodIn Van Gent and Van der Werf (2014) a prediction method for the amount of damage to toe
structures was developed. For near-bed structures Wallast and Van Gent (2002) analysed severalmethods and concluded that the most suitable prediction method to estimate the stability of rock innear-bed structures was based on a characteristic velocity. Baart et al (2010) also proposed to use acharacteristic velocity for estimates of toe stability. In the method by Wallast and Van Gent (2002) anestimate of the velocity based on deep water (linear wave theory) was used, irrespective of the actualsituation being in deep water or in shallow water. Other (more complex) estimates of a characteristicvelocity (e.g. taking non-linear effects of shallow water into account) did not improve the estimates ofthe stability and therefore preference was given to a relatively simple expression for a characteristicvelocity. In line with the approach for near-bed structures, the following expression for a characteristicvelocity based on Hs, Tm-1,0 and ht (depth above the toe) has been used for the toe:
COASTAL ENGINEERING 20144
with (1)
The analysis of the tests showed that damage to the toe increases with an increasing wave height,increases with an increasing wave period, reduces with an increasing water depth above the toe,increases with an increasing width of the toe, increases with an increasing thickness of the toe, andreduces with an increasing rock size. The influence of these parameters has been taken into account byusing the following expression (Van Gent and Van der Werf, 2014):
(2)
For a specified amount of allowable damage, this leads to a required rock size:
(3)
The validity of this prediction formula is limited to toe structures that are within the range of 10%to 30% of the water depth in front of the structure, and a water depth in front of the toe structurebetween 1.2 and 4.5 times the wave height. Guidelines have been given by Van Gent and Van der Werf(2014) on the amount of allowable damage to toe structures: It is advised to take the width of the toestructure into account when determining the design criterion for the toe structure.
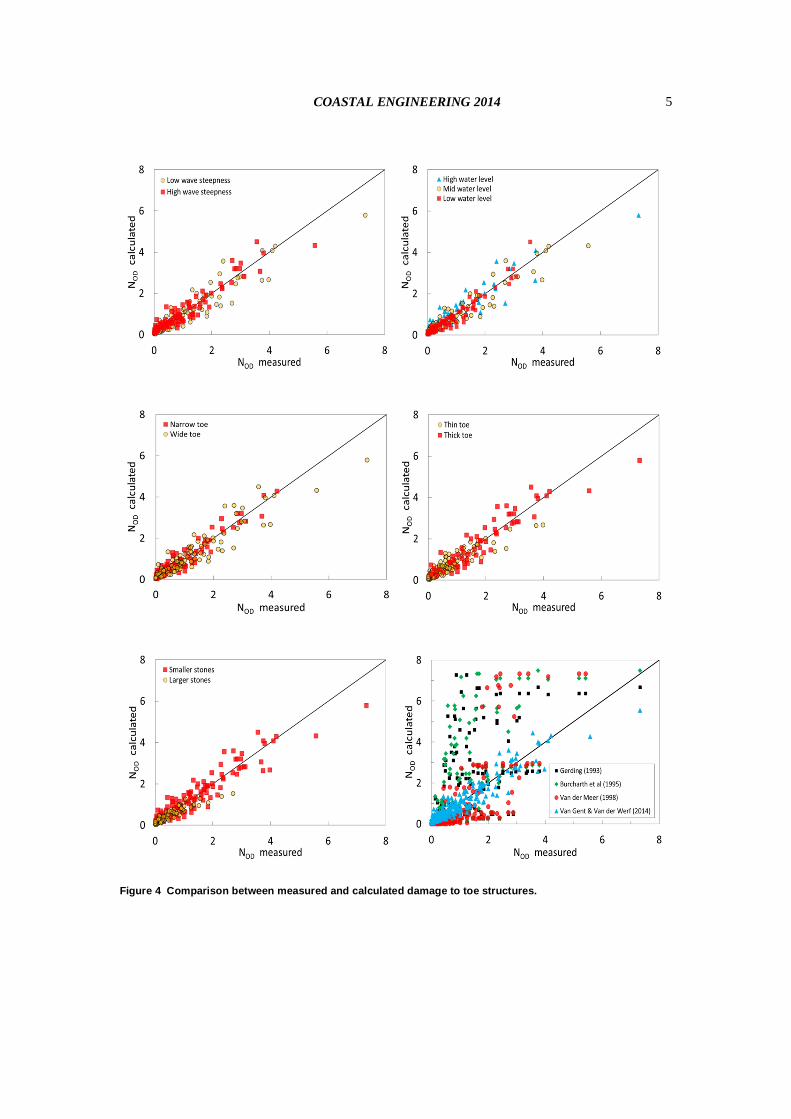
Comparison between measurements and prediction methodFigure 4 shows the calculated damage versus the measured damage, with all data on 1:2 slopes as
presented in Van Gent and Van der Werf (2014). The standard deviation of the differences between themeasured and calculated damage values NOD is =0.39.
The upper-left panel shows all data with different symbols denoting different wave steepness. Thispanel shows that the accuracy of the formula is more or less equal for both wave steepnesses. Theupper-right panel shows that the accuracy of the formula is more or less equal for all water levels,although the comparison for the lowest water level is slightly better. The mid-left panel shows that theaccuracy of the formula is slightly better for the narrow toe structures than for the wide toe structures.For practical applications this is convenient since most toe structures in practice will be closer to anarrow toe (three diameters) than to a wide toe (nine diameters). The mid-right panel shows that theaccuracy of the formula is more or less equal for thin toe structures and thick toe structures, althoughfor the thin toe structures in combination with a large amount of damage (NOD>2) the calculations seemto underestimate the measured damage somewhat. The lower-left panel shows that the accuracy of theformula is more or less equal for both rock sizes, although for the larger stones in combination with arelatively large amount of damage the calculations (NOD>2) seem to underestimate the measureddamage somewhat.
Figure 4 shows in the lower-right panel a comparison of measured 1:2 slope data with differentsymbols denoting a different prediction formula. Several formulae exist for the prediction of damage totoe structures. In Figure 4 the expressions that have been published by Gerding (1993), Van der Meer(1998), Muttray (2013), and Van Gent and Van der Werf (2014) are referred to. Although theconditions on which they are based can be different (a large portion of depth-limited conditions inearlier publications) and the definition of damage is different (i.e. NOD only based on stones thatdisappear from the toe in Gerding, 1993, and Van der Meer, 1998, versus all stone that are displaced inVan Gent and Van der Werf, 2014), an indicative comparison is made between the test results and theprediction formulae. This is relevant for those tests that are within the range of validity of existingprediction formulae and because the existing prediction formulae for rock toe structures are often beingapplied for situations like those tested. Figure 4 (lower right) clearly shows that the expression by VanGent and Van der Werf (2014) describes the performed tests much more accurately than other methods.
1,0
1sinh
s
m t
HûT kh 21,0
1,0
2 2
2m
m
k gL T
1/30.1 1/3
50 1/30.32 s t tn
s s sOD
H B t ûDH H gHN
0.3 3
50
0.032 t t sOD
s s n s
t B H ûNH H D gH
COASTAL ENGINEERING 2014 5
Figure 4 Comparison between measured and calculated damage to toe structures.
COASTAL ENGINEERING 20146
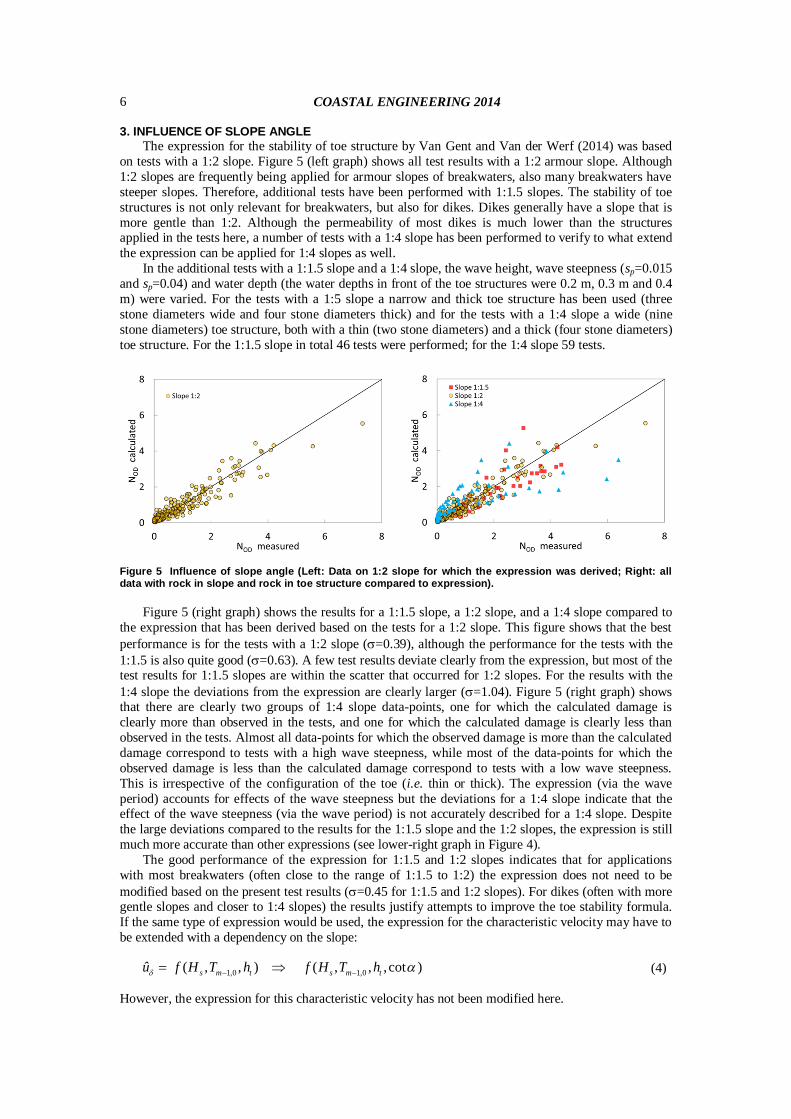
3. INFLUENCE OF SLOPE ANGLEThe expression for the stability of toe structure by Van Gent and Van der Werf (2014) was based
on tests with a 1:2 slope. Figure 5 (left graph) shows all test results with a 1:2 armour slope. Although1:2 slopes are frequently being applied for armour slopes of breakwaters, also many breakwaters havesteeper slopes. Therefore, additional tests have been performed with 1:1.5 slopes. The stability of toestructures is not only relevant for breakwaters, but also for dikes. Dikes generally have a slope that ismore gentle than 1:2. Although the permeability of most dikes is much lower than the structuresapplied in the tests here, a number of tests with a 1:4 slope has been performed to verify to what extendthe expression can be applied for 1:4 slopes as well.
In the additional tests with a 1:1.5 slope and a 1:4 slope, the wave height, wave steepness (sp=0.015and sp=0.04) and water depth (the water depths in front of the toe structures were 0.2 m, 0.3 m and 0.4m) were varied. For the tests with a 1:5 slope a narrow and thick toe structure has been used (threestone diameters wide and four stone diameters thick) and for the tests with a 1:4 slope a wide (ninestone diameters) toe structure, both with a thin (two stone diameters) and a thick (four stone diameters)toe structure. For the 1:1.5 slope in total 46 tests were performed; for the 1:4 slope 59 tests.
Figure 5 Influence of slope angle (Left: Data on 1:2 slope for which the expression was derived; Right: alldata with rock in slope and rock in toe structure compared to expression).
Figure 5 (right graph) shows the results for a 1:1.5 slope, a 1:2 slope, and a 1:4 slope compared tothe expression that has been derived based on the tests for a 1:2 slope. This figure shows that the bestperformance is for the tests with a 1:2 slope ( =0.39), although the performance for the tests with the1:1.5 is also quite good ( =0.63). A few test results deviate clearly from the expression, but most of thetest results for 1:1.5 slopes are within the scatter that occurred for 1:2 slopes. For the results with the1:4 slope the deviations from the expression are clearly larger ( =1.04). Figure 5 (right graph) showsthat there are clearly two groups of 1:4 slope data-points, one for which the calculated damage isclearly more than observed in the tests, and one for which the calculated damage is clearly less thanobserved in the tests. Almost all data-points for which the observed damage is more than the calculateddamage correspond to tests with a high wave steepness, while most of the data-points for which theobserved damage is less than the calculated damage correspond to tests with a low wave steepness.This is irrespective of the configuration of the toe (i.e. thin or thick). The expression (via the waveperiod) accounts for effects of the wave steepness but the deviations for a 1:4 slope indicate that theeffect of the wave steepness (via the wave period) is not accurately described for a 1:4 slope. Despitethe large deviations compared to the results for the 1:1.5 slope and the 1:2 slopes, the expression is stillmuch more accurate than other expressions (see lower-right graph in Figure 4).
The good performance of the expression for 1:1.5 and 1:2 slopes indicates that for applicationswith most breakwaters (often close to the range of 1:1.5 to 1:2) the expression does not need to bemodified based on the present test results ( =0.45 for 1:1.5 and 1:2 slopes). For dikes (often with moregentle slopes and closer to 1:4 slopes) the results justify attempts to improve the toe stability formula.If the same type of expression would be used, the expression for the characteristic velocity may have tobe extended with a dependency on the slope:
(4)
However, the expression for this characteristic velocity has not been modified here.
1,0 1,0( , , ) ( , , , cot )s m t s m tû f H T h f H T h
COASTAL ENGINEERING 2014 7
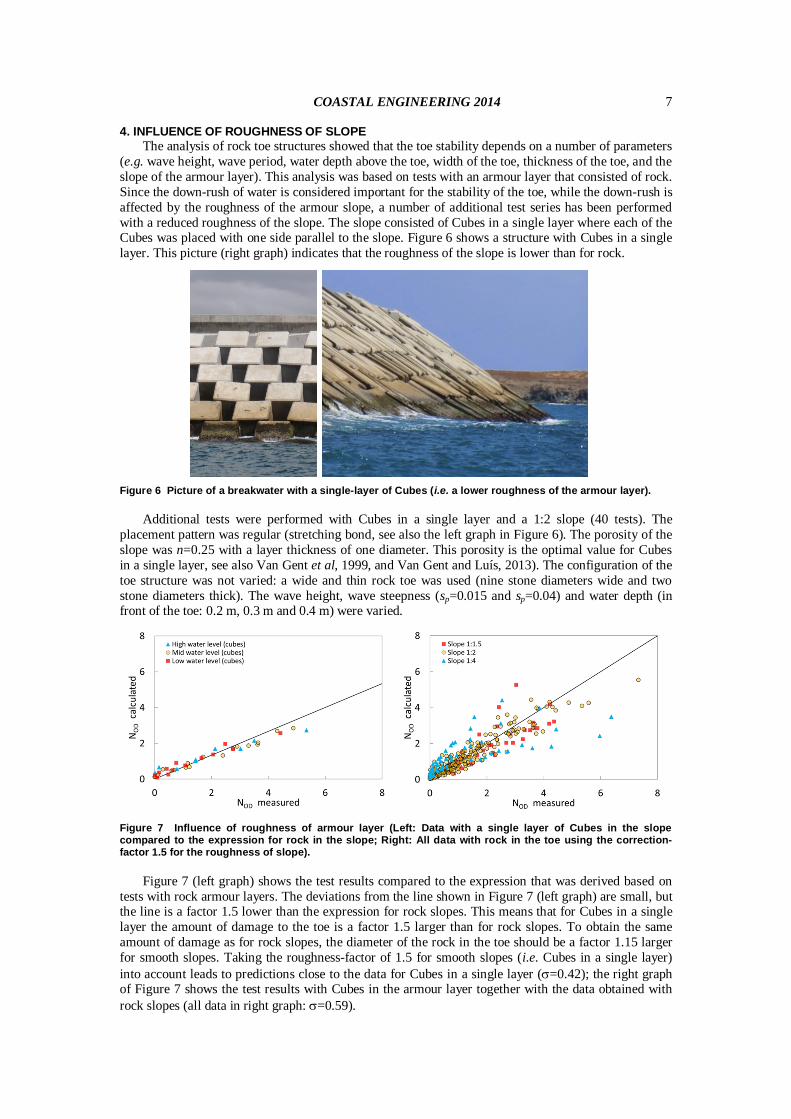
4. INFLUENCE OF ROUGHNESS OF SLOPEThe analysis of rock toe structures showed that the toe stability depends on a number of parameters
(e.g. wave height, wave period, water depth above the toe, width of the toe, thickness of the toe, and theslope of the armour layer). This analysis was based on tests with an armour layer that consisted of rock.Since the down-rush of water is considered important for the stability of the toe, while the down-rush isaffected by the roughness of the armour slope, a number of additional test series has been performedwith a reduced roughness of the slope. The slope consisted of Cubes in a single layer where each of theCubes was placed with one side parallel to the slope. Figure 6 shows a structure with Cubes in a singlelayer. This picture (right graph) indicates that the roughness of the slope is lower than for rock.
Figure 6 Picture of a breakwater with a single-layer of Cubes (i.e. a lower roughness of the armour layer).
Additional tests were performed with Cubes in a single layer and a 1:2 slope (40 tests). Theplacement pattern was regular (stretching bond, see also the left graph in Figure 6). The porosity of theslope was n=0.25 with a layer thickness of one diameter. This porosity is the optimal value for Cubesin a single layer, see also Van Gent et al, 1999, and Van Gent and Luís, 2013). The configuration of thetoe structure was not varied: a wide and thin rock toe was used (nine stone diameters wide and twostone diameters thick). The wave height, wave steepness (sp=0.015 and sp=0.04) and water depth (infront of the toe: 0.2 m, 0.3 m and 0.4 m) were varied.
Figure 7 Influence of roughness of armour layer (Left: Data with a single layer of Cubes in the slopecompared to the expression for rock in the slope; Right: All data with rock in the toe using the correction-factor 1.5 for the roughness of slope).
Figure 7 (left graph) shows the test results compared to the expression that was derived based ontests with rock armour layers. The deviations from the line shown in Figure 7 (left graph) are small, butthe line is a factor 1.5 lower than the expression for rock slopes. This means that for Cubes in a singlelayer the amount of damage to the toe is a factor 1.5 larger than for rock slopes. To obtain the sameamount of damage as for rock slopes, the diameter of the rock in the toe should be a factor 1.15 largerfor smooth slopes. Taking the roughness-factor of 1.5 for smooth slopes (i.e. Cubes in a single layer)into account leads to predictions close to the data for Cubes in a single layer ( =0.42); the right graphof Figure 7 shows the test results with Cubes in the armour layer together with the data obtained withrock slopes (all data in right graph: =0.59).
COASTAL ENGINEERING 20148
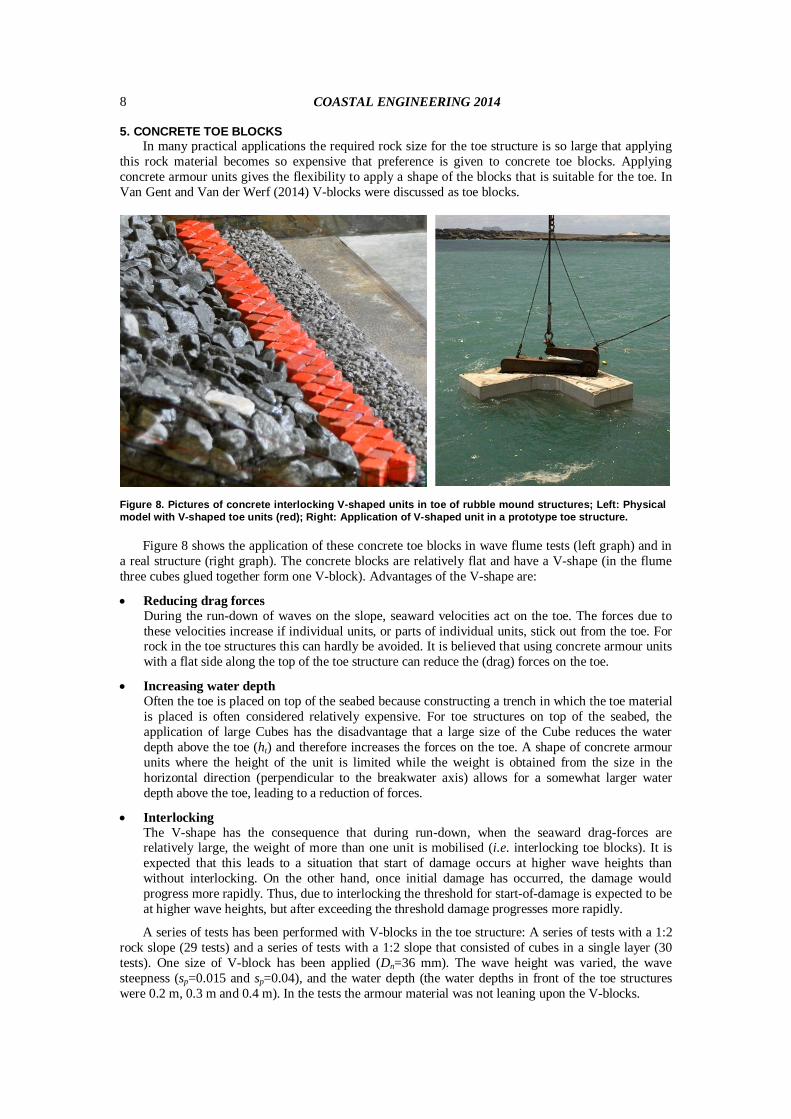
5. CONCRETE TOE BLOCKSIn many practical applications the required rock size for the toe structure is so large that applying
this rock material becomes so expensive that preference is given to concrete toe blocks. Applyingconcrete armour units gives the flexibility to apply a shape of the blocks that is suitable for the toe. InVan Gent and Van der Werf (2014) V-blocks were discussed as toe blocks.
Figure 8. Pictures of concrete interlocking V-shaped units in toe of rubble mound structures; Left: Physicalmodel with V-shaped toe units (red); Right: Application of V-shaped unit in a prototype toe structure.
Figure 8 shows the application of these concrete toe blocks in wave flume tests (left graph) and ina real structure (right graph). The concrete blocks are relatively flat and have a V-shape (in the flumethree cubes glued together form one V-block). Advantages of the V-shape are:
Reducing drag forcesDuring the run-down of waves on the slope, seaward velocities act on the toe. The forces due tothese velocities increase if individual units, or parts of individual units, stick out from the toe. Forrock in the toe structures this can hardly be avoided. It is believed that using concrete armour unitswith a flat side along the top of the toe structure can reduce the (drag) forces on the toe.
Increasing water depthOften the toe is placed on top of the seabed because constructing a trench in which the toe materialis placed is often considered relatively expensive. For toe structures on top of the seabed, theapplication of large Cubes has the disadvantage that a large size of the Cube reduces the waterdepth above the toe (ht) and therefore increases the forces on the toe. A shape of concrete armourunits where the height of the unit is limited while the weight is obtained from the size in thehorizontal direction (perpendicular to the breakwater axis) allows for a somewhat larger waterdepth above the toe, leading to a reduction of forces.
InterlockingThe V-shape has the consequence that during run-down, when the seaward drag-forces arerelatively large, the weight of more than one unit is mobilised (i.e. interlocking toe blocks). It isexpected that this leads to a situation that start of damage occurs at higher wave heights thanwithout interlocking. On the other hand, once initial damage has occurred, the damage wouldprogress more rapidly. Thus, due to interlocking the threshold for start-of-damage is expected to beat higher wave heights, but after exceeding the threshold damage progresses more rapidly.
A series of tests has been performed with V-blocks in the toe structure: A series of tests with a 1:2rock slope (29 tests) and a series of tests with a 1:2 slope that consisted of cubes in a single layer (30tests). One size of V-block has been applied (Dn=36 mm). The wave height was varied, the wavesteepness (sp=0.015 and sp=0.04), and the water depth (the water depths in front of the toe structureswere 0.2 m, 0.3 m and 0.4 m). In the tests the armour material was not leaning upon the V-blocks.
COASTAL ENGINEERING 2014 9
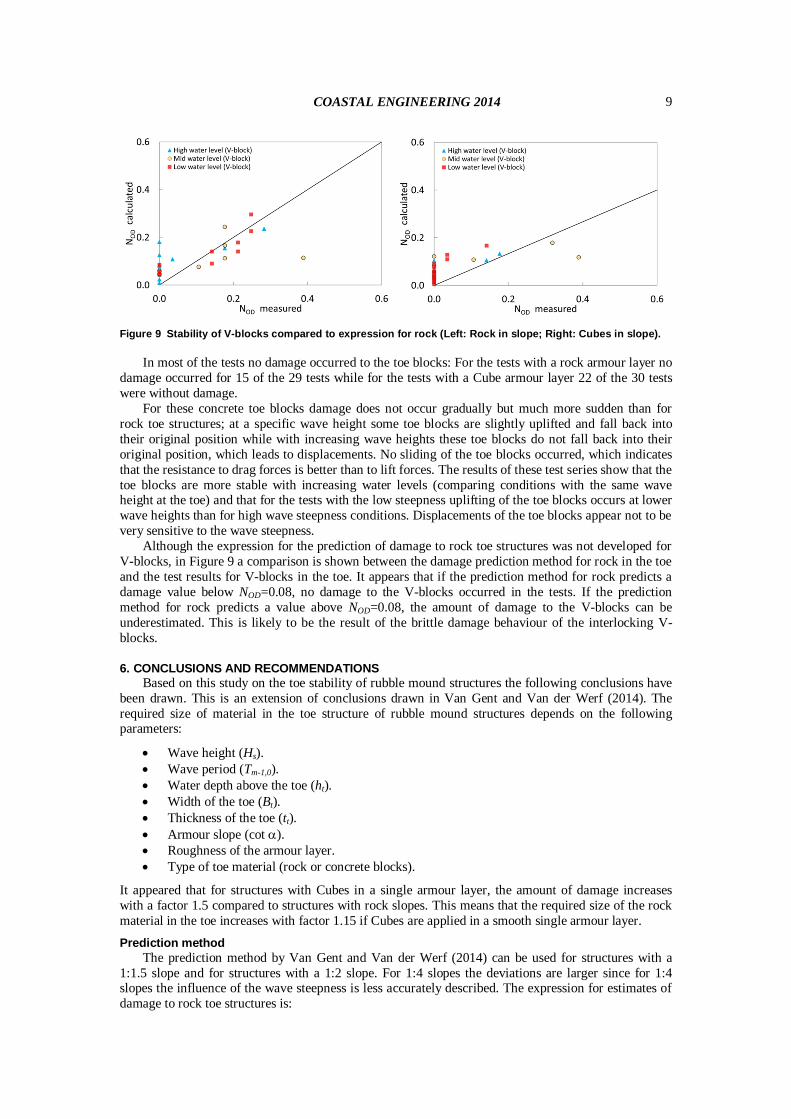
Figure 9 Stability of V-blocks compared to expression for rock (Left: Rock in slope; Right: Cubes in slope).
In most of the tests no damage occurred to the toe blocks: For the tests with a rock armour layer nodamage occurred for 15 of the 29 tests while for the tests with a Cube armour layer 22 of the 30 testswere without damage.
For these concrete toe blocks damage does not occur gradually but much more sudden than forrock toe structures; at a specific wave height some toe blocks are slightly uplifted and fall back intotheir original position while with increasing wave heights these toe blocks do not fall back into theiroriginal position, which leads to displacements. No sliding of the toe blocks occurred, which indicatesthat the resistance to drag forces is better than to lift forces. The results of these test series show that thetoe blocks are more stable with increasing water levels (comparing conditions with the same waveheight at the toe) and that for the tests with the low steepness uplifting of the toe blocks occurs at lowerwave heights than for high wave steepness conditions. Displacements of the toe blocks appear not to bevery sensitive to the wave steepness.
Although the expression for the prediction of damage to rock toe structures was not developed forV-blocks, in Figure 9 a comparison is shown between the damage prediction method for rock in the toeand the test results for V-blocks in the toe. It appears that if the prediction method for rock predicts adamage value below NOD=0.08, no damage to the V-blocks occurred in the tests. If the predictionmethod for rock predicts a value above NOD=0.08, the amount of damage to the V-blocks can beunderestimated. This is likely to be the result of the brittle damage behaviour of the interlocking V-blocks.
6. CONCLUSIONS AND RECOMMENDATIONSBased on this study on the toe stability of rubble mound structures the following conclusions have
been drawn. This is an extension of conclusions drawn in Van Gent and Van der Werf (2014). Therequired size of material in the toe structure of rubble mound structures depends on the followingparameters:
Wave height (Hs).Wave period (Tm-1,0).Water depth above the toe (ht).Width of the toe (Bt).Thickness of the toe (tt).Armour slope (cot ).Roughness of the armour layer.Type of toe material (rock or concrete blocks).
It appeared that for structures with Cubes in a single armour layer, the amount of damage increaseswith a factor 1.5 compared to structures with rock slopes. This means that the required size of the rockmaterial in the toe increases with factor 1.15 if Cubes are applied in a smooth single armour layer.
Prediction methodThe prediction method by Van Gent and Van der Werf (2014) can be used for structures with a
1:1.5 slope and for structures with a 1:2 slope. For 1:4 slopes the deviations are larger since for 1:4slopes the influence of the wave steepness is less accurately described. The expression for estimates ofdamage to rock toe structures is:
COASTAL ENGINEERING 201410
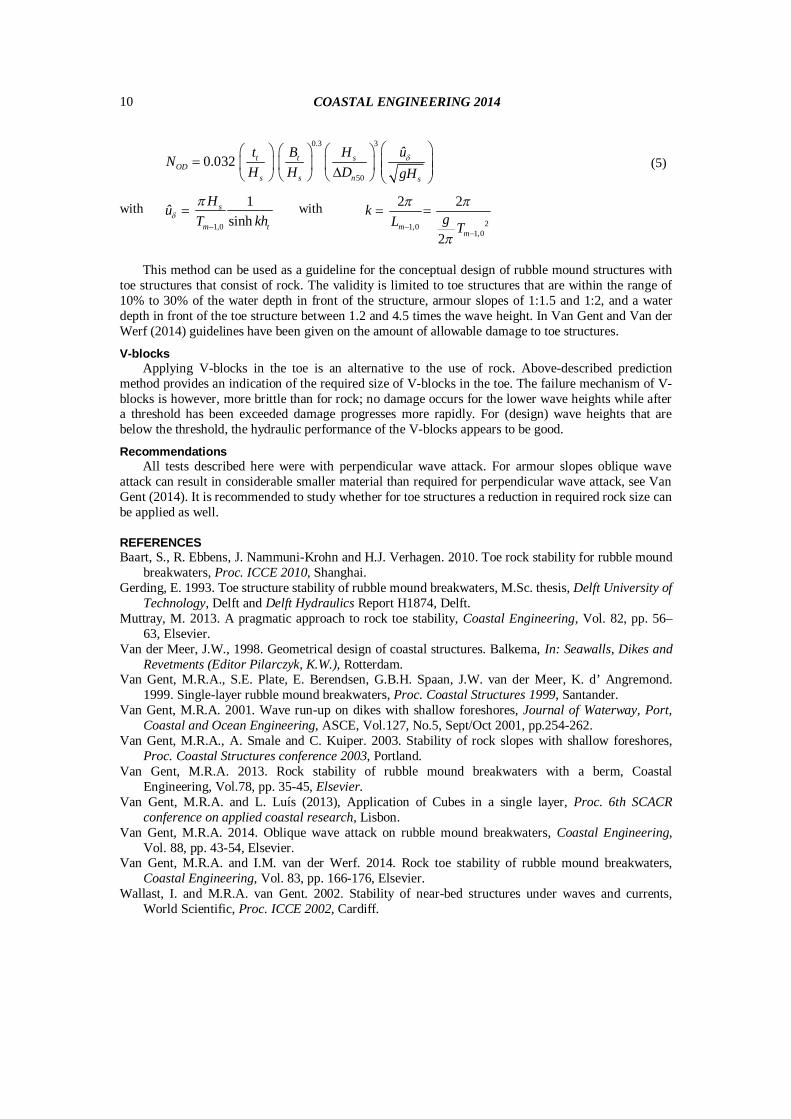
(5)
with with
This method can be used as a guideline for the conceptual design of rubble mound structures withtoe structures that consist of rock. The validity is limited to toe structures that are within the range of10% to 30% of the water depth in front of the structure, armour slopes of 1:1.5 and 1:2, and a waterdepth in front of the toe structure between 1.2 and 4.5 times the wave height. In Van Gent and Van derWerf (2014) guidelines have been given on the amount of allowable damage to toe structures.
V-blocksApplying V-blocks in the toe is an alternative to the use of rock. Above-described prediction
method provides an indication of the required size of V-blocks in the toe. The failure mechanism of V-blocks is however, more brittle than for rock; no damage occurs for the lower wave heights while aftera threshold has been exceeded damage progresses more rapidly. For (design) wave heights that arebelow the threshold, the hydraulic performance of the V-blocks appears to be good.
RecommendationsAll tests described here were with perpendicular wave attack. For armour slopes oblique wave
attack can result in considerable smaller material than required for perpendicular wave attack, see VanGent (2014). It is recommended to study whether for toe structures a reduction in required rock size canbe applied as well.
REFERENCESBaart, S., R. Ebbens, J. Nammuni-Krohn and H.J. Verhagen. 2010. Toe rock stability for rubble mound
breakwaters, Proc. ICCE 2010, Shanghai.Gerding, E. 1993. Toe structure stability of rubble mound breakwaters, M.Sc. thesis, Delft University of
Technology, Delft and Delft Hydraulics Report H1874, Delft.Muttray, M. 2013. A pragmatic approach to rock toe stability, Coastal Engineering, Vol. 82, pp. 56–
63, Elsevier.Van der Meer, J.W., 1998. Geometrical design of coastal structures. Balkema, In: Seawalls, Dikes and
Revetments (Editor Pilarczyk, K.W.), Rotterdam.Van Gent, M.R.A., S.E. Plate, E. Berendsen, G.B.H. Spaan, J.W. van der Meer, K. d’ Angremond.
1999. Single-layer rubble mound breakwaters, Proc. Coastal Structures 1999, Santander.Van Gent, M.R.A. 2001. Wave run-up on dikes with shallow foreshores, Journal of Waterway, Port,
Coastal and Ocean Engineering, ASCE, Vol.127, No.5, Sept/Oct 2001, pp.254-262.Van Gent, M.R.A., A. Smale and C. Kuiper. 2003. Stability of rock slopes with shallow foreshores,
Proc. Coastal Structures conference 2003, Portland.Van Gent, M.R.A. 2013. Rock stability of rubble mound breakwaters with a berm, Coastal
Engineering, Vol.78, pp. 35-45, Elsevier.Van Gent, M.R.A. and L. Luís (2013), Application of Cubes in a single layer, Proc. 6th SCACR
conference on applied coastal research, Lisbon.Van Gent, M.R.A. 2014. Oblique wave attack on rubble mound breakwaters, Coastal Engineering,
Vol. 88, pp. 43-54, Elsevier.Van Gent, M.R.A. and I.M. van der Werf. 2014. Rock toe stability of rubble mound breakwaters,
Coastal Engineering, Vol. 83, pp. 166-176, Elsevier.Wallast, I. and M.R.A. van Gent. 2002. Stability of near-bed structures under waves and currents,
World Scientific, Proc. ICCE 2002, Cardiff.
0.3 3
50
0.032 t t sOD
s s n s
t B H ûNH H D gH
1,0
1sinh
s
m t
HûT kh 21,0
1,0
2 2
2m
m
k gL T