1 The Economic Effects of Community Forest Management in ...
174
The Economic Effects of Community Forest Management in the Maya Biosphere Reserve Dissertation Presented in Partial Fulfillment of the Requirements for the Degree Doctor of Philosophy in the Graduate School of The Ohio State University By Corinne Bocci Graduate Program in Agricultural, Environmental & Developmental Economics The Ohio State University 2019 Dissertation Committee Brent Sohngen, Advisor Daniela Miteva Abdoul Sam Frank Lupi
-
Upload
khangminh22 -
Category
Documents
-
view
3 -
download
0
Transcript of 1 The Economic Effects of Community Forest Management in ...

1
The Economic Effects of Community Forest Management in the Maya Biosphere
Reserve
Dissertation
Presented in Partial Fulfillment of the Requirements for the Degree Doctor of Philosophy
in the Graduate School of The Ohio State University
By
Corinne Bocci
Graduate Program in Agricultural, Environmental & Developmental Economics
The Ohio State University
2019
Dissertation Committee
Brent Sohngen, Advisor
Daniela Miteva
Abdoul Sam
Frank Lupi

2
Copyrighted by
Corinne Bocci
2019

ii
Abstract
This dissertation examines the conservation and economic development effects of
community forest management in the Maya Biosphere Reserve (MBR). Maintaining the
world’s forest resources in developing countries has been a difficult, but necessary task
since conserving tropical forests is crucial for preserving biodiversity and sequestering
carbon. However, many communities located near the forest depend on extracting forest
resources as a source of income and many governments in developing countries cannot
devote enough resources to enforce forest protection efforts. This creates an
overexploitation problem since many of these forests are common-pool resources that are
rivalrous and non-excludable because of the lack of enforcement of the ill-defined
property rights.
To remedy this issue, some countries have provided communal property rights to
encourage sustainable resource use (Ostrom 1990; Schlager and Ostrom, 1992). The idea
is that households will work together and monitor each other to protect the area of land to
which they have property rights from over exploitation. In exchange, the group that
manages the area is given exclusive access to the forest resources and is able to earn a
sustainable source of income. However, for community-based forest management to
have a higher likelihood of being effective, households that are participating in the forest
management system can receive an incentive in addition to the forest being conserved.

iii
The goal of this dissertation is to assess whether the economic development and
conservation benefits of the community forest concessions in the Maya Biosphere
Reserve are effective and whether receiving payments for strict conservation would be
preferred by households. Chapter 1 is an introduction into community forestry and the
background of the Maya Biosphere Reserve. In Chapter 2, I examine the impact of
concession membership on annual household income to determine if the benefits of
participating in community forest management vary by community. Chapter 3 assesses
the private and social benefits of the forest concessions in the Maya Biosphere reserve
and examines whether the combined conservation and development benefits of
implementing the concessions outweigh the costs. In Chapter 4, I use results from a
discrete choice experiment I conducted in Maya Biosphere Reserve communities to
determine whether households would be willing to receive payments for conserving the
forest and sequestering carbon at the expense of sustainable timber harvesting.

ii
Acknowledgements
This work would not have been possible without the support of several
individuals. First, I would like to thank my advisor, Brent Sohngen, for being an
outstanding mentor who has not only provided funding for this life-changing opportunity,
but has given me continual advice, encouragement, and support for this project. Second, I
would like to thank my committee member Daniela Miteva for helping me develop my
skills as a researcher and providing me with research opportunities and supportive advice.
I would also like to thank my committee members Abdoul Sam and Frank Lupi for
serving on my committee and providing valuable feedback on my dissertation.
During my fieldwork in Guatemala, Bayron Milian was instrumental in making
the survey collection process a success by providing me with advice, resources, and
contacts. Additionally, I would like to thank Alexis Scharrer, Sarah Grossman, and
Shelby Stults for their help and support during the data collection process. I would also
like to thank my enumerators Patricia Hor, Gabriel Oliva, Paula Suntecún, Gilmer López,
and Jennefer Salas for their hard work and long hours administering the Guatemalan
household surveys. Finally, my friends and family have also given me endless support
and encouragement throughout my time as a doctoral student. I would especially like to
thank Shicong Xu, Jian Chen, John Dougherty, Beth Robison Botkins, Katy Bender,

iii
Tony Gallenstein, and Khushbu Mishra who have not only given me useful feedback on
this work, but have also been amazing friends.

iv
Vita
2010................................................................Nordonia High School
2014................................................................B.S.B.A. Business Economics, Youngstown
State University
2016................................................................M.S. Agricultural, Environmental, and
Development Economics, The Ohio State
University
2016 to present...............................................Graduate Teaching/Research Associate,
Agricultural, Environmental, and
Development Economics, The Ohio State
University
Publications
Bocci, C., Fortmann, L., Sohngen, B., & Milian, B. “The impact of community forest
concessions on income: an analysis of communities in the Maya Biosphere Reserve.”
World Development, 107, 10-21
Fields of Study
Major Field: Agricultural, Environmental, and Development Economics
v
Table of Contents
Abstract ............................................................................................................................... ii
Acknowledgements ............................................................................................................. ii
Vita ..................................................................................................................................... iv
List of Tables .................................................................................................................... vii
List of Figures .................................................................................................................. viii
Chapter 1. Community Forestry in the Maya Biosphere Reserve ...................................... 1
1.1 Community Forestry ................................................................................................. 1
1.2 Maya Biosphere Reserve Background ...................................................................... 5
Chapter 2. The Impact of Forest Concessions on Income ............................................... 10
2.1 Introduction ............................................................................................................. 10
2.2 Model of Household Labor Allocation ................................................................... 14
2.3 Data ......................................................................................................................... 22
2.4 Empirical Methods .................................................................................................. 28
2.5 Results ..................................................................................................................... 31
2.6 Conclusion .............................................................................................................. 38
Chapter 3: Assessing the private and social benefits of forest concessions in the Maya
Biosphere Reserve ............................................................................................................ 42
3.1 Introduction ............................................................................................................. 42
3.2 Data ......................................................................................................................... 47
3.2.1 Household Survey Data Collection .................................................................. 47
3.2.2 Biophysical Dara .............................................................................................. 52
3.3 Theory ..................................................................................................................... 53
3.4 Estimation ............................................................................................................... 55
3.4.1 Effect of concession membership on income .................................................. 55
3.4.2 Effect of concession management on conservation outcomes ......................... 61

vi
3.5 Results ..................................................................................................................... 65
3.5.1 Income effect ................................................................................................... 65
3.5.2 Conservation effect .......................................................................................... 69
3.5.3 Conservation and income trade-offs ................................................................ 72
3.5.4 Concession valuation ....................................................................................... 74
3.6 Conclusion .............................................................................................................. 76
Chapter 4: Timber or Carbon? Evaluating forest conservation strategies through a
discrete choice experiment ................................................................................................ 80
4.1 Introduction ............................................................................................................. 80
4.2 Methods and Data ................................................................................................... 84
4.2.1 Maya Biosphere Reserve Household Characteristics ...................................... 84
4.3.2 The Choice Experiment Instrument ................................................................. 89
4.3 Model Specification ................................................................................................ 92
4.4 Results and Discussion ........................................................................................... 95
4.5 Conclusion ............................................................................................................ 104
Bibliography ................................................................................................................... 108
Appendix A.1: Chapter 2 ................................................................................................ 122
Appendix A.2: Chapter 2 ................................................................................................ 125
Appendix B.1: Chapter 3 ................................................................................................ 126
Appendix B.2: Chapter 3 ................................................................................................ 131
Appendix C.1: Chapter 4 ................................................................................................ 133
vii
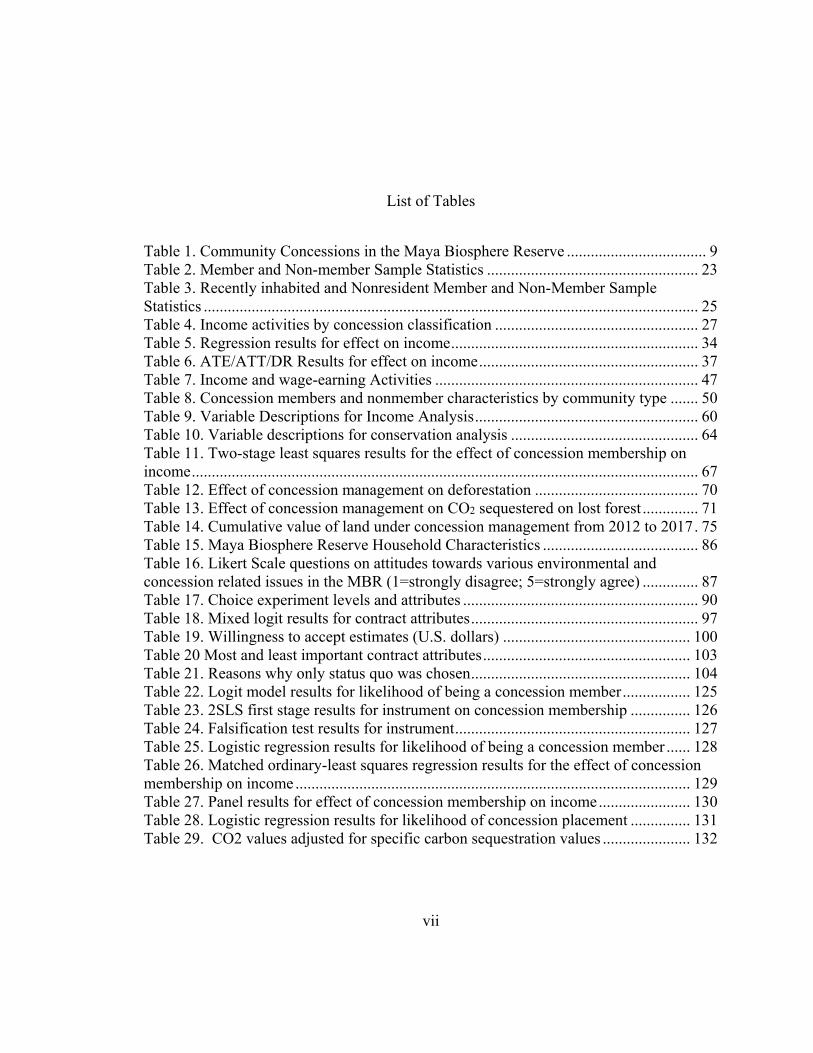
List of Tables
Table 1. Community Concessions in the Maya Biosphere Reserve ................................... 9
Table 2. Member and Non-member Sample Statistics ..................................................... 23
Table 3. Recently inhabited and Nonresident Member and Non-Member Sample
Statistics ............................................................................................................................ 25
Table 4. Income activities by concession classification ................................................... 27
Table 5. Regression results for effect on income .............................................................. 34
Table 6. ATE/ATT/DR Results for effect on income ....................................................... 37
Table 7. Income and wage-earning Activities .................................................................. 47
Table 8. Concession members and nonmember characteristics by community type ....... 50
Table 9. Variable Descriptions for Income Analysis ........................................................ 60
Table 10. Variable descriptions for conservation analysis ............................................... 64
Table 11. Two-stage least squares results for the effect of concession membership on
income ............................................................................................................................... 67
Table 12. Effect of concession management on deforestation ......................................... 70
Table 13. Effect of concession management on CO2 sequestered on lost forest .............. 71
Table 14. Cumulative value of land under concession management from 2012 to 2017 . 75
Table 15. Maya Biosphere Reserve Household Characteristics ....................................... 86
Table 16. Likert Scale questions on attitudes towards various environmental and
concession related issues in the MBR (1=strongly disagree; 5=strongly agree) .............. 87
Table 17. Choice experiment levels and attributes ........................................................... 90
Table 18. Mixed logit results for contract attributes ......................................................... 97
Table 19. Willingness to accept estimates (U.S. dollars) ............................................... 100
Table 20 Most and least important contract attributes .................................................... 103
Table 21. Reasons why only status quo was chosen ....................................................... 104
Table 22. Logit model results for likelihood of being a concession member ................. 125
Table 23. 2SLS first stage results for instrument on concession membership ............... 126
Table 24. Falsification test results for instrument ........................................................... 127
Table 25. Logistic regression results for likelihood of being a concession member ...... 128
Table 26. Matched ordinary-least squares regression results for the effect of concession
membership on income ................................................................................................... 129
Table 27. Panel results for effect of concession membership on income ....................... 130
Table 28. Logistic regression results for likelihood of concession placement ............... 131
Table 29. CO2 values adjusted for specific carbon sequestration values ...................... 132

viii
List of Figures
Figure 1. Maya Biosphere Reserve ..................................................................................... 8

1
Chapter 1. Community Forestry in the Maya Biosphere Reserve
1.1 Community Forestry
Many tropical forests are located in developing regions where local households
depend on forest resources or the land on which forest resources exist for their
livelihoods. Developing regions also may not have the strong governance that is
necessary to protect large areas of tropical forests from being overexploited by
households. Forests are then susceptible to open access concerns, where over-extraction
occurs to the point where land rents converge to zero, the forest no longer sequesters
carbon and provide provisions for biodiversity, and low-income households cannot
benefit from the resource. (Gordon, 1954; Scott, 1955).
Some developing countries have tried to resolve this issue by giving property
rights over forestland to local communities. The idea behind devolving land use rights to
communities is to encourage sustainable resource use and conservation (Ostrom, 1990;
Schlager & Ostrom, 1992). Typically, the property rights come with stipulations that the
households protect the forest from deforestation and degradation. However, for
households to be willing to participate in forest conservation efforts in exchange for land
use rights, they must have an incentive to abide by the restrictions. In the case of
community forestry in the MBR and in other developing countries, the incentive for
households to continue protecting the forest occurs when they receive income from

2
sustainable resource extraction. There is evidence that community-managed forest
concessions have succeeded in decreasing deforestation (Primack et al, 1998; Kumar
2002; Nittler & Tschinkel, 2005; Agrawal & Chhatre, 2006; Bray et al, 2008; García-
Amado et al, 2012; Blackman, 2015; Fortmann et al, 2017). However, whether
community forestry provides enough incentive for households (i.e. increased livelihoods)
to continue to participate in conservation efforts is an underexplored issue.
The goal of this dissertation is to assess the benefits and costs of community
forest management in the context of the MBR in the Petén department in northern
Guatemala. In addition, I examine the conservation and development objectives of
community forestry, and I assess whether the existing incentives can sustain the forest
management system. I contribute to the existing literature by assessing whether the
combined conservation and development benefits of forest concessions in the MBR
outweigh the costs as well as determine whether households would prefer to receive
payments for carbon sequestration instead of sustainable timber harvesting.
This dissertation is structured as follows. Section 1.2 contains background
information about the Maya Biosphere Reserve as well as the buffer zone. It describes
how the reserve was created, the different areas of the MBR, and how households are
granted access to a forest concession.
The second chapter assesses the impact of being a member of a community forest
concession on income. In this chapter, I examine whether being a concession member
increases annual household income and whether the income effect varies by community.
The dataset used contains information on household income and various demographic

3
characteristics from concession member and nonmember households in 2012. To find the
impact of concession membership on annual income, I first use matching to preprocess
the sample. Then, I use an ordinary least squares regression (OLS) and compare the
results to a doubly robust, average treatment effect, and average treatment effect on the
treated estimators. The results show that, overall, being a concession member leads to
increased annual household income, however the magnitude of the results varies by
community. For example, for households in recently-inhabited communities, which are
comprised of households with backgrounds in agriculture and cattle ranching, being a
concession member has no statistically significant effect on annual household income
earnings. However, in nonresident communities, which are comprised of households that
frequently use forestry as a supplemental source of income, the impact of being a
concession member on annual household income is positive and significant.
Chapter 3 examines the private and social benefits of the community forest
concessions and whether there are trade-offs between conservation and development in
the MBR. I then use this information to develop methods to determine if the benefits of
implementing community forest concessions in the MBR outweigh the costs. This
chapter begins by assessing whether households that participate in a concession earn
more annual income than similar households that do not participate in a concession and
whether the effect is stable over time. I use a two-stage least squares instrumental
variable approach (2SLS) and data from household surveys of MBR concession members
and nonmembers in 2012 and 2017 to determine if concession members earn higher
annual incomes than similar nonmembers. The results show that, on average, being a

4
concession member leads to higher annual household incomes and the effect of
concession membership on income increased from 2012 to 2017.
To quantify the environmental benefits, I first determine whether concessions
decrease deforestation. I use satellite imagery data and a fixed effects panel estimator to
determine if forest concessions decrease deforestation from 2012 to 2017 and find that
the forest concessions decrease deforestation. I then use the deforestation results to find
the impact of concession membership on carbon storage and use the social cost of carbon
to determine the monetary value of the additional carbon stored by the concessions.
Finally, I compare the conservation and income benefits to an estimate of the costs of
implementing the concessions and find that, on average; the benefits of the community
forest concessions outweigh the costs. In addition, in two of the three concession
communities, concessions both reduce deforestation and increase livelihoods, which
implies that there are complementarities between conservation and development.
Chapter 4 examines the willingness to accept of households in communities in the
MBR to conserve forests that sequester carbon through strict conservation efforts instead
of through sustainable timber harvesting. This chapter has two objectives. One objective
is to determine which attributes of a Payments for Ecosystem Services contract (PES) are
most valued by the households that would be required to abide by the contract. The
second objective is to determine whether forest-dwelling households prefer to engage in
sustainable timber harvesting or receive payments for carbon sequestration through strict
conservation and restricted access to the forest. I assess the households’ preferences
through a discrete choice experiment conducted in communities in the MBR and find that

5
households on average prefer to receive payments for carbon storage instead of
sustainable timber harvesting, but most prefer to continue to use forest resources for non-
timber forest product harvesting and ecotourism.
1.2 Maya Biosphere Reserve Background
The MBR was created in 1990 and covers about 2 million hectares of the Petén
department, which is about one-fifth the size of Guatemala. The reserve provides habitat
for numerous important species, such as Macaw (Ara ararauna) and Jaguars (Panthera
onca), and they contain significant cultural resources as the region is the ancestral center
of Maya civilization. The MBR is divided into three zones: the core zone, buffer zone,
and multiple-use zone. The core zone is 36% of the reserve and consists of national
parks and biotopes. It is generally reserved only for low impact tourism and scientific
investigation and receives strict protection. The buffer zone is 24% of the MBR and
forms a “buffer” around the southern border of the MBR. It was created to divert land-
use change pressure away from the core zone. The multiple-use zone is 40% of the
MBR, but unlike the core zone, it is not strictly protected. Within the multiple-use zone,
sustainable timber harvesting is permitted by forest concessions. The forest concessions
in this region were developed in the late 1990s to provide property rights to local groups
who would use the forest for sustainable (Forest Stewardship Council certified) timber
harvesting, non-timber forest product harvesting, and ecotourism. In return the groups
work to ensure that deforestation does not occur within their boundaries. Forest
concessions were encouraged with financial support from USAID after the command-
and-control approach by the government failed to adequately protect the MBR. To apply

6
for a concession, households within communities organize themselves into concession
member groups and apply for a concession through the National Council for Protected
Areas, or CONAP. To be granted a concession, community organizations need to
demonstrate that they can manage the forest resources sustainably. The concession
members within the communities had to partner with a non-governmental organization of
their choice that helped them develop a sustainable forest management plan and obtain
forest management certification from the Forest Stewardship Council (FSC) within three
years of being granted the concession. Upon approval by CONAP, the concession
members were granted exclusive, renewable land use rights to their forested area for 25
years (Radachowsky et al., 2012).
The other activities that are currently permitted within the concessions in the
MBR are ecotourism and non-timber forest product harvesting. These activities require a
separate certification from CONAP and the Forest Stewardship Council, but are generally
granted along with the sustainable timber harvesting rights. From 1994 to 2002, CONAP
granted twelve communities and two companies forest concessions. However, since
2009, three of these concessions have been cancelled or suspended because they did not
abide by FSC standards (Radachowsky et al, 2012).
In the MBR context, communities that manage the forest concessions fall into
three distinct classifications: nonresident, recently-inhabited, and long-inhabited.
Households in nonresident concession communities reside outside of the multiple-use
zone (MUZ) boundaries in larger towns and cities. Many have jobs outside of forestry
and agriculture and use forest concessions as a supplemental source of income. Recently-

7
inhabited households typically have backgrounds in agriculture and cattle ranching and
moved into the MUZ communities around the time the MBR was established. Long-
inhabited households have lived within the MUZ for multiple generations. Households
within these communities have historically depended on harvesting timber and non-
timber forest products for their livelihoods. There are also industrial concessions, which
are managed by private companies, but still need to abide by the restrictions on timber
harvesting set by the Forest Stewardship Council (Radachowsky et al., 2012; Fortmann et
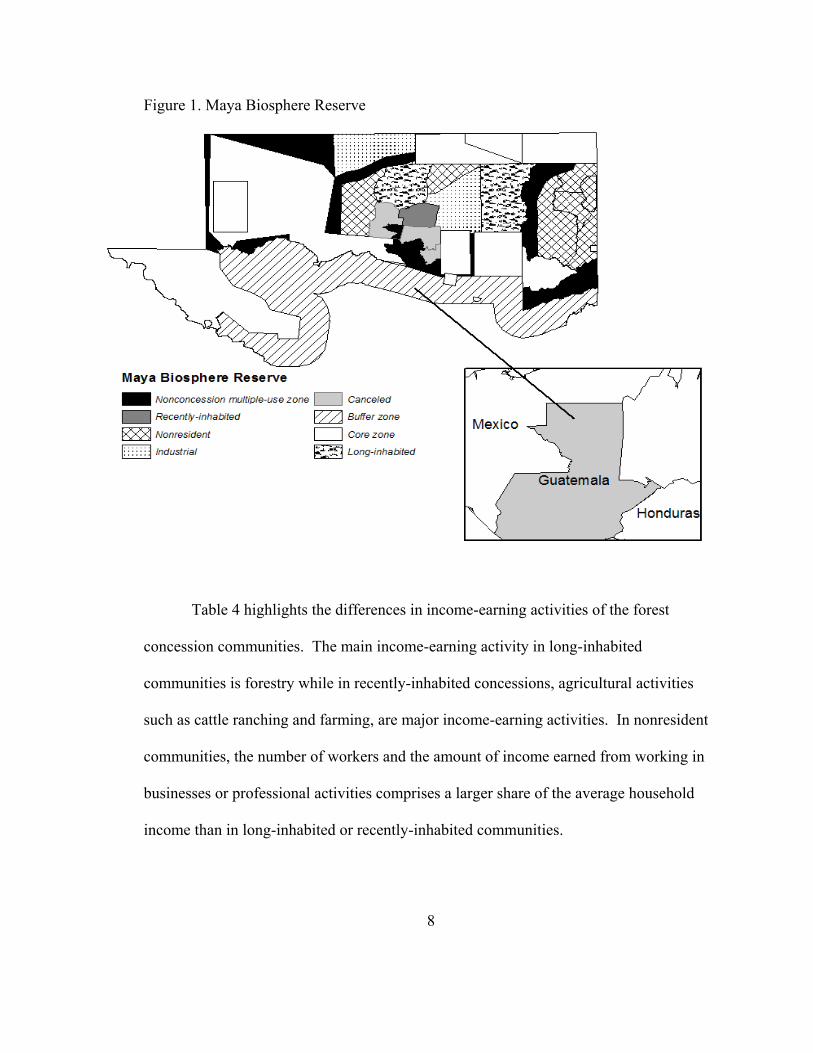
al., 2017). Figure 1 shows a map of the Maya Biosphere Reserve and the location of
nonresident, recently-inhabited, long-inhabited, and industrial concessions. Table 1
shows information about the established and canceled concessions.
8
Figure 1. Maya Biosphere Reserve
Table 4 highlights the differences in income-earning activities of the forest
concession communities. The main income-earning activity in long-inhabited
communities is forestry while in recently-inhabited concessions, agricultural activities
such as cattle ranching and farming, are major income-earning activities. In nonresident
communities, the number of workers and the amount of income earned from working in
businesses or professional activities comprises a larger share of the average household
income than in long-inhabited or recently-inhabited communities.

9
Table 1. Community Concessions in the Maya Biosphere Reserve
Concession
Classification
Management
Unit Organization Name
Size
(ha)
Year
Formed
No. of
Members
Long-inhabited
Carmelita Cooperativa
Carmelita 53,797 1997 174
Uaxactún
Sociedad Civil
Organización,
Manejo y
Conservación
Uaxactún (OMYC)
83,558 2000 280
Recently-
inhabited
Cruce a la
Colorada
Asociación Forestal
Cruce a la Colorada 20,469 2001 65
Canceled/
suspended
San Miguel la
Palotada
Asociación Forestal
San Miguel La
Palotada
7,039 1994 39
La Pasadita
Asociación de
Productores La
Pasadita
18,817 1997 122
La Colorada Asociación Forestal
La Colorada 27,067 2001 48
Nonresident
Río Chanchich
Sociedad Civil
Impulsores
Suchitecos
12,117 1998 22
Chosquitán
Sociedad Civil
Laborantes del
Bosque
19,390 2000 74
San Andrés Asociación Forestal
Integral San Andrés 51,940 2000 170
Las Ventanas Sociedad Árbol
Verde 64,973 2001 309
La Unión
Sociedad Civil
Custodios de la
Selva (CUSTOSEL)
21,177 2002 85
Yaloch Sociedad Civil El
Esfuerzo 25,386 2002 39
Industrial
Paxbán GIBOR, S.A. 65,755 1999 N/A
La Gloria Baren Comercial
Ltda. 66,548 1999 N/A

10
Chapter 2. The Impact of Forest Concessions on Income1
2.1 Introduction
Many of the world’s most valuable forests are located in developing countries
where individuals in local communities often depend on forests for their livelihood.
Although protection policies may exist, many governments do not, or cannot, devote
enough resources to enforce forest protection to prevent over-exploitation in the form of
unsustainable timber harvesting or conversion to agriculture. This issue is a common
property resource (CPR) overexploitation problem, where the forest resources are
rivalrous and nonexcludable, even when the government claims control. Because
resources ultimately are limited, land rents will be dissipated (Gordon, 1954; Besley,
1995; Galiani and Schargrodsky, 2010; Arágon et al, 2015). The solution in many cases
is to provide for property rights, either individually or in groups.
In the case of natural resource management, communal property rights have been
used widely and have encouraged sustainable resource use (Ostrom 1990; Schlager and
Ostrom, 1992). Where it is difficult to exert property rights over large areas of forests,
particularly in developing countries, many governments have opted for community-
managed common property resource systems. In these systems, local communities are
1 A version of this chapter was published in World Development in July 2018.

11
granted property rights to manage large forest estates in exchange for adopting
sustainable forest management practices. With the proper incentive (e.g., sustainable
livelihoods through avoided rent dissipation), the idea is that individuals in groups will
work together to protect the resource to ensure they can benefit from the resource in the
long run. There is evidence that community-based forest concession policies have
succeeded in decreasing deforestation (Primack et al, 1998; Kumar 2002; Nittler and
Tschinkel, 2005; Agrawl and Chhatre, 2006; Bray et al, 2008; García-Amado et al, 2012;
Blackman, 2015; Fortmann et al, 2017). However, other studies suggest that, although
community forest management may reduce forest degradation or increase tree density
and basal area, it does not always succeed in reducing deforestation (Bowler et al, 2012;
Samii et al, 2014; Pelletier et al, 2016).
Questions remain about whether community forest management can be sustained.
Sustainability requires an incentive, and while forest concession policies appear to have
had an impact on observable deforestation, it is not obvious that the rural populations
they serve have benefited with higher income. For example, Meilby et al. (2014) finds
mixed results with forest-dependent communities in Nepal. Primack et al. (1998) find that
the ejidos (communal pieces of farmland) in the Calakmul Biosphere Reserve decrease
deforestation and provide a sustainable source of income for community families. Kumar
(2002) finds that Joint Forest Management (JFM) systems in India have been successful
at reducing deforestation, but resulting benefits have only gone to the rural elite.
Adhikari et al, (2004) and Adhikari, (2005) report similar findings in Nepal, but also

12
show that socioeconomic characteristics of community groups affect individual
outcomes.
One reason for the mixed results may be free riders (Holmstrom, 1982). Although
free-riders may dissipate rents, Rotemberg (1994) suggests that efficient production and
cooperation can occur if altruism exists among team members. For example, when goods
are produced jointly by teams, an increase in a team member’s compensation can benefit
an individual if it has a positive effect on his/her own future earnings through increased
productivity of a team member. The theory outlined in Rotemberg (1994) depends on
workers knowing that their team members display similar patterns of trust and altruism.
If trust is not present, members will behave more selfishly and exert a suboptimal level of
effort if they are paid as a function of total team output alone (Holmstrom, 1982). In
some cases, however, teamwork and cooperation have been shown empirically to
increase productivity (Hamilton et al, 2003). Thus, with the right incentives and if
altruism is present, teams may increase productivity.
In this paper, we assess whether a communal property rights system in the Maya
Biosphere Reserve in Guatemala increases household income among rural households
involved in the community systems versus similar households that are not involved in
them. The systems we examine are community-based forest concessions, which provide
concession members with land-use rights to extract timber and non-timber forest products
sustainably on forestland within the reserve. For our analysis, we compare household
income levels among community concession members and neighboring non-members
using data from a household survey conducted in 2012. This region is unique because

13
there are three types of concessions that differ along socio-economic and cultural
backgrounds (Maas and Cabrera, 2008; Radachowsky et al, 2012). These differences
allow us to assess whether trust and cohesive group formation influence the effect of
concession membership on household income. Fortmann et al. (2017) show that these
differences do influence deforestation rates, but they do not investigate effects on
household welfare, although there may be other factors that contribute to the
effectiveness of being a concession member on household income,
The paper begins with a household labor allocation model where households in
the reserve allocate labor between agricultural activities and forest harvesting activities. If
forest harvesting activities are relatively more productive under the concession, this leads
to higher income levels for member households. This result relies on the relatively higher
forest product harvesting productivity of group membership. If groups are not more
productive than individuals, because, for instance, they lack trust and cohesiveness, then
group members will not necessarily have higher income.
Although we assume in the theory model that households are more productive at
forest harvesting as concession members, in the case of the Maya Biosphere Reserve,
being part of a team may be more of a burden on some households than others. For
example, if individuals who did not previously know each other came together simply to
obtain a land-use right through the formation of a concession, it may be hard for
individuals to trust each other. As a result, they will be more likely to dissolve the
contract and treat the concession land as open access. To test for this, we assess income
differentials empirically across individuals inside and out of concessions and compare

14
our results for different classes of concessions. There is also the possibility of selection
bias since unobservable factors about the households may lead to increases in income.
Also, being wealthier may lead to a higher likelihood of being a concession member
(reverse causality). To control for the possibility of selection bias, we employ matching
techniques.
The “Model of Optimal Household Labor Allocation” section of the paper
illustrates theoretically why joint production in the forest setting can lead to greater
income than individual production, and the “Results” section presents our regression
results. Our findings suggest that the effect of concession membership on annual income
is positive, but there is heterogeneity among communities in the Maya Biosphere
Reserve. Members of recently inhabited concessions, composed of many individuals
who have recently migrated to the area, do not gain income relative to non-concession
members, while the non-inhabited concessions, composed of individuals with stronger
ties to the region and those engaged largely in forestry, gain income. These results are
robust across several tests for selection effects.
2.2 Model of Household Labor Allocation
We start by assuming that households can be members of a concession in the
MBR, or work individually. Concessions in turn are given community land-use rights to
the land on which they reside, through which the group, not individuals, decides how to
manage the land. As long as benefits to the individuals in the groups are large enough,
this arrangement can remedy the problem of overexploitation described by Gordon
(1954), Scott (1955), and Hardin (1968). Each household earns wages and/or dividends

15
from forest production (including both timber and non-timber products), and in return
concession members must manage the forest in a way that avoids overexploitation and
allows the resource to regenerate for future use. Harvesting forest resources, however, is
not the only land-use option households in and around the MBR have for generating
income; they can also illegally clear forestland to use for agricultural production2. For
both concession members and non-members, there exists a tradeoff between labor
allocated to forest-related production and labor allocated to agricultural production.
We start by assuming that utility is gained from income and that income is based
on two activities: agricultural production and harvesting timber and non-timber forest
products. Other activities could be substituted for the agricultural production function
included in the model and the same results would apply although we focus on a tradeoff
between an activity that requires the conversion of forestland to pasture (agriculture) and
an activity meant to harvest resources sustainably and reduce deforestation (forestry). We
assume in this model that external factors such as corruption, illegal land speculation, and
organized crime that have been ongoing issues in the MBR and may affect household
labor decisions (Radachowsky et al, 2012), are equally as likely to affect each
concession.
Each household in our sample is classified as either a concession member or
non-member. Concession membership is voluntary, but membership is limited only to
those who applied for the sustainable land use rights. (Radachowsky et al, 2012). The
2 Although clearing the forest within in MBR is illegal, we assume that without being subject to a
protection regime, there is no protection for the forests and households can clear land for agriculture with
no consequences.

16
households maximize expected utility by choosing labor allocated to agriculture or
forestry, La and Lf, but income generated from each activity is dependent on membership
status. Concession members have communal rights to a section of forestland but must
manage the forest collectively. Profits earned from forest production, thus, depend on the
cooperation of other concession members (Radachowsky et al, 2012).
Households who are concession members maximize the following utility
function:
( ) ( ( ) ( , ) (L ))
. . L L
0
0
0
i j
i
j
i i i a i a f i f f a f
a f
a
f
f
U I U P A L P F L L w L
s t L
L
L
L
(1)
In (1), L represents the total labor force of household i. La and Lf represent the amount of
labor the household allocates to agriculture and forest production respectively. In this
model, the wage of agricultural and forest-related labor is the same per unit and is
represented by w. 𝐴𝑖(𝐿𝑎𝑖) is household i’s agricultural production function. Because
forest concessions are managed at the community level, each household’s forest resource
harvesting productivity is dependent on their individual production function, as well as
the labor and cooperation of other members. Concession household i’s production
function for timber and non-timber forest products is expressed as 𝐹𝑖 (𝐿𝑓𝑖, 𝐿𝑓𝑗
), where 𝐿𝑓𝑗
is the amount of labor other member households (j) allocate to forest-related activities.
Both 𝐴𝑖(𝐿𝑎𝑖) and 𝐹𝑖 (𝐿𝑓𝑖
, 𝐿𝑓𝑗) have decreasing returns to scale. Pa and Pf are the market
price per unit of agriculture and forest output respectively. Because the community is

17
given land rights to the property and training on how to successfully manage the forest
from a partner forest management organization, individuals who are members of the team
are relatively more productive at harvesting forest resources than if they are not part of
the concession. Thus, the production function for concession membership is relatively
more productive for all households at each level of Lf, or 𝐹𝑖 (𝐿𝑓𝑖, 𝐿𝑓𝑗
) > 𝐹𝑖(𝐿𝑓𝑖) for all i
and j3. Given their different backgrounds, households in the Petén have different levels
of agricultural and forest harvesting productivity. For example, residents of long-
inhabited community concessions will likely be more productive at harvesting forest
products than households in a recently inhabited or nonresident concession because they
or their families have lived in the MBR for multiple generations and have depended on
the forest for their livelihood.
The Lagrangian the concession members maximize is shown by equation (2) and
the first order conditions with respect to La, L, 𝐿𝑓𝑖 and 𝐿𝑓𝑗
are shown by equation (3).
( ( ) ( ,L ) ( )) ( )i i j i i i im i a i a f i f f a f i a fU P A L P F L w L L L L L (2)
'
'
'
: * ( ( ) ) 0
: * (P F ( ,L ) ) 0
: * ( ( , )) 0
L : w 0
i
i i j
j i j
a a a i a
f f f i f f
f f f i f f
L MU P A L w
L MU L w
L MU P F L L
(3)
One result is that the market wage, w, is equal to the shadow price of labor, or ʎ.
Additionally, household i’s utility is maximized when the marginal utility gained from
3 We are assuming that there is perfect information among concession households so each concession
member knows how much labor and effort is contributed by all other concession members.

18
allocating one additional unit of labor to agriculture is equal to the marginal utility gained
from allocating one additional unit of labor to forest related activities. This is shown by
equation (4) below
( , )
( )
i j
i
f i f fa
f a i a
P F L L wMU
MU P A L w
(4)
As shown by equation (4), the amount of labor each household will allocate to forestry
and agricultural production to maximize their utility will depend on 𝐴𝑖(𝐿𝑎𝑖) and
𝐹𝑖 (𝐿𝑓𝑖, 𝐿𝑓𝑗
) .
Concession policies aim to enhance welfare through the production function
𝐹𝑖 (𝐿𝑓𝑖, 𝐿𝑓𝑗
) . If the concession is managed successfully, 𝐹𝑖 (𝐿𝑓𝑖, 𝐿𝑓𝑗
) will yield more
marginal income for every unit of labor allocated to forest production than the non-
member production function. This is due to the added benefit of management training and
land-use rights as well as the gains from cooperation (i.e. labor allocated to forest
production from all other member households in the community, or 𝐿𝑓𝑗 ). The forest
production function assumes households who are members comply with the rules
associated with the concession and are aware that violating these rules will result in
membership termination. The added benefit (if successful) from the production function
𝐹𝑖 (𝐿𝑓𝑖, 𝐿𝑓𝑗
) is therefore dependent on household i and all other concession member
households abiding by the rules of the concession.
The effect of concession membership on income in the MBR ultimately depends
on the characteristics of the households in the concession communities. To assess the

19
implications of these characteristics on whether concession policies may be successful,
we examine different scenarios involving 𝐴𝑖(𝐿𝑎𝑖) and 𝐹𝑖 (𝐿𝑓𝑖
, 𝐿𝑓𝑗) , as well as the possible
income effects concession membership would have in each scenario. For simplicity, we
only examine the cases where the concession policy encourages 𝐹𝑖 (𝐿𝑓𝑖, 𝐿𝑓𝑗
) > 𝐹𝑖(𝐿𝑓𝑖) for
each unit of labor household i allocates to forest resource harvesting. Also, we assume
that the possible reallocation of labor does not have an impact on market prices for
agricultural products or forest resources. In what follows, we consider three cases based
on this model that are relevant for our analysis.
Case 1: 𝐴𝑖(𝐿𝑎𝑖) > 𝐹𝑖 (𝐿𝑓𝑖
, 𝐿𝑓𝑗) > 𝐹𝑖(𝐿𝑓𝑖
) for all levels of labor allocated to agricultural
production and forest resource harvesting
In this scenario household i is relatively more productive at agricultural
production than forest resource harvesting both with and without concession
membership. Although concession membership results in higher productivity of forest
labor, household i is still relatively more productive at agriculture than forest resource
harvesting. Even if household i were to become a member of a forest concession, they
would keep the labor allocation the same, or they may reallocate some labor to forest
harvesting. As a result, concession membership would lead to an increase in income for
household i, or would have no effect on income. We suspect that Case 1 could represent
nonresident concession members because they appear to use forestry primarily as a
supplement to their wage-earning jobs in larger towns and cities. It is not clear whether
they are relatively more productive at agriculture or forestry since these activities are not

20
typically their primary source of income. Nevertheless, the results suggest that
concession membership has a positive effect on income for nonresident concession
members, which implies that concession membership is increasing their household labor
productivity.
Case 2: 𝐹𝑖 (𝐿𝑓𝑖, 𝐿𝑓𝑗
) > 𝐹𝑖(𝐿𝑓𝑖) > 𝐴𝑖(𝐿𝑎𝑖
) for all levels of labor allocated to agricultural
production and forest resource harvesting
Case 2 represents a scenario where being a member of a community forest
concession leads to a higher level of productivity for each unit of labor allocated to
forestry for household i. Under this scenario, household i would likely reallocate labor
from agricultural production to forestry. Since there is added productivity from forest
resource harvesting and agricultural productivity for household i does not change under
the concession membership, the membership would raise income for household i.
We suspect that Case 2 applies best to long-inhabited concession members, but it
may also apply to nonresident concession members. As mentioned previously, long-
inhabited concession communities have traditionally depended on harvesting timber and
non-timber forest products for their livelihood. This implies that they were relatively
more productive at forest product harvesting than agriculture before the concession
policy was implemented. The concession would, therefore, increase the income level of
the member households since they can be more productive at forest resource harvesting.
Similarly, nonresident concession members in this case may re-allocate labor to forestry
if concession membership makes them more productive.

21
Case 3: 𝐹𝑖 (𝐿𝑓𝑖, 𝐿𝑓𝑗
) > 𝐴𝑖(𝐿𝑎𝑖) > 𝐹𝑖(𝐿𝑓𝑖
) for all levels of labor allocated to agricultural
production and forest resource harvesting
Case 3 shows that even if individuals are more productive individually at
agriculture than forestry, if team production is more productive than both, households
would reallocate labor to forest resource harvesting and concession membership would
have a positive effect on income. This case could apply to recently inhabited concessions
that successfully cooperative to increase forest productivity. Case 3 may also apply to
nonresident concessions because the concession may have improved these members’
forestry productivity function to a large enough extent that they are now relatively more
productive at forestry than agricultural production.
It is also, of course, possible that being a concession member in a recently
inhabited community has a negative impact on household income, in part because
individuals do not gain from joint production (e.g., as suggested by Maas and Cabrera,
2008 and Radachowsky et al, 2012). In this case, agricultural production is greater than
all forms of forestry production, i.e., 𝐴𝑖(𝐿𝑎𝑖) > 𝐹𝑖(𝐿𝑓𝑖
) > 𝐹𝑖 (𝐿𝑓𝑖, 𝐿𝑓𝑗
). In this example,
individuals will devote more labor to the agricultural activity. Other examples, including
cases where 𝐹𝑖 (𝐿𝑓𝑖, 𝐿𝑓𝑗
) < 𝐹𝑖(𝐿𝑓𝑖), are shown in Appendix A.1.4
4 For all cases where 𝐹𝑖 (𝐿𝑓𝑖
, 𝐿𝑓𝑗) = 𝐹𝑖(𝐿𝑓𝑖
), concession membership would likely have no effect on
income or labor allocation.

22
2.3 Data
The data we use is from a household survey of members of communities in the
Maya Biosphere reserve (Fortmann, 2014). Our sample consists of 432 concession
members and non-members in 22 villages in the Petén. Each of the 22 villages surveyed
is either associated with a community forest concession or has residents who are
members of a particular forest concession. Membership in each concession ranges from
22 to more than 300 members (Table 1). To measure the impact of the concession
membership on household income, we took several steps to sample non-member and
member populations that are as similar as possible. The members included in our sample
were selected from a member list provided by the 12 community concession groups.5
Around 25 percent of the members were randomly selected to be participants in our
study. Because we could not obtain a list of the residents who were not members of the
concession associated with each town/village, we surveyed the closest neighbors of each
selected concession member household to obtain the non-members sample. This strategy
is based on the assumption that non-members who live in close proximity to concession
members have the same job opportunities and educational backgrounds and will be
similar with regards to other unobservable, community-based factors that may affect
income generating potential. Survey participants were asked to provide a variety of
income, demographic, and forest experience questions as well as their opinions and
5 Members of La Colorada had been removed from the concession at the time of the survey and could not
be interviewed.

23
perceptions about the community forest concessions. As a result of our sampling
strategy, concession members and non-members are similar across a number of
observable characteristics except for age, whether the household depends on the forest for
their livelihood, and if the respondent was born in the Petén (Table 2).
Table 2. Member and Non-member Sample Statistics
Members Non-members
Variable Obs Mean Std. Dev. Obs Mean Std. Dev.
Number of children
under 12 in household 219 1.489 1.447 211 1.701
1.679
Number of females in
household 221 2.570 1.599 211 2.578
1.594
Spouse education level
(years of formal
education)
221 3.344 3.274 211 2.417
10.344
Household head age 220 49.377 *** 15.006 208 44.077 *** 14.080
Household head
education level (years of
formal education)
220 4.614 3.274 211 4.171
3.213
Variable Obs Freq. "Yes" Freq. "No" Obs Freq. "Yes" Freq. "No"
Household head male 221 195 26 211 176 35
Household has a loan 220 72 148 210 70 140
Household owns land 221 116 105 211 105 106
Household head is
married 221 174 67 211 164 47
Household head born in
the Petén 221 132 * 89 * 211 98 * 108 *
Household depends on
the forest for their
livelihood
221 144 *** 77 *** 218 71 *** 139 ***
Note: sample statistics are based on 432 observations. 19 observations are excluded because they reported
incomes below 0 or above 150,000Q and 43 observations are excluded because they are from cancelled
concession communities. *,**,*** denote significant mean difference at the 10, 5, and 1 percent levels. The
variable “household depends on the forest for their livelihood” was measured with a Likert Scale from 1 to 5.
“1” indicates that the household responded “strongly disagree” and “5” indicates the household responded
“strongly agree.” The response is considered a “yes” if the household responded “4” or “5” to the statement “I
depend on the forest resources for my livelihood.”

24
Household characteristics also differ by community type (Table 3). For example,
members and non-members in nonresident concession communities are, on average, more
educated than members and non-members located in recently inhabited concession
communities. For the most part, however, means of a number of demographic
characteristics are not statistically different between concession members and non-
members in recently inhabited communities (with the exception of age). The results for
the nonresident concession members and non-members, however, show that there are
several covariates that are statistically different between the two groups including
household head age, household head male, household head married, household owns
land, and household depends on the forest for their livelihood6, which could be a source
of selection bias. We take several measures outlined in the results section to address the
potential selection bias in the data.
6 Household head age, household head male, household head married, household owns land, and household
depends on the forest for their livelihood represents the average age, number of heads of households who
are male, number of households who are married, number of households that own land, and whether or not
the household depends on the forest respectively.

25
Table 3. Recently inhabited and Nonresident Member and Non-Member Sample
Statistics
Recently inhabited Nonresident
Members Non-members Members Non-members
Variable Mean Std.
Dev. Mean
Std.
Dev. Mean
Std.
Dev. Mean
Std.
Dev.
Number of
children under
12 in household
1.857 1.406 1.845 1.518 1.386 1.4 1.626 1.762
Number of
females in
household
3.000 1.617 2.563 1.471 2.653 1.577 2.597 1.658
Spouse
education level
(years of formal
education)
2.000 2.353 0.915 12.082 3.673 3.346 3.899 3.715
Household head
age 52.143 ** 20.587 42.873 ** 14.144 49.986 *** 13.68 44.58 *** 14.04
Household head
education level
(years of formal
education)
2.429 2.138 2.789 2.366 5.048 3.405 4.884 3.371
Variable Freq.
"Yes"
Freq.
"No"
Freq.
"Yes"
Freq.
"No"
Freq.
"Yes"
Freq.
"No"
Freq.
"Yes"
Freq.
"No"
Household head
male 14 0 63 8 132 ** 15 ** 112 ** 27 **
Household has a
loan 1 13 19 51 53 93 51 88
Household owns
land 9 40 15 64 83 * 64 * 92 * 47 *
Household head
is married 11 3 60 11 87 ** 60 ** 63 ** 76 **
Household head
born in the
Petén
5 9 22 48 66 81 60 75
Household
depends on the
forest for their
livelihood
5 *** 9 *** 11 *** 60 *** 92 *** 55 *** 60 *** 79 ***
Note: sample statistics are based on 128 observations for recently inhabited concessions and 286 observations
for nonresident concessions. 18 observations are excluded because they reported incomes below 0 or above
150,000Q and 43 observations are excluded because they are from cancelled concession communities.
*,**,*** denote significant mean difference at the 10, 5, and 1 percent levels. Statistics divided by
membership status are not available for long-inhabited communities due to lack of statistics on non-members.
The variable “household depends on the forest for their livelihood” was measured with a Likert Scale from 1
to 5. “1” indicates that the household responded “strongly disagree” and “5” indicates the household
responded “strongly agree.” The response is considered a “yes” if the household responded “4” or “5” to the
statement “I depend on the forest resources for my livelihood.”

26
The dependent variable in our analysis, household income, is constructed from
components of the 2012 survey focused on income earned from agricultural activities,
cattle ranching, forest harvesting activities, wage earning activities, activities associated
with the forest concessions, and other income generating activities (Table 4). The average
earnings from each source are shown for concession members and non-members in each
concession type for all households that reported positive earnings from that activity in the
past twelve months. Recently inhabited concession members earn more income from
agricultural activities as a proportion of their total income on average than long-inhabited
and nonresident concession members. In nonresident concessions, members earn more
income on average from forestry than non-members, and these communities earn more of
their income, on average, from activities not related to forestry or agriculture than
households in recently and long-inhabited concession communities.

27
Table 4. Income activities by concession classification
Concession Members Non-members
Average income Std. Dev. Average income Std. Dev.
Long-inhabited
Agriculture 1709.84 6874.66 N/A N/A
Cattle Ranching 0.00 0.00 N/A N/A
Forestry 9222.95 19284.36 N/A N/A
Tourism 278.89 1654.60 N/A N/A
Government/NGO 6330.69 16495.99 60000.00 N/A
Small Business 3844.26 10196.64 N/A N/A
Other 8468.85 16035.45 N/A N/A
Recently inhabited
Agriculture 12464.29 23306.11 15365.15 21899.78
Cattle Ranching 0.00 0.00 0.00 0.00
Forestry 0.00 0.00 197.53 1777.78
Tourism 0.00 0.00 64.81 583.33
Government/NGO 0.00 0.00 2926.54 10192.56
Small Business 3944.90 9671.52 7313.58 22788.40
Other 5173.67 9821.88 7190.99 28983.14
Nonresident
Agriculture 3316.03 14470.64 4882.48 11342.58
Cattle Ranching 30.77 384.31 850.69 6119.62
Forestry 3086.54 27290.87 168.97 1561.50
Tourism 521.79 3847.65 1055.17 9054.64
Government/NGO 9904.62 25139.49 9448.35 27406.65
Small Business 8007.05 28310.69 12698.62 45960.34
Other 15689.50 29379.02 22440.96 62000.64
Results for average income depict the average annual income earned by concession
members and non-members for each concession classification only for households that
reported positive earnings for the particular activity. Results are in quetzals. One USD is
equal to about 7.64 quetzals.

28
2.4 Empirical Methods
To examine the effect of concession membership on income we start with
ordinary least squares (OLS) models with village fixed effects. We estimate one model
for the combination of the three different classifications of community concessions
(equation (5)) and then estimate a model with only the recently inhabited community
members (equation (6)) and a model with only the nonresident community members
(equation (7)). We are unable to estimate the income effect in the long-inhabited
communities because there is only one individual in the long-inhabited communities that
is not a concession member in our sample. Also, since La Pasadita, San Miguel, and La
Colorada were cancelled or suspended in 2009, we do not include observations from
these concession communities in our analysis.
𝐼𝑛𝑐𝑜𝑚𝑒𝑖 = 𝛽0 + 𝛽𝐶𝑖 + 𝑋𝑖′𝛽𝑥 + 𝛼 + 𝛾 + ʎ + 𝜀𝑖 (5)
𝐼𝑛𝑐𝑜𝑚𝑒𝑖 = 𝛽0 + 𝛽𝐶𝑖 + 𝑋𝑖′𝛽𝑥 + ʎ + 𝜀𝑖 𝑖𝑓 𝛼 = 1 (6)
𝐼𝑛𝑐𝑜𝑚𝑒𝑖 = 𝛽0 + 𝛽𝐶𝑖 + 𝑋𝑖′𝛽𝑥 + ʎ + 𝜀𝑖 𝑖𝑓 𝛾 = 1 (7)
In equations (5) to (7), 𝐶𝑖 is a binary variable that equals 1 if observation i is a
concession member, 𝛽0 is a constant, ʎ represents village fixed effects, and 𝑋𝑖 is a
vector of demographic and socioeconomic control variables7. In equation (5), α
7 The control variables included are whether or not the respondent was born in the Petén , number of
females in the household , education level of the household head , education level of the spouse of the
household head , whether or not the household owns land , gender of the household head , age of household
head , whether or not the household depends on the forest for their livelihood , whether or not the
household has taken out a loan , number of household residents under 12 , the extent to which the
respondent trusts others , and whether or not the household head is married .

29
represents a dummy variable for recently inhabited concession communities and γ
represents a dummy variable for nonresident communities. We include α, γ, and ʎ to
control for income effects associated with unobserved community and village
characteristics8.
There is a potential selection bias problem with the OLS models (with village
fixed effects) since it is possible that certain characteristics may influence an individual’s
decision to join a concession and their potential for income generation (i.e., their
productivity). To account for observable characteristics that may lead to selection bias,
we use a matched OLS model (also with village fixed effects). The matched OLS model
estimates a standard OLS model on only those observations that fulfill the common
support requirement (also known as the overlap condition). This model uses the predicted
probabilities of being a concession member to match observations that are concession
members (treated observations) to observations that are not concession members (control
observations) that are most similar to the treated observations. Observations are matched
based on their propensity scores, which are estimated using the latent values of a logit
model (Pirracchio et al, 2013). Specifically, 𝑝𝑖 is the probability that household i is a
member of a concession based on covariates 𝑋𝑖. The model we use to estimate the
propensity scores for each household i is shown in equation (8).
𝑝𝑖 = Pr(𝐶𝑖 = 1|𝑋𝑖) =exp (𝑥𝑖
′𝛽+𝜀)
(1+exp(𝑥𝑖′𝛽+𝜀))
(8)
8 We tested for multicollinearity with a Variance of Inflation Factor (VIF) test. The results show that only
the dummy variable for being a member of a recently inhabited community is collinear. However, the
results for the concession membership coefficient do not change with this variable removed from the
analysis.

30
The covariates used in equation (8) control for factors that may lead households to join a
forest concession9. The results of the logit model used to calculate the propensity scores
are show in Appendix A.2.
In addition to comparing the results of the OLS model with village fixed effects to
the results of the matched OLS model with common support, we estimate the average
treatment effect (ATE), average treatment effect of the treated (ATT), and a doubly-
robust (DR) estimator model as robustness checks. Like the matched OLS model, these
estimators use the predicted probability of being a concession member to control for
observable characteristics of the households that are possible sources of selection bias.
However, unlike the matched OLS model, the ATE, ATT, and DR estimator models use
the inverse probability weights to account for the predicted probability of being a
concession member for each household i,
𝐴𝑇𝐸 =1
475 ∑ 𝐶𝑖𝑌𝑖 (
1
𝑝𝑖) − (1 − 𝐶𝑖)𝑌𝑖 (
1
(1−𝑝𝑖))475
𝑖=1 (9)
𝐴𝑇𝑇 =1
256∑ 𝐶𝑖𝑌𝑖 − (1 − 𝐶𝑖)𝑌𝑖 (
𝑝𝑖
(1−𝑝𝑖))475
𝑖=1 (10)
𝐷𝑅 = 1
475∑ [
𝐶𝑖𝑌𝑖−(𝐶𝑖−𝑝𝑖)𝑚1(𝑋𝑖)
𝑝𝑖]475
𝑖=1 −1
475∑ [
(1−𝐶𝑖)𝑌𝑖+(𝐶𝑖−𝑝𝑖)𝑚0(𝑋𝑖)
(1−𝑝𝑖)]475
𝑖=1 (11)
Equation (9) uses the probabilities obtained from equation (8) to estimate the
average treatment effect (ATE) of concession membership on income, or in other words,
the amount by which being a concession member changes income on average for
9 The covariates used to predict pi are the head of household’s education level, head of household’s age, the
respondent is married, education level of respondent’s spouse, whether or not the respondent was born in
the Petén, number of family members in the household, the extent to which the household trusts others,
whether or not the household has savings, and whether or not the household reports that they depend on the
forest for their livelihood.
31
concession members and non-members. Equation (10) estimates the average treatment
effect on the treated (ATT), which can be interpreted as the average effect that being a
concession member has on income, relative to what their income would have been had
they not been part of a concession (Imbens and Angrist, 1994; Pirracchio, 2013).
Equation (11) is the DR model and uses inverse probability weights and regression
adjustment to determine the effect of concession membership on income (Emsley et al,
2008; Funk et al, 2007). The inverse probability weights adjust the treatment (concession
membership) for selection bias. Additionally, 𝑚1(𝑋𝑖) and 𝑚0(𝑋𝑖) are the predicted
values from the OLS regressions of income on the covariates used in equation (5)10 for
concession members and non-members respectively.
2.5 Results
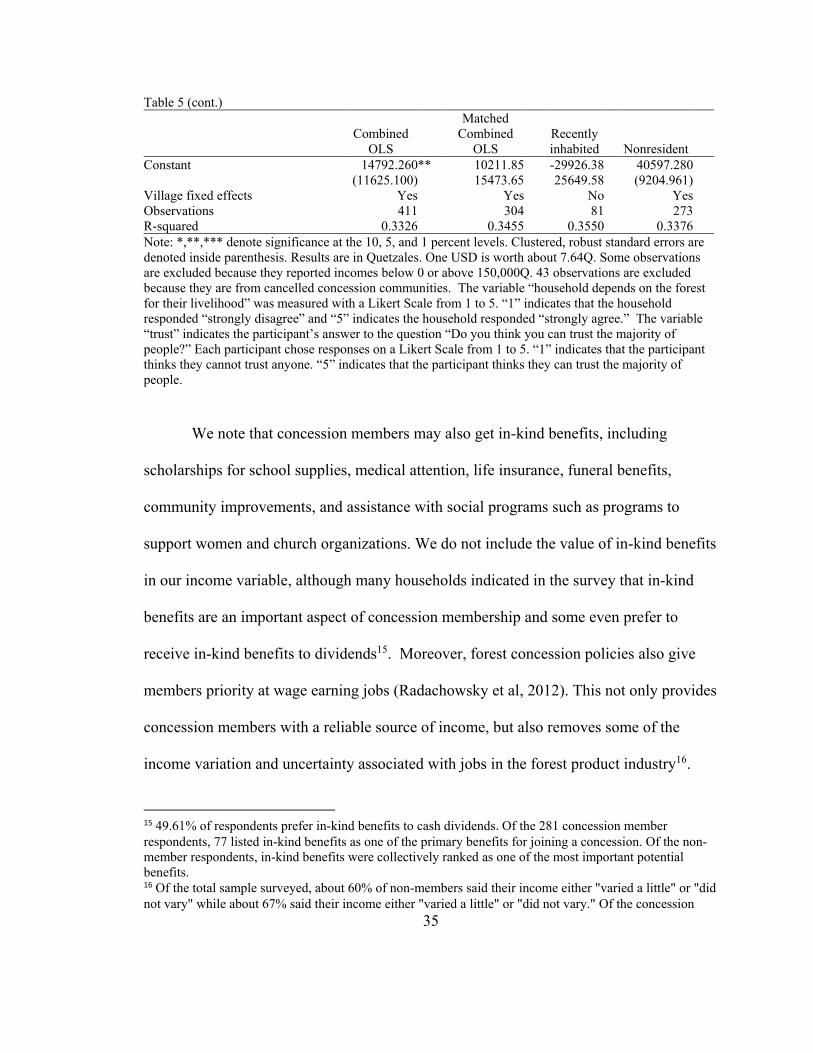
The results of the combined OLS11 model show that concession membership has a
positive and significant overall effect (at the 5% significance level) on annual income
(Table 5)12. These results suggest that concession membership, on average, increases
income by about 7,436 quetzals per year (about 1000 USD). However, we suspect the
majority of this effect is due to the strong income effect in the nonresident concession
10 The covariates are whether or not the respondent was born in the Petén , number of females in the
household , education level of the household head , education level of the spouse of the household head ,
whether or not the household owns land , gender of the household head , age of household head , whether
or not the household depends on the forest for their livelihood , whether or not the household has taken out
a loan , number of household residents under 12 , the extent to which the respondent trusts others , and
whether or not the household head is married . 11 “Combined OLS” refers to equation (1), which is the model representing the average effect of concession
membership on income for all concession types. 12 The concession membership coefficients of the Combined OLS, Recently Inhabited, and Nonresident
regressions with control variables are similar to the membership coefficient in a simple, linear regression of
concession membership on income.

32
communities. In general, being a household in a nonresident community is associated
with an increase in income of about 17,520 quetzals (about 2,335 USD) per year when
compared to long-inhabited community concessions. This may indicate that concessions
have a greater, positive effect on household livelihoods when forest harvesting activities
are meant to supplement income rather than serve as the primary source of income.
In the nonresident concession model, the results indicate that being a concession
member leads, on average, to an increase in income of about 7,634 quetzals (about 1,000
USD) per year, compared to the recently inhabited model, where concession membership
results in an increase in income of 1,416 quetzals, though the coefficient is not
significant. One explanation for this difference between concessions is that almost all
nonresident concession members receive annual dividends in addition to the wages they
earn from working in the concession, while the majority of the recently inhabited
concessions are not allowed to receive dividend payments and instead receive benefits in-
kind.
While the insignificant results for the recently inhabited concessions could be due
to the limited number of observations and a high level of variability in the annual income
levels of the respondents, it also plausible that the concession policy does not benefit
members in those concession communities. That is, it may make forest product
harvesting less productive for the concession members (see Appendix A.1 for more
details). Evidence suggests that this may be the case, as many of the recently inhabited
concessions were cancelled in 2009 because the forests were not being managed
33
sustainably13. Additionally, respondents from these concessions reported earning a higher
proportion of their income from agricultural activities than nonresident and long-
inhabited concession types on the 2012 survey, though they earned less income overall
than individuals surveyed from the other two community types14. Another reason the
concession model might not provide benefits to households in recently inhabited
communities is the lack of trust and altruism among households. Unlike in the
nonresident and the combined OLS models, the coefficient for trust for the recently
inhabited model is negative, indicating that being more trusting of your neighbors in a
recently inhabited concession decreases household income.
13 Interestingly, we ran a regression with the observations for the three concessions that were cancelled in
2009 and the parameter on concession membership was negative and insignificant, suggesting to us that it
is entirely plausible that concession membership does not increase income in these recently inhabited areas. 14 The t-test statistic for the mean difference in total revenue earned from agricultural activities between
recently-inhabited and all other communities is -6.189. “Total revenue earned from agricultural activities”
is comprised of income earned from the production of corn, beans, chile, squash, other crops and cattle
ranching The mean revenue earned from agricultural activities for recently inhabited communities is
5,659.75Q and the mean for all other communities is 1,001.432Q. The t-test statistic for the mean
difference in overall income between recently-inhabited and all other communities is 4.976 and the mean
overall income for the communities is 23,305.700Q and 37,816.52Q respectively.

34
Table 5. Regression results for effect on income
Combined
OLS
Matched
Combined
OLS
Recently
inhabited Nonresident
Household has a concession member
(1=”yes”) 7435.979 ** 11148.32 *** 1415.558 7634.098 **
(3116.051) 3600.465 8033.235 (2825.283)
Household head born in the Petén
(1= “yes”) -2578.861 -3699.814 -7936.032 -937.0821
(3150.765) 4007.789 5814.182 (3585.369)
Number of females in household 978.932 146.2342 -1328.887 820.169 (1024.098) 1239.538 3297.407 (1003.886)
Spouse education level (years of
formal education) 457.101 1665.874 *** 3158.167 * 367.6459 *
(283.141) 645.1523 1659.907 (249.056)
Household owns land (1= “yes”) 8818.022 *** 7394.074 ** 5508.813 10971.8 *** (3055.445) 3463.263 5728.447 (3232.208)
Household head is married -1140.885 -320.9769 128.8726 -1158.306 (1190.980) 1415.258 2823.039 (1383.642)
Household head gender (1=female) -6046.643 * -7533.129 12581.62 -9393.216 * (4128.200) 5081.483 11792.47 (4971.599)
Household head age 148.962 86.68688 581.4513 * 128.2831 (99.538) 126.8493 180.5271 (119.690)
Household head education level
(years of formal education) 2743.959 *** 2217.589 *** 2411.026 2562.006 ***
(518.811) 640.2843 1468.496 (583.484)
Household depends on the forest for
their livelihood 1597.796 1230.92 -367.0058 2128.494
(1326.600) 1565.302 2902.366 (2277.736)
Household has a loan (1= “yes”) -8514.288 *** -6420.709 * -6634.568 -11672.54 *** (3016.270) 3586.664 7280.478 (3831.879)
Number of children under 12 in
household -345.807 196.9151 3231.399 -659.0319
(1117.190) 1313.201 3668.124 (1222.583)
Trust 1788.117 2464.209 -2087.745 1898.948 (1209.267) 1534.836 1965.69 (1244.238)
Nonresident concession community
resident (1= “yes”) 17519.670 *** 18722.02 ***
(5972.205) 6180.63
Recently inhabited concession
community resident (1= “yes”) 2969.035 17568.29 **
(7205.686) 7653.704
35
We note that concession members may also get in-kind benefits, including
scholarships for school supplies, medical attention, life insurance, funeral benefits,
community improvements, and assistance with social programs such as programs to
support women and church organizations. We do not include the value of in-kind benefits
in our income variable, although many households indicated in the survey that in-kind
benefits are an important aspect of concession membership and some even prefer to
receive in-kind benefits to dividends15. Moreover, forest concession policies also give
members priority at wage earning jobs (Radachowsky et al, 2012). This not only provides
concession members with a reliable source of income, but also removes some of the
income variation and uncertainty associated with jobs in the forest product industry16.
15 49.61% of respondents prefer in-kind benefits to cash dividends. Of the 281 concession member
respondents, 77 listed in-kind benefits as one of the primary benefits for joining a concession. Of the non-
member respondents, in-kind benefits were collectively ranked as one of the most important potential
benefits. 16 Of the total sample surveyed, about 60% of non-members said their income either "varied a little" or "did
not vary" while about 67% said their income either "varied a little" or "did not vary." Of the concession
Table 5 (cont.)
Combined
OLS
Matched
Combined
OLS
Recently
inhabited Nonresident
Constant 14792.260 ** 10211.85 -29926.38 40597.280 (11625.100) 15473.65 25649.58 (9204.961)
Village fixed effects Yes Yes No Yes
Observations 411 304 81 273
R-squared 0.3326 0.3455 0.3550 0.3376
Note: *,**,*** denote significance at the 10, 5, and 1 percent levels. Clustered, robust standard errors are
denoted inside parenthesis. Results are in Quetzales. One USD is worth about 7.64Q. Some observations
are excluded because they reported incomes below 0 or above 150,000Q. 43 observations are excluded
because they are from cancelled concession communities. The variable “household depends on the forest
for their livelihood” was measured with a Likert Scale from 1 to 5. “1” indicates that the household
responded “strongly disagree” and “5” indicates the household responded “strongly agree.” The variable
“trust” indicates the participant’s answer to the question “Do you think you can trust the majority of
people?” Each participant chose responses on a Likert Scale from 1 to 5. “1” indicates that the participant
thinks they cannot trust anyone. “5” indicates that the participant thinks they can trust the majority of
people.

36
Members of forest concessions also have access to equipment such as sawmills and kilns
that non-members do not have. The opportunity to use this equipment and collectively
market their products gives concession members valuable experience, which could prove
advantageous in selling forest products. Hence, we suspect that the value of being a
concession member may be underestimated by our current income measure since we are
unable to include the value of these in-kind benefits and risk reduction in the household
income variable. Additionally, since concessions provide work opportunities for
concession members, there may be spillovers within the community. If, for example, the
concession provides more jobs than are able to be filled by concession members,
nonmembers may be given these jobs.
The matched OLS model, which controls for potential selection bias, also has a
positive and significant parameter for the concession membership dummy (Table 5).
ATE, ATT, and DR models also control for potential selection bias (Table 6). In the
model with the three concession types combined, the results are not significant and the r-
squared values are low. This is likely due to the limited number of observations and the
high level of variability in the income levels of the respondents. The magnitudes of the
results, however, are in line with the combined OLS results (7435.979 in the combined
OLS compared to 3855.798, 3640.789, and 3571.510). This suggests that, although
selection bias may influence the results, there is evidence that the effect of concession
membership on income is positive and this result holds across several robustness checks.
members, about 17% said they were "very worried" about their income while about 23% of non-members
said they were "very worried."

37
Table 6. ATE/ATT/DR Results for effect on income
Recently inhabited, Long-inhabited, and Nonresident Combined
ATE ATT DR
Household has a
concession member
(1=”yes)
3855.798
3640.789
3571.510
(3011.736)
(3114.432)
(3141.170)
Constant 33469.650 *** 35318.750 ***
(2032.843)
(2369.805)
Observations 419
419
432
R-squared 0.005 0.004
Recently Inhabited
ATE ATT DR
Household has a
concession member
(1=”yes)
-14870.900 *** -14718.600 *** -10183.500
(4970.855) (5825.556) (89571.630)
Constant 27976.960 *** 30869.470 ***
(3167.806) (3886.764)
Observations 84 84 85
R-squared 0.074 0.071
Nonresident
ATE ATT DR
Household has a
concession member
(1=”yes)
10637.040 *** 10796.880 *** 6954.712 **
(3694.395) (3657.362) (3554.323)
Constant 34272.730 *** 34426.500 ***
(2398.353) (2516.904)
Observations 276 276 286
R-squared 0.031 0.034
Note: *,**,*** denote significance at the 10, 5, and 1 percent levels. Robust standard errors are
denoted inside parenthesis. Results are in quetzals. One USD is worth about 7.64Q.

38
The concession membership coefficients for the ATE, ATT, and DR models for
nonresident concessions are significant, and similar to the membership coefficient in the
nonresident OLS regression. The results for the recently inhabited concession
membership coefficients for the ATE and ATT models are negative and significant while
the OLS coefficient is positive and insignificant. These results help confirm that
concessions in recently inhabited areas concessions do not raise the productivity of
members significantly in forestry activities, and may actually reduce productivity and be
worse.
2.6 Conclusion
This paper examines the role of community based forest concessions on income
generation in the Maya Biosphere Reserve of northern Guatemala. Concessions were
instituted in the late 1990s to early 2000s to provide land use rights to groups that agreed
to sustainably manage timber resources and harvest non-timber forest products. In return
for rights, the groups are not allowed to convert land to agricultural uses. Three types of
groups have obtained rights: groups that have inhabited the forests in the region for long
periods of time (long-inhabited concessions), groups that have lived in the area, but were
primarily composed of individuals or families that moved to the region around the time
the MBR was created (recently inhabited concessions), and groups that do not live in the
concessions and reside in the buffer zone of the MBR (nonresident concessions).
To analyze the impact of concession formation on income, we start with a
theoretical model of household labor allocation. One key dynamic of the forest

39
concessions is that usage rights are given to groups, rather than to individuals, and groups
are provided with training in resource and financial management from participating
NGOs. Groups are then expected to work together to produce the outputs of the
concession. Although free-riding may occur, as suggested by Rotemberg (1982) and
Hamilton et al. (2003), it is possible for group management to increase productivity, and
other studies have shown this for common property resource systems like the MBR
(Ostrom 1990; Schlager and Ostrom, 1992; Primack et al, 1998; Meilby et al, 2014). One
issue less widely addressed in earlier literature is whether certain types of groups, i.e.
those that are better able to cooperate, would gain more from common property resource
systems. The theory model illustrates the conditions under which certain communities
can take advantage of group management strategies to protect the forest and increase
their income. For example, we show that when forest productivity is greater under
concession group management with land use rights than individual exploitation of an
open-access resource, income will be greater for concession members than non-members.
This theoretical approach fits the model of forest concessions in the MBR, which
encourages cooperation among members. We test the model using data from a survey of
concession members and non-members conducted in 2012. The survey provides
information on households that were part of the community-based concessions as well as
neighboring households in the same communities that were not part of the concessions.
Surveys were obtained for all three types of forest concessions in the Maya Biosphere
Reserve: recently inhabited residential, long-inhabited residential, and nonresidential.
The results show that incomes among individuals engaged in concession activity in

40
nonresidential concessions were around 7600 quetzals (about $1,000) per year higher.
The results also suggest that members in recently inhabited concessions have the same or
less income than their non-member neighbors. Interestingly, deforestation for
subsistence agriculture also appears to have continued in the area of the recently
inhabited concessions (Maas and Cabrera, 2008, Radachowsky et al, 2012; Fortmann et
al, 2017), suggesting that the benefits of devoting labor to agriculture are robust.
Alternatively, for nonresident concession members, there are gains to the group
management associated with concession membership and incomes appear to have
increased as a result.
These results suggest that sustainable forestry, if done correctly, can provide
concession members with a steady source of income in the long-run. If nonresident
concessions consistently implemented and enforced their sustainable forest management
plans since their concessions were granted, then deforestation rates should remain low
and sustainable forest extraction can continue to serve as a source of revenue for
concession members. If, as we suspect is the case in the recently inhabited concessions,
the management plan was not successfully implemented, then the concession essentially
converts to an open access resource. According to Gordon (1954), when a resource is
open access, land rents dissipate and the resource becomes degraded. Hence, households
are unable to make a profit from sustainable resource extraction and overexploit the
resource. Of course, the forest may have also been degraded before the concessions were
granted to recently inhabited communities, implying that sustainable resource extraction
was not profitable from the beginning.

41
The results of our analysis have several additional implications. First, it is
possible to create a sustainable forest management plan that serves the dual purpose of
benefiting community members and curbing deforestation. Although this analysis only
examines a small, cross-sectional sample of community members in the Petén, the results
indicate that community forest concession policies are beneficial to certain communities.
Second, the effect of community forest concession policies on income is heterogeneous.
The effect of concession membership on income among members in nonresident
concession communities varies greatly from the effect of membership on income among
recently inhabited concession communities as well as the combination of all types of
concession communities. This indicates that concession plans should be tailored to the
specific needs of the community to best promote community development. All in all,
community forest concessions in the MBR provide a variety of benefits to local
communities and play a positive role in community development.

42
Chapter 3: Assessing the private and social benefits of forest concessions in the Maya
Biosphere Reserve
3.1 Introduction
In many developing regions, property rights for forests are not well defined and
information on forestland values is not widely available. This lack of information applies
both to market and non-market values for the many ecosystem services that forests
provide (e.g., Bowes and Krutilla, 1989; Miteva, 2019). One problem with undervaluing
the benefits that forests provide in developing regions is that local households often
depend heavily upon the resource or the land on which the resource exists. This
dependency, coupled with a disregard for the value of forestland as an amenity, weak
formal institutions and governance to enforce land use restrictions, and few incentives for
effective forest conservation could lead to households overexploiting the resource (e.g.,
Vincent, 2016; Sills & Jones, 2018). Forests are thus susceptible to common-pool
resource concerns, where over-extraction occurs to the point where land rents converge to
zero and neither low-income households nor the rest of society can benefit from the
resource (e.g., Gordon, 1954; Scott, 1955).
To promote local conservation of forest stocks, some developing country
governments have provided local community groups with property or land-use rights to
manage forest resources sustainably. Community-based common property resource

43
(CPR) management systems follow the advice of Gordon (1954) and Scott (1955), who
recommended privatizing the resource to reduce over-extraction, but rights are vested
with groups rather than single individuals or entities. Many studies have now presented
empirical evidence showing how community-based forest management systems affect
deforestation (e.g., Miteva et al, 2012; Agrawl & Chhatre, 2006; Blackman, 2015;
Fortmann et al., 2017; Alix-Garcia, 2007, Rasolofoson et al., 2015; Takahashi & Otsuka,
2016; Robinson et al., 2017). No studies to our knowledge, however, have attempted to
quantify the value of common-pool forest management systems. Common-pool systems
avoid the dissipation of rent and thus increase the value of land in forests, but there is
little empirical evidence about the benefits such systems provide. This is a critical
problem because common property systems are fairly widespread globally (Ostrom,
2009), and are increasingly used by policy makers, but to be sustainable, they need to
generate enough revenue to ensure the continued participation of their members.
Aside from the private benefits that provide members with an incentive to
participate, community systems often also support important public benefits, such as
carbon sequestration or protection of important biological or cultural resources. In
practice, there are likely to be trade-offs between the public and private benefits of
ecosystem services. For instance, more carbon sequestration may require less timber
harvesting, resulting in lower timber revenues but greater carbon services. These trade-
offs are critical to acknowledge and examine when considering whether community
systems are successful. If households that benefit financially from forest access are not
adequately preserving forests, other ecosystem services, like carbon or the provision of

44
biodiversity, may suffer. Alternatively, if a forest management system significantly
increases carbon storage, but participating households are made worse off by harvesting
fewer trees, the household-level costs of participating in the system may be too high, and
conservation efforts may ultimately fail.
This study assesses the trade-offs between welfare gains individuals receive from
harvesting trees and the public conservation benefits of community-based tropical forest
concessions. We examine these trade-offs in the context of the Maya Biosphere Reserve
(MBR) of Guatemala, where common property reserves were established starting in the
mid-1990s and early 2000s. Welfare gains are quantified using rigorous quasi-
experimental approaches and a combination of a panel household survey and geospatial
data from the MBR. Public benefits are valued by measuring the additional carbon
sequestered resulting from avoided deforestation. The analysis finds that private and
public benefits are complements, which indicates that efforts to increase income by
providing property rights also increase the provision of public goods. This outcome has
been observed in long-standing common property systems such as communal tenure
rights in Torbel, Switzerland (Ostrom, 2009), but has not been shown for common
property systems that have been established explicitly to protect lands that were formerly
open access. In the case of the MBR, this outcome results from the establishment of
property rights in the region, which avoids significant forest loss, thereby retaining forest
stocks and allowing for sustainable income generation through timber harvesting. The
results suggest that both income and conservation are compatible outcomes through the
distribution of exclusive land use rights.

45
This is one of the first studies to assess the trade-offs and complementarities
inherent in common property systems deployed to protect public resources like forests.
Some studies have examined whether community management systems benefit local
households, finding both positive and negative effects (e.g., Primack et al., 1998; Sims,
2010; Richardson et al., 2011; Bocci et al., 2018; Kumar, 2002; Adhikari et al., 2004;
Adhikari, 2005; Meilby et al., 2014). All of these studies, however, consider only a single
point in time, making it difficult to assess the sustainability of the property right regimes.
This study innovates by carefully measuring both income and public benefits over time.
We estimate the benefits of the community concessions through a counterfactual
analysis of what “would have happened” if the concessions did not exist, using an
approach that is similar to studies that have examined the welfare effects of establishing
property rights for agriculture in developing countries (e.g. Aragón, 2015; Banerjee and
Weyer, 2005; Besley, 1995; Field, 2007; Galiani and Schargrodsky, 2010; Goldstein and
Udry, 2008; Hornbeck, 2010; Johnson et al., 2002). To help control for potential selection
effects (i.e., the selection of more productive individuals into concessions), we compare
the income of concession members to non-concession neighbors using data from two
survey periods (2012 and 2017). To value avoided deforestation, we use data on
deforestation rates in the concessions and in matched parcels outside the concessions, but
within the Maya Biosphere Reserve, to show the effect of the concessions on
deforestation rates. We then estimate the societal benefits using the social cost of carbon
from Nordhaus (2017). Although there are other benefits due to common property

46
resource management (e.g., Foley et al. 2005; Pimm et al. 2014), we have not valued
these resources in this analysis.
This approach to valuing the benefits of a common property system, which uses
income gains and the marginal increase in carbon sequestration differs from approaches
that value resource rents by valuing flows of timber and non-timber forest products (e.g.,
Peters et al, 1989; Gray et al., 2015). Resource rents do not capture all the productivity
gains that accrue to households in CPR systems when common-pool resources are
managed to prevent overexploitation. For example, the results show that the concessions
increase annual household income by about 2,204 USD per concession member
household, which suggests there are local labor productivity gains. The concessions also
decreased deforestation rates by about 4.2% from 2012 to 2017. As a result, the net value
of the community-based, CPR management system in the MBR is about $5,495,900,
which is about $2.18 per hectare per year. This estimate, while positive, is likely an
underestimate given that the forest concessions also have a positive effect on many types
of wildlife. Other benefits for concession members also are not completely captured in
the income estimate17.
17 Many concession communities reinvest profits into in-kind benefits such as improved schools,
scholarships, donations to church groups, and infrastructure (Radachowsky et al., 2012; Fortmann et al.,
2017; Bocci et al., 2018).

47
3.2 Data
3.2.1 Household Survey Data Collection
Table 7 highlights the differences in income-earning activities of the forest
concession communities.
Table 7. Income and wage-earning Activities
Nonresident
2017 2012
Income Jobs Income Jobs
Forestry 33,130.00 90 14,631.25 8
Agriculture 16,575.41 96 21,346.30 65
Tourism 34,575.00 9 11,991.43 7
Business 33,994.73 201 25,151.08 96
Professional 50,202.54 111 47,811.42 75
Other 36,634.67 136 22,025.60 153
Average annual income per job 34,637.41 107.17 27,125.68 67.33
Average income per household 48,172.35 --- 45,878.35 ---
Recently-inhabited
2017 2012
Income Jobs Income Jobs
Forestry 21,034.50 58 48,000.00 1
Agriculture 33773.36 63 8,647.28 47
Tourism N/A 0 63,000.00 1
Business 9,900.00 12 18,022.67 24
Professional 22,392.00 3 23,408.75 8
Other 33,953.25 12 12,665.00 30
Average annual income per job 26,629.31 24.67 13,668.34 18.5
Average annual income per
household 36,176.18 --- 23,346.88 ---

48
The main income-earning activity in long-inhabited communities is forestry while
in recently-inhabited concessions, agricultural activities such as cattle ranching and
farming, are major income-earning activities. In nonresident communities, the number of
workers and the amount of income earned from working in businesses or professional
activities comprises a larger share of the average household income than in long-
inhabited or recently-inhabited communities.
Table 7 (cont.)
Long-inhabited
2017 2012
Income Jobs Income Jobs
Forestry 36,782.55 125 10,288.47 17
Agriculture 34,965.33 26 572.00 4
Tourism 52,747.96 25 6,000.00 2
Business 27,565.30 38 16,969.23 13
Professional 41,509.14 37 37,358.36 11
Other 35,121.39 53 8,627.75 20
Average annual income per job 37,073.58 50.67 14,825.21 11.17
Average annual income per
household 46,660.50 --- 31,601.98 ---
All Communities
2017 2012
Forestry 32,170.35 273 13,075.15 26
Agriculture 24,249.93 185 15,484.65 116
Tourism 47,734.73 34 15,894.00 10
Business 31,683.12 251 23,065.02 133
Professional 47,938.63 151 44,511.37 94
Other 35,419.30 201 19,322.27 203
Average annual income per job 33,974.61 182.5 23,143.04 97
Average annual income per
household 44,826.22 --- 39,981.97 ---
Income values are in quetzals. Average income is the average, nominal income for each job type
weighted by the number of annual jobs in each category. Average income per household is the
average annual income per household, which often includes income from more than one person
working.

49
To test whether participating in community forest management in the MBR
benefits households, we use a rotating panel survey dataset constructed from 2012 and
2017 household surveys in communities in the MBR that are associated with a
concession. Using enumerators from MBR communities, 494 households were
interviewed in 2012 and 716 households in 2017. We collected a larger sample of
households in 2017 because the population of communities increased. The 2012 sample
was constructed by first taking a random sample of 20% of the households from a
comprehensive list of active concession members in the MBR provided by CONAP.
Once the households were selected, local guides were hired from each concession to take
the enumerators to concession-member households in the sample. Then, to collect data
from nonmember households that were similar to concession households, the
enumerators administered the survey to a next door neighbor who was not a member of
the concession (Fortmann, 2014). For the 2017 survey, local guides were asked to take
the enumerators to households from the list of members and nonmembers from the 2012
survey. If the guides were unable to locate a household, the enumerators either randomly
selected an alternative concession member household using an updated comprehensive
list of active concession members or surveyed a nonmember household located near a
randomly-sampled active concession member.

50
Table 8. Concession members and nonmember characteristics by community type
All Households
2017 2012
Concession Members Nonmembers Concession members Nonmembers
Household Head
Age 50.45 *** 42.46 *** 49.64 *** 44.27 ***
Household Head
Education 6.54 ** 7.07 ** 4.37 4.27
Born in the Petén
(%) 63%
63.33%
53.18% 49.57
Land owned
(manzanas) 11.15 *** 5.85 *** 20.66 16.4
Forest dependent 0.80 *** 0.60 *** 0.53 *** 0.26 ***
Household head
gender 1.20 ** 1.26 ** 1.12 * 1.17 *
Savings 1.84 1.85 1.82 1.82
Spouse education 5.98 ** 6.40 ** 4.65 * 4.26 *
Married 0.82 * 0.78 * 0.76 * 0.81 *
Under 12 1.04 *** 1.33 *** 1.49 * 1.69 *
Trust 0.31 0.34 0.09 0.11
Observations 356 360 267 226 Nonresident
2017 2012
Concession Members Nonmembers Concession members Nonmembers Age 54 *** 44.97 *** 49.63 *** 44.57 *** Education 6.91 ** 7.62 ** 5.14 5.07 Born in the Petén
(%) 57 * 65.79 * 59.73 58.33
Land owned
(manzanas) 12.43 *** 3.51 *** 15.17 *** 8.63 ***
Forest dependent 0.72 *** 0.48 *** 0.53 *** 0.32 *** Household head
gender 1.16 *** 1.31 *** 1.10
** 1.20 **
Savings 1.81 1.80 1.76 1.79 Spouse education 6.13 ** 6.82 *** 4.80 4.57 Married 0.85 *** 0.71 *** 0.74 0.80 Under 12 0.87 *** 1.18 *** 1.36 * 1.60 * Trust 0.31 0.27 0.08 0.12 Observations 209 190 149 144

51
Table 8 (cont.)
Recently-inhabited
2017 2012
Concession Members Nonmembers Concession members Nonmembers
Age 38.94 42.92 49.17 *** 36.41 ***
Education 6.26 * 5.5 * 3.51 3.55
Born in the
Petén (%) 61.70% ** 35.90% ** 49.06% 50.00%
Land owned
(manzanas) 12.77 9.18 36.92 28.36
Forest
dependent 0.94 0.87 0.26 0.36
Household head
gender 1.26 *** 1.03 *** 1.10 1.09
Savings 1.94 1.97 1.94 * 1.77 *
Spouse
education 5.50 5.09 4.88 4.72
Married 0.85 ** 1.00 ** 0.74 0.82
Under 12 1.17 ** 1.87 ** 1.52 * 2.27 *
Trust 0.34 * 0.54 * 0.10 0.09
Observations 47 39 31 22 Long-inhabited
2017 2012
Concession Members Nonmembers Concession members Nonmembers
Age 48.51 *** 35.43 *** 48 N/A Education 5.94 *** 7.26 *** 4.12 N/A
Born in the
Petén (%) 74.75% * 86.96% * 46.38%
N/A
Land owned
(manzanas) 7.58 6.41 9.09
N/A
Forest
dependent 0.93 0.91 0.79
N/A
Household head
gender 1.25 1.30 1.18
N/A
Savings 1.87 1.88 1.90 N/A
Spouse
education 5.91 * 6.62 * 4.45
N/A
Married 0.75 0.80 0.79 N/A
Under 12 1.34 1.42 1.66 N/A
Trust 0.38 0.34 0.11 N/A
Observations 99 69 61 0

52
Table 8 (cont.)
Non-concession
2017 2012
Concession Members Nonmembers Concession members Nonmembers
Age N/A 41.77 N/A N/A Education N/A 6.13 N/A N/A Born in the
Petén (%) N/A
46.67%
N/A
N/A
Land owned
(manzanas) N/A
9.13
N/A
N/A
Forest
dependent N/A 0.58 N/A
N/A
Household head
gender N/A 1.2 N/A
N/A
Savings N/A 1.92 N/A N/A
Spouse
education N/A 5.68 N/A
N/A
Married N/A 0.82 N/A N/A
Under 12 N/A 1.23 N/A N/A
Trust N/A 0.23 N/A N/A
Observations 0 60 N/A N/A Note, *,**,*** indicate that the t-test result is statistically different across members and nonmembers at
the 90%,95%, and 99% confidence levels respectively. T-test results are not shown for long-inhabited
communities in 2012 due to the lack of nonmember observations. For non-concession communities, the
only data available is for 2017 nonmembers. For a detailed description of each variable, see Table 9.
The panel dataset consists of 113 households surveyed both in 2012 and 2017,
104 of which are concession members and 18 of which are nonmembers18. The
characteristics of the concession members and nonmembers surveyed are shown in Table
8 above.
3.2.2 Biophysical Dara
To estimate the environmental benefits of the concessions, we construct a panel
dataset to estimate the effects of concession status on deforestation and CO2 storage from
2012 to 2017. The forest loss variable is constructed using satellite imagery data of
18 We suspect that nonmembers were more likely to leave their communities than members from 2012 to
2017 because they did not have a guaranteed source of income like the concession members.

53
annual forest loss from 2012 to 2017 and percent tree cover from the year 2000 (Hansen
et al., 2013)19. To quantify the additional amount of CO2 stored by the forest conserved
by the concessions, we use the forest loss data from Hansen et al. (2013) and
aboveground woody biomass density described in Baccini et al. (2012)20. Because the
forest loss data only depicts areas of forest lost and does not detect reforestation, we
assume that once an area is deforested, it remains deforested and the aboveground woody
biomass density is negligible. We acknowledge that the effects on CO2 storage are likely
an overestimate since trees store carbon throughout their growth cycle at different rates.
3.3 Theory
The common theoretical justification for decentralizing forest governance to local
communities is that these communities have an incentive to protect forests since their
livelihoods depend on the long-term viability of the forest stocks, thus mitigating the
CPR overexploitation problem (e.g., Baland & Platteau 1996; McKean 2000).21 If
successful, CPR management systems can serve conservation and development purposes
by increasing the value of forests as an amenity, and increasing household incomes
through exclusion. Governments may also avoid costly protection if the group property
right is strong enough so that the benefits of working together to protect the resource are
greater than the costs (Ostrom, 1990).
19 Following Sexton et al. (2015), we use the year 2000 percentage tree cover data and set a 25% tree cover
threshold for what is considered forest. This process eliminates deforestation events post 2012 that do not
coincide with forest in 2012. 20 For a more detailed explanation of the covariates and data sources, see Table 6. 21 Many community-based CPR management policies are implemented with restrictions on harvesting. In
the Maya Biosphere Reserve case, this restriction is based on FSC certification standards.

54
If common property resources are exploited as open access systems, the ability for
any local household to earn income from the forest resource is greatly reduced (Gordon,
1954; Scott, 1955). A CPR management system, such as the MBR forest concessions,
can then benefit local households that have access to the forest if sustainable management
efforts are successful since the resource will be preserved for future use and households
can earn higher incomes from the resource relative to an open access situation. This
increases the value of the land under concession management in the MBR relative to
similar MBR forest not under concession management.
One way to value land rents is to assess timber and non-timber forest product
flows and value those at observed prices. While useful, in a common property resource
management system, this approach may not capture all of the gains in productivity that
occur. For example, individuals may become more productive when they are part of a
group, and the group effort can generate benefits (Holmstrom, 1982). Also, the
concessions provide an opportunity to earn income from the reserve that would not have
otherwise existed, such as value-added jobs in timber mills. By creating a stable, wage-
earning forest industry, households who are concession members no longer have to rely
on exploiting the resource illegally from areas with weaker governance. Forestry then
becomes more productive and households that are relatively more productive in forestry
can benefit by switching into forestry from other, less productive jobs. It is important to
recognize that simply being a concession member does not guarantee an increase in
income. If concession members fail to cooperate with their sustainable forest
management plan or if they cannot effectively monitor and enforce harvesting

55
restrictions, then it is possible that the concession will have a negative or no effect on
member household income (e.g., Alix-Garcia et al. 2005; Ostrom 1990; Baland &
Plattaneu 1996)22.
3.4 Estimation
3.4.1 Effect of concession membership on income
To estimate the effect of concession membership on annual income, we use a two-
stage least squares (2SLS) instrumental variable approach since it is possible that
concession membership may not be exogenous. For example, concession members likely
have connections within the community that are correlated both with the likelihood the
household is a concession member and with household income. Also, while concession
membership may affect income, it is possible that income may impact the likelihood that
a household is a concession member. Wealthier households may be more likely to be
concession members since wealthier households are typically the leaders within a
community. Alternatively, households that did not earn high incomes may be more likely
to join a concession for the opportunity to have a steady job. To mitigate the effects of
reverse causality and unobserved characteristics, we use an instrumental variable
approach. We construct an instrumental variable by matching households from the 2017
survey to households from the 2012 survey using coarsened exact matching methods.
22 We suspect this is the case with the recently-inhabited concession community group since they reside
within the forest and are unable to keep their land unless they are granted a concession. However, few of
the households have backgrounds in forestry and many prefer to rely on subsistence agriculture to make a
living so the people who go into forestry are likely less productive.

56
Matched households from the 2012 survey are a good predictor of concession
membership status for households in the 2017 survey because the households from the
2012 survey are located in the same communities as the 2017 households and have
similar opportunities to earn income. This instrumental variable mitigates the possibility
of reverse causality because the incomes of the matched 2012 households are unlikely to
determine the membership status of 2017 households. Similarly, it is unlikely that the
unobserved characteristics of the 2012 matched households are going to predict the
membership status or household incomes of the 2017 households in the survey. The
household characteristics we use for matching are household head age, household head
education, household head gender, whether the household depends on the forest for their
livelihood, number of individuals under 12 in the household, whether the household head
was born in the Petén, and level of trust23.
The coarsened exact matching method divides the 2017 data into strata. Each
stratum is comprised of observations that are exact matches based on the observable
covariates specified (Mishra, 2016; David et al, 2013; Hausman, 1996). All observations
from which any 2017 observation does not have at least one match from the 2012 data set
were dropped from the stratum. From the matched strata, we take the means of
concession membership status per stratum for the 2012 sample and code this average as 1
(indicating the household is a member) if it is greater than 0.5 and 0 (indicating the
household is not a member), if it is less than or equal to 0.5. This variable based on 2012
23 For a description of each variable used in the income effect analysis, see Table 4.

57
concession membership status is the instrument for the 2017 concession membership
status.
The instrument is valid if it is highly correlated with the variable for which it is
instrumenting and is not directly correlated with the dependent variable. In this study, the
matched 2012 concession membership status average must be correlated with 2017
membership status and the matched 2012 membership status must not be correlated with
household income. To see whether these conditions are met, we examine the first stage of
the 2SLS model. The results show that the instrument is highly correlated with
concession status due to the F-statistic being greater than 10 (Table 23)24. We cannot
directly test whether matched 2012 membership status is correlated with 2017 household
income, or the exogeneity assumption, since we only have one instrument. However, we
conduct a falsification test by estimating the effect of the instrument on income for
observations that were excluded from the analysis, which are the households in
communities whose concession was canceled or suspended and the non-concession
communities. The results indicate that the instrument is not a significant predictor of
income for the subsample. The results of the first stage of the 2SLS model and the
falsification test are in Appendix B.1.
Using the instrument described above, we estimate the 2SLS results for
concession membership on income for all concession communities as well as
24 The exception to this is for the recently-inhabited community group, which has an F-statistic of 9.73.
This could be due to the relatively small number of observations compared to the nonresident and long-
inhabited groups.

58
nonresident, recently-inhabited, and long-inhabited communities separately using
equation (12) and equation (13).
𝐼𝑛𝑐𝑜𝑚𝑒𝑖 = 𝛼 + 𝜃𝐶𝑖 + 𝑋𝑖′𝛽 + 𝛾 + 𝜀𝑖 (12)
𝐶𝑖 = 𝜃𝐶𝑗 + 𝑋𝑖′𝛽 + 𝛾 + 𝜀𝑖 (13)
In equation (12) above, the annual income of household 𝑖 is a function of 𝐶𝑖,
which is the membership status of household 𝑖, 𝑋𝑖′, which represents the household-level
covariates for household 𝑖, 𝛾, which represents village fixed effects, 𝛼, which represents a
constant, and the error term 𝜀𝑖 . Equation (13) is a function for the instrument used for
concession membership. In equation (13), 𝐶𝑗 represents the concession membership
status of household 𝑗 where household 𝑗 is the match of household 𝑖. We control for
variables that impact income including the age, gender, marital status, and education
level of the household head as well as the amount of land owned by the household,
whether the household has savings, the number of children under 12 in the household,
and the education level of the spouse of the head of the household. Married participants
are more likely to earn higher household incomes because more than one individual may
contribute to annual income within the household. Older and more educated participants
will likely have more employment opportunities because they are more likely to have
more skills and experience. The number of children under 12 is a proxy for family
dependents. Households with more dependents will likely have lower incomes because
more time needs to be spent on caring for the dependents, which means less time can be
devoted to working. Households with savings or land in this area are more likely to have
higher incomes because they have more investment opportunities due to having assets

59
Additionally, we control for whether the household depends on the forest and the level of
trust of the respondent, which are variables that affect income in forest-dwelling
communities in the Petén. Being dependent on the forest and having a higher level of
trust imply that the respondent will be more willing to cooperate with other community
members and the rules outlined in a sustainable forest management plan, which
ultimately impacts household income. More detailed descriptions of the variables used to
estimate the income effect of concession membership are shown in Table 9.

60
Table 9. Variable Descriptions for Income Analysis
Variable name Description
Household income The total amount of reported income earned by the household in quetzals.
This includes income earned from forestry and non-forestry activities as
well as dividends earned from forest concessions.
Concession
membership
Indicates whether the household is a member of a community forest
concession in the Maya Biosphere Reserve. This variable is equal to 1 if
the household is a member of a community forest concession and 0 if it is
not
Household head age Represents the age of the household head of the survey participant.
Household head
education
Represents the highest level of education obtained by the household head.
Forest dependent Constructed from a Likert scale question on the 2012 and 2017 surveys
that asked to what extent the respondent agrees with the statement “We
depend on the forest resources for our livelihood.” This variable is equal to
1 if the participant responded “agree” or “strongly agree” and 0 if the
participant responded “strongly disagree,” “disagree,” or “neutral.”
Household head
gender
Observed based on the observed gender of the participant and their
relationship to the head of the household. This variable is equal to 1 if the
participant is a male and 2 if they are a female.
Savings Indicates whether the household has savings. This variable is equal to 1 if
the household has savings and 0 if it does not.
Born Petén Indicates whether the participant was born in the Petén. This variable is
equal to 1 if the participant was born in the Petén and 0 if they were not.
Spouse education Represents the highest level of education obtained by the spouse of the
household head.
Married Indicates whether the household head has a spouse or long-term partner.
This variable is equal to 1 if the participant responded “married” or
“unified” and 0 if the participant responded “divorced,” “single,” or
“widowed.”
Under 12 Indicates the number of children under 12 that live in the household.
Trust Indicates the participant’s response to the question “Do you think that you
can trust the majority of people?” This variable is equal to 1 is the
participant responded “You can trust some people” or “You can trust the
majority of the people.” This variable is equal to 0 is the participant
responded “You need to be very careful with everyone,” “You have to be
somewhat careful with everyone,” “It’s possible that you should be
careful,” “We don’t know,” or if the participant refused to answer.
Own Land Indicates the amount of land in manzanas owned by the household.
The data were collected from 2012 and 2017 household-level surveys in MBR communities.

61
3.4.2 Effect of concession management on conservation outcomes
The value of concessions as a standing forest is comprised of several ecosystem
services such as carbon sequestered from the atmosphere. We focus on carbon
sequestration as an ecosystem service as it is a global public good, can be measured using
available datasets (e.g., Baccini et al., 2012), and can be valued using the social cost of
carbon (Nordhaus, 2017). While other ecosystem services provided by the forest in the
MBR may also be important, they often exhibit high spatial dependence, cannot easily be
measured, and/or do not have an estimated marginal value.
The present social value of the MBR forest on concession land is the discounted
sum of private and public benefits. While forest concessions in the MBR increase
household income, it is important to assess the quantity and quality of the forest
conserved by the concession when considering the value of the community-based, CPR
management policy. Before estimating the effect of the concessions on deforestation, we
take several measures to control for the possibility that concessions were not randomly
sited. First, we take a random sample of points over the entire Maya Biosphere Reserve
using a grid with 100m by 100m cells and overlaying the grid with the reserve boundaries
in ARCGIS. The purpose of the grid sampling is to help control for spatial
autocorrelation by ensuring that we are not matching non-concession plots that are too
close to concession plots (Blackman, 2015). Then, we drop plots that are in a core zone
or in the MBR buffer zone because they are under different management systems. There
are four different land classifications in the MBR: core zone, buffer zone, multiple-use
zone under concession management, and multiple-use zone not under concession

62
management. For our analysis, we focus on the multiple-use zone of the MBR because
the core zone areas typically receive more conservation funding from the government and
are not managed by communities, and the buffer zone contains titled land where clearing
forest is a legal option for households. Within the multiple-use zone, there are tracts of
land that, while still within the MBR boundaries, are not managed as a concession or core
zone area.
Matching typically produces regression coefficients that are more accurate and
robust to misspecification than only using a regression model (Imbens and Wooldridge,
2009; Ho et al., 2007). To match concession area pixels with pixels that are in the
multiple-use zone of the reserve, but are not part of a concession, we use a propensity
score, nearest neighbor matching model and drop plots that are unmatched before using a
panel estimator with year and concession fixed effects for the impact of concession
management on deforestation. The logistic regression results used for matching are in
Appendix B.1.
We restrict the matching analysis to areas of the multiple-use zone not under
concession management because they are the closest counterfactual to the forest
concessions. Both land areas are within a nature reserve created with the intent to
conserve the forest resources, but the concessions are managed by a community-based
common property resource management system while the other areas within the multiple-
use zone are just given the classification of being protected under the reserve without any
actual resources devoted to guarding the land like in the core zone. However, since the
MBR is technically a nature reserve, this status may be a deterrent to clear forest land that

63
does not exist in other areas of Guatemala. Land in the non-concession multiple-use zone
is covered with the same type of forest and is under similar deforestation threats, such as
illegal logging and slash and burn agriculture, as land under concession management
(Radachowsky et al., 2012). In other words, these areas most closely represent what
“would have happened” to the forest under concession management if the concession was
never implemented. We estimate the effect of being under concession management on
deforestation using the fixed effects panel estimator with year and concession-level fixed
effects shown in the equation (14) below.
𝑦𝑖 = 𝛼 + 𝜃𝐶𝑖 + 𝑋𝑖′𝛽 + 𝑇 + 𝛾 + 𝜀𝑖 (14)
In equation (14), 𝑦𝑖 is equal to 1 if pixel 𝑖 is deforested, 𝐶𝑖 equals 1 if the pixel is under
concession management, T represents the year fixed-effects, 𝛼 represents a constant,
𝑋𝑖 represents the characteristics of the forest land area 𝑖, 𝛾 represents the concession-level
fixed effects, and 𝜀𝑖 is an error term. In addition to whether the pixel is under concession
management, we control for distance to the nearest road, distance to the nearest
archaeological site, soil nutrients, elevation and precipitation levels. More detailed
descriptions of each of the covariates and dependent variables used to estimate the effect
of concession management on conservation are shown in Table 10.

64
Table 10. Variable descriptions for conservation analysis
To calculate the amount of CO2 stored by the additional hectares of forest
conserved, we convert the woody biomass layer described in Baccini et al. (2012) into
CO2. Although the households that participate in community forest management are
required to manage the forest sustainably, there is concern that concession logging
practices may degrade the quality of the forest even if they are reducing deforestation
overall (Frost & Bond, 2008). If, for example, concessions are selectively extracting
Variable name Description
Forest loss Represents the forest loss in each year from 2012 to 2017. The variable is
equal to 1 if the 100m by 100m pixel was deforested in a given year. A pixel
is “deforested” if the amount of forest on the pixel drops below 25%.
Carbon This variable is constructed from the Aboveground live woody biomass
density layer from Global Forest Watch. The data is at a 30-meter resolution
for the year 2000. The CO2 value per hectare is estimated from this layer as
50 percent of biomass density values multiplied by the ratio of the molecular
weight of carbon and CO2 (44/12) (Baccini et al., 2012; GlobalForestWatch,
2018).
Current Concession This variable is equal to 1 if the 100m by 100m pixel is under concession
management and 0 if it is not. The separate variables for each type of
concession are nonresident, long-inhabited, recently-inhabited, and
industrial.
Distance to road Indicates the distance of each pixel to the nearest road in meters.
Distance to
archaeological site
Indicates the distance of each pixel to the nearest archaeological site in
meters. The archaeological sites considered are el Mirador, Tikal, and
Yaxha-Nakum-Naranjo, which are the three most visited archaeological sites
in the Maya Biosphere Reserve.
Soil Nutrients An index for the amount of nutrients in the soil ranging from 1, meaning no
or few limitations, to 7, meaning water bodies, or non-soil areas
Elevation Taken from the Advanced Spaceborne Thermal Emission and Reflection
Radiometer (ASTER) Global Digital Elevation Model (GDEM), which is a
product of METWe and NASA. The resolution is 70m and the unit is meters
with 0 meters being at sea level.
Precipitation Represents the average rainfall in millimeters for each pixel for each year
from 2012 to 2017.
Unless otherwise mentioned, the data are at the 30 by 30-meter pixel resolution.

65
forest on the areas that sequester large amounts of carbon dioxide, then their social value
may be less than the average amount calculated from the woody biomass layer. To
address this issue, we compare the tons of CO2 per hectare of just the forest lost within
concession boundaries to the tons of CO2 values per hectare lost in areas outside of the
concession boundaries using a matched panel model with year fixed effects from 2012 to
201725. By comparing the CO2 values on just the areas deforested between 2012 and
2017, we determine whether the pixels lost within concession boundaries sequester
less CO2 than pixels lost outside of the concession boundaries.
3.5 Results
3.5.1 Income effect
The results of the 2SLS model for the effect of concession membership on income
are shown in Table 11. The results show that, on average, concession members earn
about 16,500 more quetzals (about $2,20426) per year than nonmembers in the same area.
This result varies by community type with nonresident and long-inhabited concession
members earning 21,490 (about $2,865) and 19,043 (about $2,539) more quetzals per
year than nonmembers in the same communities respectively. When comparing to the
average incomes for each concession type and the average income for all of the
concession types combined (Table 7), this value implies that being a concession member
increases annual household income between 40 and 50% on average. While this is a
25 We construct the variable for CO2 on pixels with forest loss by interacting the annual forest loss variable
by the carbon values calculated from the woody biomass layer (Baccini et al., 2012) 26 The dollar to quetzal exchange rate used is 7.5.

66
large increase, without access to a forest concession, many of these households would
lack a steady source of income. Additionally, concession members not only benefit from
a higher-than-average daily wage, but also receive annual dividends from the concession
profits. For example, in one of the long-inhabited concessions, Carmelita, the net profits
in 2016 were about 3 million quetzals (about $400,000). About 30% of the profits were
paid to concession members in dividends (about 5,000 quetzals per member) regardless if
they harvested timber or non-timber forest products. Concession members also get first
priority for jobs harvesting timber in the concession. These jobs pay between 200 and
300 quetzals per day, which amounts to between 21,000 and 37,000 quetzals per year per
forestry job that would not have existed if the concessions were not established27.
27 The net concession profits are from “Formato Para La Actualización del Plan de Manejo Integrado de
recursos” provided by the Cooperative Carmelita concession board members. The wage and dividend
information is taken from our 2012 and 2017 household panel of concession members and nonmembers.

67
Table 11. Two-stage least squares results for the effect of concession membership on
income
As a robustness check, we test whether concession membership affects income
using a matched, ordinary least squares (OLS) regression for households surveyed in
2017. To match concession member to nonmember households, we first use a logistic
All Communities
Long-
inhabited
Recently-
inhabited Nonresident
Concession membership 16,533*** 19,043*** -10,538 21,490***
(6,173) (4,341) (15,468) (6,954)
Household head age -25.43 -294.0*** 283.9 38.36
(123.5) (43.8) (343.6) (167.4)
Household head education 879.7 1,402 -1,339 1,330**
(586.6) (1,486) (1,845) (678.8)
Forest Dependent 675.0 11,681*** -7,156 -157.7
(4,673) (731.8) (15,064) (6,007)
Household Head Gender 6,132 10,297*** -12,630 11,605***
(4,279) (2,253) (14,022) (3,652)
Savings -8,211* -18,600*** 5,628 -7,394
(4,249) (4,721) (20,888) (4,704)
Born Petén -1,746 -9,429** 18,609 -1,720
(3,922) (4,620) (12,751) (5,431)
Spouse education 1,624*** 2,055* 1,620 1,295*
(642.7) (1,228) (2,413) (773.3)
Married 11,910*** 6,385 1,397 17,082***
(11,910) (11,213) (17,653) (4,257)
Under 12 2,043* 4,618*** -940.6 8.350
(1,097) (243.5) (3,538) (1,557)
Trust -7,197** -2,836** 3,773 -13,448***
(3,597) (1,360) (10,270) (2,865)
Own Land 260.2*** 335.7*** 351.9** 189.4
(77.3) (23.8) (175.4) (137.3)
Constant 12,624 34,074 22,655 -1,801
(13,619) (35,863) (53,171) (14,932)
Observations 642 166 86 390
R-squared 0.110 0.211 0.104 0.132
*** p<0.01, ** p<0.05, * p<0.1. Robust standard errors clustered at the village level are inside the
parenthesis. All values are adjusted for inflation. Results include village fixed effects. Observations
that were unmatched and that reported income above 300,000 quetzals a year were dropped from the
analysis. The first stage results are in Appendix B.1.

68
regression to calculate the probability of being a concession member based on observable
characteristics28. Then, we drop observations that were not matched and regress
concession membership on income using an OLS regression. The results of the matched
OLS regression are shown in Appendix B.1. For all concession types as well as
nonresident and long-inhabited communities separately, the results shown in Appendix
B.1 are similar to the results from the 2SLS model shown in Table 11. While the
magnitudes for the matched OLS regression are smaller than those in the 2SLS models,
the results of each model show that concession membership has a positive and significant
effect on income for most concession communities.
Unlike the effect on nonresident and long-inhabited concession member
households, the effect of concession membership on income for recently-inhabited
households is negative and insignificant in the 2SLS model, but positive and significant
in the matched, OLS regression. We suspect that the effect of concession membership on
income in recently-inhabited concessions is inconclusive because recently-inhabited
communities do not have backgrounds in forestry and most of the jobs are in agriculture
as shown in Table 2. It is possible that the concession members in recently-inhabited
communities do not actually want to participate in sustainable forest management or find
it difficult to cooperate with each other because they have more of an incentive to
illegally convert the forest land to agriculture due to their limited forest-based histories.
Recently-inhabited communities, however, are located within the MBR boundaries and
28 The results of the logistic regression used to find the predicted probability of being a concession member
are shown in Appendix B.1.

69
do not have titles to their land (Radachowsky et al., 2012). Thus, if they want a legal,
land-use right to the forest land, they are required to be granted a forest concession.
Additionally, three out of the four recently-inhabited concession groups that were granted
a forest management contract through CONAP have since been canceled or suspended
because they did not abide by the rules of the sustainable forest management plan
(Radachowsky et al., 2012). This suggests that they are not benefiting from the system
and have less of an incentive to sustainably manage the forest to protect their land-use
rights.
We also examine the effect of concession membership on income over time using
the panel of 113 households. The results of the fixed-effects panel model for concession
membership on income are shown in Appendix B.1. Although the results are
insignificant, the magnitude of the effect of concession membership on income is
positive, which further suggests concession membership has a positive effect on annual
household income and this effect remains positive over time29.
3.5.2 Conservation effect
The results show that all concession types reduce deforestation, although some
reduce deforestation by a greater extent than others (Table 12). On average, long-
inhabited concessions reduced deforestation by 3.8% from 2012 to 2017 relative to how
much the land would have been deforested if it was not under concession management.
29 We suspect the effect is insignificant due to the small amount of nonmember observations in the sample.
We was unable to estimate the income effect with a panel for recently-inhabited households due to an
insufficient number of nonmember, recently-inhabited households that were surveyed in 2012 and 2017.

70
Table 12. Effect of concession management on deforestation
Similarly, recently-inhabited, nonresident, and industrial concessions reduced
deforestation by 4.86%, 4.23%, and 5.61% respectively. We use the deforestation effects
for each type to calculate the hectares of forest conserved over the five-year time span of
this analysis. We first use the 2000 tree cover data described in Hansen et al. (2013) and
the average annual deforestation rate for the control group from 2001 to 2017 (about
1.7%) to determine what the tree cover reduction would have been if the concessions did
not exist. Then, we use the deforestation coefficients to determine how many of the
deforested hectares were conserved because the land was under concession
All
Concessions
Long-
inhabited
Recently-
inhabited Nonresident Industrial
Current Concession -0.0420*** -0.0379*** -0.0486*** -0.0423*** -0.0561***
(0.000253) (0.000506) (0.00127) (0.000355) (0.000517)
Distance to road -2.29e-06*** -3.87e-06*** -7.38e-06*** -3.25e-06*** -6.34e-06***
(4.09e-08) (7.99e-08) (1.42e-07) (6.59e-08) (1.01e-07)
Distance to
archaeological site 9.56e-08*** 1.00e-07*** 3.70e-07*** 3.10e-07*** 3.18e-07***
(9.74e-09) (1.88e-08) (2.49e-08) (1.42e-08) (1.84e-08)
Soil Nutrients 0.00675** 0.00817* -0.00059 0.01140*** -0.00370
(0.00312) (0.00440) (0.00537) (0.00381) (0.00432)
Elevation 6.07e-05*** 0.000139*** 0.000213*** 0.000169*** 0.000123***
(1.89e-06) (4.06e-06) (6.50e-06) (3.50e-06) (3.73e-06)
Precipitation 3.03e-06*** 5.10e-06*** -3.40e-07 3.35e-06*** -1.73e-06***
(2.60e-07) (5.84e-07) (7.52e-07) (3.38e-07) (5.66e-07)
Constant 0.0142*** -0.0115** -0.0147** -0.0190*** 0.0173***
(0.00326) (0.00481) (0.00605) (0.00408) (0.00472)
Observations 4,208,562 1,997,364 1,311,114 2,504,610 1,961,778
Number of Pixels 701,427 332,894 218,519 417,435 326,963
*** p<0.01, ** p<0.05, * p<0.1. Robust standard errors are inside the parenthesis. The “number of
pixels” represents the number of land parcels in the analysis and the “observations” row represents the
total number of observations over the entire time period. For a description of each variable used, see
Table 10.

71
management. The results in Appendix B.2 show that the concessions collectively saved
about 1,514 hectares from deforestation from 2012 to 2017.
The results in Table 13 show that, on average, the areas of forest lost in the
concessions contain about 24 tons of CO2 per hectare less than areas outside of the
concession boundaries.
Table 13. Effect of concession management on CO2 sequestered on lost forest
This suggests that the area of forest lost within the concession boundaries released
less CO2 into the atmosphere on average than the forest loss outside of the concession
boundaries. The exception to this result is the nonresident concessions. On average, the
forest areas lost within nonresident concessions had about 9.5 more tons of CO2 per
All Concession
Types
Long-
inhabited
Recently-
inhabited Nonresident Industrial
Current Concession -24.10*** -50.84*** -14.51*** 9.505*** -40.58***
(0.464) (0.900) (0.578) (1.901) (2.122)
Distance to road 0.00374*** 0.00437*** 0.00483*** 0.00465*** 0.00478***
(0.00013) (0.00013) (0.000134) (0.000135) (0.000136)
Distance to
archaeological site 0.000112*** 3.76e-05*** -1.28e-05 -4.86e-06 -5.16e-06
(1.21e-05) (1.27e-05) (1.28e-05) (1.28e-05) (1.29e-05)
Soil Nutrients -28.08*** -28.44*** -28.70*** -28.84*** -28.66***
(2.266) (2.277) (2.273) (2.286) (2.285)
Elevation 0.460*** 0.461*** 0.454*** 0.455*** 0.455***
(0.00269) (0.00277) (0.00276) (0.00280) (0.00280)
Precipitation -0.0137*** -0.0140*** -0.0138*** -0.0139*** -0.0138***
(0.000333) (0.000338) (0.000338) (0.000339) (0.000338)
Constant 272.20*** 273.40*** 275.30*** 275.30*** 274.90***
(2.527) (2.547) (2.542) (2.559) (2.558)
Observations 233,147 215,837 225,531 211,604 211,369
*** p<0.01, ** p<0.05, * p<0.1. Robust standard errors are inside the parenthesis. Coefficients are in
tons of CO2 per hectare. The observations used are the pixels that were deforested from 2012 to 2017 within concession boundaries. For a description of each variable used, see Table 10.

72
hectare than similar areas, which suggests that the areas of forest being protected by the
nonresident concessions store less CO2 on average than areas that were lost. The results
for the carbon sequestration benefits adjusted for the specific carbon values of lost forest
areas are shown in Appendix B.2.
The effect of concession management on deforestation reduction from 2012 to
2017 is the smallest for long-inhabited concessions and the largest for industrial
concessions. However, when we estimate the CO2 losses on the deforested areas, there is
a smaller amount of CO2 emitted from forest loss within the long-inhabited concession
boundaries than within the other concessions.
3.5.3 Conservation and income trade-offs
For long-inhabited and nonresident concessions, community forest management
in the MBR increases income for households without increasing deforestation. The long-
inhabited concessions increased annual household income for concession members by
about $2,539 per year and prevented about 335 hectares of forest loss with high carbon
values. Similarly, nonresident concessions decreased deforestation by 622 hectares from
2012 to 2017, and increased annual household incomes for concession members by about
$2,865.
The long-inhabited and nonresident concessions in the MBR show that
community forest management increases income for households without increasing
deforestation. However, there appears to be a trade-off between forest quality and
household income. The impact of forest concession membership on household income in

73
long-inhabited concessions is about $300 less per year than the impact in the nonresident
concessions. However as shown in Table 13, the areas protected by the nonresident
concessions have lower carbon values than the forest lost within the nonresident
concessions. This suggests that nonresident households may be exploiting the higher
quality forest, which leads to higher private benefits at the expense of additional carbon
sequestration.
Not all concessions types succeeded at providing a sustainable source of income
for households while reducing deforestation. Recently-inhabited concessions reduced
deforestation by about 4.9% from 2012 to 2017. While this avoided about 66 hectares of
deforestation, there is little statistical evidence that recently-inhabited concession
members benefited from concession membership. This suggests that there is a trade-off
between deforestation reduction and livelihood benefits in recently-inhabited
communities in the MBR. This outcome may relate to the typical background of
households in recently-inhabited concessions, which are comprised more heavily of
recent migrants to the MBR. Unlike the long-inhabited concession communities that are
comprised of households with forest-based histories and lived within the reserve
boundaries for multiple generations, many households in recently-inhabited communities
settled within the MBR boundaries around the time it was created and had little
experience with forestry.

74
3.5.4 Concession valuation
The value of the land under concession management in the MBR is the value of
the increased carbon sequestration and the additional household income concession
member households receive. To calculate the private benefits of the concessions, we
assume the annual household income impact shown in Table 11 is the same for each year
from 2012 to 2017. We calculate the value of the increased carbon sequestration due to
prevented deforestation by estimating the cumulative sequestered carbon rental value
from 2012 to 2017. To estimate the carbon rental value, we first find the asset value of
the carbon sequestered due to prevented deforestation from 2012 to 2017 using $31 as the
social cost of carbon. As shown in Table 14, this value is $15,714,443. Then, we use a
5% discount rate to calculate the average annual rental value of the carbon sequestered
over the five-year period.

75
Table 14. Cumulative value of land under concession management from 2012 to 2017
As shown in Table 14 above, the cumulative value of household income and
carbon sequestration benefits from forest concession management in the MBR from 2012
to 2017 is $17,166,005, which equates to about $34.05 per hectare. When estimated
separately, the per hectare values of long-inhabited, recently-inhabited, nonresident, and
industrial concession management separately are about $48.87, $8.27, $32.94, and $9.82
per hectare respectively.
All Community
Types
Long-
inhabited
Recently-
inhabited Nonresident Industrial
Average annual income
effect per household $2,204.42 $2,539.04 - $2,865.29 N/A
Concession member
households 1,218 454 65 699 N/A
Cumulative Income effect
(2012-2017) $13,424,947 $5,763,615 - $10,014,191 N/A
Asset value of carbon
sequestered (2012-2017) $15,712,443 $3,496,149 $710,520 $6,176,316 $5,329,458
Cumulative carbon rents
(2012-2017) $3,741,058 $832,416 $169,171 $1,470,551 $1,268,919
Hectares 504,108 134,978 20,445 348,686 129,164
Cumulative value
(income and carbon
rents) $17,166,005 $6,596,031 $169,171 $11,484,742 $1,268,919
Cumulative value per
hectare $34.05 $48.87 $8.27 $32.94 $9.82
Annual Value per hectare $6.81
External Funding $11,670,105
Total net value $5,495,900 Total net value per
hectare $10.59 Total annual net value per
hectare $2.18 The income in the "All community types" column is calculated using the income effects regression
coefficient for the entire sample. All income values are adjusted for inflation. The quetzal to USD
exchange rate used is 7.5. The carbon sequestration rental value is calculated using a 5% discount rate as
shown in Nordhaus (2017). The values for cumulative carbon rents are the sum of the annual carbon
rental values for each year from 2012 to 2017. The values for all community types represent the average
values among the concessions. The income effect for recently-inhabited concessions is not statistically
different from 0. Due to limited information on external funding, we cannot accurately report the
external funding for each concession classification.

76
The organization that oversees the concessions is the Association of Forest
Communities in the Petén (ACOFOP). ACOFOP receives grant funding from
organizations such as the Inter-American Foundation, Margaret A. Cargill Foundation,
Ford Foundation, ClimateWorks Foundation, and USAID and partners to foster
conservation efforts and economic development of surrounding communities. ACOFOP
uses these grants to manage the concessions and provide the initial investments in
equipment to add value to the harvested forest products. As shown in Table 14, the
amount these organizations contributed to concession management from 2012 to 2017 is
approximately $11,670,10530. When considering these costs, the annual net value of
concession management from 2012 to 2017 is about $2.18 per hectare.
3.6 Conclusion
This paper develops methods to evaluate the benefits of a community-based,
common property resource management system. Ostrom (2009) has observed that
common property systems that manage resources effectively, provide benefits to
community members, and protect public goods like forests or water have long existed. As
a result, policy makers have been encouraged in recent years to implement common
property systems as a way to protect natural resources in tropical forest regions where
property rights are insecure, and open access exists. Few studies, however, have
examined whether benefits of establishing such systems exceeds the costs, in part
because it is difficult to quantify the benefits. Thus, while many assessments have now
30 This value reflects the values reported in Gray et al. (2015).

77
established that CPR management systems can reduce externalities, and in particular
deforestation, no studies to our knowledge have estimated the private and public benefits
of a CPR management system. We address this issue by developing methods to calculate
the benefits of land tenure and forest management in a CPR management system in the
Maya Biosphere Reserve in northern Guatemala.
To accomplish this, we use a survey of members of the MBR forest concessions,
and nonmembers in communities in and around the reserve in two different time periods.
We use a novel instrumental variable approach to control for selectivity to estimate the
effect of membership on income and use this measure as an estimate of the productivity
gains associated with the concessions. To complete the analysis, we calculate the value of
the gains in carbon due to the concession management system using the social cost of
carbon.
The results demonstrate that community-based CPR management can have
significant welfare benefits from an environmental conservation and development
perspective. These benefits vary by concession classification. For example, Long-
inhabited concessions are the most valuable per hectare and recently-inhabited
concessions are the least31. In long-inhabited and nonresident concessions, the value
added from the increase in household incomes attributed to concession membership is
greater than the carbon sequestration values. This suggests that community-based CPR
management policies can improve livelihoods in countries with common property
resources.
31 Note that the income effect for recently-inhabited concessions is not statistically different from 0.

78
Our estimate is likely to be a lower bound for their actual values. The income
effect is likely underestimated because industrial concessions provide job opportunities to
households not associated with a community concession in communities around the
Petén. Although they are still required to manage the forest sustainably and, as shown in
Table 12, have succeeded in reducing deforestation, industrial concessions are not
managed collectively by local households, but are instead managed by private companies.
Since workers do not have a direct stake in concession profits nor in protecting the forest
like in the community concessions, if industrial concession workers are in our dataset,
they are considered to be nonmembers. Additionally, there are several in-kind benefits
concession members receive that are not quantified in the dataset including life insurance
and scholarships. Also, as shown in Appendix B.2, concession management has a
positive effect on preserving wildlife habitat, however this effect is not quantified in the
valuation.
Like many community-based resource management policies in developing
countries, MBR concessions are partially funded through international conservation and
development organizations (Gray et al., 2015). This study shows that the value of the
MBR concessions outweighs the costs. Although this estimate is a lower bound for their
actual value, in all cases, the community-based CPR management system succeeds in
reducing deforestation, which resulted in a carbon sequestration rental value of about
$3,741,058 million from 2012 to 2017. However, the conservation benefits of increasing
CO2 sequestration comprise less than half of the value of the forest concessions. The
results in Table 14 show that, without considering the private benefits, the net benefit of

79
implementing the forest concessions is negative versus about $2.18 per hectare when
considering the community development impacts. This suggests that if households were
not able to profit from the forest resources and were only compensated for the
environmental benefits of the system, their incentive to protect the forest would be
significantly reduced.
When implementing a CPR management system, it is important to consider the
implications on the local communities as well as the environment. Our results suggest
that involving local households in CPR management can result in significant societal
welfare gains. Additionally, our results show that while conservation and development
objectives can be simultaneously achieved, but there may be a small trade-off between
household income and exploiting areas with high carbon values. For example, the
nonresident concession member households benefit the most from concession
membership, but they are likely exploiting areas with high carbon values to gain more
income.
When managing common property resources, allowing local communities to take
part in the management process raises the land value of the resource area and incentivizes
households to effectively manage the forest to maximize their earnings from the resource.
These findings are especially relevant in a developing country context where households
that live near resources frequently depend on extracting the resources or using the land
for their livelihoods. All in all, if successful, community CPR management has the
potential to generate public and private benefits through conservation and economic
development.

80
Chapter 4: Timber or Carbon? Evaluating forest conservation strategies through a
discrete choice experiment
4.1 Introduction
Conserving tropical forests in developing countries is not an easy task because
property rights are often insecure, and communities located in the forest may depend on
converting forested land to agriculture or extracting forest resources as a source of
income. Conversion of forests to agriculture currently accounts for 15 to 20% of the
world’s annual carbon emissions (IPCC, 2014). Although timber management in the
tropics and elsewhere can be done sustainably to reduce emissions (e.g. Roopsind et al.,
2018; Tian et al., 2018), there is concern that even sustainable timber production leads to
forest degradation, carbon emissions, and biodiversity losses in the tropics (Schulze et al.,
2008; Ahrends et al., 2010; Brandt et al., 2016). Forest degradation in the tropics is
especially problematic because there is often significant damage done when logging
occurs (Putz et al. 2012; Martin et al. 2015). Currently, around 20.5 million hectares of
forests in developing countries are managed in FSC certified timber reserves (FSC Global
Development, 2019), however, shifting these forests to carbon reserves could increase
carbon sequestration.
This study builds on several studies that consider whether payments for
ecosystem services (PES) programs can be deployed in the tropics to conserve resources
81
(e.g., Vorlaufer et al., 2017; Jayachandran et al., 2017; Randrianarison et al., 2017; Duke
et al., 2014; Ortega-Pacheco et al, 2009; Wunder et al, 2008; Wunder and Albán, 2008;
Kosoy et al, 2008; Kosoy et al., 2007). The literature suggests that there is the potential to
lower carbon emissions in the tropics with sustainable and reduced impact logging (e.g.,
Pearson et al., 2014), but few studies have considered whether groups with forest tenure
rights would be willing to give up timber and non-timber forest product (NTFP)
harvesting to sequester carbon. This study addresses this issue by examining the trade-off
between timber production and carbon storage in forest concessions where individuals
have rights to manage forest resources. Specifically, we examine whether individuals
with rights to forest concessions already managed with FSC certification in a developing
country would be willing to further reduce timber production to gain payments for carbon
sequestration. We then determine how much they would be willing to accept to give up
timber harvesting, in conjunction with other important attributes.
Stopping harvesting and reducing emissions, however, may be costly. Tenure
arrangements for groups that allow sustainable timber harvesting link the quality of the
resource to profits and household income (Bocci et al., 2018; Meilby et al., 2014;
Fortmann et al., 2017). These exclusive land use rights provide households with an
incentive to protect forests, which diminishes overexploitation. Thus, more income can
be generated from the common-pool resource (Scott, 1955; Gordon, 1954). If, on the
other hand, households received a payment to stop extracting resources, ensuring that this
is effective would require strict monitoring of forest outcomes and linking the payments
households receive to these outcomes.

82
When deciding whether to participate in decentralized forest management,
households must consider how forest management affects their access to the resource and
income-earning potential. This study puts these household-level decisions into the
context of potential PES contracts in the Maya Biosphere Reserve (MBR) that would
restrict land use and other income-earning activities in exchange for an annual payment.
The MBR is protected through the allotment of concession management agreements to
individual communities who must maintain forest cover in return for exclusive access to
timber and NTFP harvesting. Although this study is conducted in the context of the
MBR, the results of this study can be applied to PES contracts elsewhere. Many
developing countries have decentralized tropical forest management to local community
groups in exchange for exclusive land use rights in a similar way to the MBR (e.g.
Primack et al, 1998; Kumar 2002; Agrawal & Chhatre, 2006; Alix-Garcia, 2007; Miteva
et al, 2012; Meilby et al. 2014; Rasolofoson et al.,2015).
For example, this study considers the role of property rights by examining the
trade-off between carbon storage and timber harvesting. To receive payments for carbon
storage by reducing timber harvesting, communities would have to give up a portion of
their land-use rights and an external agency would have permission to closely monitor
timber flows and carbon in the area. In principle, people should be willing to trade these
rights in return for payments, but the payments for carbon typically come from
government sources (either nationally or internationally). Although timber harvesting
requires more time than conserving the forest to receive payments for carbon
sequestration, it is possible that those with tenure rights will not trust government to pay
83
for the carbon, especially when they may have to give up a fairly secure private stream of
revenue from timber and non-timber forest products.
Communities may also value forest resources for cultural or other economic and
non-economic reasons. For instance, MBR concessions currently manage a portfolio of
income generating activities that includes timber, non-timber forest products, and
tourism. They distribute the economic benefits of their activities to members individually
through wages or dividends, and through in-kind benefits that include public goods such
as schools, medical facilities, and other benefits. These cultural and economic benefits
could have important implications when measuring preferences because a contract for
carbon sequestration could alter access to forests for all purposes. Although not all
households are able to harvest non-timber forest products, NTFP harvesting is a
culturally significant activity in the MBR and it is possible that many households enjoy
having the option to harvest them and want to preserve NTFP harvesting traditions for
future generations (Nesheim & Stølen, 2012; Taylor 2010). Similarly, tourism is a
growing industry in the MBR, which may provide substantial benefits to residents in the
future.
In the MBR concessions, some benefits are distributed to concession members via
individual payments (wages or dividends) or group payments (e.g., provision of public
goods). Carbon sequestration contracts could shift payments either more towards
individuals or more towards the provision of public goods, depending on where the
proceeds are sent. We specifically test individual preferences for the type of payment in
our analysis. We also assess contract length to determine if households prefer to enter a

84
land use contract for a longer period of time. Stable work is scare in the MBR so it is
possible that households prefer a contract that guarantees them a longer-term stable
income (Radachowsky et al., 2012; Bocci et al., 2018). The subsequent sections describe
the attributes, data, and methods of the choice experiment followed by the model
specification. The final sections describe the results of the analysis and provide a brief
discussion of their policy implications.
4.2 Methods and Data
4.2.1 Maya Biosphere Reserve Household Characteristics
We administered a survey to 716 households in communities in and around the
MBR concessions during the summer of 2017. Using lists of community members
obtained from concession leaders, we randomly selected 25% to sample. Local
enumerators then visited each selected household and conducted the survey via an in-
person interview. If no adult members of the household were present, the enumerator
asked when the participant would be returning and set up a time to return. If no adult
members of the household were present when the enumerators returned, the enumerators
surveyed another concession member household we randomly selected from the list.32
While our original protocol called for providing a small remuneration to the survey
participants (around $3), we were asked by the community concession leaders to forgo
32 The overall survey response rate for households asked to take the survey was about 99.6%. There were 2
out of 716 households given the choice experiment that did not want to participate so we selected
alternative households in these cases. We also had to select alternative houses from the concession member
list in about 10% of the cases because we were unable to find the respondent to ask for their participation.
The majority of these cases were in nonresident communities.

85
this remuneration. Instead, we provided participants with cards that contained $3 worth of
airtime for their cell phones.
Our sample includes both members of the community concessions living in 19
communities, and nonmembers who live in the same set of communities. While non-
member households cannot currently receive profits from harvesting timber through a
forest concession, they could experience the impacts of a carbon program if it alters
outputs in timber or non-timber forest products. For example, if non-members work in
one of the mills owned by the concession, lower harvests would affect their livelihoods.
Additionally, they may be affected if the payments provide public goods from which they
can benefit (e.g., better roads, schools, or medical facilities) or if carbon payments are
provided to all households within a community. Despite these potential effects, non-
members do not have land-use rights to the concessions, and thus have less to gain or lose
with a change in how they are managed. This means that they will have different values
for the potential shift in property rights. To obtain the non-member sample, we selected
households neighboring those of the concession members surveyed. We assumed
neighboring non-member households have similar spatial and observable characteristics
to the concession member sample.
The full survey that we administered contained 8 parts with this choice
experiment occurring at the end. The first 7 parts of the survey focused on demographic
characteristics of the household, income generation, attitudes towards forest resources
and the concessions, and migration history. The final section included the choice
experiment elicitation and the follow-up questions. We developed and implemented the

86
script for the choice experiment with the enumerators to help respondents better
understand the consequences of their choices. The full script in English and Spanish is
shown in Appendix A.
Most of the head of households in the sample are males (Table 15), with an
average age of 46 years and about 7 years of education. Average household income
across the groups is around $4,608 USD (34,560Q) per year (Table 15). Concession
members have higher income than non-concession members by about 48% (Bocci et al.,
2019). Around 41% of concession member households have jobs in forest-related
activities.33
Table 15. Maya Biosphere Reserve Household Characteristics
Members Nonmembers
Forest-
dwelling
Non-forest
dwelling All
Male Household Head 80% 75% 77% 78% 77%
Female Household Head 20% 25% 23% 22% 23%
Born in the Petén 63% 63% 70% 60% 63%
Born outside of the Petén 37% 37% 30% 40% 37%
Average Age 50.45 42.46 42.33 48.69 46.43
Average Education (years in school) 6.54 7.07 6.28 7.10 6.81
Median Annual Household Income $5,493 $3,933 $4,597 $4,624 $4,608
Average Annual Household income
from forest harvesting activities $1,772 $595 $2,075 $688 $1,180
Percentage of households with a job
in a forest harvesting activity 41% 14% 49% 16% 28%
One dollar is equal to about 7.5 quetzals. The average annual income from forest activities includes
households that earn $0 from forestry.
The survey contained Likert-scale questions that examined the respondents’
attitudes towards environmental issues in the MBR (Table 16). The results suggest a large
level of interest in and concern about maintaining the forest resources of the Petén. The
33 The proportion of income earned from forest-related activities is derived from a 2017 household survey
of concession members and non-members. Table 2 shows the average income earned from forest-related
activities for the combined sample of concession members and non-members.

87
respondents seem largely aligned with the current policy that limits access to a large
amount of nearby forests in that a large portion disagree or strongly disagree that anyone
should be able to access the forests to cut trees or to harvest non-timber forest products.
The respondents are also somewhat neutral about whether agriculture threatens forest
resources. To assess whether individuals discerned a difference between cattle ranching
and other types of farming, we included a question specifically asking if cattle are
threatening the forests in the final 242 of the surveys collected. The results suggest that
our respondents do distinguish between these two types of production. The results of the
Likert scale questions also indicate the importance of non-timber forest products locally.
There is stronger support for harvesting non-timber forest products and engaging in
tourism than harvesting timber among all the individuals and among the subgroups of
individuals.
Table 16. Likert Scale questions on attitudes towards various environmental and
concession related issues in the MBR (1=strongly disagree; 5=strongly agree)
All
communities
Concession
Members Nonmembers
Forest-
dwelling
Non-forest
dwelling
Statement Avg n Avg n Avg n Avg n Avg n
I depend on the forest
resources for my livelihood 3.71 713 3.98 355 3.44 358 4.28 254 3.40 459
I am very worried about the
future of the forests in the
Petén
4.58 714 4.61 355 4.55 359 4.58 254 4.58 460
Anyone should be able to cut
wood from the Maya
Biosphere Reserve
1.72 709 1.70 352 1.73 357 1.75 254 1.69 455
Anyone should be able to
harvest non-timber forest
products from the Maya
Biosphere Reserve
1.79 714 1.76 355 1.82 359 1.83 254 1.77 460
Cattle ranching is threatening
the forests in the Petén 4.52 242 4.50 105 4.55 137 N/A 0 4.52 242

88
Table 16 (cont.)
All
communities
Concession
Members Nonmembers
Forest-
dwelling
Non-forest
dwelling
Statement Avg n Avg n Avg n Avg n Avg n
Agriculture is threatening the
forests in the Petén 3.19 711 3.16 354 3.22 357 2.98 252 3.31 459
Ecotourism harms the forests
in the Petén 1.83 707 1.78 354 1.88 353 1.78 252 1.85 455
Ecotourism harms the
cultural resources in the
Maya Biosphere Reserve
1.74 712 1.66 354 1.81 358 1.69 254 1.77 458
The forests should receive
strict protection without
being exploited by
concessions or other uses
3.42 712 3.14 354 3.70 358 3.18 254 3.55 458
Protecting the historical and
cultural resources such as
Tikal and el Mirador is
important
4.70 708 4.68 353 4.73 355 4.71 249 4.70 459
Extracting wood from the
Maya Biosphere Reserve is
an important source of
income for the region
3.75 702 4.00 351 3.50 351 4.07 251 3.57 451
Extracting wood from the
Maya Biosphere Reserve,
even if done sustainably,
harms the environment
3.22 710 2.86 353 3.58 357 3.04 252 3.32 458
Extracting non-timber forest
products from the forest
(such as chicle and xate) is an
important source of income
for the region
4.31 711 4.49 354 4.14 357 4.56 252 4.18 459
Ecotourism is an important
source of income in the
region
4.26 711 4.32 354 4.21 357 4.24 252 4.28 459
It is necessary that the
government spend more
money on protecting the
forest in the Maya Biosphere
Reserve against illegal
activities
4.52 711 4.54 354 4.50 357 4.53 252 4.52 459
In 20 years, there will be the
same amount of forest in the
Maya Biosphere Reserve
2.71 709 2.96 352 2.47 357 3.14 251 2.48 458
Only 242 respondents were asked whether cattle ranching is threatening the forests in the Petén.

89
4.3.2 The Choice Experiment Instrument
Following recommendations outlined in Johnston et al. (2017), we used our findings
from several focus groups conducted in summer 2016 to identify important attributes of the
decision to enter a carbon contract. The focus groups consisted of concession members and
non-members invited from MBR communities. We invited the non-members to complete the
survey to help ensure that the results reflect an accurate valuation for all households in the
area, not just those directly involved in current concession activities (Wilson and Howarth,
2002). During the focus groups, we presented participants with lists of attributes they would
like included in a concession contract under the assumption that similar attributes would be
valued in a contract to store carbon. We chose to present this in the context of the
concessions because member and non-member households were already familiar with the
concession contract structure and the strengths and weaknesses of the current concession
contracts.
The important attributes we identified were payment size, whether non-timber and
tourism activities could continue, and contract length. Using these attributes, we developed
an initial design that asked participants to choose between one of two contracts to store
carbon or the status quo (no contract option). The two carbon storage contracts contained
different levels of the attributes that we identified as important in the focus groups. After
developing an initial design, we had it reviewed by several individuals working at NGOs in
the region who are familiar with the concession activities. To select the pictures used for the
choice experiment, we intercepted individuals in Petén communities, presented several
pictures to them, asked them what they thought the picture described, and then selected
pictures based on these perceptions. We developed a design to minimize D-error and began

90
testing the instrument in the field, following the recommendation in Johnston et al. (2017).
The instrument was blocked into 6 blocks of 6 choice occasions. After obtaining the first 25
responses in a test community, we estimated a Random Utility Model (RUM), used the
resulting parameter estimates to rerun the design to further minimize D-error, and
implemented the new design. We updated the design for approximately one week with new
data from responses obtained each day. Based on the findings from the focus groups and the
results from the test community, we used five attributes in the final instrument for this
analysis: level of carbon storage, contract length, payment per year of the contract, whether
NTFP harvesting or ecotourism is permitted, and whether the payment is at the community or
individual level (Table 17).
Table 17. Choice experiment levels and attributes
Attribute Levels
Carbon storage Increase carbon storage by 30% and decrease timber harvesting by 30%
Decrease carbon storage by 30% and increase timber harvesting by 30%
Keep timber harvesting levels the same and get paid for carbon storage
Contract length 5, 10, or 20 years
Other permitted activities Only permit NTFP harvesting
Only permit tourism
Permit both NTFP harvesting and tourism
Prohibit NTFP harvesting and tourism
Payment level Individual
Group
Payment amount 800, 2000, 3200, 4800, 10000, or 20000 quetzals
One U.S. dollar equals about 7.50 quetzals. The average annual income for MBR households is about
28,000 quetzals so the payment amounts ranged from 2.86% to 71.43% of the average income. Each
level of carbon storage is represented by a binary variable that equals 1 if the contract has that
attribute and 0 if it does not.

91
Following Johnston et al. (2017), the enumerators were instructed to clearly
describe to households how the MBR was formed, what MBR residents are currently
doing to help sequester carbon in the reserve, and ask the respondents several questions
while describing the scenario to help ensure that the respondent stayed focused and
understood the scenarios. To enhance policy consequentiality, the enumerators told
respondents to think carefully about their choices because their choices would be
considered when policy makers offered a price for carbon in future carbon sequestration
programs in the MBR. Enumerators also described the status quo option as the household
being permitted to participate in ecotourism and NTFP harvesting, not receiving a
payment to store carbon, and not receiving an additional payment. The choice experiment
script that was administered to MBR households in 2017 is in Appendix C.1.
The three levels of the carbon storage attribute represent the range of decisions
that individuals can plausibly undertake. First, as shown in Fortmann et al. (2017) the
concessions have already reduced carbon emissions because they are measurably
reducing deforestation, however, the concessions have not been explicitly remunerated
for the carbon they have stored to date (Guzman, 2019). Thus, one option would be for
the communities to receive payment for the carbon benefit they are already providing.
Second, the concessions can reduce their timber harvesting activities, which would
further increase carbon storage in the region (see Pearson et al., 2014). This would
reduce their timber revenues, but they would be compensated via carbon payments.
Alternatively, the concessions could increase their timber harvesting activities, which
would also increase their revenues, but reduce the carbon stored in the concession.

92
The contract length attribute describes the number of years the household would
have to agree to abide by the restrictions in the contract. Participants were told they
would receive the payment shown for each year of the contract and be subjected to strict
enforcement and monitoring of the carbon program. We conveyed that the monitoring
that would occur as part of the carbon program would be significantly more intensive
than current monitoring activities on the current set of programs. We also conveyed that
the concessions could lose the carbon payments if they do not abide by the restrictions.
The payment attribute shows how much the household would be compensated for
each year of the contract. Households were instructed in the survey script that the
payment is the net effect of all of the possible changes to their salaries, dividend
payments, and direct or in-kind carbon payments that result from making the adjustments
described within the contract. For example, if a household selected a contract that
required them to increase carbon storage by 30% by decreasing timber harvesting for
10,000 quetzals per year, the household should expect their net income to change by
10,000 quetzals per year after taking into account the payment and all possible changes to
their annual income.
4.3 Model Specification
To analyze the choice experiment data, we start with the typical expression of
indirect utility Vj for individual i represented by equation (15),
𝑉𝑖𝑗 = 𝑣𝑖𝑗 + 𝜀𝑖𝑗 (15)
where Vij represents the observable utility component respondent i receives by choosing
alternative j and ɛij represents the random error component. We assume the respondent

93
maximizes their utility when making a choice among the alternatives presented to them.
Hence, if respondent i chooses alternative j over another alternative (k), we assume
Vij>Vik. The probability of respondent i choosing alternative j over alternative k in choice
set c is shown in equation (16).
𝑝𝑖 (𝑗
𝑐) = 𝑝(𝑉𝑖𝑗 > 𝑉𝑖𝑘) = 𝑝[(𝑣𝑖𝑗 + 𝜀𝑖𝑗) > (𝑣𝑖𝑘 + 𝜀𝑖𝑘)], 𝑗 ≠ 𝑘 (16)
We estimate the probability of individual i choosing an alternative in the choice set c
(equation (16)) with a mixed logit. A mixed logit is more flexible than a standard logit
because it allows for random taste variation, unrestricted substitution patterns, and
correlation in unobserved factors over time (McFadden and Train, 2000). Equation (17)
shows the estimation of pij based on observable covariates of the individual (Zi) and
observable characteristics of the choice set from which individual i chooses alternative j
(Xij).
𝑝𝑖𝑗 = ∫exp(𝛽𝑖𝑋𝑖𝑗+𝛾𝑍𝑖)
∑ exp(𝛽𝑖𝑋𝑖𝑗+𝛾𝑍𝑖)𝐾𝑘=1
𝑓(𝛽|𝜃)𝑑𝛽 (17)
From equation (17), we estimate the respondent’s willingness to accept for each attribute
described in Table 19. This value represents the amount of money that must be given to a
person for them to be just as well off as they were before changing their behavior (Haab
and McConnell, 2002, Casey et al, 2008). If the respondent, for example, engages in 1%
more sustainable timber harvesting, they are changing their behavior by exerting
additional effort to harvest more timber and must be compensated accordingly. Assuming
Vij is linear and additive, we estimate the indirect utility function for the entire sample of
concession communities with equation (18).

94
𝑉𝐴𝑖𝑗 = 𝛽𝐴𝑋𝐴𝑖𝑗+ 𝛾𝐴𝑍𝐴𝑖
+ 𝜀𝐴𝑖𝑗 (18)
where the subscript A refers to “all” the sample. Due to the different backgrounds of
individuals in the sample, the attributes that maximize utility are likely not the same
across groups. For example, groups that reside within the forest would likely receive
more utility from being allowed to harvest non-timber forest products because
households have used NTFP harvesting as a stable source of income for multiple
generations and harvesting these products is culturally important to forest-dwelling
communities (Radachowsky et al., 2012; Plotkin & Famolare, 1992). Also, households
that are concession members will likely receive less utility from a carbon contract since
they have grown accustomed to earning a stable income from sustainable timber
harvesting. Because of these differences, we estimate separate indirect utility models for
concession members (equation (19)), nonmembers (equation (20)), forest-dwelling
households (equation (21)), and non-forest dwelling households (equation (22)). The
willingness to accept can then be represented as the ratio of each β for each attribute over
the β for the payment attribute (equation (23)).
𝑉𝐶𝑖𝑗 = 𝛽𝑐𝑋𝐶𝑖𝑗+ 𝛾𝐶𝑍𝐶𝑖
+ 𝜀𝐶𝑖𝑗 (19)
𝑉𝑁𝐶𝑖𝑗 = 𝛽𝑁𝐶𝑋𝑁𝐶𝑖𝑗+ 𝛾𝑁𝐶𝑍𝑁𝐶𝑖
+ 𝜀𝑁𝐶𝑖𝑗 (20)
𝑉𝐹𝑖𝑗 = 𝛽𝐹𝑋𝐹𝑖𝑗+ 𝛾𝐹𝑍𝐹𝑖
+ 𝜀𝐹𝑖𝑗 (21)
𝑉𝑁𝐹𝑖𝑗 = 𝛽𝑁𝐹𝑋𝑁𝐹𝑖𝑗+ 𝛾𝑁𝐹𝑍𝑁𝐹𝑖
+ 𝜀𝑁𝐹𝑖𝑗 (22)
𝑊𝑇𝐴 = −1 (𝛽𝑎𝑡𝑡𝑟𝑖𝑏𝑢𝑡𝑒
𝛽𝑝𝑎𝑦𝑚𝑒𝑛𝑡) (23)

95
4.4 Results and Discussion
The results for the mixed logit model for all communities combined, communities
within the forest, communities outside of the forest, concession members, and
nonmembers are shown in Table 18. The results across the full sample show that
households prefer to sign a PES contract that sells carbon rather than remain in the status
quo. Households also show preference for contracts that are longer, allow for NTFP
harvesting, allow for ecotourism, and provide household-level payments instead of
community-level or group payments. There are also several household characteristics
that affect the likelihood that a household selects the status quo. The results for the full
sample and nonmembers show that residing within a forest-dwelling community and
having a female household head makes the respondent less likely to select the status quo.
For non-forest dwelling households, having an older household head makes the
respondent less likely to select the status quo.
For forest-dwelling communities, the results for households preferring carbon or
timber harvesting are insignificant, suggesting that households living in forest
communities do not strictly prefer carbon or timber payments. Forest-dwelling
households, however, have strong preferences for NTFP harvesting and ecotourism. In
long-inhabited communities, for instance, households have traditionally depended on
harvesting non-timber forest products for their livelihoods, and harvesting non-timber
forest products like xate is a culturally important activity (Radachowsky et al., 2012;
Plotkin & Famolare, 1992). Although income from xate is lower on average than income

96
earned from timber harvesting activities34, harvesting non-timber forest products such as
xate provides a stable source of income for the region and requires almost no initial time
or capital investment since it grows naturally in the MBR and there is no expensive
equipment needed to harvest the leaves. Additionally, xate harvesting gives women and
children the opportunity to participate in the labor force with flexible schedules since xate
harvesters are typically paid per bundle of leaves and can be harvested after doing
household chores or attending school (Nesheim & Stølen, 2012). We suspect that
households residing within forested areas selected contracts heavily based on having
access to the forest and NTFP harvesting.
In contrast, households that reside outside of the forest within the MBR buffer
zone show preferences for storing carbon over increasing timber harvesting. Although
these households also prefer to have access to the forest for NTFP harvesting and
ecotourism, the parameter estimates on these attributes are smaller than the same
parameters for the forest-dwelling communities that reside within the multiple use zone.
One possible reason why households that reside outside of the forest would like to store
carbon is that many households within these communities are not concession members,
but still would like to receive compensation for protecting the forest.
34 The results from a 2017 survey of MBR communities show that the average income for a NTFP
harvester is between 50 to 100 quetzals ($6.67 to $13.33) per day while the average income for a timber
harvester or tourism worker is between 200 and 300 quetzals ($26.67 to $40) per day.

97
Table 18. Mixed logit results for contract attributes
The willingness to accept estimates calculated using equation (23) are shown in
Table 19. The attributes with positive coefficients are those for which households would
All
communities
Concession
Members
Nonmembers
Forest-
dwelling
Non-forest
dwelling
Payment amount (in
1000 Q) 0.0420 *** 0.0521 *** 0.0339 *** 0.0368 *** 0.0478 ***
(0.000004) (0.000007) (0.000006) (0.000008) (0.000006)
Store more carbon 449.57 *** 307.42 ** 593.57 *** 44.54 715.58 ***
(0.07697) (0.12372) (0.09822) (0.12188) (0.09944)
Keep the same
carbon storage 300.76 648.76 ** 6.79 586.51 372.07
(0.20227) (0.33387) (0.24680) (0.37521) (0.232.74)
Contract length 20.05 *** 23.32 *** 17.53 *** 17.05 ** 20.98 ***
(0.0041) (0.00686) (0.00514) (0.00714) (0.00509)
NTFP harvesting 1,252.72 *** 1,711.97 *** 946.37 *** 1,928.81 *** 919.15 ***
(0.08955) (0.16309) (0.10299) (0.17449) (0.09732)
Tourism 830.56 *** 1,142.67 *** 633.70 *** 1,211.49 *** 648.56 ***
(0.07180) (0.12412) (0.08731) (0.12880) (0.08670)
Group payment -225.93 *** -119.11 -289.57 *** -345.30 *** -163.88 *
(0.07082) (0.11480) (0.08962) (0.12225) (0.08774)
Status quo -2,694.18 *** -2,430.03 * -2,721.36 *** -3,939.65 *** -971.53
(0.85266) (1.2881) (1.0153) (1.31140) (0.71050)
Gender*status quo -1,076.00 ** -1,004.14 -1,133.51 ** -690.70 -744.55
(0.50039) (0.985.83) (0.56487) (0.76007) (0.62146)
Age*status quo 12.94 -32.38 17.27 -29.19 -31.63 **
(0.01643) (0.01793) (0.01847) (0.02048) (0.01549)
Education*status
quo -11.60 2.86 -8.00 0.21 -15.80
(0.00850) (0.01099) (0.01108) (0.01270) (0.01229)
Concession
member*status quo -606.81 --- --- 695.04 -823.53
(0.47606) --- --- (0.67611) (0.66121)
Forest-dwelling*
status quo -1,275 ** -951.17 -1,599.09 ** --- ---
(0.60653) (0.86106) (0.71645) --- ---
Number of
households 716 355 361 254 462
Observations 12,912 6,399 6,513 4,620 8,292
*** p<0.01, ** p<0.05, * p<0.1. Standard errors are in parenthesis. The results were divided by 1,000 to report
the coefficient values more concisely.

98
need to be compensated while the attributes with negative coefficients are those for
which households would be willing to give up money. If an attribute with a positive
coefficient were to exist in a contract offered to the average household, that household
would need to be compensated for that attribute and would be willing to accept a value no
less than the coefficient value.
On average, households are likely to choose a contract over the status quo and
these contracts are worth about $8,548 to households. This large value is consistent
across the models, suggesting strong preferences for the combined elements of the
contracts. This value illustrates incredibly strong local values associated with maintaining
forest cover, a result that is consistent with other results in our survey. For instance, a
majority of the respondents indicated that they depend on the forest resources (see Table
16), with 233 out of 254 respondents in forest-dwelling communities indicating that they
either “agree” or “strongly agree” that they depend on the forest resources for their
livelihoods. A majority of households also indicated that they are worried about the
future of the forests in the Petén, and a large majority prefer to maintain strict controls on
who can cut wood from the MBR (Table 16). Although MBR households prefer access
to the forest, the majority prefer that access is restricted via a contract.
For the entire sample, households place a $1,426 per year value on having the
option to receive a payment for increasing carbon storage by 30% and decreasing timber
revenues by 30%. Households that are not members of a concession place more value,
$2,337 per year, on increasing carbon storage by 30% by decreasing timber harvesting by
99
30%, while households that are members of a concession place $787 per year on this
option.
Concession members typically earn a living from harvesting timber, so they are
less willing to give up 30% of their timber harvesting for carbon payments. However,
reducing timber harvesting by 30% would decrease timber income for concession
members by about $532 per person per year on average35. The results show that
concession members on average are willing to take a pay cut of up to $787 per year to
receive payments for storing 30% more carbon instead of harvesting 30% more timber.
Then, after being compensated for a $532 reduction in timber harvesting income,
households would be willing to accept $25536 less per year to earn income from 30%
more carbon storage instead of 30% more timber harvesting. This implies that a payment
for a carbon storage program could result in significant household welfare gains if
implemented with minimal restrictions on NTFP harvesting and tourism.
Households in the MBR value longer contracts. For the entire sample, households
value each additional year of the carbon contract at $64. This value is highest for
nonmembers ($69). One explanation for this difference is that nonmembers do not have a
long-term contract for land use rights through a forest concession and want to experience
the benefits of a long-term contract. Interestingly, the value that forest-dwelling
communities place on longer contracts is similar to that of non-forest dwelling
communities. One potential reason is that stable work is scarce in both areas. Although
35 The average annual timber income is derived from concession financial records. A 30% reduction in
timber harvesting leads to a gain in 10.2 tons of CO2 per year per concession member. 36 -$255 is the net value of the pay cut concession members are willing to take to store carbon over timber
(-$787) and the amount they would be giving up in timber harvesting income ($532).

100
some temporary work opportunities provide an above-average income for households,
there is a high degree of risk associated with these activities since employees are not
guaranteed a salary for the entire year. Thus, it is possible that households in this region
may be willing to accept a lower salary if they were given a contract for a stable income
for a longer time period37.
Table 19. Willingness to accept estimates (U.S. dollars)
All
communities
Concession
Members Nonmembers
Forest-
dwelling
Non-forest
dwelling
Store more carbon -1,426 *** -787 *** -2,337 *** -161 -1,998 ***
Keep the same
carbon storage -954 *** -1,660 ** -27 -2,124 -1,039
Contract length -64 *** -60 *** -69 *** -62 ** -59 ***
NTFP harvesting -3,975 *** -4,380 *** -3,727 *** -6,985 *** -2,566 ***
Tourism -2,635 *** -2,924 *** -2,495 *** -4,387 *** -1,811 ***
Group payment 717 *** 305 1,140 *** 1,250 *** 458 *
Status quo 8,548 *** 6,217 * 10,716 *** 14,267 *** 2,712
Gender*status quo 3,414 ** 2,569 4,464 ** 2,501 2,079
Age*status quo -41 83 -68 106 88 **
Education*status quo 37 -7 31 -1 44
Concession
member*status quo 1,925 --- --- -2,517 2,299
Forest-
dwelling*status quo 4,047 *** 2,434 6,297 ** --- ---
*** p<0.01, ** p<0.05, * p<0.1. The exchange rate used is 7.5 quetzals to 1 U.S. Dollar.
37 About 53% of the respondents in a 2017 MBR household survey felt that having access to stable work
opportunities was more important than receiving annual dividends or in-kind benefits from a forest
concession.

101
Households have high value for the ability to access forests for ecotourism and
NTFP harvesting (Table 19). In forest-dwelling communities in particular, access to the
forest for tourism and NTFP harvesting is worth $4,387 and $6,985 respectively. These
results confirm the importance of NTFP harvesting and tourism to the region.
Additionally, the amount that the entire sample is willing to accept to take a group
payment over an individual-level payment is about $717 per year. This suggests that
households would be willing to accept less of a payment if there were a way to
compensate each household individually rather than through a group or community
organization. However, for concession members, the group payment coefficient is
insignificant. It is possible that, since they are required to collectively manage the forests
and share the benefits under the current system, concession members are more
accustomed to making decisions for the group, which often yields preferences that differ
from individual-level decisions in ecosystem services valuation (Murphy et al., 2017).
We included several statements to encourage respondents to truthfully state their
preferences, and we include questions to assess their responses. First, respondents were
told that their response would be used to influence future forest management and
conservation policies. Second, several follow-up questions were included in the survey to
determine whether individuals were making choices based on their actual preferences.
Table 20 shows the responses to these questions, which asked why a respondent chose a
contract. The responses in Table 20 confirm that households value contract length, carbon
storage, and NTFP harvesting since these attributes were most frequently reported as one
of the top three attributes households considered when choosing a contract. The

102
responses for the least important contract attributes also reaffirm the findings in Table 18
and Table 19 since whether the payment is at the group level was frequently reported as
the least important attribute for households to consider when selecting a contract and the
group payment coefficient is insignificant in two out of the five sets of results.
Importantly, the most frequent response to which attributes are least important was “none
are least important.” This implies that, although some households do not value every
attribute in the proposed contracts, many households considered every attribute when
making their contract selection choice. The results shown in Table 18 and Table 19 also
show that most attributes are highly valued by households since the coefficients are
positive and significant.
To identify why “protest voters,” or participants who only chose the status quo, or
did not want to choose a contract, the enumerators asked participants why they selected
the status quo. The responses in Table 21 show that one of the most frequent reasons
reported were that households did not like the restrictions on harvesting non-timber forest
products. This sentiment is reaffirmed by the results in Table 18 and Table 19 that show
households highly value being able to harvest non-timber forest products. Some
households also indicated that they did not believe they would receive an additional
payment or that they did not want to work for a government. One possible explanation
for this response is that many households in the area have been promised payments for
conservation, but have not yet received them because carbon programs have not yet been
fully implemented (Hodgdon et al, 2012; GuateCarbon, 2014; Guzman, 2019).

103
Table 20 Most and least important contract attributes
Top 3 "Most important when choosing a contract"
In top 3 1st 2nd 3rd
The length of the contract 53% 23% 13% 18%
The carbon stored 50% 24% 13% 13%
The level of timber extraction 40% 10% 18% 12%
If the payment is at the individual level 25% 11% 8% 6%
If the payment is at the group level 9% 2% 31% 4%
The payment amount 30% 8% 11% 11%
If you can harvest non-timber forest products 50% 14% 21% 16%
If you can participate in ecotourism 41% 9% 13% 20%
Total responses 479 479 478 475
All are important 4%
None are important 1%
Top 3 "Least important when choosing a contract"
In top 3 1st 2nd 3rd
The length of the contract 34% 17% 8% 13%
The carbon stored 19% 9% 6% 7%
The level of timber extraction 30% 13% 10% 11%
If the payment is at the individual level 40% 16% 16% 14%
If the payment is at the group level 40% 14% 22% 11%
The payment amount 35% 12% 10% 18%
If you can harvest non-timber forest products 30% 8% 15% 13%
If you can participate in ecotourism 32% 11% 12% 14%
Total responses 275 275 230 206
None are least important 74%
All are least important 0%

104
Table 21. Reasons why only status quo was chosen
4.5 Conclusion
This paper examines the potential for carbon payments to displace timber harvests
in community forest concessions in Guatemala. This region is rich in cultural resources
and biodiversity. Since the 1990s, significant resources have been extended to protect the
forests and culture in this region. This protection has occurred in the form of national
parks, community-based forest concessions, industrial concessions, and other zones that
are afforded less protection.
Evidence suggests that the community-based concessions have reduced
deforestation and encouraged additional carbon storage (Blackman, 2015 and Fortmann
et al., 2017). The results indicate that households prefer to receive payments for carbon
Response Total indicated (%)
Household does not want to sell carbon 9%
The payment is not sufficient 14%
Household does not like the restrictions on ecotourism 21%
Household does not like the restrictions on harvesting non-timber forest products 44%
Household does not like the restrictions on timber extraction 28%
The contract is too long 2%
The contract is too short 0%
Household does not believe they would receive an additional payment 26%
Household does not want to work for national or foreign governments 9%
Household does not want to answer or is not interested 9%
Household is loyal to the community or current concession system 9%
Total households only choosing the status quo 43
Households were able to select multiple responses. About 6% of survey respondents only selected the status
quo. The “Household does not want to work for national or foreign governments,” “Household does not want
to answer or is not interested,” and “ Household is loyal to the community or current concession system”
responses were compiled from the “other” response category (Appendix 1).

105
storage over timber harvesting. Non-members have the smallest willingness to accept
payments to store more carbon, which is not surprising given that they also have the
lowest opportunity costs. By choosing to get paid for carbon storage, communities must
consider a number of additional factors or attributes including whether the communities
have forest access for harvesting non-timber forest products and tourism, whether they
are willing to undergo intensive monitoring of carbon outcomes, how long the contract
will last, and whether the payments should come to them individually or to a group. To
date, however, the communities have not been compensated for this storage of carbon
(Guzman, 2019), and they have continued to harvest trees to generate income, which
likely leads to carbon emissions.
The choice experiment reveals that allowing groups to harvest non-timber forest
products and to conduct tourism operations in the region is extremely valuable to
households. The magnitudes of the willingness to accept coefficients for these two
attributes are large for all of the regressions over different groups. Evidence from other
studies points to the significant cultural value associated with harvesting non-timber
forest products (e.g., Nesheim & Stølen, 2012; Taylor 2010), and our results provide
additional evidence on this value. If government or NGOs pursue carbon contracts, it
would be important to make sure that these two activities can continue to occur.
The survey results indicate that a large proportion of the group we sampled is
worried about the future of forests in the region, and that nearly everyone was interested
in limiting access to the Maya Biosphere Reserve, regardless of whether they are
concession members. While individuals in our sample were interested in protecting the

106
cultural and ecological resources in the region, they were more divided on the extent of
protection that should be provided, with non-members advocating for modestly more
protections of the forests than members. This is understandable given that members are
more likely to exploit and use the forests for commercial purposes. Nonetheless,
members and non-members alike were interested in seeing NTFP extraction and tourism
continue.
Individuals have preferences for longer contracts, with values from $59 to $69 per
year. On average, households prefer individual contracts over group contracts, but the
results for concession members are insignificant. Concessions already provide some
benefits to concession members through group payments, so it is likely that individuals
who are members have less resistance to the idea of group payments.
The results of this study have several important policy implications. First, since
households prefer to receive payments for increasing carbon storage rather than timber
harvesting, conservation programs should focus on providing households with carbon
payments rather than paying households to harvest timber sustainably. Second, most
households in our sample prefer to receive individual payments to group payments and
providing a direct payment to households could result in significant welfare gains.
Providing households with longer contracts could also benefit households in this area
since households would be guaranteed a stable source of income for a longer time.
Finally, households overwhelmingly preferred contracts that allow for NTFP harvesting
and tourism. Allowing groups to harvest non-timber forest products and to conduct
tourism operations in the region is highly valuable to households. These two activities

107
appear to have important cultural significance in the region. If carbon contracts are to be
implemented it would be important to make sure that these two activities can continue to
occur.

108
Bibliography
Adhikari, Bhim (2005). “Poverty, Property Rights and Collective Action: Understanding the
Distributive Aspects of Common Property Resource Management.” Environment and
Development Economics 10 (1): 7–31. doi:10.1017/S1355770X04001755.
Adhikari, Bhim, Salvatore Di Falco, and Jon C. Lovett (2004). “Household Characteristics and
Forest Dependency: Evidence from Common Property Forest Management in Nepal.”
Ecological Economics 48(2): 245–57. doi:10.1016/j.ecolecon.2003.08.008.
Agrawal, Arun, and Ashwini Chhatre (2006). “Explaining Success on the Commons:
Community Forest Governance in the Indian Himalaya.” World Development 34 (1):
149–66. doi:10.1016/j.worlddev.2006.07.013.
Alix-Garcia, J. (2007). “A spatial analysis of common property deforestation.” Journal of
Environmental Economics and Management, 53: 141-157.
Aragón, Fernando M. (2015). “Do Better Property Rights Improve Local Income?: Evidence
from First Nations’ Treaties.” Journal of Development Economics 116: 43–56.
doi:10.1016/j.jdeveco.2015.03.004.
Autor, David H., Christopher J. Palmer, Parag A. Pathak (2017). “Gentrification and the
Amenity Value of Crime Reductions: Evidence from Rent Deregulation.” Working
paper. National Bureau of Economic Research.

109
Baccini, A., S.J. Goetz, W.S. Walker, N.T. Laporte, M. Sun, D. Sulla-Menashe, J. Hackler,
P.S.A. Beck, R. Dubayah, M.A. Friedla, S. Samanta, & R.A. Houghton (2012). “
Estimated carbon dioxide emissions from tropical deforestation improved by carbon-
density maps.”
Besley, Timothy (1995). “Property Rights and Investment Incentives: Theory and Evidence
from Ghana.” Journal of Political Economy 103 (5): 903–37.
Blackman, Allen (2015). “Strict versus mixed-use protected areas: Guatemala’s Maya
Biosphere Reserve.” Ecological Economics 112:14-24.
Bocci, Corinne, Lea Fortmann, Brent Sohngen, & Bayron Milian (2018). “The impact of
community forest concessions on income: an analysis of communities in the Maya
Biosphere Reserve.” World Development, 107: 10-21.
Bowes, Michael D. & John V. Krutilla (1989). Multiple-use Management: The Economics
of Public Forestlands. Resources for the Future
Bowler, David E., Lisette M. Buyung-Ali, John R. Healey, Julia PG Jones, Teri M. Knight,
and Andrew S Pullin (2012). “Does community forest management provide global
environmental benefits and improve local welfare?” Frontiers in Ecology and the
Environment, 10(1):29-36.
Bray, D. B., E. Duran, V. H. Ramos, J. F. Mas, A. Velazquez, R. B. McNab, D. Barry, and J.
Radachowsky (2008). “Tropical Deforestation, Community Forests, and Protected Areas
in the Maya Forest.” Ecology and Society, https://cgspace.cgiar.org/handle/10568/20099.

110
Buntaine, Mark T., Stuart E. Hamilton, and Marco Millones (2015). “Titling community land
to prevent deforestation: An evaluation of a best-case program in Morona-Santiago,
Ecuador” Global Environmental Change 33: 32-43.
Busch, Jonah, Kalifi Ferretti-Gallon, Jens Engelmann, Max Wright, Kemen G. Austin, Fred
Stolle, Svetlana Turubanova, Peter V. Potapov, Belinda Margono, Matthew C. Hansen,
and Alessandro Baccini (2015). “Reductions in emissions from deforestation from
Indonesia’s moratorium on new oul palm, timber, and logging concessions” Proceedings
of the National Academy of Sciences of the United States of America 112(5): 1328-1333.
Casey, James F., James R. Kahn, and Alexandre A.F. Rivas (2008). “Willingness to accept
compensation for the environmental risks of oil transport on the Amazon: A choice
modeling experiment” Ecological Economics 67: 552-559.
Chen, X., F. Lupi, J. Liu (2017). Accounting for ecosystem services in compensating for the
costs of effective conservation in protected areas. Biological Conservation, 215:233-240.
Costanza, Robert, Rudolf de Groot, Raul Sutton, Sander van der Ploeg, Sharolyn J.
Anderson, Weda Kubiszewski, Stephen Farber, & R. Kerry Turner (2014). “Changes
in the global value of ecosystem services.” Global Environmental Change, 26: 152-
158.
Costanza, Robert, Ralph d’Arge, Rudolf de Groot, Stephen Farber, Monica Grasso, Bruce
Hannon, Karin Limburg, Shahid Naeem, Robert V. O’Neill, Jose Paruelo, Robert G.
Raskin, Paul Sutton, & Marjan van den Belt (1997). “The value of the world’s
ecosystem services and natural capital.” Nature, 387(15): 253-260.

111
David, Guy, Evan Rawley, & Daniel Polsky (2013). “Integration and Task Allocation:
Evidence from Patient Care.” Journal of Economics and Management Strategy, 22(3):
617-639.
De Groot, Rudolf, Luke Brander, Sander van der Ploeg, Robert Costanza, Florence Bernard,
Leon Braat, Mike Christie, Neville Crossman, Andrea Ghermandi, Lars Hein, Salman
Hussain, Pushpam Kumar, Alistair McVittie, Rosimeiry Portela, Luis C. Rodriguez,
Patrick ten Brink, & Pieter van Beukering (2012). “Global estimates of the value of
ecosystems and their services in monetary units.” Ecosystem Services, 1:50-61.
Do, D., K. Imai, G. King, & E. Stuart (2007). “Matching as nonparametric preprocessing for
reducing model dependence in parametric causal inference.” Political Analysis 15: 199-
236.
Emsley, Richard, Mark Lunt, Andrew Pickles, and Graham Dunn (2008). “Stata Journal |
Article,” 2008. http://www.stata-journal.com/article.html?article=st0149.
Faustmann, M. (1968) “Calculation of the value which forest land and immature stands
possess for forestry” (1849). In Martin Faustman and the evolution of discounted cash
flow. Inst. Pap. No. 42, Common-wealth Forestry Institute, Oxford, U.K. Translated by
W. Linnard. Pp. 27-55.
Field, Erica (2007). “Entitled to Work: Urban Property Rights and Labor Supply in Peru.”
The Quarterly Journal of Economics, 122(4): 1561-1602.
Foley, JA, R. Defries, GP Asner, C. Barford, G. Bonan, SR Carpenter, FS Chapin, MT
Coe, GC Daily, HK Gibbs, JH Helkowski, T Holloway, EA Howard, CJ Kucharik, C.

112
Monfreda, JA Patz, iC Prentice, N. Ramankutty, PK Snyder (2005). “Global
consequences of land use”. Science, 309(5734), 570-574.
Fortmann, L. (2014) “Assessing factors that contribute to reduced deforestation and
successful community forest management in Guatemala’s Maya Biosphere Reserve”
Unpublished PhD thesis. Department of Agricultural, Environmental and Development
Economics. Ohio State University.
Fortmann, L, B. Sohngen, and D Southgate (2017). "Assessing the Role of Group
Heterogeneity in Community Forest Concessions in Guatemala’s Maya Biosphere
Reserve" Land Economics.
Frost, Peter G.H. & Ivan Bond (2008). “The CAMPFIRE programme in Zimbabwe:
Payments for wildlife services” Ecological Economics 65: 776-787.
Funk, Michele Jonsson, Daniel Westreich, Chris Wiesen, Til Stürmer, M. Alan Brookhart, and
Marie Davidian. “Doubly Robust Estimation of Causal Effects (2011).” American
Journal of Epidemiology 173 (7): 761–67. doi:10.1093/aje/kwq439.
Galiani, Sebastian, and Ernesto Schargrodsky (2010). “Property Rights for the Poor: Effects of
Land Titling.” ResearchGate 94: 700–729. doi:10.1016/j.jpubeco.2010.06.002.
Giam, X. (2017) “Global biodiversity loss from tropical deforestation.” Proceedings of the
National Academy of Sciences, 114(23): 5775-5777.
Goldstein, Markus & Christopher Udry (2008). “The Profits of Power: Land Rights and
Agricultural Investment in Ghana.” Journal of Political Economy, 116(6): 981-1022.
Gómez, Ileana and Méndez, Ernesto (2007). Association of Forest Communities of Petén,
Guatemala Context, Accomplishments and Challenges. CIFOR

113
Gordon, Scott H. (1954). “The Economic Theory of a Common-Property Resource: The
Fishery.” Journal of Political Economy 62(2): 124–42.
Gray, Erin, Peter G. Veit, Juan Carlos Altamirano, Helen Ding, Piotr Rozwalka, Ivan
Zuniga, Matthew Witkin, Fernanda Gabriela Borger, Paula Pereda, Andrea Lucchesi,
& Keyi Ussami (2007). “The Economic Costs and Benefits of Securing Community
Forest Tenure: Evidence from Brazil and Guatemala.” (2015). Working paper. World
Resources Institute.
Grüning, Christine and Layra Susanne Shuford. “Case Study: The Guyana REDD-plus
Investment Fund (GRIF).” Frankfurt School - UNEP Collaborating Centre for Climate &
Sustainable Energy Finance, (2012).
GuateCarbon. Supporting Forest Communities. (2014). Rainforest Alliance.
Guyana-The REDD Desk. “REDD in Guyana.” The REDD Desk. (2018).
Guzman, S. (2019, June 26). Personal interview.
Haab, Timothy C. and Kenneth E. McConnell. Valuing Environmental and Natural Resources.
New Horizons in Environmental Economics. (2002)
Hamilton, Barton H., Jack A. Nickerson, and Hideo Owan. “Team Incentives and Worker
Heterogeneity: An Empirical Analysis of the Impact of Teams on Productivity and
Participation.” Journal of Political Economy 111, no. 3 (2003): 465–97.
doi:10.1086/374182.
Hansen, M. C., P. V. Potapov, R. Moore, M. Hancher, S. A. Turubanova, A. Tyukavina, D.
Thau, S. V. Stehman, S. J. Goetz, T. R. Loveland, A. Kommareddy, A. Egorov, L. Chini,
C. O. Justice, & J. R. G. Townshend. 2013. “High-Resolution Global Maps of 21st-

114
Century Forest Cover Change.” Science 342 (15 November): 850–53. Data available on-
line from:http://earthenginepartners.appspot.com/science-2013-global-forest.
Hausman Jerry A. Valuation of new goods under perfect and imperfect competition. In: The
economics of new goods. University of Chicago Press, (1996): 207-248.
Ho, Daniel, Kosuke Imai, Gary King, & Elizabeth Stuart. “Matching as Nonparametric
Preprocessing for Reducing Model Dependence in Parametric Causal Inference.”
Political Analysis, 15(3): 199-236.
Hodgdon, Benjamin D., Jeffrey Hayward, and Omar (2012). “The GuateCarbon initiative and
REDD+ readiness in Guatemala.” ETFRN News 53.
Holmstrom, Bengt (1982). “Moral Hazard in Teams.” The Bell Journal of Economics 13(2):
324–40. doi:10.2307/3003457.
IPCC (2014). “Climate Change 2014: Synthesis Report. Contribution of Working Groups I, II
and III to the Fifth Assessment Report of the Intergovernmental Panel on Climate Change
[Core Writing Team, R.K. Pachauri and L.A. Meyer (eds.)]. IPCC, Geneva, Switzerland,
151.
Imbens, Guido W., and Joshua D. Angrist (1994). “Identification and Estimation of Local
Average Treatment Effects.” Econometrica 62(2): 467–75. doi:10.2307/2951620.
Jayachandran, Seema, Joost de Laat, Eric F. Lambin, Charlotte Y. Stanton (2017). “Cash for
Carbon: A Randomized Controlled Trial of Payments for Ecosystem Services to Reduce
Deforestation” Science 357(6348):267-273.
Johnson, Simon, John Mcmillan, & Christopher Woodruff (2002). “Property Rights and
Finance.” The American Economic Review, 92(5): 1335-1356.

115
Johnston , R J , Boyle , K J , Adamowicz , W V , Bennett , J , Brouwer , R , Cameron , T A ,
Hanemann , W M , Hanley , N , Ryan , M , Scarpa , R , Tourangeau , R & Vossler , C A.
(2017). “Contemporary Guidance for Stated Preference Studies.” Journal of the
Association of Environmental and Resource Economists, 4(2).
Kochi, Ikuho, Geoffrey H. Donovan, Patricia A. Champ, & John B. Loomis (2010). “The
economic cost of adverse health effects from wildfire-smoke exposure: a review.”
International Journal of Wildland Fire, 19: 803-817.
Kochi, Ikuho, Patricia A. Champ, John B. Loomis, Geoffrey H. Donovan (2012). “Valuing
mortality impacts of smoke exposure from major southern California wildfires.” Journal
of Forest Economics, 18: 61-75.
Kumar, Sanjay (2002). “Does ‘Participation’ in Common Pool Resource Management Help
the Poor? A Social Cost–Benefit Analysis of Joint Forest Management in Jharkhand,
India.” World Development 30(5): 763–82. doi:10.1016/S0305-750X(02)00004-9.
Liu, Jianguo, Shuxin Li, Zhiyun Ouyang, Christine Tam, and Xiaodong Chen (2007).
“Ecological and socioeconomic effects of China’s policies for ecosystem services”
Proceedings of the National Academy of Sciences of the United States of America
105(28):9477-9482.
Maas, Raul, and Cabrera, Claudio (2008). Forest Concessions Assessment in the Maya
Biosphere Reserve, Petén, Guatemala. Final Report. United States Agency for
International Development.
Meilby, Henrik, Carsten Smith-Hall, Anja Byg, Helle Overgaard Larsen, Øystein Juul Nielsen,
Lila Puri, and Santosh Rayamajhi (2014). “Are Forest Incomes Sustainable? Firewood
116
and Timber Extraction and Productivity in Community Managed Forests in Nepal.”
World Development, Forests, Livelihoods, and Conservation, 64, Supplement 1: S113–
24. doi:10.1016/j.worlddev.2014.03.011.
Millennium Ecosystem Assessment (MEA). (2005). “Ecosystems and Human Well-Being:
Synthesis.” Wesland Press, Washington DC.
Mishra, Khushbu & Abdoul Sam (2016). Does Women’s Land Ownership Promote Their
Empowerment? Empirical Evidence from Nepal. World Development, 78: 360-371.
Miteva, Daniela A., Subhrendu K. Pattanayak, & PJ Ferraro (2012). “Evaluation of
biodiversity policy instruments: what works and what doesn’t?” Oxford Review of
Economic Policy 28(1): 69-92.
Murphy, Mackenzie B., Georgia Mavrommati, Varun Rao Mallampalli, Richard B. Howarth,
& Mark E. Borsuk (2017). “Comparing group deliberation to other forms of preference
aggregation in valuing ecosystem services.” Ecology and Society, 22(4): 17.
Nesheim, Ingrid and Kristi Anne Stølen (2012). “The Socio-Economic Role of Xate: A Case
Study from a Returnee Community in the Maya Biosphere Reserve in Guatemala”
Journal of Sustainable Development 5(3):46-58.
Nittler, John, and Henry Tschinkel (2005). Community Forest Management in the Maya
Biosphere Reserve of Guatemala: Protection through Profits. Place of publication not
identified: publisher not identified.
Nordhaus, William (2017). “Revisiting the social cost of carbon.” Proceedings for the
National Acadeour of Sciences, 114(7): 1518-1523.
117
Ortega-Pacheco, D.V., F. Lupi and M.D. Kaplowitz (2009). “Payment for environmental
services: estimating demand within a tropical watershed.” Journal. of Natural Resource
Policy Research. 1(2) 189-202.
Ostrom, Elinor (2009). Governing the Commons. Cambridge University Press.
Pagiola, Stefano, Agustin Arcenas, and Gunars Platais (2005). “Can Payments for
Environmental Services Help Reduce Poverty? An Exploration of the Issues and the
Evidence to Date from Latin America” World Development 33(2):237-253.
Pearson, T.R., Brown, S. and Casarim, F.M. (2014). Carbon emissions from tropical forest
degradation caused by logging. Environmental Research Letters, 9(3).
Pelletier, Johanne, Nancy Gélinas, and Margaret Skutsch (2016). “The Place of Community
Forest Management in the REDD+ Landscape.” Forests.
Peters, Charles M., Alwyn H. Gentry, & Robert O. Mendelsohn (1989). “Valuation of an
Amazonian rainforest.” Nature, 339.
Pirracchio, R., M. Carone, M. Resche Rigon, E. Caruana, A. Mebazaa, and S. Chevret (2013).
“Propensity Score Estimators for the Average Treatment Effect and the Average
Treatment Effect on the Treated May Yield Very Different Estimates.” Statistical
Methods in Medical Research, 962280213507034. doi:10.1177/0962280213507034.
Pimm, S.L., C.N. Jenkins, R. Abell, T.M. Brooks, J.L. Gittleman, L.N. Joppa, P.H. Raven,
C.M. Roberts, J.O. Sexton (2014). “The biodiversity of species and their rates of
extinction, distribution, and protection.” Science, 344(6187).
Plotkin, Mark and Lisa Famolare (1992). Sustainable Harvest and Marketing of Rain Forest
Products. Island Press.

118
Primack, Richard B., David Bray, Hugo A. Galletti, and Ismael Ponciano (1998). Timber,
Tourists, and Temples: Conservation And Development In The Maya Forest Of Belize
Guatemala And Mexico. Island Press.
Radachowsky, Jeremy, Victor H. Ramos, Roan McNab, Erick H. Baur, and Nikolay Kazakov
(2012). “Forest Concessions in the Maya Biosphere Reserve, Guatemala: A Decade
Later.” Forest Ecology and Management 268: 18–28. doi:10.1016/j.foreco.2011.08.043.
Rasolofoson, Ranaivo A, Paul J. Ferraro, Clinton N. Jenkins, & Julia P.G. Jones (2015).
“Effectiveness of Community Forest management at reducing deforestation in
Madagascar.” Biological Conservation, 184: 271-277.
Richardson, Robert B., Ana Fernandez, David Tschirley, & Gelson Tembo (2011). “Wildlife
Conservation in Zambia: Impacts on Rural Household Welfare.” World Development,
40(5): 1068-1081.
Rico García-Amado, Luis, Manuel Ruiz Pérez, Irene Iniesta-Arandia, Guillaume Dahringer,
Felipe Reyes, and Sara Barrasa (2012). “Building Ties: Social Capital Network Analysis
of a Forest Community in a Biosphere Reserve in Chiapas, Mexico.” Ecology and Society
17(3). doi:10.5751/ES-04855-170303.
Rittmaster, R., W.L. Adamowicz, B. Amiro, & R.T. Pelletier (2006). “Economic Analysis of
health effects from forest fires.” Canadian Journal of Forest Research, 36(4): 868-877.
Rittmaster, R., W.L. Adamowicz, B. Amiro, & R.T. Pelletier (2008). “Erratum: Economic
analysis of health effects from forest fires.” Canadian Journal of Forest Research, 38(4):
908.

119
Robinson, Brian E., Yuta J. Masda, Allison Kelly, Margaret B. Holland, Charles Bedford,
Malcolm Childress, Diana Fletschner, Edward T. Game, Chole Ginsburg, Thea Hilhorse,
Steven Lawry, Daniela A. Miteva, Jessica Musengezi, Lisa Naughton-Treves, Christoph
Nolte, William D. Sunderlin, & Peter Veit (2018). “Incorporating Land Tenure Security
into Conservation.” Conservation Letters 11(2): 1-12.
Roopsind, A., Caughlin, T.T., van der Hout, P., Arets, E. and Putz, F.E. (2018). “Trade‐offs
between carbon stocks and timber recovery in tropical forests are mediated by logging
intensity.” Global change biology.
Rosen, Sherwin (1974). “Hedonic Prices and Implicit Markets: Product Differentiation in Pure
Competition.” Journal of Political Economy 82: 34-55
Rotemberg, Julio (1994). “Human Relations in the Workplace.” Journal of Political Economy
102(4): 684–717.
Samii, C., Lisiecki, M., Kulkarni, P., Paler, L. & Chavis, L. (2014). “Effects of payment
for environmental services and decentralized forest management on deforestation and
poverty in low- and middle-income countries.” CEE protocol: 13-015. Collaboration for
Environmental Evidence.
Schlager, Edella, and Elinor Ostrom (1992). “Property-Rights Regimes and Natural
Resources: A Conceptual Analysis.” Land Economics 68(3): 249–62.
doi:10.2307/3146375.
Schulze, M., Grogan, J. & Vidal, E. (2008). “Forest certification in Amazonia: standards
matter.” Fauna & Flora International, 42(2): 229-239.

120
Scott, Anthony (1955). “The Fishery: The Objectives of Sole Ownership.” Journal of Political
Economy, 63: 116-124.
Sexton, Joseph O., Xiao-Peng Song, Min Feng, Praveen Noojipady, Anupam Anand,
Chengquan Huang, Do-Hyung Kim, Kathrine M. Collins, Saurabh Channan, Charlene
DiMiceli, & John R. Townshend (2013). “Global, 30-m resolution continuous fields of
tree cover: Landsat-based rescaling of MODWeS vegetation continuous fields with lidar-
based estimates of error.” International Journal of Digital Earth, 6(5): 427-448.
Sills, E.O. & Jones, K. (2018). Causal inference in environmental conservation: The role of
institutions. In P. Dasgupta, S.K. Pattanayak, & V.K. Smith. Handbook of Environmental
Economics Volume 4.
Simpson, David R., Roger A. Sedjo, & John W. Reid (1996). “Valuing Biodiversity for Use in
Pharmaceutical Research.” Journal of Political Economy, 104(1): 163-185.
Sims, Katharine R.E. (2010). “Conservation and development: Evidence from Thai protected
areas.” Journal of Environmental Economics and Management, 60: 94-114.
Stults, S. (2018). “Quantifying Environmental Services: A Spatial Analysis of Northern
Guatemala. Unpublished thesis. Department of Agricultural, Environmental and
Development Economics. Ohio State University.
Sundberg, Juanita (2003). “Conservation and Democratization: Constituting Citizenship in the
Maya Biosphere Reserve, Guatemala.” Political Geography 22(7): 715–40.
doi:10.1016/S0962-6298(03)00076-3.
Takahashi, R. & K. Otsuka (2016).” Determinants of Forest Degradation under Private and
Common Property Regimes: The Case of Ethiopia.” Land Economics 92(3): 450-467.

121
Taylor, Peter Leigh (2010). “Conservation, Community, and Culture? New Organizational
Challenges of Community Forest Concessions in the Maya Biosphere Reserve of
Guatemala.” Journal of Rural Studies 26(2): 173–84. doi:10.1016/j.jrurstud.2009.09.006.
Tian, X., Sohngen, B, Baker, J.S., Ohrel, S. (2018). “Will U.S. Forests Continue to Be a
Carbon Sink?” Land Economics.
Vincent, Jeffrey (2016). “Impact Evaluation of Forest Conservation Programs: Benefit-Cost
Analysis, Without the Economics.” Environmental and Resource Economics, 63(2): 395-
408.
White, David L. & Lloyd, F. Thomas (1994). “Defining Old Growth: Implications For
Management.” Paper presented at the Eighth Biennial Southern Silvicultural Research
Conference, Auburn, AL.
Wilson, Matthew A. & Richard B. Howarth (2002). “Discourse-based valuation of ecosystem
services: establishing fair outcomes through group deliberation.” Ecological Economics,
41: 431-443.
Wunder, Sven and Montserrat Albán (2008). “Decentralized payments for environmental
services: The cases of Pimampiro and PROFAFOR in Ecuador.” Ecological Economics
65:685-698.
Wunder, Sven, Stefanie Engel, Stefano Pagiola (2008). “Taking stock: A comparative analysis
of payments for environmental services programs in developed and developing
countries.” Ecological Economics 65: 834-852.
Zabel, Astrid and Karin Holm-Müller (2008). “Conservation Performance Payments for
Carnivore Conservation in Sweden.” 22(2):247-251.

122
Appendix A.1: Chapter 2
Common-pool resource management strategies may be ineffective at increasing the
welfare of community members if the policy is not tailored to the specific needs of the
community (Ostrom, 1990). In the case of the recently inhabited communities, the effect
of concession membership on income is negative, but insignificant. It is possible that this
policy is not designed to fit the needs of the communities, which could result in non-
members being more productive at forest product harvesting than members, or
. More specifically, it is possible that
(case 4) occurs for the recently inhabited concessions. In
this case, household i is relatively more productive at agricultural production than forest
resource harvesting both with and without the concession membership. Also, in this case,
the concession is not set up properly to yield a higher productivity for each unit of labor
allocated to forest resource harvesting. If household i becomes a concession member,
they would possibly have to reallocate more labor towards agriculture or keep the
allocation of labor between forest resource harvesting and agriculture the same as when
they were not a member. The income effect of concession membership would either be
negative or concession membership would not have an impact on income. The effect
would be negative if the amount of labor reallocated to agriculture or remaining in
( ) ( , )i i ji f i f fF L F L L
( ) ( ) ( , )i i i ji a i f i f fA L F L F L L

123
forestry is less productive than that unit of labor in forestry prior to the concession
membership. In contrast, there would be no effect if the amount of labor reallocated to
agriculture or remaining in forestry is as productive as prior to the concession
membership. This would occur, for example, if the household allocated all of their labor
to agriculture prior to the concession policy.
The following cases describe other possible concession policy income effects that
may occur if the policy is not tailored to the specific needs of a community. We do not
suspect, however, that either of these cases apply to the current concession policies in the
MBR, but they may occur if additional concessions are formed.
Case 5: for all levels of labor allocated to agricultural
production and forest resource harvesting
If household i becomes a concession member in case 5, the effect that membership would
have on income would be negative. In this case, the concession is not set up in a way that
would make forest production more productive. Also, the household is relatively more
productive at forest resource harvesting than agriculture so the allocation of labor would
stay the same, but concession membership would only serve as a restriction to forest
resource production.
Case 6: for all levels of labor allocated to agricultural
production and forest resource harvesting
( ) ( , ) (L )i i j ii f i f f i aF L F L L A
( ) (L ) ( , )i i i ji f i a i f fF L A F L L

124
Case 6 represents a scenario where concession membership decreased the household’s
forest resource harvesting productivity relative to its agricultural productivity. In this
scenario, the household would reallocate labor from forest product harvesting to
agricultural production and concession membership would have a negative effect on
income since the concession is putting a restriction on forest resource harvesting
productivity. Not only would this concession policy design decrease household income,
but it would likely lead to an increase in deforestation since concession members are
shifting labor from forest product harvesting to agriculture.
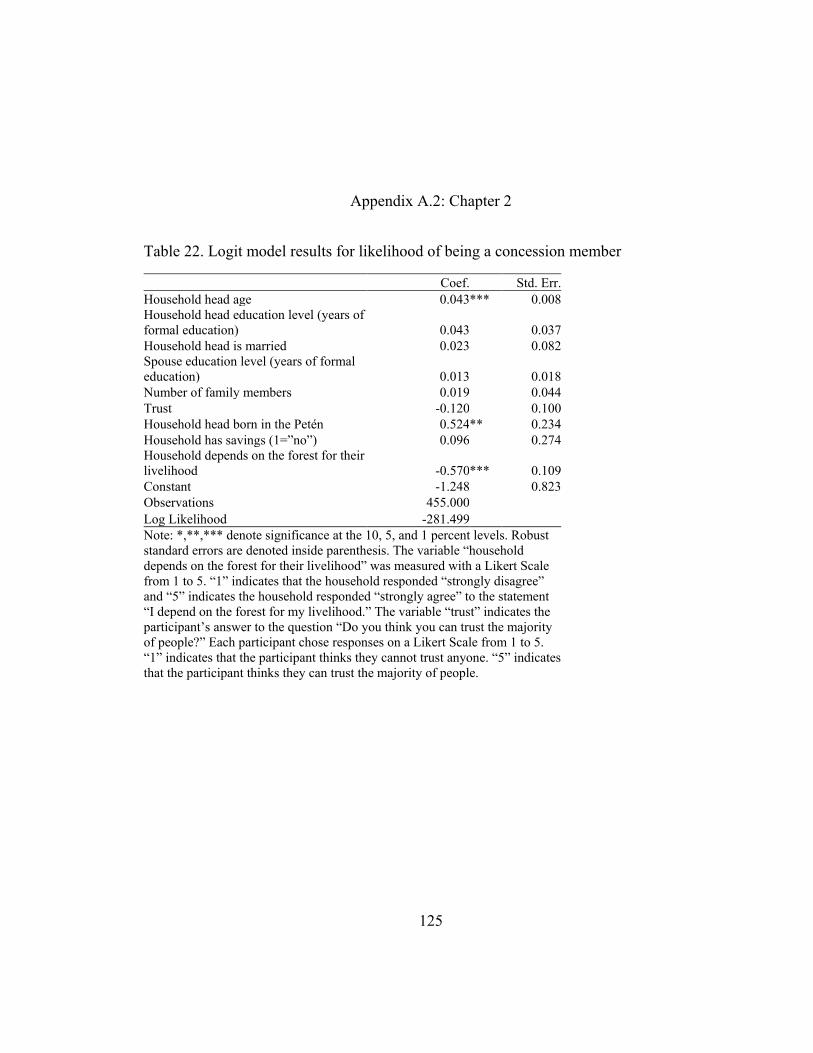
125
Appendix A.2: Chapter 2
Table 22. Logit model results for likelihood of being a concession member
Coef. Std. Err.
Household head age 0.043 *** 0.008
Household head education level (years of
formal education) 0.043 0.037
Household head is married 0.023 0.082
Spouse education level (years of formal
education) 0.013 0.018
Number of family members 0.019 0.044
Trust -0.120 0.100
Household head born in the Petén 0.524 ** 0.234
Household has savings (1=”no”) 0.096 0.274
Household depends on the forest for their
livelihood -0.570 *** 0.109
Constant -1.248 0.823
Observations 455.000
Log Likelihood -281.499
Note: *,**,*** denote significance at the 10, 5, and 1 percent levels. Robust
standard errors are denoted inside parenthesis. The variable “household
depends on the forest for their livelihood” was measured with a Likert Scale
from 1 to 5. “1” indicates that the household responded “strongly disagree”
and “5” indicates the household responded “strongly agree” to the statement
“I depend on the forest for my livelihood.” The variable “trust” indicates the
participant’s answer to the question “Do you think you can trust the majority
of people?” Each participant chose responses on a Likert Scale from 1 to 5.
“1” indicates that the participant thinks they cannot trust anyone. “5” indicates
that the participant thinks they can trust the majority of people.

126
Appendix B.1: Chapter 3
Table 23. 2SLS first stage results for instrument on concession membership
All Community
Types Long-inhabited
Recently-
inhabited Nonresident
Household head age .00198* .0034372** -.0007313 .0030943**
(.0010421) (.0016409) (.0029711) (.0014465)
Household head education -.0015469 .0017412 .0106537 -.0002937
(.0052684) (.0089562) (.0156759) (.0069655)
Forest Dependent .0620899* -.0091771 .0875065 .0663322*
(.0326653) (.078037) (.1285354) (.0383067)
Household Head Gender .0258014 .015648 .2372176** -.0205991
(.0364279) (.0589938) (.1155193) (.0482929)
Savings -.0551528 -.0413343 -.266616 -.0183232
(.0372151) (.0659855) (.1809424) (.0456959)
Born Petén .0811459** -.0029377 .2395872** .0532374
(.0338238) (.0578347) (.1024261) (.0444288)
Spouse education -.003583 .0030468 -.0168345 -.0009576
(.0057784) (.0096554) (.0212621) (.0074645)
Married .0260778 -.0397788 -.1298929 .0623913
(.0383753) (.0594423) (.1477859) (.0504363)
Under 12 -.0096468 .001789 -.0066814 -.0153684
(.0105877) (.0137944) (.0302241) (.0166224)
Trust .0103392 -.0478751 -.1112285 .0428471
(.0287561) (.0452531) (.0836104) (.0398554)
Own Land .0003596 -.0002579 -.0005975 .0013487
(.00062) (.00106) (.0015215) (.0008568)
Observations 646 167 86 393
F-statistic 33.99 31.57 9.73 21.14
R-squared 0.58 0.73 0.62 0.56
*** p<0.01, ** p<0.05, * p<0.1. Robust standard errors are inside the parenthesis. For a complete
description of each variable, see Table 9

127
Table 24. Falsification test results for instrument
Coefficient Standard Error
Instrument (matched 2012 membership status) -13,785 16,578
Household head age 149.9 304.7
Household head education 1,837 1,757
Forest Dependent -2,393 9,019
Household Head Gender -3,637 14,874
Savings 5,336 15,857
Born Petén -4,142 9,223
Spouse education 448.3 1,807
Married 13,687 16,440
Under 12 -3,383 3,721
Trust -270.4 9,812
Own Land 1,051*** 130.4
Constant -9,508 43,327
Observations 63
R-squared 0.724
*** p<0.01, ** p<0.05, * p<0.1. For a complete description of each variable, see Table 9

128
Table 25. Logistic regression results for likelihood of being a concession member
Logit results Odds Ratio
Household Head Age 0.0171** 1.017267**
(0.00721) .(007332)
Household head education 0.00669 1.006716
(0.0371) (.0373664)
Born Petén 0.284 1.32832
(0.226) (.3008249)
Constant -0.0726 .9300165
(0.524) (.4875009)
Observations 488
*** p<0.01, ** p<0.05, * p<0.1. Standard errors are in parenthesis.

129
Table 26. Matched ordinary-least squares regression results for the effect of concession
membership on income
All Communities
Long-
inhabited
Recently-
inhabited Nonresident
Concession membership 13,077*** 13,517* 19,348** 15,198**
(4,396) (7,967) (9,376) (6,367)
Household head age -6.918 -210.1 26.19 106.4
(151.5) (233.3) (310.9) (231.5)
Household head education 1,140 684.7 -643.4 1,829
(783.3) (1,336) (1,578) (1,115)
Forest Dependent 1,171 12,084 -28,139** 2,222
(4,929) (12,464) (13,177) (6,253)
Household Head Gender 8,210 13,529 -16,664 12,554
(5,420) (9,211) (11,005) (7,754)
Savings -3,091 -16,476* 10,406 -588.5
(5,363) (9,443) (18,749) (7,181)
Born Petén -2,500 -8,941 -10,660 1,651
(5,047) (8,247) (11,322) (7,252)
Spouse education 1,425* 2,623* 1,206 775.1
(842.5) (1,472) (2,039) (1,162)
Married 14,148** 8,620 2,475 20,492***
(5,579) (9,144) (13,327) (7,880)
Under 12 1,722 4,487** -971.3 -488.3
(1,526) (1,875) (3,081) (2,683)
Trust -5,946 1,039 5,801 -11,617*
(4,196) (6,443) (9,171) (6,301)
Own Land 275.9*** 337.0** 129.5 265.8*
(87.04) (138.8) (151.5) (135.5)
Constant -1,963 14,515 38,165 -25,918
(20,200) (31,038) (45,183) (29,075)
Observations 482 122 66 294
R-squared 0.140 0.221 0.223 0.141
*** p<0.01, ** p<0.05, * p<0.1. Robust standard errors are inside the parenthesis. 233 households were
unmatched and dropped from the analysis. All values are adjusted for inflation.

130
Table 27. Panel results for effect of concession membership on income
All Communities Nonresident Long-inhabited
Concession membership 12,986 14,055 4,345
(11,452) (16,348) (16,600)
Household head age -260.1 -507.0 -103.2
(215.5) (418.0) (230.9)
Household head education 210.1 19.26 1,886
(1,126) (1,774) (1,464)
Forest Dependent 4,734 14,943 -592.2
(7,640) (12,371) (9,122)
Household Head Gender -2,345 182.3 5,465
(9,796) (14,070) (14,888)
Savings 1,072 5,622 -7,768
(7,461) (10,646) (9,158)
Born Petén 8,432 14,122 1,983
(5,760) (9,362) (6,681)
Spouse education 406.2 -162.5 108.8
(1,054) (1,689) (1,311)
Married -6,214* -7,710 -2,277
(3,339) (5,171) (3,961)
Under 12 2,052 -1,567 4,285***
(1,848) (4,176) (1,590)
Trust -1,561 -10,231 12,947*
(6,694) (10,679) (7,479)
Own Land -53.55 -230.0 142.5
(125.6) (170.0) (215.6)
Constant 19,151 16,319 50,732
(28,884) (47,193) (34,461)
Observations 224 118 83
Number of Households 113 63 46
*** p<0.01, ** p<0.05, * p<0.1. Results include village fixed effects. Observations that were
unmatched and that reported income above 300,000 quetzals a year were dropped from the analysis. All
values are adjusted for inflation.

131
Appendix B.2: Chapter 3
Table 28. Logistic regression results for likelihood of concession placement
Logit results Odds Ratio
Distance to road 0.000191*** 1.00019***
(1.04e-06) (1.04e-06)
Distance to archaeological site -5.05e-05*** .99995***
(2.18e-07) (2.18e-07)
Elevation -0.00106*** .99894***
(4.20e-05) (4.20e-05)
Soil nutrients -0.04450*** .95649***
(0.00036) (0.00036)
Constant 758.00*** ---
(6.05) (6.05)
Observations 783,480 783,480
*** p<0.01, ** p<0.05, * p<0.1. Robust standard errors are inside the parenthesis.

132
Table 29. CO2 values adjusted for specific carbon sequestration values
Additional
forest
conserved
(ha)
Average
tons of CO2
per ha
Average tons of
CO2 per ha
(adjusted)
Carbon
gains
(adjusted)
Value of
CO2
(adjusted)
Long-
inhabited 342.05 278.87 329.71 112779 $3,496,149
Recently-
inhabited 65.63 334.72 349.23 22920 $710,520
Nonresident 621.53 330.07 320.56 199236 $6,176,316
Industrial 484.71 314.1 354.68 171918 $5,329,458
Total for
active
concessions 1513.92 506853 $15,712,443
The value of CO2 is calculated using $31 as the social cost of carbon (Nordhaus, 2017). The
average tons of CO2 per hectare are calculated by concession classification (long-inhabited,
recently-inhabited, nonresident, and industrial). All adjusted values are calculated using the
results for the effect of concession management on CO2 in lost forested areas shown in
Table 13.

133
Appendix C.1: Chapter 4
Survey No. ___________
Encuesta Para Hogares de Guatemala
SECCIÓN 1: INTRODUCCIÓN __________________ Encuestador: Pregunte el nombre del encuestado, y llene la información siguiente: Enumerator: Ask for the respondent’s name; fill in the information in the cells below.
1.1 Entrevistado: _________________________ 1.2 Tiempo de Inicio: _____________________ 1.3 Código de Hogar: ______________________ 1.4 Código de Encuestador: _______________ 1.5 ¿Quien es en el entrevistado? What is the relation to the head of the house?
(1)____ Jefe del hogar household head
(2)____ Cónyuge spouse
(3)____ Otro other
Si la persona entrevistada no es el jefe de la casa, conteste las preguntas 1.6 – 1.10 basado en el jefe de la casa. If the survey respondent is NOT the head of house, answer questions 1.6-1.10
based on the head of house (not spouse if interviewing spouse instead).
1.6 Genero del jefe de hogar (observado) Gender of head of house (observed) (1)_____ Hombre Male
(2)_____ Mujer Female
1.7 ¿Cuál es su ocupación principal? (¿o la ocupación del jefe de hogar?)
What is your principal occupation? (or the occupation of the head of house?)
(1)____ Trabajo relacionado con el bosque (como una concesión industrial o PFNM) Job related to forestry (2)____ Agricultor Farmer
(3)____ Jornalero diario en agricultura o ganadería daily laborer in agriculture (4)____ Trabajo doméstico para finqueros u otros patrones Domestic work for ranchers
or landowners (5)____ Empleado en pequeño negocio employee at small business (6) ____ Empleado de ONG o contratado por una ONG employee for NGO or contract
work for NGO (7)____ Empleado de gobierno o magisterio government employee
(8)____ Negocio propio (auto-empleo) self-employed business (9)____ Carpintero o artesano carpenter or wood worker
(10)___ Carrera profesional profesional career

134
(11)___ Turismo relacionado tourism related
(12)___ Ama de casa/domestica housewife/husband
(99)___ Otro, especifique_________________________________ 1.8 ¿Cuántos años tiene? (o tiene el jefe del hogar) ________ (escriba el numero o
marque “No sé”) How old are you? (or how old is the head of the household)?
(98) _____ No sé Don’t know
1.9 ¿Cuál es el grado de escolaridad más alto que ha terminado? (o ha terminado el jefe del hogar) ? What is the highest year of school completed? (Or that the head of household completed?) (1)_____ Primero o menos (no educación formal) (No formal education) (2)_____ Segundo (3)_____ Tercero (4)_____ Cuarto (5)_____ Quinto (6)_____ Sexto (7)_____ Primero Básico (8)_____ Segundo Básico
(9)_____ Tercero Básico (10)____ Diversificado (11)____ Universidad (12)____ Maestría o superior (97)____ No contesta No answer
1.10 Un grupo familiar incluye todas las personas que vive juntas y comparten alimentos diariamente. Incluyéndose usted, ¿cuántas personas viven en su casa? __________ A household is considered all the people living together that share meals on a daily basis. How many people, including yourself, live in your household?
1.11 ¿De estas personas cuantas son mujeres o niñas? _______ How many of these
people are females?
1.12 ¿Cuántas personas que viven en su casa tienen 12 años o menos? ____ How many people living in your household are less than 12 years old?
1.13 ¿Principalmente, cuál religión está practicada en su casa? What religion is
primarily practiced in your household?_________ (98)____No quiere contestar They don’t want to answer
(99)____No sé
1.14 ¿Va a la iglesia? Do you go to church?
(1)_____Sí (2)_____No (98)____No quiere contestar (99)____No sé

135
SECCIÓN 2: VIVIENDA y BIENES HOUSING AND ASSETS_______________
Ahora, voy a hacerle algunas preguntas sobre su casa, posesiones y tierra que su familia posee. Now, I will ask you some questions about your house, assets, and land that your household possesses.
Conteste las siguientes preguntas basado en observaciones de la vivienda, o pregunte al entrevistado si es necesario. Answer the following questions based on observations of the house or ask if
necessary
2.1 Techo (roof) (1) ___ Lamina iron sheets (2) ___ Guano palm
(3) ___ Madera wood (4) ___ Teja tile
(5) ___ Corozo o manaque
(6) ___ Terraza
2.2 Paredes de la casa (walls)
(1) ___ Madera wood
(2) ___ Cemento cement (3) ___ Bajareque Mud (4) ___ Adobe (5) ___ Blocks
2.3 Piso (floor) (1) ___ Cemento cement (2) ___ Madera wood
(3) ___ Tierra dirt
(4) ___ Cerámico ceramic
2.4 ¿Cuál es la fuente de agua principal en su casa? (what is the main water source ?) (1) ____ Chorro (adentro de la casa) pump inside (2) ____ Pozo comunal community well
(3) ____ Pozo propio prívate
well (4) ____ Chorro comunitario Community pump
(5) ____ Agua comprada buy
wáter
(6) ____ Rio, Nacimiento River or surface water
2.5 Combustible para cocinar principal? (energy for cooking)
(1) ___ Leña firewood (2) ___ Electricidad (3) ___ Carbón charcoal (4) ___ Gas (99)___Otro
2.6 Fuente principal para Iluminación? (lighting
source) (1) ___ Candelas candles
(2) ___ Candiles kerosene (3) ___ Leña firewood (4) ___ Electricidad (99)___Otro
Ahora me gustaría preguntarle sobre algunos artículos que hay en su casa. Now I would like to ask you about the assets your household owns.
2.7 Posee en su casa…. (lea los artículos y marque todos que tienen) Does your
household have? (a) ____ Teléfono celular cell phone
(b) ____ Televisión color television
(c) ____ Refrigerador refridgerator
(d) ____ Servicio de electricidad electricity service
(e) ____ Planta eléctrica electric generator
(f) ____ Motocicleta motorcycle
(h) ____ Carro car
(i) ____ Tractor tractor

136
(j) ____ TV Satelital satellite tv (k) ____ Panel Solar solar panel
Ahora, tengo algunas preguntas sobre tenencia de la tierra y sobre las actividades que usted realiza en su parcela. Now, I have some questions about land tenure and
what activities you are involved in on your land.
2.9 ¿Posee usted alguna tierra? Do you possess any land?
(1) ___ Si ¿cuantas manzanas? __________ how many manazas?
(2) ___ No Pase la siguiente pregunta 2.14 skip to question 2.14
2.10 ¿Dónde se ubica esta tierra? (lea las opciones y marque todas las que aplican)
Where is the location of this land?
(1) ____ Dentro de esta comunidad This community
(2) ____ Fuera de esta comunidad pero en el mismo municipio Outside of this community but in the same municipio
(3) ____ Fuera del municipio pero en el Petén Outside the municipio, but still in the
Petén (4) ____ Fuera del Petén pero en Guatemala Outside the Petén, but still in Guatemala
(5) ____ Fuera de Guatemala Outside Guatemala.
2.11 ¿Alquila alguna parte de esta parcela a otras personas? Do you rent some of this
land to others? (1) _____ Si cuantas manzanas? _________________ how many manzanas?
(2) _____ No Pase a la siguiente pregunta 2.14 skip to question 2.14
2.12 ¿Dónde se ubica esta tierra alquilada? (lea las opciones y marque todas las que aplican)
Where is the location of this rented land?
(1) ____ Dentro de la tierra que usted posee Within the land you possess
(2) ____ Dentro de esta comunidad This community
(3) ____ Fuera de esta comunidad pero en el mismo municipio Outside of this community but in the same municipio
(4) ____ Fuera del municipio pero en el Petén Outside the municipio, but still in the
Petén (5) ____ Fuera del Petén pero en Guatemala Outside the Petén, but still in Guatemala
(6) ____ Fuera de Guatemala Outside Guatemala
2.13 ¿Cuánto le pagan por manzana que usted alquila a otros al año? Q_____________
How much to do you receive per manzana rented per year?
2.14 ¿Alquila usted alguna tierra de otras personas o al municipio? Do you rent any
land from others?
(1) _____ Si cuantas manzanas? ________ how many manazas? (2) _____ No pase a la pregunta 2.17
2.15 ¿Dónde se ubica esta tierra alquilada? (lea las opciones y marque todas las que aplican)
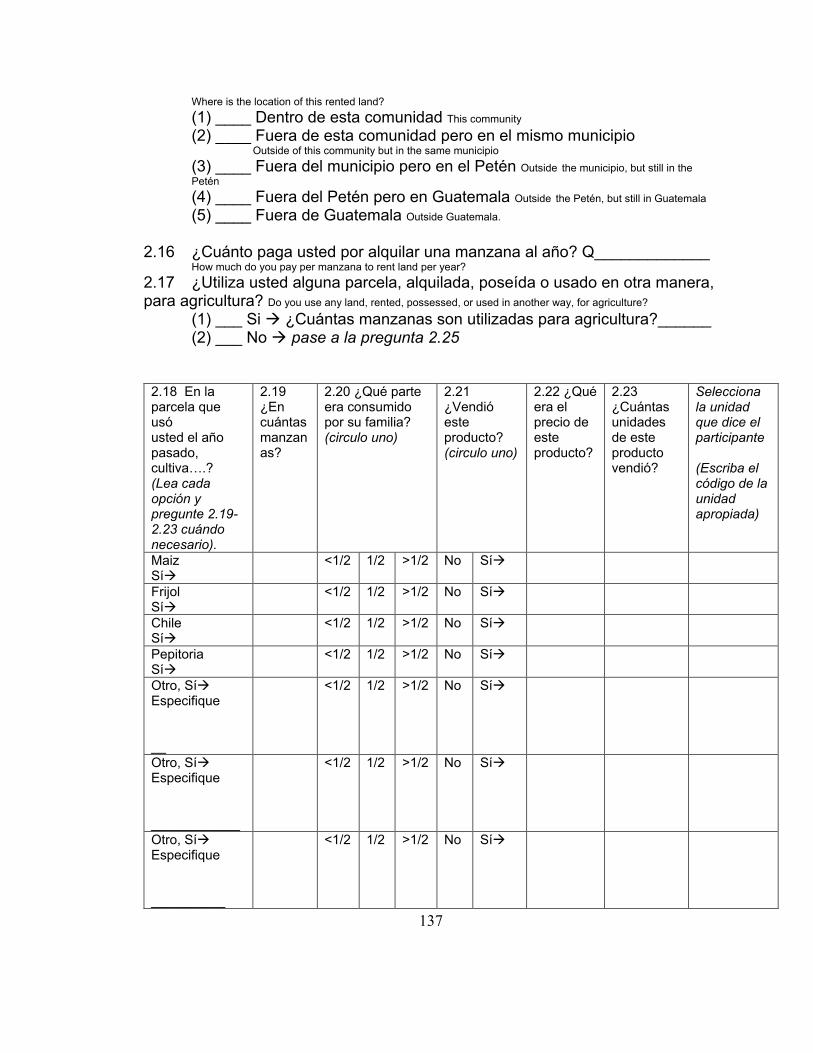
137
Where is the location of this rented land?
(1) ____ Dentro de esta comunidad This community
(2) ____ Fuera de esta comunidad pero en el mismo municipio Outside of this community but in the same municipio
(3) ____ Fuera del municipio pero en el Petén Outside the municipio, but still in the
Petén (4) ____ Fuera del Petén pero en Guatemala Outside the Petén, but still in Guatemala
(5) ____ Fuera de Guatemala Outside Guatemala.
2.16 ¿Cuánto paga usted por alquilar una manzana al año? Q_____________ How much do you pay per manzana to rent land per year?
2.17 ¿Utiliza usted alguna parcela, alquilada, poseída o usado en otra manera, para agricultura? Do you use any land, rented, possessed, or used in another way, for agriculture?
(1) ___ Si ¿Cuántas manzanas son utilizadas para agricultura?______
(2) ___ No pase a la pregunta 2.25
2.18 En la parcela que usó usted el año pasado, cultiva….? (Lea cada opción y pregunte 2.19-2.23 cuándo necesario).
2.19 ¿En cuántas manzanas?
2.20 ¿Qué parte era consumido por su familia? (circulo uno)
2.21 ¿Vendió este producto? (circulo uno)
2.22 ¿Qué era el precio de este producto?
2.23 ¿Cuántas unidades de este producto vendió?
Selecciona la unidad que dice el participante (Escriba el código de la unidad apropiada)
Maiz Sí
<1/2 1/2 >1/2 No Sí
Frijol Sí
<1/2 1/2 >1/2 No Sí
Chile Sí
<1/2 1/2 >1/2 No Sí
Pepitoria Sí
<1/2 1/2 >1/2 No Sí
Otro, Sí Especifique __
<1/2 1/2 >1/2 No Sí
Otro, Sí Especifique ____________
<1/2 1/2 >1/2 No Sí
Otro, Sí Especifique __________
<1/2 1/2 >1/2 No Sí

138
Unidades 1=busheles 2=libras 3=otro
2.24 ¿Qué otras actividades realiza en la parcela aparte de la agricultura? (Marque todas las que aplican) What activities do you do on the land you manage? (Check all
that apply) (a) _____ Ganadería cattle ranching ¿Cuánto ganó en los últimos 12 meses?
Q_____________ (b) _____ Manejo Forestal forest management (c) _____ Guamil fallow land (d) _____ Huerto orchard
(e) _____ Apicultura Bee-keeping
(99) ____ Otro, especifique________________________
2.25 ¿Ha comprado usted alguna parcela en los últimos 10 años? Have you bought any land in the past 10 years?
(1) ____ Si (2) ____ No pase a la pregunta 2.28
2.26 ¿Cuánta tierra compró? _____________ manzanas How much land did you buy?
2.27 ¿Cuánto pagó por esta tierra? Q___________en total o por manzana (circulo uno)
How much did you pay for this land?
2.28 ¿Ha tenido alguna parcela que la vendió parcial o totalmente en los últimos 10 años?
Have you had some land that you sold, either partial or all of it in the last 10 years?
(1) ____ Si (2) ____ No pase a la Sección 3 skip to section 3
2.29 ¿Cuánta tierra vendió? _____________ manzanas How much land did you sell?
2.30 ¿Por cuánto dinero vendió la manzana? Q____________ For how much did you
sell each manzana manzana?
2.31 ¿En qué año vendió la tierra? ____________ What year did you sell the land?
SECCIÓN 3. DINERO Y FINANZAS MONEY AND FINANCES_______________
Ahora, le haré algunas preguntas sobre las fuentes de ingresos de su casa y sobre cómo administra el dinero basado en la contribución económica que hacen todos los miembros de su familia para los gastos de comida, estudios, alquiler, etc. en los últimos 12 meses,

139
Now I will ask you some questions about your household’s sources of income and how you administer your money based on all the members in your household that contribute to household expenses, such as food, rent, etc.. ¿Cuántas personas en su casa, incluyéndose usted, contribuyeron con dinero
para el gasto familiar en los últimos 12 meses? (Escriba la relación con el jefe o el nombre abajo). Si cada de estas personas son socios de una concesión, por favor, solamente incluye sus salarios aquí y no dividendos ni beneficios en especie asociados con la concesión. Vamos a preguntarle a usted sobre estos beneficios más tarde. How many people in your house, including yourself, contribute to family expenses in the past 12 months? Can you give me the first names of these people? (Write the names in the first column of the table below). If any of these people are concession members, please include only their wages here and not any dividends or in-kind benefits associated with the concession. We will ask about those later.
***Hay dos tablas para estas preguntas. Una es para tres personas y la otra es para las ultimas. Llena las líneas como es necesario para cada persona que trabaja en la casa.*****
3.1 Miembro de la casa que trabajó (Escriba la relación con el jefe o el nombre abajo. Si la persona tiene más que uno trabajo, use los espacios con la misma letra de la persona)
3.2 ¿Que trabajo hizo? Utilice el código abajo para llenar el espacio.
3.3 ¿Cuánto tiempo trabajó en los últimos 12 meses?
D/M/S/Q
3.4 ¿Cuánto se le pagó por este trabajo?
(Si la persona no sabe escriba código 98 D/S/Q/M
3.5 ¿Fue este trabajo asociado con una concesión forestal comunitaria? (circulo uno)
3.6 ¿Qué parte de este trabajo fue asociado con una concesión? (circulo uno)
a) Q Sí
No No Sé
Todo Un medio o más
Menos que un medio
No sé
a) (si persona “a” tiene otro trabajo)
Sí No No Sé
Todo Un medio o más
Menos que un medio
No sé

140
a) (si persona “a” tiene otro trabajo)
Sí No No Sé
Todo Un medio o más
Menos que un medio
No sé
a) (si persona “a” tiene otro trabajo)
Sí No No Sé
Todo Un medio o más
Menos que un medio
No sé
b) Q Sí No No Sé
Todo Un medio o más
Menos que un medio
No sé
b) (si persona “b” tiene otro trabajo)
Sí No No Sé
Todo Un medio o más
Menos que un medio
No sé
b) (si persona “b” tiene otro trabajo)
Sí No No Sé
Todo Un medio o más
Menos que un medio
No sé
b) (si persona “b” tiene otro trabajo)
Sí No No Sé
Todo Un medio o más
Menos que un medio
No sé
c) Q Sí No No Sé
Todo Un medio o más
Menos que un medio
No sé
c) (si persona “c” tiene otro trabajo)
Sí No No Sé
Todo Un medio o más
Menos que un medio
No sé
c) (si persona “c” tiene otro trabajo)
Sí No No Sé
Todo Un medio o más
Menos que un medio
No sé
c) (si persona “c” tiene otro trabajo)
Sí No No Sé
Todo Un medio o más
Menos que un medio
No sé
1 = Trabajo relacionado con el bosque 2 = Jornalero diario en agricultura o ganadería
5 = Empleado de ONG o contratado por una ONG 6 = Empleado de gobierno o magisterio 7 = Negocio propio (auto-empleo) 8 = Carpintero o artesano
11= Vender productos agrícolas 12= Vender ropa/comida 13= Vender otras cosas
D=días M=meses S=semanas Q=quince días

141
3 = Trabajo doméstico para finqueros u otros patrones 4 = Empleado en pequeño negocio
9 = Carrera profesional 10= Turismo relacionado
14= Trabajo temporal 15 = Otro
Use esta tabla para continuar si hay más que tres personas que trabajan en la casa
3.1 Miembro de la casa que trabajó (Escriba la relación con el jefe o el nombre abajo. Si la persona tiene más que uno trabajo, use los espacios con la misma letra de la persona)
3.2 ¿Que trabajo hizo? Utilice el código abajo para llenar el espacio.
3.3 ¿Cuánto tiempo trabajó en los últimos 12 meses?
D/M/S/Q
3.4 ¿Cuánto se le pagó por este trabajo?
(Si la persona no sabe escriba código 98 D/S/Q/M
3.5 ¿Fue este trabajo asociado con una concesión forestal comunitaria? (circulo uno)
3.6 ¿Qué parte de este trabajo fue asociado con una concesión? (circulo uno)
d) Q Sí
No No Sé
Todo Un medio o más
Menos que un medio
No sé
d) (si persona “d” tiene otro trabajo)
Sí No No Sé
Todo Un medio o más
Menos que un medio
No sé
d) (si persona “d” tiene otro trabajo)
Sí No No Sé
Todo Un medio o más
Menos que un medio
No sé
d) (si persona “d” tiene
Sí No No Sé
Todo Un medio o más
Menos que un medio
No sé

142
otro trabajo)
e) Q Sí No No Sé
Todo Un medio o más
Menos que un medio
No sé
e) (si persona “e” tiene otro trabajo)
Sí No No Sé
Todo Un medio o más
Menos que un medio
No sé
e) (si persona “e” tiene otro trabajo)
Sí No No Sé
Todo Un medio o más
Menos que un medio
No sé
e) (si persona “e” tiene otro trabajo)
Sí No No Sé
Todo Un medio o más
Menos que un medio
No sé
f) Q Sí No No Sé
Todo Un medio o más
Menos que un medio
No sé
f) (si persona “f” tiene otro trabajo)
Sí No No Sé
Todo Un medio o más
Menos que un medio
No sé
f) (si persona “f” tiene otro trabajo)
Sí No No Sé
Todo Un medio o más
Menos que un medio
No sé
c) (si persona “c” tiene otro trabajo)
Sí No No Sé
Todo Un medio o más
Menos que un medio
No sé
1 = Trabajo relacionado con el bosque 2 = Jornalero diario en agricultura o ganadería 3 = Trabajo doméstico para finqueros u otros patrones 4 = Empleado en pequeño negocio
5 = Empleado de ONG o contratado por una ONG 6 = Empleado de gobierno o magisterio 7 = Negocio propio (auto-empleo) 8 = Carpintero o artesano 9 = Carrera profesional 10= Turismo relacionado
11= Vender productos agrícolas 12= Vender ropa/comida 13= Vender otras cosas 14= Trabajo temporal 15 = Otro
D=días M=meses S=semanas Q=quince días

143
3.7 Tuvo su casa alguna fuente adicional de ingresos en los últimos 12 meses tales como… (lea las respuestas y marque todas que aplican)
(a) ____ Dinero de otro familiar que no vive en la casa pero vive en Guatemala Cuanto?Q ___________ Money from a family member that lives in
Guatemala (b) ____ Dinero de algún programa del gobierno Cuanto? Q______ Money from a government program (c) ____ Remesas Cuanto? Q ____________ Remittances (from outside
Guatemala) (d) ____ Otro fuente, especifique _________________ Cuanto Q_____ (e) ____ Ninguno 3.8 ¿Actualmente, tiene usted algún ahorro? Do you currently have savings?
(1) ____ Si, ¿Cuánto? _________ (2) ____ No
3.9 ¿Actualmente, tiene usted algún préstamo? Do you currently have any loans? (1) ____ Si ¿Por cuánto dinero for how much money? _______ (2) ____ No pase a la pregunta 3.12 skip to question 3.12
3.10 ¿Dónde consiguió el préstamo? Where did you get the loan?
(1)____ Banco bank
(2)____ Concesión comunitaria community concession
(3)____ Institución microfinanciera microfinance institution
(4)____ Cooperativa cooperative
(5)____ Prestamista de la comunidad community lender
(6)____ Grupo de ahorro savings group
(7)____ Familiar/amigo family/friend
(99)___ Otro, especifique ________________________________________________ 3.11 ¿Aproximadamente cuánto dinero gastó su casa en los siguientes cosas el año pasado?Approximately how much money did you spend on the following last year?
(a) Medicinas y atención médica medicine/medical attention _________Q
(99)___No sé I don’t know
(b) Educación/costo de matrícula education/tuition________Q
(99)___No sé I don’t know
3.12 ¿Usted piensa que se puede confiar en la mayoría de las personas, o que se debe tener muchísimo cuidado al tratar con otras personas? Would you say that most people can be trusted, or that you can’t be too careful in dealing with people? Please tell me what you think, where 1 means you can’t be too careful and 5 means most people can be trusted.
(1)____ Se debe tener muchísimo cuidado Can’t be too careful

144
(2)____ Se debe tener algún cuidado Some care should be taken
(3)____ No se debe tener cuidado Do not have to be careful (4)____ Se puede confiar en algunas personas Can trust in some people
(5)____ Se puede confiar en la mayoría de las personas Most people can be
trusted (98)___ No sé Don’t know (97)___ No contesta No answer
SECCIÓN 4. RESPONSIBILIDADES EN SU CASA Responsibilities in your household
Ahora, voy a preguntarle a usted como algunas responsabilidades en su hogar están divididas entre usted y su cónyuge. I will now ask you about how some household
responsibilities are divided among you and your spouse.
4.1 ¿Cuál es su estado civil (o el estado civil del jefe del hogar)? What is your
marital status (or the marital status of the head of household)? (1)_____ Casado/a Married
(2)_____ Unido/a Living together but unmarried
(3) _____Divorciado/a Divorced pase a la sección 5 (4)_____ Soltero/a Single pase a la sección 5 (5)_____ Viudo/a Widowed pase a la sección 5
4.2 ¿Cuántos años tiene su cónyuge o pareja (o tiene el cónyuge o pareja del
jefe de hogar)? What is the age of your spouse or partner (or the head of household’s
spouse/partner?_________ (99)_____No sé
4.3 ¿Cuál es la ocupación principal de su esposa/o (o el esposo/a del jefe del hogar)?
What is the principal occupation of your spouse (or the head of household’s spouse)?
(1)____ Trabajo relacionado con el bosque (como una concesión industrial o PFNM) Job related to forestry (2)____ Agricultor Farmer
(3)____ Jornalero diario en agricultura o ganadería daily laborer in agriculture (4)____ Trabajo doméstico para finqueros u otros patrones Domestic work for
ranchers or landowners (5)____ Empleado en pequeño negocio employee at small business (6) ____ Empleado de ONG o contratado por una ONG employee for NGO or
contract work for NGO (7)____ Empleado de gobierno o magisterio government employee
(8)____ Negocio propio (auto-empleo) self-employed business (9)____ Carpintero o artesano carpenter or wood worker
(10)___ Carrera profesional profesional career
(11)___ Turismo relacionado tourism related
(12)___ Ama de casa/domestica housewife/husband
(99)___ Otro, especifique_____________________________________

145
4.4 ¿Cuál es el grado de escolaridad más alto que ha terminado (de la esposa del jefe de hogar)? What is the highest year of school completed? (of the spouse of the
head of the household) (1)_____ Primero o menos (no educación formal) (No formal education) (2)_____ Segundo (3)_____ Tercero (4)_____ Cuarto (5)_____ Quinto (6)_____ Sexto (7)_____ Primero Básico (8)_____ Segundo Básico (9)_____ Tercero Básico (10)____ Diversificado (11)____ Universidad (12)____ Maestría o superior (97)____ No contesta No answer
¿Quién en su hogar hace la decisión final o tiene la responsabilidad primaria para la decisión en relación a las siguientes cosas?
Yo me Mi cónyuge my spouse
Other otro
4.5 Decisiones para gastar dinero Financial decisions
4.6 Decisiones gastos médicos (visitas al doctor, medicación…etc) Medical decisions (doctor visits, medication…etc.)
4.7 Educación para sus hijos Education for your children
4.8 Necesidades (ropa, comida…etc.) Necessities
(clothes, food…etc.)
4.9 Compras grandes (vehículos, aparatos...etc.) Large purchases (vehicles, appliances…etc.)
4.10 Visitas a familia o amigos visits to family and friends
SECCIÓN 5. OPINIONES ACERCA DEL MANEJO FORESTAL Y
CONSERVACIÓN OPINIONS ABOUT FOREST MANAGEMENT AND CONSERVATION
Por favor, ordena las siguientes actividades en términos de sus importancia para asegurar las vida de la gente que viven en dentro de y cerca de la Reserva de Biosfera Maya (lea los objetivos y opciones, y circúlo el numero) Please rank the
following activities in terms of their importance for ensuring the livelihood people who live in and around the forests of the Maya Biosphere reserve (Read the objectives and options and circle the number)

146
Cuan de acuerdo está usted con lo siguiente:
Muy en desacuerdo
Desacuerdo
Neutral
De acuerdo
Muy de acuerdo
5.1 “Dependo de los recursos del bosque para mis ingresos económicos.” I depend on
the forest resources for my income
1 2 3 4 5
5.2 “Estoy muy preocupado/a por el futuro de los bosques de Petén” I am very worried
about the future of the Petén’s forests
1 2 3 4 5
5.3 “Cualquier persona debe poder cortar madera de la Reserva Biósfera Maya”. Anyone should be
able to harvest timber from the MBR
1 2 3 4 5
5.4 “Cualquier persona debe poder cortar productos forestales no maderas (e.g., Chicle o Xate) de la Reserva Biósfera Maya”. Anyone should be
able to harvest non-timber forest products from the MBR
1 2 3 4 5
5.5 “La agricultura está amenazando a los bosques en el Petén.” Agriculture (crops or
grazing) is threatening to the forests in the Petén.
1 2 3 4 5
5.6 “El turismo hace daño a los bosques en el Petén.” Tourism is
causing damage to the forests in the Petén
1 2 3 4 5
5.7 El turismo hace daño a los recursos culturales de la reserve. Tourism causes
1 2 3 4 5
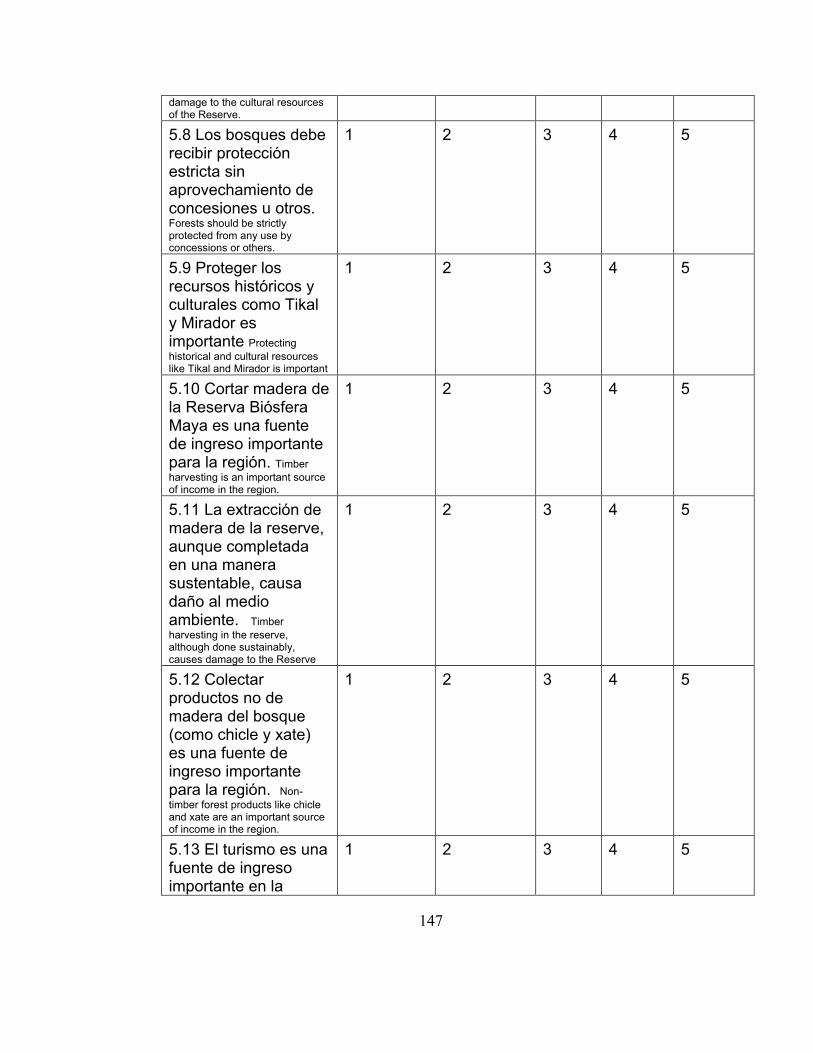
147
damage to the cultural resources of the Reserve.
5.8 Los bosques debe recibir protección estricta sin aprovechamiento de concesiones u otros. Forests should be strictly protected from any use by concessions or others.
1 2 3 4 5
5.9 Proteger los recursos históricos y culturales como Tikal y Mirador es importante Protecting
historical and cultural resources like Tikal and Mirador is important
1 2 3 4 5
5.10 Cortar madera de la Reserva Biósfera Maya es una fuente de ingreso importante para la región. Timber
harvesting is an important source of income in the region.
1 2 3 4 5
5.11 La extracción de madera de la reserve, aunque completada en una manera sustentable, causa daño al medio ambiente. Timber
harvesting in the reserve, although done sustainably, causes damage to the Reserve
1 2 3 4 5
5.12 Colectar productos no de madera del bosque (como chicle y xate) es una fuente de ingreso importante para la región. Non-
timber forest products like chicle and xate are an important source of income in the region.
1 2 3 4 5
5.13 El turismo es una fuente de ingreso importante en la
1 2 3 4 5
148
región. Tourism is an
important source of income in the region.
5.14 Es necesario que el gobierno gaste más dinero en la protección del bosque en el Petén de actividades ilegales. It is necessary for the government to spend more money on the protection of the forest in the Petén from illegal activity
1 2 3 4 5
5.15 En 20 años, habrá la misma cantidad del bosque en la Reserve In 20 years,
there will be the same amount of forest in the Reserve
1 2 3 4 5
SECCIÓN 6. LAS CONCESIONES FORESTALES COMUNITARIAS The forest
concessions
En la próxima sección, voy a hacerle algunas preguntas acerca de las concesiones forestales comunitarias. In this section I will ask you some questions about the community
forest associations. 6.1 ¿Actualmente, es usted socio de alguna concesión? Are you currently a member?
(1) ___ Si pase a la pregunta 6.16 (2) ___ No
6.2 ¿Alguna vez, ha sido socio de alguna concesión forestal comunitaria?
Have you ever been a member of a community forestry association? (1) ___ Si (2) ___ No pase a la pregunta 6.6
6.3 ¿Si alguna vez fue socio, pero ya no, en qué año terminó su afiliación?
___________ If you were a member at one time, what year did you end your membership?
6.4 ¿Vendió usted su membresía? Did you sell your membership?
(1) ___ Si A cuanto la vendió? Q________________ How much did you sell it
for? (2) ___ No 6.5 ¿Cuál fue la principal razón para terminar su afiliación con la concesión?
What was the primary reason for ending your membership in the forest community concession? (1) ____ No ganaba suficiente dinero trabajando en la concesión
Was not earning enough money working in the concession (2) ____ Había un conflicto con otro socio Had a conflict with another member

149
(3) ____ Quería centrar su atención en la agricultura Wanted to focus on agriculture (4) ____ Llegó una oportunidad más rentable A more profitable opportunity came along
(5) ______ Fui expulsado (99) ___ Otro, especifique_____________________________________
(Lea esta oración solo si fue socio en el pasado y ya no) Por favor responda las próximas preguntas con base en el tiempo en que fue usted miembro de alguna concesión. (Read this if they were a member in the past but not now.)
Please answer the next questions based on the time you were a member
Pase a la pregunta 6.16 6.6 ¿Ha escuchado algo sobre las concesiones forestales comunitarias?
Have you ever heard about the community forest concessions?
(1)___ Si (2)___ No pase a la Sección 7 skip to section 7
6.7 ¿Cuánto considera usted que sabe acerca de las concesiones forestales? (lea las respuestas) How much would you say you know about them?
(1)____ He oido algo, pero no sé nada acerca de ellas. I’ve heard of them, but I don’t know anything about them
(2)____ Se un poco de ellas. I know a little bit about them (3)____ Se mucho de ellas. I know a lot about them
6.8 ¿Alguna vez tuvo la oportunidad de formar parte de una concesión
forestal, pero no quiso? Did you ever have the opportunity to join an association or cooperative, but
did not want to join?
(1) ____ Si (2) ____ No pase a la pregunta 6.11
6.9 ¿A cuáles podría haberse unido? Which group could you have joined?
(1) _____ San Miguel (8) _____ Las Ventana (Arbol Verde) (2) _____ Uaxactún (OMYC) (9) _____ La Unión (CUSTOSEL) (3) _____ Cruce a la Colorada (AFICC) (10)_____San Andrés (AFISAP) (4) _____ Carmelita (11)_____Rio Chanchich (Suchitecos) (5) _____ La Pasadita (12)_____Chosquitán (Laborantes) (6) _____ La Colorada (AFIC) (13)_____Lechugal (Selva Maya Norte) (7) _____ Yaloch (El Esfuerzo) 6.10 ¿Por qué eligió no unirse a la concesión? Why did you choose not to join the association?
(1) ____ Muy caro Too expensive (2) ____ No está interesado en el sector forestal Not interested in forestry (3) ____ No desea unirse a un grupo comunitario Do not want to join a community
group (4) ____ No tiene tiempo No time
(5) ____ Penso que unirse la asociación no dejaba ganancias. Did not think joining the association would be profitable

150
(6) ____ No quería dejar mi trabajo para trabajar en una concesión. Did not want to leave my job to work in concession
(99) ___ Otro, especificar __________________________________
Vaya a Sección 7 Go to Section 7 6.11 Estaría interesado en unirse a una concesión forestal comunitaria si
tuviera la oportunidad? Would you be interested in joining a community forest concession if given
an opportunity?
(1) ____ Si (2) ____ No Vaya a Sección 7
6.12 ¿Cuáles son las razones principales para querer unirse una concesión? (Marque todos los que aplican) What are the main reasons you would want to join a
concession? (Check all that apply) (1) ____ Para tener mejores oportunidades de trabajo For better job opportunities
(2) ____ Quiero tener acceso legal a productos forestales Wanted legal access to
forest products
(3) ____ Tengo familia o amigos en el grupo Had family or friends in the group (4) ____ Para tener beneficios financieros asociados con la calidad de socio Financial benefits associated with membership (5) ____Para tener beneficios en especie asociados con la calidad de socio (6) ____ Todos los demás en la comunidad se estaban convirtiendo en socios Everyone else was becoming a member (7) ____ Proteger los bosques To protect the forests
(99)___ Otro, especifique ________________________________ 6.13 Por favor, clasifica usted los beneficios potenciales por ser un socio de una
concesión en orden de importancia para usted. (Indica lo más importante con
“1,” el segundo más importante con “2,” y el ultimo con “3.”) Please rank the potential
benefits for being a concession member in order of importance.
(1) ______Beneficios en especie (seguro de vida, atención médica, becas
escolares…etc.) In-kind benefits (life insurance, medical attention, schorships…etc.)
(2) ____Trabajo estable para un salario Stable work for wages
(3) ____Dividendos dividends
6.14 De los siguientes beneficios en especie potenciales para un socio de una concesión, cuales son para usted los tres más importantes. (Lea los beneficios y marque el orden de importancia que dice el entrevistado
151
Of the following potential in-kind benefits from being a concession member, which three are the most important to you? (Read the benefits and mark the order of importance that the participant states.)
(a)____mejoramiento a centros de las saludes (b)_____mejoramientos a edificios escolares (c)_____Otros mejoramientos comunidades por ejemplo, dinero a iglesias o apoyo para mujeres
(d) ____ Seguro de vida y gastos funerales life insurance
(e) ____ Medicinas y atención médica medical benefits
(f) ____ Becas escolares y gastos escolares además de servicios ofrecidos por el gobierno scholarships/grants besides services offered by the government
(g) _____ Acceso a créditos Access to loans
6.15 ¿Piensa usted que los socios de una concesión son mejor o peor en términos de sus subsistencias que los no socios? Do you think that members of a
concession are better or worse off in terms of their livelihoods than non-members?
(1)____ Mucho peor Much worse (2)____ Un poco peor A Little worse (3)____ Igual Same (4)____ Un poco mejor A Little better (5)____ Mucho mejor Much better (98)___ No sé Don’t know (97)___ No contesta No answer
Vaya la Sección 7 Go to Section 7
(Las siguientes preguntas son para socios actuales o pasados de una concesión. Salte a la Sección 7 si no es así.) (The following questions are for current and former
concession members. Skip to Section 7 otherwise) 6.16 ¿A qué grupo concesionario pertenece o perteneció? Which concession group
are/were you a member of?
(1) _____ San Miguel (8) _____ Las Ventana (Arbol Verde) (2) _____ Uaxactún (OMYC) (9) _____ La Unión (CUSTOSEL) (3) _____ Cruce a la Colorada (AFICC) (10)_____San Andrés (AFISAP) (4) _____ Carmelita (11)_____Rio Chanchich (Suchitecos) (5) _____ La Pasadita (12)_____Chosquitán (Laborantes) (6) _____ La Colorada (AFIC) (13)_____Lechugal (Selva Maya Norte) (7) _____ Yaloch (El Esfuerzo) 6.17 ¿En qué año se convirtió en socio? _______________ What year did you become
a member?
6.18 ¿Cuáles fueron las razones principales para unirse? (Marque todos los que aplican)
Why did you join? (Check all that apply)
(1) ____ Para tener mejores oportunidades de trabajo For better job opportunities

152
(2) ____ ONGs me animaron a convertirme en socio NGO encouraged me to
become member
(3) ____ Quería tener acceso legal a productos forestales Wanted legal access to
forest products
(4) ____ Tenía familia o amigos en el grupo Had family in the group (5) ____ Para tener beneficios financiarios asociados con ser socio
To receive financial benefits associated with membership
(6) ____ Para tener beneficios en especie asociados con ser socio como becas escolares o seguro de vida
To receive inkind benefits associated with being a member such as scholarships or life insurance (7) ____ Todos los demás en la comunidad se estaba convirtiendo en socios Everyone else was becoming a member (8) ____ Se vio obligado a unirse, pero no deseaba convertirse en socio Was forced to join but did not want to become member (99) ___ Otro, especifique __________________
6.19 Tuvo que hacer algún pago para unirse? Did you have to pay to join?
(1) ___ Si ¿Cuánto? Q_____________ (2) ___ No
6.20 Que beneficios recibe o podría recibir usted como socio de una
concesión? (Leas todas las respuestas y Marque todas las que aplican) What types of benefits do you receive or are eligible for as a concession member? (check all that apply) (a) _____ Tener prioridad para trabajar get first priority for jobs
(b) _____ Mejoramiento comunitario community enhancements (c) _____ Seguro de vida life insurance
(d) _____ Medicinas y atención médica medical benefits
(e) _____ Becas escolares/donaciones scholarships/grants
(f) _____ Distribución anual de ganancias annual dividends
(g) _____ Acceso a créditos Access to loans
(h) _____ Ninguno None
6.21 ¿Cómo un socio de una concesión, le prometieron algunos beneficios que no recibió? As a concession member, were you ever promised benefits you didn’t receive?
(1)_____Sí (2)_____No (99)_____No sé 6.22 Por favor, clasifica usted los beneficios por ser un socio de una concesión
en orden de importancia para usted. (Indica lo más importante con “1,” el
segundo más importante con “2,” y el ultimo con “3.”) Please rank the benefits for
being a concession member in order of importance.

153
(1) ______Beneficios en especie (seguro de vida, atención médica, becas
escolares…etc.) In-kind benefits (life insurance, medical attention,
schorships…etc.)
(2)____Trabajo estable para un salario Stable work for wages
(3)____Dividendos dividends
6.23 De los siguientes beneficios en especie para un socio de una concesión,
cuales son para usted los tres más importantes. (Lea los beneficios y marque el orden de importancia que dice el entrevistado) Of the following in-kind benefits from being a concession member, which are the most important to you? (Read the benefits and mark the order of importance that the participant states.)
(a) ____ Mejoramiento comunitario community enhancements
(b) ____ Seguro de vida life insurance
(c) ____ Medicinas y atención médica medical benefits
(d) ____ Becas escolares/donaciones scholarships/grants
(e) _____ Acceso a créditos Access to loans
6.24 ¿Piensa usted que los socios de una concesión son mejor o peor en términos de sus subsistencias que los no socios? Do you think that members of a
concession are better or worse off in terms of their livelihoods than non-members?
(1)____ Mucho peor Much worse (2)____ Un poco peor A Little worse (3)____ Igual Same (4)____ Un poco mejor A Little better (5)____ Mucho mejor Much better (98)___ No sé Don’t know (97)___ No contesta No answer
6.25 ¿Alguna vez han sido usted o su cónyuge miembro de la Junta Directiva de la Concesión?
Have you or your spouse ever been a member of the board of directors for your concession?
(1) ____ Si, yo Yes, me (2) ____ Sí, mi cónyuge Yes, my spouse (3) ____ Sí, mi cónyuge y yo Yes my spouse and I
(4) ____ No
6.26 ¿Cuánto tiempo han servido usted y/o su cónyuge en la Junta Directiva? ___________ How many years did you and/or your spouse serve on the board? 6.27 ¿Que tan satisfecho está usted en general con el manejo administrativo
de la concesión? How satisfied are you in general with the management of the concession (by the board of directors)?
(1) ____ Satisfecho satisfied
(2) ____ Neutral (3) ____ Insatisfecho unsatisfied

154
(98)____No sé Don’t know
6.28 ¿Cuál fue su trabajo principal antes de unirse a la concesión? What was your primary job before you joined the concession?
(1)____ Trabajo relacionado con el bosque (como una concesión industrial o
contrato de PFNM)
(2)____ Agricultor farmer
(3)____ Ganadero Rancher
(4)____ Jornalero diario en agricultura o ganadería daily laborer in agriculture (5)____ Trabajo Doméstico para finqueros u otros patronos (6)____ Empleado en pequeño negocio employee at small business (7)____ Empleado de ONG o contratado por una ONG employee for NGO or
contract work for NGO (8)____ Empleado de gobierno government employee (9)____ Negocio propio (auto-empleo) self-employed business (10)___ Carpintero o trabajador de la madera carpenter or wood worker (11)___ Carrera profesional profesional career (12)___ Turismo relacionado tourism related (99)___ Otro, especifique ____________________________Other, specify
6.29 ¿Comparado con antes, como siente que es su situación económica
después de haberse unido a la concesión? (lea todas las respuestas) How do you feel your economic situation was after you joined the concession compared to before you joined?
(1)____ Mucho peor Much worse (2)____ Un poco peor A Little worse (3)____ Igual Same (4)____ Un poco mejor A Little better (5)____ Mucho mejor Much better (98)___ No sé Don’t know
6.30 ¿Comparado con las personas que no son miembros de la concesión, diría usted que está mejor o peor que esta gente? Compared with people who are not
members of a concession, would you say that you are better off or worse off than these people?
(1)____ Mucho peor Much worse (2)____ Un poco peor A Little worse (3)____ Igual Same (4)____ Un poco mejor A Little better (5)____ Mucho mejor Much better (98)___ No sé Don’t know (97)___ No contesta No answer
Si no es un socio actualmente, pase a la sección 7 If not currently a member, skip to section7
6.31 ¿Cuántas asambleas se han realizado en la concesión durante los últimos 12 meses? ____
How many assembly meetings have there been in the past 12 months?

155
6.32 ¿A cuántas de estas asambleas ha asistido usted en los últimos 12 meses? ____
How many meetings have you attended in the past 12 months?
6.33 ¿Ha recibido usted ganancias por ser socio de una concesión, en los últimos 12 meses? Have you received any dividend payments in the past 12 months?
(1) ___ Si ¿Cuánto? Q_____________ (2) ___ No
6.34 ¿Si pudiera venderlo a otra persona, cuánto cree que vale su derecho a la concesión? Q_________________ o No se ______________ If you had to estimate, how much do you think your membership is currently worth if you were to sell it to another person?
6.35 ¿Se le ha asignado alguna tierra dentro de una concesión para uso
personal como agricultura? Have you been allocated any land from the concession for personal
use such as farming and agriculture? (1) ___ Si ¿Cuánta tierra? _____________ manzanas (2) ___ No
SECCIÓN 7. Migración Migration
En la próxima sección, voy a hacerle algunas preguntas acerca de su residencia y cambios de residencia durante su vida. In this section I will ask you some questions about your
residence and residence changes during your lifetime.
7.1 ¿En qué departamento nacieron sus padres? (marque por los dos padres) In which department were your parents born? (mark for each parent)
(1) ____ Petén (9) ____ Guatemala (17) ____ Sacatepéquez (2) ____ Alta Verapaz (10) ____ Chimaltenango (18) ____ San Marcos (3) ____ Izabal (11) ____ Chiquimula (19) ____ Santa Rosa (4) ____ El Quiché (12) ____ Escuintla (20) ____ Sololá (5) ____ Huehuetenango (13) ____ Jalapa (21) ____ Suchitepéquez (6) ____ Baja Verapaz (14) ____ Jutiapa (22) ____ Totonicapán (7) ____ El Progreso (15) ____ Quetzaltenango (23) ____ Otro país (8) ____ Zacapa (16) ____ Retalhuleu
7.2 ¿Hicieron sus padres trabajos con la agricultura? (1)___ Si (2)___ No 7.3 ¿Nació usted en el Petén? Were you born in the Petén? (1)___ Si Pase a la pregunta 7.5 (2)___ No

156
7.4 ¿En qué departamento nació usted? In which department were you born? (1) ____ Alta Verapaz (9) ____ Chimaltenango (16) ____ Sacatepéquez (2) ____ Izabal (10) ____ Chiquimula (17) ____ San Marcos (3) ____ El Quiché (11) ____ Escuintla (18) ____ Santa Rosa (4) ____ Huehuetenango (12) ____ Jalapa (19) ____ Sololá (5) ____ Baja Verapaz (13) ____ Jutiapa (20) ____ Suchitepéquez (6) ____ El Progreso (14) ____ Quetzaltenango (21) ____ Totonicapán (7) ____ Zacapa (15) ____ Retalhuleu (22) ____ Otro país (8) ____ Guatemala Pase a la pregunta 7.6 7.5 ¿Nació usted en esta comunidad? Were you born in this community?
(1)___ Si Pase a la sección 8 (2)___ No 7.6 ¿En qué año se mudó usted a esta comunidad? In what year did you move to this
community?_________ (99)___No sé ****Use las siguientes preguntas por los participantes que han cambiado sus residencias. Repita estas preguntas por casa cambio de residencia.*** Use the following questions for the participants that have changed residency.
7.7 ¿Antes de esta comunidad, dónde vivía usted? Utilice el código abajo para llenar el espacio. Before this community, where did you live? Use the code to fill in the space
7.8 ¿Por cuánto tiempo vivía usted en esta comunidad? How long did you
live in this community?
7.9¿Por qué vivía en esta comunidad? Utilice el código abajo para llenar el espacio. Why did you live in this community? Use the code to fill in the space
a)
b)
c)
d)
e)

157
1= La Libertad 8= Melchor de Mencos 2= San Francisco 9= Las Cruces 3= San Andrés 10= Dolores 4= Sayaxché 11= San Benito 5= San José 12= Santa Ana 6= Poptún 13= San Luis 7= Flores 14= Otra comunidad en el Petén 15= Otra comunidad dentro del país 16= Otra comunidad afuera del país
1= Mi familia y/o mis amigos estaban allá 2= Tenía trabajo allá/Había más oportunidades para trabajo allá 3= Iba un socio de una concesión 4= Iba barato a vivir aquí 5= Prefería el ambiente de esa comunidad a otras 6= Nací en esta comunidad 7=Otro
SECCIÓN 8. El Manejo de la Reserva de Biosfera Maya Management of the Maya Biosphere
Reserve Esta sección de la encuesta les pregunta a los residentes adentro y cerca de la Reserva de Biosfera Maya (MBR) a declarar como quieren que la Reserva sea dirigida. La MBR era fundada en 1990 para conservar la biodiversidad, mejorar el turismo, animar el manejo forestal sustentable, mantener el cubierto intacto del bosque, preservar los sitios arqueológicos de los Mayas. Sobre tiempo, la gente se ha dado cuenta de los esfuerzos por las comunidades de la MBR a mantener el cubierto del bosque también ha guardado el carbono en los árboles.Por guardar el carbono afuera del aire, los bosques en la MBR reducen los impactos del cambio del clima. El cambio del clima puede afectar la gente en todas partes y es posible que el cambio del clima cause sequías y fuegos en el Petén. This section of the survey asks residents in and around the Maya Biosphere Reserve to state how they want the Reserve to be managed. The MBR was established in 1990 to conserve biodiversity, enhance tourism, encourage sustainable forest management, maintain intact forest cover, and preserve Mayan archaeological sites. Over time, people have recognized that the efforts by the communities of the MBR to maintain forest cover have also stored carbon in trees. By keeping this carbon out of the air, the forests of the MBR reduce the impacts of climate change. Climate change can affect people everywhere, and may cause droughts and forest fires in the Petén Debido a la importancia de los bosques en la MBR a las comunidades que
habitan la región y los beneficios los bosques en la MBR proveen a los
residentes y gente sobre todo el mundo, Nos gustaría comprender como usted
muestra el manejo los bosques en la MBR. Particularmente, querríamos a
comprender su punto de vista en la extracción de madera y productos no de
madera, vender carbón, y participar en el turismo. Sus respuestas van a
ayudarnos a comprender como usted y sus vecinos quieren la MBR ser dirigida
en el futuro.
Given the importance of forests in the MBR to the communities that inhabit the region, and given the many benefits the
forests in the MBR provide to local residents as well as people all over the world, we would like to understand your views
on management of forests in the MBR. In particular, we are interested in understanding your views on harvesting timber

158
and non-timber forest products, selling carbon, and participating in tourism. Your responses will help us understand how
you and your neighbors want the MBR to be managed in the future.
Para hacer esto, vamos a presentarte con una colección de escenarios que
describen las maneras diferentes de dirigir la Reserva. Nos gustaría que escoja
la opción que prefiere usted. Esta opción incluye la posibilidad que prefiere
ninguna opción. La MBR consiste del área en la figura abajo. La Reserva es
dividida en tres zonas. La zona de parques nacionales es amarilla. Esta zona
consiste de áreas de preservación de prioridad alta como monumentos de las
Mayas y parques nacionales como Tikal. La extracción de madera y productos
no de madera como xate y chicle es prohibida en esta zona, aunque, se puede
participar en el turismo. La zona de uso múltiple es mostrada en verde. Las
concesiones comunitarias y dos concesiones industriales manejan esta tierra
para la extracción de madera, la extracción de productos no de madera y
turismo. También, hay áreas en esta zona que no son manejadas. La zona de
amortiguador en anaranjada es una tira de tierra de 15 kilómetros en la frontera
del sur de la Reserva que es dedicada en gran parte a las actividades de
agricultura y hacienda. Mucho de la zona de amortiguador es tierra titulada.
To do this, we will present you with a set of scenarios that describe different ways of managing the Reserve. We would
like you to choose the option you prefer, including the possibility that you prefer no changes. The MBR consists of the
area in the figure below. The reserve is divided into three zones. The core zone is in yellow. It consists of high-priority
preservation areas such as national parks and ancient ruins. Timber harvesting, non-timber forest product extraction
(such as xate and chicle) are prohibited there, although tourism can occur. The multiple use zone is shown in green.
Community based concessions and two industrial concessions manage this land for timber, non-timber forest products,
and tourism. There are also some unmanaged areas in this zone. The buffer zone in orange is a 15-kilometer wide strip
along the southern end of the reserve largely dedicated to agricultural and pastoral activities. Much of the buffer zone is
titled land.
159
Los escenarios abajo solamente consideran en el manejo en la zona de uso
múltiple en verde en el mapa arriba. Aunque las preguntas son hipotéticas, le
pregunta a usted a escoger las opciones que están basadas en sus preferencias
personales para como se debe manejar la parte verde de la Reserva. Piensa
usted de su elección como votar para el plan que prefiere. Asuma que las
actividades para que la mayoría de las personas votan será implementado
exitosamente en la zona de uso múltiple en la MBR. Su opinión en el manejo de
esta región es muy importante debido a sus experiencias de vivir aquí.
The scenarios only consider management in the multiple use zone in green in the map above. Although the questions are
hypothetical, I ask that you to make your choices based on your personal preferences for how the green part of the
reserve should be managed. Think of your choice as casting a vote for the plan you prefer. Assume that the activities that
the most people vote for will be implemented and executed successfully in the multiple use zone of the MBR. Your opinion
on the management of this region is very important, given your experiences living here.
Nos gustaría que considere usted las siguientes actividades: The following are the activities we would like you to consider
Guardar el carbono Las concesiones comunitarias en la MBR ya han reducido las emisiones de carbono en la atmosfera por impedir deforestación y practicar el manejo sustentable de los bosques. Los socios de las concesiones pueden recibir pagos para este carbono. Comunidades, también, pueden escoger a aumentar el carbono guardado por extractar menos madera de los bosques en las concesiones y en las áreas envolventes en verde arriba. Esta significa que los ingresos ganan de madera van a disminuir mientras los ingresos del carbono van a aumentar. Alternativamente, las concesiones van a aumentar la extracción de madera para aumentar los ingresos de madera extractada de la Reserva, pero no podrán a recibir los pagos del carbono. Niveles: Statu quo: La extracción de madera y el carbono guardado se quedan los mismos y no hay pagos por carbono. Junta el programa del carbono y recibir un pago por el carbono ya guardado, pero mantener el nivel actual de la extracción de madera. Reduce la extracción de madera por 20% y aumenta el carbono guardado por 20% Aumenta la extracción de madera por 20% y reduce el carbono guardado por 20% Carbon Storage The community concessions in the MBR have already stored carbon and reduced the effects of climate change by preventing deforestation and practicing sustainable forest management. They can be paid for this carbon. Communities can also choose to increase carbon storage by harvesting less timber in the concessions and surrounding areas in green above. This means that timber revenues will decline, while carbon revenues will increase. Alternatively, concessions can increase timber harvesting to increase timber revenues, but they will not be able to receive carbon payments.

160
Levels: Status Quo: Timber harvests and carbon storage remain the same as currently and there is no payment for carbon. Join carbon program and get paid for carbon already stored, but keep timber harvesting at current levels. Reduce timber harvests by 20% and increase carbon storage by 20% Increase timber harvests by 20% and reduce carbon storage by 20%.
Las ventas del carbono Si el gobierno vende el carbono a un comprador internacional afirmaría un contrato con el gobierno que garantizaría las actividades requeridas para un periodo de tiempo.. El comprador requería el monitoreo estricto de los recursos de carbono en las concesiones. Si los grupos no obedecen por los contratos, los pagos pararían y es posible que el gobierno recompense alguno o todo el dinero. Niveles: Statu quo: no vende Vende con un contrato de 5 años vende con un contrato de 10 años vende con un contrato de 20 años Carbon Sales If the government sells the carbon to an international buyer, they would sign a contract that would lock in the required activities for a given time period. The buyer would require strict monitoring of the carbon resources in the concessions, and if the groups were not abiding by the contract, then payments would stop, and the government may have to repay some or all of the money. Levels: Status Quo: Do not sell Sell with 5 year contract Sell with 10 year contract Sell with 20 year contract.
Otras actividades
El Turismo y la colección de productos forestales no de madera como chicle y xate son
actividades que ocurren actualmente entre las concesiones. Estas actividades no afectan
la extracción de madera ni el carbono guardado, pero pueden tener otros impactos en el
ecosistema y la biodiversidad que son posiblemente negativos.
Niveles:
Statu quo: Continua en la situación actual con ambas actividades
Solamente permite turismo
Solamente permite la colección de productos no de maderaNo permite ninguno
Other activities Tourism and the collection of non-timber forest products, such as chicle and xate, are also activities that currently occur
within the concessions. These activities do not affect timber harvesting or carbon storage, but they can have other,
potentially negative, impacts on ecosystems and biodiversity.
Levels

161
Status Quo: Continue as is with both activities possible in the concessions
Only allow tourism
Only allow collection of Non-timber Forest Productions
Do not allow either activity.
Pago: Por cambiar el manejo de la Reserva, los pagos que va a recibir de su concesion
puede aumentar o disminuir. Esta incluye todos los cambios posibles a sus sueldos y/o
dividendos. Debajo esta alternativa, recibiría___________
Niveles:
Status Quo: 0Q por año
+800Q por año
+2000Q por año
+3200Q por año
+4800Q por año
Payment: By changing management of the reserve, the payments you receive from your concession could increase or
decrease. This includes all possible changes to wages and/or dividends. Under this alternative, you would receive
_________.
Levels:
Status Quo: 0Q per year
+800Q per year +2000Q per year +3200Q per year +4800Q per year
*Lengua alternativa por no socios: Estos cambios en los acuerdos de las concesiones
resultaría en ingresos más grandes o más pequeños en la región, los cuales permitiría los
pagos ser hechos a todos los individuos que viven entre la región.. Debajo de esta
alternativa, recibiría ________
Niveles:
Statu Quo: 0Q por año
+800 por año
+2000Q por año
+3200Q por año
+4800Q por año
*Alternative language for non-concession members: These changes in the concession agreements would result in
larger or smaller revenues in the region, which would allow payments to be made to all individuals living within the region.
Under this alternative you would receive ___________.
Levels:
Status Quo: 0Q per year

162
+800Q per year +2000Q per year +3200Q per year +4800Q per year
El vehículo del pago:
Niveles:
El pago le viene a usted
El pago le viene a su concesión (o pueblo por los no socios)
Payment vehicle: Levels: The payment comes to you individually The payment comes to your concessions and is used for concession related efforts *Alternative for non-concession members: The payments comes to your village and is used for community improvements (sewage treatment, water supply, schools, medical clinics, etc.).
Asuma usted, por favor, que el manejo de las opciones que escoge puede ser
ejecutadas exitosamente.
Please assume that the management options you choose can be executed successfully.
Ahora, voy a presentarle a usted con cuatro escenarios. Considera cada
escenario separadamente y asuma que no puede cambiar las opciones de
diferentes escenarios. Piensa de esta actividad como una vota para los
programas que le gustaría implementar en la MBR y cualquieras actividades que
reciben la mayoría de la votas van a ser implementadas. Vamos a darle a usted
un escenario con tres opciones: dos planes propuestos y una opción para el
statu quo. Por votar por la opción de statu quo, está diciendo que prefiere
mantener los niveles actuales del turismo, la extracción de productos de madera,
la extracción de productos no de madera y el cubierto intacto del bosque con no
programa del carbono en la MBR. Por votar de uno de las opciones de los
planes propuestos, está diciendo que preferiría eso plan a la opción de statu quo
y la otra opción para el plan propuesto.
I will now present you with four choice scenarios. Consider each scenario separately and assume you cannot combine
choices from different scenarios. Think of this activity as casting a vote for the programs you would like to see
implemented in the Maya Biosphere Reserve and whichever activities receive the most votes will be implemented. You
will be given a scenario with three options: two proposed plan options and a status quo option. By voting for the status
quo option, you are saying you prefer to keep the current levels of tourism, timber harvesting, non-timber forest product
collection, and intact forest cover with no carbon program in the MBR. By voting for one of the proposed plan options, you
are saying you’d prefer that plan to the status quo and the other proposed plan option.

163
Este es el fin de la encuesta. Muchas gracias por su colaboración. Aquí hay 25 Quetzales por su tiempo. ¿Puede por favor firmar la hoja y el recibo de pago? Nuevamente gracias por su colaboración. This is the end of the interview. Thank you very much for your participation. Here is 25 Quetzales to compensate for your time. Can you please sign your name here (hand them form) in receipt of payment? Again, thank you for participating.
Este es el fin de la encuesta. Muchas gracias por su colaboración. Aquí hay 25 Quetzales por su tiempo. ¿Puede por favor firmar la hoja y el recibo de pago? Nuevamente gracias por su colaboración. This is the end of the interview. Thank you very much for your participation. Here is 25 Quetzales to compensate for your time. Can you please sign your name here (hand them form) in receipt of payment? Again, thank you for participating.
* * * * * * * * * * * * * * * PARA EL ENCUESTADOR FOR THE ENUMERATOR * * * * * 9.1 Se mostró la persona entrevistada nerviosa o irritada por las preguntas durante la encuesta?
Was the person who answered the questions irritated or nervous during the interview?
(1)______ Si (2)______ No
9.2 Considera usted que el entrevistado hizo un esfuerzo por decir la verdad? Do you think the respondent made an effort to tell the truth?
(1)______ Si (2)______ No
9.3 Como calificaría en general la calidad de la entrevista?
How would you rate the overall quality of the interview?
(1)______ Buena Good (skip next question) (2)______ Razonable Fair (3)______ Pobre Poor
9.4 Por favor anote comentarios o preocupaciones específicas: Please note specific
concerns or comments:
_____________________________________________________________________________________________________________________________________________________________________________________________________________________________________________________________________________________________________________________________________________________________________________________________________________________________________________________________________________________________________________________________________________________