Forest Age Influences Oak Insect Herbivore Community Structure, Richness, And Density
12
Ecological Applications, 16(3), 2006, pp. 901–912 Ó 2006 by the Ecological Society of America FOREST AGE INFLUENCES OAK INSECT HERBIVORE COMMUNITY STRUCTURE, RICHNESS, AND DENSITY JUNE M. JEFFRIES, 1 ROBERT J. MARQUIS, AND REBECCA E. FORKNER 2 Department of Biology, University of Missouri–St. Louis, One University Boulevard, St. Louis, Missouri 63121 USA Abstract. Plant succession is one of many factors that may affect the composition and structure of herbivorous insect communities. However, few studies have examined the effect of forest age on the diversity and abundance of insect communities. If forest age influences insect diversity, then the schedule of timber harvest rotation may have consequent effects on biodiversity. The insect herbivore community on Quercus alba (white oak) in the Missouri Ozarks was sampled in a chronoseries, from recently harvested (2 yr) to old-growth (approximately 313 yr) forests. A total of nine sites and 39 stands within those sites were sampled in May and August 2003. Unique communities of plants and insects were found in the oldest forests (122–313 yr). Density and species richness of herbivores were positively correlated with increasing forest age in August but not in May. August insect density was negatively correlated with heat load index; in addition, insect density and richness increased over the chronoseries, but not on the sunniest slopes. Forest structural diversity (number of size classes) was positively correlated with forest age, but woody plant species richness was not. In sum, richness, density, and community structure of white oak insect herbivores are influenced by variation in forest age, forest structure, relative abundance of plant species, and abiotic conditions. These results suggest that time between harvests of large, long-lived, tree species such as white oak should be longer than current practice in order to maintain insect community diversity. Key words: chronoseries; community structure; herbivorous insects; Lepidoptera; Missouri; oak; old- growth forest; Ozarks; Quercus alba; rotation length; succession; time series. INTRODUCTION Forests are subject to natural and anthropogenic disturbances such as fire, wind storms, uprooting and death of individual trees, and timber harvest (Binkley 1999). Although studies of plant succession following these forest disturbances are many (e.g., Lorimer 1980, Hibbs 1983, Reich et al. 1990, Jenkins and Parker 1998, Larsen and MacDonald 1998), there are relatively few studies of animal community responses to plant succession (as noted by Morin 1999). Particularly lacking are replicated studies of changes in insect communities with plant succession. Knowledge of such successional patterns and their underlying causes is important for understanding the forces driving temporal changes in the composition of insect communities. In addition, such knowledge has important implications for forest management. If insect community composition or diversity changes with forest age, short rotation lengths (time between consecutive harvests) may result in the landscape-level loss of unique communities of plants and insects. Changes in plant community characteristics driven by architecture or disturbance may influence insect herbi- vore communities, particularly if herbivores specialize on certain host plant species or on microhabitats provided by a particular plant growth form. Two mechanisms, both related to habitat heterogeneity, suggest that the diversity and abundance of the insect herbivore communities may increase with forest age. First, increasing complexity of plant architecture is associated with higher species diversity of herbivorous insects (Lawton 1983). Older forests may provide more stem diameter size classes and thus, more complex architecture than younger forests. Second, the inter- mediate disturbance hypothesis predicts that diversity will peak in habitats with intermediate disturbance levels (Connell 1978). Some disturbance types, such as wind damage, may differentially affect older more than younger forests because the risk of wind damage to a tree or a stand increases with age (Oliver and Larson 1996). Tree falls from wind damage in older forests may result in a disturbance regime that is intermediate between that of the most recently cut, very young forests and medium-aged forests, which are less vulner- able to wind damage than older forests. Finally, time since disturbance, disturbance magnitude, and structure may influence plant communities because of plant- specific differences in life span and shade tolerance. Manuscript received 31 March 2005; revised 31 August 2005; accepted 21 September 2005. Corresponding Editor: M. P. Ayres. 1 E-mail: [email protected] 2 Present address: Department of Biology, University of South Florida, 4202 East Fowler Avenue, SCA 110, Tampa, Florida 33620 USA. 901
Transcript of Forest Age Influences Oak Insect Herbivore Community Structure, Richness, And Density

Ecological Applications, 16(3), 2006, pp. 901–912� 2006 by the Ecological Society of America
FOREST AGE INFLUENCES OAK INSECT HERBIVORE COMMUNITYSTRUCTURE, RICHNESS, AND DENSITY
JUNE M. JEFFRIES,1 ROBERT J. MARQUIS, AND REBECCA E. FORKNER2
Department of Biology, University of Missouri–St. Louis, One University Boulevard, St. Louis, Missouri 63121 USA
Abstract. Plant succession is one of many factors that may affect the composition andstructure of herbivorous insect communities. However, few studies have examined the effect offorest age on the diversity and abundance of insect communities. If forest age influences insectdiversity, then the schedule of timber harvest rotation may have consequent effects onbiodiversity. The insect herbivore community on Quercus alba (white oak) in the MissouriOzarks was sampled in a chronoseries, from recently harvested (2 yr) to old-growth(approximately 313 yr) forests. A total of nine sites and 39 stands within those sites weresampled in May and August 2003. Unique communities of plants and insects were found in theoldest forests (122–313 yr). Density and species richness of herbivores were positivelycorrelated with increasing forest age in August but not in May. August insect density wasnegatively correlated with heat load index; in addition, insect density and richness increasedover the chronoseries, but not on the sunniest slopes. Forest structural diversity (number ofsize classes) was positively correlated with forest age, but woody plant species richness wasnot. In sum, richness, density, and community structure of white oak insect herbivores areinfluenced by variation in forest age, forest structure, relative abundance of plant species, andabiotic conditions. These results suggest that time between harvests of large, long-lived, treespecies such as white oak should be longer than current practice in order to maintain insectcommunity diversity.
Key words: chronoseries; community structure; herbivorous insects; Lepidoptera; Missouri; oak; old-growth forest; Ozarks; Quercus alba; rotation length; succession; time series.
INTRODUCTION
Forests are subject to natural and anthropogenic
disturbances such as fire, wind storms, uprooting and
death of individual trees, and timber harvest (Binkley
1999). Although studies of plant succession following
these forest disturbances are many (e.g., Lorimer 1980,
Hibbs 1983, Reich et al. 1990, Jenkins and Parker 1998,
Larsen and MacDonald 1998), there are relatively few
studies of animal community responses to plant
succession (as noted by Morin 1999). Particularly
lacking are replicated studies of changes in insect
communities with plant succession. Knowledge of such
successional patterns and their underlying causes is
important for understanding the forces driving temporal
changes in the composition of insect communities. In
addition, such knowledge has important implications for
forest management. If insect community composition or
diversity changes with forest age, short rotation lengths
(time between consecutive harvests) may result in the
landscape-level loss of unique communities of plants and
insects.
Changes in plant community characteristics driven by
architecture or disturbance may influence insect herbi-
vore communities, particularly if herbivores specialize
on certain host plant species or on microhabitats
provided by a particular plant growth form. Two
mechanisms, both related to habitat heterogeneity,
suggest that the diversity and abundance of the insect
herbivore communities may increase with forest age.
First, increasing complexity of plant architecture is
associated with higher species diversity of herbivorous
insects (Lawton 1983). Older forests may provide more
stem diameter size classes and thus, more complex
architecture than younger forests. Second, the inter-
mediate disturbance hypothesis predicts that diversity
will peak in habitats with intermediate disturbance levels
(Connell 1978). Some disturbance types, such as wind
damage, may differentially affect older more than
younger forests because the risk of wind damage to a
tree or a stand increases with age (Oliver and Larson
1996). Tree falls from wind damage in older forests may
result in a disturbance regime that is intermediate
between that of the most recently cut, very young
forests and medium-aged forests, which are less vulner-
able to wind damage than older forests. Finally, time
since disturbance, disturbance magnitude, and structure
may influence plant communities because of plant-
specific differences in life span and shade tolerance.
Manuscript received 31 March 2005; revised 31 August 2005;accepted 21 September 2005. Corresponding Editor: M. P.Ayres.
1 E-mail: [email protected] Present address: Department of Biology, University of
South Florida, 4202 East Fowler Avenue, SCA 110, Tampa,Florida 33620 USA.
901

An additional factor that must be taken into accountfor understanding the effects of forest succession oninsect communities are the habitat requirements of theinsect taxa under consideration. Previous studies exam-ining forest age and insect diversity have found disparatepatterns depending on the requirements of the focal taxafor particular habitats and host plants. Heyborne et al.(2003) and Inoue (2003) found higher insect diversity inyounger forests due to relatively large numbers ofspecies specializing on early plant successional stages.Conversely, Grove (2002) and Maeto et al. (2002) founda positive correlation between forest age and beetlediversity, due to the requirements of many specialistspecies for large trees present only in the later stages ofsuccession. Schowalter (1995), who sampled multiplearthropod trophic levels and feeding guilds on Douglas-fir (Pseudotsuga menziesii), found a nonsignificant trendof increasing diversity with forest age.
The objective of the current study was to documentcharacteristics of an herbivorous insect communityassociated with single deciduous host plant species(Quercus alba) over a long time span (300þ yearchronoseries) and to relate them to changes in vegetationstructure.We sampled insects inmultiple stands per forestage, twice during the year and in different microhabitats,allowing us to account for forest age, seasonal effects, andthe contribution of slope aspect to the observed patterns.In addition, we related variation in vegetation composi-tion and structure to variation in insect density andspecies richness. A single previous study (Maeto et al.2002) has related changes in vegetation structure andspecies composition as an explanation for the effects offorest age on changing insect communities.
METHODS
Insect surveys were conducted 5–20 May 2003 and 5
August to 5 September 2003. Insects were sampled at
nine sites ranging in age from two years (recently
harvested, natural regrowth) to approximately 313 years
old in southeastern Missouri, USA (Table 1, Fig. 1; see
Plate 1). The nine sites were selected using existing
dendrochronological data (stands aged .18 yr) and
harvest records (stands aged 2–18 yr) from silvicultur-
alists (Table 1). Slope aspect has been correlated with
differences in vegetation (Shifley et al. 2000), insect
abundance (Marquis and Le Corff 1997), and wind-
throw disturbance (Rebertus and Meier 2001). There-
fore, at least four sampling locations from each site were
chosen so that two were on north- and east-facing slopes
and two were on south- and west-facing slopes.
Sampling locations were separated by topographic
features, such as ridgetops and ravines, while habitat
edges were avoided. At each sampling location, at least
six trees were marked (saplings, branches of larger trees)
and at least 3000 leaves were sampled. The number of
leaves, trees, and sampling locations adequate to assess
insect density and richness was established in a previous
study (Marquis and Le Corff 1997).
The study host plant, white oak (Quercus alba) is a
large, long-lived (Burns and Honkala 1990) and
abundant tree species in this region, ranking highest in
relative density, third highest in relative basal area
(Shifley et al. 2000), and highest of five oak species in
leaf-chewing insect richness (R. Marquis, unpublished
manuscript). White oak is an intermediately shade-
tolerant tree species present through all stages of Ozarkforest succession. It can resprout from stumps after
disturbance, persist for up to 90 years in the understory
until release by formation of a canopy gap, and often is
a dominant canopy tree (Burns and Honkala 1990).
The more than 260 species of leaf-chewing insect
herbivores (primarily larval micro-lepidoptera, but also
Orthoptera, Coleoptera, larval Hymenoptera, and phas-
TABLE 1. Site information.
Site Abbreviation Description Latitude north Longitude west
1 BS Big Spring Natural Area, Ozark National Scenic Riverway 36856038 00 90859034 00
2 CRNA Current River Natural Area, Pioneer Forest 37815013 00 9181604 00
3 D120 Mark Twain National Forest, Doniphan/ElevenPoint Ranger District, Compartment 120
3684906 00 9184056 00
4 DRE7 Current River Conservation Area, Paint RockState Forest, Missouri Ozark Forest EcosystemProject, Site 5
37810041 00 9181058 00
5 DR Current River Conservation Area, DeerRun/Paint Rock State Forest, Missouri OzarkForest Ecosystem Project, Sites 5 and 6
3781009 00 9181054 00
6 P9 Mark Twain National Forest, Potosi RangerDistrict, Compartment 9
37859046 00 9183027 00
7 P13 Mark Twain National Forest, Potosi RangerDistrict, Compartment 13
37859041 00 90857032 00
8 P40 Mark Twain National Forest, Potosi RangerDistrict, Compartment 40
37857014 00 9183019 00
9 SBSP Sam Baker State Park, Mudlick MountainNatural Area
37816029 00 90831025 00
� Estimated age of sampled stands.� Source of age estimate.
JUNE M. JEFFRIES ET AL.902 Ecological ApplicationsVol. 16, No. 3

mids) on white oak in Missouri can be identified in situ
because researchers have collected, identified, photo-
graphed, and reared them for over a decade (Marquis et
al. 2006; see Plate 1). Leaf-chewing insects unidentified in
the field were individually collected and reared in the lab.
During daylight hours, each sapling or tree, the trunk,
associated twigs and branches, and both sides of leaves
between ground level and 2.5 m above ground were
visually examined. The identity and abundance of all
leaf-chewing insects encountered were recorded. Begin-
ning at the base of a selected tree, inspection continued
upward 2.5 m until all leaves were examined, or until at
TABLE 1. Extended.
Age� (yr) Source� Forest size (ha) No. stands sampled
122 unpublished tree core data; S. Shifley,personal communication
142 4
313 unpublished tree core data; R. Guyette,personal communication
4 4
18 harvest records, Mark Twain National Forest 64 4
7 harvest records, Missouri Department of Conservation 10 2
49–79 unpublished tree core data; J. Kabrick,personal communication
51 9
111 tree core data, Mark Twain National Forest 59 4
101 tree core data, Mark Twain National Forest 75 4
2 harvest records, Mark Twain National Forest 62 4
223 natural area nomination report (1980), MissouriDepartment of Natural Resources
283 4
FIG. 1. Study site locations, Missouri, USA. See Table 1 for site coordinates and descriptions.
June 2006 903OAK INSECT HERBIVORE FOREST CHRONOSERIES

least 600 leaves per tree were sampled. The southernmost
sites were sampled before the northern sites for each
sampling period. During the second sampling period, all
leaves sampled were tallied by tree. The same trees were
examined for each sampling period, except for one
location at the site Potosi 9 (P91), where a new location
was selected because of nearby timber harvest activity.
A vegetation survey for the forest stand surrounding
each insect sampling location was conducted 2–29 June
2003. Stem basal area per unit land area was estimated
by tree species and by size class using the point-sample
Bitterlich method, applied with a 10 basal area factor
wedge prism (Husch et al. 1982, Hebert et al. 1988).
Slope aspect was determined using a compass, and
TABLE 2. Herbivore sampling results.
Location�Stand, spatial
group�
May 2003 August 2003 Estimatedforestage (yr)
Heatloadindex
Leaf areasampled(m2)Density§ Richnessjj Density§ Richnessjj
P40 3, b 2.81 0.72 8.78 0.87 2 0.02 32.00P40 4, b 4.31 0.64 10.80 0.78 2 0.20 34.55P40 ave., low htld # 3.56 0.68 9.79 0.83 2 0.11 33.28P40 2, a 1.73 0.48 5.34 0.70 2 0.65 27.14P40 1, a 2.26 0.48 5.67 0.68 2 0.80 29.26P40 ave., high htld # 1.99 0.48 5.51 0.69 2 0.73 28.20DRE7 DRE36, a 4.77 1.12 3.57 0.77 7 0.01 9.85DRE7 DRE45, a 4.74 0.85 3.15 0.95 7 0.99 10.55D120 4, b 3.73 0.98 6.79 1.19 18 0.03 19.31D120 2, a 3.09 3.09 5.10 0.82 18 0.07 21.98D120 1, a 7.25 1.36 7.31 0.96 18 0.34 17.66D120 3, b 3.99 1.20 5.10 0.96 18 0.53 20.78D120 ave., low htld # 4.52 1.09 6.08 0.98 18 0.24 19.93DR DRE31, b 7.05 1.42 8.20 1.43 49 0.00 16.17DR DRC30, a 11.09 2.67 2.79 0.48 65 0.07 9.38DR DRC23, a 10.97 1.83 4.22 1.01 71 0.60 13.13DR DRC6, b 9.50 2.15 2.44 0.95 74 0.11 8.85DR DRC14, a 12.73 3.02 3.03 0.95 79 0.20 6.29DR ave., low htld # 10.27 2.22 4.14 0.96 68 0.19 10.76DR DRE27, b 8.02 1.58 5.76 1.60 59 0.76 15.20DR DRC50, a 6.52 1.12 4.93 1.13 60 0.89 15.19DR DRE43, b 5.13 1.28 4.63 1.25 65 0.76 10.14DR DRC61, b 6.60 2.71 2.50 0.77 71 1.00 5.91DR ave., high htld # 6.57 1.67 4.46 1.19 64 0.86 11.61P13 3, a 2.47 0.85 5.36 1.20 101 0.11 25.91P13 1, a 2.39 0.65 5.96 1.01 101 0.19 30.55P13 ave., low htld # 2.43 0.75 5.66 1.11 101 0.15 28.23P13 4, b 2.32 0.76 5.59 0.96 101 0.77 30.23P13 2, b 2.46 0.64 6.37 1.01 101 0.85 29.69P13 ave., high htld # 2.39 0.70 5.98 0.99 101 0.81 29.96P9 2, a 3.66 1.14 9.25 1.24 111 0.05 21.84P9 3, b 1.78 0.57 5.80 0.96 111 0.12 26.40P9 ave., low htld # 2.72 0.86 7.53 1.08 111 0.09 24.12P9 1, a 5.31 1.29 3.32 0.96 111 0.96 18.65P9 4, b 1.94 0.65 2.16 0.86 111 1.00 23.20P9 ave., high htld # 3.63 0.97 2.74 0.91 111 0.97 20.93BS 4, b 4.30 0.65 5.78 0.61 122 0.30 30.95BS 2, a 4.41 0.73 7.28 0.77 122 0.41 24.71BS 1, a 5.96 0.79 6.66 0.70 122 0.46 31.54BS 3, b 2.60 0.58 4.77 0.61 122 0.51 34.57BS ave., low htld # 4.32 0.69 6.12 0.67 122 0.42 30.44SBSP 1, a 5.76 1.15 8.39 1.47 223 0.04 15.61SBSP 4, a 4.19 1.74 6.79 1.18 223 0.13 12.66SBSP ave., low htld # 4.98 1.45 7.59 1.33 223 0.08 14.14SBSP 3, b 4.26 0.78 4.15 0.88 223 0.84 19.26SBSP 2, b 4.76 1.24 3.62 1.45 223 0.99 9.67SBSP ave., high htld # 4.51 1.01 3.89 1.17 223 0.92 14.46CRNA 4, a 7.43 1.09 9.21 1.39 313 0.00 20.19CRNA 2, b 6.99 1.04 9.96 1.09 313 0.23 20.18CRNA 1, a 6.54 1.37 12.19 1.25 313 0.34 16.82CRNA 3, b 5.73 0.89 9.75 1.08 313 0.54 25.84CRNA ave., low htld # 6.67 1.10 10.28 1.20 313 0.28 20.76
� Location¼ site code (Table 1).� Stand¼ sampling location, shared code¼ spatial group.§ Density¼ no. insects/m2 leaf area sampled.jj Richness¼ no. insect species/m2 leaf area sampled.# htld, heat load.
JUNE M. JEFFRIES ET AL.904 Ecological ApplicationsVol. 16, No. 3

percentage of tree canopy cover was estimated using a
canopy tube (Grabner 2000) at four locations 10 m from
a selected focal tree (one upslope, one downslope, and
two at the same elevation as the focal tree but on
opposite sides). Vegetation of the sites DRE7 and DR
was surveyed between September 2001 and April 2002
(Shifley et al. 2000).
Total leaf area sampled per stand was estimated from
the physical count of sampled leaves for each stand
multiplied by 58.7 cm2, the average understory leaf area
(one side) for Q. alba in the Missouri Ozarks (Le Corff
and Marquis 1999). Three trees from the P40 site,
sampling location 1, were excluded from all analyses
because the leaf counts greatly exceeded the target of 600
leaves per tree. Heat load index (McCune and Keon
2002) was calculated as (1� cos[h� 45])/2, where h is the
slope aspect (degrees east of north). This equation
transforms slope aspect to a number between 0 and 1,
with 0 corresponding to the coolest northeast-facing
slope and 1 to the warmest southwest-facing slope.
Species richness per leaf area sampled was calculated by
summing the total number of oak herbivore species
encountered in the sampling location, and dividing by
the leaf area sampled in that location (Table 2).
Herbivore abundance per leaf area sampled (density)
was calculated from the total number of individual
organisms counted in the sampling location, divided by
the leaf area sampled in that location, and ln transformed
for normality. These variables thus relate to the insect’s
food resource and compensate for variability in total leaf
area sampled per location. Unidentified insects (118
individuals, May sampling period; 39 individuals,
August sampling period) were included in density
measures but were excluded from species richness per
leaf area.
The relationship between leaf area, forest age,
latitude, and slope aspect on the one hand, and
herbivore species richness and herbivore density per leaf
area on the other was tested with multiple regression at
the site level (PROC REG, type II sums of squares [SAS
Institute 2004]), separately for lower heat load index
(0�0.64) stands (slope aspect 0–1518 and 299–3608) and
for higher heat load index (0.65–1) southwest-facing
stands (slope aspect 152–2988). Possible changes in
herbivore community structure with forest age were
analyzed with nonmetric multidimensional scaling
(NMS; Shepard 1962a, b, Kruskal 1964a, b) using PC-
ORD (MjM Software Design, version 4.30, Gleneden
Beach, Oregon, USA). To reduce potential noninde-
pendence of sampling units (stands) but still retain a
sufficient sample size to conduct ordinations, nearest
stands within a site were combined into one or two
groups (spatial groups), and their values averaged. This
resulted in 17 sample units total for all ordinations. The
within-site distance between centroids of spatial groups
was 587 6 340 m (mean 6 SE, n ¼ 8). Neighboring
stands that were averaged to form spatial groups share
the same letter following the comma after the stand
designation in Table 2. Insect ordinations were per-
formed separately for May and August herbivore
communities, using the Sørensen distance measure and
herbivore density for each species, relativized by the
maximum average density in each sample unit, to allow
comparison among sample units. Rare species were
excluded to prevent disproportionate effects on results.
As a result, only those species comprising the top 95% of
all individuals for each sampling period were included.
Vegetation data also were analyzed with NMS, using
the Sørensen distance measure and the basal stem area
per unit land area for each plant species, relativized by the
maximum average density in each sample unit, to allow
comparison among sample units. To include differences
in the architecture of the forests, the community was
subdivided into size classes (3.8–11.4, 11.4–17.8, and
continuing in 10.2-cm increments to 99.1 cm dbh), such
that the community matrix consisted of the basal stem
area per unit land area covered by each species–size-class
combination. Rare species–size-class combinations were
excluded, leaving only those combinations that appeared
in four or more stands. This analysis was repeated for
plant species alone, and for size class alone.
After excluding outlier sample units, optimum dimen-
sionality for plant and insect ordinations was deter-
mined through an automated search mode using a
random starting configuration, 40 runs with real data,
and 50 runs with randomized data. The range of final
stress values for all ordinations was 8.8–13.7, stable
solutions (instability ,0.00001) were found after 74–110
iterations, and a final solution was found in three
dimensions except for the size class ordination where it
was found in two dimensions. Randomization tests
indicated that low final stress values were not due to
chance alone (P ¼ 0.02).
Differences among forest age groups (2–18 yr, 49–111
yr, 122–313 yr) in insect and plant communities were
tested with multiresponse permutation procedures
(MRPP; Mielke 1984, Mielke and Berry 2001) using
PC-ORD and Sørensen’s distance measure. The step-up
Bonferroni procedure (Hochberg 1988) was applied to
correct the criteria P value for multiple pairwise
comparisons. Insect and plant NMS axes were rotated
with respect to forest age, and scores were tested for
correlation using multiple regression.
RESULTS
The number of stem diameter size classes present in
each site, a measure of structural heterogeneity, in-
creased with forest age (Fig. 2A). Forest age did not
explain variation in the number of plant species (49 total
sampled) or species–size-class combinations (P . 0.6, r2
, 0.04). Basal area of stems taller than 1.4 m (Fig. 2B)
increased with forest age, then declined after approx-
imately 200 years. Canopy cover (Fig. 2C) increased
sharply in the first 2–18 yr of the chronoseries and
changed little thereafter. All three forest age groups had
significantly (P , 0.0001) dissimilar vegetation com-
June 2006 905OAK INSECT HERBIVORE FOREST CHRONOSERIES

munities by size class (Fig. 3A) and by combined
species–size-class abundance (Table 3). Considering
plant species alone, old and young forests were margin-
ally different, while old forests were not significantly
different from medium-aged forests (Fig. 3B, Table 3).
Old forests were different because of the presence of
shade-tolerant (Acer saccharum, Cercis canadensis) and
shade intolerant (Fraxinus americana, Carya tomentosa)
tree species, while young sites were different because of
the influence of shade-tolerant (Morus rubra), shade-
intolerant (Juglans nigra, Pinus echinata, Rhamnus
caroliniana), and intermediately shade-tolerant species
(Celtis occidentalis) (Burns and Honkala 1990).
Although the distribution of Q. alba among size classes
was uneven among sites, with large diameter Q. alba
weighting older forests (not shown), no age group was
weighted by Q. alba when considering plant species
alone (Fig. 3B), suggesting similar abundance by basal
stem area in all forest age groups.
The total number of herbivore individuals encoun-
tered in May was 3216, comprising 79 species; 5007
individuals were recorded in August with 70 species; and
126 species were encountered overall. May insect density
correlated negatively with latitude of census site (Tables
4 and 5) for high but not for low heat load index stands.
Aside from leaf area sampled, no additional variables
FIG. 3. Nonmetric multidimensional scaling (NMS) scoresfor vegetation. (A) Ten vegetation size classes of plants tallerthan 1.4 m, 17 sample units, including size classes occurring infour or more stands. The coefficient of determination for axes 1and 2 has r2 ¼ 0.91. Differences among age groups aresignificant (P ¼ 0.0002). Vegetation size classes weighting thestand groups are listed. (B) Twenty-seven plant species (of 49encountered), 17 sample units, including species occurring infour or more stands. The coefficient of determination for axes 2and 3 was r2 ¼ 0.72. Plant species weighting the stand agegroups are listed.
FIG. 2. The effect of forest age on (A) number of sizeclasses, (B) stem basal area/ha, and (C) tree canopy cover.
JUNE M. JEFFRIES ET AL.906 Ecological ApplicationsVol. 16, No. 3

were significant predictors of May insect species richness
or density. After accounting for variation in leaf area
sampled, August herbivore species richness and density
correlated positively with forest age (Fig. 4A and B,
Tables 4 and 5), and August herbivore density correlated
negatively with heat load index for high heat load index
sites (Fig. 4C, Tables 4 and 5).
The herbivore communities differed by forest age
groups for May (Fig. 5A) and August (Fig. 5B, Table 3).
After rotating NMS scores with respect to forest age,
insect and plant scores were correlated, with plant
species and size class scores explaining 22–62% of the
variation in May and August insect community struc-
ture (P¼ 0.07 maximum, Tables 6 and 7). Plant species
and plant size class scores were also significantly
correlated with each other (Tables 6 and 7).
DISCUSSION
Increasing forest age resulted in higher density and
species richness of white oak herbivores for low heat
load index stands in the August 2003 census. Previously,
Marquis and Le Corff (1997) and Marquis et al. (2000)
had found similar results for insect communities on Q.
alba and Q. velutina in medium-aged forests that varied
by 25 years in age. The results of the current study
extend these earlier findings to both older and younger
forests. Similar results have been found in two other
systems: insect species richness and abundance positively
correlated with forest age for saproxylic beetles in
Australian tropical rainforest (Grove 2002) and long-
icorn beetles in Japanese temperate forests (Maeto et al.
2002). However, these insects have specific habitat
requirements better fulfilled by forests with very large
trees, as compared to the present study of oak
herbivores, in which the host plant was abundant in all
stands sampled. Schowalter (1995) found slightly higher
diversity of temperate conifer canopy arthropods with
increasing forest age of non-plantation Douglas-fir
forests from 150 years to 400 years old, although the
trend was not significant.
The positive correlation of insect species richness with
forest age is consistent with two related hypotheses: (1)
increasing complexity of plant architecture with forest
age (Lawton 1983) and (2) changing disturbance regimes
with forest age (Connell 1978). First, forest age groups
differed significantly in plant architecture as indicated by
the ordination of tree size classes and the positive
correlation of number of size classes with forest age.
Specifically, oldest forests were less dense (stem basal
area/ha) than medium-aged forests and contained
structural components (two classes of the largest
diameter trees) not present in medium-aged forests.
The heterogeneous architecture present in older forests
may positively influence insect herbivore richness, as
there is a well-established relationship between plant
architecture and insect herbivore diversity (Strong et al.
1984 and references therein).
Second, the intermediate disturbance hypothesis
(Connell 1978) proposes that ecosystems at equilibrium
are less diverse than those of intermediate age, while
recently highly disturbed ecosystems have lower species
richness because few species have accumulated in the
short time available for colonization. The plant and
insect communities in the young forests of this study are
recovering from recent timber harvest (clear-cutting),
TABLE 3. Multi-response permutation procedures (MRPP) results based on Sørensen distances for herbivore and vegetationcommunities.
Community
Group, by forest age
Old vs. medium Old vs. young Medium vs. young All groups
T A P T A P T A P T A P
Herbivores
May �1.68 0.039 0.063� �2.98 0.078 0.010* �2.05 0.051 0.036� �3.48 0.071 0.002*August �3.12 0.070 0.005* �2.73 0.071 0.011* �1.52 0.032 0.075� �3.60 0.072 0.001*
Vegetation
Species–size class �2.9 0.048 0.006* �4.09 0.066 0.0006* �2.35 0.044 0.016* �4.73 0.067 ,0.0001*Species only �1.72 0.035 0.058 �2.45 0.055 0.019� �0.12 0.004 0.376 �2.01 0.041 0.037*Size class only �4.11 0.135 0.003* �4.13 0.155 0.003* �4.34 0.174 0.003* �6.41 0.192 ,0.0001*
Notes: Key for column headings: T, separation test statistic; A, chance-corrected within group agreement.* Statistically significant at a ¼ 0.05; � Statistically significant at a ¼ 0.10 (multiple comparisons were evaluated by Hochberg
[1988] step-up Bonferroni correction).
TABLE 4. Multiple regression models for herbivore speciesrichness and density.
Model r2 P
Low heat load index stands, by site, n ¼ 9
Richness August 2003 ¼ 0.85 þ 0.001(age) 0.45 0.048ln(density Aug 2003) ¼1.04 þ 0.03(lfm2) þ 0.002(age) 0.66 0.040
High heat load index stands, by site, n ¼ 6
ln(density May 2003)¼ 8.44 � 0.04(lfm2) � 0.17(lat) 0.91 0.032
ln(density Aug 2003) ¼ 3.91 � 2.85(htld) 0.83 0.011
Note: Abbreviations are: Age, forest age; lfm2, total leaf areasampled; htld, heat load; lat, latitude.
June 2006 907OAK INSECT HERBIVORE FOREST CHRONOSERIES

TABLE 5. Multiple regression partial r2 and P values for herbivore species richness and density.
Variable
Low heat load index stands, by site High heat load index stands, by site
August 2003 richness August 2003 density May 2003 density August 2003 density
r2 P r2 P r2 P r2 P
Total leaf area sampled NS 0.61 0.038 0.75 0.096 NS
Forest age 0.45 0.048 0.15 0.064 NS NS
Heat load index NS NS NS 0.83 0.011Latitude NS NS 0.19 0.004 NS
Note: NS, not significant (not included in model).
FIG. 4. Significant multiple regression variables in theAugust 2003 herbivore census: (A) species richness of herbiv-orous insects increases with forest age for low heat load indexstands; (B) density of herbivorous insects increases with forestage for low heat load stands, after controlling for total leaf area;(C) density of herbivorous insects decreases with heat loadindex (heat load index: 0 ¼ most shaded northeast aspect, 1 ¼sunniest southwest aspect) for high heat load index stands.
FIG. 5. Nonmetric multidimensional scaling (NMS) scoresfor insects. (A) Thirty-two May herbivore species (of 70 Mayspecies), 17 sample units. The coefficient of determination foraxes 1 and 3 has r2¼0.58. Herbivore species weighting the standgroups are listed. (B) Twenty-six August herbivore species (of79 August species), 16 sample units (one outlier, SBSPb, wasremoved). The coefficient of determination for axes 2 and 3 wasr2¼ 0.59. Herbivore species weighting the stand age groups arelisted.
JUNE M. JEFFRIES ET AL.908 Ecological ApplicationsVol. 16, No. 3

and might be expected to have lower oak herbivore
species richness. As the forest ages, colonizers arrive,
and richness increases. Comparison of disturbance
regimes of medium-age (49–111 yr) and older (122–313
yr) forests could lead to two outcomes for insect species
richness. If the original timber harvest is the only
important disturbance, then older forests would be
expected to have lower richness than medium-aged
forests because more time has elapsed since the
disturbance, promoting equilibrium through interac-
tions such as competition, where the best competitors
may eventually fill the available niche space. However, if
smaller, patchy disturbances (Pickett 1976), such as fire,
treefalls, or insect outbreaks occur more frequently in
older than in medium-aged forests, then higher species
richness could be supported in older forests. These older
forests would consist of an array of microhabitats that
vary in structural complexity and disturbances that
prevent competitive exclusion.
A disturbance that might differentially affect old and
medium-aged forests is damage from wind. The oldest
trees offer more resistance to wind because of their large
crowns, resulting in higher risk of wind damage to a tree
or a stand with increasing age (Oliver and Larson 1996).
And when wind damage does occur, treefalls in northern
hardwood old-growth forests generate gap areas over
four times larger than those created by treefalls in
medium-aged forests (Dahir and Lorimer 1996). Fur-
thermore, slope aspect patterns of windthrow may
interact with increasing forest age. In a study of
medium-aged (50–100-yr-old) Ozark forests, Rebertus
and Meier (2001) found treefall gaps unevenly distrib-
uted with respect to slope aspect, with fewer on south-
facing slopes than on others. In the present study, total
basal stem area declined after approximately 200 years
(Fig. 2B) suggesting that tree mortality is present in the
old-growth sites, which could result in patchy distur-
bances. Thus, if wind-induced treefalls in older forests
represent an intermediate disturbance regime, then old
forests could be expected to have higher insect diversity
than both younger and medium-aged forests.
It is difficult to determine the relative contribution of
the architecture and disturbance hypotheses considered
here. This is due in part to the fact that the variety of
structures, both large and small, available in the oldest
forests is due to the presence of the large size, long-lived
trees as well as small trees in gaps generated by windfall
of canopy trees. Plant species composition and forest
architecture change with forest age, and the two
contribute approximately equally to differences in insect
community structure (Tables 6 and 7). Other potential
mechanisms for the observed patterns of diversity and
abundance might include gap and predator dynamics,
and changes in plant chemistry with forest age, which
represent avenues for future research.
There was a significant, positive correlation between
forest age and insect density but only in August on
slopes with low heat load indices (Tables 4 and 5).
Maeto et al. (2002) tested the effect of slope aspect on
species richness, and found no slope effect, but the
TABLE 6. Multiple regression models for plant and herbivoreNMS scores, after rotating axes with respect to forest age.
Model r2 P
May herbivores axis 1¼ �0.08 þ 0.54(vegsize1) 0.34 0.018
May herbivores axis 2¼ �0.08 � 0.28(vegsize2) 0.22 0.070
May herbivores axis 3¼ 0.02 � 0.49(vegspp1) þ 0.42(vegspp3) 0.62 0.002
Aug herbivores axis 1¼ �0.04 þ 0.87(vegspp1) 0.51 0.002
Aug herbivores axis 2¼ �0.006 þ 0.42(vegsize2) 0.30 0.0275
Aug herbivores axis 3¼ �0.01 � 0.48(vegspp3) 0.40 0.009
Veg size axis 1¼ 0.0005 þ 0.94(vegspp2) � 0.47(vegspp3) 0.62 0.002
Veg size axis 2¼ 0.0003 � 0.63(vegspp3) 0.37 0.013
Note: The variable vegspp2 (axis 2 for plant speciescomposition) was not significantly correlated with insect scores,but was correlated with vegsize variables (vegetation size classcategories).
TABLE 7. Multiple regression partial r2 and P values for plant and herbivore NMS scores, after rotating axes with respect to forestage.
Variable
Vegetation species Vegetation size class
Axis 1 Axis 2 Axis 3 Axis 1 Axis 2
r2 P r2 P r2 P r2 P r2 P
May herbivores axis 1 NS NS NS 0.34 0.018 NS
May herbivores axis 2 NS NS NS NS 0.22 0.07May herbivores axis 3 0.21 0.02 NS 0.31 0.01 NS NS
August herbivores axis 1 0.51 0.02 NS NS NS NS
August herbivores axis 2 NS NS NS NS 0.30 0.028August herbivores axis 3 NS NS 0.40 0.01 NS NS
Veg size axis 1 NS 0.46 0.002 0.25 0.01Veg size axis 2 NS NS 0.37 0.01
Note: NS, not significant, P . 0.05.
June 2006 909OAK INSECT HERBIVORE FOREST CHRONOSERIES
wood- and bark-feeding insects they studied may have
been better protected from heat stress than the more
exposed leaf-chewing insects of the present study.
Marquis and Le Corff (1997) showed that slope aspect
affects oak herbivore insect abundance in Ozark forests,
with fewer insects on sunny south- and west-facing
slopes than on shaded north- and east-facing slopes. The
current study confirms that result, with declining
abundance (Tables 4 and 5, Fig. 4C) correlated with
increasing heat load index (sunny slopes). Abiotic
conditions can influence herbivore survival directly
through stressful temperatures and humidity. Herbivore
sensitivity to abiotic conditions is demonstrated by the
relatively low densities of insects on sunny slopes in
August but not in May when temperatures would be
cooler (Tables 4 and 5). The structure of the oldest
forests may ameliorate stressful abiotic conditions by
offering stable microclimates that favor herbivore
success, compared to younger forests. Chen et al.
(1995) found microclimatic gradients from clear-cut
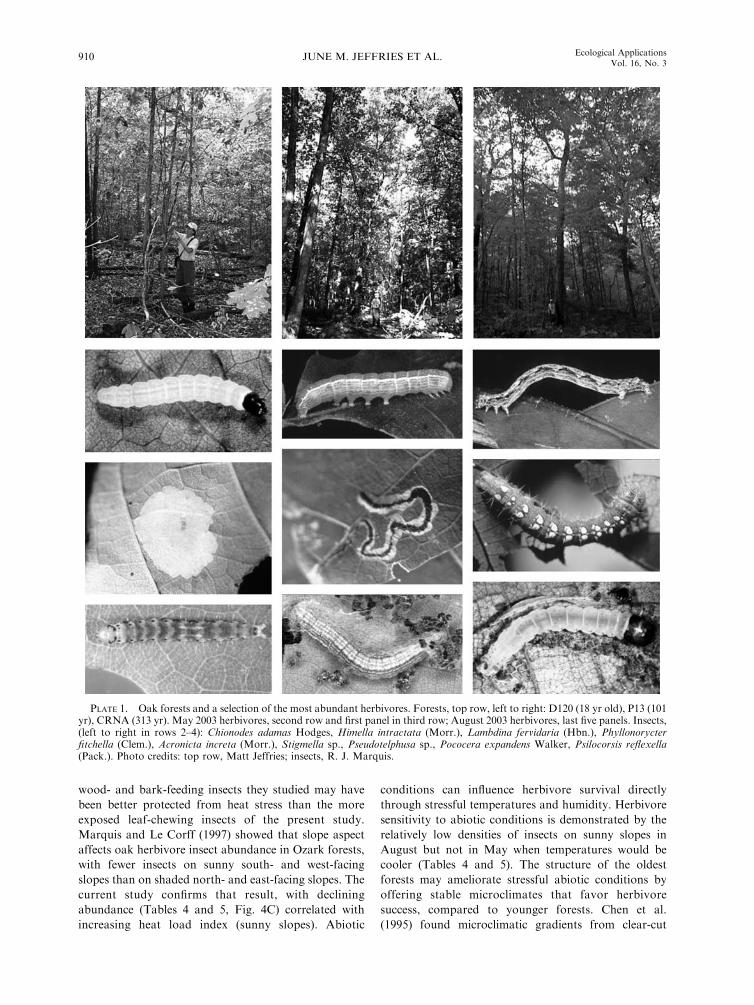
PLATE 1. Oak forests and a selection of the most abundant herbivores. Forests, top row, left to right: D120 (18 yr old), P13 (101yr), CRNA (313 yr). May 2003 herbivores, second row and first panel in third row; August 2003 herbivores, last five panels. Insects,(left to right in rows 2–4): Chionodes adamas Hodges, Himella intractata (Morr.), Lambdina fervidaria (Hbn.), Phyllonorycterfitchella (Clem.), Acronicta increta (Morr.), Stigmella sp., Pseudotelphusa sp., Pococera expandens Walker, Psilocorsis reflexella(Pack.). Photo credits: top row, Matt Jeffries; insects, R. J. Marquis.
JUNE M. JEFFRIES ET AL.910 Ecological ApplicationsVol. 16, No. 3

edges into old-growth Douglas-fir forests, with more
stable conditions within the old-growth forest than in
the clear-cut edges. Differences in microclimate among
forests could be important late in the season when
herbivores may experience stress from high temper-
atures, compared to milder early season conditions.
Variation in temperature and relative humidity can
affect oviposition and egg development of insect
herbivores (Tisdale and Wagner 1990), which may affect
their abundance. Insects also could be affected indirectly
through changes in plant quality. Jacquart et al. (1992)
found increasing plant water stress at edges of an old-
growth deciduous forest, while declining leaf quality
over the season (Feeny 1970, Forkner et al. 2004) and on
sunny slopes (Forkner and Marquis 2004) represents a
biotic gradient to oak herbivore insects. How this biotic
gradient relates to forest age was not determined, but
could contribute to the overall seasonal patterns of
species richness and density found here.
The results of this study have implications for timing
between timber harvests and for conservation planning.
Adequate conservation of the insect fauna in forests of
long-lived trees such as white oak may require longer
time periods between timber harvests at the same
location (extended rotation time) for some portion of
the total forested landscape than is prescribed by current
silvicultural practice. Rotation times are partially based
on maximizing the economic gains from timber harvest
(Smith 1996) by limiting timber losses due to age and
accident. Current practice in Ozark forests is to harvest
every 80–100 years (Brookshire et al. 1997). The present
study indicates that oak herbivore species richness and
density continue to increase for 200 years beyond the
current rotation period, and that unique communities
exist in older forests (122–313 yr) compared to medium-
aged (49–111 yr) and young (2–18 yr) forests. The same
is true for salamander density in this system (Herbeck
and Larsen 1999). However, modern harvest practices
differ greatly from those used when medium-aged
forests were last cut (Guyette and Larsen 2000): instead
of entire landscapes being harvested, now smaller areas
are cut at any one time. These harvest techniques leave a
forest mosaic of differing ages, which may positively
influence the recovery rate of recently harvested forests.
The evidence presented here suggests that the highest
levels of insect richness and density, along with unique
assemblages of plants and oak herbivore insects, occur
in older forests. If so, core areas of old growth, with
attention given to site-specific slope aspects, should be
preserved within this mosaic in order to maintain the
biodiversity of the system.
ACKNOWLEDGMENTS
We thank R. Jensen for assistance in planning and carryingout this project, and the agencies and personnel at each of theresearch sites for their cooperation and assistance: PioneerForest, Missouri Department of Natural Resources, NationalPark Service, Mark Twain National Forest, and the MissouriDepartment of Conservation. S. Shifley and J. Kabrick
provided advice and assistance in planning this project. Wethank the following for help in the field: K. Knox, A. Loayza,N. Moorehouse, L. Lihou, J. Floyd, L. Hirst, M. Jeffries, T.Boshart, and B. Baker. This manuscript was improved withcomments and suggestions by A. Ması́s, R. Rı́os, K. Boege, B.Baker, L. Abdala, P. Van Zandt, N. Barber, M. Ogburn, H.Dutra, R. Ricklefs, P. Stevens, and T. Knight. This work wassupported in part by USDA Cooperative Lands, Preventionand Suppression Grant 02 DG 1124225 430, and the MissouriDepartment of Conservation.
LITERATURE CITED
Binkley, D. 1999. Disturbance in temperate forests of thenorthern hemisphere. Pages 453–466 in L. Walker, editor.Ecosystems of the world 16, ecosystems of disturbed ground.Elsevier Science, New York, New York, USA.
Brookshire, B., R. Jensen, and D. Dey. 1997. The MissouriOzark forest ecosystem project: past, present, and future.Pages 1–25 in B. Brookshire and S. Shifley, editors.Proceedings of the Missouri Ozark Forest Ecosystem Projectsymposium, GTR NC-193. U.S. Dept. of Agriculture, ForestService, North Central Forest Experiment Station, St. Paul,Minnesota, USA.
Burns, R., and B. Honkala. 1990. Silvics of North America.Volume 2. Hardwoods. Agricultural Handbook 654. U.S.Department of Agriculture, Forest Service, Washington,D.C., USA.
Chen, J., J. F. Franklin, and T. A. Spies. 1995. Growing-seasonmicroclimatic gradients from clearcut edges into old-growthDouglas-fir forests. Ecological Applications 5:74–86.
Connell, J. H. 1978. Diversity in tropical rain forests and coralreefs. Science 199:1302–1309.
Dahir, S. E., and C. G. Lorimer. 1996. Variation in canopy gapformation among developmental stages of northern hardwoodstands. Canadian Journal of Forest Research 26:1875–1892.
Feeny, P. 1970. Seasonal changes in oak leaf tannins andnutrients as a cause of spring feeding by winter mothcaterpillars. Ecology 51:565–581.
Forkner, R. E., and R. J. Marquis. 2004. Uneven-aged andeven aged logging alter foliar phenolics of oak treesremaining in forested habitat matrix. Forest Ecology andManagement 199:21–37.
Forkner, R. E., R. J. Marquis, and J. T. Lill. 2004. Feenyrevisited: condensed tannins as anti-herbivore defences inleaf-chewing herbivore communities of Quercus. EcologicalEntomology 29:174–187.
Grabner, J. 2000. Ground layer vegetation in the MissouriOzark forest ecosystem project: pre-treatment species com-position, richness, and diversity. Pages 107–123 in B.Brookshire and S. Shifley, editors. Missouri Ozark forestecosystem project: the landscape experiment. GTR NC-208.U.S. Department of Agriculture, Forest Service, NorthCentral Forest Experiment Station St. Paul, Minnesota, USA.
Grove, S. J. 2002. The influence of forest management historyon the integrity of the saproxylic beetle fauna in anAustralian lowland tropical rainforest. Biological Conserva-tion 104:149–171.
Guyette, R., and D. Larsen. 2000. A history of anthropogenicand natural disturbances in the area of the Missouri Ozarkforest ecosystem project. Pages 19–40 in B. Brookshire and S.Shifley, editors. Missouri Ozark forest ecosystem project: thelandscape experiment. GTR NC-208. U.S. Department ofAgriculture, Forest Service, North Central Forest Experi-ment Station St. Paul, Minnesota, USA.
Hebert, T. J., J. Rondeux, and C. Laurent. 1988. Comparisonbetween three types of sampling units in beech stands.Annales des Sciences Forestieres (Paris) 45:209–222.
Herbeck, L. A., and D. R. Larsen. 1999. Plethodontidsalamander response to silvicultural practices in MissouriOzark forests. Conservation Biology 13:623–632.
June 2006 911OAK INSECT HERBIVORE FOREST CHRONOSERIES

Heyborne, W. H., J. C. Miller, and G. L. Parsons. 2003.Ground dwelling beetles and forest vegetation change over a17-year period, in western Oregon, USA. Forest Ecology andManagement 179:123–134.
Hibbs, D. 1983. Forty years of succession in central NewEngland. Ecology 64:1394–1401.
Hochberg, Y. 1988. A sharper Bonferroni procedure formultiple tests of significance. Biometrika 75:800–802.
Husch, B., C. Miller, and T. Beers. 1982. Forest mensuration.Wiley and Sons, New York, New York, USA.
Inoue, T. 2003. Chronosequential change in a butterflycommunity after clear-cutting of deciduous forests in a cooltemperate region of central Japan. Entomological Science 6:151–163.
Jacquart, E. M., T. V. Armentano, and A. L. Spingarn. 1992.Spatial and temporal tree response to water stress in an old-growth deciduous forest. American Midland Naturalist 127:158–171.
Jenkins, M., and G. Parker. 1998. Composition and diversity ofwoody vegetation in silvicultural openings of southernIndiana forests. Forest Ecology and Management 109:57–74.
Kruskal, J. B. 1964a. Multidimensional scaling by optimizinggoodness of fit to a nonmetric hypothesis. Psychometrika 29:1–27.
Kruskal, J. B. 1964b. Nonmetric multidimensional scaling: anumerical method. Psychometrika 29:115–129.
Larsen, C., and G. MacDonald. 1998. An 840-year record offire and vegetation in a boreal white spruce forest. Ecology79:106–118.
Lawton, J. H. 1983. Plant architecture and the diversity ofphytophagous insects. Annual Review of Entomology 28:23–39.
Le Corff, J., and R. J. Marquis. 1999. Differences betweenunderstorey and canopy in herbivore community composi-tion and leaf quality for two oak species in Missouri.Ecological Entomology 24:46–58.
Lorimer, C. 1980. Age structure and disturbance history of asouthern Appalachian virgin forest. Ecology 61:1169–1184.
Maeto, K., S. Sato, and H. Miyata. 2002. Species diversity oflongicorn beetles in humid warm-temperate forests: theimpact of forest management practices on old-growth forestspecies in southwestern Japan. Biodiversity and Conservation11:1919–1937.
Marquis, R. J., and J. Le Corff. 1997. Estimating pretreatmentvariation in the oak leaf-chewing insect fauna of the MissouriOzark Forest Ecosystem Project (MOFEP). Pages 332–346 inB. Brookshire and S. Shifley, editors. Proceedings of theMissouri Ozark forest ecosystem project symposium. GTRNC-193. U.S. Department of Agriculture, Forest Service,North Central Forest Experiment Station, St. Paul, Minne-sota, USA.
Marquis, R. J., R. E. Forkner, J. Lill, and J. Le Corff. 2000.Impact of timber harvest on species accumulation curves foroak herbivore communities of the Missouri Ozarks. MissouriOzark forest ecosystem project (MOFEP). Pages 183–195 inS. Shifleyand J. Kabrick, editors. Proceedings of the secondMissouri Ozark forest ecosystem project symposium. GTRNC-227. U.S. Department of Agriculture, Forest Service,
North Central Forest Experiment Station, St. Paul, Minne-sota, USA.
Marquis, R. J., S. Passoa, J. Whitfield, J. Le Corff, J. Lill, andR. E. Forkner. 2006. An illustrated guide to the immaturelepidopteran fauna of oaks in Missouri. U.S. Department ofAgriculture, Forest Service, in press.
McCune, B., and D. Keon. 2002. Equations for potentialannual direct incident radiation and heat load. Journal ofVegetation Science 13:603–606.
Mielke, P. W., Jr. 1984. Meteorological applications ofpermutation techniques based on distance functions. Pages813–830 in P. R. Krishnaiah and P. K. Sen, editors.Handbook of statistics. Volume 4. Elsevier Science Publish-ers, New York, New York, USA.
Mielke, P. W., Jr., and K. J. Berry. 2001. Permutation methods:a distance function approach. Springer, New York, NewYork, USA.
Morin, P. 1999. Community ecology. Blackwell Science,Oxford, UK.
Oliver, C. D., and B. C. Larson. 1996. Forest stand dynamics.Wiley, New York, New York, USA.
Pickett, S. T. A. 1976. Succession: an evolutionary interpreta-tion. American Naturalist 110:107–119.
Rebertus, A. J., and A. J. Meier. 2001. Blowdown dynamics inoak–hickory forests of the Missouri Ozarks. Journal of theTorrey Botanical Society 128:362–369.
Reich, P., M. Abrams, D. Ellsworth, E. Kruger, and T. ,T.Tabone. 1990. Fire affects ecophysiology and communitydynamics of central Wisconsin oak forest regeneration.Ecology 71:2179–2190.
SAS Institute. 2004. SAS version 9.0. SAS Institute, Inc., Cary,North Carolina, USA.
Schowalter, T. 1995. Canopy arthropod communities in relationto forest age and alternative harvest practices in westernOregon. Forest Ecology and Management 78:115–125.
Shepard, R. N. 1962a. The analysis of proximities: multidimen-sional scaling with an unknown distance function. I.Psychometrika 27:125–139.
Shepard, R. N. 1962b. The analysis of proximities: multidimen-sional scaling with an unknown distance function. II.Psychometrika 27:219–246.
Shifley, S., L. Roovers, R. Jensen, and D. Larsen. 2000.Composition and structure of woody forest vegetation in theMissouri Ozark forest ecosystem project. Pages 71–106 in B.Brookshire and S. Shifley, editors. Missouri Ozark forestecosystem project: the landscape experiment. GTR NC-208.U.S. Department of Agriculture, Forest Service, NorthCentral Forest Experiment Station, St. Paul,Minnesota,USA.
Smith, D. 1996. The practice of silviculture: applied forestecology. Wiley, New York, New York, USA.
Strong, D. R., J. H. Lawton, and R. Southwood. 1984. Insectson plants, community patterns and mechanisms. HarvardUniversity Press, Cambridge, Massachusetts, USA.
Tisdale, R. A., and M. R. Wagner. 1990. Effects of photoperiod,temperature, and humidity on oviposition and egg developmentof Neodiprion fulviceps (Hymenoptera: Diprionidae) on cutbranches of ponderosa pine. Environmental Entomology 19:456–458.
JUNE M. JEFFRIES ET AL.912 Ecological ApplicationsVol. 16, No. 3