Phylogenetic community structure during succession: Evidence from three Neotropical forest sites
9
Please cite this article in press as: Letcher, S.G., et al., Phylogenetic community structure during succession: Evidence from three Neotropical forest sites. Perspect. Plant Ecol. Evol. Syst. (2011), doi:10.1016/j.ppees.2011.09.005 ARTICLE IN PRESS G Model PPEES-25147; No. of Pages 9 Perspectives in Plant Ecology, Evolution and Systematics xxx (2011) xxx–xxx Contents lists available at SciVerse ScienceDirect Perspectives in Plant Ecology, Evolution and Systematics j o ur nal homepage: www.elsevier.de/ppees Research article Phylogenetic community structure during succession: Evidence from three Neotropical forest sites Susan G. Letcher a,b,∗ , Robin L. Chazdon c , Ana C.S. Andrade d,1 , Frans Bongers e,1 , Michiel van Breugel f,1 , Bryan Finegan g,1 , Susan G. Laurance h,1 , Rita C.G. Mesquita d,1 , Miguel Martínez-Ramos i,1 , G. Bruce Williamson d,j,1 a Department of Environmental Studies, Purchase College, 735 Anderson Hill Road, Purchase, NY 10577, USA b Organization for Tropical Studies, Apartado 676-2050, San Pedro de Montes de Oca, Costa Rica c Department of Ecology and Evolutionary Biology, University of Connecticut, 75 North Eagleville Road, Storrs, CT 06269-3043, USA d Biological Dynamics of Forest Fragments Project, Instituto Nacional de Pesquisas da Amazonia, C.P. 478, Manaus, AM 69011-970, Brazil e Forest Ecology and Forest Management Group, Wageningen University, Centre for Ecosystem Studies, P.O. Box 47, 6700 AA, Wageningen, The Netherlands f Smithsonian Tropical Research Institute, Apartado 2072, Balboa, Panama g División de Investigación y Desarrollo, Centro Agronómico Tropical de Investigación y Ense˜ nanza, Apartado 93-7170, Turrialba, Costa Rica h School of Marine and Tropical Biology, James Cook University, Cairns, QLD 4878, Australia i Centro de Investigaciones en Ecosistemas, Universidad Nacional Autónoma de México, Antigua Carretera a Pátzcuaro No. 8701 Col. Ex-Hacienda de San José de La Huerta, C.P. 58190, Morelia, Michoacán, Mexico j Department of Biological Sciences, Louisiana State University, Baton Rouge, LA 70808, USA a r t i c l e i n f o Article history: Received 11 February 2011 Received in revised form 1 September 2011 Accepted 6 September 2011 Keywords: Angiosperm phylogeny Chronosequence Community assembly Phylogenetic community structure Tropical forest a b s t r a c t The phylogenetic structure of communities can reveal forces shaping community assembly, but the vast majority of work on phylogenetic community structure has been conducted in mature ecosystems. Here, we present an analysis of the phylogenetic structure of three Neotropical rain forest communities under- going succession. In each site, the net relatedness of the community is initially high and consistently declines during succession. This pattern is evident both when comparing plots of different age classes and when comparing stem size classes within each plot: the oldest plots and the youngest stem cohorts, representing the most advanced stages of succession, have the lowest relatedness. Our results suggest that succession leaves a distinct signature in the phylogenetic structure of communities, which may reflect an increasing role of biotic interactions in community assembly during succession. We discuss theoret- ical explanations for the decline in community phylogenetic relatedness during succession, and suggest directions for future study. © 2011 Elsevier GmbH. All rights reserved. Introduction The phylogenetic structure of communities can shed light on community assembly processes (Webb et al., 2002; Cavender-Bares et al., 2009; Vamosi et al., 2009). Despite the focus on patterns of assembly, most studies of community phylogenetic structure have focused on mature ecosystems (Vamosi et al., 2009). An emerging literature (Verdú et al., 2009; Letcher, 2010; Helmus et al., 2010; Norden et al., in press) links community phylogenetic structure to ∗ Corresponding author at: Purchase College, 735 Anderson Hill Road, Purchase, NY 10577, USA. Tel.: +1 914 251 6646; fax: +1 914 251 6635. E-mail address: [email protected] (S.G. Letcher). 1 In alphabetical order. assembly processes in ecological rather than evolutionary time in an effort to understand the mechanisms underlying succession. Examining the phylogenetic structure of communities during succession allows assessment of ecological forces driving succes- sional systems and their relative strengths at different points in the process of assembly. In a pioneering study of phylogenetic com- munity structure, Webb (2000) discussed how the relatedness of species that co-occur in a landscape can reveal the relative strength of the underlying forces that drive community assembly. Phylo- genetic community structure can be assessed by comparing the relatedness of co-occurring species to a null model expectation generated by randomly sampling the regional species pool (Webb, 2000; Webb et al., 2002). A community can show random phylo- genetic structure, in which observed values overlap with the null model expectation; phylogenetic clustering, in which species are more closely related than chance would predict; or phylogenetic 1433-8319/$ – see front matter © 2011 Elsevier GmbH. All rights reserved. doi:10.1016/j.ppees.2011.09.005
Transcript of Phylogenetic community structure during succession: Evidence from three Neotropical forest sites
G
P
R
PN
SMMa
b
c
d
e
f
g
h
i
Mj
a
ARRA
KACCPT
I
ceaflN
N
1d
ARTICLE IN PRESS Model
PEES-25147; No. of Pages 9
Perspectives in Plant Ecology, Evolution and Systematics xxx (2011) xxx– xxx
Contents lists available at SciVerse ScienceDirect
Perspectives in Plant Ecology, Evolution and Systematics
j o ur nal homepage: www.elsev ier .de /ppees
esearch article
hylogenetic community structure during succession: Evidence from threeeotropical forest sites
usan G. Letchera,b,∗, Robin L. Chazdonc, Ana C.S. Andraded,1, Frans Bongerse,1,ichiel van Breugel f,1, Bryan Finegang,1, Susan G. Lauranceh,1, Rita C.G. Mesquitad,1,iguel Martínez-Ramosi,1, G. Bruce Williamsond,j,1
Department of Environmental Studies, Purchase College, 735 Anderson Hill Road, Purchase, NY 10577, USAOrganization for Tropical Studies, Apartado 676-2050, San Pedro de Montes de Oca, Costa RicaDepartment of Ecology and Evolutionary Biology, University of Connecticut, 75 North Eagleville Road, Storrs, CT 06269-3043, USABiological Dynamics of Forest Fragments Project, Instituto Nacional de Pesquisas da Amazonia, C.P. 478, Manaus, AM 69011-970, BrazilForest Ecology and Forest Management Group, Wageningen University, Centre for Ecosystem Studies, P.O. Box 47, 6700 AA, Wageningen, The NetherlandsSmithsonian Tropical Research Institute, Apartado 2072, Balboa, PanamaDivisión de Investigación y Desarrollo, Centro Agronómico Tropical de Investigación y Ensenanza, Apartado 93-7170, Turrialba, Costa RicaSchool of Marine and Tropical Biology, James Cook University, Cairns, QLD 4878, AustraliaCentro de Investigaciones en Ecosistemas, Universidad Nacional Autónoma de México, Antigua Carretera a Pátzcuaro No. 8701 Col. Ex-Hacienda de San José de La Huerta, C.P. 58190,orelia, Michoacán, Mexico
Department of Biological Sciences, Louisiana State University, Baton Rouge, LA 70808, USA
r t i c l e i n f o
rticle history:eceived 11 February 2011eceived in revised form 1 September 2011ccepted 6 September 2011
eywords:ngiosperm phylogeny
a b s t r a c t
The phylogenetic structure of communities can reveal forces shaping community assembly, but the vastmajority of work on phylogenetic community structure has been conducted in mature ecosystems. Here,we present an analysis of the phylogenetic structure of three Neotropical rain forest communities under-going succession. In each site, the net relatedness of the community is initially high and consistentlydeclines during succession. This pattern is evident both when comparing plots of different age classesand when comparing stem size classes within each plot: the oldest plots and the youngest stem cohorts,
hronosequenceommunity assemblyhylogenetic community structureropical forest
representing the most advanced stages of succession, have the lowest relatedness. Our results suggest thatsuccession leaves a distinct signature in the phylogenetic structure of communities, which may reflectan increasing role of biotic interactions in community assembly during succession. We discuss theoret-ical explanations for the decline in community phylogenetic relatedness during succession, and suggestdirections for future study.
© 2011 Elsevier GmbH. All rights reserved.
aa
sspm
ntroduction
The phylogenetic structure of communities can shed light onommunity assembly processes (Webb et al., 2002; Cavender-Barest al., 2009; Vamosi et al., 2009). Despite the focus on patterns ofssembly, most studies of community phylogenetic structure haveocused on mature ecosystems (Vamosi et al., 2009). An emerging
Please cite this article in press as: Letcher, S.G., et al., Phylogenetic commforest sites. Perspect. Plant Ecol. Evol. Syst. (2011), doi:10.1016/j.ppees.201
iterature (Verdú et al., 2009; Letcher, 2010; Helmus et al., 2010;orden et al., in press) links community phylogenetic structure to
∗ Corresponding author at: Purchase College, 735 Anderson Hill Road, Purchase,Y 10577, USA. Tel.: +1 914 251 6646; fax: +1 914 251 6635.
E-mail address: [email protected] (S.G. Letcher).1 In alphabetical order.
sogrg2gmm
433-8319/$ – see front matter © 2011 Elsevier GmbH. All rights reserved.oi:10.1016/j.ppees.2011.09.005
ssembly processes in ecological rather than evolutionary time inn effort to understand the mechanisms underlying succession.
Examining the phylogenetic structure of communities duringuccession allows assessment of ecological forces driving succes-ional systems and their relative strengths at different points in therocess of assembly. In a pioneering study of phylogenetic com-unity structure, Webb (2000) discussed how the relatedness of
pecies that co-occur in a landscape can reveal the relative strengthf the underlying forces that drive community assembly. Phylo-enetic community structure can be assessed by comparing theelatedness of co-occurring species to a null model expectationenerated by randomly sampling the regional species pool (Webb,
unity structure during succession: Evidence from three Neotropical1.09.005
000; Webb et al., 2002). A community can show random phylo-enetic structure, in which observed values overlap with the nullodel expectation; phylogenetic clustering, in which species areore closely related than chance would predict; or phylogenetic
ING Model
P
2 gy, Ev
eee
dt(lCtafisa2dsc
snd2pcsp2sa(mi1tssrsc
eiCbewcntsfcccpt
M
iwM
9tdosws1eoepaop2o
Pandafle1claCpi2stpttto
FoamOa(eb(fvdfif
ptw
ARTICLEPEES-25147; No. of Pages 9
S.G. Letcher et al. / Perspectives in Plant Ecolo
venness (also called phylogenetic overdispersion in some studies,.g. Letcher, 2010), in which species are less closely related thanxpected.
The interpretation of phylogenetic community structureepends on how traits are distributed on the phylogeny. Functionalraits are particularly useful for assessing community structureKraft and Ackerly, 2010). If functional traits are conserved withinineages, as numerous studies suggest (Prinzing et al., 2001;hazdon et al., 2003; Swenson et al., 2007; Kraft and Ackerly, 2010),he phylogenetic structure of communities can be used to inferssembly processes. Phylogenetic clustering suggests that abioticltering is the dominant force governing community assembly: thehared habitat tolerances and preferences of closely related speciesre the strongest force determining species coexistence (Webb,000). Phylogenetic evenness suggests that biotic filtering is theominant force: antagonistic interactions among closely relatedpecies lead to the exclusion of some taxa, leaving a communityomposed of distant relatives (Webb, 2000; Webb et al., 2002).
Tropical forest succession in old fields provides an excellenttudy system for examining the phylogenetic structure of commu-ities during succession, due to the diversity and relatively rapidynamics of young tropical forest stands (Chazdon, 2008; Letcher,010). A century of research, most of it in the last 50 years, hasroduced a general understanding of how this successional pro-ess operates (reviewed in Finegan, 1996; Chazdon, 2008). Early inuccession, open space is colonized by fast-growing, light-woodedioneer species that can tolerate harsh microclimates (Chazdon,008). These species generally produce profuse crops of smalleeds that require high light levels for germination and growth,nd so they fail to establish later in succession except in gapsde Souza and Válio, 2001). Slower-growing, shade-tolerant trees,
ore characteristic of old-growth forests, can establish at any pointn succession but may be subject to dispersal limitation (Finegan,996). These species eventually come to dominate the stand dueo their longevity and their ability to germinate and grow in thehade (Finegan, 1996). Extremely light-demanding and extremelyhade-tolerant species are the ends of a wide gradient of life histo-ies (Poorter et al., 2004). The same angiosperm clades may containpecies positioned in different places on this gradient, althoughonservation of traits implies proximity along the gradient.
Theoretically, habitat filtering should be more important inarly succession, where species that colonize must contend withntense sunlight, desiccation stress, and infertile soils (Holl, 1999;hazdon, 2003, 2008). Later in succession, biotic interactionsecome much more important determinants of colonization andstablishment (Chazdon, 2008). Based on the theoretical frame-ork of Webb et al. (2002), we would expect to see phylogenetic
lustering in early succession, followed by a decrease in commu-ity relatedness as biotic filters increase in importance. Here, weest the hypothesis that community relatedness declines as succes-ion proceeds. We compare the phylogenetic structure of tropicalorest communities undergoing succession at three geographi-ally distinct Neotropical sites in two ways: comparing replicatedhronosequences of plots, and comparing stems of different sizelasses within each plot as a proxy for successional stage in eachlot. We discuss alternative hypotheses and future directions forhe study of phylogenetic community structure during succession.
aterials and methods
Please cite this article in press as: Letcher, S.G., et al., Phylogenetic commforest sites. Perspect. Plant Ecol. Evol. Syst. (2011), doi:10.1016/j.ppees.201
We used chronosequence data from lowland tropical forestsn three sites: Mexico, Costa Rica, and Brazil. Plots in Mexico
ere located in the Marquéz de Comillas and in the adjacentontes Azules Biosphere Reserve, Chiapas, approximately 16◦04′N,
ewtT
PRESSolution and Systematics xxx (2011) xxx– xxx
0◦45′W (Breugel et al., 2007). The mean annual temperature athe site is 23 ◦C and the annual rainfall is ca. 3000 mm, with ary season (<100 mm per month) from February to April. Theriginal vegetation of the area is lowland tropical rain forest andemideciduous forest; forest structure and composition changeith topography and soil. Thus, all plots were established within
ame geo-morphological landscape unit, in rolling hills between15 and 300 m asl with sandy and loam soils. The secondary for-st plots were located on fallow cornfields that had been cut fromld-growth forest, cultivated for 1 year, and abandoned (Breugelt al., 2007). We used chronosequence data collected in 2001, whenlots ranged in age from 2.5 to 19 years (Breugel et al., 2007),nd old-growth forest data from nearby plots (Table S1). In sec-ndary forests, stems ≥1 cm dbh were censused in10 m × 50 mlots; in old-growth forests, stems ≥10 cm dbh were censused in a0 m × 250 m plot, and stems 1–10 cm dbh censused in 40 subplotsf 5 m × 10 m. The data used in this study included 9137 stems.
Costa Rican plots were located in the Sarapiquí region, Herediarovince, at 10◦25′N, 84◦00′W, between 40 and 200 m asl. The meannnual temperature is 26 ◦C and the annual rainfall 3900 mm, witho pronounced dry season (McDade et al., 1994). Soils are volcanic-erived entisols, inceptisols, and ultisols in the USDA classification,nd vary in fertility depending on the age of the underlying lavaows and the amount of alluvial nutrient inputs. The original veg-tation of the area is lowland tropical rain forest (McDade et al.,994). Secondary forest plots were located in areas that had beenut from old-growth forest. Four plots were cut and immediatelyeft fallow; the rest were actively managed as pasture for 4–6 yearsnd subsequently abandoned (Norden et al., 2009; Letcher andhazdon, 2009). We used secondary forest data from 2007, whenlots ranged in age from 13 to 45 years (Table S1), and eight plots
n nearby old-growth forest were censused, two in 2007 and six in008. All plots were 1 ha in size, and trees ≥5 cm dbh were cen-used (Norden et al., 2009). There was a partial overlap betweenhe 1 ha plots surveyed here and the larger stems in 12 of the 30lots, 0.1 ha in size, surveyed by Letcher (2010); we conductedhe analysis both including and excluding these stems to ensurehat the signal observed in the Costa Rican data was not driven byhese stems. The total data set included 17,981 stems; 1249 stemsverlapped with the Letcher (2010) data set.
Plots in Brazil were associated with the Biological Dynamics oforest Fragmentation Project (BDFFP), approximately 80 km northf Manaus, Amazonas (2◦24′S, 54◦54′W), between 90 and 160 msl. The mean annual temperature in the area is 26.7 ◦C and theean annual rainfall 2200 mm, with a dry season from August toctober (Lovejoy and Bierregaard, 1990). Soils in the region arecidic, nutrient-poor xanthic ferralsols in the FAO classificationChauvel et al., 1987). The vegetation is evergreen terra firme for-st. Secondary forest plots had been cut from old-growth forest,urned in some cases, used as pasture for 4–6 years, and abandonedMesquita et al., 2001). We used data from 2007; plot ages rangedrom 11 to 26 years (Table S1). Four old-growth forest plots in theicinity were used for comparison. In the secondary forest plots,iameter thresholds ranged from 1 to 3 cm and plot size rangedrom 500 to 600 m2. The old-growth plots were 1 ha in size, andncluded stems ≥10 cm dbh. In total, 6087 stems were includedrom Brazil.
For each site, we constructed an appropriate regional speciesool consisting of all woody species that were actual or poten-ial colonists to the plots, to the best of our ability. We beganith regional floristic inventories for each of the three sites, and
unity structure during succession: Evidence from three Neotropical1.09.005
xcluded all species that were non-woody, had no range overlapith the latitudinal or elevation range of the study plots, or failed
o reach a large enough diameter to be included in the sampling.he regional species list for Mexico was drawn from Martínez and
IN PRESSG Model
P
gy, Evolution and Systematics xxx (2011) xxx– xxx 3
B(clav≥sR
yadccaes
mtitWtfepddPiat
2slsdiwoe
gsdHilpia
s1enrNeswb
OG30-4520-2911-192.5-9
Forest age
NR
I
-2
-1
0
1
2
3 MexicoCosta RicaBrazil
xxxxx
A
A
B
a
ab
bab
a'
b'
b'
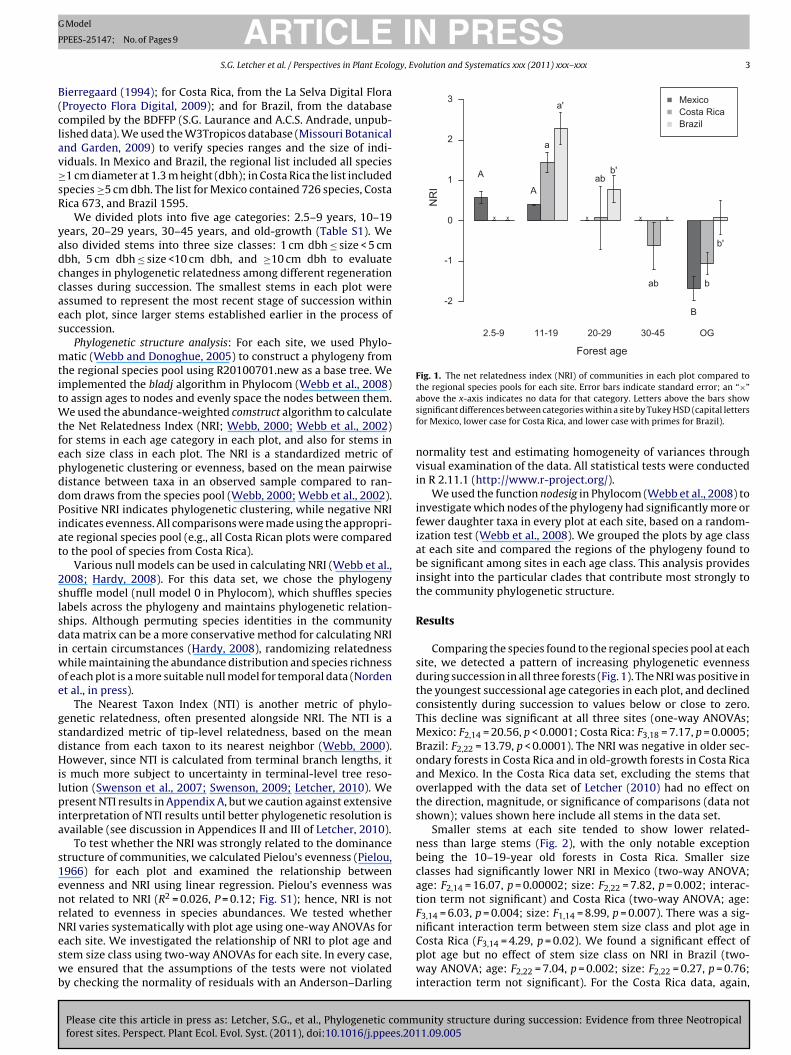
Fig. 1. The net relatedness index (NRI) of communities in each plot compared tothe regional species pools for each site. Error bars indicate standard error; an “×”asf
nvi
ifiabit
R
sdtcTMBoaots
nbcatFn
ARTICLEPEES-25147; No. of Pages 9
S.G. Letcher et al. / Perspectives in Plant Ecolo
ierregaard (1994); for Costa Rica, from the La Selva Digital FloraProyecto Flora Digital, 2009); and for Brazil, from the databaseompiled by the BDFFP (S.G. Laurance and A.C.S. Andrade, unpub-ished data). We used the W3Tropicos database (Missouri Botanicalnd Garden, 2009) to verify species ranges and the size of indi-iduals. In Mexico and Brazil, the regional list included all species1 cm diameter at 1.3 m height (dbh); in Costa Rica the list included
pecies ≥5 cm dbh. The list for Mexico contained 726 species, Costaica 673, and Brazil 1595.
We divided plots into five age categories: 2.5–9 years, 10–19ears, 20–29 years, 30–45 years, and old-growth (Table S1). Welso divided stems into three size classes: 1 cm dbh ≤ size < 5 cmbh, 5 cm dbh ≤ size <10 cm dbh, and ≥10 cm dbh to evaluatehanges in phylogenetic relatedness among different regenerationlasses during succession. The smallest stems in each plot weressumed to represent the most recent stage of succession withinach plot, since larger stems established earlier in the process ofuccession.
Phylogenetic structure analysis: For each site, we used Phylo-atic (Webb and Donoghue, 2005) to construct a phylogeny from
he regional species pool using R20100701.new as a base tree. Wemplemented the bladj algorithm in Phylocom (Webb et al., 2008)o assign ages to nodes and evenly space the nodes between them.
e used the abundance-weighted comstruct algorithm to calculatehe Net Relatedness Index (NRI; Webb, 2000; Webb et al., 2002)or stems in each age category in each plot, and also for stems inach size class in each plot. The NRI is a standardized metric ofhylogenetic clustering or evenness, based on the mean pairwiseistance between taxa in an observed sample compared to ran-om draws from the species pool (Webb, 2000; Webb et al., 2002).ositive NRI indicates phylogenetic clustering, while negative NRIndicates evenness. All comparisons were made using the appropri-te regional species pool (e.g., all Costa Rican plots were comparedo the pool of species from Costa Rica).
Various null models can be used in calculating NRI (Webb et al.,008; Hardy, 2008). For this data set, we chose the phylogenyhuffle model (null model 0 in Phylocom), which shuffles speciesabels across the phylogeny and maintains phylogenetic relation-hips. Although permuting species identities in the communityata matrix can be a more conservative method for calculating NRI
n certain circumstances (Hardy, 2008), randomizing relatednesshile maintaining the abundance distribution and species richness
f each plot is a more suitable null model for temporal data (Nordent al., in press).
The Nearest Taxon Index (NTI) is another metric of phylo-enetic relatedness, often presented alongside NRI. The NTI is atandardized metric of tip-level relatedness, based on the meanistance from each taxon to its nearest neighbor (Webb, 2000).owever, since NTI is calculated from terminal branch lengths, it
s much more subject to uncertainty in terminal-level tree reso-ution (Swenson et al., 2007; Swenson, 2009; Letcher, 2010). Weresent NTI results in Appendix A, but we caution against extensive
nterpretation of NTI results until better phylogenetic resolution isvailable (see discussion in Appendices II and III of Letcher, 2010).
To test whether the NRI was strongly related to the dominancetructure of communities, we calculated Pielou’s evenness (Pielou,966) for each plot and examined the relationship betweenvenness and NRI using linear regression. Pielou’s evenness wasot related to NRI (R2 = 0.026, P = 0.12; Fig. S1); hence, NRI is notelated to evenness in species abundances. We tested whetherRI varies systematically with plot age using one-way ANOVAs for
Please cite this article in press as: Letcher, S.G., et al., Phylogenetic commforest sites. Perspect. Plant Ecol. Evol. Syst. (2011), doi:10.1016/j.ppees.201
ach site. We investigated the relationship of NRI to plot age andtem size class using two-way ANOVAs for each site. In every case,e ensured that the assumptions of the tests were not violated
y checking the normality of residuals with an Anderson–Darling
Cpwi
bove the x-axis indicates no data for that category. Letters above the bars showignificant differences between categories within a site by Tukey HSD (capital lettersor Mexico, lower case for Costa Rica, and lower case with primes for Brazil).
ormality test and estimating homogeneity of variances throughisual examination of the data. All statistical tests were conductedn R 2.11.1 (http://www.r-project.org/).
We used the function nodesig in Phylocom (Webb et al., 2008) tonvestigate which nodes of the phylogeny had significantly more orewer daughter taxa in every plot at each site, based on a random-zation test (Webb et al., 2008). We grouped the plots by age classt each site and compared the regions of the phylogeny found toe significant among sites in each age class. This analysis provides
nsight into the particular clades that contribute most strongly tohe community phylogenetic structure.
esults
Comparing the species found to the regional species pool at eachite, we detected a pattern of increasing phylogenetic evennessuring succession in all three forests (Fig. 1). The NRI was positive inhe youngest successional age categories in each plot, and declinedonsistently during succession to values below or close to zero.his decline was significant at all three sites (one-way ANOVAs;exico: F2,14 = 20.56, p < 0.0001; Costa Rica: F3,18 = 7.17, p = 0.0005;
razil: F2,22 = 13.79, p < 0.0001). The NRI was negative in older sec-ndary forests in Costa Rica and in old-growth forests in Costa Ricand Mexico. In the Costa Rica data set, excluding the stems thatverlapped with the data set of Letcher (2010) had no effect onhe direction, magnitude, or significance of comparisons (data nothown); values shown here include all stems in the data set.
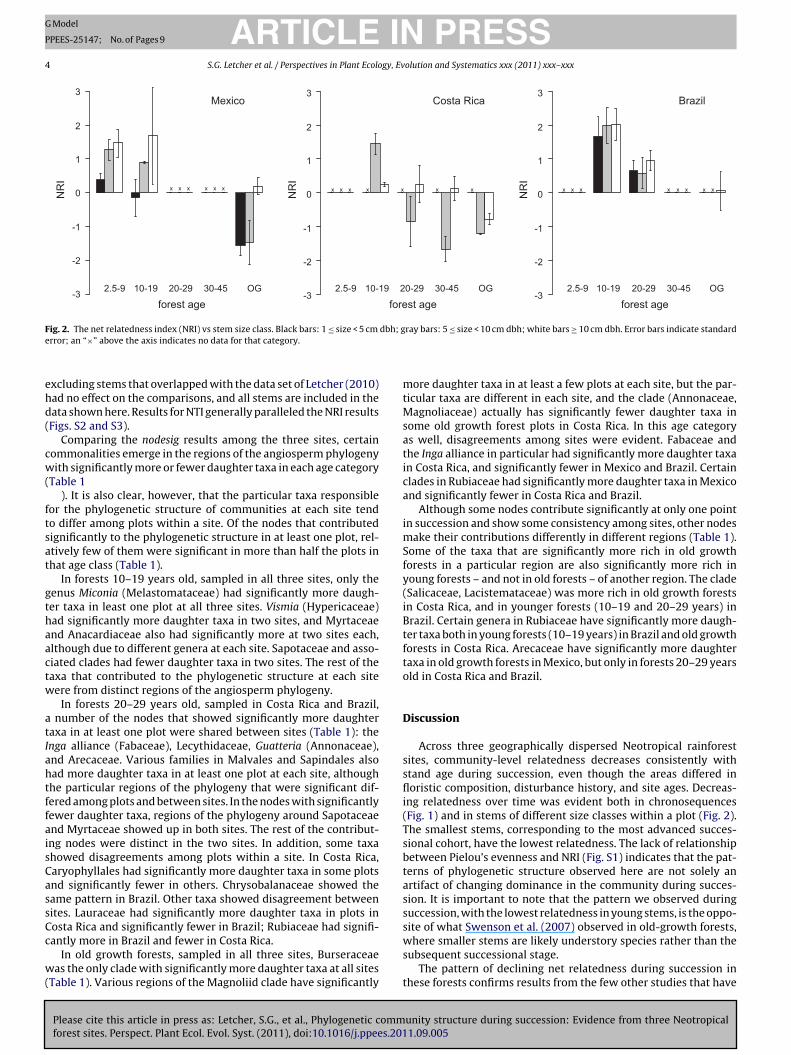
Smaller stems at each site tended to show lower related-ess than large stems (Fig. 2), with the only notable exceptioneing the 10–19-year old forests in Costa Rica. Smaller sizelasses had significantly lower NRI in Mexico (two-way ANOVA;ge: F2,14 = 16.07, p = 0.00002; size: F2,22 = 7.82, p = 0.002; interac-ion term not significant) and Costa Rica (two-way ANOVA; age:3,14 = 6.03, p = 0.004; size: F1,14 = 8.99, p = 0.007). There was a sig-ificant interaction term between stem size class and plot age in
unity structure during succession: Evidence from three Neotropical1.09.005
osta Rica (F3,14 = 4.29, p = 0.02). We found a significant effect oflot age but no effect of stem size class on NRI in Brazil (two-ay ANOVA; age: F2,22 = 7.04, p = 0.002; size: F2,22 = 0.27, p = 0.76;
nteraction term not significant). For the Costa Rica data, again,
ARTICLE IN PRESSG Model
PPEES-25147; No. of Pages 9
4 S.G. Letcher et al. / Perspectives in Plant Ecology, Evolution and Systematics xxx (2011) xxx– xxxN
RI
-3
-2
-1
0
1
2
3
OG30-4520-2910-192.5-9
Mexico
forest age
xxxxxx
NR
I-3
-2
-1
0
1
2
3
OG30-4520-2910-192.5-9
Costa Rica
forest age
xxxxxxx
NR
I
-3
-2
-1
0
1
2
3
OG30-4520-2910-192.5-9
Brazil
forest age
xxxxxxxx
F dbh; ge
ehd(
cw(
ftsat
gthaactw
atIahtffaisCassCc
w(
mtMsatica
imSfy(iBtfto
D
ssfli(Tsbtasss
ig. 2. The net relatedness index (NRI) vs stem size class. Black bars: 1 ≤ size < 5 cm
rror; an “×” above the axis indicates no data for that category.
xcluding stems that overlapped with the data set of Letcher (2010)ad no effect on the comparisons, and all stems are included in theata shown here. Results for NTI generally paralleled the NRI resultsFigs. S2 and S3).
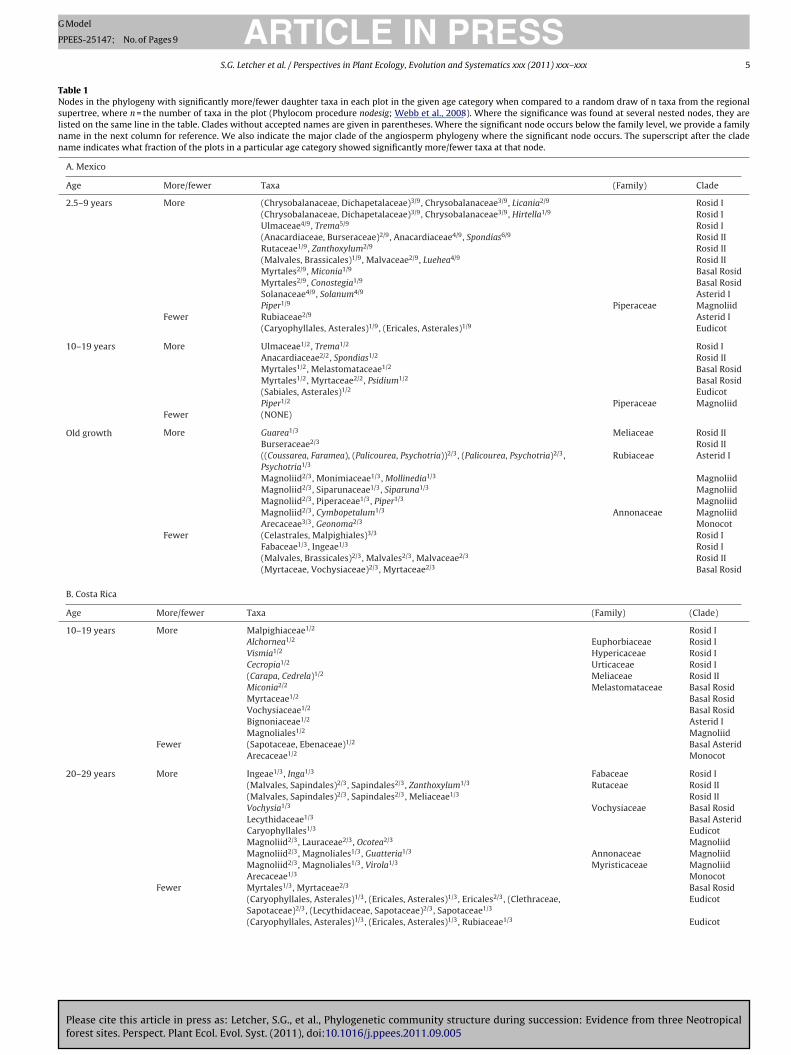
Comparing the nodesig results among the three sites, certainommonalities emerge in the regions of the angiosperm phylogenyith significantly more or fewer daughter taxa in each age category
Table 1). It is also clear, however, that the particular taxa responsible
or the phylogenetic structure of communities at each site tendo differ among plots within a site. Of the nodes that contributedignificantly to the phylogenetic structure in at least one plot, rel-tively few of them were significant in more than half the plots inhat age class (Table 1).
In forests 10–19 years old, sampled in all three sites, only theenus Miconia (Melastomataceae) had significantly more daugh-er taxa in least one plot at all three sites. Vismia (Hypericaceae)ad significantly more daughter taxa in two sites, and Myrtaceaend Anacardiaceae also had significantly more at two sites each,lthough due to different genera at each site. Sapotaceae and asso-iated clades had fewer daughter taxa in two sites. The rest of theaxa that contributed to the phylogenetic structure at each siteere from distinct regions of the angiosperm phylogeny.
In forests 20–29 years old, sampled in Costa Rica and Brazil, number of the nodes that showed significantly more daughteraxa in at least one plot were shared between sites (Table 1): thenga alliance (Fabaceae), Lecythidaceae, Guatteria (Annonaceae),nd Arecaceae. Various families in Malvales and Sapindales alsoad more daughter taxa in at least one plot at each site, althoughhe particular regions of the phylogeny that were significant dif-ered among plots and between sites. In the nodes with significantlyewer daughter taxa, regions of the phylogeny around Sapotaceaend Myrtaceae showed up in both sites. The rest of the contribut-ng nodes were distinct in the two sites. In addition, some taxahowed disagreements among plots within a site. In Costa Rica,aryophyllales had significantly more daughter taxa in some plotsnd significantly fewer in others. Chrysobalanaceae showed theame pattern in Brazil. Other taxa showed disagreement betweenites. Lauraceae had significantly more daughter taxa in plots inosta Rica and significantly fewer in Brazil; Rubiaceae had signifi-
Please cite this article in press as: Letcher, S.G., et al., Phylogenetic commforest sites. Perspect. Plant Ecol. Evol. Syst. (2011), doi:10.1016/j.ppees.201
antly more in Brazil and fewer in Costa Rica.In old growth forests, sampled in all three sites, Burseraceae
as the only clade with significantly more daughter taxa at all sitesTable 1). Various regions of the Magnoliid clade have significantly
ws
t
ray bars: 5 ≤ size < 10 cm dbh; white bars ≥ 10 cm dbh. Error bars indicate standard
ore daughter taxa in at least a few plots at each site, but the par-icular taxa are different in each site, and the clade (Annonaceae,
agnoliaceae) actually has significantly fewer daughter taxa inome old growth forest plots in Costa Rica. In this age categorys well, disagreements among sites were evident. Fabaceae andhe Inga alliance in particular had significantly more daughter taxan Costa Rica, and significantly fewer in Mexico and Brazil. Certainlades in Rubiaceae had significantly more daughter taxa in Mexicond significantly fewer in Costa Rica and Brazil.
Although some nodes contribute significantly at only one pointn succession and show some consistency among sites, other nodes
ake their contributions differently in different regions (Table 1).ome of the taxa that are significantly more rich in old growthorests in a particular region are also significantly more rich inoung forests – and not in old forests – of another region. The cladeSalicaceae, Lacistemataceae) was more rich in old growth forestsn Costa Rica, and in younger forests (10–19 and 20–29 years) inrazil. Certain genera in Rubiaceae have significantly more daugh-er taxa both in young forests (10–19 years) in Brazil and old growthorests in Costa Rica. Arecaceae have significantly more daughteraxa in old growth forests in Mexico, but only in forests 20–29 yearsld in Costa Rica and Brazil.
iscussion
Across three geographically dispersed Neotropical rainforestites, community-level relatedness decreases consistently withtand age during succession, even though the areas differed inoristic composition, disturbance history, and site ages. Decreas-
ng relatedness over time was evident both in chronosequencesFig. 1) and in stems of different size classes within a plot (Fig. 2).he smallest stems, corresponding to the most advanced succes-ional cohort, have the lowest relatedness. The lack of relationshipetween Pielou’s evenness and NRI (Fig. S1) indicates that the pat-erns of phylogenetic structure observed here are not solely anrtifact of changing dominance in the community during succes-ion. It is important to note that the pattern we observed duringuccession, with the lowest relatedness in young stems, is the oppo-ite of what Swenson et al. (2007) observed in old-growth forests,
unity structure during succession: Evidence from three Neotropical1.09.005
here smaller stems are likely understory species rather than theubsequent successional stage.
The pattern of declining net relatedness during succession inhese forests confirms results from the few other studies that have
Please cite this article in press as: Letcher, S.G., et al., Phylogenetic community structure during succession: Evidence from three Neotropicalforest sites. Perspect. Plant Ecol. Evol. Syst. (2011), doi:10.1016/j.ppees.2011.09.005
ARTICLE IN PRESSG Model
PPEES-25147; No. of Pages 9
S.G. Letcher et al. / Perspectives in Plant Ecology, Evolution and Systematics xxx (2011) xxx– xxx 5
Table 1Nodes in the phylogeny with significantly more/fewer daughter taxa in each plot in the given age category when compared to a random draw of n taxa from the regionalsupertree, where n = the number of taxa in the plot (Phylocom procedure nodesig; Webb et al., 2008). Where the significance was found at several nested nodes, they arelisted on the same line in the table. Clades without accepted names are given in parentheses. Where the significant node occurs below the family level, we provide a familyname in the next column for reference. We also indicate the major clade of the angiosperm phylogeny where the significant node occurs. The superscript after the cladename indicates what fraction of the plots in a particular age category showed significantly more/fewer taxa at that node.
A. Mexico
Age More/fewer Taxa (Family) Clade
2.5–9 years More (Chrysobalanaceae, Dichapetalaceae)3/9, Chrysobalanaceae3/9, Licania2/9 Rosid I(Chrysobalanaceae, Dichapetalaceae)3/9, Chrysobalanaceae3/9, Hirtella1/9 Rosid IUlmaceae4/9, Trema5/9 Rosid I(Anacardiaceae, Burseraceae)2/9, Anacardiaceae4/9, Spondias6/9 Rosid IIRutaceae1/9, Zanthoxylum2/9 Rosid II(Malvales, Brassicales)1/9, Malvaceae2/9, Luehea4/9 Rosid IIMyrtales2/9, Miconia1/9 Basal RosidMyrtales2/9, Conostegia1/9 Basal RosidSolanaceae4/9, Solanum4/9 Asterid IPiper1/9 Piperaceae Magnoliid
Fewer Rubiaceae2/9 Asterid I(Caryophyllales, Asterales)1/9, (Ericales, Asterales)1/9 Eudicot
10–19 years More Ulmaceae1/2, Trema1/2 Rosid IAnacardiaceae2/2, Spondias1/2 Rosid IIMyrtales1/2, Melastomataceae1/2 Basal RosidMyrtales1/2, Myrtaceae2/2, Psidium1/2 Basal Rosid(Sabiales, Asterales)1/2 EudicotPiper1/2 Piperaceae Magnoliid
Fewer (NONE)
Old growth More Guarea1/3 Meliaceae Rosid IIBurseraceae2/3 Rosid II((Coussarea, Faramea), (Palicourea, Psychotria))2/3, (Palicourea, Psychotria)2/3,Psychotria1/3
Rubiaceae Asterid I
Magnoliid2/3, Monimiaceae1/3, Mollinedia1/3 MagnoliidMagnoliid2/3, Siparunaceae1/3, Siparuna1/3 MagnoliidMagnoliid2/3, Piperaceae1/3, Piper1/3 MagnoliidMagnoliid2/3, Cymbopetalum1/3 Annonaceae MagnoliidArecaceae3/3, Geonoma2/3 Monocot
Fewer (Celastrales, Malpighiales)3/3 Rosid IFabaceae1/3, Ingeae1/3 Rosid I(Malvales, Brassicales)2/3, Malvales2/3, Malvaceae2/3 Rosid II(Myrtaceae, Vochysiaceae)2/3, Myrtaceae2/3 Basal Rosid
B. Costa Rica
Age More/fewer Taxa (Family) (Clade)
10–19 years More Malpighiaceae1/2 Rosid IAlchornea1/2 Euphorbiaceae Rosid IVismia1/2 Hypericaceae Rosid ICecropia1/2 Urticaceae Rosid I(Carapa, Cedrela)1/2 Meliaceae Rosid IIMiconia2/2 Melastomataceae Basal RosidMyrtaceae1/2 Basal RosidVochysiaceae1/2 Basal RosidBignoniaceae1/2 Asterid IMagnoliales1/2 Magnoliid
Fewer (Sapotaceae, Ebenaceae)1/2 Basal AsteridArecaceae1/2 Monocot
20–29 years More Ingeae1/3, Inga1/3 Fabaceae Rosid I(Malvales, Sapindales)2/3, Sapindales2/3, Zanthoxylum1/3 Rutaceae Rosid II(Malvales, Sapindales)2/3, Sapindales2/3, Meliaceae1/3 Rosid IIVochysia1/3 Vochysiaceae Basal RosidLecythidaceae1/3 Basal AsteridCaryophyllales1/3 EudicotMagnoliid2/3, Lauraceae2/3, Ocotea2/3 MagnoliidMagnoliid2/3, Magnoliales1/3, Guatteria1/3 Annonaceae MagnoliidMagnoliid2/3, Magnoliales1/3, Virola1/3 Myristicaceae MagnoliidArecaceae1/3 Monocot
Fewer Myrtales1/3, Myrtaceae2/3 Basal Rosid(Caryophyllales, Asterales)1/3, (Ericales, Asterales)1/3, Ericales2/3, (Clethraceae,Sapotaceae)2/3, (Lecythidaceae, Sapotaceae)2/3, Sapotaceae1/3
Eudicot
(Caryophyllales, Asterales)1/3, (Ericales, Asterales)1/3, Rubiaceae1/3 Eudicot

Please cite this article in press as: Letcher, S.G., et al., Phylogenetic community structure during succession: Evidence from three Neotropicalforest sites. Perspect. Plant Ecol. Evol. Syst. (2011), doi:10.1016/j.ppees.2011.09.005
ARTICLE IN PRESSG Model
PPEES-25147; No. of Pages 9
6 S.G. Letcher et al. / Perspectives in Plant Ecology, Evolution and Systematics xxx (2011) xxx– xxx
Table 1(continued)
B. Costa Rica
Age More/fewer Taxa (Family) (Clade)
30–45 years More Fabales1/5, Fabaceae1/5, Ingeae2/5, Inga2/5 Fabaceae Rosid I(Anacardiaceae, Burseraceae)2/5, Burseraceae2/5, Protium3/5 Rosid IIMagnoliid1/5, Magnoliales3/5, Annonaceae1/5, Xylopia1/5 MagnoliidMagnoliid1/5, Magnoliales3/5, Annonaceae1/5, Guatteria1/5 MagnoliidMagnoliid1/5, Magnoliales3/5, Myristicaceae1/5, Virola1/5 MagnoliidMagnoliid1/5, Lauraceae1/5, Ocotea1/5 Magnoliid
Fewer (Celastrales, Malpighiales)1/5, Malpighiales1/5 Rosid IFicus1/5 Moraceae Rosid IMyrtales2/5, Myrtaceae1/5, Eugenia1/5 Basal RosidMyrtales2/5, Vochysiaceae1/5 Basal Rosid(Ericales, Asterales)1/5, (Lamiids, Campanuliids)2/5 Asterid(Sabiales, Asterales)1/5 Eudicot(Caryophyllales, Asterales)1/5, (Ericales, Asterales)1/5, (Clethraceae,Sapotaceae)1/5, Sapotaceae1/5
Eudicot
Piperaceae1/5, Piper1/5 Magnoliid
Old growth More (Lacistemataceae, Salicaceae)1/8 Rosid I(Celastrales, Malpighiales)2/8, Malpighiales2/8, Clusiaceae1/8 Rosid I(Celastrales, Malpighiales)2/8, Malpighiales2/8, Humiriaceae1/8 Rosid IFabaceae2/8, Ingeae2/8, Inga1/8 Fabaceae Rosid I(Perebea, Naucleopsis)2/8 Moraceae Rosid I(Lecythidaceae, Sapotaceae)1/8, Sapotaceae1/8, Pouteria1/8 Asterid(Malvales, Sapindales)1/8, Malvaceae1/8 Rosid II(Malvales, Sapindales)1/8, Sapindales2/8, (Anacardiaceae, Burseraceae)4/8,Burseraceae5/8, Protium3/8
Rosid II
(Malvales, Sapindales)1/8, Sapindales1/8, (Carapa, Cedrela)1/8 Meliaceae Rosid IIMagnoliid3/8, Magnoliales3/8, Unonopsis1/8 Annonaceae MagnoliidMagnoliid3/8, Magnoliales3/8, Xylopia2/8 Annonaceae MagnoliidMagnoliid3/8, Magnoliales3/8, Virola1/8 Myristicaceae MagnoliidLaurales1/8, Lauraceae1/8, Ocotea2/8 Magnoliid
Fewer Ficus2/8 Moraceae Rosid I(Acanthaceae, Solanaceae)2/8 Asterid I(Caryophyllales, Asterales)4/8, (Ericales, Asterales)4/8, (Lamiids,Campanuliids)4/8, Lamiids3/8, Rubiaceae1/8, (Palicourea, Psychotria)1/8
Eudicot
(Annonaceae, Magnoliaceae)1/8 Magnoliid
C. Brazil
Age More/fewer Taxa (Family) (Clade)
10–19 years More (Violaceae, (Salicaceae, Lacistemataceae))4/10, (Salicaceae,Lacistemataceae)3/10, Salicaceae7/10
Rosid I
Hypericaceae2/10, Vismia4/10 Rosid ISwartzia1/10 Fabaceae Rosid IRosales1/10, (Moraceae, Urticaceae)1/10, Urticaceae4/10, Pourouma3/10 Rosid IRosales1/10, (Moraceae, Urticaceae)1/10, Cecropia2/10 Rosid IAnacardiaceae1/10, Tapirira2/10 Rosid IIMalvids3/10, Myrtales3/10, Melastomataceae3/10, Bellucia3/10 RosidMalvids3/10, Myrtales3/10, Melastomataceae3/10, Miconia4/10 Rosid((Coussarea, Faramea), (Palicourea, Psychotria))2/10, (Palicourea, Psychotria)2/10 Asterid ILecythidaceae1/10 Basal AsteridAnnonaceae4/10, Guatteria2/10 Magnoliid
Fewer (Poales, Asterales)2/10
(Dichapetalaceae, Chrysobalanaceae)1/10 Rosid IEricales2/10, Sapotaceae1/10 Basal AsteridEricales2/10 Lecythidaceae1/10 Basal AsteridLauraceae1/10 Magnoliid
20–29 years More (Violaceae, (Salicaceae, Lacistemataceae))2/8, (Lacistemataceae, Salicaceae)1/8,Lacistemaceae1/8, Lacistema1/8
Rosid I
Chrysobalanaceae2/8, Hirtella1/8 Rosid IChrysobalanaceae2/8, Licania1/8 Rosid IAparisthmium1/8 Euphorbiaceae Rosid IFabaceae2/8, Mimosoideae1/8, Ingeae2/8, Inga3/8 Rosid IRosales3/8, (Moraceae, Urticaceae)2/8, Urticaceae4/8, Pourouma5/8 Rosid IHypericaceae1/8, Vismia3/8 Rosid I(Malvales, Sapindales)3/8, Burseraceae5/8, Protium6/8 Rosid II(Malvales, Sapindales)3/8, Sapindales3/8, Burseraceae5/8, Trattinnickia2/8 Rosid II(Malvales, Sapindales)3/8, Sapindales3/8, Sapindaceae1/8, Cupania1/8 Rosid II(Malvales, Sapindales)3/8, Sapindales3/8, Anacardiaceae1/8 Rosid II(Malvales, Sapindales)3/8, Sapindales3/8, Simaroubaceae3/8, Simaba1/8 Rosid II(Malvales, Sapindales)3/8, Sapindales3/8, Sapindaceae1/8, Toulicia1/8 Rosid II(Malvales, Sapindales)3/8, Malvaceae2/8, Theobroma1/8 Rosid II

ARTICLE IN PRESSG Model
PPEES-25147; No. of Pages 9
S.G. Letcher et al. / Perspectives in Plant Ecology, Evolution and Systematics xxx (2011) xxx– xxx 7
Table 1(continued)
C. Brazil
Age More/fewer Taxa (Family) (Clade)
Melastomataceae4/8, Miconia3/8 Basal RosidMelastomataceae4/8, Bellucia4/8 Basal RosidLamiids2/8, Rubiaceae1/8, Cinchonoideae2/8 Asterid ILamiids2/8, Rubiaceae1/8, Palicourea1/8 Asterid ILecythidaceae2/8, Eschweilera3/8 Basal AsteridLecythidaceae2/8, Corythophora1/8 Basal AsteridMagnoliales2/8, Annonaceae2/8, Annona1/8 MagnoliidMagnoliales2/8, Annonaceae2/8, Guatteria1/8 MagnoliidArecaceae2/8, Oenocarpus2/8 Monocot
Fewer (Dichapetalaceae, Chrysobalanaceae)2/8,Chrysobalanaceae2/8 Rosid IMyrtaceae1/8 Basal RosidGentianales3/8 Asterid I(Ericales, Asterales)3/8, Lecythidaceae1/8 Asterid(Ericales, Asterales)3/8, Sapotaceae1/8, Pouteria1/8 AsteridLauraceae1/8 Magnoliid
Old growth More Rosales3/4, (Moraceae, Urticaceae)2/4, Brosimum2/4 Moraceae Rosid IRosales3/4, Moraceae2/4, Pseudolmedia1/4 Rosid IHumiriaceae1/4 Rosid IBurseraceae3/4, Protium3/4 Rosid IIEricales4/4, Sapotaceae3/4, Pouteria3/4 Basal AsteridEricales4/4, Sapotaceae3/4, Micropholis1/4 Basal AsteridEricales4/4, Lecythidaceae4/4, Eschweilera2/4 Basal AsteridMagnoliid3/4, Myristicaceae2/4, Virola1/4 MagnoliidMagnoliid3/4, Lauraceae1/4, Ocotea1/4 Magnoliid
Fewer (Malpighiales, Celastrales)1/4, Malpighiales1/4 Rosid I(Fabaceae, Polyagalaceae)1/4, Fabaceae2/4, Mimosoideae2/4, Ingeae2/4, Inga2/4 Rosid I(Connaraceae, Elaeocarpaceae)1/4, Elaeocarpaceae1/4, Sloanea1/4 Rosid IClusiaceae1/4 Rosid ISapindales2/4, Sapindaceae1/4 Rosid IIMalvids3/4, Myrtales3/4, Myrtaceae3/4, (Calyptranthes, Eugenia)2/4 Basal RosidMalvids3/4, Myrtales3/4, Melastomataceae1/4, Miconia1/4 Basal RosidLamiids4/4, Gentianales4/4, Rubiaceae4/4 Asterid I(Sabiales, Asterales)2/4 Eudicot
aOgtidscisTccsa
iysidPplPaehs
ls(tCbsireaitpae((e
bsfc
ddressed community phylogenetic structure during succession.ur data support the recent findings of Letcher (2010) on the phylo-enetic structure of a chronosequence of 30 plots in Costa Rica, andhe results of Norden et al. (in press) for long-term monitoring plotsn the same landscape. In other systems, Verdú et al. (2009) foundeclining relatedness from early to intermediate stages of succes-ion in Mediterranean shrublands in Spain. Helmus et al. (2010),omparing the phylogenetic structure of zooplankton communitiesn lakes, found that the communities of frequently disturbed lakeshow much higher relatedness than those of less-disturbed lakes.ogether, these studies suggest that assembly processes in ecologi-al time exhibit a distinct signature in the phylogenetic structure ofommunities. In particular, recently disturbed, young communitieshow high relatedness, and community-level relatedness decliness succession proceeds.
The only notable exception to the general pattern of decreas-ng relatedness during succession was in Costa Rican forests 10–19ears old, where smaller stems had higher relatedness than largetems. Costa Rica was also the only site where we found a signif-cant interaction term between plot age and stem size class. Thisiscrepancy is probably due to the abundance of one tree species,entaclethra macroloba (Willd.) Kuntze (Fabaceae) in one of the twolots in this age category. This plot had the highest NRI and second-
owest value of Pielou’s evenness of all plots in Costa Rica (Fig. S1).entaclethra contributes 74% of stems in the 5–10 cm diameter class
Please cite this article in press as: Letcher, S.G., et al., Phylogenetic commforest sites. Perspect. Plant Ecol. Evol. Syst. (2011), doi:10.1016/j.ppees.201
nd 13% of stems in the 10+ cm diameter class. This plot was anxception, though; only four of the 54 plots surveyed had equal origher dominance by a single species, and none of these plots haduch high NRI values.
staw
Considering the particular taxa that contribute to the phy-ogenetic structure, some large-scale patterns emerge across allites. Taxa already identified as important Neotropical pioneersPopma et al., 1988; Dalling et al., 1998; Chazdon, 2008) con-ribute strongly to the phylogenetic structure in early succession:ecropia, Pourouma, Vismia, Miconia, and Trema. All of these taxaelong to the Rosid clade. Norden et al. (in press) found that pioneerpecies in northeastern Costa Rica were significantly phylogenet-cally clustered, mainly coming from the Rosid clade. The higherelatedness that we observed in young forests could be partiallyxplained by the dominance of closely related pioneer species. Notll of these taxa are characteristic of every site, though, and evenn the sites where they do appear they are seldom significant con-ributors to the phylogenetic structure in more than half of thelots (Table 1). In addition, not all of the important pioneer taxare Rosids. Solanum (Asterid), Piper (Magnoliid), and certain gen-ra in Rubiaceae, particularly species of Palicourea and PsychotriaAsterid), are significantly richer in early succession in many sitesTable 1) and are recognized as pioneers (Popma et al., 1988; Dallingt al., 1998; Válio and Scarpa, 2001).
As succession proceeds, Asterids and Magnoliids generallyecome increasingly important contributors to the phylogenetictructure of communities. Here as well, though, local-scale dif-erences are important. In the intermediate and old-growth ageategories, certain nodes have significantly more daughter taxa in
unity structure during succession: Evidence from three Neotropical1.09.005
ome plots and significantly fewer in other plots within a site. Taxahat are significantly richer in young plots at one site are also richert old-growth plots in another site. The patterns of relatedness thate observed in these three sites are not simply due to the turnover

ING Model
P
8 gy, Ev
oct
wibenphreoadiL
imhdecge2hohnwirsi(tssv
saic(ttplt1inbam
bstec
hd(gtwesdt
taNcs(aFmfr
A
3awaNcNCtcBB
A
i
R
B
B
C
C
C
C
C
C
ARTICLEPEES-25147; No. of Pages 9
S.G. Letcher et al. / Perspectives in Plant Ecolo
f particular clades at particular points in succession, but rather to aommunity-wide shift from closely related taxa in early successiono distantly related taxa in later succession.
Theoretically, when phylogenetic niche conservatism isidespread, patterns of phylogenetic clustering stem from abiotic
nteractions and patterns of phylogenetic evenness stem fromiotic filtering (Webb, 2000; Webb et al., 2002; Cavender-Barest al., 2009; Vamosi et al., 2009). There is strong evidence foriche conservatism in higher plants (Prinzing et al., 2001), andarticularly in tropical forest trees, where niche conservatismas been demonstrated in functional, reproductive, and defense-elated traits (Chazdon et al., 2003; Chave et al., 2006; Swensont al., 2007; Kraft and Ackerly, 2010). If we accept the assumptionf phylogenetic niche conservatism, these results corroborate
model of succession in which abiotic filtering predominatesuring early succession, and biotic filtering becomes increasingly
mportant as succession proceeds (Webb, 2000; Chazdon, 2008;etcher, 2010).
Numerous studies have confirmed the importance of bioticnteractions in shaping the composition of tropical tree com-
unities. Density-dependent seedling mortality mediated byost-specific pathogens helps to maintain tropical tree speciesiversity (Bell et al., 2006; Queenborough et al., 2007; Mangant al., 2010; McCarthy-Neumann and Kobe, 2010). Trees withonspecific neighbors tend to have higher mortality and lowerrowth rates than trees with heterospecific neighbors (Connellt al., 1984; Webb and Peart, 1999; Harms et al., 2000; Comita et al.,010). Beyond conspecific–heterospecific effects, several studiesave detected community-level effects of phylogenetic diversityn plant survival and growth. In Borneo, Webb et al. (2006) foundigher seedling survival in neighborhoods with greater phyloge-etic diversity, suggesting that distantly related neighbors have aeaker negative effect on seedling survival. Uriarte et al. (2004),
n Panama, found that incorporating information on neighborhoodelatedness improved the fit of likelihood-based models predictingapling growth in approximately half of the 60 species they stud-ed. Most tropical herbivores (Weiblen et al., 2006) and pathogensGilbert, 2002; Gilbert and Webb, 2007) are clade-specific, ratherhan strictly host-specific. When individual trees establish duringuccession, they bring communities of pests and pathogens that canuppress the establishment of closely related individuals in theiricinity, a phenomenon that merits further study.
The pattern of declining relatedness that we observed duringuccession corroborates a model of succession in which biotic inter-ctions increase in importance over time. An alternate explanationnvokes dispersal limitation. The species that colonize in early suc-ession tend to be small-seeded and dispersed by wind or batsChazdon, 2008). If these traits are conserved in the phylogeny,he predominance of species drawn from these clades could drivehe high relatedness observed in early successional stands, and theattern of declining relatedness over time could be driven by the
oss of these closely related species from the system and the addi-ion of species dispersed by birds and terrestrial mammals (Holl,999; Chazdon et al., 2003). Experimental studies will be useful
n teasing apart these two alternatives. Does a species fail to colo-ize a particular successional stage and grow to a given size classecause the seeds do not arrive, because they lack physiologicaldaptations required for survival, or because of density-dependentortality caused by pests or pathogens?One important caveat to this study is that our analysis is
ased on chronosequence data. Previous studies have demon-
Please cite this article in press as: Letcher, S.G., et al., Phylogenetic commforest sites. Perspect. Plant Ecol. Evol. Syst. (2011), doi:10.1016/j.ppees.201
trated that the successional trajectories of plots monitored overime may not conform to chronosequence predictions (Chazdont al., 2007; Johnson and Miyanishi, 2008). In Neotropical forests,hronosequence predictions of structural variables (e.g., basal area)
C
PRESSolution and Systematics xxx (2011) xxx– xxx
ave proven much more accurate when compared to monitoringata than predictions of species richness and species compositionChazdon et al., 2007). Examining changes over time in the phylo-enetic structure of communities based on monitoring data, ratherhan chronosequences, will be an important step in determininghether the patterns we observed here are truly indicative of for-
st community structure. An analysis of 12 years of change in fourecondary forest plots in Costa Rica (Norden et al., in press) showseclining relatedness over time in every plot, although the trajec-ories do not all fall on the same line.
Here we have shown that the phylogenetic structure ofropical forest communities undergoing succession shows remark-ble commonalities between three widely dispersed sites in theeotropics. Early successional communities are dominated bylosely related species, but relatedness declines in every case asuccession proceeds. Following the interpretation of Webb et al.2002), this pattern suggests an increasing role of biotic inter-ctions in shaping community structure as succession proceeds.uture studies of seed dispersal, experiments on seedling establish-ent, and large-scale studies on compilations of phylogenetic and
unctional trait data will be useful in elucidating the mechanismsesponsible for this pervasive pattern.
cknowledgements
Work in Mexico was supported by NWO-WOTRO grant W85-26 to MvB and FB, and by SEMARNAT-CONACyT 2002-C01-0597nd SEP-CONACyT CB-2005-01-51043 to MMR; work in Costa Ricaas supported by NSF DEB-0639393 and DEB-0639114 to RLC and
n NSF graduate fellowship to SGL. RLC acknowledges the Danishational Research Foundation for support to the Center for Macroe-ology, Evolution and Climate. Work in Brazil was supported bySF DEB-0614044 to SL, Conselho Nacional de Desenvolvimentoientifico e Tecnologico (CNPq) to RCGM, and NSF DEB-0639114o GBW. We thank many field assistants, taxonomists, and techni-ians who have made this work possible, especially Tony Vizcarraentos. This is publication number 585 in the technical series of theiological Dynamics of Forest Fragments Project.
ppendix A. Supplementary data
Supplementary data associated with this article can be found,n the online version, at doi:10.1016/j.ppees.2011.09.005.
eferences
ell, T., Freckleton, R.P., Lewis, O.T., 2006. Plant pathogens drive density-dependentseedling mortality in a tropical tree. Ecol. Lett. 9, 569–574.
reugel, M., Bongers, F., Martínez-Ramos, M., 2007. Species turnover during earlysecondary forest succession: recruitment, mortality, and species turnover.Biotropica 35, 610–619.
avender-Bares, J., Kozak, K.H., Fine, P.V.A., Kembel, S.W., 2009. The merging ofcommunity ecology and phylogenetic biology. Ecol. Lett. 12, 693–715.
hazdon, R.L., 2008. Chance and determinism in tropical forest succession. In: Car-son, W.P., Schnitzer, S.A. (Eds.), Tropical Forest Community Ecology. BlackwellScientific, Oxford, pp. 384–408.
hauvel, A., Lucas, Y., Boulet, R., 1987. On the genesis of the soil mantle of the regionof Manaus, central Amazonia, Brazil. Experientia 43, 234–241.
have, J., Muller-Landau, H.C., Baker, T.R., Easdale, T.A., ter Steege, H., Webb, C.O.,2006. Regional and phylogenetic variation of wood density across 2456 Neotrop-ical tree species. Ecol. Appl. 16, 2356–2367.
hazdon, R.L., 2003. Tropical forest recovery: legacies of human impact and naturaldisturbances. Persp. Plant Ecol. Evol. Syst. 6, 51–71.
hazdon, R.L., Careaga, S., Webb, C.O., Vargas, O., 2003. Community and phylogenetic
unity structure during succession: Evidence from three Neotropical1.09.005
structure of reproductive traits of woody species in wet tropical forests. Ecol.Monogr. 73, 331–348.
hazdon, R.L., Letcher, S.G., van Breugel, M., Martínez-Ramos, M., Bongers, F., Fine-gan, B., 2007. Rates of change in tree communities of secondary Neotropicalforests following major disturbances. Philos. Trans. R. Soc. B 362, 273–289.

ING Model
P
gy, Ev
C
C
D
d
F
G
G
H
H
H
H
J
K
L
L
L
M
M
M
M
M
M
N
N
P
P
P
P
P
Q
S
S
U
V
V
V
W
W
W
W
W
ARTICLEPEES-25147; No. of Pages 9
S.G. Letcher et al. / Perspectives in Plant Ecolo
omita, L.S., Muller-Landau, H.C., Aguilar, S., Hubbell, S.P., 2010. Asymmetric densitydependence shapes species abundances in a tropical tree community. Science329, 330–332.
onnell, J.H., Tracy, J.G., Webb, L.J., 1984. Compensatory recruitment, growth, andmortality as factors maintaining rain forest tree diversity. Ecol. Monogr. 54,141–164.
alling, J.W., Hubbell, S.P., Silvera, K., 1998. Seed dispersal, seedling establishmentand gap partitioning among tropical pioneer trees. J. Ecol. 86, 674–689.
e Souza, R.P., Válio, I.F.M., 2001. Seed size, seed germination, and seedling survivalof Brazilian tropical tree species differing in successional status. Biotropica 33,447–457.
inegan, B., 1996. Pattern and process in neotropical secondary rain forests: the first100 years of succession. Trends Ecol. Evol. 11, 103–114.
ilbert, G.S., 2002. Evolutionary ecology of plant diseases in natural ecosystems.Annu. Rev. Phytopathol. 40, 13–43.
ilbert, G.S., Webb, C.O., 2007. Phylogenetic signal in plant pathogen–host range.Proc. Natl. Acad. Sci. U.S.A. 104, 4979–4983.
ardy, O., 2008. Testing the spatial phylogenetic structure of local communities:statistical performances of different null models and test statistics on a locallyneutral community. J. Ecol. 96, 914–926.
arms, K.E., Wright, S.J., Calderón, O., Hernández, A., Herre, E.A., 2000. Pervasivedensity-dependent recruitment enhances seedling diversity in a tropical forest.Nature 404, 493–495.
elmus, M.R., Keller, W., Paterson, M.J., Yan, N.D., Cannon, C.H., Rusak, J.A., 2010.Communities contain closely related species during ecosystem disturbance.Ecol. Lett. 13, 162–174.
oll, K.D., 1999. Factors limiting tropical moist forest regeneration in agriculturalland: soil, microclimate, vegetation and seed rain. Biotropica 31, 459–468.
ohnson, E.A., Miyanishi, K., 2008. Testing the assumptions of chronosequences insuccession. Ecol. Lett. 11, 419–431.
raft, N.J.B., Ackerly, D.D., 2010. Functional trait and phylogenetic tests of commu-nity assembly across spatial scales in an Amazonian forest. Ecol. Monogr. 80,401–422.
etcher, S.G., 2010. Phylogenetic structure of angiosperm communities during trop-ical forest succession. Proc. R. Soc. B 277, 97–104.
etcher, S.G., Chazdon, R.L., 2009. Rapid recovery of biomass, species richness, andspecies composition in a forest chronosequence in northeastern Costa Rica.Biotropica 41, 608–617.
ovejoy, T.E., Bierregaard, R.O., 1990. Central Amazonian forest fragments andthe Minimum Critical Size of Ecosystems Project. In: Gentry, A.H. (Ed.), FourNeotropical Rainforests. Yale University Press, New Haven, pp. 60–71.
angan, S.A., Schnitzer, S.A., Herre, E.A., Mack, K.M.L., Valencia, M.C., Sanchez, E.I.,Bever, J.D., 2010. Negative plant–soil feedback predicts tree-species relativeabundance in a tropical forest. Nature 466, 752–755.
artínez, E., Ramos-A., Chiang, C.H.F., 1994. Lista florística de la Lacandona, Chiapas.Bol. Soc. Bot. Mex. 54, 99–177.
cCarthy-Neumann, S., Kobe, R.K., 2010. Conspecific plant–soil feedbacks reducesurvivorship and growth of tropical tree seedlings. J. Ecol. 98, 396–407.
cDade, L.A., Bawa, K.S., Hespenheide, H.A., Hartshorn, G.S. (Eds.), 1994. La Selva:Ecology and Natural History of a Neotropical Rain Forest. University of Chicago
Please cite this article in press as: Letcher, S.G., et al., Phylogenetic commforest sites. Perspect. Plant Ecol. Evol. Syst. (2011), doi:10.1016/j.ppees.201
Press, Chicago.esquita, R.C.G., Ickes, K., Ganade, G., Williamson, G.B., 2001. Alternative succes-
sional pathways in the Amazon Basin. J. Ecol. 89, 528–537.issouri Botanical Garden, 2009. W3 TROPICOS Database. Available at:
http://www.tropicos.org (accessed August–October 2009).
W
W
PRESSolution and Systematics xxx (2011) xxx– xxx 9
orden, N., Letcher, S.G., Boukili, V., Swenson, N.G., Chazdon, R.L. Demographicdrivers of successional changes in phylogenetic dispersion across life-historystages in tropical plant communities. Ecology, in press; doi:10.1890/10-2179.1.
orden, N., Chazdon, R.L., Chao, A., Jiang, Y.-H., Vilchez-Alvarado, B., 2009. Resilienceof tropical rain forests: tree community reassembly in secondary forests. Ecol.Lett. 12, 385–394.
ielou, E.C., 1966. The measurement of diversity in different types of biologicalcollections. J. Theor. Biol. 13, 131–144.
oorter, L., van de Plassche, M., Willems, M., Boot, R.G.A., 2004. Leaf traits andherbivory rates of tropical trees differing in successional status. Plant Biol. 6,746–754.
opma, J., Bongers, F., Martínez-Ramos, M., Veneklaas, E., 1988. Pioneer speciesdistribution in treefall gaps in Neotropical rain forest; a gap definition and itsconsequences. J. Trop. Ecol. 4, 77–88.
rinzing, A., Durka, W., Klotz, S., Brandl, R., 2001. The niche of higher plants: evidencefor phylogenetic conservatism. Proc. R. Soc. B 268, 2383–2389.
royecto Flora Digital, 2009. La Flora Digital de La Selva. Available at:http://sura.ots.ac.cr/local/florula3/ (accessed June–September 2009).
ueenborough, S.A., Burslem, D.F.R.P., Garwood, N.C., Valencia, R., 2007. Neigh-borhood and community interactions determine the spatial pattern of tropicalseedling survival. Ecology 88, 2248–2258.
wenson, N.G., 2009. Phylogenetic resolution and quantifying the phy-logenetic diversity and dispersion of communities. PLOS One, e4390,doi:10.1371/journal.pone.0004390.
wenson, N.G., Enquist, B.J., Thompson, J., Zimmerman, J.K., 2007. The influence ofspatial and size scale on phylogenetic relatedness in tropical forest communi-ties. Ecology 88, 1770–1780.
riarte, M., Condit, R., Canham, C.D., Hubbell, S.P., 2004. A spatially explicit modelof sapling growth in a tropical forest: does the identity of neighbors matter? J.Ecol. 92, 348–360.
álio, I.F.M., Scarpa, F.M., 2001. Germination of seeds of tropical pioneer speciesunder controlled and natural conditions. Rev. Brasil. Bot. 24, 79–84.
amosi, S.M., Heard, S.B., Vamosi, J.C., Webb, C.O., 2009. Emerging patterns inthe comparative analysis of phylogenetic community structure. Mol. Ecol. 18,572–592.
erdú, M., Rey, P.J., Alcántara, J.M., Siles, G., Valiente-Banuet, A., 2009. Phylogeneticsignatures of facilitation and competition in successional communities. J. Ecol.97, 1171–1180.
ebb, C.O., 2000. Exploring the phylogenetic structure of ecological communities:an example for rain forest trees. Am. Nat. 156, 145–155.
ebb, C.O., Ackerly, D.D., Kembel, S.W., 2008. Phylocom: software for the analy-sis of community phylogenetic structure and character evolution. Version 4.01.Available at: http://www.phylodiversity.net/phylocom.
ebb, C.O., Ackerly, D.D., McPeek, M.A., Donoghue, M.J., 2002. Phylogenies andcommunity ecology. Annu. Rev. Ecol. Syst. 33, 475–505.
ebb, C.O., Donoghue, M.J., 2005. Phylomatic: tree assembly for applied phyloge-netics. Mol. Ecol. Notes 5, 181–183.
ebb, C.O., Gilbert, G.S., Donoghue, M.J., 2006. Phylodiversity-dependent seedlingmortality, size structure, and disease in a Bornean rain forest. Ecology 87,S123–S131.
unity structure during succession: Evidence from three Neotropical1.09.005
ebb, C.O., Peart, D.R., 1999. Seedling density dependence promotes coexistence ofBornean rain forest trees. Ecology 80, 2006–2017.
eiblen, G.D., Webb, C.O., Novotny, V., Basset, Y., Miller, S.E., 2006. Phylogeneticdispersion of host use in a tropical insect herbivore community. Ecology 87,S62–S75.