1 Stabilization of Soft Clay Soil by Deep Mixing Mohamed ...
16
1 Stabilization of Soft Clay Soil by Deep Mixing Mohamed Mamdouh Zakaria 1 , Kamal Mohamed Hafez 2 , Walid Hamdy El Kamash 3 , Azza Hassan Moubarak 3 1 Engineering Dept., Suez Canal Authority, Ismailia, Egypt 2 Professor, Geotechnical and Foundation Engineering Department, Faculty of Engineering, Suez Canal University, Ismailia, Egypt 3 Associate Professor, Geotechnical and Foundation Engineering Department, Faculty of Engineering, Suez Canal University, Ismailia, Egypt [email protected], [email protected], [email protected] Abstract: East Port Said Port is considered one of the most important industrial regions in Egypt with soft clay soil. This paper focuses on the geotechnical properties of this area. To study the rehabilitation of this important region. Deep mixing method (DMM) with ordinary Portland cement or quicklime is used for soil improvement. In the laboratory, trial mix designs are used to compare soil properties before and after treatment. Effects of binder type, binder content, various water cement ratio and curing duration on soft clay improvement are studied. Three small- scale laboratory models (untreated soil model, model with end bearing deep mixing columns and model with floating deep mixing columns) are instrumented to measure the settlement of soil. Two Dimensional finite element analysis is carried out using PLAXIS program. A comparison between the 2D finite element analysis results and the physical model results is done. Results agree generally with each other. A finite element analysis is carried out to show the comparison between the performance of the soil with and without deep mixing. Effects of pile depth, pile spacing, pile diameter, pile type and soil compression index are illustrated in this study. Finally, according to the previous results, an equation is predicted to calculate the settlement using deep mixing method. [Mohamed Mamdouh Zakaria, Kamal Mohamed Hafez, Walid Hamdy El Kamash, Azza Hassan Moubarak. Stabilization of Soft Clay Soil by Deep Mixing. Life Sci J 2020;17(3):1-15]. ISSN: 1097-8135 (Print) / ISSN: 2372-613X (Online). http://www.lifesciencesite.com . 1. doi:10.7537/marslsj170320.01 . Keywords: East Port Said Port, Soft clay, Deep mixing method, Stabilization, Finite element analysis. 1. Introduction East Port Said Port is one of the largest national projects constructed on soft clay soil which opened in October 2004 to serve the world trade. Many projects are executed in this region. Settlement rates in this region were typically high (Hamed, O., 2017). Studying the effect of soft clay improvement using deep mixing method illustrated in many researches (Jiang et al., 2013). Three dimensional finite element methods are used to illustrate the settlement behavior of soft soils improved by deep mixed columns. Columns modulus, soft soil thickness, and area replacement ratio decrease the settlement of treated soft soil (Madhyannapu and Puppala, 2014). The effectiveness of the deep mixing technology and construction are discussed. An analytical model proposed for a deep soil mixing (DSM) to predict the settlement behavior of expansive sub-soils. Finally, the results indicated that the deep mixing method (DMS) technique was effective to improve soft clay soils. (Caraşca, 2016) Stated that soil treatment and stabilization by mixing is considered an economical method to improve soft clay. To understand the properties of the improved soils, many experimental tests were performed on different artificial soils. Flexure strength, unconfined compressive strength tests and wave velocity measurements were carried out experimentally. In addition, porosity, permeability and density were studied on the hardened improved soil. Results in this paper follow the same trend as the results of the other studies. A laboratory- scale model is used to investigate the effect of improving the clay soil by installed deep mixing piles in a compacted clay soil (Abiodun and Nalbantoglu, 2014). Chemical reactions of soil produces strong inter particle bonds; which increases the unconfined compressive strength. (Yao et al., 2016) Illustrated that the in-situ test is not economic and easy. Physical model were used to study the effect of some properties of deep mixing method such as, column length, the area replacement ratio and surcharge load. Increasing of column length and area replacement ratio decreases the foundation settlement at the same surcharge load. However, increasing in column length is more efficient than higher area replacement ratio (Jamsawang et al., 2017).
-
Upload
khangminh22 -
Category
Documents
-
view
0 -
download
0
Transcript of 1 Stabilization of Soft Clay Soil by Deep Mixing Mohamed ...

1
Stabilization of Soft Clay Soil by Deep Mixing
Mohamed Mamdouh Zakaria1, Kamal Mohamed Hafez2, Walid Hamdy El Kamash3, Azza Hassan Moubarak3
1Engineering Dept., Suez Canal Authority, Ismailia, Egypt
2Professor, Geotechnical and Foundation Engineering Department, Faculty of Engineering, Suez Canal University, Ismailia, Egypt
3Associate Professor, Geotechnical and Foundation Engineering Department, Faculty of Engineering, Suez Canal University, Ismailia, Egypt
[email protected], [email protected], [email protected]
Abstract: East Port Said Port is considered one of the most important industrial regions in Egypt with soft clay soil. This paper focuses on the geotechnical properties of this area. To study the rehabilitation of this important region. Deep mixing method (DMM) with ordinary Portland cement or quicklime is used for soil improvement. In the laboratory, trial mix designs are used to compare soil properties before and after treatment. Effects of binder type, binder content, various water cement ratio and curing duration on soft clay improvement are studied. Three small-scale laboratory models (untreated soil model, model with end bearing deep mixing columns and model with floating deep mixing columns) are instrumented to measure the settlement of soil. Two Dimensional finite element analysis is carried out using PLAXIS program. A comparison between the 2D finite element analysis results and the physical model results is done. Results agree generally with each other. A finite element analysis is carried out to show the comparison between the performance of the soil with and without deep mixing. Effects of pile depth, pile spacing, pile diameter, pile type and soil compression index are illustrated in this study. Finally, according to the previous results, an equation is predicted to calculate the settlement using deep mixing method. [Mohamed Mamdouh Zakaria, Kamal Mohamed Hafez, Walid Hamdy El Kamash, Azza Hassan Moubarak. Stabilization of Soft Clay Soil by Deep Mixing. Life Sci J 2020;17(3):1-15]. ISSN: 1097-8135 (Print) / ISSN: 2372-613X (Online). http://www.lifesciencesite.com. 1. doi:10.7537/marslsj170320.01. Keywords: East Port Said Port, Soft clay, Deep mixing method, Stabilization, Finite element analysis.
1. Introduction East Port Said Port is one of the largest national
projects constructed on soft clay soil which opened in October 2004 to serve the world trade. Many projects are executed in this region. Settlement rates in this region were typically high (Hamed, O., 2017). Studying the effect of soft clay improvement using deep mixing method illustrated in many researches (Jiang et al., 2013). Three dimensional finite element methods are used to illustrate the settlement behavior of soft soils improved by deep mixed columns. Columns modulus, soft soil thickness, and area replacement ratio decrease the settlement of treated soft soil (Madhyannapu and Puppala, 2014). The effectiveness of the deep mixing technology and construction are discussed. An analytical model proposed for a deep soil mixing (DSM) to predict the settlement behavior of expansive sub-soils. Finally, the results indicated that the deep mixing method (DMS) technique was effective to improve soft clay soils. (Caraşca, 2016) Stated that soil treatment and stabilization by mixing is considered an economical method to improve soft clay. To understand the
properties of the improved soils, many experimental tests were performed on different artificial soils. Flexure strength, unconfined compressive strength tests and wave velocity measurements were carried out experimentally. In addition, porosity, permeability and density were studied on the hardened improved soil. Results in this paper follow the same trend as the results of the other studies. A laboratory- scale model is used to investigate the effect of improving the clay soil by installed deep mixing piles in a compacted clay soil (Abiodun and Nalbantoglu, 2014). Chemical reactions of soil produces strong inter particle bonds; which increases the unconfined compressive strength. (Yao et al., 2016) Illustrated that the in-situ test is not economic and easy. Physical model were used to study the effect of some properties of deep mixing method such as, column length, the area replacement ratio and surcharge load. Increasing of column length and area replacement ratio decreases the foundation settlement at the same surcharge load. However, increasing in column length is more efficient than higher area replacement ratio (Jamsawang et al., 2017).

Life Science Journal 2020;17(3) http://www.lifesciencesite.com LSJ
2
2. Soil Properties Of Port-Said Clay East Port Said Port area is composed of soft to
medium stiff clay extending to depth exceeding 50 meters (Hamed, O., 2017). Soil samples were collected from the study region and field investigations carried out through the Suez Canal Authority Research Center. The investigated zone has an approximated area of 42 square kilometers. Six boreholes with depths ranging from 42 to 63m were performed.
The generalized soil properties obtained from the boring logs are shown in Table 1. The soil strata are classified into several layers. Natural water content ranges from 57.50 to 84.21%, total unit weight ranges from 15.8 to 16.7 kN/m3, liquid limit ranges from 57 to 125%, plastic limit oscillates from 25 to 46%, and undrained shear strength varies from 6.5 to 34.5 kPa, which indicates that Port-Said clay layers are classified as very soft to firm clay (Hamed, O., 2017).
Table 1: Properties of Port-Said (Hamed, O., 2017).
Sample Extraction depth (m) w�
(%) Specific gravity
γ (kN/m3)
LL (%)
PI (%)
I� S� (kPa)
1 6-8 57.50 2.671 16.7 84 53 0.50 22.5 2 12-14 60.7 2.633 16.0 57 32 1.12 15 3 20-22 83.04 2.674 16.1 108 76 0.67 6.5 4 26-28 79.59 2.561 16.1 125 98 0.54 21.5 5 34-36 76.62 2.470 16.2 101 72 0.66 27.5 6 40-42 84.21 2.475 16.1 116 70 0.55 22.5 7 46-48 80.06 2.658 15.8 109 66 0.56 34.5
3. Soil Improvement Problematic soft clay soil is characterized by its
low bearing capacity, low shear strength, high compressibility and volume instability (Hebib and Farrell, 2003). Under such circumstances, any structure would be unstable, or the expected deformation during and/or after construction would exceed the allowable value, so necessary solutions must be undertaken (Larsson, S., 2003).
(a) Changing the type of structure foundation. (b) Replacing the problem soils. (c) Improving the properties of soft soil. (d) Introducing reinforcing material into soft soil. Soil improvement covers (b), (c) and (d) above
(Kitazume and Terashi, 2013).
4. Laboratory Program The laboratory Program is divided into two
phases. Trial mix samples according to.
Small scale model. 4.1. Trial Mix Samples
The main objective of this phase is to confirm the feasibility of using deep mixing method to improve strength and compressibility of soft clay soil for the studied region through an experimental program in the laboratory. After reviewing literature and projects on soil improvement, Samples are prepared by changing binder type, binder quantity, water cement ratio, and curing duration. Samples taken from depth 26 to 28m are selected for trial mix tests to test the properties before and after treatment. Five cement ratios, two binder types, three binder contents, and four curing duration are used for comparison of the results as shown in Table 2. The experimental program procedures and the variables were chosen based on past researches (Liu et al., 2017), (li et al., 2016), and (Mullins et al., 2015).
Table 2: Experimental Program for Mixing Tests
Binder Binder quantity Water cement ratio Curing time Cement 150 kg/m3 0, 1, 1.2, 1.4, 1.6 7 Cement 150 kg/ m3 1 3, 7, 14, 28 Cement 200 kg/ m3 1 3, 7, 14, 28 Cement 250 kg/ m3 1 3, 7, 14, 28 Quicklime 150 kg/ m3 1 3, 7, 14, 28 Quicklime 200 kg/m3 1 3, 7, 14, 28 Quicklime 250 kg/m3 1 3, 7, 14, 28

Life Science Journal 2020;17(3) http://www.lifesciencesite.com LSJ
3
In order to determine the optimum water cement ratio of the soil, soft clay samples were intimately mixed with cement at quantity of 150 kg/m3 of wet soil, and at various water cement ratios. First, wet cement slurry was prepared by mixing cement with water according to a 0, 1, 1.2, 1.4, and 1.6 water cement ratio. Water was added in three separate batches into the cement to allow slurry homogenization. The slurry was mixed with two spatulas and hand for one minute in between each interval of pouring to assure a homogeneous mixture. The final state of the slurry should be liquid.
Second, untreated soils were homogenized with the Matest Mixer. Samples were transferred to the mixer’s metal bowl and placed under the mixer’s mechanical mixing hook. A mixing speed setting of Level 1, or 140 RPM, was used for 10 minutes to homogenize the clay soil before cement addition. Next, binder slurry was added to the untreated soil in
four batches. The mixer was turned off first to add the first batch of binder slurry. Then the mixture was allowed to mix for one minute at the speed Level 1. After one minute, the second batch was added with the same mixing procedure until all binders were added. During the mixing intervals, the side of the mixing bowl was scraped with spatula to ensure consistent homogenization of the mixture. The mixing speed was switched to Level 2 or 240 RPM after adding the fourth batch of cement slurry to further homogenize the mixture. Figure 1 shows preparing of the specimen in laboratory.
After the soil was mixed, it was compacted into steel tubes with diameter 5 cm and depth 15 cm, in 3 layers, tamping between each layer. Finally, the samples were extracted from the tubes and saved in paraffin wax and stored in climate-controlled area for 7 days.
(a) Mixer (b) soft soil before mixing (c) Cement mix
Figure 1: Preparing of the specimen in laboratory.
(a) Sample in Steel Tube (b) Sample after Extracting (c) Paraffin Wax
(d) Sample after Saving (e) Climate-Controlled Area
Figure 2: Sample Saving and Curing
Life Science Journal 2020;17(3) http://www.lifesciencesite.com LSJ
4
The results show that the ideal water cement ratio for the samples is one. The same previous steps were repeated with quicklime at content of 150, 200, and 250 kg/m3 of wet soil, water cement ratio of one, and at curing time of 3, 7, 14, and 28 days. Three specimens were molded for each curing period. The average undrained shear strength of the samples for each curing period was determined by unconfined compression tests (Bergado et al., 1999).
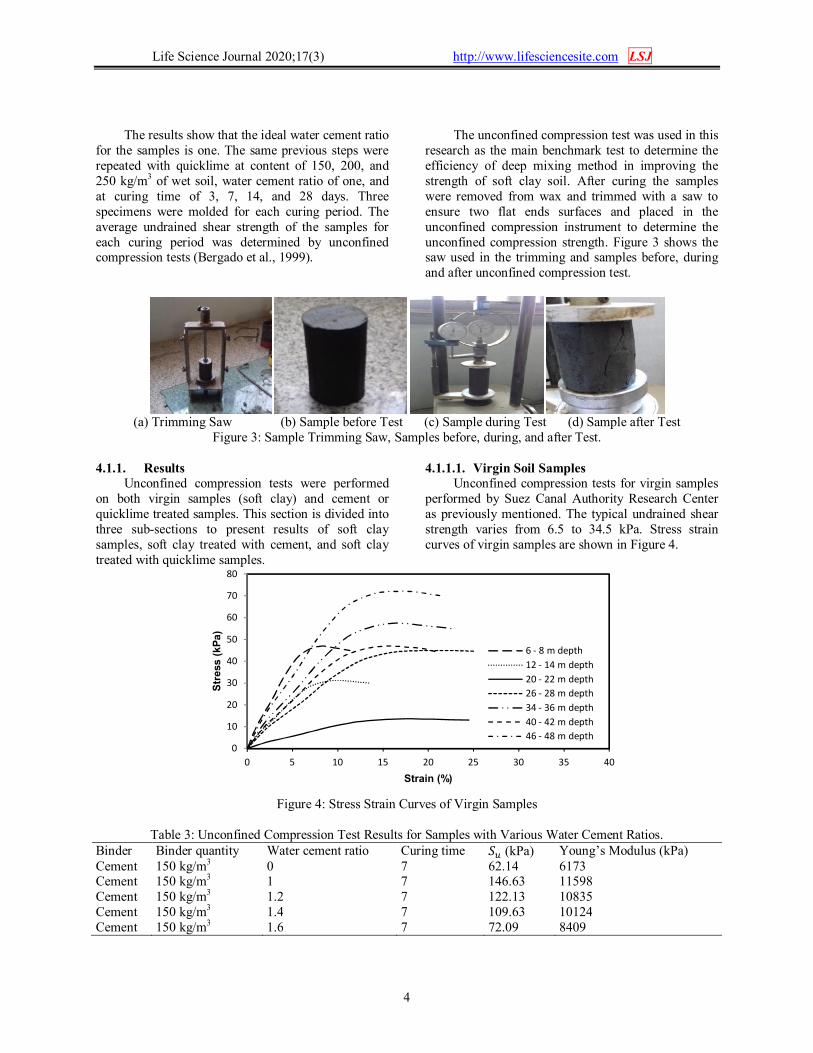
The unconfined compression test was used in this research as the main benchmark test to determine the efficiency of deep mixing method in improving the strength of soft clay soil. After curing the samples were removed from wax and trimmed with a saw to ensure two flat ends surfaces and placed in the unconfined compression instrument to determine the unconfined compression strength. Figure 3 shows the saw used in the trimming and samples before, during and after unconfined compression test.
(a) Trimming Saw (b) Sample before Test (c) Sample during Test (d) Sample after Test
Figure 3: Sample Trimming Saw, Samples before, during, and after Test.
4.1.1. Results Unconfined compression tests were performed
on both virgin samples (soft clay) and cement or quicklime treated samples. This section is divided into three sub-sections to present results of soft clay samples, soft clay treated with cement, and soft clay treated with quicklime samples.
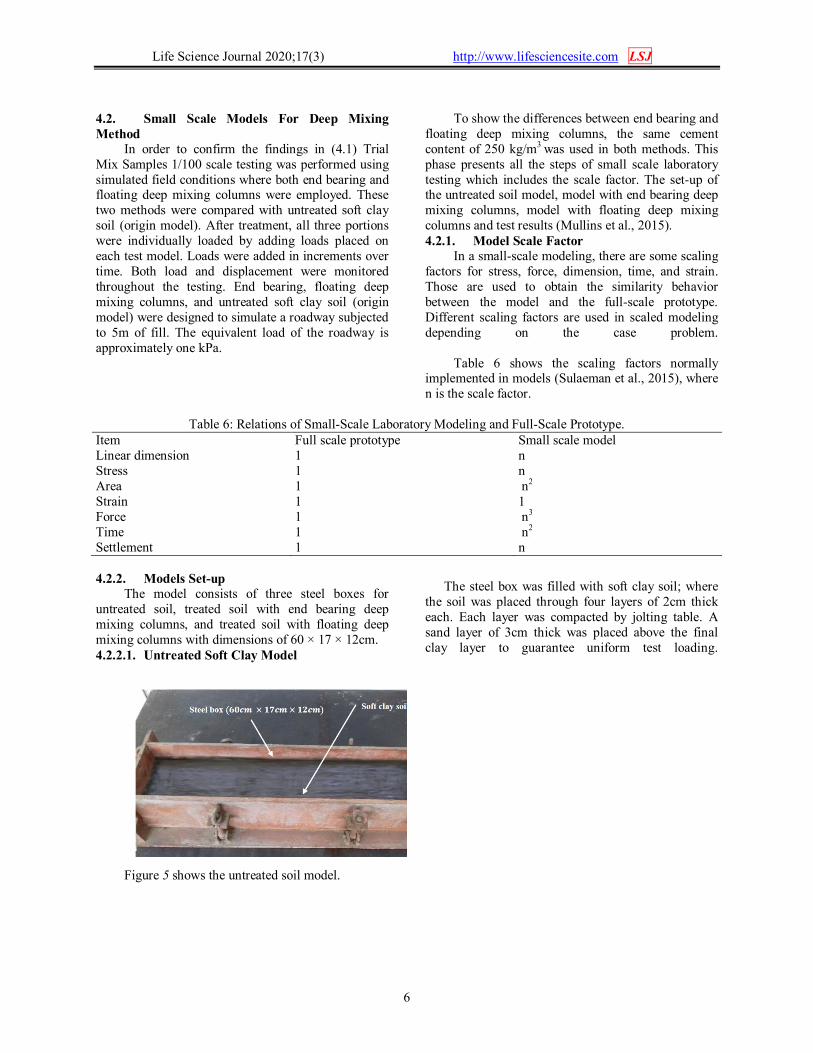
4.1.1.1. Virgin Soil Samples Unconfined compression tests for virgin samples
performed by Suez Canal Authority Research Center as previously mentioned. The typical undrained shear strength varies from 6.5 to 34.5 kPa. Stress strain curves of virgin samples are shown in Figure 4.
Figure 4: Stress Strain Curves of Virgin Samples
Table 3: Unconfined Compression Test Results for Samples with Various Water Cement Ratios.
Binder Binder quantity Water cement ratio Curing time �� (kPa) Young’s Modulus (kPa) Cement 150 kg/m3 0 7 62.14 6173 Cement 150 kg/m3 1 7 146.63 11598 Cement 150 kg/m3 1.2 7 122.13 10835 Cement 150 kg/m3 1.4 7 109.63 10124 Cement 150 kg/m3 1.6 7 72.09 8409
0
10
20
30
40
50
60
70
80
0 5 10 15 20 25 30 35 40
Str
ess (
kP
a)
Strain (%)
6 - 8 m depth
12 - 14 m depth
20 - 22 m depth
26 - 28 m depth
34 - 36 m depth
40 - 42 m depth
46 - 48 m depth

Life Science Journal 2020;17(3) http://www.lifesciencesite.com LSJ
5
4.1.1.2. Soft Clay Treated with Cement
Before starting of tests, the samples with cement content of 150 kg/m3, water cement ratio of 0, 1, 1.2, 1.4, and 1.6, and at curing time of 7 days were tested to determine the optimum water cement ratio. The optimum water cement ratio for the studied soft clay is one. The unconfined compression tests for samples with various water cement ratios are summarized in Error! Reference source not found.. Then, the remaining cement samples were prepared and tested with different cement contents, water cement ratio of one, and at various curing days. The unconfined compression tests for soft clay treated with cement are summarized in Soft Clay Treated with Quicklime
The efficiency of quicklime treatment is tested by using samples taken from the test pits. Quicklime stabilization was effective in strengthening organic soils (Liu et al., 2017). High calcium quicklime was used in this study. The quicklime quantities were 150, 200, and 250 kg/m3 and curing durations were 3, 7, 14, and 28 days.
Based on the unconfined compression test results, the efficiency of quicklime in treating the site clay is very low. Normally quicklime is not efficient in treating soft clay soils though it may be excellent for other problematic soils (Liu et al., 2017). The unconfined compression tests for clay treated with quicklime are summarized in Table 5.
Table 4.
4.1.1.3. Soft Clay Treated with Quicklime The efficiency of quicklime treatment is tested
by using samples taken from the test pits. Quicklime stabilization was effective in strengthening organic soils (Liu et al., 2017). High calcium quicklime was used in this study. The quicklime quantities were 150,
200, and 250 kg/m3 and curing durations were 3, 7, 14, and 28 days.
Based on the unconfined compression test results, the efficiency of quicklime in treating the site clay is very low. Normally quicklime is not efficient in treating soft clay soils though it may be excellent for other problematic soils (Liu et al., 2017). The unconfined compression tests for clay treated with quicklime are summarized in Table 5.
Table 4: Unconfined Compression Test Results for Soft Clay Treated with Cement Samples
Binder Binder quantity Water cement ratio Curing time �� (kPa) Young’s Modulus (kPa) Cement 150 kg/m3 1 3 98.4 7872 Cement 150 kg/m3 1 7 147.6 11648 Cement 150 kg/m3 1 14 168.3 13464 Cement 150 kg/m3 1 28 196.8 16588 Cement 200 kg/m3 1 3 111.4 8912 Cement 200 kg/m3 1 7 195.0 16608 Cement 200 kg/m3 1 14 222.7 18448 Cement 200 kg/m3 1 28 247.4 22032 Cement 250 kg/m3 1 3 142.0 11360 Cement 250 kg/m3 1 7 213.0 17936 Cement 250 kg/m3 1 14 232.9 19616 Cement 250 kg/m3 1 28 284.0 25120
Table 5: Unconfined Compression Test Results for Clay Treated with Quicklime Samples.
Binder Binder quantity Water lime ratio Curing time �� (kPa) Young’s Modulus (kPa) Quicklime 150 kg/m3 1 3 22.5 2007 Quicklime 150 kg/m3 1 7 33.8 2970 Quicklime 150 kg/m3 1 14 39.6 3433 Quicklime 150 kg/m3 1 28 45.0 4230 Quicklime 200 kg/m3 1 3 34.2 2273 Quicklime 200 kg/m3 1 7 40.8 4235 Quicklime 200 kg/m3 1 14 48.8 4704 Quicklime 200 kg/m3 1 28 51.0 5618 Quicklime 250 kg/m3 1 3 43.0 2897 Quicklime 250 kg/m3 1 7 58.9 4574 Quicklime 250 kg/m3 1 14 61.0 5002 Quicklime 250 kg/m3 1 28 71.7 6406
Life Science Journal 2020;17(3) http://www.lifesciencesite.com LSJ
6
4.2. Small Scale Models For Deep Mixing Method
In order to confirm the findings in (4.1) Trial Mix Samples 1/100 scale testing was performed using simulated field conditions where both end bearing and floating deep mixing columns were employed. These two methods were compared with untreated soft clay soil (origin model). After treatment, all three portions were individually loaded by adding loads placed on each test model. Loads were added in increments over time. Both load and displacement were monitored throughout the testing. End bearing, floating deep mixing columns, and untreated soft clay soil (origin model) were designed to simulate a roadway subjected to 5m of fill. The equivalent load of the roadway is approximately one kPa.
To show the differences between end bearing and floating deep mixing columns, the same cement content of 250 kg/m3 was used in both methods. This phase presents all the steps of small scale laboratory testing which includes the scale factor. The set-up of the untreated soil model, model with end bearing deep mixing columns, model with floating deep mixing columns and test results (Mullins et al., 2015). 4.2.1. Model Scale Factor
In a small-scale modeling, there are some scaling factors for stress, force, dimension, time, and strain. Those are used to obtain the similarity behavior between the model and the full-scale prototype. Different scaling factors are used in scaled modeling depending on the case problem.
Table 6 shows the scaling factors normally implemented in models (Sulaeman et al., 2015), where n is the scale factor.
Table 6: Relations of Small-Scale Laboratory Modeling and Full-Scale Prototype.
Item Full scale prototype Small scale model Linear dimension 1 n Stress 1 n Area 1 n2 Strain 1 1 Force 1 n3 Time 1 n2 Settlement 1 n 4.2.2. Models Set-up
The model consists of three steel boxes for untreated soil, treated soil with end bearing deep mixing columns, and treated soil with floating deep mixing columns with dimensions of 60 × 17 × 12cm. 4.2.2.1. Untreated Soft Clay Model
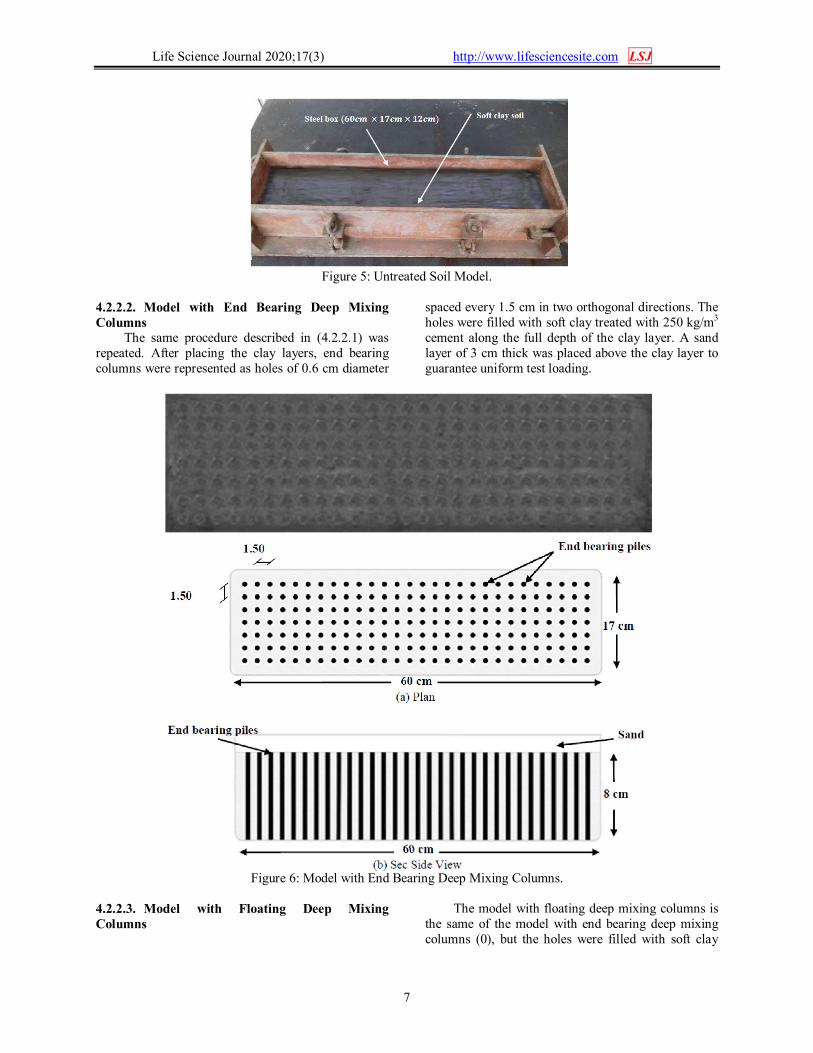
The steel box was filled with soft clay soil; where the soil was placed through four layers of 2cm thick each. Each layer was compacted by jolting table. A sand layer of 3cm thick was placed above the final clay layer to guarantee uniform test loading.
Figure 5 shows the untreated soil model.
Life Science Journal 2020;17(3) http://www.lifesciencesite.com LSJ
7
Figure 5: Untreated Soil Model.
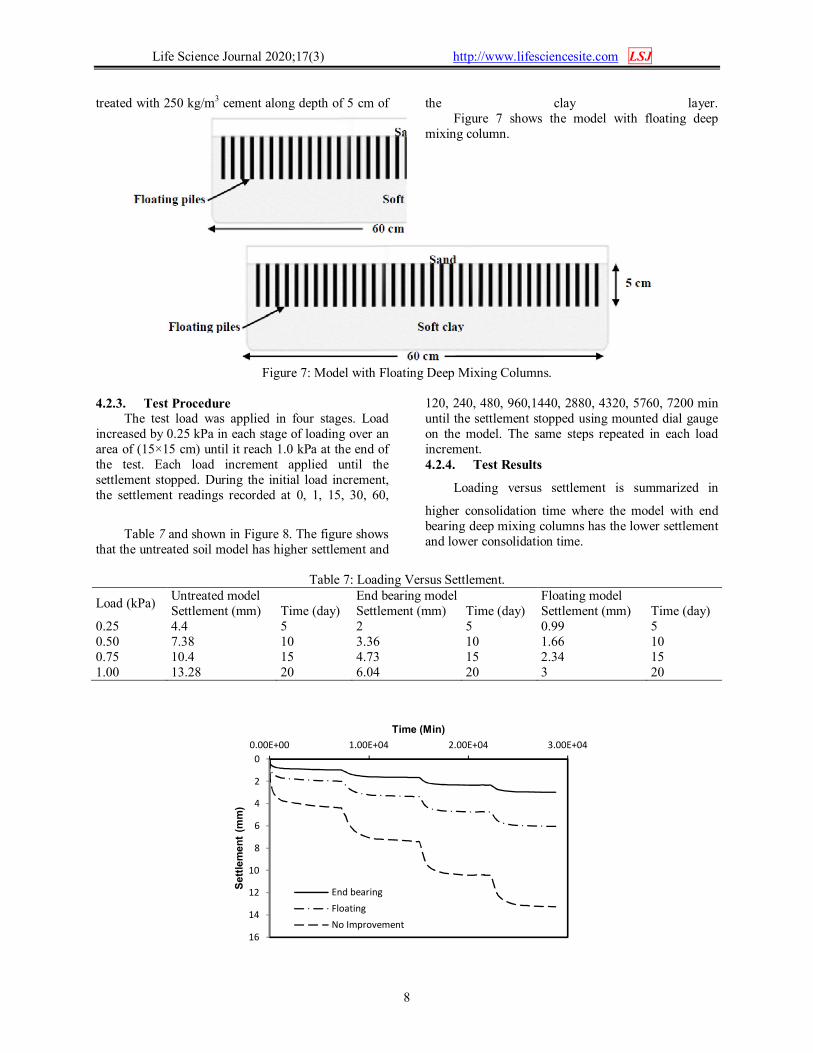
4.2.2.2. Model with End Bearing Deep Mixing Columns
The same procedure described in (4.2.2.1) was repeated. After placing the clay layers, end bearing columns were represented as holes of 0.6 cm diameter
spaced every 1.5 cm in two orthogonal directions. The holes were filled with soft clay treated with 250 kg/m3 cement along the full depth of the clay layer. A sand layer of 3 cm thick was placed above the clay layer to guarantee uniform test loading.
Figure 6: Model with End Bearing Deep Mixing Columns.
4.2.2.3. Model with Floating Deep Mixing Columns
The model with floating deep mixing columns is the same of the model with end bearing deep mixing columns (0), but the holes were filled with soft clay
Life Science Journal 2020;17(3) http://www.lifesciencesite.com LSJ
8
treated with 250 kg/m3 cement along depth of 5 cm of the clay layer.
Figure 7 shows the model with floating deep mixing column.
Figure 7: Model with Floating Deep Mixing Columns.
4.2.3. Test Procedure
The test load was applied in four stages. Load increased by 0.25 kPa in each stage of loading over an area of (15×15 cm) until it reach 1.0 kPa at the end of the test. Each load increment applied until the settlement stopped. During the initial load increment, the settlement readings recorded at 0, 1, 15, 30, 60,
120, 240, 480, 960,1440, 2880, 4320, 5760, 7200 min until the settlement stopped using mounted dial gauge on the model. The same steps repeated in each load increment. 4.2.4. Test Results
Loading versus settlement is summarized in
Table 7 and shown in Figure 8. The figure shows that the untreated soil model has higher settlement and
higher consolidation time where the model with end bearing deep mixing columns has the lower settlement and lower consolidation time.
Table 7: Loading Versus Settlement.
Load (kPa) Untreated model End bearing model Floating model Settlement (mm) Time (day) Settlement (mm) Time (day) Settlement (mm) Time (day)
0.25 4.4 5 2 5 0.99 5 0.50 7.38 10 3.36 10 1.66 10 0.75 10.4 15 4.73 15 2.34 15 1.00 13.28 20 6.04 20 3 20
0
2
4
6
8
10
12
14
16
0.00E+00 1.00E+04 2.00E+04 3.00E+04
Sett
lem
en
t (m
m)
Time (Min)
End bearing
Floating
No Improvement
Life Science Journal 2020;17(3) http://www.lifesciencesite.com LSJ
9
Figure 8: Loading Versus Settlement Curve
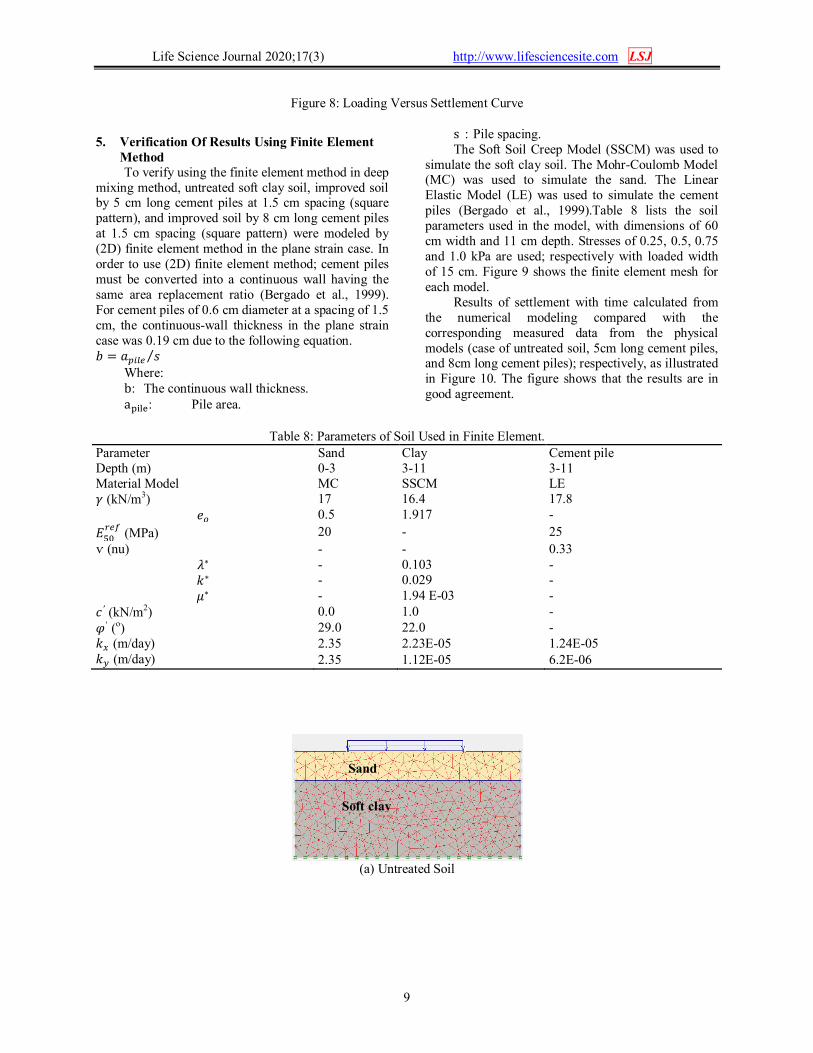
5. Verification Of Results Using Finite Element Method To verify using the finite element method in deep
mixing method, untreated soft clay soil, improved soil by 5 cm long cement piles at 1.5 cm spacing (square pattern), and improved soil by 8 cm long cement piles at 1.5 cm spacing (square pattern) were modeled by (2D) finite element method in the plane strain case. In order to use (2D) finite element method; cement piles must be converted into a continuous wall having the same area replacement ratio (Bergado et al., 1999). For cement piles of 0.6 cm diameter at a spacing of 1.5 cm, the continuous-wall thickness in the plane strain case was 0.19 cm due to the following equation. � = ����� �⁄
Where: b: The continuous wall thickness. a����: Pile area.
s: Pile spacing. The Soft Soil Creep Model (SSCM) was used to
simulate the soft clay soil. The Mohr-Coulomb Model (MC) was used to simulate the sand. The Linear Elastic Model (LE) was used to simulate the cement piles (Bergado et al., 1999).Table 8 lists the soil parameters used in the model, with dimensions of 60 cm width and 11 cm depth. Stresses of 0.25, 0.5, 0.75 and 1.0 kPa are used; respectively with loaded width of 15 cm. Figure 9 shows the finite element mesh for each model.
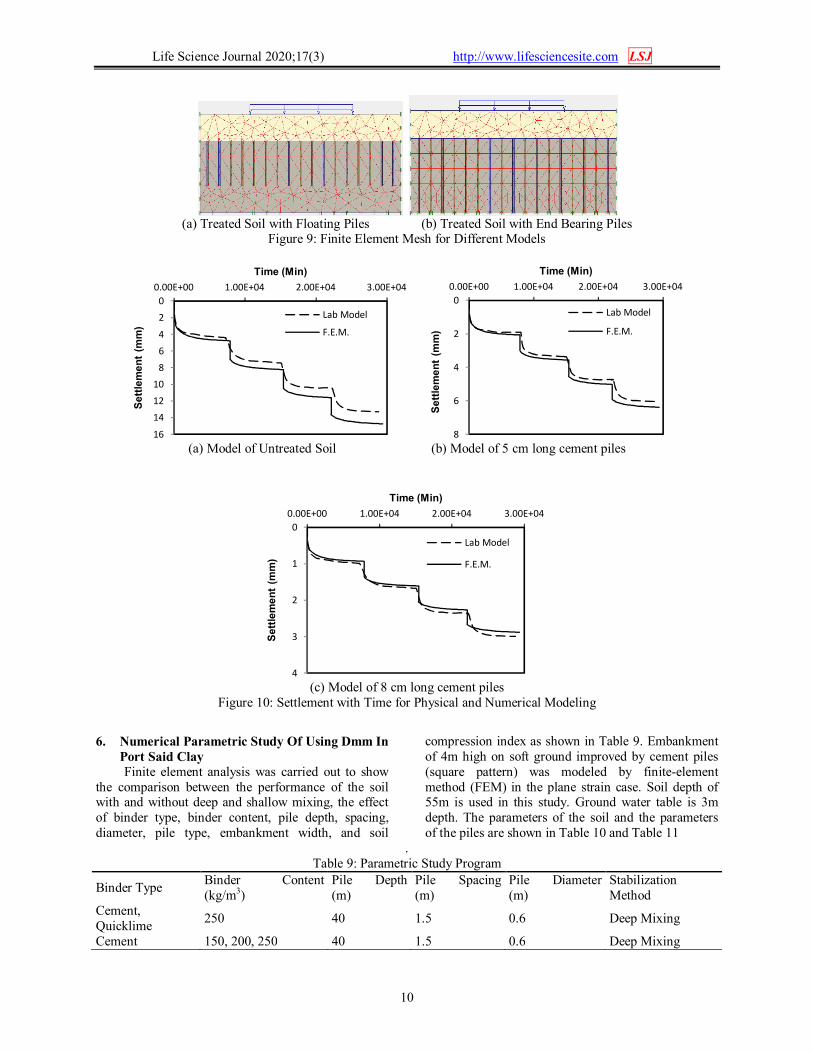
Results of settlement with time calculated from the numerical modeling compared with the corresponding measured data from the physical models (case of untreated soil, 5cm long cement piles, and 8cm long cement piles); respectively, as illustrated in Figure 10. The figure shows that the results are in good agreement.
Table 8: Parameters of Soil Used in Finite Element.
Parameter Sand Clay Cement pile Depth (m) 0-3 3-11 3-11 Material Model MC SSCM LE � (kN/m3) 17 16.4 17.8
�� 0.5 1.917 -
������
(MPa) 20 - 25
ѵ (nu) - - 0.33 �∗ - 0.103 - �∗ - 0.029 - �∗ - 1.94 E-03 -
�′ (kN/m2) 0.0 1.0 - �′ (o) 29.0 22.0 - �� (m/day) 2.35 2.23E-05 1.24E-05 �� (m/day) 2.35 1.12E-05 6.2E-06
(a) Untreated Soil
Soft clay
Sand
Life Science Journal 2020;17(3) http://www.lifesciencesite.com LSJ
10
(a) Treated Soil with Floating Piles (b) Treated Soil with End Bearing Piles
Figure 9: Finite Element Mesh for Different Models
(a) Model of Untreated Soil (b) Model of 5 cm long cement piles
(c) Model of 8 cm long cement piles
Figure 10: Settlement with Time for Physical and Numerical Modeling
6. Numerical Parametric Study Of Using Dmm In
Port Said Clay Finite element analysis was carried out to show
the comparison between the performance of the soil with and without deep and shallow mixing, the effect of binder type, binder content, pile depth, spacing, diameter, pile type, embankment width, and soil
compression index as shown in Table 9. Embankment of 4m high on soft ground improved by cement piles (square pattern) was modeled by finite-element method (FEM) in the plane strain case. Soil depth of 55m is used in this study. Ground water table is 3m depth. The parameters of the soil and the parameters of the piles are shown in Table 10 and Table 11
. Table 9: Parametric Study Program
Binder Type Binder Content (kg/m3)
Pile Depth (m)
Pile Spacing (m)
Pile Diameter (m)
Stabilization Method
Cement, Quicklime
250 40 1.5 0.6 Deep Mixing
Cement 150, 200, 250 40 1.5 0.6 Deep Mixing
0
2
4
6
8
10
12
14
16
0.00E+00 1.00E+04 2.00E+04 3.00E+04
Sett
lem
en
t (m
m)
Time (Min)
Lab Model
F.E.M.
0
2
4
6
8
0.00E+00 1.00E+04 2.00E+04 3.00E+04
Sett
lem
en
t (m
m)
Time (Min)
Lab Model
F.E.M.
0
1
2
3
4
0.00E+00 1.00E+04 2.00E+04 3.00E+04
Sett
lem
en
t (m
m)
Time (Min)
Lab Model
F.E.M.

Life Science Journal 2020;17(3) http://www.lifesciencesite.com LSJ
11
Cement 250 20, 30, 40 1.5 0.6 Deep Mixing Cement 250 40 1.5, 2.0, 2.5 0.6 Deep Mixing Cement 250 40 2.5 0.6,0.8, 1.0 Deep Mixing Cement 250 40 1.5 0.6 Deep Mixing
Table 10: Port Said Soil Parameters Used in PLAXIS 2D
Parameter Fill & Sand Clay 1 Clay 2 Clay 3 Clay 4 Sand Depth (m) 0-3 3-15 15-25 25-35 35-51 51-55 Material Model MC SSCM SSCM SSCM SSCM MC � (kN/m3) 17 16.7 15.9 15.8 15.7 18
�� 0.5 1.64 1.90 2.01 2.03 0.5 ��� (MPa) 20 - - - - 30
�∗ - 0.084 0.118 0.114 0.111 - �∗ - 0.031 0.026 0.028 0.032 - �∗ - 0.0009 0.0015 0.0019 0.0021 -
�′ (kN/m2) 0.0 1.0 1.0 1.0 1.0 0.0 �′ (o) 29.0 22.0 22.0 22.0 22.0 35.0 �� (m/day) 4.70 4.62E-5 3.63E-5 3.23E-5 2.69E-5 4.70 �� (m/day) 2.35 2.31E-5 1.81E-5 1.63E-5 1.34E-5 2.35
�� 0.52 0.557 0.691 0.752 0.779 0.43
Table 11: Deep Mixing Piles Parameters Used in PLAXIS 2D
Parameter Pile (150 kg cement) Pile (200 kg cement) Pile (250 kg cement) Pile (250 kg Quicklime) Depth (m) 0-40 0-40 0-40 0-40 Material Model LE LE LE LE
(kN/m3) 17.5 17.6 17.8 17.65
E�� (MPa) 16.5 22 25 6.5 ѵ (nu) 0.33 0.33 0.33 0.2
k� 1.47E-5 1.35E-5 1.24E-5 1.42E-5 k� 7.3E-6 6.7E-6 6.2E-6 6.9E-6
6.1. Effect of Binder type
Effect of binder type has been studied using a binder content of 250 kg/m3, 40 m pile depth, 1.5m pile spacing, 0.6m pile diameter, and two different binder types (quicklime and cement). The embankment width is 24m. The equivalent continuous wall width in the plain strain case was 0.19m. The FEM mesh of soil treated with deep mixing is shown in Figure 11. Final settlements measured by this model
at the crest center of embankment are 1.43, 0.73, and 0.34 m for untreated soil, treated soil with quicklime and treated soil with cement, respectively as presented in Figure 12. Settlement reduction factors are 0.48, and 0.76 for treated soil with quicklime and treated soil with cement, respectively. Figure 13 shows the deformed meshes for 4m high embankment on untreated soil and on treated soil with various binder types.
Figure 11: The FEM Mesh of Deep Mixing Method.
Fill & sand
Clay 3
Clay 2
Clay 1
Clay 4
Sand
3 m
12 m
10 m
16 m
4 m
10 m
40 m

Life Science Journal 2020;17(3) http://www.lifesciencesite.com LSJ
12
Figure 12: Settlement-Time Relationship for Deep Mixing at Various Binder Types.
(a) Untreated Soil (b) Treated Soil with Quicklime (c) Treated Soil with Cement (Max Settlement = 1.43m) (Max Settlement = 0.73m) (Max Settlement = 0.34m)
Figure 13: The Deformed Meshes of 4m High Embankment for at Various Binder Types.
6.2. Effect of Binder (Cement) Content Effect of binder content was studied using
cement piles with 40m pile depth, 1.5m pile spacing, 0.6m pile diameter, and three different cement contents of 150, 200, and 250 kg/m3. The embankment width is 24m. Final settlements measured by this model at the crest center of embankment are 1.43, 0.43, 0.38, and 0.34 m for untreated soil, treated soil with cement content of 150, 200, and 250 kg/m3, respectively as shown in
Figure 14: Settlement-Time Relationship at Various Cement Contents
Figure 15: Settlement-Time Relationship at Various Pile Depths
. Settlement reduction factors are 0.70, 0.73, and 0.76 for treated soil with 150, 200, and 250 kg/m3 cement content, respectively. 6.3. Effect of Pile Depth
Effect of pile depth was studied using cement piles with 250 kg/m3 cement content, 1.5m pile spacing, 0.6m pile diameter, and three different pile depths 20, 30, and 40 m. The embankment width is 24m. The equivalent continuous wall width in the plain strain case was 0.19m. Final settlements
measured by this model at the crest center of embankment are 1.43, 0.74, 0.52 and 0.34m for untreated soil, treated soil with 20, 30, and 40 m pile depth, respectively as presented in. Settlement reduction factors are 0.48, 0.64, and 0.76 for treated soil with 20, 30, and 40m pile depth, respectively. 6.4. Effect of Pile Spacing
Effect of pile spacing was studied using cement piles with 250 kg/m3 cement content, 40m pile depth, 0.6m pile diameter, and three different pile spacing 1.5, 2, and 2.5m. Embankment width is 24m. Final settlements measured by this model at the crest center of embankment are 1.43, 0.34, 0.46, and 0.59m for untreated soil, treated soil with 1.5, 2, and 2.5m pile spacing, respectively as presented in
Figure 15: Settlement-Time Relationship at Various Pile Spacing
Figure 16: Settlement-Time Relationship at Various Pile Diameters
. Settlement reduction factors are 0.76, 0.67, and 0.58 for treated soil with 1.5, 2, and 2.5m pile spacing, respectively.
0.0
0.2
0.4
0.6
0.8
1.0
1.2
1.4
1.6
0 5 10 15 20 25 30 35 40
Sett
lem
en
t (m
)
Time (year)
un treated
CemetLime

Life Science Journal 2020;17(3) http://www.lifesciencesite.com LSJ
13
Figure 14: Settlement-Time Relationship at Various Cement Contents
Figure 15: Settlement-Time Relationship at Various Pile Depths
6.5. Effect of Pile Diameter
Effect of pile diameter was studied using cement piles with 250 kg/m3 cement content, 40m pile depth, 2.5m pile spacing, and three different pile diameters 0.6, 0.8, and 1m. The embankment width is 24m. Final settlements measured by this model at the crest center
of embankment are 1.43, 0.59, 0.44, and 0.36 m for untreated soil, treated soil with 0.6, 0.8, and 1 m pile diameter, respectively as presented in Figure 16. Settlement reduction factors are 0.58, 0.69, and 0.74 for treated soil with 0.6, 0.8, and 1m pile diameter, respectively.
Figure 15: Settlement-Time Relationship at Various Pile Spacing
Figure 16: Settlement-Time Relationship at Various Pile Diameters
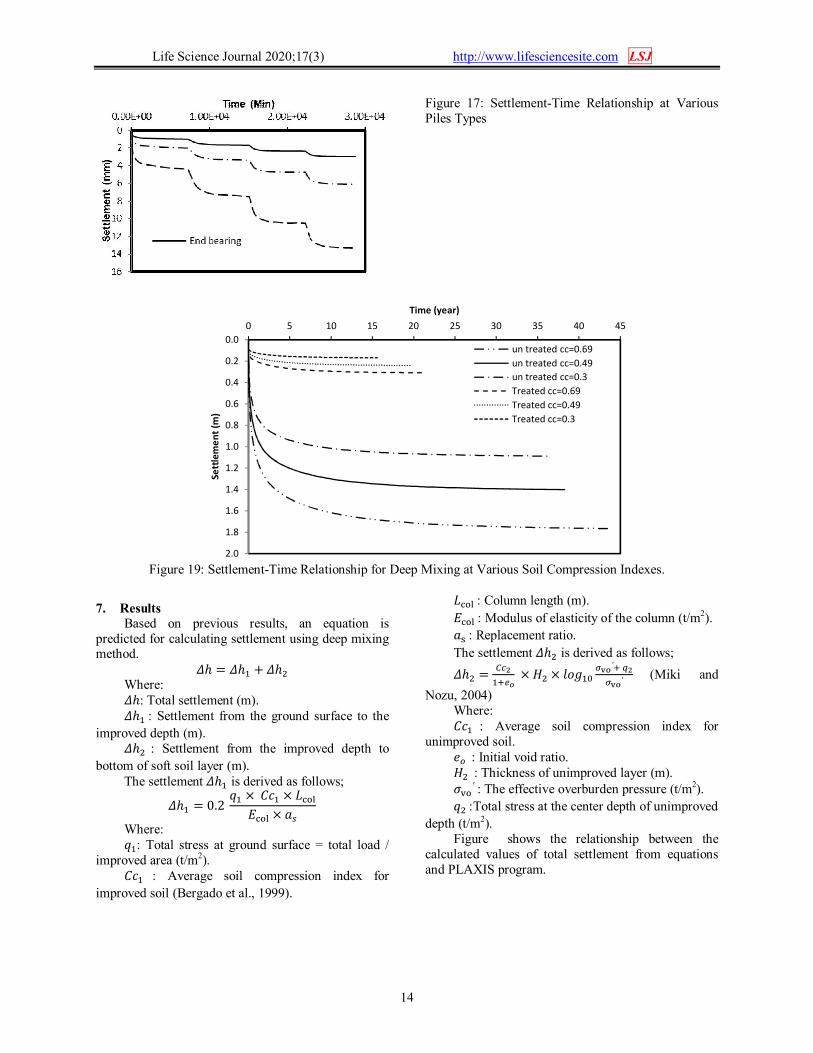
6.6. Effect of Pile Type
Effect of pile type (floating and end bearing) was studied using cement piles with 250 kg/m3 cement content, 1.5m pile spacing, 0.6m pile diameter, and two different pile types (floating and end bearing). The embankment width is 24m. Final settlements measured by this model at the crest center of embankment are 1.43, 0.74, and 0.23m for untreated soil, treated soil with floating piles, and end bearing piles, respectively as presented in Figure 17. Settlement reduction factors are 0.48 and 0.84 for treated soil with floating piles and end bearing piles, respectively. 6.7. Effect of Soil Compression Index
Effect of soil compression index was studied using cement piles with 250 kg/m3 cement content, 40 m pile depth, 2.5m pile spacing, 0.6m pile diameter, and three soil compression indexes (0.69, 0.49, and
0.3). Embankment width is 24m. The equivalent continuous wall width in the plain strain case was 0.19m. Final settlements measured by this model at the crest center of embankment are 1.77, 1.40, 1.09, 0.31, 0.24, and 0.17m for untreated soil of 0.69 compression index, untreated soil of 0.49 compression index, untreated soil of 0.3 compression index, treated soil of 0.69 compression index, treated soil of 0.49 compression index, and treated soil of 0.3 compression index, respectively as presented in Figure 19. Settlement reduction factors are 0.82, 0.83, and 0.84 for treated soil of 0.69 compression index, treated soil of 0.49 compression index, and treated soil of 0.3 compression index, respectively.
0.0
0.2
0.4
0.6
0.8
1.0
1.2
1.4
1.6
0 5 10 15 20 25 30 35 40
Sett
lem
en
t (m
)
Time (year)
un treated250 kg/m3200 kg/m3150 kg/m3
Life Science Journal 2020;17(3) http://www.lifesciencesite.com LSJ
14
Figure 17: Settlement-Time Relationship at Various Piles Types
Figure 19: Settlement-Time Relationship for Deep Mixing at Various Soil Compression Indexes.
7. Results Based on previous results, an equation is
predicted for calculating settlement using deep mixing method.
�ℎ = �ℎ� + �ℎ� Where: �ℎ: Total settlement (m). �ℎ�: Settlement from the ground surface to the
improved depth (m). �ℎ� : Settlement from the improved depth to
bottom of soft soil layer (m). The settlement �ℎ� is derived as follows;
�ℎ� = 0.2�� ×��� × ����
���� × ��
Where: ��: Total stress at ground surface = total load /
improved area (t/m2). ��� : Average soil compression index for
improved soil (Bergado et al., 1999).
����: Column length (m).
����: Modulus of elasticity of the column (t/m2).
��: Replacement ratio.
The settlement �ℎ� is derived as follows;
�ℎ� =���
����× �� × �����
���′���
���′ (Miki and
Nozu, 2004) Where: ��� : Average soil compression index for
unimproved soil. ��: Initial void ratio. ��: Thickness of unimproved layer (m). ���
′: The effective overburden pressure (t/m2).
��: Total stress at the center depth of unimproved
depth (t/m2). Figure shows the relationship between the
calculated values of total settlement from equations and PLAXIS program.
0.0
0.2
0.4
0.6
0.8
1.0
1.2
1.4
1.6
1.8
2.0
0 5 10 15 20 25 30 35 40 45
Sett
lem
en
t (m
)
Time (year)
un treated cc=0.69
un treated cc=0.49
un treated cc=0.3
Treated cc=0.69
Treated cc=0.49
Treated cc=0.3

Life Science Journal 2020;17(3) http://www.lifesciencesite.com LSJ
15
Figure 20: Relationship between Calculated Settlement from Equations and PLAXIS program
8. Conclusion
From the results of laboratory program and numerical modeling, the following conclusions can be drawn.
Increasing the cement content from 150 to 250kg/m3 improves the unconfined compression strength by 35.5% and decreases settlement of the embankment by 21% after curing time 28 days. One the other hand, increasing the lime content is not efficient to increase the values of the unconfined compression strength.
Curing time has a significant effect on the unconfined compression strength. Increasing the time from 7 to 28 days increases the strength by 25% at cement content 150 kg/m3.
The optimum water cement ratio in laboratory mixed samples equals one.
Settlement of the embankment decreases by 54% when, the pile depth increases from 20 to 40m at cement content 250kg/m3, 1.5m pile spacing and 0.6m pile diameter.
Pile spacing 1.5m considers a suitable spacing to reduce the value of the embankment settlement. Settlement reduction factor for 1.5m pile spacing equals 0.76 at 250kg/m3 cement content, 40m pile depth.
Settlement reduction factor increases from 0.58 to 0.74 for pile diameter 0.6m and 1m, respectively at 250kg/m3, 40m pile depth and 2.5m pile spacing.
End bearing piles are more effective than floating piles in improvement of soft clay.
Decreasing the compression index from 0.69 to 0.3 decreases the settlement by 45% for treated soil by deep mixing pile.
9. Acknowledgments The authors would like to thank the staff and
directors of the geotechnical laboratory of Suez Canal Authority for their support with the laboratory testing program.
References 1. Abiodun, A. A., and Nalbantoglu, Z., "Lime Pile
Techniques for the Improvement of Clay Soils", Canadian Geotechnical Journal, Vol. 52, Issue 6, pp. 760-768, 2014.
2. Bergado, D. T., Ruenkrairergsa, T., Taesiri, Y., and Balasubramaniam, A. S., "Deep Soil Mixing Used to Reduce Embankment Settlement", Proceedings of the Institution of Civil Engineers-Ground Improvement, Vol. 3, Issue. 4, pp. 145-162, 1999.
3. Caraşca, O., "Soil Improvement by Mixing: Techniques and Performances", Energy Procedia, Vol. 85, pp. 85-92, 2016.
4. Hamed, O., "Modeling and Laboratory Testing of Port Said Marine Clay and Applications on Geotechnical Design of Ports", A Thesis Submitted in Partial Fulfilled for the Requirement of The Degree of Doctor of Philosophy in Civil Engineering, Ain Shams university, 2017.
5. Hebib, S. and Farrell, E.R., "Some Experiences on the Stabilization of Irish Peats", Canadian Geotechnical Journal, Vol. 40, Issue. 1, pp. 107-120, 2003.
6. Jamsawang, P., Nuansrithong, N., Voottipruex, P., Songpiriyakij, S., and Jongpradist, P., "Laboratory investigations on The Swelling Behavior of Composite Expansive Clays Stabilized with Shallow and Deep Clay-Cement
0.00
0.20
0.40
0.60
0.80
1.00
0.00 0.20 0.40 0.60 0.80 1.00
Tota
l Se
ttle
me
nt
fro
m P
LAX
IS
Total Settlement from Equations
Life Science Journal 2020;17(3) http://www.lifesciencesite.com LSJ
16
Mixing Methods", Applied Clay Science, Vol. 148, pp. 83-94, 2017.
7. Jiang, Y., Han, J., and Zheng, G., "Numerical Analysis of Consolidation of Soft Soils Fully-Penetrated by Deep-Mixed Columns", KSCE Journal of Civil Engineering, Vol. 17, Issue. 1, pp. 96-105, 2013.
8. Kitazume, M., and Terashi, M., "The Deep Mixing Method", CRC Press, 2013. Larsson, S., “Mixing Processes for Ground Improvement by Deep Mixing”, Doctoral Thesis Published in Royal Institute of Technology, Stockholm, Sweden, 2003.
9. Larsson, S., “Mixing Processes for Ground Improvement by Deep Mixing”, Doctoral Thesis Published in Royal Institute of Technology, Stockholm, Sweden, 2003.
10. Li, S., Kirstein, A., Gurpersaud, N., and Liu, J., "Experimental Investigation of Cement Mixing to Improve Champlain Sea Clay", GeoVancouver 2016, Vancouver, Canadian Geotechnical Society, 2016.
11. Liu, J., Li, B. S., Ahmad, A., and Pouydal, C. "Laboratory Investigation of Deep Soil Mixing in Treatment of Organic Clays in Ontario", 2017.
12. Madhyannapu, R. S., and Puppala, A. J., "Design and Construction Guidelines for Deep Soil Mixing to Stabilize Expansive Soils", Journal of Geotechnical and Geo-environmental Engineering, Vol. 140, Issue 9, 2014.
13. Miki, H., and Nozu, M., "Design and Numerical Analysis of Road Embankment with Low Improvement Ratio Deep Mixing Method", Geotechnical Engineering for Transportation Projects, pp. 1395-1402, 2004.
14. Mullins, G., Gunaratne, M., Johnson, K., Costello, K., Baker, S., Mitchell, E., and Mullins, M., "Soil Mixing Design Methods and Construction Techniques for Use in High Organic Soils (No. BDK84-977-25)", Florida, Dept. of Transportation, 2015.
15. Sulaeman, A, Ling, L. and Sajiharjo, M., "Modelling of Clay Behavior in Pile Loading Test Using One-Gravity Small-Scale Physical Model", Applied Mechanics and Materials, Vol. 773, PP. 1535-1541, July, 2015.
16. Yao, K., Yao, Z., Song, X., Zhang, X., Hu, J., and Pan, X., "Settlement Evaluation of Soft Ground Reinforced by Deep Mixed Columns", International Journal of Pavement Research and Technology, Vol. 9, Issue. 6, pp. 460-465, 2016.
2/9/2020