02 February USA Lamb Report.pub - Meat & Livestock Australia
16
February 2019 Prepared by: Steiner Consulting Group 800.526.4612 USA DomesƟc Lamb Market - Supply/Demand SituaƟon • The annual USDA ’Sheep and Goats’ inventory report was origi- nally scheduled to be released on January 31, 2019. The re- port’s release has now been rescheduled and it will be pub- lished on February 28. In addiƟon, please keep in mind that USDA plans to release this spring the results of its 5-year Census of Agriculture. The Census offers the most current overview of the US sheep and goat industry. The map on page 14 shows the concentraƟon of the industry as reported in the 2012 Census. As more informaƟon becomes available we will make sure to provide a synopsis and analysis here. • Weak prices for lamb in the second half of 2018 appear to have limited placements of lambs on feed and resulted in a notable reducƟon of on feed inventories in Colorado, a key lamb feed- ing state (see map on page 14). The total number of lambs on feed in Colorado as of February 1 was esƟmated to be 152,898 head, 15.3% lower than a year ago and about unchanged com- pared to the five year average. • Considering the pace of slaughter in recent weeks we expect to see further reducƟons in the number of lambs on feed. What remains unknown at this Ɵme is the supply of lambs on the ground as of January 1 and the potenƟal for lamb slaughter in 2019, a quesƟon that will be answered when the inventory data becomes public. • US lamb and sheep slaughter in the four weeks ending Febru- ary 16 averaged 38,000 head/wk, 7.2% higher than the previ- ous year. Keep in mind that these are just esƟmates at this Ɵme and will be revised in early March. Seasonally the peak in US Easter lamb and sheep slaughter happens in late March or early April. Easter this year will be later than normal so we think this year’s peak will likely take place in the second week of April. Strong prices for domesƟc lamb have encouraged pro- ducers to push more numbers into the marketplace. While this will help contain some price inflaƟon in the very near term it could lead to a smaller than expected increase in seasonal slaughter and thus contribute to even higher prices in late March and early April. Already the value of the domesƟc lamb cutout in January was 5% higher than the same period a year ago. • Retail lamb feature acƟvity has shown some improvement in recent weeks, which may have contributed to the higher prices for both domesƟc and export product. Retail features in the four weeks ending February 16 were 69% higher than the year before and 11% higher than the five year average. Weekly USA Lamb & Sheep Slaughter '000 Head/Week. Source: USDA. Compiled and Analysis by Steiner Consulting 26.0 31.0 36.0 41.0 46.0 51.0 Jan Feb Mar Apr May Jun Jul Aug Sep Oct Nov Dec 5-Yr 2018 2019 NATIONAL RETAIL LAMB FEATURE REPORT : ACTIVITY INDEX Source: USDA. Latest data point is for January 25, 2019 - 2,000 4,000 6,000 8,000 10,000 12,000 14,000 16,000 18,000 20,000 Jan Feb Mar Apr May Jun Jul Aug Sep Oct Nov Dec 5-Yr Avg. 2017 2018 2019 Monthly US Lamb Market Update February 2019 Issue Prepared Exclusively for Meat & Livestock Australia - Sydney February 19, 2019 COLORADO LAMBS ON FEED Monthly Data Reported by the Livestock Market Information Center 50 100 150 200 250 300 JAN FEB MAR APR MAY JUN JUL AUG SEP OCT NOV DEC Avg. 2013-17 2018 2019
-
Upload
khangminh22 -
Category
Documents
-
view
2 -
download
0
Transcript of 02 February USA Lamb Report.pub - Meat & Livestock Australia
February 2019
Prepared by: Steiner Consulting Group 800.526.4612
USA Domes c Lamb Market - Supply/Demand Situa on
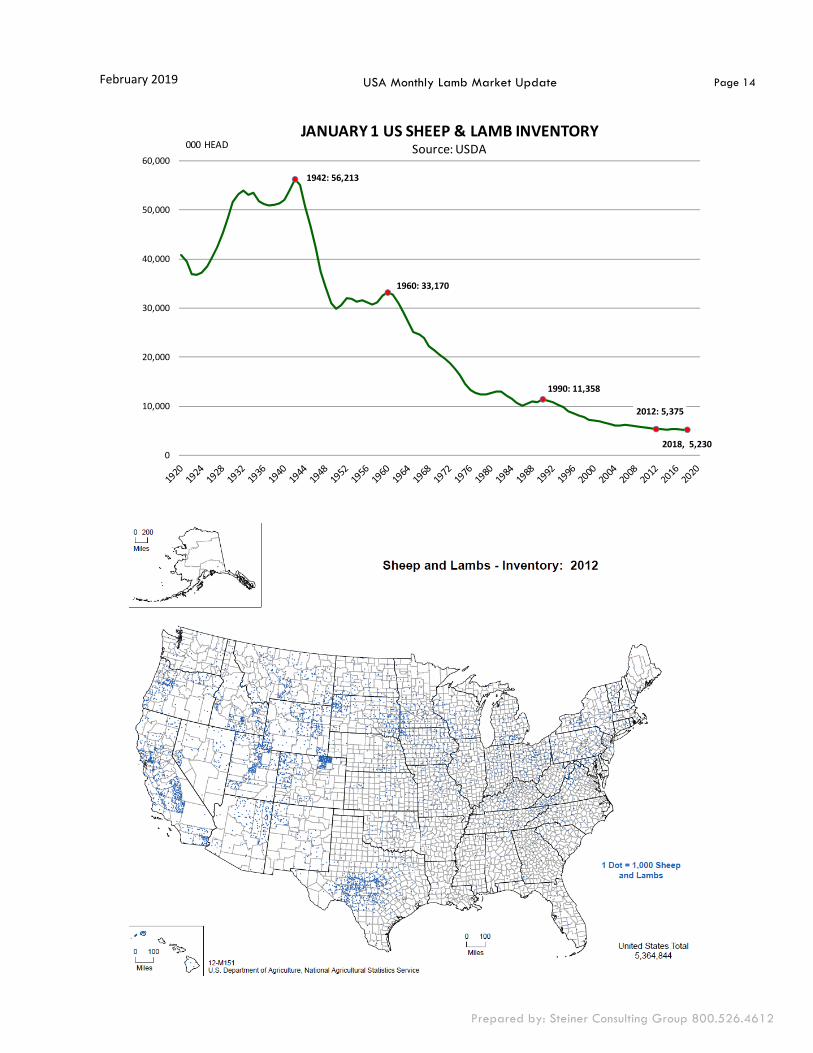
• The annual USDA ’Sheep and Goats’ inventory report was origi-nally scheduled to be released on January 31, 2019. The re-port’s release has now been rescheduled and it will be pub-lished on February 28. In addi on, please keep in mind that USDA plans to release this spring the results of its 5-year Census of Agriculture. The Census offers the most current overview of the US sheep and goat industry. The map on page 14 shows the concentra on of the industry as reported in the 2012 Census. As more informa on becomes available we will make sure to provide a synopsis and analysis here.
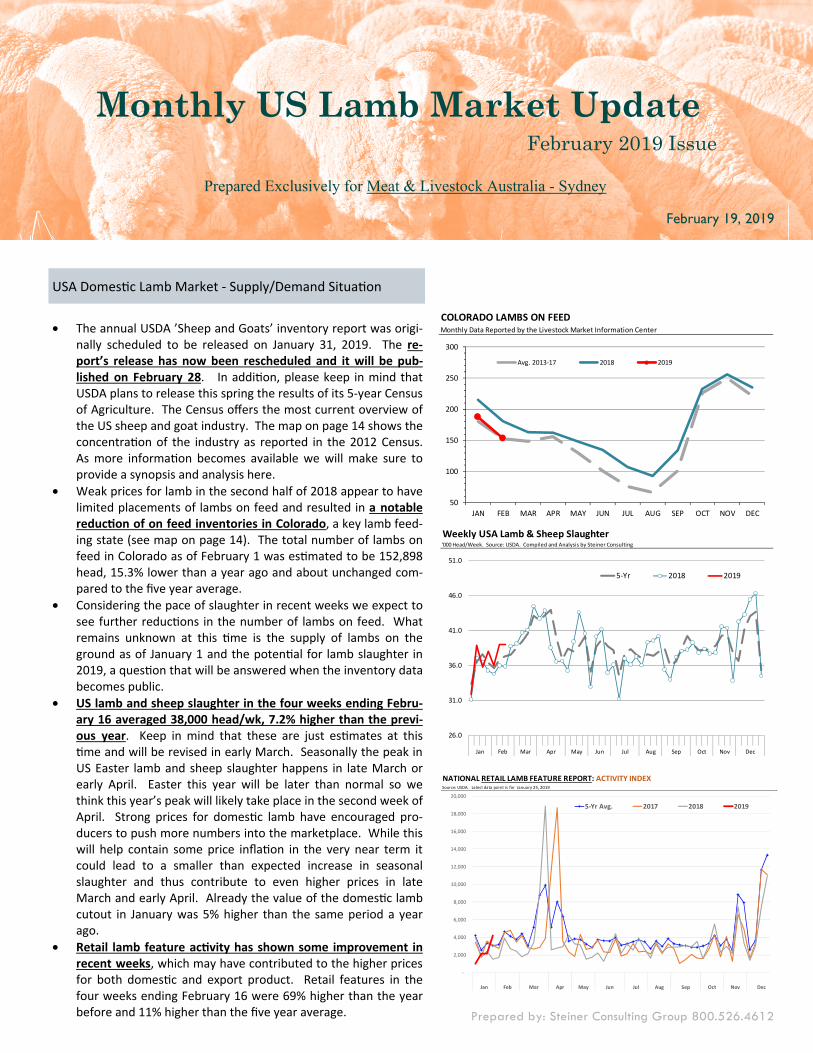
• Weak prices for lamb in the second half of 2018 appear to have limited placements of lambs on feed and resulted in a notable reduc on of on feed inventories in Colorado, a key lamb feed-ing state (see map on page 14). The total number of lambs on feed in Colorado as of February 1 was es mated to be 152,898 head, 15.3% lower than a year ago and about unchanged com-pared to the five year average.
• Considering the pace of slaughter in recent weeks we expect to see further reduc ons in the number of lambs on feed. What remains unknown at this me is the supply of lambs on the ground as of January 1 and the poten al for lamb slaughter in 2019, a ques on that will be answered when the inventory data becomes public.
• US lamb and sheep slaughter in the four weeks ending Febru-ary 16 averaged 38,000 head/wk, 7.2% higher than the previ-ous year. Keep in mind that these are just es mates at this
me and will be revised in early March. Seasonally the peak in US Easter lamb and sheep slaughter happens in late March or early April. Easter this year will be later than normal so we think this year’s peak will likely take place in the second week of April. Strong prices for domes c lamb have encouraged pro-ducers to push more numbers into the marketplace. While this will help contain some price infla on in the very near term it could lead to a smaller than expected increase in seasonal slaughter and thus contribute to even higher prices in late March and early April. Already the value of the domes c lamb cutout in January was 5% higher than the same period a year ago.
• Retail lamb feature ac vity has shown some improvement in recent weeks, which may have contributed to the higher prices for both domes c and export product. Retail features in the four weeks ending February 16 were 69% higher than the year before and 11% higher than the five year average.
Weekly USA Lamb & Sheep Slaughter'000 Head/Week. Source: USDA. Compiled and Analysis by Steiner Consulting
26.0
31.0
36.0
41.0
46.0
51.0
Jan Feb Mar Apr May Jun Jul Aug Sep Oct Nov Dec
5-Yr 2018 2019
NATIONAL RETAIL LAMB FEATURE REPORT: ACTIVITY INDEXSource: USDA. Latest data point is for January 25, 2019
-
2,000
4,000
6,000
8,000
10,000
12,000
14,000
16,000
18,000
20,000
Jan Feb Mar Apr May Jun Jul Aug Sep Oct Nov Dec
5-Yr Avg. 2017 2018 2019
Monthly US Lamb Market Update February 2019 Issue
Prepared Exclusively for Meat & Livestock Australia - Sydney
February 19, 2019
COLORADO LAMBS ON FEEDMonthly Data Reported by the Livestock Market Information Center
50
100
150
200
250
300
JAN FEB MAR APR MAY JUN JUL AUG SEP OCT NOV DEC
Avg. 2013-17 2018 2019
February 2019
Page 2
Prepared by: Steiner Consulting Group 800.526.4612
Imported Lamb Supply and Price Trends
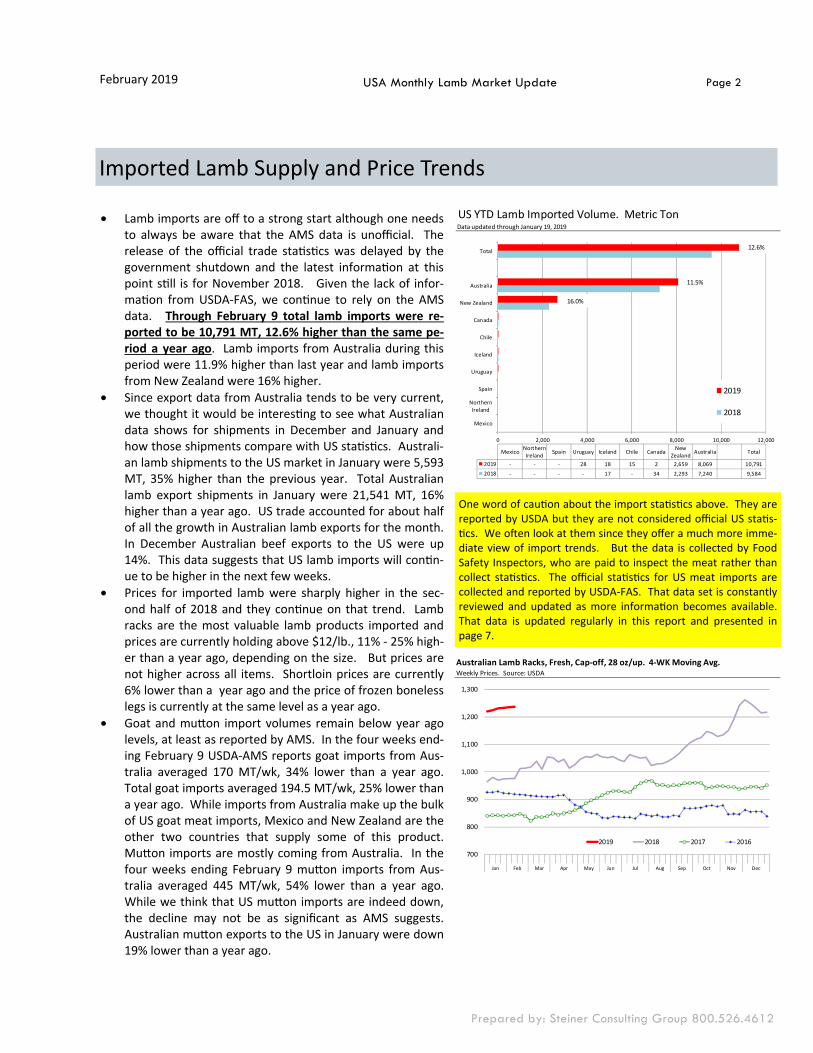
• Lamb imports are off to a strong start although one needs to always be aware that the AMS data is unofficial. The release of the official trade sta s cs was delayed by the government shutdown and the latest informa on at this point s ll is for November 2018. Given the lack of infor-ma on from USDA-FAS, we con nue to rely on the AMS data. Through February 9 total lamb imports were re-ported to be 10,791 MT, 12.6% higher than the same pe-riod a year ago. Lamb imports from Australia during this period were 11.9% higher than last year and lamb imports from New Zealand were 16% higher.
• Since export data from Australia tends to be very current, we thought it would be interes ng to see what Australian data shows for shipments in December and January and how those shipments compare with US sta s cs. Australi-an lamb shipments to the US market in January were 5,593 MT, 35% higher than the previous year. Total Australian lamb export shipments in January were 21,541 MT, 16% higher than a year ago. US trade accounted for about half of all the growth in Australian lamb exports for the month. In December Australian beef exports to the US were up 14%. This data suggests that US lamb imports will con n-ue to be higher in the next few weeks.
• Prices for imported lamb were sharply higher in the sec-ond half of 2018 and they con nue on that trend. Lamb racks are the most valuable lamb products imported and prices are currently holding above $12/lb., 11% - 25% high-er than a year ago, depending on the size. But prices are not higher across all items. Shortloin prices are currently 6% lower than a year ago and the price of frozen boneless legs is currently at the same level as a year ago.
• Goat and mu on import volumes remain below year ago levels, at least as reported by AMS. In the four weeks end-ing February 9 USDA-AMS reports goat imports from Aus-tralia averaged 170 MT/wk, 34% lower than a year ago. Total goat imports averaged 194.5 MT/wk, 25% lower than a year ago. While imports from Australia make up the bulk of US goat meat imports, Mexico and New Zealand are the other two countries that supply some of this product. Mu on imports are mostly coming from Australia. In the four weeks ending February 9 mu on imports from Aus-tralia averaged 445 MT/wk, 54% lower than a year ago. While we think that US mu on imports are indeed down, the decline may not be as significant as AMS suggests. Australian mu on exports to the US in January were down 19% lower than a year ago.
USA Monthly Lamb Market Update
Australian Lamb Racks, Fresh, Cap-off, 28 oz/up. 4-WK Moving Avg.Weekly Prices. Source: USDA
700
800
900
1,000
1,100
1,200
1,300
Jan Feb Mar Apr May Jun Jul Aug Sep Oct Nov Dec
2019 2018 2017 2016
US YTD Lamb Imported Volume. Metric TonData updated through January 19, 2019
0 2,000 4,000 6,000 8,000 10,000 12,000
Mexico
NorthernIreland
Spain
Uruguay
Iceland
Chile
Canada
New Zealand
Australia
Total
Mexico NorthernIreland Spain Uruguay Iceland Chile Canada New
Zealand Australia Total
2019 - - - 28 18 15 2 2,659 8,069 10,7912018 - - - - 17 - 34 2,293 7,240 9,584
2019
2018
12.6%
11.5%
16.0%
One word of cau on about the import sta s cs above. They are reported by USDA but they are not considered official US sta s-
cs. We o en look at them since they offer a much more imme-diate view of import trends. But the data is collected by Food Safety Inspectors, who are paid to inspect the meat rather than collect sta s cs. The official sta s cs for US meat imports are collected and reported by USDA-FAS. That data set is constantly reviewed and updated as more informa on becomes available. That data is updated regularly in this report and presented in page 7.
February 2019
Page 3
Prepared by: Steiner Consulting Group 800.526.4612
USA Monthly Lamb Market Update
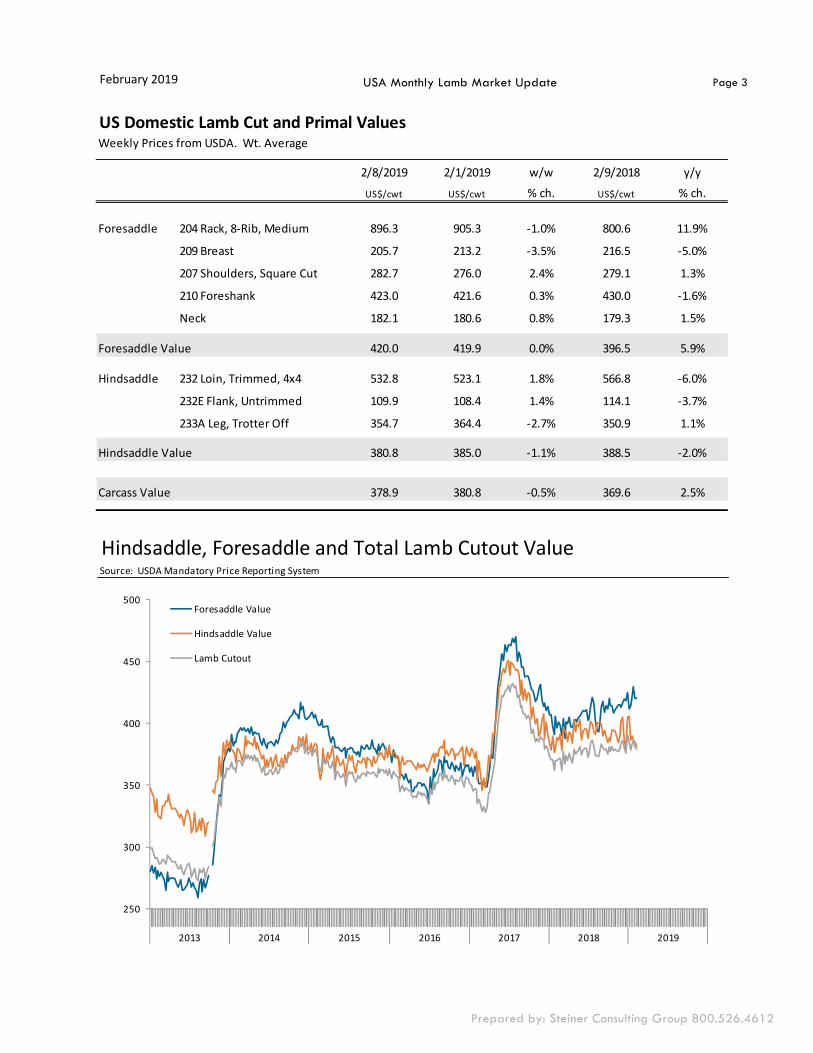
US Domestic Lamb Cut and Primal ValuesWeekly Prices from USDA. Wt. Average
2/8/2019 2/1/2019 w/w 2/9/2018 y/yUS$/cwt US$/cwt % ch. US$/cwt % ch.
Foresaddle 204 Rack, 8-Rib, Medium 896.3 905.3 -1.0% 800.6 11.9%
209 Breast 205.7 213.2 -3.5% 216.5 -5.0%
207 Shoulders, Square Cut 282.7 276.0 2.4% 279.1 1.3%
210 Foreshank 423.0 421.6 0.3% 430.0 -1.6%
Neck 182.1 180.6 0.8% 179.3 1.5%
Foresaddle Value 420.0 419.9 0.0% 396.5 5.9%
Hindsaddle 232 Loin, Trimmed, 4x4 532.8 523.1 1.8% 566.8 -6.0%
232E Flank, Untrimmed 109.9 108.4 1.4% 114.1 -3.7%
233A Leg, Trotter Off 354.7 364.4 -2.7% 350.9 1.1%
Hindsaddle Value 380.8 385.0 -1.1% 388.5 -2.0%
Carcass Value 378.9 380.8 -0.5% 369.6 2.5%
Hindsaddle, Foresaddle and Total Lamb Cutout ValueSource: USDA Mandatory Price Reporting System
250
300
350
400
450
500
2013 2014 2015 2016 2017 2018 2019
Foresaddle Value
Hindsaddle Value
Lamb Cutout
February 2019
Page 4
Prepared by: Steiner Consulting Group 800.526.4612
USA Monthly Lamb Market Update
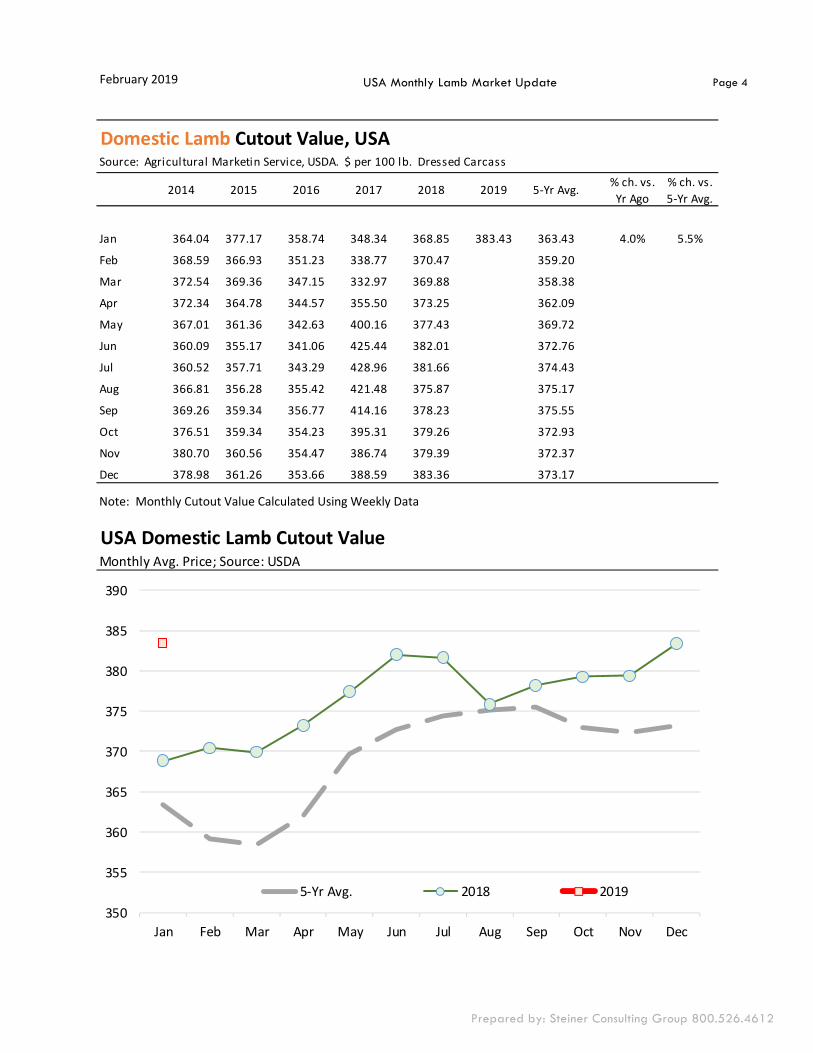
Domestic Lamb Cutout Value, USASource: Agricultural Marketin Service, USDA. $ per 100 lb. Dressed Carcass
2014 2015 2016 2017 2018 2019 5-Yr Avg. % ch. vs. Yr Ago
% ch. vs. 5-Yr Avg.
Jan 364.04 377.17 358.74 348.34 368.85 383.43 363.43 4.0% 5.5%
Feb 368.59 366.93 351.23 338.77 370.47 359.20
Mar 372.54 369.36 347.15 332.97 369.88 358.38
Apr 372.34 364.78 344.57 355.50 373.25 362.09
May 367.01 361.36 342.63 400.16 377.43 369.72
Jun 360.09 355.17 341.06 425.44 382.01 372.76
Jul 360.52 357.71 343.29 428.96 381.66 374.43
Aug 366.81 356.28 355.42 421.48 375.87 375.17
Sep 369.26 359.34 356.77 414.16 378.23 375.55
Oct 376.51 359.34 354.23 395.31 379.26 372.93
Nov 380.70 360.56 354.47 386.74 379.39 372.37
Dec 378.98 361.26 353.66 388.59 383.36 373.17
USA Domestic Lamb Cutout ValueMonthly Avg. Price; Source: USDA
350
355
360
365
370
375
380
385
390
Jan Feb Mar Apr May Jun Jul Aug Sep Oct Nov Dec
5-Yr Avg. 2018 2019
Note: Monthly Cutout Value Calculated Using Weekly Data
February 2019
Page 5
Prepared by: Steiner Consulting Group 800.526.4612
USA Monthly Lamb Market Update
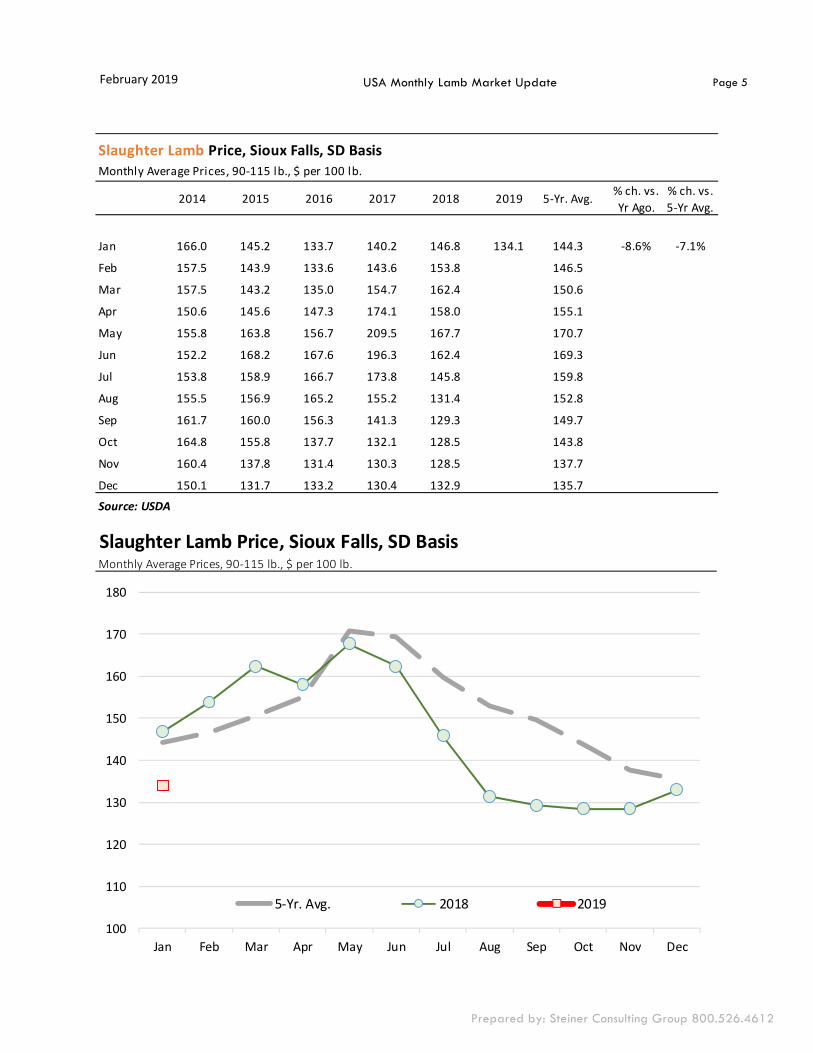
Slaughter Lamb Price, Sioux Falls, SD BasisMonthly Average Prices, 90-115 lb., $ per 100 lb.
2014 2015 2016 2017 2018 2019 5-Yr. Avg. % ch. vs. Yr Ago.
% ch. vs. 5-Yr Avg.
Jan 166.0 145.2 133.7 140.2 146.8 134.1 144.3 -8.6% -7.1%
Feb 157.5 143.9 133.6 143.6 153.8 146.5
Mar 157.5 143.2 135.0 154.7 162.4 150.6
Apr 150.6 145.6 147.3 174.1 158.0 155.1
May 155.8 163.8 156.7 209.5 167.7 170.7
Jun 152.2 168.2 167.6 196.3 162.4 169.3
Jul 153.8 158.9 166.7 173.8 145.8 159.8
Aug 155.5 156.9 165.2 155.2 131.4 152.8
Sep 161.7 160.0 156.3 141.3 129.3 149.7
Oct 164.8 155.8 137.7 132.1 128.5 143.8
Nov 160.4 137.8 131.4 130.3 128.5 137.7
Dec 150.1 131.7 133.2 130.4 132.9 135.7Source: USDA
Slaughter Lamb Price, Sioux Falls, SD BasisMonthly Average Prices, 90-115 lb., $ per 100 lb.
100
110
120
130
140
150
160
170
180
Jan Feb Mar Apr May Jun Jul Aug Sep Oct Nov Dec
5-Yr. Avg. 2018 2019

February 2019
Page 6
Prepared by: Steiner Consulting Group 800.526.4612
USA Monthly Lamb Market Update
Imported Lamb Price SummarySource: USDA Agricultural Marketing Service, Mandatory Price Reporting
2018 Volume
2018 Wt. Avg. $
2018 Implied Value Feb 12, 2018 Jan 28, 2019 Feb 11, 2019
% ch. vs. Week Ago
% ch. vs. Year Ago
Fresh/ChilledPounds $/lb. Total $
AUS Shortloin, 1-Rib, 0x0 6,664,659 5.49$ 36,594,809$ 5.46$ 5.30$ 5.14$ -3.0% -5.8%
AUS Shoulder, Square-cut 3,082,890 3.05$ 9,388,526$ 3.12$ 3.15$ 3.04$ -3.2% -2.4%
AUS Rack, FR, Cap-off, 28 oz/up 3,648,361 10.76$ 39,248,324$ 9.84$ 12.34$ 12.33$ -0.1% 25.3%
AUS Shortloin, 1-Rib, 1x1 86,131 5.25$ 452,216$ 5.34$ -$ -$ n/a n/a
AUS Leg, semi bnls 724,300 4.11$ 2,978,688$ 4.37$ -$ -$ n/a -100.0%
AUS Rack, FR, Cap-off, 24-28 oz 818,864 11.80$ 9,662,356$ 11.27$ 12.13$ 12.31$ 1.5% 9.3%
AUS Rack, FR, Cap-off, 20-24 oz 398,837 11.79$ 4,703,267$ 11.03$ 12.24$ 12.30$ 0.5% 11.5%
AUS Foreshank, VP 322,785 3.54$ 1,142,206$ 3.86$ -$ -$ n/a n/a
Subtotal 15,746,827 6.62$ 104,170,393$ 6.38$ 6.66$ 6.58$ -1.2% 3.2%
Frozen
AUS Leg, Long 7,830,816 2.39$ 18,729,227$ 3.58$ 3.78$ 3.78$ 0.0% 5.4%
AUS Leg, bnls 6,211,383 2.39$ 14,855,974$ 3.90$ 3.94$ 3.92$ -0.5% 0.5%
AUS Shoulder, Square-cut, bnls 2,378,197 2.39$ 5,688,014$ 3.64$ 3.89$ 3.89$ -0.1% 6.9%
AUS Shoulder, Square-cut 5,371,749 2.39$ 12,847,793$ 2.60$ 2.67$ 2.70$ 0.9% 3.8%
AUS Foreshank, LP 2,138,417 2.39$ 5,114,524$ 2.60$ 2.77$ 2.87$ 3.6% 10.7%
AUS Hindshank, VP 601,864 2.39$ 1,439,498$ 2.64$ -$ 3.19$ #DIV/0! 20.8%
AUS Rack, FR, Cap-off, 28 oz/up 869,420 2.39$ 2,079,421$ 10.58$ 12.22$ 11.82$ -3.2% 11.7%
AUS Hindshank, LP 433,616 2.39$ 1,037,094$ 3.02$ 3.50$ 3.37$ -3.7% 11.7%
AUS Rack, FR, Cap-off, 20-24 oz 915,618 2.39$ 2,189,914$ 10.31$ 12.06$ 11.26$ -6.6% 9.3%
AUS Rack, FR, Cap-off, 24-28 oz 988,527 2.39$ 2,364,293$ 9.64$ 12.25$ 11.51$ -6.1% 19.4%
NZ Rack, FR, Cap-off, 16-20 oz 3,407,131 2.39$ 8,148,950$ 10.73$ 12.00$ 11.88$ -1.0% 10.7%
NZ Rack, FR, Cap-off, 12-16 oz 2,084,679 2.39$ 4,985,997$ 10.80$ 12.32$ 12.27$ -0.3% 13.6%
NZ Rack, FR, Cap-off, 20 oz/up 1,203,118 2.39$ 2,877,538$ 10.22$ 11.88$ 11.95$ 0.6% 16.9%
NZ Rack, FR, Cap-off, 12 oz/dn 96,444 2.39$ 230,668$ 11.15$ 12.50$ 12.38$ n/a n/a
Subtotal 34,530,979 2.39$ 82,588,907$ 5.33$ 5.82$ 5.82$ -0.1% 9.1%
Please note that the prices, volume and sales value reported above represents only subset of total US lamb imports. It only reflects the data reported through the Mandatory Price Repor ng System. It is only for nego ated sales, no formula sales. Trade from smaller importers and traders is not included in the summary above. Data that does not meet the confiden ality guidelines also is not included in the above table.
February 2019
Page 7
Prepared by: Steiner Consulting Group 800.526.4612
USA Monthly Lamb Market Update
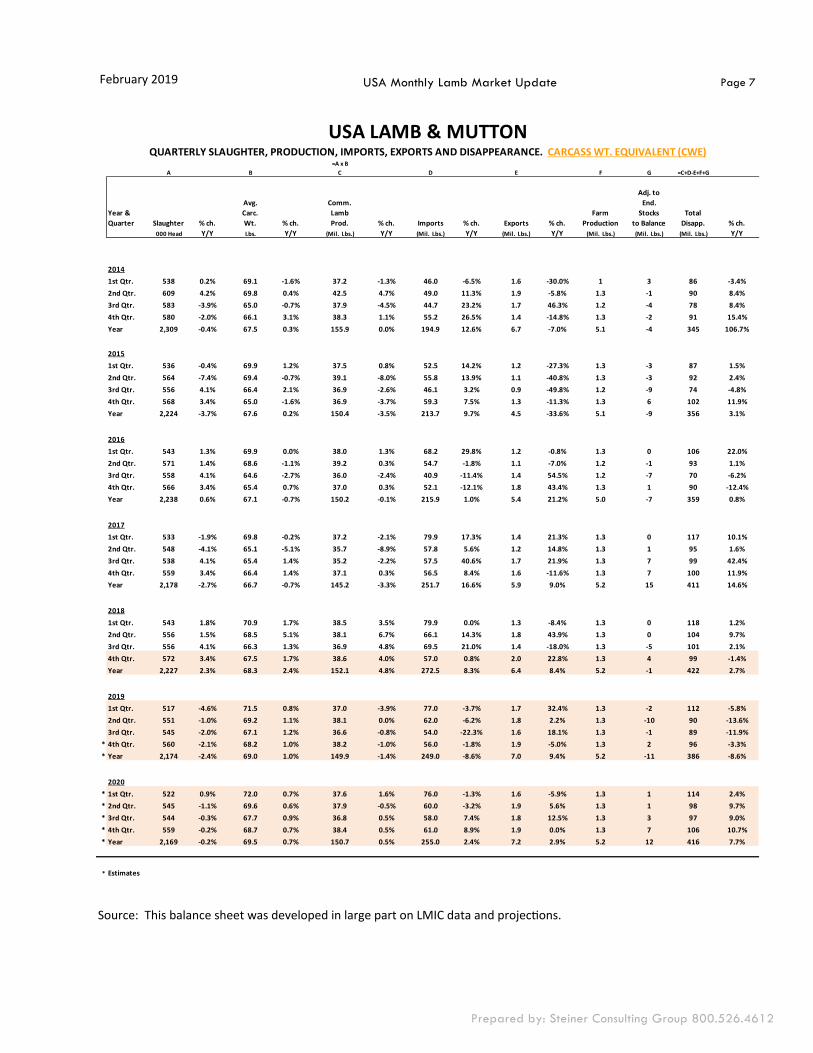
Source: This balance sheet was developed in large part on LMIC data and projec ons.
USA LAMB & MUTTONQUARTERLY SLAUGHTER, PRODUCTION, IMPORTS, EXPORTS AND DISAPPEARANCE. CARCASS WT. EQUIVALENT (CWE)
=A x BA B C D E F G =C+D-E+F+G
Year & Quarter Slaughter % ch.
Avg.Carc.Wt. % ch.
Comm.LambProd. % ch. Imports % ch. Exports % ch.
Farm Production
Adj. to End.
Stocks to Balance
Total Disapp. % ch.
000 Head Y/Y Lbs. Y/Y (Mil. Lbs.) Y/Y (Mil. Lbs.) Y/Y (Mil. Lbs.) Y/Y (Mil. Lbs.) (Mil. Lbs.) (Mil. Lbs.) Y/Y
20141st Qtr. 538 0.2% 69.1 -1.6% 37.2 -1.3% 46.0 -6.5% 1.6 -30.0% 1 3 86 -3.4%2nd Qtr. 609 4.2% 69.8 0.4% 42.5 4.7% 49.0 11.3% 1.9 -5.8% 1.3 -1 90 8.4%3rd Qtr. 583 -3.9% 65.0 -0.7% 37.9 -4.5% 44.7 23.2% 1.7 46.3% 1.2 -4 78 8.4%4th Qtr. 580 -2.0% 66.1 3.1% 38.3 1.1% 55.2 26.5% 1.4 -14.8% 1.3 -2 91 15.4%Year 2,309 -0.4% 67.5 0.3% 155.9 0.0% 194.9 12.6% 6.7 -7.0% 5.1 -4 345 106.7%
20151st Qtr. 536 -0.4% 69.9 1.2% 37.5 0.8% 52.5 14.2% 1.2 -27.3% 1.3 -3 87 1.5%2nd Qtr. 564 -7.4% 69.4 -0.7% 39.1 -8.0% 55.8 13.9% 1.1 -40.8% 1.3 -3 92 2.4%3rd Qtr. 556 4.1% 66.4 2.1% 36.9 -2.6% 46.1 3.2% 0.9 -49.8% 1.2 -9 74 -4.8%4th Qtr. 568 3.4% 65.0 -1.6% 36.9 -3.7% 59.3 7.5% 1.3 -11.3% 1.3 6 102 11.9%Year 2,224 -3.7% 67.6 0.2% 150.4 -3.5% 213.7 9.7% 4.5 -33.6% 5.1 -9 356 3.1%
20161st Qtr. 543 1.3% 69.9 0.0% 38.0 1.3% 68.2 29.8% 1.2 -0.8% 1.3 0 106 22.0%2nd Qtr. 571 1.4% 68.6 -1.1% 39.2 0.3% 54.7 -1.8% 1.1 -7.0% 1.2 -1 93 1.1%3rd Qtr. 558 4.1% 64.6 -2.7% 36.0 -2.4% 40.9 -11.4% 1.4 54.5% 1.2 -7 70 -6.2%4th Qtr. 566 3.4% 65.4 0.7% 37.0 0.3% 52.1 -12.1% 1.8 43.4% 1.3 1 90 -12.4%Year 2,238 0.6% 67.1 -0.7% 150.2 -0.1% 215.9 1.0% 5.4 21.2% 5.0 -7 359 0.8%
20171st Qtr. 533 -1.9% 69.8 -0.2% 37.2 -2.1% 79.9 17.3% 1.4 21.3% 1.3 0 117 10.1%2nd Qtr. 548 -4.1% 65.1 -5.1% 35.7 -8.9% 57.8 5.6% 1.2 14.8% 1.3 1 95 1.6%3rd Qtr. 538 4.1% 65.4 1.4% 35.2 -2.2% 57.5 40.6% 1.7 21.9% 1.3 7 99 42.4%4th Qtr. 559 3.4% 66.4 1.4% 37.1 0.3% 56.5 8.4% 1.6 -11.6% 1.3 7 100 11.9%Year 2,178 -2.7% 66.7 -0.7% 145.2 -3.3% 251.7 16.6% 5.9 9.0% 5.2 15 411 14.6%
20181st Qtr. 543 1.8% 70.9 1.7% 38.5 3.5% 79.9 0.0% 1.3 -8.4% 1.3 0 118 1.2%2nd Qtr. 556 1.5% 68.5 5.1% 38.1 6.7% 66.1 14.3% 1.8 43.9% 1.3 0 104 9.7%3rd Qtr. 556 4.1% 66.3 1.3% 36.9 4.8% 69.5 21.0% 1.4 -18.0% 1.3 -5 101 2.1%4th Qtr. 572 3.4% 67.5 1.7% 38.6 4.0% 57.0 0.8% 2.0 22.8% 1.3 4 99 -1.4%Year 2,227 2.3% 68.3 2.4% 152.1 4.8% 272.5 8.3% 6.4 8.4% 5.2 -1 422 2.7%
20191st Qtr. 517 -4.6% 71.5 0.8% 37.0 -3.9% 77.0 -3.7% 1.7 32.4% 1.3 -2 112 -5.8%2nd Qtr. 551 -1.0% 69.2 1.1% 38.1 0.0% 62.0 -6.2% 1.8 2.2% 1.3 -10 90 -13.6%3rd Qtr. 545 -2.0% 67.1 1.2% 36.6 -0.8% 54.0 -22.3% 1.6 18.1% 1.3 -1 89 -11.9%
* 4th Qtr. 560 -2.1% 68.2 1.0% 38.2 -1.0% 56.0 -1.8% 1.9 -5.0% 1.3 2 96 -3.3%* Year 2,174 -2.4% 69.0 1.0% 149.9 -1.4% 249.0 -8.6% 7.0 9.4% 5.2 -11 386 -8.6%
2020* 1st Qtr. 522 0.9% 72.0 0.7% 37.6 1.6% 76.0 -1.3% 1.6 -5.9% 1.3 1 114 2.4%* 2nd Qtr. 545 -1.1% 69.6 0.6% 37.9 -0.5% 60.0 -3.2% 1.9 5.6% 1.3 1 98 9.7%* 3rd Qtr. 544 -0.3% 67.7 0.9% 36.8 0.5% 58.0 7.4% 1.8 12.5% 1.3 3 97 9.0%* 4th Qtr. 559 -0.2% 68.7 0.7% 38.4 0.5% 61.0 8.9% 1.9 0.0% 1.3 7 106 10.7%* Year 2,169 -0.2% 69.5 0.7% 150.7 0.5% 255.0 2.4% 7.2 2.9% 5.2 12 416 7.7%
* Estimates
February 2019
Page 8
Prepared by: Steiner Consulting Group 800.526.4612
USA Monthly Lamb Market Update
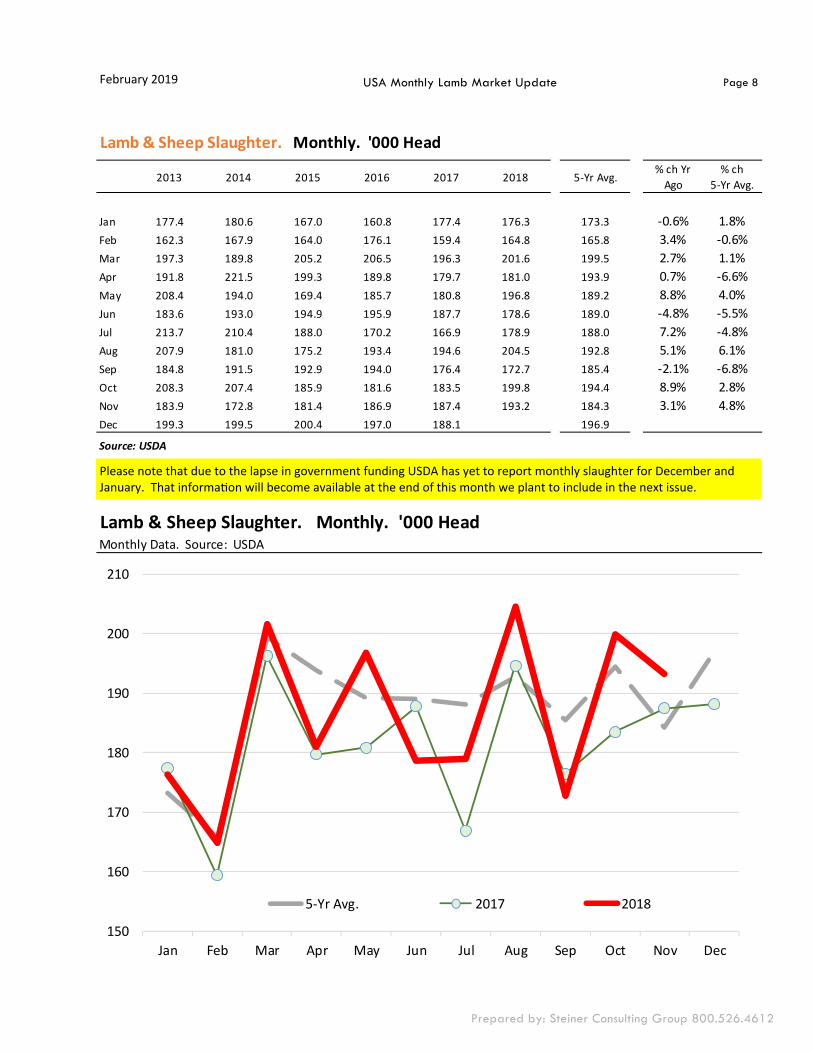
Lamb & Sheep Slaughter. Monthly. '000 Head
2013 2014 2015 2016 2017 2018 5-Yr Avg.% ch Yr
Ago% ch
5-Yr Avg.
Jan 177.4 180.6 167.0 160.8 177.4 176.3 173.3 -0.6% 1.8%Feb 162.3 167.9 164.0 176.1 159.4 164.8 165.8 3.4% -0.6%Mar 197.3 189.8 205.2 206.5 196.3 201.6 199.5 2.7% 1.1%Apr 191.8 221.5 199.3 189.8 179.7 181.0 193.9 0.7% -6.6%May 208.4 194.0 169.4 185.7 180.8 196.8 189.2 8.8% 4.0%Jun 183.6 193.0 194.9 195.9 187.7 178.6 189.0 -4.8% -5.5%Jul 213.7 210.4 188.0 170.2 166.9 178.9 188.0 7.2% -4.8%Aug 207.9 181.0 175.2 193.4 194.6 204.5 192.8 5.1% 6.1%Sep 184.8 191.5 192.9 194.0 176.4 172.7 185.4 -2.1% -6.8%Oct 208.3 207.4 185.9 181.6 183.5 199.8 194.4 8.9% 2.8%Nov 183.9 172.8 181.4 186.9 187.4 193.2 184.3 3.1% 4.8%Dec 199.3 199.5 200.4 197.0 188.1 196.9
Source: USDA
Lamb & Sheep Slaughter. Monthly. '000 HeadMonthly Data. Source: USDA
150
160
170
180
190
200
210
Jan Feb Mar Apr May Jun Jul Aug Sep Oct Nov Dec
5-Yr Avg. 2017 2018
Please note that due to the lapse in government funding USDA has yet to report monthly slaughter for December and January. That informa on will become available at the end of this month we plant to include in the next issue.
February 2019
Page 9
Prepared by: Steiner Consulting Group 800.526.4612 Source: USDA
USA Monthly Lamb Market Update
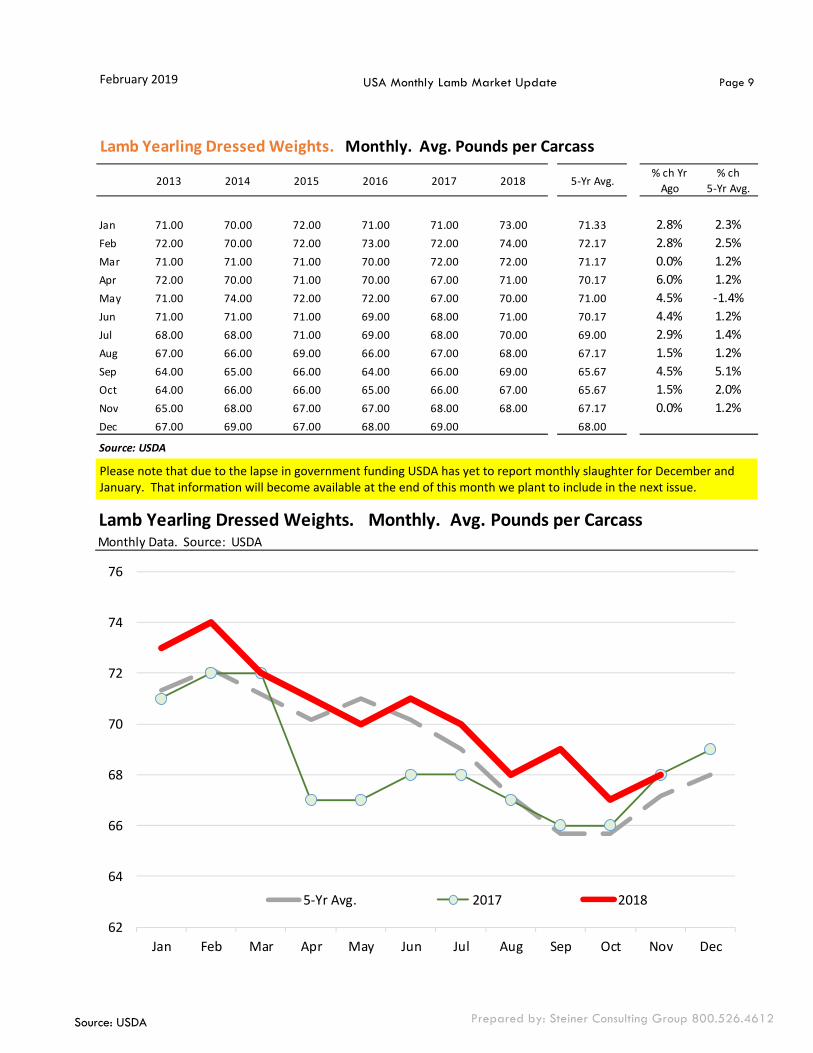
Lamb Yearling Dressed Weights. Monthly. Avg. Pounds per Carcass
2013 2014 2015 2016 2017 2018 5-Yr Avg.% ch Yr
Ago% ch
5-Yr Avg.
Jan 71.00 70.00 72.00 71.00 71.00 73.00 71.33 2.8% 2.3%Feb 72.00 70.00 72.00 73.00 72.00 74.00 72.17 2.8% 2.5%Mar 71.00 71.00 71.00 70.00 72.00 72.00 71.17 0.0% 1.2%Apr 72.00 70.00 71.00 70.00 67.00 71.00 70.17 6.0% 1.2%May 71.00 74.00 72.00 72.00 67.00 70.00 71.00 4.5% -1.4%Jun 71.00 71.00 71.00 69.00 68.00 71.00 70.17 4.4% 1.2%Jul 68.00 68.00 71.00 69.00 68.00 70.00 69.00 2.9% 1.4%Aug 67.00 66.00 69.00 66.00 67.00 68.00 67.17 1.5% 1.2%Sep 64.00 65.00 66.00 64.00 66.00 69.00 65.67 4.5% 5.1%Oct 64.00 66.00 66.00 65.00 66.00 67.00 65.67 1.5% 2.0%Nov 65.00 68.00 67.00 67.00 68.00 68.00 67.17 0.0% 1.2%Dec 67.00 69.00 67.00 68.00 69.00 68.00
Source: USDA
Lamb Yearling Dressed Weights. Monthly. Avg. Pounds per CarcassMonthly Data. Source: USDA
62
64
66
68
70
72
74
76
Jan Feb Mar Apr May Jun Jul Aug Sep Oct Nov Dec
5-Yr Avg. 2017 2018
Please note that due to the lapse in government funding USDA has yet to report monthly slaughter for December and January. That informa on will become available at the end of this month we plant to include in the next issue.
February 2019
Page 10
Prepared by: Steiner Consulting Group 800.526.4612
USA Monthly Lamb Market Update
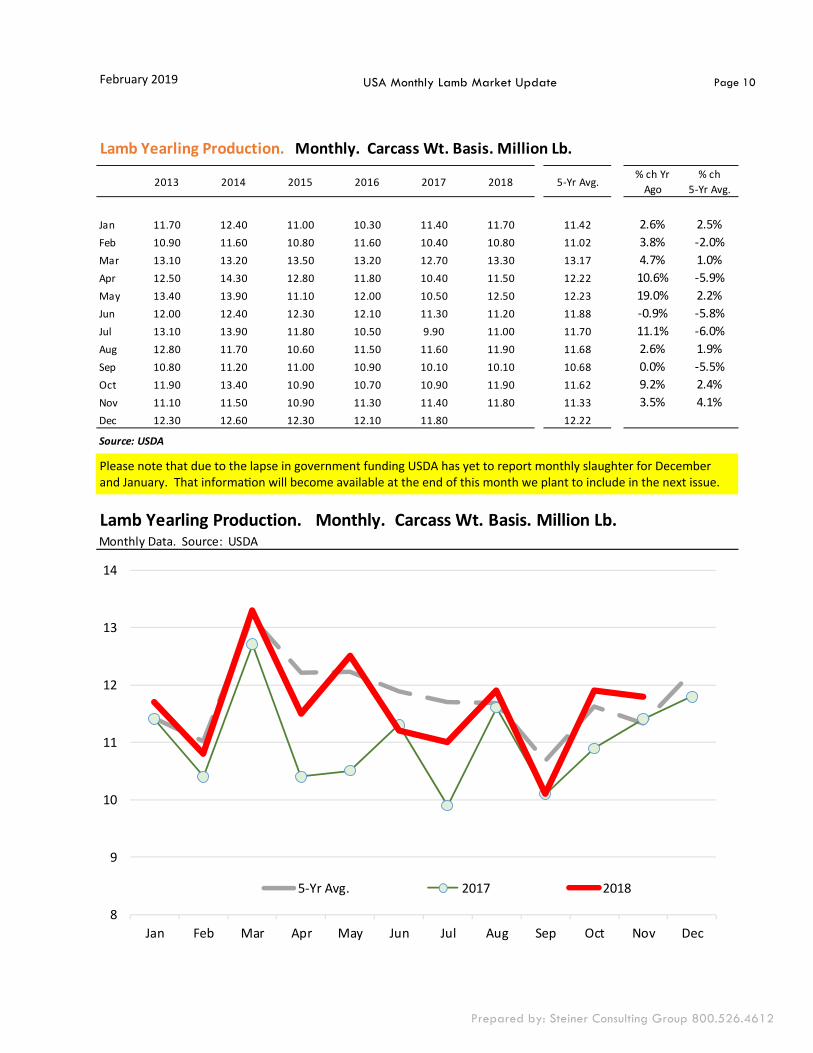
Lamb Yearling Production. Monthly. Carcass Wt. Basis. Million Lb.
2013 2014 2015 2016 2017 2018 5-Yr Avg.% ch Yr
Ago% ch
5-Yr Avg.
Jan 11.70 12.40 11.00 10.30 11.40 11.70 11.42 2.6% 2.5%Feb 10.90 11.60 10.80 11.60 10.40 10.80 11.02 3.8% -2.0%Mar 13.10 13.20 13.50 13.20 12.70 13.30 13.17 4.7% 1.0%Apr 12.50 14.30 12.80 11.80 10.40 11.50 12.22 10.6% -5.9%May 13.40 13.90 11.10 12.00 10.50 12.50 12.23 19.0% 2.2%Jun 12.00 12.40 12.30 12.10 11.30 11.20 11.88 -0.9% -5.8%Jul 13.10 13.90 11.80 10.50 9.90 11.00 11.70 11.1% -6.0%Aug 12.80 11.70 10.60 11.50 11.60 11.90 11.68 2.6% 1.9%Sep 10.80 11.20 11.00 10.90 10.10 10.10 10.68 0.0% -5.5%Oct 11.90 13.40 10.90 10.70 10.90 11.90 11.62 9.2% 2.4%Nov 11.10 11.50 10.90 11.30 11.40 11.80 11.33 3.5% 4.1%Dec 12.30 12.60 12.30 12.10 11.80 12.22
Source: USDA
Lamb Yearling Production. Monthly. Carcass Wt. Basis. Million Lb.Monthly Data. Source: USDA
8
9
10
11
12
13
14
Jan Feb Mar Apr May Jun Jul Aug Sep Oct Nov Dec
5-Yr Avg. 2017 2018
Please note that due to the lapse in government funding USDA has yet to report monthly slaughter for December and January. That informa on will become available at the end of this month we plant to include in the next issue.
February 2019
Page 11
Prepared by: Steiner Consulting Group 800.526.4612
USA Monthly Lamb Market Update
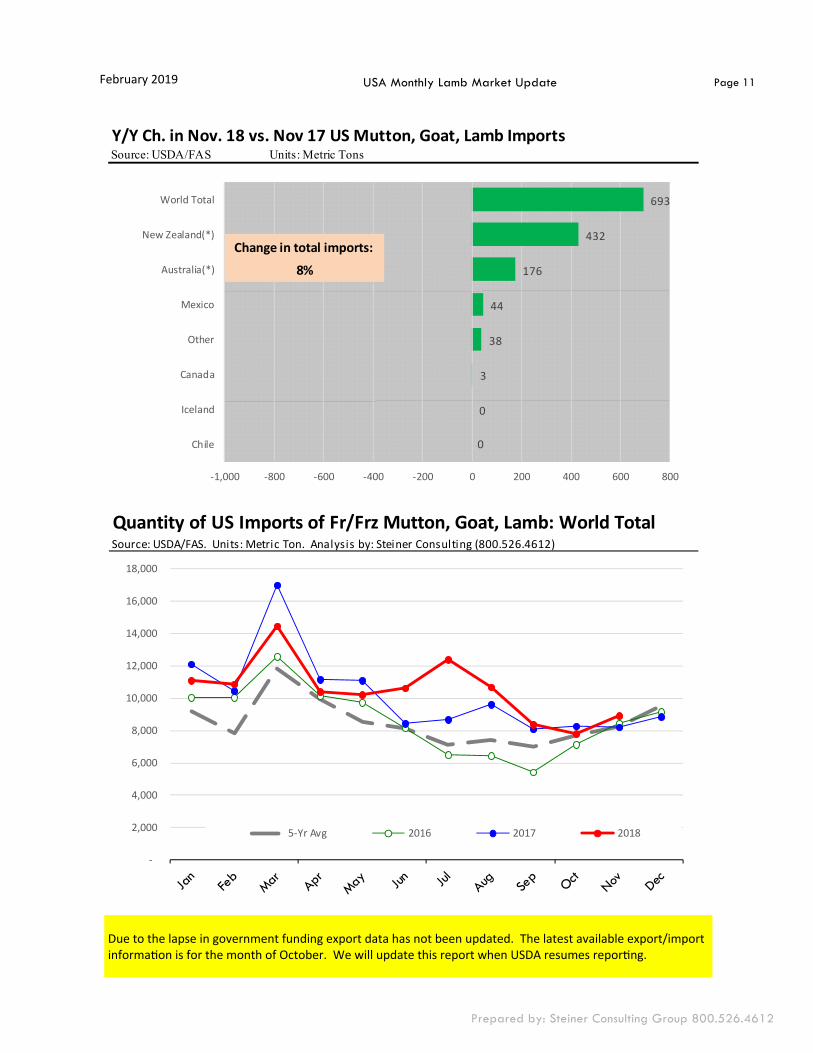
Quantity of US Imports of Fr/Frz Mutton, Goat, Lamb: World TotalSource: USDA/FAS. Units: Metric Ton. Analysis by: Steiner Consulting (800.526.4612)
-
2,000
4,000
6,000
8,000
10,000
12,000
14,000
16,000
18,000
5-Yr Avg 2016 2017 2018
Y/Y Ch. in Nov. 18 vs. Nov 17 US Mutton, Goat, Lamb ImportsSource: USDA/FAS Units: Metric Tons
0
0
3
38
44
176
432
693
-1,000 -800 -600 -400 -200 0 200 400 600 800
Chile
Iceland
Canada
Other
Mexico
Australia(*)
New Zealand(*)
World Total
8%Change in total imports:
Due to the lapse in government funding export data has not been updated. The latest available export/import informa on is for the month of October. We will update this report when USDA resumes repor ng.

February 2019
Page 12
Prepared by: Steiner Consulting Group 800.526.4612
USA Monthly Lamb Market Update
Y/Y Ch. in Nov. 18 vs. Nov 17 US Mutton, Goat, Lamb Import Value ($)Source: USDA/FAS Units: US Dollars
0
0
65,057
78,193
284,294
1,787,599
10,592,589
12,807,732
0 5,000,000 10,000,000 15,000,000
Iceland
Chile
Canada
Other
Mexico
Australia(*)
New Zealand(*)
World Total
Change in total importvalue:18%
$ Value of US Imports of Fr/Frz Mutton, Goat, Lamb: World TotalSource: USDA/FAS. Units: US Dollars. Analysis by: Steiner Consulting (800.526.4612)
20,000,000
30,000,000
40,000,000
50,000,000
60,000,000
70,000,000
80,000,000
90,000,000
100,000,000
110,000,000
120,000,000
2016 2017 2018 5-Yr Avg
Due to the lapse in government funding export data has not been updated. The latest available export/import informa on is for the month of October. We will update this report when USDA resumes repor ng.
February 2019
Page 13
Prepared by: Steiner Consulting Group 800.526.4612
USA Monthly Lamb Market Update
Quantity of US Imports of Fr/Frz Mutton, Goat, Lamb: New Zealand(*)Source: USDA/FAS. Units: Metric Ton. Analysis by: Steiner Consulting (800.526.4612)
-
500
1,000
1,500
2,000
2,500
3,000
3,500
4,000
4,500
2016 2017 2018 5-Yr Avg
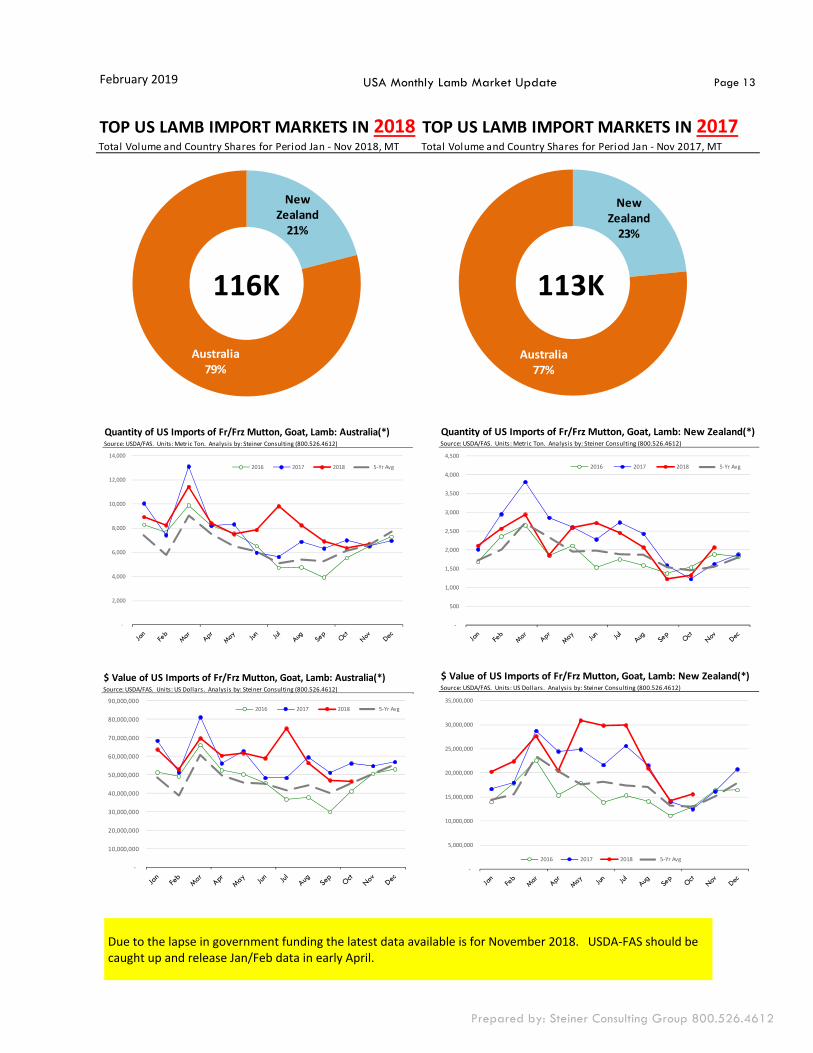
TOP US LAMB IMPORT MARKETS IN 2018 TOP US LAMB IMPORT MARKETS IN 2017Total Volume and Country Shares for Period Jan - Nov 2018, MT Total Volume and Country Shares for Period Jan - Nov 2017, MT
New Zealand
23%
Australia77%
New Zealand
21%
Australia79%
113K116K
Quantity of US Imports of Fr/Frz Mutton, Goat, Lamb: Australia(*)Source: USDA/FAS. Units: Metric Ton. Analysis by: Steiner Consulting (800.526.4612)
-
2,000
4,000
6,000
8,000
10,000
12,000
14,000
2016 2017 2018 5-Yr Avg
$ Value of US Imports of Fr/Frz Mutton, Goat, Lamb: Australia(*)Source: USDA/FAS. Units: US Dollars. Analysis by: Steiner Consulting (800.526.4612)
-
10,000,000
20,000,000
30,000,000
40,000,000
50,000,000
60,000,000
70,000,000
80,000,000
90,000,0002016 2017 2018 5-Yr Avg
$ Value of US Imports of Fr/Frz Mutton, Goat, Lamb: New Zealand(*)Source: USDA/FAS. Units: US Dollars. Analysis by: Steiner Consulting (800.526.4612)
-
5,000,000
10,000,000
15,000,000
20,000,000
25,000,000
30,000,000
35,000,000
2016 2017 2018 5-Yr Avg
Due to the lapse in government funding the latest data available is for November 2018. USDA-FAS should be caught up and release Jan/Feb data in early April.
February 2019
Page 14
Prepared by: Steiner Consulting Group 800.526.4612
USA Monthly Lamb Market Update
1942: 56,213
1960: 33,170
1990: 11,358
2012: 5,375
2018, 5,230 0
10,000
20,000
30,000
40,000
50,000
60,000
JANUARY 1 US SHEEP & LAMB INVENTORYSource: USDA 000 HEAD
February 2019
Page 15
Prepared by: Steiner Consulting Group 800.526.4612
USA Monthly Lamb Market Update
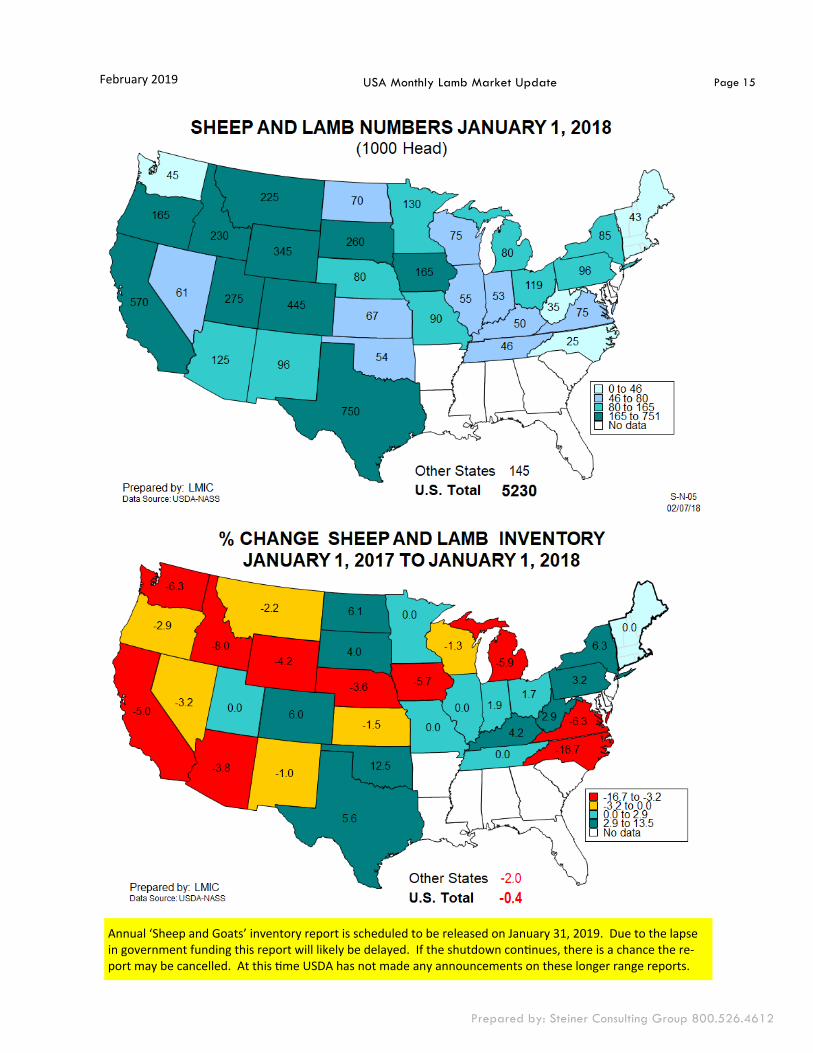
Annual ‘Sheep and Goats’ inventory report is scheduled to be released on January 31, 2019. Due to the lapse in government funding this report will likely be delayed. If the shutdown con nues, there is a chance the re-port may be cancelled. At this me USDA has not made any announcements on these longer range reports.
February 2019
Page 16
Prepared by: Steiner Consulting Group 800.526.4612
USA Monthly Lamb Market Update
0
50
100
150
200
250
300
350
400
450
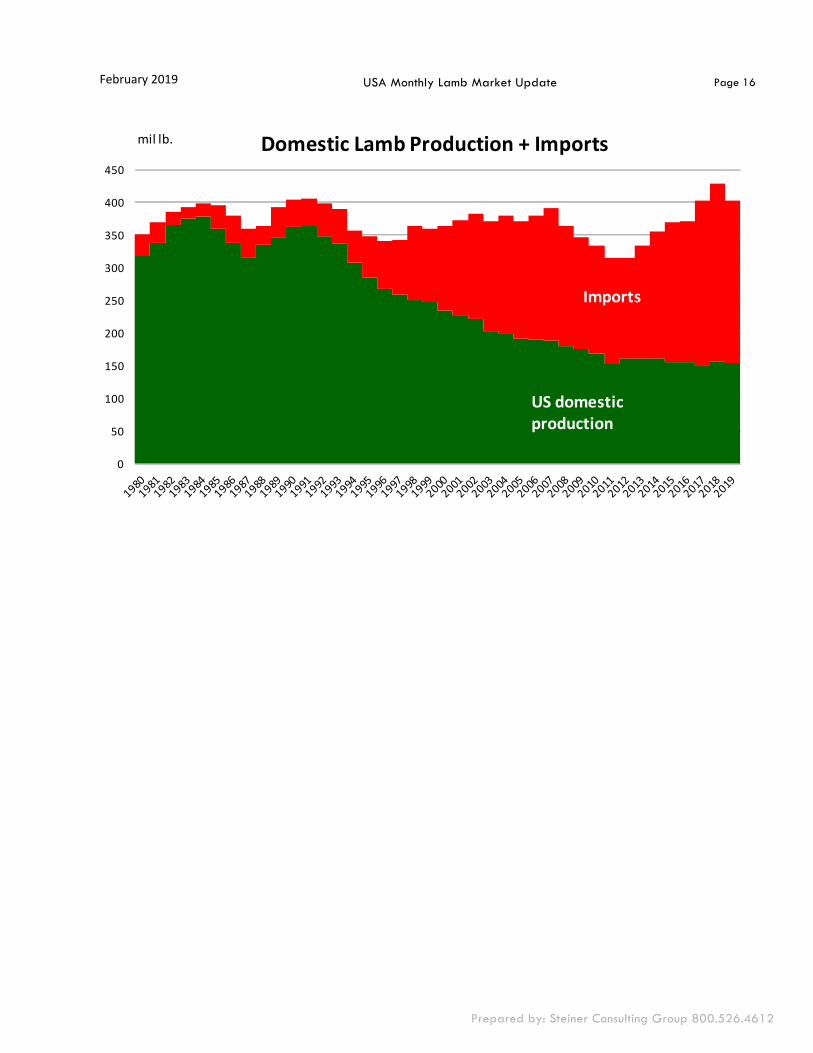
Domestic Lamb Production + Importsmil lb.
US domestic production
Imports