The Project for the Master Plan Study on Livestock, Meat and ...
356
Livestock and Fisheries Department, Government of Sindh The Islamic Republic of Pakistan JAPAN INTERNATIONAL COOPERATION AGENCY KAIHATSU MANAGEMENT CONSULTING, INC. C.D.C. INTERNATIONAL CORPORATION RDD JR 11-087 The Project for the Master Plan Study on Livestock, Meat and Dairy Development in Sindh Province in the Islamic Republic of Pakistan Final Report Part 3 Appendices October 2011
-
Upload
khangminh22 -
Category
Documents
-
view
1 -
download
0
Transcript of The Project for the Master Plan Study on Livestock, Meat and ...

Livestock and Fisheries Department, Government of Sindh The Islamic Republic of Pakistan
JAPAN INTERNATIONAL COOPERATION AGENCY
KAIHATSU MANAGEMENT CONSULTING, INC. C.D.C. INTERNATIONAL CORPORATION
RDD
JR
11-087
The Project for the Master Plan Study on Livestock, Meat and Dairy Development
in Sindh Province in the Islamic Republic of Pakistan
Final Report
Part 3
Appendices
October 2011

Livestock and Fisheries Department, Government of Sindh The Islamic Republic of Pakistan
JAPAN INTERNATIONAL COOPERATION AGENCY
KAIHATSU MANAGEMENT CONSULTING, INC. C.D.C. INTERNATIONAL CORPORATION
The Project for the Master Plan Study on Livestock, Meat and Dairy Development
in Sindh Province in the Islamic Republic of Pakistan
Final Report
Part 3
Appendices
October 2011

The Project for the Master Plan Study on Livestock, Meat and Dairy
Development in Sindh Province
in the Islamic Republic of Pakistan
Final Report
Table of Contents
Appendices
A. List of the Recommended Projects
B. Provincial Profiles
C. Report of the First Household Survey in Sindh Province (by local consulting firm)
D. Second Household Survey
E. Third Household Survey
F. Periodical Data Collection
G. Institutions (Research and Development Institute of Buffalo)
H. Report on Livestock Disease Control (by local consultant)
I. Marketing (partly by local consultant)
J. Gender
K. Extension Services in the Upper Sindh, Filed Survey Report (by local consultant)
L. Review and Suggestions from Major Related Projects in the Past
M. Project Outlines
Appendix A
List of the Recommended Projects

Ap
pen
dix
A
A -
1
Lis
t of
the
Rec
om
men
ded
Pro
ject
s
Rel
ated
Act
ion
Pla
nsi
NO
P
roje
ct T
itle
P
roje
ct O
utlin
e M
ajor
Act
ivit
ies
Pri
ori
tyii
M
ajor
Rea
sons
(1)
Irri
gat
ed A
reas
,
(2)
Non-i
rrig
ated
area
s,
(3)
Fee
ds
1
The
pro
ject
for
pro
moti
ng
the
recy
clin
g-b
ased
lives
tock
man
agem
ent
To f
orm
ula
te f
arm
ing m
odel
s on r
ecycl
ing-b
ased
inte
gra
ted liv
esto
ck m
anag
emen
t fo
r ea
ch
lives
tock
typ
e.
Sel
ecti
on o
f cr
op, m
ethod o
f cu
ltiv
atio
n,
and liv
esto
ck a
nd a
ppro
pri
ate
recy
clin
g-b
ased
liv
esto
ck m
anag
emen
t
are
pra
ctic
ed.
○
Sin
ce m
ix-f
arm
ing is
alre
ady
pra
ctic
ed
wid
ely,
the
urg
ency
is
low
.
(1)I
rrig
ated
Are
as,
(2)
Non-i
rrig
ated
area
s,
(3
) F
eeds
2
The
pro
ject
for
envir
onm
ent an
d liv
esto
ck
To s
tudy
on d
isposa
l of
pas
ture
s, w
asta
ge
from
slau
ghte
rhouse
, and m
ethan
e gas
fro
m b
urp
of
catt
le a
nd b
uff
alo
Res
earc
h a
nd s
ugges
tions
○
Ther
e ar
e oth
er thin
gs
wit
h h
igher
pri
ori
ties
(1)
Irri
gat
ed A
reas
,
(2)
Non-i
rrig
ated
area
s,
(5
) G
enet
ic
Impro
vem
ent
3
The
pro
ject
for
the
embry
o tra
nsf
er o
f co
w
and b
uff
alo
To im
pro
ve
bre
edin
g b
y fr
eeze
-pre
serv
atio
n o
f
fert
iliz
ed e
gg f
rom
super
ior
cow
and b
uff
alo
Est
abli
shm
ent of
rule
s of
fert
iliz
ed e
ggs
pro
duct
ion, e
stab
lish
men
t of
the
quar
anti
ne
syst
em o
f ovum
coll
ecti
on
caw
, san
itar
y pro
duct
ion o
f fe
rtil
ized
,
pri
nting o
n f
erti
lize
d s
traw
.
△
It is
import
ant, b
ut th
e nee
ds
of
farm
ers
are
rela
tivel
y lo
w.
(1)
Irri
gat
ed A
reas
,
(2)
Non-i
rrig
ated
area
s,
(5
) G
enet
ic
Impro
vem
ent
4
The
pro
ject
for
impro
vin
g
froze
n s
emen
of
catt
le a
nd
buff
alo
To p
roduce
act
ive
and h
ygie
nic
sem
en
Est
abli
shm
ent of
rule
s of
froze
n s
emen
pro
duct
ion, e
stab
lish
men
t of
bull
s
quar
anti
ne
syst
em, e
stim
atio
n o
f th
e
num
ber
of
sem
en a
fter
coll
ecti
on,
hyg
ienic
fro
zen s
emen
pro
duct
ion,
pri
nting o
n s
emen
str
aw, a
nd s
tric
t
exam
inat
ion o
f se
men
vit
alit
y
△
It is
import
ant, b
ut th
e nee
ds
of
farm
ers
are
rela
tivel
y lo
w.
(1)
Irri
gat
ed A
reas
,
(2)
Non-i
rrig
ated
area
s,
(5)
Gen
etic
Impro
vem
ent
5
The
pro
ject
for
capac
ity
dev
elopm
ent of
lives
tock
AI
tech
nic
ians
To incr
ease
conce
ption r
ate
of
AI
and the
num
ber
of
fert
iliz
ed a
nim
als
thro
ugh c
apac
ity
dev
elopm
ent of
AI
tech
nic
ians
Tra
inin
gs
△
It is
import
ant, b
ut th
e nee
ds
of
farm
ers
are
rela
tivel
y lo
w.
(1)
Irri
gat
ed A
reas
,
(2)
Non-i
rrig
ated
area
s,
(5)
Gen
etic
Impro
vem
ent
6
The
pro
ject
for
esta
bli
shin
g the
exam
inat
ion s
yste
m f
or
repro
duct
ive
funct
ions
of
bulls
(cat
tle
and b
uff
alo)
To c
ull
infe
rior
bull
s by
exam
inin
g thei
r
repro
duct
ive
funct
ions
at liv
esto
ck m
arket
s an
d
exhib
itio
ns
Dev
elopin
g the
exam
inat
ion g
uid
elin
e, a
cam
pai
gn f
or
awar
enes
s ra
isin
g
△
Alt
hough it is
im
port
ant, “
the
pro
ject
for
impro
vin
g c
ow
and b
uff
alo b
reed
s in
Sin
dh p
rovin
ce”
has
hig
her
pri
ori
ty.
(1)
Irri
gat
ed A
reas
,
(2)
Non-i
rrig
ated
area
s,
(5)
Gen
etic
Impro
vem
ent
7
The
pro
ject
for
capac
ity
dev
elopm
ent to
exam
ine
repro
duct
ive
funct
ions
of
bulls
(cat
tle
and b
uff
alo)
To im
pro
ve
tech
niq
ues
to e
xam
ine
the
repro
duct
ive
funct
ions
of
bull
s (c
attle
and
buff
alo)
Tra
inin
gs
to v
eter
inar
y doct
ors
△
Alt
hough it is
im
port
ant, “
the
pro
ject
for
impro
vin
g o
f co
w a
nd b
uff
alo b
reed
s in
Sin
dh p
rovin
ce”
has
hig
her
pri
ori
ty.

A -
2
Rel
ated
Act
ion
Pla
nsi
NO
P
roje
ct T
itle
P
roje
ct O
utlin
e M
ajor
Act
ivit
ies
Pri
ori
tyii
M
ajor
Rea
sons
(1)
Irri
gat
ed A
reas
,
(2)
Non-i
rrig
ated
area
s,
(5)
Gen
etic
Impro
vem
ent
8
The
pro
ject
for
capac
ity
dev
elopm
ent to
exam
ine
repro
duct
ive
funct
ions
of
cow
and f
emal
e buff
alo
To im
pro
ve
conce
ption r
ates
of
cow
and f
emal
e
buff
alo w
hic
h s
uff
er f
rom
rep
roduct
ion
dis
turb
ance
by
pro
vid
ing a
ppro
pri
ate
dia
gnosi
s
and tre
atm
ents
Tra
inin
gs
to v
eter
inar
y doct
ors
○
Alt
hough it is
im
port
ant, “
the
pro
ject
for
impro
vin
g o
f co
w a
nd b
uff
alo b
reed
s in
Sin
dh p
rovin
ce”
has
hig
her
pri
ori
ty.
(1)
Irri
gat
ed A
reas
,
(2)
Non-i
rrig
ated
area
s,
(5)
Gen
etic
Impro
vem
ent
9
The
pro
ject
for
the
bas
ic
study
on the
impro
vem
ent
of A
I co
nce
ption r
ate
To im
ple
men
t a
bas
ic s
tudy
to im
pro
ve
a
conce
ption r
ate
of
cow
and b
uff
alo
Stu
die
s on d
iffe
rence
of
sign a
nd
stre
ngth
of
hea
ting b
y re
gio
n, b
y se
ason,
by
feed
man
agem
ent, tim
ing a
nd
dura
tion o
f hea
ting, t
ime
of
ovula
tion,
and tim
ing o
f fe
rtil
izat
ion
○
It is
import
ant, b
ut th
e nee
ds
of
farm
ers
are
rela
tivel
y lo
w.
(1)
Irri
gat
ed A
reas
,
(2)
Non-i
rrig
ated
area
s,
(6)
Entr
epre
neu
rship
,
(7)
Mar
ket
ing
10
The
pro
ject
for
impro
vin
g
the
dis
trib
uti
on
infr
astr
uct
ure
To im
pro
ve
feed
er r
oad
s fr
om
mai
n r
oad
to r
ura
l
area
wher
e th
ere
are
abundan
t lives
tock
but not
acce
ss to m
arket
Dis
cuss
ion w
ith loca
l gover
nm
ent an
d
com
munit
y, p
lannin
g a
nd c
onst
ruct
ion
△
The
road
const
ruct
ion s
eem
s not a
pro
ject
under
the
dep
artm
ent
(1)
Irri
gat
ed A
reas
,
11
The
pro
ject
for
dev
elopin
g a
ppro
pri
ate
tech
nolo
gie
s fo
r sm
all an
d
med
ium
sca
le d
airy
farm
ers
To iden
tify
appro
pri
ate
dai
ry tec
hnolo
gie
s of
farm
ing, f
eed a
nd g
rass
land m
anag
emen
t,
repro
duct
ion, a
nim
al h
ealt
h, a
nd b
reed
ing f
or
mic
ro, s
mal
l, a
nd m
ediu
m f
arm
ers,
and d
evel
op
appro
pri
ate
teac
hin
g m
anual
s
Pla
nnin
g a
nd im
ple
men
tati
on o
f th
e
dem
onst
rati
on, e
xtr
acti
ons
of
appro
pri
ate
tech
niq
ues
, and d
evel
opm
ent of
man
ual
s
◎
Appro
pri
ate
dai
ry tec
hnolo
gie
s fo
r m
icro
,
smal
l, a
nd m
ediu
m s
cale
dai
ry f
arm
ers
are
not ver
ifie
d o
n f
arm
yet
. It is
quit
e
nec
essa
ry a
nd u
rgen
t.
(3)
Irri
gat
ed A
reas
12
The
pro
ject
for
dev
elopin
g a
ppro
pri
ate
fatt
enin
g tec
hnolo
gie
s
To iden
tify
appro
pri
ate
fatt
enin
g tec
hnolo
gie
s in
the
irri
gat
ed a
reas
for
impro
vem
ent of
fatt
enin
g
effi
cien
cy a
nd incr
ease
of
farm
ers’
inco
me,
and
dev
elop a
ppro
pri
ate
teac
hin
g m
anual
s
On f
arm
dem
onst
rati
on a
nd v
erif
icat
ion
of
fatt
enin
g tec
hnolo
gie
s fo
cusi
ng o
n
feed
ing.
◎
Appro
pri
ate
fatt
enin
g tec
hnolo
gie
s ar
e not
ver
ifie
d o
n f
arm
. It is
quit
e nec
essa
ry a
nd
urg
ent.
(1)
Irri
gat
ed A
reas
13
The
pro
ject
for
appro
pri
ate
dai
ry f
arm
ing
in c
attl
e co
lonie
s
To im
pro
ve
mil
k p
roduct
ivit
y in
cat
tle
colo
nie
s
- T
rain
ing o
f fa
rmin
g, f
eedin
g
man
agem
ent, f
odder
, rep
roduct
ion,
anim
al h
ealt
h, a
nd b
reed
ing.
- Im
pro
vem
ent of
targ
et p
lots
for
a bet
ter
rear
ing c
onditio
n, e
.g. i
nst
alla
tion o
f
ven
tila
tion a
nd low
erin
g r
eari
ng d
ensi
ty.
◎
Incr
ease
in the
pro
duct
ion c
apab
ilit
y o
f
catt
le c
olo
nie
s has
a s
ignif
ican
t im
pac
t.

A -
3
Rel
ated
Act
ion
Pla
nsi
NO
P
roje
ct T
itle
P
roje
ct O
utlin
e M
ajor
Act
ivit
ies
Pri
ori
tyii
M
ajor
Rea
sons
(1)
Irri
gat
ed A
reas
14
The
pro
ject
for
the
bas
ic
study
on s
altb
ush
mutt
on
To s
tudy
nee
ds,
pro
duct
ion a
nd s
upply
sys
tem
of
the
salt
bush
mutton a
s a
bra
nded
pro
duct
R
esea
rch a
nd s
ugges
tions
○
Bra
ndin
g o
f li
ves
tock
pro
duct
s is
a p
art of
import
ant st
rate
gie
s, b
ut it
is
not a
hig
hly
urg
ent m
atte
r.
(1)
Irri
gat
ed A
reas
15
The
pro
ject
for
pro
moti
ng
pro
duct
ion a
nd s
ales
of
hig
h q
ual
ity
mea
t
To p
rom
ote
pro
duct
ion a
nd s
ales
of
hig
h q
ual
ity
mea
t w
hic
h c
an b
e so
ld b
y hig
her
pri
ce f
or
dom
esti
c an
d inte
rnat
ional
mar
ket
Nee
ds
asse
ssm
ent, e
stab
lish
men
t of
stan
dar
d o
f m
eat qual
ity,
tra
inin
gs
of
fatt
enin
g tec
hniq
ue,
sal
es p
rom
otion
△
Pro
moti
ng h
igh q
ual
ity
mea
t is
im
port
ant,
but th
is s
hould
be
care
full
y c
onsi
der
ed
afte
r a
mea
t gra
din
g s
yst
em is
off
icia
lly
inst
itutional
ized
.
(1)
Irri
gat
ed A
reas
16
The
pro
ject
for
pro
moti
ng
rear
ing liv
esto
ck f
or
Eid
fest
ival
To s
upport
far
mer
s w
ho r
ear
lives
tock
for
Eid
fest
ival
as
aim
ing incr
ease
of
the
num
ber
of
lives
tock
and f
arm
ers
who a
re involv
ed to the
busi
nes
s fo
r E
id f
esti
val
(ta
rget
ing a
reas
can
be
San
ghar
dis
tric
t w
her
e th
ere
are
succ
essf
ul ca
ses)
A n
eeds
anal
ysis
, tra
inin
gs
of
rear
ing
tech
niq
ues
, support
s of
sell
ing
○
The
mar
ket
dem
and is
hig
h. H
ow
ever
, the
maj
or
targ
et o
f th
is p
roje
ct w
ould
not be
mic
ro a
nd s
mal
l sc
ale
but m
ediu
m a
nd
larg
e fa
rmer
s.
(2)
Non-i
rrig
ated
area
s 17
The
pro
ject
for
lives
tock
pro
motion in the
non-i
rrig
ated
are
as
To iden
tify
appro
pri
ate
tech
nolo
gie
s of
rear
ing
and m
arket
ing f
or
mic
ro, s
mal
l, a
nd m
ediu
m
farm
ers
in the
non-i
rrig
ated
are
as to s
tabil
ize
thei
r
livel
ihood, a
nd d
evel
op a
ppro
pri
ate
teac
hin
g
man
ual
s
Pla
nnin
g a
nd im
ple
men
tati
on o
f th
e
dem
onst
rati
on o
f m
odel
s, e
xtr
acti
ons
of
appro
pri
ate
tech
niq
ues
on r
eari
ng a
nd
mar
ket
ing, a
nd d
evel
opm
ent of
man
ual
s
◎
Appro
pri
ate
tech
nolo
gie
s fo
r non-i
rrig
ated
area
s ar
e not ver
ifie
d o
n f
arm
yet
. It is
quite
nec
essa
ry a
nd u
rgen
t.
(2)
Non-i
rrig
ated
area
s 18
The
pro
ject
for
wat
er
supply
fo
r li
ves
tock
To d
evel
op g
round w
ater
in n
on-i
rrig
ated
are
a
aim
ing a
t im
pro
vem
ent of
lives
tock
pro
duct
ion.
Tar
get
are
as a
re T
har
des
ert an
d K
ohis
tan h
illy
area
.
Inves
tigat
ion o
f gro
und w
ater
,
pre
par
atio
n o
f a
pla
n, w
ell si
nker
and
set-
up o
f w
ater
supply
fac
ilit
y, a
nd
org
aniz
ing m
anag
emen
t co
oper
ativ
e
◎
One
of
larg
est co
nst
rain
ts o
n liv
esto
ck
pro
duct
ion in the
non-i
rrig
ated
are
as is
lim
itat
ion o
f w
ater
.
(2)
Non-i
rrig
ated
area
s 19
The
pro
ject
for
the
feed
pro
duct
ion in s
alty
lan
d
To incr
ease
a p
roduct
ion o
f fe
ed b
y cu
ltiv
atin
g
fodder
on s
alty
lan
ds
Imple
men
tati
on o
f a
study
on s
alin
ity
tole
rant pla
nts
and s
alty
lan
ds,
pre
par
atio
n o
f a
pla
n f
or
dev
elopm
ent
and d
emonst
ration o
f sa
lty
land
uti
liza
tion
◎
One
of
larg
est co
nst
rain
ts o
n liv
esto
ck
pro
duct
ion in the
non-i
rrig
ated
are
as is
lim
itat
ion o
f fo
dder
.
A -
4
Rel
ated
Act
ion
Pla
nsi
NO
P
roje
ct T
itle
P
roje
ct O
utlin
e M
ajor
Act
ivit
ies
Pri
ori
tyii
M
ajor
Rea
sons
(2)
Non-i
rrig
ated
area
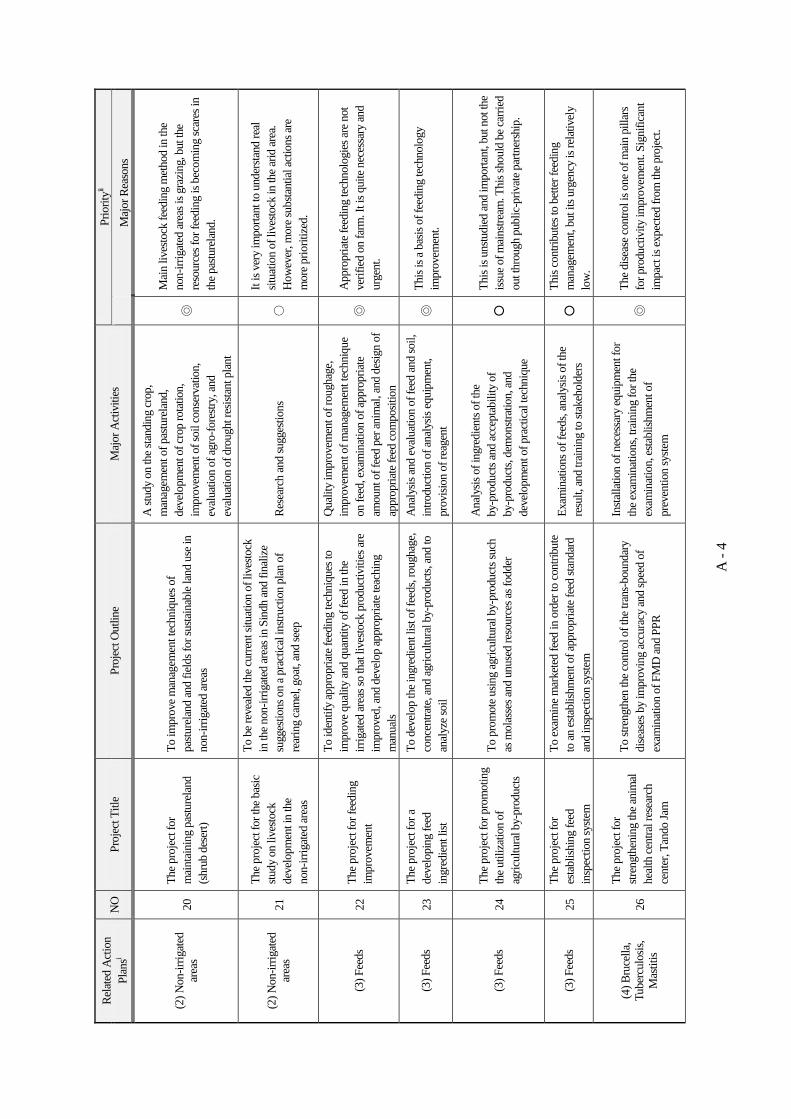
s 20
The
pro
ject
for
mai
nta
inin
g p
astu
rela
nd
(shru
b d
eser
t)
To im
pro
ve
man
agem
ent te
chniq
ues
of
pas
ture
land a
nd f
ield
s fo
r su
stai
nab
le lan
d u
se in
non-i
rrig
ated
are
as
A s
tudy
on the
stan
din
g c
rop,
man
agem
ent of
pas
ture
land,
dev
elopm
ent of
crop r
ota
tion,
impro
vem
ent of
soil c
onse
rvat
ion,
eval
uat
ion o
f ag
ro-f
ore
stry
, and
eval
uat
ion o
f dro
ught re
sist
ant pla
nt
◎
Mai
n liv
esto
ck f
eedin
g m
ethod in the
non-i
rrig
ated
are
as is
gra
zing, b
ut th
e
reso
urc
es f
or
feed
ing is
bec
om
ing s
care
s in
the
pas
ture
land.
(2)
Non-i
rrig
ated
area
s 21
The
pro
ject
for
the
bas
ic
study
on liv
esto
ck
dev
elopm
ent in
the
non-i
rrig
ated
are
as
To b
e re
vea
led the
curr
ent si
tuat
ion o
f li
ves
tock
in the
non-i
rrig
ated
are
as in S
indh a
nd f
inal
ize
sugges
tions
on a
pra
ctic
al inst
ruct
ion p
lan o
f
rear
ing c
amel
, goat
, and s
eep
Res
earc
h a
nd s
ugges
tions
○
It is
ver
y im
port
ant to
under
stan
d r
eal
situ
atio
n o
f li
ves
tock
in the
arid
are
a.
How
ever
, m
ore
subst
anti
al a
ctio
ns
are
more
pri
ori
tize
d.
(3)
Fee
ds
22
The
pro
ject
for
feed
ing
impro
vem
ent
To iden
tify
appro
pri
ate
feed
ing tec
hniq
ues
to
impro
ve
qual
ity
and q
uan
tity
of
feed
in the
irri
gat
ed a
reas
so that
liv
esto
ck p
roduct
ivit
ies
are
impro
ved
, an
d d
evel
op a
ppro
pri
ate
teac
hin
g
man
ual
s
Qual
ity
impro
vem
ent of
rough
age,
impro
vem
ent of
man
agem
ent te
chniq
ue
on f
eed, e
xam
inat
ion o
f ap
pro
pri
ate
amount of
feed
per
anim
al, a
nd d
esig
n o
f
appro
pri
ate
feed
com
posi
tion
◎
Appro
pri
ate
feed
ing tec
hnolo
gie
s ar
e not
ver
ifie
d o
n f
arm
. It is
quit
e nec
essa
ry a
nd
urg
ent.
(3)
Fee
ds
23
The
pro
ject
for
a
dev
elopin
g f
eed
ingre
die
nt list
To d
evel
op the
ingre
die
nt li
st o
f fe
eds,
rough
age,
conce
ntr
ate,
and a
gri
cultura
l by-p
roduct
s, a
nd to
anal
yze
soil
Anal
ysis
and e
val
uat
ion o
f fe
ed a
nd s
oil
,
intr
oduct
ion o
f an
alysi
s eq
uip
men
t,
pro
vis
ion o
f re
agen
t
◎
This
is
a bas
is o
f fe
edin
g tec
hnolo
gy
impro
vem
ent.
(3)
Fee
ds
24
The
pro
ject
for
pro
moti
ng
the
uti
liza
tion o
f
agri
cult
ura
l by-
pro
duct
s
To p
rom
ote
usi
ng a
gri
cult
ura
l by-
pro
duct
s su
ch
as m
ola
sses
and u
nuse
d r
esourc
es a
s fo
dder
Anal
ysis
of
ingre
die
nts
of
the
by-
pro
duct
s an
d a
ccep
tabil
ity
of
by-
pro
duct
s, d
emonst
ration, a
nd
dev
elopm
ent of
pra
ctic
al tec
hniq
ue
○
This
is
unst
udie
d a
nd im
port
ant, b
ut not th
e
issu
e of
mai
nst
ream
. This
should
be
carr
ied
out th
rough p
ubli
c-pri
vat
e par
tner
ship
.
(3)
Fee
ds
25
The
pro
ject
for
esta
bli
shin
g f
eed
insp
ection s
yste
m
To e
xam
ine
mar
ket
ed f
eed in o
rder
to c
ontr
ibute
to a
n e
stab
lish
men
t of
appro
pri
ate
feed
sta
ndar
d
and insp
ecti
on s
yste
m
Exam
inat
ions
of
feed
s, a
nal
ysis
of
the
resu
lt, a
nd tra
inin
g to s
takeh
old
ers
○
This
contr
ibute
s to
bet
ter
feed
ing
man
agem
ent, b
ut it
s urg
ency
is
rela
tivel
y
low
.
(4)
Bru
cell
a,
Tuber
culo
sis,
Mas
titi
s 26
The
pro
ject
for
stre
ngth
enin
g the
anim
al
hea
lth c
entr
al r
esea
rch
cente
r, T
ando J
am
To s
tren
gth
en the
contr
ol of
the
tran
s-boundar
y
dis
ease
s by
impro
vin
g a
ccura
cy a
nd s
pee
d o
f
exam
inat
ion o
f F
MD
and P
PR
Inst
alla
tion o
f nec
essa
ry e
quip
men
t fo
r
the
exam
inat
ions,
tra
inin
g f
or
the
exam
inat
ion, e
stab
lish
men
t of
pre
ven
tion s
yste
m
◎
The
dis
ease
contr
ol is
one
of
mai
n p
illa
rs
for
pro
duct
ivit
y im
pro
vem
ent. S
ignif
ican
t
impac
t is
expec
ted f
rom
the
pro
ject
.

A -
5
Rel
ated
Act
ion
Pla
nsi
NO
P
roje
ct T
itle
P
roje
ct O
utlin
e M
ajor
Act
ivit
ies
Pri
ori
tyii
M
ajor
Rea
sons
(4)
Bru
cell
a,
Tuber
culo
sis,
Mas
titi
s 27
The
pro
ject
for
dem
onst
rati
ng the
tran
s-boundar
y dis
ease
s
quar
anti
ne
model
To d
emonst
rate
fre
e ar
eas
from
FM
D a
nd P
PR
in
ord
er to e
stab
lish
nec
essa
ry tec
hniq
ues
and
syst
em f
or
pre
ven
tion o
f F
MD
and P
PR
at th
e
pro
vin
cial
lev
el
Rev
isio
n o
f ru
les
on a
nim
al h
ealth,
dem
onst
rati
on o
f quar
antine
insp
ection
syst
em, t
rain
ing o
f quar
antine
off
icer
s,
des
ign a
nd d
emonst
ration o
f th
e fr
ee
area
s
◎
The
dis
ease
contr
ol is
one
of
mai
n p
illa
rs
for
pro
duct
ivit
y im
pro
vem
ent. T
hough the
input of
the
pro
ject
is
larg
e, s
ignif
ican
t
impac
t is
expec
ted f
rom
the
pro
ject
.
(4)
Bru
cell
a,
Tuber
culo
sis,
Mas
titi
s 28
The
pro
ject
for
incr
easi
ng
the
pro
duct
ion o
f vac
cine
To im
pro
ve
the
pro
duct
ion a
nd d
istr
ibuti
on
syst
em o
f vac
cines
for
lives
tock
Set
up o
f dis
cuss
ion tab
le f
or
stak
ehold
ers
of
vac
cine
pro
duct
ion,
esta
bli
shm
ent of
busi
nes
s m
odel
s,
dev
elopm
ent of
pro
duct
ion a
nd
dis
trib
uti
on p
lans,
pro
duct
ion o
f vac
cines
△
Import
ance
of
vac
cine
is c
lear
, but
import
ed v
acci
nes
are
wid
ely
uti
lize
d
today
as
wel
l as
loca
l m
ade
vac
cines
.
More
over
, man
y st
akeh
old
ers
mak
e th
e
feas
ibil
ity
of
the
pro
ject
uncl
ear.
(5)
Gen
etic
Impro
vem
ent
29
The
pro
ject
for
impro
vin
g
cow
and b
uff
alo b
reed
s in
Sin
dh p
rovin
ce
To p
repar
e an
d im
ple
men
t th
e pra
ctic
al a
nd
sim
ple
pla
n o
f bre
ed im
pro
vem
ent th
rough
support
ing the
Sin
dh L
ives
tock
Bre
eder
s
Ass
oci
atio
ns
Bas
ic s
tudy,
tra
inin
g o
n tec
hnic
ians,
list
-up o
f re
gis
tere
d f
arm
ers,
sel
ecti
on o
f
anim
als,
pro
gen
y te
stin
g, p
repar
atio
n a
nd
imple
men
tati
on o
f gen
etic
im
pro
vem
ent
pla
n
◎
Gen
etic
im
pro
vem
ent is
one
of
mai
n p
illa
rs
for
pro
duct
ivit
y im
pro
vem
ent.
Impro
vem
ent of
fam
ous
loca
l bre
eds
is
indis
pen
sably
im
port
ant fo
r S
indh.
(5)
Gen
etic
Impro
vem
ent
30
The
pro
ject
for
the
embry
o tra
nsf
er o
f co
w
and b
uff
alo
To im
pro
ve
bre
edin
g b
y fr
eeze
-pre
serv
atio
n o
f
fert
iliz
ed e
gg f
rom
super
ior
cow
and b
uff
alo
Est
abli
shm
ent of
rule
s of
fert
iliz
ed e
ggs
pro
duct
ion, e
stab
lish
men
t of
the
quar
anti
ne
syst
em o
f ovum
coll
ecti
on
caw
, san
itar
y pro
duct
ion o
f fe
rtil
ized
,
pri
nting o
n f
erti
lize
d s
traw
.
△
It is
import
ant, b
ut th
e nee
ds
of
farm
ers
are
rela
tivel
y lo
w.
(6)
Mar
ket
ing
31
The
pro
ject
for
dev
elopin
g m
arket
ing
skil
l of
farm
ers
To d
evel
op m
odel
met
hods
of
farm
er-o
rien
ted
mar
ket
ing tec
hniq
ues
R
esea
rch, p
ilot pro
ject
, sugges
tion
◎
By
dev
elopin
g a
nd d
isse
min
atin
g the
model
met
hods,
far
mer
s ca
n incr
ease
thei
r
sale
s an
d the
dis
trib
ution c
han
nel
of
mil
k
wil
l be
dev
eloped
(6)
Mar
ket
ing
32
The
pro
ject
for
fost
erin
g
the
publi
c an
d p
rivat
e
par
tner
ship
To f
ost
er c
oll
abora
tion w
ith p
rivat
e co
mpan
ies
so
as to d
isse
min
ate
dai
ry tec
hniq
ues
, incr
ease
mil
k
and m
eat pro
duct
ion, a
nd im
pro
ve
thei
r qual
ity.
Ther
e ar
e tw
o lev
els
of
coll
abora
tions.
The
coll
abora
tion a
t th
e pro
vin
cial
lev
el thro
ugh P
DA
and that
at th
e dis
tric
t le
vel
thro
ugh
pri
vat
e
com
pan
ies
work
ing a
t th
e sa
me
area
wil
l be
dem
onst
rate
d in the
pro
ject
.
Est
abli
shm
ent of
syst
em to c
oll
abora
te
wit
h p
rivat
e co
mpan
ies
and N
GO
s, a
pla
nnin
g b
ased
on the
collab
ora
tion a
t
dis
tric
t le
vel
, a p
repar
atio
n o
f poli
cy to
hom
ogen
ized
liv
esto
ck tec
hniq
ues
○
Bec
ause
of
lim
ited
gover
nm
ent budget
,
hum
an r
esourc
es, a
nd s
trat
egy,
dev
elopm
ent of
lives
tock
sec
tor
init
iate
d
only
by
gover
nm
ent is
dif
ficu
lt.
NG
Os
and p
rivat
e co
mpan
ies
are
doin
g
man
y ex
tensi
on a
ctiv
itie
s, b
ut th
ere
is n
o
coll
abora
tions
among them
.

A -
6
Rel
ated
Act
ion
Pla
nsi
NO
P
roje
ct T
itle
P
roje
ct O
utlin
e M
ajor
Act
ivit
ies
Pri
ori
tyii
M
ajor
Rea
sons
(6)
Mar
ket
ing
33
The
pro
ject
for
pro
moti
on
of
cold
chai
n
To d
evel
op a
nd d
emonst
rate
model
s of
inst
alla
tion o
f m
ilk c
hil
ler
faci
liti
es b
ased
on c
ost
ben
efit
anal
ysis
Cas
e st
udy,
pilot pro
ject
s, e
val
uat
ion a
nd
anal
ysis
, an
d d
emonst
ration o
f m
odel
s ◎
Pro
moti
on o
f es
tabli
shm
ent of
cold
chai
n
is im
port
ant to
dev
elop d
istr
ibution
net
work
(6)
Mar
ket
ing
34
The
pro
ject
for
impro
vin
g
lives
tock
mar
ket
s
To d
evel
op a
guid
elin
e fo
r m
anag
emen
t of
lives
tock
mar
ket
so that
liv
esto
ck tra
nsa
ctio
n
bec
om
e ef
fect
ive
and e
ffic
ient
A s
tudy
on liv
esto
ck m
arket
, sel
ecti
on o
f
model
liv
esto
ck m
arket
, dev
elopm
ent of
a guid
elin
e fo
r m
anag
emen
t of
lives
tock
mar
ket
, appli
cation o
f th
e guid
elin
e at
sele
cted
mar
ket
s
◎
Ther
e is
a lar
ge
room
for
impro
vem
ent in
lives
tock
mar
ket
, and its
posi
tive
effe
ct o
n
lives
tock
tra
nsa
ctio
n is
expec
ted to b
e hig
h.
(6)
Mar
ket
ing
35
The
pro
ject
for
rehab
ilit
atio
n o
f
slau
ghte
rhouse
To d
evel
op a
guid
elin
e fo
r m
anag
emen
t of
slau
ghte
rhouse
s so
that
pro
cess
ing c
apac
ity a
nd
condit
ions
are
impro
ved
.
A s
tudy
on c
urr
ent si
tuat
ion o
f
slau
ghte
rhouse
s, a
nd p
lannin
g o
f
rehab
ilit
atio
n/inst
allm
ent of
slau
ghte
rhouse
, dev
elopm
ent of
a
guid
elin
e, a
pplica
tion o
f th
e guid
elin
e at
sele
cted
sla
ughte
rhouse
s
◎
Ther
e is
a lar
ge
room
for
impro
vem
ent in
lives
tock
mar
ket
. T
his
is
nec
essa
ry f
or
food s
afet
y an
d e
xport
pro
moti
on.
(6)
Mar
ket
ing
36
The
pro
ject
for
impro
vem
ent of
mil
k
qual
ity
To a
im s
tandar
diz
atio
n o
f m
ilk b
ased
on its
qual
ity,
and p
rom
otion o
f qual
ity
mil
k.
Surv
ey o
n m
ilk q
ual
ity
in c
urr
ent
dis
trib
uti
on c
han
nel
, consu
mer
nee
ds
surv
ey, fo
rmula
tion o
f m
ilk q
ual
ity
stan
dar
d, p
rom
otion o
f bra
nded
qual
ity
mil
k
◎
It w
ould
be
the
firs
t st
ep f
or
impro
vem
ent
of
mil
k q
ual
ity.
(6)
Mar
ket
ing
37
The
pro
ject
on the
mea
t
gra
din
g s
yste
m
To a
im intr
oduct
ion o
f m
eat st
andar
d b
ased
on its
qual
ity,
and p
rom
otion o
f qual
ity
mea
t
Surv
ey o
n c
urr
ent si
tuat
ion o
f m
eat
qual
ity,
consu
mer
nee
ds
surv
ey,
dev
elopm
ent of
dra
ft m
eat gra
din
g
syst
em, i
nst
itutional
izat
ion o
f th
e
gra
din
g s
yste
m, p
rom
oti
on o
f bra
nded
qual
ity
mea
t
◎
It w
ould
be
the
firs
t st
ep f
or
impro
vem
ent
of
mea
t an
d m
eat pro
duct
s’ q
ual
ity.
(6)
Mar
ket
ing
38
The
pro
ject
for
the
study
on f
orm
ula
tion o
f lo
cal
spec
ialt
ies
To s
ugges
t poss
ibilit
y of
loca
l sp
ecia
ltie
s w
hic
h
contr
ibute
an incr
ease
of
inco
me,
reg
ional
dev
elopm
ent, a
nd f
utu
re e
xport
pro
moti
on s
uch
as o
stri
ch, c
amel
, des
i poult
ry, s
alt bush
mutton,
ghee
, butt
er, c
hee
se, s
alt bush
mutton, v
eal m
eat,
and s
o o
n
Res
earc
h a
nd s
ugges
tions
◎
The
pote
nti
al o
f li
ves
tock
dev
elopm
ent in
each
are
a is
lar
ge
but is
not fo
cuse
d w
ell.
This
stu
dy
sugges
ts p
ote
nti
al loca
l
spec
ialt
ies
whic
h w
ill be
appli
ed to “
the
pro
ject
for
pro
moti
ng loca
l sp
ecia
ltie
s”.
(6)
Mar
ket
ing
39
The
pro
ject
for
pro
moti
ng
loca
l sp
ecia
ltie
s
To m
ake
loca
l peo
ple
to b
e pro
ud o
f an
d
contr
ibute
far
mer
s’ inco
me,
reg
ional
Form
ula
tion o
f th
e co
mm
itte
e fo
r lo
cal
spec
ialt
ies,
a m
arket
stu
dy
and s
elec
tion
◎
Act
ive
par
tici
pat
ion o
f lo
cal fa
rmer
s ca
n b
e
expec
ted thro
ugh this
pro
ject
. T
his
is
a

A -
7
Rel
ated
Act
ion
Pla
nsi
NO
P
roje
ct T
itle
P
roje
ct O
utlin
e M
ajor
Act
ivit
ies
Pri
ori
tyii
M
ajor
Rea
sons
dev
elopm
ent, a
nd f
utu
re e
xport
pro
moti
on
thro
ugh p
rom
oti
ng loca
l sp
ecia
ltie
s w
hic
h a
re
sele
cted
in “
the
pro
ject
for
the
form
ula
tion s
tudy
on loca
l sp
ecia
ltie
s” s
uch
as
cam
el, d
esi poult
ry,
ghee
, butt
er, c
hee
se, s
alt bush
mutton, v
eal m
eat,
and s
o o
n
of
loca
l sp
ecia
ltie
s at
the
dis
tric
t le
vel
or
zonal
lev
el, f
orm
ula
tion o
f th
e ex
ecuti
ve
com
mit
tees
at th
e dis
tric
t le
vel
,
dev
elopm
ent of
the
imple
men
tati
on p
lan,
support
fin
anci
ng the
pilot pro
ject
quite
effe
ctiv
e lo
cal ap
pro
ach o
f li
ves
tock
pro
motion.
(6)
Mar
ket
ing
40
The
pro
ject
for
mar
ket
info
rmat
ion s
yste
m
To d
evel
op a
model
sys
tem
for
dis
sem
inat
ing
nec
essa
ry m
arket
info
rmat
ion o
n d
airy
and m
eat
pro
duct
s
Sel
ecti
on o
f an
org
aniz
atio
n in-c
har
ge,
kin
ds
of
info
rmat
ion, m
ethods
of
dat
a
coll
ecti
on a
nd d
isse
min
atio
n,
dev
elopm
ent of
a m
odel
sys
tem
◎
This
pro
ject
wil
l fa
cili
tate
far
mer
s an
d
dis
trib
ute
rs to e
ffic
ientl
y pro
duce
, sel
l, a
nd
dis
trib
ute
thei
r pro
duct
s.
(6)
Mar
ket
ing
41
The
pro
ject
for
esta
bli
shm
ent of
export
pro
motion inst
itution
To e
stab
lish
an inst
ituti
on f
or
export
pro
moti
on
in a
ccord
ance
wit
h o
ther
inst
itutions.
To d
evel
op
an a
ctio
n p
lan b
y th
e in
stitution
Est
abli
shm
ent of
the
inst
ituti
on f
or
export
pro
motion, a
nd d
evel
opm
ent of
acti
on p
lan
◎
For
the
export
pro
moti
on, e
stab
lish
men
t of
inst
itution in a
ssoci
ate
wit
h the
lives
tock
dep
artm
ent is
im
port
ant
(6)
Mar
ket
ing
42
The
surv
ey o
n p
rom
oti
ng
export
of
lives
tock
and
lives
tock
pro
duct
s
To p
rom
ote
export
liv
esto
ck a
nd liv
esto
ck
pro
duct
s
A m
arket
stu
dy
of
lives
tock
and
lives
tock
pro
duct
s of
nei
ghbori
ng
countr
ies,
qual
ity
impro
vem
ent of
lives
tock
and liv
esto
ck p
roduct
s, a
nd
pre
par
atio
n o
f bra
ndin
g s
trat
egy
○
Alt
hough p
rom
oti
ng e
xport
is
import
ant,
mee
ting d
om
esti
c dem
and is
the
pri
mar
ily
issu
e to
be
addre
ssed
.
(6)
Mar
ket
ing
43
The
pro
ject
for
pro
moti
ng
export
of
mozz
arel
la
chee
se
To p
rom
ote
pro
duct
ion a
nd e
xport
of
hygie
nic
and h
igh q
ual
ity
of
mozz
arel
la c
hee
se w
hic
h
mee
t an
inte
rnat
ional
sta
ndar
d
A s
tudy
on c
urr
ent pro
duct
s an
d m
arket
pote
nti
al, d
evel
opm
ent of
pro
duct
s,
pro
motion a
nd a
dver
tise
men
t
○
Mozz
arel
la c
hee
se is
a pro
duct
wit
h h
igh
pote
nti
alit
y in
an inte
rnat
ional
mar
ket
, but
its
impac
t is
lim
ited
.
(6)
Mar
ket
ing
44
The
pro
ject
for
the
bas
ic
study
on q
ual
ity
and
mar
ket
pote
nti
al o
f w
ool
To c
ontr
ibute
to p
rom
oti
on o
f w
ool e
xport
by
studyi
ng q
ual
ity
and m
arket
pote
ntial
of
wool
Res
earc
h a
nd s
ugges
tions
△
This
fie
ld is
alre
ady
studie
d a
nd e
xport
wool in
dust
ry is
wel
l-es
tabli
shed
.
Ther
efore
the
pri
ori
ty is
low
(6)
Mar
ket
ing
45
The
pro
ject
for
contr
oll
ing
smuggli
ng
To c
ontr
ol sm
uggli
ng o
f li
ves
tock
and liv
esto
ck
pro
duct
s
A s
tudy
on the
curr
ent si
tuat
ion, a
dis
cuss
ion w
ith s
takeh
old
ers,
and
enac
ting a
law
and d
evel
opin
g a
ctiv
ity
pla
n to c
ontr
ol sm
uggli
ng
△
Alt
hough c
ontr
oll
ing s
muggli
ng is
import
ant, the
area
the
LF
D c
an a
ddre
ss is
lim
ited
.

A -
8
Rel
ated
Act
ion
Pla
nsi
NO
P
roje
ct T
itle
P
roje
ct O
utlin
e M
ajor
Act
ivit
ies
Pri
ori
tyii
M
ajor
Rea
sons
(6)
Mar
ket
ing
46
The
pro
ject
for
dev
elopin
g f
erm
ente
d
mil
k p
roduct
s
To d
evel
op a
nd p
rom
ote
the
ferm
ente
d m
ilk
pro
duct
s in
the
inte
rnat
ional
mar
ket
A s
tudy
on c
urr
ent pro
duct
s, a
nee
ds
asse
ssm
ent, a
nd a
dev
elopm
ent an
d
pro
motion o
f pro
duct
s
△
Ben
efic
iary
far
mer
s m
ight be
lim
ited
in
num
ber
. M
ore
over
, A p
rom
oti
on o
f ex
port
pro
duct
s bas
ical
ly s
hould
be
init
iate
d b
y
the
pri
vat
e se
ctor
(6)
Mar
ket
ing
47
The
study
on the
bas
ic
study
on f
ood s
afet
y
To im
ple
men
t a
bas
ic s
tudy
to p
rom
ote
liv
esto
ck
insp
ection a
imin
g a
t im
pro
vem
ent of
the
food
safe
ty
Stu
dy
on a
ctual
situat
ion, f
ood
insp
ection, a
nd s
ugges
tions
△
This
is
an im
port
ant is
sue,
but in
crea
se in
pro
duct
ivit
y is
more
sig
nif
ican
t. M
ore
over
,
esse
nti
al p
arts
of
this
iss
ue
are
inco
rpora
ted
in “
The
pro
ject
for
impro
vem
ent of
mil
k
qual
ity”
and “
The
pro
ject
for
the
bas
ic
study
on m
eat gra
din
g s
yste
m”.
(6)
Mar
ket
ing
48
The
pro
ject
for
impro
vin
g
qual
ity
of
mil
k a
nd
dis
trib
uti
on c
han
nel
To d
evel
op a
dis
trib
ution c
han
nel
fro
m r
ura
l
pro
duce
rs to u
rban
mar
ket
s
Tec
hnic
al tra
inin
g o
n g
ood q
ual
ity
of
mil
k, e
stab
lish
men
t of
dis
trib
ution
chan
nel
fro
m r
ura
l pro
duce
rs to u
rban
mar
ket
, an a
nnual
contr
act an
d
dem
onst
rati
on o
f a
model
in
coll
abora
tion w
ith r
ura
l fa
rmer
s an
d
urb
an b
uye
rs
○
In the
real
situat
ion, t
his
model
may
fit
to
med
ium
and lar
ge
farm
ers
rath
er than
smal
l fa
rmer
s.
(6)
Mar
ket
ing
49
The
pro
ject
for
the
consu
mer
pro
moti
on o
f
the
pro
cess
ed m
ilk
To s
tudy
on the
consu
mer
pre
fere
nce
, a s
upply
syst
em, a
nd a
rel
atio
nsh
ip b
etw
een p
rice
and
hyg
iene/
qual
ity
of
pro
cess
ed m
ilk
Res
earc
h a
nd s
ugges
tions
△
The
tim
ing m
ight be
too e
arly
.
(7)
Entr
epre
neu
rship
50
The
pro
ject
for
stre
ngth
enin
g b
usi
nes
s
min
d o
f fa
rmer
s
To c
reat
e aw
aren
ess
on im
pro
vem
ent an
d
busi
nes
s m
ind, a
nd then
pro
vis
ion o
f bas
ic
busi
nes
s sk
ills
in o
rder
to s
tabil
ize
the
livel
ihood
of
targ
eted
lan
dle
ss, m
icro
and s
mal
l fa
rmer
s
Aw
aren
ess
crea
tion o
f fa
rmer
s, tra
inin
g
of
pro
duct
ion a
nd m
anag
emen
t,
pro
vis
ion o
f m
arket
info
rmat
ion
◎
Aw
aren
ess
crea
tion a
nd c
han
ge
of
min
dse
t
of
targ
eted
vuln
erab
le f
arm
ers
are
ver
y
import
ant an
d u
rgen
t fo
r st
abil
izin
g thei
r
livel
ihood.
(7)
Entr
epre
neu
rship
51
The
pro
ject
for
fost
erin
g
lives
tock
entr
epre
neu
rs
To e
stab
lish
model
s of
lives
tock
entr
epre
neu
rs a
s
targ
etin
g c
om
mer
cial
far
mer
s an
d f
arm
ers
inte
rest
ed in liv
esto
ck b
usi
nes
s in
irr
igat
ed a
rea
and h
ave
a ca
pac
ity
(lan
d a
nd f
inan
ce)
to s
tart
busi
nes
s
Tra
inin
gs
of
busi
nes
s pla
nnin
g,
finan
cing, a
nd liv
esto
ck m
anag
emen
t,
and m
arket
ing s
upport
◎
Not only
pro
duct
ion tec
hnolo
gie
s but al
so
busi
nes
s sk
ills
are
nec
essa
ry to im
pro
ve
the
farm
ers’
liv
elih
ood.
(7)
Entr
epre
neu
rship
52
The
pro
ject
for
stre
ngth
enin
g f
arm
er
org
aniz
atio
ns
This
pro
ject
support
s org
aniz
ing a
nd
stre
ngth
enin
g f
arm
ers’
gro
ups
com
pri
sed o
f
mic
ro, s
mal
l, a
nd m
ediu
m f
arm
ers.
It ai
ms
to
enab
le the
farm
ers
to p
roduce
join
tly
and s
ell as
Aw
aren
ess
rais
ing c
ampai
gn, t
rain
ings
of
par
tici
pat
ory
dev
elopm
ent m
ethods,
trai
nin
gs
to s
tren
gth
en f
arm
ers’
org
aniz
atio
n, a
nd im
ple
men
ting p
ilot
◎
Alt
hough o
rgan
izin
g f
arm
ers
has
a h
uge
pote
nti
al to m
ake
lives
tock
far
min
g m
ore
effe
ctiv
e an
d e
ffic
ient, it has
not bee
n
addre
ssed
. As
this
is
a bas
is o
f org
aniz
ing

A -
9
Rel
ated
Act
ion
Pla
nsi
NO
P
roje
ct T
itle
P
roje
ct O
utlin
e M
ajor
Act
ivit
ies
Pri
ori
tyii
M
ajor
Rea
sons
wel
l as
to e
stab
lish
good r
elat
ionsh
ip w
ith thei
r
landow
ner
.
acti
vit
ies
farm
ers,
this
pro
ject
should
be
conduct
ed
pri
or
to the
above
men
tioned
tw
o p
roje
cts.
(7)
Entr
epre
neu
rship
53
The
pro
ject
for
form
ula
ting liv
esto
ck
cooper
ativ
es
To s
upport
org
aniz
ing a
liv
esto
ck c
ooper
ativ
e
bas
ed o
n f
arm
ers
gro
ups
aim
ing a
t th
e ben
efit
s of
farm
ers
and e
ffec
tive
man
agem
ent of
the
org
aniz
atio
ns
A s
tudy
on the
curr
ent si
tuat
ion o
f
farm
ers’
org
aniz
atio
ns
at the
dis
tric
t
level
, lis
t-up o
f m
oti
vat
ed f
arm
ers’
gro
ups,
set
-up o
f a
dis
cuss
ion a
mong
sever
al f
arm
ers’
gro
ups,
an
esta
bli
shm
ent of
the
agri
culture
corp
ora
tive
syst
em, a
n e
stab
lish
men
t of
nec
essa
ry f
acil
itie
s, a
tra
inin
g f
or
the
man
agem
ent of
the
org
aniz
atio
ns
△
Ther
e ar
e fe
w s
ucc
esse
s of
org
aniz
ing
lives
tock
cooper
ativ
es in P
akis
tan. A
t le
ast
trai
nin
gs
for
farm
ers’
lea
der
s or
form
ula
tion o
f sm
alle
r fa
rmer
s’
org
aniz
atio
ns
nee
d to b
e ca
rrie
d o
ut b
efore
this
pro
ject
.
(7)
Entr
epre
neu
rship
54
The
pro
ject
for
a ca
pac
ity
dev
elopm
ent of
vil
lage
lead
ers
To d
evel
op c
apac
itie
s of
vil
lage
lead
ers
who c
an
bri
ng b
enef
it w
idel
y to
his
com
munit
y. T
his
pro
ject
tar
get
s la
ndow
ner
s an
d v
illa
ge
lead
ers,
and p
ay s
pec
ial at
tention to the
stro
ng
rela
tionsh
ip a
mong the
peo
ple
bel
ongin
g to the
sam
e en
dogam
y gro
ups.
Aw
aren
ess
rais
ing to c
om
munit
y le
ader
s
and r
esid
ence
s, tra
inin
gs
of
par
tici
pat
ory
dev
elopm
ent m
ethod, a
support
to
org
aniz
e fa
rmer
s’ g
roups,
pilot ac
tivit
ies
by
farm
ers’
gro
ups
○
This
pro
ject
should
be
imple
men
ted a
fter
the
pro
ject
for
stre
ngth
enin
g f
arm
ers
org
aniz
atio
ns
to d
evel
op f
arm
ers
gro
ups
to
the
nex
t le
vel
such
as
lives
tock
cooper
ativ
es.
(7)
Entr
epre
neu
rship
55
The
pro
ject
for
esta
bli
shin
g a
mec
han
ism
for
calf
sal
vat
ion
To e
stab
lish
a m
echan
ism
to r
escu
e ca
lves
gen
erat
ed f
rom
cat
tle
colo
nie
s an
d d
istr
ibute
to
smal
l an
d m
ediu
m f
arm
ers
Des
ign o
f th
e m
echan
ism
, purc
has
ing o
f
young c
alves
, est
abli
shm
ent of
shed
,
dev
elopm
ent of
subst
itute
of
mil
k.
Dev
elopm
ent of
del
iver
y pla
n, t
rain
ing
of
rear
ing
◎
This
pro
ject
incl
udes
tw
o u
rgen
t an
d
import
ant is
sues
, utili
zation o
f th
e
unta
pped
res
ourc
e an
d p
rovis
ion o
f
assi
stan
ce to s
mal
l an
d m
ediu
m s
cale
fam
ers.
(7)
Entr
epre
neu
rship
56
The
pro
ject
for
dev
elopin
g liv
esto
ck
revolv
ing s
yste
m
To im
pro
ve
livel
ihood o
f la
ndle
ss a
nd m
icro
farm
ers
thro
ugh p
rovid
ing liv
esto
ck b
y a
lives
tock
rev
olv
ing s
yste
m
Form
ula
tion o
f fa
rmer
s’ g
roup, t
rain
ing
for
pre
par
atio
n o
f busi
nes
s pla
n, a
nd
trai
nin
g o
f li
ves
tock
man
agem
ent an
d
mar
ket
ing
◎
This
is
a pro
ject
to p
rese
nt a
model
for
vuln
erab
le lan
dle
ss a
nd m
icro
sca
le
farm
ers
to h
ave
lives
tock
at lo
w r
isk
and
inves
tmen
t. S
ust
ainab
ilit
y of
the
pro
ject
is
expec
ted to b
e hig
h.
(7)
Entr
epre
neu
rship
57
The
pro
ject
for
pro
moti
ng
lives
tock
shar
ing
To im
pro
ve
inco
me
of
mic
ro, s
mal
l, a
nd m
ediu
m
farm
ers
by
revie
win
g, r
edes
ignin
g, a
nd
pro
moting the
lives
tock
shar
ing
Rev
iew
and r
edes
ign o
f th
e sh
arin
g
model
s, tra
inin
gs
of
rear
ing a
nd s
elling
tech
niq
ues
, a p
rom
oti
on o
f
docu
men
tati
ons
of
agre
emen
ts, a
nd
awar
enes
s ra
isin
g f
or
busi
nes
s
◎
Liv
esto
ck s
har
ing is
wid
ely
pra
ctic
ed b
y a
num
ber
of
farm
ers.
The
pro
ject
enab
le
both
an o
wner
and liv
esto
ck s
har
ers
to b
e
ben
efit
ed a
t lo
w r
isk.

A -
10
Rel
ated
Act
ion
Pla
nsi
NO
P
roje
ct T
itle
P
roje
ct O
utlin
e M
ajor
Act
ivit
ies
Pri
ori
tyii
M
ajor
Rea
sons
(7)
Entr
epre
neu
rship
58
The
pro
ject
for
the
bas
ic
study
on p
rom
oti
ng d
ry
anim
al r
ecyc
ling
The
mec
han
ism
of
recy
clin
g d
ry a
nim
als
in r
ura
l
area
s, w
hic
h g
ener
ated
fro
m c
attl
e co
lonie
s, is
esta
bli
shed
for
furt
her
appli
cation.
A s
tudy
on c
urr
ent si
tuat
ion f
rom
vie
wpoin
ts o
f val
ue
of
gen
etic
conse
rvat
ion a
nd c
ost
eff
ecti
ven
ess,
des
ign, d
emonst
ration, a
nd e
stab
lish
men
t
of
a m
echan
ism
◎
This
pro
ject
incl
udes
tw
o u
rgen
t an
d
import
ant is
sues
, utili
zation o
f th
e
unta
pped
and w
aste
d r
esourc
e an
d
pro
vis
ion o
f as
sist
ance
to s
mal
l an
d
med
ium
sca
le f
amer
s in
rura
l ar
eas.
(7)
Entr
epre
neu
rship
59
The
pro
ject
for
support
ing
entr
epre
neu
rship
of
pri
vat
e vet
erin
aria
ns
To s
upport
pri
vat
e vet
erin
aria
ns
to p
rovid
e
vet
erin
ary
serv
ices
on b
usi
nes
s bas
is s
ust
ainab
ly
Aw
aren
ess
rais
ing o
f fa
rmer
s,
refr
eshm
ent of
know
ledge
and
tech
niq
ues
of
pri
vat
e vet
erin
aria
ns
○
Role
of
pri
vat
e vet
erin
aria
ns
and liv
esto
ck
dep
artm
ent is
not st
rate
gic
ally
dem
arca
ted
yet
.
(7)
Entr
epre
neu
rship
60
The
pro
ject
of
the
bas
ic
study
on the
pro
moti
on o
f
the
rura
l fi
nan
ce
To s
tudy
feas
ibil
ity
of
loan
sys
tem
such
as
finan
ce p
rovid
ed b
y li
ves
tock
rel
ated
org
aniz
atio
ns
and info
rmal
fin
ance
bet
wee
n
landow
ner
and f
arm
ers
aim
ing a
t pro
moti
on o
f
rura
l fi
nan
ce
Set
-up o
f a
table
for
dis
cuss
ions
wit
h
lives
tock
rel
ated
org
aniz
atio
ns,
a s
tudy
on c
urr
ent si
tuat
ion o
f in
form
al f
inan
ce,
a pilot pro
ject
, and p
roposi
ng
sugges
tions
△
Buildin
g c
onse
nsu
s on the
sugges
tions
seem
s to
req
uir
e lo
ng tim
e an
d lar
ge
effo
rt.
(7)
Entr
epre
neu
rship
61
The
pro
ject
for
the
bas
ic
study
on m
icro
finan
ce
To e
nab
le f
arm
ers
who h
ave
lim
ited
acc
ess
to
finan
ce to r
ecei
ve
nec
essa
ry f
inan
ce
Stu
dy
on c
urr
ent M
F p
roje
cts,
a p
ilot
pro
ject
, and p
roposi
ng s
ugges
tions
△
Bas
ical
ly, M
F s
ervic
es s
hould
be
pro
vid
ed
by
NG
Os
and p
rivat
e se
ctor
not by
the
LF
D. I
n that
cas
e, the
impac
t fr
om
this
pro
ject
may
be
lim
ited
.
(7)
Entr
epre
neu
rship
62
The
pro
ject
for
the
bas
ic
study
on p
rom
oti
on o
f bio
bas
To s
tudy the
cost
-eff
ecti
ven
ess
of
bio
gas
to
pro
mote
uti
liza
tion o
f bio
bas
R
esea
rch a
nd s
ugges
tions
△
Alt
hough e
nvir
onm
enta
l an
d e
ner
gy iss
ue
is im
port
ant, im
pro
vem
ents
of
pro
duct
ivit
y
or
livel
ihood h
ave
hig
her
pri
ori
ty.
(7)
Entr
epre
neu
rship
63
The
pro
ject
for
esta
bli
shin
g the
lives
tock
com
pen
sati
on s
yste
m
In J
apan
, ther
e is
a m
utu
al a
id s
yste
m f
inan
ced
by
the
countr
y, p
refe
cture
s, a
nd p
roduce
rs to
avoid
lar
ge
man
agem
ent lo
ss c
ause
d b
y an
acci
den
t or
thef
t of
larg
e an
imal
s. T
he
pro
ject
aim
s to
est
abli
sh m
utu
al a
id s
yst
em to r
educe
pro
duce
rs’
risk
s by
involv
ing c
ontr
ibutions
from
mil
k p
roce
ssin
g c
om
pan
ies,
dis
trib
ute
rs, a
nd
larg
e la
nd o
wner
s. M
ore
over
the
pro
ject
intr
oduce
s li
ves
tock
insu
rance
sys
tem
to s
upport
pro
duce
rs.
Set
ting u
p a
tab
le f
or
mee
ting w
ith
stak
ehold
ers
in d
airy
sec
tor,
nee
ds
asse
ssm
ent an
d e
stab
lish
men
t of
the
mutu
al a
id s
yste
m a
nd the
lives
tock
insu
rance
sys
tem
, and s
upport
of
pilot
acti
vit
ies
○
The
nee
ds
of
lives
tock
com
pen
sati
on
mec
han
ism
s ar
e st
ill pre
mat
ure
.

A -
11
Rel
ated
Act
ion
Pla
nsi
NO
P
roje
ct T
itle
P
roje
ct O
utlin
e M
ajor
Act
ivit
ies
Pri
ori
tyii
M
ajor
Rea
sons
(7)
Entr
epre
neu
rship
64
The
pro
ject
for
one
vil
lage
one
pro
duct
To s
upport
tar
get
vil
lages
to d
evel
op a
nd
pro
mote
spec
iali
zed liv
esto
ck p
roduct
s in
volv
ing
loca
l gover
nm
ent, the
Indust
ries
and C
om
mer
ce
Dep
artm
ent, a
nd the
Food D
epar
tmen
t
Form
ula
tion o
f one
vil
lage
one
pro
duct
s,
trai
nin
gs
of
nec
essa
ry tec
hniq
ues
such
as
pro
cess
ing tec
hniq
ues
, rea
ring
tech
niq
ues
, and m
arket
ing tec
hniq
ues
,
hold
ing a
conte
st, s
ales
pro
moti
on
△
Pro
duct
s dev
eloped
and p
rom
ote
d in this
pro
ject
are
bas
ical
ly n
ot only
liv
esto
ck
pro
duct
s but al
so v
ario
us
pro
duct
s fr
om
mult
i se
ctors
. .
(7)
Entr
epre
neu
rship
65
The
pro
ject
for
esta
bli
shin
g a
nd
pro
moting the
road
side
stat
ions
To c
ontr
ibute
far
mer
s’ inco
me
and r
egio
nal
dev
elopm
ent by
esta
bli
shin
g r
oad
side
stat
ions
along h
ighw
ay to s
ell li
ves
tock
pro
duct
s
pro
duce
d in the
surr
oundin
g a
reas
Form
ula
tion o
f m
anag
emen
t co
mm
itte
e,
clar
ific
atio
n o
f ru
les
to u
se the
road
side
stat
ions,
est
abli
shm
ent of
the
road
side
stat
ions,
tra
inin
g o
n m
anag
emen
t
△
This
pro
ject
should
be
imple
men
ted a
fter
form
ula
ting loca
l sp
ecia
ltie
s an
d o
ne
vil
lage
one
pro
duct
s.
(8)
Str
ength
enin
g o
f
the
Dep
artm
ent
66
The
pro
ject
for
form
ula
ting liv
esto
ck
dev
elopm
ent poli
cy a
nd
stra
tegy
To f
orm
ula
te a
nd inst
itutional
ize
policy
,
stra
tegy,
and 5
yea
r pla
n a
s guid
elin
es f
or
imple
men
ting liv
esto
ck d
evel
opm
ent, a
nd f
or
pre
par
ing a
nnual
act
ivit
y pla
ns
Form
ula
tion o
f S
indh liv
esto
ck
dev
elopm
ent poli
cy, f
inal
izat
ion o
f
stra
tegy,
form
ula
tion o
f 5 y
ear
acti
on
pla
n
◎
Poli
cy, s
trat
egy,
and 5
yea
r pla
n s
hould
be
form
ula
ted a
nd inst
ituti
onal
ized
for
the
dev
elopm
ent of
lives
tock
sec
tor
in lin
e
wit
h the
mas
ter
pla
n
(8)
Str
ength
enin
g o
f
the
Dep
artm
ent
67
The
pro
ject
for
publi
city
T
o p
ubli
cize
the
lives
tock
dev
elopm
ent pla
ns
by
var
ious
mea
ns
Pre
par
atio
n o
f w
eb p
age
and p
amphle
t,
open
ing o
f dev
elopm
ent fo
rum
◎
Budget
alloca
tions
and o
ther
nec
essa
ry
cooper
atio
n w
ill bec
om
e ea
sier
for
the
dep
artm
ent to
obta
in thro
ugh p
ubli
city
of
lives
tock
dev
elopm
ent
(8)
Str
ength
enin
g o
f
the
Dep
artm
ent
68
The
pro
ject
for
stre
ngth
enin
g
imple
men
tati
on s
truct
ure
To r
estr
uct
ure
the
dep
artm
ent fo
r im
ple
men
ting
lives
tock
dev
elopm
ent sm
ooth
ly c
onsi
der
ing
nec
essa
ry a
reas
of
acti
vit
ies,
such
as
farm
man
agem
ent, f
eedin
g m
anag
emen
t, f
odder
,
repro
duct
ion, a
nim
al h
ealt
h, b
reed
ing, a
nd
exte
nsi
on
Res
truct
uri
ng o
f th
e dep
artm
ent, a
nd
pre
par
atio
n o
f T
OR
s fo
r ea
ch d
irec
tora
te
◎
It is
inev
itab
le f
or
the
dep
artm
ent to
esta
bli
sh a
new
str
uct
ure
for
imple
men
ting
lives
tock
dev
elopm
ent in
lin
e w
ith the
mas
ter
pla
n
(8)
Str
ength
enin
g o
f
the
Dep
artm
ent
69
The
pro
ject
for
form
ula
ting h
um
an
reso
urc
e m
anag
emen
t an
d
dev
elopm
ent pla
ns
To r
ecru
it, a
lloca
te, t
rain
, and m
anag
e hum
an
reso
urc
es p
roper
ly f
or
smooth
ly im
ple
men
ting
lives
tock
dev
elopm
ent pla
ns
Form
ula
tion o
f hum
an r
esourc
e
man
agem
ent pla
n incl
udin
g r
ecru
itm
ent
pla
n, h
um
an r
esourc
e dev
elopm
ent pla
n,
recr
uit
men
t, a
lloca
tion, t
rain
ing, a
nd
man
agem
ent of
the
staf
f bas
ed o
n those
pla
ns
◎
Hum
an r
esourc
e m
anag
emen
t an
d
dev
elopm
ent ar
e es
senti
al f
or
the
dev
elopm
ent of
the
lives
tock
sec
tor
(8)
Str
ength
enin
g o
f
the
Dep
artm
ent
70
The
pro
ject
for
stre
ngth
enin
g p
roje
ct
man
agem
ent ca
pac
ity
To s
tren
gth
en the
Liv
esto
ck D
epar
tmen
t S
indh
for
its
abilit
y of
PD
C (
pla
n, m
onitori
ng,
eval
uat
ion)
whic
h is
requir
ed f
or
pla
nnin
g a
nd
man
agin
g the
pro
ject
s
Tra
inin
gs
of
pro
ject
man
agem
ent,
pre
par
atio
n o
f oper
atio
n m
anual
s,
esta
bli
shm
ent of
info
rmat
ion s
yste
m,
pre
par
atio
n o
f an
nual
act
ivit
y pla
ns
and
eval
uat
ion r
eport
s
◎
Pro
ject
man
agem
ent is
one
of
day
-to-d
ay
acti
vit
ies,
so this
is
urg
ent.
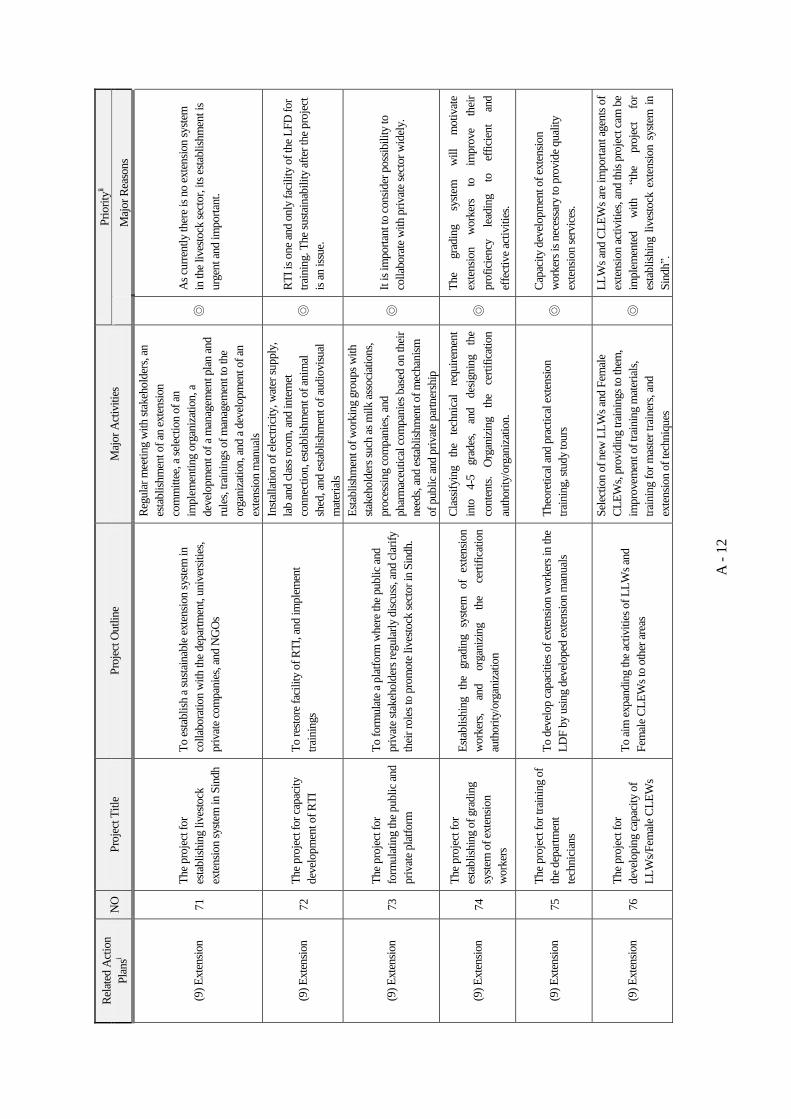
A -
12
Rel
ated
Act
ion
Pla
nsi
NO
P
roje
ct T
itle
P
roje
ct O
utlin
e M
ajor
Act
ivit
ies
Pri
ori
tyii
M
ajor
Rea
sons
(9)
Exte
nsi
on
71
The
pro
ject
for
esta
bli
shin
g liv
esto
ck
exte
nsi
on s
yste
m in S
indh
To e
stab
lish
a s
ust
ainab
le e
xte
nsi
on s
yste
m in
coll
abora
tion w
ith the
dep
artm
ent, u
niv
ersi
ties
,
pri
vat
e co
mpan
ies,
and N
GO
s
Reg
ula
r m
eeti
ng w
ith s
takeh
old
ers,
an
esta
bli
shm
ent of
an e
xte
nsi
on
com
mit
tee,
a s
elec
tion o
f an
imple
men
ting o
rgan
izat
ion, a
dev
elopm
ent of
a m
anag
emen
t pla
n a
nd
rule
s, tra
inin
gs
of
man
agem
ent to
the
org
aniz
atio
n, a
nd a
dev
elopm
ent of
an
exte
nsi
on m
anual
s
◎
As
curr
entl
y th
ere
is n
o e
xte
nsi
on s
yst
em
in the
lives
tock
sec
tor,
its
est
abli
shm
ent is
urg
ent an
d im
port
ant.
(9)
Exte
nsi
on
72
The
pro
ject
for
capac
ity
dev
elopm
ent of
RT
I
To r
esto
re f
acil
ity
of
RT
I, a
nd im
ple
men
t
trai
nin
gs
Inst
alla
tion o
f el
ectr
icit
y, w
ater
supply
,
lab a
nd c
lass
room
, and inte
rnet
connec
tion, e
stab
lish
men
t of
anim
al
shed
, and e
stab
lish
men
t of
audio
vis
ual
mat
eria
ls
◎
RT
I is
one
and o
nly
fac
ilit
y of
the
LF
D f
or
trai
nin
g. T
he
sust
ainab
ilit
y af
ter
the
pro
ject
is a
n iss
ue.
(9)
Exte
nsi
on
73
The
pro
ject
for
form
ula
ting the
publi
c an
d
pri
vat
e pla
tform
To f
orm
ula
te a
pla
tform
wher
e th
e public
and
pri
vat
e st
akeh
old
ers
regula
rly
dis
cuss
, and c
lari
fy
thei
r ro
les
to p
rom
ote
liv
esto
ck s
ecto
r in
Sin
dh.
Est
abli
shm
ent of
work
ing g
roups
wit
h
stak
ehold
ers
such
as
mil
k a
ssoci
atio
ns,
pro
cess
ing c
om
pan
ies,
and
phar
mac
euti
cal co
mpan
ies
bas
ed o
n thei
r
nee
ds,
and e
stab
lish
men
t of
mec
han
ism
of
publi
c an
d p
rivat
e par
tner
ship
◎
It is
import
ant to
consi
der
poss
ibil
ity
to
coll
abora
te w
ith p
rivat
e se
ctor
wid
ely.
(9)
Exte
nsi
on
74
The
pro
ject
for
esta
bli
shin
g o
f gra
din
g
syst
em o
f ex
tensi
on
work
ers
Est
abli
shin
g
the
gra
din
g
syst
em
of
exte
nsi
on
work
ers,
an
d
org
aniz
ing
the
cert
ific
atio
n
auth
ori
ty/o
rgan
izat
ion
Cla
ssif
ying
the
tech
nic
al
requir
emen
t
into
4-5
gra
des
, an
d
des
ignin
g
the
conte
nts
. O
rgan
izin
g
the
cert
ific
atio
n
auth
ori
ty/o
rgan
izat
ion.
◎
The
gra
din
g
syst
em
wil
l m
oti
vat
e
exte
nsi
on
work
ers
to
impro
ve
thei
r
pro
fici
ency
le
adin
g to
ef
fici
ent
and
effe
ctiv
e ac
tivit
ies.
(9)
Exte
nsi
on
75
The
pro
ject
for
trai
nin
g o
f
the
dep
artm
ent
tech
nic
ians
To d
evel
op c
apac
itie
s of
exte
nsi
on w
ork
ers
in the
LD
F b
y usi
ng d
evel
oped
exte
nsi
on m
anual
s
Theo
reti
cal an
d p
ract
ical
exte
nsi
on
trai
nin
g, s
tudy
tours
◎
Cap
acit
y dev
elopm
ent of
exte
nsi
on
work
ers
is n
eces
sary
to p
rovid
e qual
ity
exte
nsi
on s
ervic
es.
(9)
Exte
nsi
on
76
The
pro
ject
for
dev
elopin
g c
apac
ity
of
LL
Ws/
Fem
ale
CL
EW
s
To a
im e
xpan
din
g the
acti
vit
ies
of
LL
Ws
and
Fem
ale
CL
EW
s to
oth
er a
reas
Sel
ecti
on o
f new
LL
Ws
and F
emal
e
CL
EW
s, p
rovid
ing tra
inin
gs
to them
,
impro
vem
ent of
trai
nin
g m
ater
ials
,
trai
nin
g f
or
mas
ter
trai
ner
s, a
nd
exte
nsi
on o
f te
chniq
ues
◎
LL
Ws
and C
LE
Ws
are
import
ant ag
ents
of
exte
nsi
on a
ctiv
itie
s, a
nd this
pro
ject
cam
be
imple
men
ted
wit
h
“the
pro
ject
fo
r
esta
bli
shin
g l
ives
tock
exte
nsi
on s
yste
m i
n
Sin
dh”.

A -
13
Rel
ated
Act
ion
Pla
nsi
NO
P
roje
ct T
itle
P
roje
ct O
utlin
e M
ajor
Act
ivit
ies
Pri
ori
tyii
M
ajor
Rea
sons
(9)
Exte
nsi
on
77
The
pro
ject
for
foll
ow
-up
trai
nin
g o
f L
LW
s/F
emal
e
CL
EW
s
To s
tren
gth
en s
kil
ls o
f th
e cu
rren
t L
LW
s an
d
Fem
ale
CL
EW
s, a
nd p
rom
ote
a c
ollab
ora
tion
wit
h the
dep
artm
ent
A s
tudy
on c
urr
ent si
tuat
ion, n
eeds
anal
ysis
for
trai
nin
g, e
xtr
action o
f good
pra
ctic
es, t
rain
ings
◎
LL
Ws
and C
LE
Ws
are
import
ant ag
ents
of
exte
nsi
on a
ctiv
itie
s, a
nd this
pro
ject
cam
be
imple
men
ted
wit
h
“the
pro
ject
fo
r
esta
bli
shin
g l
ives
tock
exte
nsi
on s
yste
m i
n
Sin
dh”.
(9)
Exte
nsi
on
78
The
Pro
ject
for
enhan
cing
the
exte
nsi
on s
ervic
e
pro
vis
ion
Mai
nly
thro
ugh t
he
OJT
, dev
elopin
g t
he
capac
ity
of
exte
nsi
on w
ork
ers
Mai
nly
thro
ugh
the
OJT
, dev
elopin
g t
he
capac
ity
of
exte
nsi
on w
ork
ers
regar
din
g
exte
nsi
on co
nte
nts
, m
ethods,
re
port
ing,
info
rmat
ion s
har
ing,
lead
ersh
ip,
role
as
the
chan
ge
agen
t et
c.
◎
The
LF
D h
as n
ot
accu
mula
ted n
eces
sary
know
ledge
and
exper
ience
s ab
out
exte
nsi
on
work
, so
it
is
nec
essa
ry
to
pro
vid
e th
e ex
tensi
on
work
ers
wit
h
pra
ctic
al tra
inin
g o
n the
fiel
d.
(10)
Form
ula
ting
futu
re-o
rien
ted
pro
duct
ion s
yste
m
cente
red o
n c
attl
e
colo
nie
s
79
The
pro
ject
for
trea
tmen
t
of
cow
dung a
nd e
fflu
ent
from
cat
tle
colo
nie
s
Const
ruct
ion o
f a
pla
nt fo
r tr
eating c
ow
dung a
nd
affl
uen
t fr
om
cat
tle
colo
nie
s to
all
evia
te a
har
mfu
l im
pac
t on s
urr
oundin
g e
nvir
onm
ent
Bas
ic s
tudy
on the
curr
ent si
tuat
ion,
des
ignin
g o
f th
e fa
cili
ty is
des
igned
, and
pre
par
atio
n o
f m
arket
ing p
lan f
or
man
ure
and b
iogas
, const
ruct
ion o
f th
e
faci
lity
, oper
atio
n o
f th
e fa
cili
ty a
nd
mar
ket
ing a
ctiv
itie
s
◎
Envir
onm
enta
l pro
ble
ms
arose
fro
m c
attl
e
colo
nie
s ar
e urg
ent an
d b
ecom
ing m
ore
seri
ous.
i R
elat
ed A
ctio
n P
lans:
Act
ion P
lan (
1):
Dev
elopm
ent an
d E
xte
nsi
on o
f A
ppro
pri
ate
Dai
ry a
nd F
atte
nin
g T
echnolo
gie
s in
the
Irri
gat
ed A
reas
Act
ion P
lan (
2):
Dev
elopm
ent an
d E
xte
nsi
on o
f A
ppro
pri
ate
Fat
tenin
g T
echnolo
gie
s in
the
Non-i
rrig
ated
Are
as
Act
ion P
lan (
3):
Im
pro
vem
ent of A
nim
al F
eeds
Act
ion P
lan (
4):
Eli
min
atio
n o
f B
ruce
lla,
Tuber
culo
sis,
Mas
titis
and O
ther
Im
port
ant A
nim
al D
isea
ses
Act
ion P
lan (
5):
Gen
etic
Im
pro
vem
ent of
Loca
l B
reed
s
Act
ion P
lan (
6):
Mar
ket
ing I
mpro
vem
ent fo
r E
xport
Act
ion P
lan (
7):
Entr
epre
neu
rship
Dev
elopm
ent
Act
ion P
lan (
8):
Str
ength
enin
g o
f th
e D
epar
tmen
t
Act
ion P
lan (
9):
Exte
nsi
on S
yste
m D
evel
opm
ent
Act
ion P
lan (
10):
Futu
re-o
rien
ted C
attl
e C
olo
ny
Pro
duct
ion S
yste
m
ii P
riori
ty:
◎: M
ost
ly p
riori
tize
d p
roje
cts
incl
uded
in A
cton P
lans
by
2020
○: P
riori
tize
d p
roje
cts
△: Im
port
ant, b
ut re
lati
vel
y le
ss p
riori
tize
d p
roje
cts
Appendix B
Provincial Profiles

Appendix B
Appendix B - 1
Table B-1 Talula Areas (1/2)
District Taluka Area (arce) Area (Sq.km) District Total (Sq.km)
Daharki 620,774.18 2,512.180
Ghotki 218,153.05 882.834
Khangarh 397,948.75 1,610.440
Mirpur Mathelo 193,645.59 783.656
Ubauro 175,528.11 710.337 6,499.447
New Sukkur 31,318.18 126.740
Pano Akil 166,471.61 673.687
Rohri 246,614.06 998.012
Saleh Pat 739,034.27 2,990.770
Sukkur 105,233.60 425.865 5,215.074
Faizganj 246,225.87 996.441
Gambat 141,524.27 572.728
Khairpur 119,059.64 481.817
Kingri 140,358.53 568.011
Kotdiji 125,430.91 507.601
Nara 2,849,496.98 11,531.510
Sobhodero 125,958.91 509.738
Thari Mirwah 166,855.58 675.241 15,843.087
Bhiria (City) 97,158.08 393.185
Kandiaro 227,333.63 919.987
Mehrabpur 67,723.01 274.065
Moro 188,417.90 762.500
N.Feroze 171,516.29 694.102 3,043.839
Daur 491,976.25 1,990.960
Kazi Ahmed 265,470.35 1,074.320
Nawabshah 138,809.65 561.743
Sakrand 216,698.42 876.947 4,503.970
Kandhkot 175,528.41 710.338
Kashmore 344,607.83 1,394.580
Tangwani 174,550.82 706.382 2,811.300
Garhi Yasin 230,718.54 933.685
Khanpur 166,756.77 674.841
Lakhi 94,855.42 383.866
Shikarpur 142,556.13 576.904 2,569.296
Garhi Khairo 181,499.32 734.502
Jacobabad 168,086.67 680.223
Thull 331,614.05 1,341.990 2,756.715
Kamber 567,891.27 2,298.170
Miro Khan 111,391.45 450.785
Nasirabad 96,404.84 390.137
Qubo Saeed Khan 261,337.16 1,057.590
Shahdadkot 105,183.09 425.661
Sijawal 80,320.07 325.044
Warah 165,822.13 671.058 5,618.445
Bakrani 111,172.63 449.900
Dokri 120,231.97 486.562
Larkana 94,812.60 383.693
Ratodero 146,188.90 591.605 1,911.760
Dadu 202,941.39 821.275
Johi 889,472.09 3,599.570
K.N.Shah 646,290.92 2,615.450
Mehar 245,920.85 995.206 8,031.501
Kotri 350,180.70 1,417.130
Manjhad 549,300.65 2,222.940
Sehwan 579,214.87 2,344.000
Thana Bulla Khan 1,306,916.88 5,288.900 11,272.970
Kashmore
Note: The above taluka areas were measured by planimeter for preparing GIS maps, and therefore the district areas do not coincide
with the published ones.
Ghotki
Sukkur
Khairpur
Naushero Feroze
Shaheed Benazirabad
(Nawabshah)
Shikarpur
Jacobabad
Kamber Shadadkot
Larkana
Dadu
Jamshoro

Appendix B - 2
Table B-1 Talula Areas (2/2)
District Taluka Area (arce) Area (Sq.km) District Total (Sq.km)
Ghorabari 279,906.29 1,132.740
Jati 870,838.41 3,524.160
Keti Bunder 178,336.72 721.703
Kharo Chhan 142,349.91 576.070
M.P.Bathoro 178,495.84 722.347
M.P.Sakro 725,750.97 2,937.010
Shah Bunder 821,075.78 3,322.780
Sujawal 176,927.28 715.999
Thatta 921,666.64 3,729.850 17,382.659
Hala 96,960.73 392.386
Matiari 176,421.12 713.951
Saedabad 86,509.82 350.093 1,456.430
Chamber 124,134.81 502.356
Jhando Mari 197,499.62 799.253
Tando Allahyar 60,720.09 245.725 1,547.334
Hyderabad (City) 6,956.47 28.152
Hyderabad (Rural) 182,488.35 738.504
Latifabad 55,361.09 224.038
Qasimabad 7,485.01 30.291 1,020.985
Bulri Shah Karim 195,313.06 790.404
Tando Ghulam Hyder 93,882.31 379.928
Tando M Khan 93,537.39 378.532 1,548.864
Badin 435,697.02 1,763.200
Matli 261,061.86 1,056.480
S.F.Rahoo 388,534.89 1,572.340
Talhar 198,704.04 804.127
Tando Bago 374,028.54 1,513.640 6,709.787
Jam Nawaz Ali 116,394.46 471.032
Khipro 1,453,892.07 5,883.690
Sanghar 544,487.41 2,203.460
Shahdadpur 219,632.54 888.821
Sinjhoro 209,673.03 848.517
Tando Adam 100,993.74 408.707 10,704.227
Digri 125,710.46 508.732
Hussain Bux Mari 61,677.96 249.602
Jhuddo 157,762.11 638.441
Kot Ghulam Muhammad 195,637.02 791.715
Mirpurkhas 116,449.58 471.255
Sindhri 78,130.58 316.183 2,975.928
Kunri 177,210.18 717.144
Pithoro 122,737.61 496.701
Samaro 149,609.35 605.448
Umerkot 906,273.53 3,667.560 5,486.853
Chachro 1,585,325.57 6,415.580
Diplo 971,088.24 3,929.850
Mithi 1,303,121.82 5,273.550
Nagarparkar 933,885.89 3,779.300 19,398.280
Baldia 5,482.86 22.188
Bin Qasim 150,058.82 607.267
Gaddap 518,281.65 2,097.410
Gulberg 4,042.25 16.358
Gulshan-e-Iqbal 20,263.18 82.002
Jamsheed Qtr. 6,540.62 26.469
Keemari 106,227.04 429.886
Korangi 13,665.69 55.303
Landhi 10,996.43 44.501
Liaquatabad 3,406.13 13.784
Lyari 1,368.88 5.540
Malir 23,982.57 97.054
New Karachi 5,674.93 22.966
North Nazimabad 4,348.02 17.596
Orangi 5,390.26 21.814
Saddar 5,100.68 20.642
Shah Faisal Colony 11,036.94 44.665
Site 6,824.35 27.617 3,653.062
141,961.812 141,961.812
Note: The above taluka areas were measured by planimeter for preparing GIS maps, and therefore the district areas do not coincide
with the published ones.
Badin
Thatta
Matiari
Tando Allahyar
Hyderabad
Tando Muhammad Khan
Sanghar
Mirpurkhas
Umerkot
Tharparkar
Karachi
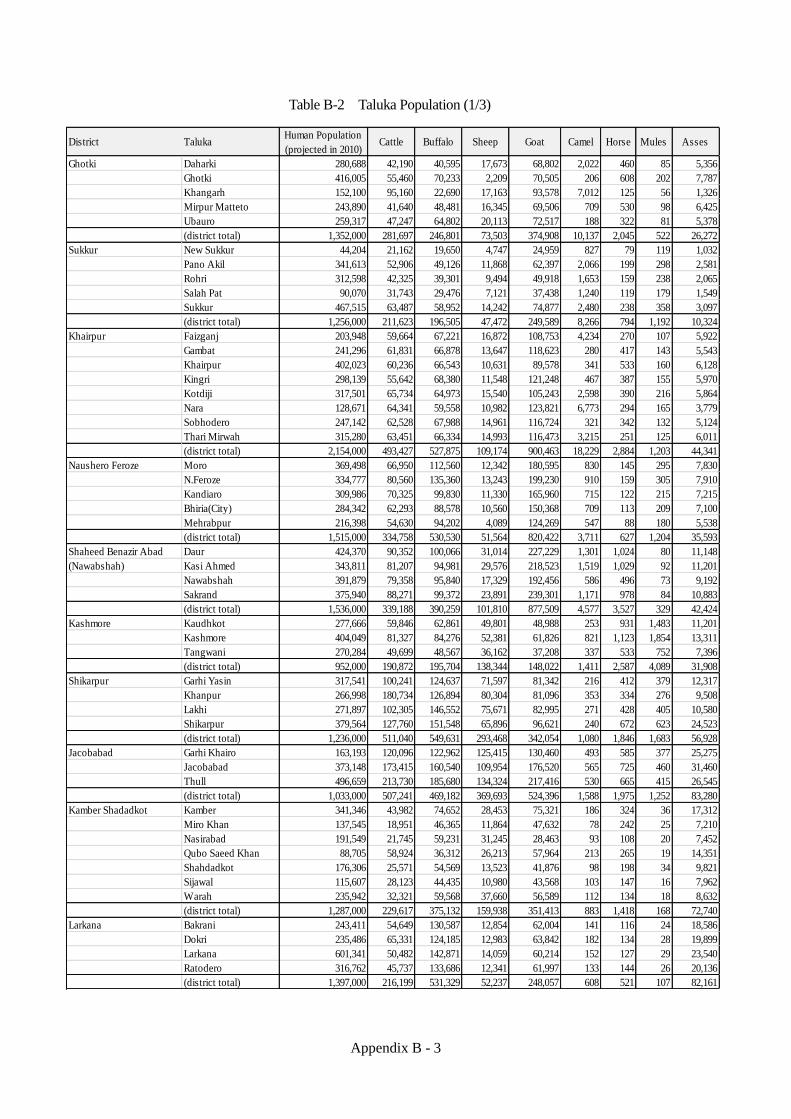
Appendix B - 3
Table B-2 Taluka Population (1/3)
District TalukaHuman Population
(projected in 2010)Cattle Buffalo Sheep Goat Camel Horse Mules Asses
Ghotki Daharki 280,688 42,190 40,595 17,673 68,802 2,022 460 85 5,356
Ghotki 416,005 55,460 70,233 2,209 70,505 206 608 202 7,787
Khangarh 152,100 95,160 22,690 17,163 93,578 7,012 125 56 1,326
Mirpur Matteto 243,890 41,640 48,481 16,345 69,506 709 530 98 6,425
Ubauro 259,317 47,247 64,802 20,113 72,517 188 322 81 5,378
(district total) 1,352,000 281,697 246,801 73,503 374,908 10,137 2,045 522 26,272
Sukkur New Sukkur 44,204 21,162 19,650 4,747 24,959 827 79 119 1,032
Pano Akil 341,613 52,906 49,126 11,868 62,397 2,066 199 298 2,581
Rohri 312,598 42,325 39,301 9,494 49,918 1,653 159 238 2,065
Salah Pat 90,070 31,743 29,476 7,121 37,438 1,240 119 179 1,549
Sukkur 467,515 63,487 58,952 14,242 74,877 2,480 238 358 3,097
(district total) 1,256,000 211,623 196,505 47,472 249,589 8,266 794 1,192 10,324
Khairpur Faizganj 203,948 59,664 67,221 16,872 108,753 4,234 270 107 5,922
Gambat 241,296 61,831 66,878 13,647 118,623 280 417 143 5,543
Khairpur 402,023 60,236 66,543 10,631 89,578 341 533 160 6,128
Kingri 298,139 55,642 68,380 11,548 121,248 467 387 155 5,970
Kotdiji 317,501 65,734 64,973 15,540 105,243 2,598 390 216 5,864
Nara 128,671 64,341 59,558 10,982 123,821 6,773 294 165 3,779
Sobhodero 247,142 62,528 67,988 14,961 116,724 321 342 132 5,124
Thari Mirwah 315,280 63,451 66,334 14,993 116,473 3,215 251 125 6,011
(district total) 2,154,000 493,427 527,875 109,174 900,463 18,229 2,884 1,203 44,341
Naushero Feroze Moro 369,498 66,950 112,560 12,342 180,595 830 145 295 7,830
N.Feroze 334,777 80,560 135,360 13,243 199,230 910 159 305 7,910
Kandiaro 309,986 70,325 99,830 11,330 165,960 715 122 215 7,215
Bhiria(City) 284,342 62,293 88,578 10,560 150,368 709 113 209 7,100
Mehrabpur 216,398 54,630 94,202 4,089 124,269 547 88 180 5,538
(district total) 1,515,000 334,758 530,530 51,564 820,422 3,711 627 1,204 35,593
Shaheed Benazir Abad Daur 424,370 90,352 100,066 31,014 227,229 1,301 1,024 80 11,148
(Nawabshah) Kasi Ahmed 343,811 81,207 94,981 29,576 218,523 1,519 1,029 92 11,201
Nawabshah 391,879 79,358 95,840 17,329 192,456 586 496 73 9,192
Sakrand 375,940 88,271 99,372 23,891 239,301 1,171 978 84 10,883
(district total) 1,536,000 339,188 390,259 101,810 877,509 4,577 3,527 329 42,424
Kashmore Kaudhkot 277,666 59,846 62,861 49,801 48,988 253 931 1,483 11,201
Kashmore 404,049 81,327 84,276 52,381 61,826 821 1,123 1,854 13,311
Tangwani 270,284 49,699 48,567 36,162 37,208 337 533 752 7,396
(district total) 952,000 190,872 195,704 138,344 148,022 1,411 2,587 4,089 31,908
Shikarpur Garhi Yasin 317,541 100,241 124,637 71,597 81,342 216 412 379 12,317
Khanpur 266,998 180,734 126,894 80,304 81,096 353 334 276 9,508
Lakhi 271,897 102,305 146,552 75,671 82,995 271 428 405 10,580
Shikarpur 379,564 127,760 151,548 65,896 96,621 240 672 623 24,523
(district total) 1,236,000 511,040 549,631 293,468 342,054 1,080 1,846 1,683 56,928
Jacobabad Garhi Khairo 163,193 120,096 122,962 125,415 130,460 493 585 377 25,275
Jacobabad 373,148 173,415 160,540 109,954 176,520 565 725 460 31,460
Thull 496,659 213,730 185,680 134,324 217,416 530 665 415 26,545
(district total) 1,033,000 507,241 469,182 369,693 524,396 1,588 1,975 1,252 83,280
Kamber Shadadkot Kamber 341,346 43,982 74,652 28,453 75,321 186 324 36 17,312
Miro Khan 137,545 18,951 46,365 11,864 47,632 78 242 25 7,210
Nasirabad 191,549 21,745 59,231 31,245 28,463 93 108 20 7,452
Qubo Saeed Khan 88,705 58,924 36,312 26,213 57,964 213 265 19 14,351
Shahdadkot 176,306 25,571 54,569 13,523 41,876 98 198 34 9,821
Sijawal 115,607 28,123 44,435 10,980 43,568 103 147 16 7,962
Warah 235,942 32,321 59,568 37,660 56,589 112 134 18 8,632
(district total) 1,287,000 229,617 375,132 159,938 351,413 883 1,418 168 72,740
Larkana Bakrani 243,411 54,649 130,587 12,854 62,004 141 116 24 18,586
Dokri 235,486 65,331 124,185 12,983 63,842 182 134 28 19,899
Larkana 601,341 50,482 142,871 14,059 60,214 152 127 29 23,540
Ratodero 316,762 45,737 133,686 12,341 61,997 133 144 26 20,136
(district total) 1,397,000 216,199 531,329 52,237 248,057 608 521 107 82,161

Appendix B - 4
Table B-2 Taluka Population (2/3)
District TalukaHuman Population
(projected in 2010)Cattle Buffalo Sheep Goat Camel Horse Mules Asses
Dadu Dadu 456,967 102,320 89,885 75,665 275,670 12,640 1,002 200 8,310
Johi 288,949 90,640 85,678 86,940 285,989 10,370 732 190 6,540
K.N.Shah 352,938 146,215 94,093 75,696 112,730 6,126 732 360 7,360
Mehar 443,146 129,627 116,327 45,428 125,675 12,891 1,009 1,157 16,773
(district total) 1,542,000 468,802 385,983 283,729 800,064 42,027 3,475 1,907 38,983
Jamshoro Kotri 289,202 48,360 61,390 25,136 81,921 626 327 37 9,632
Manjhad 139,471 31,459 22,640 32,346 91,547 938 84 29 5,338
Sehwan 237,672 24,373 34,105 52,329 125,784 1,019 188 27 7,156
Thana Bulla Khan 144,655 59,540 605 61,937 114,939 1,495 271 16 7,258
(district total) 811,000 163,732 118,740 171,748 414,191 4,078 870 109 29,384
Thatta Ghorabari 146,967 44,386 39,387 16,345 37,562 1,097 297 45 2,039
Jati 172,708 47,045 41,603 19,485 39,817 1,330 365 75 2,145
Keti Bunder 35,808 44,909 38,960 15,975 36,985 1,165 180 39 2,117
Kharo Chhan 35,760 41,305 39,755 16,203 37,311 1,065 389 42 2,089
M.P.Bathoro 211,661 46,985 41,885 18,495 40,315 1,043 403 73 2,169
M.P.Sakro 277,058 45,065 40,054 16,975 37,456 1,103 205 45 2,109
Shah Bunder 140,130 46,052 40,965 19,205 40,315 1,279 389 89 2,149
Sujawal 177,364 47,302 42,005 19,739 40,103 1,303 399 69 2,105
Thatta 353,544 47,565 42,503 19,709 41,502 1,317 409 89 2,215
(district total) 1,551,000 410,614 367,117 162,131 351,366 10,702 3,036 566 19,137
Matiari Hala 225,655 90,534 92,105 19,731 125,405 350 310 25 7,510
Matiari 333,256 95,239 93,390 18,930 108,231 320 217 17 6,125
Saecorbad 159,089 81,133 49,188 13,204 96,367 206 163 27 6,693
(district total) 718,000 266,906 234,683 51,865 330,003 876 690 69 20,328
Tando Allahyar Chamber 174,783 23,259 69,612 6,507 95,685 162 146 68 3,462
Jhando Mari 189,534 14,538 20,884 7,192 63,790 205 186 86 4,385
Tando Allahyar 287,683 20,352 48,728 3,425 53,158 172 156 73 3,692
(district total) 652,000 58,149 139,224 17,124 212,633 539 488 227 11,539
Hyderabad Hyderabad (City) 731,770 16,121 97,290 2,280 57,970 125 538 30 1,028
Hyderabad (Rural) 410,158 25,110 46,498 15,974 95,962 415 675 80 5,876
Latifabad 785,350 21,080 98,225 5,600 72,492 482 145 55 4,094
Qasimabad 160,722 14,173 67,150 5,280 69,538 53 280 65 4,937
(district total) 2,088,000 76,484 309,163 29,134 295,962 1,075 1,638 230 15,935
Tando Muhammad Khan Bulri Shah Karim 219,521 22,721 56,648 11,058 47,352 945 27 78 3,008
Tando Ghulam Hyder 163,115 12,761 45,339 3,635 42,101 1,164 13 81 1,740
Tando M Khan 231,364 21,934 55,947 9,540 46,813 320 43 52 3,509
(district total) 614,000 57,416 157,934 24,233 136,266 2,429 83 211 8,257
Badin Badin 403,024 69,328 120,625 45,160 93,640 2,066 410 42 4,230
Matli 394,683 60,530 76,537 45,580 143,039 1,195 400 33 6,500
S.F.Rahoo 254,543 68,940 128,386 61,633 105,500 2,397 335 40 2,847
Talhar 146,975 50,938 85,790 24,359 85,390 1,179 209 35 2,530
Tando Bago 338,776 65,633 86,915 46,340 150,730 1,835 360 34 2,840
(district total) 1,538,000 315,369 498,253 223,072 578,299 8,672 1,714 184 18,947
Sanghar Jam Nawaz Ali 125,473 30,965 10,705 3,624 50,916 145 55 119 4,414
Khipro 320,238 65,334 20,924 28,855 215,538 4,496 74 213 7,130
Sanghar 368,912 125,948 100,709 24,307 163,534 1,311 560 204 10,118
Shahdadpur 431,369 54,416 63,602 10,926 76,290 118 195 156 7,680
Sinjhoro 277,816 50,630 51,863 9,539 109,877 201 95 113 7,950
Tando Adam 321,191 42,942 75,740 6,328 80,429 135 621 184 8,526
(district total) 1,845,000 370,235 323,543 83,579 696,584 6,406 1,600 989 45,818

Appendix B - 5
Table B-2 Taluka Population (3/3)
District TalukaHuman Population
(projected in 2010)Cattle Buffalo Sheep Goat Camel Horse Mules Asses
Mirpurkhas Digri 212,616 38,482 38,884 11,794 111,440 449 91 15 2,945
Hussain Bux Mari 115,918 21,111 25,152 5,386 82,587 224 48 5 1,677
Jhuddo 203,386 32,870 35,644 10,981 102,621 414 78 13 2,714
Kot Ghulam Muhammad 249,346 31,267 35,482 9,761 99,414 410 74 10 2,668
Mirpurkhas 415,451 33,672 48,200 13,827 115,448 489 99 18 3,128
Sindhri 198,283 44,131 50,986 16,173 154,502 1,080 535 185 1,841
(district total) 1,395,000 201,533 234,348 67,922 666,012 3,066 925 246 14,973
Umerkot Kunri 220,379 65,220 20,410 21,474 92,400 1,430 100 14 5,095
Pithoro 113,079 40,800 22,300 23,500 88,450 900 76 10 6,750
Samaro 156,907 30,699 26,400 21,732 65,537 1,265 125 16 7,890
Umerkot 435,636 60,589 28,732 82,300 290,000 2,864 190 18 8,900
(district total) 926,000 197,308 97,842 149,006 536,387 6,459 491 58 28,635
Tharparkar Chachro 498,118 184,645 6,378 175,841 513,702 40,556 1,835 410 78,014
Diplo 225,391 237,339 21,738 359,835 601,804 24,447 2,410 0 52,018
Mithi 336,316 182,416 9,604 387,606 553,889 39,210 1,593 338 71,103
Nagarparkar 213,175 147,865 8,608 261,840 548,481 31,143 2,681 727 45,522
(district total) 1,273,000 752,265 46,328 1,185,122 2,217,876 135,356 8,519 1,475 246,657
Karachi Baldia 8,433 14,455 7,321 8,544 600 350 60 2,275
Bin Qasim 13,729,000 65,320 117,900 38,655 133,990 971 645 425 6,445
Gaddap 40,777 47,321 18,322 29,321 360 112 50 1,140
Gulberg 150 ― ― 900 ― ― ― 312
Gulshan-e-Iqbal 601 200 50 500 ― 200 ― 700
Jamsheed Qtr. 640 ― ― 800 ― 25 50 ―
Keemari 400 ― ― 2,000 ― ― ― ―
Korangi 38,335 60,087 13,776 54,312 500 250 150 1,118
Landhi 75,665 108,876 12,433 184,888 600 322 200 3,200
Liaquatabad 495 ― 50 400 ― 50 ― ―
Lyari 209 ― 2,221 1,100 678 322 ― ―
Malir 24,650 35,998 13,995 69,130 278 100 100 1,230
New Karachi 12,500 28,919 5,417 9,755 400 235 150 ―
North Nazimabad 809 ― ― 1,500 50 63 75 400
Orangi 543 ― ― 1,090 900 412 100 1,990
Saddar 85 ― ― 200 ― 50 45 ―
Shah Faisal Colony 500 300 200 1,015 100 50 87 1,200
Site 435 ― 200 300 812 60 ― 351
(district total) 13,729,000 270,547 414,056 112,640 499,745 6,249 3,246 1,492 20,361
Sindh Total 42,400,000 6,925,022 7,340,162 3,958,508 12,572,221 278,424 44,999 19,512 1,004,925

Appendix C
Report of the First Household Survey
in Sindh Province
(by local consulting firm)

Appendix C
Household Survey Report of Livestock
in
Sindh Province
(Final Report)
Submitted
to
JICA/GoS
by
SEBCON (Pvt.) Ltd. Islamabd
(March 24th, 2011)

EXECUTIVE SUMMARY - The livestock sub-sector in Sindh province occupies a share of 23 percent in
livestock population in the country whereas its share in the production of
fodder crops is 16 percent. It, therefore, faces fodder shortages particularly in
the months of January, July, August, November and December.
- Despite inter temporal shortages of fodder, the average milk productivity
levels in Sindh province remain higher among all four provinces.
- With the exception of buffalo (fresh) milk which has the highest productivity
in the world, the other type of milk i.e. cow milk, sheep and goat milk display
productivity levels far below the levels achieved in major producing countries.
It implies substantial potential reposed which needs to be taped.
- The biggest advantage availed by Sindh province is in the form of
significantly high proportions of farm area that is irrigated i.e. 85 to 90 percent
which is one among the highest in the world. However, this advantage has not
yet been fully exercised which also has adverse effects on livestock sub-sector,
in addition to crop sub-sector.
- The assured supply of water through a vast canal network system tends to
create potentially for the supply of fodder and other crop residues for the
livestock population. In spite of fodder shortages, there is a distinct difference
between irrigated and unirrigated areas in terms of type of animals kept. The
population of cattle and buffaloes largely exists in irrigated areas, whereas
sheep and goats are largely raised in unirrigated areas.
- It is interesting to observe that in between crop and livestock activities there is
a substitution effect i.e. those with smaller land and water resources tend to
focus less on livestock development. However, the larger size agricultural
farms enjoy higher degrees of complementarity between cropping and
livestock activities each supporting and reinforcing each other.
- The large scale cattle colonies in Karachi and specific areas in Jamshoro
district exclusively raise large size animals i.e. cattle and buffaloes. Their
scale of operation is distinctly different and currently not conducive to the
pattern observed in rural Sindh. However, in the development plan for
livestock in Sindh these areas provide significant learning experiences.
- The responses on willingness to pay for livestock insurance showed that larger
proportion of farmers was interested in unirrigated areas in relation to those in
irrigated areas. However, on the whole farmers because of their poverty
and/or ignorance to the concept of insurance had not shown higher level of
willingness. In order for such efforts to succeed a large scale campaign needs
to be carried out in increasing the level of awareness.

CONTENTS Executive Summary
1. Introduction
1.1 Crop-Livestock Interface in Sindh Province
1.2 Rationale for Livestock
1.3 International Comparison of Milk Productivity
1.4 Objectives of the Study
1.5 Sampling Framework
1.6 Classification of Farmers and Regions
2. Social Aspects of Livestock Holders in Sindh
2.1 Educational Background
2.2 Religion
2.3 Mother tongue
2.4 Caste
2.5 Size of Livestock
3. Incidence of Diseases
3.1 Overall Situation
3.2 Service Providers for Treatment of Diseases
3.3 Characteristics for Improving Gene of Cattle and Buffaloes
3.4 Characteristics for Culling Cattle and Buffaloes
3.5 Milking Practices
3.6 Comparison of Cattle and Buffaloes
3.7 Discussion
4. Levels of Economic Values of Agricultural & Livestock Activities
4.1 Levels of Milk Productivity
4.1.1 Cows & Buffaloes
4.1.2 Sheeps and Goats
4.2 Levels of Return in Crop Cultivation
4.3 Level of Economic Values Associated with Cattle & Buffaloes
4.4 Level of Economic Values Associated with Sheep and Goats
5. Factors Affecting Livestock Development in Sindh
5.1 Relationship between Crop Cultivation & Livestock Activities
5.2 Milk Productivity – Fodder Shortage Interface
5.3 Farmers Willingness to Pay for Livestock Insurance
6. Sales of Milk 7. Conclusions and Recommendations

Appendix C - 1
1. Introduction
The Sindh province, being part of an arid region, has remained water deficient from
the beginning. The irrigation water supplies to the province, as a contiguous part of
Indus River System, therefore act as life blood to its fertile land. Currently, over 85
percent of its farm land is irrigated – a proportion which is one among the highest in
the world.
The irrigation supplies have thus significantly accelerated the pace of land cultivation
in the province during the twentieth century. Nevertheless, the inter-temporal
variations in water supplies have given rise to a mix of different crops and livestock
production pattern. The prospects for livestock growth were determined in view of
the possibility of different fodder crops and residues from other crops.
However, the ghost of famine, drought and hence food insecurity have haunted the
region in a historical context. In this backdrop, the agrarian pattern which emerged
during the British control of the area created greater inequities in land distribution
pattern, particularly in Sindh province. These in turn incapacitated the entrepreneurial
urge to emerge among farmers, particularly the small owners and the landless. As a
consequence the farmers adopted survival strategies to mitigate the recurrence of food
insecurity problem in the area.
1.1 Crop-Livestock Interface in Sindh Province
With a geographical area of 14.09 million hectares, the province of Sindh, a total of
4.87 million hectare is cultivated. The three barrages (divergent dams) in Sindh
command a total of 3.44 million hectares of which 3.19 million hectares is irrigated
(Development Statistics of Sindh, 2008, page 63). It implies that over 92 percent of
the command area of barrages in Sindh is irrigated. A significant which does not
come under controlled irrigation system largely depends on rainfall which has an
erratic pattern in terms of its timing, amount, regulatory and distribution. In the
obtaining situation the canal water supplies carry the status of life blood particularly
to the rural population of the province. Due to increased levels of water logging and
salinity in Sindh, there has been extremely low level of investment in tubewells
particularly in the private sector.
Most of the rainfed areas are in the districts of Tharparkar, Khairpur, and Jamshoro.
In the remaining 20 districts, land is largely cultivated by canal water supplies, and
limited supplies from tubewells.
With the establishment of a vast network of irrigation water supplies in most of the
districts, which also portray different cropping systems, a large number of crops in the
Kharif (summer) and Rabi (winter) seasons are grown. These include food and cash
crops, pulses, oilseeds, vegetables, condiments, fruits and fodder crops. During
2008-09, fodder crops were grown on 0.3 million hectares in Sindh which accounted
for 1.27 percent of fodder area in Pakistan (Agriculture Statistics of Pakistan, 2008-09,
page 87). In Sindh the acreage under fodder accounts for 7.85 percent of the total
cropped area of 3.82 million hectares. However, it is rather alarming that whereas
Sindh contributes 16.1 percent in the total cropped area in Pakistan, its share in fodder
acreage is only 1.27 percent.

Appendix C - 2
Along with the crop cultivation pattern in Sindh, raising of a sizeable livestock
population also exists which in many ways compliments with the cropping pattern
within irrigated areas. In the unirrigated areas the livestock farming in a way tends to
substitute the crop cultivation largely due to non-availability of water supplies.
Therefore, across different agro-climatic zones in Sindh, different pattern of livestock
farming emerged. The type of animals kept includes cows, buffaloes, goats and sheep.
In addition, domestic animals like camel, horses, donkeys are also part of the
livestock population in Sindh.
Table-1 provides estimates on livestock population in Sindh from 1976 to 2009-10
using various sources of information.
Table – 1
Estimated Livestock Population in Sindh Province (# Animals in Million unless otherwise Mentioned)
Year Source
Cattle Buffalo Sheep Goat Camel
# Periodical
Growth Rate (%)
# Periodical
Growth Rate (%)
# Periodical
Growth Rate (%)
# Periodical
Growth Rate (%)
# Periodical
Growth Rate (%)
1976 Livestock Census 2.85 1.83 1.83 4.24 0.14
1986 Livestock Census 3.87 35.8 3.22 75.9 2.62 43.2 6.76 59.4 0.22 57.1
1996 Livestock Census 5.46 41.1 5.62 74.5 3.71 41.6 9.73 43.9 0.23 4.5
2006 Livestock Census 6.92 26.7 7.34 30.6 3.9 6.7 12.57 29.2 0.28 21.7
2008-09 Ministry of L&DD 7.73 11.7 8.02 9.3 4.08 3.0 13.64 8.5 0.29 3.5
2009-10 Projected 8.02 3.75 8.26 3.0 4.2 3.0 14.01 2.7 0.29 0
Sources: 1. Various Reports of Livestock Census reported in Development Statistics of Sindh 2008,
Government of Sindh.
2. Derived estimates from national level projection after 2006 by Ministry of Livestock &
Dairy Development (MLDD) Government of Pakistan, reported in Development
Statistics of Sindh, 2008 (Pages 181-189).
3. Based on the animal specific growth rates between 2006 and 2008-09, estimated
animal population for the year 2009-10 wee derived.
It shows the prominent features of the estimated population of 8.02 million cattle,
8.26 million buffaloes, 4.2 million sheep, 14.01 million goats and 0.29 million camels.
As per 2006 livestock census in the country, the relative share of Sindh in the country
in this respect shows significant contributions. For example, Sindh carries a share of
23 percent in cattle, 27 percent in buffaloes, 15 percent in sheep, 23 percent in goats
and 30 percent in camel population (Agriculture Statistics, Government of Pakistan,
2008-09, Table 120, page 181). In addition, Sindh’s share in poultry birds is around
19 percent in the country.
This shows a much larger share of Sindh in the country in terms of livestock
population when compared with 16.1 percent share in total cropped area.
Furthermore, a comparative estimate on milk productivity across four provinces
shows that average level of milk productivity of cows, buffaloes and goats in Sindh is
higher.

Appendix C - 3
Table – 2
Comparative Levels of Milk Productivity across Provinces as per Livestock Census of 2006
(Liters/Day/Animal)
Provinces Cow Buffalo Goat
Punjab 6.31 7.71 1.36
Sindh 6.62 8.9 1.72
Khyber Pakhtonkhwa (NWFP) 5.09 7.28 1.33
Balochistan 6.15 7.61 1.09
Pakistan 6.15 7.93 1.42
Source: Livestock Census of 2006, Special Report, Table-1, Page 1-4.
It further implies that the share of Sindh in total production of milk in the country is
even higher than its share in livestock population.
1.2 Rationale for Livestock
The current pattern of livestock activities in Sindh presents a somewhat convolutal
role of the livestock sub-sector within the gambit of the overall agricultural sector.
The only exception is that of Karachi Cattle Colonies which have no cropping
activities and have largely developed on their own initiatives.
The farming community in Sindh largely raises livestock as supplementary activities
with cropping culture. The current pattern so observed in Sindh are also common to
the entire country where livestock activities compliments to the crop sub-sector on the
basis of providing fodder output and residues from main crops.
In a socio-economic context, raising livestock appear as part of the survival
mechanism against food insecurity and poverty. Therefore, livestock activities are
considered a mechanism of not only making complementarities with the cropping
output but is a conscious activity to act as a form of savings as well. It is also a part
of the food chain of the households, and facilitate in providing instant cash flow at
time of distress.
These social and microeconomic aspects of livestock activities in Sindh are largely
devoid of the technical and economic potentials reposed. The fertile land, irrigated
status and a large number of productive species of different animals are the resource
endowments of the province which require a scientifically designed and aggressively
planned focus on the development of the livestock sub-sector that can create the basis
for a vibrant economic activity in order that effective uplift of the rural masses and a
harmonized social development is achieved.
The above discussion shows the relative edge that the province of Sindh carries in
livestock population and milk production. It tends to demonstrate the potentials
reposed. However, it also shows a relatively smaller share in fodder crops acreages
implying insufficiency of fodder production in the province and hence dependence on
imports from other provinces. The timeliness required in the prompts supplies of
fodder tend to create shortages in different parts of the year and is considered one the
main obstacles in improving livestock productivity levels in Sindh.

Appendix C - 4
Another major, rather the most important factor in improving the productivity of the
livestock sub-sector in the province (and at the national level as well) is the general
lack of a dynamic and scientific approach towards its development. A schematic
chart tends to display the current status and approach adapted in the province in
developing livestock sub-sector.
Schematic Chart Highlighting Traditional & Non-Traditional Aspects of Livestock Development in Sindh Province
It portrays a set of factors that largely traditional and static in nature which tend to
provide a justification for the existence of livestock population. The crop sub-sector
provides fodder and residues from other crops as a complementary input to the
livestock population. In most of the rural areas, a general lack of social services and
economic opportunities imposes self containment of the farming sector they restrict
themselves in an enclave for the growth of livestock. It is largely caused b the
incapacity of the institutional framework to guide and assist the livestock holders.
The element of social insecurity has perpetuated in the region which forces the rural
community to use livestock as a form of savings and asset. Therefore, a joint impact
of these factors provide the justification for raising livestock population which
obviously does not carry the flavor of dynamic and scientifically established approach
towards livestock development at the regional level. Therefore, these factors persist
Traditionally Held Factors
Factors Process 1. Irrigated Agriculture Functional Support 2. Remoteness of Village Self Containment 3. Income Poverty Income Supplement
4. Social Insecurity Form of Saving/Asset
STATIC FACTORS
Raising of
Livestock
DYNAMIC/MODERN ASPECTS
Non-Traditional Institutional Factors
Factors 1. Fiscal & Monetary Support
from Government 2. Quality of Research &
Dissemination through Universities
3. Role of Line Departments
4. Financial Institutions
5. Private Sector Participation
Process 1. Investment Incentives
2. Technical Knowledge
3. Provision of Animal
Health Facilities
4. Provision of Investment
Capital
5. Assured Demand for
Dairy & Livestock
Products
Appendix C - 5
and render the sub-sector as a somewhat static towards its path of development
despite the potentials reposed.
The chart also displays a number of non-traditional approaches towards the
development of the livestock sub-sector which are the basis for a scientific and
efficient followed in countries which lead the world in production and supplies of
livestock products. The non-traditional institutional factors include roles of
government, educational institutions, service providers, financial institutions and the
private sector. The process through which these sources contribute towards the
development of livestock sub-sector include investment incentives, creation of
technical knowledge through research and its dissemination, provision of animal
health care facilities, availability of capital for investment and an assured demand for
livestock products through an active and vibrant participation of the private sector.
Currently, these non-traditional factor are not fully participating in the development of
the livestock sub-sector of Sindh province largely because of a clear lack of
integration among them in focusing on the sub-sector. Through an effective
integration of these non-traditional factors in terms of a Development Plan the
livestock sub-sector can overcome its current deficiencies and a basis can be created
to achieve competitive edge with other developed/developing countries. The further
prospects for the export of dairy and livestock products can be established which
would help reduce rural poverty and enhance welfare gains all across.
1.3 International Comparison of Milk Productivity
In view of the preceding discussion on the prevailing levels of milk productivity in
Sindh and prospects for future development, it would be relevant to examine the
relative position of Pakistan among the major producing regions in the world.
Table 3 provides a comparative picture of 21 major countries in the level of milk
productivity of cows, buffaloes, sheeps and goats. It shows that of 21 countries
Pakistan ranks 18th
in cow milk. Among the top 8 countries in terms of milk
productivity of buffaloes, Pakistan ranks 1st. In case of sheep and goat milk, Pakistan
productivity levels rank 5th
and 12th
, respectively.

Appendix C - 6
Table – 3
Levels of Milk (Whole Fresh) Productivity by Animals across Major Producing Countries
(Kg/Animal/Annum)
# Countries Cows Buffaloes Sheep Goats
1. Armenia 2151 0 232 643
2. Austria 6068 0 411 635
3. Belarus 4510 0 0 819
4. Bhutan 257 400 0 0
5. Canada 8395 0 0 0
6. China 2832 547 29 200
7. Czech Republic 7055 0 221 750
8. Egypt 1882 1600 49 14
9. Germany 6794 0 0 972
10. India 1172 1598 0 132
11. Iran 1843 1065 30 30
12. Indonesia 1858 0 30 40
13. Japan 7497 0 0 0
14. Jamaica 952 0 0 391
15. Malaysia 423 1150 0 429
16. Netherlands 7342 0 0 0
17. New Zealand 3500 0 0 0
18. Pakistan 1230 1931 50 141
19. Turkey 2802 1002 78 105
20. United Kingdom 7101 0 0 0
21. USA 9331 0 0 0
Source: FAO STAT 2009 (Website)
In other terms, Pakistan achieves only 13 percent of USA’s cow productivity levels,
12 percent of the level of goat milk productivity of Austria, and 14.5 percent of milk
productivity of goat of Germany. Only in case of buffaloes milk Pakistan ranks
Highest.

Appendix C - 7
Chart – 1
Levels of Fresh Milk (whole) Productivity of Cows across Countries
0
1000
2000
3000
4000
5000
6000
7000
8000
9000
10000
Kg
/Co
w/A
nn
um
Arm
en
ia
Au
str
ia
Be
laru
s
Bh
uta
n
Ca
na
da
Ch
ina
Cze
ch
Re
pu
bli
c
Eg
yp
t
Ge
rma
ny
Ind
ia
Ira
n
Ind
on
esia
Jap
an
Jam
aic
a
Ma
lays
ia
Ne
the
rla
nd
s
Ne
w Z
eala
nd
Pak
ista
n
Tu
rkey
Un
ited
Kin
gd
om
US
A
Chart – 2
Levels of Fresh Milk (whole) Productivity of Buffaloes across Countries
0
200
400
600
800
1000
1200
1400
1600
1800
2000
Kg
/Bu
ffalo
es/A
nn
um
Bh
uta
n
Ch
ina
Eg
yp
t
Ind
ia
Iran
Mala
ysia
Pakis
tan
Tu
rkey
Keeping in view these milk productivity levels where Pakistan has significant
deficiencies and the fact that it ranks 4th
or 5th
in the world in total milk production
level, it is easier to ascertain the massive opportunity losses incurred by not availing
the productivity enhancement measure. Furthermore, the past production loss of milk
because of maintaining an age old processing and distribution system of milk, the
need for extensive measures for the shifts in production and post-production systems
through a Master Plan seems strongly justified.

Appendix C - 8
Chart – 3
Levels of Fresh Milk (whole) Productivity of Sheeps across Countries
0
50
100
150
200
250
300
350
400
450K
g/S
heep
/An
nu
m
Arm
enia
Au
stri
a
Ch
ina
Cze
ch R
epu
blic
Eg
ypt
Iran
Ind
on
esia
Pak
ista
n
Tu
rkey
Chart – 4
Levels of Fresh Milk (whole) Productivity of Goats across Countries
0
100
200
300
400
500
600
700
800
900
1000
Kg
/Go
at/
An
nu
m
Arm
enia
Au
stri
a
Bel
aru
s
Ch
ina
Cze
ch R
epu
blic
Eg
ypt
Ger
man
y
Ind
ia
Iran
Ind
on
esia
Jam
aica
Mal
aysi
a
Pak
ista
n
Tu
rkey

Appendix C - 9
1.4 Objectives of the Study
In the light of the discussion presented in preceding sections efforts are being made to
prepare a Master Plan for the development of livestock sub-sector in Sindh.
Accordingly, a baseline survey of livestock holders in Sindh was undertaken with the
following measure objectives:
a) To furnish necessary data and information to the Project Team in formulating
a comprehensive development strategy for livestock and dairy development
Master Plan.
b) To collect information on such aspects as social, economic, agricultural and
livestock to prepare a baseline of the livestock sub-sector.
1.5 Sampling Framework
In order to capture the characteristics of farmers in Sindh, the Household Survey was
conducted by a local consulting firm. The survey was made in the form of interview,
and 720 households in the selected 8 districts were surveyed. The districts covered by
the Survey are Karachi, Badin, Tharparkar, Jamshoro, Sukkur, Larkana Tando
Allahyar and Sanghar. Six villages were selected from each district, and 15
households were selected from each village, both of them being based on the criteria
prepared by the Project Team. The selected villages are shown in Table 1-5-1. The
topics of questionnaire were extended to various topics such as income and
consumption, agriculture, livestock, credit gender, social organization, etc. Yet the
main purpose of the survey is to understand the characteristics of the farm households
in relation to the number of the animals, the ownership and size of the land they
possess as well as agro-ecological and geographical conditions of the areas they reside.
Therefore, specific criteria, as shown in Tables 1-5-2, Table 1-5-3 and 1-5-4, were
applied for selecting the households.

Appendix C - 10
Table 1-5-1 List of the Villages for the Household Survey
Table 1-5-2 Household Selection Criteria for Cattle
Colonies in Karachi
Landless Land owners
Small farmers
(No. of animals: 0-50) 4 farms
Small - Medium farmers
(No. of animals: 51-100) 3 farms
Medium farmers
(No. of animals: 101-150) 3 farms
Medium - Large farmers
(No. of animals: 151-200) 3 farms
Large farmers
(No. of animals: 201-) 2 farms
District Village U/C Taluka
Karachi Landhi Cattle Colony
Nagori Cattle Colony
Shedi Goth Memon Goth
Juma Goth Ibrahim Hydri
Qureshi Colony Near Super Highway
Goth Moidan Goth Moidan
Badin Khanai Jat Khor Wah Golarchi
Baghali Mehri Dubi Gloarchi
Chak No.25 Golarchi Golarchi
Bukhsho Lund Pangrio Tando Bago
Allah Dino Badin 2 Badin
Lakhadino Unar Chabralo Tando Bago Tando Bago
Tharparkar Kasbo Nagarparkar Nagarparkar
Oon Jo Wandha Nagarparkar Nagarparkar
Mithrio Bhiwti Mithrio Bhiwti Mithi
Warwai Khairo Ghulam Shah Mithi
Chapper Khinsar Chhachhro
Baliari Baliari Diplo
Jamshoro Ramazan Rajar Petaro Kotri
Qadan Shoro Allah Bachayo Shoro Kotri
Mian Barecho (Wai) Arab Khan Thana Bola Khan
Salah Muhammad Brahman Thana Bola Khan Thana Bola Khan
Karchat Thana Arab Khan Thana Bola Khan
Ali Murad Barejo Mole Thana Bola Khan
Sukkur Thomi Tarrai Saleh Pat
Thatt Trimhoon Rohri
Trimhoon Trimhoon Rohri
Laung Bhambhoro Tarrai Saleh Pat
Faqir Indhar (Muhammad Saleh Undhar) Sultan Pur Pano Aquil
Umer Buriro Sangi Pano Aquil
Larkana Darra Badah-2 Dokri
Mirpur Bhutto Pir Bakhsh Bhutto Rato Dero
Chato Wahan Mehrapur Bakrani
Dhamrah Dhamrah Larkana
Faridabad Wada Mahar Bakrani
Goth Bosan Waris Dino Machi Rato Dero
Tando Allahyar Chatan Aresar Bagan Jarwar Chambar
Behar Mir Jat Tando Soomro Jhando Mori
Haji Yusif Halephoto Pak Snghar Jhando Mori
Masoo Khan Bozdar Dad Jarwar Chambar
Miandad Rind Chambar-2 Chambar
Dito Kalro Shaikh Moosa Tando Allahyar
Sanghar Chuttyaron Chuttyaron Sanghar
Tando Mitha Khan Chuttyaron Sanghar
Naubad Naubad Jam Nawaz Ali
Bahadur Khaskheli Jhol Sinjhoro
Urs Chanio Hathungo Khipro
Chutto Mangerio Jhol Sinjhoro

Appendix C - 11
Table 1-5-3 Household Selection Criteria for Karachi Rural and Other Districts in Irrigated
Areas
Specialized in Livestock
(no cropping)
Landless Land owners
Small farmers
(No. of animals: 0-5) 1 household
(If not available, add to
small landless farmers)
4 households 4 households
Medium farmers
(No. of animals: 6-20) 5 households
Large farmers
(No. of animals: 50-150)
1 households
(If not available, add
to medium farmers)
The selection criteria is not continuous, in order to include the famers who own a large
number of livestock in the sample.
Table 1-5-4 Household Selection Criteria for Non-irrigated Areas
Specialized in Livestock
(no cropping)
Landless Land owners
Small farmers
(No. of animals: 0-20) 3 Households
2 households 4 households
Medium farmers
(No. of animals: 21-50) 4 households
Large farmers
(No. of animals: 101-)
2 households
(If not available, add
to medium farmers)
The selection criteria is not continuous, in order to include the famers who own a large
number of livestock in the sample.
Count one for one small ruminant (sheep/goat)
Count one camel as 12 small ruminants
Count one cattle as 10 small ruminants
In addition, a key informant survey was also conducted for each village, before the
start of household survey, using a village level questionnaire. The purpose was to
collect village level characteristics as well as to identify 15 households to be covered
through household survey. The questionnaire was administered with key informants
of the village in a joint meeting.

Appendix C - 12
1.6 Classification of Farmers and Regions
As described in Table 1-6-1, livestock farmers are grouped into the categories
depending on the size of animal holdings for dairy, sheep and goats, and fattening farmers. To
obtain a single indicator that reflect the scale of animal holdings for various kinds of livestock,
the animal unit which is depicted in Table 1-6-2 is used for the analysis.
Number of Head
Holdings Classification
Dairy More than 11 heads Large Farmers
6-10 heads Medium Farmers
1-5 heads Small Farmers
Sheep and More than 71 heads Large Farmers
Goats 31-70 heads Medium Farmers
1-30 heads Small Farmers
Fattening M re than 41
heads Large Farmers
1-40 heads Small Farmers
Kind of
Livestock
Animal Unit
Factor
Buffalo 1.0
Cattle 0.8
Sheep 0.1
Goat 0.1
Donkey 0.4
Horse 1.0
Camel 1.1
As depicted in Table 1-6-3, farmers are grouped into following categories based on
the status of land ownership. Owner-cum-tenants are grouped into landowners1
. The
landowners are further classified into sub-categories based on the area of own land as
depicted in Table 1-6-4. Those who are not engaged in agriculture but holds livestock are
classified as “Non-farm livestock holders”. In some cases, non-farm livestock holders are
further divided into “Non-farm large livestock holders” who own 10 units of animals in terms
of animal unit and “Other non-farm livestock holders” who own less than that unit. An
attempt has been made to separately categorize and analyze the landowners who have less
than one acre of land since they can be treated as very vulnerable subsistence farmers.
However, there are only eight households of this group in the sample, and also the separation
of these households does not affect the main findings of this chapter.
Categorization Based on Land
Ownership
Landowner
Owner-cum-tenant
Tenant
Non-farm large livestock holders
Other non-farm livestock holders
Area of Own Land Classification
More than 100 Acres Large Landowner
25-99 Acres Medium Landowner
5-24 Acres Small Landowner
Less than 5 Acres Micro Landowner
Table 1-6-5 describes the regional classification used for the analysis. Farmers in the
cattle colonies are grouped as “Colony”. As shown in Table 1-6-1, for the analysis of
consumption/income and dairy animals, three villages which are close to Karachi and
Hyderabad are classified as “Non-irrigated dairy areas” as the dairy farming is practiced
extensively for these areas. The other non-irrigated areas are grouped into “Other non-
irrigated areas”.
1 except for the Chapter 5.7 Rural Finance
Table 1-6-1 Classification of Livestock Farmers Table 1-6-2 Animal Unit for Sindh
Table 1-6-4 Classification of Landowners
Table 1-6-3 Categorization Based on Land Ownership

Appendix C - 13
Table 1-6-5 Classification of
Regions
Table 1-6-6 Regions for the Analysis of Consumption and Dairy Animals
Regions
Colony
Irrigated Area
Non-irrigated Area
Regions for Dairy Section
Colony
Irrigated Area
Non-irrigated Dairy Area
Other Non-irrigated Area
Appendix C - 14
2. Social Aspects of Livestock Holders in Sindh
This section provides descriptive coverage of social aspects of sampled households.
These include:
- Education
- Household Size
- Religion
- Mother Tongue
- Source of Fuel
- Access to Electricity
- Land Ownership
- Sources of Irrigation

Appendix C - 15
3. Incidence of Diseases
Information was gathered on the incidence of 6 diseases (diarrhea, Inappetance,
mastitis, cold, retention of placenta and dystocia) in the animals from sampled
households in the irrigated (462 respondents) and non-irrigated (255 respondents)
zones. The information also included data from fattening animals (both large and
small ruminants). However, this related to only 3 diseases namely diarrhea, cold and
Inappetance and is based on a total of 292 respondents who reported keeping animals
for fattening2.
3.1 Overall Situation
On the whole, the most common disease reported was calf diarrhea (43.8%) and the
least common was dystocia (26.3%). On the basis of landownership, the incidence
pattern was similar. Most common was calf diarrhea with 47.6% and the least
common was dystocia with 24.5%. The landless reported rather high incidence of all
the diseases that varied in the range of 37.4% for diarrhea to 49.6% for retention of
placenta.
The farm size seem to influence the incidence of diseases-larger the farm higher the
incidence (range 32.0% for dystocia to 58.6% for diarrhea).
3.1.1 Irrigated Zone
On the whole, the most common disease reported was diarrhea (50.4%) and the least
common was dystocia (28.4%). On the basis of land ownership the situation was
similar for land owners (diarrhea 54.4% and dystocia 25.3%) but for the landless the
situation was different. Most common disease was retention of placenta with 62.4%
and least common was diarrhea with 45.5%. Animals of the tenants had the lowest
incidence of all the diseases that varied between 11.6% (for dystocia) to 43.4% (for
diarrhea). Animals with landless respondents had high incidence of diseases that
ranged with the highest incidence of 62.4% in retention of placenta to the lowest of
45.5% in diarrhea.
The farm size seems to influence the incidence of diseases. The animals in large farms
had the highest incidence of all the diseases except for inappetance.
3.1.2 Non-irrigated Zone
The incidence of diseases on the whole appeared much lower as it occurred in a
narrow range of 17.3% to 18.7%. On the basis of landownership, the landowners
reported the highest range of 20.6% to 24.7%. The landless reported the lowest
incidence from no mastitis to 3.3% for cold. The situation about the animals with the
tenants remained between those of the landowners and the landless. Size of the farms
greatly influenced the incidence of the diseases with highest rate for all the 6 diseases
in large farms
2 Detailed tables related to this section of the report have been annexed.
Appendix C - 16
3.1.3 Fattening Animals
These comprised of two types of animals namely, large ruminants (cattle and
buffaloes) and small ruminants (sheep and goats). Within each type there were two
groups according to the number of heads. For both the large and small ruminant types
there were less than 3 respondents for the bigger groups. So the total for each type has
been described for the incidence of their 3 diseases (diarrhea, cold and inappetance).
On the whole, in the large ruminants the incidence of diseases was rather high. The
highest incidence was of cold (71.4%) and lowest was for inappetance (51.4%). In
small ruminants, the disease situation was much better with a high of 32.5% for cold
and a low of 19.5% for inappetance.
In the irrigated zone, the disease incidence was high in the large ruminants (highest
73.1% for diarrhea and cold and lowest 46.3% for inappetance). In small ruminants,
the disease incidence appeared somewhat lower with highest rate of 43.8% for
diarrhea and lowest of 22.5% for inappetance.
In unirrigated zone, the large ruminants had the highest incidence of inappetance and
cold (66.7% each) and lowest incidence of diarrhea with 55.6%. The small ruminants
had low incidence of the 3 diseases that ranged between 15.9% and 18.9%.
3.2 Service Providers for Treatment of Diseases
Information was gathered about seven service providers from the public and private
sectors for providing treatment of diseases to the animals of the respondents. These
were government veterinarians and paravets and private veterinarians, paravets, friend,
relatives and the farmers themselves. The diseases were the same for which their
incidences were surveyed namely, diarrhea in calves, inappetance, cold, mastitis,
retention of placenta and dystocia. The information is based on the responses from a
total of 315 respondents. For fattening animals the numbers of respondents were 25
for large ruminants and 95 for the small respondents.
3.2.1 Overall Situation
The major providers of the services were the farmers themselves. This varied from a
high of 64% for diarrhea, mastitis and cold to a low of 59% for retention of placenta
and dystocia. This was followed by private paravets with a high of 42% for the
treatment of inappetance to a low of 15% for dystocia. There was indication that for
difficult diseases like dystocia and retention of placenta government veterinarians had
somewhat greater role although still behind the private paravets. Other service
providers had insignificant roles. An important aspect of the treatment of diseases was
that almost all farmers did arrange treatment for their animals either themselves or by
a service provider.
For landowners, landless and the tenants the patterns were similar with the farmers as
the major providers followed by the private paravets and insignificant roles by others.
The farm size did not seem to influence the choice of service provider because the
pattern of service provision was more or less similar to that of the overall situation.
For both the large and small ruminants under fattening the pattern was similar i.e.
major role of farmers followed by private vets.

Appendix C - 17
3.2.2 Irrigated Zone
On the whole the pattern was similar but for difficult diseases like retention of
placenta, dystocia and mastitis the government veterinarians had some role but still in
third place after farmers and private paravets. This may be due to the presence of
government veterinary hospitals in the irrigated areas. This pattern did not seem to be
influenced by farm size, as well.
For fattening animals also the self treatment by farmers was followed by private vets
and government vets.
3.2.3 Non-irrigated Zone
On the whole, there was much higher role of the farmers themselves followed by the
government vets and much reduced role of the private sector service providers. The
farmers’ role was as much as 81% for diarrhea and a low of 59% for dystocia. For
land owners, the high was 86% and a low of 65%. But for the tenants, it was 100%
treatment by the farmers for diarrhea and inappetance and the lowest was 50% for
retention of placenta. For this disease, government vets had 50% role in its treatment.
The landless treated 100% of cold themselves followed 100% cases of retention of
placenta and 67% cases of dystokia the by government vets.
On the basis of farm size, it appears that medium sized farms depended more on their
own skills for the treatment of some diseases and on government providers some
others. For example, 91% for dystokia and 86% for inappetance the treatments were
provided by the farmers themselves. However, in addition to their self services, they
utilized government vets for diarrhea (17%), cold (27%), mastitis and inappetance
(14% each) and retention of placenta (18%). On the other hand, large farmers also
depended more on their skills with a high of 100% for the treatment of mastitis, 90%
for inappetance and 76% for diarrhea.
For large ruminants under fattening, the pattern was the increased role of farmer
themselves 83% for cold to 67% for inappetance. Private paravets were the only other
service providers (17% for cold to 33% for inappetance). For small ruminants the
pattern was similar but with government service providers in the third place after
private paravets.
3.3 Characteristics for Improving Gene of Cattle and Buffaloes
Views of farmers were ascertained on nine characteristics for improving the gene of
cattle and buffaloes. The characteristics are milk production, fast growth, height,
udder type, teat type, body type, body capacity, colour and liveliness. Out of the total
of 720 respondents, the opinions of only 623 are considered because these possessed
cattle and buffaloes.
3.3.1 Overall Situation
On the whole, 83% considered milk production to be the top characteristic for gene
improvement of cattle and buffaloes. This was followed by teat type (58%) and udder
type (52%). Colour, height and body capacity were considered the least important
characteristics (24%, 26% and 34% respectively). On the land ownership basis, the

Appendix C - 18
landless had similar choices but with greater emphasis ranging from 90% to 76% and
60% respectively. Land owners also had similar preferences but the tenants had
slightly different opinion. Their third choice was for fast growth. Farm size did not
seem to affect the choice of characteristics for gene improvement.
3.3.2 Irrigated Zone
On the whole, the pattern for the top three characteristics was similar i.e. milk
production followed by teat type and udder type. The least important characteristics
were also similar i.e. colour, height and body capacity. Similar was the situation about
landless and the land owners. However, the tenants placed fast growth as their third
choice. Small farms had the same first three choices. But the large and medium sized
farms differed in their second and third choices. The second choice for large farms
was liveliness followed by teat type. For medium sized farms, fast growth was the
second choice followed by teat type.
3.3.3 Non-irrigated Zone
On the whole and on the basis of land ownership, the patterns of choices were nearly
similar i.e. milk production followed by teat and udder types. Colour, liveliness and
height were considered the least important characteristics (11%, 14% and 19%
respectively). For large farms the choices were milk production followed by udder
type and fast growth. However, the medium sized farms chose milk production
followed by udder type and teat type. The small sized farms choice was milk
production followed by teat type and udder type.
3.4 Characteristics For Culling Cattle And Buffaloes
Views of farmers were obtained about characteristics for culling cattle and buffaloes.
The characteristics considered are old age, low production, blind teat, disease, fracture,
injury and no reproduction. Opinions of only 623 respondents out of a total of 720 are
considered here because these possessed cattle and buffaloes.
3.4.1 Overall Situation
On the whole, the first three major characteristics for culling cattle and buffaloes were
old age (74%), low production (57%) and blind teats (51%). These were also the
choices for the land owners, landless and the tenants. The size of the farms did not
affect the characteristics for culling the cattle and buffaloes.
3.4.2 Irrigated Zone
The choices of characteristics for culling cattle and buffaloes remained the same even
in the irrigated zone i.e. old age followed by low production and blind teats. The size
of farms did not affect the choices.
3.4.3 Non-irrigated
On the whole, the pattern remained similar to that of the respondents in the irrigated
zone. However, there were small changes on the basis of land ownership. For the
tenants, the old age was followed by blind teat with low production as the third
characteristic. The land owners placed both the low production and blind teats as
equally important characteristics (48% each). Large farms had the common pattern of

Appendix C - 19
old age followed by low production and blind teats. But the medium and small farms
placed blind teats in second place followed by low production.
3.5 Milking Practices
Information was obtained on six milking practices. These are milking frequency,
milking under a roofed place, cleaning the udder, using filter, mastitis test and use of
hormone for milking. A total of up to 643 respondents were involved.
3.5.1 Overall Situation
The results of each practice are presented as follows:
Frequency of Daily Milking: On the whole, more than two third of the respondents
(67%) milked their animals twice every day. The highest proportion of farmers were
the landless who milked twice daily (87%) followed by land owners (64%) and
tenants (62%). Farm size did not seem to influence the frequency of daily milking.
Roof in the Milking Place: On the whole, just over half (55%) the farmers had roof
over their milking place. However and surprisingly, a high proportion of landless
farmers (76%) had roofs followed at a distance by the landowners (53%) and tenants
(41%). Farm size did not seem to influence the presence or otherwise of roof over the
milking place.
Clean Udder: On the whole, a very high proportion of farmers (92%) cleaned the
udder of their animals before milking. This practice did not seem to be influenced by
the land ownership or even the farm size.
Use of Filter: On the whole, very few farmers used filters (18%). But there was a wide
variation on land ownership basis. The landless were the highest users of filters (55%)
followed at a distance by the land owners (12%) and the worst were the tenants (7%).
There seem to be no influence of farm size on the use of filter for milking.
Mastitis Test: On the whole, most of the farmers never undertook mastitis test (68%),
26% undertake this test at present while 6% did test their animals in the past. It is not
surprising to find that 84% of tenants never had this test followed by 74% by the
landowners and 35% by the landless. However, currently more (54%) landless test
their animals followed by 21% landowners and 15% tenants. Farm size did not seem
to influence the mastitis testing.
Use of Hormone for Milking: More than half (58%) never used hormone while 24%
still use it and only 18% did use it in the past but not anymore. On the land ownership
basis the landless are the worst culprit because 59% still use it. However, not many
landowners (16%) and tenants (18%) use the hormone now. Farm size did not affect
the use of hormone for milking.
3.5.2 Irrigated Zone
The results of each milking practice are presented as follows:
Frequency of Daily Milking: On the whole, nearly two third (67%) of farmers
milked their animals twice daily. On the land ownership basis, the landless lead in
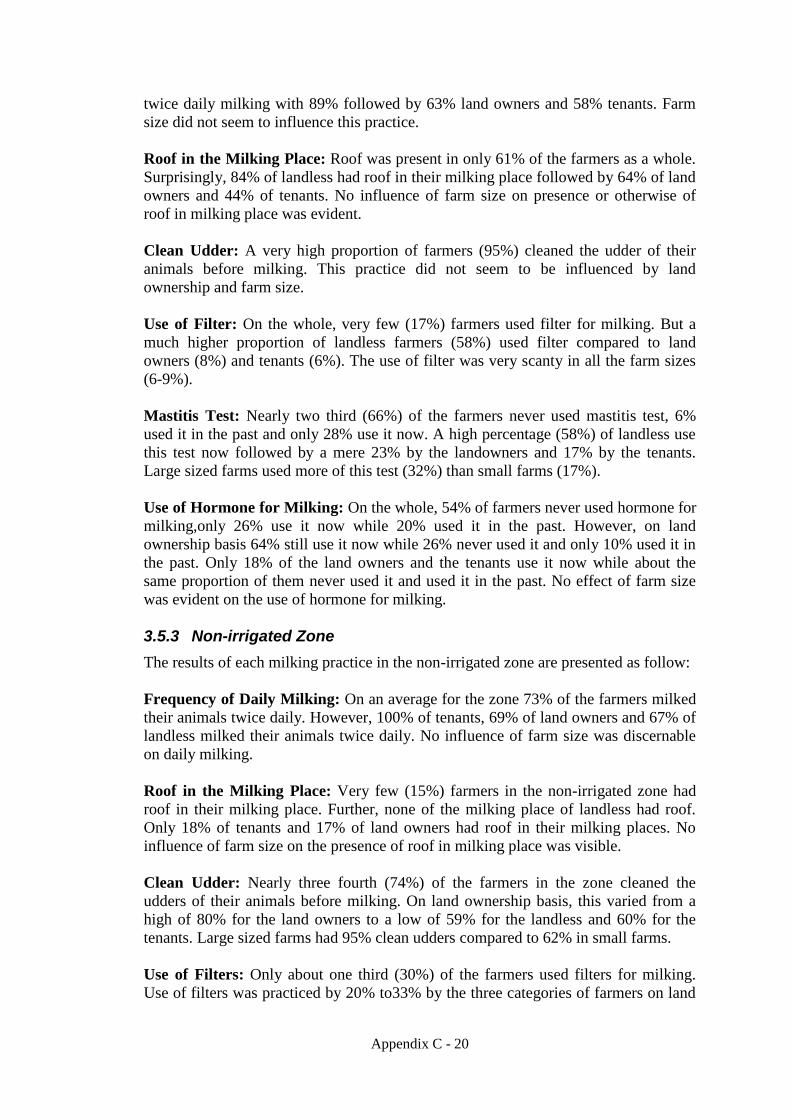
Appendix C - 20
twice daily milking with 89% followed by 63% land owners and 58% tenants. Farm
size did not seem to influence this practice.
Roof in the Milking Place: Roof was present in only 61% of the farmers as a whole.
Surprisingly, 84% of landless had roof in their milking place followed by 64% of land
owners and 44% of tenants. No influence of farm size on presence or otherwise of
roof in milking place was evident.
Clean Udder: A very high proportion of farmers (95%) cleaned the udder of their
animals before milking. This practice did not seem to be influenced by land
ownership and farm size.
Use of Filter: On the whole, very few (17%) farmers used filter for milking. But a
much higher proportion of landless farmers (58%) used filter compared to land
owners (8%) and tenants (6%). The use of filter was very scanty in all the farm sizes
(6-9%).
Mastitis Test: Nearly two third (66%) of the farmers never used mastitis test, 6%
used it in the past and only 28% use it now. A high percentage (58%) of landless use
this test now followed by a mere 23% by the landowners and 17% by the tenants.
Large sized farms used more of this test (32%) than small farms (17%).
Use of Hormone for Milking: On the whole, 54% of farmers never used hormone for
milking,only 26% use it now while 20% used it in the past. However, on land
ownership basis 64% still use it now while 26% never used it and only 10% used it in
the past. Only 18% of the land owners and the tenants use it now while about the
same proportion of them never used it and used it in the past. No effect of farm size
was evident on the use of hormone for milking.
3.5.3 Non-irrigated Zone
The results of each milking practice in the non-irrigated zone are presented as follow:
Frequency of Daily Milking: On an average for the zone 73% of the farmers milked
their animals twice daily. However, 100% of tenants, 69% of land owners and 67% of
landless milked their animals twice daily. No influence of farm size was discernable
on daily milking.
Roof in the Milking Place: Very few (15%) farmers in the non-irrigated zone had
roof in their milking place. Further, none of the milking place of landless had roof.
Only 18% of tenants and 17% of land owners had roof in their milking places. No
influence of farm size on the presence of roof in milking place was visible.
Clean Udder: Nearly three fourth (74%) of the farmers in the zone cleaned the
udders of their animals before milking. On land ownership basis, this varied from a
high of 80% for the land owners to a low of 59% for the landless and 60% for the
tenants. Large sized farms had 95% clean udders compared to 62% in small farms.
Use of Filters: Only about one third (30%) of the farmers used filters for milking.
Use of filters was practiced by 20% to33% by the three categories of farmers on land

Appendix C - 21
ownership basis. No influence of farm size was noticed on the use of filters for
milking.
Mastitis Test: On the whole, only 12% farmers use mastitis test while 6% used it in
the past and 82% never used this test. Tenant farmers never used this test nor use it
now. However, only 20% landless farmers and 13% land owners use this test. This
practice was much less in large farms (5%) as compared to that in medium sized
farms (15%).
Use of Hormone for Milking: On the whole, only 6% of farmers use the hormone,
86% never used it and 6% used it in the past. Tenant farmers were the major users of
hormone (22%) followed by landless (10%) and land owners (3%). Large farms did
not use it compared to 18% by the small farms.
3.6 Comparison of Cattle and Buffaloes
The respondents were asked to compare cattle with buffaloes on the following four
aspects of these animals:
1. Easier to manage
2. More milk production
3. Faster growth
4. Easier reproduction
The results of their responses are presented as follows:
3.6.1 Overall Situation
Easier to Manage: Cattle were reported to be slightly easier to manage (47%) than
buffaloes (44%). However, landless farmers considered buffaloes to be easier to
manage (59%) than cattle even though the tenants and landowners thought otherwise
with cattle preferred by 51% and 49% respectively. Size of the farm did not affect the
preference for cattle.
More Milk Production: Buffaloes were preferred by a wide margin with 83% farmers
choosing them for greater milk production. All the landless, tenants and the land
owners found buffaloes to be better for more production (63%, 86% and 86%
respectively). The farm size did not seem to affect the choice of buffaloes.
Faster Growth: Cattle were the choice for faster growth with 65% choosing this
species. All the 3 land ownership types voted almost similarly. Farm size did not
reflect differently.
Easier Reproduction: On the whole, the buffaloes got slightly more support with 38%
followed by 31% for cattle and 29% thought both the species to be similar in matters
of reproduction. Farm size did not seem to influence the choices.
3.6.2 Irrigated Zone
Easier to Manage: On the whole, 50% of farmers thought buffaloes to be easier to
manage against 41% for cattle with 8% considering no difference between the two
species. On the land ownership basis, the landless preferred buffaloes by a wider
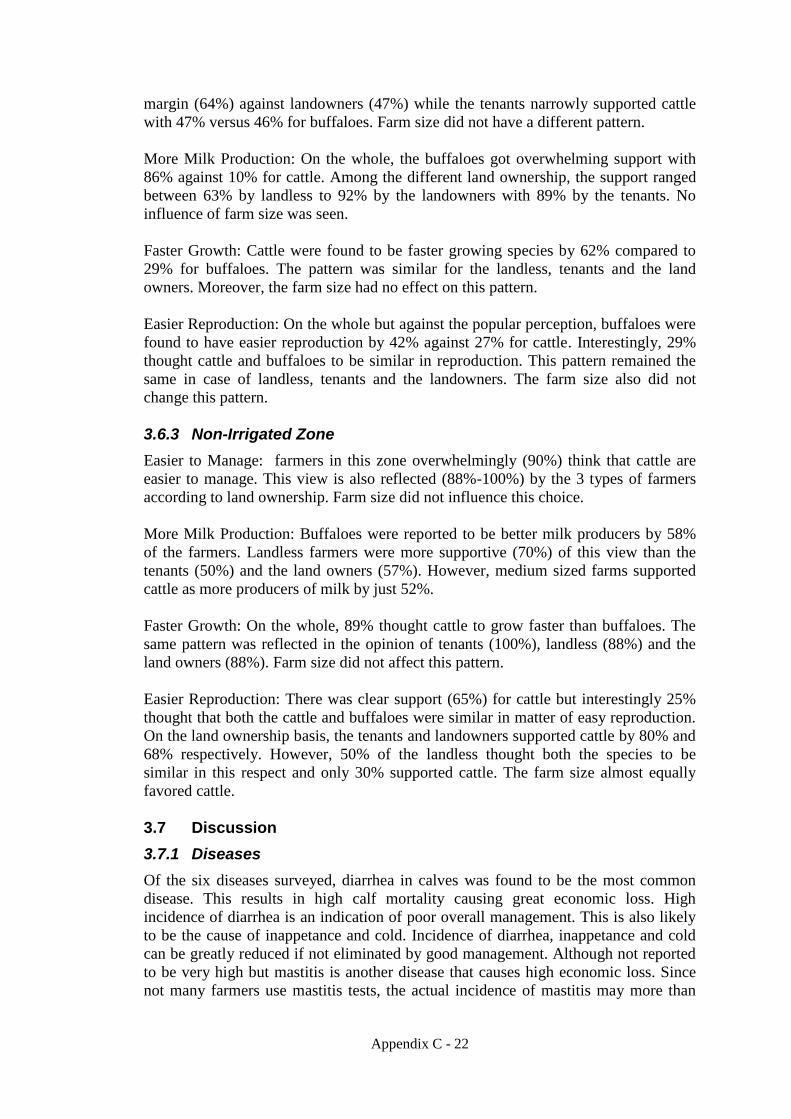
Appendix C - 22
margin (64%) against landowners (47%) while the tenants narrowly supported cattle
with 47% versus 46% for buffaloes. Farm size did not have a different pattern.
More Milk Production: On the whole, the buffaloes got overwhelming support with
86% against 10% for cattle. Among the different land ownership, the support ranged
between 63% by landless to 92% by the landowners with 89% by the tenants. No
influence of farm size was seen.
Faster Growth: Cattle were found to be faster growing species by 62% compared to
29% for buffaloes. The pattern was similar for the landless, tenants and the land
owners. Moreover, the farm size had no effect on this pattern.
Easier Reproduction: On the whole but against the popular perception, buffaloes were
found to have easier reproduction by 42% against 27% for cattle. Interestingly, 29%
thought cattle and buffaloes to be similar in reproduction. This pattern remained the
same in case of landless, tenants and the landowners. The farm size also did not
change this pattern.
3.6.3 Non-Irrigated Zone
Easier to Manage: farmers in this zone overwhelmingly (90%) think that cattle are
easier to manage. This view is also reflected (88%-100%) by the 3 types of farmers
according to land ownership. Farm size did not influence this choice.
More Milk Production: Buffaloes were reported to be better milk producers by 58%
of the farmers. Landless farmers were more supportive (70%) of this view than the
tenants (50%) and the land owners (57%). However, medium sized farms supported
cattle as more producers of milk by just 52%.
Faster Growth: On the whole, 89% thought cattle to grow faster than buffaloes. The
same pattern was reflected in the opinion of tenants (100%), landless (88%) and the
land owners (88%). Farm size did not affect this pattern.
Easier Reproduction: There was clear support (65%) for cattle but interestingly 25%
thought that both the cattle and buffaloes were similar in matter of easy reproduction.
On the land ownership basis, the tenants and landowners supported cattle by 80% and
68% respectively. However, 50% of the landless thought both the species to be
similar in this respect and only 30% supported cattle. The farm size almost equally
favored cattle.
3.7 Discussion
3.7.1 Diseases
Of the six diseases surveyed, diarrhea in calves was found to be the most common
disease. This results in high calf mortality causing great economic loss. High
incidence of diarrhea is an indication of poor overall management. This is also likely
to be the cause of inappetance and cold. Incidence of diarrhea, inappetance and cold
can be greatly reduced if not eliminated by good management. Although not reported
to be very high but mastitis is another disease that causes high economic loss. Since
not many farmers use mastitis tests, the actual incidence of mastitis may more than

Appendix C - 23
found here. This can also be prevented with appropriate measures like improved
hygiene and regular diagnostic tests.
3.7.2 Service Providers for Treatment of Diseases
It is a matter of serious concern that the major service provider for the treatment of
diseases is the farmer himself. Knowing that the vast majority of farmers are illiterate
makes the situation more serious and grave.

Appendix C - 24
4. Financial and Economic Aspects of Livestock Holders
The section highlights the financial and economic aspects of the 717 sampled
households. The information gathered from households has been classified across
categories of agricultural land ownership pattern and variations across size categories
of the livestock maintained. The sub-sections provide information on such aspects as
distribution across households, animals; levels of milk productivity, consumption and
sales, and incomes generated from agriculture.
4.1 Households
The distribution of sampled households across 8 districts is provided by Table 4.1.
Table - 4.1
Sampled Households by District across Different Categories
(Percentage)
Karachi Badin Sukkur Larkana Tando
Allahyar Sanghar Tharparkar
Jamshoro
Total
Irrigated Land Owner 1.1% 6.0% 4.2% 7.3% 7.9% 6.6% 0.0% 0.0% 33.1%
Tenant 0.6% 3.2% 3.2% 3.8% 3.2% 3.3% 0.0% 0.0% 17.3%
Owner-cum-Tenants 0.1% 2.5% 4.3% 0.8% 0.4% 1.8% 0.0% 0.0% 10.0%
Non-Farmer 0.1% 0.8% 0.8% 0.7% 0.8% 0.7% 0.0% 0.0% 4.0%
Total 2.0% 12.6% 12.6% 12.6% 12.4% 12.4% 0.0% 0.0% 64.4%
Non-Irrigated
Land Owner 1.4% 0.0% 0.0% 0.0% 0.0% 0.0% 6.6% 6.8% 14.8%
Tenant 0.4% 0.0% 0.0% 0.0% 0.0% 0.0% 1.7% 2.0% 4.0%
Owner-cum-Tenants 0.1% 0.0% 0.0% 0.0% 0.0% 0.0% 1.8% 0.4% 2.4%
Non-Farmer 2.2% 0.0% 0.0% 0.0% 0.0% 0.0% 2.5% 3.3% 8.1%
Total 4.2% 0.0% 0.0% 0.0% 0.0% 0.0% 12.6% 12.6% 29.3%
Karachi Cattle Colony 6.3% 0.0% 0.0% 0.0% 0.0% 0.0% 0.0% 0.0% 6.3%
Total 12.4% 12.6% 12.6% 12.6% 12.4% 12.4% 12.6% 12.6% 100%
Table 4.2 highlights the distribution of sampled households which are categorized into
large, medium and small holders of livestock (Dairy and Goat/Sheep)
Table – 4.2
Sampled Households across Categories of Livestock in Irrigated Area* (% against total sample households)
Goat and Sheep
Large Medium Small No goat and
sheep Total
Dairy
(Cow and
Buffalo)
Large 1% 2% 8% 6% 17%
Medium 0% 0% 13% 12% 25%
Small 0% 0% 32% 23% 55%
No Dairy 0% 0% 3% 0% 4%
Total 1% 2% 55% 41% 100%

Appendix C - 25
Table – 4.3
Sampled Households across Categories of Livestock in Non-irrigated Area* (% against total sample households)
Goat and Sheep
Large Medium Small No goat and
sheep Total
Dairy
(Cow and
Buffalo)
Large 2% 2% 2% 6% 13%
Medium 0% 3% 7% 9% 19%
Small 1% 3% 21% 4% 30%
No Dairy 1% 12% 25% 0% 39%
Total 5% 20% 56% 19% 100%
* Categories refer to weighted size of animal herds.
Animal categories were determined as follows:
1. Dairy Animals (All Cows and Buffaloes)
Large = More Then 10 Animals
Medium = 6 To 10 Animals
Small = 1 To 5 Animals
2. Goats and Sheep Large = More than 70
Medium = 31-70
Small = 1-30
The tables above show that many of the sample households own both dairy animals
and sheep/goats. In the irrigated area, 96% of sample households own dairy animals,
whereas 59% of sample households own sheep/goats. In the non-irrigated area, 61%
of sample households own dairy animals but 81% of them own sheep/goat.
Most of the sample households are small or medium size holders of dairy animals or
sheep/goat, and the number of large size farmers is very small.
4.2 Animals
Table 4-4 provides information on the average number of animals held by sampled
households across different categories. It shows that the size of livestock holding is
extremely large for the farmers of Karachi cattle colonies compared to other farmers.
The average number of buffalo holding is larger in the irrigated than non-irrigated
area. However, the average number of goat and sheep holding is larger in the non-
irrigated area than irrigated area. The number of cattle holding is a little larger in the
non-irrigated area.
Also, the average number of livestock holding is generally larger for the landholders
(landowner and owner-cum-tenants) than landless farmers (tenants and non-farm).

Appendix C - 26
Table – 4.4
Average Number of Animal Holdings (Numbers)
Buffalo Cattle Goat Sheep Animal Unit
Karachi Cattle Colony 113 39 1 0 135
Irrigated 6 3 8 2 9
Landowner 8 4 10 2 12
Owner-cum-tenant 6 4 6 0 8
Tenant 3 1 3 0 4
Non-farm 4 1 8 7 6
Non-irrigated 3 5 30 7 10
Landowner 5 6 27 8 13
Owner-cum-tenant 4 5 20 5 10
Tenant 0 2 26 2 5
Non-farm 0 1 32 5 4
4.3 Milk Productivity and Sale Pattern
Tables 4.5 to 4.9 provide information on herds of milk productivity, consumption and
pattern of sale.
Table – 4.5
Milk Productivity by Dairy Animals across Size Categories (# Liters per Day per )
Cattle and Buffalo
Large Medium Small
Irrigated
Land Owner 4.7 4.5 4.3
Tenant 3.9 3.0 4.2
Owner-cum-Tenants 5.5 3.0 3.9
Non-Farmer 3.6 0 4.8
Non-Irrigated
Land Owner 3.2 3.3 2.9
Tenant 3.8 3.5 3.5
Owner-cum-Tenants 3.0 3.3 3.6
Non-Farmer 4.2 5.8 5.3
Karachi Cattle Colony 8.00 0 0
A macro level picture of Pakistan’s position in relation to major producing countries
in terms of milk productivity was discussed in section 1 of this report.
The irrigated farms have a higher productivity level of milk of dairy animals as a
result of a more assured supply of fodder. However, the Karachi Cattle Colony shows
nearly twice the level of milk productivity. The associated reasons for such a high
levels include a better feed provision and a comprehensive animal health care system.

Appendix C - 27
Table – 4.6
Proportion of Self Consumption of Milk in the Total Production across Size Categories (Percentage)
Cattle and Buffalo
Large Medium Small
Irrigated
Land Owner 61.6 55.0 69.0
Tenant 82.5 20.0 70.5
Owner-cum-Tenants 68.8 70.7 70.4
Non-Farmer 74.8 0 48.4
Non-Irrigated
Land Owner 66.5 57.1 78.4
Tenant 81.7 100 81.8
Owner-cum-Tenants 100 100 90.5
Non-Farmer 67.8 22.4 51.7
Karachi Cattle Colony 1.8 0 0
Table 469 shows the extent to which the produced milk is consumed with the
household. On average, over half of the production is consumed within the household.
The non-farmers reported a somewhat lower range of self consumption. The Karachi
Cattle Colony showed almost negligible proportion of self consumption.
Table – 4.7
Milk Sold to Different Markets (Large Dairy Farmers) (Percentages)
Large Category Cattle and Buffalo
Self Consumed
Sold Companie
s Whole-salers
Shops Others
Irrigated Land Owner 61.57 38.43 4.66 11.65 8.15 13.97 Tenant 82.55 17.45 0 0 0 17.45 Owner-cum-Tenants 68.76 31.24 10.41 10.41 0 10.41 Non-Farmer 74.85 25.15 1.40 1.40 19.56 2.79 Non-Irrigated Land Owner 66.47 33.53 0 17.65 12.35 3.53 Tenant 81.71 18.29 18.29 0 0 0 Owner-cum-Tenants 100 0 0 0 0 0 Non-Farmer 67.79 32.21 0 1.89 26.52 3.79 Karachi Cattle Colony 1.76 98.24 10.34 51.70 36.19 0
Table 4.7 shows the pattern of consumption of large dairy farmers and sale of milk to
different sources. The pattern shows that dairy milk is largely sold to wholesales and
shops.
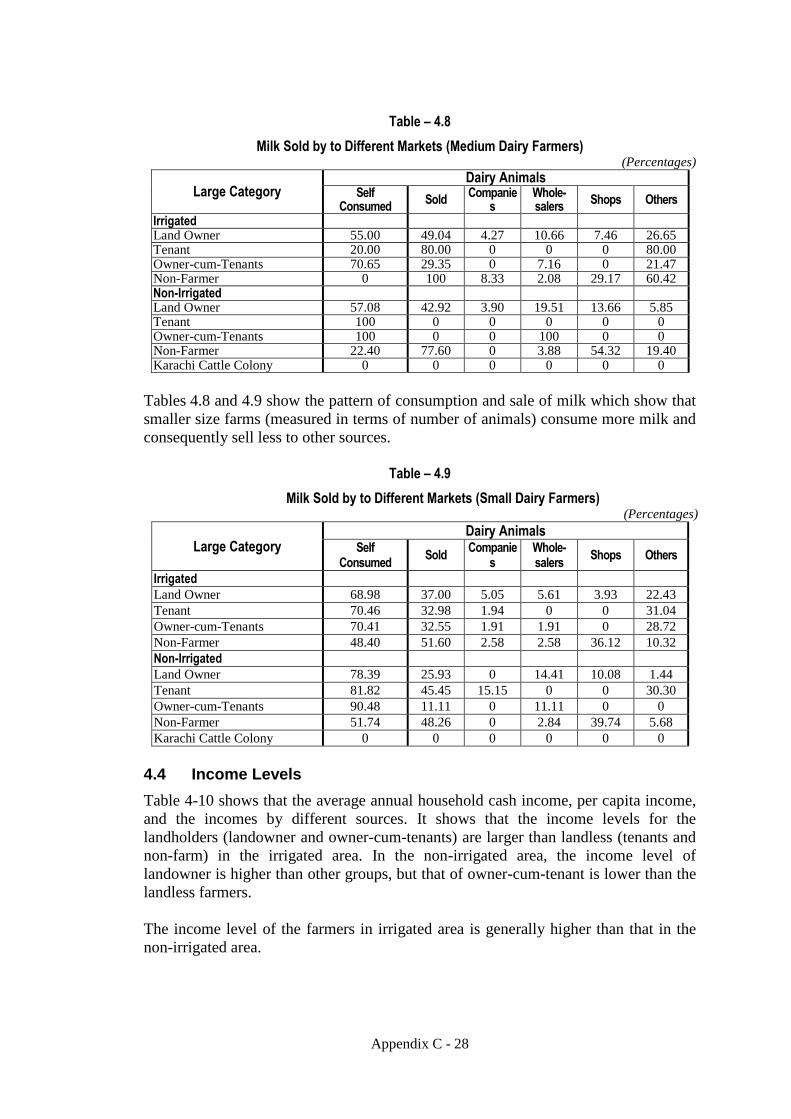
Appendix C - 28
Table – 4.8
Milk Sold by to Different Markets (Medium Dairy Farmers) (Percentages)
Large Category Dairy Animals
Self Consumed
Sold Companie
s Whole-salers
Shops Others
Irrigated Land Owner 55.00 49.04 4.27 10.66 7.46 26.65 Tenant 20.00 80.00 0 0 0 80.00 Owner-cum-Tenants 70.65 29.35 0 7.16 0 21.47 Non-Farmer 0 100 8.33 2.08 29.17 60.42 Non-Irrigated Land Owner 57.08 42.92 3.90 19.51 13.66 5.85 Tenant 100 0 0 0 0 0 Owner-cum-Tenants 100 0 0 100 0 0 Non-Farmer 22.40 77.60 0 3.88 54.32 19.40 Karachi Cattle Colony 0 0 0 0 0 0
Tables 4.8 and 4.9 show the pattern of consumption and sale of milk which show that
smaller size farms (measured in terms of number of animals) consume more milk and
consequently sell less to other sources.
Table – 4.9
Milk Sold by to Different Markets (Small Dairy Farmers) (Percentages)
Large Category Dairy Animals
Self Consumed
Sold Companie
s Whole-salers
Shops Others
Irrigated
Land Owner 68.98 37.00 5.05 5.61 3.93 22.43
Tenant 70.46 32.98 1.94 0 0 31.04
Owner-cum-Tenants 70.41 32.55 1.91 1.91 0 28.72
Non-Farmer 48.40 51.60 2.58 2.58 36.12 10.32
Non-Irrigated
Land Owner 78.39 25.93 0 14.41 10.08 1.44
Tenant 81.82 45.45 15.15 0 0 30.30
Owner-cum-Tenants 90.48 11.11 0 11.11 0 0
Non-Farmer 51.74 48.26 0 2.84 39.74 5.68
Karachi Cattle Colony 0 0 0 0 0 0
4.4 Income Levels
Table 4-10 shows that the average annual household cash income, per capita income,
and the incomes by different sources. It shows that the income levels for the
landholders (landowner and owner-cum-tenants) are larger than landless (tenants and
non-farm) in the irrigated area. In the non-irrigated area, the income level of
landowner is higher than other groups, but that of owner-cum-tenant is lower than the
landless farmers.
The income level of the farmers in irrigated area is generally higher than that in the
non-irrigated area.

Appendix C - 29
Table – 4.10
Income Level of Household for Different Source (Rs.)
Total Cash
Income
Per
Capita
Income
Agriculture
Cash
Income
Livestock
Cash Income
Wages
and
Salaries
Colony 1,625,644 140,030 0 1,592,933 14,667
Irrigated 314,035 30,073 233,919 -8,796 57,504
Landowner 425,350 40,211 343,351 -13,635 64,051
Owner-cum-tenant 275,180 21,077 167,014 1,402 59,129
Tenant 168,079 19,659 118,318 -11,030 38,573
Non-farm 124,886 14,092 0 14,976 80,905
Non-irrigated 175,392 18,972 63,020 69,050 37,102
Landowner 203,327 22,428 94,583 58,888 43,698
Owner-cum-tenant 108,091 10,585 65,079 -3,512 39,971
Tenant 116,333 12,356 72,481 12,541 28,621
Non-farm 173,593 18,423 0 137,147 28,448
Total 355,747 33,723 169,184 114,531 48,840
Table 4.11 shows the decomposition of income into the sources. Large part of the
incomes for the landholders comes from agricultural activities. It is interesting to see
that the livestock activities are in red for many farmers in the irrigated area, whereas
farmers in the non-irrigated area generate profit from livestock activities except for
owner-cum-tenants.
Table – 4.11
Income Source as a Ratio of Total Income (Percentage)
Agriculture
Cash Income
Livestock
Cash Income
Wages and
Salaries Other
Colony 0% 98% 1% 1%
Irrigated 74% -3% 18% 10%
Landowner 81% -3% 15% 7%
Owner-cum-tenant 61% 1% 21% 17%
Tenant 70% -7% 23% 13%
Non-farm 0% 12% 65% 23%
Non-irrigated 36% 39% 21% 4%
Landowner 47% 29% 21% 3%
Owner-cum-tenant 60% -3% 37% 6%
Tenant 62% 11% 25% 2%
Non-farm 0% 79% 16% 5%
Total 48% 32% 14% 7%

Appendix C - 30
4.6 Fodder Shortages
Information was gathered from the respondents on a month-wise shortage of fodder.
Tables 4.12 and 4.13 show the month-wise pattern of fodder shortages for dairy
animals and goats and sheep, respectively.
Table – 4.12
Month Wise Reported Fodder Shortage (Cattle and Buffalo) (% of Households against Total HH)
Total # of HH
Jan Feb March April May Jun Jul Aug Sep Oct Nov Dec
Irrigated
Land Owner 237 22% 8% 5% 18% 24% 35% 31% 12% 4% 13% 32% 27%
Tenant 124 32% 16% 10% 15% 19% 29% 30% 13% 7% 13% 32% 35%
Owner-cum-Tenants 72 25% 13% 10% 18% 19% 21% 17% 6% 0% 8% 38% 33%
Non-Farmer 29 34% 24% 21% 21% 28% 41% 41% 17% 17% 21% 38% 38%
Non-Irrigated
Land Owner 106 28% 24% 18% 19% 36% 42% 34% 8% 4% 7% 10% 17%
Tenant 29 17% 14% 7% 7% 24% 28% 24% 7% 0% 3% 7% 10%
Owner-cum-Tenants 17 12% 6% 0% 12% 47% 71% 71% 6% 0% 6% 12% 12%
Non-Farmer 58 38% 31% 7% 2% 9% 16% 10% 2% 0% 10% 26% 31% Karachi Cattle Colony
45 33% 16% 0% 0% 0% 0% 0% 0% 4% 22% 33% 33%
It appears that months of January, April, May, June, November and December
experience fodder shortages, particularly at owned farm in both irrigated and
un-irrigated areas. This pattern is also evident from Table 4.13 which provides
information on goat and sheep farms.
Table – 4.13
Month Wise Reported Fodder Shortage (Goats and Sheep) (% of Households against Total HH)
Total # of HH
Jan Feb March April May Jun Jul Aug Sep Oct Nov Dec
Irrigated Land Owner 237 21% 10% 5% 18% 16% 15% 10% 4% 3% 8% 28% 24%
Tenant 124 28% 15% 7% 10% 11% 10% 9% 4% 3% 6% 20% 24%
Owner-cum-Tenants 72 21% 10% 3% 8% 13% 10% 8% 3% 0% 7% 26% 21%
Non-Farmer 29 28% 17% 10% 10% 10% 14% 14% 10% 10% 10% 24% 31%
Non-Irrigated
Land Owner 106 25% 19% 16% 27% 74% 87% 75% 14% 9% 12% 19% 25%
Tenant 29 48% 28% 21% 17% 52% 62% 48% 7% 7% 17% 17% 34%
Owner-cum-Tenants 17 24% 18% 12% 41% 76% 118% 94% 18% 0% 0% 12% 12%
Non-Farmer 58 16% 12% 7% 26% 52% 66% 50% 7% 5% 7% 7% 16%
Karachi Cattle Colony 45 0% 0% 0% 0% 0% 0% 0% 0% 0% 0% 0% 0%
4.7 Fattening of Animals
As evident from earlier tables on animal population, the enterprise of animal fattening
was limited. Tables 4.19 to 4.25 show different facts of animal fattening.
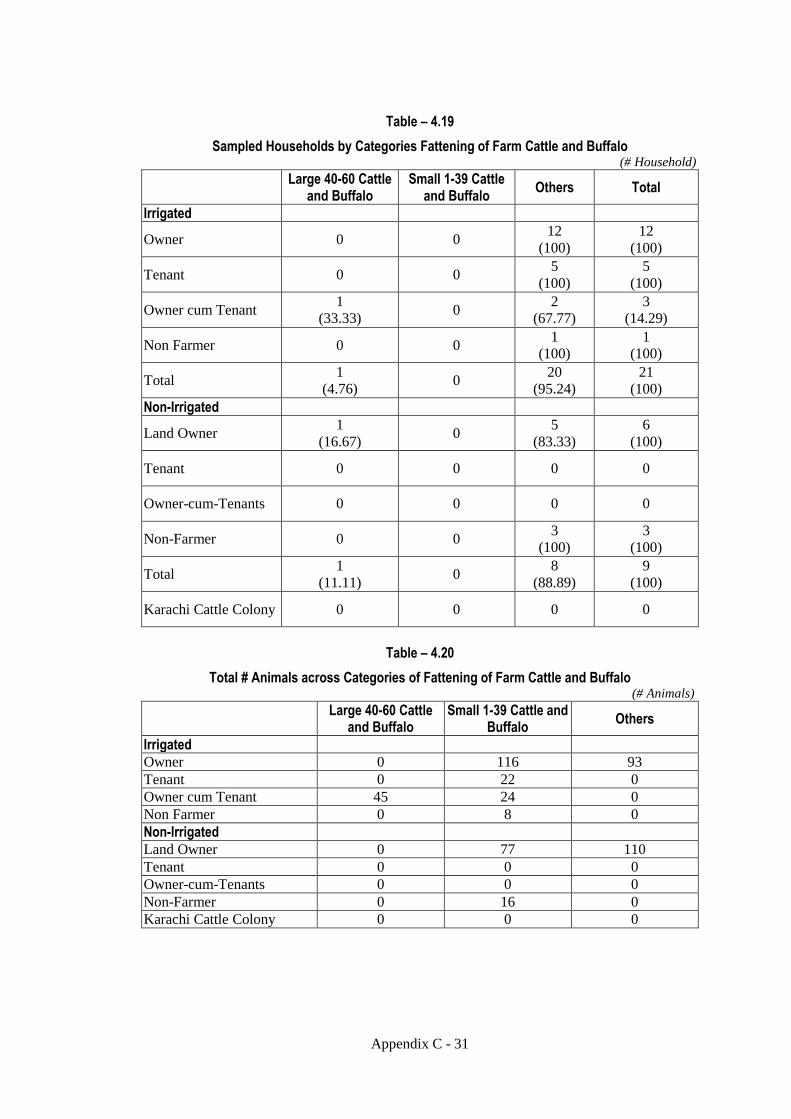
Appendix C - 31
Table – 4.19
Sampled Households by Categories Fattening of Farm Cattle and Buffalo (# Household)
Large 40-60 Cattle
and Buffalo Small 1-39 Cattle
and Buffalo Others Total
Irrigated
Owner 0 0 12
(100)
12
(100)
Tenant 0 0 5
(100)
5
(100)
Owner cum Tenant 1
(33.33) 0
2
(67.77)
3
(14.29)
Non Farmer 0 0 1
(100)
1
(100)
Total 1
(4.76) 0
20
(95.24)
21
(100)
Non-Irrigated
Land Owner 1
(16.67) 0
5
(83.33)
6
(100)
Tenant 0 0 0 0
Owner-cum-Tenants 0 0 0 0
Non-Farmer 0 0 3
(100)
3
(100)
Total 1
(11.11) 0
8
(88.89)
9
(100)
Karachi Cattle Colony 0 0 0 0
Table – 4.20
Total # Animals across Categories of Fattening of Farm Cattle and Buffalo (# Animals)
Large 40-60 Cattle
and Buffalo Small 1-39 Cattle and
Buffalo Others
Irrigated
Owner 0 116 93
Tenant 0 22 0
Owner cum Tenant 45 24 0
Non Farmer 0 8 0
Non-Irrigated
Land Owner 0 77 110
Tenant 0 0 0
Owner-cum-Tenants 0 0 0
Non-Farmer 0 16 0
Karachi Cattle Colony 0 0 0

Appendix C - 32
Table – 4.21 Average Number of Animals across Categories of Fattening of Farm Cattle and Buffalo
(# Animals / Household)
Large 40-60 Cattle
and Buffalo Small 1-39 Cattle and
Buffalo Others
Irrigated
Owner 17.20 6.68 3.13
Tenant 2.03 10.00 2.64
Owner cum Tenant 11.80 7.00 3.03
Non Farmer 1.96 0 3.68
Non-Irrigated
Land Owner 27.69 6.65 2.90
Tenant 8.43 5.60 3.36
Owner-cum-Tenants 1.00 5.90 2.28
Non-Farmer 12.25 7.56 3.54
Table – 4.22
Total Income from All Sources across Categories of Fattening of Farm Cattle and Buffalo (Pak. Rs./Household)
Large 40-60 Cattle
and Buffalo Small 1-39 Cattle and
Buffalo Others
Irrigated
Owner 1,737,420 0 13,352,741
Tenant 384,598 0 0
Owner cum Tenant 2,308,660 2,394,721 0
Non Farmer 42,848 0 0
Non-Irrigated
Land Owner 0 2,222,308 10,043,773
Tenant 0 0 0
Owner-cum-Tenants 0 0 0
Non-Farmer 0 350,220 0
Table – 4.23
Income from Livestock As A Ratio of Total Income across Categories of Fattening of Farm Cattle and Buffalo
(Percentages)
Large 40-60 Cattle
and Buffalo Small 1-39 Cattle and
Buffalo Others
Irrigated Owner 0 35 11
Tenant 0 38 0
Owner cum Tenant 22 31 0
Non Farmer 0 100 0
Non-Irrigated
Land Owner 0 63 58
Tenant 0 0 0
Owner-cum-Tenants 0 0 0
Non-Farmer 0 100 100

Appendix C - 33
Table – 4.24
Net Income from Agriculture as a Ratio of Total Income Across Categories of Fattening of Farm Cattle and Buffalo
(Pak. Rs.)
Large 40-60 Cattle
and Buffalo Small 1-39 Cattle and
Buffalo Others
Irrigated
Owner 0 37 42
Tenant 0 0 0
Owner cum Tenant 0 0 0
Non Farmer 0 0 0
Non-Irrigated
Land Owner 0 0 0
Tenant 0 0 0
Owner-cum-Tenants 0 0 0
Non-Farmer 0 0 0
Table – 4.25
Value of Livestock Assets across Categories of Fattening of Farm Cattle and Buffalo
(Pak. Million Rs.)
Large 40-60 Cattle
and Buffalo Small 1-39 Cattle and
Buffalo Others
Irrigated
Owner 1,233 0 18,140
Tenant 608 0 0
Owner cum Tenant 893 1,385 0
Non Farmer 492 0 0
Non-Irrigated
Land Owner 0 4,002 22,864
Tenant 0 0 0
Owner-cum-Tenants 0 0 0
Non-Farmer 0 795 0

Appendix C - 34
5. Factors Affecting Livestock Development in Sindh
5.1 Relationship between Crop Cultivation & Livestock Activities
The different levels of income generated through cropping and livestock activities,
presented in terms of quintiles, were examined to ascertain any pattern that may have
existed between these activities. Table 5.1 shows patterns of distribution of income
generated from these sources. It reflects that the farm households associated with the
lowest quintiles of both crop income and livestock are strongly interlinked in terms of
the proportion of sampled households.
Table – 5.1
Relationship between Cropping and Livestock Activities
Crop Income Quintiles Quintile-1 Quintile-2 Quintile-3 Quintile-4 Quintile-5 Total
Quintile-1 29 18 18 22 57 144
Quintile-2 53 31 24 29 7 144
Quintile-3 28 45 30 28 13 144
Quintile-4 25 31 45 24 18 143
Quintile-5 9 19 27 40 47 142
Total 144 144 144 143 142 717
0
10
20
30
40
50
60
Quintile-1 Quintile-2 Quintile-3 Quintile-4 Quintile-5
Chart - 5.1
Quintile-1 Quintile-2 Quintile-3 Quintile-4 Quintile-5
It is evident that lowest income quintile of livestock income is gradually related to
higher and then lower number of farms as crop income levels shifts to higher quintiles,
i.e. from 29 to 9. Similarly in case of the lowest income quintile of crop income, the
gradual shift towards higher quintiles of livestock income the number of households
initially decline and move upwards i.e. from 29 to 57.
The trends so depicted show that the income initially show inverse relationship
between their reflecting substitution effect. However, towards higher income
quintiles the income levels co-very reflecting complimentarity between the two
sources.

Appendix C - 35
5.2 Milk Productivity – Fodder Shortage Interface
The variability in milk productivity levels were related to fodder shortages across
different months as reported by farm households to judge the extent to which these
factors are related.
Table – 5.2
Levels of Fodder Shortages across Months and Categories of Milk Productivity (Sheep)
Average Sheep Milk Productivity
Jan Feb Mar Apr May Jun Jul Aug Nov Dec
.13 - .5 6 3 3 5 9 11 10 2 5 6
.51 - 1 2 2 1 3 4 4 2 0 1 2
1+ 0 0 0 1 1 1 0 0 0 1
0
2
4
6
8
10
12
Jan Feb Mar Apr May Jun Jul Aug Nov Dec
Chart - 5.2
.13 - .5 .51 - 1 1+
The information on fodder shortages were related to various categories of milk
productivity of large and smaller animals. Table shows that those who had higher
milk productivity had lower proportions of farmers complaining for fodder shortages.
Similarly those with low productivity of milk had higher proportion of farms.
Table – 5.3
Levels of Fodder Shortages across Months and Categories of Milk Productivity (Goat)
Average Goat Milk Productivity
Jan Feb Mar Apr May Jun Jul Aug Sep Oct Nov Dec
.13 - .5 44 16 14 28 54 69 55 11 10 25 41 43
.51 - 1 38 19 15 36 52 52 45 10 4 6 34 43
1+ 5 1 0 2 7 8 6 1 1 2 7 7
Total 87 36 29 66 113 129 106 22 15 33 82 93

Appendix C - 36
0
10
20
30
40
50
60
70
Jan Feb Mar Apr May Jun Jul Aug Sep Oct Nov Dec
Chart - 5.3
.13 - .5 .51 - 1 1+
The charts to depict such tendencies. The month of January, May, June, July,
November and December seem critical months when fodder remains short and milk
productivity is kept at low levels. The relationship seem equally valid for all type of
milk and hence appear as the most critical issues facing the livestock sub-sector in
Sindh.
Table – 5.4
Levels of Fodder Shortages across Months and Categories of Milk Productivity (Cattle & Buffaloe)
Average Cow and Buffalo Milk Productivity
Jan Feb March April May Jun Jul Aug Sep Oct Nov Dec
.5 - 2 25 13 14 30 47 50 39 10 3 8 26 21
2.01 - 5 92 44 26 45 65 85 77 25 13 34 88 95
5.01 - 10 56 37 13 16 31 52 49 19 6 28 55 59
10+ 3 4 2 1 0 2 2 0 0 2 4 4
0
20
40
60
80
100
Jan Feb Mar Apr May Jun Jul Aug Sep Oct Nov Dec
Chart - 5.4
.5 - 2 2.01 - 5 5.01 - 10 10+
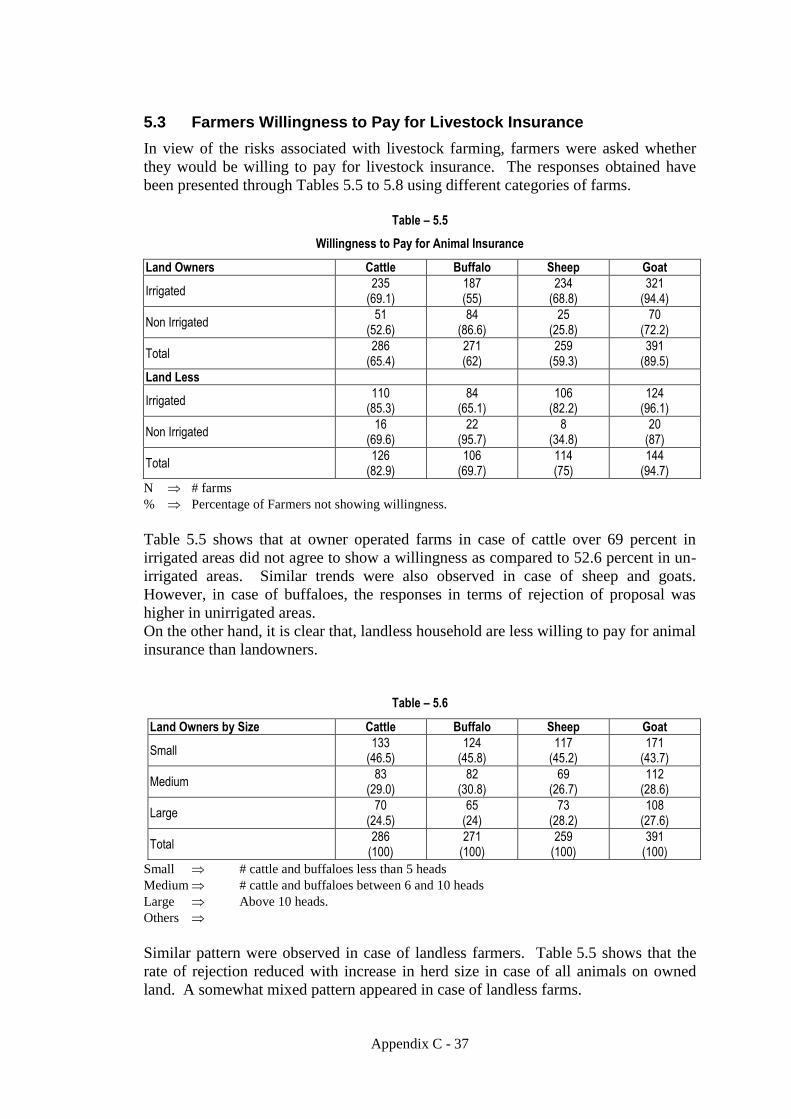
Appendix C - 37
5.3 Farmers Willingness to Pay for Livestock Insurance
In view of the risks associated with livestock farming, farmers were asked whether
they would be willing to pay for livestock insurance. The responses obtained have
been presented through Tables 5.5 to 5.8 using different categories of farms.
Table – 5.5
Willingness to Pay for Animal Insurance
Land Owners Cattle Buffalo Sheep Goat
Irrigated 235
(69.1) 187 (55)
234 (68.8)
321 (94.4)
Non Irrigated 51
(52.6) 84
(86.6) 25
(25.8) 70
(72.2)
Total 286
(65.4) 271 (62)
259 (59.3)
391 (89.5)
Land Less
Irrigated 110
(85.3) 84
(65.1) 106
(82.2) 124
(96.1)
Non Irrigated 16
(69.6) 22
(95.7) 8
(34.8) 20
(87)
Total 126
(82.9) 106
(69.7) 114 (75)
144 (94.7)
N # farms
% Percentage of Farmers not showing willingness.
Table 5.5 shows that at owner operated farms in case of cattle over 69 percent in
irrigated areas did not agree to show a willingness as compared to 52.6 percent in un-
irrigated areas. Similar trends were also observed in case of sheep and goats.
However, in case of buffaloes, the responses in terms of rejection of proposal was
higher in unirrigated areas.
On the other hand, it is clear that, landless household are less willing to pay for animal
insurance than landowners.
Table – 5.6
Land Owners by Size Cattle Buffalo Sheep Goat
Small 133
(46.5) 124
(45.8) 117
(45.2) 171
(43.7)
Medium 83
(29.0) 82
(30.8) 69
(26.7) 112
(28.6)
Large 70
(24.5) 65
(24) 73
(28.2) 108
(27.6)
Total 286
(100) 271
(100) 259
(100) 391
(100)
Small # cattle and buffaloes less than 5 heads
Medium # cattle and buffaloes between 6 and 10 heads
Large Above 10 heads.
Others
Similar pattern were observed in case of landless farmers. Table 5.5 shows that the
rate of rejection reduced with increase in herd size in case of all animals on owned
land. A somewhat mixed pattern appeared in case of landless farms.

Appendix C - 38
Table – 5.7
Land Less Cattle Buffalo Sheep Goat
Small 85
(86.7) 68
(69.4) 82
(83.7) 94
(95.9)
Medium 16
(59.3) 13
(48.1) 18
(66.7) 26
(96.3)
Large 2
(66.7) 2
(66.7) 3
(100) 3
(100)
Other 23
(95.8) 23
(95.8) 11
(45.8) 21
(87.5)
Total 126
(82.9) 106
(69.7) 114 (75)
144 (94.7)
Small # cattle and buffaloes less than 5 heads
Medium # cattle and buffaloes between 6 and 10 heads
Large Above 10 heads.
On the whole it appears that landless households are less willing to pay for insurance
than landowners. Also, small farmers show higher rejection as compared to bigger
farmers. These results may suggest that livestock insurance is “luxury” good where
worse-off households tend not to be motivated to purchase.

Appendix C - 39
6. Sales of Milk
Figure 6-1 shows the relationship between the total production of milk and propensity to sell
milk for households in the irrigated area with each landholding status of households. The data
are drawn from the results of the first household survey. The vertical axis of the table
indicates the total production of milk per day for each household and the horizontal axis
shows the percentage of milk sold to total production. From the figure, one can see that,
except for the households who do not sell milk at all, there is a positive relation between the
two variables. It indicates that the households sell the milk which is surplus to the self-
consuming portion.
Also, except for the households who do not sell milk at all, the number of households in the
quadrant 2 is very small, whereas that in quadrant 1 is quite large. This suggests that
households who produce more than 10 liters a day tend to sell large portion of milk they
produced. If one applies the average milking cattle ratio to total cattle (50%) and the average
milk production per head/day (4 litter) in this region, those who produce more than 10 liters a
day (households in quadrant 1 and 2) are almost equivalent to medium and large livestock
holders who own more than 5 cattle and/or buffaloes.
Furthermore, all the large landowners in the sample are concentrated in the far left in the table,
indicating that they do not sell milk at all regardless of the scale of their milk production.
Seemingly, these household do not take milk as a source of income as they have a large
amount of agricultural income. This can be supported by the fact that many of them give out
their milk to the poor, which was found by the fieldwork of the Project Team.
Table 6-1 depicts the distribution of each landholding group of households in terms of total
milk production and the percentage of milk sold to total production. One can see that most of
the tenants and non-farm households are in the category of producing less than 10 liters a day.
Also, the ratio of households who produce more than 10 liters a day tends to be larger for
larger landowners.
0
5
10
15
20
25
30
35
40
45
50
55
60
65
70
0% 20% 40% 60% 80% 100%
Large Landowners
Micro to Medium
Landholders
Tenants
Non-farm Livestock
Holders
12
3 4
Litter per day
% of sold/total

Appendix C - 40
0-50 % 51-100% Total
More than 10 liter a day 43 81 124
Large Landowner 10
10
Medium Landowner 6 12 18
Small Landowner 16 28 44
Marginal Landowner 7 27 34
Tenant 4 11 15
Non Farm Livestock
3 3
Less than 10 liter a day 220 56 276
Large Landowner 1
1
Medium Landowner 7 3 10
Small Landowner 67 11 78
Marginal Landowner 68 17 85
Tenant 70 19 89
Non Farm Livestock 7 6 13
Total 263 137 400
Figure 6-2 shows the percentage of households by propensity to sell their milk for each
range of the scale of milk production. From the figure, it is clear that most of those who
produce less than 5 liters a day do not sell their milk at all, suggesting that this amount is
an indicator for those who have surplus milk for sale. This is consistent to the finding of
the field survey by the Project Team; for the family of 8-9 members, average consumption
of milk is 5 liters a day. Furthermore, with regard to those who produce more than 10 liters
a day, which is equivalent to medium and large livestock holders, more than half of them
sell 50% or more of total produced milk.
Table 6-1 Distribution of Households in Total Milk Production and
Propensity to Sell
Figure 6-2 Percentage of households by propensity to sell for scale of milk production

Appendix C - 41
The amount of milk consumed at home and the propensity to sell may be affected by the
number of family members. However, in case for the sample households of this survey, their
propensities to sell are not influenced by the number of family members. Table 6-2 shows the
average number of family member for each category of milk production and ratio of milk sold
to total production. One cannot find a clear relation between the number of family members
and the propensity to sell milk. The findings above appear to be relevant regardless of the
number of family members as long as it is within the range of around 8 to 15, as indicated in
the table.
% of milk sold
Milk production a day
(Range, liter)
0-50 % 51-100% Total
1-5 10.3 8.4 9.1
6-10 12.8 13.3 11.3
11-15 15.3 12.7 13.1
16-20 12.9 14.0 12.2
More than 20 15.0 13.8 13.6
Table 6-2 Number of Family Member for Each Category of Milk Production and
Propensity to Sell

Appendix C - 42
7. Conclusions and Recommendations
- The livestock sub-sector in Sindh is a vital and integrated part of the
crop-sector across all its district with the exception of Karachi and
parts of Tharparkar and Jamshoro districts.
- The extensive irrigation system in the province creates the basis for the
livestock sub-sector sustenance particularly the large size animal for
whom the supply of fodder is assured by the irrigation status.
- In the rainfed areas, a dominating culture of raising sheep and goats
prevails which largely depends on natural vegetational systems.
- The sub-sector tends to province supplies of milk and meat to its
inhabitants. However, the province despite carrying a share of 23
percent in total animal population only contributes 16 percent in the
production of fodder at the national level.
- The average level of milk productivity in Sindh is higher than other
provinces. However, when compared at the international level, the
productivity level of milk from cows, sheep and goats are significantly
below the levels achieved by major producing areas in the world. Only
in case of buffalo milk, the productivity levels are highest in the world.
- A diverse social and cultural environment prevails where the livestock
raising has remained an integral part. However, the pattern followed in
keeping the livestock is largely traditional.
- The institutional framework designed to guide and support farmers
seem to have serious limitations in providing the required animal
health services to the places those are required. The role of the private
sector is extremely relevant and exists but without any policy
framework.
- There is an absence of any support from the government through fiscal
and monetary measures which may create investment incentives for the
sub-sector.
- The post-production processes adopted in the storage processing and
distribution of milk seem inefficient and the modern and scientific
arrangements have yet to emerge in most of the areas.
- The role of the livestock department is vital and extensive measures
would be required to enhance its capacity.
- An enabling environment needs to be evolved for ensuring competition
as well as collaboration with the private sector.
- A vast majority of the livestock holders seem to be ignorant about the
effectiveness of investments in livestock. A massive campaign need to
be initiated in collaboration with the private sector to guide and
support.

Appendix C - 43
- At the provincial level, these initiatives need to regularly organize
exhibitions and competitions as organized in the provinces of Punjab
and Baluchistan. In addition, representatives of the livestock holders
be sent to major institutions and markets in the world to observe and
learn new techniques of production and post-production processes for
milk and milk products.
- The system and practices of animal fattening is weak and operates on a
traditional basis which creates inefficiencies.
- The current level of complementarities between livestock and cropping
systems need to be re-examined with a market based approach without
disturbing the cultural and social network present in the area. This will
help sustain any developmental effort designed for the area.
- The most significant benefit of livestock development initiatives would
be in the form of resource generation for the poor farm households and
would help reduce the levels of rural poverty.
- Of the six diseases surveyed, diarrhea in calves was found to be the
most common disease. This results in high calf mortality causing great
economic loss. High incidence of diarrhea is an indication of poor
overall management. This is also likely to be the cause of inappetance
and cold. Incidence of diarrhea, inappetance and cold can be greatly
reduced if not eliminated by good management. Although not reported
to be very high but mastitis is another disease that causes high
economic loss. Since not many farmers use mastitis tests, the actual
incidence of mastitis may be more than found here. This can also be
prevented with appropriate measures like improved hygiene and
regular diagnostic tests.
- It is a matter of great concern that the major service provider for the
treatment of diseases is the farmer himself. Knowing that the vast
majority of farmers are illiterate makes the situation more serious and
grave. The other serious concern is the very minor role of public sector
services. The qualified veterinarian is hardly visible. The reason is that
there are so few of them. The good news is the appearance of private
paravets as the second main provider of livestock services. It seems
that he is available in villages where the animals are located
irrespective of the quality of his services. Private paravets are the
future.
- The majority of respondents chose milk production, teat and udder
types and fast growth for gene improvement of cattle and buffaloes
instead of phenotypic traits like colour, height, liveliness, etc. This is
very encouraging because these are characteristics of economic
importance.
- Old age, low production and blind teats were by and large reported to
be the reasons for culling cattle and buffaloes. These are the traits that
reflect their economic importance. These choices speak of the
awareness of the farmers.

Appendix C - 44
- It is interesting to note that while most of the farmers seem to clean the
udder of the animals before milking, the incidence of mastitis is still
fairly high. The term cleaning needs clarification. If antiseptics are not
used, it is not really cleaning the udder. Similarly, use of filter needs
clarification. Moreover, the small percentage of farmers using mastitis
tests is likely to hide the real situation about the incidence of the
disease. Fewer farmers reported using hormone for milking is against
the general perception about it.
- Whatever the general public perception about the qualities of cattle and
buffaloes in respect of the four traits surveyed here, the results seem to
be clear only in respect of milk production and faster growth. For more
milk buffalo is the animal of choice and cattle for faster growth.
- The overall perception is that irrigation brings greater resources and
prosperity that are likely to support larger herds. But that did not seem
to result in better management of animals.
- On the whole, it appears that the tenants and landless were worse off
than the landowners but not necessarily always in poor management of
animals.
- Only two recommendations are made but it is believed that these two
are very comprehensive and address the major problems revealed by
the current survey.
i) Organize a massive training/awareness program for farmers to
cover all aspects of livestock production as an enterprise. The
existing graduate veterinary staff of the livestock department
may be mobilized/trained to undertake this program on a
regular basis.
ii) Develop a cadre of village livestock workers (both men and
women) in the private sector to provide primary animal health
and production services in the rural areas.
Appendix D
Second Household Survey

Appendix D
Appendix D - 1
The Second Household Survey
1 Survey Method
(1) Overview
The second household survey aimed to capture the household economies in rural Sindh in a
detailed way. The survey was conducted in the form of interview, and questions of the interview included
all the economic activities of each household in the last 12 months, including self-consumed part of their
production of agriculture, wage or payment in kind, and gift in kind, as well as the cash revenue and
cost/expenditure of households. The non-cash items in their income and consumption were translated to
money terms using spot-sale prices, and they were included to total income and consumption expenditure
on top of the cash income and expenditure. The items in the questionnaire also included the information on
the value of their assets and liabilities such as land, livestock, building, saving, and outstanding loans, etc.
The unit value of their lands and buildings were estimated by owner’s own assessment. On the other hand,
the unit value of each type of livestock was determined by the Project Team considering the selling prices
of each type of livestock in the sample.
(2) Sampling Method
(a) Selection of villages
As one of the major objectives of this survey is to compare the livelihood among the household in
different social strata, our sampling strategy was to have large number of sample households in a limited
number of villages. Therefore, we decided to survey on one village each from Badin (irrigated area) and
Tharparkar (non-irrigated area); both districts are strategically important for livestock sector where dairy
activities are flourished in Badin and fattening of sheep and goats is prospered in Tharparkar. The following
villages were selected as sample, as the sizes of these villages are around 350-500 households, which are
typical size for the districts.
Muhammad Soomar Samejo (M.S.S) in Badin
Pabuhar in Tharparkar
(b) Selection of Sample Households
The sampling of households was made by stratified sampling method, where sampling strata
were based on the classification of Census of Agriculture of Pakistan. The categories of strata and their
definition are shown in Table D-1.

Appendix D - 2
Condition
Landowner
Large Owns more than 100 acre
Medium Owns 25-99 acre
Small Owns 5-24 acre
Marginal Holds less than 5 acres
Tenants
Non-farmer
Livestock
holder
Holds one or more
cattle/buffalo or 5 or more
goats/sheep
Other
The sample households in each stratum were extracted in proportion to the ratio of households in
each stratum to total number of household in the village. Tables D-2 and D-3 show the estimated number of
households and the sample household in each stratum in the sample villages. The estimated numbers of
households are based on the key informant interviews. The averages of their ranges were used for the
stratification.
M.S.SEstimated #
of HH
Average of
Estimated
Range
%Number of
Sample HH%
Medium Landowner 5 5 1% 2 2%
Small Landowner 45-50 48 14% 18 14%
Micro Landowner 35-40 38 11% 13 10%
Tenant 80-90 85 24% 31 25%
Non Farm Livestock Holder 100-120 110 31% 39 31%
Non Farm Other 60-70 65 19% 23 18%
Total 325-375 350 100% 126 100%
PabuharEstimated #
of HH
Average of
Estimated
Range
%Number of
Sample HH%
Large Landowner 4 4 1% 3 2%
Medium Landowner 30-40 35 7% 9 7%
Small Landowner 110-130 120 24% 29 23%
Micro Landowner 80-90 85 17% 21 17%
Tenant 250-280 265 52% 62 50%
Total 474-544 509 100% 124 100%
Table D-1 Household Category based on Census of Agriculture Classification
Table D-2 Total Number of HH and the Sample HH in each Stratum in M.S.S
Table D-3 Total Number of HH and the Sample HH in each Stratum in Pabuhar

Appendix D - 3
2 Characteristics of Sample Villages
(1) Muhammad Soomar Samejo (M.S.S) in Badin
The village is located in east Badin district and is about 5Km from Golarch town. It is faced with
a main road, and there is a natural oil field at the entrance of the village where some of the villagers work
for. The history of the village started in 1959 when the lands were allocated to 13 families of Sameja groups
as the irrigation was newly facilitated. The families of Jatt communities moved from Thatta district to the
village 5 years later as they had trouble with canal water in their homeland. Other 2 groups households
moved to the villages thereafter.
The numbers of households by endogamous and their basic description at the time of survey
(which were drawn from key informants) are shown in Table D-4.
Endogamous
Group
Number of
Households Description
Sameja 240 Non-farm group who are originally
engaged in livestock and labor
Mallah 7 Non-farm group who are originally
engaged in livestock and labor
Jatt 110
Non-farm group who are originally
engaged in livestock activities
(especially camels)
Khaskheli 10 Non-farm group who are originally
engaged in fishing
There is one primary school for boys and one for girls in the village. Majority of the village claim
that the biggest problem of the village is the low level of education.
(2) Pabuhar in Tharparkar
The village is located in east Tharparkar and about 10Km from Mithi. There are 8 primary
schools and 1 secondary school. According to the key informants, the education level of the village is quite
high compared to other villages of districts, and there are one or more government employee in half of the
households in the village. Many villagers also work at the large cities in Pakistan such as Karachi and
Islamabad at temporary basis.
The numbers of households by endogamous group and their basic description at the time of
survey (which were drawn from key informants) are shown in Table D-5.
Table D-4 Number of HH by Endogamous Group and Description

Appendix D - 4
Endogamous
Groups Religion
Number of
Household Description
Oadaja Muslim 25 Originally landowner
group
Thakur Hindu 150 Originally landowner
group
Charan Hindu 15 Originally religious
vocation group
Menghwar Hindu 320 Non-farm group
3 Production of Beef
As half of the new born cattle or buffaloes are male, all the cattle/buffalo holding farmers can earn
incomes from the natural fattening of male cattle/buffalo. All the cattle/buffalo holders can be the targets for
the increase in beef production and the improvement of income level by fattening male cattle/buffalo.
It is, however, important to note that fattening male cattle/buffalo is not thought to be an object of
the production activity or business for many of the farmers. Rather, they are often considered as liquid
assets when the farmers need cash. Accordingly, male calves are often sold for meat before maturity, and
this appears to be a loss of livestock resources. Based on the field survey in Badin by the Project Team,
many of the male cattle and buffaloes are sold around one year after their birth for around Rs.12,000 when
their average weigh is around 180Kg. However, it is found that most farmers acknowledge that the best
timing for selling male cattle/buffaloes is at 3 years old when their weight often exceeds 300Kg. They also
agree that with good feeding and care for male cattle/buffaloes, they can earn enough profit by selling them
after 3 years of rearing after birth. Thus, fattening male cattle/buffalo until 3 year old appears to be good
investment, and selling young calves appear to be a loss of an opportunity to generate income.
One important characteristics of fattening male cattle/buffalo is, however, relatively low turnover
ratio. That, the period of investment until earning cash by selling it, is quite long, whereas, for the dairy
production, farmers can earn cash day by day within the milking period of cattle/buffalo. This makes it hard
for resource-less farmers to fat male cattle/buffalo for a long time, even if its rate of return is high.
Thus, the problem of fattening male cattle/buffalo with low turnover ratio involves its difficulty of
cash flow management during the period of production. For those who have large amount of income from
various sources, it would be relatively easy to make their ends during the fattening period. It is, however,
difficult for those who have limited amount of income or assets to manage cash flow of the household
during the fattening period. According to Table 8-3-4 above, these households who have difficulty in cash
flow management corresponds to marginal landowners, tenants, and non-farm households, who have small
or no agricultural income.
Table D-5 Number of HH by Endogamous and Description

Appendix D - 5
# of
Sample
HH
Annual Milk Selling
Revenue minus
Purchased Feed (Rs.)
Milk
Production a
day (liter)
Milk Sold
a day
(liter)
% of milk
sold
Medium Landowner 1 -75,000 19.5 0.0 0%
Small Landowner 5 -17,577 6.5 0.9 14%
Marginal Landowner 4 -5,564 2.3 0.3 14%
Tenant 13 11,721 4.1 1.9 46%
Non Farm Livestock 22 11,186 4.7 2.6 56%
Total 45 4,741 5 2 41%
Table D-6 depicts the status of household cash flow in livestock sector by landholding status. The
data of table are drawn from the dairy farmers in M.S.S villages in Badin. The third column of the table
shows the annual cash revenue from selling milk minus the amount of purchased feed for livestock. As the
feed constitute most of the variable costs for livestock rearing, this figure indicates the annual cash balance
for the dairy farmers. One can see that this figure is negative for landowners and the amount of loss is
bigger for larger landowners whereas that for landless is positive. This indicates that larger landowners can
endure the condition of negative cash flow in the livestock activities while they consume at home or give
out to others most of milk produced, probably because they have enough cash income from cropping.
Among the categories of landowners, however, marginal landowners appear not to have much capacity to
do this, as their cash balances are slightly less than zero. On the other hand, these figures for landless
households are positive, indicating that these household appear to have to manage the costs of purchasing
feed within the amount of their cash income of milk, as they cannot substitute the negative cash balance by
other income sources. The table also shows that they tend to sell large portion of milk they produced and
thus the amount of self-consumed at home are lower. They appear to be required to sell their milk to
balance the cash flow of their livestock activities.
As indicated above, marginal landowners and landless households appear to have difficulty in
conducting planned investment in fattening male cattle/buffalo as they may be required to sell their
livestock in the middle of fattening period when they face the urgent need of cash.
4 Feed Management
For the livestock activities, feed is the biggest components of recurring costs. As shown in Table
D-7, which is drawn from the results of the second household survey, the costs for fodder and concentrates
constitute most parts of the recurring costs for all the groups of households. Also, as the quality of feed
considerably affects the health and production ability of milk of livestock, feed management is an important
factor for the productivity of livestock farmers regardless of the scale and the types of livestock farming.
Accordingly, improvement of feed management should be targeted to any types of livestock
farmers. However, for the improvement of feeding management, it is important to consider the
characteristics of households in terms of the access to self-producing fodder. As shown in Table D-8, which
is drawn from the results of the second household survey, percentage of feed supplied by self-produced feed
Table D-6 Household Cash Flow in Livestock Sector

Appendix D - 6
at home is bigger for the larger landowners, whereas landless households M.S.S village (irrigated area) very
much depend on the purchased feed. Also, farmers in the Pabuhar (non-irrigated area), farmers are more
dependent on open land (or grazing). The optimum strategy for feed management should be different for
each type of these farmers. Thus, the different approach of support on feed management should be taken
depending on the characteristics of household in terms of the source of feed supply.
# of sample
HH
Concent-
ratesFodder Medicine
Vetenary
Charges
Transpor-
tation
Total
Recurring
Costs
% of
concentrates
plus fodder
to total
recurring
costs
M.S.S 126 14,429 8,907 742 209 0 24,287 96%
Medium Landowner 2 45,500 12,000 2,000 0 0 59,500 97%
Small Landowner 18 23,273 7,522 1,389 339 0 32,523 95%
Micro Landowner 13 5,105 1,962 331 100 0 7,497 94%
Tenant 31 15,332 5,729 597 226 0 21,884 96%
Non Farm Livestock 39 18,403 18,559 1,059 300 0 38,321 96%
Non Farm Other 23 2,122 1,565 17 9 0 3,713 99%
Pabuhar 124 12,611 5,745 1,159 54 115 19,684 93%
Large Landowner 3 44,667 36,667 6,000 0 0 87,333 93%
Medium Landowner 9 29,911 20,444 1,944 178 0 52,478 96%
Small Landowner 29 12,567 7,510 1,821 126 0 22,024 91%
Micro Landowner 21 9,386 1,814 962 0 190 12,352 91%
Tenant 62 9,662 2,620 568 24 165 13,039 94%
Total 250 13,528 7,339 949 132 57 22,004 95%
Number of
Sample HH
% of feed
self-
produced
% of feed
supplied by
the open
land
% of feed
purchased
M.S.S 96 26% 31% 43%
Medium Landowner 2 75% 0% 25%
Small Landowner 17 74% 8% 19%
Micro Landowner 11 40% 46% 15%
Tenant 23 28% 22% 50%
Non Farm Livestock 39 0% 43% 58%
Non Farm Other 4 0% 50% 50%
Pabuhar 124 18% 67% 16%
Large Landowner 3 42% 33% 25%
Medium Landowner 9 29% 44% 27%
Small Landowner 29 24% 61% 16%
Micro Landowner 21 23% 63% 14%
Tenant 62 10% 77% 14%
Total 220 21% 51% 28%
Table D-7 Annual Recurring Costs for Livestock (Rs.)
Table D-8 Distribution of Feed by Sources
Source: The Second Household Survey
Source: The Second Household Survey

Appendix E
Third Household Survey

Appendix E - 1
Appendix E
The Third Household Survey
1 Survey Method
(1) Overview
The third household survey was conducted by the Project Team between July and August 2011.
The purpose of this survey is to grasp the state of agricultural and livestock activities and household
economies of large landowners. The survey was conducted in the following villages where some large
landowners reside.
Village Name District
Barchani Tando Mohmmad Khan
Kari Bakar Sukkur
Juma Khan Talpur Sanghar
In order to elucidate their roles and positions within the village they reside, samples households
were selected from various categories of villagers including large landowners. The survey was conducted in
the form of interview, asking them the same questionnaires as in the second household survey. The number
of total sample households in these three villages was 159.
Moreover, to further clarify the characteristics of large landowners in Sindh, 15 other landowners
in 6 districts were interviewed using the same questionnaires.
(2) Selection of Sample Households
The sampling of households was made by stratified sampling method, where sampling strata
were based on the classification of Census of Agriculture of Pakistan, as in the second household survey.
The categories of strata and their definition are shown in Table E-2.
Condition
Landowner
Large Owns more than 100 acre
Medium Owns 25-99 acre
Small Owns 5-24 acre
Marginal Holds less than 5 acres
Tenants
Non-farmer
Livestock
holder
Holds one or more
cattle/buffalo or 5 or more
goats/sheep
Other
Table E-2 Household Category based on Census of Agriculture
Table E-1 List of Sample Villages

Appendix E - 2
The sample households in each stratum were extracted in proportion to the ratio of households in
each stratum to total number of household in the village. Tables E-3 shows the estimated number of
households and the sample household in each stratum in the sample villages respectively. The estimated
numbers of households are based on the key informant interviews. The averages of their ranges were used
for the stratification.
2 Household Economy
(1) Living Standards
Table E-4 shows the average annual income and consumption expenditures for each group of the
households. Figure E-1 is the graphic representation of average per capita consumption for each stratum of
household groups. One can see the huge gap in living standards (indicated by income and consumption
expenditure) between large landowners and other groups of households.
Estimate #
of HH%
Number of
Sample HH%
Barchani
Large Landowner 5 1.2% 1 1.9%
Medium Landowner 12 3.0% 2 3.8%
Small Landowner 10 2.5% 1 1.9%
Marginal Landowner 40 10.0% 5 9.4%
Tenant 150 37.3% 19 35.8%
Non Farm Livestock 135 33.6% 18 34.0%
Other Non Farm 50 12.4% 7 13.2%
Total 402 100.0% 53 100.0%
Kari Bakar
Large Landowner 1 0.7% 1 1.9%
Medium Landowner 1 0.7% 1 1.9%
Small Landowner 6 4.1% 3 5.7%
Marginal Landowner 25 16.9% 10 18.9%
Tenant 60 40.5% 20 37.7%
Non Farm Livestock 25 16.9% 9 17.0%
Other Non Farm 30 20.3% 9 17.0%
Total 148 100.0% 53 100.0%
Juma Khan Talpur
Large Landowner 1 0.7% 1 1.9%
Medium Landowner 1 0.7% 1 1.9%
Small Landowner 7 4.7% 3 5.7%
Tenant 45 30.0% 15 28.3%
Non Farm Livestock 81 54.0% 28 52.8%
Other Non Farm 15 10.0% 5 9.4%
Total 150 100.0% 53 100.0%
Table E-3 Total Number of HH and Sample HH in each Stratum

Appendix E - 3
Number of
Sample HH
Per capita
Total
Cunsupmtion
Expenditure
HH Total
Consumption
Expenditure
Per
Capita
Total
Income
HH Total
Income
Barchani 53 29,101 232,713 48,443 384,080
Large Landowner 1 266,844 2,415,047 553,373 5,300,693
Medium Landowner 2 89,349 1,045,296 155,849 1,320,893
Small Landowner 1 78,903 623,662 113,662 897,716
Marginal Landowner 5 27,788 242,722 30,316 265,182
Tenant 19 17,605 131,817 37,385 291,457
Non Farm Livestock 18 25,079 149,983 30,773 177,980
Other Non Farm 7 13,291 112,386 24,706 206,971
Kari Bakar 53 28,873 332,705 31,867 384,470
Large Landowner 1 513,972 9,955,530 743,782 13,948,344
Medium Landowner 1 26,302 289,323 10,360 113,956
Small Landowner 3 28,153 302,116 18,209 191,000
Marginal Landowner 10 20,873 180,307 18,365 143,146
Tenant 20 19,251 151,289 14,834 115,116
Non Farm Livestock 9 20,406 115,827 22,802 124,837
Other Non Farm 9 14,238 67,878 21,630 98,256
Juma Khan Talpur 53 24,403 220,972 49,201 610,747
Large Landowner 1 213,217 4,051,128 1,126,979 21,412,605
Medium Landowner 1 47,470 569,645 165,325 1,983,904
Small Landowner 3 16,341 118,421 29,221 217,403
Tenant 15 22,329 187,119 27,334 240,136
Non Farm Livestock 28 21,067 129,977 26,153 153,295
Other Non Farm 5 11,766 57,862 17,078 85,316
Total 159 27,459 262,130 43,170 459,766
Table E-4 Annual Total Income and Consumption Expenditure (Rs.)
Figure E-1 Per Capita Annual Total Consumption Expenditure (Rs.)

Appendix E - 4
(2) Consumption Expenditure
Table E-5 and Figure E-2 show the consumption expenditure patterns of households in each
category, and Figure E-3 depicts that of each household group excluding large landowners. As indicated in
Table E-5, the percentage of expenditure on food (self-produced and purchased) to total expenditure for
large landowners are between 22% and 39% for the sample villages and are much smaller than those of
marginal landowners, tenants, and non-farm households, which are more than 70% for all sample villages.
Self-produced
Food
Purchased
Food
Apparel,
textile, and
footwear
Expense for
ceremonyMedial Care Education
Loan
Repayments
Other
Expenses
Lending
loan
Purchasing
Asset
Self-produced
and
Purchased
Food
Barchani 23% 34% 5% 4% 4% 2% 2% 11% 1% 15% 57%
Large Landowner 21% 18% 5% 4% 2% 2% 3% 11% 7% 27% 39%
Medium Landowner 14% 13% 2% 4% 7% 2% 6% 17% 0% 36% 26%
Small Landowner 21% 18% 3% 1% 2% 1% 0% 7% 0% 47% 39%
Marginal Landowner 26% 39% 8% 3% 4% 3% 0% 14% 0% 4% 65%
Tenant 32% 42% 5% 4% 4% 1% 3% 6% 0% 3% 74%
Non Farm Livestock 30% 46% 4% 4% 3% 0% 0% 10% 0% 3% 76%
Other Non Farm 0% 73% 5% 5% 3% 3% 0% 10% 0% 0% 73%
Kari Bakar 20% 26% 4% 4% 3% 1% 0% 41% 0% 1% 46%
Large Landowner 6% 16% 4% 4% 2% 2% 0% 66% 0% 1% 22%
Medium Landowner 36% 29% 4% 3% 7% 3% 0% 17% 0% 0% 65%
Small Landowner 43% 21% 4% 6% 8% 0% 0% 11% 0% 7% 64%
Marginal Landowner 42% 35% 4% 11% 2% 0% 0% 6% 0% 0% 77%
Tenant 44% 36% 4% 3% 5% 0% 0% 8% 0% 0% 80%
Non Farm Livestock 38% 43% 4% 2% 5% 0% 2% 6% 0% 0% 82%
Other Non Farm 0% 81% 6% 4% 3% 0% 0% 6% 0% 0% 81%
Juma Khan Talpur 29% 28% 4% 4% 2% 2% 17% 10% 1% 3% 56%
Large Landowner 13% 10% 4% 5% 1% 4% 47% 14% 2% 0% 23%
Medium Landowner 47% 13% 9% 11% 4% 3% 0% 15% 0% 0% 59%
Small Landowner 9% 44% 7% 9% 5% 3% 5% 17% 0% 0% 53%
Tenant 46% 28% 3% 3% 2% 0% 2% 7% 0% 10% 73%
Non Farm Livestock 34% 44% 4% 3% 3% 0% 0% 8% 1% 3% 78%
Other Non Farm 4% 75% 4% 7% 2% 2% 0% 6% 0% 0% 79%
Total 23% 29% 4% 4% 3% 2% 5% 23% 1% 6% 52%
Table E-5 Percentage Distribution of Each Component of Total Consumption Expenditure
Figure E-2 Annual Consumption Expenditure by Component (Rs.)
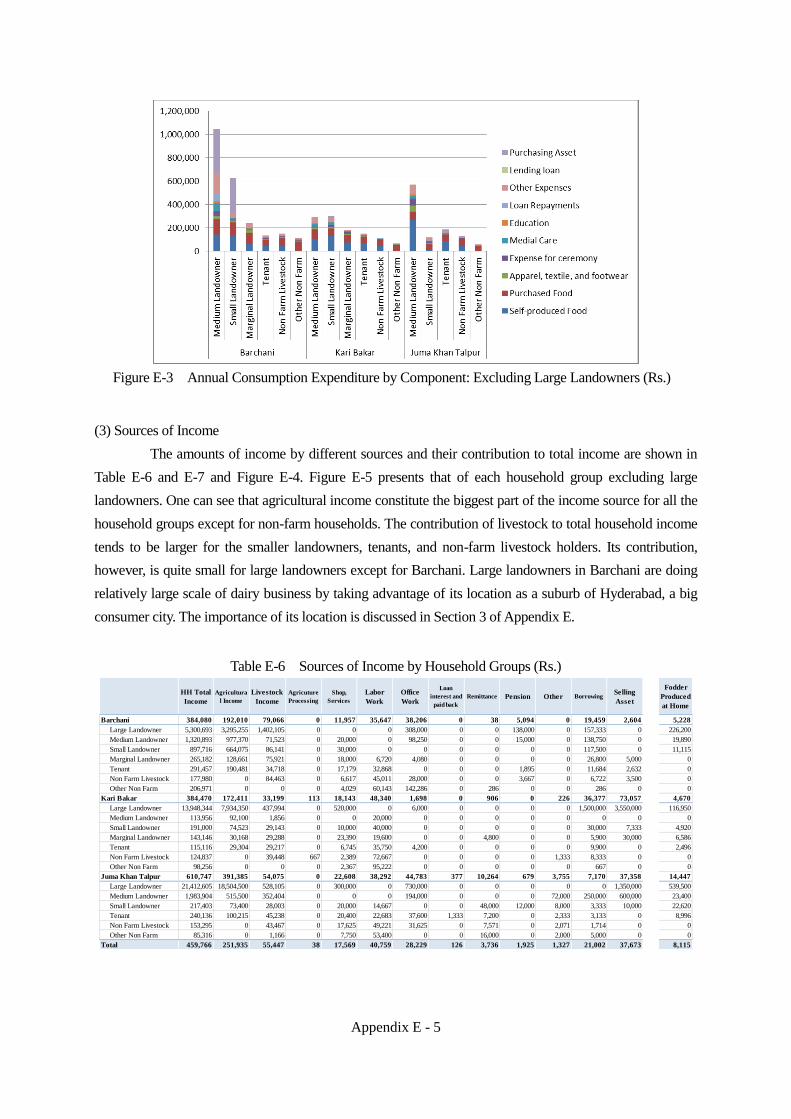
Appendix E - 5
(3) Sources of Income
The amounts of income by different sources and their contribution to total income are shown in
Table E-6 and E-7 and Figure E-4. Figure E-5 presents that of each household group excluding large
landowners. One can see that agricultural income constitute the biggest part of the income source for all the
household groups except for non-farm households. The contribution of livestock to total household income
tends to be larger for the smaller landowners, tenants, and non-farm livestock holders. Its contribution,
however, is quite small for large landowners except for Barchani. Large landowners in Barchani are doing
relatively large scale of dairy business by taking advantage of its location as a suburb of Hyderabad, a big
consumer city. The importance of its location is discussed in Section 3 of Appendix E.
HH Total
Income
Agricultura
l Income
Livestock
Income
Agricuture
Processing
Shop,
Services
Labor
Work
Office
Work
Loan
interest and
paid back
Remittance Pension Other BorrowingSelling
Asset
Fodder
Produced
at Home
Barchani 384,080 192,010 79,066 0 11,957 35,647 38,206 0 38 5,094 0 19,459 2,604 5,228
Large Landowner 5,300,693 3,295,255 1,402,105 0 0 0 308,000 0 0 138,000 0 157,333 0 226,200
Medium Landowner 1,320,893 977,370 71,523 0 20,000 0 98,250 0 0 15,000 0 138,750 0 19,890
Small Landowner 897,716 664,075 86,141 0 30,000 0 0 0 0 0 0 117,500 0 11,115
Marginal Landowner 265,182 128,661 75,921 0 18,000 6,720 4,080 0 0 0 0 26,800 5,000 0
Tenant 291,457 190,481 34,718 0 17,179 32,868 0 0 0 1,895 0 11,684 2,632 0
Non Farm Livestock 177,980 0 84,463 0 6,617 45,011 28,000 0 0 3,667 0 6,722 3,500 0
Other Non Farm 206,971 0 0 0 4,029 60,143 142,286 0 286 0 0 286 0 0
Kari Bakar 384,470 172,411 33,199 113 18,143 48,340 1,698 0 906 0 226 36,377 73,057 4,670
Large Landowner 13,948,344 7,934,350 437,994 0 520,000 0 6,000 0 0 0 0 1,500,000 3,550,000 116,950
Medium Landowner 113,956 92,100 1,856 0 0 20,000 0 0 0 0 0 0 0 0
Small Landowner 191,000 74,523 29,143 0 10,000 40,000 0 0 0 0 0 30,000 7,333 4,920
Marginal Landowner 143,146 30,168 29,288 0 23,390 19,600 0 0 4,800 0 0 5,900 30,000 6,586
Tenant 115,116 29,304 29,217 0 6,745 35,750 4,200 0 0 0 0 9,900 0 2,496
Non Farm Livestock 124,837 0 39,448 667 2,389 72,667 0 0 0 0 1,333 8,333 0 0
Other Non Farm 98,256 0 0 0 2,367 95,222 0 0 0 0 0 667 0 0
Juma Khan Talpur 610,747 391,385 54,075 0 22,608 38,292 44,783 377 10,264 679 3,755 7,170 37,358 14,447
Large Landowner 21,412,605 18,504,500 528,105 0 300,000 0 730,000 0 0 0 0 0 1,350,000 539,500
Medium Landowner 1,983,904 515,500 352,404 0 0 0 194,000 0 0 0 72,000 250,000 600,000 23,400
Small Landowner 217,403 73,400 28,003 0 20,000 14,667 0 0 48,000 12,000 8,000 3,333 10,000 22,620
Tenant 240,136 100,215 45,238 0 20,400 22,683 37,600 1,333 7,200 0 2,333 3,133 0 8,996
Non Farm Livestock 153,295 0 43,467 0 17,625 49,221 31,625 0 7,571 0 2,071 1,714 0 0
Other Non Farm 85,316 0 1,166 0 7,750 53,400 0 0 16,000 0 2,000 5,000 0 0
Total 459,766 251,935 55,447 38 17,569 40,759 28,229 126 3,736 1,925 1,327 21,002 37,673 8,115
Figure E-3 Annual Consumption Expenditure by Component: Excluding Large Landowners (Rs.)
Table E-6 Sources of Income by Household Groups (Rs.)

Appendix E - 6
Agricultural
Income
Livestock
Income
Agricuture
Processing
Shop,
ServicesLabor Work
Office
Work
Loan
interest and
paid back
Remittance Pension Other BorrowingSelling
Asset
Fodder
Produced
at Home
Barchani 50% 21% 0% 3% 9% 10% 0% 0% 1% 0% 5% 1% 1%
Large Landowner 62% 26% 0% 0% 0% 6% 0% 0% 3% 0% 3% 0% 4%
Medium Landowner 74% 5% 0% 2% 0% 7% 0% 0% 1% 0% 11% 0% 2%
Small Landowner 74% 10% 0% 3% 0% 0% 0% 0% 0% 0% 13% 0% 1%
Marginal Landowner 49% 29% 0% 7% 3% 2% 0% 0% 0% 0% 10% 2% 0%
Tenant 65% 12% 0% 6% 11% 0% 0% 0% 1% 0% 4% 1% 0%
Non Farm Livestock 0% 47% 0% 4% 25% 16% 0% 0% 2% 0% 4% 2% 0%
Other Non Farm 0% 0% 0% 2% 29% 69% 0% 0% 0% 0% 0% 0% 0%
Kari Bakar 45% 9% 0% 5% 13% 0% 0% 0% 0% 0% 9% 19% 1%
Large Landowner 57% 3% 0% 4% 0% 0% 0% 0% 0% 0% 11% 25% 1%
Medium Landowner 81% 2% 0% 0% 18% 0% 0% 0% 0% 0% 0% 0% 0%
Small Landowner 39% 15% 0% 5% 21% 0% 0% 0% 0% 0% 16% 4% 3%
Marginal Landowner 21% 20% 0% 16% 14% 0% 0% 3% 0% 0% 4% 21% 5%
Tenant 25% 25% 0% 6% 31% 4% 0% 0% 0% 0% 9% 0% 2%
Non Farm Livestock 0% 32% 1% 2% 58% 0% 0% 0% 0% 1% 7% 0% 0%
Other Non Farm 0% 0% 0% 2% 97% 0% 0% 0% 0% 0% 1% 0% 0%
Juma Khan Talpur 64% 9% 0% 4% 6% 7% 0% 2% 0% 1% 1% 6% 2%
Large Landowner 86% 2% 0% 1% 0% 3% 0% 0% 0% 0% 0% 6% 3%
Medium Landowner 26% 18% 0% 0% 0% 10% 0% 0% 0% 4% 13% 30% 1%
Small Landowner 34% 13% 0% 9% 7% 0% 0% 22% 6% 4% 2% 5% 10%
Tenant 42% 19% 0% 8% 9% 16% 1% 3% 0% 1% 1% 0% 4%
Non Farm Livestock 0% 28% 0% 11% 32% 21% 0% 5% 0% 1% 1% 0% 0%
Other Non Farm 0% 1% 0% 9% 63% 0% 0% 19% 0% 2% 6% 0% 0%
Total 55% 12% 0% 4% 9% 6% 0% 1% 0% 0% 5% 8% 2%
Table E-7 Sources of Income (Percentage Distribution against Total Income)
Figure E-4 Sources of Income by Household Group (Rs.)
Figure E-5 Sources of Income by Household Group: Excluding Large landowners (Rs.)

Appendix E - 7
(4) Assets and Liabilities
Table E-8 and E-9 and Figure E-6 represent the asset holing position of households for each
group. Figure E-7 shows that for each group except for large landowners. One can observe that there is a
huge gap in the value of asset holding among the groups. The inequalities in asset holding are even greater
than the results of the second household survey, which is discussed in Chapter 9.8.5. This is mainly due to
the fact that large landowners in irrigated areas are not included in the second household survey.
Also, one can notice that landholding status play the dominant role in differentiating the values of
their asset holing, and agricultural lands constitute 90% of total net worth in the three sample villages
overall. Livestock constitute a significant portion of net worth for the tenants and the non-farm livestock
holders.
It should also be noted that the lands, livestock, house and other building constitute almost all of
the values of their asset holdings.
Total AssetAgricultural
Land
Other land
(House etc)Livestock
Houses and
Other
Buildings
Agricultural
MachineryVehicles Saving Securities
Outstanding
LoanPreservation
Total
Liabilities
(Outstanding
Debt)
Net Worth
Barchani 2,563,850 1,665,094 230,566 180,986 409,590 13,920 40,869 12,042 47 10,044 692 19,513 2,544,337
Large Landowner 59,770,850 48,500,000 1,600,000 5,219,833 2,835,000 219,183 726,833 400,000 0 233,333 36,667 94,000 59,676,850
Medium Landowner 19,395,675 16,075,000 639,750 266,000 2,001,250 75,000 285,925 39,000 1,250 12,500 0 76,250 19,319,425
Small Landowner 5,040,500 3,500,000 580,000 105,300 600,750 30,000 223,200 1,250 0 0 0 118,500 4,922,000
Marginal Landowner 2,031,880 820,000 271,000 128,360 660,600 67,720 81,200 1,000 0 2,000 0 28,000 2,003,880
Tenant 388,074 0 102,000 43,758 219,684 0 4,947 4,053 0 13,632 0 19,421 368,653
Non Farm Livestock 693,778 0 267,917 123,972 290,167 0 7,778 3,667 0 278 0 8,778 685,000
Other Non Farm 322,936 0 92,143 4,343 224,286 0 593 1,571 0 0 0 314 322,621
Kari Bakar 15,847,501 15,341,736 119,583 60,535 141,019 33,538 147,496 434 0 2,264 896 45,906 15,801,595
Large Landowner 817,392,250 800,000,000 5,325,000 655,250 2,002,000 1,702,500 7,560,000 0 0 100,000 47,500 2,000,000 815,392,250
Medium Landowner 5,389,200 5,000,000 0 140,400 151,000 75,000 22,800 0 0 0 0 0 5,389,200
Small Landowner 1,989,167 1,410,000 83,300 158,533 317,333 0 20,000 0 0 0 0 30,000 1,959,167
Marginal Landowner 623,140 388,200 10,000 65,320 150,600 0 8,820 200 0 0 0 5,900 617,240
Tenant 167,410 0 18,150 45,710 101,050 0 1,900 600 0 0 0 9,650 157,760
Non Farm Livestock 110,756 0 27,778 41,078 38,556 0 567 556 0 2,222 0 9,444 101,311
Other Non Farm 65,800 0 5,556 0 55,000 0 4,800 444 0 0 0 667 65,133
Juma Khan Talpur 7,455,945 6,207,547 264,811 118,153 629,000 8,915 47,128 54,654 0 5,642 120,094 11,585 7,444,360
Large Landowner 351,088,200 300,000,000 13,000,000 1,439,000 25,001,000 450,000 2,259,200 2,500,000 0 74,000 6,365,000 0 351,088,200
Medium Landowner 16,176,800 12,000,000 175,000 341,000 3,001,000 0 159,800 300,000 0 200,000 0 250,000 15,926,800
Small Landowner 5,854,367 5,666,667 0 90,367 94,000 0 0 3,333 0 0 0 1,333 5,853,033
Tenant 312,920 0 30,000 100,620 179,133 1,500 0 1,667 0 0 0 19,933 292,987
Non Farm Livestock 195,271 0 14,643 95,993 78,786 0 2,814 2,143 0 893 0 1,286 193,985
Other Non Farm 35,117 0 0 2,783 32,000 0 0 333 0 0 0 5,000 30,117
Total 8,622,432 7,738,126 204,987 119,891 393,203 18,791 78,498 22,377 16 5,983 40,561 25,668 8,596,764
Table E-8 Value of Assets and Liabilities of Households by Type (Rs.)

Appendix E - 8
Agricultural
Land
Other land
(House etc)Livestock
Houses and
Other
Buildings
Agricultural
MachineryVehicles Saving Securities
Outstandin
g LoanPreservation
Total
Liabilities
(Outstanding
Deb)
Barchani 65% 9% 7% 16% 1% 2% 0% 0% 0% 0% -1%
Large Landowner 81% 3% 9% 5% 0% 1% 1% 0% 0% 0% 0%
Medium Landowner 83% 3% 1% 10% 0% 1% 0% 0% 0% 0% 0%
Small Landowner 69% 12% 2% 12% 1% 4% 0% 0% 0% 0% -2%
Marginal Landowner 40% 13% 6% 33% 3% 4% 0% 0% 0% 0% -1%
Tenant 0% 26% 11% 57% 0% 1% 1% 0% 4% 0% -5%
Non Farm Livestock 0% 39% 18% 42% 0% 1% 1% 0% 0% 0% -1%
Other Non Farm 0% 29% 1% 69% 0% 0% 0% 0% 0% 0% 0%
Kari Bakar 97% 1% 0% 1% 0% 1% 0% 0% 0% 0% 0%
Large Landowner 98% 1% 0% 0% 0% 1% 0% 0% 0% 0% 0%
Medium Landowner 93% 0% 3% 3% 1% 0% 0% 0% 0% 0% 0%
Small Landowner 71% 4% 8% 16% 0% 1% 0% 0% 0% 0% -2%
Marginal Landowner 62% 2% 10% 24% 0% 1% 0% 0% 0% 0% -1%
Tenant 0% 11% 27% 60% 0% 1% 0% 0% 0% 0% -6%
Non Farm Livestock 0% 25% 37% 35% 0% 1% 1% 0% 2% 0% -9%
Other Non Farm 0% 8% 0% 84% 0% 7% 1% 0% 0% 0% -1%
Juma Khan Talpur 83% 4% 2% 8% 0% 1% 1% 0% 0% 2% 0%
Large Landowner 85% 4% 0% 7% 0% 1% 1% 0% 0% 2% 0%
Medium Landowner 74% 1% 2% 19% 0% 1% 2% 0% 1% 0% -2%
Small Landowner 97% 0% 2% 2% 0% 0% 0% 0% 0% 0% 0%
Tenant 0% 10% 32% 57% 0% 0% 1% 0% 0% 0% -6%
Non Farm Livestock 0% 7% 49% 40% 0% 1% 1% 0% 0% 0% -1%
Other Non Farm 0% 0% 8% 91% 0% 0% 1% 0% 0% 0% -14%
Total 90% 2% 1% 5% 0% 1% 0% 0% 0% 0% 0%
Table E-9 Percentage Distribution of Values in the Net Worth of Households
Figure E-6 Value of Asset Holdings by Different Type (Rs.)

Appendix E - 9
(5) Lorenz Curves for Consumption Expenditure and Asset Holdings
Figures E-8 and E-9 show the Lorenz curves of consumption expenditure and asset values for the
sample villages. These curves show what percentage of total expenditure or assets are owned by any given
percentage of households. The percentage of households is plotted on the x-axis, the percentage of
expenditure or assets on the y-axis. The more convex curve represents the more inequality in the
distribution of wealth.
The figures show that Lorenz curve for the value of asset is much more convex than that for
consumption expenditure for all the sample villages, indicates that the inequality is more profound in asset
holdings than consumption expenditure. One can also see that the inequalities in asset holding are even
greater than the results of the second household survey, which is discussed in Chapter 9.8.6, due to the
inclusion of large landowners in irrigated areas for the third household survey.
The disparity in the agricultural land holding status is more profound than that of total asset
holdings as the curve for the agricultural land is extremely convex for all villages. As in the case in 9.8.6,
the inequality in the livestock holding is not significant for the both villages, probably reflected by the
relative easiness to purchase livestock.
Figure E-8 Lorenz Curves for Barchant Figure E-9 Lorenz Curves for Kari Bakar
Figure E-7 Value of Asset Holdings by Different Type: Excluding Large Landowners (Rs.)

Appendix E - 10
Figure E-10 Lorenz Curves for Juma Khan Talpur
(6) Status of Debt
Table E-11 depicts the percentage distribution of average amount of debt for each type of
households. It shows that about 70% of households in the sample do not have debt. For those households
who have debts, the amount of debts varies among households.
Table E-12 depicts the percentage distribution of ratio of debt amount to annual income. It shows
that percentages of households who have more than 30% debt-income ratio are very small. The table also
shows that more than 80% of non-farm households do not have debt at all, which may indicate the limited
access to credit for them.
It is important to note that about 40% of tenant households own debt, which is much higher rate
than non-farm households. During the interview, many of the tenant interviewees state that they tend to
borrow money from their landowners when they need lump sum amount of money for marriage ceremony
or funeral. This suggests that having a tenancy relation often provide tenant some access to credit. However,
the amount that their landowners can lend is mostly around 2,000- 3,000 Rs. at a time which is usually not
enough for their borrowing for investment. During the interview, a couple of tenants state that they borrow
money form NGOs for investing on livestock, as they cannot borrow a large amount of money form their
landowners.
Amount of debt
Category 0 0-50005,001-
10,000
10,001-
20,000
20,001-
30,000
30,001-
40,000
40,001-
50,000
50,001-
100,000
More than
100,000
Large Landowner 67% 0% 0% 0% 0% 0% 0% 0% 33%
Medium Landowner 50% 17% 0% 0% 0% 0% 0% 0% 33%
Small Landowner 40% 10% 0% 10% 10% 0% 0% 20% 10%
Marginal Landowner 53% 7% 0% 7% 20% 7% 0% 7% 0%
Tenant 63% 2% 7% 13% 6% 0% 0% 7% 2%
Non Farm Livestock 80% 2% 4% 5% 5% 0% 0% 4% 0%
Other Non Farm 86% 5% 5% 0% 5% 0% 0% 0% 0%
Total 69% 4% 4% 7% 7% 1% 0% 5% 4%
Table E-11 Percentage Distribution of Amount of Debt by Household Type (Rs.)

Appendix E - 11
(7) Acquisition of Lands
This section investigates the state of new acquisition of lands for the sample households. As
suggested in Section 9.8.7, this will indicate the level of mobilization among the social strata. Table E-13
depicts the number of landholding households who did not inherit the land from their families. The table
shows that, among 36 land-holding households in the sample, only 10 households in did not inherit land; in
other words, only 10 households in the sample became the new landowners within their generation. Also,
Table E-14 depicts the size of lands purchased by these 10 new landowners. It shows that the sizes of land
they purchased are quite small.
These facts suggest that even though purchasing agricultural lands by landless households exist to
some extent, newly acquiring agricultural land in a large scale is quite rare for landless households,
indicating the low incidents of mobilization among the social ladders.
Table E-13 Number of Landowners who Did Not
Inherit Land
Table E-14 Acres of Land Purchased
(8) Coping Strategy
Table E-15 shows the results of a question for how to cope with a shock such as famine.
Increasing livestock sale is the most popular option for all household groups except for non-farm other
Annual incom/Debt
Category0% 1-10% 11-20% 21-30% 31-40% 41-50% 51-60% 61-70% 71-80%
More
than 80%
Large Landowner 67% 17% 0% 0% 0% 0% 0% 0% 17% 0%
Medium Landowner 50% 17% 33% 0% 0% 0% 0% 0% 0% 0%
Small Landowner 40% 30% 10% 10% 10% 0% 0% 0% 0% 0%
Marginal Landowner 53% 7% 13% 27% 0% 0% 0% 0% 0% 0%
Tenant 63% 13% 13% 4% 0% 2% 2% 2% 0% 2%
Non Farm Livestock 82% 9% 7% 0% 0% 2% 0% 0% 0% 0%
Other Non Farm 86% 9% 0% 5% 0% 0% 0% 0% 0% 0%
Total 69% 12% 10% 5% 1% 1% 1% 1% 1% 1%
Number of
Landowners
HH who did
not inherite
land
Barchani 16 1
Large Landowner 3 0
Medium Landowner 4 0
Small Landowner 4 0
Marginal Landowner 5 1
Kari Bakar 15 9
Large Landowner 1 0
Medium Landowner 1 1
Small Landowner 3 1
Marginal Landowner 10 7
Juma Khan Talpur 5 0
Large Landowner 1 0
Medium Landowner 1 0
Small Landowner 3 0
Total 36 10
Acres of land
purchased
Number
of HHs
1 1
2 6
4 1
7 1
25 1
Total 10
Table E-12 Percentage Distribution of the Ratio of Debt to Income
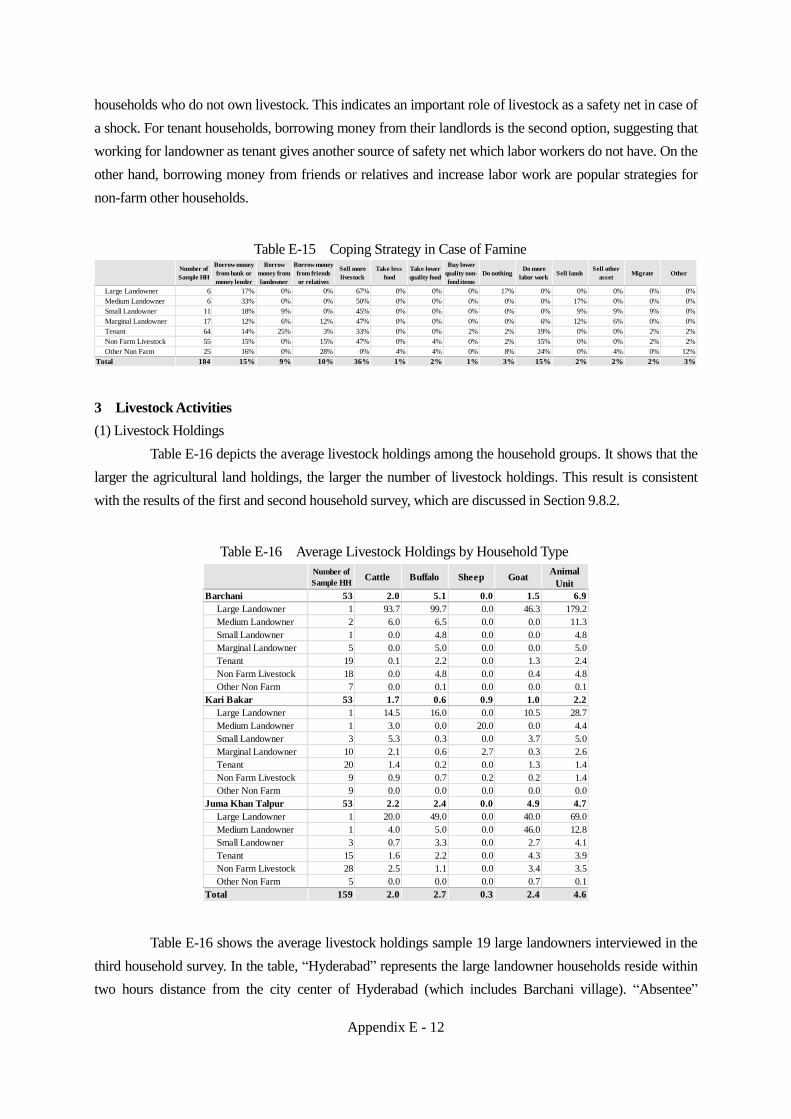
Appendix E - 12
households who do not own livestock. This indicates an important role of livestock as a safety net in case of
a shock. For tenant households, borrowing money from their landlords is the second option, suggesting that
working for landowner as tenant gives another source of safety net which labor workers do not have. On the
other hand, borrowing money from friends or relatives and increase labor work are popular strategies for
non-farm other households.
3 Livestock Activities
(1) Livestock Holdings
Table E-16 depicts the average livestock holdings among the household groups. It shows that the
larger the agricultural land holdings, the larger the number of livestock holdings. This result is consistent
with the results of the first and second household survey, which are discussed in Section 9.8.2.
Table E-16 shows the average livestock holdings sample 19 large landowners interviewed in the
third household survey. In the table, “Hyderabad” represents the large landowner households reside within
two hours distance from the city center of Hyderabad (which includes Barchani village). “Absentee”
Number of
Sample HH
Borrow money
from bank or
money lender
Borrow
money from
landowner
Borrow money
from friends
or relatives
Sell more
livestock
Take less
food
Take lower
quality food
Buy lower
quality non-
food items
Do nothingDo more
labor workSell lands
Sell other
assetMigrate Other
Large Landowner 6 17% 0% 0% 67% 0% 0% 0% 17% 0% 0% 0% 0% 0%
Medium Landowner 6 33% 0% 0% 50% 0% 0% 0% 0% 0% 17% 0% 0% 0%
Small Landowner 11 18% 9% 0% 45% 0% 0% 0% 0% 0% 9% 9% 9% 0%
Marginal Landowner 17 12% 6% 12% 47% 0% 0% 0% 0% 6% 12% 6% 0% 0%
Tenant 64 14% 25% 3% 33% 0% 0% 2% 2% 19% 0% 0% 2% 2%
Non Farm Livestock 55 15% 0% 15% 47% 0% 4% 0% 2% 15% 0% 0% 2% 2%
Other Non Farm 25 16% 0% 28% 0% 4% 4% 0% 8% 24% 0% 4% 0% 12%
Total 184 15% 9% 10% 36% 1% 2% 1% 3% 15% 2% 2% 2% 3%
Number of
Sample HHCattle Buffalo Sheep Goat
Animal
Unit
Barchani 53 2.0 5.1 0.0 1.5 6.9
Large Landowner 1 93.7 99.7 0.0 46.3 179.2
Medium Landowner 2 6.0 6.5 0.0 0.0 11.3
Small Landowner 1 0.0 4.8 0.0 0.0 4.8
Marginal Landowner 5 0.0 5.0 0.0 0.0 5.0
Tenant 19 0.1 2.2 0.0 1.3 2.4
Non Farm Livestock 18 0.0 4.8 0.0 0.4 4.8
Other Non Farm 7 0.0 0.1 0.0 0.0 0.1
Kari Bakar 53 1.7 0.6 0.9 1.0 2.2
Large Landowner 1 14.5 16.0 0.0 10.5 28.7
Medium Landowner 1 3.0 0.0 20.0 0.0 4.4
Small Landowner 3 5.3 0.3 0.0 3.7 5.0
Marginal Landowner 10 2.1 0.6 2.7 0.3 2.6
Tenant 20 1.4 0.2 0.0 1.3 1.4
Non Farm Livestock 9 0.9 0.7 0.2 0.2 1.4
Other Non Farm 9 0.0 0.0 0.0 0.0 0.0
Juma Khan Talpur 53 2.2 2.4 0.0 4.9 4.7
Large Landowner 1 20.0 49.0 0.0 40.0 69.0
Medium Landowner 1 4.0 5.0 0.0 46.0 12.8
Small Landowner 3 0.7 3.3 0.0 2.7 4.1
Tenant 15 1.6 2.2 0.0 4.3 3.9
Non Farm Livestock 28 2.5 1.1 0.0 3.4 3.5
Other Non Farm 5 0.0 0.0 0.0 0.7 0.1
Total 159 2.0 2.7 0.3 2.4 4.6
Table E-15 Coping Strategy in Case of Famine
Table E-16 Average Livestock Holdings by Household Type

Appendix E - 13
represents the absentee landowners. It shows that the cattle and buffalo holdings for “Hyderabad” are quite
large. Many of the large landowners in this category are in fact intensively engaged in dairy business,
utilizing their locational advantages as suburbs of a big consumer city.
It also shows that the livestock holdings for the absentee landowners are relatively small. This is
probably reflected by their difficulties in taking care of a large number of animals at the places that are
distant from their home. During our interview, one absentee landowner claimed that problem of theft
hinders him owning a large number of livestock at home.
(2) Fodder
The right hand side of Table E-17 shows the total cultivated area and the cultivated area of fodder
by household type. It shows that the areas of fodder cultivation are much larger for the larger landholding
households than other household groups. The middle part of the table shows the percentage distribution of
fodder usage by source. It shows that percentage of feed supplied by self-produced feed at home is bigger
for the larger landowners, whereas landless households depend on the purchased feed considerably.
The right hand side of the table shows the annual recurring costs for livestock rearing. The table
indicates that large landowners spend much more on concentrates than smaller landowners, tenants, and
non-farm households. One can also see that the large landowners spend relatively large amount of costs for
permanent laborers. Overall, these observations suggest that the large landowners rear their livestock with
the relatively better conditions than other strata of households.
Number of
Sample HHCattle Buffalo Sheep Goat
Animal
Unit
Hyderabad 4 94 127 0 35 206
Absentee 3 5 14 0 0 19
Other 12 27 38 14 36 65
Total 19 37 53 9 30 87
Table E-16 Average Livestock Holdings of Large Landowners

Appendix E - 14
(3) Milk Production and Sales
Table E-18 depicts the average total weekly production of milk and their distribution to sales
amount, self-consumption, and other for the household who have milking cows and buffaloes. It shows that
the production of milk is prominently higher for large landowners than other groups. One can also see that
most of the household retain some portion of the milk they produced for their consumption at home.
Total
Cultivated
Area (A)
Cultivated
Area of
Fodder (B)
% (B/A)
% of feed
self-
produced
% of feed
supplied by
the open
land
% of feed
purchased
Total cost of
purchased
fodder
Total cost of
purchased
concentrate
Total cost of
purchased
other feed
Salary for
Permanent
Laborers
Other costs
for
livestock
Number of
Livestock
Reaed (AU)
Barchani 6.1 0.2 3% 26 54 20 43,936 48,338 8,500 90,000 8,400 8
Large Landowner 118.7 6.3 5% 68 3 28 220,667 326,667 12,100 180,000 12,000 83
Medium Landowner 31.0 2.0 6% 69 13 19 15,250 38,050 60,000 11
Small Landowner 12.3 0.6 5% 65 19 16 23,333 29,500 3,000 5
Marginal Landowner 2.6 0.0 0% 34 18 48 25,333 31,170 4,800 4,800 5
Tenant 6.1 0.0 0% 25 62 13 9,880 21,611 100 24,000 3
Non Farm Livestock 0 80 20 25,714 21,053 100 4
Other Non Farm 0 100 0
Kari Bakar 20.0 0.3 1% 50 45 5 2,700 25,759 2,100 122,667 1,000 4
Large Landowner 848.5 8.0 1% 100 0 0 175,000 181,000 29
Medium Landowner 15.0 0.0 0% 100 0 0 3,000 1,200 1,200 2
Small Landowner 6.8 0.6 9% 100 0 0 13,150 4
Marginal Landowner 6.8 0.3 4% 54 46 0 19,233 1,300 6,000 800 6
Tenant 5.4 0.1 2% 50 49 1 1,500 12,740 100 3
Non Farm Livestock 13 68 21 3,000 12,233 100 2
Other Non Farm
Juma Khan Talpur 10.4 1.0 10% 17 67 16 8,193 19,172 100 66,600 5
Large Landowner 402.0 43.5 11% 100 0 0 84,000 144,000 69
Medium Landowner 42.0 4.0 10% 100 0 0 62,400 13
Small Landowner 13.5 1.0 7% 33 33 33 25,000 22,000 4
Tenant 4.6 0.3 7% 39 59 3 6,500 34,000 100 36,000 4
Non Farm Livestock 0 78 23 7,031 10,546 100 24,000 4
Other Non Farm 0 100 0 0
Total 12 0.5 5% 31 55 14 19,193 31,706 3,743 92,979 3,643 6
Number of
Sample HH
Total
Procution of
Milk per
week (liter)
Total Milk
Sold per
week (liter)
Total Milk Self
Consumed per
week (liter)
Total Milk
Given per
week (liter)
Total Milk
Other per
week (liter)
Milk
Production per
head/day (liter)
Barchani 38 219 164 51 3 1 3.9
Large Landowner 1 1,241 1,167 52 11 11 6.8
Medium Landowner 2 75 51 24 0 0 4.3
Small Landowner 1 51 22 27 1 0 5.8
Marginal Landowner 4 65 43 21 1 0 4.9
Tenant 6 79 55 23 2 0 5.8
Non Farm Livestock 17 66 51 14 2 0 4.2
Kari Bakar 31 214 63 141 10 0 2.4
Large Landowner 1 252 183 69 0 0 3.6
Medium Landowner 1 21 0 19 2 0 1.5
Small Landowner 3 19 0 17 2 0 1.0
Marginal Landowner 6 27 2 23 0 0 2.3
Tenant 12 24 1 23 0 0 2.1
Non Farm Livestock 7 34 14 18 2 0 3.6
Juma Khan Talpur 29 49 22 23 3 1 3.5
Large Landowner 1 140 112 14 14 0 2.9
Medium Landowner 1 70 0 65 5 0 3.3
Small Landowner 1 70 63 7 0 0 5.0
Tenant 7 63 33 26 4 0 3.9
Non Farm Livestock 19 36 12 21 2 1 3.4
Total 98 90 64 23 2 1 3.7
Table E-17 Production of Fodder, Usage of Fodder by Sources, and Annual Recurring Costs for
Livestock (Rs.)
Table E-18 Production and Sales of Milk by Household Type

Appendix E - 15
Table E-19 depicts the average total weekly production of milk and their distribution to sales
amount, self-consumption, and other for 19 sample large landowners. It shows that the milk productions of
large landowners who live in the suburb of Hyderabad are quite large, reflecting their investing efforts on
dairy business.
It is also important to note that some large landowners refrain from selling milk and tend to give
other villagers their milk that are the surplus to self-consumed amount at home. Some interviewees state
that people take it appropriate for large landowners to do dairy activities for business and, if they sell
surplus milk rather than give them away, it will cause social tensions. Based on the field work of the team,
this traditional notion is deep-rooted in Sanghar districts, but it cannot be seen in the northern Sindh such as
Sukkur, Larkana, and Shikarpir. This feature can be seen in Table E-19, as the portion of milk sales to total
milk production is quite low for the large landowners in the Sanghar district.1
(4) Milk Consumption
Table E-20 shows the amount of milk purchased and self-consumed for a household and the per
capita milk consumption per week. It indicates that the per capita consumption of milk is significantly
larger for the large landowners than other household groups.
1 This issue is also discussed in Section 6 of Appendix C based on the result of first household survey. It is important to note that all
of the sample large landowners in the first household survey do not sell their milk at all. All of them reside in the central and
southern parts of the province, and 60% of them reside in Sanghar.
Number
of Sample
HH
Total
Procution of
Milk per
week (liter)
Total Milk
Sold per
week (liter)
Total Milk
Self
Consumed
per week
(liter)
Total Milk
Given per
week (liter)
Total Milk
Other per
week (liter)
Milk
Production
per
head/day
(liter)
Hyderabad 4 1,719 1,588 114 8 8 6.7
Sanghar 5 604 84 206 96 218 5.0
Absentee 3 177 122 32 4 3 6.4
Other 7 324 190 106 28 0 4.3
Total 19 668 446 122 38 60 5.3
Table E-19 Production and Sales of Milk: Large Landowners

Appendix E - 16
Table E-21 and E-22 show the amount of milk purchased and self-consumed for a household and
the per capita milk consumption per week for milk producing households and non-producing households
respectively. The tables indicate that the per capita consumption of milk for milk producing households is
much larger than non-producing households even though many of the non-producing households purchase
milk for consumption. It is also important to note that all of the non-producing households are lower strata
of social group, and thus they tend not to have enough resources to have alternative source of protein. The
fact poses an important implication for the development strategy of dairy industry, as the price increase in
milk is likely to benefit the milk producers but may damage the nutritious condition and food security of the
most impoverished strata of rural societies.
Number of
Sample HH
Total Milk
Purchased
per week
(liter)
Total Milk
Self
Consumed
per week
(liter)
Per capita Milk
Consumption
per week (liter)
Barchani 53 9 15 1.9
Large Landowner 1 52 5.5
Medium Landowner 2 14 28 2.3
Small Landowner 1 7 29 3.8
Marginal Landowner 5 12 22 2.2
Tenant 19 12 13 1.7
Non Farm Livestock 18 5 13 2.2
Other Non Farm 7 7 7 0.9
Kari Bakar 53 4 14 1.7
Large Landowner 1 6 72 4.6
Medium Landowner 1 19 1.7
Small Landowner 3 17 1.8
Marginal Landowner 10 5 15 1.5
Tenant 20 5 15 1.8
Non Farm Livestock 9 3 14 2.6
Other Non Farm 9 3 2 0.5
Juma Khan Talpur 53 5 14 1.8
Large Landowner 1 14 0.7
Medium Landowner 1 65 5.4
Small Landowner 3 4 4 0.6
Tenant 15 5 13 1.5
Non Farm Livestock 28 6 15 2.2
Other Non Farm 5 3 2 0.4
Total 159 6 14 1.8
Table E-20 Consumption of Milk (Total Households)

Appendix E - 17
Table E-21 Consumption of Milk (Milk
Producing Households)
Table E-22 Consumption of Milk (Non-milk
-producing Households)
Number of
Sample HH
Total Milk
Purchased
per week
(liter)
Total Milk
Self
Consumed
per week
(liter)
Per capita Milk
Consumption
per week (liter)
Barchani 38 6 16 2.1
Large Landowner 1 52 5.5
Medium Landowner 2 14 28 2.3
Small Landowner 1 7 29 3.8
Marginal Landowner 4 21 26 2.6
Tenant 6 23 2.6
Non Farm Livestock 17 7 14 2.3
Kari Bakar 31 0 22 2.6
Large Landowner 1 6 72 4.6
Medium Landowner 1 19 1.7
Small Landowner 3 17 1.8
Marginal Landowner 6 23 2.1
Tenant 12 23 2.7
Non Farm Livestock 7 18 3.2
Juma Khan Talpur 29 23 2.9
Large Landowner 1 14 0.7
Medium Landowner 1 65 5.4
Small Landowner 1 7 1.2
Tenant 7 26 3.0
Non Farm Livestock 19 21 3.0
Total 98 11 23 2.8
Number of
Sample HH
Total Milk
Purchased
per week
(liter)
Per capita
Milk
Consumptio
n per week
(liter)
Barchani 22 9 1.1
Marginal Landowner 1 4 0.7
Tenant 13 12 1.2
Non Farm Livestock 1 3 0.1
Other Non Farm 7 7 0.9
Kari Bakar 23 4 0.5
Marginal Landowner 4 5 0.5
Tenant 8 5 0.4
Non Farm Livestock 2 3 0.3
Other Non Farm 9 3 0.5
Juma Khan Talpur 25 4 0.3
Small Landowner 2 4 0.3
Tenant 8 5 0.2
Non Farm Livestock 9 6 0.5
Other Non Farm 6 3 0.4
Total 70 6 0.6

Appendix F
Periodical Data Collection

Appendix F - 1
Appendix F
I. The Periodical Farm Survey
1. Introduction
Periodical farm survey is an important activity to make master plan for livestock
development in Sindh Province. The main purpose is to know the actual situation of the farmhouse
and to understand true needs for the improvement the farmer`s social, economic status and technical
level. Specifically, it is to increase the productivity of livestock and incomes.
2. Plan of Study for Farm
(1) Taking the Farmer's Point of View
Project members will conduct their work from the point of view of the farmer. In this
project the livestock sector will be seen through the eyes of the farmer, and their needs identified.
After these needs have been identified, activities that meet these needs will form the backbone of
the project. Normally in projects, the needs with the greatest return for least investment receive
priority. In this project, even if the needs require substantial investments (for instance infrastructure,
animal breeding, etc), they must be met. Consequently, it is important to classify and consolidated
these needs into categories. Many interesting discoveries will emerge as these needs are met.
In the search and discovery process, there is no need to rely on high technology solutions.
It will be important to further polish and enhance the traditional practices and methods that are
serving the farmers well. Through the region specific products program, one leading output will be
various rural community developments that the local residents can take pride it. Traditional
practices will also be respected.
Through development cooperation it is important that the expression of “creating a
complete break for farmers from their present situation” be rephrased as “scattering the seeds, to act
as entry points for improvement to traditional agricultural practices and customs currently being
used”. To be a good seed, it must i) match the current situation, ii) be desired by farmers, and iii) be
relatively simple to establish. Once these seeds sprout, an environment (extension services) must be
provided that nourishes the development of these young seedlings. The origins of development lie
in the actions of the farmers. Without these actions, results will not eventuate. The projects point of
departure, will be from examining and analyzing the collected data and survey observations from
the point of view of the farmer, and then identifying those needs the farmer is interested in, can
easily resolve and break free from.
The project will examine the sought after needs from the perspective of i) yield
improvement, ii) product quality improvement, and iii) household livelihood improvement. These
will directly lead to increases in household income and poverty reduction. Indirectly connected with
increases in household income will be iv) other improvements in rural households, such as issues
related to rural community and gender. During Phase 1 of the project these needs will be identified
and brought into the spotlight to be addressed and polished in Phase 2.
(2) Subjects of survey farmers
In order to clarify the characteristics related to farm size and economic situation, strict
adherence to zoning will not be needed. For the purpose of this survey, farms involved in Dairy
Cattle “Included buffalo” will be classified as follows:
i) Small sized farmers
ii) Medium sized farmers
iii) Landless farmers (small scale farmers or agrarian labourers “Halley”)
iv) Large sized farmers
Before carrying out the farmer selections, the definition of small, medium and large will
be considered. (For large sized farmers, collecting data on all livestock will be overwhelming. In
this case a representative sample of 10 head will be sufficient.)

Appendix F - 2
In addition, it will be necessary to investigate the farmers of a fatting cattle and also farmers of
sheep, goat and camel in the dry land.
(3) A main purpose of survey
1) To grasp real situations and needs of the production sites for the preparation of the master plan
2) To prepare the questionnaires of the Community and Household survey to be carried out by a
local consultant
3) To assist to formulate suitable projects
Note: The focus should be placed on small landholders and landless farmers. The data will also be
taken from large and mid-size landholders as a reference.
(4) Survey methods
4.1 Farm households
1) Household interviews
2) Data collection by the project team members (only once)
3) Periodical collection of data by the counterpart or others (weekly)
4.2 Communities particularly
1) Workshops, group discussions, etc.
(5) Key points
- should consider the limitation of time, manpower, and budget
- should conduct the survey effectively and efficiently
- should obtain as accurate information as possible
Note: It should therefore be considered that the survey is conducted in collaboration with an
organization experienced in providing field training on livestock sector, or that the survey is
commenced as a pre-test with such organization.
(6) Selection of farm households
6.1 Easiness of the survey
- Good access to the farms
- Near to any city center
- Existence of suitable surveyors
- Full-time farmers
6.2 Attitudes of the farmers
- Interested to the survey
- Faithfull
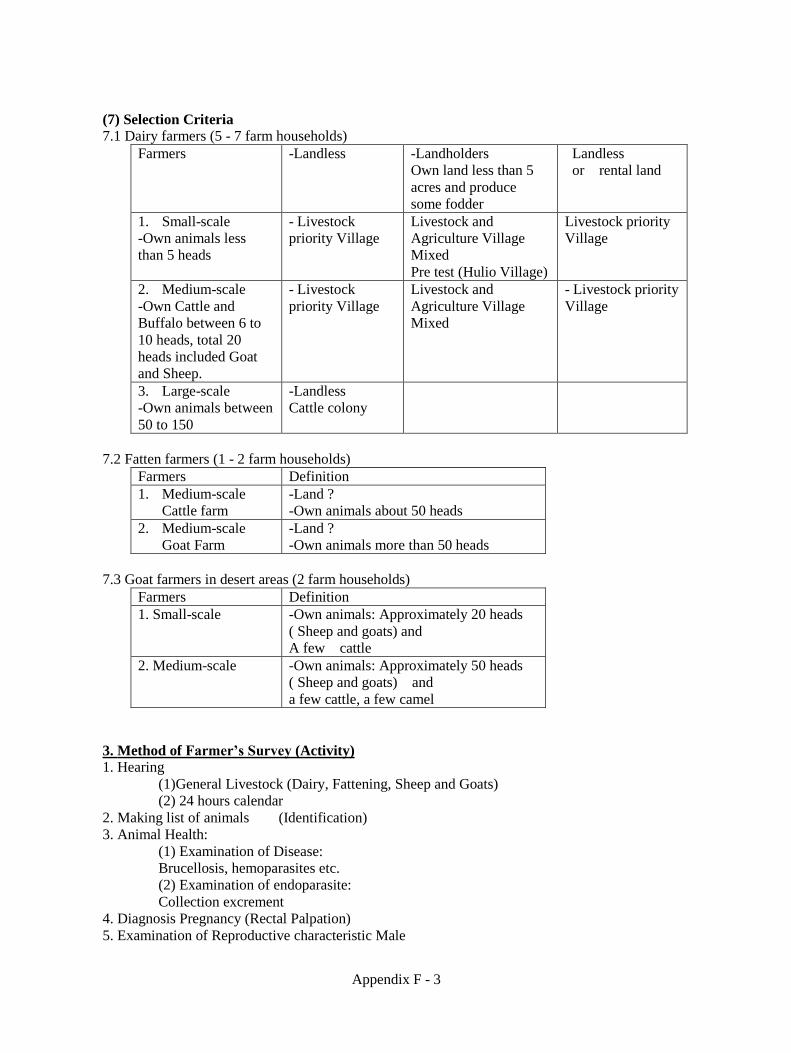
Appendix F - 3
(7) Selection Criteria
7.1 Dairy farmers (5 - 7 farm households)
Farmers -Landless
-Landholders
Own land less than 5
acres and produce
some fodder
Landless
or rental land
1. Small-scale
-Own animals less
than 5 heads
- Livestock
priority Village
Livestock and
Agriculture Village
Mixed
Pre test (Hulio Village)
Livestock priority
Village
2. Medium-scale
-Own Cattle and
Buffalo between 6 to
10 heads, total 20
heads included Goat
and Sheep.
- Livestock
priority Village
Livestock and
Agriculture Village
Mixed
- Livestock priority
Village
3. Large-scale
-Own animals between
50 to 150
-Landless
Cattle colony
7.2 Fatten farmers (1 - 2 farm households)
Farmers Definition
1. Medium-scale
Cattle farm
-Land ?
-Own animals about 50 heads
2. Medium-scale
Goat Farm
-Land ?
-Own animals more than 50 heads
7.3 Goat farmers in desert areas (2 farm households)
Farmers Definition
1. Small-scale -Own animals: Approximately 20 heads
( Sheep and goats) and
A few cattle
2. Medium-scale -Own animals: Approximately 50 heads
( Sheep and goats) and
a few cattle, a few camel
3. Method of Farmer’s Survey (Activity)
1. Hearing
(1)General Livestock (Dairy, Fattening, Sheep and Goats)
(2) 24 hours calendar
2. Making list of animals (Identification)
3. Animal Health:
(1) Examination of Disease:
Brucellosis, hemoparasites etc.
(2) Examination of endoparasite:
Collection excrement
4. Diagnosis Pregnancy (Rectal Palpation)
5. Examination of Reproductive characteristic Male

Appendix F - 4
6. Measure of the domestic animal (Genetic evaluation)
The weight?,Girth, Height, Length, Width hip, Width rump etc.
7. Evaluation type of udder
8. Milking:
(1) Milk production Kg
(2) Examination of mastitis:
The comparison between CMT and detergent method (Pakistan method)
(3) Milking time
9. Body condition score” BCS”
10. Facility for Livestock
11. Agricultural machinery
12. A measurement of the feed
13. A measurement of fodder in field
14. Feed analysis
15. Soil analysis
(Agreement of the Permission of activities for Farmer)
Farmer Name:
No Main Activities Agreement
1 Hearing General Livestock
2 Examination of Disease
Collection Blood sample
3 Examination of endoparasite
Collection excrement
4 Diagnosis Pregnancy
(Rectal Palpation )
5 Measure of the domestic animal
(Genetic evaluation)
6 Measure of Milk production
7 Examination of Mastitis
8 Measure of fodder in field
9 Use ear Tag

Appen
dix
F -
5
4.
Work
ing P
lan
of
Stu
dy
(6
mo
nth
s)
(1)N
ove
mbe
r(2
)Decem
ber
(3)J
anuar
y(4
)Febr
uar
y(5
)Mar
ch
(6)A
pril
1S
mall s
cale
Dair
y F
arm
er
(Landle
ss)
◎○
△△
△●
△△
△●
△△
△●
△△
△●
△△
△●
△△
◎
2S
mall s
cale
Dair
y F
arm
er
(Landhold
er)
◎○
△△
△●
△△
△●
△△
△●
△△
△●
△△
△●
△△
◎
3M
ediu
m s
cale
Dair
y F
arm
er
(Landle
ss)
◎○
△△
△●
△△
△●
△△
△●
△△
△●
△△
△●
△△
◎
4M
ediu
m s
cale
Dair
y F
arm
er
(Landhold
er)
◎○
△△
△●
△△
△●
△△
△●
△△
△●
△△
△●
△△
◎
5Larg
e s
cale
Dair
y F
arm
er
(Landle
ss)
◎○
△△
△●
△△
△●
△△
△●
△△
△●
△△
△●
△△
◎
6M
ediu
m s
cale
Fatt
enin
g C
att
leFarm
er
◎○
△△
△●
△△
△●
△△
△●
△△
△●
△△
△●
△△
◎
7M
ediu
m s
cale
Fatt
enin
g G
oat
Farm
er
◎○
△△
△●
△△
△●
△△
△●
△△
△●
△△
△●
△△
◎
8S
mall s
cale
Goat
and S
heep F
arm
er
in d
esert
are
a◎
○△
△△
●△
△△
●△
△△
●△
△△
●△
△△
●△
△◎
9M
ediu
m s
cale
Goat
and S
heep
Farm
er
in d
esert
are
a◎
○△
△△
●△
△△
●△
△△
●△
△△
●△
△△
●△
△◎
Dura
tion o
f S
tudy f
or
Farm
No
N
ote
: ○
:Mea
sure
men
t F
odd
er &
Pas
t (W
hole
day
work
)
◎
:Hea
rin
g, O
bse
rvat
ion,
Ear
Tag
g,
Mil
ikin
g R
ecord
etc
. (W
hole
day
work
)
△
: W
eekly
rep
ort
(H
alf
day
work
)
●
: M
onth
ly c
oll
ecti
on
Dat
a (W
hole
day
work
)

Appendix F - 6
5. List of the local technicians and farmers
(1) Small scale landless: Started date of survey: 30 Oct 2010
Survey by PDDC in Hyderabad
Name of Responsibility: Dr. Rasool Bux Soomro
Name of Technician in charge: Dr. Naheed Baloch
U/C: Maso Bhurghari, Village: Mathio Hajano,
Farmer: Mr.Ghulam Ali
(2) Small scale landholder: Started date of survey: 28 Oct 2010
Survey by Livestock Deptt.Mirpur Khas,
Name of Responsibility: Dr. Zawar Laghari
Name of Technician in charge: Dr. Naeem Siddique
Taluka: Hussain Bux Maree, Village: Haji Allah Bux Maree,
Farmer: Mr. Ali Hassan
(3) Medium scale landless: Started date of survey: 29 Oct 2010
Survey by Livestock Deptt. Mirpur Khas,
Name of Responsibility: Dr. Zawar Laghari
Name of Technician in charge: Dr. Naeem Siddique
Taluka: Hussain Bux Maree, Village: Haji Allah Bux Maree,
Farmer: Mr. Chattan
(4) Medium scale landholder: Started date of survey: 03 Nov 2010
Survey by Livestock Deptt. Tando Allhayar,
Name of Responsibility: Dr. Javaid Ahmed
Name of Technician in charge: Dr. Mazhar Ali
Taluka: Tando Allahyar, Village: Bachal Khaskheli,
Farmer: Mr. Manthar
(5) Large scale landless: Started date of survey: 02 Nov 2010
Survey by Livestock Deptt. Hyderabad, Hospital Old Cattle Colony
Name of Responsibility: Dr. Ghulam Jeelani
Name of Technician in charge: Dr. Muhammad Farooq Laghari
Taluka: Hyderabad, Old cattle colony
Farmer: Mr.Haji Aamir Ghouri
(6) Medium scale Fattening Farmer( Cattle): Started date of survey: 04 Nov 2010
Survey by Livestock. Deptt Sanghar,
Name of Responsibility: Dr. Javaid Ahmed Gujjar
Name of Technician in charge: Dr. Khushi Muhammad
Taluka: Jhole , Village:Jamaldin
Farmer: Mr. Haji Jamal Din
(7) Medium scale Fattening Farmer( Goat): Started date of survey: 04 Nov 2010
Survey by Livestock Deptt. Sanghar,
Name of Responsibility: Dr. Javaid Ahmed Gujjar
Name of Technician in charge: Dr. Khushi Muhammad
Taluka: Jhole, Village: Muhammad Sharif Marri ,
Farmer: Mr. Wazir Muhammad

Appendix F - 7
(8) Medium scale Sheep and Goats Farm in desert areas: Started date of survey: 14 Nov 2010
Survey by Livestock Deptt.Tharparkar
Name of Responsibility: Dr. Nobat Khan Khoso
Name of Technician in charge: Dr. Jhaman
Taluka: Mithi, Village: Mithrio Bhatti,
Farmer: Mr. Karman s/o Bhojo
(9) Medium scale Sheep and Goats Farm in desert areas: Started date of survey: 15 Nov 2010
Survey by Livestock Deptt.Tharparkar
Name of Responsibility: Dr. Nobat Khan Khoso
Name of Technician in charge: Dr. Jhaman
Taluka: Mithi, Village: Pabuhar,
Farmer: Mr. Pancho
6. Weekly data collection
It must be visit the farm once a week and carry out hearing. You decide with the consultation of
farmer to fix a day to visit every week. And you keep it in mind to visit it on the same day you decided with
the farmer as much as possible. It dates back between one week from a day before visiting it and interview it
such as income and expenditure, reproduction, animal health, feeding etc. There are not many people
recording it in a farmhouse. However, it seems that you can get it because farmer still memorize it for one
week.
You record all data in registers on the site and you must reconfirm its before returning. And you
make modifications it on the site, if you find some abnormal data. You must note the day when you
confirmed the delivery of the domestic animal. The measurement for body weight of newborn should be
taken.
7. Monthly data collection
It is a milk production and the weight measurement mainly. You do the day when we started an
survey with a basic day and you count it from a basic day on an measurement date of the next month and
carry it out during -3 days and +3 days.
(an example)
In the case of a day basic 15th
-3 days: 12th, +3 days: 18th
You carry out the measurement between 12th and 18th.

Appendix F - 8
II. Survey Results of Representative Farmers
1. Small-Scale Dairy Farmer (Landless)
1.1 Survey Background
Responsible Organisation: PDDC, Hyderabad
Responsive: Regional Manager Hyderabad, Dr. Rasol Bux Soomro
Person in Charge: Dr. Naheed Boloch
Surveyed Farmer: Mr. Ghulam Ali
Location: Mathio Hajano village, Maso Bhugari Union Council,
Hyderabad (sub-district), Hyderabad (district)
1.2 Introduction
This farm is close to Hyderabad city and was selected with the co-operation of PDDC. Mathio
Hajano village is in an irrigated area, about 20km north of Hyderabad town. In terms of gathering market
information and marketing produce it is well located. However, according to the Livestock Department the
village has not received any serious guidance on animal health practices. The surveyed farmer and his
neighbour’s livestock never vaccinated.
It is an old village, established in 1870. It is about 50 acres in area with 430 families living in the
village. Most of the villagers do not have own land. There are about 300 households in the village who do not
have own land, and are practising small-scale dairy farming. These families are thus unable to grow their own
fodder supply. Among the other households, there are ones who raise goats or sheep. These families are among
the few who look after dry (non-lactating) buffalo sharing from the commercial or cattle colonies around
Hyderabad. These farmers are depending on this source of income.
1.3 Criteria for Farmer Selection There were three candidate households that fit the category of small-scale landless farmer. All three
candidate households are located in Mathio Hajano village, Hyderabad. To evaluate (score) the farmers, we
first visited Mr. Shair Khan, second on the list. On his farm they do not graze the buffalo, but rather feed them
like a cattle colony. Not the type of farmer we wanted to survey for this category. Next we visited Mr. Ghulam
Ali, the first on the list. He is a landless dairy farmer who milks two buffalo, and fits the category of the farmer
sought, so we chose to survey him.
1.4 Farmer Outline Mr. Ghulam Ali lives in the village. Although his house is small, it is solidly constructed of concrete.
Although he is enthusiastic to improve his livestock skills, he is not good at reading or writing and keeps no
livestock production records. To date, he has received no guidance on livestock husbandry. He lives together
with wife, his eldest son (24 years old), and his eldest daughter (23 years old), a family of four adults.
1.5 Farm Management
Diagnosis of Farm Management from January to December 2010 was based on interviews conducted
over a 6 month period from November 2010 to May 2011, on weekly data collected, and monthly records of
weight measurements and milk tests. During this year there were frequent changes in livestock. Details of these
changes were confirmed on the last visit.
It turned out that Mr. Ghulam Ali is participating in a special sharing arrangement with commercial
dairy farmers in the vicinity of Hyderabad. He leases cattle out that are heavily pregnant to these farmers for
five months. This arrangement began some 3 years ago. In the village, there are 7 families that are participating
in this special form of share leasing. The name of the person who rents the cows is Mr. Sharif. A relative of Mr.
Ghulam Ali who lives in the village and works for this farmer, introduced the two. The lease period is for 5
months after calving, when milk yields are the highest. The fee is 12,000Rp. Once milk yields drop off in the
sixth month, the cows are returned to his farm. At this stage Mr. Ghulam Ali conducts the milking. We also
learnt he keeps dry buffalo from another commercial farmer until heavily pregnant for a monthly fee of
1,000Rp/head. Even though this is a special case of dairy farm operation, We completed the diagnosis, as it
may be of use in the future.

Appendix F - 9
1.5.1 Basic Information for Farm Management Analysis
(1) Family Labour & Labourer Rates
Table 1. Family labour.
Main
Occupatio
n
Land Owner
Farm work
Livestock work Hour Amount
/year
Ghulam Ali
55years
Manageme
nt
Dairy
No Cutting grass &
transport
2=Rp16 11,680
Wife 40
years
Multiple
work
Agriculture
5months busiest
season
Rp125/day
Milking & cutting
grass
4=Rp64 23.360
Son 24
years
Manageme
nt Dairy
No Watching grazing,
milking, Cutting
grass
8=Rp12
5
45.625
Daughter
17 years
Hose work
Labor
Agricultur
e
Agriculture
5months busiest
season
Rp125/day
No No No
Total 80,665
(a) Farm labour rates in the village are 125Rp/day (8 hour day).
(b) Farm income for his wife and daughter (they work in the land owner's fields: a 5 month
farming season) is 2 persons x 5 months x 30 days = 300 days x 125Rp = 37,500Rp.
(2) Employees
Temporary employees work for 6 months a year. Their main work is watching grazing animal.
Their monthly wage is 2,300Rp. They work for 5 months. The total annual salary is 11,500Rp.
(3) Animal Stock Purchases
No animal stock purchased in survey period.
(4) Livestock Inventory
Mr. Ghulam owns 2 adult female buffalo and 2calvess. Other livestock includes those being looked
after.
(5) Feed
(i) Berseem
For the 2.5 months from late January to late March they buy feed. Mr. Ghulam Ali buys the crop from
a 0.25 acre portion, from their relatives at a special price of 3,000Rp.
(ii) Concentrate Feed
He feeds the milking cows a concentrate feed of cotton seed cake and wheat bran throughout the year.
Total amount is 1,825kg/year, which costs a total of 45,625Rp..
*Cotton seed cake: 30Rp/kg x 2.5 (head of cattle) x365 days = 27,375Rp.
*Wheat bran: 20Rp/kg x 2.5 (head of cattle) x 365 days = 18,250Rp.
(iii) Wheat Straw
The farmer bought 2,200kg of wheat straw in December for 9,000Rp.
(6) Depreciation of Water Buffalo
In the Hyderabad cattle colonies there are examples of 16-year-old water buffalo still being milked.
For commercial purposes though, calculations will assume the milking life of a buffalo is from the beginning
of first milking and lasts for 10 years. The value of a heifer about to begin milking in a cattle colony (referring
to trading prices among commercial dairy farmers in the district) is provisionally 100,000Rp. For small to

Appendix F - 10
medium-scale farmers in rural areas it is 70,000Rp.
(7) Depreciation of Buildings and Equipment
(i) Cattle Shelter
A simple thatched roof shelter 5m x 6m, 30m2 in area. The buildings are thought to last about 5 years.
They were built 3 years ago. As no materials were purchased, only the labour of building it will be taken into
account.
Labour: 125Rp/day Building: 1 (day) x 3 (labourers),
Material Collection: 2 (hrs.) x 15 (days) x 1 (labourer)
Total : 855Rp.
Depreciation of one third of this is 285Rp
(8) External Farm Earnings
Sharing of dairy cows after calving: 12,000Rp (5 months)
Sharing of dry cows until calving: 1,000Rp/day
Looking after cattle grazing during the busy farming season: 60Rp/head/day.
1.5.2 Diagnosis of Dairy Farm Management
(1) Summary of Operation Results
Table 2. Abstract of results of Farm Management.
Last year This year Comparing174,075163,615-92,415
4,38585,050
30
80,66526,888
Production Cost 92Production Cost 9,192
1.8593.3??
40?
Beginning year 0End of year 0
Average Fat % %Average Fat non solid %
The total production milk (Ton)Production milk Kg / cow
Number of cow (head)The total land area of fodder (Acre)
Production cost Rp/milk 1KgProduction cost Rp/milk 100Kg
Balance of liabilities Rp
Total income family (Rp)Income / cow (Rp)
ArticulCurrent year total production cost Production CostSales gross profitNet profit yearNet income year
Liabilities
Technical Level
Dairy situation
Average of milk price RpAverage of interval parturition Months
Income labor family
Feeding size
(i) Scale of Farm Management
A small-scale dairy farmer milking only the 2 adult female buffalo he owns. As he does not own land,
he cannot increase his self-sufficiency in feed supply.
Table 3. Livestock inventory. Table 4. No. of labourers. Number of family 4
Dairy Beef Buffalo Working number family 13 2.5 Dairy work number 33 2 1 Employment Permanent 0
Introduction Employment Temporary 1Birth, Transfer 1 Child count 0.5 person.Sale 1Accident, CullingTransfer
3 3 2
Enter
Out
End of year
AverageBeginning year
Category CowYounganimal
New calfFattening animal
(2) Seasonal Production Costs
From the table, production costs are 174,075Rp (see Table 5). This is a cost per adult female cow of
58,025Rp. Milk costs about 92Rp/litre to produce. You can see it is quite a high production cost. As the
market price for milk is 40Rp/litre, you realise the severe conditions of farm management.

Appendix F - 11
Table 5. Cost of production.
3.Cost of production SDLL Milking Cow number 3 Heads
(1)Current year production cost (Unit:Rp & %) *Total number of cow & buffalo: 3 Heads
Annual produc. Milk: 1780 0 1780 Kg
Saling Self-consumption Total
ArticulAmount of
moneyCost/Cow
% ofdistribution
Maiting cost 0 0 00 0 0
57,625 19,208 330 0 0
Employment 11,500 3,833 xFamily (A) 80,665 26,888 46Total 92,165 30,722 53
500 167 00 0 00 0 0
Building, construct 285 95 xMachine, vehicle 0 0 x
Domestic animal 21,000 7,000 x
Total 21,285 7,095 12
1,000 333 1500 167 0
1,000 333 10 0 0
174,075 58,025 146
Purchase concentrate:1 ,825 Kg
8,650 2,883 2 calves 50Kgx2
0 0
10,110 3,370 2 Heifer0 0
9,000 3,000
163,615 54,538
Production Cost /Cow 54,538Production Cost / 1 Liter milk 92Production Cost / 100 Liter milk 9,192
③Amount of cow transferred within the year
⑥Sale young & fattening animals
Fuel
Depreciation
Repar costTool of Livestock & Agriculture
②Value of animals beginning of the year
④Value of animals end of the year
Purchase Livestock animal (from outside)Purchase Feed
Material for production Feed (Seed, Fertilizer etc.)
Labor
Medical treatment & medicine
Production cost①+②-③-④-⑤-⑥
Cost of consumption, Communication, TransportCost of rental
①Current year production cost total
⑤Sale of calves
Electricity & Water
The concentrate feed, which is cotton seed cake and wheat bran, is fed to the milking cows every day
(1kg/head, for a total of 2kg/day). This represents about 33% of costs. In Japan, the concentrate feed would
represent about 40~45% of costs, a considerably higher figure. When you take into account the heating,
veterinary, building, facilities and equipment costs sustained in Japan compared to virtually nothing in this
district, you can comprehend the robust, low cost, management structure that is in place.
(3) Calculation of Profits/Loss
See calculations in Table 6.
Gross sales are 174,075Rp. There is a gross deficit of 92,415Rp on these sales. With a production
cost of 92Rp/litre, this result is only natural. However, this farmer is actively involved in other forms of
revenue raising, such as lending and taking care of other cattle, as well as looking after neighbouring farmers
cattle, grazing them during the busy farming season. When you take these other external farm revenues
(96,800Rp) into account, together with his family's labour revenue, the family clears 85,050Rp per year.

Appendix F - 12
Table 6. Profit and loss calculations.
Amount (Rs. ) Amount per cow(Rs. )
0 0Sale of milk 71,200 23,733Sale of calves 0 0Sale young & fattening animals 9 ,000 3,000Other 0 0Total (B) 80,200 26,733①Value of animals beginning of the year 8,650 2,883②Current year total production cost 174,075 58,025③Amount of cow transferred within the year 0 0④Value of animals end of the year 10,110 3,370Total cost of Sales(C) ①+②-③-④ (C) 172,615 57,538
-92,415 -30,805Sales cost 0 0Insurance fee 0 0Office cost 0 0Labor cost 0 0⑥Total 0 0
-92,415 -30,805Interest receivable 0 0Subsidy and compensation 0 0Other 96,800 32,267⑦Total 96,800 32,267Interets payable 0 0Rents payable 0 0Other 0 0⑧Total 0 0
4,385 1,46285,050 28,350
Net prof it year (D) ⑤-⑥+⑦-⑧
Net income year (A) +(D)
Non-operatingcost
Articul
Revenue fromlivestock
⑤Sales gross prof it (B) - (C)
Non-operatingincome
Selling, generaland
administrativeexpenses
Operating prof it (Business prof it) ⑤-⑥=(E)
Cost of sales
Note: Non-Operating Income (profit) ,
Sharing milking cows for 5 months: 12,000Rp/head. (2,400Rp x 2 months = 4,800)
Salary for looking after animals: 60Rp x 5 (head) x 150 (days) = 4,5000Rp. Looking
after dry cows : 7 (head) x 5 (month) x 1,000Rp = 35,000Rp
Total 96,800Rp.
(4) Analysis and Technical Evaluation of Dairy Farm Management
For this landless farmer, a production cost of 54,538Rp per head of adult female animal is high. This
is especially so as the annual milk yield per head of adult female animal of 593 litres/year is an extremely low
result (see Table 7). As mentioned previously, the reason for this is he is lending the cows out for 5 months for
12,000Rp prior to his own milking. With a milk yield of 1.6 litres/head/day, he is only earning 23,733Rp.
In comparison to the revenue earned from milk sales, the price of providing feed concentrate is
extremely high at 81% of expenditures. If possible, this should be below 50%, in an ideal situation 30%. This
works out to be a feed efficiency of 0.97 for the concentrate feed, a low figure. In future, taking into account the
energy of the feed, when a good quality formula feed is supplied, a feed efficiency of 2.50 should be obtainable.
That is, for every 1kg of formula feed supplied, 2.5 litres of milk is produced.

Appendix F - 13
Table 7. Analysis of Farm Management.
Category Item Year 2010
Beginning of year Number of cows: Head 3Land area of fodder: Acres 0Land area fodder per Cow: Acres 0.00Area of Pasture : Acres 0
Area of Pasture per Cow: Acres 0.00Cost / Cow Rp 54,538Cost / 1 Kg Rp 92
Cost / 100 Kg Rp 9,1921) Production milk / Total cows Kg 5932) Production milk / Milking Cows Kg 593
3) Day production / Total Cows Kg 1.64) Day production / Milking Cows Kg 1.6
5) Milk production rate: Produc milk Kg per Total cows / Produc. Milk Kg permilking cows %
100
6) Milk sale incom / Total Cows Rp 23733
7) Milk sale incom / Milking Cows Rp 237338) Average of Fat rate % ?9) Average of Non Fat Solido rate % ?10) Average of milk sale price Rp 4011) Average of Parturition Number on beginning year ?
12) Average of Parturition Number on Culling ?13) Average of Parturition Interval day ?14) Rate of purchase feed Rp / Milk income Rp % 81
15) Efficiency Feed: Total production milk Liter/Total concentrate used Kg 0.97
16) Efficiency Feed: Total production milk Liter/Total Formula feed used Kg Not use
17) Concentrate feed Kg / Total Cows Kg18) Formula feed Kg / Total Cows Kg Not use19) ⑤Sales gross profit Rp / Total cows Rp
% of sale milk Sale incomeRp/Using home Rp 0% of sale milk Sale income Kg/Using home Kg 100
Farm situation
Production Cost
Technique Level
1.5.3 Productivity
(1) Calf Growth
We monitored the weight of 2 calves (see Table 8). A daily weight gain of 240g and 220g per day. A
result that is lower than the village average (350g/day).
Table 8. Weight of the two calves.
Oct Nov Dec Jan Feb Mar Apr May DG gNo.13 64 75 77 78 81 96 108 240gNo.15 42 44 51 54 55.5 222g
0
20
40
60
80
100
120
Oct Nov Dec Jan Feb Mar Apr May
Growing curve for calf
No.13 No.15
Figure 1. Growth curve of the calves.
(2) Milk Yield
We observed the milking of the two water buffalo. A low average milk production rate of 2 to 3
litres/day was observed. In addition, the period taken to milk the buffalo was quite long. Though No. 10 was
calved in October 2009, becomes dry by April 2011 (16 months lactation period). No. 11 was calved in March
Appendix F - 14
2010 and becomes dry in March 2011 (12 months lactation period).
1.5.4 Production Model
We calculated the extra sales if the farmer did not lend his cows out for the first 5 months after
calving, and milked them himself. The result was that there was not much difference in revenue income.
1.5.5 Goats
The farmer owns only 1 female goat, and looks after another 3 young female and 1 male goat. The
agreement was that he would receive half of the kids born. When the animals are sold, he will receive half the
sales price. For breeding buck is borrowed from the village for free to service the female goats.
1.5.6 Cost of Living
The average weekly cost of living over 6 months was 2,063Rp. This works out to be 8,841Rp/month,
or 106,092Rp/year. With an annual net income of 69,910Rp, this leaves a shortfall of 36,182Rp in the cost of
living. The income of the farm labour wife and daughter does, amounts to 37,500Rp/year, so the family
manage to scrape by.
Table 9. Breakdown of weekly expenditures.
Description Rp %
Mainpuri, Sopari 301 14.6
Food and beverages 1273 61.6
Apparel, textile, footwear 100 4.8
Transport and communication 66 3.2
Fuel & Lighting 300 14.5
Medical care 23 1.1
Total 2063 100.0
Food costs represent 61.6% of expenditures, a high Engels co-efficient. Moreover, it is interesting to
note that within this tight budget lifestyle, the patriarch's tobacco represents 14.6% of expenditure.
1.6 Feeding Management
Mr. Ghulam Ali is responsible for the livestock, while his son actually carries out the livestock
management. However, milking and supply of feed is performed by both his wife and son.
1.6.1 Livestock Facilities
The only facility he uses is a thatched roof livestock shelter. When the animals return from grazing
they are tethered to stakes in the ground.
1.6.2 Daily Routine
4:30am Feeding time, 5:00 am Milking, 9~16:00 Grazing, watering and bathing, 18:00 pm Milking, 19:00
pm Feeding time, 20:00 Watering.
1.6.3 Milking
After parturition, the calves are used to stimulate milk let down before milking. It was explained that
when the calves are separated from their mothers, injections of oxytocin are used to stimulate milk production.
Though it was learnt only at the end of the survey, that this farmer lends out his water buffalo for 5 months just
after calving (the period when milk production is highest) to a nearby commercial dairy farmer for 12,000Rp.
In the 6th month, after the buffalo have become accustomed to injections of oxytocin, the buffaloes are
returned to him and milking using this chemical stimulation is continue

Appen
dix
F -
15
1.7
Fee
d S
yst
em (
Gra
zin
g, C
ut
& C
arr
y a
nd
Cro
p r
esid
ue
Mix
ed)
(1)
Fee
din
g c
alen
dar
12
34
12
34
12
34
12
34
12
34
12
34
12
34
Gra
zing
Wat
erco
urse
ban
k
Bat
hing
are
a
Open
are
a(O
pen g
razi
ng a
rea locate
d a
long I
ndus
river)
Stu
bble
fie
ld
(Wheat
stubble
)
Purc
has
ed f
eed
sB
erse
em (
1/4
acr
e)
Whe
at s
traw
Mill
et s
tove
r
Sug
erca
ne top (
Fre
e of ch
arge
)
Cotton
seed
cak
e (M
ilkin
g co
w)
Whe
at b
ran
(Milk
ing
cow
)
511
12
12
34
Fig
ure
2 F
eedin
g c
alen
dar
duri
ng R
abi
Sea
son

Appendix F - 16
(2) Feeding management
This farmer milks late lactating buffalo and gets 2 litres per day. Although the buffalo are raised
mainly by grazing, lactating buffalo are fed supplemental feed (see Table1.10). Judging from the nutritive
value of this feed, the nutrition required to maintain the body and produce 2 litres of milk per day is 4.17kg
TDN and 0.58kg DCP. When the nutritive value obtained from supplementary feed is subtracted from this, it
is estimated that 50% of TDN and 62% of DCP needs to be obtained from grazing. It is approximately
14.5kg (3.4kg DM basis) of native grasses (see Table 11, Figure 2).
Table1.10 Value of Supplemental Feed for Buffalo
Supplemental Feed DM intake TDN DCP
Kg
Wheat straw (2.5kg) 2.3 0.91 0
Wheat bran (1.25kg) 1.13 0.83 0.14
Cotton seed cake (0.5kg) 0.44 0.35 0.08
Total (4.25kg) 3.87 2.09 0.22
DM: Dry Matter TDN: Total Digestible Nutrients DCP: Digestible Crude Protein
Table1.11 Nutritive Value of Native Grasses
Native grasses DM DCP TDN
Cynodon dactyon (early vegetative) 19.1 8.3 56.9
Cenchrus setigerus (early bloom) 21.9 14.2 70.5
Dactyloctenium aegyptium (early bloom) 28.6 9.5 58.7
Average 23.2 10.7 62
%
1.8 Reproduction
In the village, the raising of about 20 dry cattle is shared between two families. Each farmer keeps
one stud bull, and when a female is in heat the stud bull is borrowed for free service. Water buffalo are
determined to be in heat when a special roaring is heard. They come into heat mostly at night (80%), with the
rest during the day (20%). The female in heat is brought to where the stud bull is kept for servicing. To promote
servicing, the female is tethered to a rope. In November 2010,we conducted a pregnancy appraisal on two
milking buffalo. Both were not pregnant. They came into heat in February and became pregnant.
1.9 Animal Health
1.9.1 Foot &Mouth Disease
Disease come during January the farmer treated their animals locally by feeding 2eggs per buffalo.
1.9.2 Result of examination of samples at CVDL Tandojam.
Blood, milk and faecal sample were collected from 3 animals. Several endoparasites were detected
but brucellosis was found negative.
1.9.3 Treatment of Livestock Diseases
In cases of serious sickness, the livestock are seen by a private veterinarian in Hyderabad. The cost of
treatment depends on the treatment, but ranges from 300~1,000Rp. With Pakistan having such a long history
of raising cattle, the main means of treating sick or diseased livestock is the traditional way of treatment, that
has been handed down from grandfather to father to son. It is quite interested in this tradition. Putting aside the
effectiveness of these treatments for now, the main treatments are:
1. Cold (cough): No special treatment.
2. Diarrhoea: Give them butter.
3. Internal Parasite Control: They have not treated
4. Afterbirth Lethargy: Extract placenta and give an infusion of neem.
5. Vaginal Prolapse: Use a local traditional wooden/rope frame to support external vulva.
Appendix F - 17
6. Tympani: Occurs when the animals are feeding on Egyptian clover. Feed them oil,
and relieve the gas build up.
7. Dystocia: Depend on local techniques.
8. Sub-Clinical Mastitis: Give the animal a potion made up of red chillies, sugar, and oil.
9. Promotion of Heat: Give the animal a herbal medicine sold in the village that is called
Burinjeno, Brinjal, Laong etc.,
10. Hoof Trimming: This is down by a carpenter in the village using local techniques.
1.9.4 Mastitis
We conducted a sub-clinical mastitis test on the 2 water buffalo that were being milked. At milking
no special precautions are being taken to clean the udder, but the tests were negative.
1.9.5 Vaccinations
The farmer did not know about vaccinations, therefore the livestock never received any vaccinations.
1.9.6 Common Livestock Diseases
The most common diseases found are HS, FMD, CCPP, PPR, Enterotoxaemia.
1.10 Breeds The water buffalo being raised were Kundhi buffalo, small in body size and with low milk yields.
Selective breeding has not occurred to improve productivity of the breed. Moreover, there are no plans at this
date to do so. The two stud bulls being kept in the village were normal, unimpressive males. If the genetic
capacity of these water buffalo stud bulls was much higher, then over time the capacity of the entire villages
water buffaloes would be improved. This will need to be considered in the future.

Appendix F - 18
2. Small-Scale Dairy Farmer (Owns Land)
2.1 Survey Background
Responsible Organisation: Livestock Department, Mirpurkhas district
Responsive: Mr. Zawar Ali Leghari (head of district Livestock Department
since July 2008)
Technical Person in Charge: Dr. Naeem Siddiqhe
Surveyed Farmer: Mr. Ali Hassan
Location: Haji Allah Bux village, Hussain Bux Maree sub-district,
Mirpurkhas district.
2.2 Introduction The farmer was selected with the co-operation of the Livestock Department, Mirpurkhas district, and
with the permission of the land owner, Mr. Shah Baig (owns 500 acres of land). Haji Allah Bux village is
located in an irrigated area, 7 km from the town of Mirpurkhas (about 20 minutes away). This village was
established in 1850, and is quite old. The village covers an area of about 15 acres, and contains 67 households.
Most of the families in these households are tenants and working for the above mentioned land owner. They
either rent land or graze the stubble in the harvested fields of the land owner, or utilize agricultural residues. A
very good relationship has been established with the land owner. In Mirpurkhas district there are two
privately run commercial animal markets. An urban cattle market held on a Tuesday (about 200 head of cattle),
and a small-scale farmer market held on a Wednesday (around 400~500 head of sheep & goat).
2.3 Criteria for Farmer Selection The farmer was selected with the co-operation of a C/P Dr. Arif Khan. Three candidate farmers were
identified as potentially fitting the category of small-scale farmer with property. Each farmer lives in a
different district, one in Tando Allayar district, another in Hyderabad district, and the third in Mirpurkhas
district. As they are quite some distance from each other, it would have been difficult, in terms of time, to
re-evaluate each of them. So the farmer with the highest evaluation score was chosen.
2.4 Farmer Outline
Mr Ali's house sits in the middle of fields for as far as the eye can see. His house is one of a cluster of
three houses. His house is a simple house made from mud walls and a roof. Mr. Ali is a Muslim, while the other
two families are Hindu, and they are farmer labourers who do not have own land. Mr. Ali himself owns 5 acres
of land. He grows sugar cane, wheat, sorghum, and berseem clover. He also manages part of the owner's land
everyday in the morning. He receives 1,050Rp for this. As he graduated from primary school, he can read and
write. He does not however keep a record of the livestock on his farm. The make up of his family, is two sons
and a wife (a household of 5).
2.5 Farm Management
The 5 acres he owns is valued at 300,000Rp/acre. All the farm labour is carried out by family
members. He has no special need to hire labourers. Even though he is a small-scale farmer, he is blessed with
owning property. His farm management strategy is to improve the profitability of his farm, while supporting
his livestock by working in his spare time. The climate and fluctuation in crop prices is quite severe in this area.
There is also the handicap of the need for large investments. On the other hand, revenues are also quite
substantial, so farming is a worthwhile pursuit. Of the 2 adult female water buffalo he keeps, 1 he is taking
care of for somebody else. He is also taking care of two heifers. Thus he only owns one of the 4 livestock
being raised. There is little desire to increase his livestock holdings. However, he is growing feed, such as
berseem clover and Jantar. Moreover, the agricultural residues from wheat, cotton, and sugar cane production
could be used for feed. The livestock production potential for farmers who own land is large.

Appendix F - 19
2.5.1 Basic Information for Farm Management Analysis
(1) Family Labour and Labourer Rates
See details of family labour in Table 12.
Table 12. Family labour.
Main
Occupatio
n
Own Farm work Livestock work Hour Amount
/year
Ali Hussan Managem
ent of
Land
Owner’s
farm
Management Management 2=Rp16 11,680
Wife Multiple
work
Work Milking, clean 2=Rp16 11,680
1st Son
26year
Work in tenant
land
No No No
2nd
Son19year
Work Watching grazing,
milking, Cutting
grass
8=Rp12
5
45.625
Total 68,985
(i) Wife's Farm Labour
Mr. Ali's wife works on the farm from 7~11am, and again from 2~6pm (a total of 8 hours).
(2) Revenue
For the 6 months from November 2010 to May 2011 (see Table 13).
Table 13. Revenues.
Content Total %
Income of
Agriculture
Sugarcane, Wheat, Cotton Rp72,000 67
Management of
landowners farm
Rp1,050/week
Rp27,300/6 months
Rp27,300 25
Dairy Not selling milk、sell young buffalo
Rp9,000/head
Rp9,000 8
Total Rp108,300 100
(3) Expenditure
For the 6 months from November 2010 to May 2011 (see Table 14).
Table 14. Expenditure.
Content Total %
Fodder Berseem seed:3,160, Jantar
seed:1,200,
Rp4,360 8
Feed Wheat Straw: 1,050 Rp1,050 2
Cost of agriculture Wheat seed:4,000, Cotton sed:1,400,
Tractor for leveling,
preparation:16,300,
Sowing:2,000,Urea:23,000, DCP:Free
Rp46,700 90
Total Rp52,110 100

Appendix F - 20
2.5.2 Diagnosis of Dairy Farm Management
He does not sell milk; moreover no milking occurred during the survey period. Thus no data could be
collected. Thus a dairy farm management diagnosis could not be performed.
2.5.3 Cost of Living
During these 6 months the average weekly cost of living was 6,334Rp (see Table 15), which works
out to be 25,336Rp/month or 329,368Rp/year.
Table 15. Details of average weekly expenditure.
Description Rp %
Food and beverages 4,010 63
Apparel, textile, footwear 358 6
Transport and communication 1,043 16
Fuel & Lighting 70 1
Medical care 858 14
Total 6,334 100.0
Purchase of food commodities represented 63% of this expenditure, a high Engels co-efficient.
2.6 Feeding Management
Mr. Ali Hassan is the person in charge of livestock management, while the actual management of
livestock is carried out by his second son. However, the work of milking and feeding the livestock is carried
out by both his wife and second son. In the start 2 adult female buffalo and 2 heifers were registered in
November. During first visit he did not explain that his own buffalo is only and remaining were on sharing
basis.
2.6.1 Livestock Facilities
Two paddocks surrounded by thorny bushes (called a lorho in the local language), where buffalo and
goats are kept.
2.6.2 Goat Management
Although this was of interest to the survey, these goats were owned by his eldest son and we missed
the opportunity to ear tag and weigh these animals.
2.6.3 Daily Routine for Water Buffalo
6:00am: Milking
8:00: Tethered to a tree beside the canal
9~17:30: Grazing, watering, and bathing
18:00: Milking
20:00: Feeding
2.6.4 Milking
Normally the milking is done twice a day. When late in the lactating period, the milk yields are low,
and they only milk in the morning during this period. No special measures are taken to clean udders at milking.
2.6.5 Grazing Grazing land of the land owner is close by his home. Watching on grazing animals carried out by the
neighbour’s son. The allowance for this watching is not money, but rather provision of grain once a month. The
appetite of the water buffalo is hearty and they continue to eat continuously for a long time without resting.
They particularly prefer to eat a short grass (a Cinodon type). They can chew this well, which supports the fact
they have large capacity rumen. The water buffalo have a relatively narrow tongue compared to cattle, thus the
tongue appears to be long and narrow. They deftly manoeuvre this tongue to search for fodder and seem to eat
faster than cattle.
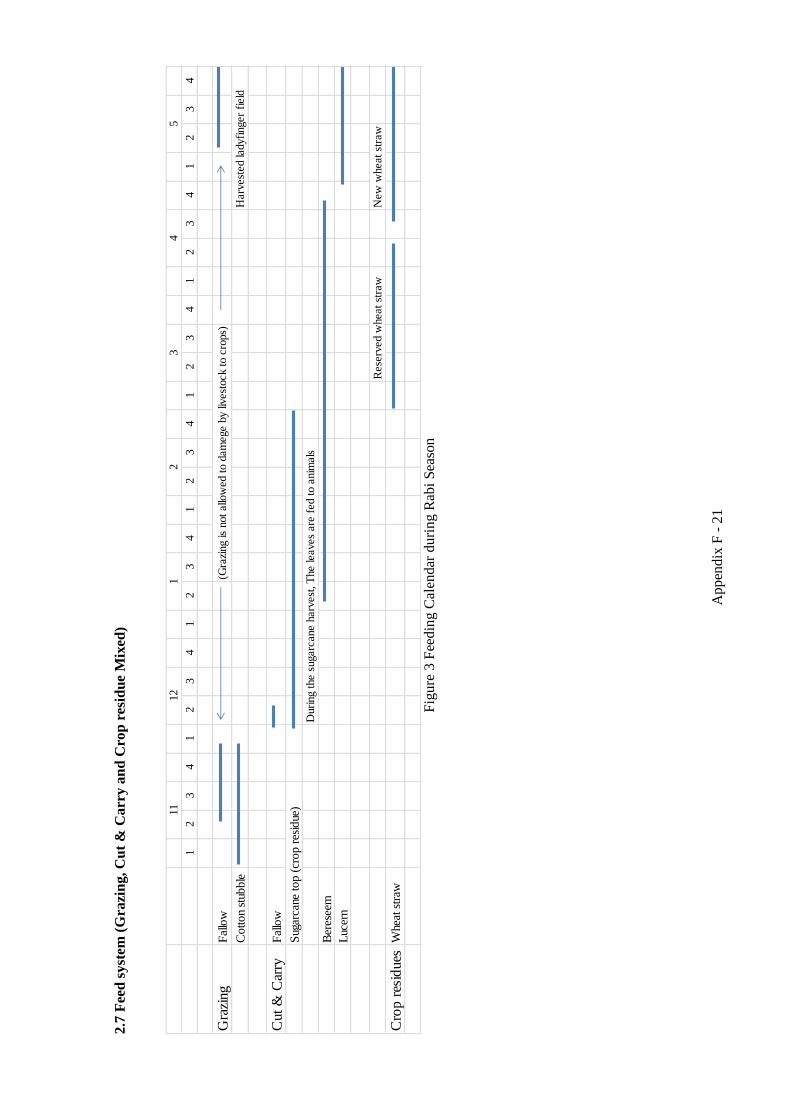
Appen
dix
F -
21
2.7
Fee
d s
yst
em (
Gra
zin
g, C
ut
& C
arr
y a
nd
Cro
p r
esid
ue
Mix
ed)
12
34
12
34
12
34
12
34
12
34
12
34
12
34
Gra
zing
Fal
low
(Gra
zing is
not
allo
wed t
o d
am
ege b
y liv
est
ock t
o c
rops)
Co
tto
n st
ubb
leH
arv
est
ed ladyfi
nger
field
Cut
& C
arry
Fal
low
Sug
arca
ne to
p (
cro
p r
esid
ue)
Duri
ng t
he s
ugarc
ane h
arv
est
, T
he leaves
are
fed t
o a
nim
als
Ber
esee
m
Luc
ern
Rese
rved w
heat
stra
wN
ew
wheat
stra
w
Cro
p r
esid
ues
Whe
at s
traw
511
12
12
34
Fig
ure
3 F
eedin
g C
alen
dar
duri
ng R
abi
Sea
son

Appendix F - 22
2.8 Reproduction
The two buffalo heifers becomes in heat during December, but were not serviced by a bull. At this
point the Livestock Department technician gave the buffalo heifers a hormone injection for induction of heat.
After this they came into heat at irregular intervals. They were artificially inseminated by local technician and
pregnancy was not confirmed yet.
2.9 Animal Health
2.9.1 Common Livestock Diseases
The most common found diseases are HS, FMD, CCPP, PPR, Enterotoxaemia, and contagious
pneumonia.
2.9.2 Vaccinations
The Livestock Department provides guidance on HS, CCPP, Enterotoxaemia vaccinations.
2.9.3 Diseases during Survey
During the survey the following were observed, fever as a result of coli, mange, and death by rabies
of a buffalo heifer being nurtured.
2.9.4 Result of examination of samples at CVDL Tandojam.
Blood, milk and faecal sample were collected from 3 animals. Several endoparasites were detected
but brucellosis was found negative. 1 Positive for Blood Parasite (Anaplasma marginate)

Appendix F - 23
3. Medium-Scale Farmer (Landless)
3.1 Survey Background
Responsible Organisation: Livestock Department, Mirpurkhas district
Responsive: Mr. Zawar Ali Leghari, Head of District (head since July 2008)
Person in Charge: Dr. Naeem Siddiqhe
Surveyed Farmer: Mr Chattan
Location: Haji Allah Bux village, Hussain Buz Maree sub district,
Mirpurkhas district.
3.2 Introduction
This farmer lives in the same village as the surveyed small-scale farmer who owns land. Please see
No. 2.2 that for a description of the village.
3.3 Criteria for Farmer Selection
This farmer was selected with the co-operation of a C/P Dr. Babbar. Three candidate farmers were
identified as fitting the category for medium-scale farmer (landless). As these farmers were located in
Hyderabad district, Tando Allayar district, and Mirpurkhas district, it was, for time reasons, difficult to
re-evaluate each farmer, so the farmer with the highest evaluation score was chosen to be surveyed.
3.4 Farmer Outline
Mr. Chattan lives in a house about 100m from the landowner. He lives in an earthen wall tenement
style house. He lives in a cluster of 8 households, all relatives. In the courtyard of each house, water buffalo,
cattle and goats are kept. He is the leader of this cluster of eight households. Moreover, in the mornings he
manages a portion of the land owner’s property for a weekly allowance of Rs.700. He rents 5 acres from the
land owner to cultivate wheat, cotton, and sugar cane. In the afternoons he manages his own fields, and
livestock. As he cannot read or write he does not keep any records of his farm. About once every month a
meeting of the relatives is held. At this meeting opinions about livestock management, etc. are exchanged. Livestock income is based on market sales. The reason for this is that when selling through middlemen, the
selling price is low and losses are made. The make up of his family is 2 sons, 2 daughters, and a wife (a
household of 6).
3.5 Farm Management
The diagnosis of Farm Management is based on data gathered from interviews conducted during the
5 months of the survey, from November 2010 to May 2011, as well as data collected weekly , and from
monthly monitoring of livestock weight and milk tests.
3.5.1 Basic Information for Farm Management Analysis
(1) Family Labour and Labourer Rates
Table 16. Family labour.
Main
Occupation
Tenant Land,
Own Farm
work
Livestock
work
Hour Amount
/year
Mr.Chattan Management
of Land
Owner’s farm
cultivation Management 1=Rp16 5840
Wife House work 7~11 am
2~18 pm
Milking &
cleaning
2=Rp32
11680
1st Son 12
years
Student 4 hours in the
morning
Watching on
grazing &
cutting grass
4=Rp32 11680
2nd
Son 6 Student Helping in Watching on 4=Rp32 11680

Appendix F - 24
years agriculture
work
grazing
1st Daughter
11
Supporting in
house work
Helping Cutting grass 2=Rp16 5840
2nd
Daughter 5 Child No Cleaning 0
Total 46720
(i) Women's Agricultural Labour
The women work on the farm from 7 ~ 11:00am, and again from 2~6pm (a total of 8 hours).
(ii) )Sons
Mr. Chattan's sons are primary school students. They attend classes from 8:00~13:30. When they
return home from school they help with livestock management.
(iii) Regional Agricultural Labour Costs
The labourers in this area general receive 125Rp/ day (8 hour day).
(iv) )Family Labour (Livestock Husbandry)
Family members receive the same daily allowance as other agricultural labourers. For adult
labourers (per hour rate): 125Rp ÷ 8 (hours) = 16Rp/hour, for children, 50% of adult rates = 8Rp/hour.
(2) Livestock Purchases
During the period from 2010 until May 2011 no livestock were purchased.
(3) Livestock Inventory
All livestock are owned by the farmer. Moreover, no livestock are being lent out.
(4) Depreciation of Water Buffalo
As 16-year-old of age water buffalo are still being milked in the cattle colonies of Hyderabad, the
working life of a buffalo will be calculated as starting from the first milking period, and continuing for a period
of 10 years. The commercial trading price of heifers when they first commence to be milked in the cattle
colonies is 100,000Rp and for small to medium-scale farmers in the rural areas 70,000Rp.
(5) Depreciation of Buildings and Equipment
(i) Cattle Shelter
A simple shelter with a thatched roof is re-built every year. As no materials are purchased, only the
labour costs associated with building these shelters will be included in the calculations. The roof material is
sugar cane tops, and wooden poles are used for the pillars.
Labour rates: 125Rp/day,
Building: 1 (day) x 4 (labourers) = 500Rp;
Collection of roofing material: 2 (labourers) x 1(day) = 250Rp;
Total: 750Rp.
(ii) Equipment Costs
The equipment used includes a fodder cutting machine, motorbike, etc. The expected lifespan of this
equipment was determined and the Depreciation applied.
(6) Feed
(i)Berseem Clover
The farmer rents 5 acres of land from the land owner, of which 1 acre he cultivates berseem clover.
He harvested the clover for 3.5 months from January 9th to April 23rd, which he supplies to his livestock.
Seed: 1,200Rp,
Fertilizer: 1,660Rp,
Labour: 400Rp
Total : 3,260Rp.

Appendix F - 25
(ii)Concentrate Feed
He does not supply his livestock with concentrate feed.
(7) Evaluation of Livestock
The livestock being raised, apart from those water buffalo bearing calves, in other words those water
buffalo that are calves or are immature were valued at the end of December 2010 by estimating their weight
and using a carcass recovery rate of 50%, and a meat price of 173Rp/kg. The total evaluation price of the 5
young water buffalo was 8,650Rp.
3.5.2 Diagnosis of Dairy Farm Management
(1) Summary of Operations Results (Estimated Value in 2010)
Table 17. Abstract of the Results of Farm Management Last year This year Comparing
81,48044,4542,0962,096
48,8164
0.2546,72011,680
Production Cost 24Production Cost 2,387
1.9465.5??
25?
Beginning year 0End of year 0
Balance of liabilities Rp
Total income family (Rp)Income / cow (Rp)
ArticulCurrent year production cost totalProduction CostSales gross profitNet profit yearNet income year
Liabilities
Technical Level
Dairy situation
Average of milk price RpAverage of interval parturition Months
Income labor family
Feeding size
Average Fat % Average Fat non solid
The total production milk (Ton)Production milk Kg / cow
Number of cow (head)The total land area of fodder (Acre)
Production cost Rp/milk 1KgProduction cost Rp/milk 100Kg
(2) Scale of Operations
Table 18. Dairy Inventory. Table 19. Labourers.
Number of family 6Dairy Beef Buffalo Working number family 5
4 4.5 Dairy work number 54 2 0 Employment Permanent 0
Introduction Employment Temporary 0Birth, Transfer 2 2 Child count 0.5 person.Sale 1Accident, CullingTransfer 2
4 3 0
Fattening animalYounganimal
New calfCow
Out
End of year
AverageBeginning year
Enter
Category
Table 20. Land area.
Total Own Tenant Communal Total Own TenantRiceCultivation 5 5 0.25 0.25FallowingPastureGraizing
Land use Production FodderCategory

Appendix F - 26
3.5.3 Seasonal Production Costs
See details in Table 21.
Table 21. Cost of production.
3.Cost of production, Profit and loss MDLL Milking Cow number 2 Heads
(1)Current year production cost (Unit:Rp & %) *Total number of cow & buffalo: 4 Heads
Annual produc. Milk: 931 931 1862 Kg
Saling Self-consumption Total
Articul Amount (Rs.) Amount per cow Rs.) % of
distribution
Maiting cost 0 0 00 0 00 0 0
3,260 815 4
Employment 0 0 0Family (A) 46,720 11,680 57Total 46,720 11,680 57
500 125 10 0 00 0 0
Building, construct 750 188 1Machine, vehicle 250 63 0
Domestic animal 28,000 7,000 34
Total 29,000 7,250 36
500 125 1500 125 1
1,000 250 10 0 0
81,480 20,370 193
Purchase concentrate:0 Kg
8,650 2,163
0 0
36,676 9,1690 0
9,000 2,250
44,454 11,114Production Cost /Cow 11,114Production Cost / 1 Liter milk 24Production Cost / 100 Liter milk 2,387
③Amount of cow transferred within the year
⑥Sale young & fattening animals
Fuel
Depreciation
Repar costTool of Livestock & Agriculture
②Value of animals beginning of the year
④Value of animals end of the year
Purchase Livestock animal (from outside)Purchase Feed
Material for production Feed (Seed, Fertilizer etc.)
Labor
Medical treatment & medicine
Production cost①+②-③-④-⑤-⑥
Cost of consumption, Communication, TransportCost of rental
①Current year production cost total
⑤Sale of calves
Electricity & Water
(1) Milk Production
Mr. Chattan did not sell any milk in the period prior to the survey, it was all for home consumption.
Then on 26th February 2011, he started to sell milk to a middleman for the low price of 25Rp/litre. Two
animals are being milked, with a weekly average milk yield of 35 litres/week, which works out to be a low
average milk yield of 5 litres/day. Using this data, a yield simulation for the milking period was performed, a
yield of 1,010 kg and 851kg respectively, for a total of 1,861kg. Although half of this is actual being consumed
at home, for the purposes of production cost calculations (2010 Management Diagnosis) all of the milk is
assumed to be sold.
(2) Profit/Loss Calculations
A gross income of 36,676Rp, and an overall expenditure of 53,454Rp (see Table 22), a net income
was 2,096Rp. When family labour income of 46,720Rp is included, there is a net profit of 48,816Rp. Family
labour costs represent a large 53% of production costs. From this you can comprehend how livestock
management using natural resources requires little financial investment.

Appendix F - 27
Table 22 Profit and loss calculations.
Amount (Rs.) Amount per cow Rs.)
Sale of milk 23,275 5,819Milk consumed at home 23,275 5,819Sale of calves 0 0Sale young & fattening animals 9 ,000 2,250Other 0 0Total (B) 55,550 13,888①Value of animals beginning of the year 8,650 2,163②Current year total production cost 81,480 20,370③Amount of cow transferred within the year 0 0④Value of animals end of the year 36,676 9,169Total cost of Sales(C) ①+②-③-④ (C) 53,454 13,364
2,096 524Sales cost 0 0Insurance fee 0 0Office cost 0 0Labor cost 0 0⑥Total 0 0
2,096 524Interest receivable 0 0Subsidy and compensation 0 0Other 0 0⑦Total 0 0Interets payable 0 0Rents payable 0 0Other 0 0⑧Total 0 0
2,096 52448,816 12,204
Net prof it year (D) ⑤-⑥+⑦-⑧
Net income year (A) +(D)
Non-operatingcost
Articul
Revenue fromlivestock
⑤Sales gross prof it (B) - (C)
Non-operatingincome
Selling, generaland
administrativeexpenses
Operating prof it (Business prof it) ⑤-⑥=(E)
Cost of sales
(3) Analysis and Technical Evaluation of Dairy Farm Management
Table 23. Analysis of dairy Farm Management.
Category Item Year 2010 Year 2011
Beginning of year Number of cows: Head 4Land area of fodder: Acres 0.25Land area fodder per Cow: Acres 0.06Area of Pasture : Acres
Area of Pasture per Cow: Acres 0.00Cost / Cow Rp 11,114Cost / 1 Kg Rp 24
Cost / 100 Kg Rp 2,3871) Production milk / Total cows Kg 4662) Production milk / Milking Cows Kg 931
3) Day production / Total Cows Kg 1.34) Day production / Milking Cows Kg 2.65) Milk production rate: Produc milk Kg per Total cows/ Produc. Milk Kg per milking cows %
50
6) Milk sale incom / Total Cows Rp 11638
7) Milk sale incom / Milking Cows Rp 232758) Average of Fat rate % ?9) Average of Non Fat Solido rate % ?10) Average of milk sale price Rp 2511) Average of Parturition Number on beginning year ?
12) Average of Parturition Number on Culling ?13) Average of Parturition Interval day ?14) Rate of purchase feed Rp / Milk income Rp % 0
15) Efficiency Feed: Total production milk Liter/Totalconcentrate used Kg16) Efficiency Feed: Total production milk Liter/TotalFormula feed used Kg
Not use
17) Concentrate feed Kg / Total Cows Kg18) Formula feed Kg / Total Cows Kg Not use19) ⑤Sales gross profit Rp / Total cows Rp
% of sale milk incomeRp/Using home Rp 50% of sale milk quantity Kg/Using homeKg 50
Farm situation
Production Cost
Technique Level

Appendix F - 28
3.5.4 Productivity
(1) Calf Growth
According to the Sukkur Buffalo Research Centre, the average weight of buffalo calves at birth is
22kg. For the two calves that were born in November 2010, the growth of these calves, given they were not fed
concentrate feed but only natural feed, was extremely good. A daily gain of 550g and 450g respectively was
observed, a high average of 500g/day.
Birth Nov Dec Jan Feb Mar
No.4 Male 22 52 89.5 94 104.5
No.9 Male 22 49 67 80 90 103
0
20
40
60
80
100
120
Kg
Growing Curve of Calves
Figure 4 Growth curves of calves.
(2) Buffalo Milk Production Capacity The figure below notes the milk yield data for 2 cows that were being milked twice a day after
calving (see Figure 5).
Nov Dec Jan Feb Mar Apr May
No Name 3 2.4 2.4 3.2 4.5 4.2 3.7
No.5 3 3.2 3.6 4 3.8 3.8 3
00.5
11.5
22.5
33.5
44.5
5
Kg
Milk Curve
Figure 5. Milk yield curves.
With proper husbandry and healthy animals, milk yields rise after calving, peak, and then slowly
decline before entering the non-lactating period. This milk yield curve is abnormal. It is inferred that there was
a problem just after calving. If you use this milk yield curve, then the yield simulation (calculated for 305 days
of milking) for No Name and No. 5 is 1,010kg and 851kg respectively.
If I use the milk yield curve I have previously obtained, the simulation works out to be 1,166kg and
1,070kg respectively, an increase in yield. This figure is thought to represent a result near the potential
production capacity of buffaloes.
(i) Data for No Name
The actual milk yield curve is shown by the blue line (see Figure 6). The red line represents the normal
milk yield curve. When husbandry is well performed and a normal milk yield curve is obtained, an increase in
yield of 156kg is obtained.
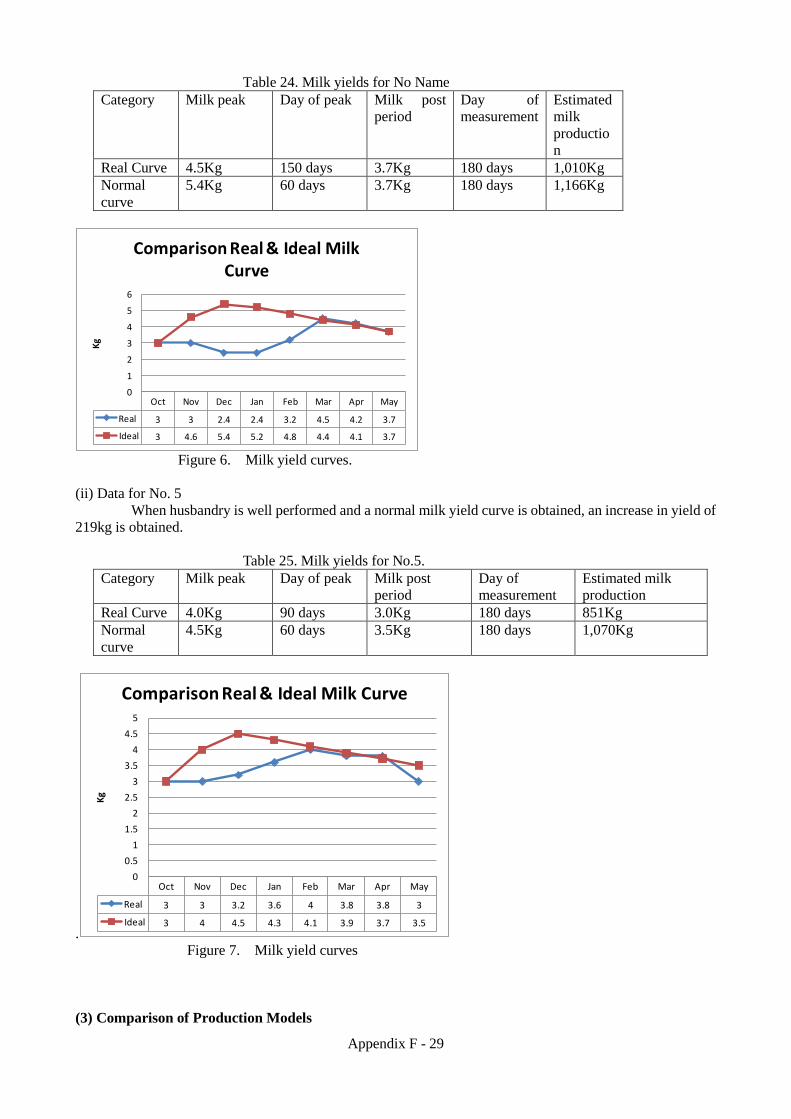
Appendix F - 29
Table 24. Milk yields for No Name
Category Milk peak Day of peak Milk post
period
Day of
measurement
Estimated
milk
productio
n
Real Curve 4.5Kg 150 days 3.7Kg 180 days 1,010Kg
Normal
curve
5.4Kg 60 days 3.7Kg 180 days 1,166Kg
Oct Nov Dec Jan Feb Mar Apr May
Real 3 3 2.4 2.4 3.2 4.5 4.2 3.7
Ideal 3 4.6 5.4 5.2 4.8 4.4 4.1 3.7
0
1
2
3
4
5
6
Kg
Comparison Real & Ideal Milk Curve
Figure 6. Milk yield curves.
(ii) Data for No. 5
When husbandry is well performed and a normal milk yield curve is obtained, an increase in yield of
219kg is obtained.
Table 25. Milk yields for No.5.
Category Milk peak Day of peak Milk post
period
Day of
measurement
Estimated milk
production
Real Curve 4.0Kg 90 days 3.0Kg 180 days 851Kg
Normal
curve
4.5Kg 60 days 3.5Kg 180 days 1,070Kg
.
Oct Nov Dec Jan Feb Mar Apr May
Real 3 3 3.2 3.6 4 3.8 3.8 3
Ideal 3 4 4.5 4.3 4.1 3.9 3.7 3.5
0
0.5
1
1.5
2
2.5
3
3.5
4
4.5
5
Kg
Comparison Real & Ideal Milk Curve
Figure 7. Milk yield curves
(3) Comparison of Production Models

Appendix F - 30
In dairy-farming, the milk yield per animal has a large influence on profitability. For each increase in
milk yield per animal, the profits become larger. To demonstrate this, current milk production yields for the
farmer was modelled for comparison using 6 different scenarios.
(i) Model 1
The parameters for the model are, half the milk collected is consumed at home for which no income
is received, the rest is sold. There are 4 adult female buffalo, 2 of these are being milked.
Main feed supply: grazing in harvested fields, banks, orchards, etc.
Cut forage: grass, and winter berseem clover.
Other roughage: sugar cane tops and wheat straw.
All low cost, natural feed produced on-site. The berseem clover grown on the rented land is supplied
for 2.5 months. Volume of milk sold is half the estimated milk yield (1,010 + 851 = 1,861kg).
For only half the year this is 931kg.
(ii) Model 2
Under the same conditions and management as above, but all of the milk is sold year round.
(iii) Model 3
In this model the husbandry management is well performed and the milk yield curve obtained is close
to the potential production capacity of buffalo. All the milk is sold. The estimated milk sold is 2,236kg (1,166
+ 1,070kg). This represents an average milk production capacity of 4kg/head/day.
(iv) Model 4
Is the same as model 3, where the same peak in milk yield is achieved after calving, but the animals
are fed the concentrate feed below for 120 days after parturition.
If this production capacity buffalo (4kg/day) is only feed the traditional way with 1kg/day of concentrate feed
made up of cotton seed cake and wheat bran, then production efficiency is low and profits are decreased.
Cotton seed cake: 30Rp/kg x 2 (head of cattle) x 120 days = 7,200Rp (240kg)
Wheat bran: 20Rp/kg x 2 (head of cattle) x 120 days = 4,800Rp (240kg)
Total: 12,000Rp 480kg
(v) Model 5
In this model the production capacity of buffalo is achieved in commercial dairy farming. This
represents an average milk production capacity of 8kg/head/day. The milk yield peaks 35 days after calving at
12kg/day, and then slowly declines to 6kg/day 50days after calving. At this level, total annual milk production
per animal is 2,400kg, and when milking two animals this represents 4,800kg of milk a year. In this model the
production capacity of buffalo is achieved, while supplying the concentrate feed noted in model 4. To achieve
this, the buffalo breed needs to be improved, and the quality and quantity of feed appropriate to this capacity
needs to be supplied. This indicates that if a good capacity breed is used, and husbandry is improved, then large
increases in earnings can be obtained.
(vi) Model 6
This model is the same as model 5, but the price the milk is sold at is 40Rp/litre. As would be
expected, there is a large increase in profits. The large regional differences in the price of milk are a big
problem that will need to be addressed in the future.
Table 26. Comparison of outputs from models.
Articles
Model
No.1
Selling
half
milk
Model
No.2
Selling
whole
milk
Model
No.3
Improve
feeding
managem
ent
Model
No.4
Suppleme
nt
concentra
te feed
120 days
Model
No.5
Improve
genetic
capacity
Model
No.6
Improve
price of
milk
Selling milk Kg 931Kg 1862Kg 2,236Kg 2,236Kg 4,800Kg 4,800Kg
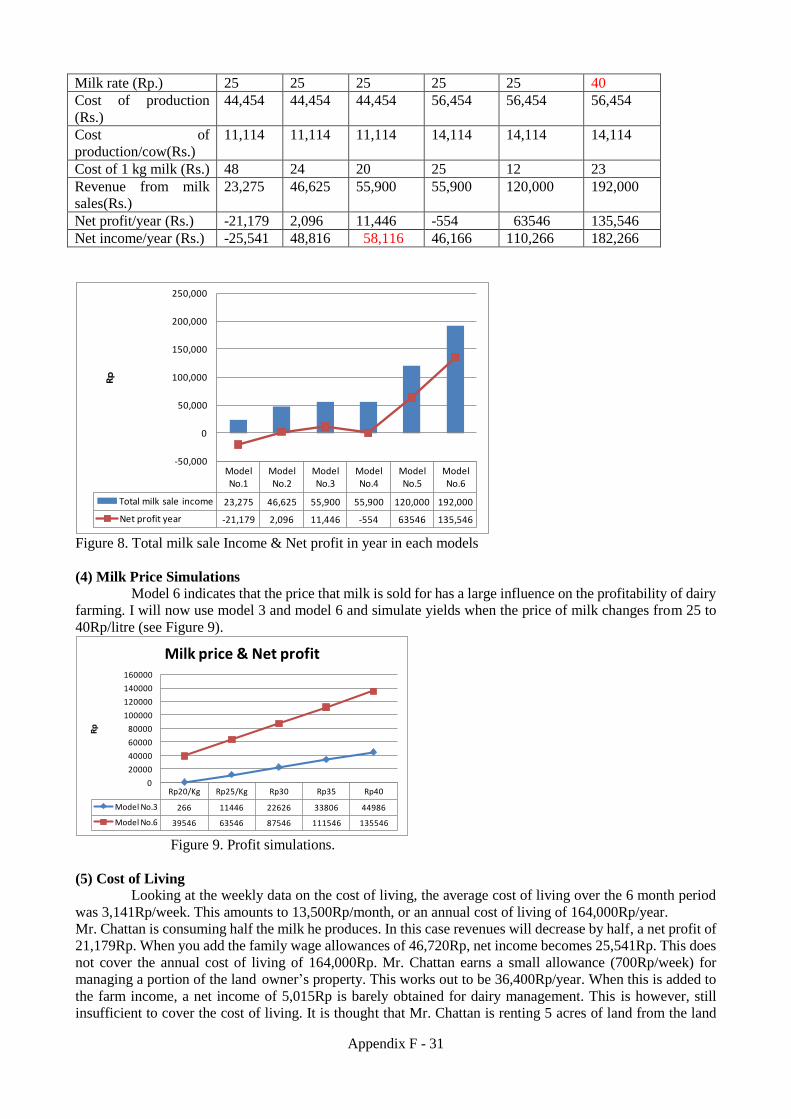
Appendix F - 31
Milk rate (Rp.) 25 25 25 25 25 40
Cost of production
(Rs.)
44,454 44,454 44,454 56,454 56,454 56,454
Cost of
production/cow(Rs.)
11,114 11,114 11,114 14,114 14,114 14,114
Cost of 1 kg milk (Rs.) 48 24 20 25 12 23
Revenue from milk
sales(Rs.)
23,275 46,625 55,900 55,900 120,000 192,000
Net profit/year (Rs.) -21,179 2,096 11,446 -554 63546 135,546
Net income/year (Rs.) -25,541 48,816 58,116 46,166 110,266 182,266
Model No.1
Model No.2
Model No.3
Model No.4
Model No.5
Model No.6
Total milk sale income 23,275 46,625 55,900 55,900 120,000 192,000
Net profit year -21,179 2,096 11,446 -554 63546 135,546
-50,000
0
50,000
100,000
150,000
200,000
250,000
Rp
Figure 8. Total milk sale Income & Net profit in year in each models
(4) Milk Price Simulations Model 6 indicates that the price that milk is sold for has a large influence on the profitability of dairy
farming. I will now use model 3 and model 6 and simulate yields when the price of milk changes from 25 to
40Rp/litre (see Figure 9).
Rp20/Kg Rp25/Kg Rp30 Rp35 Rp40
Model No.3 266 11446 22626 33806 44986
Model No.6 39546 63546 87546 111546 135546
0
20000
40000
60000
80000
100000
120000
140000
160000
Rp
Milk price & Net profit
Figure 9. Profit simulations.
(5) Cost of Living Looking at the weekly data on the cost of living, the average cost of living over the 6 month period
was 3,141Rp/week. This amounts to 13,500Rp/month, or an annual cost of living of 164,000Rp/year.
Mr. Chattan is consuming half the milk he produces. In this case revenues will decrease by half, a net profit of
21,179Rp. When you add the family wage allowances of 46,720Rp, net income becomes 25,541Rp. This does
not cover the annual cost of living of 164,000Rp. Mr. Chattan earns a small allowance (700Rp/week) for
managing a portion of the land owner’s property. This works out to be 36,400Rp/year. When this is added to
the farm income, a net income of 5,015Rp is barely obtained for dairy management. This is however, still
insufficient to cover the cost of living. It is thought that Mr. Chattan is renting 5 acres of land from the land

Appendix F - 32
owner and cultivating cash crops, such as sugar cane and wheat, in order to cover the shortfall in the cost of
living. Unfortunately the weekly data of farm income and expenditure was not kept so further details cannot be
given.
Table 27. Details of weekly cost of living.
Aount Rp %
Food, beverage, 2344 71.5
Apparel, textile, and foot wear 380 12.1
Transport & communication 389 12.4
Fuel & Light 34 1.0
Total 3141 100.0
Food supplies cost 71.5% of expenditures, a high Engels coefficient.
3.6 Feeding Management
Mr. Chattan's children are still young, so he is still basically managing the livestock himself. The two
boys are herding the buffalo during grazing, but only after they have returned home from school, do they
accompany the grazing buffalo. In November there were 4 adult female buffalo, one immature buffalo and 2
calves, for a total of 7 animals being raised. He owns them all.
3.6.1 Livestock Facilities
A simple roofed shelter located in front of the house. At night the livestock are tethered to stakes in
the ground.
3.6.2 Daily Routine for Buffalo 5:30am: Supply feed
6:00 am Milking
8~17:00 Grazing, watering, and bathing
17:00pm Milking
3.6.3 Milking Milking takes place twice a day. In the latter half of the lactating period when milk yields decrease
milking is done only once a day, in the morning. At milking no special cleaning of the udder is performed.
3.6.4 Observations of Grazing
The water buffalo have a hearty appetite and continue to eat grass. During the 3 hours I observed
them grazing, they hardly took any time to rumination. They were grazing in a cotton field that had been
previously harvested. They eat any type of grass. They also ate with relish, 2 types of saline tolerant plants.
They even ate the hard shells of cotton left after the harvest. Normally when cattle graze, if there is sufficient
grass they will eat for an hour or two until their stomach is full, sprawl on the ground and rumination. In the
case where the grass is insufficient grazing takes longer. With poor quality and insufficient pasture, heat stress,
long distances to walk, and significant energy spent on feeding, the feeding habits, strength and adaptability of
the water buffalo to this harsh environment is remarkable.

Appen
dix
F -
33
3.7
Fee
d s
yst
em (
Gra
zin
g, C
ut
& C
arr
y, C
rop
res
idu
es M
ixed
)
(1)
Fee
din
g c
ale
nd
ar
Fig
ure
10
Mix
ed F
eedin
g M
anag
emen
t duri
ng R
abi
Sea
son

Appendix F - 34
(2) Feeding management
This farmer gets 3.8 litres per day in March and April. It is estimated that the nutritional requirement
for this period is 5.05kg TDN and 0.83kg DCP. The feed during this period is shown in Table 28. Twenty
kilograms of beseem and 26kgs of sugarcane tops are fed to the buffalo in twice a day. Judging from the
nutritive value of this feed, the TDN intake has been fully met, and 30% of DCP intake needs to be gained
elsewhere. It is estimated that the DCP shortfall is made up by grazing.
Table 28 Value of Supplemental Feed for Buffalo in March
Supplemedntal Feed DM intake TDN DCP
Kg
Sugarcane top (26kg) 7.54 3.71 0.22
Berseem (20kg) 2.3 1.52 0.39
Total (46kg) 9.84 5.23 0.61
In May, farmer gets 2.0 litres per day. It is estimated that the nutritional requirement for this period
is 4.17kg TDN and 0.58kg DCP. The feed during this period is shown in Table 29. Eight kilograms of
wheat straw and 0.25kgs of wheat middling are fed to the buffalo in twice a day. Judging from the nutritive
value of this feed, when the nutritive value obtained from supplementary feed is subtracted from this, it is
estimated that 32% of TDN and 97% of DCP needs to be obtained from grazing. It is approximately 23kg
(5.3kg DM basis) of native grasses (see Table 29, Figure 10).
Wheat straw is reserved for periods of feed scarcity, but a diet of wheat straw is not adequate compared to
native grasses
Table 29 Value of Supplemental Feed for Buffalo in May
Supplemental Feed DM intake TDN DCP
Kg
Wheat straw (8kg) 7.36 2.66 0
Wheat middling (0.25kg) 0.22 0.18 0.02
Total (8.25kg) 7.58 2.84 0.02
3. 8 Reproduction
The land owner keeps 2 stud bulls for servicing female buffalo in heat, which the villagers can
borrow for free. Water buffalo come into heat 80% of the time at night, most often at 2~3 o'clock in the
morning. The sign that the buffalo is in heat is a special roaring sound. As regards servicing by a bull, the
buffalo in heat is tethered for a while to delay the servicing. It is still possible to successfully service a buffalo
whose heat is declining or has disappeared.
3.9 Animal Health
3.9.1 Common Livestock Diseases
The common diseases found are HS, FMD, CCPP, PPR, E. toxaemia, and contagious pneumonia.
3.9.2 Vaccinations The Department of Livestock provides guidance for HS, CCPP, E. Toxaemia. The livestock have
been vaccinated for contagious diseases.
3.9.3 Mastitis A sub-clinical mastitis test has been performed. The results were false positives.
Appendix F - 35
3.9.4 Result of examination of samples at CVDL Tandojam.
Blood, milk and faecal sample were collected from 4 animals. Several endo parasites were detected
but brucellosis was found negative.

Appendix F - 36
4. Medium-Scale Dairy Farmer (Owns Land)
4.1 Survey Background
Responsible Organisation: Department of Livestock, Tando Allahyar.
Technical Person in Charge: Dr. Mazhar Ali
Surveyed Farmer: Mr. Manthar
Location: Bachal Khaskheli village, Tando Allahyar sub-district, Tando
Allahyar district.
4.2 Introduction
This farm was selected with the co-operation of the Department of Livestock, Tando Allahyar district,
and the consent of the land owner (owns 40 acres). Bachal Khaskheli village is located in richly irrigated area,
about 7km from the town of Tando Allahyar, about 20 minutes travel. This is an old village established in 1835.
The village is located on 9 acres of land, and has 110 households. Most of the families in these households are
landless, and all keep livestock. The estimated number of livestock raised is 200 water buffalo, 50 cattle, 100
goats, and 4 camels.
4.3 Criteria for Farmer Selection
This farmer was selected with the co-operation of a C/P, Dr. Iqtidar Memon. Three candidate farmers
were identified as fitting the category of land owning medium-scale dairy farmer. As the farmers are located in
different districts; Hyderabad, Tando Allahyar, and Mirpurkhas districts, and due to time constraints, they
could not all be visited for re-evaluation. The farmer in Mirpurkhas district had the highest score (68), however
since the land owning small-scale and landless medium-scale representative dairy farmers had already been
selected from this area, he was not selected. We did not want the survey to be skewed towards this district. So
Mr. Manthar from Tando Allahyar district, with the second highest score was chosen.
4.4 Farmer Outline
Mr. Manthar lives in the village. He owns 5 acres of land and this was reason he was selected as a
full-time farmer. However, after the survey commenced we learnt that he also owns a small scale, flour mill in
the village, leaving the farm management to his wife and worker. In addition, half way through the survey he
became a local government official for tube well water administration. He receives a weekly salary of 1,050Rp
for this. In his own land he grows sugar cane, wheat, cotton, sorghum, and berseem clover. The make-up of the
family is 5 sons, 2 daughters and a wife, for a household total of 9.
4.5 Farm Management
Though we learnt after the survey had commenced that he was not a full time farmer as we had hoped
for, his co-operative attitude and the ability to obtain valuable baseline data convinced us to continue with the
analysis.
4.5.1 Basic Information for Farm Management Analysis
(1) Family Labour and Labourer Rates
Table 30. Family labour.
Main
Occupation
Own Farm
work
Livestock
work
Hour Amount
/year
Mr.Manthar 52
years
Plural work Management Management 1=Rp17 6,205
Wife50years House work No Milking,
Feeding, Clean
4=Rp68 24,820
1st Son 30 years Shop No No No No
2nd
Son 27 years Flour mill No No No No
3rd
Son 24 years Office worker No No No No
4th Son 20 years Office worker No No No No
5th Son 18 years Student No No No No
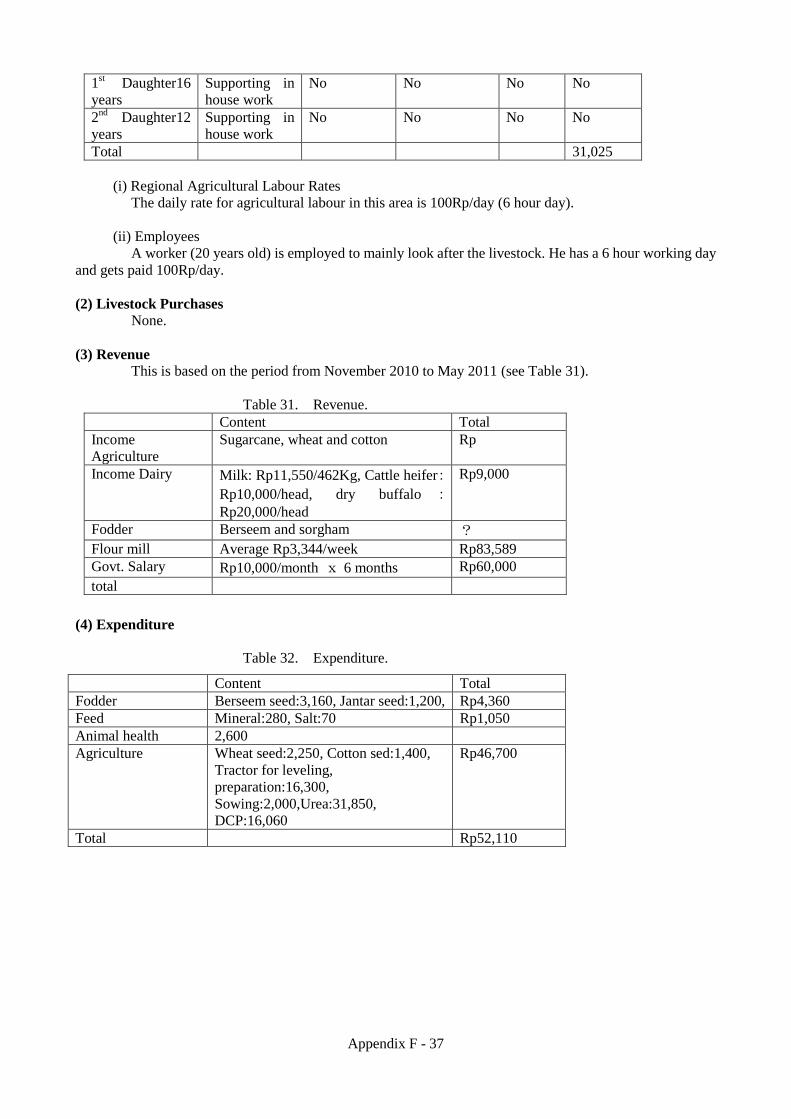
Appendix F - 37
1st Daughter16
years
Supporting in
house work
No No No No
2nd
Daughter12
years
Supporting in
house work
No No No No
Total 31,025
(i) Regional Agricultural Labour Rates
The daily rate for agricultural labour in this area is 100Rp/day (6 hour day).
(ii) Employees
A worker (20 years old) is employed to mainly look after the livestock. He has a 6 hour working day
and gets paid 100Rp/day.
(2) Livestock Purchases
None.
(3) Revenue
This is based on the period from November 2010 to May 2011 (see Table 31).
Table 31. Revenue.
Content Total
Income
Agriculture
Sugarcane, wheat and cotton Rp
Income Dairy Milk: Rp11,550/462Kg, Cattle heifer:
Rp10,000/head, dry buffalo :Rp20,000/head
Rp9,000
Fodder Berseem and sorgham ?
Flour mill Average Rp3,344/week Rp83,589
Govt. Salary Rp10,000/month x 6 months Rp60,000
total
(4) Expenditure
Table 32. Expenditure.
Content Total
Fodder Berseem seed:3,160, Jantar seed:1,200, Rp4,360
Feed Mineral:280, Salt:70 Rp1,050
Animal health 2,600
Agriculture Wheat seed:2,250, Cotton sed:1,400,
Tractor for leveling,
preparation:16,300,
Sowing:2,000,Urea:31,850,
DCP:16,060
Rp46,700
Total Rp52,110
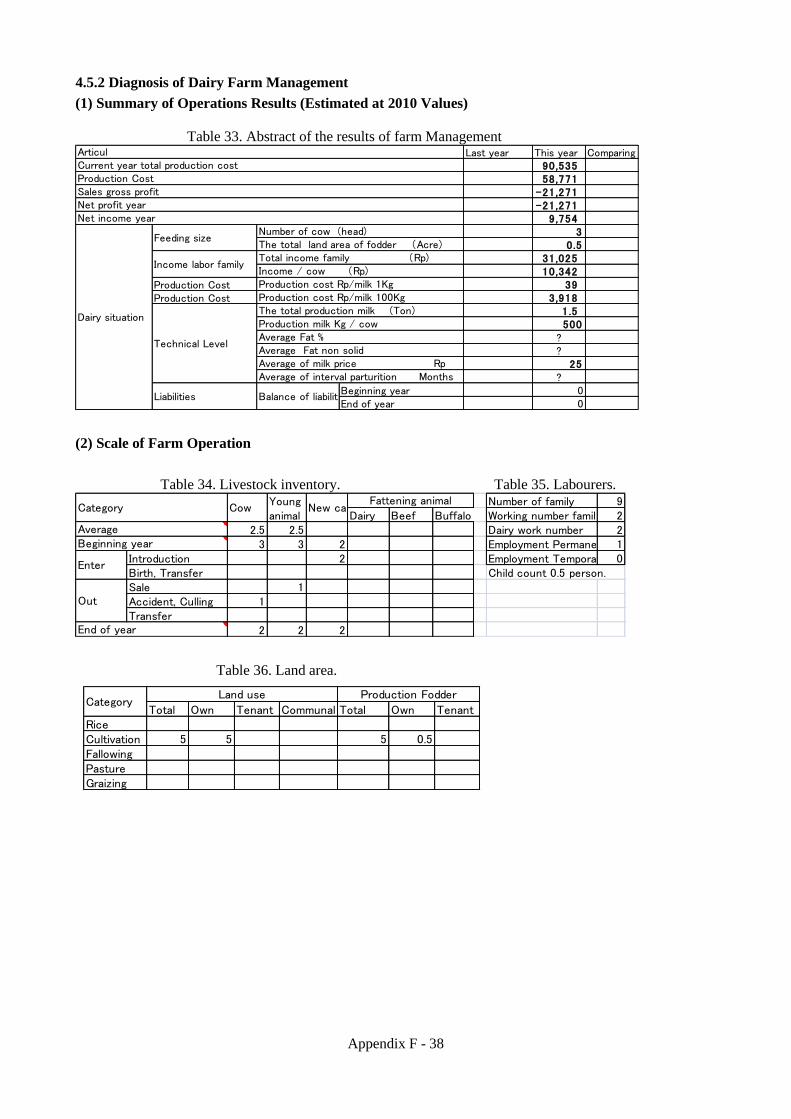
Appendix F - 38
4.5.2 Diagnosis of Dairy Farm Management
(1) Summary of Operations Results (Estimated at 2010 Values)
Table 33. Abstract of the results of farm Management Last year This year Comparing
90,53558,771
-21,271-21,271
9,7543
0.531,02510,342
Production Cost 39Production Cost 3,918
1.5500
??
25?
Beginning year 0End of year 0
Average Fat % Average Fat non solid
The total production milk (Ton)Production milk Kg / cow
Number of cow (head)The total land area of fodder (Acre)
Production cost Rp/milk 1KgProduction cost Rp/milk 100Kg
Balance of liabilities Rp
Total income family (Rp)Income / cow (Rp)
ArticulCurrent year total production cost Production CostSales gross profitNet profit yearNet income year
Liabilities
Technical Level
Dairy situation
Average of milk price RpAverage of interval parturition Months
Income labor family
Feeding size
(2) Scale of Farm Operation
Table 34. Livestock inventory. Table 35. Labourers. Number of family 9
Dairy Beef Buffalo Working number family 22.5 2.5 Dairy work number 2
3 3 2 Employment Permanent 1Introduction 2 Employment Temporary 0Birth, Transfer Child count 0.5 person.Sale 1Accident, Culling 1Transfer
2 2 2
Enter
Out
End of year
AverageBeginning year
Category CowYounganimal
New calfFattening animal
Table 36. Land area.
Total Own Tenant Communal Total Own TenantRiceCultivation 5 5 5 0.5FallowingPastureGraizing
CategoryLand use Production Fodder

Appendix F - 39
4.5.3 Seasonal Production Costs
Table 37. Cost of production.
3.Cost of production, Profit and loss MDLH Milking Cow number 2 Heads
(1)Current year production cost (Unit:Rp & %) *Total number of cow & buffalo: 3 Heads
Annual produc. Milk: 1500 0 1500 Kg
Saling Self-consumption Total
Articul Amount (Rs.) Amount per cow Rs.) % of
distribution
Maiting cost 400 133 00 0 0
1,050 350 14,360 1,453 5
Employment 36,500 12,167 40
Family (A) 31,025 10,342 34
Total 67,525 22,508 75
500 167 10 0 00 0 0
Building, construct 100 33 xMachine, vehicle 100 33 x
Domestic animal 15,000 5,000 x
Total 15,200 5,067 17
500 167 1500 167 1500 167 1
0 0 090,535 30,178 175
Purchase concentrate:0 Kg
28,026 9,342 2 calves, 2 young0 0
39,790 13,263 2 calves, 2 young0 0
20,000 6,667 2 heads
58,771 19,590Production Cost /Cow 19,590 6,530Production Cost / 1 Liter milk 39 13Production Cost / 100 Liter milk 3,918 1,306
④Value of animals end of the year
Purchase Livestock animal (from outside)Purchase Feed
Material for production Feed (Seed, Fertilizer etc.)
Labor
Medical treatment & medicine
Production cost①+②-③-④-⑤-⑥
Cost of consumption, Communication, TransportCost of rental
①Current year production cost total
⑤Sale of calves
Electricity & Water
Fuel
Depreciation
Repar costTool of Livestock & Agriculture
②Value of animals beginning of the year③Amount of cow transferred within the year
⑥Sale young & fattening animals
From the below table production costs are 58,771Rp (see Table 37). The production cost per adult
female is 19,590Rp. The production cost per litre of milk is 39Rp. As lighting, veterinarian, building, facility
and equipment costs are close to nothing, this is a strong low-cost management structure based on raising
livestock by utilizing natural resources.

Appendix F - 40
4.5.4 Calculation of Profit/ Loss
Table 38. Profit and loss calculations.
Amount (Rs.) Amount per cow Rs.)
Sale of milk 0 0Milk consumed at home 37,500 12,500Sale of calves 0 0Sale young & fattening animals 20,000 6,667Other 0 0Total (B) 57,500 19,167①Value of animals beginning of the year 28,026 9,342②Current year total production cost 90,535 30,178③Amount of cow transferred within the year 0 0④Value of animals end of the year 39,790 13,263Total cost of Sales(C) ①+②-③-④ (C) 78,771 26,257
-21,271 -7,090Sales cost 0 0Insurance fee 0 0Office cost 0 0Labor cost 0 0⑥Total 0 0
-21,271 -7,090Interest receivable 0 0Subsidy and compensation 0 0Other 0 0⑦Total 0 0Interets payable 0 0Rents payable 0 0Other 0 0⑧Total 0 0
-21,271 -7,0909,754 3,251
Net prof it year (D) ⑤-⑥+⑦-⑧
Net income year (A) +(D)
Non-operatingcost
Articul
Revenue fromlivestock
⑤Sales gross prof it (B) - (C)
Non-operatingincome
Selling, generaland
administrativeexpenses
Operating prof it (Business prof it) ⑤-⑥=(E)
Cost of sales
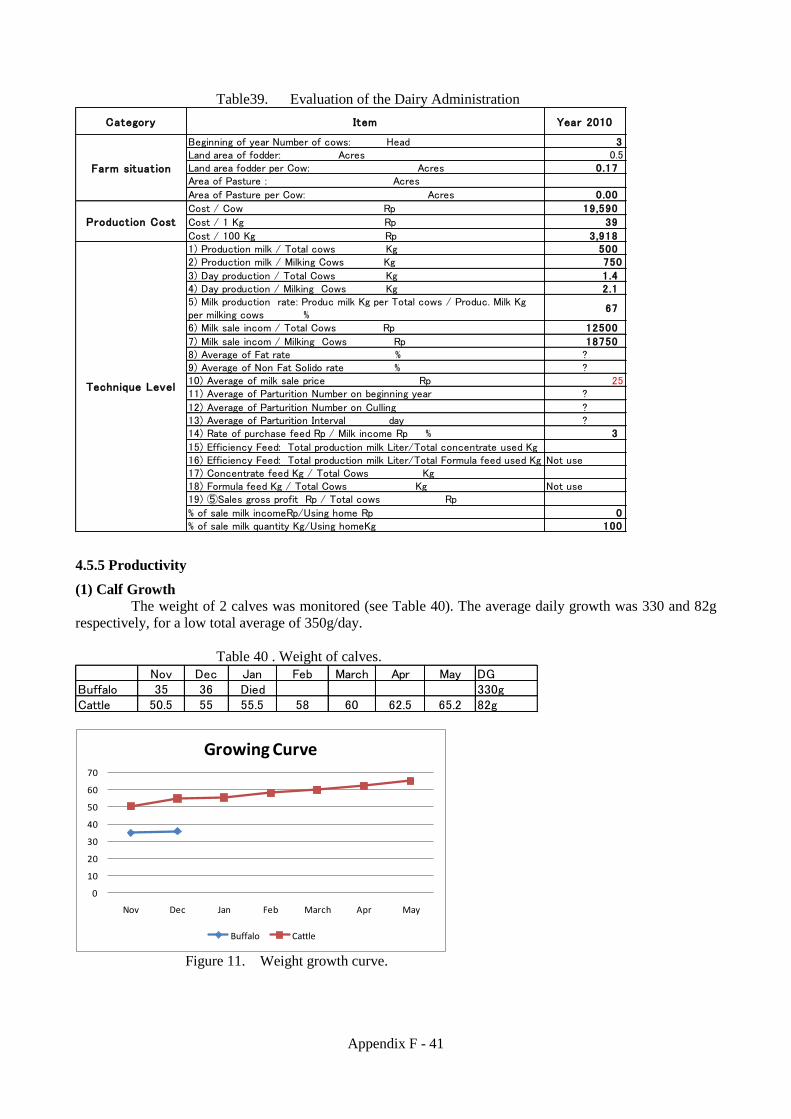
Appendix F - 41
Table39. Evaluation of the Dairy Administration
Category Item Year 2010
Beginning of year Number of cows: Head 3Land area of fodder: Acres 0.5Land area fodder per Cow: Acres 0.17Area of Pasture : Acres
Area of Pasture per Cow: Acres 0.00
Cost / Cow Rp 19,590
Cost / 1 Kg Rp 39
Cost / 100 Kg Rp 3,9181) Production milk / Total cows Kg 5002) Production milk / Milking Cows Kg 750
3) Day production / Total Cows Kg 1.44) Day production / Milking Cows Kg 2.15) Milk production rate: Produc milk Kg per Total cows / Produc. Milk Kgper milking cows %
67
6) Milk sale incom / Total Cows Rp 12500
7) Milk sale incom / Milking Cows Rp 187508) Average of Fat rate % ?9) Average of Non Fat Solido rate % ?10) Average of milk sale price Rp 2511) Average of Parturition Number on beginning year ?
12) Average of Parturition Number on Culling ?13) Average of Parturition Interval day ?14) Rate of purchase feed Rp / Milk income Rp % 3
15) Efficiency Feed: Total production milk Liter/Total concentrate used Kg16) Efficiency Feed: Total production milk Liter/Total Formula feed used Kg Not use17) Concentrate feed Kg / Total Cows Kg18) Formula feed Kg / Total Cows Kg Not use19) ⑤Sales gross profit Rp / Total cows Rp
% of sale milk incomeRp/Using home Rp 0% of sale milk quantity Kg/Using homeKg 100
Farm situation
Production Cost
Technique Level
4.5.5 Productivity
(1) Calf Growth
The weight of 2 calves was monitored (see Table 40). The average daily growth was 330 and 82g
respectively, for a low total average of 350g/day.
Table 40 . Weight of calves.
Nov Dec Jan Feb March Apr May DGBuffalo 35 36 Died 330gCattle 50.5 55 55.5 58 60 62.5 65.2 82g
0
10
20
30
40
50
60
70
Nov Dec Jan Feb March Apr May
Growing Curve
Buffalo Cattle
Figure 11. Weight growth curve.
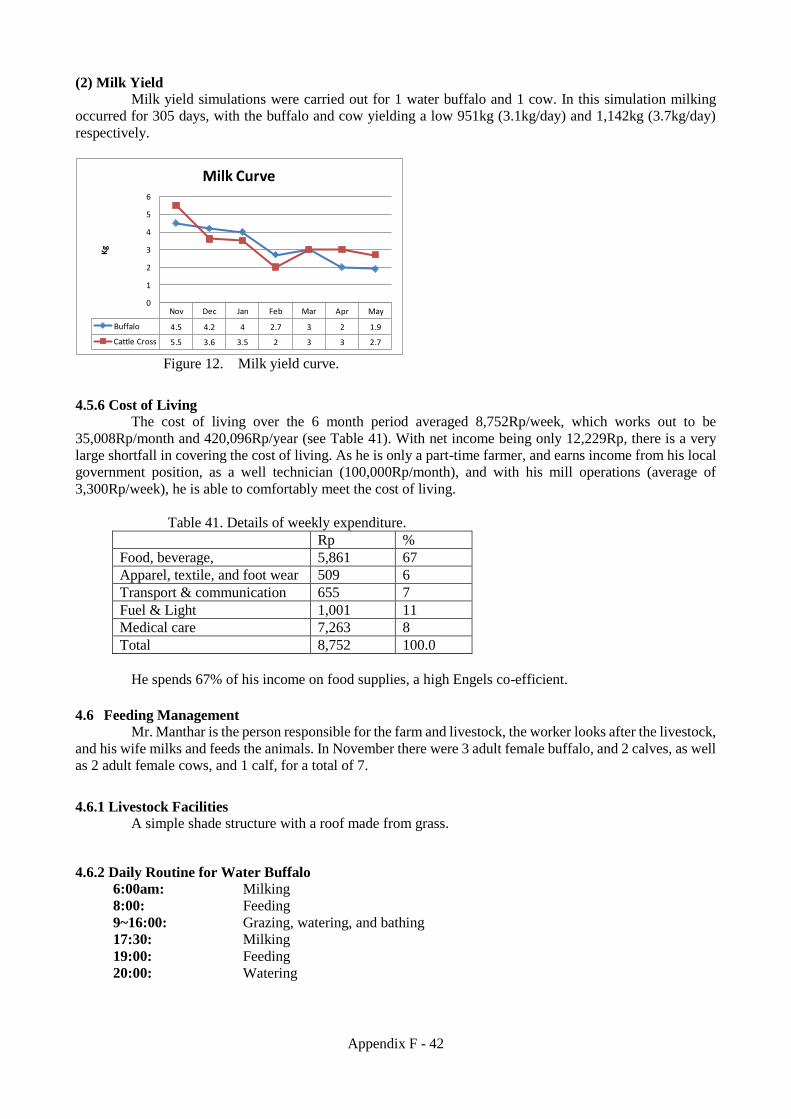
Appendix F - 42
(2) Milk Yield
Milk yield simulations were carried out for 1 water buffalo and 1 cow. In this simulation milking
occurred for 305 days, with the buffalo and cow yielding a low 951kg (3.1kg/day) and 1,142kg (3.7kg/day)
respectively.
Nov Dec Jan Feb Mar Apr May
Buffalo 4.5 4.2 4 2.7 3 2 1.9
Cattle Cross 5.5 3.6 3.5 2 3 3 2.7
0
1
2
3
4
5
6
Kg
Milk Curve
Figure 12. Milk yield curve.
4.5.6 Cost of Living
The cost of living over the 6 month period averaged 8,752Rp/week, which works out to be
35,008Rp/month and 420,096Rp/year (see Table 41). With net income being only 12,229Rp, there is a very
large shortfall in covering the cost of living. As he is only a part-time farmer, and earns income from his local
government position, as a well technician (100,000Rp/month), and with his mill operations (average of
3,300Rp/week), he is able to comfortably meet the cost of living.
Table 41. Details of weekly expenditure.
Rp %
Food, beverage, 5,861 67
Apparel, textile, and foot wear 509 6
Transport & communication 655 7
Fuel & Light 1,001 11
Medical care 7,263 8
Total 8,752 100.0
He spends 67% of his income on food supplies, a high Engels co-efficient.
4.6 Feeding Management
Mr. Manthar is the person responsible for the farm and livestock, the worker looks after the livestock,
and his wife milks and feeds the animals. In November there were 3 adult female buffalo, and 2 calves, as well
as 2 adult female cows, and 1 calf, for a total of 7.
4.6.1 Livestock Facilities
A simple shade structure with a roof made from grass.
4.6.2 Daily Routine for Water Buffalo
6:00am: Milking
8:00: Feeding
9~16:00: Grazing, watering, and bathing
17:30: Milking
19:00: Feeding
20:00: Watering

Appendix F - 43
4.6.3 Milking
Normally the animals are milked twice a day, as the milk volume decreases milking is performed
only once a day in the morning. At milking there is no special cleaning of the udder.

Appen
dix
F -
44
4.7
F
eed
ing s
yst
ems
(Gra
zin
g, C
ut
& C
arr
y,
Cro
p r
esid
ues
Mix
ed)
(1)
Fee
din
g c
ale
nd
ar
12
34
12
34
12
34
12
34
12
34
12
34
12
34
Gra
zing
Wat
erco
urse
ban
k
Road
sid
e
Fal
low
Cut
& C
arry
Cro
op fie
ld
(Gra
sses
& W
eed)
Wat
erco
urse
ban
k
Road
sid
e
Fal
low
Gre
en f
od
der
Ber
esee
m20kg/d
ay
Cro
p r
esid
ues
Whe
at s
traw
10kg/d
ay
Sug
erca
ne top
40kg/d
ay
Purc
ased
fee
dW
heat
bra
n1kg/a
nim
al/day
(milk
ing
cow
)C
otton
seed
cak
e0.5
kg/a
nim
al/day
Sal
t (b
lock
)F
ree a
ccess
511
12
12
34
Fig
ure
13
Fee
din
g C
alen
dar
duri
ng R
abi
Sea
son

Appendix F - 45
(2) Feeding management
This farmer milks late lactating buffalo and crossbred cow and get 2.7 litres per day and 3 litres per
day in February respectively. It is estimated that the nutritional requirement for this period is 4.48kg TDN,
0.66kg DCP in buffalo and 4.61kg TDN, 0.7kg DCP in cow. The feed during this period is shown in table
4.6.1. Ten kilograms of beseem, 20kgs of sugarcane tops and 0.5kg of cotton seed cake are fed to the
buffalo and the cow in twice a day. When the nutritive value obtained from supplementary feed is subtracted
from this, it is estimated that 12% of TDN and 27% of DCP in buffalo and 14% of TDN and 32% of DCP in
cow need to be obtained from grazing and cut and carry systems. It is approximately 7kg (1.6kg DM basis)
of native grasses.
Table 42 Value of Supplemental Feed for Buffalo & Crossbred Cow in February
Supplemental Feed DM intake TDN DCP
Berseem (10kg) 1.15 0.759 0.22
Sugarcane top (20kg) 5.8 2.85 0.17
Cotton seed cake (0.5kg) 0.44 0.35 0.09
Total (30.5kg) 7.39 3.96 0.48
Kg
In March, farmer gets 3 litres per day each. It is estimated that the nutritional requirement for this
period is 4.61kg TDN, 0.69kg DCP in buffalo and crossbred cow. The feed during this period is shown in
Table 43. Ten kilograms of berseem, 5kgs of wheat straw, 1kg of wheat bran and 0.5kg of cotton seed cake
are fed to the buffalo and cow in twice a day. When the nutritive value obtained from supplementary feed is
subtracted from this, it is estimated that 25% of TDN and 40% of DCP need to be obtained from grazing and
cut and carry systems. It is approximately 11kg (2.6 kg DM basis) of native grasses.
Table 43 Value of Supplemental Feed for Buffalo & Crossbred Cow in March
Supplementary feed DM intake TDN DCP
Berseem (10kg) 1.15 0.759 0.22
Wheat straw (5kg) 4.6 1.67 0
Wheat bran (1kg) 0.9 0.66 0.11
Cotton seed cake (0.5kg) 0.44 0.35 0.09
Total (16.5kg) 7.09 3.44 0.42
KG
4.8 Reproduction
The breeding bull owned by the neighbour land owner is about 1km away from the village, and when
an animal comes in heat the animal is lead to the land owner’s home for mating with a stud bull (a free service).
4.9 Animal Health
4.9.1 Common Livestock Diseases
The most common livestock diseases encountered are HS, FMD, CCPP, PPR, Enterotoxaemia, and
contagious pneumonia.

Appendix F - 46
4.9.2 Vaccinations
The Livestock Department provides guidance on HS, CCPP, Enterotoxaemia.
4.9.3 Mastitis
A sub-clinical mastitis test proved negative.
4.9.4 Result of examination of samples at CVDL Tandojam.
Blood, milk and faecal sample were collected from 5 animals. Several endo parasites were detected
but brucellosis was found negativ

Appendix F - 47
5. Large-Scale Dairy Farmer (Landless)
5.1 Survey Background
Responsible Organisation: Livestock Department, Hyderabad district, Old Cattle Colony
Veterinary Hospital
Responsive: Dr. Liaqat Ali Jat
Person in Charge: Dr. Muhammed Farooque Leghari
Surveyed Farmer: Mr. Haji Aamir
Location: Old Cattle Colony, Hyderabad sub-district, Hyderabad district.
5.2 Introduction
The cattle colony was established in Hyderabad 40 years ago. Subsequently, a second colony (new)
was built. According to a survey conducted by the Veterinary Department of Sindh Agricultural University in
2010, in the old cattle colony there are 90 farmers with an estimated total number of animals of about 14,000.
Thus on average each farmer keeps 155 head of cattle (see Figure 10). The largest farmers (2) have more than
2,000 animals (see Fig 11). The smallest farmer has 40 animals (see Figure 10). This colony is run by the
Mehran Cattle Colony Association, with the participation of all farmers. Of the milk produced, 80% of it is
marketed through middle men. Thirty percent of the farmers market the milk through their own shops. The
Milk Retailer Association has a large influence over the distribution of this milk. Every day huge amounts of
manure is generated. From April to November, it is sold, since there is a demand for compost manure.
However, in winter when there is no demand for it, middleman are contracted to dispose of it.
Table 38. Situation of the Cattle Colony in Hyderabad, 2010
Farm Buffalo Cattle Total
New Cattle
colony
72 5,517 heads
(91.2%)
532 heads
(8.8%)
6,049 heads
Old Cattle
Colony
90 12,689 heads
(91%)
1,258 heads
(9%)
13,947
heads
Total 162 18,206 heads
( 91% )
1,790 heads
( 9% )
19,996
heads
1 -50
51 -100
101 -150
151 -200
201 -250
251 -300
301 -500
501 -1000
Heads 1273 3498 4085 4689 1789 1154 1508 2000
No. Farmer 38 44 34 28 8 4 4 2
0
5
10
15
20
25
30
35
40
45
50
0
500
1000
1500
2000
2500
3000
3500
4000
4500
5000
H
e
a
d
s
Figure 10. Farmer and cattle numbers at cattle colony, Hyderabad.
5.3 Criteria for Farmer Selection
This farmer was selected with the co-operation of the Livestock Department, Hyderabad district, the
Old Cattle Colony Veterinary Hospital, and C/P Dr. Ali Akhatar Shahani and Dr. Mukhtiar Ahmed Babar.
Three candidate farmers were identified as fitting the category of large-scale dairy farmer (landless), two were
in the Old Cattle Colony, and one was in the New Cattle Colony. Mr. Haji Aamir was selected as he had the
highest evaluation score.
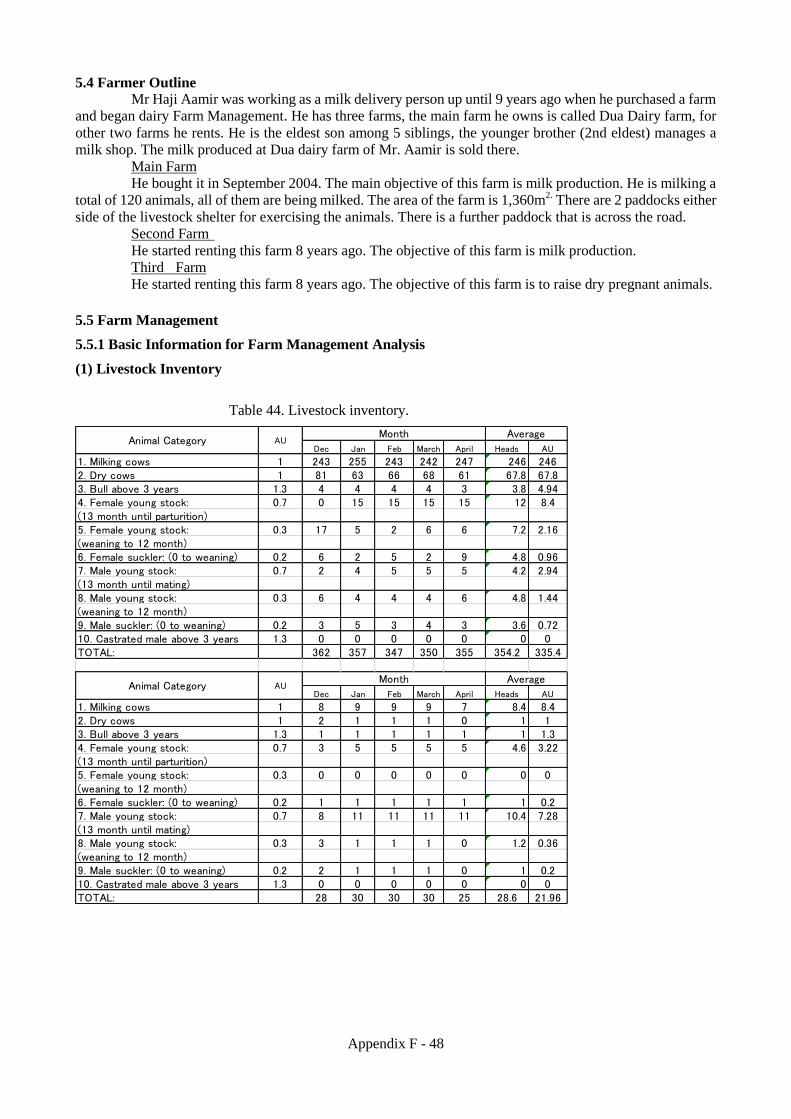
Appendix F - 48
5.4 Farmer Outline
Mr Haji Aamir was working as a milk delivery person up until 9 years ago when he purchased a farm
and began dairy Farm Management. He has three farms, the main farm he owns is called Dua Dairy farm, for
other two farms he rents. He is the eldest son among 5 siblings, the younger brother (2nd eldest) manages a
milk shop. The milk produced at Dua dairy farm of Mr. Aamir is sold there.
Main Farm
He bought it in September 2004. The main objective of this farm is milk production. He is milking a
total of 120 animals, all of them are being milked. The area of the farm is 1,360m2. There are 2 paddocks either
side of the livestock shelter for exercising the animals. There is a further paddock that is across the road.
Second Farm
He started renting this farm 8 years ago. The objective of this farm is milk production.
Third Farm
He started renting this farm 8 years ago. The objective of this farm is to raise dry pregnant animals.
5.5 Farm Management
5.5.1 Basic Information for Farm Management Analysis
(1) Livestock Inventory
Table 44. Livestock inventory.
Dec Jan Feb March April Heads AU
1. Milking cows 1 243 255 243 242 247 246 2462. Dry cows 1 81 63 66 68 61 67.8 67.83. Bull above 3 years 1.3 4 4 4 4 3 3.8 4.944. Female young stock: 0.7 0 15 15 15 15 12 8.4(13 month until parturition)5. Female young stock: 0.3 17 5 2 6 6 7.2 2.16(weaning to 12 month)6. Female suckler: (0 to weaning) 0.2 6 2 5 2 9 4.8 0.967. Male young stock: 0.7 2 4 5 5 5 4.2 2.94(13 month until mating)8. Male young stock: 0.3 6 4 4 4 6 4.8 1.44(weaning to 12 month)9. Male suckler: (0 to weaning) 0.2 3 5 3 4 3 3.6 0.7210. Castrated male above 3 years 1.3 0 0 0 0 0 0 0TOTAL: 362 357 347 350 355 354.2 335.4
Dec Jan Feb March April Heads AU
1. Milking cows 1 8 9 9 9 7 8.4 8.42. Dry cows 1 2 1 1 1 0 1 13. Bull above 3 years 1.3 1 1 1 1 1 1 1.34. Female young stock: 0.7 3 5 5 5 5 4.6 3.22(13 month until parturition)5. Female young stock: 0.3 0 0 0 0 0 0 0(weaning to 12 month)6. Female suckler: (0 to weaning) 0.2 1 1 1 1 1 1 0.27. Male young stock: 0.7 8 11 11 11 11 10.4 7.28(13 month until mating)8. Male young stock: 0.3 3 1 1 1 0 1.2 0.36(weaning to 12 month)9. Male suckler: (0 to weaning) 0.2 2 1 1 1 0 1 0.210. Castrated male above 3 years 1.3 0 0 0 0 0 0 0TOTAL: 28 30 30 30 25 28.6 21.96
AUAnimal CategoryMonth Average
Animal Category AUMonth Average
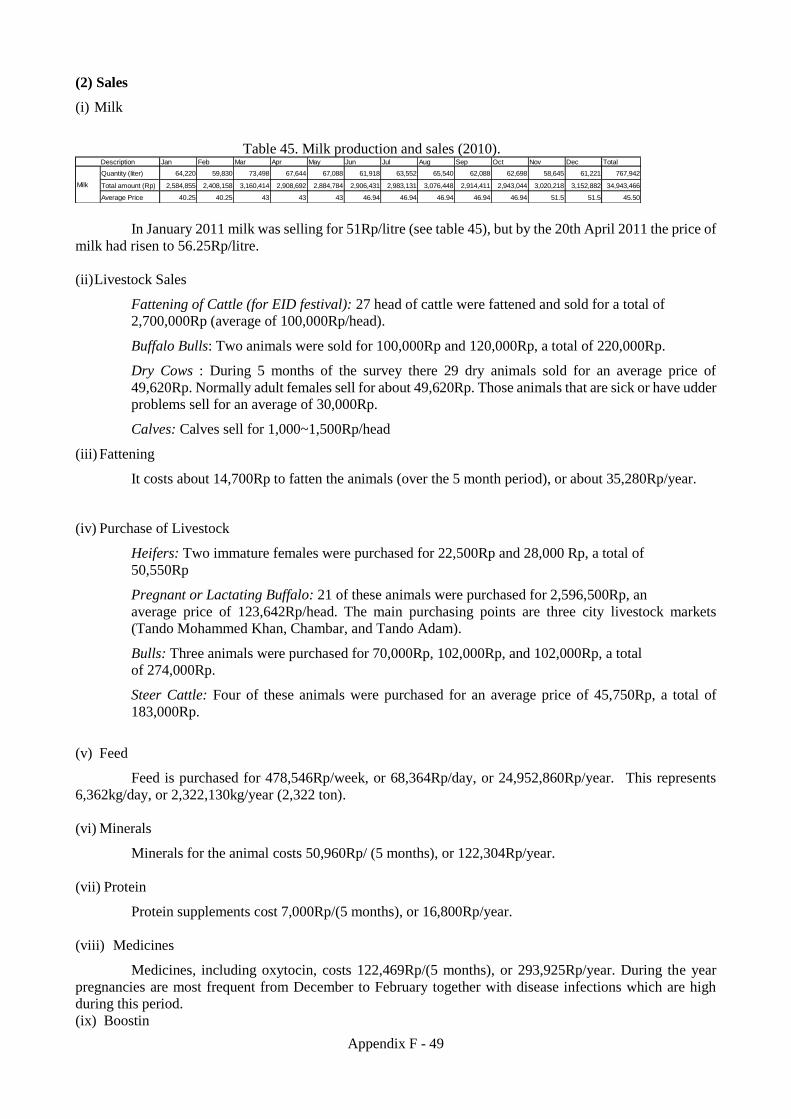
Appendix F - 49
(2) Sales
(i) Milk
Table 45. Milk production and sales (2010). Jan Feb Mar Apr May Jun Jul Aug Sep Oct Nov Dec Total
Quantity (Iiter) 64,220 59,830 73,498 67,644 67,088 61,918 63,552 65,540 62,088 62,698 58,645 61,221 767,942
Total amount (Rp) 2,584,855 2,408,158 3,160,414 2,908,692 2,884,784 2,906,431 2,983,131 3,076,448 2,914,411 2,943,044 3,020,218 3,152,882 34,943,466
Average Price 40.25 40.25 43 43 43 46.94 46.94 46.94 46.94 46.94 51.5 51.5 45.50
Description
Milk
In January 2011 milk was selling for 51Rp/litre (see table 45), but by the 20th April 2011 the price of
milk had risen to 56.25Rp/litre.
(ii) Livestock Sales
Fattening of Cattle (for EID festival): 27 head of cattle were fattened and sold for a total of
2,700,000Rp (average of 100,000Rp/head).
Buffalo Bulls: Two animals were sold for 100,000Rp and 120,000Rp, a total of 220,000Rp.
Dry Cows : During 5 months of the survey there 29 dry animals sold for an average price of 49,620Rp. Normally adult females sell for about 49,620Rp. Those animals that are sick or have udder
problems sell for an average of 30,000Rp.
Calves: Calves sell for 1,000~1,500Rp/head
(iii) Fattening
It costs about 14,700Rp to fatten the animals (over the 5 month period), or about 35,280Rp/year.
(iv) Purchase of Livestock
Heifers: Two immature females were purchased for 22,500Rp and 28,000 Rp, a total of
50,550Rp
Pregnant or Lactating Buffalo: 21 of these animals were purchased for 2,596,500Rp, an
average price of 123,642Rp/head. The main purchasing points are three city livestock markets
(Tando Mohammed Khan, Chambar, and Tando Adam).
Bulls: Three animals were purchased for 70,000Rp, 102,000Rp, and 102,000Rp, a total
of 274,000Rp.
Steer Cattle: Four of these animals were purchased for an average price of 45,750Rp, a total of
183,000Rp.
(v) Feed
Feed is purchased for 478,546Rp/week, or 68,364Rp/day, or 24,952,860Rp/year. This represents
6,362kg/day, or 2,322,130kg/year (2,322 ton).
(vi) Minerals
Minerals for the animal costs 50,960Rp/ (5 months), or 122,304Rp/year.
(vii) Protein
Protein supplements cost 7,000Rp/(5 months), or 16,800Rp/year.
(viii) Medicines
Medicines, including oxytocin, costs 122,469Rp/(5 months), or 293,925Rp/year. During the year
pregnancies are most frequent from December to February together with disease infections which are high
during this period.
(ix) Boostin
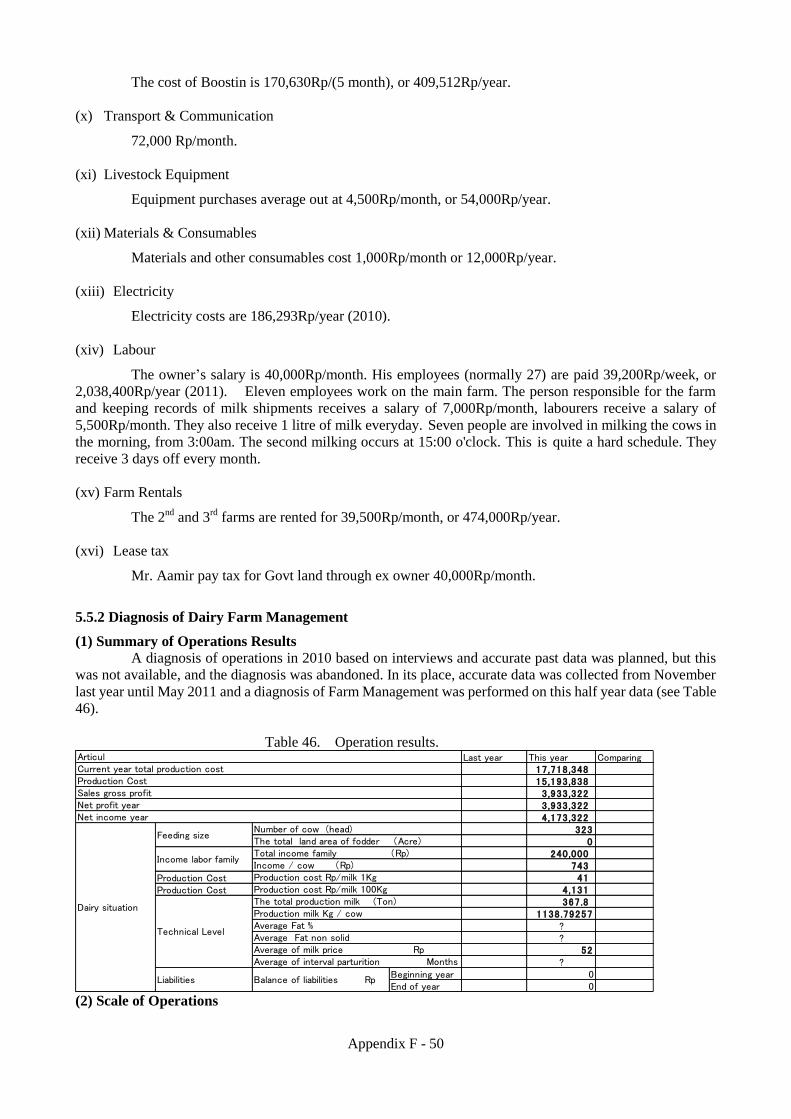
Appendix F - 50
The cost of Boostin is 170,630Rp/(5 month), or 409,512Rp/year.
(x) Transport & Communication
72,000 Rp/month.
(xi) Livestock Equipment
Equipment purchases average out at 4,500Rp/month, or 54,000Rp/year.
(xii) Materials & Consumables
Materials and other consumables cost 1,000Rp/month or 12,000Rp/year.
(xiii) Electricity
Electricity costs are 186,293Rp/year (2010).
(xiv) Labour
The owner’s salary is 40,000Rp/month. His employees (normally 27) are paid 39,200Rp/week, or
2,038,400Rp/year (2011). Eleven employees work on the main farm. The person responsible for the farm
and keeping records of milk shipments receives a salary of 7,000Rp/month, labourers receive a salary of
5,500Rp/month. They also receive 1 litre of milk everyday. Seven people are involved in milking the cows in
the morning, from 3:00am. The second milking occurs at 15:00 o'clock. This is quite a hard schedule. They
receive 3 days off every month.
(xv) Farm Rentals
The 2nd
and 3rd
farms are rented for 39,500Rp/month, or 474,000Rp/year.
(xvi) Lease tax
Mr. Aamir pay tax for Govt land through ex owner 40,000Rp/month.
5.5.2 Diagnosis of Dairy Farm Management
(1) Summary of Operations Results
A diagnosis of operations in 2010 based on interviews and accurate past data was planned, but this
was not available, and the diagnosis was abandoned. In its place, accurate data was collected from November
last year until May 2011 and a diagnosis of Farm Management was performed on this half year data (see Table
46).
Table 46. Operation results. Last year This year Comparing
17,718,34815,193,8383,933,3223,933,3224,173,322
3230
240,000743
Production Cost 41Production Cost 4,131
367.81138.79257
??
52?
Beginning year 0End of year 0
Balance of liabilities Rp
Total income family (Rp)Income / cow (Rp)
ArticulCurrent year total production cost Production CostSales gross profitNet profit yearNet income year
Liabilities
Technical Level
Dairy situation
Average of milk price RpAverage of interval parturition Months
Income labor family
Feeding size
Average Fat % Average Fat non solid
The total production milk (Ton)Production milk Kg / cow
Number of cow (head)The total land area of fodder (Acre)
Production cost Rp/milk 1KgProduction cost Rp/milk 100Kg
(2) Scale of Operations

Appendix F - 51
Table 47. Livestock inventory. Table 48. Labourers. Number of family
Dairy Beef Buffalo Working number family 27Dairy work number
333 54 9 Employment PermanentIntroduction Employment TemporaryBirth, Transfer Child count 0.5 person.SaleAccident, Culling 1Transfer
323 58 13
Enter
Out
End of year
AverageBeginning year
Category CowYounganimal
New calfFattening animal
5.5.3 Cost of Living
Unlike the rural based farmers, Mr. Aamir's cost of living was only 48 and 50% of income (see table
49). The weekly cost of living was however 6,695Rp, 52 times higher than his rural counterparts. His cost of
living is estimated to be 200,340Rp/year. It is thought to be even higher, as he has expenses associated with his
children's education and other expenses as well.
Table 49. Details of weekly expenditure.
Rp %
Food, beverage, 8011 48
Apparel, textile, and foot wear 2283 14
Transport & communication 1256 7
Fuel & Light 4989 30
Medical care 156 1
Total 16695 100
5.6 Feeding management
Mr. Haji Aamir is the owner, cum person responsible for the dairy farm. There is a person in charge at
each of the 3 farms, at two of the farms milking is being done. The remaining farm is used to raise dry pregnant
animals. Every 2 or 3 days the volume of milk from each animal is measured and its production capacity
determined. For those animals with high milk production capacity, when dry they are raised on the farm again
until they become pregnant. For those with low production capacity, they are sold to the slaughter house. The
animals are not tagged, but the place where the animal is tethered is numbered. Each day the animals are
released into a paddock for exercise. They are then returned to the shelter and tethered in the same place.
The calves are sent to the slaughter house within 1 week of being born. Although the numbers are
small, there are calves from mothers who have good production capacity who are kept and raised to be milked
later on. The daily growth rate of calves is a low 250g. Moreover, the BCS of lactating animals is in the low
range of 1~1.8. Many issues of husbandry remain to be addressed in the future.
The average milk yield for all the animals in April was 8.2kg/day/head, with a maximum of 14kg,
and a minimum of 3kg. Even with this large range in production rates, the management of adult females
remains the same for all animals. It is thought that management could improve productivity by dividing the
animals into 2 groups, a high and low production capacity group. The high production capacity group could
then be fed a high energy, good quality feed, and managed in a suitable way.
5.6.1 Livestock Facilities
The main cattle shed is built from brick, is sturdy and can be used for the long term. The roof is made
from reeds, and needs to be replaced every 10 years. With the walls being brick, the shelter has poor ventilation.
During the summer temperatures in the cattle shed are high, increasing poor performance statistics. The floor
area is a large 68 x 20m (1,360m2).

Appendix F - 52
5.6.2 Daily Routine
02:00am Animals are brought back from the paddocks and tethered.
03~05:00 Milking (fed an average of 8~9kg/head)
06:00 Returned to paddock. While in the paddock, the milking shed is hosed
down and feed prepared)
09:00 Returned from paddock and tethered in milking shed. The animals are
watered in between.
14:00 The animals are hosed down and cleaned with water.
15~17:00 Milking. Fed an average of 8~9kg/head.
18:00 Returned to paddock.
5.6.3 Milking
The animals are milked by hand twice a day, once at 3:00am in the morning, and then at 15:00 pm in
the afternoon. The 12 hour interval between milking is ideal. Although the morning milking at 3:00am is hard
work, it cannot be helped when milk market requirements are taken into consideration. Basically, as calves are
not kept, there is no stimulus from calves to the adult females to produce milk. Therefore, 5 minutes before
milking the animal is injected with 2cc of oxytocin.
Each milking takes 2 hours to perform, for a daily total of 4 hours of milking. In the milking
operations, the work is organized and carried out briskly. This highlights the competency of Pakistani workers.
First of all, there is the person in charge of injecting oxytocin, then there is the person who wheelbarrows in
8.5kg of feed per animal. Five minutes after the injections has been given, the 7 milkers begin milking the
animals in order. Though there appear to be a few who are lethargic with poor milking skills, most of the
milkers are well-trained and skilled at their job. However, there is no cleaning of the udder prior to or during
milking. There is also no dipping of the udder after milking.
The use of growth hormones to increase milk production began about 5 years ago. They use an
Korean product called Boosten (Bovine somatotropin Hormone). According to the literature this is expected to
boost production by about 10~15%. The price of a 2.1ml vial is 285Rp, with 0.3ml/head being injected every
other day. Consequently this works out to be an expensive 41Rp/injection/head.
(1) Milking Speed It takes 7 people 2 hours (120 minutes) to milk all the animals. As there are 113 animals, that means
1 person milks 16 animals. If you divide 120 by 16, the time necessary to milk one animal is 7.5 minutes. I
randomly timed the milking of 11 animals. The average time taken was 3.9 minutes (roughly 4 minutes). In the
afternoon the milk yield was 4.4kg/head. This means a milking rate of 1kg/minute. Normally when milking,
the oxytocin (a lactogenic hormone) takes 7 minutes to circulate around the blood system. Thus, milking is
recommended to be completed within 7 minutes. With this in mind, in those 7 minutes 7kg can be milked, and
with a morning and an afternoon milking, milking animals with a 14kg/day milk production capacity is
feasible at this speed of milking . If production capacity increases above this, then the animal would be best
milked by two people, one from each side.
(2) Milk Filter
The milk is not filtered. The presence of feed and other wind blown impurities in the milk was
observed. A special metal bucket is used to collect the milk, the full buckets are then poured into a large metal
container. After milking is completed, the milk is shipped (without filtering).
(3) Animal Age
I made observations and interviewed people at the main farm, where 117 animals are being milked,
about the age of animals being milked and the months since calving. . The average age is 7.9 ± 2.05, the
maximum age was 16 years old, and the minimum age was 3.5 years old. Though an old 16-year-old animal
was present, it was quite lean looking. The average age from calving was 4.5 ± 2.72 months, with a maximum
of 16 months, and a minimum of 0 months. There was an animal that was still being milked 16 months after
parturition. Though it is reported that the lactating period of water buffalo is short, you can see that there are
individuals with very long lactating periods.

Appendix F - 53
5.7 Feed
Cattle colony is large scale urban and peri-urban dairy production system. In this system, 100% of
ingredients fed to livestock are purchased from markets.
In cattle colonies, even though the milk yield between buffalo varies significantly, they are all fed the same
amount of feed. It is thought that the necessary nutritional requirement needed to obtain an average of 9 litres
of milk per head per day is being met the TDN basis (see Table 50,51).
The compounding ratio is determined by personal experience and exchange of information between dairy
farmers.
Table50 Value of House Compounded Feed for Milking Buffalo
Ingredientskg/animal/
day
DM intake
kg/dayTDN (kg) DCP (kg)
Maize(Green) 7.4 1.62 0.99 0.09
Wheat straw 4.3 3.96 1.43 0
Cotton seed cake 1.7 1.51 1.19 0.3
Wheat bran 3.4 3.07 2.25 0.39
Mung Churi 1.8 1.63 0.92 0.19
Gram Churi 1 0.9 0.65 0.07
Rice polish 0.4 0.365 0.29 0.04
Mineral premix 0.008
Total 20.008 13.055 7.72 1.08
Table51 Nutrient Requirements for Milking Buffalo
Nutrient requirements
TDN DCP
Maintenance 3.28 0.329
Milk production/L 0.443 0.124
(6.5% Butter Fat)
9 L milk production 3.99 1.12
Total 7.27 1.45
5.8 Reproduction
The farmer owns 2 Kundhi buffalo stud bulls. They are exercised in the paddock twice a day, 3 hours
in the morning, and 8 hours in the evening, for a total of 11 hours. Any buffalo in heat is serviced during this
time. I carried out pregnancy tests on 21 water buffaloes, (for all of them it was more than 4 months since their
last calving). Ten of the buffalo had conceived (a rate of 48%). For these 10 animals the date of conception
(servicing) was estimated by subtracting the gestational age. The average was 3.7 ± 1.25 months since the last
calving. It is generally said that the conception rate of water buffalo is low, however only looking at these
results it is possible to maintain a normal conception rate, that is if good husbandry and reproduction
management is in place.
5.9 Animal Health
5.9.1 Common Disease Situation
According to the weekly data collected, there were frequent treatments of pneumonia and mastitis.
Other problems included udder problems, abortion, difficult births, and placenta retention after birth. Local
technician examined 4 animals that had aborted foetuses and collected the milk samples for diagnosis at CVDL
Tandojam. All 4 tested positive for brucellosis. These animals yet not culled, 2 continued to be raised, and the
other 2 were sold to buitcher. Between mid-January and February 7 cases of foot and mouth disease occurred.
The Livestock Department though does not have official evidence. Calves with colds, fever and diarrhoea were

Appendix F - 54
frequent. A number of them died. Fungal infection of teats shows papules also infect the hands of milker was
observed mostly in the month of January.
5.9.2 Mastitis
When at milking, no cleaning of the udder is done, and the animals are group fed, the normal rate of
sub-clinical mastitis is expected to be about 70%. I randomly tested 13 animals for sub-clinical mastitis.
Nos. Of infected
The result was that 9 of the 13 animals had sub-clinical mastitis. 「
- Negative:: 4 animals、「 ± False Positive:: 2 animals、「
+ Positive grade 1:: 2 animals、「 ++ Positive grade 2: 3 animals、「
+++ Positive grade 3::2 animals.
For those animals with a positive grade 2 result, or more treatment, is necessary. That means 5
animals (38%) need to be treated. Of the total number of teats (13 x 4 = 52) tested, 17 (33%) were found to
have sub-clinical mastitis. The details are as follows: 「
- Negative:: 35、「 ±」False positive::5、「
+ Positive grade 1:: 7、「 ++ Positive grade 2::3、「
+++ Positive grade 3:: 2.
Thus a total of 5 (9.6%) of teats need to be treated. Considering these results, of all the 113 animals
being milked, it is estimated that of all the teats (452), only 43 (9.6) need to be treated.
5.9.3 Prevention
The animals were vaccinated for HS, once in June and then again in November. They were
vaccinated for foot and mouth disease once in November. They were de-wormed for endo-parasites twice,
once in April and then again in October.
5.9.4 Animal Health
5.10 Breeds
Of the 120 animals being milked, 116 were buffalo and only 4 were European hybrids. A breakdown
of the buffalo breeds is as follows, there were pure Kundhi, crosses between Kundhi and Nili Ravi, and Nili
Ravi; respectively 54 (47%), 60 (52%), and 2 (1%). This is a typical commercial dairy farm, the main objective
of which is milk production. From this respective, they do not prefer any one breed, but rather seek to
maximize milk production with high production capacity animals. The animals are purchased in the city
livestock markets at Tando Mohammed Khan, Tando Adam and Chambar. At the time of selection, they select
those animals with large udders, with teats that are medium in size, and the teats are soft to feel.
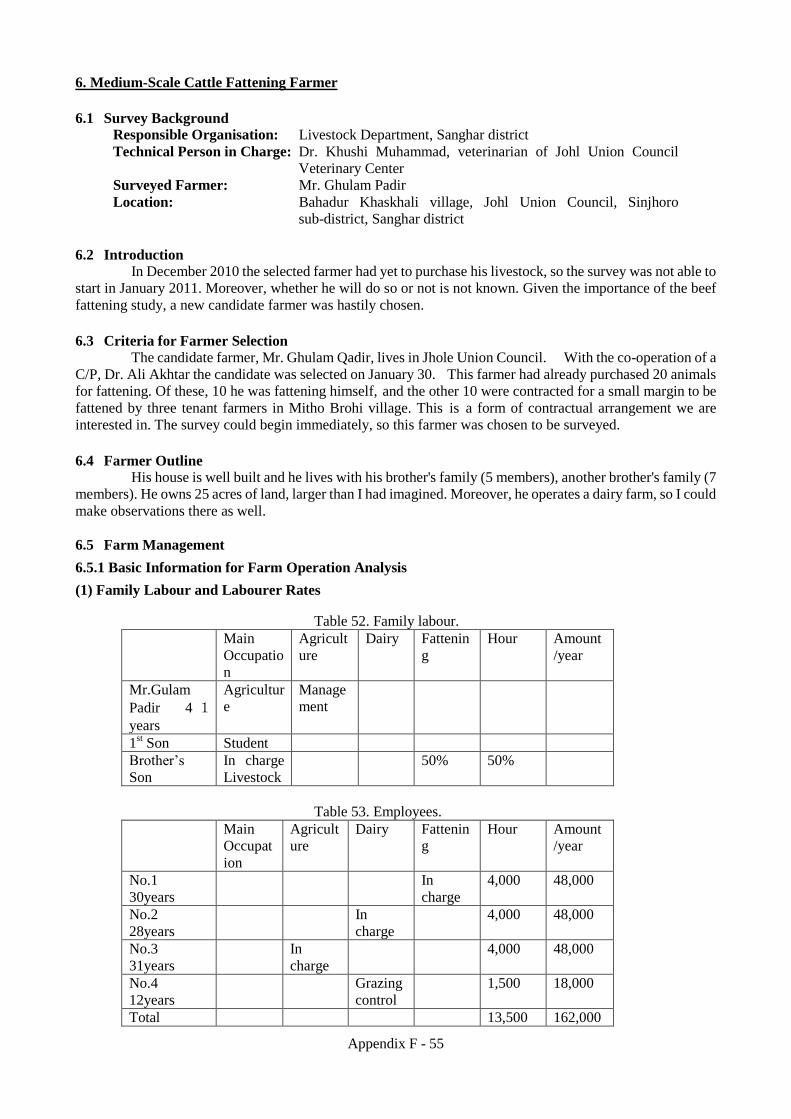
Appendix F - 55
6. Medium-Scale Cattle Fattening Farmer
6.1 Survey Background
Responsible Organisation: Livestock Department, Sanghar district
Technical Person in Charge: Dr. Khushi Muhammad, veterinarian of Johl Union Council
Veterinary Center
Surveyed Farmer: Mr. Ghulam Padir
Location: Bahadur Khaskhali village, Johl Union Council, Sinjhoro
sub-district, Sanghar district
6.2 Introduction
In December 2010 the selected farmer had yet to purchase his livestock, so the survey was not able to
start in January 2011. Moreover, whether he will do so or not is not known. Given the importance of the beef
fattening study, a new candidate farmer was hastily chosen.
6.3 Criteria for Farmer Selection
The candidate farmer, Mr. Ghulam Qadir, lives in Jhole Union Council. With the co-operation of a
C/P, Dr. Ali Akhtar the candidate was selected on January 30. This farmer had already purchased 20 animals
for fattening. Of these, 10 he was fattening himself, and the other 10 were contracted for a small margin to be
fattened by three tenant farmers in Mitho Brohi village. This is a form of contractual arrangement we are
interested in. The survey could begin immediately, so this farmer was chosen to be surveyed.
6.4 Farmer Outline
His house is well built and he lives with his brother's family (5 members), another brother's family (7
members). He owns 25 acres of land, larger than I had imagined. Moreover, he operates a dairy farm, so I could
make observations there as well.
6.5 Farm Management
6.5.1 Basic Information for Farm Operation Analysis
(1) Family Labour and Labourer Rates
Table 52. Family labour.
Main
Occupatio
n
Agricult
ure
Dairy Fattenin
g
Hour Amount
/year
Mr.Gulam
Padir 4 1
years
Agricultur
e
Manage
ment
1st Son Student
Brother’s
Son
In charge
Livestock
50% 50%
Table 53. Employees.
Main
Occupat
ion
Agricult
ure
Dairy Fattenin
g
Hour Amount
/year
No.1
30years
In
charge
4,000 48,000
No.2
28years
In
charge
4,000 48,000
No.3
31years
In
charge
4,000 48,000
No.4
12years
Grazing
control
1,500 18,000
Total 13,500 162,000

Appendix F - 56
(2) Agricultural Costs
The following costs were confirmed;
Tilling: 39,300Rp Fertilizer: 84,600Rp
Herbicide: 4,800Rp Insecticide: 13,400Rp
Cotton Seeds: 19,200RP Sowing Cotton: 1,400Rp
Total: 162,700Rp
(3) Livestock Production Costs The following costs were confirmed;
Goats: 87,000Rp (1 goat was purchased on 27th February) and 649,000Rp (8 goats
were purchased on 2nd May). An average price of 81,125Rp.
Feed: Green cut corn stalks were purchased for 10,000Rp.
Artificial Insemination: Performed for 800Rp.
6.5.2 Diagnosis of Cattle Fattening Management
(1) Summary of Operation Results (2010)
The livestock bought in January were bought with the intention of fattening for sale during the EID
festival. However, even though the goats were bought with this intention, over half of them have already been
sold. They were sold to a farmer who would fatten himself for the Eid festival.
Although valuable data collection began in January, there is still not enough data. For the reason
that livestock management costs are intermingled with dairy operation costs, diagnosis of the fattening
management was not attempted.
6.5.3 Productivity
(1) Cattle Fattening
The table below notes the livestock purchased, date of purchase and the purchase price. The daily
gain between January and May was monitored by measuring chest girth and estimating weight. The
measurement scale used was made in the USA for use in South America. The average daily gain was a
relatively good result of 545g/day.
Table 54. Purchase and sales of cattle.
Date of purchasePrice Sale Price
white 1 Dhani Nov.2010 90,000 19/4 160,000 733.3white 2 Dhani Nov.2010 90,000 19/4 160,000 383.3
Brown mouth Sahiwal cross Nov.2010 52,000 End of Feb. 75,000Black mouth Sahiwal cross Nov.2010 52,000 Endo of Feb. 75,000
Dark red black (+) Sahiwal cross Nov.2010 90,000 441.7Light red (-) Sahiwal cross Nov.2010 90,000 375.0Light black (-) Thari cross Nov.2010 60,000 541.7White roan (+) Thari cross Nov.2010 60,000 316.7
Sahiwal RB Sahiwal2 Nov.2010 90,000 19/4 155,000 966.7Light red Sahiwal3 Nov.2010 80,000 19/4 155,000 333.3Frisian cross Frisian cross Nov.2010 130,000 19/4 165,000 816.7
545.4
Purchase
Average
Sold ID Breed DG

Appendix F - 57
White roan (+)
Light red Light red
(-)white 2 white 2
Dark red black (+)
Light black (-)
white 1 white 1Frisian cross
Sahiwal RB
DG 317 333 375 383 383 442 542 733 733 817 967
0
200
400
600
800
1000
1200
gDG
Figure 14. Daily gain.
6.5.4 Cost of Living
During the 6 month period of the survey, the average weekly cost of living was 8,637Rp, which
works out to be 34,548Rp/month, or 449,072Rp/year (see Table 55).
Table 55. Details of weekly expenditure.
Rp %
Food, beverage, 4,702 55
Apparel, textile, and foot wear 978 11
Transport & communication 1,453 17
Fuel & Light 696 8
Medical care 807 9
Total 8,636 100
Food cost 4,702Rp (55%), Clothes 978Rp (11%), Transportation/Communication 1,453Rp (17%),
lighting 696Rp (8%), Medical 807Rp (9%). This is a total of 8,636Rp (100%). During this 6 month period
apart from the above weekly expenditures, there were special expenditures related to repair of the house
173,000Rp, Wedding gifts 8,000Rp, Meson 24,350Rp, for a total of 205,350Rp.
6.6 Feeding management
6.6.1 Dairy Farm
Although the objective was to examine fattening management, information related to dairy farming
was collected. Milking occurs twice a day, once a 5:00am in the morning and then again at 5:00pm in the
evening. The number of animals milked on the day of the survey was 15. A total of 40 litres was collected. Of
that 20 litres was sold to a local middleman and the remaining 20 litres consumed by the extended family.
Milking is being done in the morning and at night, so with a total milk yield of 80 litres/day that means a milk
yield of 5.3 litres/head/day.
(1) Cattle Milking cows: 7 (1 Sahiwal cross, 1 Red Sindhi, and 3 Red Sindhi cross), Dry cows: 5, heifer: 6,
weaned calves: 4 (female) & 4 (male), suckling calves: 4 (Female), & 3 (male), bull for mating: 1 (Kankej
breed), Bullock: 2 (for ploughing and hauling feed), young male stock: 20.
(2) Water Buffalo By breed: Kundhi: milking: 8, dry: 8, heifer: 9, weaned calves: 3(female) and 5 (male), suckling
calves: 7 (female) and 1 (male), bull: 1 and young male stock: 1.

Appendix F - 58
6.6.2 Fattening
They are being raised tethered and bridled, and not grazed Even though he is fattening 10 of his own
animals, he is also fattening in a share arrangement (since 10 years ago) with the 3 farmers in Mitho Brohi
village. This year he has contracted out fattening of 4, 4, and 2 animals to three farmers. The price of purchase
is known when in the EID festival the animals are sold the profits will be shared 50:50. All feed is paid for by
the owner, as well as any necessary veterinary fees. At sale all production costs are split 50:50.
Castration is by a crush method administered by a technician from the Department of Livestock. The
cost is 50Rp/head.

Appen
dix
F -
59
6.7
F
eed
(1) F
eed
ing c
ale
nd
ar
of
catt
le f
att
enin
g
11
12
12
34
12
34
12
34
12
34
12
34
12
34
12
34
Ro
ughag
eB
erse
em20kg/a
nim
al/day
Whe
at s
traw
10kg/a
nim
al/day
Mai
ze10kg/a
nim
al/day
So
rghu
m (
mul
ti-cu
t)20kg/a
nim
al/day
Co
ncen
trat
esW
heat
bra
n0.5
kg/a
nim
al/day
Co
tto
n se
ed c
ake
0.5
kg/a
nim
al/day
Whe
at m
idd
ling
0.5
kg/a
nim
al/day
Sal
t (b
lock
)F
ree a
ccess
Mus
tard
oil
0.5
l/anim
al/m
onth
Ghe
e (D
esi)
0.5
l/anim
al/w
eek
Bro
wn
suge
r(G
hru)
3kg/5
anim
als
/month
1.D
ilute
bro
wn s
uger(
Ghru
) w
ith w
ate
r (B
row
n s
uger
solu
tion)
2.M
ix w
heat
bra
n, cott
on s
eed c
ake a
nd w
heat
mid
dlin
g w
ith b
row
n s
uger
solu
tion
*M
ixed r
ation is
fed t
o a
nim
als
3 t
imes
a d
ay (
7:0
0, 15:0
0, 20:0
0)
21
34
5
Ingre
die
nts
DM
inta
ke
TD
ND
CP
Bers
eem
(20kg)
2.3
0.2
0.3
9
Wheat
stra
w (
10kg)
9.2
3.3
30
Wheat
bra
n (
0.5
kg)
0.4
50.3
30.0
6
Cott
on s
eed c
ake (
0.5
kg)
0.4
40.3
50.0
9
Wheat
mid
dlin
g (
0.5
kg)
0.4
40.3
60.0
4
Tota
l (
31.5
kg)
12.8
34.5
70.5
8
Kg
Ingre
die
nts
DM
inta
ke
TD
ND
CP
Wheat
stra
w (
10kg)
9.2
3.3
30
Maiz
e (
10kg)
2.1
91.3
30.1
2
Wheat
bra
n (
0.5
kg)
0.4
50.3
30.0
6
Cott
on s
eed c
ake (
0.5
kg)
0.4
40.3
50.0
9
Wheat
mid
dlin
g (
0.5
kg)
0.4
40.3
60.0
4
Tota
l (
21.5
kg)
12.7
25.7
0.3
1
Kg
Ingre
die
nts
DM
inta
ke
TD
ND
CP
Wheat
stra
w (
10kg)
9.2
3.3
30
Multi-
cut
Sorg
hum
(20kg)
31.7
90.2
1
Wheat
bra
n (
0.5
kg)
0.4
50.3
30.0
6
Cott
on s
eed c
ake (
0.5
kg)
0.4
40.3
50.0
9
Wheat
mid
dlin
g (
0.5
kg)
0.4
40.3
60.0
4
Tota
l (
31.5
kg)
13.5
36.1
60.4
kg
Tab
le 5
6.
V
alue
of
Hou
se C
om
pound
ed
Fee
d f
or
Fat
tenin
g C
attl
e in
Feb
ruar
y, M
arch
T
able
57. V
alue
of
House
Com
pounded
Fee
d f
or
Fat
tenin
g C
attl
e in
May
Tab
le 5
8.
V
alue
of
Hou
se C
om
pounded
Fee
d
for
Fat
tenin
g C
attl
e in
Jun t
o S
epte
mber

Appendix F - 60
6.8 Breeds
This farmer goes every year to Punjab district to buy livestock. The main breeds are a Bhagnari
variety Dajal breed, Sahiwal breed, and Cholistani cross breed. They all are meat type breeds, particularly
around the thighs. Through long experience he has learnt that these breeds fatten well, and demand high prices
during the EID festival. In fact, during the short data collection period the average daily growth rate was
545g/day, and 967g/day for a Sahiwal and Zebu cross respectively. This indicates that the Zebu breeds have a
high potential for fattening.

Appendix F - 61
7. Medium-Scale Goat Fattening
7.1 Farmer Survey Background
Responsible Organisation: Livestock Department, Sanghar district
Person in Charge: Dr. Khushi Muhammad
Surveyed Farmer: Mr. Wazir Muhhammad(48 years old, Tel: 0301-3804044
Location: Muhammad Sharif Mari village, Kur Kali Union
Council, Jhole sub-district, Sanghar district
7.2 Introduction
This farmer was selected with the co-operation of the Livestock Department, Sanghar district. The
village of Muhammad Sharif Mari is in an irrigated area, about 5km from Jhole town. The village was
established in 1970 and covers an area of 8 acres. In the village there are 85 households, all small-scale
farmers. About 10% of them having own land, the other 90% are landless. About half the households are
raising goats, while only two households are commercially fattening cattle. About 100 water buffalo are
being raised, and there are no camels.
7.3 Criteria for Farmer Selection
We selected the farmer with the co-operation of a C/P, Dr. Ali Akhtar. There was one candidate
farmer and he was selected a week ago. There were no other farmers to compare with, so Mr. Wazir
Muhhamad Khan was selected.
7.4 Farmer Outline
There are 5 brothers and sisters and they co-operative operate a 25 acre farm. Mr. Khan's first wife
died and he remarried. Moreover, he has married again and now has 2 wives. Consequently, the make up of
the household is two wives, 3 sons and 7 daughters, for a total of 13. He owns the village mosque and opens
it up to the villagers also pay the expenses.
7.5 Farm Management
7.5.1 Basic Information for Farm Management Analysis
(1) Family Labour and Labourer Rates
Table 59. Family labour.
Main
Occupation
Agriculture Buffalo, Goat
& Sheep
Hour Rp/Year
Mr.Wazir 48years Agriculture Management Management 4=Rp48 17,520
1st Wife 38years House
work
Milking,
Feeding
2=Rp24 8,760
2nd
Wife 22Years House
work
Milking,
Feeding
2=Rp24 8,760
1st Son 22years
2nd
Son 12years
3rd
Son 3.5years
1st Daughter
18years
No No
2nd
Daughter 13years
No No
3rd
Daughter 9years
Student No
4th Daughter
8years
Student No
5th Daughter
5years
Student No
Total 35,040

Appendix F - 62
(2) Employees
The in-charge goat (23 years old) receives 3,000Rp/month salary. The in-charge buffalo (15 years
old) receives 2,500Rp/month.
(3) Livestock Facilities
(i) Paddock
A simple paddock surrounded by thorny bushes (called a lorho by the locals). It can be used for 2
years.
(ii) Equipment Costs
A motorbike was bought in 2009 for 38,000Rp. This bike is used for livestock purposes about 10%
of the time. A feed cutter was bought in 2003 for 12,000Rp. Depreciation has been completed on this. A car
was bought in 2010 for 675,000Rp and sold this year. This was used for livestock purposes about 10% of the
time.
(4) Agricultural Production Costs
The following costs were confirmed;
Tilling: 70,700Rp Fertilizer: 77,965Rp,
Herbicide: 90,600Rp Insecticide: 9,340Rp,
Cotton Seeds: 17,600Rp, Fuel: 2,500Rp
Total: 268,705Rp
(5) Livestock Production Costs
Purchase of Goats: In November 21 animals were purchased for 128,100Rp (an average price
6,100Rp/head). Another 7 were purchased in December for 52,500Rp (an average price of
7,500Rp).
Feed:
Minerals: 1,160Rp,
Tree Fodder: 9,440Rp
Acacia Leaves: 1,400Rp,
Jantar Seeds: 2,200Rp.
Medicines: 3,460Rp.
7.5.2 Diagnosis of Goat fattening management
(1) Results of management (2010)
When the first interview started it was already November and the goats had already been sold for
Eid festival. Thus I was not able to observe the goats. The goats bought in November and December were
bought at Tando Adam market or nearby villages and the average price in November and December was
7,500Rp and 6,500Rp respectivley. Of the goats that were bought to fatten for Eid, 7 of them were sold on
the 15th May to a middleman for 9,000Rp/head. Unfortunately I was not able to record individual details and
monitor weight gains of these animals. Though the aim of the survey was to obtain important basic data on
goat fattening, the livestock costs associated with buffalo and goat farming were intertwined and we were
unable to conduct the diagnosis on goat fattening.
7.5.3 Productivity
(1) Goat
(i) Goat Fattening
The breeds were pure Pateri, and cross Pateri goats. In November and December 2010 ten bucks
were bought for fattening. Their ages were from 7~11 months old, with the average age 9.25 months.
The average weight of males was 25.8kg. (see Figure 15). The average daily gain between December and
May was 44g/day (see Figure 16).

Appendix F - 63
0
5
10
15
20
25
30
35
40
7 8 9 10 11 12 13 14 15 16
a Pateri
b Pateri Mix
c
d
e
f
g
h Pateri
I Pateri
j Pateri
k
7 8 9 10 11 12 13 14 15 16
Average 24.0 23.3 23.8 26.5 29.3 31.0 31.8 35.0 34.7 36.0
0.0
5.0
10.0
15.0
20.0
25.0
30.0
35.0
40.0
軸ラ
ベル
Average
Figure 15. Individual weight. Figure 16. Average weight.
(ii) Growth of Kids
The average daily growth was 76g/day.
0
2
4
6
8
10
12
14
16
18
20
1 2 3 4 5 6 7
a
b
c
d
e
f
1 2 3 4 5 6 7
Avg. 5.1 7.5 10.3 11.9 13.6 18.0 18.8
0.0
2.0
4.0
6.0
8.0
10.0
12.0
14.0
16.0
18.0
20.0
軸ラ
ベル
Avg.
Figure 17. Individual weight. Figure 18. Average weight.
During the first 6 months, growth is very fast, it thereafter decreases to 25g/day. The measurement
at 6 months appears to be incorrect. For this reason it appears to have been balanced out in the 7th month.
2 3 4 5 6 7
DG 81.3 94.4 52.8 56.9 145.8 25.0
0.0
20.0
40.0
60.0
80.0
100.0
120.0
140.0
160.0
gram
DG
Figure 19. Daily weight gains
7.5.4 Cost of Living
During the 6 months the weekly cost of living data was taken, average weekly cost of living was
12,856Rp/week, or 50,344Rp/month, or 654,472Rp/year (see Table 60). The cost of food supplies represents
35% of expenditures, a relatively good lifestyle. Medical expenses were high at 27%. It is thought to be due
to a large number of young children.

Appendix F - 64
Table 60. Details of weekly expenses
Rp %
Food, beverage, 4,407 35
Apparel, textile, and foot wear 1,452 12
Transport & communication 2,004 16
Rental 500 4
Fuel & Light 808 6
Medical care 3415 27
Total 12,586 100.0
You see that there is an extremely high Engels co-efficient of 84%.
7.6 Feeding Management
7.6.1 Daily Routine for Goat Husbandry
8:00am Feed the goats
9~13:00 Grazing
18:00 Feed the goats
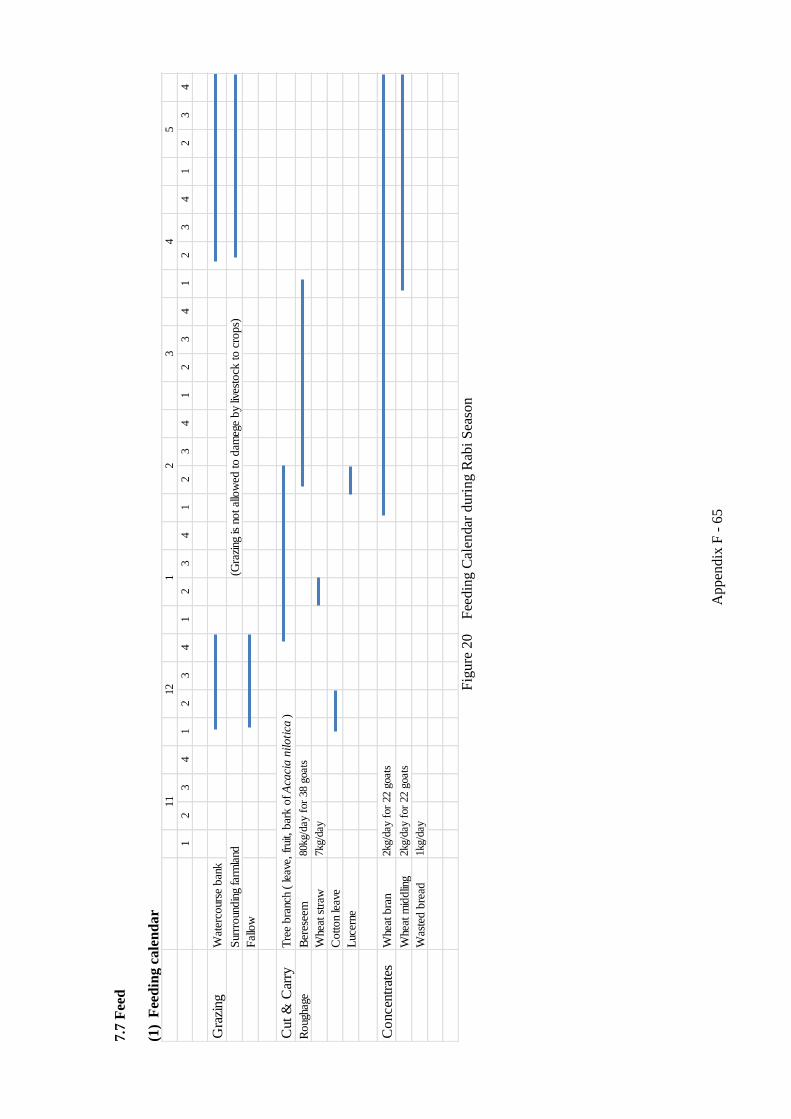
Appen
dix
F -
65
7.7
Fee
d
(1)
Fee
din
g c
ale
nd
ar
12
34
12
34
12
34
12
34
12
34
12
34
12
34
Gra
zing
Wat
erco
urse
ban
k
Sur
rroun
din
g fa
rmla
nd(G
razi
ng is
not al
low
ed to d
ameg
e by
lives
tock
to c
rops)
Fal
low
Cut
& C
arry
Tre
e bra
nch
( le
ave,
fru
it, b
ark o
f A
caci
a n
iloti
ca)
Roug
hage
Ber
esee
m80kg/d
ay f
or
38 g
oats
Whe
at s
traw
7kg/d
ay
Cotton
leav
e
Luc
erne
Co
ncen
trat
es
Whe
at b
ran
2kg/d
ay f
or
22 g
oats
Whe
at m
iddlin
g2kg/d
ay f
or
22 g
oats
Was
ted b
read
1kg/d
ay
511
12
12
34
Fig
ure
20
F
eedin
g C
alen
dar
duri
ng R
abi
Sea
son

Appendix F - 66
8. Small-Scale Goat/ Sheep Farmer in Arid Area
8.1 Survey Background
Responsible Organisation: Livestock Department, Tharparkar district
Technical Person in Charge: Mr. Jammal
Surveyed Farmer: Mr. Karman s/o Bhojo
Location: Mithio Bhatti village, Mithi sub-district,
Tharparkar district.
8.2 Introduction
This farmer was selected with the cooperation of the Livestock Department, Tharparkar district.
Mithrio Bhatti village is in a desert area, 22 km from the district capital of Mithi. It takes about 30 minutes to
travel there. It is an old village established over 400 years ago. It is 1km2 in area, and there are 450
households in the village. Most of the villagers depend on raising goats or sheep for a livelihood.
8.3 Criteria for Farmer Selection
This farmer was selected with the co-operation of C/P, Dr. Muhammad Arif Khan and Dr. Abdul
Sattar Memom. There were three candidate farmers, Mr. Chahno (an evaluation score of 68), Mr. Karman
(an evaluation score of 59), and Mr. Nandlal (an evaluation score of 56). After interviewing Mr. Chahno and
Mr. Karman, we selected Mr. Karman. The reason we chose Mr. Karman was that he had milking the goats,
which meant that at milking at 8:30am all the animals were present to be surveyed. As it turned out, Mr.
Chahno had already left for grazing and could not have been surveyed anyway.
8.4 Farmer Outline
Mr Karman lives in the village. He has many children and consequently many expenses. He has
learnt to handle a number of different jobs on different days. He owns a camel, so he leases land on which he
grows sorghum, millet, gowar, etc . The make up of his household is 5 sons, 2 daughters, and a wife. His
eldest son, Gansham, lives and works in Mithi. For that reason, his second eldest son (18 years old) manages
the livestock.
8.5 Farm Management
8.5.1 Basic Information for Farm Management Analysis
(1) Family Labour and Labourers Rates
Table 61. Family labour.
Main
Occupation
Tenant land
work
Livestock
work
Hour Amount
/year
Karman Agriculture Work Management 2=24 8,760
Wife House work Milking 30
minutes
2=24
8,760
1st Son 18years Office work:
2500Rp/mon
th
No No し
2nd
Son 15years Livestock Grazing
control &
other
8=10
0
36,500
3rd
Son 9years Student No
4th Son 7years Student No
5th Son 4years No
1st
Daughter17years
House work No
2nd
Daughter 2years
No
Total 54,020
* His second eldest son works from 8~11am, and again from 3~6pm.

Appendix F - 67
8.5.2 Facilities & Equipment
(1) Paddock
He uses a lorho (local name), a simple paddock surrounded by thorny bushes, that needs to be
rebuilt every year. To build it, it requires 2 people for 2 days. To gather the materials it takes 2 person days.
This is a total cost of 1,200Rp. Depreciation is 1,200Rp/year.
(2) Tools
The following were purchased, shears (1), sickle (2), and some rope.
Agricultural Production Equipment: 2 oxen-ploughs and a planter.
(3) Scale of Farm Management
Table 62. Sheep inventory. Table 63. Goat inventory.
0 0 0 0 6 1 5 6 6 6
8 7 6 6 0 7 1 0 0 0
0 0 0 0 0 0 0 0 0 0
2
0
0 0 0 0 3 0 3 4 4 4
0
0
0 0 0 0 3 0 1 2 2 2
0 0 0 0 0 0 0 0 0 0
10 9 8 8 14 11 13 14 14 14
2
Jan FebNov Dec
0
0
0
0
2
0
0
0
3
0
0
Nov Dec
10. Castrated male above 1 year
TOTAL:
0
0
0
3
6. Female suckler: (0 to weaning)
7. Male young stock:
(7 month until mating)
8. Male young stock:
(weaning to 6 month)
9. Male suckler: (0 to weaning)
2. Dry
3. Buck above 1 year
4. Female young stock:
(7 month until parturition)
5. Female young stock:
(weaning to 12 month)
(weaning to 6 month)
9. Male suckler: (0 to weaning)
10. Castrated male above 1 years
TOTAL:
Animal Category
1. Milking
5. Female young stock:
(weaning to 6 month)
6. Female suckler: (0 to weaning)
7. Male young stock:
(7 month until mating)
8. Male young stock:
Animal Category
1. Milking
2. Dry
3. Ram above 1 year
4. Female young stock:
(7 month until parturition)
0
0
0
2
0
0
0
Mar Jan Feb Mar
2
0
0
0
2 2
0
0
0
2
0
0
0
(4) Analysis of farm management
Enough basic data on this farmer has not been collected so a detailed analysis will not be carried
out.
8.5.3 Productivity
(1) Goats
(i) Growth of Adult Female Goats
The biggest reach 40kg, after which they maintain this weight (see Figure 21). This probably means
they are late maturing, becoming adults at 3.5 years old. The young female adults grow slowly putting on
weight during winter in this severe climate. Looking at the overall average, you can see for some reason the
weights of the animals decrease in December (see Figure 22).
0
5
10
15
20
25
30
35
40
45
Nov Dec Jan Feb Mar
a 7 year
b 4 year
c 4 year
d 4 year
e 4 year
f 5 year
Nov Dec Jan Feb Mar
Weight 31.7 30.7 32.6 33.0 33.8
29.0 29.5 30.0
30.5 31.0 31.5
32.0 32.5 33.0 33.5 34.0
34.5
Kg
Weight
Figure 21. Individual weight of goats. Figure 22. Average weight of goats.

Appendix F - 68
(ii) Growth of Kids
The weight at birth of female goats averages 2.9kg. For males it averages 3.5kg. The overall
average is 3.1kg. The average daily gain for the 120 days from November was 55g.
0
2
4
6
8
10
12
Birth 1 2 3 4
a
b
c
d
e
f
Birth 1 2 3 4
Weight 3.1 3.9 6.1 8.9 9.7
0.0
2.0
4.0
6.0
8.0
10.0
12.0
Kg
Weight
Figure 23. Individual weight of kids Figure 24. Average weight of kids.
Daily gain increases from birth and peaks at 95g/day at 3 months of age, there after decreasing (see
Figure 25).
1 2 3 4
DG 26 73 95 26
0
10
20
30
40
50
60
70
80
90
100
Gra
m
DG
Figure 25. Daily weight gain.
(2) Sheep
(i) Growth of Ewe s
The biggest sheep reach 40kg (see Figure 26). The smallest was 33kg, which they maintain. It was
confirmed they range in age from 8 to 9 years old.
0
5
10
15
20
25
30
35
40
45
Nov Dec Jan Feb Mar
a 5 year
b 2 year
c 9 year
d 8 year
Nov Dec Jan Feb Mar
Weight 30.1 31.9 37.5 37.4 37.4
0.0
5.0
10.0
15.0
20.0
25.0
30.0
35.0
40.0
Kg
Weight
Figure 26. Individual weight of sheep. Figure 27. Average weight of sheep.
(ii) Growth of Lambs
The average weight of lambs at birth is 3.0±0.32kg (see Figure 28). The average daily gain at 2
months old is 83g/day (see Figure 29).
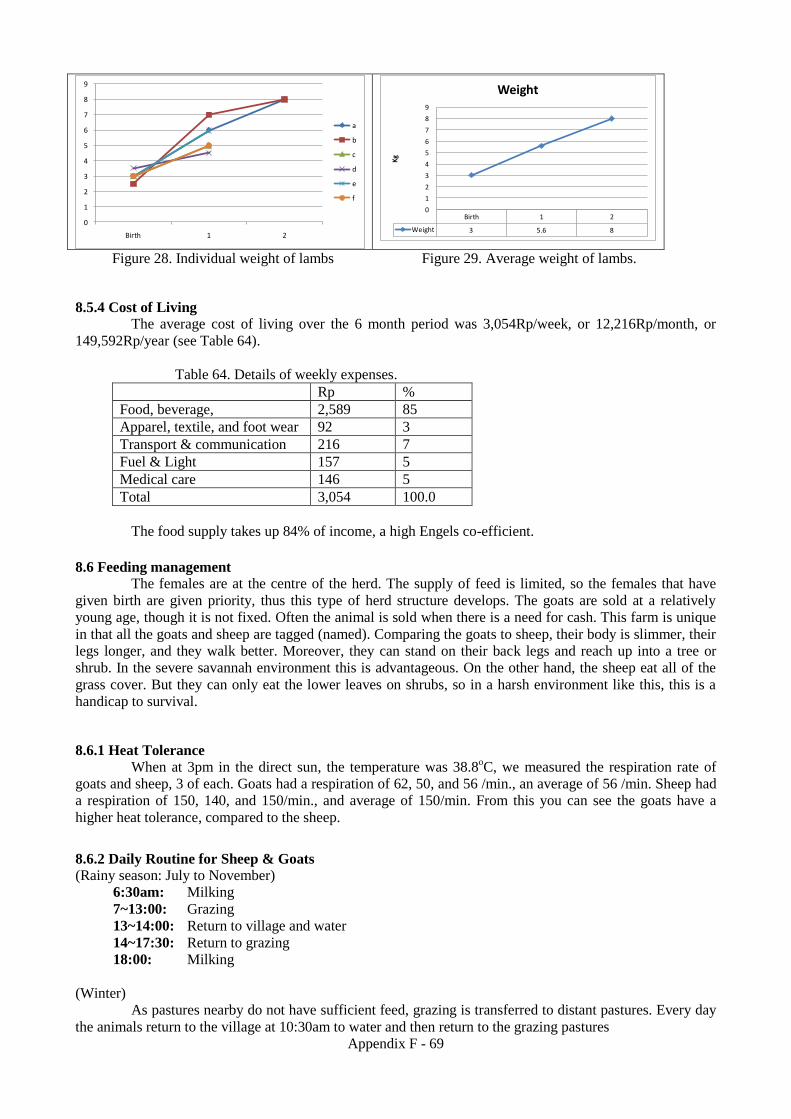
Appendix F - 69
0
1
2
3
4
5
6
7
8
9
Birth 1 2
a
b
c
d
e
f
Birth 1 2
Weight 3 5.6 8
0
1
2
3
4
5
6
7
8
9
Kg
Weight
Figure 28. Individual weight of lambs Figure 29. Average weight of lambs.
8.5.4 Cost of Living
The average cost of living over the 6 month period was 3,054Rp/week, or 12,216Rp/month, or
149,592Rp/year (see Table 64).
Table 64. Details of weekly expenses.
Rp %
Food, beverage, 2,589 85
Apparel, textile, and foot wear 92 3
Transport & communication 216 7
Fuel & Light 157 5
Medical care 146 5
Total 3,054 100.0
The food supply takes up 84% of income, a high Engels co-efficient.
8.6 Feeding management
The females are at the centre of the herd. The supply of feed is limited, so the females that have
given birth are given priority, thus this type of herd structure develops. The goats are sold at a relatively
young age, though it is not fixed. Often the animal is sold when there is a need for cash. This farm is unique
in that all the goats and sheep are tagged (named). Comparing the goats to sheep, their body is slimmer, their
legs longer, and they walk better. Moreover, they can stand on their back legs and reach up into a tree or
shrub. In the severe savannah environment this is advantageous. On the other hand, the sheep eat all of the
grass cover. But they can only eat the lower leaves on shrubs, so in a harsh environment like this, this is a
handicap to survival.
8.6.1 Heat Tolerance
When at 3pm in the direct sun, the temperature was 38.8oC, we measured the respiration rate of
goats and sheep, 3 of each. Goats had a respiration of 62, 50, and 56 /min., an average of 56 /min. Sheep had
a respiration of 150, 140, and 150/min., and average of 150/min. From this you can see the goats have a
higher heat tolerance, compared to the sheep.
8.6.2 Daily Routine for Sheep & Goats
(Rainy season: July to November)
6:30am: Milking
7~13:00: Grazing
13~14:00: Return to village and water
14~17:30: Return to grazing
18:00: Milking
(Winter)
As pastures nearby do not have sufficient feed, grazing is transferred to distant pastures. Every day
the animals return to the village at 10:30am to water and then return to the grazing pastures

Appen
dix
F -
70
8.7
Fee
d
(1)
Fee
din
g c
ale
nd
ar
12
34
12
34
12
34
12
34
12
34
12
34
12
34
Gra
zing
Open
are
a
All
day g
razi
ng
Sup
plim
enta
ryC
rop r
esid
ueG
uar,
Moth
leav
es &
pods,
Gua
r se
ed
Fed
din
gT
ree
leav
e &
fru
itsK
andi l
eave
s &
Fru
it, B
er le
aves
GL
,ML
GL
,ML
GL
,ML
GL
,ML
GL
,Ml
GL
GL
GL
GL
KL
GL
,ML
GL
KL
KL
KL
,KF
KL
KL
KL
GS
GS
GS
GS
GS
GL
=G
uar
leave
ML
=M
oth
leave
KL
=K
andi le
ave
GS
=G
uar
seed
KF
=K
andi fr
uit
4
anim
als
8 a
nim
als
10 a
nim
als
11 a
nim
als
(Feed r
ate
:L
eave &
Fru
it =
0.5
kg/a
nim
al/day
Seed =
0.1
kg/a
nim
al/day)
511
12
12
34
Fig
ure
30
F
eedin
g C
alen
dar
duri
ng D
ry S
easo
n

Appendix F - 71
Open grazing areas (range land) are feed resources for livestock. Small ruminants and camels are
grazed throughout the year in range land. In general, milking animals are fed supplements, if grazing land
conditions worsen. Sometime weak animal also are fed supplements. Farmer feed haulms and seed of legume
crops to animals as protein supplements during the dry season (see Table 65, Figure 30). Tree leaves and
fruits also are one of the most important protein supplements. Kandi leaves contain around 15% protein and
the pods also provide a good fodder (see Table 66).
Table 65 Nutritive Value of Supplemental feeds
Supplements DM (%) TDN (%) DCP (%)
Cluster bean Hay 60.6 15.5
Seed 92.4 70.3 22.2
Moth bean Haulm 52.3 6.4
Table 66 Useful trees to animal feed during the dry season in Mithi, Tharparkar
Vernacular
name
Botanical name Leave Fruit Remark
Kandi Prosopis cineraria ◎ ◎ Cut & Carry
Khumbhat Acacia senegal ○, ▲ ◎ Grazing
Ber Ziziphas nummularia ◎ ◎ Grazing
Khabar Salvadora oleoides ▲ ○, △ Grazing
Devi Prosopis juliflora ○ Grazing
◎All animal、○Goat、△Sheep、 ▲Camel
8.8 Reproduction
The farmer does not own a stud male goat or ram for mating. He borrows a neighbour’s animal for
free for this purpose.
8.9 Animal Health
During this survey, 2 of the kids had diarrhoea and tympana, 1 lamb had diarrhoea and died. During
the winter many have colds and coughs.
8.10 Breeds
8.10.1 Goats
Of the eleven adult female goats, 1 was a cross Kamori breed, 1 Tharri cross, and 6 Bujri cross. The
average age of adult female goats was relatively young at 4.3 years old. The average weight was 31.7kg,
with a maximum of 40kg and a minimum of 23kg. Average body height was 63.7cm, with a maximum of
72.7 and a minimum of 63.7cm. Average body length was 60.7cm, with a maximum of 65.6cm and a
minimum of 51cm. Average chest girth was 67.6, with a maximum of 73.5cm and a minimum of 54cm.
8.10.2 Sheep
Of the 10 sheep, 7 were ewes. All the sheep were a special Kachhi breed. The average age of the
ewes was 5.3 years old, with a maximum of 9 years old. The average weight was 31.3kg, with a maximum of
36kg and a minimum of 24.5kg. The average body height was 65cm, with a maximum of 69cm and a
minimum of 61cm. The average body length was 59.3cm, with a maximum of 66.6cm and a minimum of
54cm. The average chest girth was 72.8cm, with a maximum of 77cm and a minimum of 69cm.
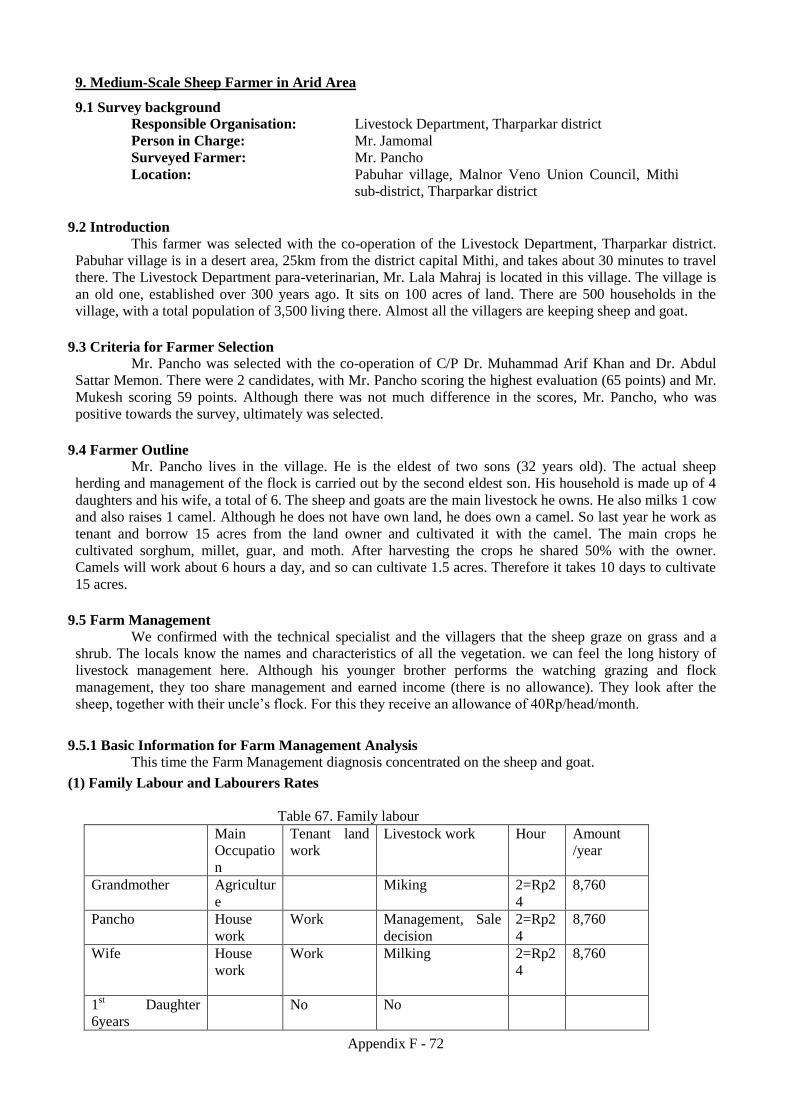
Appendix F - 72
9. Medium-Scale Sheep Farmer in Arid Area
9.1 Survey background
Responsible Organisation: Livestock Department, Tharparkar district
Person in Charge: Mr. Jamomal
Surveyed Farmer: Mr. Pancho
Location: Pabuhar village, Malnor Veno Union Council, Mithi
sub-district, Tharparkar district
9.2 Introduction
This farmer was selected with the co-operation of the Livestock Department, Tharparkar district.
Pabuhar village is in a desert area, 25km from the district capital Mithi, and takes about 30 minutes to travel
there. The Livestock Department para-veterinarian, Mr. Lala Mahraj is located in this village. The village is
an old one, established over 300 years ago. It sits on 100 acres of land. There are 500 households in the
village, with a total population of 3,500 living there. Almost all the villagers are keeping sheep and goat.
9.3 Criteria for Farmer Selection
Mr. Pancho was selected with the co-operation of C/P Dr. Muhammad Arif Khan and Dr. Abdul
Sattar Memon. There were 2 candidates, with Mr. Pancho scoring the highest evaluation (65 points) and Mr.
Mukesh scoring 59 points. Although there was not much difference in the scores, Mr. Pancho, who was
positive towards the survey, ultimately was selected.
9.4 Farmer Outline
Mr. Pancho lives in the village. He is the eldest of two sons (32 years old). The actual sheep
herding and management of the flock is carried out by the second eldest son. His household is made up of 4
daughters and his wife, a total of 6. The sheep and goats are the main livestock he owns. He also milks 1 cow
and also raises 1 camel. Although he does not have own land, he does own a camel. So last year he work as
tenant and borrow 15 acres from the land owner and cultivated it with the camel. The main crops he
cultivated sorghum, millet, guar, and moth. After harvesting the crops he shared 50% with the owner.
Camels will work about 6 hours a day, and so can cultivate 1.5 acres. Therefore it takes 10 days to cultivate
15 acres.
9.5 Farm Management
We confirmed with the technical specialist and the villagers that the sheep graze on grass and a
shrub. The locals know the names and characteristics of all the vegetation. we can feel the long history of
livestock management here. Although his younger brother performs the watching grazing and flock
management, they too share management and earned income (there is no allowance). They look after the
sheep, together with their uncle’s flock. For this they receive an allowance of 40Rp/head/month.
9.5.1 Basic Information for Farm Management Analysis
This time the Farm Management diagnosis concentrated on the sheep and goat.
(1) Family Labour and Labourers Rates
Table 67. Family labour
Main
Occupatio
n
Tenant land
work
Livestock work Hour Amount
/year
Grandmother Agricultur
e
Miking 2=Rp2
4
8,760
Pancho House
work
Work Management, Sale
decision
2=Rp2
4
8,760
Wife House
work
Work Milking 2=Rp2
4
8,760
1st Daughter
6years
No No

Appendix F - 73
2nd
Daughter
4years
No No
3rd
Daughter 3years
No No
4th Daughter
9month
No No
Brother 25years Livestock No Grazing control &
general
management
8=100 36,500
Total 62,780
His younger brother works from 8~12:00am and again from 2~sunset. In the dry season the grazing
pasture is 2km away. The flock walks slowly, grazing on grass as they go. It takes about 1 hour to reach the
pasture area.
(2) Livestock Facilities
(i) Paddock
He uses a lorho (local name), a simple paddock surrounded by thorny bushes that needs to be
repaired every year and replaced every 5 years. It takes 3 people 2 days to build it. The materials for it take 2
people/ day to collect. It costs 800Rp and Depreciation is on 300Rp
(ii) Watering Place
There are three water places established around the well. Although we thought these were all
communal watering facilities, 1 of them is actually owned by Mr. Pancho. He built it 7 years ago for
5,000Rp. It has a life span of 10 years.
(iii) Equipment
No special equipment used.
9.5.2 Diagnosis of farm management
(1) Summary of Operation Results (2010)
Table 68. Abstract of the results of farm management
Last year This year101,93043,180
144,020161,020223,800
36
62,7801,744
Production Cost 69Production Cost 6,854
0.617.5
??
40?
Beginning year 0End of year 0
Balance of liabilities Rp
Total income family (Rp)Income / Femal Adult (Rp)
ArticulCurrent year total production cost Production CostSales gross profitNet profit yearNet income year
Liabilities
Technical Level
Dairy situation
Average of milk price RpAverage of interval parturition Months
Income labor family
Feeding size
Average Fat % Average Fat non solid
The total production milk (Ton)Production milk Kg / Female Adult
Number of Femal Adult (head)The total land area of fodder (Acre)
Production cost Rp/milk 1KgProduction cost Rp/milk 100Kg

Appendix F - 74
(2) Scale of Operations
Table 69. Sheep inventory Table 70. Goat inventory
5 5 14 14 11 11 8 16 21 21 14 16
12 12 3 3 8 8 12 4 0 0 12 10
2 2 2 2 1 1 1 1 1 1 1 1
2
0
2 2 5 5 5 5 0 3 3 3 4 4
0
0
2 1 7 6 6 6 0 5 10 10 10 12
0 0 0 0 0 0 0 0 0 0 0 0
25 24 33 32 33 33 27 35 40 40 41 43
Nov Dec Feb Mar Apr MayNov Dec Feb Mar Apr May
0
0
0
0
0
0
2
0
0
0
0
0
5
0
0
0
0
0
2
0
0
0
2
0
0
0
5
0
0
0
2
0
0
0
6
0
10. Castrated male above 1 year
TOTAL:
2
0
0
0
6
0
0
0
6. Female suckler: (0 to weaning)
7. Male young stock:
(7 month until mating)
8. Male young stock:
(weaning to 6 month)
9. Male suckler: (0 to weaning)
2. Dry
3. Buck above 1 year
4. Female young stock:
(7 month until parturition)
5. Female young stock:
(weaning to 12 month)
(weaning to 6 month)
9. Male suckler: (0 to weaning)
10. Castrated male above 1 years
TOTAL:
Animal Category
1. Milking
5. Female young stock:
(weaning to 6 month)
6. Female suckler: (0 to weaning)
7. Male young stock:
(7 month until mating)
8. Male young stock:
Animal Category
1. Milking
2. Dry
3. Ram above 1 year
4. Female young stock:
(7 month until parturition)
He owns all of the livestock, and he does not lend out any livestock to anyone else.
(i) Livestock Looked after for Someone Else
During the busy farm season in the wet season (from July to October) he looks after and grazes on
average 25 sheep (adults). The fee for looking after these sheep is 40Rp/head/month.
(ii) Other Livestock Owned
He also owns 1 adult female cow (thari breed) for milking, 1 heifer, and 1 camel (Dhatti breed).

Appendix F - 75
(3) Seasonal Production Costs
Table 71. Cost of production.
3.Cost of production, Profit and loss MediamGoat Milking number 0 Heads
(1)Current year production cost (Unit:Rp & %) *Total number Goat & Sheep: 36 Heads
Annual produc. Milk: 630 0 630 Kg
Self-consumptionSaling Total
Articul Amount (Rs.) Amount per cow Rs.) % of
distribution
Maiting cost 0 0 00 0 00 0 00 0 0
Employment 0 0 xFamily (A) 62,780 1,744 xTotal 62,780 1,744 62
0 0 00 0 00 0 0
Building, construct 1,100 31 xMachine, vehicle 500 14 x
Domestic animal 36,550 1,015 x
Total 38,150 1,060 37
0 0 0500 14 0500 14 0
0 0 0101,930 2,831 100
Purchase concentrate:Kg
40,900 1,136
41,650 1,157
58,000 1,6110 00 0
43,180 1,199
Production Cost /Femal adult 1 ,199Production Cost / 1 Liter milk 69Production Cost / 100 Liter milk 6,854
③Amount of female adult transferred within the year
⑥Sale young & fattening animals
Fuel
Depreciation
Repar costTool of Livestock & Agriculture
②Value of animals beginning of the year
④Value of animals end of the year
Purchase Livestock animal (from outside)Purchase Feed
Material for production Feed (Seed, Fertilizer etc.)
Labor
Medical treatment & medicine
Production cost①+②-③-④-⑤-⑥
Cost of consumption, Communication, TransportCost of rental
①Current year production cost total
⑤Sale of kids
Electricity & Water
(4) Calculation of Profits/ Loss
See Table 72 for details.

Appendix F - 76
Table 72. Profit and loss calculations.
Amount (Rs.) Amount per cow Rs.)
Sale of milk 0 0Milk consumed at home 25,200 700Sale of kids 0 0Sale young & fattening animals 162,000 4,500Other 0 0Total (B) 187,200 5,200①Value of animals beginning of the year 40,900 1,136②Current year total production cost 101,930 2,831③Amount of cow transferred within the year 41,650 1,157④Value of animals end of the year 58,000 1,611Total cost of Sales(C) ①+②-③-④ (C) 43,180 1,199
144,020 4,001Sales cost 0 0Insurance fee 0 0Office cost 0 0Labor cost 0 0⑥Total 0 0
144,020 4,001Interest receivable 0 0Subsidy and compensation 0 0Other 17,000 472⑦Total 17,000 472Interets payable 0 0Rents payable 0 0Other 0 0⑧Total 0 0
161,020 4,473223,800 6,217
Net prof it year (D) ⑤-⑥+⑦-⑧
Net income year (A) +(D)
Non-operatingcost
Articul
Revenue fromlivestock
⑤Sales gross prof it (B) - (C)
Non-operatingincome
Selling, generaland
administrativeexpenses
Operating prof it (Business prof it) ⑤-⑥=(E)
Cost of sales
9.5.3 Productivity
There was an opportunity to observe grazing from January to May. During this dry season it is just
a battle to survival in this parched environment until the wet season comes. They seek any kind of greener,
whether grass or shrub. The shrubs in particular have dense canopies of green leaves. More than likely, these
shrubs have deep reaching root systems to effectively extract subterranean water. For this reason the adult
sheep and lambs are able to grow.
(1) Goats
(i) Growth of Adult Female Goats
The cross bred Kamori goats are the biggest, weighing about 40kg when fully grown (see Figure
31). It is presumed because they are late maturing they continue to grow until 3.5 years old. The young adult
animals continue to put on weight slowly.
0
5
10
15
20
25
30
35
40
45
Nov Dec Jan Feb March Apri May
kamori cross
Thari cross
Thari cross
Bujri cross
kamori cross
Nov Dec Jan Feb March Apri May
Weight 31.6 32.8 33.9 33.8 34.0 35.0 36.0
29.0
30.0
31.0
32.0
33.0
34.0
35.0
36.0
37.0
Kg
Weight
Figure 31. Individual weight of goats Figure 32. Average weight of goats
(ii) Growth of Kids (young goats)
The average weight at birth of female goats (4) was 3.38kg (see Figure 33). For males (10) the
weight was 2.95kg. The overall average weight was 3.07 ± 0.37kg. For the 240 days from November, the

Appendix F - 77
average daily gain was 50g/day (see Figure 30).
0
2
4
6
8
10
12
14
16
18
Birth 1 2 3 4 5 6 7
a
b
c
d
e
f
g
h
i
j
k
l
m
n
Birth 1 2 3 4 5 6 7
Weight 3.0 3.6 6.3 8.7 10.2 12.4 13.7 15.0
0.0
2.0
4.0
6.0
8.0
10.0
12.0
14.0
16.0
Kg
Weight
Figure 32. Individual weight of kids. Figure 33. Average weight of kids.
Weight gain peaks at 2 months old (90g/day) and then slowly decreases to 75g at 5 months, and
45g/day there after.
1 2 3 4 5 6 7
DG 20 90 81 50 75 42 44
0
10
20
30
40
50
60
70
80
90
100
Gra
m
DG
Figure34. Daily gain of kids.
(2) Sheep
(i) Growth of Ewes
The largest ewes are 40kg, with slow ones weighing 33kg (see Figure 35). The overall weight gain
continues steadily until the animals reach earlier adulthood (3.5 years old).
0
5
10
15
20
25
30
35
40
45
Nov Dec Jan Feb Mar
a 4Y
b 3Y
c 3Y
d 3Y
e 3.5Y
Nov Dec Jan Feb Mar
Weight 29.9 32.2 32.8 34.2 34.9
27
28
29
30
31
32
33
34
35
36
Kg
Weight
Figure 35. Individual weight of ewes. Figure 36. Average weight of ewes.
(ii) Growth of Lambs
The average weight at birth for females (6) is 3.28 ±0.72kg, for males (10) 2.85 ± 0.25kg, for an
overall average of 3.06.
For the 240 days from November, the average daily gain was 105g/day.

Appendix F - 78
Birth 1 2 3 4 5 6 7
Weight 2.9 4.0 7.2 9.0 11.0 13.9 17.5 25.0
0.0
5.0
10.0
15.0
20.0
25.0
30.0 K
g
Weight
1 2 3 4 5 6 7
DG 40 110 60 70 100 120
0
20
40
60
80
100
120
140
Gra
m
DG
Figure 37. Individual weight of lambs Figure 38. Average weight of lambs.
9.5.4 Cost of Living
During the 6 months of data collection, the cost of living was 3,537Rp/week, or 14,148Rp/month,
or 169,776Rp/year (see Table 74). Net income from livestock was 223,800Rp, enough to cover the cost of
living, but not with a great deal of room to spare, especially since there is no children's education or other
expenses to cover. The cost of food supplies is 84% of expenditures, a high Engels co-efficient.
Table 74. Details of weekly expenditures.
Rp %
Food, beverage, 2,979 84
Apparel, textile, and foot wear 212 6
Transport & communication 98 3
Fuel & Light 184 5
Medical care 64
Total 3,537 100.0
9.6 Feeding management
On the first day of the survey, each individual animal was confirmed, ear tagged, body weight,
body measurements were taken in the middle of the paddock. All livestock are owned by Mr. Pancho. The
total number of livestock is 27 goats, 24 sheep for a total of 51 animals (all owned by Mr. Pancho). There
was 1 male goat, and 2 rams. When selling an animal males have priority. In this way females remain in the
flock to produce the current make-up. There is no custom of naming animals, but they know well the
individual characteristics of every animal.They also raised a cow for milking, as well as a heifer and a camel.
9.6.1 Livestock Facilities
(1) Paddock
He uses a lorho (local name), that is built near the watering place.
Watering Facilities: There are 3 watering places built near the well, with paddocks made from
thorny bushes nearby. I thought all these were communal facilities, but in fact Mr. Pancho owns one of them.
(2) Daily Routine for Sheep and Goats
(Wet season: from July to October)
7:00am: Milking
8:00: Grazing
15:00: Return to village for watering
16:00: Grazing
19:00: Return to village for watering
(Winter)
In the winter, the feed in the pastures near the village is not sufficient, so the animals must travel to
more distant pastures. Every day they return to the village at 1:00pm to water and then return to the pasture
areas.

Appen
dix
F -
79
9.7
Fee
d
(1)
Fee
din
g c
ale
nd
ar
12
34
12
34
12
34
12
34
12
34
12
34
12
34
Gra
zing
Open
are
a
Day g
razi
ng
All
day g
razi
ng
Dri
nkin
g w
ate
r at
vill
age (
12:0
0~
14:0
0)
Sup
plim
enta
ryC
rop r
esid
ueG
uar,
Moth
leav
es &
podsM
illet
stover
(Catt
le)
Fed
din
gT
ree
leav
e &
fru
itsK
andi l
eave
s &
Fru
it, B
er le
aves
GL
,ML
GL
,ML
GL
,ML
GL
,ML
GL
,ML
GL
,ML
GL
,ML
GL
,ML
KL
,KF
KL
,KF
KL
,KF
KL
,KF
KL
,KF
GS
GS
GS
GS
GS
GS
GL
=G
uar
leave
ML
=M
oth
leave
KL
=K
andi le
ave
16 a
nim
als
20 a
nim
als
24 a
nim
als
GS
=G
uar
seed
KF
=K
andi fr
uit
(Feed r
ate
:L
eave &
Fru
it =
0.5
kg/a
nim
al/day,
Seed =
0.1
kg/a
nim
al/day)
511
12
12
34
Fig
ure
39 F
eedin
g C
alen
dar
duri
ng D
ry S
easo
n

Appendix F - 80
9.8 Reproduction
During the wet season there is a short period were feed of high nutrition is more readily available.
During this period the sheep and goats recover with sufficient nutrients and in the latter part of the wet
season many of the female goats come into heat. For this reason every year from late November to March is
the birthing season.
9.9 Animal Health
9.10 Breeds
9.10.1 Goats
Make up of the flock: 20 animals are adult females, 1 male adult, and 6 young female goats.
(1) Breeds
All of the animals are crossbred of the Kamori, Bujri, and Harri breeds. The most prevalent is the
Thari breed. The animals are relatively young, with an average age of 4.1 years old. The average weight is
31.7kg, with a maximum of 37kg and a minimum of 27kg. The average body height is 72.9cm, with a
maximum of 79.9cm and a minimum of 69.1cm. The average chest girth is 71.8cm, with a maximum of
79cm and a minimum of 67cm. Milking Efficiency Of the 20 animals 8 are being milked (40%).
9.10.2 Sheep
The make up of the flock, 16 adults, 2 rams, 2 young sheep (1 male and 1 female), and 4 suckling
lambs (2 male and 2 female).
Breeds They are all a special Kacchi breed. The average age is 3.3 years old, with a maximum of a 4 year
old. The average body weight is 29.9kg, with a maximum of 35kg and a minimum of 29.9kg. The average
body height is 63.3cm, with a maximum of 65.5cm and a minimum of 61cm. The average body length is
50.5cm, with a maximum of 66.8cm and a minimum of 50.5cm. The average chest girth is 76.2cm, with a
maximum of 78cm and a minimum of 72cm.
Table 75. Body measurements of goat and sheep. Esti.
Goat Age Height Length Girth Weightn=6 Year Front cm cm Kg
Average 4.1 72.9 71.8 31.7Max. 6.0 79.9 79.0 37.0Min. 3.0 69.1 67.0 27.0
Esti.
Sheep Age Height Length Girth Weightn=5 Year Front cm cm Kg
Average 3.3 63.26 50.5 76.2 29.9Max. 4.0 65.5 66.8 78.0 35.0Min. 3.0 61.9 50.5 72.0 25.0
Measurement
Measurement

Appendix F - 81
Annex of feed Composition
Table of Feed Composition
Category Feed DM (%) CP CF E.E NFE Ash Ca P DCP TDN Ref.
Green Jowar Fresh 23.3 8.2 22.6 1.5 61.9 5.8 4.1 54.4 2
Fodder Maize Fresh 21.9 10 31.5 1.4 48.4 8.7 5.5 60.9 2
Bajra Fresh 15 13.7 27.5 1.7 42.2 14.9 7.1 59.5 2
Rice(vegetative) 7 25.9 1.8 47.3 18 2
Rice(regrowth) 32.8 9 28.3 1.8 45 15.9 5.2 55.7 2
Lucerne Fresh 22.7 22.9 26 3.5 36.1 11.5 2.56 0.31 18.1 62.0 2
Berseem Fresh 11.5 21.4 23.2 3.4 33.8 18.3 2.25 0.3 16.9 66.0 2
Crop Wheat Dry 92 3.1 45.4 1.1 40.2 10.2 0.02 36.2 2
residues Rice Dry 93.8 2.4 36.5 0.9 43.8 16.5 0.24 41.7 2
Maize Dry 84.1 5.9 38.5 1.8 44 9.8 2.1 56.7 2
Sorghum Dry 93.7 3.7 41.8 1.1 44 9.4 1.2 55.3 2
Millet Dry 94.5 3.8 37.3 1.5 51.5 5.9 0.5 45.3 2
Barley Dry 91.7 25 44.6 1.4 33.9 17.6 6.5 47.3 2
Sugercane top Fresh 29 5.9 33.5 1.7 50.3 8.5 2.9 49.2 4
Sugercane trush 0.6 37.3 4
Cotton leave Fresh 40.0 22.3 10 ー 47.9 19.8 1.93 0.48 15.2 53.7 1
Chick pea Dry 90.6 6 44.4 0.5 35.8 13.3 0.34 0.12 2.4 37.0 2
Lentir DM
Field pea Dry 88.4 8.4 42.5 1.4 39.6 8.1 4.1 48.1 2
Mung Dry 8.9 28.1 2.8 47.1 13.1 6.5 54.9 2
Rabi pulses Dry
Kharif pulses Dry 8.9 28.6 2.8 47.1 12.6 6.5 55.1 2
Groundnut Dry 9.9 21.1 2.4 57.3 9.3 6.3 68.7 2
Guar Dry 10.6 23.9 1.5 53.4 10.6 6.5 67.3 2
Sunflower Dry 21.2 19.4 9.3 3.3 49.4 18.6 14.4 57.5 2
By-products Wheat Bran 90.2 15.2 10.1 5.6 64.4 4.7 0.12 0.72 12.6 73.3 1
Rice Polish 91.20 12.2 13.3 10.6 53 10.9 0.32 0.96 10.6 80.2 1
Cotton Seed cake 88.8 27.4 18.9 8 39.3 6.4 0.21 0.84 19.7 78.5 1
Sunflower Seed cake 87.5 36.4 12 12.3 29.3 10 0.57 1.37 27.3 71.1 1
Groundnut Meal 90 33.5 25.5 10.1 24.6 16.3 31.5 75.4 2
Sesame Meal 91 42 7 8.7 30.1 12.2 2.67 0.94 38.2 63.9 1
Cluster bean Meal 91.5 45.3 8 6.2 34.1 6.4 0.4 0.67 43.3 75.8 1
Linseed Cake 91 43.1 10.8 11.7 28 6.4 0.57 1.03 37.3 83.9 1
Rape & Mustard Seed cake 91.5 39 10.2 3.4 36.1 11.3 0.81 1.16 32.8 65.6 1
Mung Churi with Hull 90.6 20.5 10.8 2.9 48.3 17.5 11.7 56.3 3
Chick pea Churi with Hull 90.3 11.7 23.9 2.8 50.2 11.4 7.7 72.0 3
Other bean Churi with Hull 88.8 19.65 14.8 1 60.4 7.8 9.6 69.6 2
Wheat Middling 88.9 11.8 0.6 1.7 85.4 0.5 8.7 81.6 2
Maize Bran
Non-conven Bagasse 51.2 1.8 48.7 ー 47.2 2.3 1.11 0.02 0.0 33.7 1
tional feeds Molasses 78 2.6 73.0 1
Wasted dates
Fruit juice
Bone meal 89.5 22.8 2.2 2.2 7.8 65 20.75 9.16 1
Blaad meal 89.3 77.5 1.5 3.2 8.3 9.5 0.7 0.34 1
Fish meal 92.2 55.6 1.1 9.7 0.3 33.3 7.28 1.96 1
Banana leave &
stemFresh 20.5 11 29.6 3 25.8 30.6 1.41 0.26 1
Source:
1 Composition of Various Indigenous Feeding Stuffs of Sindh Province, Pkistan, Sindh Agriculture University, Tandojam, 1982
2 Animal Feed Resource Information System, FAO, http://www.fao.org.ag/aga/AGAP/FRG/afris/index_en.htm
3 Data analyzed at Department of Food and Nutrition, University of Veterinary and Animal Sciences, Lahore December 2010
4 Standard Tables of Feed Composition in Japan, Japan Livestock Industry Association
As % of dry matter
Nutirients ValueCemical composition

Appendix F - 82
III. Cross-Sectional Analysis of Dairy Farm Management
1. Background
This diagnosis of dairy farm management is based on a periodic survey of 5 different categories of
farm.
No. 1 farm is a small-sized farm operated by a landless farmer in Hyderabad District.
No. 2 is a small-sized farm operated by a land-owning farmer in Mirpurkhas District.
No. 3 is a medium-sized farm operated by a landless farmer in Mirpurkhas District.
No. 4 is a medium-sized farm operated by land-owning farmer in Tando Allhayar District.
No. 5 is a large-sized farm, operated by a landless farmer in a cattle colony near Hyderabad City.
The farm management diagnosis is based on weekly and monthly data collected over 6 months
from December 2010 to May 2011. This data was then used to estimate annual production costs, and profits
and losses for the year 2010 (see Table 1). However for the No. 5 farmer at the cattle colony, there is a large
turnover (purchases and sales) of livestock that has a big influence on monthly balance of payments.
Extrapolating this data to annual estimates is problematic, so the farm management diagnosis is performed
on the half year period for which there is actual data.
For the purposes of comparative farm analysis, the data for the small-sized land-owning farmer (No.
2) is incomplete, and hence is not included in this analysis. This analysis is restricted to the four remaining
farms.
2. Results
In terms of farm scale and location, the No. 5 farm located near Hyderabad City stands out as a
large commercial dairy enterprise employing 27 people, and milking an average of 323 head of cattle per
month. The other three farms are located in more rural areas and practice more traditional forms of cattle
raising and dairy production. As a consequence total milk production for the farms was 1,780; 1,862 ; 1,500;
and 367,830 litres respectively for farms No. 1, 3, 4, and 5. Milk production for the No. 5 farm was on a
totally different scale (see Table 76).
Table 76. Comparison of Farm Management Results
Category of FarmNo.1.Small ScaleDairy Landless
No.3.Medium ScaleFdairy Landless
No.4.Medium ScaleDairy Owns land
No.5.Large ScaleDairy Landless
District name Hyderabad Mirpurkhas Tando Allahayar HyderabadVillage name Mithio Hajano Haji Allah Bux Maree Bachai Khaskheli Old Cattle Colony
3 4 3 3230 0 5 00 5 0 00 0.25 0.50 0
New calf 0 0 0 ?Young animal 1 1 2 ?Fattenining animal 0 0 0 ?
174,075 81,480 57,035 17,718,348163,615 44,454 25,271 15,193,838
92 24 17 4154,538 11,114 8,424 47,03985,050 48,816 43,254 4,173,32228,350 12,204 14,418 12,920
46 57 54Income livestock Rs. 26,733 13,888 19,167 59,279Sale cost price Rs. 57,538 13,364 15,090 47,102% of Purchase feed 33 4 2 ?% of Depreciation 12 36 27 ?
1,780 1,882 1,500 367,830593 466 500 1,13840 25 25 52
Articul
a. Scale
b. ProductionCost
c. Income
d. Profit &loss
Per one cow
Current year production cost totalProduction cost Rs.Production cost/1 liter milk Rs.Production cost/Cow Rs.Net income year Rs.Net income year/ Cow Rs.% of Income
f. ProductionTechniquelevel
Cow number (head)Own land (Acres)Tenant land (Acres)Production Fodder (Acres)
Sale animal (Head)
Total milk production LiterProduction milk / Total cows LiterAverage of milk sale price Rs.
The estimated production costs in the year 2010 (excluding No. 5 farm) were 170,075; 81,480; and
57,035 Rs for farms No. 1, 3, and 4 respectively. Production costs for No. 1 farm were roughly twice those
for No. 2 farm, and three times those for No. 4 farm. The reason for this is that the landless No. 1 farmer has
to buy in feed (wheat bran and cotton seed cake) throughout the year, while only getting poor milk yields
from the water buffalo. It can be seen that this results in high production costs.
Production costs per litre were 92; 24; 17; and 41 Rs respectively. The production costs for No. 1

Appendix F - 83
farm were extremely high compared to the other farms. It is interesting to note that, even though the farmer
in the cattle colony (No. 5 farm) had to purchase all his feed and pay a salary to all his employees, his
production cost of 41 Rs/litre was still less than the 92 Rs the farmer on the No. 1 farm was paying. When
milk production efficiency per head of cattle was calculated, the results were 593, 466, 500 and 1,138
litres/head of cattle respectively (see Figure 40). The production efficiency on farm No. 5 is roughly twice
that of the other farms. Thus, it can be inferred that it costs 41Rs per litre to achieve this production
efficiency.
Production costs per head of cattle were calculated to be 54,538; 11,114; 8,424; and 47,039 Rs
respectively. For No. 3 and 4 farms that do not purchase much feed, costs are about 10,000 Rs/ head of cattle,
roughly a fifth of the 54,538 Rs that for No. 1 farm. This cost for No. 1 farm is even higher than that paid on
No. 5 farm.
Figure 40. Comparison of production costs per head of cattle and per litre of milk.
The percentage of purchased feed to total production costs was 33%, 4% and 2% respectively.
Family labour costs were a relatively high 46%, 57%, and 54% respectively. This indicates how much
traditional dairy farming in rural Pakistan depends on raising the cattle on natural feed, such as pasture
grasses and crop harvest residues, thereby minimizing feed costs.
When comparing milk production costs and /litre with average sales price/litre, the production costs
were 92 for 40, 24 for 25, 17 for 25, and 41 for 52 Rs respectively. Except the No.1 farm, the other three
farms getting profit.
Figure 41. Comparison of milk production costs/litre and sales price/litre for each farm.

Appendix F - 84
The price of milk varies significantly depending on region. In the future it will be important to
reduce this gap. A price of 52 Rs for milk from the cattle colony, located Hyderabad city is 12 Rs higher than
the 40 Rs received for milk from Mithio Hajano village, located 20 kilometers from Hyderabad city. For
milk produced in the districts of Tando Allhayar, one hour drive away, and Mirpurkhas, a two hour drive
away, there is a large drop in price to 25 Rs.
3. Discussion
3.1 Small-Sized Farms
1) Husbandry on Small-Sized Dairy Farms (<5 head of cattle, including calves)
For dairy farmers operating with this small number of animals, it is difficult to operate the farm on
a sound economic basis. There is a need to increase the number of animals being raised.
For example, if there are two animals being milked throughout the year, then a stable volume of
milk can be sold. In Sindh province the conception rate of buffalo is estimated to be less than 50%.
With this low rate of reproduction, if there are 4 adult females being kept, this will ensure 2 are
available for milking at any one time. With this calculation in mind, it is estimated that the small-sized
farmer needs to increase his herd size to the level of a medium-sized farmer of 6 to 10 animals.
2) Approach of Small-Sized, Land-Owning, Livestock Farmers
A dairy farmer of this size cannot live off farm earnings alone, he needs to supplement his income
with outside work.
3.2 Small to Medium-Sized Dairy Farms
1) Small to Medium-Sized Dairy Farms Raising Livestock on Naturally Available Feed (Natural
feeding)
This traditional, low cost, approach maximizes the use of local conditions and natural resources for
raising livestock. In this approach family labour costs account for around 50-60% of total costs.
2) Small to Medium-Sized Farms with Land Rented from the Local Landlord
For example, a very profitable approach in Tando Allhayar and Mirpurkhas districts is to grow cash
crops on the rented land, and sharing 50% the harvested crop with the landlord as a form of rental
payment. It is also possible to grow some fodder on part of the rented land. Landlords in Mirpurkhas
District provide seeds for sowing, and fertilizer on an informal loan basis.
3.3 Medium-Sized Farms
1) A High Potential to Improve Production Efficiency on these Farms (whether the farmer owns land
or not).
By improving production efficiency there is a high potential to put dairy farming on a sound
economic footing.
2) Even Medium-Sized, Landless Farmers Can Run an Economically Sound Dairy Farm.
For example, in the cattle colony of Jat, in Badin District, if current milk yields from buffalo are
ensured, this is more than enough to cover feed purchases. With good nutritional management and
husbandry, farm management can be put on a sound economic basis. Even with 100% purchase of
feed and the resultant increases in milk yields, it is possible to constrain production costs and put dairy
farm management on sound economic basis, similar to above.
3.4 Large-Sized Dairy Farms
1) Opportunities to Improve Productivity on Large-Sized, Landless Dairy Farms
Under current management regimes, it was confirmed that there are large differences in individual
animal milk productivity, ranging from 2.7 to 17 litres /day/animal. Given this large difference in
individual productivity, it is possible to improve productivity by increasing the number of animals
with high production capacity. Moreover, production capacity can be improved by dividing the herd
into low and high production groups, and feeding the groups appropriately, according to their
production capacity. However, there is the problem in the tightly confined cattle colonies that many of
the dry animals are sold off, and new livestock with widely varying production capacity are brought in
on a regular basis.

Appendix G
Institutions
(Research and Development Institute of Buffalo)

Appen
dix
G -
1
Ap
pen
dix
G
DIS
TR
ICT
WIS
E L
IST
OF
VE
TE
RIN
AR
Y I
NS
TIT
UT
ION
S W
OR
KIN
G I
N S
IND
H P
RO
VIN
CE
AL
ON
G W
ITH
PO
SIT
ION
OF
ST
AF
F S
AN
CT
ION
ED
/ W
OR
KIN
G I
N T
HE
SE
IN
ST
ITU
TIO
NS
Sr.
#
Dis
tric
t
No.
of
Vet
.
Hosp
itals
/
Dis
pen
sari
es
No.
of
Vet
. M
ob
ile
Un
its
No.
of
Un
ion
Cou
nci
l V
et.
Cen
ters
Tota
l
A l
l o
c a
t i
o n
o
f
S t
a f
f
Tec
hn
ical
Para
Tec
hn
ical
Oth
er
Tota
l
San
ctio
ned
W
ork
ing
S
an
ctio
ned
W
ork
ing
S
an
ctio
ned
W
ork
ing
S
an
ctio
ned
W
ork
ing
1.
Nau
shah
ro F
ero
ze
10
01
42
53
14
10
77
60
44
31
13
5
10
1
2.
San
gh
ar
12
03
28
43
15
11
43
37
49
38
10
7
86
3.
Kar
ach
i 0
6
01
08
15
33
32
19
19
30
27
82
78
4.
Lar
kan
a
08
01
16
25
18
12
48
46
40
36
10
6
94
5.
Su
kku
r 0
7
0
16
23
10
05
25
25
66
66
10
1
96
6.
Gh
otk
i 0
4
01
13
18
09
05
20
20
32
30
61
55
7.
Mir
purk
has
1
0
01
50
61
20
19
24
24
28
27
72
70
8.
Jam
sho
ro
01
01
18
20
10
07
20
14
27
21
57
42
9.
Kh
airp
ur
22
03
75
10
0
18
17
85
83
75
75
17
8
17
5
10
. U
mer
ko
t 0
2
0
11
0
11
2
15
15
22
18
16
16
53
49
11
. T
and
o A
llah
yar
0
3
0
07
10
07
07
14
08
14
11
35
26
12
. S
hik
arp
ur
08
01
22
31
13
13
26
21
47
47
86
81
13
. Ja
cob
abad
0
5
01
20
26
04
03
17
17
26
26
47
46
14
. M
oh
tarm
a B
enaz
ir
Bh
utt
o S
hah
eed
(N
awab
shah
) 1
0
0
44
54
16
12
38
38
32
26
86
76
15
. T
and
o M
uh
amm
ad
Kh
an
04
01
11
16
05
05
09
09
21
21
35
35
16
. T
hat
ta
12
01
19
32
13
10
15
15
54
54
82
79
17
. B
adin
0
7
01
23
31
15
14
23
20
45
45
83
79
18
. T
har
par
kar
0
8
02
15
1
16
1
17
09
12
8
82
10
6
62
25
1
15
3
19
. H
yd
erab
ad
04
01
13
18
28
23
26
21
39
39
93
83
20
. K
ash
mo
re
06
0
08
14
06
03
12
11
11
11
29
25
21
. M
atia
ri
07
0
23
30
12
12
23
23
20
20
55
55
22
. Q
amb
ar /
Sh
ahd
adko
t 0
8
0
21
29
12
06
13
13
18
18
43
37
23
. D
adu
08
03
48
59
18
15
61
61
54
54
13
3
13
0
TO
TA
L S
IND
H P
RO
VIN
CE
1
72
23
78
6
98
1
32
8
26
5
78
8
68
5
89
4
80
1
20
10
17
51
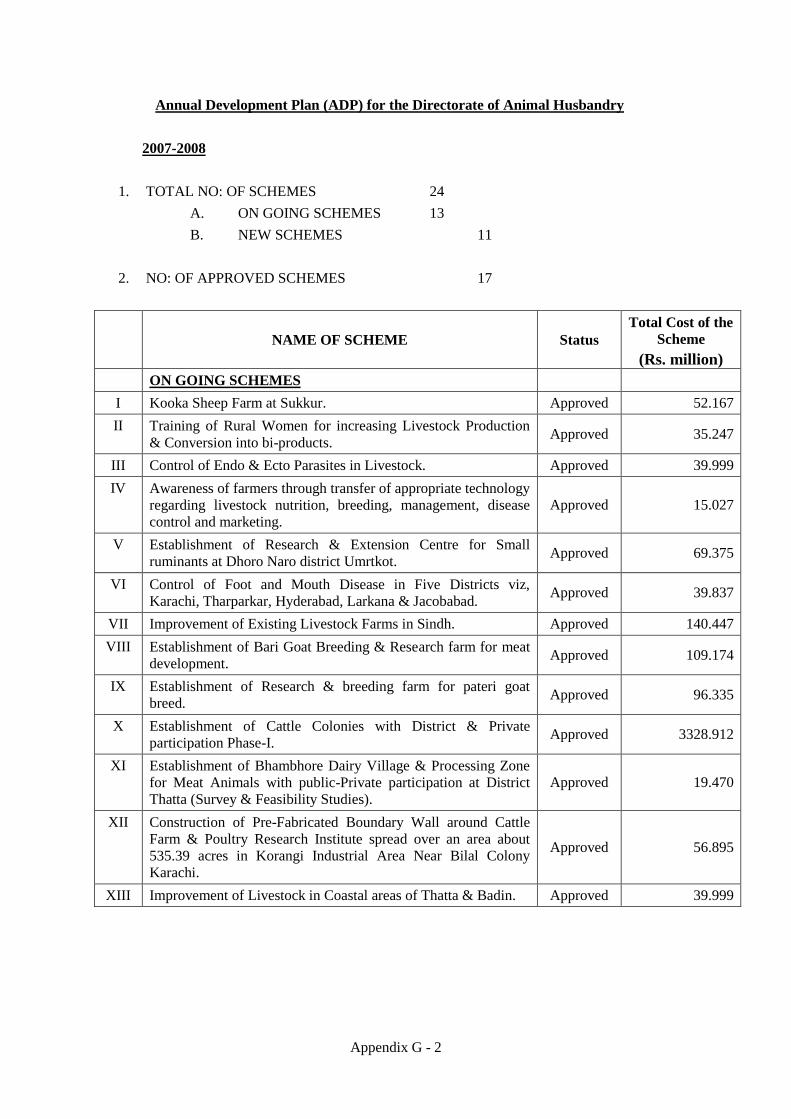
Appendix G - 2
Annual Development Plan (ADP) for the Directorate of Animal Husbandry
2007-2008
1. TOTAL NO: OF SCHEMES 24
A. ON GOING SCHEMES 13
B. NEW SCHEMES 11
2. NO: OF APPROVED SCHEMES 17
NAME OF SCHEME Status
Total Cost of the
Scheme
(Rs. million)
ON GOING SCHEMES
I Kooka Sheep Farm at Sukkur. Approved 52.167
II Training of Rural Women for increasing Livestock Production
& Conversion into bi-products. Approved 35.247
III Control of Endo & Ecto Parasites in Livestock. Approved 39.999
IV Awareness of farmers through transfer of appropriate technology
regarding livestock nutrition, breeding, management, disease
control and marketing.
Approved 15.027
V Establishment of Research & Extension Centre for Small
ruminants at Dhoro Naro district Umrtkot. Approved 69.375
VI Control of Foot and Mouth Disease in Five Districts viz,
Karachi, Tharparkar, Hyderabad, Larkana & Jacobabad. Approved 39.837
VII Improvement of Existing Livestock Farms in Sindh. Approved 140.447
VIII Establishment of Bari Goat Breeding & Research farm for meat
development. Approved 109.174
IX Establishment of Research & breeding farm for pateri goat
breed. Approved 96.335
X Establishment of Cattle Colonies with District & Private
participation Phase-I. Approved 3328.912
XI Establishment of Bhambhore Dairy Village & Processing Zone
for Meat Animals with public-Private participation at District
Thatta (Survey & Feasibility Studies).
Approved 19.470
XII Construction of Pre-Fabricated Boundary Wall around Cattle
Farm & Poultry Research Institute spread over an area about
535.39 acres in Korangi Industrial Area Near Bilal Colony
Karachi.
Approved 56.895
XIII Improvement of Livestock in Coastal areas of Thatta & Badin. Approved 39.999

Appendix G - 3
NAME OF SCHEME Status
Total Cost of the
Scheme
(Rs. million)
NEW SCHEMES
I Strengthening of Research & Training Institute for Livestock
Dev. at Tando Muhammad Khan.
Approved
in principal 39.244
II Establishment of Salvage Farms. Approved 44.387
III Establishment of Bhambhore Dairy Village & Processing Zone
for Meat Animals with Public-Private Participation at Dist:
Thatta.
Un-
Approved 350.000
IV Capacity Building of Officers / Officials of Livestock wing
through Training / Post Graduate Diploma & Short Courses. Approved 48.520
V Camel Breeding & Research Farm for Dhatti Camel. Un-
Approved 50.000
VI Establishment of Directorate of Information & Publicity for
Livestock Development.
Un-
Approved 15.000
VII Establishment of Feed Mill & Construction of Two Veterinary
Dispensaries and Six Veterinary Centers at District Karachi,
Umerko & Khairpur.
Approved
in principal 35.624
VIII Establishment of Community Livestock Farm at Model Village
Ahmedabad District Thatta. Approved 18.383
IX Provision of Chilling Tanks. Approved 99.800
X Establishment of Model Community Farms. Un-
Approved 600.000
XI Goat Demonstration Farm in the Coastal area of Thatta. Approved
in principal 76.310
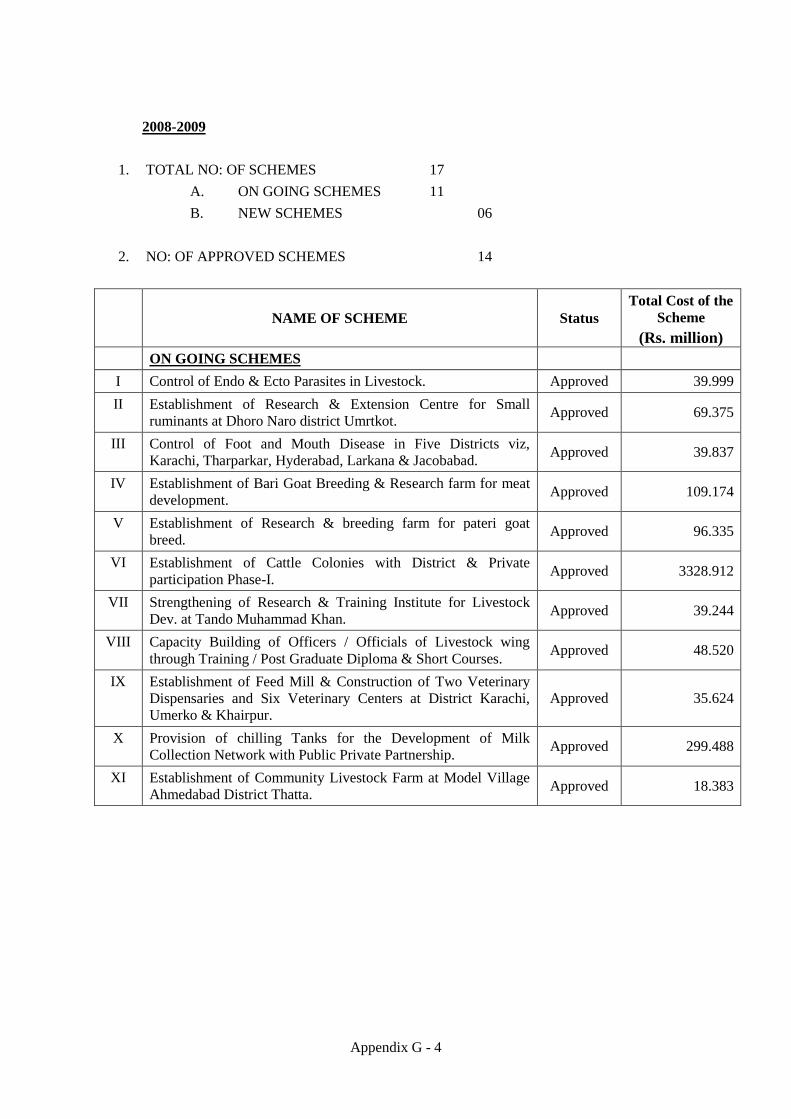
Appendix G - 4
2008-2009
1. TOTAL NO: OF SCHEMES 17
A. ON GOING SCHEMES 11
B. NEW SCHEMES 06
2. NO: OF APPROVED SCHEMES 14
NAME OF SCHEME Status
Total Cost of the
Scheme
(Rs. million)
ON GOING SCHEMES
I Control of Endo & Ecto Parasites in Livestock. Approved 39.999
II Establishment of Research & Extension Centre for Small
ruminants at Dhoro Naro district Umrtkot. Approved 69.375
III Control of Foot and Mouth Disease in Five Districts viz,
Karachi, Tharparkar, Hyderabad, Larkana & Jacobabad. Approved 39.837
IV Establishment of Bari Goat Breeding & Research farm for meat
development. Approved 109.174
V Establishment of Research & breeding farm for pateri goat
breed. Approved 96.335
VI Establishment of Cattle Colonies with District & Private
participation Phase-I. Approved 3328.912
VII Strengthening of Research & Training Institute for Livestock
Dev. at Tando Muhammad Khan. Approved 39.244
VIII Capacity Building of Officers / Officials of Livestock wing
through Training / Post Graduate Diploma & Short Courses. Approved 48.520
IX Establishment of Feed Mill & Construction of Two Veterinary
Dispensaries and Six Veterinary Centers at District Karachi,
Umerko & Khairpur.
Approved 35.624
X Provision of chilling Tanks for the Development of Milk
Collection Network with Public Private Partnership. Approved 299.488
XI Establishment of Community Livestock Farm at Model Village
Ahmedabad District Thatta. Approved 18.383

Appendix G - 5
NAME OF SCHEME Status
Total Cost of the
Scheme
(Rs. million)
NEW SCHEMES
I Establishment of Goat breeding farm at Hala. Un-
Approved -
II Improvement of Hostel facilities for farmers and in-service
training institute for livestock Development Tando Muhammad
Khan.
Approved 39.807
III Construction of Taluka Veterinary Dispensaries in Sindh Phase-
I. Approved 353.743
IV Construction and up-gradation of Veterinary Centers to
Veterinary Dispensaries. Approved 165.789
V Public Private partnership for Developing Livestock and Dairy
farming in Sindh.
Un-
Approved 500.000
VI Establishment of Bhambhore Dairy Village & Processing Zone
for Meat Animals with Public-Private Participation at Dist:
Thatta
Un-
Approved 350.000
2009-2010
1. TOTAL NO: OF SCHEMES 02
A. ON GOING SCHEMES 02
B. NEW SCHEMES 00
2. NO: OF APPROVED SCHEMES 02
NAME OF SCHEME Status
Total Cost of the
Scheme
(Rs. million)
ON GOING SCHEMES
I Construction of Taluka Veterinary Dispensaries in Sindh Phase-
I. Approved 353.743
II Construction and up-gradation of Veterinary Centers to
Veterinary Dispensaries. Approved 165.789

Appendix G - 6
Buffalo Breed Improvements
In Sindh province milk production is predominantly from buffaloes (only about 10% of the milk is
obtained from cattle). Moreover, most consumers prefer to drink buffalo milk compared to cattle milk.
Given this situation, in any future development of the dairy industry buffaloes will play a major role. An
important key to this buffalo production though will be improvements to productivity. With this in mind, in
October 2010 we visited the Buffalo Research Institute in Pattoki district, Punjab province, and the
Development & Research Kundhi Buffalo Farm in Sukkur district, Sindh province. There we observed and
collected information related to the activities of these institutes, as well as conducted interviews with key
staff members.
I. Buffalo Research Institute (BRI); Pattoki, Punjab province
1. Introduction
This institute is involved in the research development of Nili-Ravi buffalo ( a milk type buffalo).
Their main activities center on a progeny testing program, a form of sib testing that selects proven (tested)
bulls to sire offspring with improved productivity. To achieve this the institute maintains a staff of 512 (58
technical staff) and a large budget to perform these activities. Although their level of endeavor and
motivation are laudable, low conception rates for artificial insemination and the low level of extension
reaching farmers, begs the question about the effectiveness of the progeny testing program.
Efficient artificial insemination is a vital technical link in the successful establishment of a progeny
testing program. It is through artificial insemination that candidate bull buffalo and their offspring are
produced. And then through selection of proven bulls with desired genetic characteristics frozen semen is
collected. This semen is then used to artificially inseminate buffalo being raised by farmers to produce a
new generation of buffalo with improve productivity.Although the amount of semen being collected this
way and the number of calves produced by artificial insemination using this semen have not been
confirmed by the institute, it is thought to be minimal. If the number of calves produced via artificial
insemination was divided by the total amount invested in BRI, the cost per offspring would surely be
extremely high.
2. History
The Breeding Cattle Center was established in 1977, and Buffalo Research Institute (BRI)
functioning since October, 2005, is exclusively mandated for research based development of buffalo.
3. Location
BRI is located at a central place of the famous Nili and Ravi breeds of buffalo. It is 72 km from
Lahore on Lahore-Multan Road, is located between latitude 27 to 34 and longitude 68 to 75. It is spanned
over an area 1079 acres. Its Southern side is occupied by Ravi campus of UVAS, Lahore.
4. Mission
To increase income of farmers by raising unit productivity of buffaloes through research based
applications in area of its reproduction and production resulting into poverty alleviation and thereby socio-
economic development.

Appendix G - 7
5. Objectives
1) Genetic development in buffalo through production of maximum number of proven bull and their wide
scale use in breeding.
2) Development and application of the latest reproductive technologies for enhancing reproductive
efficiency in buffalo and produce genetics material as per international standards.
3) Improving reproductive and productive traits in buffalo.
4) Nutritional interventions for balanced feed, TMR and such other non-conventional aspects.
5) Training of farmers in buffalo management dairying and meat production.
6. Strategy
Increase in unit productivity by bringing about genetic development through maximum use of
proven bulls.
Focused areas:
1) Progeny testing Program
2) Production of Balanced Feed and introduction of new feed intervention.
3) Mechanization is Agriculture and Dairy Operations.
4) Embryo Transfer
5) Training of farmers in buffalo dairying and meat production and promotion of buffalo.
7. Divisions
1) Administrative & Management, 2) Breeding & Genetics, 3) Animal Reproduction, 4) Animal Nutrition,
5) Farm & Health, 6) Economics & Technology Transfer
8. Laboratories
1) Computer and Molecular Genetics (field PTP)
2) Male Reproduction (semen deep freezing, Andrology)
3) Embryo Trasfer (E.T)
4) Feed Analisis
5) Rumen Microbiology
9. Production and Reproduction
Bulls (draft animal) :3 heads
Buffaloes cows:279 heads
Male Young Stock:13 heads
Female Young Stock:149 heads
Male Suckle:97 heads
Female Suckle:107 heads
CRC ‘Buffalo Calve raising for semen collection :12 heads
Total 660 heads
*Result of Reproduction
Buffaloes Cows Pregnant:90 heads (32% of pregnant in 279 heads)
Female Young Stock Pregnant:30 heads (20% of pregnant in 149 heads)
Calving due in current month :20 heads

Appendix G - 8
* Supply of Breeding Stock Bulls
Private Breeder for selling : 29 heads
Annually 400 bulls are breed, of these 100 (25%) are supplied to the artificial insemination centers for
semen collection, 150 (38%) bulls are distributed to farmers for natural mating, and the remaining 150
animals are weeded out of the program.
10. Buffalo Breeds
There is relatively small variation in body stature amongst buffaloes. The form of the horn is
different, with or without white spot markings in various patterns on the body. I confirmed that the Nili-
Ravi buffalo is a cross between Nili and Ravi breeds, and the Nili-Ravi has not been completely fixed
pure breed. The characteristics of the Nili and Ravi buffalo were explained to me as follows:
Breed Lactation
period
Number of
parturition
Milk
production
Weight Repro-
duction
Appearance
Nili Aveg. 300
days
Many
Max.12
times
2000~
3000Kgs
Medium
450Kgs
Same One white spot:
Point of tail
Ravi Avg.
200days
8~9 times Many
Max.4000Kgs
Large
550Kgs
Same Five white spots:
The position that
be decided
12.Feeding Management ( 24hr calender)
① Milking the Herd
03:00am: Herd of milking buffalo are brought in from the paddock and tethered at a stall
04:00~07:00am: Morning Milking
At milking, feed concentrate, equivalent to half the milk production (18%
crude protein), is supplied to the buffalos
07:00~10:00am: Grazing
10:00am: Tethered at the stall again and feed (green roughage, or wheat straw: 1% dry
matter). The amount supplied is roughly 10% of body weight.
16:00~19:00pm: Afternoon Milking
At milking, feed concentrate, equivalent to half the milk production (18%
crude protein).
19:30pm: Return to Paddock
➁ Dry milking Buffalo
The amount of concentrate fed to these animals is 2kg/ day/ head.
13. Artificial Insemination
Frozen semen is produced at four artificial insemination centers in Punjab province.
* The Main Process of Semen Production:
Semen Collection: once a week, diluted with egg yolk and citric acid, sperm count: 40 million
sperm/ straw, straw size: 0.5ml, antibiotics used: penicillin and streptomycin.

Appendix G - 9
* Artificial Insemination in field:
Due to poor conception rates, insemination is conducted twice on the day when the animal is in
heat (morning and afternoon, or afternoon and morning; using two straws). With this regime a 55%
conception rate is achieved.
14.Embryo Transfer
As results have not been very good, and running costs are high, embryo transfer activities are
currently suspended.
15.Nutrition Research
Although the laboratory had expensive analytical equipment installed, this was not being used,
since the necessary reagents and apparatus were not kept in stock.
16.Progeny Test
Progeny testings is be conducted at three Buffalo Centers (Bhunikey-Pattoki farm in Kasur
district; Chak Katora farm in Bahawalpur district; Haroonabad farm in Bahawalpur district) in
conjunction with 10 other districts in Punjab province. There are 15,000 dames (adult female) buffalo
registered for this testing. There are 68 candidate testing bulls, with tested daughter buffalo: on average
11.6 heads per testing bull, a maximum of 40 head, and a minimum of 4 head. Milk productivity for
these tested daughter is on average 2613kg, with a maximum of 3118kg, and a minimum of 2016g. This
is very interesting data.
Evaluation of capacity genetic for proven buffalo bulls using the BLUP method and it make
necessary environment adjustment such as season of birth, region and parturition number of daughter etc.,
but the details have not been confirmed.
17.Body Characteristics and Other
① Length of Adult Female Buffalo
The weight data of five milking buffalo were collected, and carried out their mesurement body
also Body Condition Score «BCS». Details of the data are appended on the next page.
② Mammary type
There is considerable variation between individuals in the mammary type and teats were long.

Appen
dix
G -
10
N
am
e o
f F
arm
e
B
uff
alo
Rese
arc
h I
nst
itu
te P
att
ok
i
Dis
tric
t: P
anja
bT
alu
ka:K
asu
r
Date
of
Vis
it
Date
of
Resu
lts
Bre
ed
Part
turi
.R
epro
.H
eig
ht
Length
Heart
Dep
thW
idth
Wid
thW
eig
ht
Peri
od
Milk
Milk
Pro
d.
-t
ion
gir
thH
eart
Hip
rum
p1
23
45
Avg
Real
Pro
d.
305
day
1202
Nili
Ravi
515-S
ep-1
0P
reg.
132.4
145.2
214.0
68.2
35.4
665
22
54
44
252
1771
2193
7.2
2184
Nili
Ravi
54-O
ct-
10
Pre
g.
133.2
143.2
209.0
78.5
63.6
35.4
600
1.5
33
45
3.3
240
654
2005
6.6
315
Nili
Ravi
525-J
un-1
0P
reg.
133.0
143.5
213.0
82.2
60.0
37.6
620
1.5
43
25
3.1
223
1903
2636
8.6
Mil
kin
g4
140
Nili
Ravi
413-J
ul-
10
Pre
g.
128.5
146.5
185.0
71.3
62.0
33.0
580
1.5
33
25
2.9
215
1391
2068
6.8
345
Nili
Ravi
415-S
ep-1
0N
o132.2
152.5
213.0
79.2
67.2
43.0
640
14.5
34
53.5
123
1047
1688
5.5
Avr.
131.9
146.2
206.8
77.8
64.2
36.9
621
3.4
224
1608
2205
7.2
Baff
alo
Avera
ge
Measu
rem
ent
Body C
onditio
n S
core
IDN
am
eN
o.
Part
.
21-O
ct
Na
me o
f F
arm
e
B
uff
alo
Rese
arc
h I
nst
itu
te P
att
ok
i
Dis
tric
t:P
anja
bT
alu
ka:K
asu
r
(D
ate
of
Vis
it)
Date
of
Resu
lts
Bre
ed
Part
turi
.R
epro
.P
eri
od
Milk
Milk
Pro
d.
Peri
od
Milk
Milk
Pro
d.
Peri
od
Milk
Milk
Pro
d.
Peri
od
Milk
Milk
Pro
d.
Peri
od
Milk
Milk
Pro
d.
-t
ion
Real
Pro
d.
305
day
Real
Pro
d.
305
day
Real
Pro
d.
305
day
Real
Pro
d.
305
day
Real
Pro
d.
305
day
1202
Nili
Ravi
515-S
ep-1
0P
reg.
223
1628
2227
7.3
313
1804
1758
5.8
221
1881
2596
8.5
252
1771
2193
7.2
2184
Nili
Ravi
54-O
ct-
10
Pre
g.
321
2561
2433
8.0
175
718
1251
4.1
223
1093
1495
4.9
241
2245
2841
9.3
240
1654
2005
6.6
315
Nili
Ravi
525-J
un-1
0P
reg.
303
2443
2459
8.1
200
1762
2687
8.8
166
1503
2762
9.1
223
1903
2636
8.6
Mil
kin
g4
140
Nili
Ravi
413-J
ul-
10
Pre
g.
178
1779
3048
10.0
253
1207
1455
4.8
213
1188
1701
5.6
215
1391
2068
6.8
5345
Nili
Ravi
415-S
ep-1
0N
o134
1000
2276
7.5
234
2140
2789
9.1
123
1047
1688
5.5
Baff
alo
6A
ve.
232
1882
2489
8.2
235
1526
1988
6.5
206
1416
2138
7.0
224
1608
2205
7.2
7
IDN
am
eN
o.
Part
.
4th
Lacta
tion
Avera
ge
21-O
ct-
10
1st
Lacta
tion
2nd L
acta
tion
3er
Lacta
tion

Appendix G - 11
II. Development & Research Kundhi Buffalo Institute in Sukkur, Sindh
1. Introduction
This research center was established in 1975, and has operated for 34 years as the only
buffalo breeding center in Sindh province. The Center engages in the conservation and improvement
of buffalo breeds. The Center is on a huge 820 acre site, in Taluka Rohri, Sukkur. It has a total staff
of 60, including an administrative head, and under him an agricultural engineer, a veterinarian, and 4
assistant engineers on site. The Center is divided into two functional; the Kundhi Buffalo Research
Institute and the Semen Production Unit.
2. Location
The Center is in Rohri (Taluka), Marrhi (Union Council), Sukkur (District).
3. Mission
The center's mission is to conserve and improve the genetic of Kundhi buffalo.
4. Objective
1) Conservation of the Kundhi breed
2) Free distribution of male pedigree calves to farmers at the Union Council level
5. Activities
Activities include maintenance of buffalo with high genetic potential for use in improving the
Kundhi breed, and distribution of male pedigree buffalo calves to farmers for natural maitimg
purposes.
6. Number of Buffalo Kept (as of September 2010)
Category No. of Animals
1 Bulls for natural mating 5
2 Adult female buffalo 75
3 Heifer 90
4 Young Male 62
5 Male suckling calf 23
6 Female suckling calf 15
7 Castrated male buffalo 2
Total 272
7. Milking
As of October 2010 there were a total of 70 adult female buffalo, milk was collected from 35
of these buffalo, and the other 35 were dry. That milking is being performed on 50% of the adult
females is a good ratio.
Milking occurs twice a day, once at between 4:30~5:30 am and then again at between
4:30~5:30 pm. The ideal interval of 12 hours between milking was met. Oxytocin was not being used
to stimulate milk production. Suckling calves were used to naturally stimulate milk production. When
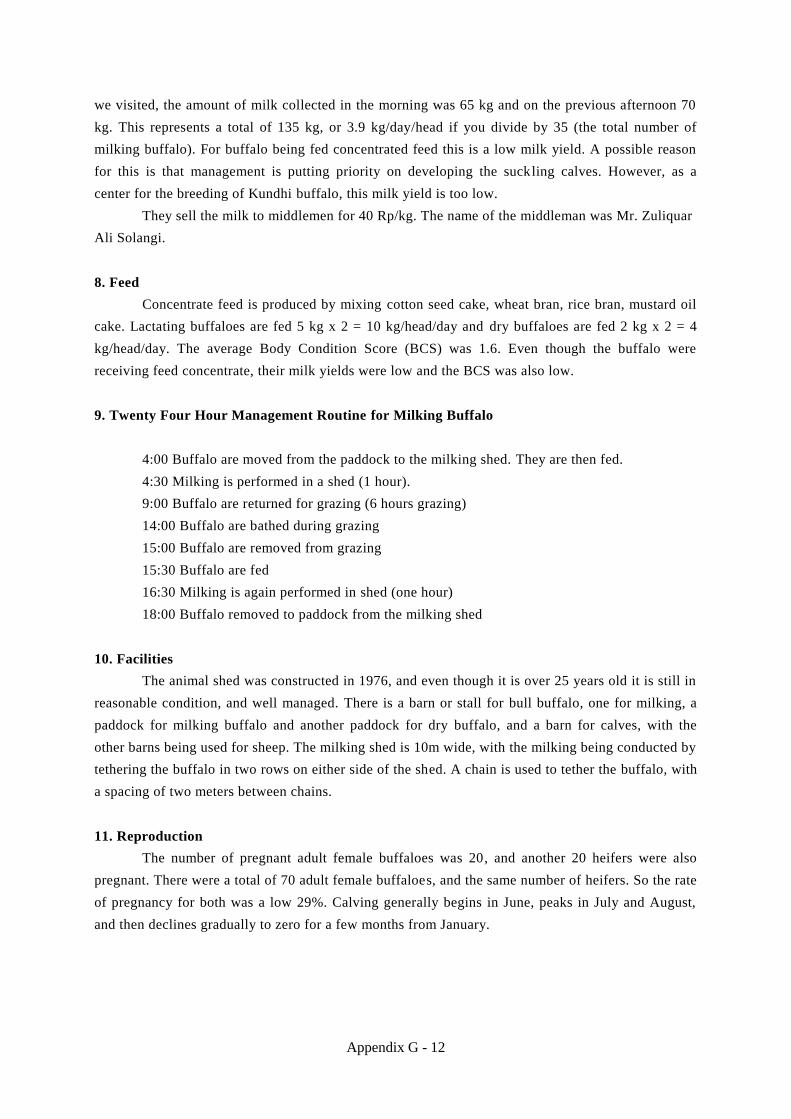
Appendix G - 12
we visited, the amount of milk collected in the morning was 65 kg and on the previous afternoon 70
kg. This represents a total of 135 kg, or 3.9 kg/day/head if you divide by 35 (the total number of
milking buffalo). For buffalo being fed concentrated feed this is a low milk yield. A possible reason
for this is that management is putting priority on developing the suckling calves. However, as a
center for the breeding of Kundhi buffalo, this milk yield is too low.
They sell the milk to middlemen for 40 Rp/kg. The name of the middleman was Mr. Zuliquar
Ali Solangi.
8. Feed
Concentrate feed is produced by mixing cotton seed cake, wheat bran, rice bran, mustard oil
cake. Lactating buffaloes are fed 5 kg x 2 = 10 kg/head/day and dry buffaloes are fed 2 kg x 2 = 4
kg/head/day. The average Body Condition Score (BCS) was 1.6. Even though the buffalo were
receiving feed concentrate, their milk yields were low and the BCS was also low.
9. Twenty Four Hour Management Routine for Milking Buffalo
4:00 Buffalo are moved from the paddock to the milking shed. They are then fed.
4:30 Milking is performed in a shed (1 hour).
9:00 Buffalo are returned for grazing (6 hours grazing)
14:00 Buffalo are bathed during grazing
15:00 Buffalo are removed from grazing
15:30 Buffalo are fed
16:30 Milking is again performed in shed (one hour)
18:00 Buffalo removed to paddock from the milking shed
10. Facilities
The animal shed was constructed in 1976, and even though it is over 25 years old it is still in
reasonable condition, and well managed. There is a barn or stall for bull buffalo, one for milking, a
paddock for milking buffalo and another paddock for dry buffalo, and a barn for calves, with the
other barns being used for sheep. The milking shed is 10m wide, with the milking being conducted by
tethering the buffalo in two rows on either side of the shed. A chain is used to tether the buffalo, with
a spacing of two meters between chains.
11. Reproduction
The number of pregnant adult female buffaloes was 20, and another 20 heifers were also
pregnant. There were a total of 70 adult female buffaloes, and the same number of heifers. So the rate
of pregnancy for both was a low 29%. Calving generally begins in June, peaks in July and August,
and then declines gradually to zero for a few months from January.
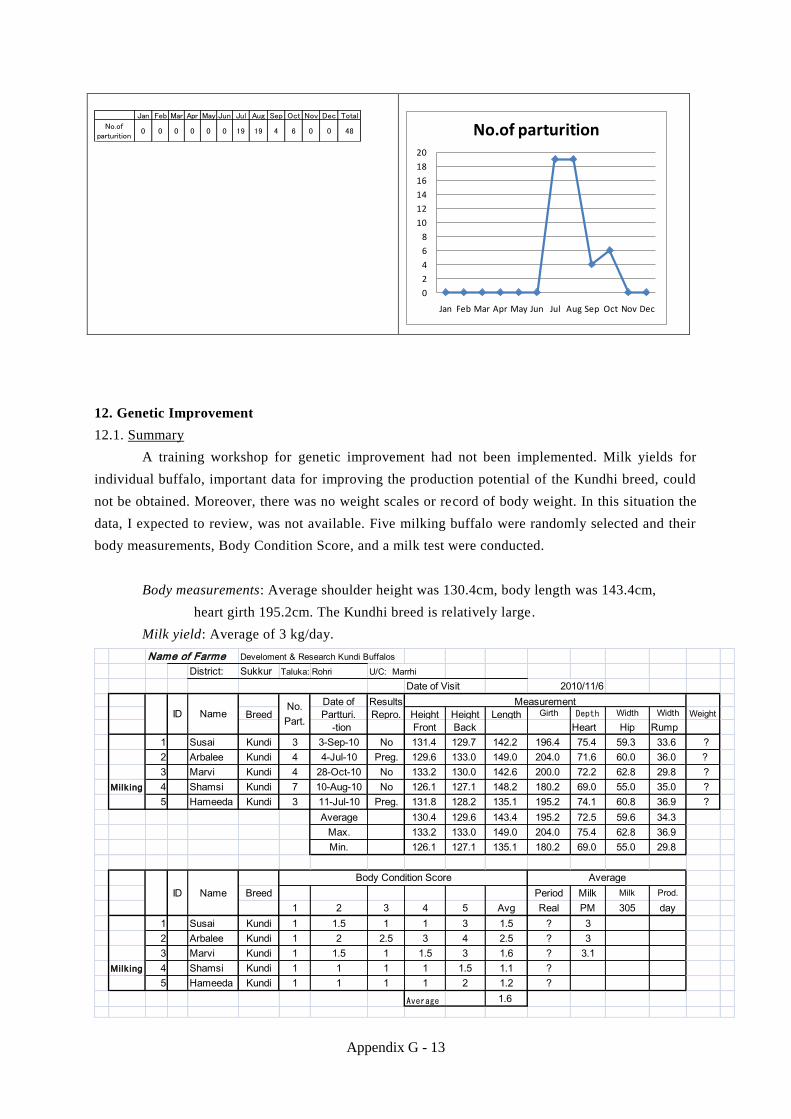
Appendix G - 13
Jan Feb Mar Apr May Jun Jul Aug Sep Oct Nov Dec Total
No.ofparturition
0 0 0 0 0 0 19 19 4 6 0 0 48
0
2
4
6
8
10
12
14
16
18
20
Jan Feb Mar Apr May Jun Jul Aug Sep Oct Nov Dec
No.of parturition
12. Genetic Improvement
12.1. Summary
A training workshop for genetic improvement had not been implemented. Milk yields for
individual buffalo, important data for improving the production potential of the Kundhi breed, could
not be obtained. Moreover, there was no weight scales or record of body weight. In this situation the
data, I expected to review, was not available. Five milking buffalo were randomly selected and their
body measurements, Body Condition Score, and a milk test were conducted.
Body measurements: Average shoulder height was 130.4cm, body length was 143.4cm,
heart girth 195.2cm. The Kundhi breed is relatively large.
Milk yield: Average of 3 kg/day.
Name of Farme Develoment & Research Kundi Buffalos
District: Sukkur Taluka: Rohri U/C: Marrhi
Date of Visit
Date of Results
Breed Partturi. Repro. Height Height Length Girth Depth Width Width Weight
-tion Front Back Heart Hip Rump
1 Susai Kundi 3 3-Sep-10 No 131.4 129.7 142.2 196.4 75.4 59.3 33.6 ?
2 Arbalee Kundi 4 4-Jul-10 Preg. 129.6 133.0 149.0 204.0 71.6 60.0 36.0 ?
3 Marvi Kundi 4 28-Oct-10 No 133.2 130.0 142.6 200.0 72.2 62.8 29.8 ?
Milk ing 4 Shamsi Kundi 7 10-Aug-10 No 126.1 127.1 148.2 180.2 69.0 55.0 35.0 ?
5 Hameeda Kundi 3 11-Jul-10 Preg. 131.8 128.2 135.1 195.2 74.1 60.8 36.9 ?
Average 130.4 129.6 143.4 195.2 72.5 59.6 34.3
Max. 133.2 133.0 149.0 204.0 75.4 62.8 36.9
Min. 126.1 127.1 135.1 180.2 69.0 55.0 29.8
Breed Period Milk Milk Prod.
1 2 3 4 5 Avg Real PM 305 day
1 Susai Kundi 1 1.5 1 1 3 1.5 ? 3
2 Arbalee Kundi 1 2 2.5 3 4 2.5 ? 3
3 Marvi Kundi 1 1.5 1 1.5 3 1.6 ? 3.1
Milk ing 4 Shamsi Kundi 1 1 1 1 1.5 1.1 ?
5 Hameeda Kundi 1 1 1 1 2 1.2 ?
Average 1.6
No.
Part.
2010/11/6
Body Condition Score Average
ID Name
Measurement
ID Name

Appendix G - 14
12.2 Weight of Calves at Birth
From July until November 48 calves were born, their average weight was 21.7 kg, a max.
weight of 24 kg and a min. weight of 19.8 kg.
No. of Calves Born Mean Max. Min.
July 19 20.2 24 18
August 19 20.5 25 17
eptember 4 22.3 23 21
October 6 23.5 24 23
Average 21.7 24 19.8
12.3 Liner Classification
12.3.1 Summary
It is not known whether the Holstein liner classification is applicable to buffalo, but for
reference purposes 5 randomly selected buffalo were classified using this liner classification system.
The average height at the shoulder was 130.4cm, and at the hip 129.6cm, with a drop in the line from
the front to the back.
Compared to cattle, buffalo have a deep chest and a robust frame.
Heart (chest) girth: 195.2cm
Chest depth: 72.5cm
Hip width: 59.6cm.
Body length: 143.4cm.
This wide chest confirms the consumption capability of buffalo.
The previous month we had visited the Buffalo Research Institute in Pattoki, Punjab province.
At that time we took the body measurements of 5 Nili Ravi milking buffalo. These measurements are
compared to those of the Kundhi buffalo. The body frame of the Kundhi buffalo is no less large than
that of the Nili Ravi. However, the Nili Ravi had an average body weight of 621 kg, and a BCS of 3.4.
Compared to the Kundhi, the Nili Ravi buffalo are slightly more plump (fatter).
12.4 Body Measurements
Date of
Breed Measurment Height Height Length Girth Depth Width Width Weight BCS
Front Back Heart Hip Rump
Nili Ravi 21-Oct-10 131.9 x 146.2 206.8 77.8 64.2 36.9 621 3.4
Kundhi 6-Nov-10 130.42 129.6 143.42 195.16 72.46 59.58 34.26 ? 1.6
Measurement

Appendix G - 15
12.5 Liner Classification
The traits of the hind legs and the hooves were generally good, probably necessary for the
support of a large body. Overall, the udder is poor in structure. It is strongly hoped that future
breeding efforts will improve this trait.
1 2 3 4 5 1 2 3 4 5
Strength 75.4 71.6 72.2 69 74.1
Rump Angle 45 50 30 40 45
Thurl Width 33.6 36 29.8 35 36.9
Rear Leg, Side View 5 5 30 5 5
Rear Legs , Rear View 25 25 30 25 25
Foot Angle 35 35 5 30 10
Fore Udder Attachment 45 1 45 45 45
Rear Udder , Height 10 12 10 12 15
Rear Udder , Width 12 7 14 14 14
Udder Cleft 25 30 40 25 25
Deep Udder 14 14 12 8 13
Teat length 6 10 6 9 12
Measurement (cm) Scoring5 Heads Buffalos(No.1 --5)
12.6 Comparisons of Body Measurements between the Two Breeds
In order to compare the body characteristics of Kundhi and Nili Ravi buffalo, body height
relative to body length, hip width relative to body length, chest girth relative to body length, hip
width relative to rump width were calculated. The results are respectively 1.1 to 1.1, 2.3 to 2.4, 1.41
to 1.36, and 1.74 to 1.74. There was not a great deal of difference between the breeds. Although the
Nili Ravi buffalo has a relative bigger body than the Kundhi buffalo, but their body types are
relatively similar.
Nili Ravi Kundhi
Length/Height 1.1 1.1
Length/ hip width 2.28 2.4
Girth/Length 1.41 1.36
Hip width/Rump
width 1.74 1.74
12.7 Tapes for Measurement of Body Weight
In the future when designing a tape for measuring the body weight of buffalo, there should be
no need to develop a tape separately for the Nili Ravi and Kundhi breeds, or for that matter for cross
breeds, as the scale appears to be the same for both breeds.
12.8 Udder Traits
The volume of the udder is small and poor. Moreover, differences in udder traits between
individuals are large. The udder in diagram No.5 has a relatively good structure, with a fore-
attachment.

Appendix G - 16
13. Number of Male Buffalos
For the 4 years from 2005 to 2008 the number of male calf was 48. Looking at a yearly
breakdown of this, there were 17 in 2005, 8 in 2006, 18 in 2007, and 5 in 2008.
14. Semen Production Unit
14.1 Bulls Buffalo
There were a total of 28 bulls buffalos tethered in a barn/ stall, 23 of these were used for
semen collection, and other 5 bulls were used for natural mating. There was also one dummy buffalo
used for semen collection. These bulls are fed the same amount of feed concentrate as an adult female
buffalo. They are not put out to pasture, but the body is splashed down with water twice a day.
Individuals with overgrown hooves are frequent. Periodic trimming of the hooves is thought to be
necessary. Buffalo are late maturing, not reaching full maturation until 5 years old.
14.2 Frozen Semen Production
Frozen buffalo semen is produced using the same semen processing procedures as those used
with cattle. Semen is collected once a week. As electrical outages are frequent, collection days are
flexible depending on whether there is electricity supply on that day. Once semen is collected, a
motility test is immediately undertaken. The semen is diluted with egg yolk in citric acid, and then
the temperature is lowered in stages in a cooling box, and then dispensed into a straw. The straw is
frozen using a local container into which gas of nitrogen is poured to lower the temperature. Then the
semen is frozen in the liquid nitrogen. The objective is for one straw to contain 50 million sperm.
Normally, the frozen semen is shipped after it has passed a rigorous evaluation for motility.
The semen produced is immersed in liquid nitrogen and stored there. Normally the motility
evaluation is made 24 hours (next day) after it is produced. For every lot of semen (for each
individual semen collection) three straws are randomly selected and then tested. If even one straw has
a motility of semen of less than +++30% (bad semen), the entire lot is discarded. Unfortunately, the
motility test is not enforced at the Semen Production Unit.
14.3 Inspection of Semen Collection and Testing of Motility of Frozen Semen
14.3.1 Semen Collection
Collection of semen from buffalo bull was observed at the Institute. A dummy buffalo was
used for semen collection. Six milliliters of semen fluid was collected. The motility was normal. The
color was however light, and there were few active sperm seen under the microscope. Sperm motility

Appendix G - 17
was evaluated by a technician immediately after the semen was collected. A rating of 80 percent was
given by this technician.
14.3.2 Motility of Semen
Frozen semen collected the week before was thawed, and then sperm motility tested. The
responsible technician evaluated the sperm at 50%, where as I evaluated it at 5%. This latter figure is
at a level that the semen is not worth using. The temperature of the water bath to thaw the sperm was
set at a low temperature of 27oC. The motility test must be carried out every time under the same
correct conditions. At this point, the temperature of the water bath was raised to 38oC, the contents of
one entire straw was placed on a glass slide, evenly mixed, and then two drops were taken for
evaluation. Unfortunately, the result was not that good. With such semen, it is questionable that a
stable pregnancy rate can be obtained.
There are two possible reasons for such poor motility. Either it is a production process related
problem, or a physiological problem with buffalo semen. This will require further research and
improvements.
14.3.3 Labeling of Straws
The straw, in which the collected semen was stored, did not have any labeling on it. There was
a French printer for printing on the straw, but it was not being used to label the straw. Lot recording
is extremely important. The main things that need to be recorded, include breed of bull, name, lot
number, date of production, etc.
14.3.4 Calculation of Sperm Numbers after Semen Collection
There was no equipment to calculate sperm numbers, so 2 milliliters of semen was being
placed in each straw to produce 22 straws. I respect the experience, instinct and efforts of the
technician, but the calculation and placement of the correct number of sperm in each straw is
extremely important.

Appendix H
Report on Livestock Disease Control
(by local consultant)

Appendix H
Report on Livestock Disease Control
MASTERPLAN STUDY ON LIVESTOCK
MEAT AND DAIRY DEVELOPMENT IN
SINDH PROVINCE
FOR KAIHATSU MANAGEMENT CONSULTING INC,
JAPAN
January – February 2011
DR. BAZ MUHAMMAD JUNEJO,
RT. SECRETARY
LIVESTOCK & FISHERIES SINDH
ADDRESS:- B-25, G. C. H. SOCIETY,
QASIMABAD PHASE-I HYDERABAD

TABLE OF CONTENTS
SR NO TOPIC PAGE NO
1 1.1 CONTROL ON ENDO & ECTO PARASITES IN LIVESTOCK 1-7
1.1.1 PROJECT OUTLINE 1
1.1.2 RESULT OF THE PROJECT 5
1.1.3 VIEWS ABOUT CONTROL OF ENDO AND ECTO PARASITIES IN SINDH 6
1.2 PARTICIPATORY DISEASE SURVEILLANCE IN PAKISTAN 8-13
1.2.1 PROJECT OUTLINE 8
1.2.2 RESULT OF THE PROJECT 12
1.2.3 VIEWS / HOW TO APPLY 13
1.3 STRENGTHENING OF LIVESTOCK SERVICES PROJECT 14-23
1.3.1 PROJECT OUTLINE 14
1.3.2 RESULT OF THE PROJECT 20
1.3.3 VIEWS / HOW TO APPLY 23
2 COORDINATION AMONG VARIOUS STAKEHOLDERS IN PARTICIPATORY DISEASE SURVEILLANCE (ESPECIALLY BETWEEN FEDERAL AND PROVINCIAL GOVERNMENT)
24-27
3 CONCLUSION 28-38
3.1 WHAT IS MOST SUITABLE DISEASE CONTROL SYSTEM IN SINDH 28
3.2 WHAT SHOULD BE STRENGTHENED OR NEWLY DEVELOPED TO MAKE THE SYSTEM FUNCTIONAL
33
4 OUTBREAK OF DISEASE 39-48
4.1 QUESTION:-1 REGULATION IN THE COUNTRY 39
4.2 QUESTION:-2 EFFORTS OF LIVESTOCK DEPARTMENT IN CASE OF DISEASE OUTBREAKS
42
4.3 IMPORTANT LIVESTOCK DISEASES
43
SUMMARY & RECOMMENDATIONS 49
LIST OF ABBREVIATIONS 50
REFERENCE 52
LIST OF PERSONS INTERVEIWED 53-54

Appendix H - 1
1.1 CONTROL ON ENDO & ECTO PARASITES IN LIVESTOCK
1.1.1 PROJECT OUTLINE
PROJECT NAME CONTROL OF ENDO AND ECTO PARASITES IN LIVESTOCK
PERIOD 60 months (2003-2004 to 2007-2008) extended one year up to 30.06.2009
IMPLEMENTING ORGANIZATION:
SPONSORING LIVESTOCK AND FISHERIES DEPTT Execution operation and maintenance D.G L/ F and D.A H Sindh.
COOPERATING ORGANIZATION
i. Farmer communities ii. Related NGO’s iii. Drug Dealers iv. Equipment supplier
TARGET AREAS SINDH PROVINCE
TARGET BENEFICIARIES 1. Livestock Farmers 2. Livestock Traders 3. Milk Dealers 4. Wool / Hairs dealers 5. Butchers / Meat Suppliers 6. Skin & hide Dealer
BUDGET COST OF THE PROJECT
39.999 Million
SOURCE Government of Sindh
OVERALL GOAL
1. Purchase of Anthelmintic / Drugs for Deworming 2. Purchase of equipment for deworming 3. Repair of Vehicles to be used as mobile units. 4. Drenching of 0.410 (million) cattle and buffalo from 4.232 cattle and buffaloes in milk. 5. Drenching / Deworming of 1.698 (Million) Small ruminants from 9.414 population. 6. Awareness and training of farmers 7. Record keeping regarding disease control.
PROJECT PURPOSE
i. Training & Awareness of farmers
ii. Record keeping regarding disease control
iii. Deworming of infested animals (buffalo / cattle in Milk & sheep & goat).
iv. Improving physical health
v. Increasing the production of milk, meat, wool, hairs, skin hides by 40-50%
vi. Maintaining immunity status of the animal against other diseases.
vii. Increasing Reproduction.

Appendix H - 2
OUTPUTS
1. Farmers were aware of the losses due to Endo and Ecto parasitic and benefits of deworming. 2. Sense of record keeping regarding disease control created amongst the farmers. 3. About 10% of the milking cattle and buffaloes were drenched and about 12% sheep and goat were
drenched against parasitic diseases. 4. 40 to 50% milk meat, hairs, wool were increased along both physical health of animals and quality
of skin and hides. 5. Farmers have realized the importance of deworming and trying to provide deworming from their
own resource to producing animals.
ACTIVITIES
1. Lectures by the mobile veterinary officers will be delivered on method of controlling the parasites, losses caused by parasites and better management.
2. Publicity material like leaflets / booklet, pamphlets etc, in Sindhi and Urdu language will be produced and distributed in the farmers.
3. Printing of cards distribution to farmers keeping vaccination deworming & treatment record. 4. Four veterinary mobile teams will visit different villages and private farms or each district of the
province for 4-5 days a week and collect the information about intensity of different parasites species of the animals and will be identify risk areas.
5. Field days /farmers days will be organized to provide awareness.
6. Demonstration will be arranged regarding correct method of drenching. 7. Necessary treatment related to parasitic disease will also be given during visit or field days. 8. Drenching will be performed in different villages during the visit to 0.410 million large & 1.698
million small ruminants, by completion of the project, to demonstrate its benefits to the farmers so that they may adapt it as a regular feature.
9. During the fourth and fifth year, the value of the drugs used will be partially recovered at the rate of Rs.2.00 per dose for small animals and Rs.10.00 per dose for the large animals. The amount thus recovered will be deposited in government treasury account No.1261-410 Animal Husbandry, Sindh. INDICATORS FOR MONITORING AND EVALUATION
1. Deworming I. cattle Buffaloe (in milk) II. sheep & Goat
0.410 Million 1.698 Million
2. Equipment for deworming purchased
Drenching gun 120ml 211 Nos.
3 Four vehicles repaired for Mobile units 4 Training and Awareness of farmers
through publicity material 20000 Nos. in Urdu & sindhi
5. Production increased Milk 163.779 Million Liters Beef 6.066 Million Kg Mutton 5.543 Million Kg
Amounting to Rs.4457.556 increased in addition 40% wool 40% hairs & 40% quality of Skin & Hide improved
6 Socio- economy of participating farmers improved because of improving their income.

Appendix H - 3
1.1.2 RESULT OF THE PROJECT
1. Farmers aware about the losses caused by Endo & Ecto Parasites through public material.
2. Mobility increased as after repair, four vehicles were made road worthy used for training of farmers deworming of animals
3. Physical health of animals and reproductive efficiency were improved by deworming 0.4043 Million Milking cattle and buffaloes, and 1.5581 million sheep and goat.
4. Production of deworming animals were increased i.e. Milk, meat, wool & hairs by about 40% and quality of skin & hide (fetched good price).
5. The income of Livestock traders, butchers blood contractors, Milk, wool, Hairs, and skin & hide traders increased.
6. The income of farmers increased. 7. Out of 80% population livestock raising about 50% socio economy improved by
generated self-employment. 8. Poverty reduction.
EFFECTS OF THE PROJECT (INDIRECT OUT COMES) GENERAL
i. Resistance of animals against disease, were developed ii. Income of the benefitted farmers was increased by 40%. iii. About 15% farmers were aware about the benefits of deworming to see the result of
drenched animals. iv. Equipments were made available at hospital. v. Overall Development in Livestock sector. vi. Poverty alleviation. vii. Overall livestock related business were improved i.e. Milk, Meat, fodder medicines
etc. viii. Trend of fattening was introduced to the farmers.
LESSON LEARNED a. PROJECT IDENTIFICATION
The stakeholders were involved in project identification process. The ground realities of the areas were studied by visiting the area.
b. PROJECT PREPARATION The requirement of the project ascertained with the consultation of stakeholders, field staff and the market position.
c. PROJECT APPROVAL While approving the demands future trends of inflation be considered with realistic approach.
d. PROJECT FINANCING a. Funds may be provided accordingly the financial phasing of the project. b. Funds were released in time.
e. PROJECT IMPLEMENTATION a. Procurement be made in time. b. Arrangement may be made for proper and timely monitoring.

Appendix H - 4
POSITIVE POINTS AND BACK GROUND
1. The farmers specially Arid Areas and commercial dairy farming were unaware about the infestation of parasitic and losses caused by them. They were welawared after the project results. Now they are deworming their animals from own resources.
2. The kidding and lambing rate were increased in the drenched animals. 3. The production of milk, meat, wool, hairs were increased. 4. The income of the farmers were increased. 5. Health status were improved. 6. The quality of skin & hide were improved by 40%. 7. The dewormed animals were resistant to other disease. 8. Overall livestock business were improved. NEGATIVE POINTS AND BACKGROUND
1. The funds were not released as per provision of PC-I there was variation in year wise financial targets and against the total cost of Rs.39.999 Million only 31.180 Millions were released.
2. The physical targets were very low only 10% of the milking of cattle, buffaloe and 12% of sheep and goats were drenched.
3. The stake holders were not involved in activities of the project as the department officers did not informed the beneficiaries about the project name and activities only drenched their animals.
4. Targets of deworming as per PC-I were not achieved as in case of cattle buffaloes 2-3 % in case of Sheep & goat about 9-10% were less.
Appendix H - 5
1.1.3 VIEWS ABOUT CONTROL OF ENDO AND ECTO PARASITIES IN SINDH
Due to geographical conditions of the provinces the animals of interior Sindh are grazing from standing water in ponds, low lying and water logged areas, which is the main source of infestation of flukes and round worms.
In desert, hilly areas and at commercial farms / colonies not housed properly and in insanitary conditions are the main source of external parasites i.e. Ticks lices, mange mites etc producing tick borne disease responsible for mortality and lowering production.
While interviewing Madam Nasreen KB Mirbhar Professor of Parasitology SAU Tando Jam about the Endo Parasitic infestation at commercial colonies of Karachi and Hyderabad where the conditions are totally different then interior Sindh, as there are no ponds, water logging etc how the infestation occurs the reply was very simple that adult flukes / worms can survive for years and fodder from interior Sindh for commercial farmers colonies is the main source of infestation of Endo parasites. It means more than 90% animals (Herbivorous) are infested with worms. The best solution is deworming with quality drugs (Anthelimintics) best strategy is four times a year i.e. first deworming then after 3-4 weeks then after six months then after 3-4 weeks. If not possible at least two times a year with six months interval. Which will improve the physical condition (health) improve reproduction maintain immunity against disease increasing production of milk, meat, wool, hairs, skin & hides by 40-50%.
From the discussion it was observed that parasitic infestation starts after rainfall, mainly in june and july.
While interviewing Dr. A. P. Umerani, Director Vet Research CVDL Tando Jam it was observed that during year 2009-2010 total 8620 specimens were received and processed and 2964 were found positive for parasitic disease and 727 were found positive for other diseases like PPR, Brucellasis, anthrax, Pnuemonia, Mastitis, HS, FMD, Black Quarter, Eenteroxamia, E.Coli and Proteus infection. It means more than 80% positive cases were of parasitic disease.
These like projects to control all types of internal parasites i.e. Flukes, all types of roundworm, tape worms, all types of Haemoparasites, Ticks, Lices, Mange, Mites are important for increasing livestock production, increasing income of farmers and poverty reduction.
AS FAR AS ASSUMABLE FACTS REGARDING COMMERCIAL AND ARID AREAS, FARMERS ARE CONCERNED
Mainly commercial dairy farming Districts in Sindh are Hyderabad, Badin, Thatta, Sukkur,
Larkana, Shikarpur & Karachi. In these Districts about 15-20% Buffaloes / Cattle are in commercial
setup, except Karachi where 90% animals are kept in commercial dairy farming system.
Arid districts, of Sindh are Thatta about 30% Dadu about 40% Mirpurkhas about 40%
Tharparkar about 90% Sanghar about 40% Sukkur about 15%, Khairpur about 30% Larkana about
5% Karachi about 30 %.
This was a smaller project with main idea to show the benefits to farmers. Mainly animals of
poor farmers were targeted. In commercial dairy farming 5-6 animals in a farm were drenched to
show them results and benefits.

Appendix H - 6
IN COMMERCIAL DAIRY FARMING AREA THE FOLLOWING NUMBER OF ANIMALS WERE DRENCHED
(Figures in Millions)
NAME OF DISTRICT
NO OF CATTLE IN MILK (2003 PROJECTED)
NO OF BUFFALOES IN MILK (2003 PROJECTED)
TARGET TOTAL
PERCENTAGE IN COMMERCIAL SETUP 20%
HYDERABAD 0.131 0.378 0.050 0.010 BADIN 0.064 0.132 0.020 0.004 THATTA 0.105 0.210 0.021 0.004 SUKKUR 0.076 0.145 0.016 0.003 LARKANA 0.081 0.272 0.026 0.005 SHIKARUR 0.060 0.172 0.016 0.003 KARACHI 0.071 0.239 0.023 0.020 (90%) TOTAL 0.588 1.548=2.136 0.172 0.049
Total about 8-9% animals i.e. 0.172 Million, (cattle & Buffaloes) in Milk were drenched in
commercial dairy farming area out of which 26% i.e. 0.049 Million belonging to commercial farmers.
It is assumed that per farmer four to five animals were drenched, total 40000 to 43000 farmer’s
animals were drenched in commercial dairy districts about 12000 commercial farmers were
benefitted.
After the completion of project total Milk increased in the province annually were about
164.00 (Million Liters) and in commercial Dairy District about 42% of the total milk increased i.e.
about 66.00 Million liters of milk and about 175.0 Million Liters of Milk at Commercial farms were
increased.
ARID AREAS OF SINDH ARE AS UNDER (Fig in millions)
NAME OF DISTRICT
SHEEP POPULATION PROJECTED
(2003)
GOAT POPULATION PROJECTED
PERCENTAGE IN ARID AREA
NUMBER 22
(2003) TOTAL
TARGETS ACHIEVED
THATTA 0.128 0.177 0.305 0.044 30% Kohistan 0.013 DADU 0.275 0.587 0.862 0.125 40% Koh. &
Kachho 0.050
MIRPURKHAS 0.148 0.692 0.840 0.122 40% Desert 0.050 THARPARKAR 0.628 1.383 2.011 0.291 90% Desert 0.261 SANGHAR 0.150 0.494 0.644 0.093 40% Desert 0.038 SUKKUR 0.044 0.174 0.217 0.033 15% Nara 0.005 KHAIRPUR MIRS
0.093 0.437 0.546 0.079 30% Nara 0.024
LARKANA 0.169 0.178 0.347 0.050 5% Kohistan 0.003 KARACHI 0.033 0.245 0.278 0.040 30% Kohistan 0.012 TOTAL 6.050 0.877 0.456

Appendix H - 7
Out of total 15.58 Million sheep & Goat about 6% i.e. 0.877 animals were drenched in Arid district
about 3% i.e. 0.456 animals were targeted in Arid Areas. It is assumed that average holding of one
farmer is ten animals, total 45000 farmers of arid areas were benefitted.
Total meat increased in Sindh after completion of the project was about 11.5 Million Kgs and in arid
Districts about 0.7 Million Kgs of Meat.
Quality anthelmitics are very costly therefore poor farmers were unable to purchase for
deworming their animals.
Realizing the situation government of Sindh Animal Husbandry Department prepared project and
provided anthelmintics drugs through this project for free deworming (some amount were charged
in last year) than these farmers came to know the benefits of the project.
Other benefits which were not counted were increase in quality and quantity of wool (about
40%) 1 to 1.5 Kg of wool per sheep and about 1.0 KG of Hairs / Goat annually, (Two Times
shearing) Quality of skin & Hides and increase in kidding lambing rate by 20-30%. (As per report of
DO L/S Mithi & Dr. Jaimal, NGO/ thardeep)
Appendix H - 8
1.2 PARTICIPATORY DISEASE SURVEILLANCE IN PAKISTAN 1.2.1 PROJECT OUTLINE
PROJECT NAME Support for emergency prevention and control of main Transboundary Animals
DISEASES IN PAKISTAN Rinderpest, Foot and Mouth, Pestides Petitis Ruminant, GCP / PAK 88-EC
PERIOD January 2002 to June 2005 (PDS) July 2005 to June 2006 (SLSP)
IMPLEMENTING ORGANIZATION
Project funded by European Commission and implemented by FAO up to 2005 and from July 2005 to June 2006 by SLSP
COOPERATING ORGANIZATION
Ministry of Food & Agriculture Livestock and Provincial Departments of Livestock (Animal health)
TARGET AREA-PAKISTAN
i. Farmers ii. Slaughter house iii. Livestock Traders iv. VO’s of Livestock Department v. NGO’s
TARGET BENEFICIARIES i. Farmers ii. Livestock Department iii. NGO’s
BUDGET 1.8 Million Euros
SOURCE OF BUDGET European Commission
OVERALL GOAL
i. Rinder pest Eradication
ii. Capture & record present & historical Report of TAD i.e RP, FMD & PPR
iii. National Policy on TAD Disease i.e. FMD and PPR
iv. Establish an effective surveillance reporting system and clinical surveillance data base to
support the accreditation of rinderpest as a part of the pathway to formal recognition of
disease freedom by the office of international des Epizootic (OIE)
v. Identification & prioritize disease with important livelihood impact in Pakistan from the
Livestock owners perspective.
PROJECT PURPOSE
I. Eradication of RP
II. Searching TAD through establishing teams in the country from 10% villages.
III. Strengthening of Livestock Department of the province.
IV. Awareness of farmers Traders, NGO’s for control of Animal Disease.
V. Control on quackery Treatment.
VI. To search out other disease of economical importance to farmers other then TAD

Appendix H - 9
OUTPUT
i. Skills of staff required for disease surveillance, diagnosis and reporting improved.
ii. Improved surveillance facilities in five research institutes i.e.
i. National Veterinary Lab Islamabad (reference lab)
ii. Central Veterinary diagnostic Lab. Tando Jam
iii. VRI Quetta
iv. VRI Lahore
v. VRI Peshawar
iii. Increased knowledge of TAD Prevalence and impact.
iv. National control strategy for FM Disease by Dr. Zulfiquar Ex .DG Res VRI Lahore
v. National Control strategy for PPR by Dr. Qurban DG National Lab Islamabad.
vi. Clinical evidence for freedom of rinderpest
Project management appointed.
ACTIVITIES
I. TAD Info Training 6 Data Manager Trained
II. PDS Training 51 VOs trained used in 17 teams for work. (three stage process)
III. Training of trainers in PE and PDS- 7 Master trainers trained Nationally & internationally (Two Step
process trainers trained only for experience PDS practitioners).
IV. Decision maker workshops arranged.
V. Inter provincial review of PDS performance.
VI. Elisa Training of 10 VO’s conducted
VII. Awareness training of progressive farmers, VO’s (private and public)
VIII. Training on disease investigation and surveillance by an expartise consultant Dr. Tailor for all
veterinarians (public and private).
IX. Support for PPR Epidemiological studies by NARC
X. Support to FMD referral centre at NVL Islamabad.
XI. Technology transfer for live aerosol vaccine consultant from Nepal for training at VRI Lahore VRI
Quetta VRI Peshawar Vaccine production unit Tando Jam NVL Islamabad (one month training)
XII. Technology transfer for production of PPR Vaccine training in France for one month one RO from VRI
Lahore one RO From VRI Quetta trained. Seed virus for production procured from France
XIII. Pakistan villages searched 2002-2005
10% villages searched in each province including FATA as

Appendix H - 10
TABLE SHOWING THE DISEASE SURVEILLANCE ACTIVITIES IN PAKISTAN INCLUDING AJK AND NORTHERN AREAS
ICT NA AJK BALUCHISTAN SINDH NWFP PUNJAB TOTAL DISTRICT COVERED 1 6 7 16 15 31 34 110 VILLAGES SEARCHED 46 632 891 713 997 1267 2784 7330 MEETINGS CONDUCTED
74 687 927 735 1702 1323 3103 8551
FARMERS ATTENDED MEETINGS
849 11624 7819 6887 24484 34959 31411 118033
PLACES WITH VETY SERVICES AVAILABLE
74 5 182 379 474 859 1496 3469
PLACES WITH SIANAS SERVICES AVAILABLE
36 8 185 151 280 318 1573 2551
FARMERS WHO DESCRIBED HISTORY OF RP
0 7 0 3 304 0 3 317
FARMERS WHO DESCRIBED HISTORY OF PPR
18 33 200 13 408 6 263 941
FARMERS WHO DESCRIBED HISTORY OF FMD
73 596 472 510 1618 1247 2611 7127
FARMERS WHO DESCRIBED HISTORY OF S.E
0 3 7 2 213 1 23 249
TRACED RP CASES 0 0 0 0 0 0 0 0 TRACED PPR CASES 1 0 2 7 23 1 29 63 TRACED FMD CASES 20 0 1 0 3 0 0 24 TRACED S.E. CASE 0 0 2 0 2 0 1 5
VILLAGES SEARCHED IN YEAR TOTAL
PROVINCE 2003 2004 2005 2006
PUNJAB 659 1385 579 350 2973
SINDH 793 1214 730 405 3142
NWFP 285 415 380 248 1328
BTN 174 309 159 246 888
AJK 203 451 334 100 1088
NAS 127 596 0 100 823
ICT 13 30 15 25 110
TOTAL 2254 4400 2197 1501 10352
During the participatory disease search activities the teams had direct interaction with 118033 farmers during 8551 meetings to gather qualitative disease intelligence regarding Transboundary animals disease particularly Rinderpest, FMD, PPR alongwith some other important Livestock disease in the country.

Appendix H - 11
XIV. National Technical consultant appointed (DR. Manzoor Hussain) FAO Technical
Advisory Services provided regularly.
XV. Convening National Animal disease emergency committee conducted terminal Mid and
End Review.
INDICATORS FOR MONITORING
1. Sero surveillance 2. PDS Data 3. Training workshops 4. Field Investigation 5. Meeting with farmers. 6. Villages visited. 7. Livestock markets visited.
OTHER IMPORTANT LS DISEASES FROM PDS
DATA4.
2 4.5
6.8
5.7
0.3
0.2 1.
1
0.9
6.3
6.3
10.3
9.9
0.7
0.5
5.9
5.1
8.4
10.9
7
7.6
0 0
7.8
4.3
7.4
6.9
3.9
5.6
21.4
10.7
0.6
0.5
0 0
16.6
18.2
0.6
0.2
2.8
2.5
20
19.4
0.4
0.4
7.8
7.8
0.5
0.5
7.8
6.8
7.9
6.9
0.5
0.4
3
2.2
0
5
10
15
20
25
ETP ETI MASTP MASTI MANGEP MANCEI ENDOP ENDOI
Sindh
Punjab
NWFP
NA
Islamabad
Balochistan
AJK
ETP (Ent: Prevalence), ETI (Ent: Importance) MAS TP (Mastitis Prevalence), MAS TI (Mastitis Importance) MANGEP (Mange Prevalence) MANGEI (Mange Importance) ENDOP (Endoparasites Prevalence) ENDOI (Endoprarasites Importance)
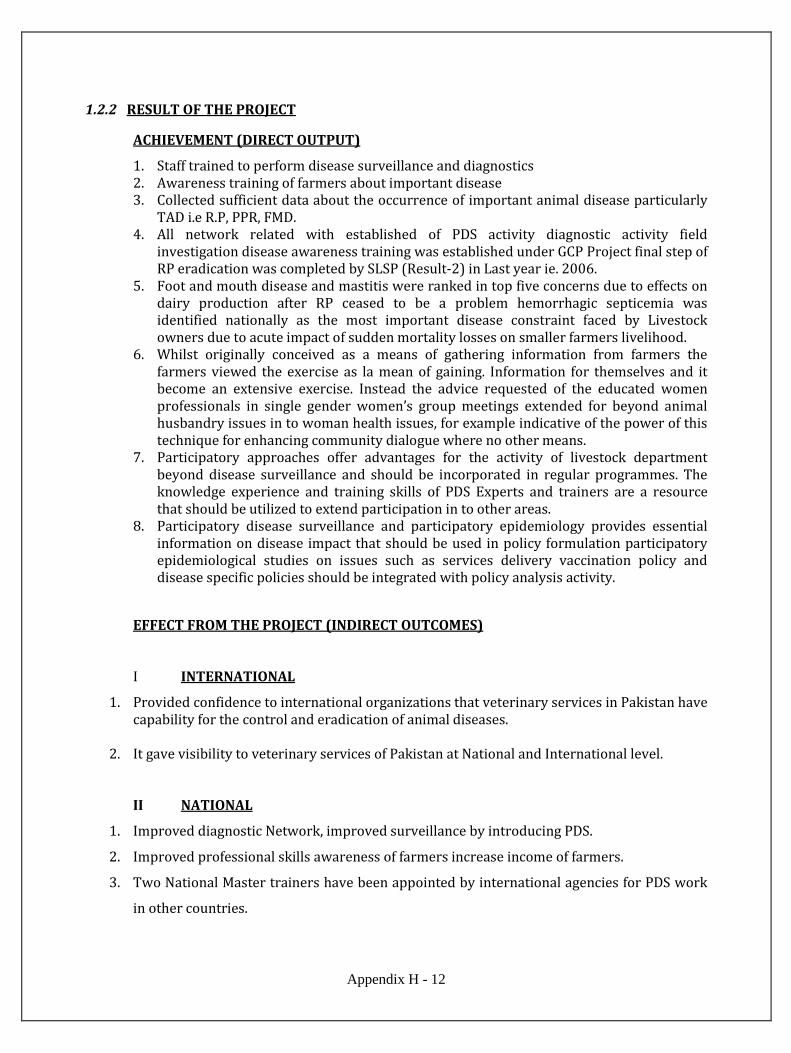
Appendix H - 12
1.2.2 RESULT OF THE PROJECT
ACHIEVEMENT (DIRECT OUTPUT)
1. Staff trained to perform disease surveillance and diagnostics 2. Awareness training of farmers about important disease 3. Collected sufficient data about the occurrence of important animal disease particularly
TAD i.e R.P, PPR, FMD. 4. All network related with established of PDS activity diagnostic activity field
investigation disease awareness training was established under GCP Project final step of RP eradication was completed by SLSP (Result-2) in Last year ie. 2006.
5. Foot and mouth disease and mastitis were ranked in top five concerns due to effects on dairy production after RP ceased to be a problem hemorrhagic septicemia was identified nationally as the most important disease constraint faced by Livestock owners due to acute impact of sudden mortality losses on smaller farmers livelihood.
6. Whilst originally conceived as a means of gathering information from farmers the farmers viewed the exercise as la mean of gaining. Information for themselves and it become an extensive exercise. Instead the advice requested of the educated women professionals in single gender women’s group meetings extended for beyond animal husbandry issues in to woman health issues, for example indicative of the power of this technique for enhancing community dialogue where no other means.
7. Participatory approaches offer advantages for the activity of livestock department beyond disease surveillance and should be incorporated in regular programmes. The knowledge experience and training skills of PDS Experts and trainers are a resource that should be utilized to extend participation in to other areas.
8. Participatory disease surveillance and participatory epidemiology provides essential information on disease impact that should be used in policy formulation participatory epidemiological studies on issues such as services delivery vaccination policy and disease specific policies should be integrated with policy analysis activity.
EFFECT FROM THE PROJECT (INDIRECT OUTCOMES)
I INTERNATIONAL
1. Provided confidence to international organizations that veterinary services in Pakistan have capability for the control and eradication of animal diseases.
2. It gave visibility to veterinary services of Pakistan at National and International level.
II NATIONAL
1. Improved diagnostic Network, improved surveillance by introducing PDS.
2. Improved professional skills awareness of farmers increase income of farmers.
3. Two National Master trainers have been appointed by international agencies for PDS work
in other countries.

Appendix H - 13
LESSON LEARNED
POSITIVE POINTS AND BACKGROUND
1. Two types of surveillance carried out a) Disease surveillance b) Sero Surveillance (farmers
were key informants)
2. Never such type of surveillance were carried out before.
3. Data collected consolidated analyzed and dossier was prepared for submission to concern
authorities (OIE) as a result Pakistan was provisionally declared as Rinderpest free country.
4. Capacity building of the departmental officers of the country was carried out including AJK
FATA and Northern Areas for:-
a. Preparation of Special Diagnostic teams.
b. Awareness of farmers regarding disease problems
c. Seasonal incidence of different disease in livestock
d. Close coordination of departmental officers with farmers and NGOs
NEGATIVE POINTS AND BACKGROUND
1. The project was confined to only one disease i.e. RP as Sero surveillance was carried out for
one disease.
2. Mobility problems were seen while performing field work.
3. A main objective was to confirm the presence or absence of Rinderpest in the country.
4. No vaccines / material was provided to deal with TAD on emergency basis.
5. There was no provision of incentives for the elder farmers of the village who worked as
coordinator between the village farmers and teams.
VIEWS / HOW TO APPLY
PDS provided Epidemiological Data on Transboundary Animal Diseases i.e. R.P, PPR & FMD
Data which helped in declaration of eradication of Rinderpest in the Country.
Also the Data on Disease of economical importance for farmers like HS & Mastitis were
captured from the surveillance report, for future strategy for control of infectious diseases in the
area.
This type of work can be replicated in the province and country for carrying out disease
surveillance and technical Monitoring of disease control work.

Appendix H - 14
1.3 STRENGTHENING OF LIVESTOCK SERVICES PROJECT
1.3.1 PROJECT OUTLINE
PROJECT NAME Strengthening of Livestock Services project:- PAK / RELEX / 2001/0129
PERIOD Six Years 16 Sept 2003 to 15 Sept 2009
IMPLEMENTING ORGANIZATION
MINFAL (Livestock Division) Islamabad European Union Islamabad
THROUGH
COST Local (PSDP) Rs.405.39 Million (in kind 70%+cash 30%) FEC Rs.1587.27 Million (EU Grant) TOTAL Rs.1992.66 Million
COOPERATING ORGANIZATION
1. Livestock Departments of the Country. 2. NGO’s 3. Private Vets 4. Pak Vet Medical Council 5. Teaching Institutes
FEDERAL PROJECT MANAGEMENT UNIT
SUPERVISED BY EU DIRECTOR + NATIONAL DIRECTOR ISLAMABAD
PROV. MANAGEMENT UNIT
NORTHERN AREA SUB OFFICE OF FPMU GILGIT
AZAD JAMU KASHMIR (AJK) SUB OFFICE FPMU AT MUZZAFARABAD
FATA SUB OFFICE FPMU FATA
GOVERNORS SECRETARIAT
SINDH AT HYDERABAD PUNJAB AT LAHORE NWFP AT PESHAWAR BALUCHISTAN AT QUETTA

Appendix H - 15
TARGET AREAS
1. Livestock Department 2. NGOs 3. Livestock Farmers / traders 4. Pakistan Vet Medical Council 5. Teaching Institutes
TARGET BENEFICIARIES
1. Livestock Department all provinces & Sub units 2. NGO’s 3. Livestock Farmers 4. Livestock Traders 5. Milk Traders 6. Drug & Vaccine dealers
STUDY OF RESULT :: SLSP Result-2 :: DISEASE REPORTING AND SURVEILLANCE SYSTEM FUNCTIONS BUDGET:- 0.987959 Euro (Million) 77.201245 Pak Rs. (Million) 14% of the total project expenditure SOURCE “European Union Grant” OVERALL GOAL 1. To eradicate rinderpest disease from the country. 2. To enhance efficiency and effectiveness of delivery of livestock services. 3. Improvement of disease diagnosis monitoring and reporting system. 4. Vaccine production particularly against newly emerging and TAD. 5. Capacity building of the veterinary staff 6. Awareness / training of farmers. PROJECT PURPOSE
1. Eradication of Rinderpest Disease 2. Strengthening of Livestock services regarding diagnosis reporting and monitoring 3. Awareness / training of farmers for disease reporting. 4. Capacity building of the staff of livestock department. 5. Production of vaccine regarding Transboundary animal disease 6. Capacity building of the livestock departmental officers.
PAKISTAN Balochistan : Pishin, Zhob, Kalat, Qilla
Saifullah, Loralai, Mastung. KP : Peshawar, Charsada, Swat,
Mardan, Abbotabad, Noshehra. Punjab : Kasur, T.T. Singh, Bhakkar,
Gujrat, Chakwal, Bhawalpur. Sindh : Thatta, Badin, Sanghar, Dadu,
Therparker, Khairpur. FPMU Sub-Units : AJK, NAs, FATA,ICT
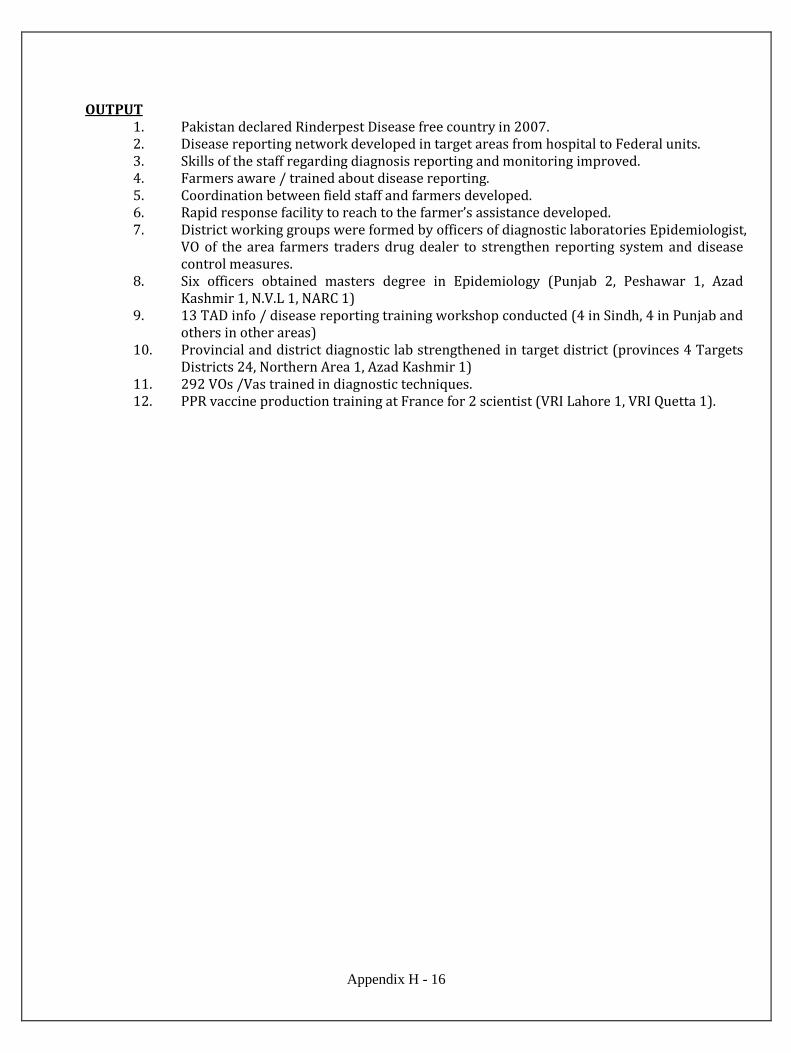
Appendix H - 16
OUTPUT
1. Pakistan declared Rinderpest Disease free country in 2007. 2. Disease reporting network developed in target areas from hospital to Federal units. 3. Skills of the staff regarding diagnosis reporting and monitoring improved. 4. Farmers aware / trained about disease reporting. 5. Coordination between field staff and farmers developed. 6. Rapid response facility to reach to the farmer’s assistance developed. 7. District working groups were formed by officers of diagnostic laboratories Epidemiologist,
VO of the area farmers traders drug dealer to strengthen reporting system and disease control measures.
8. Six officers obtained masters degree in Epidemiology (Punjab 2, Peshawar 1, Azad Kashmir 1, N.V.L 1, NARC 1)
9. 13 TAD info / disease reporting training workshop conducted (4 in Sindh, 4 in Punjab and others in other areas)
10. Provincial and district diagnostic lab strengthened in target district (provinces 4 Targets Districts 24, Northern Area 1, Azad Kashmir 1)
11. 292 VOs /Vas trained in diagnostic techniques. 12. PPR vaccine production training at France for 2 scientist (VRI Lahore 1, VRI Quetta 1).

Appendix H - 17
Source:- Final report of the project given by PD SLSP
Source:- Final report of the project given by PD SLSP
S.# Location EPI Unit DDRC MVH Total
1 Federal 01 0 0 01
2 Punjab 07 06 06 19
3 Sindh 07 06 06 19
4 Baluchistan 07 06 06 19
5 KP 07 06 06 19
6 AJK 02 02 02 06
7 NAs 02 02 02 06
8 FATA 01 0 01 02
9 ICT 0 0 01 01
Total 34 28 30 92
S.# Item Federal Punjab KP +FATA Sindh BTN AJK NAs Total
1 Desktop computer
1 19 25 19 19 06 04 93
2 Lazerjet Printer
1 19 25 19 19 06 04 93
3 GPS 1 07 09 07 07 02 01 34
4 UPS 1 19 25 19 19 06 04 93

Appendix H - 18
Source:- Final report of the project given by PD SLSP
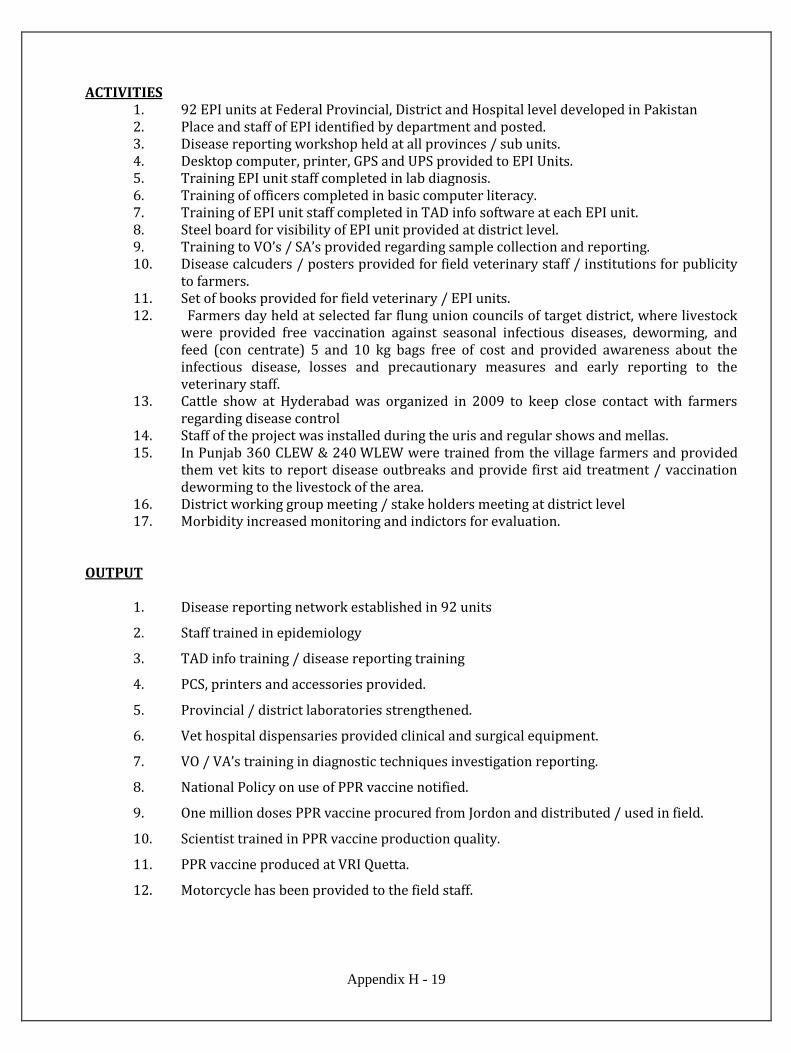
Appendix H - 19
ACTIVITIES 1. 92 EPI units at Federal Provincial, District and Hospital level developed in Pakistan 2. Place and staff of EPI identified by department and posted. 3. Disease reporting workshop held at all provinces / sub units. 4. Desktop computer, printer, GPS and UPS provided to EPI Units. 5. Training EPI unit staff completed in lab diagnosis. 6. Training of officers completed in basic computer literacy. 7. Training of EPI unit staff completed in TAD info software at each EPI unit. 8. Steel board for visibility of EPI unit provided at district level. 9. Training to VO’s / SA’s provided regarding sample collection and reporting. 10. Disease calcuders / posters provided for field veterinary staff / institutions for publicity
to farmers. 11. Set of books provided for field veterinary / EPI units. 12. Farmers day held at selected far flung union councils of target district, where livestock
were provided free vaccination against seasonal infectious diseases, deworming, and feed (con centrate) 5 and 10 kg bags free of cost and provided awareness about the infectious disease, losses and precautionary measures and early reporting to the veterinary staff.
13. Cattle show at Hyderabad was organized in 2009 to keep close contact with farmers regarding disease control
14. Staff of the project was installed during the uris and regular shows and mellas. 15. In Punjab 360 CLEW & 240 WLEW were trained from the village farmers and provided
them vet kits to report disease outbreaks and provide first aid treatment / vaccination deworming to the livestock of the area.
16. District working group meeting / stake holders meeting at district level 17. Morbidity increased monitoring and indictors for evaluation.
OUTPUT
1. Disease reporting network established in 92 units
2. Staff trained in epidemiology
3. TAD info training / disease reporting training
4. PCS, printers and accessories provided.
5. Provincial / district laboratories strengthened.
6. Vet hospital dispensaries provided clinical and surgical equipment.
7. VO / VA’s training in diagnostic techniques investigation reporting.
8. National Policy on use of PPR vaccine notified.
9. One million doses PPR vaccine procured from Jordon and distributed / used in field.
10. Scientist trained in PPR vaccine production quality.
11. PPR vaccine produced at VRI Quetta.
12. Motorcycle has been provided to the field staff.

Appendix H - 20
1.3.2 RESULT OF THE PROJECT ACHIEVEMENT
1. Disease reporting system strengthened in Punjab disease reports has increased about 200% and Sindh also increased by about 30-40% reports received by the Provincial units of Punjab & Sindh during the period as under:-
CONTAGIOUS DISEASE REPORTS RECEIVED IN TAD INFO UP TO DECEMBER 2008
Name of Disease
Total Reports
received
No of Sick
animals
No. of Dead
animals
FMD 468 2022 377
PPR 98 3974 882
HS 194 693 210
CCPP 55 719 72
ET 165 1292 224
Brucellosis 14 85 9
Theileriosis 15 40 5
CPD 9 129 3
BQ 30 65 32
Rabies 32 34 28
Camel Pox 2 6 0
S/Goat Pox 5 46 3
Buff. Pox 1 50 0
Anthrax 2 2 1
Babesiosis 3 11 0
Total 1093 9168 1846
Source: Director Planning & Development Directorate General Livestock & Dairy Development Punjab

Appendix H - 21
EPI SINDH
Name of Disease July 2008 to June 2009
July 2009 to 30 June
2010
HS 71 21
Goat Pox 15 4
CPP 55 05
PPR 47 16
Ent: Tox: 92 34
FMD 93 34
Sheep pox 4
Cow pox 2
LFD 18 15
Food Poisoning 1 1
Trypanosomiasis 4 1
Anthrax -- 2
TOTAL 403 130
Pakistan achieved the status of Rinderpest Disease Free country in May, 2007. Six officers obtained Masters degree in Epidemiology from England and Netherlands. 13 TAD info / Disease Reporting Trainings Workshops conducted. PCs, printers & accessories provided in target districts and sub-units of FPMU. Provincial and District Diagnostic Lab Strengthened in target districts. 292 VOs/Vas trained in Diagnostic Techniques. 900 officers, 316 field staff and 2735 farmers imparted training in different disciplines. Information management units setup at Islamabad Lahore Quetta and Peshawar. Extensive range of messages, leaflets, posters for vaccination and disease, calendar,
booklets, prepared and distributed to stakeholders (81 publications) 100 radio, 35 TV programmes and 5000 short messages in national and local languages produced for farmers awareness.
Supported the Pakistan vet Medical Council (PVMC) in DVM curriculum revision in order to update / upgrade the education syllabus.
Livestock legislation reviewed and revised. Field veterinary hospital / dispensaries were strengthened by providing clinical and
surgical equipment. Source:- Final report of the project given by PD SLSP

Appendix H - 22
EFFECT OF THE PROJECT (INDIRECT OUTCOME) 1. Reduction in disease in the Livestock of country. 2. Reduction in mortality due to Livestock Disease. 3. Per animals production increased. 4. Income of the farmers increased. 5. Awareness of farmers regarding all aspects of Livestock dev. 6. Quality of service improved 7. Exposure Visits of different provinces and different districts. 8. Model of Disease control introduced.
LESSON LEARNED POSITIVE POINTS AND BACKGROUND
1. Awareness of farmers. 2. Awareness of field staff and policy makers and managers. 3. Political will to give priority to livestock sector 4. Poverty alleviation 5. Increase profit from livestock due to marketing service. 6. Strengthening of institutes. 7. Rinderpest eradication and control of other TAD and economical importance diseases. 8. Disease surveillance and reporting system was further upgraded by upgrading post of
project Director diagnostic lab Lahore to provide services in whole province. 9. Mobility improved few four wheel vehicles and 500 Motorcycles provided to each in whole
province of Punjab (2200 motorcycles) NEGATIVE POINTS AND BACKGROUND
1. Agreed resources were not provided like mobility equipment etc.
2. Delay in release of funds.
3. Smaller targets hardly 20-25% districts of the country were targeted still 50 district in the
country are left. Farmer’s days were organized hardly in 4-5% union councils, which has no
or little impact on the farmers. The system was incomplete in whole country including
Sindh and Punjab.
4. All the hospital / dispensaries are not provided with EPI units only one hospital in each
target district provided with EPI Unit.
5. Farmers are the main source of disease reporting but the farmers are not well connected
(required to be more connected) with the reporting system.
6. Foreign training as per agreement not provided.
7. Continuity and sustainability of the Activity after closure of project is questionable.
8. Instead of Rs.1992.0 Million agreed cost only Rs.1339.0 Million released, upto date
expenditure was Rs.1286.0 Million saving of Rs.53.00 Million were transferred to
settlement of internal displaced person of FATA.
Source:- Final report of the project given by PD SLSP

Appendix H - 23
1.3.3 VIEWS / HOW TO APPLY This is a very good system for reporting disease outbreaks in field provided this is well connected with farmers. The present system developed under result 2 of SLSP has three deficiencies. 1. In Sindh out of 23 districts, only 12 districts are connected with network.
2. Out of 179 hospitals / dispensaries only 6 hospitals are connected in target area rest are
without EPI Network.
3. Farmers are not well connected with the system even the directorate of animal disease surveillance system in Punjab (development project costing 194.5 Million for the period 2009 to 2012) the farms are required to be more connected.
In Sindh on the pattern of Punjab the post of DIO may be upgraded as Directorate of
Disease Surveillance and Reporting in Sindh by well connecting the farmers of the villages through a well coordinated link, so that it works permanently.
The data gathered through the disease surveillance and reporting system will be used
for further disease control strategy.

Appendix H - 24
2. COORDINATION AMONG VARIOUS STAKEHOLDERS IN PARTICIPATORY DISEASE SURVEILLANCE IN PAKISTAN: The cooperation ship among various stakeholders especially between federal and
provincial government in this project:
1: At federal level there is a steering committee, consisting of:
i. Secretary Ministry of Food & Agriculture Islamabad Chairman
ii. Provincial Secretaries Livestock Members
iii. A.H commissioner Members (National Coordinator)
iv. FAO / Res Rep Member
v. EU / Res Rep Member
vi. National Consultant Member / Secretary
vii. PDS Expert (Mr. Mariner) Member
[Approval & Facilitating Body, for working plan.
2: TECHNICAL WORKING GROUP
Federal body under the Chairmanship of Animal Husbandry Commissioner
i. AHC (National Coordinator) Chairman
ii. PDS Expert Member / Advisor
iii. National Consultant Member / Secretary
iv. All provincial DG Livestock / Incharge (Livestock) Member
v. All Provincial Director A Health Member
vi. All Director VRI’s Member
vii. Member Animal Science PARC Islamabad Member
Source:- Final report of the project given by the National Coordinator PDS project
This committee was responsible to prepare work plan and discuss, guide technical matters
related to project. Supervision and Monitoring body for field work. Provincial TAD Officer who was
supervising and facilitating the activities of TAD Provincial teams, were submitting progress report
alongwith Members of the team after every quarter in workshop at provincial head quarters by
rotation in every province / unit and Work plan for future quarter was also finalized.
III NATIONAL COORDINATOR ISLAMABAD
Animal Husbandry Commissioner Livestock Division at Islamabad was responsible for
supervision and monitoring the activities at National Level. National Consultant and PDS Expert (Dr.
Meriner) were assisting him.

Appendix H - 25
IV PROVINCIAL COORDINATOR
Director General Livestock Department / in charge Animal Health Activities at provinces /
Units were facilitating in operation supervising and monitoring the activities at provincial level.
V TAD OFFICERS (TRANSBOUNDARY ANIMAL DISEASE)
A senior Technical officer working for disease control in the province / unit were selected
and trained to work as TAD Officer in the province, he was supposed to facilitate, supervise and
monitor the activities of the TAD Teams of the province.
VII TAD TEAMS
There were 17 teams in the country consisting of three members each with Senior VO as in
charge plus one Lady Veterinary Officer in few teams in Sindh and Punjab provinces as under:-
1. Punjab 4 teams
2. Sindh 4 teams
3. Baluchistan 2 Teams
4. NWFP 2 teams
5. AJK 2 teams
6. Northern Areas 2 teams
7. Islamabad (Capital) 2 teams
Provincial TAD Officers in consultation with DG Livestock / DAH selected randomly 10
villages of all the Districts in the province and carried out disease surveillance work. Those were
supposed to visit each & every selected village regularly as per approved programme and interview
almost all the farmers in the village and cattle markets regarding search of disease LVO were
interviewing lady farmers of the village
The coordination of team in charge with farmers was through a Elder farmer of the village
selected for the purpose and VO of the concern area.
The VO’s of the teams were selected on the following criteria. The List (about double than
the required) interested and energetic VO’s were prepared by Director AH with the consultation of
Provincial Coordinator, than after some training by Mr. Merinar (Expert) & National Consultant
they were tested and the best were selected accordingly and provided further training to carry out
disease surveillance, back tracing etc work. Total fifty VO’s for PDS work and Master trainers were
trained.
The work was carried out for about 30 months (2003 to 2005) the workers were provided
full facilities likes mobility TA & DA and other expenses, without delay.
To provide technical training workshops were held Islamabad. Including provincial
coordinators / policy makers. Finally after declaration the country free from Rinderpest in 2006 all
good workers were awarded shields at Islamabad by FAO /EU /GO Pakistan.
Source:- Final report of the project given by the National Coordinator PDS project

Appendix H - 26
COORDINATION WITH PROVINCIAL TAD TEAMS
STEERING COMMITTEE
Secretary MINFAL -- Chairman Provincial Secretaries Livestock -- Member Animal Husbandry Commissioner ISB Member Resident Representative of FAO / EU Members PDS Expert (Dr.Merinar) Member National Consultant Member
TECHNICAL WORKING GROUP
Animal Husbandry Commissioner Chairman National Consultant Member / Secretary All Provincial DG’s Livestock Member All Provincial Director AH Member All Director VRI Members Member Animal Science PARC Member
PROVINCIAL COORDINATOR
All DG’s Livestock / Incharge Livestock Department
TAD OFFICER A senior Technical Officer working for disease Control In the province selected and
trained for the purpose Teams
Source:- Final report of the project given by the National Coordinator PDS project
Each team was consisting of 3 VO’s and Senior Most was incharge with additional Lady
Veterinary Officer in few teams of Sindh and Punjab.
Approving authority
of work plan and
facilitating body
To prepare annual
work plan and discuss
technical matters &
monitoring
Supervision and
monitoring of TAD
work in province and
coordination with
National Coordinator
Supervision and monitoring work of
the teams in the province and report
to National Consultant through
provincial Coordinator
PUNJAB SINDH
NWFP BALCHISTAN ISB AJK NA
4 1 4 2 2 2 2
10% villages, all Farmers with coordination
of elder farmer

Appendix H - 27
10% villages were randomly selected for carrying out disease surveillance with coordination of a (elder farmer selected for the purpose) in the Livestock of the village and livestock market. Villages were visited by the teams after confirmation and willingness of the farmers, to get full cooperation.
Source:- Final report of the project given by the National Coordinator PDS project
MONTHLYMONTHLY
VO
Distt EUDOL
Director
TAD
Vet
assistantFarmer
AHC
(FEU)
OIE
Director General
VRI
NVL

Appendix H - 28
3. CONCLUSION
3.1. WHAT IS THE MOST SUITABLE DISEASE CONTROL SYSTEM IN SINDH.
Livestock disease control in Sindh is based on the following components:- Disease surveillance & Diagnosis Treatment of ailing of animals. Production of vaccines / availability of vaccines. Preventive vaccination against infectious disease and deworming against parasitic
diseases Motivation, training, publicity of farmers regarding disease control.
Directorate of Animal Husbandry / Health Sindh has prepared an yearly calendar for control of infectious & parasitic diseases and is issuing a generalized disease forecast on quarterly basis keeping in view the previous record of disease and trying to provide publicity for the information of the farmers of the province. Only progressive and commercial farmers, hardly 10% - 15% who are well aware of the benefits of preventive vaccination and deworming are protecting their animals accordingly animals of the rest farmers are at risk.
For the provision of Disease control measures there are 179 Veterinary Hospital /
Dispensary at District & Tehsil Level and 600 Veterinary Centres at union council level, and 23 Mobile units, one on at each District Head Quarter with supporting staff of 334 VO’s & 742 Para veterinary workers to provide Veterinary assistance in the province. The working of district is supervised by a District Officer who is also responsible for other Livestock Development activities. Director Animal Husbandry is overall incharge for Disease control activities of the Province, assisted by a Senior Level Officer Disease investigation officer, ADIO, ADCO and two Assistant Res. Officers providing disease diagnosis facilities through a smaller Lab at LCC Karachi mainly for collection of samples. For training and awareness of farmers, field workers, a training center is located at Red Sindhi Cattle Breeding farm TM Khan.
Disease diagnosis and research work is carried out by Directorate of Veterinary research
and diagnosis Tando Jam established under assistance of FAO / UNDP. Having one main center, central veterinary diagnostic Lab Tando Jam with sections headed by SRO’s are Pathology, Microbiology Parasitalogy and Epidemiology and six sub centers headed by RO’s at Karachi, Dadu, Mithi, Sukkur Larkana and Naushahro feroze . These centers are lacking in equipment and required facilities.
Every year field veterinarians are reporting about 200-300 out breaks of contagious and
parasitic diseases, treatment carried out for about 1.5-2.0 million animals, deworming carried out for about 1.7 million animals, preventive vaccination 6.8 to 7.0 million animals with highest number against H.S and lowest number against F&M diseases. The preventive vaccination against most prevalent disease HS is not more than 12% treatment of contagious & non contagious diseases is 8-9% shows that there is acute shortage of manpower and input including mobility and other hand only progressive farmers, commercial farmers in urban & peri urban areas and nearer are getting benefits of service and farmers of far-flung areas are unaware and are at risk.

Appendix H - 29
REGARDING AWARENESS OF DISEASE PREVENTION BETWEEN COMMERCIAL AND SUBSISTENCE FARMERS
It is correct that larger number of urban commercial dairy farmers are well awared, periurban commercial dairy farmers are, having less awareness and subsistence farmers are having lesser awareness or no awareness, specially the farmers of the far flung areas.
Commercial farmers are more aware because mainly they are educated, nearer to vet: hospitals and working in close coordination with field veterinarians and they are having all the required facilities like electronics and print media and they have knowledge about disease symptoms and advance information about outbreaks etc. as they are attending awareness programmes of the dept regularly, where as subsistence ( smaller, poor and rural farmers) are devoid of all required facilities and knowledge.
BOTTLE NECKS IN THE EXISTING DISEASE CONTROL SYSTEM
Unawareness of majority of farmers about :-
FACTS - Benefits of early reporting of outbreaks
of a disease and seeking veterinary help Hardly 10% farmers of commercial sector are reporting disease outbreaks.
- Benefits of regular vaccination drenching, dipping of animals against various diseases
Hardly 10 to 12 % vaccination and drenching are being carried out for other diseases but in case of foot and mouth preventive vaccination is below 1% no dips for control of ecto parasites are available.
- Benefits of hygienic housing of livestock Rural farmers are mainly unaware about importance of the hygienic housing.
- Proper disposal of carcases died due to diseases.
Carcasses of animals died due to disease are lying in open area especially in desert rural area and on super high and spreading diseases to healthy animals and human beings.
Lack of proper attention towards rearing of sucklers and calves.
There is about 25% to 30% mortality in Buffaloe calves at commercial dairy colonies due to white scours, simple diarrahea, coccidiosis, other parasites and F&M disease. In arid areas mortality in Kids is about 50-70% and in lambs is 30% to 35% mainly due to PPR, F&M disease, diarrhea and internal parasites.
Delay in response to Disease report Rapid responses teams are not available under District Officer Livestock and area VO due to lack of facilities are avoiding.
Lack of adequate treatment facilities in public and private sector
Only 179 Veterinary Dispensary, about 600 Veterinary centers and 23 Mobile units are available for about 37.0 Million Livestock without required facilities
Lack of appropriate diagnostic facility Very few centers devoid of required facilities are available.
Lack of data on disease prevalence Poor working of Epidemiological section. No culture of upto date reporting by field staff
Shortage of drugs / medicines in public There is shortage of drugs and vaccines in the
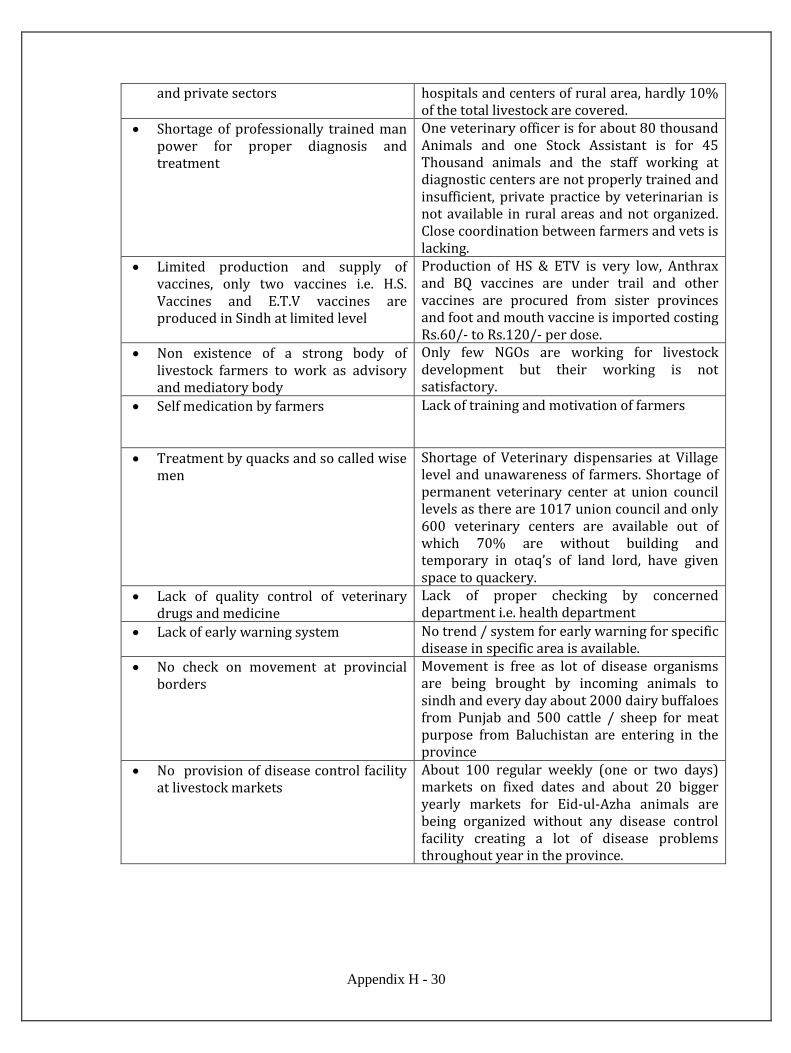
Appendix H - 30
and private sectors hospitals and centers of rural area, hardly 10% of the total livestock are covered.
Shortage of professionally trained man power for proper diagnosis and treatment
One veterinary officer is for about 80 thousand Animals and one Stock Assistant is for 45 Thousand animals and the staff working at diagnostic centers are not properly trained and insufficient, private practice by veterinarian is not available in rural areas and not organized. Close coordination between farmers and vets is lacking.
Limited production and supply of vaccines, only two vaccines i.e. H.S. Vaccines and E.T.V vaccines are produced in Sindh at limited level
Production of HS & ETV is very low, Anthrax and BQ vaccines are under trail and other vaccines are procured from sister provinces and foot and mouth vaccine is imported costing Rs.60/- to Rs.120/- per dose.
Non existence of a strong body of livestock farmers to work as advisory and mediatory body
Only few NGOs are working for livestock development but their working is not satisfactory.
Self medication by farmers Lack of training and motivation of farmers
Treatment by quacks and so called wise men
Shortage of Veterinary dispensaries at Village level and unawareness of farmers. Shortage of permanent veterinary center at union council levels as there are 1017 union council and only 600 veterinary centers are available out of which 70% are without building and temporary in otaq’s of land lord, have given space to quackery.
Lack of quality control of veterinary drugs and medicine
Lack of proper checking by concerned department i.e. health department
Lack of early warning system No trend / system for early warning for specific disease in specific area is available.
No check on movement at provincial borders
Movement is free as lot of disease organisms are being brought by incoming animals to sindh and every day about 2000 dairy buffaloes from Punjab and 500 cattle / sheep for meat purpose from Baluchistan are entering in the province
No provision of disease control facility at livestock markets
About 100 regular weekly (one or two days) markets on fixed dates and about 20 bigger yearly markets for Eid-ul-Azha animals are being organized without any disease control facility creating a lot of disease problems throughout year in the province.

Appendix H - 31
Unavailability of disaster Management programe for livestock in case of any natural calamity
It has been observed that after every 5-6 years there is heavy drought in arid areas heavy rains, floods, earthquakes. Cyclones in irrigated and coastal areas creating lot of mortality and disease problems in Livestock of whole province but there is no any disaster management programe to provide relief and rehabilitation for livestock in Sindh.
Lack of mobility with field workers Hardly 30% of the field workers are having mobility and rest are without mobility and it is very difficult for them to visit farmers far-flung scattered areas for provision disease control measures to their livestock even at many places mobile units, DO Livestock, senior officers responsible for disease control (vaccination & diagnostic work) are without mobility, which has created lot of disease problems in the province.

Appendix H - 32
No trend for keeping record of disease control measures by livestock farmers.
Livestock farmers are not keeping record of disease control measures carried out at their livestock. Even many commercial farmers are not keeping proper record neither field veterinarians are giving much importance to record keeping. Therefore farmers are unable to arrange for regular vaccination, drenching to their livestock on proper schedule. Always they carry out disease control measures after heavy losses due to disease outbreaks, in their livestock
Lack of research on disease control
There is no culture of research on any aspect of Livestock Development Scientist university professors are the opinion that the efficacy of vaccines and drugs is lowered due to mutation of organisms. Resistance of animals indiscriminate use of drugs and vaccines
Shortage of Cool chains at field Quality of vaccines are maintained if they are kept at required temperature upto use at field level. Storage should have provided deep freezers (Large) hospital dispensaries, equipped mobile units / center with refrigerators and field workers with coolers and thermos flasks. Researchers are of the opinion that even bacterial vaccines are required to be kept at 4 °c (producing better results).

Appendix H - 33
3.2 WHAT SHOULD BE THE STRENGTHENED OR NEWLY DEVELOPED TO MAKE THE SYSTEM FUNCTIONAL
A STRENGTHENING OF EXISTING SYSTEM i. DISEASE REPORTING SYSTEM
Disease reporting is very weak, either the disease reports are ignored by the farmers due to
his illiteracy or far away from the field veterinarians or by field staff due to unknown reasons. Only
progressive farmers of rural areas & farmers of the commercial dairy colonies & vet Officers
working in those areas are sending Disease out breaks through E.D.R form (Epizootic disease
reporting) a semi complicated farm which can be simplified.
It is essential that in rural areas from every big village or bunch of smaller villages having
population of 5000 animals a livestock disease report Activist/ Reporter be selected / deputed to
report disease out breaks promptly. A stock Assistants if available in the area or a progressive
farmer / his son of the area with some education may be selected and trained regarding diseases,
symptoms of disease, on the pattern of CLEW and WLEW Punjab chapter of result of 2 SLSP and
report writing on simple proforma in local language devised for the purpose. The person selected
should be assigned other social activities like cattle shows motivation of livestock farmers for
vaccinating their livestock & and provide publicity to development schemes to become familiar &
popular in area. Carry out simple treatment deworming, vaccination in case of emergency. Two
hundred Activist will be sufficient for rural or far flung area (not nearer to Taluka HQ). They may be
paid some salary plus some amount on each correct report and plus stationery, proforma and
expenses they made on the report Every year in December or June Best Activist should be awarded
through a ceremony so that every activist should perform as best worker.
ii. UP GRADATION OF DISEASE DIAGNOSTIC FACILITIES:
C.V.D.L Tando jam and six sub centers may be upgraded by providing required facilities and in first
phase new sub centers at Jacobabad and Sanghar district may be established to provide disease
diagnostic facilities to the farmers of far-flung areas (new sub centers are required to be established
at all remaining districts or the staff and facilities may be increased at nearby existing sub centers
so that it is able to provide required services to other district).
At C.V.D.L Tando jam along with existing Facilities, provision for strengthening of pathology
section especially histopathology and for diagnosis of viral fungal and Haemoparasites may be
included with required trained staff and equipments, antigens etc. Epidemiology section may be
activated and up graded well equipped and well staffed so that it is able to carry out
epidemiological studies in whole province of Sindh.

Appendix H - 34
Six existing sub centers may be up graded well equipped and well staffed so that they are
able to carry out diagnosis for parasitic diseases and for collection of samples for submission to
C.V.D.L for processing Diagnosis of other diseases. At least two new sub centers at Jacobabad
(Provincial border) and Sanghar (Indian border) presently out of reach from the other centers may
be established, to carry out parasitic disease diagnosis work and sample collection work. There is
heavy load of work on sub centre Mithi due to very big area (22000 KM) and larger L/S population
(more than 4.2 Million) required to be upgraded at the level of Research centre for Arid zone with
mandate of parasitic & Bacterial disease diagnosis & research on the disease & control.
iii. AVAILABILITY OF HIGH QUALITY VACCINE
The important tool for disease control is Quality vaccine, against all viral, bacterial and
P.P.L.O disease.
The capacity of existing vaccine center at Tando Jam be increased and expanded, so that at
least it should fulfill the requirement of vaccines, for all viral, and P.P.L.O and Bacterial diseases and
antigens like tuberculine brucelline and jhonine etc. The requirement of each vaccine for the
province is about 40.0 million doses every year with 10% increase per year.
As far as FMD vaccines is concerned Trivalent vaccine (A.O. Asia-I) produced by
Lahore is not liked / not used by commercial farmers very few are using due to lesser cost may be
commercial farmers are more quality conscious about 75 to 80% are using imported vaccines
costing Rs.60/- to 120/- per dose, which seems to be costly. Annand Dairy Cooperative Society
India with assistance of Indian Government has arranged with multinational company Merial for
two items they have established the production labs / factory at India and producing / providing
FMD vaccine and imizole (control of Haemo paraties) in Friesian cattle and local herd within
Rs.20/- per dose both, which has given boost to the dairy industry specially pure Friesian cattle
same type arrangements are advised to be taken in Sindh for whole country by collecting seed from
LCC Karachi for production of vaccine.
iv UP GRADATION AND ESTABLISHMENT OF TRAINING CENTERS:
Training centre at T.M khan farm may be up graded to provide training to farmers , diseases
reporter / Activist (male and female) and provide training to the field officers i.e. VO and S.A’S
regarding for disease control.
Two more training centers with facility of hostel to accommodate about 50 farmers, well equipped
may be established at Sukkur and Mithi to provide training facilities to L/S of the area. From

Appendix H - 35
training centers publicity and awareness programmes be initiated through media audio video
equipment with special daily one hour programme in sindhi and urdu on radio and TV regarding
disease control in L/S for providing awareness to the farmers for avoiding self medication, quack’s
treatment and awareness regarding preventive vaccination from veterinary department and
management of sucklers and calves / kids
v) INCREASE DISEASE CONTROL CENTERS IN RURAL AREAS / COOL CHAIN UPTO FIELD.
The number of veterinary centers mobile units VO’s and S.A’s may be increased at least by
Double specially in rural, Arid and semi arid area’s so that farmers reach to the veterinary centres is
easy and accessible. All the diseases control centres old and newly opened may be provided with
required inputs including cool chains for centres and field worker to maintain the quality of
vaccines / drugs.
vi) STRENGTHING OF EPIDEMOLOGICAL SECTION
Epidemiology section of CVDL may be well staffed, well equipped so that it is able to carry
out cross sectional and longitudinal and other technical surveys of diseases in Livestock and Data
may be well circulated to all the Directorates, Director General Livestock and to Secretariat and
Livestock Division Federal Government so that planning for future development is carried out
effectively.
vii) (PROVISION OF MOBILITY TO THE WORKERS RESPONSIBLE FOR DISEASE CONTROL) All officers responsible for disease control measures at Directorate level, at, district level at
diagnostic centers veterinary dispensary and veterinary centres level should be provided with
mobility for visiting farmers of far flung areas easily in connection with providing disease control
measures. Supervising and monitoring officer may be provided, with four wheel drive vehicles and
field worker with motorcycles.
B. NEW EDITION
i. RESPONSE TO DISEASE REPORT
Rapid response team consisting of One VO and Two S.A’s may be established at district HQ
under district Officer Livestock to immediate rush at the village on receiving the disease outbreak
reports visit affected farms and village animals, segregate sick animals from healthy, arrange
collection of samples / Morbid Material treatment of ailing animals / proper disposal of dead
animals, vaccination through concern officer with the assistance from Director vet res Tando Jam
and DO Livestock of the District after receiving report from the lab; and guide the farmer of area for

Appendix H - 36
checking the movements of outgoing and incoming animals, and provide publicity to neighboring
farmers for the purpose.
ii. INTRODUCTION OF EARLY WARNING SYSTEM
An affective early warning system for specific disease in specific areas be introduced and
provided wide publicity to create awareness amongst farmers so that they are able to protect their
animals, well in advance.
iii. DISEASE CONTROL FACILITY AT LIVESTOCK MARKETS
All the animals entering in regular livestock markets & special markets like Eid-ul-Azha
Markets should be provided with Disease control facilities through a newly established
directorate of Livestock marketing, and the control of Livestock markets may be transferred to
Livestock Department through a regulation and newly established Directorate should run the
markets by providing other required facilities as there are about one hundred regular market on
fixed spots and about twenty L/S Markets during Eid-ul-azha (yearly) for bigger cities like Karachi
Hyderabad and Sukkur or L/S department should provide disease control measures at cattle
markets through own resources or through a developed project.
(Dr. Zulfiqar FAO National consultant FMD (2003) highlighted the probable links between
gathering of animals through movement and seasonal stress with the disease incidence.) Director
General Livestock Extension Punjab is of the same view that viral disease like FMD and PPR are
prevailing throughout year causing heavy losses only due to cattle piri’s.
iv) ESTABLISHMENT QUARANTINE STATION.:
To check the movements of animals entering in province from other provinces a quarantine
station may be established well equipped well staffed to accommodate sufficient number of dairy
Animals at Rohri / Sukkur / Karachi.
v) FORMATION OF SINDH CHAMBER OF LIVESTOCK( NEW PRIVATE SECTOR ADVISORY BODY):
To look after the problems of L/S farmers and stake holders Like feed and fodder supplier
milk dealers processing and retailers, medicines distributor transporter’s livestock and meat
tradders cattle piri’s holders slaughter houses holders L/S dairy farmers association N.G.O’s,
consumers, officers of livestock department and local government, An Advisory body may be
established in private sector with some infrastructure assistance from public sector up to level of
district in first phase than upto level of union councils to deal solve all disease control and other L/S
Appendix H - 37
development affairs, and coordination / mediation of farmers with public sector on the pattern of
Sindh Chamber of Agriculture.
vi) PRIVATIZATION OF VETERINARY SERVICES:
There are more than one thousands jobless veterinary graduates, in Sindh and it is very
difficult for the public sector to utilize all jobless vet graduate, on other hand there is utmost
requirement of more vet graduates to be involved in the sector specially to carry out disease
control measure in L/S of far flung areas and increase the covering percentage. In Arid Areas
especially Mithi District there are 17 posts of VO in public sector and 12 VO (12 clinics) in private
sector Thar Deep NGO one VO has to look after more than 150000 animals, which is larger number.
On the pattern of Afghanistan privatization of veterinary services a donor project, in Sindh may be
started through a assisted project to carryout Veterinary services in private sector in organized way.
On about 20,000 animals (50% large+ 50% small) one vet officer after proper training be
earmarked an area and provide with one motor cycle and required daily use equipments drugs
and vaccines etc, to carry out practice and charge fixed amount per treatment, deworming
vaccination etc from a fixed place named as Private vet center / Clinics. He should keep proper
record with him and report to D.O L/S of the district progress report, disease outbreaks work done
on regular basis. The project may continue supply all required items like instruments, drugs,
vaccines etc for Disease control free of charge plus some monthly salary at least for six months or
one year, till he is popularize in the area as private practitioner and after that he should go on
purchase these items from the income Revolving funds and continue his practice at his own in this
way farmers of far flung areas will get more vet facilities , save their animals from quacks Daho’s
and on other hand jobless veterinarian will get employment.
vii) PROVISION OF DIPS IN SHEEP / WOOL AREAS
Dips alongwith required medicines demonstrations and training be provided in Arid Areas
to control Ecto Parasites in small ruminants and production of high quality wool, hairs and skin.
VIII REASEACH ON DISEASE CONTROL OF LIVESTOCK
Research component is lacking for livestock development in the department Research work
may be started on various components of disease control by up gradation the post of Director
Veterinary research to the level of DG VET research with coordination of veterinary faculty of
Sindh agriculture University Tando Jam so that disease control work is carried out smoothly on
scientific grounds, and the production is increased.

Appendix H - 38
XI CREATION OF DISEASE FREE ZONE
Efforts may be carried out to carry out disease control work in such a way in isolated areas
zones like coastal area or desert area to create disease free zones.
X DISASTER MANAGEMENT FOR LIVESTOCK
To face any disastrous situation in livestock, due to flood, heavy rains, earth quakes,
drought, cyclones etc. a project/ program to provide relief and rehabilitation measures for livestock
on permanent basis is to be established.
As always disease problems mainly due to drought in desert area / heavy floods / rains in
irrigated & coastal areas is spreading very fast in other areas of the Sindh as there is no any
checking on movement of livestock in the province.
XI) PROVISION OF HEALTH CARDS BY A.H DEPT TO THE FARMERS:-
To keep the proper record of disease out breaks, treatment of animal prevention vaccination, drenching and sample collection etc. L/S farmers may be provided with HEALTH CARDS for keeping proper record, which will remind them and field veterinarian for due dates of prevention vaccination and drenching along with pamphlets on disease occurring in the area with symptoms, treatment prevention measure etc for the awareness of farmers.
XII) INITIATIVES FOR DISEASE CONTROL OF CALVES / KIDS A program for control of disease in calves, kids and lambs may be started with special
attention to commercial dairy colonies and Arid Areas, along with provisions of Milk replacer at
reasonable rates and training of farmers on rearing of calves / kids / lambs.
XIII) DEMONSTATIVE PUBLICITY FILMS
Awareness of farmers regarding disease control in livestock related topics. Demonstrative
films may be prepared on area livestock farms locally in Sindhi and Urdu along with interviews of
the progress in farmers for the training publicity of farmers so that they are able to carry out
proper disease control practices.
XIV) MONITORING & EVALUATION OF WORK DONE
Monitoring work at departmental level is very poor working of Directorate of planning &
monitoring cell may be activated, and one senior VO (newly created) may be posted as District.
Monitoring officers under directorate with to carryout physical / general monitoring of
developmental and non-development activities at ground / village level.
Technical monitoring of disease control work is essential which should be carried out by
Directorate of Veterinary Research, Tando Jam with coordination of Animal health and Directorate
Appendix H - 39
Monitoring, the blood samples may be collected from the vaccinated animals and checked for
immunity titre to check the vaccination done and quality of vaccine.
4. OUTBREAK OF DISEASE
4.1 REGULATION IN THE COUNTRY
IN PAKISTAN FOLLOWING REGULATIONS ARE EXISTING REGARDING DISEASE CONTROL:-
ANIMAL HEALTH
i. Glanders and Farcy Act, 1899
ii. Sindh Glanders and Farcy Rules 1921
iii. South African Horse sickness Rules, 1959
iv. Dourine Act, 1910
v. Punjab Dourine Rules, 1952
vi. Sindh Cattle (Contagious Diseases) Rules, 1949
vii. NWFP Animal Contagious Disease Act, 1948
viii. Bye-laws for Registration and Control of Dogs and Preventive of Rabies, 1979
GLANDERS AND FARCY ACT, 1899
Substituted by the Central Laws (Status Reform) Ordinance, 1960 and extends to whole of
Pakistan. It also includes South African Horse Sickness through the Notification of the
Government of West Pakistan in 1959. It is a comprehensive Act and covers all aspects of
the infections.
The provinces of Punjab and Sindh made Rules under this Act. But the Rules framed
by Punjab in 1908 were superseded by the South African Horse Sickness Rules 1959.
However, the Sindh Glanders and Farcy Rules, 1921 are still in force.
Any animal found positive has to be destroyed.
SINDH GLANDERS AND FARCY RULES, 1959
It has been framed under the Glanders and Farcy Act, 1899 and applies to the whole of
Sindh except to the city and port of Karachi.
WEST PAKISTAN AFRICAN HORSE SICKNESS RULES, 1959.
Now extends to all the 4 provinces of Pakistan under Articles 19 of President’s order No.1 of
1970.
Appendix H - 40
DOURINE ACT, 1910
Extends to whole of Pakistan and appears fairly comprehensive. Any animal found
positive has to be destroyed.
SINDH CATTLE (CONTAGIOUS DISEASES) ACT 1948.
As the title suggests this Act extends to all parts of Sindh and is fairly comprehensive.
It empowers the veterinary officer under the Act to compulsorily vaccinate animals against
a contagious disease, mark the animals and penalize those owners who refuse vaccination
of their animals. It also empowers the government to regulate inter and intra provincial
movement of livestock to prevent spread of contagious disease. It can also establish
movement of livestock to prevent spread of contagious disease. It can also establish
quarantine stations and if necessary carryout compulsory vaccinations of the quarantined
animals. The government can also control holding of livestock markets, fairs and traffic of
animals. Livestock owners are also obliged under this Act to report the incidence of
contagious disease to the nearest veterinary hospital. Schedule of disease are 1. Rinderpest
2. H.S 3. Anthrax 4. BQ 5. Contagious abortion & 6. TB.
SINDH CATTLE (CONTAGIOUS DISEASES) RULES, 1949
These Rules have been framed under the Sindh Cattle (contagious Diseases)
Act,1948. It mainly clarifies and details some aspects of the Act like declaration as infected
area, period of detention in a quarantine, charges for animals under detention, exercise of
powers by the veterinary officers, disposal of animals destroyed etc.
NWFP ANIMAL CONTAGIOUS DISEASES ACT, 1948
It is essentially very similar to the Sindh Cattle (Contagious Diseases) Act, 1948.
Therefore, the provisions under this Act are also exactly the same. However, the provisions
for penalties are more elaborate. Schedule of Diseases are 1.RP 2. FMD 3. HS 4. BQ 5.
Anthrax 6.TB 7. Jhone’s disease 8. Glanders 9. Epizootic Lymphangitis 10. Dourine 11.
Rabbies 12. Surra
BYE LAWS FOR REGISTRATION AND CONTROL OF DOGS AND PREVENTION OF RABIES,
1979
It only extends to the Taxila Cantonment. These provisions now exist under the
Local Government Ordinance, 2001 (sixth Schedule).
OUTLINES OF THE PROPOSED SINGLE COMPREHENSIVE LEGISLATION ON ANIMAL
HEALTH (UNDER SLSP)
An act to prevent and control contagious diseases and regulate import, export and
quarantine of animals and animal products.
1. Short title, extent and commencement.

Appendix H - 41
(i) This Act may be called the Pakistan Animal health Act, 2006.
(ii) It extends to the whole of Pakistan
(iii) It shall come into force at once.
2. CHAPTERS
I. Notifiable Diseases
II. Surveillance and Monitoring
III. Animal Movement
IV. Import, Export and Quarantine.
3. This Act to over-ride all other laws in the subject.
4. Definitions
Act, animals, Animal Products, Notifiable Disease, Contagious Disease, Infection, Carcass,
Fodder, Little, Veterinary Inspector, Inoculation, Health Certificate, Prescribed, Local
Authority, Head of the Department, Import and Export, Points of Entry, Quarantine,
Quarantine Officer (Under process of approval) with livestock division
Regulations for control of contagious diseases are there can be enforced when
required.
In case of disease outbreak of any contagious nature farmers cooperate fully with the V.O of
the area and other officers to carry out diseases control measures, sometimes by force.
The provincial department of livestock is mandated to provide treatment and
vaccination for the prevention of infectious diseases along with other Livestock
development activities. This department has a network of veterinary hospital,
dispensaries and veterinary centers. Throughout the province at district, taluka and
union council level. However, there is acute shortage of technical staff and funds

Appendix H - 42
4.2 QUESTION 2:
When the outbreak of disease occurs, how has the Livestock department dealt with the situation
Based on the experience, when there is an outbreak, the area V.O on information through
stock Assistant of the area or through media or other source, visiting area attending disease
outbreak, segregate. Sick animals, from healthy treat sick animals symptomatically issue EDR
mentioning the facts and history of the disease to DO Livestock and Director Animal husbandry
Hyderabad Sindh and with the help of C.V.D.L staff collect samples / morbid material for diagnosis
and on their advice carry out further treatment of sick and vaccination to healthy animals and
animals of willing farmers in the village, and V.O or S.A are visiting regularly at least three times till
the disease is subsided. If the disease outbreak is not controlled and continued for some time, help
from provincial Directorate of Animal Husbandry Hyderabad and Veterinary Research Tando Jam
and National Veterinary Lab: Islamabad is requested, and research team of National Vet. Lab
Islamabad is visiting recording the facts of disease and collecting samples morbid material for
diagnosis and guiding for disease control measures accordingly.
Hardly 10-15 percent of progressive farmers of commercial sector and veterinary field staff
working in that area are reporting disease out breaks promptly & getting proper disease control
assistance from the department. Animals of the rest farmers are almost unattended and at the risk
of disease.

Appendix H - 43
4.3 IMPORTANT LIVESTOCK DISEASES PREVALENT IN SINDH
BASED ON
1- Interviews 2- Epidemiological Survey 3- Diagnostic reports
AREA: ARID AREAS (DESERT)
S# Specie Season/Month Infections (Viral & Bacterial)
Remarks
VIRAL
1. Bovine, Ovine &
Caprine
i. November, December &
January ii. July & August
Foot & Mouth Disease 1. About 25% Herds are affected 2. Morbidity a. Cattle : 10-15% b. Calves : 50% c. Kids : 40-50% d. Lambs : 40-50% 3. Mortality a. Adult : 1-2 % b. Calves : 10% c. Kids : 50-60% d. Lambs : 40-50% 4. Abortion in goats and sheep.
Note: FMD is causing losses annually of Rs.1.82 Billion (2004). But from the PDS report it has been observed that HS & Mastitis in commercial and other area also causing heavy losses.
Vice Chancellor Veterinary and Animal Husbandry Lahore informed that they have developed a Bivalent oil vaccine for control of FMD and HS giving immunity for one year cost is Rs.30/- per dose. Main reason of FMD was said to be stress of drought and winter (Cold weather)
2. Ovine & Caprine Oct to January i. Pesti, Des petites
Ruminants (PPR)
1. About 25% herds are affected 2. More out breaks in goats than
sheeps. 3. Morbidity : 100% 4. Mortality a. Goat : 20 – 25% a. Sheep : 25% b. Kids : 50-60% c. Lambs : 40-50%
Main reason was said to be stress of drought and winter Oct to Dec ii. Goat Pox & Sheep Pox 1. 10-15 % Herds are affected
2. Morbidity a. Adults : 05-10% b. Kids : 10-20%

Appendix H - 44
c. Lambs : 10-15% 3. Mortality b. Kids : 02-05% c. Lambs : 02-05%
BACTERIAL
3. Ovine & Caprine July to Sept
Mainly after rains
Enterotoxaemia 1. About 20-30 % herds are affected
2. More outbreak in goat than sheep. 3. Morbidity a. Goat : 50-60% b. Sheep : 30-40% c. Kids : 30-40% d. Lambs : 30-40% 4. Mortality a. Adults : 10-15% b. Kids : 20-30% c. Lambs : 20-30%
4. Ovine & Caprine April to July Anthrax 1. Outbreaks in i. Mathi – 3 UC’s ii. Diplo – 2 UC’s iii. Nagarparkar – 1 UC iv. Chachtro- 1 UC
2. Herds affected 50-60% 3. Morbidity – 90%
i. Adult 50-60% ii. Kids / Lamb 50-60%
4. Mortality i. Adult 10-20% ii. Kids / Lambs 30%
Mainly due to injuries in mouth after eating fruits & leaves of tree (khabar)
6. Bovine June & July
Dec & January
Hemorrhagic septicemia 1. Barrage area of Diplo and Mathi 2. Herds affected 20-30% 3. Morbidity (Adult and Calves) –
60% 4. Mortality (Adult and Calves) –
10% 7. Camel Dec & January Pneumonia (Bleeding
from nostrils)
Pasteurellosis
About 5000 Camels were affected with pneumonia 3 died. Treatment with antibiotics was satisfactory
First time Pasteurellosis was diagnosed in Camels in Sindh and Cholistan (Punjab)
8 Bovine & Caprine Round the year Mastitis About 10-20% herds are affected Morbidity Cattle 10-20% Goat 20%
Due to Quack’s treatment, mostly one teat is lost than animals are sold / slaughtered.
9. Ovine & Caprine Oct to January Contagious Pleuro
Pneumonia (CPP)
1. About 50% Herds are involved. 2. Morbidity – 40% 3. Mortality –

Appendix H - 45
i. Adult 10-20% ii. Lambs / Kids 30-40%
PARASITIC INFESTATION 10 Camel / Goat /
Sheep / Cattle
Round the year 1. Flukes
2. Roundwarms
3. Ticks
4. Mange & mites
5. Trypano somiasis
6. Theliariasis
While interviewing RO Mithi and checking the work done report 2009-2010 sub center diagnostic Lab Mithi out of 3310 positive samples 3230 samples were positive of parasitic infestation and only 80 were positive of other disease i.e. anthrax -17, entrotoxaemia-17, FMD-28, HS-18, which is evident of larger number of animals are infested with parasites.
COMMERCIAL DAIRY COLONIES KARACHI / HYDERABAD
VIRAL DISEASE
Bovine Nov, Dec, January, July & August
FMD From 12 to 13 lacs animals about 50 to 60% are affected inspite of preventive vaccination by Aftovax (A.O asia-I) Aftibin (A.O) FMD Lahore (A.O asia-I) (Rus) A.O Asia-I. No immunity was created. Losses Occurred
i. 50% Milk Production reduced ii. Abortion in 100% advance
pregnant buffaloes. iii. Mortality in Suklers-60to70% 4-5
months calves 10%-20%
Note:- It was informed by DO Livestock Karachi & VOLCC Karachi that FMD has spread after Eid-ul-Azha Market
Scientist of National Lab Islamabad are of the opinion that mutation is type ‘O’ has occurred. The second opinion is that previously (5-6 years back) Iranian FMD vaccine was used at commercial colonies Karachi may be some Iranian type virus has created problems. For confirmation samples have been collected and sent to Pir Bright (Viral Reference Lab). A senior dairy farmer of LCC Karachi Haji Sikandar Ali Nagori and his friends are using FMD vaccine of VRI Lahore, since 12-15 years there is no outbreak of FMD at their farms, but their sanitary condition and other managemental conditions are excellent. It is presumed that management has to play an important role in controlling and spreading FMD outbreaks.
Bovine Dec January Buffaloe Pox / Cow Pox 30-35% wara’s from 6000 wara’s are affected Morbidity 40% no Mortality production reduced by 10% pustules on hands of Gawalla in below 25years age. Disease spread through gawallas subsided in march automatically but the farmer has to check secondary infection.
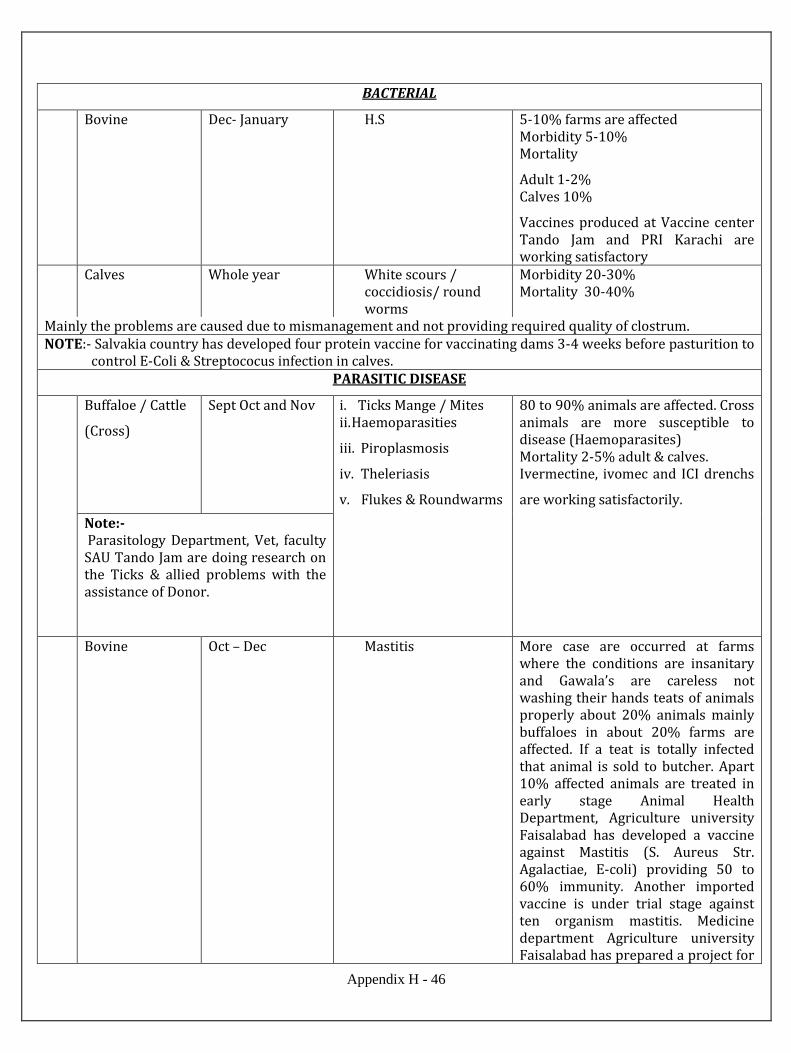
Appendix H - 46
BACTERIAL
Bovine Dec- January H.S 5-10% farms are affected Morbidity 5-10% Mortality
Adult 1-2% Calves 10%
Vaccines produced at Vaccine center Tando Jam and PRI Karachi are working satisfactory
Calves Whole year White scours / coccidiosis/ round worms
Morbidity 20-30% Mortality 30-40%
Mainly the problems are caused due to mismanagement and not providing required quality of clostrum. NOTE:- Salvakia country has developed four protein vaccine for vaccinating dams 3-4 weeks before pasturition to
control E-Coli & Streptococus infection in calves. PARASITIC DISEASE
Buffaloe / Cattle
(Cross)
Sept Oct and Nov i. Ticks Mange / Mites ii. Haemoparasities
iii. Piroplasmosis
iv. Theleriasis
v. Flukes & Roundwarms
80 to 90% animals are affected. Cross animals are more susceptible to disease (Haemoparasites) Mortality 2-5% adult & calves. Ivermectine, ivomec and ICI drenchs
are working satisfactorily.
Note:- Parasitology Department, Vet, faculty SAU Tando Jam are doing research on the Ticks & allied problems with the assistance of Donor.
Bovine Oct – Dec Mastitis More case are occurred at farms where the conditions are insanitary and Gawala’s are careless not washing their hands teats of animals properly about 20% animals mainly buffaloes in about 20% farms are affected. If a teat is totally infected that animal is sold to butcher. Apart 10% affected animals are treated in early stage Animal Health Department, Agriculture university Faisalabad has developed a vaccine against Mastitis (S. Aureus Str. Agalactiae, E-coli) providing 50 to 60% immunity. Another imported vaccine is under trial stage against ten organism mastitis. Medicine department Agriculture university Faisalabad has prepared a project for

Appendix H - 47
control of HS and Mastitis, sent to PARC for funding.
OTHER IRRIGATED AREAS VIRAL DISEASE
Bovine
Ovine & Caprine
Dec – Jan July & August
FMD
PPR
10-20% herds involved Morbidity 30 to 40% More production losses. Mortality in calves 10-20% 1. More outbreaks in goat than sheep 2. Morbidity adult 80% Lamb /kid
90% 3. Mortality Adult 10%, Lamb/ Kid
20-30% BACTERIAL
Camel Dec & Jan Pasteurellosis Thatta & Badin 3-4 camels died. Phenumonia Bloody discharge treatment with Antibiotics gave response.
Bovine June July Dec Jan
HS Morbidity 30%
Mortality Adults 10%
Calves 15-20% Ovine & Caprine June & July Entrotoxaemia Morbidity 40%
Mortality 20%
Ovine & Caprine Dec & Jan CPP Morbidity 30%
Mortality 20%
Bovine June / July Black quarter Outbreaks occurring after rains
young cattle 1-2 years age are
involved.
Morbidity 10%
Mortality 15-20%
Treatment with Antibiotics giving
satisfactory results.
PARASITIC INFESTATION Bovine
Ovine & caprine June July Ticks Mange, Mites,
Fascialiasis, Round worms, babesiasis, coccidiosis & Theleriasis
Mainly after rains more outbreaks at
farms whose floor is wet (No sunlight
and fresh air) Both adult and claves /
kids involved.
Further Directorate of vet Res CVDL Tando Jam has carried out research work and diagnosis of Zoonotic disease
(Public health importance)

Appendix H - 48
In year 2010-2011 have collected samples from seven districts of the Sindh Province including desert and
commercial dairy farming diagnosis work carried out at CVDL Tando Jam
Source: Discussion with Director General, Livestock, Director Animal Husbandry, Disease Investigation Officer, NGOs of the concerned areas and District Officer of the concerned Districts.
SAMPLES COLLECTED
NAME OF
DISTRICT
BRCELLA ABORTUS
B.MELITENSIS TUBERCULOSIS ANTHRAX
Karachi 447 0 10 0
Tharparkar 439 1004 10 6
Hyderabad 472 0
Tando Allahyar 128 540
N. Feroze 23 0
Larkana 207 0
Dadu
Total 2110 1753 20 6
Source: Director Veterinary Research Central Veterinary Diagnostic Lab Tandojam
NO. OF SAMPLES EXAMINED
NO. OF SAMPLES
POSITIVE
PERCENTAGE
B. Abortus 2110 582 27.58
B. Melitensis 1753 21 1.19
T.B 20 4 20
Anthrax 6 6 100
Source: Director Veterinary Research Central Veterinary Diagnostic Lab Tandojam
The work is important from Public Health point of view, may be extended in whole Sindh by producing Antigen for sensitivity test against all diseases including Jhone’s Disease at Sindh Vaccine Center Tando Jam.

Appendix H - 49
SUMMARY
Disease control and maintenance of health of animals is directly related to economic
productivity of livestock. Diseases may cause heavy financial losses to livestock farmers because of
high morbidity and mortality of many prevalent diseases in Sindh and higher percentage of animals
at risk (over 85% animals are without vaccination cover). During outbreaks many animals either
die or are made less productive due to the diseases. Healthy animals convert feed more efficiently
while diseased animals produce less and become uneconomical. Thus, diseases can be ranked as
one of the most important factors. The main reasons of disease outbreaks in the area are stress
caused by drought (malnutrition), Heavy rains, cyclones and heavy floods, insanitary conditions,
winter & summer season, congestion overcrowding, long duration transportation (Livestock piris).
RECOMMENDATIONS
A Well strengthened well coordinated research based disease control program for livestock
is to be initiated in Sindh with active disease reporting, rapid response in connection with diagnosis,
supply of quality inputs for treatment deworming and vaccination, awareness and training of
farmers with intention to create few small scale disease free zones,
The disease control strategy should be “prevention is better than cure” vaccination against
all diseases and deworming should be free of charge in first year then on 50% charges up to project
period. The treatment should be on charge basis (cost of patent medicines drugs on company rates,
from a store at Hospital Level) except simple treatment, which should be free.

Appendix H - 50
LIST OF ABBREVIATION
SR#
1. NGO Non Governmental Organization
2. VET Veterinary
3. CVDL Central Veterinary Diagnostic Laboratory
4. PPR Pestides Petitis Ruminants
5. HS Hemorrhagic Septicaemia
6. FMD Foot & Mouth Disease
7. E. COLI Escherichia Coli
8. PDS Participatory Disease Surveillance
9. GCP Government of Pakistan
10. EC European Commission
11. SLSP Strengthening of Livestock Services Project
12. TAD Transboundary Animal Diseases
13. OIE Office of International Epizootics
14. VRI Veterinary Research Institute
15. DG Director General
16. RES Research
17. TAD INFO Transboundary Animal Disease Information
18. VO Veterinary Officer
19. RO Research Officer
20. FATA Federally Administrated Tribal Agency
21. ICT Islamabad Capital Territory
22. NWFP North Western Frontier Province
23. BTN Baluchistan
24. AJK Azad Jammu & Kashmir
25. LS Livestock
26. PVMC Pakistan Veterinary Medical Council
27. EPI UNIT Epidemiological Unit
28. GPS Global Positioning System
29. UPS Uninterrupted Power Supply
30. SA Stock Assistant
31. CLEW Community Livestock Extension Worker
32. WLEM Women Livestock Extension Worker
33. PCS Personal Computer System
34. CCPP Contagious Caprine Pleuro Pneumonia
35. ET Entero Toxaemia
36. CPD Contagious Pneumonia Disease
37. BQ Black Quarter
38. S/GOAT POX Sheep Pox / Goat Pox

Appendix H - 51
39. Buff Buffaloe
40. LFD Liver Fluke Disease
41. FPMU Federal Project Management Unit
42. DVM Doctor of Veterinary Medicine
43. FAO Food & Agriculture Organization
44. RES: REP: Resident Representative
45. AHC Animal Husbandry Commissioner
46. EU European Union
47. GOP Government of Pakistan
48. TA & DA Travelling Allowance & Daily Allowance
49. ISB Islamabad
50. MINFAL Ministry of Food, Agriculture & Livestock
51. ADIO Assistant Disease Investigation Officer
52. ADCO Assistant Disease Control Officer
53. LAB Laboratory
54. LCC KYC Landhi Cattle Colony Karachi
55. TM Khan Tando Muhammad Khan
56. ETV Entero Toxaemia Vaccine
57. DO LIVESTOCK District Officer Livestock
58. PPLO Pluro Pnuemonia Like Organisms
59. TV Television
60. TB Tuberculosis
61. EDR Epizootic Disease Reporting
62. B. Abortus Brucella Abortus
63. SE Stomatitis Enteritis
64. MAST Mastitis
65. ENDO Endoparasites

Appendix H - 52
LITERATURE REFERRED
1. K.B Mirbhar, A.M. Kalhoro, F.M. Soomro, B.M. Junejo, Livestock action plan FAO 2003.
2. Baz Muhammad Junejo, Progressive Control Of FMD in Pakistan Consultancy Report Sindh 2009-2010.
3. Baz Muhammad Junejo, M. Hussain, T.H Chandio, R.A. Dar Questionnaire Survey of Herd Health & Productivity in 1990-91.
4. Zulfiquar, National Control Strategy for F.M. Disease FAO 2005-2006.
5. Qurban Ali, National Control Strategy for PPR Disease FAO 2005-2006.
6. M. Farani Livestock Laws Manual FAO of UNO Italy 1983.

Appendix H - 53
MEETINGS / INTERVIEWS HELD
SR # NAME POST Dr. Muhammad Nawaz Vice Chancellor Vet. And AH Uni. Punjab Lahore 1. Dr. Ghulam Sarwar Shaikh Director General Livestock Sindh Hyderabad. 2. Dr. Abdullah Mewati Director Animal Husbandry Sindh 3. Dr. Aslam Pervez Umrani Director Vet Res CVDL Tando Jam 4. Mr. Shahbuddin Memon Chief Agriculture P & D Sindh 5. Dr. KB Mirbhar Professor Medicine SAU Tando Jam 6. Madam Nasreen Associate Professor of Parasitology SAU T Jam 7. Dr. Tejmal DIO Directorate of AH Sindh Hyderabad
8. Dr. Liaquat Jat ADIO / TADCO Sindh 9. Dr. Zulfiqar Bhutto VO Dev Section DG Office 10. Dr. Ghulam Hussain Dawach Deputy Project Coordination LDD Board Hyd 11. Dr. Noor Ahmed Soomro Monitoring Officer SLSP Hyderabad 12. Dr. Khadim Hussain Soomro DPD SLSP Hyderabad 13. Dr. Siraj Ahmed Eisani PD Vaccine Production Unit Tando Jam 14. Mr. Farooq Ahmed Samara Medical Store Hyderabad 15. Mr. Abdul Majeed China Medical Shotre Hyderabad 16. Haji Mohammad Aslam Dairy Farmer Cattle Colony Hyderabad 17. Mr. Naveed Malik Dairy Farmer New cattle Colony Hyderabad 18. Haji Mohammad Bux Jatoi Dairy Farmer old Cattle Colony Hyderabad 19. Haji Muhammad Yousuf Jatoi Dairy Farmer Old Cattle Colony Hyderabad 20. Haji Muhammad Haneef Dairy Farmer Old Cattle colony Hyderabad 21. Abdul Khalique Qureshi General Secretary Dairy Farmers Association Old Cattle
colony Hyderabad 22. Riaz Ahmed Abrejo Dairy Farmer Hala Hyderabad 23. Rias Iqbal Khan Jatoi Fodder Dealer old cattle colony Hyderabad 24. Dr. Zainulabadien Mandan DO L/S Badin 25. Dr. Nobat Khan Khoso DO L/S Tharparkar 26. Dr. Jaimal Dhamani Rt. Professor Vet Med. SAU Tando Jam / NGO 27. Dr. Nasruallah Panwahar DO L/S Karachi 28. Dr. A. Hafeez Shaikh VO LCC Karachi 29. Dr. Abdul Wahid Mughal Private Veterinary Practitioner LCC Karachi 30. Dr. Khushaldas Private Vet Practitioner Super highway Karachi 31. Mr. Mohammad Jameel Memon Progressive Dairy and Beef Cattle Farmer Karachi 32. Haji Sikandar Ali Nagori Ex-President Dairy Farmers Association LCC Karachi 33. Dr. Manzoor Hussain National Consultant PDS / FAO Islamabad 34. Dr. Saeed Ahmed PD SLSP Islamabad 35. Dr. DPD SLSP Islamabad 36. Dr. Mohammad Afzal Chairman PARC Islamabad 37. Mr. Naseer Ahmed Memon Chief Executive SPO NGO Pakistan 38. Dr. Ghulam Muhammad Professor Medicine Agriculture Uni. Faisalabad 39. Dr. Cal. Tariq Mustafa Vaccine Medicine Dealer 40. Dr. Irfan Zahid DG Livestock & Dairy Development Punjab 41. Dr. Liaquat Ali Director HQ Planning R/S Punjab Lahore
42. Dr. Munawar Ahmed D.S Livestock Secretariat Karachi. 43. Dr. A. Ghaffar Memon D.S Technical Livestock Secretariat Karachi.

Appendix H - 54
44. Dr. Mohan Lal Malhi Ex-EDO Agriculture CDG Karachi. 45. Dr. Rasheed Ahmed Director Disease Surveillance & Reporting Punjab Lahore 46. Dr. Ashok Kumar VO Thardeep Mithi 47. Dr. Rashid Ahmed Dar R.O Epidemiology CVDL T Jam 48. Dr. Arshad Mahmood Data Management Officer Livestock Dept Punjab 49. Dr. Khushi Mohammad Professor Microbiology Vet & AH university Lahore 50. Dr. Shabnam Dev Section Livestock Punjab 51. Mr. Ghulam Akbar Dars Progressive Livestock farmer Kunri Umerkot.
Appendix I
Marketing
(partly by local consultant)
- I-1. Information provided by the Sindh Livestock Department
- I-2. Data collected by the value chain study
I-2-1. Livestock market
I-2-2. Farm gate price of milk, beef, and mutton
I-2-3. Major Constraints of retailers of milk, beef, and mutton as well as
users of livestock
- I-3. Integrated information
I-3-1. Estimated flow of livestock
I-3-2. Government price and market price
- I-4. Production cost and farm gate price of milk in Karachi and Hyderabad
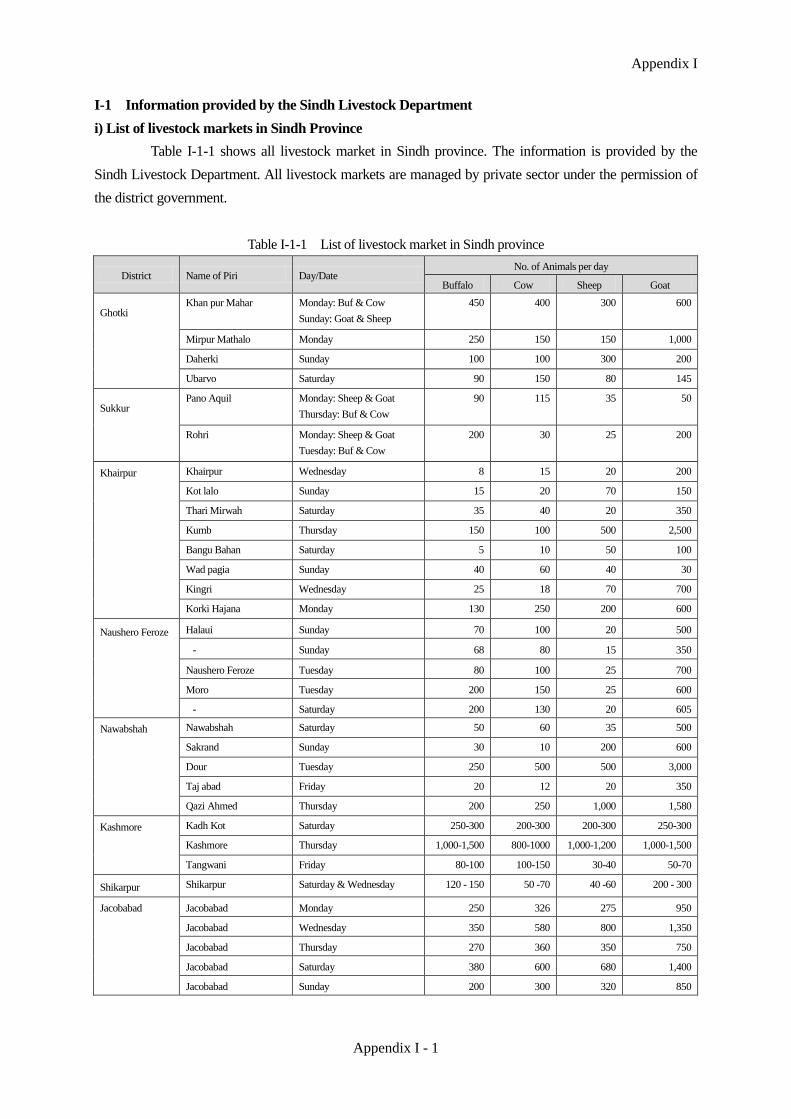
Appendix I
Appendix I - 1
I-1 Information provided by the Sindh Livestock Department
i) List of livestock markets in Sindh Province
Table I-1-1 shows all livestock market in Sindh province. The information is provided by the
Sindh Livestock Department. All livestock markets are managed by private sector under the permission of
the district government.
Table I-1-1 List of livestock market in Sindh province
District Name of Piri Day/Date No. of Animals per day
Buffalo Cow Sheep Goat
Ghotki Khan pur Mahar Monday: Buf & Cow
Sunday: Goat & Sheep
450 400 300 600
Mirpur Mathalo Monday 250 150 150 1,000
Daherki Sunday 100 100 300 200
Ubarvo Saturday 90 150 80 145
Sukkur Pano Aquil Monday: Sheep & Goat
Thursday: Buf & Cow
90 115 35 50
Rohri Monday: Sheep & Goat
Tuesday: Buf & Cow
200 30 25 200
Khairpur Khairpur Wednesday 8 15 20 200
Kot lalo Sunday 15 20 70 150
Thari Mirwah Saturday 35 40 20 350
Kumb Thursday 150 100 500 2,500
Bangu Bahan Saturday 5 10 50 100
Wad pagia Sunday 40 60 40 30
Kingri Wednesday 25 18 70 700
Korki Hajana Monday 130 250 200 600
Naushero Feroze
Halaui Sunday 70 100 20 500
- Sunday 68 80 15 350
Naushero Feroze Tuesday 80 100 25 700
Moro Tuesday 200 150 25 600
- Saturday 200 130 20 605
Nawabshah Nawabshah Saturday 50 60 35 500
Sakrand Sunday 30 10 200 600
Dour Tuesday 250 500 500 3,000
Taj abad Friday 20 12 20 350
Qazi Ahmed Thursday 200 250 1,000 1,580
Kashmore Kadh Kot Saturday 250-300 200-300 200-300 250-300
Kashmore Thursday 1,000-1,500 800-1000 1,000-1,200 1,000-1,500
Tangwani Friday 80-100 100-150 30-40 50-70
Shikarpur Shikarpur Saturday & Wednesday 120 - 150 50 -70 40 -60 200 - 300
Jacobabad Jacobabad Monday 250 326 275 950
Jacobabad Wednesday 350 580 800 1,350
Jacobabad Thursday 270 360 350 750
Jacobabad Saturday 380 600 680 1,400
Jacobabad Sunday 200 300 320 850

Appendix I - 2
District Name of Piri Day/Date No. of Animals per day
Buffalo Cow Sheep Goat
Kumber
Shahdadkot
By pass road
Naseerabad
Monday 250 150 450 350
Larkana Larkana Saturday & Wednesday 200 100 300 500
Rato Dero Thursday 100 50 100 200
Naudero Sunday 100 70 150 200
Dadu DADU Monday 200 250 200 300
MEHAR Thursday 400 600 500 700
JOHI Sunday 250 300 400 500
K . N SHAH Tuesday: Goat & Sheep
Thursday: Buf & Cow
100 150 150 200
Drigh Bala Thursday 150 200 200 400
Wahi Pandhi Friday 100 200 400 600
Jamshoro Jhangara Tuesday 200 100 200 600
Jamshoro Wednesday 10 20 100 400
Kotri Friday & Wednesday 20 100 150 700
Sann Tuesday 10 15 200 800
Bhan Tuesday 250 150 200 500
Thatta Thatta City Thursday 95 76 147 170
Mirpur Bathoro Throughout year 250 300 50 200
Mirpur Sakro Tuesday 100 200 200 3
Chuhar Jamili Tuesday 120 115 210 235
Matiari Hala First Monthly (monthly) 500 1,000 150 2,000
Tando
Allah Yar
Tando Allahyar Thursday 80 90 250 550
Usman Shah huri Wednesday 190 170 40 160
Town Chamber Tuesday 2,800 1,200 200 3,000
Hyderabad By pass piri National
Highway
Wednesday 188 275 700 1,800
T. M.Khan
Tando Sain dad Sunday 400-600 300-500 30-50 250-400
Mir Mumtaz Talpur
(old)
Regular Permanent 250-300 - - -
Dildar Tando Sain dad Thursday 100-150 50-100 50 50-100
Al- Fatah Market Near
Ayoubia Hotel
Wednesday 100-250 50-100 30 50
Badin Talhar Saturday 3,000 4,000 3,500 4,500
Dumballo Sunday 200 150 500 1,200
Nondo Sunday 100 100 400 600
Golarchi Monday 500 400 600 1,500
Shadi Large Monday 150 200 400 700
Kadhan Tuesday 350 150
Pangrio Tuesday 500 800 800 2,500
Tnado Bago Thursday 900 2,000
Haji Sanwan Thursday 300 400
Kadhan Thursday 100 150
Seerani Friday 100 100 300 400
Badin Daily Basis 200 200
Ghulam Shah Annual (27 Zulhaji) (donkey)

Appendix I - 3
District Name of Piri Day/Date No. of Animals per day
Buffalo Cow Sheep Goat
Tando Ghulam Ali Annual (11 Moharam) (camel)
Sanghar Shadad pur Monday 5,500 1,800 1,500 3,500
Khipro Monday: Buf & Cow
Tuesday: Goat & Sheep
800 5,300 3,500 6,000
Shah pur Chakar Wednesday 1,000 1,165 980 2,500
Sanghar Thursday 600 1,500 1,200 2,300
Tando Adam Saturday 2,500 4,500 2,300 4,500
MirpurKhas Mirpurkhas Tuesday: Buf & Cow
Wednesday: Goat & Sheep 250 180 60 700
Belaro Thursday 125 110 40 250
Sindhri Sunday 120 100 90 230
Kot Ghulam
Muhammad Monday 150 120 50 350
Umar Kot Bacha Band Thursday 10 15 200 300
Soofi Faqir Saturday 20 25 60 400
Cheel Band Friday 110 - - -
Kunri Saturday 70 100 50 300
Umar Kot Town Monday 0 5 100 500
Tharparker Mithi Piri. Sunday 20-30 130-170 500-700 1,500-1,800
Islam Kot pri Thursday: Buf, Cow, Goat,
Sheep
20-25 100-125 200-300 800-1,200
Wednesday: Camel Camel: 200-250 - -
Karachi Landhi Cattle Colony Wednesday to Sunday (5day
in total)
25,000
(5,000/day)
5,000
(1,000/day)
15,000
(3,000/day)
25,000
(5,000/day)
Malir Karachi Tuesday 500 1,000 2,000 2,000
Mawach Goth Hub
River Road Wednesday 4,000 2,000 5,000 8,000
Supper High way
Temorary piri for
eid-ul-azha
Once a year 500,000 800,000 1,200,000
Source: The Sindh Livestock Department

Appendix I - 4
ii) Retail price of milk, beef, and mutton determined by local government in Jan, 2011
Table I-1-2 shows market price of milk, beef, and mutton determined by local government. The
related documents from each district were collected in January 2011 through the office of director general
(DG office). The right end column indicates the dates when the prices were approved by the district
government. In case of Dadu district, the government prices of milk, beef, and mutton have not been
revised since July 2006. In some districts, the government fixed prices seem to have become pro forma.
Table I-1-2: Retail price of milk, beef, and mutton determined by local government in January 2011
District Milk Beef Mutton
Date of the document
1 Ghotki 40 160 300 2010/9/1
2 Sukkur 40 Cow: 230
Buffalo: 240 380 2010/1/10
3 Khairpur Khairpur City: 50
Other area: 40 Calf & young Buffalo: 200
Buffalo&Cow w/o bone: 220 Goat and sheep: 300
Chella: 340 2011/1/20
4 N. Feroze 42 180-200 300 – 320 2010/11/30
5 Nawabshah 40 160 230 – 250 2009/8/19
6 Kashmore 40 150 260 2009/8/22
7 Shikarpur 40 200 (buffalo) – 220 (cow) 380 2010/1/10
8 Jaccobabad 45 220 (cow) 350 2010/11/15
9 K.Shahdadkot 40 150 260 2009/8/22
10 Larkana 40 200 (buffalo) – 200 (cow) 380 2010/1/10
11 Dadu 26 (B) - 28 (A) 130 220 2006/7/10
12 Jamshoro 49 220 340 2010-2011
13 Thatta Cow: 35
Buffalo: 40 180-200
150 (sheep) – 325 – 350 (goat)
2010/8/10
14 Matiari 36 150 260 2009/8/20
15 T.Allahyar 46 180 – 190 (calf) 340 2010/8/16
16 Hyderabad 50 baffalo & cow (bara): 180
Baffalo (bachiya): 190 Cow (bachiya): 200
340 2010/5/12
17 T. M. Khan 44 Buffalo female: 170
Buffalo male: 190 female goat: 300 Young goat: 330
N/A
18 Badin 35 100 – 180 (calf) 280 2010/8/12
19 Sanghar 40 180 300 N/A
20 Mirpur Khas 44 180 – 200 350 2010/8/4
21 Umer Kot 45 180 320 2010/7/26
22 Tharparkar Cow: 30
Buffalo:40 N.A.
mutton (Halwan) (6 to 8)kg animal/ goat (kid male from 9kg
to 12kg animal) Mithi: 380/300 Diplo: 300/280
Chachro: 360/300 NPK: 360/300
2010/11/24
23 Karachi 60 220 415-440 Milk: 2010/05
Others: N/A
Source: the Sindh Livestock Department

Appendix I - 5
iii) Slaughterhouses
Table I-1-3 shows the number of recognized public slaughterhouse in Sindh. All animals
slaughtered at these slaughterhouses are all for domestic market. The information was provided by the
Sindh Livestock Department.
Table I-1-3 Recognized Slaughterhouses in Sindh During 2008-2009
No District Number of Slaughter house
1 Khairpur 3
2 Sukkur 3
3 Jacobabad 4
4 Shikarpur 2
5 Nawabshah 3
6 Noushero Feroz 4
7 Larkana 7
8 Sanghar 5
9 Tarparkar 2
10 Mirpurkhas 9
11 Dadu 6
12 Hyderabad 7
13 Badin 7
14 Thatta 6
15 Karachi 4
16 Umerkot 3
17 Ghotki 3
18 Tando Mohamed Kahn 1
19 Tando Allahyar 1
20 Matiari 2
21 Qambar/Shahdakot 1
22 Kashmore 1
23 Jamshoro 1
Total 85
Source: the Sindh Livestock Department

Appendix I - 6
I-2 Data collected by the value chain study
I-2-1 Livestock market
i) List of livestock markets surveyed and the number of livestock sold at each livestock market
Table I-2-1 shows names of surveyed livestock markets and the number of livestock sold at each
livestock market. A major livestock market is selected for the value chain study in each district. Totally 23
livestock markets in Sindh province were surveyed.
Table I-2-1 The Number of livestock sold at surveyed livestock markets
District Name of Market Buffalo Cattle Goat Sheep
1 Ghotki Mirpur Mathelo 166 123 113 0
2 Sukkur*1 Ali Wahan 775 700 1,225 650
3 Khairpur*4 Khairpur Vegetable
Market 8 2 105 0
4 N.Feroze Moro 663 448 938 185
5 Nawabshah Nawabshah 464 345 1,123 1,470
6 Kashmore*2 Kashmore 211 401 655 186
7 Shikarpur*2 Shikarpur 498 440 490 820
8 Jaccobabad Jaccobabad 274 292 344 450
9 K. Shadadkot K. Shadadkot 85 107 130 0
10 Larkana Larkana Cattle Colony 398 115 275 155
11 Dadu Dadu 230 219 910 450
12 Jamshoro Bhan Sayed Abad 150 182 435 135
13 Thatta Thatta 66 66 380 295
14 Matiari Hala 1,053 618 3,200 905
15 Tando Allahyar Tuesday Market 2,560 1080 2,125 1,700
16 Hyderabad*4 Hyderabad 2,570 1420 2,150 1,950
17 T. M. Khan Tando Saeendad 1,818 663 248 93
18 Badin*3 Talhar 465 328 0 0
19 Sanghar Shehdadpur 5,500 1,400 8,950 980
20 Mirpurkhas*2 Mirpurkhas 725 420 1,320 1,000
21 Umerkot*4 Umerkot 7 145 3,288 835
22 Tharparkar Mithi 0 264 870 550
23 Karachi Landhi Cattle Colony 2,073 1,359 5,125 3,625
*1: The livestock market at Ali Wahan is newly established and it was not on Table 1-1-1
*2: The differences from figures on Table 1-1-1 was caused by the seasonal fluctuation
*3: The livestock market at Talhar is divided into 2 areas, one for large animals and another for small animals. The field researcher
may have visited at only an area for large animals
*4: The reasons of the differences from figures on Table 1-1-1 was not confirmed
Source: Survey by the Project Team

Appen
dix
I -
7
ii)
Pri
ces
of
ma
jor
liv
esto
ck s
old
at
surv
eyed
liv
esto
ck m
ark
et
Tab
le I
-2-2
sh
ow
s p
rice
s m
ajo
r li
ves
tock
sold
at
surv
eyed
liv
esto
ck m
arket
.
Tab
le I
-2-2
P
rice
s of
maj
or
lives
tock
sold
at
surv
eyed
liv
esto
ck m
arket
D
istr
ict
Na
me o
f M
ark
et
Mil
kin
g B
uff
alo
C
att
le f
or
mea
t G
oa
t fo
r m
ea
t S
heep
for
mea
t
1
Gh
otk
i M
irp
ur
Ma
thelo
5
0,0
00
- 7
0,0
00
8
,00
0 -
10
,00
0
2
Su
kk
ur
Ali
Wa
han
7
0,0
00
- 1
10
,00
0
27
,000
- 3
0,0
00
6,0
00
- 9
,00
0
5,0
00
– 5
,50
0
3
Kh
air
pu
r K
ha
irp
ur
Vegeta
ble
Ma
rket
60
,000
- 6
5,0
00
7
,00
0 -
8,0
00
4
N.F
ero
ze
Moro
6
0,0
00
- 9
0,0
00
40
,000
- 4
5,0
00
17
,000
- 1
8,0
00
6,0
00
- 7
,50
0
5
Naw
ab
sha
h
Naw
ab
sha
h
60
,000
- 1
20
,00
0
30
,000
- 5
0,0
00
6,0
00
- 8
,00
0
10
,000
- 1
5,0
00
6
Ka
shm
ore
K
ash
more
6
0,0
00
- 8
0,0
00
6
,00
0 -
8,0
00
9,0
00
- 1
3,0
00
7
Sh
ika
rpu
r S
hik
arp
ur
70
,000
- 1
00
,00
0
30
,000
- 4
5,0
00
9,0
00
- 1
0,0
00
5,0
00
- 6
,00
0
8
Ja
ccob
aba
d
Ja
ccob
aba
d
70
,000
- 1
20
,00
0
50
,000
- 1
00
,00
0
5,5
00
- 6
,00
0
11
,000
- 1
2,0
00
9
K.
Sh
ad
ad
kot
K.
Sh
ad
ad
kot
35
,000
- 9
0,0
00
22
,000
- 2
5,0
00
10
,000
- 1
2,0
00
10
,000
- 1
1,0
00
10
La
rka
na
L
ark
an
a C
att
le C
olo
ny
70
,000
- 8
0,0
00
7
,00
0 -
8,0
00
12
,000
- 1
5,0
00
11
Da
du
D
ad
u
70
,000
- 1
00
,00
0
25
,000
- 4
0,0
00
12
,000
- 1
5,0
00
3,0
00
- 3
5,0
0
12
Ja
msh
oro
B
ha
n S
ayed
Aba
d
30
,000
- 8
0,0
00
50
,000
- 6
0,0
00
10
,000
- 1
2,0
00
8,0
00
- 1
0,0
00
13
Th
att
a
Th
att
a
80
,000
- 1
20
,00
0
70
,000
- 8
0,0
00
7,0
00
- 1
1,0
00
10
,000
- 1
2,0
00
14
Ma
tia
ri
Ha
la
60
,000
- 1
00
,00
0
35
,000
- 4
5,0
00
6,5
00
- 8
,00
0
9,0
00
- 1
4,0
00
15
Ta
nd
o A
lla
hyar
Tu
esd
ay M
ark
et
85
,000
- 1
50
,00
0
75
,000
- 8
5,0
00
4,0
00
- 4
,50
0
7,5
00
- 8
,00
0
16
Hyd
era
ba
d
Hyd
era
ba
d
60
,000
- 1
00
,00
0
30
,000
- 3
5,0
00
12
,000
- 1
3,0
00
4,5
00
- 5
,00
0
17
T.
M.
Kh
an
T
an
do S
aeen
da
d
80
,000
- 1
50
,00
0
40
,000
- 6
0,0
00
8,0
00
- 1
2,0
00
4,0
00
- 5
,00
0
18
Bad
in
Ta
lha
r 7
5,0
00
- 1
00
,00
0
70
,000
- 1
00
,00
0
19
Sa
ngh
ar
Sh
eh
da
dp
ur
70
,000
- 1
00
,00
0
60
,000
- 8
0,0
00
5,0
00
- 2
0,0
00
3,0
00
- 6
,00
0
20
Mir
pu
rkh
as
Mir
pu
rkh
as
90
,000
- 1
20
,00
0
55
,000
- 7
0,0
00
15
,000
- 2
0,0
00
12
,000
- 1
5,0
00
21
Um
erk
ot
Um
erk
ot
5
0,0
00
- 5
5,0
00
10
,000
- 1
5,0
00
3,0
00
- 5
,00
0
22
Th
arp
ark
ar
Mit
hi
4
0,0
00
- 4
5,0
00
7,0
00
- 8
,00
0
3,5
00
-
23
Ka
rach
i L
an
dh
i C
att
le C
olo
ny
50
,000
- 7
0,0
00
20
,000
- 5
0,0
00
6,0
00
- 7
,00
0
4,0
00
- 5
,00
0
Sou
rce:
Su
rvey b
y t
he P
roje
ct T
ea
m
:
Hig
her
pri
ce
:
Low
er
pri
ce
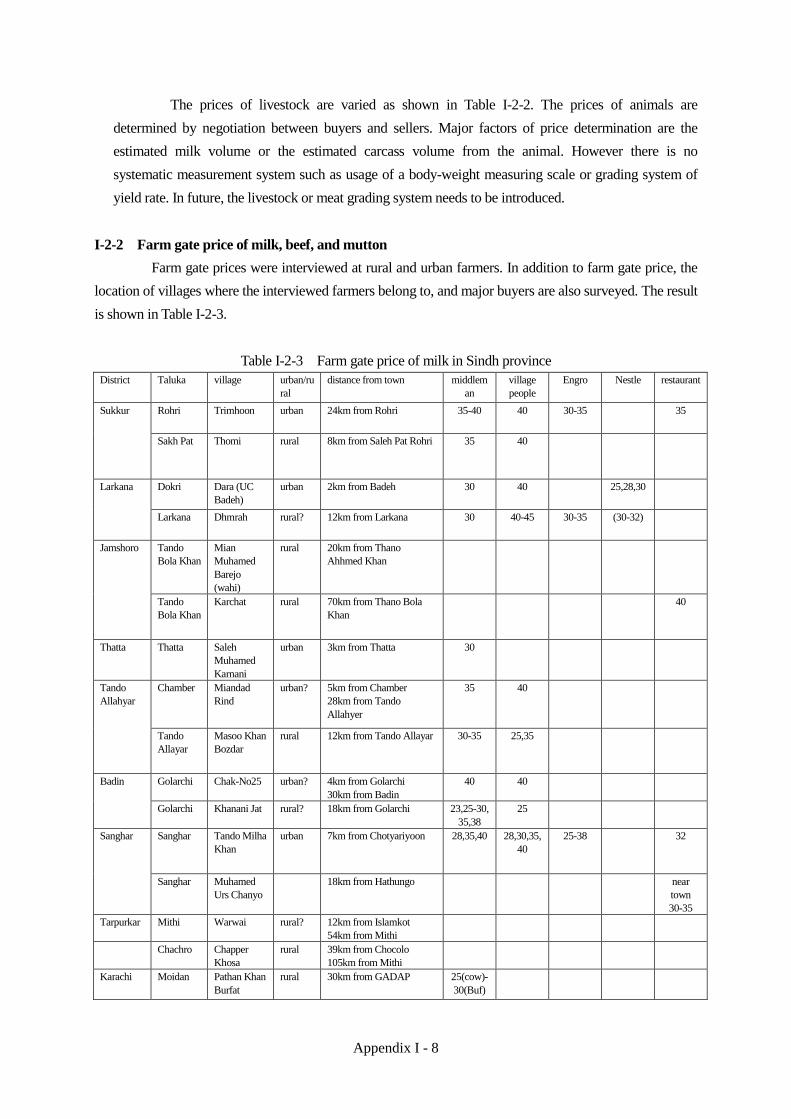
Appendix I - 8
The prices of livestock are varied as shown in Table I-2-2. The prices of animals are
determined by negotiation between buyers and sellers. Major factors of price determination are the
estimated milk volume or the estimated carcass volume from the animal. However there is no
systematic measurement system such as usage of a body-weight measuring scale or grading system of
yield rate. In future, the livestock or meat grading system needs to be introduced.
I-2-2 Farm gate price of milk, beef, and mutton
Farm gate prices were interviewed at rural and urban farmers. In addition to farm gate price, the
location of villages where the interviewed farmers belong to, and major buyers are also surveyed. The result
is shown in Table I-2-3.
Table I-2-3 Farm gate price of milk in Sindh province
District Taluka village urban/ru
ral
distance from town middlem
an
village
people
Engro Nestle restaurant
Sukkur Rohri Trimhoon urban 24km from Rohri 35-40 40 30-35 35
Sakh Pat Thomi rural 8km from Saleh Pat Rohri 35 40
Larkana Dokri Dara (UC
Badeh)
urban 2km from Badeh 30 40 25,28,30
Larkana Dhmrah rural? 12km from Larkana 30 40-45 30-35 (30-32)
Jamshoro Tando
Bola Khan
Mian
Muhamed
Barejo
(wahi)
rural 20km from Thano
Ahhmed Khan
Tando
Bola Khan
Karchat rural 70km from Thano Bola
Khan
40
Thatta Thatta Saleh
Muhamed
Karnani
urban 3km from Thatta 30
Tando
Allahyar
Chamber Miandad
Rind
urban? 5km from Chamber
28km from Tando
Allahyer
35 40
Tando
Allayar
Masoo Khan
Bozdar
rural 12km from Tando Allayar 30-35 25,35
Badin Golarchi Chak-No25 urban? 4km from Golarchi
30km from Badin
40 40
Golarchi Khanani Jat rural? 18km from Golarchi 23,25-30,
35,38
25
Sanghar Sanghar Tando Milha
Khan
urban 7km from Chotyariyoon 28,35,40 28,30,35,
40
25-38 32
Sanghar Muhamed
Urs Chanyo
18km from Hathungo near
town
30-35
Tarpurkar Mithi Warwai rural? 12km from Islamkot
54km from Mithi
Chachro Chapper
Khosa
rural 39km from Chocolo
105km from Mithi
Karachi Moidan Pathan Khan
Burfat
rural 30km from GADAP 25(cow)-
30(Buf)

Appendix I - 9
I-2-3 Major Constraints of retailers of milk, beef, and mutton as well as users of livestock
In the field survey, interviews to retailers of milk, beef, and mutton as well as people at livestock
market were conducted in order to know what issues retailers and other stakeholders are facing. The major
findings are shown below.
i) Milk
The result of interviews with 46 mil retail shops is following.
Table I-2-4 Major Constraints for Milk
Retail Shops
Major issues #
Quality of Milk 13
Poor Feed Management 10
Shortage of (good quality of) Milk 7
Adulteration 6
Less Fat Ratio 6
High Feed Cost 4
Figure I-2-1 Major Constraints for Milk Retail Shops
Table I-2-5 shows the opinions on sales trend and its reasons given by the milk shopkeepers.
Twelve shopkeepers among 46 milk shops think that his shop has increased the sales in these years while
sixteen shopkeepers think that his shop has decreased the sales in these years. The average increase ratio
among twelve shopkeepers who think his sales has increased is 51.4% while the average decrease ratio
among sixteen shopkeepers who think his sales has decreased is 32.5%.
Table I-2-5 Opinions on Sales Trend and Its Reasons Given by Milk Retail Shops
Sales trend Answer % of Increase/
Decrease *
Main reasons
Increase 12 26.1% 51.4% Population: 2
Milk quality: 2
Shop is newly open: 1
Shop location: 1
Urbanization: 1
Decrease 16 34.8% 32.5% Inflation: 6
Direct sales by credit:4
Poverty: 2
Strike: 1
Other newly opened Shops:1
No answer 16 34.8%
N.A 2
Total 46 100%
0 5 10 15 20 25
Quality of Milk
Poor Feed Management
Shortage of (good quality of)…
Adulteration
Less Fat Ratio
High Feed Cost

Appendix I - 10
ii) Beef
The result of interviews with 36 beef retail shops is following.
Table I-2-6 Major Constraints for Beef Retail
Shops
Major issues #
Rising Price of Livestock 23
Smuggling 14
Meat Market 9
no Slaughter House/not Clean 7
Tax at Livestock Market 5
Inflation 5
Poverty 3
Rising Price of Beef 3
Less Livestock 3
Figure I-2-2 Major Constraints for Beef Retail Shops
Table I-2-7 shows the opinions on sales trend and its reasons given by the shopkeepers of beef
retail shops. Three shopkeepers among 36 beef shops only think that his shop has increased the sales in
these years while 28 shopkeepers think that his shop has decreased the sales in these years. The average
increase ratio among three shopkeepers who think his sales has increased is 20% while the average decrease
ratio among 28 shopkeepers who think his sales has decreased is 43%. As compared with milk shops, beef
shops seem to have more difficulty in sales. The same tendency can be observed for mutton retail shops as
shown in Table I-2-9.
Table I-2-7 Opinions on Sales Trend and Its Reasons Given by Beef Retail Shops
Sales trend Answer % of Increase/
decrease
Main reasons
Increase 3 7% 20%
Decrease 28 61% 43% Inflation: 12
ChickenPrice:9
AnimalPrice:6
Poverty: 2
Flood: 1
No answer 5 11%
N.A - -
Total 36
iii) Mutton
The result of interviews with 38 mutton retail shops is following:
0 5 10 15 20 25
Rising Price of Livestock
Smuggling
Meat Market
no Slaughter House/not Clean
Tax at Livestock Market
Inflation
Poverty
Rising Price of Beef
Less Livestock
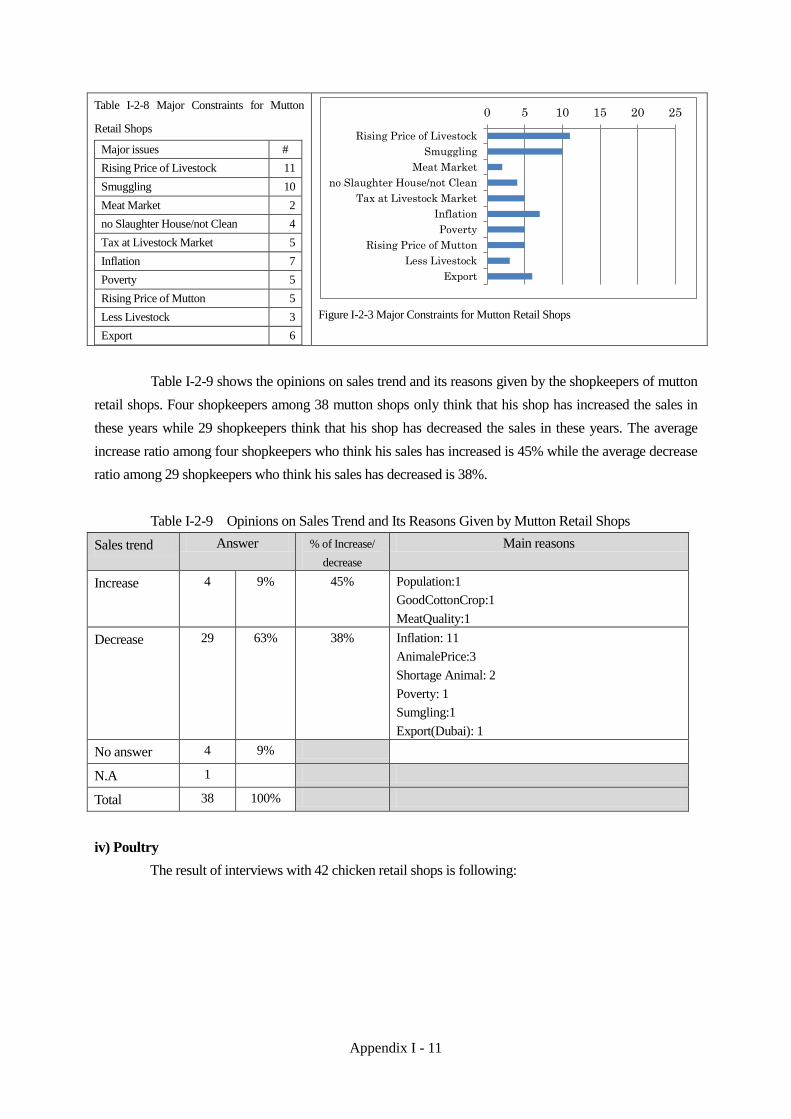
Appendix I - 11
Table I-2-8 Major Constraints for Mutton
Retail Shops
Major issues #
Rising Price of Livestock 11
Smuggling 10
Meat Market 2
no Slaughter House/not Clean 4
Tax at Livestock Market 5
Inflation 7
Poverty 5
Rising Price of Mutton 5
Less Livestock 3
Export 6
Figure I-2-3 Major Constraints for Mutton Retail Shops
Table I-2-9 shows the opinions on sales trend and its reasons given by the shopkeepers of mutton
retail shops. Four shopkeepers among 38 mutton shops only think that his shop has increased the sales in
these years while 29 shopkeepers think that his shop has decreased the sales in these years. The average
increase ratio among four shopkeepers who think his sales has increased is 45% while the average decrease
ratio among 29 shopkeepers who think his sales has decreased is 38%.
Table I-2-9 Opinions on Sales Trend and Its Reasons Given by Mutton Retail Shops
Sales trend Answer % of Increase/
decrease
Main reasons
Increase 4 9% 45% Population:1
GoodCottonCrop:1
MeatQuality:1
Decrease 29 63% 38% Inflation: 11
AnimalePrice:3
Shortage Animal: 2
Poverty: 1
Sumgling:1
Export(Dubai): 1
No answer 4 9%
N.A 1
Total 38 100%
iv) Poultry
The result of interviews with 42 chicken retail shops is following:
0 5 10 15 20 25
Rising Price of Livestock
Smuggling
Meat Market
no Slaughter House/not Clean
Tax at Livestock Market
Inflation
Poverty
Rising Price of Mutton
Less Livestock
Export

Appendix I - 12
Table I-2-10 Major Constraints for Chicken
Retail Shops
Major issues #
Price of Fodder 11
Wastage 10
Quality of Medicine 6
Price Fluctuation 5
Expensive chicken 5
Poverty 3
Transportation cost 3
Quality of Fodder 2
Infuriation 2
Infrastructure (electricity etc) 2
Figure I-2-4 Major Constraints for Chicken Retail Shops
Table I-2-11 Opinions on Sales Trend and its Reasons Given by Chicken Retail Shops
Sales trend Answer % of Increase/
decrease
Main reasons
Increase 17 37% 25% GoodService:1
GoodCrop:1
HighMeatPrice:2
Decrease 15 33% 26% Inflation: 5
Low Purchasing Power: 2
Newly Open Shop: 2
No answer 9 20%
N.A 1
Total 42 100%
v) Livestock market
Based on the interviews with the persons in charge of the surveyed 23 livestock market as well as
sellers and buyers of livestock at livestock market, the major constraints for them are following;
1) There is no necessary facility such as water, electricity, shade, banking, security, residence, and so on,
(13/23)
2) The number of animal at livestock market in Sindh are declining (8/23)
3) Tax at livestock market are overcharged or injustice (5/23)
4) Smuggling reduces the number of animal (3/23)
5) Less buyers come to the livestock market (2/23)
6) Some buyers purchase livestock from directly farmers at villages (2/23)
As shown in Figure I-2-5, more than half of surveyed livestock lack necessary facilities. Some
persons in charge of the surveyed livestock market complained that government has not provided any
facility. Moreover some users such as sellers and buyers of livestock complained that the tax is overcharged
or injustice. Indeed, the amounts of tax are varied at each livestock market. On the other hand, Tando
Saeendad livestock market which is one of the best livestock market in Sindh charges higher tax but
0 5 10 15 20 25
Price of Fodder
Westage
Quality of Medicine
Price Fluctuation
Expensive chicken
Poverty
Transportation cost
Quality of Fodder
Infuration
Infrastructure including…

Appendix I - 13
provides necessary facility. Better livestock market management is needed to be studied and shared with
stakeholders.
Table I-2-12 Major Constraints at Livestock
Market
Major issues #
Facility 13
Decline in animals 8
Tax at livestock market
(overcharged or injustice)
5
Smuggling reduces # of animals 3
Less buyer 2
Direct purchase 2
Figure I-2-5: Constraints at livestock market (n = 23)
I-3 Integrated information
Based on information provided by the Sindh Livestock Department and information collected by the
value chain study, movement of livestock in Sindh provinces was estimated. In addition, the government price
and market price of livestock products are summarized into each tables.
I-3-1 Estimated flow of livestock
Tables I-3-1 to I-3-5 and Figure I-3-1 show estimated flow of livestock per week based on information
collected though the value chain study at livestock markets and the list of livestock market in Sindh province as
shown in Table I-3-1. The estimated flow of livestock is calculated by assuming that all flows of each livestock
are identical in same district. As the information collected in the value chain study are based on the interview
with major stakeholders such as a person in-charge of livestock market, the provided information may be rough
figures which may not fit to statistic data provided by government. In addition, it is said that there are seasonal
difference of sales volume, destination, and price at livestock market. If same study is done in summer, for
example, the result may be not same as the result of this study done in winter, December 2010 to January 2011.
However, it is important to know brief image of the movement of livestock in Sindh provinces. Tables
I-3-1, I-3-2, I-3-3, I-3-4 and I-3-5 show a flow of total head of major 4 livestock, milking bovine, dry bovine, and
goat and sheep, as well as total animal unit of major 4 livestock. The Figure I-3-1 is illustrated based on the result
of Table I-3-1. The width of allow in Figure I-3-1indicates the number of livestock brought from the livestock
market to other districts. As shown in Figure I-3-1, large number of livestock comes to Karachi from almost all
districts in Sindh, and large number of livestock is exported from Karachi. Some of livestock come to Hyderabad
which has the second biggest city in Sindh. In addition, a certain amount of livestock go to Baluchistan. Many
buyers and sellers at livestock market complained that many livestock smuggle to Iran and Afghanistan through
Baluchistan.
0 5 10 15
Facility
Less Animal
Tax (overcharge, injustice)
Smuggling
Security
Less Buyer
Direct Purchase

Appendix I - 14
Figure I-3-1 Flow of major 4 livestock in Sindh province
1,000 head
5,000 head
10,000 head

Appen
dix
I -
15
Tab
le I
-3-1
E
stim
ated
flo
w o
f m
ajor
4 l
ives
tock
(b
uff
alo,
catt
le, sh
eep,
and
go
at)
per
wee
k (
unit
: h
ead
)
D
esti
nat
ion
Ori
gin D
istr
ict
Ghotk
iSukk
ur
Khai
rp
ur
Nau
s
her
o
Fer
oz
Naw
ab
shah
Kas
hm
ore
Shik
a
rpur
Jaco
bab
ad
Kam
b
er Shad
a
Lar
kan
aD
adu
Jam
sho
roT
hat
taM
atia
riT
ando
Allah
y
ar
Hy
der
a
bad
Tan
do
Muha
mm
ad
Bad
inSan
ghar
Mir
pur
khas
Um
er
kot
Thar
par
ka
r
Kar
achi
Pan
jab
Bal
och
i
stan
abro
adto
tal
Ghotk
i1,0
48
55
1,4
37
800
295
3,6
35
Sukkur
447
22
215
163
847
Khai
rpur
3,5
76
1,9
75
5,5
51
Nau
sher
o F
eroze
303
522
3,2
13
4,0
38
Naw
absh
ah3,6
45
956
3,7
04
569
8,8
75
Kas
hm
ore
1,8
70
1,4
51
2,5
24
5,8
44
Shik
arp
ur
284
150
101
185
720
Jaco
bab
ad1,9
43
1,8
31
7,5
67
11,3
41
Kam
ber
Shad
adkot
374
196
198
768
Lar
kan
a1,8
94
1,1
25
152
3,1
70
Dad
u2,9
99
1,5
11
2,9
78
7,4
88
Jam
shoro
147
2,9
40
557
2,0
59
5,7
03
That
ta1,5
67
780
2,3
47
Mat
iari
1,2
83
455
1,9
11
3,6
50
Tan
do A
llah
yar
2,0
43
1,3
06
296
393
67
3,8
32
7,9
38
Hy
der
abad
699
1,3
84
879
2,9
63
T.M
. K
han
35
374
1,1
41
18
427
161
89
2,2
45
Bad
in1,8
32
5,0
26
6,2
32
13,0
90
San
ghar
386
5,9
52
21,8
76
10,5
73
4,5
93
43,3
80
Mir
purk
has
428
785
1,3
97
315
2,9
25
Um
erkot
307
258
289
1,0
77
333
2,2
65
Thar
par
kar
427
681
179
2,3
75
3,6
62
Kar
achi
650
708
60,7
16
29,7
75
91,8
49
Punja
b1,5
93
1,5
93
Bal
och
ista
n2,2
68
2,2
68
tota
l1,0
48
447
3,5
76
303
3,6
45
3,4
62
284
4,2
11
374
1,9
16
3,1
46
2,9
40
2,2
53
1,2
83
2,4
29
15,3
80
1,1
41
6,4
33
22,1
72
1,4
37
356
179
111,0
38
1,2
34
17,6
00
29,8
64
238,1
54
S
ou
rce:
Su
rvey
by t
he
Pro
ject
Tea
m i
n D
ecem
ber
20
10 t
o J
anu
ary 2
011
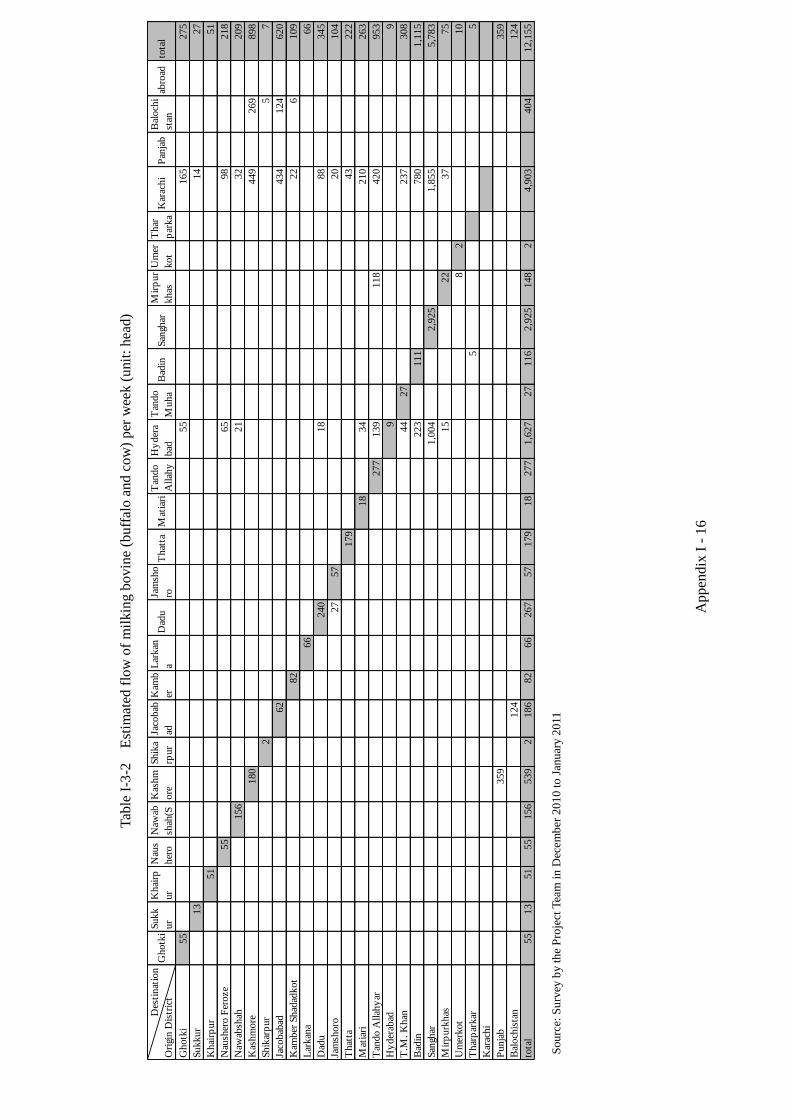
Appen
dix
I -
16
Tab
le I
-3-2
Est
imat
ed f
low
of
mil
kin
g b
ovin
e (b
uff
alo a
nd c
ow
) p
er w
eek (
unit
: h
ead
)
D
esti
nat
ion
Ori
gin D
istr
ict
Ghotk
iSukk
ur
Khai
rp
ur
Nau
s
her
o
Fer
oz
Naw
ab
shah
(S
hah
eed
Kas
hm
ore
Shik
a
rpur
Jaco
bab
ad
Kam
b
er Shad
a
Lar
kan
aD
adu
Jam
sho
roT
hat
taM
atia
riT
ando
Allah
y
ar
Hy
der
a
bad
Tan
do
Muha
mm
ad
Bad
inSan
ghar
Mir
pur
khas
Um
er
kot
Thar
par
ka
r
Kar
achi
Pan
jab
Bal
och
i
stan
abro
adto
tal
Ghotk
i55
55
165
275
Sukkur
13
14
27
Khai
rpur
51
51
Nau
sher
o F
eroze
55
65
98
218
Naw
absh
ah156
21
32
209
Kas
hm
ore
180
449
269
898
Shik
arp
ur
25
7
Jaco
bab
ad62
434
124
620
Kam
ber
Shad
adkot
82
22
6109
Lar
kan
a66
66
Dad
u240
18
88
345
Jam
shoro
27
57
20
104
That
ta179
43
222
Mat
iari
18
34
210
263
Tan
do A
llah
yar
277
139
118
420
953
Hy
der
abad
99
T.M
. K
han
44
27
237
308
Bad
in223
111
780
1,1
15
San
ghar
1,0
04
2,9
25
1,8
55
5,7
83
Mir
purk
has
15
22
37
75
Um
erkot
82
10
Thar
par
kar
55
Kar
achi
Punja
b359
359
Bal
och
ista
n124
124
tota
l55
13
51
55
156
539
2186
82
66
267
57
179
18
277
1,6
27
27
116
2,9
25
148
24,9
03
404
12,1
55
S
ou
rce:
Su
rvey
by t
he
Pro
ject
Tea
m i
n D
ecem
ber
20
10 t
o J
anu
ary 2
011

Appen
dix
I -
17
Tab
le I
-3-3
E
stim
ated
flo
w o
f dry
bovin
e (b
uff
alo a
nd c
ow
) per
wee
k (
un
it:
hea
d)
D
esti
nat
ion
Ori
gin D
istr
ict
Ghotk
iSukk
ur
Khai
rp
ur
Nau
s
her
o
Fer
oz
Naw
ab
shah
(S
hah
eed
Kas
hm
ore
Shik
a
rpur
Jaco
bab
ad
Kam
b
er Shad
a
Lar
kan
aD
adu
Jam
sho
roT
hat
taM
atia
riT
ando
Allah
y
ar
Hy
der
a
bad
Tan
do
Muha
mm
ad
Bad
inSan
ghar
Mir
pur
khas
Um
er
kot
Thar
par
ka
r
Kar
achi
Pan
jab
Bal
och
i
stan
abro
adto
tal
Ghotk
i172
172
Sukkur
22
22
Khai
rpur
257
257
Nau
sher
o F
eroze
117
117
Naw
absh
ah67
67
Kas
hm
ore
649
649
Shik
arp
ur
15
15
Jaco
bab
ad495
495
Kam
ber
Shad
adkot
13
33
45
Lar
kan
a52
34
86
Dad
u385
385
Jam
shoro
38
111
148
That
ta158
158
Mat
iari
134
134
Tan
do A
llah
yar
302
106
36
67
511
Hy
der
abad
79
79
T.M
. K
han
35
35
18
89
Bad
in1,7
65
1,7
65
San
ghar
386
1,0
69
1,4
55
Mir
purk
has
60
60
Um
erkot
116
34
150
Thar
par
kar
77
Kar
achi
650
708
1,3
59
Punja
b260
260
Bal
och
ista
n99
99
tota
l172
22
257
117
67
909
15
593
13
52
422
111
844
134
688
79
35
2,4
98
1,1
75
213
101
67
8,5
84
S
ou
rce:
Su
rvey
by t
he
Pro
ject
Tea
m i
n D
ecem
ber
20
10 t
o J
anu
ary 2
011

Appen
dix
I -
18
Tab
le I
-3-4
Est
imat
ed f
low
of
bovin
e (b
uff
alo a
nd c
ow
) per
wee
k (
un
it:
hea
d)
So
urc
e: S
urv
ey b
y t
he
Pro
ject
Tea
m i
n D
ecem
ber
20
10
to
Jan
uar
y 2
011
D
esti
nat
ion
Ori
gin
Dis
tric
tG
ho
tki
Su
kk
ur
Kh
airp
ur
Nau
s
her
o
Fer
oz
Naw
ab
shah
(S
hah
eed
Kas
hm
ore
Sh
ika
rpu
r
Jaco
bab
ad
Kam
b
er Sh
ada
Lar
kan
aD
adu
Jam
sho
roT
hat
taM
atia
riT
and
o
Allah
y
ar
Hy
der
a
bad
Tan
do
Mu
ha
mm
ad
Bad
inSan
ghar
Mir
pu
r
kh
as
Um
er
kot
Th
ar
par
ka
r
Kar
ach
iP
anja
bB
alo
chi
stan
abro
adto
tal
Gh
otk
i351
55
990
295
1,6
90
Su
kku
r160
22
153
89
424
Kh
airp
ur
921
921
Nau
sher
o F
ero
ze
178
240
760
1,1
78
Naw
absh
ah629
224
529
1,3
82
Kas
hm
ore
1,1
65
829
896
2,8
90
Sh
ikar
pu
r37
40
43
120
Jaco
bab
ad673
911
2,0
33
3,6
16
Kam
ber
Sh
adad
kot
165
143
91
400
Lar
kan
a280
526
113
920
Dad
u1,3
58
541
1,0
39
2,9
38
Jam
sho
ro147
503
85
268
1,0
03
Th
atta
768
488
1,2
56
Mat
iari
320
196
983
1,5
00
Tan
do A
llah
yar
891
934
131
229
67
2,5
32
4,7
85
Hy
der
abad
146
211
106
463
T.M
. K
han
35
196
700
18
427
161
89
1,6
25
Bad
in1,8
32
5,0
26
6,2
32
13,0
90
San
ghar
386
2,5
89
11,8
51
6,6
34
1,2
20
22,6
80
Mir
pu
rkh
as151
204
648
152
1,1
55
Um
erk
ot
21
133
65
137
355
Th
arp
ark
ar54
208
262
Kar
ach
i650
708
23,1
55
11,0
94
35,6
08
Pu
nja
b1,0
46
1,0
46
Bal
och
ista
n723
723
tota
l351
160
921
178
629
2,2
11
37
1,3
96
165
303
1,5
06
503
1,4
54
320
1,2
76
7,2
09
700
5,8
05
11,9
83
566
133
47,8
45
5,1
97
11,1
83
102,0
29

Appen
dix
I -
19
Tab
le I
-3-5
E
stim
ated
flo
w o
f goat
and s
hee
p p
er w
eek (
un
it:
hea
d)
D
esti
nat
ion
Ori
gin D
istr
ict
Ghotk
iSukk
ur
Khai
rp
ur
Nau
s
her
o
Fer
oz
Naw
ab
shah
(S
hah
eed
Kas
hm
ore
Shik
a
rpur
Jaco
bab
ad
Kam
b
er Shad
a
Lar
kan
aD
adu
Jam
sho
roT
hat
taM
atia
riT
ando
Allah
y
ar
Hy
der
a
bad
Tan
do
Muha
mm
ad
Bad
inSan
ghar
Mir
pur
khas
Um
er
kot
Thar
par
ka
r
Kar
achi
Pan
jab
Bal
och
i
stan
abro
adto
tal
Ghotk
i698
448
800
1,9
45
Sukkur
287
61
75
423
Khai
rpur
2,6
55
1,9
75
4,6
30
Nau
sher
o F
eroze
126
282
2,4
53
2,8
60
Naw
absh
ah3,0
16
733
3,1
75
569
7,4
93
Kas
hm
ore
705
621
1,6
28
2,9
54
Shik
arp
ur
247
110
101
142
600
Jaco
bab
ad1,2
71
920
5,5
35
7,7
25
Kam
ber
Shad
adkot
208
53
106
368
Lar
kan
a1,6
13
598
38
2,2
50
Dad
u1,6
41
970
1,9
40
4,5
50
Jam
shoro
2,4
37
472
1,7
91
4,7
00
That
ta799
292
1,0
91
Mat
iari
963
259
928
2,1
50
Tan
do A
llah
yar
1,1
52
371
165
165
1,3
00
3,1
53
Hy
der
abad
553
1,1
73
773
2,5
00
T.M
. K
han
179
441
620
Bad
in
San
ghar
3,3
64
10,0
25
3,9
39
3,3
73
20,7
00
Mir
purk
has
277
581
749
163
1,7
70
Um
erkot
286
126
224
941
333
1,9
10
Thar
par
kar
427
627
179
2,1
67
3,4
00
Kar
achi
37,5
61
18,6
81
56,2
41
Punja
b547
547
Bal
och
ista
n1,5
45
1,5
45
tota
l698
287
2,6
55
126
3,0
16
1,2
51
247
2,8
16
208
1,6
13
1,6
41
2,4
37
799
963
1,1
52
8,1
72
441
627
10,1
89
872
224
179
63,1
94
1,2
34
12,4
03
18,6
81
136,1
25
S
ou
rce:
Su
rvey
by t
he
Pro
ject
Tea
m i
n D
ecem
ber
20
10 t
o J
anu
ary 2
011

Appen
dix
I -
20
Tab
le I
-3-6
Est
imat
ed F
low
of
maj
or
4 l
ives
tock
(b
uff
alo,
catt
le,
goat
, an
d s
hee
p)
per
wee
k (
unit
: an
imal
un
it)
D
esti
nat
ion
Ori
gin
Dis
tric
tG
ho
tki
Su
kk
ur
Kh
airp
ur
Nau
s
her
o
Fer
oz
Naw
ab
shah
(S
hah
eed
Kas
hm
ore
Sh
ika
rpu
r
Jaco
bab
ad
Kam
b
er Sh
ada
Lar
kan
aD
adu
Jam
sho
roT
hat
taM
atia
riT
and
o
Allah
y
ar
Hy
der
a
bad
Tan
do
Mu
ha
mm
ad
Bad
inSan
ghar
Mir
pu
r
kh
as
Um
er
kot
Th
ar
par
ka
r
Kar
ach
iP
un
jab
Bal
och
i
stan
abro
adto
tal
Gh
otk
i397
51
934
80
263
1,7
25
Su
kku
r178
22
151
87
438
Kh
airp
ur
1,0
84
198
1,2
81
Nau
sher
o F
ero
ze
173
244
935
1,3
52
Naw
absh
ah845
272
791
57
1,9
65
Kas
hm
ore
1,1
17
823
990
2,9
30
Sh
ikar
pu
r54
43
10
49
156
Jaco
bab
ad729
888
2,3
38
3,9
55
Kam
ber
Sh
adad
kot
172
142
93
407
Lar
kan
a418
559
104
1,0
81
Dad
u1,4
22
555
1,0
68
3,0
45
Jam
sho
ro131
693
126
424
1,3
74
Th
atta
737
490
1,2
27
Mat
iari
376
194
945
1,5
15
Tan
do A
llah
yar
940
865
138
210
54
2,5
23
4,7
29
Hy
der
abad
190
299
168
658
T.M
. K
han
35
200
697
18
427
129
71
1,5
77
Bad
in1,5
33
4,4
32
5,6
65
11,6
30
San
ghar
365
2,5
89
11,7
13
6,2
23
1,3
74
22,2
63
Mir
pu
rkh
as165
240
668
156
1,2
30
Um
erk
ot
45
142
80
216
33
517
Th
arp
ark
ar43
106
18
383
550
Kar
ach
i591
620
26,2
33
12,3
34
39,7
79
Pu
nja
b1,0
07
1,0
07
Bal
och
ista
n791
791
tota
l397
178
1,0
84
173
845
2,1
24
54
1,5
20
172
440
1,5
53
693
1,3
64
376
1,3
05
7,0
73
697
5,1
75
11,8
50
592
134
18
51,0
28
123
5,8
08
12,4
05
107,1
82
So
urc
e: S
urv
ey b
y t
he
Pro
ject
Tea
m i
n D
ecem
ber
20
10
to
Jan
uar
y 2
011
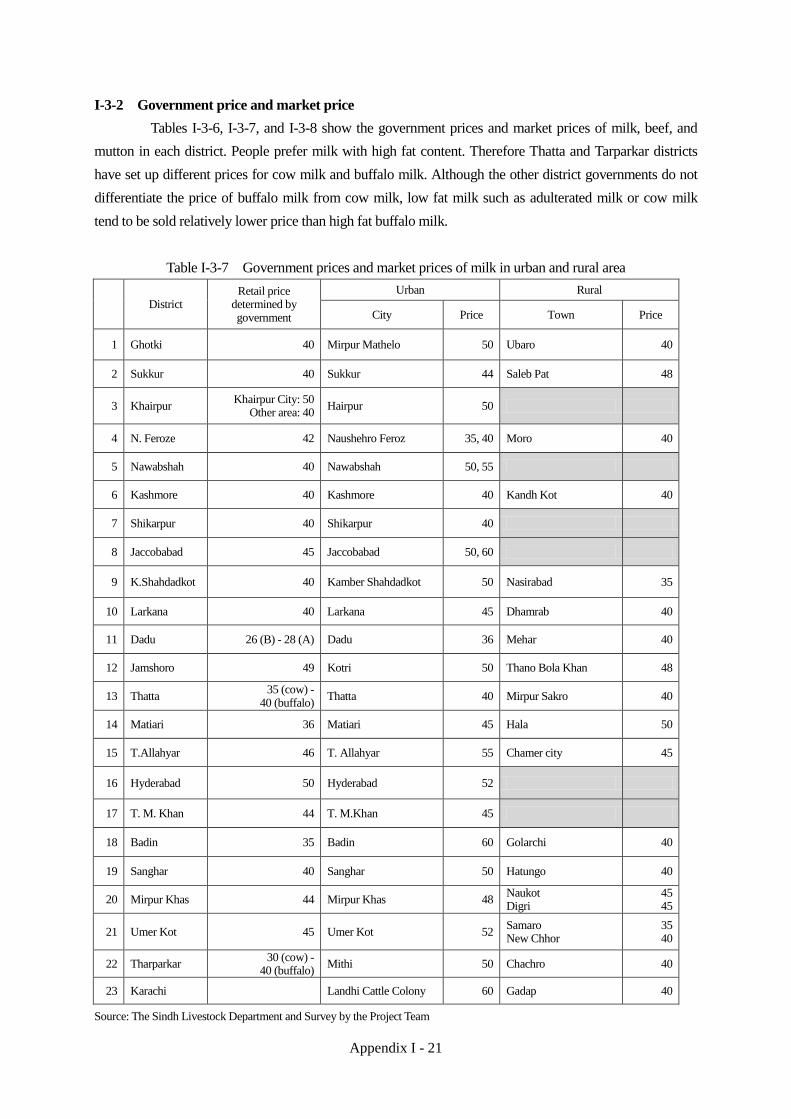
Appendix I - 21
I-3-2 Government price and market price
Tables I-3-6, I-3-7, and I-3-8 show the government prices and market prices of milk, beef, and
mutton in each district. People prefer milk with high fat content. Therefore Thatta and Tarparkar districts
have set up different prices for cow milk and buffalo milk. Although the other district governments do not
differentiate the price of buffalo milk from cow milk, low fat milk such as adulterated milk or cow milk
tend to be sold relatively lower price than high fat buffalo milk.
Table I-3-7 Government prices and market prices of milk in urban and rural area
District Retail price
determined by government
Urban Rural
City Price Town Price
1 Ghotki 40 Mirpur Mathelo 50 Ubaro 40
2 Sukkur 40 Sukkur 44 Saleb Pat 48
3 Khairpur Khairpur City: 50
Other area: 40 Hairpur 50
4 N. Feroze 42 Naushehro Feroz 35, 40 Moro 40
5 Nawabshah 40 Nawabshah 50, 55
6 Kashmore 40 Kashmore 40 Kandh Kot 40
7 Shikarpur 40 Shikarpur 40
8 Jaccobabad 45 Jaccobabad 50, 60
9 K.Shahdadkot 40 Kamber Shahdadkot 50 Nasirabad 35
10 Larkana 40 Larkana 45 Dhamrab 40
11 Dadu 26 (B) - 28 (A) Dadu 36 Mehar 40
12 Jamshoro 49 Kotri 50 Thano Bola Khan 48
13 Thatta 35 (cow) -
40 (buffalo) Thatta 40 Mirpur Sakro 40
14 Matiari 36 Matiari 45 Hala 50
15 T.Allahyar 46 T. Allahyar 55 Chamer city 45
16 Hyderabad 50 Hyderabad 52
17 T. M. Khan 44 T. M.Khan 45
18 Badin 35 Badin 60 Golarchi 40
19 Sanghar 40 Sanghar 50 Hatungo 40
20 Mirpur Khas 44 Mirpur Khas 48 Naukot Digri
45 45
21 Umer Kot 45 Umer Kot 52 Samaro New Chhor
35 40
22 Tharparkar 30 (cow) -
40 (buffalo) Mithi 50 Chachro 40
23 Karachi Landhi Cattle Colony 60 Gadap 40
Source: The Sindh Livestock Department and Survey by the Project Team
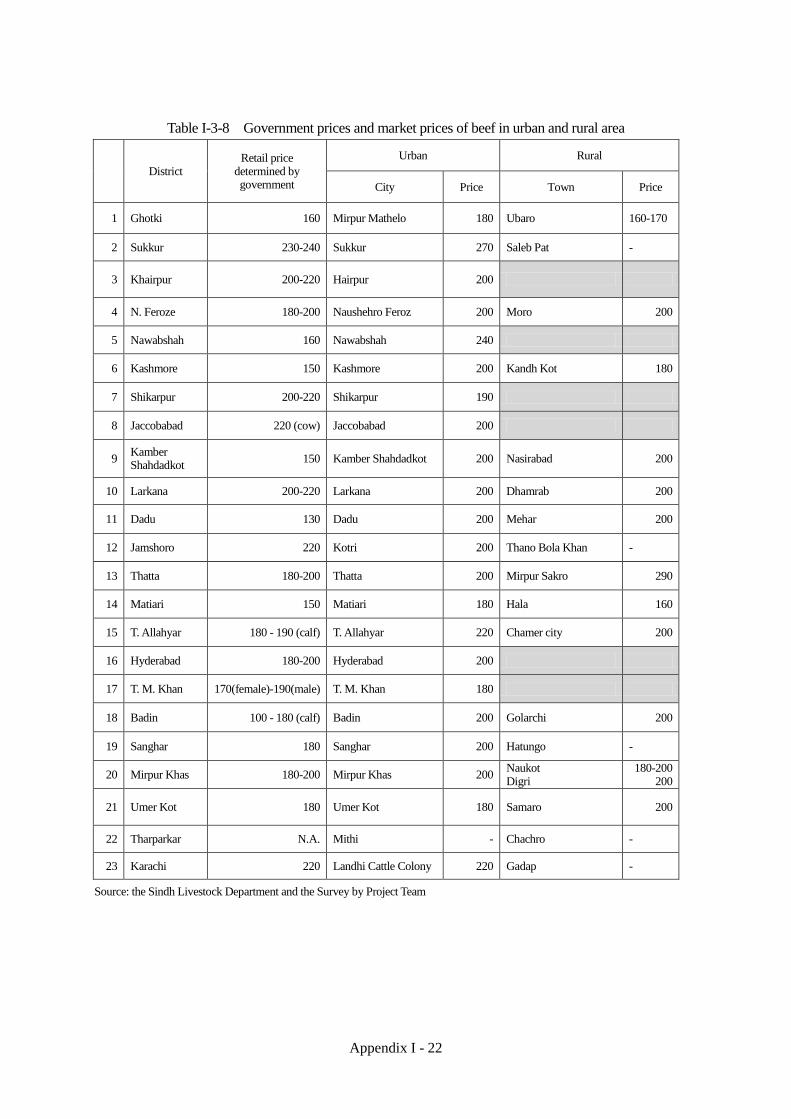
Appendix I - 22
Table I-3-8 Government prices and market prices of beef in urban and rural area
District Retail price
determined by government
Urban Rural
City Price Town Price
1 Ghotki 160 Mirpur Mathelo 180 Ubaro 160-170
2 Sukkur 230-240 Sukkur 270 Saleb Pat -
3 Khairpur 200-220 Hairpur 200
4 N. Feroze 180-200 Naushehro Feroz 200 Moro 200
5 Nawabshah 160 Nawabshah 240
6 Kashmore 150 Kashmore 200 Kandh Kot 180
7 Shikarpur 200-220 Shikarpur 190
8 Jaccobabad 220 (cow) Jaccobabad 200
9 Kamber Shahdadkot
150 Kamber Shahdadkot 200 Nasirabad 200
10 Larkana 200-220 Larkana 200 Dhamrab 200
11 Dadu 130 Dadu 200 Mehar 200
12 Jamshoro 220 Kotri 200 Thano Bola Khan -
13 Thatta 180-200 Thatta 200 Mirpur Sakro 290
14 Matiari 150 Matiari 180 Hala 160
15 T. Allahyar 180 - 190 (calf) T. Allahyar 220 Chamer city 200
16 Hyderabad 180-200 Hyderabad 200
17 T. M. Khan 170(female)-190(male) T. M. Khan 180
18 Badin 100 - 180 (calf) Badin 200 Golarchi 200
19 Sanghar 180 Sanghar 200 Hatungo -
20 Mirpur Khas 180-200 Mirpur Khas 200 Naukot Digri
180-200 200
21 Umer Kot 180 Umer Kot 180 Samaro 200
22 Tharparkar N.A. Mithi - Chachro -
23 Karachi 220 Landhi Cattle Colony 220 Gadap -
Source: the Sindh Livestock Department and the Survey by Project Team

Appendix I - 23
Table I-3-9 Government prices and market prices of mutton in urban and rural area
District Retail price
determined by government
Urban Rural
City Price Town Price
1 Ghotki 300
Mirpur Mathelo 380
Ubaro 340
2 Sukkur 380
Sukkur 400
Saleb Pat -
3 Khairpur 300 - 340
Hairpur 360
4 N. Feroze 300-320
Naushehro Feroz 250
Moro 380
5 Nawabshah 230-250
Nawabshah 400
6 Kashmore 260
Kashmore 400
Kandh Kot 400
7 Shikarpur 380
Shikarpur 420
8 Jaccobabad 350
Jaccobabad 460
9 Kamber Shahdadkot
260 Kamber Shahdadkot
400 Nasirabad 400
10 Larkana 380
Larkana 400
Dhamrab -
11 Dadu 220
Dadu 400
Mehar 380
12 Jamshoro 340
Kotri 450
Thano Bola Khan 400
13 Thatta 150 (sheep) - 325-350 (goat)
Thatta 360
Mirpur Sakro 0
14 Matiari 260
Matiari 440
Hala 340-400
15 T. Allahyar 340
T. Allahyar 400
Chamer city 400
16 Hyderabad 340
Hyderabad 440
17 T. M. Khan 300 (female) 330 (male)
T. M. Khan 400
18 Badin 280
Badin 350-400
Golarchi 400
19 Sanghar 300
Sanghar 400
Hatungo -
20 Mirpur Khas 350
Mirpur Khas 440 Naukot
Digri 400
300-320
21 Umer Kot 320
Umer Kot 400
Samaro 380
22 Tharparkar
Mithi 400
Chachro 380
23 Karachi
Landhi Cattle Colony 440
Gadap 440
Source: Sindh Livestock Department and the Survey by Project Team
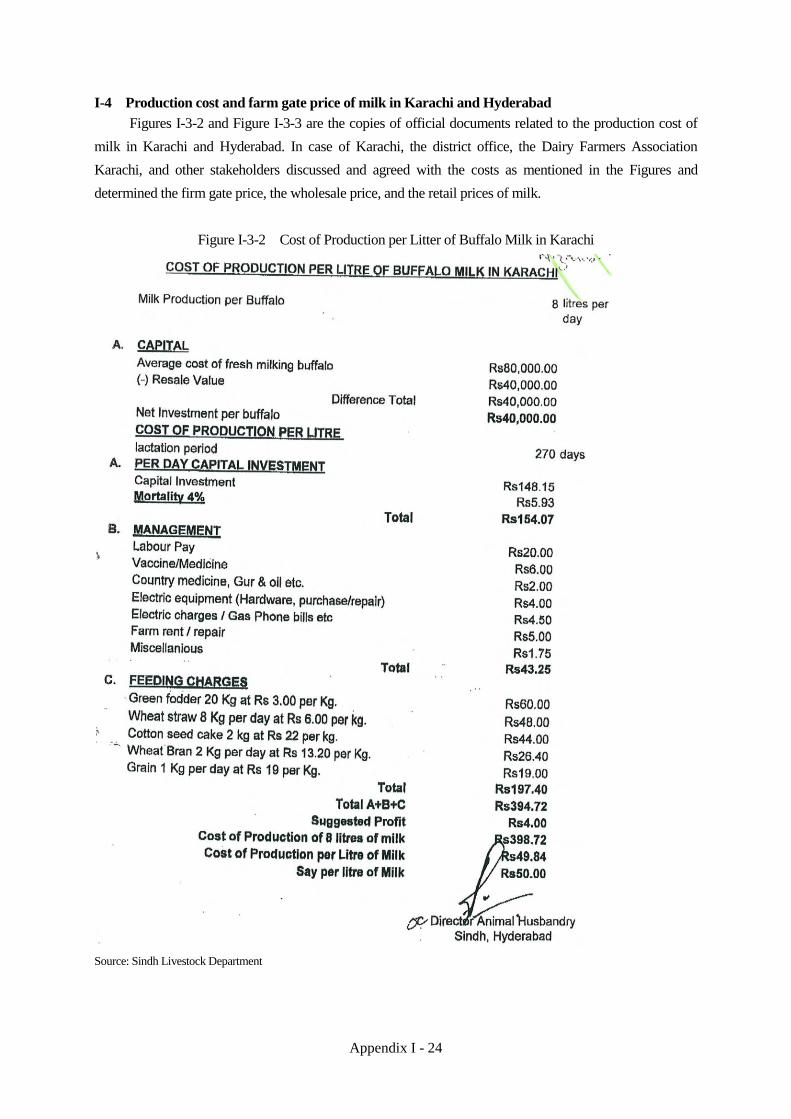
Appendix I - 24
I-4 Production cost and farm gate price of milk in Karachi and Hyderabad
Figures I-3-2 and Figure I-3-3 are the copies of official documents related to the production cost of
milk in Karachi and Hyderabad. In case of Karachi, the district office, the Dairy Farmers Association
Karachi, and other stakeholders discussed and agreed with the costs as mentioned in the Figures and
determined the firm gate price, the wholesale price, and the retail prices of milk.
Figure I-3-2 Cost of Production per Litter of Buffalo Milk in Karachi
Source: Sindh Livestock Department

Appendix I - 25
Figure I-3-3 Cost of Production per Litter of Buffalo Milk in Hyderabad
Source: Sindh Livestock Department
Appendix J
Gender
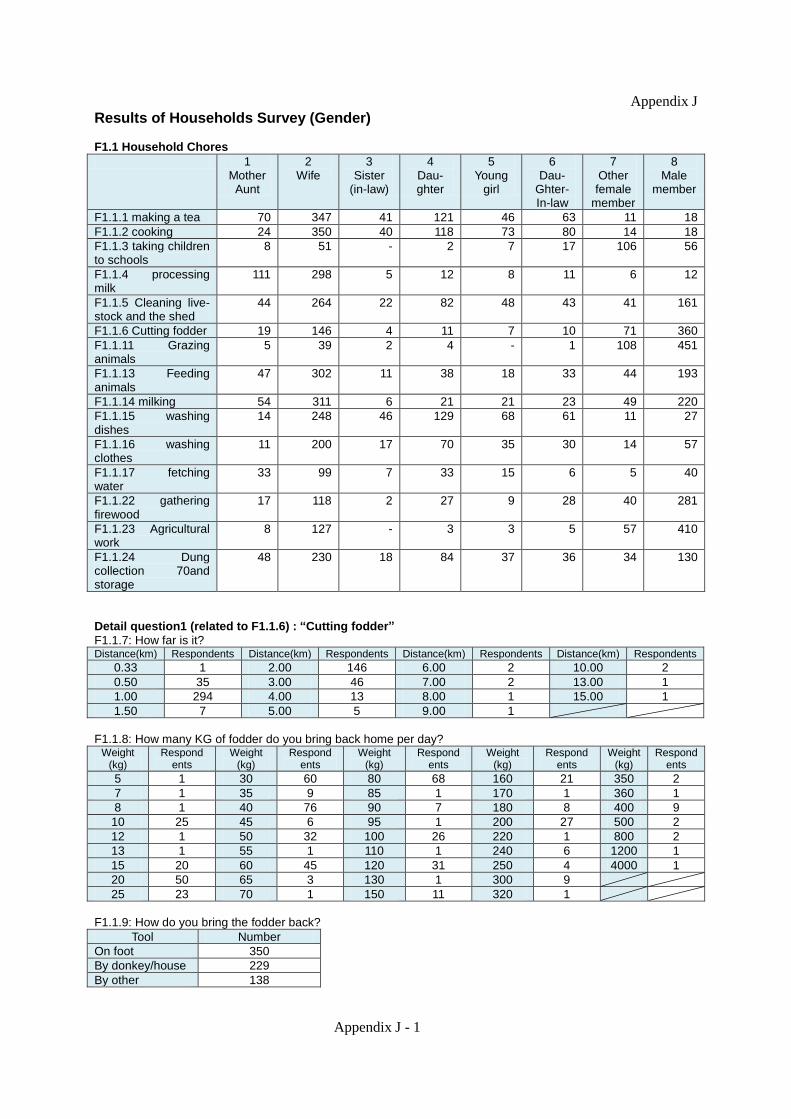
Appendix J - 1
Appendix J Results of Households Survey (Gender) F1.1 Household Chores
1 Mother Aunt
2 Wife
3 Sister
(in-law)
4 Dau- ghter
5 Young
girl
6 Dau-
Ghter- In-law
7 Other female
member
8 Male
member
F1.1.1 making a tea 70 347 41 121 46 63 11 18
F1.1.2 cooking 24 350 40 118 73 80 14 18
F1.1.3 taking children to schools
8 51 - 2 7 17 106 56
F1.1.4 processing milk
111 298 5 12 8 11 6 12
F1.1.5 Cleaning live- stock and the shed
44 264 22 82 48 43 41 161
F1.1.6 Cutting fodder 19 146 4 11 7 10 71 360
F1.1.11 Grazing animals
5 39 2 4 - 1 108 451
F1.1.13 Feeding animals
47 302 11 38 18 33 44 193
F1.1.14 milking 54 311 6 21 21 23 49 220
F1.1.15 washing dishes
14 248 46 129 68 61 11 27
F1.1.16 washing clothes
11 200 17 70 35 30 14 57
F1.1.17 fetching water
33 99 7 33 15 6 5 40
F1.1.22 gathering firewood
17 118 2 27 9 28 40 281
F1.1.23 Agricultural work
8 127 - 3 3 5 57 410
F1.1.24 Dung collection 70and storage
48 230 18 84 37 36 34 130
Detail question1 (related to F1.1.6) : “Cutting fodder”
F1.1.7: How far is it? Distance(km) Respondents Distance(km) Respondents Distance(km) Respondents Distance(km) Respondents
0.33 1 2.00 146 6.00 2 10.00 2
0.50 35 3.00 46 7.00 2 13.00 1
1.00 294 4.00 13 8.00 1 15.00 1
1.50 7 5.00 5 9.00 1
F1.1.8: How many KG of fodder do you bring back home per day?
Weight (kg)
Respond ents
Weight (kg)
Respond ents
Weight (kg)
Respond ents
Weight (kg)
Respond ents
Weight (kg)
Respond ents
5 1 30 60 80 68 160 21 350 2
7 1 35 9 85 1 170 1 360 1
8 1 40 76 90 7 180 8 400 9
10 25 45 6 95 1 200 27 500 2
12 1 50 32 100 26 220 1 800 2
13 1 55 1 110 1 240 6 1200 1
15 20 60 45 120 31 250 4 4000 1
20 50 65 3 130 1 300 9
25 23 70 1 150 11 320 1
F1.1.9: How do you bring the fodder back?
Tool Number
On foot 350
By donkey/house 229
By other 138

Appendix J - 2
F1.1.10: How many times do you go to cut fodder?
Frequency Respondent Frequency Respondent
1 time 208 5 times 4
2 times 292 6 times -
3 times 48 7 times 6
4 times 3 8 times 41
Detail question2 (related to F1.1.11): “Grazing Plot”
F1.1.12: How far is it to grazing plots? Distance(km) Respondents Distance(km) Respondents Distance(km) Respondents
0.33 1 3.00 72 9.00 1
0.50 23 4.00 13 10.00 4
1.00 219 5.00 14 13.00 1
1.50 7 6.00 7 15.00 1
2.00 160 7.00 1 20.00 1
2.50 1 8.00 28
Detail question3 (related to F1.1.17): “Drinking Water”
F1.1.18: How far is it to the water points? Distance(km) Respondents Distance(km) Respondents Distance(km) Respondents
0.3 1 2.0 34 4.0 1
0.5 38 2.5 1 5.0 5
1.0 101 3.0 4 8.0 4
F1.1.19: How many litres of water do you fetch per day? Quantity(litre) Respondents Quantity(litre) Respondents Quantity(litre) Respondents
0.5 1 60.0 27 280.0 1
6.0 1 65.0 3 300.0 5
8.0 1 70.0 10 400.0 1
10.0 7 80.0 16 500.0 16
15.0 2 90.0 2 600.0 1
20.0 12 100.0 106 800.0 1
25.0 3 110.0 1 1000.0 3
30.0 23 128.0 1 1200.0 1
35.0 1 150.0 3
40.0 17 160.0 2
45.0 3 200.0 48
50.0 21 250.0 3
F1.1.20: Is the water safe for drinking?
Yes 699 No 18
F1.1.21: Is the water sweet or brackish?
Sweet 627 Blackish 82 n/a 8
F1.2 Power Holder among female members of household
Status Respondents
Mother (in-law) 490
Daughter 13
Daughter-in-law 16
Educated young ladies 5
Others 193
F2.2. Who makes a decision? (Who has strong influence on livestock management?)
Treatment of
animals
Size of herds
Purchase of
animals
Selling animals
Feeding animals
Breeding animals
Fodder Shed
construction
Female 7 6 3 4 184 4 16 73
Male 685 674 694 688 335 703 634 515
Both 25 37 20 25 198 10 67 128

Appendix J - 3
F3.1. What are the constraints of being female?
Movement Heavy workload education Power of
decision making Others
339 250 511 458 14
F3.2. What are benefit of being female?
Little work outside
Little physical labour
Protection by Purdah
Power of decision making
Others
390 366 369 23 61
F3.3 How far can you go freely/without any acceptance of your husband (male member)?
>1km 1≦n<10km 10km≦ No rule
(no limitation)
327 238 80 30
F3.4 From which distance do you need to be accompanied with male of the household? Distance(km) Respondents Distance(km) Respondents Distance(km) Respondents
0.05 1 12.00 10 50.00 20
0.50 2 15.00 15 55.00 2
2.00 1 18.00 2 60.00 2
3.00 1 20.00 34 80.00 4
4.00 3 21.00 1 90.00 1
5.00 56 25.00 14 100.00 4
6.00 5 28.00 1 150.00 1
7.00 5 30.00 16 200.00 1
8.00 8 35.00 4 500.00 1
9.00 2 40.00 15 888.00 40
10.00 146 45.00 2 n/a 297
F3.5 What is the purpose of the travel?
Shopping Marriage/ Funeral
Visiting Friend/relatives
Others
41 538 104 32
(ALL)

Appendix K
Extension Services in the Upper Sindh
Field Survey Report
(by local consultant)

Appendix K
EXTENSION SERVICES
IN THE UPPER SINDH
FIELD SURVEY REPORT
By: Karim Nawaz
DECEMBER 2010 - JANUARAY 2011
Appendix K - 1
1. Introduction
1.1 Background:
The government of Sindh and the Japan International Cooperation Agency (JICA) agreed upon the scope of work for the Project for the Master Plan Study on Livestock, Meat and Dairy Development in Sindh province (herein after called “the Project”) on the 1st of September, 2009. Then A JICA Study Team (herein after called “the Study Team”) headed by Mr. Hiroshi Okabe was dispatched to Sindh province. This field survey was done as a part of the Project.
1.2 Period:
December 2010 – January 2011
1.3 SurveyArea:
The upper part of Sindh Province: 9 districts, namely Shikarpur, Jacobabad, Larkana, Quamber- Shadadkot, Ghotki, Sukkur, Khaipur, Naushehro Feroz and Kashmore
1.4 Survey Methodology
The survey was implemented by Mr. Karim Nawaz (herein after called “the Consultant”), who the Study Team entrusted the survey to.
The Consultant had compiled date and information by means of meetings and discussions with district officers, staff and farmers in the field. Then the collected data and information from the district officers were verified at field level through discussions with field staff (triangulation).
The field staff included district officers, veterinary officers, livestock production officers, stock assistants, livestock Inspectors and others. Interviews and discussions were held with community livestock workers in the field, and also directly with livestock farmers, middlemen and traders.
Study also includes the extension service of private sector such as Engro Foods and civil society group – SRSO (the PMILS) working in livestock sector in upper Sindh.
2. Extension Services in Livestock Department, Sindh
2.1 Administrative Framework and its objectives
Livestock department is headed by Director General (DG) under the Secretary, Livestock and Fisheries Department in provincial government framework. It has different divisions such as animal husbandry, planning, animal breeding, poultry production and research, vaccine production, veterinary research and diagnostic centre. Among these the field branch has a presence in all districts, Taluka and union councils across the province. Each district headquarters has at least one veterinary hospital with veterinary officer(s) (hereinafter called “VO”), stock assistant(s) (hereinafter called “SA”) and support staff. The district officer (livestock) heads the department at that level and coordinates activities of different sub sectors, routine work and also implements any special program such as donor funded or special project(s). Livestock department has objective to increase farmer’s income through adoption of improved production methods and technologies and better access to livestock services. Further to this objectives also include training and extension programs for para-veterinarian staff and farmers at the rural community levels (Livestock Policy Government of Sindh).
In Pakistan historically livestock (large ruminants) are kept by farmers for two main purposes: a) to meet the dietary needs such as milk and meat for rural and urban population,

Appendix K - 2
b) to perform farm activities mainly draught power. They are the cash in hand for farmers and thus are preferred in the farming set-up. About 50% of red meat consumed in the country comes from large ruminants; however, despite this beef production is not considered to be a separate specialized production activity. In fact this is viewed as a by-product from animals kept for milk and draught purposes. Historically most native breeds have been developed for either milk production or draught power with hardly any cattle breed specifically for beef production. Hence under present conditions, the entire livestock production system revolves around milk production. By far milk is the most valuable animal product and has strong demand throughout the year. Similar is the case with small ruminant that most stock is multipurpose and not specifically for meat production. Dairy farming in close proximity to urban centres linkages to the milk processing plants operated by large corporations such as Engro Foods, Haleeb, Nestle and many more, provide bulk buying and technology support to the milk producers and widespread all time availability to consumers. Due to increase in population, per capita income and dietary habits, there has been a modest increase in demand for livestock products mostly milk. Poultry has filled in most of the meat demand, though further scope and potential remain there. Throughout the field survey, the number one issue identified by farmers everywhere and also endorsed by filed livestock staff, is how to increase the milk production of cattle and improve weight gain of small ruminants. The present average of milk production and body weight is reportedly far less than the genetic potential. There are several major causes for this low productivity, such as inadequate fresh fodder and absence of hay making and silage making practices, support services such as health, regulation, management and marketing. It has been pointed out that at district level the department of livestock is not involved in adjusting or regulating the milk prices. There is serious shortfall of green fodder in particular months during a year and at the same time decline in fodder production has been shown over past years in the province. This negatively affects production and health in livestock. During the survey it has been noticed that at many places animals are kept in small compounds: much smaller than area required allowing the animals to move freely. There is not a conducive situation in the province for the growth of the livestock sector on modern and improved levels. Lack of water also hinders the development of this sector in some areas of the province.
To expedite this process, the socially and economical viable technology and practices already tested at research stations need to be introduced at field level. Presently under the traditional production system, increase in livestock products is related to the number of livestock and not correlated to productivity of per animal as such in the country. Nevertheless improved animal efficiency will be a necessity for future increase in food production. It has been noticed during the survey that livestock farms have far less production due to unproductive and less productive animals at their farm. These types of animals consume a substantial share of food and feed and management efforts thus affecting negatively the entire productive animal population at the same time. This results in a decrease in average production of milk and meat, leading to the conclusion that present livestock numbers are not capable of meeting the nation’s demand in such farming practices. Moreover, livestock sector contributes towards 50% of agriculture sector but evidences show that its annual budget is far less than 50% of agricultural budget in the province and country. Insufficient funding remains another critical factor to improve this sector at the pace it deserves. The aim of this field survey was to find gaps in livestock development related to extension and recommend possible measures to overcome this situation and ultimately contribute towards optimal productivity.
2.2 Extension Services and Situation Analysis
Generally extension services in livestock sector deal with transfer of information from experts to the farmers and sharing of information among stakeholders for increasing the productivity, enhancing skills and contributing towards attitudinal changes. To achieve this several

Appendix K - 3
approaches can be applied ranging from field visits, discussion sessions, mobilization, demonstrations, study visits, practicals, messages delivery, campaign etc.
District officer is a senior professional in-charge of district for livestock department. There are veterinary officers, livestock (stock) assistant, livestock inspector and dresser in technical team besides auxiliary staff. In some districts there is also livestock production officer responsible for breeding (artificial insemination service). The district officer, livestock production officer and veterinary officers are graduates in veterinary medicine (four years degree course after 12 grade qualification). The stock assistant and other technical staff has usually diploma of two years. There are 10 master degree holders working in 9 districts of upper Sindh.
At field level the Livestock Department mainly focuses on treatment of animals as its major activity in the province besides limited coverage of artificial insemination, i.e. 5%. (page 35, Livestock and Dairy Development Basic Study Report, August 2009) Presently the department does not have specific sub sector of extension wing like agriculture department in the province. Their graduate degree holders (District Officer and Veterinary Officer) don’t study extension in depth at degree program level as compared to their university colleagues in the agriculture discipline. The whole veterinary educational system at degree level is dominated by clinical practices. However, at field level livestock department does provide regular field services to farmers on a seasonal and occasional basis for vaccination (against diseases common in the province/country), de-worming and regulatory work.
The current tour plan to vaccinate and drench animals is perceived as “extension service” within departmental circles (personal communication at filed with officials of Department of Livestock in upper 9 districts of Sindh). Presently department services are for general population having more animals at place(s) so that extension worker can perform maximum during his visit but in this way small and dispersedly and remotely located farmers are bypassed and a number of these farmers are high in the province. Similarly the small farmer has fewer choices for milk marketing.
The staff (VO and SA) prepares a tour plan to visit field usually for 10-12 days a month. They inform field staff (in-charge livestock dispensaries/centres, stock assistants/attendants, dressers, guards, bull attendants and other lower staff who stays at filed level and farmers through mobile phone, personal messages and sometimes through letters too. Individual and farmers groups are contacted at field level where vaccination and drenching program is performed besides treatment of animals against different diseases. In some cases medicines are prescribed to farmers and they will purchase it from private medical stores. Discussion is also held with farmers about care of animals, proper vaccination, medication and general principles of animal husbandry during meetings. This is done verbally in the local language to an assembly of individuals and groups of farmers.
From time to time farmers also contact department staff and request them to visit the area for vaccination and drenching. Also when any outbreak occurs, farmers communicate to department’s staff. They respond to it within its present meagre facilities. The present level of satisfaction regarding extension services is moderate to low in many cases and emphasizing the need to aggressively improve the situation. Most districts don’t have mobile unit (a van/field vehicle) for extension services or the unit is not functional due to insufficient funds for maintenance and driving. Therefore field staffs travel by motorcycles or local transport. There is no common and wider use of multimedia, leaflets, brochures, black board, notice boards or other useful tools for explaining different aspects of animal husbandry to farmers. The professionals and staff are not even trained in communication and extension services as such. There is hardly any provision to take farmers for a study or exposure visit to a model farm such as milk pasteurization plant, breeding farm, demonstration site for improved varieties of fodder, feed mills, research stations, pharmaceutical factories and diagnostic laboratories etc.

Appendix K - 4
Due to treatment facilities and long interaction provided by the department, farmers now experience health improvement up to some extent. (Interviews with livestock farmers in 9 districts) However, the next steps required are advice on productivity increase, management aspects, nutrition and reduction of economic losses. Introducing extension approaches in view of integrated activities, coordination approaches, management practises require reform and support at different levels within the livestock department. The present setup of district government where agriculture and livestock comes under the same administrative arrangement could be helpful to integrate and coordinate activities in a better way.
2.3 Gaps
Through field surveys the following gaps have been identified regarding extension services:
1) Human Resources Development/Institutional Set-up
- Lack of staff at field level (present coverage is 1258 animals/per vet staff) - Lack of skills in extension methods among staff before joining - Very limited refresher course/up-gradation and tailor made course for staff during the
service - Absence of publicity wing such as directorate at provincial level (Publicity wings
designs, promotes and disseminates different messages to be published in news papers, radio, TV and other media channels. This wing also serves as production role of extension messages, leaflets, booklets, manuals and awareness statements). The audience/listener range is quite wide but basically farmers, traders, people involved in livestock production sector)
- Lack of coordination between agriculture and livestock department for the promotion of integrated ventures such as introduction of fodder crops and related issues. It is a similar case with forest department where rangelands and forestry activities can be designed by keeping in view the livestock role and dependency
- Insufficient extension supporting material such as leaflets, pamphlets, posters, documentaries, charts etc.
- No regular aggressive awareness campaign at provincial level to provide information about epidemics control, emergency response and promotion of new technologies and management practices adaptation (only 5% coverage of artificial insemination and same number for vaccination)
- Inadequate human resources in the province (many posts are lying vacant) and existing staff have to perform multiple duties
- Lack of coordination among sub sectors of livestock department such as livestock production, hospitals, poultry, breeding farms, training centres
- Lack of coordination among livestock department, civil society groups (NGOs), private commercial organization (pharmaceutical companies and feed mills) and milk collection and processing companies
- Low level of trust among farmers about government initiatives (This was replied by farmers in some areas (at least 50% cases) during the field interviews)
- Traditional farming practices using local methods - Law and order situation in some rural areas (This was particularly found in upper
Sindh districts where some 40-50 animals were kept in small compound within the house. When asked why not to have a separate and wider site for these livestock the answer was “theft and bad law and order situation does not allow to move outside village even a 100 meters away from the village and this was seen in many places during the field survey
- Lack of proper monitoring system to cater for the needs and progress of field work based on findings and follow up
- Department has serious shortage of female professionals and staff and thus bypass half of the population
- Insufficient farmers field school approach in the province

Appendix K - 5
- No initiative for organising farmers.
2) Physical Resources
- Lack of any functional mobile unit for extension work at field level in many districts - Insufficient necessary infrastructure such as proper buildings with facilities, furniture,
equipment (presently one veterinary infrastructure covers 158 square kilometres, (page 35, Livestock and Dairy Development Basic Study Report, August 2009) )
- Absence of helping tools for extension work such as field unit multimedia, camera, generator and material for awareness raising and new development in the field of livestock
- Absence of model farm and required set up such as artificial insemination production and demonstration facilities for farmer’s visits.
- Lack of modern communication facilities such as computer, internet, email etc.
3) Financial Resources
- No specific budget for extension work presently (other than field tour for treatment) - Insufficient funds for present field extension work - No funds for demonstration, experiments, exposure, awareness, incentive purposes - Delay in release of funds - Nominal fee charges to farmers presently - No incentive for organising farmers
2.5 Findings and Recommendations:
- Extension services to small and poor farmers need to be stressed and supported with an output of at least one visit to a farmer group in 3 months.
- Department can synchronise the extension approaches based on previous experience, NGOs and private sector experience.
- Government should ensure stability and continuity of extension approaches in the department.
- Professionals and staff need to include extension services in the job description and it must be reflected in the annual/periodical performance evaluation.
- The proposed extension approaches must include participatory methodologies and ways, i.e. need based, feedback and involvement and participation of farmers.
- Incentive policy (Staff covering maximum number of farmers and livestock should be given extra rewards or bonus and similarly farmers using improved practices according to staff recommendations must be appreciated such as certificate, present/gift voucher etc. needs to be introduced – both for staff and farmers.
- Partnership is needed with farmers, NGOs and private sector and training institutions. - Department has implemented different projects in the past and applied extension
methodologies and ways specific to a particular project’s life. This experience needs to be consolidated, documented and shared and for this workshop is recommended.
- Framer organization needs to be established, strengthen on cooperative model. - Professionals and staff need to be trained in participatory methodologies and
practices to establish cooperatives of dairy farmers and livestock holders. - Livestock management training needs to be provided to farmers including record
keeping in order to monitor the progress and see the impact over time period. - Artificial insemination program need to be run as a joint venture between village
para-professionals trained and role of farmer organizations needs to be legitimised.
Extension staff aim is to cater the needs of farmers in order to increase productivity and profitability and facilitate them in overcoming their problems through efficient and safe skills and practices. At the same time extension staff/professionals need to learn with farmers and exchange knowledge and expertise with tem in order to cover social and technical aspects at

Appendix K - 6
field level. It is suggested that capacity building is required at both level – Livestock staff and framers level. Among many few are suggested here: Training Workshops for staff in extension methodologies based on experience gained by private sector, NGOs and staff itself. It will depend upon willingness of participants and trainer/facilitator skills. On Job training for staff already working – putting theory into practice. It is complementary to training workshops (above) Mentoring of young and new staff by a senior(s) and qualified livestock professionals (consultants and ex service senior professionals) Staff joint meetings on regular basis to share experience and plan together. Such events create environment to discuss progress, coordination among different sub sectors, shortfall, feedback and new experiences etc.. It can be facilitated by senior professionals/mangers. Study Tour/Visits are important to see different and new things and can compare with their own situation/progress.
Farmer field schools allow farmers are helpful in learning from each other in a structured course or experiment. At the same time staff can also learn by facilitating and observing these activities. For this staff need to be trained and must have experience so that best practised can be discussed and learned. Staff also learn to organise farmers for useful and relevant production activities and imparting training. Onsite training will help staff and farmer to learn and exchange knowledge and good practices. Formal studies – refresher course/up-gradation course are highly useful to update the knowledge and state of the art skills and technology. Use of regular news bulletins/magazines related to livestock sectors will be useful for knowledge gaining for staff. Internet and computer facilities are needed for planning, monitoring and performance of work and staff. For this workshop can be organised at the start of project (Master Plan under JICA) for orientation, work plan formulation, monitoring etc. And this should be continued on regular basis. Follow up workshop should cover the topics based on monitoring system identifying the gaps/difficulties at field level.
2.6 SWOT ANALYSIS LIVESTOCK DEPARTMENT
1) Strength
- Livestock department has had staff presence in wider geographical locations in the province for quite a long time and thus have trust, familiarity and interaction with farmers at field level.
- Veterinary officers and stock assistants have a tour plan of approximately 10 days every month to visit field farmers.

Appendix K - 7
- Clear understanding of extension approaches at higher level in the department is an advantage to show sensitivity for this important sub sector.
- The printing facilities for extension material are available within the department??
- There are training institutions in the province under livestock department
2) Weakness
- The present extension related approaches are not completely need specific such as AI, nutrition, management and marketing and mainly concentrates around health related activities (It means that what staff is doing presently is mainly treatment/vaccination and not covering other aspects fully and genuinely such as nutrition, feed and fodder, animal husbandry management practices and marketing etc.) .
- The field offices (centres/dispensaries) are less in number and poorly equipped and maintained regarding extension services.
- Poor budget allocation for extension services.
- Inadequate use of modern technology in extension services.
- Lack of clear understanding about extension services exclusively for livestock sector development.
- Absence of female professionals and staff in the department
3) Opportunity
- Untapped manpower in the department and availability of manpower in the province.
- Willingness to learn and obtain training in extension services.
- Huge potential to address the issues pertaining to livestock development in the province such as small farmers and women.
- Diversification in livestock extension services – management, nutrition, marketing etc.
- Collaboration with private sector
4) Threats
- Lack of leadership in coming years as many senior professionals will retire in near future (sorry I don’t have exact numbers but it has been widely discussed by staff in the field and also in DG office in Hyderabad – maybe we should delete it if we can’t prove it).
- Inadequate political will to support the department.
- Unskilled in extension methodologies.
- Lack of willingness on the part of female staff to join department.
- Presence of liable (dependable) personnel in the department

Appendix K - 8
3. Extension methodologies and contents: Sindh Rural Support Organization (SRSO), Sukkar, Sindh
3.1 Introduction of the SRSO
3.1.1 Profile of the SRSO
Vision To see socially and economically empowered communities
Mission To meet the challenge of assaulting poverty and help the poor to get above the poverty line and to help marginalized rural people and harness their potential to bring about change in their quality of life on a self help basis
Organizational Goal
To alleviate poverty in all UCs of nine districts of upper Sindh and go to scale
To address and support Government of Sindh’s policy of poverty alleviation
To complement and supplement Government of Pakistan’s efforts to translate poverty reduction strategies into action
Approach and Strategy
The people need to be mobilized. They need social guidance to harness their potential.
Organize communities and prepare investment Plan at household, group and village level, including credit, technical assistance and training required by the community.
Initiate savings discipline program Prepare a local level infrastructure plan in productive and social
sector with community ownership and contribution Network with local NGOs and CBOs. SRSO believes that success of social mobilization is achieved when
the community is fully sensitized towards understanding its problems and finding solutions by itself.
Sustainability of the program is based on creating proactive community organizations by attitudinal change.
3.1.2 Methodology of the SRSO in implementation
The basic unit of the SRSO’s activities is called a “Community Organization” (hereinafter called “CO”). All intervention of the SRSO to the communities and the people is done through the CO. Thus the SRSO initiates its activities from the formulation of the CO.
At the first, the SRSO selects candidates of the CO by its setting criteria (field assessment). The criteria includes whether to have milking cattle(s) and other prerequisite such as water, farming practices and scope of natural resources management, etc.
The SRSO dispatches its social organizers to the candidate communities. The social organizers begin to have a dialogue with community leaders, and then gradually extend the dialogue to the other people and women. The social organizers explore the development needs of the community by means of those dialogues, Participatory Rural Appraisal and the other study methods such as questionnaire and/or interviews. Upon potential and willingness, a CO is formed in that location.
The CO is main body at village level to work with, through participatory approaches and it is aimed that CO will be sustainable organization at grassroots level to carry our development activities in future too, once project is ended. COs are linked with other service organizations, line department and private sector. Also COs take advantages of different programs offered by linked organization. Human resource development, joint saving fund and organizational development are key pillars of this approach.

Appendix K - 9
3.2 Prime Minister’s Special Initiative for Livestock
SRSO is a member of Rural Support Program Network. In the Prime Minister’s Special Initiative for Livestock (hereinafter called “the PMSIL), as the same as the other RSP Network NGOs, SRSO was in charge of the implementation of the program in the upper Sindh. The PMSIL aimed to expand outreach services of animal health by means of training village people as “community livestock extension worker” (hereinafter called “CLEW”). SRSO and others arranged the trainings and supported the CLEWs technically and logistically during the project.
Under the community development approach of SRSO and based on the field assessment reports the potential villages, having milking cattle and other prerequisite such as water, farming practices and scope of natural resources management are selected to work with. Under regular community development program of SRSO social organiser initiates dialogues and diagnostic survey in villages where need for development is high. Participatory rural appraisal and few different methods such as survey questionnaire and dialogues are used to assess the situation of village(s). Separate meetings and detail discussion are held with male and female population of village.
The SRSO gave 15 days intensive training to candidates of CLEWs. The candidates were selected one suitable person from each CO. This training includes vaccination skills, de-worming methods, general management practices, and nutrition and marketing techniques. Also refresher and up-gradation courses are provided from time to time. It is mandatory for all paraprofessionals to receive refresher training on needed subjects as per agreement between CO and SRSO.
The lectures and trainings are held in local languages and Urdu and use of multimedia and charts is there. Trainees are provided literature, notes, and charts about different topics. Moreover, posters are given to these professionals to put on walls in village guest house, shops and other common places where farmer can see information about livestock development. Feedback is sought from participants, and question answer sessions are held in order to further clarify points of concern pertaining to field issues experienced by trainees. CLEWs are provided transport facilities and food during the training.
At the end of the training, the participants are provided a small tool kit, which is necessary to carryout general and basic treatment for livestock. SRSO technical professionals provide backstopping support to these CLEWs on regular basis during the project’s life. Almost 70-80% of these workers have been still functional after the termination of PMSIL. The extension work contents include motivation through discussion, meetings, practical demonstration and leaflets. Participatory process is applied throughout the work and community is involved at each and every step of planning and implementation. Table 1. Project Achievement of the SRSO in PMSIL
Activity No.
CLEWs Trained 165
Female Livestock Farmers trained (beneficiaries) 12,014
Field Days/ Community Workshops (Vet) 384
Vaccination of Animals 1,105,613
Animal De-worming 361,571

Appendix K - 10
3.3 SWOT Analysis about the Potential of the SRSO in terms of Livestock Extension Service Provider
Table 2. SWOT Analysis about the Potential of the SRSO in terms of Livestock Extension Service Provider
Strength Weakness
NGO and thus have flexibility in extension approaches
Have wide coverage and linkages with grassroots organizations (community organizations/groups) mostly in rural areas throughout the province
Have multidisciplinary teams for extension work
Have institutional memories and experience of addressing livestock extension services and human resources development
Have gender sensitive approaches in extension services
Depend upon donor/external funding Usually don’t work in urban areas Don’t have special focus on livestock or
agriculture as such Lack marketing skills enhancement in
extension services
Opportunity Threat
Long established linkages with rural communities can be further strengthened
May cover more locations in social mobilization sectors in rural areas
Trained human resources in capacity development including extension services
The government (livestock department) perception towards NGOs extension work is not favourable
Other NGOs may lead this sector in the future (When other NGO like national rural support program (NRSP) or similar NGO will entre in this field then SRSO may get setback as competitor)
Overhead cost is higher (government perception)
3.4 Interview with CLEWs in Sukkar
Mr. Fayayz Hussain is 32 years person from village Darawahan in district Sukkar. This village has livestock farmers and is a central position among nearby villages. Date palm and various other crops are cultivated in this area and people mostly depend upon agriculture and livestock. Low quality/grade date palm fruits (both fresh and dried) are used as feed for small ruminants in this area. SRSO is working in this area since last several years. SRSO puts emphasis on human resource development and village paraprofessionals are trained under their capacity enhancement program under livelihood sector.
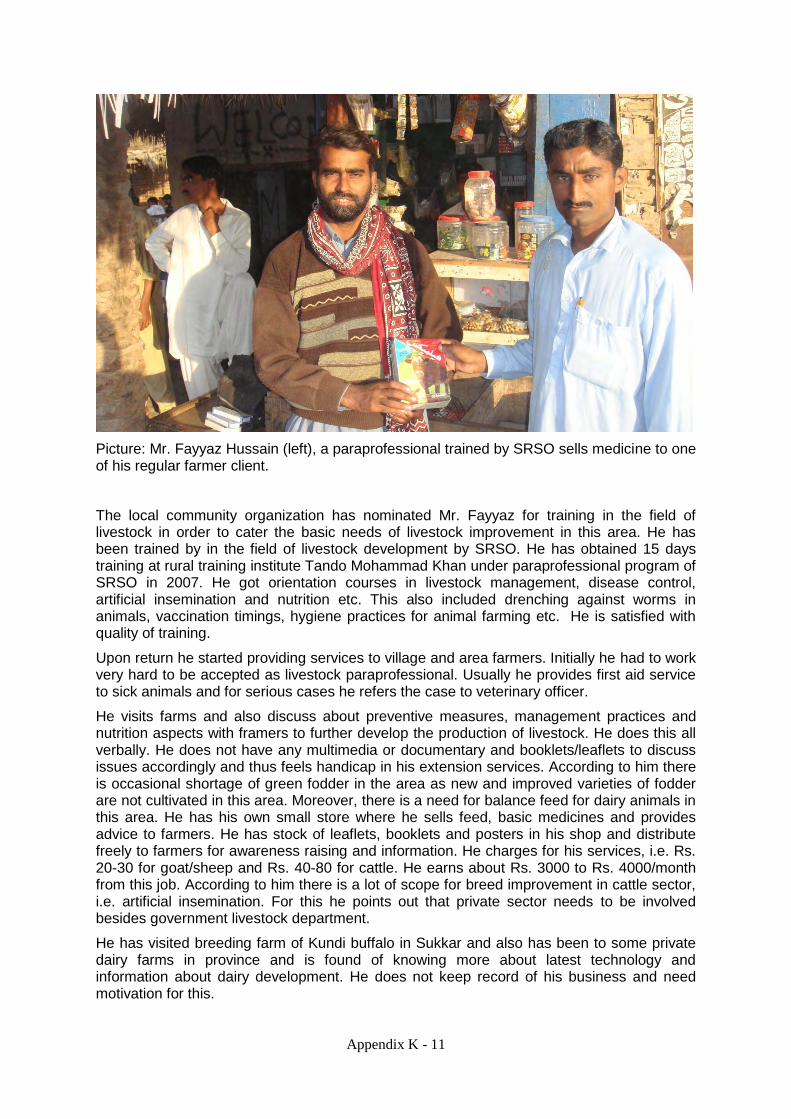
Appendix K - 11
Picture: Mr. Fayyaz Hussain (left), a paraprofessional trained by SRSO sells medicine to one of his regular farmer client.
The local community organization has nominated Mr. Fayyaz for training in the field of livestock in order to cater the basic needs of livestock improvement in this area. He has been trained by in the field of livestock development by SRSO. He has obtained 15 days training at rural training institute Tando Mohammad Khan under paraprofessional program of SRSO in 2007. He got orientation courses in livestock management, disease control, artificial insemination and nutrition etc. This also included drenching against worms in animals, vaccination timings, hygiene practices for animal farming etc. He is satisfied with quality of training.
Upon return he started providing services to village and area farmers. Initially he had to work very hard to be accepted as livestock paraprofessional. Usually he provides first aid service to sick animals and for serious cases he refers the case to veterinary officer.
He visits farms and also discuss about preventive measures, management practices and nutrition aspects with framers to further develop the production of livestock. He does this all verbally. He does not have any multimedia or documentary and booklets/leaflets to discuss issues accordingly and thus feels handicap in his extension services. According to him there is occasional shortage of green fodder in the area as new and improved varieties of fodder are not cultivated in this area. Moreover, there is a need for balance feed for dairy animals in this area. He has his own small store where he sells feed, basic medicines and provides advice to farmers. He has stock of leaflets, booklets and posters in his shop and distribute freely to farmers for awareness raising and information. He charges for his services, i.e. Rs. 20-30 for goat/sheep and Rs. 40-80 for cattle. He earns about Rs. 3000 to Rs. 4000/month from this job. According to him there is a lot of scope for breed improvement in cattle sector, i.e. artificial insemination. For this he points out that private sector needs to be involved besides government livestock department.
He has visited breeding farm of Kundi buffalo in Sukkar and also has been to some private dairy farms in province and is found of knowing more about latest technology and information about dairy development. He does not keep record of his business and need motivation for this.

Appendix K - 12
4. Engro Foods
4.1 Introduction of Extension Activities of Engro Foods
1) Agri-service
Engro Foods organizes its own extension teams consisted of professionals; veterinary doctor, livestock assistant (SA), social organizer and agronomist. They are called as “Agri-Service”, and provide integrated extension services in 800 villages of 11 districts. The main activities of the Agri-Service are to conduct training sessions, regular seminars, discussion forums and/or demonstration events on topics relevant to dairy development at field level. According to the Engro Foods, the communication network among livestock workers, field staff, villagers/farmers, middlemen and management has been established.
A “complete package” of the Engro Foods is 1) that chiller plants and milk collection centres (MCC) are established at appropriate sites, and 2) that the Agri-Service visits the MCCs and farmers regularly and provides appropriate advice, encouragement and/or appreciation. They considered that the visits (interaction) would be a key of success. Under working contract with villages, farmers bring milk directly to chiller plant twice a day. And in some cases, depending upon the situation, a middle man collects milk from different farmers and brings it to chiller plant. In both cases then milk price is different.
Figure 1. Organization Chart of Engro Foods
Table 3.Engro Foods Own extension service in Livestock Sector in Sindh
Designation Number Qualification Gender
Field Supervisor 10 Intermediate male
Area Manger 5 MBA/M Com/ MA Economics male
Area Officers 18 Vet graduate, MA Economics male
Agricultural Services Officer
10 Vet Graduates/ M.Sc in vet sciences male
Stock Assistant 12 Diploma course in relevant field male
Zonal Agri. Services Manager
01 DVM and MA Rural sociology male
National Program Director
National Program Manager
Adminstration and Financial
officer
Asst Admn Officer
Human Resource
Coordinator
Monitoring and Evaluation
Coordinator
Zonal Coordinators - 2
Field Teams- 10

Appendix K - 13
2) One Window Operation
Further to this, Engro Foods started another innovative program, “one window operation”. In the program, Engro Foods opens stores dealing with equipment for agriculture and livestock management (medicine, feed, seed for fodder and fertilizer) where are nearby MCCs. (Some stores are instituted in a part of MCC.) Engro Foods manages the facility of store and monitors the quality of equipment and services. However they do not touch with the operation of the store, but entrusts trained paraprofessionals in the area called Khushhali Ghar.
Engro Foods claimed that the most important thing of the program is to deal quality products in the store, and to obtain the trust of the farmers. Also Engro Foods allows contracted farmers to buy needed items on credit. The field staff of the Agri-service informs the contracted farmers about the store and its services, and encourages farmers to use this facility for their livestock and dairy improvement.
3) Model Village
Engro has also model village concept where 20-25 or more farmers are ready to sell milk on regular basis and also willing to take part in training and other extension services provided by Engro under a joint program of dairy development. As a private organisation, this is their regular extension program in the province. Under regular extension services budget estimate for human resources is about Rs. 10 million a year.
4.2 The Community Empowerment through Livestock and Credit (CELDAC)
As a women’s development program of the UNDP, the Community Empowerment through Livestock and Credit (CELDAC) Project was initiated in 2006 and ended in 2010. The CELDAC was implemented in Punjab and Sindh provinces. Since Engro Foods achieved good track record of livestock farmer trainings in various parts of country, UNDP selected Engro Foods as the counterpart of UNDP’s project in Sindh Province. (The counterpart in Punjab was Nestle.)
The CELDAC focuses on the empowerment of rural poor women through livestock management. Therefore, the CELDAC aimed to create a cadre of female rural entrepreneurs (Lady Livestock Worker: LLW) who were economically independent and served their communities effectively to address livestock management issues.
Under this program, technical staff of Engro Foods conducted field visits and imparted trainings to villagers. Practical demonstrations and farmers days were organised in livestock improvements skills and new technologies. Use of multimedia is common tool for training besides written materials. Engro Foods has prepared a comprehensive and quality manual of livestock farmers training in Sindhi and Urdu languages. Relevant topics of training were explained in easy language and illustrations in this manual. At the end of training, every participant was given a copy of this manual for further use.
According to interview held with paraprofessionals, one of the best things under this program was what the trained farmers visited to Engro Foods’ main milk plant in Sukkar. In the plant, farmers saw the modern technology – pasteurizations and packing of milk. There was feedback system about effectiveness of training events, and refresher courses were also held when the technical staff felt any necessity. Demonstration of urea straw treatments, vaccination, de-worming skills were provided to farmers and village paraprofessionals.
Ultimately the project aimed to increase farmers’ income, to generate employment opportunities through improving their livestock management skills, to ensure their livelihoods and food security at both levels of the household and community. During discussion with Engro management, they pointed out the necessity of backstopping/support to the newly trained livestock workers continually, at least during initial years.
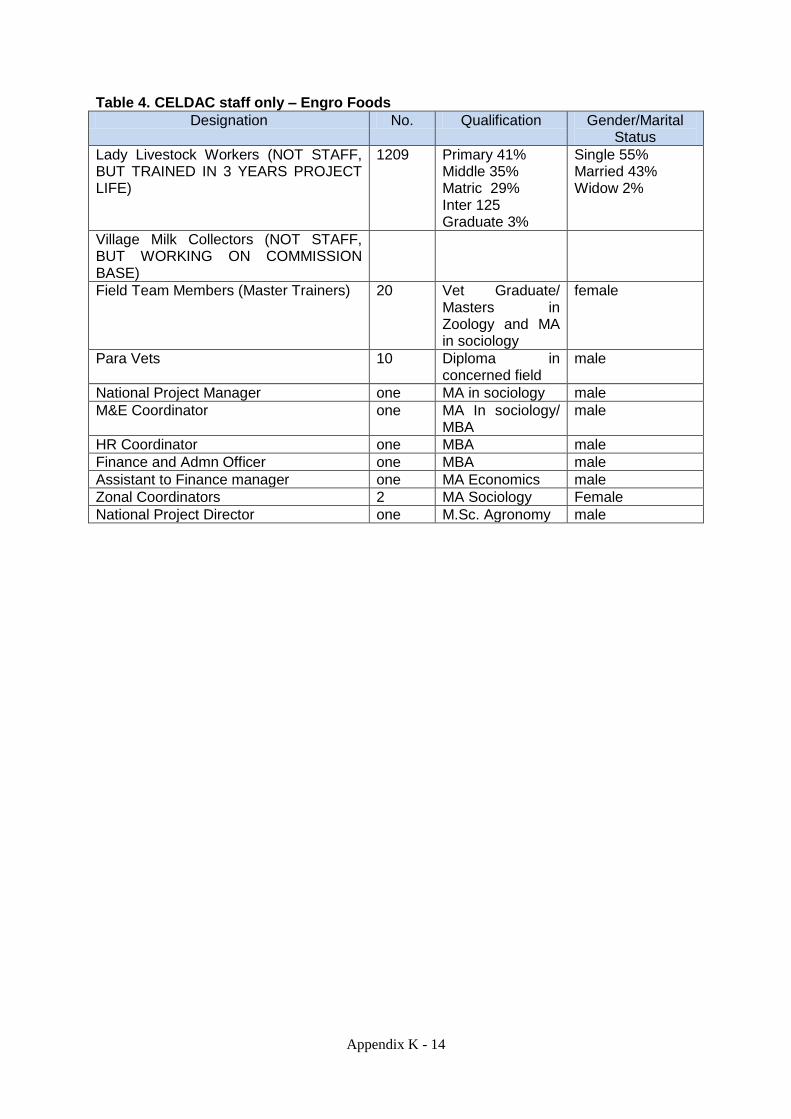
Appendix K - 14
Table 4. CELDAC staff only – Engro Foods
Designation No. Qualification Gender/Marital Status
Lady Livestock Workers (NOT STAFF, BUT TRAINED IN 3 YEARS PROJECT LIFE)
1209 Primary 41% Middle 35% Matric 29% Inter 125 Graduate 3%
Single 55% Married 43% Widow 2%
Village Milk Collectors (NOT STAFF, BUT WORKING ON COMMISSION BASE)
Field Team Members (Master Trainers) 20 Vet Graduate/ Masters in Zoology and MA in sociology
female
Para Vets 10 Diploma in concerned field
male
National Project Manager one MA in sociology male
M&E Coordinator one MA In sociology/ MBA
male
HR Coordinator one MBA male
Finance and Admn Officer one MBA male
Assistant to Finance manager one MA Economics male
Zonal Coordinators 2 MA Sociology Female
National Project Director one M.Sc. Agronomy male

Appendix K - 15
4.3 SWOT Analysis about the Potential of the Engro Foods in terms of Livestock Extension Service Provider
Table 5. SWOT Analysis about the Potential of the Engro Foods in terms of Livestock Extension Service Provider
Strength Weakness
Engro has coverage at strategic field levels.
It has multidisciplinary approach in extension – livestock health, nutrition, preventive aspects and human resources development and marketing.
It has doorstep/village level facility for milk collection.
Its main emphasis is on quality and productivity.
It has human resources development capacity, ability and experience
So far its coverage is limited (not in all districts or all villages).
It is a business oriented private company and does not necessarily work with the poorest of the poor or in remote locations.
It only works in dairy sector and meat, poultry and other animal sector are not covered.
Opportunity Threat
It has field experience in Sindh and ranks topmost in the private commercial sector.
It can expand its coverage based on potential.
Possibility of joint venture with the government.
It has effective extension models and can serve as training prototype for others.
Quality control of extension services may not be maintained over longer period (during the field survey it has been discussed with farmers and even some of Engro Foods staff did partially agree that Engro Foods progress needs further improvement over a time period. This means that initially work is in rapid progress but lateron the progress is slowed).
Government policies may affect adversely progress (presently Engro has somewhat a monopoly of big private firm but as soon as Government will boost the livestock sector in the province then many other private and commercial firms will enter in this field – in this way government policies are directly affecting private sector in the province).
Presently Engro Foods has started establishment of its own dairy farm with more than 300 cattle heads (Cows) in Nara canal area in Khairpur district. This dairy farm will also serve as research and training site for professionals and farmers of Sindh in future under its human resources development program.
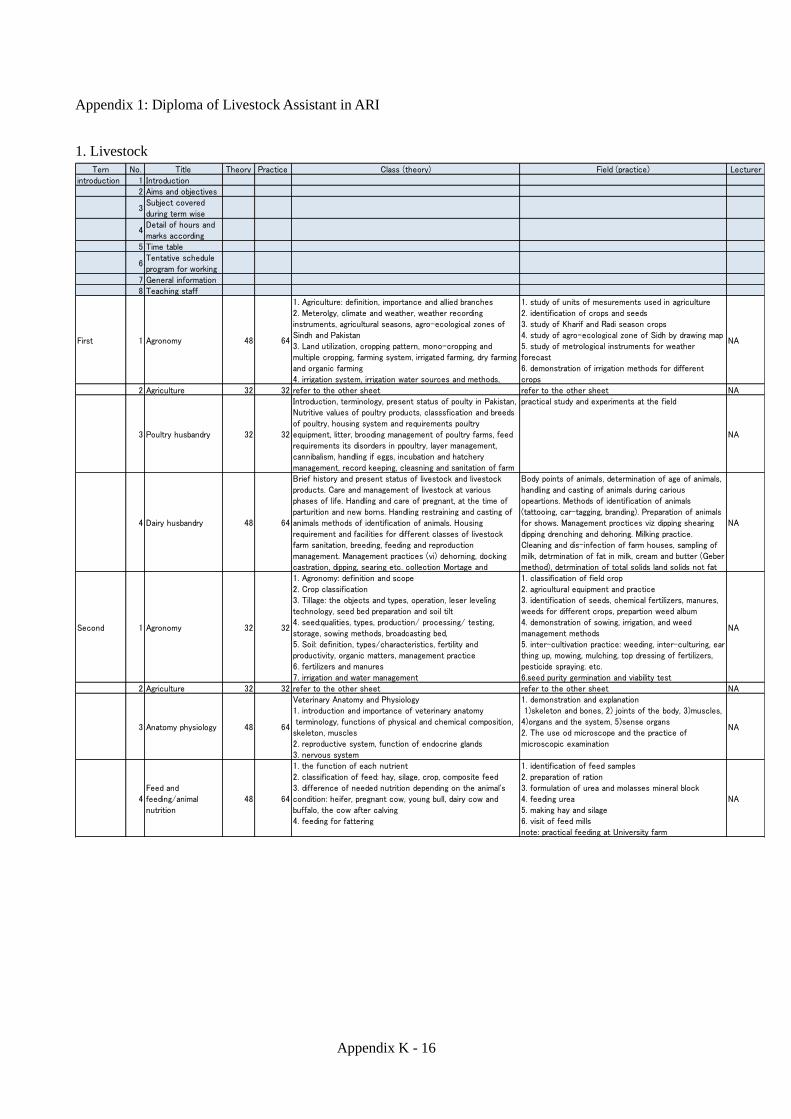
Appendix K - 16
Appendix 1: Diploma of Livestock Assistant in ARI
1. Livestock
Tern No. Title Theory Practice Class (theory) Field (practice) Lecturerintroduction 1 Introduction
2 Aims and objectives
3Subject coveredduring term wise
4Detail of hours andmarks according
5 Time table
6Tentative scheduleprogram for working
7 General information8 Teaching staff
First 1 Agronomy 48 64
1. Agriculture: definition, importance and allied branches2. Meterolgy, climate and weather, weather recordinginstruments, agricultural seasons, agro-ecological zones ofSindh and Pakistan3. Land utilization, cropping pattern, mono-cropping andmultiple cropping, farming system, irrigated farming, dry farmingand organic farming4. irrigation system, irrigation water sources and methods,
1. study of units of mesurements used in agriculture2. identification of crops and seeds3. study of Kharif and Radi season crops4. study of agro-ecological zone of Sidh by drawing map5. study of metrological instruments for weatherforecast6. demonstration of irrigation methods for differentcrops
NA
2 Agriculture 32 32 refer to the other sheet refer to the other sheet NA
3 Poultry husbandry 32 32
Introduction, terminology, present status of poulty in Pakistan,Nutritive values of poultry products, classsfication and breedsof poultry, housing system and requirements poultryequipment, litter, brooding management of poultry farms, feedrequirements its disorders in ppoultry, layer management,cannibalism, handling if eggs, incubation and hatcherymanagement, record keeping, cleasning and sanitation of farm
practical study and experiments at the field
NA
4 Dairy husbandry 48 64
Brief history and present status of livestock and livestockproducts. Care and management of livestock at variousphases of life. Handling and care of pregnant, at the time ofparturition and new borns. Handling restraining and casting ofanimals methods of identification of animals. Housingrequirement and facilities for different classes of livestockfarm sanitation, breeding, feeding and reproductionmanagement. Management practices (vi) dehorning, dockingcastration, dipping, searing etc. collection Mortage and
Body points of animals, determination of age of animals,handling and casting of animals during cariousopeartions. Methods of identification of animals(tattooing, car-tagging, branding). Preparation of animalsfor shows. Management proctices viz dipping shearingdipping drenching and dehoring. Milking practice.Cleaning and dis-infection of farm houses, sampling ofmilk, detrmination of fat in milk, cream and butter (Gebermethod), detrmination of total solids land solids not fat
NA
Second 1 Agronomy 32 32
1. Agronomy: definition and scope2. Crop classification3. Tillage: the objects and types, operation, leser levelingtechnology, seed bed preparation and soil tilt4. seed:qualities, types, production/ processing/ testing,storage, sowing methods, broadcasting bed,5. Soil: definition, types/characteristics, fertility andproductivity, organic matters, management practice6. fertilizers and manures7. irrigation and water management
1. classification of field crop2. agricultural equipment and practice3. identification of seeds, chemical fertilizers, manures,weeds for different crops, prepartion weed album4. demonstration of sowing, irrigation, and weedmanagement methods5. inter-cultivation practice: weeding, inter-culturing, earthing up, mowing, mulching, top dressing of fertilizers,pesticide spraying. etc.6.seed purity germination and viability test
NA
2 Agriculture 32 32 refer to the other sheet refer to the other sheet NA
3 Anatomy physiology 48 64
Veterinary Anatomy and Physiology1. introduction and importance of veterinary anatomy terminology, functions of physical and chemical composition,skeleton, muscles2. reproductive system, function of endocrine glands3. nervous system
1. demonstration and explanation 1)skeleton and bones, 2) joints of the body, 3)muscles,4)organs and the system, 5)sense organs2. The use od microscope and the practice ofmicroscopic examination
NA
4Feed andfeeding/animalnutrition
48 64
1. the function of each nutrient2. classification of feed: hay, silage, crop, composite feed3. difference of needed nutrition depending on the animal'scondition: heifer, pregnant cow, young bull, dairy cow andbuffalo, the cow after calving4. feeding for fattering
1. identification of feed samples2. preparation of ration3. formulation of urea and molasses mineral block4. feeding urea5. making hay and silage6. visit of feed millsnote: practical feeding at University farm
NA

Appendix K - 17
Tern No. Title Theory Practice Class (theory) Field (practice) Lecturer
Third 1Livestock extensionservice
32 32
1. Basic principles of extension and extension workers to enhance people's behaviour/attitude change2. Extension methods 1) audio visual aid 2) listening method 3) writing method: articles, report etc. 4) reading method
interviews to farmers about their soci-economicproblems1. formulation of small groups2. preparation: interview structure, practice among thestudents3. interview to the farmers4. report writing
NA
2 Islamiat 32 na1. basic beliefs of Islam2. Islamic identity3. Quran and Hedith
NA
3Animalhealth/veterinaryphysiology
64 64
introduction and scope of physiology1. cell: structure and function2. homeostasis nervous system3. endocrine system: function of hormone hypothalamus andits relation with pituitary gland4. blood: composition and functions, characteristics of blood,blood pressure
general laboratory instruction1) collection of blood2) preparation of blood smears3) erythrocyte sedimentation rate counting4) determination of blood groups5) urine analysis
NA
4Veterinarypharmacology
1. terminology and source of drugs2. dosage forms3. administration of drugs4. classification of drugs5. general effects of drugs6. mechanism of drug actions, absorption, distribution,metabolism and excretion of drugs7. advarse reaction of drugs
1. weight and measures prescription2. writing prescription3. incompatibilities preparation4. preparation of some internal dosage forms
NA
5Animal reproductionand artificialinsemination
32 32
1. Functional anatomy of male and female reproductivesystem2. introduction of A.I.: history, scope and development;advantage and limitation of A.I.; semen collection, evaluationand processing
1. Determination of donor bulls/semen after qualityassesment2. Collection of semen3. Training for insemination, pregnancy diagosis in cows
NA
6Animal breeding andgenetics
32 32
1. methods for improvement of performance of farm animals:inbreeding, linebreeding, outbreeding 1) the use, 2) advantages/disadvantages2. selection 1) basic principle, 2) kinds and methods of selection, 3)selection of superior male and female animals for seed stock3. Record keeping
1. exercise of data recording for different productivetrails of cattle, sheep and goats2. to observe different breeds of livestock3. exercise of calculating ERPA
NA
Forth 1Animal health: Vet.Micro biology andpathology
32 32
1. Microbiology and bacteriology2. Fungi3. Viology structure size of virus, general properties of viruses, classfication,transmission, multiplication interferon viruses4. Vaccine
1. microscope care and handling microscope2. collection of specimen for microbiological examinationsterilization3. methods of sterilizations stains and staining ofbacteria
NA
2veterinary clinic:medicine andsurgery
48 64
Control, diagnosis and treatment of various diseases1. definition of preventive veterinary medicine and publichealth2. Various prophylactic measures (control strategies)3. Vaccine 1) Vaccine preventable diseases 2) Non-vaccine preventable diseases 3) Vaccine schedule4. Epidemologies
NA
3Animal productionand management
32 32
1. Brief history of livestock and the products2. Care and management of livestock at various phases of itslife3. Handling, restraining and casting metod4. Hygine and sanitation of house and facility5. Productivity: breeding, feeding and reproduction6. Management practice: dehorning, docking, castration,dipping, shearing, etc.7. Quality of milk and the value added products
1. Body points of animals2. Determination of age of animals3. Handling and casting of animals4. Method of identification of animals5. Preparation of animals for fine show6. Dipping, shearing, clipping, drenching, dehorning, etc.7. Cleaning and dis-infection of farm house8. Detemination of fat, solid in milk and the products,preservation, pasteurization and sterilization of milk9. Sanitation
NA
4Veterinaryparasitological
32 16
1. Introduction and historical background2. Injury and death (necrosis and gangrene) of cells3. Disturbance of circulation4. Inflammation and repair neoplasia5. Classification and differentiation of pathology of common
1. Demonstration of general2. Gross and histopathological lessons3. Procudere of postmortem examination collection4. preservation and dispatch of laboratory species5. Demonstration of section cutting and staining
NA
5Veterinary publichealth
32 32
Scope and importance of milk and meat inspection in publichealth1. Physical and chemical properies of milk2. Source of contamination3. Methods of preservation: transportation, chilling and storage4. Milk borne diseases and treatment5. Adulteration of milk6. Characters of good meat7. Postmortem changes of meat8. Inspection of meat in the market9. Slaughtering law/Acts
1. Physical examination of quality of milk2. Labo practice: sampling, various testing→milk quality(MMT, Surf test), pH, and specific gravityand cell count detrmination, Methylene blue reductiontest, detection of adulteration and water content3. Comparative study on various organ systems4. Demonstration at local slaughter houses: ante- andpost-mortem examination5. Detection of lesion carcass rendering meal (unfit forhuman consumption)
NA
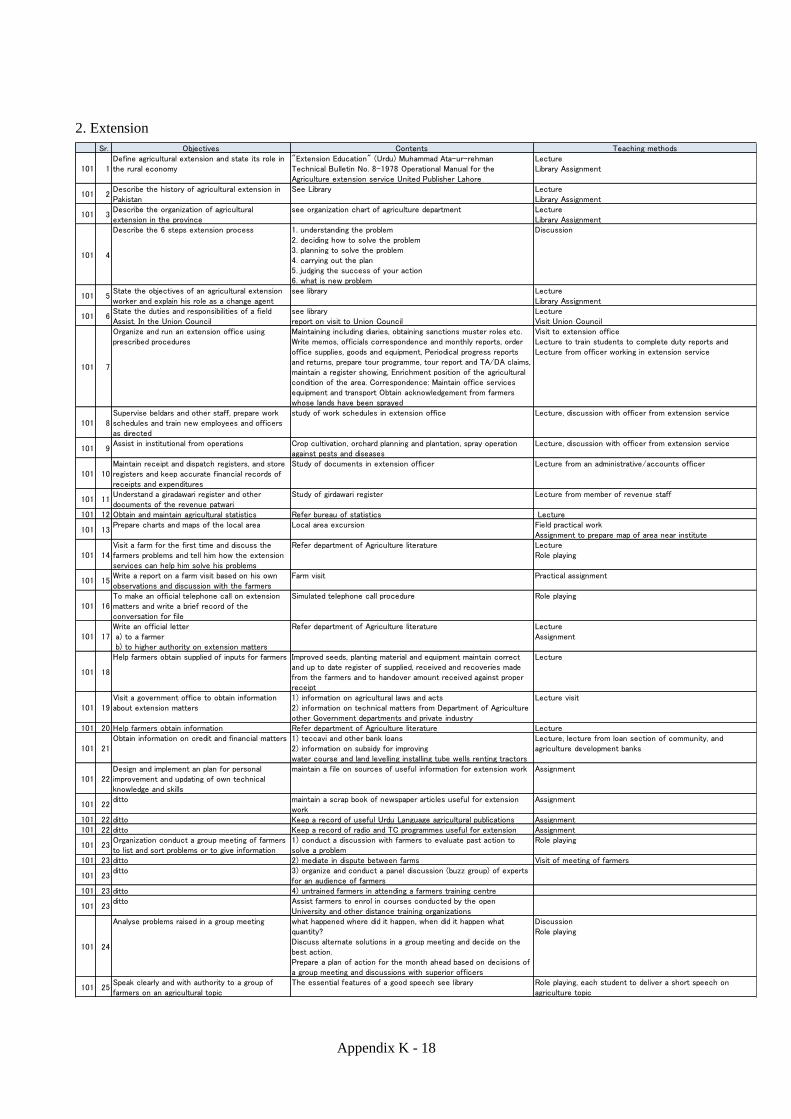
Appendix K - 18
2. Extension
Sr. Objectives Contents Teaching methods
101 1Define agricultural extension and state its role inthe rural economy
"Extension Education" (Urdu) Muhammad Ata-ur-rehmanTechnical Bulletin No. 8-1978 Operational Manual for theAgriculture extension service United Publisher Lahore
LectureLibrary Assignment
101 2Describe the history of agricultural extension inPakistan
See Library LectureLibrary Assignment
101 3Describe the organization of agriculturalextension in the province
see organization chart of agriculture department LectureLibrary Assignment
101 4
Describe the 6 steps extension process 1. understanding the problem2. deciding how to solve the problem3. planning to solve the problem4. carrying out the plan5. judging the success of your action6. what is new problem
Discussion
101 5State the objectives of an agricultural extensionworker and explain his role as a change agent
see library LectureLibrary Assignment
101 6State the duties and responsibilities of a fieldAssist. In the Union Council
see libraryreport on visit to Union Council
LectureVisit Union Council
101 7
Organize and run an extension office usingprescribed procedures
Maintaining including diaries, obtaining sanctions muster roles etc.Write memos, officials correspondence and monthly reports, orderoffice supplies, goods and equipment, Periodical progress reportsand returns, prepare tour programme, tour report and TA/DA claims,maintain a register showing, Enrichment position of the agriculturalcondition of the area. Correspondence: Maintain office servicesequipment and transport Obtain acknowledgement from farmerswhose lands have been sprayed
Visit to extension officeLecture to train students to complete duty reports andLecture from officer working in extension service
101 8Supervise beldars and other staff, prepare workschedules and train new employees and officersas directed
study of work schedules in extension office Lecture, discussion with officer from extension service
101 9Assist in institutional from operations Crop cultivation, orchard planning and plantation, spray operation
against pests and diseasesLecture, discussion with officer from extension service
101 10Maintain receipt and dispatch registers, and storeregisters and keep accurate financial records ofreceipts and expenditures
Study of documents in extension officer Lecture from an administrative/accounts officer
101 11Understand a giradawari register and otherdocuments of the revenue patwari
Study of girdawari register Lecture from member of revenue staff
101 12 Obtain and maintain agricultural statistics Refer bureau of statistics Lecture
101 13Prepare charts and maps of the local area Local area excursion Field practical work
Assignment to prepare map of area near institute
101 14Visit a farm for the first time and discuss thefarmers problems and tell him how the extensionservices can help him solve his problems
Refer department of Agriculture literature LectureRole playing
101 15Write a report on a farm visit based on his ownobservations and discussion with the farmers
Farm visit Practical assignment
101 16To make an official telephone call on extensionmatters and write a brief record of theconversation for file
Simulated telephone call procedure Role playing
101 17Write an official letter a) to a farmer b) to higher authority on extension matters
Refer department of Agriculture literature LectureAssignment
101 18
Help farmers obtain supplied of inputs for farmers Improved seeds, planting material and equipment maintain correctand up to date register of supplied, received and recoveries madefrom the farmers and to handover amount received against properreceipt
Lecture
101 19Visit a government office to obtain informationabout extension matters
1) information on agricultural laws and acts2) information on technical matters from Department of Agricultureother Government departments and private industry
Lecture visit
101 20 Help farmers obtain information Refer department of Agriculture literature Lecture
101 21Obtain information on credit and financial matters 1) teccavi and other bank loans
2) information on subsidy for improvingwater course and land levelling installing tube wells renting tractors
Lecture, lecture from loan section of community, andagriculture development banks
101 22Design and implement an plan for personalimprovement and updating of own technicalknowledge and skills
maintain a file on sources of useful information for extension work Assignment
101 22ditto maintain a scrap book of newspaper articles useful for extension
workAssignment
101 22 ditto Keep a record of useful Urdu Language agricultural publications Assignment101 22 ditto Keep a record of radio and TC programmes useful for extension Assignment
101 23Organization conduct a group meeting of farmersto list and sort problems or to give information
1) conduct a discussion with farmers to evaluate past action tosolve a problem
Role playing
101 23 ditto 2) mediate in dispute between farms Visit of meeting of farmers
101 23ditto 3) organize and conduct a panel discussion (buzz group) of experts
for an audience of farmers101 23 ditto 4) untrained farmers in attending a farmers training centre
101 23ditto Assist farmers to enrol in courses conducted by the open
University and other distance training organizations
101 24
Analyse problems raised in a group meeting what happened where did it happen, when did it happen whatquantity?Discuss alternate solutions in a group meeting and decide on thebest action.Prepare a plan of action for the month ahead based on decisions ofa group meeting and discussions with superior officers
DiscussionRole playing
101 25Speak clearly and with authority to a group offarmers on an agricultural topic
The essential features of a good speech see library Role playing, each student to deliver a short speech onagriculture topic

Appendix K - 19
Sr. Objectives Contents Teaching methods
101 26Demonstrate improved practices using visual aids Real examples, charts, flipcharts flannel boards etc. when speaking
to a group of farmersPractical work filmstrip each student to demonstrate use ofeach visual aid
101 27Demonstrate correctly improved methods ofspraying harvesting, use of machinery, planting
Field demonstration Practical work each student to demonstrate
101 28Advise on establishment and maintenance ofkitchen gardens for improved nutrition
"Vegetable growing for demonstrable use" (Urdu) Alama Iqbal OpenUniversity. "Grow Vegetables" by Niaz Muhammad Refer
Discussion
101 29Set out trail plots and use them fordemonstration and keep records of the resultsboth within institutions and on farms
department of agriculture literature LectureVisit to trail plots
101 30Take part in the organization and teaching of acourse given at farmers training centre
Library references DiscussionVisit to farmer training course
101 31Visit a Union Council and later write a report onits organization and activities
Report on visit Visit
101 32Identify cooperative progressive farmers for on-farm demonstrations and arrange a visit to a farmof a progressive grower
visits DiscussionVisit progressive farmers
101 33Carry out the correct procedures for electricconnection, installation of tube-well rebate ondiesel fuel etc.
WAPDA literature LectureLecture from WAPDA
101 34Conduct a crop estimation acreage and yieldsurvey for each crop in each season by cuttingcrop samples
Library referenceLiterature from Department of Revenue and Agriculture
LectureVisit crop estimation work
101 35Assist in the organization of a field day in aninstitution
1) Organize an agricultural stall in a local fair (male)2) Organize an agriculture competition3) Assist in judging animals or produce in an agricultural competition
Assist in arranging institute field day
101 36Use the media for the extension message 1) Prepare an article or news item for a newspaper
2) Prepare a script for a radio broadcast3) Take record on interview for use in rural broadcasting
Assignment
101 37
Describe the general problems with extension andhow extension can be referred using the basicguidelines of the T and V system describe thehistory of the T and V system
Reasons why the T and V system was introduced into Pakistan andwhere it is now operating."Agriculture extension" by Benor, D. and Harrison, J.. World Bank1977
LectureLibrary Assignment
101 38
Describe the chain of command and operation ofa T and V system in Pakistan and explain therelationship to "Contact" farmers and "Follower"farmers
Visit a district where a T and V system is operating and write areport on the method of operation and chain of command
AssignmentVisit T and V system and write report
101 39State the responsibilities of a field assistantworking in a T and V. System to the UnionCouncil
RefereDepartment of Agriculture Literature Discussion
101 40
Describe the basic concepts of rural society inPakistan
Social values, norms and the relationship of the individual to hissociety. Social organization, stratification and institutions of ruralsociety village, mosque, school.The village as a unit of social organization. "Pakistani Society"(Urdu) by Ghulam Hurtaza Turk
Lecture
102 1
Describe the basic concepts of rural society inPakistan
Social values, norms and the relationship of the individual to hissociety. Social organization, stratification and institutions of ruralsociety village, mosque, school.The village as a unit of social organization. "Pakistani Society"(Urdu) by Ghulam H
Lecture
2Describe the major socio-economic problems inrural society
Lecture
3Describe the forces for and against social changein Pakistan
Discussion
4Describe the sources conflict between groups ofpeople in rural society
Discussion
5Discuss the role of the extension agent inpromoting social change
Discussion
6State the objectives of the cooperativemovement
Lecture
7Explain the need for cooperative activity toachieve goals in rural society
Role Playing
8State the different types of cooperativeorganizations and their functions
Visit a cooperative and write a report on the aims and organization Assignment for visit cooperative and write report
9Describe how to organize a cooperative society Methods of encouraging cooperative behaviours in a group of
farmersdiscussion
10Analyse the advantages and disadvantages ofcooperative organizations and farming based ontheir success on failure in Pakistan
Refer to reports on cooperative movements Discussion
11State the seed for and objectives of programplanning of extension work
Library reference Lecture
12 State the steps of program planning Library reference Lecture

Appendix K - 20
Sr. Objectives Contents Teaching methods
13Analyse a local extension activity into itsseparate steps of the planned extension program
Report on visit Assignment visit to local extension activity and report
14
Describe different rural development programanalyse the success and failure of different ruraldevelopment programme with have beenimplemented in Pakistan
Monthly journal (Marboot) (Urdu)"Review of progress- IRDP" 1972-76Miinistry of Social Welfare
Discussion
15Define leadership and explain its Islamic concept The qualities of a good leader; the types of leadership and how to
select, develop and train leaders "Local leadership" (Urdu) by QaziNasir Ahmeed
Lecture
16
Describe the types of motivation and techniquesfor motivation
a) Psychological driveb) Social motivec) ego or integrative motived) self development (achievement motivation)
Lecture
17Use group dynamics to assess and control groupactivities
Refer hand-book for discussion leaders DiscussionRole playing
18
Describe communication patterns in rural society 1) The need for communication and the importance for effectivecommunication of communication skills knowledge and empathy2) The reason for breakdown in communication giving real examples
Lecture
19
Discuss the work of the extension worker as aprofessional leader
Refer: "Rural community organization" by D.Sanderson andR.A.Poison."Local leadership (Urdu) by Qazi Nasir Ahmed "The art ofLeadership" by O.Tead
Discussion
20Explain the importance of youth clubs for ruraldevelopment
4H clubs movement, future framers of America and other ruralyouth movement" The 4H Handbook" by H.A.William
LectureDiscussion
21 Organize a rural youth club in a village Educational and promotional activities for a rural youth club Visit/organize rural youth club
22Write a report on the aims and functions of arural youth organization
Report on visit Assignment report on visit to youth club
23Explain the importance of adult educational andnon formal education to improve rural life
The different methods of instruction on organization for adulteducation in Pakistan. Refer "Adult Education" (Urdu) by Ch.Ghulam Hussain
Lecture
24Write a report on the successes and failures ofadult education programme which has beenstudied near the institute
Report on visitRefer to catalogue of courses at Allma Iqubal Open University
Assignment report on visit to adult education program

Appendix K - 21
Appendix 2: RTI Training
1. CLEW
Day Title Trainer
1 Introduction2 Skeletal system of farm animal Dr. Ghansham Das
2 Digestive system mono-gastric vs ruminant Dr. Ali Akhtar Shahani
2 Circulatory system Dr. Rukhsana Vighio2 Respiratory system Dr. Ghansham Das3 Excretory system Dr. M. Mubarak Jatoi3 Muscular system Dr. Ali Akhtar Shahani3 Nervous system Dr. Ghansham Das3 Endocrine system Dr. Ghansham Das3 Reproductive system Dr. Ali Akhtar Shahani
4 Concept of good management for animal production Dr. Noor-un-Nissa Marri
4 Principle and design of dairy farm Dr. Ali Akhtar Shahani
4 Housing of large and small ruminants - on farm livestock facilities Dr. Ali Akhtar Shahani
4 General principles for carrying out distressful management procedures Dr. Liaqat Ali Abro
4 Visit to different sheds - layout of small large ruminant sheds Dr. Ali Akhtar Shahani
5 Care and management of dam and calf Dr. Liaqat Ali Abro
5 Care and management of heifers Dr. Rukhsana Vighio
5 Care and management of pregnant and dry animals Dr. Rukhsana Vighio
5 Selection and management of breeding bull Dr. M. Mubarak Jatoi
5 Selection and management of breeding bucks and ram Dr. M. Mubarak Jatoi
6Field visit1) visit to model livestock farm2) visit to livestock market
Dr. Ali Akhtar ShahaniDr. M. Mubarak JatokiDr. Liaqat Ali abro
7 Preparing time schedule for dairy farm operation Dr. Liaqat Ali Abro7 Restraining different farm animals - practical Dr. M. Mubarak Jatoi7 Maintenance of high level of fertility in the herd Dr. Ali Akhtar Shahani7 Importance of farm records - different farm records Dr. Liaqat Ali Abro7 Qualities of farm manager Dr. Ali Akhtar Shahani8 Principles and scope of animal breeding Dr. Sahib Khan Shahani8 Livestock breeds of Sindh - practical Dr. Ali Akhatar Shahani8 Systems of breeding Dr. Sahib Khan Shahani8 Principles of farm animal selection Dr. Liaqat Ali Abro8 Breeding bull soundness Dr. Ali Akhtar Shahani9 Artificial breeding - history, advantages and techniques Dr. Abdul Qadir Junejo9 Demonstration of AI Dr. Sahib Khan Shahani9 The estrus cysle in cattle and buffalo Dr. Sahib Khan Shahani9 Heat detection methods - proper time of insemination Dr. Abdul Qadir Junejo9 Ovulation and fertilization Dr. Ali Akhtar Shahani
10 Female reproductive organs - practical Dr. Abdul Wahab Ansari10 Pregnancy diagnosis - practical Dr. Ali Akhtar Shahani10 Causes of preganancy failure Dr. Sahib Khan Shahani11 Factors affecting cow fertility Dr. Sahib Khan Shahani11 Factores affecting bull fertility Dr. Ali Akhtar Shahani11 Sign of parturition - birth handling Dr. Sahib Khan Shahani11 Dystokia - cause and handling Dr. Abdul Wahab Ansari11 Abotion - causes, treatment and control Dr. Sahib Khan Shahani12 Retention of placenta - causes, treatment and control Dr. Sahib Khan Shahani12 Prolapse of the uterus - causes, treatment and control Dr. Ali Akhtar Shahani12 Repeat breeding - causes, treatment and control Dr. Sahib Khan Shahani12 An-estrus - causes, treatment and contol Dr. Abdul Wahab Ansari12 Reproductive herd health program Dr. Ali Akhatar Shahani13 Dairy Technology - importance and scope Dr. Ali Akhtar Shahani13 Milk - composition of milk Dr. Rukhsana Vighio13 Factors affecting composition of milk Dr. Rukhsana Vighio13 Clean milk - how to produce clean milk Dr. M. Mubarak Jatoi13 Milking methods - demonstration Dr. Ali Akhtar Shahani14 Factors affecting milk quality Dr. Noor-un-Nissa Marri14 Preservation of milk - lecture and demonstration Dr. Liaqat Ali Abro14 Milk bi-products Dr. Noor-un-Nissa Marri14 Milk born diseases Dr. Ali Akhtar Shahani14 Marketing of milk Dr. Liaqat Ali Abro15 Causes of range land degradation - recommendations Dr. Aslam Pervaz Umrani15 Fodder trees shrub and grasses of barani areas Dr. Ghansham Das15 Meeting the needs of nomads Dr. Aslam Pervaz Umrani15 Grazing practice Dr. Ali Akhtar Shahani16 Nutrients - functions and requirements in animal body Dr. Ghansham Das16 Composition of feed stuffs - importance, functions and sources Dr. Nazir Ahmed Nizamani16 Basics of ration formulation Dr. Ali Akhtar Shahani16 Effects of nutritional deficiencies on production Dr. Ghansham Das16 Hay marking - lecture and practical Dr. Nazir Ahmed Nizamani
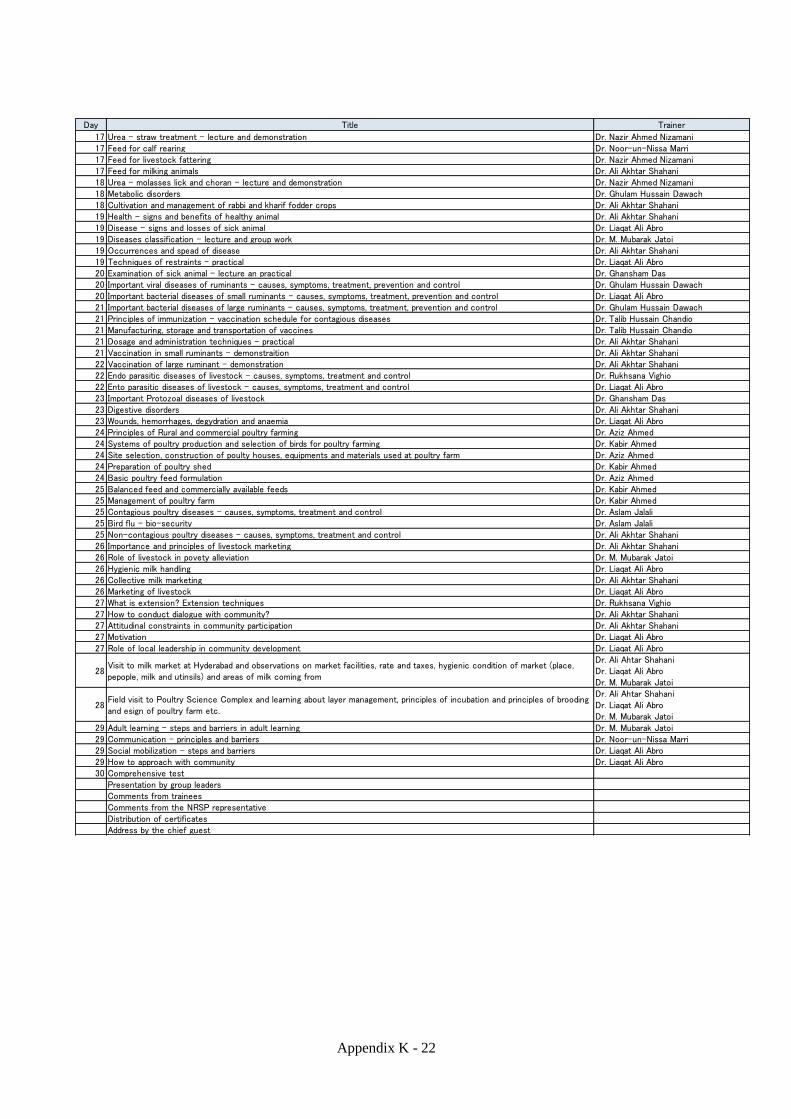
Appendix K - 22
Day Title Trainer
17 Urea - straw treatment - lecture and demonstration Dr. Nazir Ahmed Nizamani17 Feed for calf rearing Dr. Noor-un-Nissa Marri17 Feed for livestock fattering Dr. Nazir Ahmed Nizamani17 Feed for milking animals Dr. Ali Akhtar Shahani18 Urea - molasses lick and choran - lecture and demonstration Dr. Nazir Ahmed Nizamani18 Metabolic disorders Dr. Ghulam Hussain Dawach18 Cultivation and management of rabbi and kharif fodder crops Dr. Ali Akhtar Shahani19 Health - signs and benefits of healthy animal Dr. Ali Akhtar Shahani19 Disease - signs and losses of sick animal Dr. Liaqat Ali Abro19 Diseases classification - lecture and group work Dr. M. Mubarak Jatoi19 Occurrences and spead of disease Dr. Ali Akhtar Shahani19 Techniques of restraints - practical Dr. Liaqat Ali Abro20 Examination of sick animal - lecture an practical Dr. Ghansham Das20 Important viral diseases of ruminants - causes, symptoms, treatment, prevention and control Dr. Ghulam Hussain Dawach20 Important bacterial diseases of small ruminants - causes, symptoms, treatment, prevention and control Dr. Liaqat Ali Abro21 Important bacterial diseases of large ruminants - causes, symptoms, treatment, prevention and control Dr. Ghulam Hussain Dawach21 Principles of immunization - vaccination schedule for contagious diseases Dr. Talib Hussain Chandio21 Manufacturing, storage and transportation of vaccines Dr. Talib Hussain Chandio21 Dosage and administration techniques - practical Dr. Ali Akhtar Shahani21 Vaccination in small ruminants - demonstraition Dr. Ali Akhtar Shahani22 Vaccination of large ruminant - demonstration Dr. Ali Akhtar Shahani22 Endo parasitic diseases of livestock - causes, symptoms, treatment and control Dr. Rukhsana Vighio22 Ento parasitic diseases of livestock - causes, symptoms, treatment and control Dr. Liaqat Ali Abro23 Important Protozoal diseases of livestock Dr. Ghansham Das23 Digestive disorders Dr. Ali Akhtar Shahani23 Wounds, hemorrhages, degydration and anaemia Dr. Liaqat Ali Abro24 Principles of Rural and commercial poultry farming Dr. Aziz Ahmed24 Systems of poultry production and selection of birds for poultry farming Dr. Kabir Ahmed24 Site selection, construction of poulty houses, equipments and materials used at poultry farm Dr. Aziz Ahmed24 Preparation of poultry shed Dr. Kabir Ahmed24 Basic poultry feed formulation Dr. Aziz Ahmed25 Balanced feed and commercially available feeds Dr. Kabir Ahmed25 Management of poultry farm Dr. Kabir Ahmed25 Contagious poultry diseases - causes, symptoms, treatment and control Dr. Aslam Jalali25 Bird flu - bio-security Dr. Aslam Jalali25 Non-contagious poultry diseases - causes, symptoms, treatment and control Dr. Ali Akhtar Shahani26 Importance and principles of livestock marketing Dr. Ali Akhtar Shahani26 Role of livestock in povety alleviation Dr. M. Mubarak Jatoi26 Hygienic milk handling Dr. Liaqat Ali Abro26 Collective milk marketing Dr. Ali Akhtar Shahani26 Marketing of livestock Dr. Liaqat Ali Abro27 What is extension? Extension techniques Dr. Rukhsana Vighio27 How to conduct dialogue with community? Dr. Ali Akhtar Shahani27 Attitudinal constraints in community participation Dr. Ali Akhtar Shahani27 Motivation Dr. Liaqat Ali Abro27 Role of local leadership in community development Dr. Liaqat Ali Abro
28Visit to milk market at Hyderabad and observations on market facilities, rate and taxes, hygienic condition of market (place,pepople, milk and utinsils) and areas of milk coming from
Dr. Ali Ahtar ShahaniDr. Liaqat Ali AbroDr. M. Mubarak Jatoi
28Field visit to Poultry Science Complex and learning about layer management, principles of incubation and principles of broodingand esign of poultry farm etc.
Dr. Ali Ahtar ShahaniDr. Liaqat Ali AbroDr. M. Mubarak Jatoi
29 Adult learning - steps and barriers in adult learning Dr. M. Mubarak Jatoi29 Communication - principles and barriers Dr. Noor-un-Nissa Marri29 Social mobilization - steps and barriers Dr. Liaqat Ali Abro29 How to approach with community Dr. Liaqat Ali Abro30 Comprehensive test
Presentation by group leadersComments from traineesComments from the NRSP representativeDistribution of certificatesAddress by the chief guest

Appendix K - 23
2. CELDAC
Day Title Trainer
1 Introduction2 Sustainable dairy farming Dr. M. Mubarak Jatoi2 Factor of dairy production Dr. Rasheed Ahmed Nizamani2 Concept of good management - managemnt systems Dr. M. Mubarak Jatoi2 Principles and design of dairy farm Dr. Ali Akhtar Shahani2 Visit to different farm buildings Dr. Ali Akhtar Shahani3 Importance and advantages of mixed farming system Dr. M. Mubarak Jatoi3 Care and management of calf Dr. Ali Akhtar Shahani3 Care and management of dry and milking animals Dr. M. Mubarak Jatoi3 Importance of farm records Dr. Ali Akhtar Shahani3 Qualities of good farm manager Dr. Liaqat Ali Abro4 Livestock breed of Sindh - group work Dr. Ali Akhtar Shahani4 Principles of farm animal selection Dr. M. Mubarak Jatoi4 Selection and management of breeding bull Dr. M. Uris Samo4 The estrus cycle - Heat detection and time of insemination Dr. Ali Akhtar Shahani4 Artificial breeding - history, advantages and techniques Dr. M. Uris Samo5 An estrus and repeat breeding - causes, treatment and prevention Dr. M. Uris Samo5 Pregnancy diagnosis methods Dr. Ali Akhtar Shahani5 Factor affecting reproduction Dr. Ali Akhtar Shahani5 Abortion - causes, treatment and control Dr. M. Uris Samo5 Problems during parturition and its handling Dr. M. Uris Samo6 Retention of placenta - causes, treatment and control Dr. M. Uris Samo6 Prolapse of the uterus - causes, treatment and control Dr. M. Uris Samo6 Reproductive herd health program Dr. Ali Akhtar Shahani6 Milk and milk bi-products Dr. Rukhsana Vighio6 Income generating activities and opportunities for rural women Dr. Rukhsana Vighio7 Mikl Preservaion Factors affecting milk quality - how to produce clean milk Dr. Liaqat Ali Abro7 Milk borne diseases and need for microbiological test facility Dr. Ali Akhtar Shahani7 Concept of milk producer group Dr. Liaqat Ali Abro7 Composition of feed stuffs - importance and resources Dr. Ali Akhtar Shahani7 Formulation of balanced ration Dr. Amir Amanullah Solangi
81) Visit to Semen Production Unit Karachi2) Visit to Poultry Research Institute Karachi3) Livestock Experimental Station Karachi
Dr. AliAkhtar ShahaniDr. Liaqat Ali AbroDr. M. Mubarak Jatoi
9 Weekly written test 19 Effect of nutritional deficiencies on production Dr. Amir Amanullah Solangi9 Preparation of yearly fodder calender Dr. Liaqat Ali Abro9 Importantce of urea in livestock feeding Dr. Amir Amanullah Solangi9 Urea - molasses Choran - demonstration Dr. Ali Akhtar Shahani9 Urea - straw treatment - demonstration Dr. Ali Akhtar Shahani
101) Visit to CVDL, Tando Jam2) Visit to Vaccine Prodution Unit Tando Jam3) Visit to District Officer, Poultry Production Mirpurkhas
Dr. AliAkhtar ShahaniDr. Liaqat Ali AbroDr. M. Mubarak Jatoi
11 What is extension - extension techniques Dr. M. I. Leghari11 How to approach to community Dr. M. I. Leghari11 Attitudinal constraints in participatory approach Dr. Ali Akhtar Shahani11 Role of local leadership in community development Dr. Mubarak Ali Jatoi11 Qualities and duties of extension worker Dr. Rukhsana Vighio12 Health - signs and benefits - group work Dr. Ali Akhtar Shahani12 Disease ranking - group work Dr. Rukhsana Vighio12 Examination of sick animals Dr. Ghanshamdas12 Occurrence and spread of disease Dr. Ali Akhtar Shahani13 Important Viral diseases of small ruminants Dr. Ali Akhtar Shahani13 Important viral diseases of large ruminants Dr. M. Mubarak Jatoi13 Important bacterial diseases of small ruminants Dr. Ali Akhtar Shahani13 Important bacterial diseases of large ruminants Dr. Ghanshamdas13 Eradication of contagious diseases - surveillance and reporting system Dr. M.Soomar Khoso14 Important Protozoal diseases of ruminants Dr. Ali Akhtar Shahani14 Mastitis - causes, symptoms, losses, diagnostic methods and control Dr. Ali Akhtar Shahani14 Endo parasitic diseases - causes, symptoms and treatment Dr. M. Mubarak Jatoi14 Ecto parasitic diseases - causes, symptoms and treatment Dr. M. Mubarak Jatoi14 Digestive disorders Dr. Ghanshamdas15 Principles of immunization - vaccination schedule Dr. Talib Hussain Chandio15 Sample collection and submission for laboratory diagrnosis Dr. Perkash Dewani15 Systems and management of poultry farming at village level Dr. Aziz Ahmed Khan15 Basic poultry feed formulation at village level Dr. Aziz Ahmed Khan15 Vaccination of ruminants - dosage and techniques - practical Dr. Ali Akhtar Shahani16 Weekly written test 216 Contagious poultry diseases - vaccination schedule Dr. Aslam Jalali16 Avian influenza - current situation and measures for its prevention Dr. Aslam Jalali16 Presentation of group leaders16 Comment from UNDP representative16 Distribution of certificates16 Address by the Chief Guest
Appendix L
Review and Suggestions from
Major Related Projects in the Past
- Study of Pakistan Livestock & Dairy Development Board
- Study of the Pakistan Dairy Development Company (PDDC)
- Study of the Prime Minister`s Special Initiative for Livestock Project
- Study of Strengthening of Livestock Services in Sindh (SLSP)
- Study of the Community Empowerment through Livestock Development
and Credit
- Review of Sindh Dairy and Meat Development Company (SDMDC)

Report - Study of Pakistan Livestock & Dairy Development Board Appendix L - 1
Appendix L
Survey Report
On
the Review and Suggestions from Major Related Projects in the Past
Dr. Yameen Memon
Consultant
February, 2011
Report - Study of Pakistan Livestock & Dairy Development Board Appendix L - 2
Study on the Livestock & Dairy Development Board
Acronyms
AJK Azad Jammu & Kashmir
DPC Deputy Project Coordinators
FANA Federal Administered Northern Areas
FATA Federal Administered Tribal Areas
FMD Foot and Mouth Disease
HS Hemorrhagic Septicemia
JICA Japan International Cooperate Agency
LDDB Livestock & Dairy Development Board
MCT Milk Chillers Technicians
MINFAL Ministry of Food, Agriculture & Livestock
MOU Memorandum of Understanding
PDDB Pakistan Dairy Development Board
PDDC Pakistan Dairy Development Company
SPU Semen Production Unit
VLW Village Livestock Workers
Report - Study of Pakistan Livestock & Dairy Development Board Appendix L - 3
1 Introduction
The project report presents the lessons learnt from Livestock & Dairy Development Board
(LDDB) project by reviewing the information from the secondary sources, interviewing the
relevant stakeholders and visiting the fields. The study has been undertaken for Kaihatsu
Management Consulting Inc. (KMC) & C.D.C. International Cooperation to facilitate in
preparation of the Master Plan Study on Livestock, Meat and Dairy Development in Sindh
Province.
1.1 Field Visits and Meeting with the Relevant Stakeholders
The Consultant made visits to various relevant places and convened meeting with the pertinent
stakeholders in relation to the assignment. The list of persons met is presented as Annex –I
2 Background:
Until very recently the importance of the livestock commensurate with its contribution to the
national economy was never fully appreciated and recognized. However the age old perception
about this sector are now changing for the better. The President, the Prime Minister and the
Ministers are talking about the importance of livestock, therefore, Ministry of Food Agriculture
and Livestock, Government of Pakistan had established an autonomous agency under companies
Act namely Livestock & Dairy Development Board (LDDB) to promote development of
livestock in the country.
The Livestock & Dairy & Development Board has been implementing the project entitled “Milk
Collection, Processing and Dairy Production & Development Program” with the total cost of
Rs.1520.847 Million in all four provinces including AJK, FANA and FATA from 2006 to 2011.
3 Objective of the Project
The overall objectives of the proposed program was to increase milk production by about 10-
15% thus ensuring better availability of milk and milk products in the country. The specific
objectives were to:
Move from subsistence dairying farming to market oriented farming (more than 10,000
rural substance dairy farmers are likely to enter into the milk marketing chain due to
project interventions);
Produce 20,000 additional breeding animals of better genetic potential for milk
production;
Improve milk collection and marketing from small and landless dairy farmers through
farmer organizations in order to improve livelihood of dairy farmers (production and
marketing of milk is expected to increase the milk production by 30-40% in the project
area); and
Make available superior quality and progeny tested bulls for genetic improvement.

Report - Study of Pakistan Livestock & Dairy Development Board Appendix L - 4
4 Expected Outcomes
The following were the quantifiable targets for overall project at the end of 5 years:
Form 300 village based farmers’ organizations, and establish 300 milk cooling
centers;
Mobilize and train 500 milk collectors;
Register 3,000 and 1,000 market-oriented rural and progress dairy farmers
respectively;
Establish operational mechanism for provision of services and feed to the registered
farmers;
Produce and market additional 35,000 liters of milk per day in the project area;
Register 800 and 600 additional farmers in Punjab and Sindh respectively in progeny
testing program;
Establish two and three calf rearing centers in Punjab and Sindh respectively;
Production of 500,000 frozen doses of semen from the progeny tested bulls; and
Make operational milk processing plant in NWFP.
5 Planned Activities
The following main activities are envisaged in the program:
Registration and formation of farmer organizations of small and landless dairy farmers;
Establishment of milk cooling centers;
Establishment feedlot fattening farms for Beef and Mutton;
Establishment of Slaughter Houses;
Establishment of Butcheries;
Capacity building for Butchers, registered farmers, Village Livestock Workers (VLWs);
Provision of technical and financial assistance to the registered farmers;
Creation of linkages between producer and processors;
Production of quality breeding animals;
Initiation and implementation of progeny testing program;
Technical assistance for production of quality breeding animals;
Arranging animal fairs and exhibitions for sale of quality stock produced by farmers; and
Coordination with various organizations and stakeholders.
6 Administrative Arrangements for Project Implementation
The LDDB is made responsible for planning, execution and implementation of the project
activities throughout the country having its federal office at Islamabad. The Deputy Project
Coordinators (DPC) at project areas. The DPC of Sindh is based at Hyderabad. He is assisted
staff including Field Operation Managers, Progeny Testing Mangers, Personal Assistant, Admin
and Finance Assistant and support staff including drivers and office boy.
Report - Study of Pakistan Livestock & Dairy Development Board Appendix L - 5
The federal office develops overall project action plan, coordinates with various offices in the
provinces, and monitors and evaluates project activities on quarterly and yearly basis. The Board
assesses the project progress and monitoring reports and approves the work/ action plans.
7 Implementation of the Project in Sindh
The project is being implemented in nine districts of Sindh Province including: Tando
Mohammad Khan, Tando Allahyar, Badin, Thatta, Matiari, Shaheed Benazirabad (Nawabshah),
Sanghar, Sukkur and Ghotki. So far achievements are presented below:
Milk Collection and Marketing for Small and Landless Farmers
The project has established 75 farmer organizations involving 5,079 farmers in all nine districts
after identifying various villages where potential milk was available. These farmer organizations
have signed MOU/Agreement with LDDB and have opened joint bank accounts.
The members of these organizations have been provided veterinary cover including vaccination
–66,792 animals were vaccinated against HS disease, while 24,710 animals were vaccinated
against FMD. A total 12,542 adult and calves have been provided de-worming.
Trainings have been imparted to 50 Milk Chillers Technicians (MCTs) and Village Livestock
Workers (VLWs) from Chiller Manufacturer Company and Sindh Agriculture University Tando
jam respectively. In addition 3,714 farmers have been trained at the field level.
Total 21 milk chiller units have been installed along with generators and milk testing kits were
provided to these organizations in addition, the support of concentrate feed and first aid
veterinary cover on revolving basis was provided.
Total 22,682.5 and 326,410 kgs fodder seed and concentrates respectively have been distributed.
The medicines worth Rs.815,328 and 4,871 kg of Booster Vanda have been provided to the
registered farmers.
The equipment related to semen collection and artificial insemination has been provided to
Semen Production Unit at Experiment and Research Buffalo Kundi Farm Rohi and Experiment
and Research Red Sindhi Cattle Farm Korangi Karachi.
One Semen Production and Calf Rearing Center is under construction in private sector on cost
sharing basis (50-50%).
Provision of Services to the Progressive Farmers
The project has registered 142 progressive farmers and 19,153 animals.
In all seven AI technicians have been trained.
Total 38, 218 animals were vaccinated against HS disease, while 14,073 animals were
vaccinated against FMD.
De-worming of calves and adult animals were 8,670 and 3,486 respectively
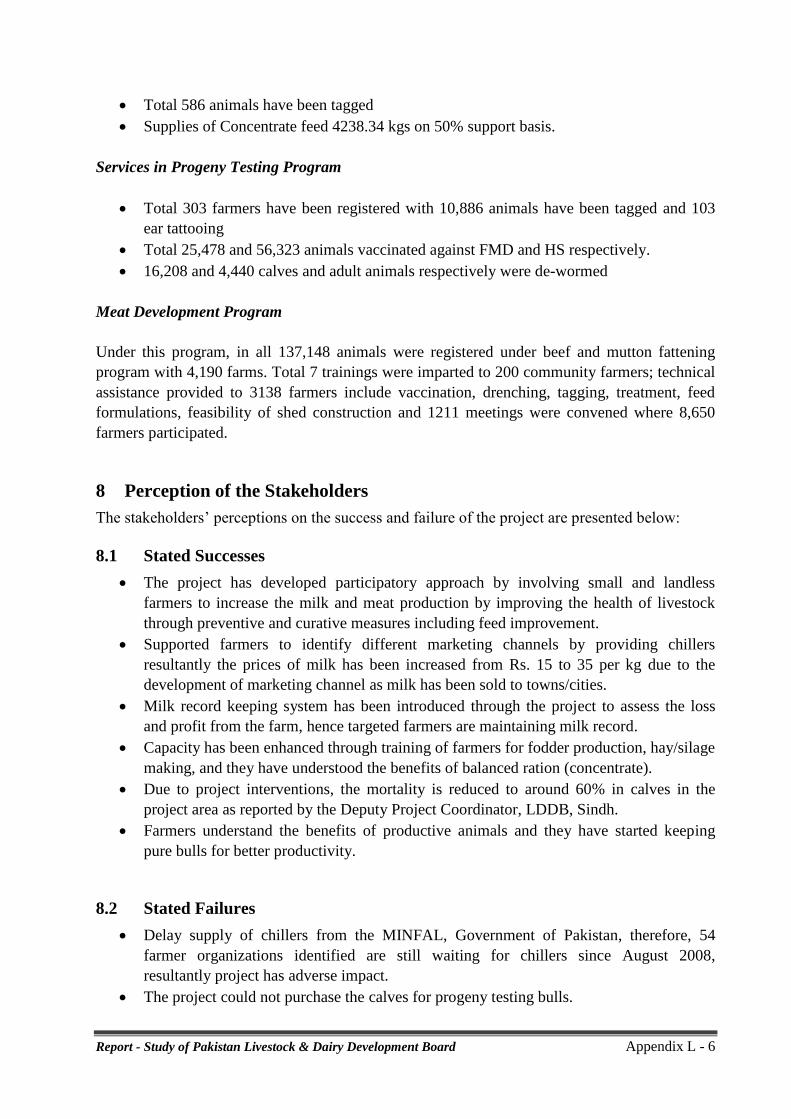
Report - Study of Pakistan Livestock & Dairy Development Board Appendix L - 6
Total 586 animals have been tagged
Supplies of Concentrate feed 4238.34 kgs on 50% support basis.
Services in Progeny Testing Program
Total 303 farmers have been registered with 10,886 animals have been tagged and 103
ear tattooing
Total 25,478 and 56,323 animals vaccinated against FMD and HS respectively.
16,208 and 4,440 calves and adult animals respectively were de-wormed
Meat Development Program
Under this program, in all 137,148 animals were registered under beef and mutton fattening
program with 4,190 farms. Total 7 trainings were imparted to 200 community farmers; technical
assistance provided to 3138 farmers include vaccination, drenching, tagging, treatment, feed
formulations, feasibility of shed construction and 1211 meetings were convened where 8,650
farmers participated.
8 Perception of the Stakeholders
The stakeholders’ perceptions on the success and failure of the project are presented below:
8.1 Stated Successes
The project has developed participatory approach by involving small and landless
farmers to increase the milk and meat production by improving the health of livestock
through preventive and curative measures including feed improvement.
Supported farmers to identify different marketing channels by providing chillers
resultantly the prices of milk has been increased from Rs. 15 to 35 per kg due to the
development of marketing channel as milk has been sold to towns/cities.
Milk record keeping system has been introduced through the project to assess the loss
and profit from the farm, hence targeted farmers are maintaining milk record.
Capacity has been enhanced through training of farmers for fodder production, hay/silage
making, and they have understood the benefits of balanced ration (concentrate).
Due to project interventions, the mortality is reduced to around 60% in calves in the
project area as reported by the Deputy Project Coordinator, LDDB, Sindh.
Farmers understand the benefits of productive animals and they have started keeping
pure bulls for better productivity.
8.2 Stated Failures
Delay supply of chillers from the MINFAL, Government of Pakistan, therefore, 54
farmer organizations identified are still waiting for chillers since August 2008,
resultantly project has adverse impact.
The project could not purchase the calves for progeny testing bulls.

Report - Study of Pakistan Livestock & Dairy Development Board Appendix L - 7
Project activities have been stopped on the instruction of MINFAL from 2008 to May
2009 and again from July 2010 to date due to non release of operational funds.
Instruments are not provided specifically for semen production unit (SPU) and calve
rearing center (CRC).
9 Project Analysis
Sustainability: The farmers fetch immediate benefits from milk with initial mobilization and
training. Therefore in the project, farmers were motivated to form milk producing groups and
start milk collection and marketing. Hence out of 21 chillers provided in the project, 20 are still
functional. One chiller is non functional due to conflict among community members themselves.
This model of milk providing groups and collective marketing seems successful and can be
sustainable with due mobilization and technical assistance. Besides other 40 milk producing
groups formed under the project, reportedly, are also motivated to run a chiller participatory
business if provided by the project. Moreover, after the pullout by the project, most of the
chillers are functional and working, which itself is an indicator of sustainability.
Whereas the fattening of animal for meat production, what, requires longer duration in relative
terms, and has been a challenge for the project and farmers. This component involves direct
subsidy as a cash payment which provides immediate relief but could not be successful. It has
been observed that after the pullout by the project, farmers could not continue these practices,
hence it is concluded that this component is not sustainable.
9.1 Factors of Success or Failures:
Successes
Farmers’ awareness and understanding has been increased due to capacity building
program and adoption of modern practices in health management, and marketing
channels.
As stated by the farmers and Deputy Project Coordinator, LDDB, Sindh, the productivity
of milk and meat has been increased (around 5%) and mortality reduced in animals
(around 30%) and particularly in calves (around 60%) due to project interventions.
Farmers were motivated to form milk producing groups and start milk collection and
marketing. Hence out of 21 chillers provided in the project, 20 are still functional. One
chiller is non functional due to conflict among community members themselves.
Failures
Since superior quality progeny tested bulls for genetic improvements of Red Sindhi
cattle and Kundi buffaloes are not available, consequently the program of breed
improvement has no significant success.
Chillers committed to the farmer group could not be supplied to them as per schedule of
the program, therefore, farmers shown their concerns on the program.
The purchase of calves from elite milk producers mothers could not be made according
to the program, therefore, the breed improvement program was not materialized.

Report - Study of Pakistan Livestock & Dairy Development Board Appendix L - 8
Project activities have been stopped on the instruction of authorities from 2008 to May
2009 and again from July 2010 to date due to non release of funds, resultantly
discontentment among livestock farmers has been observed.
The fattening of animal for meat production involves direct subsidy as a cash payment
which provides immediate relief but could not be successful. It has been learnt that only
30% of farmers are practicing the fattening program.
9.2 Major Lessons Learnt for the Master Plan
Some of the lessons learnt are:
In this project superior quality progeny tested bulls for genetic improvements of Red
Sindhi cattle and Kundi buffaloes as envisaged in this project could not be provided and
project ended with no results. In order to improve the livestock breed and conduct pilot
research on different aspects of livestock needs project activities continue for more than
10 years.
The milk adulteration issues must be addressed at all levels including production,
collection and processing units/ levels through implementation of the legislation, so that
the role of middleman in the market is minimized and profit share goes to the farmer.
References
1. Report of Dairy Development Board, Regional Office Sindh Hyderabad
2. Milk Collection, Processing and Dairying Production & Development, PC-1, Government of
Pakistan, June 2006.
Annex I - Persons Met
1. Dr. Ghulam Hussain Dawach, Deputy Project Coordinator, LDDB Sindh Hyderabad
2. Dr.Mushtaque Hussain Jokhio, Feedlot Fattening Specialist, LDDB Sindh, Hyderabad.
3. Dr. Himraj Veterinary Officer, LDDB, Mirpurkhas.
4. Mr. Mohd Bux, Farmer, Umerkot Road near Mirpurkhas.
5. Mr. Shoukat, Farmer Umerkot Road near Mirpurkhas.
6. Syed Osaf Rasool Shah, Farmer, Haji Pir Shah Village, old Shadi Pali, District
Mirpurkhas.
7. Dr. Fayaz Laghari Superintendent, Livestock Experiment and Research Kundi Buffalo
Farm, Rohri.
8. Dr. Mohammad Allam Solangi, Deputy Director, Semen Production Unit, Livestock
Experiment and Research Kundi Buffalo Farm, Rohri.

Report - Study of the Study of the Pakistan Dairy Development Company (PDDC) Appendix L - 9
Study of the Pakistan Dairy Development Company (PDDC)
Acronyms
DVM Doctor of Veterinary Medicines
JICA Japan International Cooperate Agency
KMC Kaihatsu Management Consulting
MINFAL Ministry of Food, Agriculture & Livestock
NGO Non Government Organization
NRSP National Rural Support Program
PDDC Pakistan Dairy Development Company
SAFWCO Sindh Agricultural and Forestry Workers Coordinating Organization
SRSO Sindh Rural Support Organization
SWOG Dairy Strategic Working Group
USAID United States Agency for International Development

Report - Study of the Study of the Pakistan Dairy Development Company (PDDC) Appendix L - 10
1 Introduction
The report presents the lessons learnt from the Pakistan Dairy Development Company (PDDC)
project by reviewing the data collected from the secondary sources, interviewing the relevant
stakeholders and by visiting the project areas. The study has been undertaken for the Kaihatsu
Management Consulting Inc. (KMC) and C.D.C. International Corporation to support the project
of Master Plan Study on Livestock, Meat and Dairy Development in Sindh Province.
1.1 Field Visits and Meeting with the Relevant Stakeholders
The consultant made visits to various relevant places and convened meetings with the pertinent
stakeholders in relation to the assignment. The list of persons met is presented as Annex – 1.
2 Background
Pakistan Dairy Development Company (PDDC) has been established as a public-partnership to
coordinate the dairy development activities of the private sector. It is registered under section 32
of the Companies Ordinance 1984. PDDC aimed to establish a strategies direction for realizing
the Dairy sector of Pakistan and is determined to establish one of the best private-public
Partnership cultures. The process was initiated by the industry in partnership with government
while strategic support was provided by the Dairy Strategic Working Group (SWOG) of USAID
program.
3 Project Components
PDDC project was initiated for five years (2006 – 2011), with the following components:
i. Model farm program
ii. Cooling Tanks Program.
iii. Biogas Program
iv. Community Farm Program
v. Rural Service Provider
vi. PDDC Extension Service
4 Goal, Objectives and Activities of the Project
The project goal is to enhance milk and meat production of livestock small farmers.
The specific objectives and activities of the various components of the project are presented
below:
Establish Farmer Model for Development of Dairy Sector
Activities:
Provides cost effectives ways to install essential infra-structure for the proper
management of dairy herds;

Report - Study of the Study of the Pakistan Dairy Development Company (PDDC) Appendix L - 11
Trains active farmers in the farm management practices necessary to achieve production
potential of their herds; and
Enhances farm incomes by mentoring and advising farmers throughout the transition to
modern practices.
To provide education and training to farmers
Provide Technical Support to Construct Biogas Plant by the Farmers
Activities:
To provide cheaper source of fuel for cooking;
To improve hygienic conditions at the farm and in the home;
To improve livelihood of the dairy farmers; and
To provide bio slurry (rich source of Nitrogen) for field.
Provide Technical Know How for Low Cost Fodder Production
Activities:
To provide low cost fodder for dairy animal for the promotion of dairy industry;
To minimize the labor cost by introducing mechanization in fodder production; and
To provide technology for better fodder production and conservation.
Establish Community Farm by Providing Technical Support
To establish community farms in five districts of Sindh; and
To provide technical and financial support through bank.
To provide education and training to farmers
Establish Cooling Tanks to Access Milk Marketing to Farmers
To provide market access to small milk producers, middlemen and milk processing
plants; and
To protect milk from adulteration.
5 Expected Targets
The following targets were set in five districts of Sindh (Mirpurkhas, Umerkot, Dadu, Sukkur
and Nawabshah):
Establishment of 270 model farms;
Installation of 83 cooling tanks;
Construction of 57 biogas plants;
Organization of field days, training, and farm days and
Establishment of 26 community farms in the targeted areas
6 The Role and Linkages with Various Organizations
Project linkages have been developed with various NGOs and other organizations like
SAFWCO, SRSO, NRSP, Aga Khan Economic Board, Livestock Department, Government of

Report - Study of the Study of the Pakistan Dairy Development Company (PDDC) Appendix L - 12
Sindh, Local Farmer’s Associations, Sindh Agriculture University Tando Jam, ICI Pakistan and
Nestle Pak Ltd.
7 Implementation of the Project
Component/Activity Target Accomplishment
Model farms 270 213
Community farms 26 26
Bio gas plants 57 57
Milk Cooling Tanks 83 83
Field days organized 20
Milk collection and transportation1
Implementation of pasteurization program2
8 Perceptions of the Stakeholders
The stakeholders’ perceptions on the successes and failures are presented below:
Success
The company facilitates the target farmers to avail the Bank loan facility to establish
livestock model farm. The company pays the interest of the loan on the borrowed amount,
whereas farmer has to repay the capital/borrowed amount to the bank, hence farmer owns
the investment made in the farm.
Due to proper livestock management practices, around 60% of the livestock mortality
has been reduced and around 10% milk and meat production increased as perceived by
the Project Farm Manager and farmers.
The farmers are keeping only productive animals and raising calves for fattening.
Due to the project interventions, farmers understand the need of animals i.e. feed,
concentrates, water, pre and post care of parturition, hence they have started practicing
feeding concentrates, providing water according to animal need and pre and post care of
parturition.
Failures
Initially due to supply of low quality equipment / materials (Shavers, pipes, water pumps,
chafing machines, fencing materials) to the farmers created negative impact on the
project.
Due to financial constraints the project field activities are on hold since 2008 which in
result has not only stopped the process but de-motivated farmers for their participation in
the project.
Farmers are always expecting cash or kind (like feeds etc.) as has been done in other
projects like LDDB.
1 The program could not be implemented.
2 The program could not be implemented.

Report - Study of the Study of the Pakistan Dairy Development Company (PDDC) Appendix L - 13
Change of ministries from Ministry of Industries to MINFAL created administrative and
financial problems. Since Officers of MINIFAL were not involved in the inception of the
project, therefore, they had different perceptions of the project activities.
9 Project Analysis
9.1 Factors of Success and Failure
Success
The rural communities use wood and animal dung as a source of kitchen fuel. It creates
smoke and causes women health hazards. Due to installation of biogas plants, de-
forestation and health hazards has been decreased.
Per animal productivity in milk (around 5%) and economic profitability (around 25%)
has been increased due to project interventions as awareness among farmers for better
feeding, breeding, management and health cover were provided through the project
activities as stated by the farmers interviewed.
Milk market activities increased due to installation of milk collection tank program.
Failure
Most of the project activities were stopped before their maturity, however, sustainability
is questionable at this time as the transformation of farmers from traditional farming to
progressive farming and enterprising is a daunting task which required continued process
of mobilization and support. The results of a process stopped half way are obviously
affecting sustainability.
9.2 Major Lesson learned for Master plan
Some of the lessons learnt are:
To develop the livestock sector as a whole, the needs of the small landholders, landless
livestock owners or tenants to be identified and supported through package of husbandry
innovation for rural farm animals demand that technologies that are cost effective,
efficient, practicable and most appropriate to local conditions should be introduced on
mass scale, which will enable them to stand on their feet and make the livestock
production system more sustainable and viable.
In order to develop efficient and affordable animal sheds, the design of sheds if made by
the livestock housing experts it will improve the design and farmers may be attracted to
replicate.
As farmers are selling their draught animals on lower prices in the market, hence it is
suggested that an awareness program be started that the farmer may feed these animals
for some time to improve their weight to fetch good prices in the market.
Introduction of processing technologies like establishment of milk processing plants and
meat processing plants (modern slaughter houses) should be considered by the
government so that farmers get better prices of their products.
Report - Study of the Study of the Pakistan Dairy Development Company (PDDC) Appendix L - 14
References:
1. The White Revolution- Dhoodh Darya, June 2006. Huma Fakhar et al, Market Fakhar
Law International.
2. Livestock and Dairy Development Basic Study Report, August 2009.
3. Rural Livestock Production in Pakistan by Mohammad Younis & Mohammad
Yaqoob, Research Paper, Department of Livestock Management, Faculty of Animals
Husbandry, University of Agriculture Faisalabad, Pakistan.

Report - Study of the Study of the Pakistan Dairy Development Company (PDDC) Appendix L - 15
Annex-I Persons Met
1. Dr. Rasool Bux Soomro, Farm Manager PDDC, Hyderabad.
2. Dr. Zahid Mangrio, PDDC, Umerkot.
3. Mr. Bashir Ahmad Mehar, Livestock Farmer, Village Frush Mori, District Umerkot.
4. Mr. Ahmad Halepoto, Livestock Farmer, Village Habib Halepoto, District Umerkot.
5. Mr. Mohammed Musa, Livestock Farmer, Village Habib Halepoto, District Umerkot.
6. Mr. Allhwaryio, Livestock Farmer, Village Habib Halepoto, District Umerkot.
7. Mr. Sahibdine, Livestock Farmer, Village Habib Halepoto, District Umerkot.
8. Mr. Mohammed Sallar, Village Habib Halepoto, District Umerkot.

Draft Report on Prime Minister`s Special Initiative for Livestock Appendix L - 16
Study on the Prime Minister`s Special Initiative for Livestock Project
Acronyms
AI Artificial Insemination
AJK Azad Jammu & Kashmir
AKRSP Aga Khan Rural Support Program
BRSP Balochistan Rural Support Program
CEO Chief Executive Officer
CLEW Community Livestock Extension Workers
CO Community Organizations
CVDL Central Veterinary Diagnostic Laboratory
DLO District Livestock Officer
DMV Doctors of Veterinary Medicines
FANA Federal Administered Northern Areas
FATA Federal Administered Tribal Areas
GBTI Ghazi Barotha Taraqiati Idara
IEC Information, Education and Communication
JICA Japan International Cooperate Agency
KMC Kaihatsu Management Consulting, Inc.
MINFAL Ministry of Food, Agriculture & Livestock
NRSP National Rural Support Program
NSC National Steering Committee
PCC Provincial Coordination Committee
PMU Project Management Unit
PRSP Punjab Rural Support Program
RSP Rural Support Programs
RSPN Rural Support Program Network
SMT Social Mobilization Team
SRSO Sindh Rural Support Organization
SRSP Sarhad Rural Support Program
TRDP Thardeep Rural Development Program

Draft Report on Prime Minister`s Special Initiative for Livestock Appendix L - 17
1 Introduction
The report presents the lessons learnt from the Prime Minister’s Special Initiatives for Livestock
Project by reviewing the information/ data collected from the secondary sources, interviewing
the relevant stakeholders, and visiting the fields. The study has been undertaken for Kaihatsu
Management Consulting, Inc. (KMC) in coordination with Japan International Cooperate
Agency (JICA) to facilitate in preparation of the Master Plan Study on Livestock, Meat and
Dairy Development in Sindh Province.
1.1 Field Visits and Meeting with the Relevant Stakeholders
The consultant made visits to various relevant places and convened meetings with the pertinent
stakeholders to accomplish the task. The list of persons met is presented as Annex – 1.
2 Background
The Prime Minister’s Special Initiative for Livestock Project was initiated by the Ministry of
Food, Agriculture & Livestock nationwide (all four provinces, AJK, FANA and FATA) in
January 2007 initially for 5 years time period. The project was envisaged to implement in 80
districts, 1,963 Union Councils and for over 13 million rural poor/small farmers with the total
cost of Pak Rs. 1,696.40 Million supported by the Government of Pakistan. The key project
stakeholders were: MINFAL, RSPN, RSPs (AKRSP, BRSP, GBTI, NRSP, PRSP, SRSO, SRSP,
TRDP), Provincial Governments, District Governments, Livestock Training Institutes, and Rural
Poor/Livestock Farmers through Community Organizations.
3 Objectives of the Project
The main objectives of the project were to:
Enhance the livestock productivity by using social mobilization mechanism for provision
of improved veterinary services at farmers’ doorsteps targeting 13M rural poor for
Pakistan and 3M rural poor for Sindh;
Create rural livestock assets, 12.17M liters annual additional milk production for
Pakistan and 3M liters for Sindh and 0.20M tons for Pakistan and 0.047M tons for Sindh
annual additional meat production after completion of the project; and
Reduce poverty among the small livestock farmers.
4 The Project Activities
The project activities devised in the project were to:
Establish veterinary clinic at the field unit level and provide animals health artificial
insemination, livestock production extension services and curative and preventive
treatment;
Advise farmers for animals fattening breed improvement, milk production enhancement,
and improved farm management practice;
Draft Report on Prime Minister`s Special Initiative for Livestock Appendix L - 18
Assist Community Organizations (CO) to identify male and female Community
Livestock Extension Workers (CLEWs);
Develop linkages and arrange with Government Institutes/Department for training of
CLEWs, supervise guide CLEWs on the job; and
Assist social mobilization teams (SMTs) in Social Mobilization and CO formation and
assist livestock farmers in accessing micro credit.
5 Salient Features of the Project
The objectives of the project were two pronged; first was the enhancement of livestock
productivity and second was the creation of rural livestock assets. The enhancement of livestock
productivity was to be achieved through the provision of livestock production and extension and
veterinary services at farmers’ doorsteps targeting 13 million rural poor. For this community
organizations of livestock farmers’ were to be created through Social Mobilization.
The RSPN has partnered with eight RSPs, these RSPs employ Doctors of Veterinary Medicines
(DMV) to oversee training and support. The DMVs are housed in a veterinary clinic that have a
clinic assistant and are given PKR 100,000 worth of veterinary supplies & Equipments. The
DMV is also provided with a motorbike to visit surrounding areas to treat and vaccinate animals.
The project also trains a cadre of 7,250 “self-employed” and voluntary Community Livestock
Extension Workers (CLEWs). These CLEWs are trained for one month at a government
Livestock Training institution in basic veterinary skills, and enhancement of meat and milk
production. The CLEWs get paid by community members for the services they offer and are in
touch with the DMVs in case of any emergency and outbreaks of disease. To create rural
livestock assets, the goal of the project was to help produce an additional 12.17 million liters of
milk and 0.2 million tones of meat.
6 The Roles of Various Organizations and Committees
The project was implemented under the auspices of the Ministry of Food, Agriculture and
Livestock, Government of Pakistan through National Rural Support Program Network (RSPN).
In order to implement the project, MINFAL created a project management unit and constituted
committees at different level. The roles and responsibilities of the relevant organizations and
committees are presented in the following sections:
6.1 MINFAL – Project Management Unit
The Project Management Unit (PMU) was established under MINFAL mainly to:
Prepare consolidated progress and annual reports and their presentation before the
National Steering Committee (NSC); and
Act as a liaison between NSC and RSPs through RSPN, monitor and coordinate the
activities and undertake performance reviews and provide secretarial support to the NSC.

Draft Report on Prime Minister`s Special Initiative for Livestock Appendix L - 19
6.2 National Steering Committee
The National Steering Committee (NSC) constituted to:
Provide strategic direction to the PMU in the management of PM’s Livestock Initiative;
Approve work plans for implementation, and set goals and targets for the RSPs;
Approve quarterly budgets for RSPs before these are released by the PMU;
Review and progress of work and approve quarterly and annual reports, accounts of the
RSPs;
Ensure the presence of an appropriate monitoring and accountability mechanism in the
PMU and RSPs for assessing the quantitative and qualitative progress of the project; and
Approve the selection and appointment of Third Party Auditor for auditing accounts/
activities of RSPs.
7 RSPN Project Implementation Unit
The project implementing partner created project implementation unit within RSPN largely to:
Develop in consultation with the RSPs annual and quarterly work plans and budgets and
submit these to PMU; and
Monitor and facilitate the RSPs in the implementation of project activities.
7.1 Rural Support Programs
The project implementation responsibility was with the Rural Support Programs (RSPs) working
in all four provinces, AJK, FANA and FATA. These include: AKRSP, BRSP, GBTI, NRSP,
PRSP, SRSO, SRSP, and TRDP. In Sindh TRDP, NRSP and SRSO were responsible to
implement the project. These organizations were obliged to:
Use the holistic approach of social mobilization as per the work plans and budgets
approved by the NSC;
Hire DVMs, DLOs and other project staff in a fair and transparent manner; and
Manage the implementation of this program.
7.2 Provincial Governments
The Provincial Coordination Committee (PCC) was formulated to:
Undertake physical progress review and coordinate with RSPs to ensure timely and
effective implementation of project activities;
Ensure complementarities with other projects and activities of the provincial and federal
government;
Advise MINFAL for improvements in the project;
Facilitate provision of medicines and vaccines; and
Facilitate project related technical training (e.g. CLEWs).
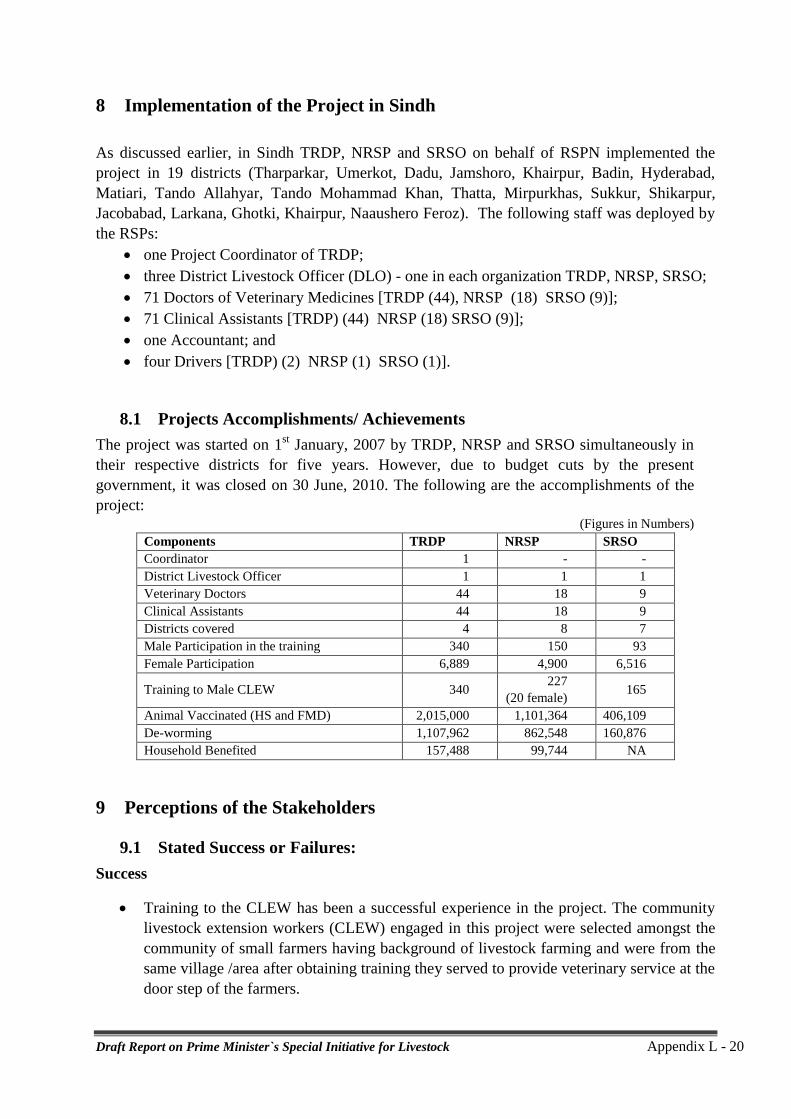
Draft Report on Prime Minister`s Special Initiative for Livestock Appendix L - 20
8 Implementation of the Project in Sindh
As discussed earlier, in Sindh TRDP, NRSP and SRSO on behalf of RSPN implemented the
project in 19 districts (Tharparkar, Umerkot, Dadu, Jamshoro, Khairpur, Badin, Hyderabad,
Matiari, Tando Allahyar, Tando Mohammad Khan, Thatta, Mirpurkhas, Sukkur, Shikarpur,
Jacobabad, Larkana, Ghotki, Khairpur, Naaushero Feroz). The following staff was deployed by
the RSPs:
one Project Coordinator of TRDP;
three District Livestock Officer (DLO) - one in each organization TRDP, NRSP, SRSO;
71 Doctors of Veterinary Medicines [TRDP (44), NRSP (18) SRSO (9)];
71 Clinical Assistants [TRDP) (44) NRSP (18) SRSO (9)];
one Accountant; and
four Drivers [TRDP) (2) NRSP (1) SRSO (1)].
8.1 Projects Accomplishments/ Achievements
The project was started on 1st January, 2007 by TRDP, NRSP and SRSO simultaneously in
their respective districts for five years. However, due to budget cuts by the present
government, it was closed on 30 June, 2010. The following are the accomplishments of the
project: (Figures in Numbers)
Components TRDP NRSP SRSO
Coordinator 1 - -
District Livestock Officer 1 1 1
Veterinary Doctors 44 18 9
Clinical Assistants 44 18 9
Districts covered 4 8 7
Male Participation in the training 340 150 93
Female Participation 6,889 4,900 6,516
Training to Male CLEW 340 227
(20 female) 165
Animal Vaccinated (HS and FMD) 2,015,000 1,101,364 406,109
De-worming 1,107,962 862,548 160,876
Household Benefited 157,488 99,744 NA
9 Perceptions of the Stakeholders
9.1 Stated Success or Failures:
Success
Training to the CLEW has been a successful experience in the project. The community
livestock extension workers (CLEW) engaged in this project were selected amongst the
community of small farmers having background of livestock farming and were from the
same village /area after obtaining training they served to provide veterinary service at the
door step of the farmers.

Draft Report on Prime Minister`s Special Initiative for Livestock Appendix L - 21
Social mobilization to the small farmers’ was needed to understand the concept. Most of
the farmers do not understand the objective of the project activities and their benefits.
Though community extension workers, the farmers understand the message about the
benefits.
Government role in the monitoring process of the project has been supportive as
Provincial Coordination Committee headed by the Ex-Secretary, Livestock Department
convened meetings of relevant officials and paid visits to monitor the project activities.
Failure
The field vehicles were not exclusively provided to the Veterinary Doctors and their
visits were jointly planned with social organization and microcredit teams; therefore,
they were constrained to follow their own work plan.
During emergencies or outbreak of diseases, like H.S, FMD, PPR, and Anthrax, essential
required medicines and vaccines were not available. On the other hand, Veterinary
Doctors were not authorized to purchase any medicines, vaccines, de-wormers etc. from
the market on their own to handle the emergency; resultantly in some cases the farmers
were not benefited.
Due to financial constraints, project activities were discontinued after three years of
project period, consequently the project objectives could not be achieved as planned for
example the service of artificial insemination (AI) for the improvement of genetic
potential of the livestock could not be provided as these were planned for the last two
years of the project.
Similarly, training on AI was not imparted to the CLEWS in the project as it was
envisaged in the fourth year of the project.
Project Veterinary Officers at the field level were unable to obtain technical support
/advice from staff of livestock departments on disease control particularly in case of any
outbreak of animal diseases as they did not have direct linkages with them.
Since it was envisaged that each clinic will be provided with Rs.400,000 as a revolving
funds, Rs.100,000 for equipment and Rs. 70,000 and Rs. 75,000 for Office furniture of
motorcycle respectively of as one time grant for its sustainability but it could not be
materialized.
10 Project Analysis
Sustainability: The sustainability of the project was dependant of social mobilization, training,
service products including medicines and ratification insemination and establishment of clinics
of qualified veterinary doctors through government grants. Two dependant factors social
mobilization and training of CLEW were done as per the project plan, whereas medicines and
semen were not provided as well as clinics were not established by Doctors, thus sustainability
of the project came under risk.
It could be concluded that social mobilization and trainings of CLEW will continue its positive
impact, which in result may motivate farmers for treatment of their animals and go for artificial

Draft Report on Prime Minister`s Special Initiative for Livestock Appendix L - 22
insemination. This could further be strengthened by supplementing the missing parts by another
project by government or other donor to take the stock forward.
10.1 Factors of Success and Failures
Successes
Veterinary clinics established at field unit level equipped with qualified veterinary
doctors and trained CLEWS effectively provided livestock production extension services
(preventive and curative) at the door step of small livestock farmers has been a
successful model as perceived by the farmers and staff, resultantly around 60 percent
mortality rate has been reduced and around 5 percent milk production increased as
reported by the Project Coordinator and Veterinary Officers interviewed.
Around 20% of CLEW are still working in the field particularly in the rural areas who
are connected with the NRSP and TRDP (where there centers are working), whereas the
rest of them based in towns/cities could not continue as they have no funds money to buy
the medicines and support to get the credit.
Effective role of male and female CLEW in preventive and curative animal diseases at
the door step of small farmers in their respective areas played key role in the success. As
they have been earning Rs.1500 - 2000 per month for themselves.
Out of 71, 20 clinics are still functioning after three years (project ended) through the
resources of TRDP and NRSP.
The concept of service charges from the farmers has been accepted by the community
that supports for financial sustainability of the sector.
Animal migration reduced to around 50% as animals had to travel long distance (around
100 kms) from desert to irrigated areas. The migration was being made due to
unavailability of fodder in desert area. However, due to recent past rains and provision of
feed through the project, the animal migration had reduced.
due to recent rains in the area and project intervention as perceived by the staff and
community.
Failures
The component of AI, breed improvement, nutritional and fattening program could not
be implemented for reasons that semen and liquid nitrogen were not supplied to the
project.
Occasionally releases of finances from the Government to the implementing
organizations delayed the planned project activities during the implementation of the
project.
Discontinuation of the project after 3 years period could not achieve the project
objectives fully like AI services etc.
The concept of the revolving funds for sustainability of the veterinary clinics through the
trained Veterinary Doctors could not be materialized due to sudden stoppage of the
project.

Draft Report on Prime Minister`s Special Initiative for Livestock Appendix L - 23
10.2 Major Lessons Learnt for the Master Plan
The lessons learnt from the project are:
The project initiated with the activities detailed out for five years and chopped off after
three years could not give the desired results.
The reasonable subsidies on feed, medicines, vaccines for the poor livestock farmers will
encourage to keep the animals for their livelihood, as these farmers are unable to afford
the high prices of medicines and vaccines.
Organization of the trainings, refresher courses and follow-ups be considered a
significant contribution towards livestock development, however, need assessment be
made part of the capacity building programs.
Livestock services should be at the door step of the farmer, as mostly farmers do not take
livestock to the hospital for treatment and vaccination. In this case, the mobile veterinary
clinic model will work.
A well designed monitoring mechanism with transparent accountability ensures the high
rate of project success as learnt from the discussions with the project officials, as
participatory review process as monitoring tool will be helpful.
The baseline, midterm impact evaluation, and the end line should be the part of the
project. The project baseline could not be made at the start of the project, whereas the
final evaluations (end line) could not be done as the project closed before the specified
time. As the baseline, midterm and final evaluation of the project is of significance
importance, it is recommended that these studies be carried out.
Easily understandable Information, Education and Communication (IEC) material in
local languages guides to the farmers, communities and technical persons as it was
lacking in this project as perceived by the communities in particular.
References
1. Livestock and Dairy Development Basic Study Report. Submitted by MAP Service
Group to JICA Pakistan Office Japan international Cooperation Agency, August 2009.
2. Progress Report of Prime Ministers Special initiative Livestock. February, 2007 to June
2010, National Rural Support Program, Badin Region.
3. M.A. Younis & M. Yaqoob, 2009. Rural Livestock Production in Pakistan.
Department of Livestock Management, Faculty of Animal Husbandry, University of
Agriculture Faisalabad. Pakistan.

Draft Report on Prime Minister`s Special Initiative for Livestock Appendix L - 24
Annex – 1 Persons Met
The meetings were convened with the following persons:
1. Dr. Zahid Hussain Mangrio, Veterinary Doctor PDDC, Umerkot.
2. Dr. Ghunsham Das, Veterinary Doctor TRDP, Umerkot.
3. Dr. Ashok Kumar, Veterinary Doctor, TRDP, Mithi.
4. Mr. Santosh Kumar, Community Livestock Extension Worker (CLEW), Village
Pabhohar, District Tharparkar.
5. Mr. Malook Livestock Farmers, Village Nanisar, Union Council Mithrio Bhatti, Taluka
Mithi, District Tharparkar.
6. Mr. Wasand, Livestock Farmers, Village Nanisar, Union Council Mithrio Bhatti, Taluka
Mithi, District Tharparkar.
7. Dr. Sono Khangarani, Chief Executive Officer (CEO), TRDP.
8. Dr. Jaimal Dhanani, Coordinator, Prime Minister Special Initiatives for Livestock Project.
9. Dr. Jhamandas, In charge CVDL Branch, Mithi.
10. Dr. Zeeshan, Veterinary Doctor NRSP, Tando Mohammed Khan.
11. Ms. Aneela Nizamani, Female CLEW NRSP, Village Bakhar Nizamani Taluka Tando
Mohammad Khan.
12. Ms. Shahnaz Khaskeli, Female CLEW NRSP, Village Rajo Nizamani, District Tando
Mohammad Khan.
13. Mr. Dildar Ali Nizamani Male CLEW Village Ghulam Mohammad Nizamani Taluka
Tando Mohammad Khan
14. Mr. Ubaidullah Solangi, CLEW, Village Shaikh Bhurikio, Taluka Tando Mohammad
Khan.
15. Mr. Ahmed Khan Soomro, Sub Cluster Coordinator Bisp PTS SRSO Sukkur Head
Office.
16. Dr. Mukhtiar A. Noonari, Ex – Coordinator SRSO, Sukkur.

Report - Study of Strengthening of Livestock Services in Sindh (SLSP) Appendix L - 25
Study of Strengthening of Livestock Services in Sindh (SLSP)
Acronyms
AI Artificial Insemination
AJK Azad Jammu Kashmir
CVDL Central Veterinary Diagnostic Laboratory
DLO District Livestock Officer
DAH Director Animal Husbandry
DG Director General
EA Executing Agency
EU European Union
FMD Foot and Mouth Disease
FPMU Federal Project Management Unit
GoP Government of Pakistan
HS Hemorrhagic Septicemia
JICA Japan International Cooperate Agency
KMC Kaihatsu Management Consulting, Inc.
LSMIS Livestock Sector Management Information System
M&E Monitoring & Evaluation
MINFAL Ministry of Food, Agriculture & Livestock
MTR Mid Term Review
NRSP National Rural Support Program
NARC National Agriculture Research Center
NGO Non Governmental Organization
NWFP North-West Frontier Province
PM&E Planning, Monitoring and Evaluation
PPMU Provincial Project Management Unit
PPR Pestedes Petites Ruminants
PSC Project Steering Committee
RP Rinderpest
SLSP Strengthening of Livestock Services in Sindh
SPO Strengthening Participatory Organization
UC Union Council
UNDP United Nations Development Program
VRI Veterinary Research Institute
WLEW Women Livestock Extension Worker

Report - Study of Strengthening of Livestock Services in Sindh (SLSP) Appendix L - 26
1 Introduction
The report presents the lessons learnt from the Strengthening of Livestock Services
Project (SLSP) by reviewing the data collected from the secondary sources, interviewing the
relevant stakeholders, visiting the field activities in the project areas. The study has been
undertaken by the consultations by Kaihatsu Management Consulting Inc. (KMC) and C.D.C.
International Corporation to support in preparation of the Master Plan Study on Livestock,
Meat and Dairy Development in Sindh Province.
1.1 Field Visits and Meeting with the Relevant Stakeholders
The consultant made visits to various relevant places and convened meetings with the
pertinent stakeholders in relation to the assignment; the list of persons met is presented as
Annex – 1.
2 Background
Initially the project was designed to eradicate Rinderpest disease from Pakistan. After
sometime the government declared that Pakistan is free from Rinderpest disease. Then the
project was converted into Strengthening of Livestock Services Project (SLSP). The project
had ten (10) components which at letter stage were integrated into five components.
The project covers the entire territory of Pakistan including AJK Northern Areas and
Ilamabad Capital Territory. It was being implemented from Islamabad being project’s
national headquarters and Lahore, Peshawar, Hyderabad and Quetta as provincial
headquarters.
The project was funded by the European Union (EU) and the Government of Pakistan (GoP).
The total project budget was Euro 25,942 M of which the EUs contribution as a grant was
Euro 22.9 M (88.3% of total budget), and that of GoP was the equivalent of Euro 3,042 M
(11.7%). Implementation of the project started from September 2003 and was supposed to
complete till September, 2009. Two-year project extension was provided till September, 2011.
3 Objective of the Project
The overall objective of the project was to assist the Government of Pakistan (GoP) to realize
the potential of the livestock sector, by improvement of farmers’ livelihoods through better
provision of livestock services, especially of disease control, and through enhancing
productivity.
The specific objective were to strengthen the GoP capacity to plan and manage the sustainable
delivery of public services to the sector in the context of a difficult economic situation, while
at the same time examining ways in which the private sector delivery of services can be
improved.

Report - Study of Strengthening of Livestock Services in Sindh (SLSP) Appendix L - 27
Beneficiaries: The immediate beneficiaries are the national, provincial and, eventually
district livestock services, while the ultimate beneficiaries are the farmers, particularly
smallholders, whose livelihoods will be improved.
4 Project Description and Components
As described by the Mid Term Review (MTR) mission, the project, which should be
considered as a process project rather than a technical blueprint approach, has ten components,
which are linked to different mechanisms of the sector. Activities in the field addressed the
two key areas, i.e. animal production (animal health, nutrition) and marketing. The project
targeted the problems of animal disease control. Following up on the progress made in the
final eradication of Rinderpest, the project could have brought its resources to bear on other
key diseases of socio-economic importance, which may include, for example, Foot and Mouth
Disease (FMD), Peste des petites ruminants (PPR), Haemorrhagic Septicaemia (HS) and
parasitic infestation. Animal nutrition and feed supply strategies, especially fodder supply,
together with the improvement of markets and the marketing system for internal as well as
external needs were also to be addressed by the project. The ten components were:
i. Policy and regulatory framework.
ii. Disease surveillance, diagnostic and reporting.
iii. Vaccine production.
iv. Strengthening of field veterinary service.
v. Human resource development.
vi. Interdisciplinary livestock sector research.
vii. Information and communication.
viii. Studies and surveys.
ix. Regional and sub-regional co-operation and coordinator.
x. Core project management.
5 Expected Outcomes
A summary of the main outputs expected were:
Final eradication of Rinderpest from the country;
Control of Foot and Mouth Disease (FMD) and other key disease through successful
progressive strategies;
Adequate status of animals nutrition and fodder supply;
Improved markets and marketing system for internal as well as for export needs;
Reliable Livestock Sector Management system;
Functional epidemiological units for proper diagnosis monitoring and surveillance of
animals disease; and
Federal and Provincial Governments are better able to address policy issue concerning
operation of the livestock sector.
In order to implement the recommendations of the midterm review of the project, the
government made revision in the project’s logical framework and project focused on the

Report - Study of Strengthening of Livestock Services in Sindh (SLSP) Appendix L - 28
delivery of results, rather than comprising a series of components. Thus SLSP was expected
to achieve:
Public and private sector service delivery system improved/ strengthened in selected
districts;
Disease reporting and surveillance system functional;
Model for improved productivity and service delivery demonstrated/ developed;
Information and communication system form central part of service delivery; and
Systems, capacities and structures for project management developed, followed and
transferred to GoP.
6 The Role of Various Organizations and Committees
The implementation partners are Federal Ministry of Food, Agriculture and Livestock
(MINFAL) which is the executing agency (EA) represented by its livestock wings and the
Provincial Departments of Livestock. The EA has established Project Steering Committee
(PSC) for policy guidelines and coordination between all institutions involved in this project.
The PSC assisted the EA in determining the project orientation and review work plan and
budgets.
A Federal Project Management Unit (FPMU) established by the EA at the Livestock Division
Headquarters in Islamabad, and headed by the one full-time National Co-Director appointed
by the EA and endorsed by the Commission, and one European Co-Director, appointed by the
Commission and endorsed by the EA, as Team Leader of the EC Technical Assistance Team.
Four Provincial Project Management Units (PPMUs) set up in the Livestock Departments of
each of the major Provinces (Balochistan, NWFP, Punjab and Sindh) and each headed by one
full-time National Co-Manager and one European Co-Manager appointed by the EA and
endorsed by the Commission,
7 Monitoring and Evaluation
Day-to-day technical and financial monitoring was part of the FPMU Co-Directors' and
PPMU Co-Managers' responsibilities. Independent consultants recruited directly by the EC on
specially established terms of reference to implement the external monitoring and evaluation
on behalf of the EA and the EC.
The baseline survey was carried out by the consultancy firm. Special Monitoring &
Evaluation (M&E) staff recruited and trained for this purpose. The mid term review was
carried out during 2006.
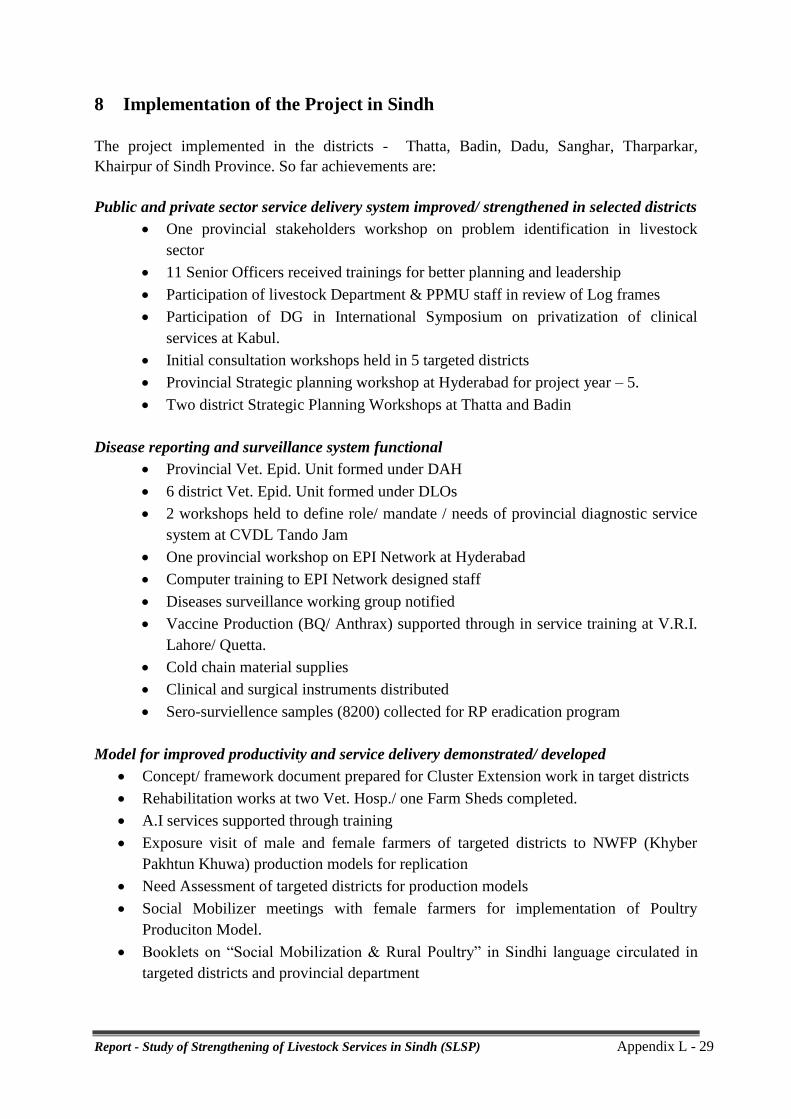
Report - Study of Strengthening of Livestock Services in Sindh (SLSP) Appendix L - 29
8 Implementation of the Project in Sindh
The project implemented in the districts - Thatta, Badin, Dadu, Sanghar, Tharparkar,
Khairpur of Sindh Province. So far achievements are:
Public and private sector service delivery system improved/ strengthened in selected districts
One provincial stakeholders workshop on problem identification in livestock
sector
11 Senior Officers received trainings for better planning and leadership
Participation of livestock Department & PPMU staff in review of Log frames
Participation of DG in International Symposium on privatization of clinical
services at Kabul.
Initial consultation workshops held in 5 targeted districts
Provincial Strategic planning workshop at Hyderabad for project year – 5.
Two district Strategic Planning Workshops at Thatta and Badin
Disease reporting and surveillance system functional
Provincial Vet. Epid. Unit formed under DAH
6 district Vet. Epid. Unit formed under DLOs
2 workshops held to define role/ mandate / needs of provincial diagnostic service
system at CVDL Tando Jam
One provincial workshop on EPI Network at Hyderabad
Computer training to EPI Network designed staff
Diseases surveillance working group notified
Vaccine Production (BQ/ Anthrax) supported through in service training at V.R.I.
Lahore/ Quetta.
Cold chain material supplies
Clinical and surgical instruments distributed
Sero-surviellence samples (8200) collected for RP eradication program
Model for improved productivity and service delivery demonstrated/ developed
Concept/ framework document prepared for Cluster Extension work in target districts
Rehabilitation works at two Vet. Hosp./ one Farm Sheds completed.
A.I services supported through training
Exposure visit of male and female farmers of targeted districts to NWFP (Khyber
Pakhtun Khuwa) production models for replication
Need Assessment of targeted districts for production models
Social Mobilizer meetings with female farmers for implementation of Poultry
Produciton Model.
Booklets on “Social Mobilization & Rural Poultry” in Sindhi language circulated in
targeted districts and provincial department

Report - Study of Strengthening of Livestock Services in Sindh (SLSP) Appendix L - 30
Booklet on “Community Livestock Extension Workers” developed by SLSP-Punjab is
being translated Sindhi language is at final stage
Fodder plots trial established at Agriculture Research Facility Tandojam
Linkage developed with Nuclear Institute of Agriculture (NIA) Tandojam for
establishment of salinity resistant fodders
Information and communication system form central part of service delivery
Material developed and disseminated in local language during training and workshops
Photographs and reports of different event sent to FPMU for dissemination
Systems, capacities and structures for project management developed, followed and
transferred to GoP.
Report schedule is followed both for technical progress reports and preparing work-
plans
9 Perception of the Stakeholders
9.1 Stated Successes
Perceived successes by the stakeholders are presented below:
Provision of 500 motorbikes to the Veterinary Doctors strengthened around 50%
efficiency in services at the grass root level as stated by the Project Officials. Even
during recent flood in Dadu districts staff helped to flood affectees.
The strengthening of Training Institute at Tando Mohammad Khan through its repair
and provision of appropriate equipment resulting long run support for organizing
trainings.
Under SLSP, the trainings were imparted on social mobilization aspects to the staff of
Livestock Department as master trainers by the resource persons of National NGOs
like Strengthening Participatory Organization (SPO). Resultantly, the master trainers
of the Department provided training to the participants of various organizations like
NRSP and TRDP under Prime Minister’s Special Initiatives for Livestock project.
Disease reporting /sampling system has become effective as samples are being
collected and sent to Central Veterinary Disease Diagnostic Laboratory on regular
basis.
9.2 Stated Failures
Some of the reasons stated by the stakeholders are presented below:

Report - Study of Strengthening of Livestock Services in Sindh (SLSP) Appendix L - 31
In order to implement the project, Agro-Technical Co. deployed staff from Islamabad
to work in Sindh. Those staff members had not close interaction with the local staff.
Initially logical framework analysis was not prepared in consultation with the relevant
stakeholders, consequently, it was revised at least three times.
Most of the money spent on the high charges of the consultancies, rather than field
project activities.
The project staff from the government side has been governed under Government of
Sindh rules for their daily allowances and hotel stay. The actual cost of hotels and
meals were higher than the government rates which burdened the pockets of staff from
government resulting demonization at their part. Whereas, the company staff was
entitled to higher allowances and hotel changes.
Limited number of Project Steering Committees due to busy schedule of Secretary
Livestock Department, as a result policy decisions got delayed.
Implementation in project activities hindered due to late releases of funds from the
government.
10 Project Analysis
10.1 Factors of Success or Failures
Sustainability: Synthesizing project activities and interventions to the regular and core
functions of the department was a challenging task. However, project made an effort to
strategize the project interventions by developing a logical framework of the project, yet the
ownership of the logical framework remained an issue. Besides, the project interventions
seem to be activities without having results based strategic outcome which could continue
after the phase out of the project.
Successes
Extension veterinary servicers were improved through project intervention, resulted in
around 50% reduction in livestock mortality as reported by Department Officials like
DLO, Tharparkar.
Disease reporting systems has been improved by providing equipment and computers
to strengthening the CVDL Mithi (Tharparkar), Dadu, Sukkur and Tando Jam under
the project.
Training facilities have been improved by strengthening the capacity and capability of
Tando Mohd Khan Training Institute.
Failures
The start of the project was plagued by a host of problems, the most serious of which
were: a 5-month delay by the EC to advance the initial funding, shortage and lack of
constancy of staff, senior staff provided by GoP holding other posts simultaneously

Report - Study of Strengthening of Livestock Services in Sindh (SLSP) Appendix L - 32
and unable to give adequate attention to SLSP, delays in the procurement of vehicles
and equipment.
10.2 Major Lessons Learnt for the Master plan
The participatory process of project formulation and design requires more attention in
order to have collective understanding and ownership.
The value of participatory approaches has been recognized, which increases the sense
of ownership of the project. Participatory approaches tend to result in more effective
interventions as the ultimate beneficiaries are involved in determining what is feasible
in addressing their problems.
The most compelling farmers’ need is to enhance animal productivity by strengthening
the advisory services for production – embracing nutrition, breeding, housing and
management as well as animal health – that should be need based, as it is envisaged
that needs of farmers is different with regard to geographical area and number of
animals.
In case of national level project, flow of funds committed to the concerned units be
released well on time with no hindrances to continue activities at the field level.
A separate project for strengthening the extension services that work for the livestock
sector be designed and implemented.
Planning, Monitoring and Evaluation (PM&E) Directorate staff need their capacity
building enhanced in PM&E system so that they are able to monitor and evaluate
project activities on regular basis.
Strengthen the staff capacity of Department’s Training Institute to train other staff in
Artificial Insemination (AI) component.
Addressing the matter of gender for the improvement of livestock at all levels as learnt
from the discussions of project officials particularly rural women be trained for
management of livestock.
The frequent changes of European Co-Manager hampered and delayed the
implementation of project activities. Therefore, project success depends on the staff
availability for the complete project period.
References
1. Annual Progress Report. Provincial Project Management Unit Sindh, July 2008 to
June 2009. Provincial Project Management Unit Sindh, Hyderabad.
2. Strengthening of Livestock Services Project (SLSP) Pakistan. Mid Term Review Final
Report prepared by Agrisystems limited, May 2006.

Report - Study of Strengthening of Livestock Services in Sindh (SLSP) Appendix L - 33
Annex -1 Persons Met 1. Dr. Ghulam Sarwar Shaikh, Director General Sindh, Animal Husbandry Department,
Hyderabad
2. Dr. Aslam Pervaiz Umrani, Director, Central Veterinary Diagnostic Laboratory,
Tandojam.
3. Dr. Noor Mohammad Soomro, Monitoring Officer of GoP, SLSP Project, Hyderabad.
4. Dr. Khadim Hussain Soomro, Deputy Director SLSP Sindh, Hyderabad.
5. Dr. Nobat Khan Khoso, District Livestock Officer, Mithi.
6. Dr. Jhaman Das, Veterinary Officer & In-charge CVDL Centre, Mithi.
7. Dr. Zanwar Hussain Laghari, District Livestock Officer, Mirpurkhas.
8. Mr. Mohammed Malook, Trainee Wool Shearing & Weaving, Village Nainisar, UC
Mithro Bhatti, District Mithi.
9. Dr. Ghulam Rasool Samajo, Manager Natural Resources Manager, Thardeep Rural
Development Program, Sukkur
10. Dr. Noor Nisa Marri, Field Operations Manager, Livestock Dairy Development Board,
Matiari.
11. Dr. Mastan Ali Khokhar, Livestock Advisor to DCO Sukkur.

Report Study of the Community Empowerment through Livestock Development and Credit. Appendix L - 34
Study of the Community Empowerment through
Livestock Development and Credit
Acronyms
CBO Community Based Organization
CELDAC Community Empowerment through Livestock Development and Credit
EFL Engro Food Ltd.
GPS Gender Support Program
JICA Japan International Cooperate Agency
KMC Kaihatsu Management consulting Inc
LEAD Leadership for Environment and Development
LLW Lady Livestock Worker
M&E Monitoring & Evaluation
MEWS Mehran Educational Welfare Society
MFI Microfinance Institute
NGO Non Government Organization
PMU Project Management Unit
SBE Small Business Enterprise
UNDP United Nations Development Programme
VDO Village Development Organization
VMC Village Milk Collector

Report Study of the Community Empowerment through Livestock Development and Credit. Appendix L - 35
1 Introduction
The report presents the lessons learnt from the Community Empowerment through Livestock
Development & Credit Project supported by the UNDP by reviewing the data collected from the
secondary sources, and interviewing the relevant stakeholders. The study has been undertaken
for Kaihatsu Management consulting Inc. (KMC) and C.D.C. International Corporation to
facilitate in preparation of the Master Plan Study on Livestock, Meat and Dairy Development in
Sindh Province.
1.1 Field Visits and Meeting with the Relevant Stakeholders
The consultant made visits to various relevant places and convened meetings with the pertinent
stakeholders in relation to the assignment. The list of persons met is presented as Annex – 1.
2 Background
The Community Empowerment through Livestock Development & Credit (CELDAC) project
was implemented for three year period i.e. September 2006 to September 2009. It was designed
to enhance the income and employment of rural women through livestock skills development,
improved livelihood and food security at the household and community level. The project
implemented under the auspices of UNDP`s and the Government of Pakistan overarching
Gender Support Program (GPS). The initiative was being implemented in Punjab and Sindh with
two private sector partners from the dairy sector namely Nestle Pakistan (Punjab) and Engro
Foods Limited (Sindh). The total cost of the project was US$ 1.3026 million (Donor
contribution US$ 1.0206 million and Engro Fertilizer Ltd contribution was US$ 0.282 million).
3 Goal and Output of the Project
The project goal was to enhance income and employment generation of rural women through
livestock skills development, improved livelihoods and food security at the household and
community level.
The outputs envisaged in the project were to:
At least 1200 women self employed and generating extra income through livestock
extension services and improving nutritional status and food security at the household
level. Livestock production increased through timely provision of primary animal health
and production services by reducing livestock morbidity and mortality rate; and
Income and employment generation of poor livestock households through facilitation to
institutionalized collateral free credit and saving facilities.

Report Study of the Community Empowerment through Livestock Development and Credit. Appendix L - 36
4 Planned Activities
Under the first output the following main activities were designed to implement the project:
Develop project mobilization strategy;
Conduct baseline survey and develop Monitoring and Evaluation (M&E) system;
Convene meeting with the Project Steering Committee and potential partners NGOs/
Community Based Organizations (CBOs);
Organize training of Project Management Unit (PMU) staff and Training of Trainers;
Design curricula for Lady Livestock Workers (LLWs) training and develop training
modules;
Printing of material including modules, brochures, manual, and signboards for LLWs;
Conduct mid-term review of the project; and
Develop networking with the other development actors of similar projects for the
sustainability of CELDAC interventions.
In order to achieve the second output, following main activities were envisioned in the project:
Facilitate and collaborate with microfinance institutes (MFIs) and LLWs to develop
customized micro financing;
Establish of female Village Milk Collectors (VMCs) to establish female small business
entrepreneurs;
Organize training of LLWs on Small Business Enterprise (SBE);
Create networking among LLWs and Vendors/suppliers for Livestock products; and
Follow up and income generation of LLWS.
5 Implementation of the Project in Sindh
In order to implement the project, Engro Foods Limited – the implementing partner established
the Project Management Unit (PMU) at Sukkur. The project steering committee was established
and has conducted two meetings during the project period April 2007 – September, 2009.
The PMU management hired a team of Lady Master Trainers and Lady Social Mobilizers. To
mobilize the project, the team organized a Project Mobilization workshop at Sukkur mainly to
create understanding among UNDP, EFL & PMU team members about the design of the project
besides knowing their respective obligations at all the stages of project management cycle.
The comprehensive baseline survey was carried out by LEAD Pakistan. The baseline survey
indicates many minor and major indictors through which the impact of the project was supposed
to gauge. The baseline survey area was divided into four parts based on crops, canal water
availability, desert, and grazing areas, considering the diseases, available nutrition and services
to livestock owners vary in all four parts. The project implemented in Ghotki, Sukkur, Khairpur,
Naushahro Feroze, Shaheed Benazirabad, Dadu, Larkana, Kambar, and Shikarpur Districts.

Report Study of the Community Empowerment through Livestock Development and Credit. Appendix L - 37
In all 1,209 LLWs were trained in project districts of upper Sindh province, covering around 706
villages over a period of six weeks by the Lady Master Trainers and Social Mobilizers. The
trainings focused on livestock management & role of women, livestock healthcare and
prevention, livestock products and marketing, and community empowerment.
The project made efforts to establish network with other development NGOs working in the area
such as Mehran Educational Welfare Society (MEWS) in District Khairpur, Goth Seenghar
Foundation District Khairpur and Village Development Organization (VDO) District
Nawabshah. Some of the LLWs were engaged in livestock projects carried out by these NGOs.
These LLWs were involved in looking after the basic health of the animals at village level.
The project facilitated LLWs, Small Business Enterprisers (SBEs) and Female Village Milk
Collectors (VMCs) in meeting with MFIs for provision of collateral free credit and saving
facilities in order to enhance income generation. Total 59 female VMCs were established against
the target of 50. The female VMCs practice has considerably increased the income of LLWs and
on an average one female VMC earns Rs. 2000 – 2500 per month through commission from
milk collection and marketing.
6 Perception of the Stakeholders
The stakeholders’ perceptions on the success and failure of the project are presented below:
6.1 Stated Successes
The skilled developed by 1200 LLWs through this project is a successful step to provide
services at the grass root level where male members do not have access and their services
could be utilized for different projects for example Vaccinators in government
department.
The project helped in enhancing the income of about Rs.2000 per month to around 40%
of trained LLWs who are self employed and around 2% have been employed by various
NGOs in their livestock projects after the project has been completed.
Since the project is a successful model by indulging ladies livestock workers in
veterinary services, it can be replicated in other areas with some lessons learned from
this pilot project.
The focus of LLWs training was not solely on technical aspect of livestock management
& disease prevention but also special attention was given to build her personal capacity
and skills to work with the community for extension services in livestock, as a result they
are earning for the livelihood.
6.2 Stated Failures
While identifying and registering LLWs, rural based educated and motivated girls were
not available. In some cases motivated and education girls were available but due to
social constraints, their families were not willing to allow them for the project.
The project faced difficulty to deploy Lady Veterinary Doctors for the project activities,
as some of them were not up to mark in their skills though they were qualified.
Report Study of the Community Empowerment through Livestock Development and Credit. Appendix L - 38
Due to scattered villages and unavailability of regular communication facilities around
villages, females felt difficulty to travel from one village to another to provide extension
livestock services to the farmers.
Since LLWs did not qualify their trainings from any recognized institution including
University, therefore, legal certificate from the Govt. for veterinary services could not be
awarded to them for future practice in the field as Veterinarian.
7 Project Analysis:
Sustainability: The human skill is an important capital for sustainable livelihoods. The LLWs
trained through the project now possess the basic skills for livestock management and health
which in result they are not only getting income by providing services to the farmers in their
villages but the livestock of their own family is also benefited. Further, there are spillover effects
of these women to other women for improved livestock management practices.
7.1 Factors of Success or Failures
Successes
The skilled and trained LLWs are available and are able to provide the extension services
related to livestock management, health and nutrition at the household level in the
villages, resultantly the services are available at the doorsteps that has improved the
income through developing a marketing channel of milk by collection of milk from
individuals and channelized to milk processing plants. In addition some around 3%
LLWs were involved as Village Milk Collector (FVMC) and they were earning Re.1 per
liter as a commission for milk collection and marketing consequently the milk market
channel developed.
The project has not only opened the opportunities for under valued rural women to earn
but it has also positively impact an improving their self esteem.
Failures
The community could not see the benefit from getting microcredit loan from NGOs like
Sindh Rural Support Organizations (SRSO) on the interest rates (around 25%) perceived
by them on high side, therefore, they were not willing to get the credit facilities, and
hence the pilot project intervention could not be implemented.
Through social mobilization process, the girls were identified from various villages and
get them trained as LLWs in the project. After the project, the sustainability of their
services is questionable, as coordination of LLWs with private medicine companies
could not be materialized as most of the companies are established in cities whereas the
LLWs are based in scattered villages in various districts.
The project conceptualized the linkages of LLW with milk processing plants,
governmental organizations, NGOs and pharmaceutical company that were not carried
out for their future sustainability.

Report Study of the Community Empowerment through Livestock Development and Credit. Appendix L - 39
7.2 Major Lesson Learnt for the master Plan
Some of the lessons learnt are:
As the community lacks the livestock services at their door steps, the services of LLW
were first experience in the villages. LLW provided services to the community and
simultaneously were earning for their living.
LLW can offer a vital solution to and can play an important role in an effective delivery
of animals’ health services and community mobilization at the doorstep of small
livestock holders.
LLW had improved their qualification as they were motivated to seek high education for
example around 3% LLWs improved their qualification from Matriculation to the
intermediate level.
References
1. Mid Term Review of Project Funded by Engro Food and UNDP Community
Empowerment through Livestock Development and Credit June 2009.
2. A Step to Bright Future. 2009. Publication of Engro Food CELDAC Sukkur
3. Livestock and Dairy Development Basic Study Report MAP Services Group JICA.
Annex – 1 Persons Met
1. Mr. Mohammad Ramazan Buriro Project Manager UNDP / Engro Food Pak. Sukkur
2. Mr. Aftab Ahmed Solangi Monitoring & Evolution Coordinator UNDP, Engro Food Pak
Sukkur.
3. Ms. Gul Bahar, Ex-LLW, UNDP Engro Food Pak, Village Sadarjune Bhatune Near Pir-
jo-Ghot Dist Khairpur
4. Ms. Zakia Khatoon, Ex-LLW, UNDP Engro Food Pak, Village Sadarjune Bhatune Near
Pir-jo-Ghot Dist Khairpur
5. Ms. Phapul W/O Mr Qadir Bux Rahujo, Ex-LLW, UNDP Engro Food Pak, Village
Sadarjune Bhatune Near Pir-jo-Ghot Dist Khairpur
6. Ms. Punia Khatoon , Ex-LLW, UNDP Engro Food Pak, Village Sadarjune Bhatune Near
Pir-jo-Ghot Dist Khairpur
7. Mr. Shakeel Ahmed, Coordinator, Mehran Education trust Sadarjune Bhatune Dist
Khairpur.

Appendix L - 40
Review of Sindh Dairy and Meat Development Company (SDMDC)
(prepared by the Project Team)
1. Objectives
Objective of SDMDC is to enhance milk and meat production through providing effective market
mechanism to the milk and meat producers in rural area and also to resolve the bottlenecks and problem
causing low production of their animals.
2. Mechanism
SDMDC will become a self-depended entity, which would generate business to run its operations.
3. Target
Major emphasis to be on small farmers with 5 or less animals. Most of them are landless or small
landholders. Whereas they own 95% of cattle population.
4. Expected Activities and interventions
SDMDC interventions would be to initially train master trainers and then facilitate model farms and
community farms all over Sindh. Improvement in Farm Management will be practiced to increase
productivity and incomes.
Originally 3 new government farms were planned to be established, and it was planned to transfer the
management of the new 3 farms and 6 existing government farms in Sindh to SDMDC. However the
construction of the new farms has been suspended, because necessary budget was not released. As of
August 2011, the department is requesting the provincial government to provide a necessary fund to
finish the construction of the new farms, or to give permission of auction or lease of the farms.
5. Progress
Establishment of SDMDC was announced by the government of Sindh in July 2009. After that seven
member board of directors were appointed - three senior government officials and four persons from the
private sector. Later on, the recruitment of a chef executive officer was on public but the post has not
been appointed yet. One time budget as much as 500 million Rs was released from Sindh Government as
seed money for operation of SDMDC.
However, no staff has been assigned and no activity plan has been prepared as of August 2011, though
they were planned in 2010-11 Pakistani fiscal year. There is no clear prediction to the future of SDMDC.
Appendix M
Project Outlines

Appendix M - 1
Appendix M
Project Outlines
1.1 Background
Pakistan is outstanding in terms of the number of livestock the country possesses. It has the 8th
largest number of cattle in the world, is 2nd in number of buffalo, 3rd in goats, and 9th in sheep. It is also
the 5th largest dairy producer in the world. Even with the relatively large size of the livestock sector in
world terms, however, the domestic demand for dairy and meat products will be outstripping its supply in
near future along with the sharply increasing population and the urbanization. This challenges the livestock
sector in Pakistan to tackle various and immediate issues. That includes that i) milk is mostly self-consumed
by rural households, ii) technologies for the improvement of production and productivity are undeveloped,
iii) feed resources in the country are hardly sufficient for nutritious requirements of the livestock, iv) there is
huge loss of dairy and meat products due to poor cold chain facilities and management, v) these products
are unhygienic due to poor marketing infrastructures, and vi) institutions and regulatory framework are
outdated.
The Government of Pakistan has in recent years focused policy on the promotion of the livestock
sector. The Poverty Reduction Strategy Paper (PRSP II) enacted in January 2009 is an example of this. This
is in response to the rapid increase in Pakistan's population and the need to secure food supplies for this
population. In addition, the first Livestock Development Policy was enacted in 2007 at the federal level to
promote livestock and dairy production. The Ministry of Livestock and Dairy Development was established
in 2008 as a separate entity from the Ministry of Agriculture.
To date, Punjab Province has been the sole focus of livestock and dairy production development
by both the public and the private sectors (investment), as well as other donor support. In comparison, the
number of cattle and buffalo in Sindh Province is about half that in Punjab Province. On the other hand, the
common Red Sindhi cattle and the Kundhi buffalo breeds have their ancestral origins in Sindh Province,
and these and other breeds found in Sindh Province represent important genetic breeds for tropical livestock
production. In addition, Karachi, the largest commercial city in Pakistan, is located on the coast. In terms of
meeting growing demands on dairy and livestock products, and developing livestock-related exports, this
city has huge potential.
In Sindh Province the disparity in economic earning power between large and small land owners,
as well as landless non-farming households, is enormous. There is a strong relationship between lack of
land or livestock ownership and poverty. In such a situation, the livestock is an important asset, particularly
for small and landless farmers. This livestock also provides an important source of nutrition and income for
these rural households. For these reasons, efforts to reduce poverty in rural communities of the province
should be made based more on the livestock sector, paying attention to its significance and high
development potentials.
However, the organization of the Ministry of Livestock and Fisheries, Government of Sindh, and
government services to the livestock sector in general are weak. This weak structure has been inherited
from the English colonial period, where the focus was on disease prevention and veterinarian services.
Little attention was given to personnel development or animal production/nutrition in the livestock sector.
This situation was further worsened by a lack of public sector vision and lack of private sector involvement

Appendix M - 2
in the sector.
These facts lie behind the Government of Pakistan's request of a technical cooperation to the
Government of Japan for identifying the regional strengths and comparative advantages of the livestock
sector in Sindh Province. This project aims to formulate a livestock development strategy through to 2020,
and a master plan which recommends practical policies, implementation structures, and action plans. The
Project Team, composed by the consultants, has been assigned since July 2010 for implementing the
project.
1.2 Project Objectives
The project aims to strengthen potentials and comparative advantages for the development of the
livestock sector in Sindh Province, and ultimately achieve balanced regional development and poverty
reduction through promoting the sector. It is expected that the stakeholders of the livestock sector in Sindh
fully exploit such development potentials and comparative advantages, which would eventually lead to the
development of Sindh, and enhance the proud and dignity of the people.
In this project, a comprehensive development strategy of the entire livestock sector and the master
plan including the action plans are drawn up, considering small and medium scale farmers as ultimate
beneficiaries. In the master plan, the development scenarios are prepared and based on that, the priority
actions are indicated. It would then be reflected to the formulation of a project in the next phase.
1.3 Expected Outputs
In order to achieve the above mentioned objectives, the outputs of the project are set as follows:
(1) Conduct the field survey on the current situation. Identify potentials, comparative advantages, and
bottlenecks of the livestock sector. Draft a livestock development strategy targeted through to the year
2020.
(2) Draft a Master Plan through to 2020 for the livestock development of Sindh Province.
(3) Provide technology transfer to Pakistani counterparts (C/P) during the implementation of the project.
1.4 Schedule and Phases of the Project
As shown in Figure 1-4-1, the project was implemented over 14 months. The schedule and scope
of the project are as follows:
(1) Phase-1 (July 2010 to March 2011; 8 months): Conduct the field survey and analysis of current
situations and the bottlenecks to development. Draft livestock development strategies to 2020 for each
zone in Sindh Province.
(2) Phase-2 (April 2011 to September 2011; 6 months): Based on the above livestock development
strategies, draw up a mid-term Master Plan through to 2020, that focuses on small rural households as
the ultimate beneficiaries.
The reports were submitted as shown in Figure 1-4-1.
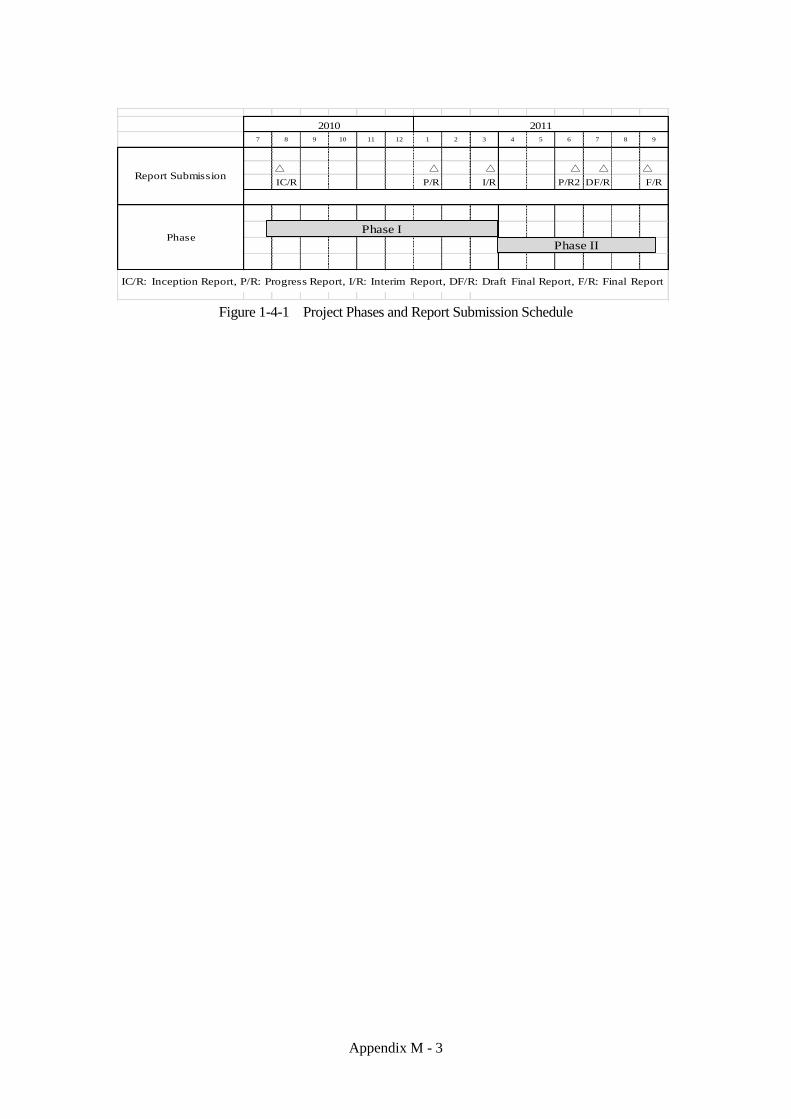
Appendix M - 3
Figure 1-4-1 Project Phases and Report Submission Schedule
7 8 9 10 11 12 1 2 3 4 5 6 7 8 9
△ △ △ △ △ △
IC/R P/R I/R P/R2 DF/R F/R
2010 2011
Phase
Report Submission
IC/R: Inception Report, P/R: Progress Report, I/R: Interim Report, DF/R: Draft Final Report, F/R: Final Report
Phase I
Phase II