01944363 2012
18
This article was downloaded by: [Oklahoma State University] On: 30 November 2014, At: 20:12 Publisher: Routledge Informa Ltd Registered in England and Wales Registered Number: 1072954 Registered office: Mortimer House, 37-41 Mortimer Street, London W1T 3JH, UK Journal of the American Planning Association Publication details, including instructions for authors and subscription information: http://www.tandfonline.com/loi/rjpa20 Growing Cities Sustainably Marcial H. Echenique a , Anthony J. Hargreaves b , Gordon Mitchell c & Anil Namdeo d a University of Cambridge b Martin Centre for Architectural and Urban Studies, University of Cambridge c Faculty of Environment, University of Leeds d School of Civil Engineering, University of Newcastle Published online: 03 May 2012. To cite this article: Marcial H. Echenique , Anthony J. Hargreaves , Gordon Mitchell & Anil Namdeo (2012) Growing Cities Sustainably, Journal of the American Planning Association, 78:2, 121-137, DOI: 10.1080/01944363.2012.666731 To link to this article: http://dx.doi.org/10.1080/01944363.2012.666731 PLEASE SCROLL DOWN FOR ARTICLE Taylor & Francis makes every effort to ensure the accuracy of all the information (the “Content”) contained in the publications on our platform. However, Taylor & Francis, our agents, and our licensors make no representations or warranties whatsoever as to the accuracy, completeness, or suitability for any purpose of the Content. Any opinions and views expressed in this publication are the opinions and views of the authors, and are not the views of or endorsed by Taylor & Francis. The accuracy of the Content should not be relied upon and should be independently verified with primary sources of information. Taylor and Francis shall not be liable for any losses, actions, claims, proceedings, demands, costs, expenses, damages, and other liabilities whatsoever or howsoever caused arising directly or indirectly in connection with, in relation to or arising out of the use of the Content. This article may be used for research, teaching, and private study purposes. Any substantial or systematic reproduction, redistribution, reselling, loan, sub-licensing, systematic supply, or distribution in any form to anyone is expressly forbidden. Terms & Conditions of access and use can be found at http://www.tandfonline.com/page/terms-and-conditions
-
Upload
independent -
Category
Documents
-
view
1 -
download
0
Transcript of 01944363 2012

This article was downloaded by: [Oklahoma State University]On: 30 November 2014, At: 20:12Publisher: RoutledgeInforma Ltd Registered in England and Wales Registered Number: 1072954 Registered office: Mortimer House, 37-41 MortimerStreet, London W1T 3JH, UK
Journal of the American Planning AssociationPublication details, including instructions for authors and subscription information:http://www.tandfonline.com/loi/rjpa20
Growing Cities SustainablyMarcial H. Echenique a , Anthony J. Hargreaves b , Gordon Mitchell c & Anil Namdeo da University of Cambridgeb Martin Centre for Architectural and Urban Studies, University of Cambridgec Faculty of Environment, University of Leedsd School of Civil Engineering, University of NewcastlePublished online: 03 May 2012.
To cite this article: Marcial H. Echenique , Anthony J. Hargreaves , Gordon Mitchell & Anil Namdeo (2012) Growing Cities Sustainably, Journalof the American Planning Association, 78:2, 121-137, DOI: 10.1080/01944363.2012.666731
To link to this article: http://dx.doi.org/10.1080/01944363.2012.666731
PLEASE SCROLL DOWN FOR ARTICLE
Taylor & Francis makes every effort to ensure the accuracy of all the information (the “Content”) contained in the publicationson our platform. However, Taylor & Francis, our agents, and our licensors make no representations or warranties whatsoeveras to the accuracy, completeness, or suitability for any purpose of the Content. Any opinions and views expressed in thispublication are the opinions and views of the authors, and are not the views of or endorsed by Taylor & Francis. The accuracyof the Content should not be relied upon and should be independently verified with primary sources of information. Taylorand Francis shall not be liable for any losses, actions, claims, proceedings, demands, costs, expenses, damages, and otherliabilities whatsoever or howsoever caused arising directly or indirectly in connection with, in relation to or arising out of theuse of the Content.
This article may be used for research, teaching, and private study purposes. Any substantial or systematic reproduction,redistribution, reselling, loan, sub-licensing, systematic supply, or distribution in any form to anyone is expressly forbidden.Terms & Conditions of access and use can be found at http://www.tandfonline.com/page/terms-and-conditions

121
Problem, research strategy, andfindings: It is commonly asserted that so-called compact development is the urbanform most able to sustainably accommodategrowth by reducing travel distances andconserving land, but credible supportiveevidence remains limited. This studyrigorously and realistically tested the relativeperformance of spatial options over the next30 years for three distinct kinds of Englishcity regions. Statistical models first forecastthe behavior of people within interactingmarkets for land and transport. Theseoutputs were then fed to establishedsimulation models to generate 26 indicatorsmeasuring the economic efficiency, resourceuse, social impact, and environmentalimpact of the spatial options. This permit-ted an explicit comparison of the costs andbenefits of compact against sprawling urbanforms for these regions. While the proto-types (i.e., compaction, sprawl, edgeexpansion, and new towns) were indeedfound to differ in their sustainability, noone form was clearly superior. Rather, thechange to “white collar” lifestyles andassociated population growth dominates theimpacts on the natural environment andresources, far overwhelming those attributa-ble to spatial urban form.
Takeaway for practice: Urban formpolicies can have important impacts onlocal environmental quality, economy,crowding, and social equity, but theirinfluence on energy consumption andland use is very modest; compact develop-ment should not automatically be associ-ated with the preferred spatial growthstrategy.
Growing CitiesSustainably
Does Urban Form Really Matter?
Marcial H. Echenique, Anthony J. Hargreaves, Gordon Mitchell, and Anil Namdeo
The paradigm of city planning in recent decades has been to promote thecompact city of dense development focused around urban centers ofemployment and local services to reduce the need to travel long dis-
tances and to make cities more vibrant. This is a reaction against sprawl inducedby the near universal use of private automobiles. Claims that compaction willmake cities more sustainable have been debated for some time, but they lackconclusive supporting evidence as to the environmental and, particularly, eco-nomic and social effects. Ewing, Bartholomew, Winkelman, Walters, and Chen(2007) and the Commission for Integrated Transport (2009) provide goodreviews. The Transport Research Board (2009) analyzed studies based on ob-served data of U.S. cities to investigate the claim that compaction reduces vehic-ular travel, and concluded that it had a very modest effect (a conclusion verymuch in line with results we discuss below). It, nevertheless, retained an opti-mistic view that there may be benefits under some scenarios that it could notactually find in practice. The neglect of the economic and social costs of com-paction is a significant omission in the Transport Research Board’s argument.
The SOLUTIONS research project aimed to test the performance ofurban compaction and alternative spatial options compared to the trend overthe next 30 years for English city regions (for final report, see Echenique,Barton, Hargreaves, & Mitchell, 2010). To do this in a rigorous and realisticmanner it is necessary to use models applied to actual city-regions to
Keywords: urban form, compaction,smart growth, sprawl, sustainability,regional spatial planning
Research support: The research wasfunded by the UK Engineering andPhysical Science Research Council.
About the authors:Marcial H. Echenique ([email protected])is professor of land use and transport at theUniversity of Cambridge. Anthony J.Hargreaves ([email protected]) is a seniorresearch associate in the Martin Centre for
Architectural and Urban Studies, Universityof Cambridge. Gordon Mitchell([email protected]) is a lecturer in theFaculty of Environment, University ofLeeds. Anil Namdeo ([email protected]) is a senior lecturer in theSchool of Civil Engineering, University ofNewcastle.
Journal of the American Planning Association,
Vol. 78, No. 2, Spring 2012
DOI 10.1080/01944363.2012.666731
© American Planning Association, Chicago, IL.
Dow
nloa
ded
by [
Okl
ahom
a St
ate
Uni
vers
ity]
at 2
0:12
30
Nov
embe
r 20
14
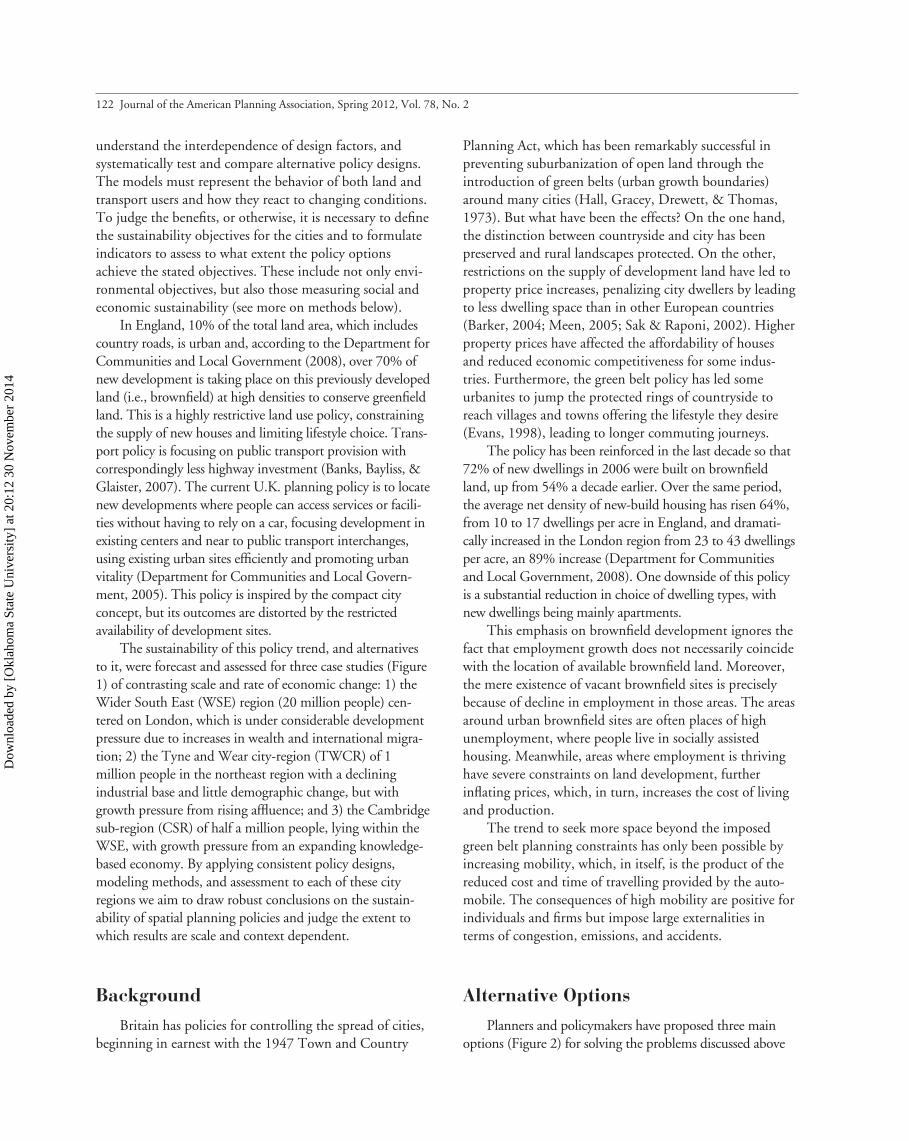
122 Journal of the American Planning Association, Spring 2012, Vol. 78, No. 2
understand the interdependence of design factors, andsystematically test and compare alternative policy designs.The models must represent the behavior of both land andtransport users and how they react to changing conditions.To judge the benefits, or otherwise, it is necessary to definethe sustainability objectives for the cities and to formulateindicators to assess to what extent the policy optionsachieve the stated objectives. These include not only envi-ronmental objectives, but also those measuring social andeconomic sustainability (see more on methods below).
In England, 10% of the total land area, which includescountry roads, is urban and, according to the Department forCommunities and Local Government (2008), over 70% ofnew development is taking place on this previously developedland (i.e., brownfield) at high densities to conserve greenfieldland. This is a highly restrictive land use policy, constrainingthe supply of new houses and limiting lifestyle choice. Trans-port policy is focusing on public transport provision withcorrespondingly less highway investment (Banks, Bayliss, &Glaister, 2007). The current U.K. planning policy is to locatenew developments where people can access services or facili-ties without having to rely on a car, focusing development inexisting centers and near to public transport interchanges,using existing urban sites efficiently and promoting urbanvitality (Department for Communities and Local Govern-ment, 2005). This policy is inspired by the compact cityconcept, but its outcomes are distorted by the restrictedavailability of development sites.
The sustainability of this policy trend, and alternativesto it, were forecast and assessed for three case studies (Figure1) of contrasting scale and rate of economic change: 1) theWider South East (WSE) region (20 million people) cen-tered on London, which is under considerable developmentpressure due to increases in wealth and international migra-tion; 2) the Tyne and Wear city-region (TWCR) of 1million people in the northeast region with a decliningindustrial base and little demographic change, but withgrowth pressure from rising affluence; and 3) the Cambridgesub-region (CSR) of half a million people, lying within theWSE, with growth pressure from an expanding knowledge-based economy. By applying consistent policy designs,modeling methods, and assessment to each of these cityregions we aim to draw robust conclusions on the sustain-ability of spatial planning policies and judge the extent towhich results are scale and context dependent.
Background
Britain has policies for controlling the spread of cities,beginning in earnest with the 1947 Town and Country
Planning Act, which has been remarkably successful inpreventing suburbanization of open land through theintroduction of green belts (urban growth boundaries)around many cities (Hall, Gracey, Drewett, & Thomas,1973). But what have been the effects? On the one hand,the distinction between countryside and city has beenpreserved and rural landscapes protected. On the other,restrictions on the supply of development land have led toproperty price increases, penalizing city dwellers by leadingto less dwelling space than in other European countries(Barker, 2004; Meen, 2005; Sak & Raponi, 2002). Higherproperty prices have affected the affordability of housesand reduced economic competitiveness for some indus-tries. Furthermore, the green belt policy has led someurbanites to jump the protected rings of countryside toreach villages and towns offering the lifestyle they desire(Evans, 1998), leading to longer commuting journeys.
The policy has been reinforced in the last decade so that72% of new dwellings in 2006 were built on brownfieldland, up from 54% a decade earlier. Over the same period,the average net density of new-build housing has risen 64%,from 10 to 17 dwellings per acre in England, and dramati-cally increased in the London region from 23 to 43 dwellingsper acre, an 89% increase (Department for Communitiesand Local Government, 2008). One downside of this policyis a substantial reduction in choice of dwelling types, withnew dwellings being mainly apartments.
This emphasis on brownfield development ignores thefact that employment growth does not necessarily coincidewith the location of available brownfield land. Moreover,the mere existence of vacant brownfield sites is preciselybecause of decline in employment in those areas. The areasaround urban brownfield sites are often places of highunemployment, where people live in socially assistedhousing. Meanwhile, areas where employment is thrivinghave severe constraints on land development, furtherinflating prices, which, in turn, increases the cost of livingand production.
The trend to seek more space beyond the imposedgreen belt planning constraints has only been possible byincreasing mobility, which, in itself, is the product of thereduced cost and time of travelling provided by the auto-mobile. The consequences of high mobility are positive forindividuals and firms but impose large externalities interms of congestion, emissions, and accidents.
Alternative Options
Planners and policymakers have proposed three mainoptions (Figure 2) for solving the problems discussed above
Dow
nloa
ded
by [
Okl
ahom
a St
ate
Uni
vers
ity]
at 2
0:12
30
Nov
embe
r 20
14

Echenique et al.: Growing Cities Sustainably 123
and making cities more sustainable. These can be character-ized as compaction, market-led dispersal, and planned expan-sion, with each one being a product of differing opinions on
priorities for urban development. Compaction increases theintensity of urban areas in order to reduce vehicle travel andincrease social diversity and urban vitality. Dispersal
Figure 1. The case study areas.
Dow
nloa
ded
by [
Okl
ahom
a St
ate
Uni
vers
ity]
at 2
0:12
30
Nov
embe
r 20
14

diminishes the intensity of urban land use to reduce the costsof living and production and reflects the demand for afford-able space and less crowding. Expansion by planned periph-eral development and new settlements attempts to deliver theadvantages of the preceding options and minimize theirdisadvantages by developing communities that are notcrammed and protecting the open landscape.
CompactionCompaction has been promoted in the United King-
dom by Richard Rogers’s Urban Task Force (Rogers,1999), which led to a White Paper on Urban Renaissanceand policy advice (e.g., Department for Communities andLocal Government, 2005). The main recommendationswere to focus development at much higher densities withincities, mainly on brownfield land, and to invest in publictransport. The policy assumes development is focusedaround a strong urban center where most commercial
activity takes place. Compaction is often promoted as theurban form best able to lower CO2 emissions.
A basic premise behind the prescription for higherdensity was an assumed relationship between density andfuel consumption proposed by Newman and Kenworthy(1989), who concluded that high-density cities consumeless energy. This relationship has been discredited as thecausality cannot be attributed solely to density determin-ing fuel consumption; it has been demonstrated thatdensity plays a small part in energy consumption if theprice of fuel and other automobile travel costs, relative toincome, is included in the analysis (I. Gordon, 1997). Amore plausible causal explanation is that in those citiesthat have cheap travel, people tend to travel further inorder to have more living space, as prices are lower out-side central areas. Thus, transport cost is the cause ofdensity rather than density being the cause of lower fuelconsumption.
124 Journal of the American Planning Association, Spring 2012, Vol. 78, No. 2
Figure 2. Alternative spatial designs for urban regions.Source: Adapted with permission from Corine Land Cover, European Environment Agency.
Dow
nloa
ded
by [
Okl
ahom
a St
ate
Uni
vers
ity]
at 2
0:12
30
Nov
embe
r 20
14

Echenique et al.: Growing Cities Sustainably 125
The compaction debate is not, of course, restricted tothe United Kingdom (see Jenks, Burton, & Williams,1996, and Williams, Burton, & Jenks, 2000, for interna-tional case studies and critiques). In the United States,there has been a vociferous campaign against sprawl pro-moted by smart growth and by the Congress for the NewUrbanism (Calthorpe, 1993; Duany & Plater-Zyberk,1991; Katz, 1994). They argue for focusing higher densitydevelopment in areas with improved public transportsupply (transit-oriented development). As an example, seethe Oregon State Government (2010) urbanization andtransportation policies. The evidence so far is rather incon-clusive. Boarnet and Crane (2001) analyzed several casestudies and were skeptical of the connection betweenurban design and travel behavior: “Land-use and urbandesign proposals, if they influence travel behavior, do so bychanging the price of travel” (p. 103). From a meta-analy-sis of studies, Ewing and Cervero (2001, 2010) concludedthat increasing density itself has only a marginal impact onreducing automobile travel. Doubling the density of aneighborhood only reduces automobile vehicle distancetraveled by around 5% per person, although other built-environment factors such as proximity to downtown areasand jobs can reduce automobile distance traveled by around20%. The obvious conclusion is that an increase in densitywill increase traffic congestion, and Sorensen (2009) demon-strates that high average density is the main cause of highwaycongestion in Los Angeles. It can also increase the overallrespiratory disease burden as exposure to traffic emissions isincreased (Schweitzer & Zhou, 2010).
It is argued that an aging population will demandsmaller dwellings and that immigrants tend to live inapartments in central districts. There is, however, nosubstantial evidence that older couples leave their spacioushouses and gardens, as the space may be kept for receivingthe family on occasions during the year. When immigrantsarrive, they are, on the whole, poorer and younger, and soare prepared to live in small apartments, but, as they be-come older and wealthier, they move to the suburbs (Department of Environment, Transport and the Regions,2000). Proponents of high density claim that it will im-prove health by encouraging more walking and cycling,whereas opponents point out that high-density livingwould reduce the healthy and popular activity of gardening(Donovan & Halpern, 2002; Gross & Lane, 2007).
DispersalDispersal has been promoted by many economic ana-
lysts (e.g., I. Gordon, 2008; Richardson & Gordon, 2001).Reducing restrictions on the supply of land clearly reducesits price, which, in turn, increases its use. The consequences
are more living space and lower real estate costs, which, inturn, reduce living, labor, and production costs, making theregion more competitive and productive in certain industrialsectors. Sprawl is, generally, the consequence of allowing themarket for supply and demand of land to operate withoutrestriction (Bruegmann, 2005). The detractors of this formof development argue that it is environmentally unsound asit increases resource consumption (land, nonrenewableenergy), reduces biodiversity, increases greenhouse gasemission, and is socially unjust (Rogers & Power, 2000).Some argue that dispersal requires more extensive utility androad networks than denser districts, but others argue thatalthough the networks are more extensive the unit cost ofinstallation is lower.
The dispersed city idea of mixing rural and urban usesthrough transport improvements has a long traditiondating from 19th-century planners such as Cerda(1859/1991) with his Barcelona Plan, and the Russiandisurbanists, such as Milliutin (Kopp, 1970). The great20th-century advocate was Wright (1932), who proposedBroadacre city, where inhabitants had an acre per personintermingled with industry, agriculture, and services.
The cost of such designs has been analyzed extensively(e.g., Burchell et al., 2002), but without convincing con-clusions. Glaeser and Kahn (2003/2004) argue that sprawlis the inexorable product of automobile-based living thatbrings considerable improvements in quality of life, andthat the social problems of people without mobility shouldbe addressed by targeted public policies. Environmentalimpacts can, thus, be offset by technological change, suchas low-carbon automobiles (King, 2007). One of the mainarguments for the dispersed city is that there is no longer asingle center where most jobs and services occur. Urbanareas, rather, exhibit a dispersed and often polycentricstructure, bringing jobs and services closer to residents witha more complex movement pattern not readily served bypublic transport (Hall & Pain, 2006).
Cities of continental Europe, particularly of Mediter-ranean countries, which hitherto have been considered asmodels of compaction, are changing rapidly to the samepattern observed in the United States. The dispersed ordiffused city has been the object of substantial analysis,which demonstrates it has become the new city form nowthat automobile ownership is nearly universal and thenecessary highways and utilities are in place. Dematteis(1998) argues that the two types of cities, Anglo-Saxon andLatin, are converging to the same model in which theprocess of peripheral growth is diluting the importance ofthe center, while new nodes of activities (e.g., edge cities;Garreau, 1991) are emerging as part of a bigger network ofthe diffused urban metropolis.
Dow
nloa
ded
by [
Okl
ahom
a St
ate
Uni
vers
ity]
at 2
0:12
30
Nov
embe
r 20
14

Barcelona, lauded as an exemplar of good compact plan-ning in the Urban Task Force work (Rogers, 1999), is dispers-ing rapidly with emerging nodes of development (edge cities)beyond the coastal mountain range with most of the newdevelopments following the motorway network. People andjobs are moving out and taking advantage of the emergingmobility to search for space at lower prices (Busquets, 2005).
The dispersal of jobs is also apparent in England. Newbusiness and technology parks have emerged in the out-skirts of cities with good automobile accessibility (Breheny,1996), offering a green environment to highly qualifiedemployees.
Planned ExpansionIn the United Kingdom, the Town and Country
Planning Association (TCPA; 2007) has strongly advo-cated planned urban settlements as an intermediate formof development, or New Towns. The main ideas are overa century old, originating from Ebenezer Howard (1898/1902). With his garden cities concept, he tried to obtainthe best of both worlds, town and country, through acontrolled migration from congested urban areas toplanned, balanced communities on greenfield sites. Theinitial new towns were expanded after World War II butcame to a halt in the 1970s due to the amount of govern-ment funding required and the belief that theycontributed to the decline of existing cities. The inten-tion of the planned settlement is to increase the supply ofurban land to obtain the economic and social objectivesof a dispersal policy without the environmental impactscaused by scattered development.
The U.K. government has recently been considering anew form of town for promoting sustainability: Eco-towns(Department for Communities and Local Government,2007). Due to cutbacks in funding, only one of just 5,000homes is planned to go ahead near Bicester, Oxfordshire,funded by the private sector. It has the garden cities’ aim ofproviding open green space and of achieving net-zerocarbon emissions using green technologies strongly influ-enced by new eco-towns, such as Vauban in Germany. Itis unlikely, however, that U.K. eco-towns will be suffi-ciently large and self-contained to avoid becoming auto-mobile-based dormitory towns.
Option DesignThe spatial options were designed to be as distinct as
possible from the trend to show their benefits and disad-vantages; each was designed to achieve its full sustainabilitypotential.
Compaction clustered most of the new development inurban centers at even higher densities than the trend on
green space as well as brownfield. This achieves some ofthe smart growth principles (U.S. Environmental Protec-tion Agency, 2006) at the expense of very limited housingchoice and a loss of open urban space.
Dispersal was a simulation of market-led development,in which case green belt constraints were relaxed andtransport investment focused on highways.
Expansion was based on advice from the U.K. TCPAwith many similarities to smart growth principles. It in-cluded edge expansion around London, along transportcorridors, and five new settlements of around 50,000dwellings 40 miles from London. The designs optimisti-cally assumed that they could achieve similar attractiveurban environments with high levels of walking and cy-cling to historic English university towns.
Method
Our study took the following three-step approach,applied to each of the case study city-regions (Figure 3).First, select the policy tools; second, simulate behavioralresponses to those policies using the best ready-made cityregion models; and third, use these forecasts to estimatethe 26 sustainability metrics.
The policy tools are the various forms of regulation,pricing, and direct investment for land use and transport.The computer models forecasted the likely locational andtravel behavior of households and firms within the con-straints set by the policy tools. The models used were Lon-don and South East Region (LASER) owned by the Depart-ment for Transport (see Marcial Echenique and Partners,2004); Tyneside Area Multi Modal Study (TAMMS), ownedby the Highway Agency (Ove Arup & Partners InternationalLimited & Scott Wilson Scotland Ltd., 2002); and Cam-bridgeshire MENTOR model (MENCAM) owned byCambridgeshire County Council. All models were based onthe MEPLAN (MENTOR is the Windows version) software(Echenique 1994, 2005), models that simulate the market ofinteraction between demand for land by households andfirms and the supply of dwellings and nonresidential floorspace. They also simulate the demand for travel by passengersand freight and the supply of multimodal transport. Theinputs to the model of dwellings, employment floor space,and transport networks per zone represent the spatial policystrategies. The interaction of supply and demand for landand transport determines the prices of land, the cost of livingand production for households and firms, and amount ofcongestion on transport networks.
Figure 4 shows the growth in dwellings and employ-ment input for each of the case studies, while Figure 5
126 Journal of the American Planning Association, Spring 2012, Vol. 78, No. 2
Dow
nloa
ded
by [
Okl
ahom
a St
ate
Uni
vers
ity]
at 2
0:12
30
Nov
embe
r 20
14

Echenique et al.: Growing Cities Sustainably 127
shows the differences in dwellings for each of the optionscompared to the trend (employment had a similar pat-tern). Figure 5 shows that spatial policies only make arelatively small difference to existing development at thecity-region scale over the forecast periods (WSE andTWCR, 30 years; CSR, 20 years) as most of the urbandevelopment of the future is already here (the U.K.dwelling stock and commercial floor space changes 1%per annum).
Finally, MEPLAN model outputs for each spatialpolicy option were used to drive further models to assesspolicy outcomes against 26 sustainability indicators thatmeasure economic efficiency, social impact and equity,environmental protection, as well as loss of natural re-sources. The following quantitative assessment shows thatthere are tradeoffs between different criteria; improving theoutcome on one may be accompanied by negative impactson others. The preferred option will depend on the weightgiven to competing objectives within a broader policymak-ing process.
Sustainability Assessment of theTrend Policy and Its Alternatives
Results of the sustainability assessment are summa-rized in Tables 1–3 addressing the 26 indicators. Figure 6compares the changes from base to forecast year on eightof the headline indicators across the four assessmentdomains (see also Mitchell, Hargreaves, Namdeo, &Echenique, 2011, for a detailed discussion of the energyand carbon analysis, including road user charging sensi-tivity tests). This illustrates a continuation of the currentpolicy trend, resulting in most indicators becomingsubstantially worse over the forecast period. The alterna-tive spatial configurations of land use and transport makevery little difference compared to the impacts of socioeco-nomic change and population growth. The only indica-tors that do not necessarily worsen are those that arerelative measures, such as social segregation, or thoseamenable to technological mitigation, such as noxiousvehicle emissions.
Figure 3. Flow chart outlining the method.
Dow
nloa
ded
by [
Okl
ahom
a St
ate
Uni
vers
ity]
at 2
0:12
30
Nov
embe
r 20
14

The pattern of differences between the spatial op-tions, such as compaction or dispersal, are very consistentacross case studies on indicators that are directly related
to physical characteristics of urban form, such as landtake, transport energy use, traffic emissions, crowdingand impermeability.
128 Journal of the American Planning Association, Spring 2012, Vol. 78, No. 2
Figure 4. Growth in dwellings (%) and employment from base to forecast year.
Figure 5. Difference in dwellings (%) between the options and trend at the forecast year.
Dow
nloa
ded
by [
Okl
ahom
a St
ate
Uni
vers
ity]
at 2
0:12
30
Nov
embe
r 20
14

Echenique et al.: Growing Cities Sustainably 129
As expected, compaction performs the best on conserv-ing land take. The dispersal and expansion options wouldboth require more land than the trend and much of thiswould be greenfield. However, there is a lot of undevel-oped land available in the case study areas so the increaseor reduction in urban land compared to the trend is lessthan 1% of the total.
Vehicle distance traveled would also increase over thetrend broadly in line with population growth for the WSE
and TWCR as automobile ownership and trip lengthsincrease offsetting the growth in rail trips, which resultfrom investment in public transport. Only the CSR wouldachieve a reduction in vehicle miles traveled (VMT) perperson. This is a result of relaxing the green beltconstraints to allow development closer to Cambridge byallowing edge expansion with improved public transport,as a radical departure from the past tightly constrainedpolicy.
Table 1. Sustainability appraisal, Wider South East region.
CRITERIA Categoryc Units 1997 base 2031 trend Compaction Dispersal Expansion
Quantity Difference from base year
Land developeda R km2 3,868 18% 10% 23% 21%Total floorspace growth R Million m2 905 25% 23% 27% 26%Transport energy R PJ/yr 898 38% 37% 42% 38%Commercial buildings energy R PJ/yr 182 35% 35% 35% 35%Residential buildings energy R PJ/yr 550 16% 15% 16% 16%Total energy consumption R PJ/yr 1,630 30% 29% 33% 30%CO2 emission (buildings and transport) E Mt/yr 113 34% 33% 37% 34%CO emission transport E Kt/yr 1,359 –75% –76% –75% –75%NOx emission transport E Kt/yr 438 –66% –66% –65% –66%VOC emission transport E Kt/yr 55 –54% –55% –53% –55%PM10 emission transport E Kt/yr 18 –74% –74% –73% –74%High income household expenditure S £ pcm 3,250 3% 2% 1% 2%Low income household expenditure S £ pcm 1,483 20% 20% 17% 19%Personal Injury road traffic accidents S Total/yr 200,016 –6% –8% –4% –6%Vitality S index unity 1.38 1.41 1.46 1.40
% of % Difference from base year (%)
Mean surface impermeability (sealing) E zones 21 3 4 2 3Aquatic systems likely to be degraded E zones 14 2 1 3 4Less than 28m2 per capita floorspace S population 10 2 6 –2 –1Road links traffic noise above 65dbb S network 61 10 10 10 10High driver stress roads S network 13 4 4 4 4Road crossing time � 30 seconds S network 8 4 3 4 4
Gini index of inequality (GI)
Social segregation S Gini index 0.13 0.13 0.14 0.13 0.13Social distribution of NOx emission S Gini index 0.19 0.01 0.01 0.04 0.02Social distribution of traffic noise S Gini index 0.13 0.13 0.14 0.13 0.13
1997–2031 trend Difference from trend
Net economic benefitd C £M/yr –31,768 –56 574 543Transport economic efficiencyd C £M/yr na –40 292 150
Notes:a. In the base year, 11% of the land in the Wider South East region was already developed for urban and transport uses.b. LA10,18h emission.c. Criteria categories: R � resources; E � environmental; S � social; C � economic.d. Economic benefits are in 1997 prices.
Dow
nloa
ded
by [
Okl
ahom
a St
ate
Uni
vers
ity]
at 2
0:12
30
Nov
embe
r 20
14

The alternative spatial options have relatively littleimpact on VMT for the city region compared to the trendforecast. Compaction would reduce VMT by 5%. Thisfinding was remarkably consistent across all three casestudies. The expansion option could be achieved withoutan increase in VMT, provided the expansion areas areplanned around good public transport links, in areas withstrong local employment growth, which achieve a highdegree of self-containment of jobs and services, and
encourage walking and cycling. The dispersal optionwould increase VMT, but only by around 5% compared tothe trend (although it would gradually increase if thepolicy continued beyond the forecast period). This smallincrease in automobile travel for dispersal becomes lesssurprising when considering the relative changes in devel-opment between the central and outer areas. For example,the dispersal option would have 19% fewer dwellings inCambridge than the trend at the forecast year. Dispersing
130 Journal of the American Planning Association, Spring 2012, Vol. 78, No. 2
Table 2. Sustainability appraisal, Tyne and Wear city-region.
CRITERIA Categoryc Units 2001 base 2031 trend Compaction Dispersal Expansion
Quantity Difference from base year
Land developeda R km2 314 13% 8% 16% 16%Total floor space growth R Million m2 75 13% 12% 14% 14%Transport energy R PJ/yr 45 10% 8% 9% 10%Commercial buildings energy R PJ/yr 16 13% 13% 13% 13%Residential buildings energy R PJ/yr 48 8% 7% 9% 8%Total energy consumption R PJ/yr 109 10% 9% 9% 10%CO2 emissions (buildings and transport) E Mt/yr 8 11% 10% 11% 11%CO emission transport E Kt/yr 30 –68% –68% –68% –68%NOx emission transport E Kt/yr 22 –70% –70% –70% –70%VOC emission transport E Kt/yr 2 –52% –51% –51% –50%PM10 emission transport E Kt/yr 1 –76% –76% –76% –76%High income household expenditure S £ pcm 1,950 20% 23% 17% 19%Low income household expenditure S £ pcm 1,067 21% 23% 18% 20%Personal Injury road traffic accidents S Total/yr 4,482 –21% –21% –21% –21%Vitality S index unity 1.23 1.24 1.29 1.26
% of % Difference in % from base
Mean surface impermeability (sealing) E zones 23 3 4 2 2Aquatic systems likely to be degraded E zones 27 4 0 9 4Less than 31m2 per capita floor space S population 9 4 14 –2 –2Road links traffic noise above 65dbb S network 34 5 4 5 5High driver stress roads S network 16 5 5 5 5Road crossing time � 30 seconds S network 3 1 1 1 1
Gini index of inequality (GI)
Social segregation S GI 0.15 0.13 0.14 0.13 0.13Social distribution of NOx emission S GI 0.24 0.01 0.09 0.01 0.02Social distribution of traffic noise S GI 0.15 0.12 0.11 0.13 0.13
2001–2031 trend Difference from trend
Net economic benefitd C £M/yr –1,272 –24 55 64Transport economic efficiencyd C £M/yr n.a. 24 13 35
Notes:a. In the base year, 14% of the land in the TWCR was already developed for urban and transport uses.b. LA10,18h emission.c. Criteria categories: R = resources; E � environmental; S � social; C � economic.d. Economic benefits are in 2000 prices.
Dow
nloa
ded
by [
Okl
ahom
a St
ate
Uni
vers
ity]
at 2
0:12
30
Nov
embe
r 20
14

these, however, into the surrounding areas results in anincrease of only 6% more than the trend (Figure 5), be-cause the population of the surrounding area is muchgreater than Cambridge itself. In addition, many of thedispersed dwellings and employment in the modelingsimulation coalesce along the transport corridors, wherethe accessibility and demand for dwellings is greater thanthe more isolated rural areas. Consequently, the broadpattern of development that emerges would not be dissimi-
lar to the trend and expansion options, although it wouldbe more dispersed at the local scale.
For comparative purposes, each scenario has the samecity-region-wide totals for dwellings, population, andemployment. The compaction option has higher densitiesin the urban centers but less development in the surround-ing areas. This is reversed in the dispersal and expansionoptions. It is, therefore, difficult to directly compare themodel forecasts with the survey-based methods in the
Echenique et al.: Growing Cities Sustainably 131
Table 3. Sustainability appraisal, Cambridge sub-region.
CRITERIA Categoryc Units 2001 base 2021 trend Compaction Dispersal Expansion
Quantity Difference from base year
Land developeda R km2 144 13% 8% 17% 15%Total floor space growth R Million m2 23 24% 23% 25% 25%Transport energy R PJ/yr 22 11% 7% 16% 10%Commercial buildings energy R PJ/yr 5 26% 26% 26% 26%Residential buildings energy R PJ/yr 14 16% 15% 17% 17%Total energy consumption R PJ/yr 41 15% 12% 17% 15%CO2 emissions (buildings and transport) E Mt/yr 3 16% 13% 18% 15%CO emission transport E Kt/yr 19 –73% –75% –72% –74%NOx emission transport E Kt/yr 8 –69% –70% –68% –68%VOC emission transport E Kt/yr 0.7 –60% –62% –58% –61%PM10 emission transport E Kt/yr 0.3 –64% –65% –63% –64%High income household expenditure S £ pcm 2,729 40% 27% 38% 52%Low income household expenditure S £ pcm 1,951 46% 30% 44% 58%Personal injury road traffic accidents S Total/yr 2,826 –25% –26% –22% –26%Vitality S index unity 1.35 1.30 1.38 1.38
% of % Difference from base year (%)
Mean surface impermeability (sealing) E zones 11 2 3 1 1Aquatic systems likely to be degraded E zones 3 1 0 1 2Less than 29m2 per capita floor space S population 11 4 13 –4 –4Road links traffic noise above 65dbb S network 46 5 5 7 2High driver stress roads S network 18 3 3 2 3Road crossing time � 30 seconds S network 1 2 1 2 1
Gini index of inequality (GI)
Social segregation S GI 0.16 0.18 0.18 0.17 0.19Social distribution of NOx emission S GI 0.24 0.29 0.27 0.28 0.28Social distribution of traffic noise S GI 0.18 0.20 0.20 0.20 0.22
2001–2021 trend Difference from trend
Net economic benefitd C £M/yr –1,667 711 278 –204Transport economic efficiencyd C £M/yr n.a. –3 –2 0
Notes:a. In the base year, 6% of the land in the CSR was already developed for urban and transport uses.b. LA10,18h emission.c. Criteria categories: R � resources; E � environmental; S � social; C � economic.d. Economic benefits are in 1991 prices.
Dow
nloa
ded
by [
Okl
ahom
a St
ate
Uni
vers
ity]
at 2
0:12
30
Nov
embe
r 20
14

132 Journal of the American Planning Association, Spring 2012, Vol. 78, No. 2
Figure 6. Comparison of alternative policies with respect to headline indicators. Resources indicators: a) urban land-take compared to base year, b)transport energy compared to base year. Environmental indicators: c) impermeability compared to base year, d) NOx from transport compared to baseyear. Social indicators: e) crowding compared to base year, f) social segregation compared to base year. Economic indicators: g) net economic costcompared to the trend, h) transport efficiency compared to trend.
Dow
nloa
ded
by [
Okl
ahom
a St
ate
Uni
vers
ity]
at 2
0:12
30
Nov
embe
r 20
14

literature. Figures 7a–7c show the areas of compaction forthe case study city-regions. The average increase in grossdensity ranged from about 40% in London, 60% in Tyne and Wear, to 75% in Cambridge. (These grossdensities are measured at the electoral ward level, thesmallest U.K. administrative area. The areas of urbancompaction are arbitrarily defined as those where thedensity is at least 15% greater than the trend.) Hence, the5% reduction in VMT is equivalent to a 10% reductionfrom a doubling of density. This is broadly consistent withthe elasticity from the literature reported earlier, given thatthe design of the compaction option includes higher densi-ties, clustered in downtown areas close to jobs.
Surface impermeability from built surfaces such asroofs and roads increases over the trend. Compaction addsthe least new impermeable surface area of any option, but
does so in areas that are already among the most imperme-able. These localized increases in impermeability wouldelevate flood risk and loading of diffuse pollutants (such asheavy metals) draining into receiving rivers, with potentialimpacts on water and ecological quality. Dispersal addsmore impermeable land than the other options, but floodrisk and diffuse source loadings would be lower becausedevelopment tends to be in areas that are not heavily builtup and so have an initially low impermeability value.
Noxious air pollution from transport has declinedsubstantially and will continue to improve over the nextdecade as a result of significant improvements in vehiclestandards, but will then begin to worsen as the emissionreductions per vehicle are overwhelmed by traffic growth.
Crowding would increase over the forecast period forthe trend because of current policy of higher density
Echenique et al.: Growing Cities Sustainably 133
Figure 7a. Compacted areas for Wider South East compaction option.
Dow
nloa
ded
by [
Okl
ahom
a St
ate
Uni
vers
ity]
at 2
0:12
30
Nov
embe
r 20
14

development. Compaction would increase crowding stillfurther as most of the new dwellings would be apartments.Dispersal and expansion would reduce crowding as a resultof releasing more land for housing.
The costs to the economy increase over the forecastperiod in all of the case study areas because the supply ofdwellings and transport capacity fails to keep pace withgrowing lifestyle expectations. The shift to a more service-oriented economy leads to an increasing proportion ofprofessional and clerical workers who have greater de-mands for living space and mobility. The current policytrend does not satisfy the demand for housing types in theright location as it restricts the supply of dwellings tomainly apartments on brownfield sites in locations that do
not necessarily correspond to where the employment isgrowing. The knowledge- and service-based jobs increase inthe environmentally attractive areas where there is a lack ofland being supplied for development. The spatial disparitybetween supply and demand pushes the house prices up,while it adds to wage costs and increases automobile travel.
The net economic cost indicator measures the impacton those sectors of the economy that cannot pass on higherprices to others. These include changes in costs to exportindustries (basic sector) and costs imposed on retired andunemployed people. The total increase in costs over theforecast period to 2031 is estimated to be about £30 billionper annum for the WSE (in 1997 prices), about £1.3billion per annum for Tyne and Wear (in 2000 prices),
134 Journal of the American Planning Association, Spring 2012, Vol. 78, No. 2
Figure 7b. Compacted areas for Tyne and Wear city-region compaction option.Dow
nloa
ded
by [
Okl
ahom
a St
ate
Uni
vers
ity]
at 2
0:12
30
Nov
embe
r 20
14

and £1.6 billion per annum for the CSR (in 1991 prices).These cost increases arise from the shift toward white-collar employment combined with increases in houseprices and transport congestion, which would reduceeconomic competitiveness. For the WSE and Tyne andWear, the spatial allocation of housing and transportmakes relatively little difference to economic costs com-pared to these increases over the trend period. However,differences in economic costs between the spatial policyoptions are more apparent in the CSR, where there isgreater pressure for growth within a smaller area. Thesegrowth pressures also tend to increase social segregation,especially if the spatial policy allocates new housing to lessdesirable locations.
The direction of change on the socioeconomic indica-tors varies among case study areas due to their differingunderlying socioeconomic characteristics. They depend on
the tendency for activities to either coalesce or dispersefrom the core cities. As with many other U.K. city-regions,employment and population tend to disperse from thepost-industrial urban areas of London and Tyne and Wearinto the greener outer suburbs. Compaction would exacer-bate the shortage of housing in outer areas, and this imbal-ance between supply and demand would push averagerents up and hence the cost of living and wage costs. Con-versely, Cambridge is a focus of employment growth witha university, hi-tech economy, and an attractive low-density urban environment. Compaction would help tomeet the growing shortage of housing in Cambridge andreduce average prices, although this may reduce its attrac-tiveness over the longer term.
No single policy would be suitable for all of the casestudy areas. Planning policy should therefore allow flexibil-ity within sustainable planning guidelines.
Echenique et al.: Growing Cities Sustainably 135
Figure 7c. Compacted areas for Cambridge Sub-Region compaction option.
Dow
nloa
ded
by [
Okl
ahom
a St
ate
Uni
vers
ity]
at 2
0:12
30
Nov
embe
r 20
14

Conclusions
The current planning policy strategies for land use andtransport have virtually no impact on the major long-termincreases in resource and energy consumption. They generallytend to increase costs and reduce economic competitiveness.The relatively small differences between options are over-whelmed by the impacts of socioeconomic change and popu-lation growth. The differences between land use and transportpolicies are greater for a smaller area with pressure for growthas in the CSR. The impacts of a policy, though, tend to evenout when applied over a larger, more diverse area.
Smart growth principles should not unquestioninglypromote increasing levels of compaction on the basis ofreducing energy consumption without also considering itspotential negative consequences. In many cases, the poten-tial socioeconomic consequences of less housing choice,crowding, and congestion may outweigh its very modestCO2 reduction benefits.
Achieving the targets on reducing CO2 emissions canbe more effectively pursued using technological improve-ments such as switching to non-fossil energy sources. Thiscan also be achieved by substantial behavioral changes suchas shifting from the automobile to public transport. Thelatter demands strong incentives or penalties to make asignificant difference, which would have a detrimentaleffect on some of the social and economic indicators.Relying on technological improvements is arguably moreplausible because it has been estimated that they can con-tribute an order of magnitude to the abatement of CO2
emissions for transport (King, 2007; McKinsey & Com-pany, 2010) and buildings (MacKay, 2009).
Creating successful communities means first havingbroader planning objectives. Appropriate green technolo-gies designed along ecological principles can be included toreduce the environmental impacts. Urban form can affectthe feasibility of introducing green technologies. Ground-source heat pumps, for instance, require relatively low-density development, while combined heat and powersystems require a concentration of activities provided bycompact forms of development. These interrelationshipsbetween urban form and green technologies are beingexplored by further ongoing research (see www.regionalvi-sions.ac.uk) to reach a broader understanding of the sus-tainability of spatial planning policies.
ReferencesBanks, N., Bayliss, D., & Glaister, S. (2007). Roads and reality: Motor-ing towards 2050. London, UK: RAC Foundation.Barker, K. (2004). Barker review of housing supply. Norwich, UK:HMSO.
Boarnet, M. G., & Crane, R. (2001). Travel by design: The influence ofurban form on travel. Oxford, UK: Oxford University Press.Breheny, M. (1996). Centrist, de-centrists and compromisers: Views on thefuture urban form. In M. Jenks, E. Burton, & K. Williams (Eds.), The compactcity: A sustainable urban form? (pp. 10–29). London, UK: E. & F. N. Spon.Bruegmann, R. (2005). Sprawl: A compact history. Chicago, IL: Univer-sity of Chicago Press.Burchell, R., Lweenstein, G., Dolphin, W., Galley, C., Downs, A., Seskin,S., … & Moore, T. (2002). Cost of sprawl–2000 (TCRP Report 74).Washington, DC: Transport Research Board, National Research Council.Busquets, J. (2005). Barcelona: The urban evolution of a compact city.Nicolodi, Italy: Harvard University Graduate School of Design.Calthorpe, P. (1993). The next American metropolis: Ecology, communityand the American dream. New York, NY: Princeton Architectural Press.Cerda, I. (1991). Teoría de la construcción de ciudades [Theory of cityconstruction]. Madrid, Spain: Ministry of Public Administration, City ofBarcelona, and Madrid City Council. (Original work published 1859)Commission for Integrated Transport. (2009). Land use and trans-port: Settlement patterns and the demand for travel. London, UK: Hal-crow Group Ltd.Dematteis, G. (1998). Suburbanización y peri urbanización: Ciudadesanglosajonas y ciudades Latinas [Suburbanization and peri-urbanization:Anglo Saxon and Latin cities and towns]. In F. J. Monclus (Ed.), Laciudad dispersa [The dispersed city] (pp. 17–35). Barcelona, Spain:Centro de Cultura Contemporánea de Barcelona. Department for Communities and Local Government. (2005).Planning policy statement 1; delivering sustainable development. RetrievedFebruary 8, 2012, from http://www.communities.gov.ukDepartment for Communities and Local Government. (2007). Eco-town prospectus. Retrieved February 8, 2012, from http://www.commu-nities.gov.ukDepartment for Communities and Local Government. (2008). Land usechanges in England: Residential development to 2006. London, UK: HMSO.Department of Environment, Transport and the Regions. (2000).Our towns and cities–Delivering an urban renaissance. Norwich, UK:Department of the Environment, Transport and the Regions, HMSO. Donovan, N., & Halpern, D. (2002). Life satisfaction: The state ofknowledge and implications for government. Cabinet Office analyticalpaper, December, 2002. London, UK: Cabinet Office. Retrieved April2, 2012, from http://webarchive.nationalarchives.gov.uk/20070101092320/http://cabinetoffice.gov.uk/strategy/downloads/seminars/ls/paper.pdfDuany, A., & Plater-Zyberk, E. (1991). Towns and town-makingprinciples. New York, NY: Rizzoli.Echenique, M. H. (1994). Urban and regional planning at the MartinCentre: Its origin, its present, and its future. Environmental Planning B,21(5), 517–533.Echenique, M. H. (2004). Econometric models of land use & trans-portation. In D. Hensher, K. Button, K. Haynes, & P. Stopher (Eds.),Handbook of transport geography & spatial systems (pp. 185–202).London, UK: Elsevier Sciences.Echenique, M. H., Barton, H., Hargreaves, A. J., & Mitchell, G.(2010). SOLUTIONS Final report sustainability of land use and transportin outer neighbourhoods. Retrieved February 15, 2012, fromhttp://www.suburbansolutions.ac.ukEvans, A. (1998). Of growth controls, green belts and economics. Reading,UK: University of Reading.Ewing, R., Bartholomew, K., Winkelman, S., Walters J., & Chen, D.(2007). Growing cooler: The evidence on urban development and climatechange. Chicago, IL: Urban Land Institute.
136 Journal of the American Planning Association, Spring 2012, Vol. 78, No. 2
Dow
nloa
ded
by [
Okl
ahom
a St
ate
Uni
vers
ity]
at 2
0:12
30
Nov
embe
r 20
14
Ewing, R., & Cervero, R. (2001). Travel and built environment–syn-thesis. Transportation Research Record, 1780, 87–114.Ewing, R., & Cervero, R. (2010). Travel and built environment: A meta-analysis. Journal of the American Planning Association, 76(3), 265–294.Garreau, J. (1991). Edge city: Life on the new frontier. New York, NY:Knopf Doubleday. Glaeser, E., & Kahn, M. (2004). Sprawl and urban growth (NBERworking paper series, Cambridge, MA). In J. V. Henderson & J. F.Thisse (Eds.), Handbook of regional and urban economics, (Vol. 4, No. 4,pp. 2481–2527). Amsterdam, The Netherlands: Elsevier. (Originalwork published 2003)Gordon, I. (1997). Densities, urban form and travel behaviour, Townand Country Planning, 66(9), 239–241. Gordon, I. (2008). Density and the built environment. Energy Policy,36(12), 4652–4656. Gordon, P., Richardson, H. W., & Jun, M.-J. (1991). The commutingparadox: Evidence from the top twenty. Journal of American PlanningAssociation, 57(4), 416–420.Gross, H., & Lane, N. (2007). Landscape of the lifespan: Exploringaccounts of own gardens and gardening. Environmental Psychology,27(3), 225–241.Hall, P., Gracey, H., Drewett, R., & Thomas, R. (1973). The contain-ment of urban England. Oxford, UK: George Allen and Unwin. Hall, P., & Pain, K. (2006). The polycentric metropolis: Learning frommega-city-regions in Europe. London, UK: Earthscan.Howard, E. (1902). The garden cities of tomorrow. London, UK: SwanSonnenschein. (Original work published 1898 as Tomorrow, a peacefulplan to social reform) Jenks, M., Burton, E., & Williams, K. (Eds.) (1996). The compact city:A sustainable urban form? London, UK: E. & F. N. Spon. Katz, P. (1994). The new urbanism: Toward an architecture of commu-nity. New York, NY: McGraw-Hill.King, J. (2007). The King review of low-carbon cars. Report, October2007. Norwich, UK: Office for Public Sector Information. RetrievedApril 3, 2012, from http://www.hm-treasury.gov.uk/kingKopp, A. (1970). Town and revolution: Soviet architecture and city plan-ning, 1917–1935. T. E. Burton (Trans.). New York, NY: George Braziller.MacKay, D. J. C. (2009). Sustainable energy—Without the hot air.Cambridge, UK: UIT. Marcial Echenique and Partners. (2002). LASER enhancement project:Final report. Report produced for ITEA Division, Department forTransport, Contract No. PPAD9/65/71, May 2002. London, UK:Department for Transport. Meen, G. (2005). On the economics of the Barker review of housingsupply. Housing Studies, 20(6), 949–971. McKinsey & Company, on behalf of a consortium of 31 public andprivate companies. (2010, November). A portfolio of powertrains for Europe:A fact based analysis: The role of battery electric vehicles, plug-in hybrids andfuel cell electric vehicles. Retrieved February 1, 2012, from http://www.zeroemissionvehicles.eu/uploads/Power_trains_for_Europe.pdfMitchell G., Hargreaves, A. J., Namdeo A., & Echenique, M. H.(2011). Land use, transport and carbon futures: The impact of spatial
form strategies in three UK urban regions. Environment and Planning A,43(9), 2143–2163.Newman, P., & Kenworthy, J. (1989). Gasoline consumption andcities: a comparison of U.S. cities with a global survey. Journal of theAmerican Planning Association 55(1), 24–37.Oregon State Government. (2010). Oregon’s statewide planning goals & guidelines. Oregon Department of Land Conservation and Develop-ment. Retrieved February 2, 2012, from http://www.oregon.gov/lcdOve Arup & Partners International Limited, and Scott WilsonScotland Ltd in association with Marcial Echenique & Partners andSocial Research Associates Ltd. (2002). Tyneside area multi-modal study:Study report. Department for Transport & Government Office for theNorth East, November 2002, Government Office for the North EastNewcastle, UK. To obtain a copy of the report, contact Arup, 13Fitzroy Street, London W1T 4BQ, UK.Richardson, H., & Gordon, P. (2001). Compactness or sprawl:America’s future vs. the present. In M. Echenique & A. Saint (Eds.),Cities for the new millennium (pp. 53–64). London, UK: E. & F. N.Spon.Rogers, R. (1999). Towards an urban renaissance: Final report of theUrban Task Force. Department for the Environment, Transport and theRegions, London HMSO. London, UK: Spon.Rogers, R., & Power, A. (2000). Cities for a small country. London, UK:Faber and Faber.Sak, B., & Raponi, M. (2002). Housing statistics in the European Union2002. Liège, Belgium: International Centre for Research and Informa-tion on the Public and Cooperative Economy, University of Liège. Schweitzer, L., & Zhou, J. (2010). Neighborhood air quality, respira-tory health, and vulnerable populations in compact and sprawledregions. Journal of the American Planning Association, 76(3),363–371.Sorensen, P. (2009). Moving Los Angeles. Access: The Magazine of theUniversity of California Transportation Center, 35 (Fall), 16–24.Town and County Planning Association. (2007). Best Practice inurban extensions and new settlements. London, UK: Town and CountryPlanning Association, HMSO. Retrieved April 3, 2012, fromhttp://www.tcpa.org.uk/data/files/newtowns.pdfTransportation Research Board. (2009). Driving and the built environ-ment: The effects of compact development on motorized travel, energy use,and CO2 emissions. Special Report 298 by the Transportation ResearchBoard and the Board on Energy and Environmental Systems, of theNational Research Council of the National Academies. Washington,DC: Author. Retrieved April 3, 2012, from http://www.trb.org/Publica-tions/Blurbs/162093.aspxU. S. Environmental Protection Agency. (2006). This is smart growth.Report by the International City/County Management Association andthe Smart Growth Network. Washington DC: Author. RetrievedDecember 21, 2012, from http://www.smartgrowth.orgWilliams, K., Burton, E., &Jenks, M. (Eds.). (2000). Achievingsustainable urban form. London, UK: E. & F. N. Spon. Wright, F. L. (1932). The disappearing city. New York, NY: W. F.Payson.
Echenique et al.: Growing Cities Sustainably 137
Dow
nloa
ded
by [
Okl
ahom
a St
ate
Uni
vers
ity]
at 2
0:12
30
Nov
embe
r 20
14