01 NAFTA Czerwi-ski Paper BIODEG 2010 Bio Ex Di V6 COLORS-p
18
Influences of Biocomponents (RME) on Emissions of a Diesel Engine with SCR Authors: Czerwinski, Jan 1 ; Stepien, Zbigniew 2 ; Oleksiak, Stanislaw 2 ; Otto, Andersen 3 1 University of Applied Sciences, Biel-Bienne, Switzerland (AFHB), 2 Oil and Gas Institute, Krakow, Poland (INIG) 3 Western Norway Research Institute, Sogndal, Norway (Vestforsk) ABSTRACT SCR *) (selective catalytic reduction) is regarded as the most efficient deNO x -system. In combination with a Diesel particle filter (DPF) it represents a very important step towards zero emission Diesel fleet. The present paper informs about the results obtained with SCR and with blend fuels containing different share of RME (B7, B20, B30 and B100). The investigations were performed according to the procedures of the international network project VERTdePN. Also a combined system (DPF+SCR) was included in the investigations. Beside the legally limited exhaust emission components some non-legislated like NO 2 , N 2 O, NH 3 and nanoparticles were measured at stationary and dynamic engine operation. The most important findings are: the increased share of RME w/o aftertreatment causes an increase of NO x by higher engine load and reduction of CO and HC; at transient operation (ETC) these tendencies are less pronounced and only B100 shows an increase of NO x , with SCR alone there are no differences of NO x and of NOx reduction rate (K NOX ) with increasing RME portion; there is lowering of CO and HC, with DPF+SCR K NOX -values are slightly higher, than with SCR alone, due to the production of NO 2 in the catalytic DPF (upstream of SCR), there is excellent count filtration efficiency of DPF, up to 99.9% ; with SCR alone there is usually a small reduction of nanoparticles concentrations (in the range of 10-20%, similar like an usual oxidation catalyst). In general it can be said, that some relationships of results, which are remarked at stationary operation can disappear or even be inverted at transient operation. This is to explain with the running chemical reactions in the aftertreatment system, which meet quite different changing conditions (p, T and composition) during the transients. INTRODUCTION The removal of NO x from the lean exhaust gases of Diesel engines (also lean-burn gasoline engines) is an important challenge. Selective catalytic reduction (SCR) uses a supplementary substance – reduction agent – which in presence of catalysts produces useful reactions transforming NO x in N 2 and H 2 O. The preferred reduction agent for toxicological and safety reasons is the water solution of urea (AdBlue), which due to reaction with water (hydrolysis) and due to thermal decomposition (thermolysis) produces ammonia NH 3 , which is the real reduction substance. +) Abbreviations see at the end of paper A classical SCR deNO x system consists of 4 catalytic parts: 1
Transcript of 01 NAFTA Czerwi-ski Paper BIODEG 2010 Bio Ex Di V6 COLORS-p

Influences of Biocomponents (RME) on Emissions of a Diesel Engine with SCR
Authors: Czerwinski, Jan1; Stepien, Zbigniew2; Oleksiak, Stanislaw2; Otto, Andersen3
1University of Applied Sciences, Biel-Bienne, Switzerland (AFHB), 2Oil and Gas Institute, Krakow, Poland (INIG)3Western Norway Research Institute, Sogndal, Norway (Vestforsk)
ABSTRACT
SCR*) (selective catalytic reduction) is regarded as the most efficient deNOx-system. In combinationwith a Diesel particle filter (DPF) it represents a very important step towards zero emission Dieselfleet.The present paper informs about the results obtained with SCR and with blend fuels containingdifferent share of RME (B7, B20, B30 and B100). The investigations were performed according tothe procedures of the international network project VERTdePN. Also a combined system(DPF+SCR) was included in the investigations.Beside the legally limited exhaust emission components some non-legislated like NO2, N2O, NH3 and nanoparticles were measured at stationary and dynamic engine operation.
The most important findings are: the increased share of RME w/o aftertreatment causes an increase of NOx by higher engine load
and reduction of CO and HC; at transient operation (ETC) these tendencies are less pronouncedand only B100 shows an increase of NOx,
with SCR alone there are no differences of NOx and of NOx reduction rate (KNOX) withincreasing RME portion; there is lowering of CO and HC,
with DPF+SCR KNOX-values are slightly higher, than with SCR alone, due to the production ofNO2 in the catalytic DPF (upstream of SCR),
there is excellent count filtration efficiency of DPF, up to 99.9% ; with SCR alone there isusually a small reduction of nanoparticles concentrations (in the range of 10-20%, similar likean usual oxidation catalyst).
In general it can be said, that some relationships of results, which are remarked at stationaryoperation can disappear or even be inverted at transient operation. This is to explain with therunning chemical reactions in the aftertreatment system, which meet quite different changingconditions (p, T and composition) during the transients.
INTRODUCTION
The removal of NOx from the lean exhaust gases of Diesel engines (also lean-burn gasoline engines)is an important challenge. Selective catalytic reduction (SCR) uses a supplementary substance –reduction agent – which in presence of catalysts produces useful reactions transforming NOx in N2
and H2O.The preferred reduction agent for toxicological and safety reasons is the water solution of urea(AdBlue), which due to reaction with water (hydrolysis) and due to thermal decomposition(thermolysis) produces ammonia NH3, which is the real reduction substance.
+) Abbreviations see at the end of paper
A classical SCR deNOx system consists of 4 catalytic parts: 1

NanoMet
SMPS
precatalyst converting NO to NO2 (with the aim of 50/50 proportion) injection of AdBlue (with the intention of best distribution and evaporation in the exhaust
gas flow) hydrolysis catalyst (production of NH3) selective catalyst (several deNOx reactions) oxidation catalyst (minimizing of NH3 slip).
The main deNOx-reactions between NH3, NO and NO2 are widely mentioned in the literature [1, 2,3, 4]. They have different speeds according to the temperatures of gas and catalysts, space velocityand stoichiometry. All these influences cause a complex situation of reactions during the transientengine operation.Additionally to that there are temperature windows for catalysts and cut off the AdBlue-injection atlow exhaust gas temperatures to prevent the deposits of residues.
Several side reactions and secondary substances are present. An objective is to minimize the tailpipe emissions of: ammonia NH3, nitrous oxide N2O, isocyanic acid HNCO and ammonium nitrateNH4 NO3 (also known as secondary nanoparticles).
The combination of particle filtration (DPF) and of the most efficient deNOx technology (SCR) iswidely considered as the best solution, up to date, to minimize the emissions of Diesel engines.
For the use of biocomponents the limiting of impurities and phosphorus in biofuels according to thepresent standards is an obligatory prerequisite for successful operation.
The present paper shows some results of research of SCR-and (DPF+SCR)-systems with different rates of biocomponents (RME). The tests were performed at the Laboratories for IC-Engines and Exhaust Emission Control of the University of Applied Sciences Biel, Switzerland (AFHB) in collaboration with the BIODEG project partners.
Some results with the combined exhaust aftertreatment systems with the market fuel and information about the VERdePN project, which focuses on the quality testing of aftertreatment systems for retrofitting are given in [5].
TESTED ENGINE, FUELS, LUBRICANT
Test engine
Manufacturer: Iveco, Torino ItalyType: F1C Euro 3Displacement: 3.00 LitersRPM: max. 4200 rpmRated power: 100 kW @ 3500 rpmModel: 4 cylinder in-lineCombustion process: direct injectionInjection system Bosch Common Rail 1600 barSupercharging: Turbocharger with intercoolingEmission control: noneDevelopment period: until 2000 (Euro 3)
Fig. 1 shows the engine and the apparatus for nanoparticle analytics SMPS and NanoMet in the laboratory for IC-engines, University of Applied Sciences, Biel-Bienne.
2
Fig. 1: IVECO engine F1C and equipment for nanoparticle measurements in the engine room

Fuels
Following base fuels were used for the research (Table 1): Shell Formula Diesel fuel Swiss market summer quality (10 ppm S) according to SN EN 590 Rapeseed Oil Methyl Ester RME from Flamol, Berne, CH
Table 1: Fuel properties as per EU-standards Table 2: Principal parameters of the blend fuels and further analysis of the test fuels
Table 1 represents the most important data of the fuels according to the standards and the analysiscertificates. It can be remarked, that there are differences of density, heat value, stoichiometric air requirement andboiling range, which have influences on the engine operation and especially on the full loadparameters. These changing fuel parameters were taken into account by the evaluation ofmeasurements.
The resulting fuel parameters for the blend fuels are represented in Table 2.
MEASURING SET-UP AND INSTRUMENTATION
Engine dynamometer and standard test equipment
Fig. 2 represents the special systems installed on the engine, or in its periphery for analysis of the regulated and unregulated emissions.
Laboratory equipment employed: Dynamic test bench Kristl & Seibt with force transducer HBM T10F Volatile components:
- Horiba exhaust gas measurement devices Type: VIA-510 for CO2, CO, HCIR, O2, Type: CLA-510 for NO, NOx (this standard hot analyser with one reactor is marked in this report as “1 CLD”)
- Amluk exhaust gas measurement device Type: FID 2010 for HCFID,
FTIR (Fourier Transform Infrared) Spectrometer (AVL SESAM) with the possibility of simultaneous, time-resolved measurement of approx. 30 emission components – among those validated are: NO, NO2, NOx, NH3, N2O.
- 3 -
3
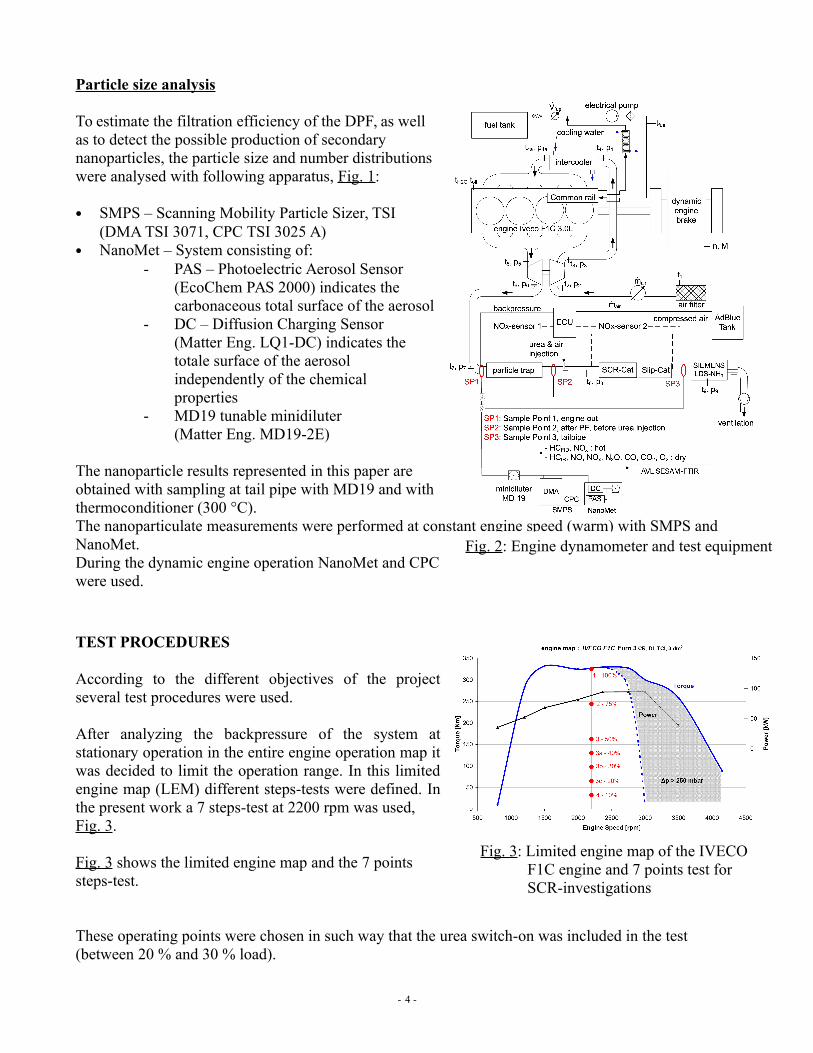
Particle size analysis
To estimate the filtration efficiency of the DPF, as wellas to detect the possible production of secondarynanoparticles, the particle size and number distributionswere analysed with following apparatus, Fig. 1:
SMPS – Scanning Mobility Particle Sizer, TSI(DMA TSI 3071, CPC TSI 3025 A)
NanoMet – System consisting of:- PAS – Photoelectric Aerosol Sensor
(EcoChem PAS 2000) indicates the carbonaceous total surface of the aerosol
- DC – Diffusion Charging Sensor (Matter Eng. LQ1-DC) indicates the totale surface of the aerosol independently of the chemical properties
- MD19 tunable minidiluter (Matter Eng. MD19-2E)
The nanoparticle results represented in this paper areobtained with sampling at tail pipe with MD19 and withthermoconditioner (300 °C).The nanoparticulate measurements were performed at constant engine speed (warm) with SMPS and NanoMet. During the dynamic engine operation NanoMet and CPC were used.
TEST PROCEDURES
According to the different objectives of the projectseveral test procedures were used.
After analyzing the backpressure of the system atstationary operation in the entire engine operation map itwas decided to limit the operation range. In this limitedengine map (LEM) different steps-tests were defined. Inthe present work a 7 steps-test at 2200 rpm was used, Fig. 3.
Fig. 3 shows the limited engine map and the 7 points steps-test.
These operating points were chosen in such way that the urea switch-on was included in the test (between 20 % and 30 % load).
- 4 -
Fig. 2: Engine dynamometer and test equipment
Fig. 3: Limited engine map of the IVECOF1C engine and 7 points test for SCR-investigations

The denomination of the OP’s from other measuring series was not changed in order to keepcomparability with other projects and new OP’s were named by adding a letter 3a, 3b, 3c).
For a more detailed investigation of the tested system different sampling positions (SP) were used (seeFig. 2): SP 0 sampling engine out w/o aftertreatment system (same as SP1)SP 1 sampling engine out with aftertreatment systemSP 2 sampling engine after DPF (before urea dosing) with aftertreatment systemSP 3 sampling engine at tailpipe with aftertreatment system
The dynamic testing was performed with the ETC(European Transient Cycle), which in this workwas defined on the basis of the non limited engineoperation map (NEM), Fig. 4.
The tests have shown that the backpressure atdynamic operation is generally lower, as atstationary operation and therefore the dynamictests were performed with ETC adapted to theentire engine operation map. Fig. 4: Torque and speed in ETC IVECOF1C.
The tests were driven after a warm-up phase, when the enginecoolant temperature and lube oil temperature reached their stationary values (stationary points tests).
Before the start of each dynamic cycle the same procedure of conditioning was used to fix as well aspossible the thermal conditions of the exhaust gas aftertreatment system.This conditioning was: 5 min pt. 1 and 0.5 min idling.
The test program consisted of:
test procedures: steps-tests at 2200 rpm and ETC (NEM); aftertreatment systems: without, with (DPF+SCR), with SCR only; fuels: Diesel (ULSD), B7, B20, B30 and B100.
TESTED SYSTEMS SCR and (DPF+SCR)
The combined exhaust gas aftertreatment system (DPF+SCR) was installed on the IVECO researchengine in the ICE-laboratory in Biel, CH.This system is designed for dynamic on-road applications.The filters and catalysts are exchangeable moduls, for SCR alone the DPF modulus was removed.The investigated combination is: a coated Cordierite DPF upstream and Vanadium-based SCR catalystdownstream of the urea injection point (see scheme Fig. 2). Additionally to the elements in the engine exhaust system an Ad Blue-tank and Ad Blue injection unitwith pump, sensors and electronic control were installed in the laboratory.There are following sensors, which enable the open-loop control of urea dosing: 2× Temperature sensors (PT200) 1× AdBlue level sensor 1× Mass Air Flow sensor 2× NOx sensors (upstream and downstream DPF)Optional: 1× NOx sensor downstream SCR catalysts for monitoring of performance.
- 5 -

Urea dosing and control unit has an open loop control.
Optional: GPRS Flight recorder enables: data logging of system performance, state and alarms on a remote server/database changing and checking of configuration parameters of urea dosing unit via internet.
The SCR-system, which was investigated in the present work is without mixer (only mixing tube 1.0 m).
The DPF has a VERT-conform filtration quality, in average for NP filtration efficiency FE > 99%.
RESULTS
Variations of fuel
Fig. 5 – the increased share of RME w/o aftertreatment causes in steps-tests: increase of NOx by higherengine load, reduction of CO and HC (here always HCFID) and slight lowering of texh (not represented)It is to remark that all part load operating points are driven exactly at the same torque and speed. Thefull load point OP 1 in contrary has always the same speed but the torque results from different heatvalues of the used fuels. That means the results at OP 1 are overlapped by the effect of different torque.At transient operation in ETC, Fig.6, these tendencies are present, but less pronounced, than atstationary steps-tests.
Fig.5: Limited emissions in steps-test at 2200rpm with different fuels w/o aftertreatement
Fig. 6: Emissions in ETC with different fuels w/o aftertreatment
With DPF+SCR the higher rate of RME provokes principally similar effects, which nevertheless aresuperimposed by the exhaust gas aftertreatment.
Fig. 7 represents some non-legislated components in steps-test and Fig. 8 the emissions and NOx-conversion rates in function of exhaust gas temperature with B0, B30 and B100.
The light-off of the catalysis in DPF starts already at OP 3c (texh8 180 – 200 °C) with elimination of CO(not represented here), but the stronger deNOx effect starts at OP 3b (texh8 approx. 240 °C).
- 6 -

Fig.7: Unregulated emissions in steps-test at 2200
rpm with different fuels with DPF and SCR; α=0.9
Fig.8: Comparison of emissions in steps-test with DPF+SCR and B0, B30 and B100; α=0.9; FTIR
- 7 -

In the conditions, where NO2 is produced – in the middle range of exhaust gas temperature – RME causes higher NO2 -values.
In the conditions where NH3 is produced RME causes lower NH3-values. The differences of NH3 nevertheless are very little and they can be interfered by some stochastic store-release-effects and reactions in the SCR system. At full load, OP1, there is also the influence of lower torque with increasing B-content. In spite of that the higher NOx-values at high- and full load with B100 are confirmed.
Generally it can be stated, that there are little influences of the biocomponents in fuel on the emissions with DPF+SCR.Fig. 9 shows the results of interesting NOx-components in function of exhaust gas temperature with BO, B30 and B100 for SCR alone.
In steps-tests there is no clear influence of RME portion on NOx. There is reduction of CO at higher load and general reduction of HC (not represented here). There are very little influences on NO2 and NH3.
The light-off of the SCR alone is with RME 100 at a slightly lower temperature, than with B0 and B30 ( t 10-20 °C). Except of that there are no other clear effects of the RME-content on the presented parameters.
- 8 -

Fig.9: Comparison of emissions in steps-tests with SCR and B0, B30 and B100; α=0.9; FTIR
Fig.11: Comparison of emissions in steps-tests with DPF+SCR and SCR, with the base fuel; α=0.9; FTIR
In dynamic operation (ETC), Fig. 10, there are no differences of NOx, NO2 and NH3 and there is lowering of CO and HC with higher RME content.

The influence of RME on NO2 with DPF+SCR which was remarked at stationary operation (more NO2 with more RME in certain texh-range) is no more present or even inversed at transient operation. Similarly for NH3, which was reduced by RME (with DPF+SCR) in stationary steps-tests and is notreduced or even increased in the dynamic test.
Fig.10: Emissions in ETC with different fuels with SCR
In general, it can be said, that some relationships of results, which are remarked at stationary operation can disappear or even be inverted at transient operation. This is to explain with the running chemical reactions in the aftertreatment system, which meet quite different changing conditions (p, T) during the transients.

Different exhaust aftertreatment systems
Fig. 11 represents the nitric emissions in function of exhaust gas temperature, with Diesel base fuel, forthe three investigated variants:
reference case (Ref.) without exhaust gas aftertreatment, combined aftertreatment system (DPF+SCR) and SCR alone.
With the catalyzed DPF there is a production of NO2 in the temperature range 250 °C – 350 °C. With the combined system (DPF+SCR) there is a slight emission of N2O (up to 4 ppm) in the lowest temperature range and there are lower NH3- values, than with SCR alone.The increase of NOx conversion rate KNOX is with the combined system at a slightly lower temperature ( t 10-20 °C)
Fig. 12: summarizes the conversion rates KNOX resulting from datalogging with OEM-UDS-sensors with B0, B30 and B100 in stationary steps-tests. The remarkable NOx-conversion takes place at OP 3b and all higher operating points. With DPF+SCR KNOX-values are slightly higher due to the production of NO2 in the catalytic DPF (upstream of SCR).
There are principally no significant differences of KNOX with different fuels, except of more reduction of NOx with B100 at the lowest OP3c (easier light-off with B100).
Fig. 13 represents the average NOx, NO2 and NH3 values in ETC. It is to remark that for DPF+SCR there are in average lower NOx, higher NO2 and lower NH3, than for SCR. The tendency of higher NOxwith RME (B100) is confirmed.
Fig.12: NOx conversion rates with different exhaust aftertreatment systems at stationary operation; α=0.9; UDS-sensors; 2200 rpm

Fig.13: Average values of NOx, NO2 and NH3 in ETC with different fuels and aftertreatment systems; α=0.9; FTIR

The reduction efficiencies in ETC with B0, B30and B100 and with both investigated exhaust aftertreatment systems are depicted in Fig. 14 (reduction efficiency RE and conversion rate Kx
are synonyms, they are calculated in this figure from the FTIR-results SP0 and SP3. With the combined system (DPF+SCR) there are clearly higher RE for NOx and lower RE for NO2.
There is no clear influence of biocomponent content on the reduction efficiency (except of a slight monotone tendency of lowering RE for NO2 with SCR alone).
Fig.14: Comparisons of reduction efficiencies in ETC; α=0.9; FTIR
Regarding the comparison of the two aftertreatment systems it can be summarized that: there are advantages of catalytic activity and production of NO2 upstream of SCR in the combined
system, the combined system has a slightly better conversion of NOx and a lower production of ammonia
NH3; there is an easier light off at slightly lower texh, there are no influences of biocomponents on the NOx-reduction efficiencies.Several other non-legislated components have been measured with FTIR, among others: isocyanic acid,hydrocyanic acid and formaldehydes. All these components have very low absolute values in the range of some “ppms” and are not further represented in this paper.The combined system (DPF+SCR) shows in most cases the tendency to minimize these components.
(Nano) Particles Emissions
The particle filter of the combined system had the filtration efficiency, which fulfilled the actual VERT quality requirements (PCFE > 99 %). I was interesting to state if there are some influences of biocomponents on the filtration resp. reduction efficiency of NP’s of the combined system (DPF+SCR) and how is the influence of SCR alone on NP’s ?
Fig. 15 shows the SMPS particle size distribution spectra without and with SCR at OP1 with B0, B30 and B100. There is a reduction of NP count concentration due to increasing B-content. This is in accordance with the other research results which generally state lower PM emissions with FAME’s at full load (higher O2-content in fuel, lower accumulation mode).
The penetration nevertheless stays similar for all fuel variants at approx. 90 %. This small reduction of nanoparticles concentration represents the diffusion losses in the mixing tube and in the SCR catalyst.
Penetration is a parameter representing the portion of particulates passing through the aftertreatment device; it is a ratio of down – to upstream concentrations.
Penetration = 1 – filtration efficiency.

Further comparisons of trapping efficiencies in stationary and dynamic engine operation (OP1 and ETC) are given in Table 3. The filtration efficiencies are estimated according to three parameters: integrated particle counts in the size range 20-300 nm or CPC for dynamic operation – PCFE ; DC-signal – DCFE; particle mass – PMFE.
Fig.15: SMPS-PSD spectra with B0, B30 and B100 and SCR; α= 0.9; 2200 rpm/100 % load
Tab. 3: Trapping efficiencies in stationary and dynamic operation; 2200 rpm / 100 % and ETC
With DPF+SCR and B0 there is an excellent filtration rate of 99.66 %. At this OP urea injection afterDPF is active. This trapping efficiency decreases with growing RME portion: 97.06 % with B30 and81.02 % with B100. This tendency is confirmed by DCFE and partly by PMFE.
The increase of NP-emission after the system (SP3) is surely not attributed to any failure of DPF, but tothe effects of condensation and creation of secondary NP’s after the DPF. These effects can be due tothe high exhaust gas temperature (production of sulfates, evaporation of higher boiling HC) and to theinter-action of the gas after DPF with the injected Ad Blue and with the SCR-system. The secondaryNP after SCR were found in 19 and they are subject of further investigations. It is probable thatboth: physical interaction (enabling a more intense condensation of substances) and chemicalinteraction (new products entering in the aerosol) take place. About a more detailed knowledge in thisrespect further research is necessary.
For SCR alone the reduction rates of nanoparticles at OP1 (stationary operation) have fluctuatingvalues.The negative value with B0 signifies an increase of NP and PM emission. With B100 there isexceptional reduction of particle mass (PM), which is not confirmed by the nanoparticles results (PCand DC). This picture leads to a supposition of stochastic store-release effects, a problem, which isdifficult accessible for investigations, but has to be kept in mind during the further research.
The average trapping efficiencies in dynamic operation (ETC) depict well the tendencies given bystationary operation.
The most important findings of this section are: excellent particle reduction in the (DPF+SCR) system at part load and increase of nanoparticles
penetration with growing RME portion (interaction of biocomponents and secondary NP), little particle reduction rates with SCR alone, in the range of 10 %; hypothesis of store-release-
effects with SCR.


CONCLUSIONS
From the present tests performed at stationary engine operation in steps-tests and at dynamic engineoperation in ETC several results can be remarked. The most important are:
for RME content the increased share of RME w/o aftertreatment causes an increase of NOx by higher engine load and
reduction of CO and HC; at transient operation (ETC) these tendencies are less pronounced andonly B100 shows an increase of NOx,
with DPF+SCR in the stationary conditions, where NO2 is produced RME causes higher NO2 –values and in the conditions, where NH3 is produced RME causes lower NH3 –values,
in dynamic tests (ETC) with DPF+SCR only higher NOx-emissions with RME 100 are to remark,CO and HC are for all fuels at zero level (catalytic conversion),
with SCR alone there are no differences of NOx and of NOx reduction rate (KNOX) with increasingRME portion; there is lowering of CO and HC,
in dynamic tests (ETC) with SCR there are no differences of NOx and there is lowering of CO andHC with RME,
there are generally no influences of RME-portion in fuel on the conversion values KNOX and KNO2, the light-off of the SCR alone is with RME 100 at a slightly lower temperature, than with B0 and
B30 ( t 10-20 °C).
for exhaust aftertreatment system with DPF+SCR KNOX-values are slightly higher, than with SCR alone, due to the production of NO2
in the catalytic DPF (upstream of SCR), with DPF+SCR the CO- and HC-emissions are mostly eliminated, with DPF+SCR in certain range of the exhaust temperature there are higher NO 2-values than with
SCR alone; these NO2-values are further increased with RME, with DPF+SCR the NH3-emissions are lower than for SCR, the reduction efficiencies in ETC with the combined system DPF+SCR, are for NOx higher and for
NO2 lower.
for nanoparticle emissions without aftertreatment and with increasing RME-share the maximum of the count concentration of
the PSD moves to smaller sizes and it decreases at full load, with DPF+SCR there is excellent filtration efficiency of DPF, up to 99.96 %, at stationary full load operation with DPF+SCR and with RME 100 there is an intense production
of secondary nanoparticles from the SCR part; this effect lowers remarkably the overall NP-reduction efficiency; it is almost not visible at dynamic operation,
with SCR alone there is usually a small reduction of nanoparticles concentrations (in the range of10-20 %) losses in the mixing tube and in the two in line SCR catalysts; in dynamic operation thisreduction is smaller (below 10 %),
with SCR at full load there is a slight increase of NP-counts due to the secondary NP-production, certain results with SCR show surprisingly high variations of reduction rates; this is explained with
the emitting dispersion during certain measuring series and has to be regarded in further research.The emitting dispersion can originate from some memory effects (store-release) of the entiresystem (engine + exhaust system). The measuring dispersion for nanoparticles is excluded byconformity of results obtained with different measuring methods.
In general it can be said, that some relationships of results, which are remarked at stationaryoperation can disappear or even be inverted at transient operation. This is to explain with therunning chemical reactions in the aftertreatment system, which meet quite different changingconditions (p, T) during the transients.

LITERATURE
[1] Willems, F.; Cloudt, R.; van den Eijnden, E.; van Genderen, M.; Verbeek, R.; de Jager,B.; Boomsma, W.; van den Heuvel, I.: Is Closed-Loop SCR Control Required to Meet FutureEmission Targets? SAE Techn. Paper 2007-01-1574
[2] Hosoya, M.; Kawada, Y.; Sato, S.; Shimoda, M.: The Study of NOx and PM ReductionUsing Urea Selective Catalytic Reduction System for Heavy Duty Diesel Engine. SAE Techn.
Paper 2007-01-1576 [3] Görsmann, C.: Retrofit SCRT® – A retrofit system for the simultaneous reduction of
carbon monoxide, hydrocarbon, soot particulate and oxides of nitrogen emissions fromcommercial vehicles, 4. FAD – Konferenz, Dresden, Nov. 2006, p. 155.
[4] Girard, J-W.; Cavataio, G.; Lamber, Ch. K.: The Influence of Ammonia Slip Catalystson Ammonia, N2O and NOx Emissions for Diesel Engines. SAE Techn. Paper 2007-01-1572
[5] Czerwinski, J.; Zimmerli, Y.; Mayer, A.; Heeb, N.; Lemaire, J.; D’Urbano, G.; Bunge, R.; Testing of Combined DPF+SCR Systems for HD-retrofitting VERTdePN. SAE Techn.
Paper 2009-01-0284. ABBREVIATIONS
AFHB Abgasprüfstelle FH Biel, CH Air min stoichiometric air requirement Bxx blend fuel with biocomponent share xx% CFPP cold filter plugging point CLD chemoluminescence detector CNC condensation nuclei counter CPC condensation particle counter DC Diffusion Charging Sensor DCFE diffusion charge filtration
efficiency dePN de Particles + deNOx
DMA differential mobility analyzer DPF Diesel Particle Filter ECU electronic control unit EMPA Eidgenössische Material Prüf- und
Forschungsanstalt EPA Environmental Protection Agency ETC European Transient Cycle FE filtration efficiency FID flame ionization detector FL full load FTIR Fourrier Transform Infrared
Spectrometer HD heavy duty Hu lower calorific value ICE internal combustion engines
Kx conversionrate of “x”
LDS Laser Diode Spectrometer (for NH3) LEM limited engine map MD19 heated minidiluter NanoMet NanoMet nanoparticle summary
surface analyser (PAS + DC + MD19) NEM nonlimited engine map NP nanoparticles < 999 nm (SMPS range) OEM original equipment manufacturer OP operating point PAS Photoelectric Aerosol Sensor PC particle counts PCFE particle counts filtration efficiency PM particulate matter, particle mass PMFE particle mass filtration efficiency PSD particle size distribution RE reduction efficiency RME rapeseed oil methyl ester SCR selective catalytic reduction SMPS Scanning Mobility Particle Sizer SP sampling position TC thermoconditioner. Total Carbon TTM Technik Thermische Maschinen ULSD ultra low sulfur Diesel

VERT Verification of Emission Reduction Technologies
VERTdePN VERT DPF + VERT deNOx
feed factor of urea dosing; ratio: urea injected / urea stoichio- metric; calculated by the ECU.