01 MS Cover page October, 2021.pub - Ethiopian Medical ...
211
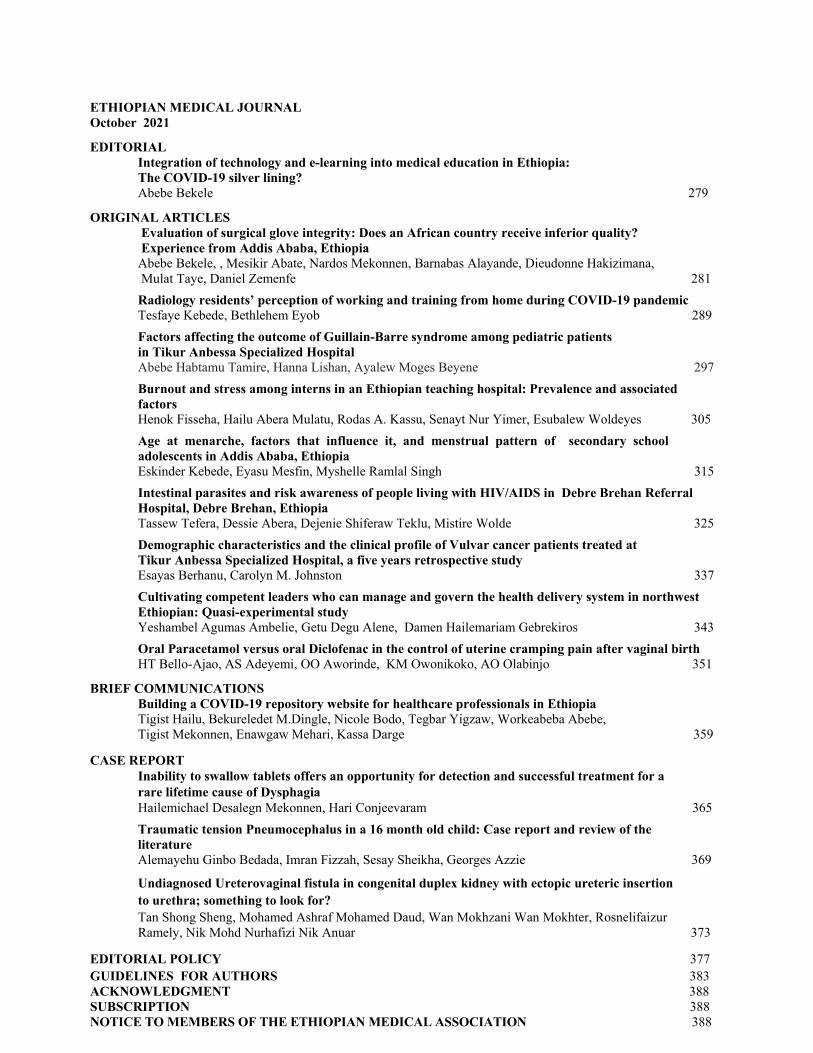
ETHIOPIAN MEDICAL JOURNAL OCTOBER 2021 VOLUME 59 NUMBER 4 ETHIOPIAN MEDICAL ASSOCIATION P.O. Box 3472, Addis Ababa, Ethiopia Tel. No. 251-15533742 www.emjema.org [email protected] [email protected] Fax: 251-1-5533742 Addis Ababa, Ethiopia EDITORIAL Integration of technology and e-learning into medical education in Ethiopia: The COVID-19 silver lining? ORIGINAL ARTICLES Evaluation of surgical glove integrity: Does an African country receive inferior quality? Experience from Addis Ababa, Ethiopia Radiology residents’ perception of working and training from home during COVID-19 pandemic Factors affecting the outcome of Guillain-Barre syndrome among pediatric patients in Tikur Anbessa Specialized Hospital Burnout and stress among interns in an Ethiopian teaching hospital: Prevalence and associated factors Age at menarche, factors that influence it, and menstrual pattern of secondary school adolescents in Addis Ababa, Ethiopia Intestinal parasites and risk awareness of people living with HIV/AIDS in Debre Brehan Referral Hospital, Debre Brehan, Ethiopia Demographic characteristics and the clinical profile of Vulvar cancer patients treated at Tikur Anbessa Specialized Hospital, a five years retrospective study Cultivating competent leaders who can manage and govern the health delivery system in northwest Ethiopian: Quasi-experimental study Oral Paracetamol versus oral Diclofenac in the control of uterine cramping pain after vaginal birth BRIEF COMMUNICATIONS Building a COVID-19 repository website for healthcare professionals in Ethiopia CASE REPORT Inability to swallow tablets offers an opportunity for detection and successful treatment for a rare lifetime cause of Dysphagia Traumatic tension Pneumocephalus in a 16 month old child: Case report and review of the literature Undiagnosed Ureterovaginal fistula in congenital duplex kidney with ectopic ureteric insertion to urethra; something to look for? ISSN0014-1755
-
Upload
khangminh22 -
Category
Documents
-
view
3 -
download
0
Transcript of 01 MS Cover page October, 2021.pub - Ethiopian Medical ...

ETHIOPIAN MEDICAL
JOURNAL OCTOBER 2021 VOLUME 59 NUMBER 4
ETHIOPIAN MEDICAL ASSOCIATION P.O. Box 3472, Addis Ababa, Ethiopia
Tel. No. 251-15533742 www.emjema.org
[email protected] [email protected]
Fax: 251-1-5533742 Addis Ababa, Ethiopia
EDITORIAL
Integration of technology and e-learning into medical education in Ethiopia: The COVID-19 silver lining?
ORIGINAL ARTICLES Evaluation of surgical glove integrity: Does an African country receive inferior quality? Experience from Addis Ababa, Ethiopia
Radiology residents’ perception of working and training from home during COVID-19 pandemic
Factors affecting the outcome of Guillain-Barre syndrome among pediatric patients in Tikur Anbessa Specialized Hospital
Burnout and stress among interns in an Ethiopian teaching hospital: Prevalence and associated factors Age at menarche, factors that influence it, and menstrual pattern of secondary school adolescents in Addis Ababa, Ethiopia
Intestinal parasites and risk awareness of people living with HIV/AIDS in Debre Brehan Referral Hospital, Debre Brehan, Ethiopia
Demographic characteristics and the clinical profile of Vulvar cancer patients treated at Tikur Anbessa Specialized Hospital, a five years retrospective study
Cultivating competent leaders who can manage and govern the health delivery system in northwest Ethiopian: Quasi-experimental study
Oral Paracetamol versus oral Diclofenac in the control of uterine cramping pain after vaginal birth
BRIEF COMMUNICATIONS Building a COVID-19 repository website for healthcare professionals in Ethiopia
CASE REPORT Inability to swallow tablets offers an opportunity for detection and successful treatment for a rare lifetime cause of Dysphagia
Traumatic tension Pneumocephalus in a 16 month old child: Case report and review of the literature
Undiagnosed Ureterovaginal fistula in congenital duplex kidney with ectopic ureteric insertion to urethra; something to look for?
ISSN0014-1755

The Ethiopian Medical Journal is the official quarterly publication of the Ethiopian Medical As-sociation. It is devoted to the advancement and dissemination of knowledge pertaining to medi-cine in Ethiopia and other developing countries.
EDITORIAL BOARD
Editor-in-Chief Mirkuzie Woldie
Associate Editors-in-Chief
Yeshigeta Gelaw
Editors Eyasu Makonnen
Abebe Bekele Markos Tesfaye
Alemayehu Worku Workeabeba Abebe Tekalign Deressa
Wondwossen Amogne Wendemagegn Enbiale
Esayas Kebede Genet Gebremedhin Fasika Amdeselasie
Fiker Bekele
Corresponding Editors Kassa Darge
Charles Larson Frances Lester Paulos Quana’a
Solomon Tesfaye Carmela G. Abate Henry Blumberg Russell Kempker
Journal Manager
Meaza Aklilu
Senior Researcher Mohammed Feyisso Shaka
ETHIOPIAN MEDICAL JOURNAL October 2021
EDITORIAL Integration of technology and e-learning into medical education in Ethiopia: The COVID-19 silver lining? Abebe Bekele 279
ORIGINAL ARTICLES Evaluation of surgical glove integrity: Does an African country receive inferior quality? Experience from Addis Ababa, Ethiopia
Abebe Bekele, , Mesikir Abate, Nardos Mekonnen, Barnabas Alayande, Dieudonne Hakizimana, Mulat Taye, Daniel Zemenfe 281
Radiology residents’ perception of working and training from home during COVID-19 pandemic Tesfaye Kebede, Bethlehem Eyob 289
Factors affecting the outcome of Guillain-Barre syndrome among pediatric patients in Tikur Anbessa Specialized Hospital Abebe Habtamu Tamire, Hanna Lishan, Ayalew Moges Beyene 297
Burnout and stress among interns in an Ethiopian teaching hospital: Prevalence and associated factors Henok Fisseha, Hailu Abera Mulatu, Rodas A. Kassu, Senayt Nur Yimer, Esubalew Woldeyes 305
Age at menarche, factors that influence it, and menstrual pattern of secondary school adolescents in Addis Ababa, Ethiopia
Eskinder Kebede, Eyasu Mesfin, Myshelle Ramlal Singh 315
Intestinal parasites and risk awareness of people living with HIV/AIDS in Debre Brehan Referral Hospital, Debre Brehan, Ethiopia Tassew Tefera, Dessie Abera, Dejenie Shiferaw Teklu, Mistire Wolde 325
Demographic characteristics and the clinical profile of Vulvar cancer patients treated at Tikur Anbessa Specialized Hospital, a five years retrospective study Esayas Berhanu, Carolyn M. Johnston 337
Cultivating competent leaders who can manage and govern the health delivery system in northwest Ethiopian: Quasi-experimental study
Yeshambel Agumas Ambelie, Getu Degu Alene, Damen Hailemariam Gebrekiros 343
Oral Paracetamol versus oral Diclofenac in the control of uterine cramping pain after vaginal birth HT Bello-Ajao, AS Adeyemi, OO Aworinde, KM Owonikoko, AO Olabinjo 351
BRIEF COMMUNICATIONS Building a COVID-19 repository website for healthcare professionals in Ethiopia Tigist Hailu, Bekureledet M.Dingle, Nicole Bodo, Tegbar Yigzaw, Workeabeba Abebe, Tigist Mekonnen, Enawgaw Mehari, Kassa Darge 359
CASE REPORT Inability to swallow tablets offers an opportunity for detection and successful treatment for a rare lifetime cause of Dysphagia Hailemichael Desalegn Mekonnen, Hari Conjeevaram 365
Traumatic tension Pneumocephalus in a 16 month old child: Case report and review of the literature Alemayehu Ginbo Bedada, Imran Fizzah, Sesay Sheikha, Georges Azzie 369
Undiagnosed Ureterovaginal fistula in congenital duplex kidney with ectopic ureteric insertion to urethra; something to look for?
Tan Shong Sheng, Mohamed Ashraf Mohamed Daud, Wan Mokhzani Wan Mokhter, Rosnelifaizur Ramely, Nik Mohd Nurhafizi Nik Anuar 373
EDITORIAL POLICY 377 GUIDELINES FOR AUTHORS 383 ACKNOWLEDGMENT 388 SUBSCRIPTION 388 NOTICE TO MEMBERS OF THE ETHIOPIAN MEDICAL ASSOCIATION 388

279
Abebe Bekele. Ethiop Med J, 2021, Vol. 59, No. 4 EDITORIAL
INTEGRATION OF TECHNOLOGY AND ELEARNING INTO MEDICAL
EDUCATION IN ETHIOPIA: THE COVID-19 SILVER LINING?
Abebe Bekele, MD, FCS, FACS For quite some time, it has become very clear that the most realistic way to achieve sustainable development in a country is through quality education, and by extension through research and innovation. Unfortunately, Africa has not benefited optimally from quality education due to various factors, several of which are obvious. One such fac-tors is the very poor adaptation and integration of technology and eLearning into the education system in Africa (and Ethiopia). Health professional’s education in the continent is one clear example of such a situation. E-learning has several advantages over traditional learning. Digitalization of teaching and learning ensures avail-ability of huge and filtered information, allows easy manipulation of contents, offers possibility of real-time update and exchange, and it also allows for recording of lessons for possible repetition in the future. Formative and sum-mative assessment, student mentorship and support can also be easily integrated to it. Additionally, E-learning al-lows easy communication between the teacher and students that overcomes distance in space. In today’s globalized world, the possibility of sharing of resources across partners (for free or procured) has also emerged as one advan-tage of eLearning. Prior to the COVID epidemic, the full potential of technology and innovations in medical education in African and Ethiopia might not have been fully appreciated. However, it might not be out of place to say that technology and innovation saved medical education in the year 2020-21 all over the globe. The world witnessed the reality that educational technology and innovation could contribute significantly to medical education more than we probably had ever imagined. From the delivery of didactic teaching (lectures) remotely, simulation, clinical teaching, labora-tory teaching, student mentorship and assessment (MCQs and clinical examinations), and the need to provide a hybrid form of teaching and training - the integration of technology played key role in many instances to support medical education. One major point to emphasize at this juncture is that medical educators (and trainees) need to acquire new skills and competencies on how to use medical education technology and innovations. However, inappropriate, and reck-less deployment of technology and innovation have the potential to do more harm than good. With emphasis on competency-based medical education, there is clear indication that when technology and innovations are used, there must be evidence that this is helping trainee achieve the desired goal: i.e. enhanced performance. From our limited experience with eLearning (mostly Case Based Collaborative Learning) at the department of sur-gery of the Addis Ababa University, we have clearly seen that most medical students involved were very interested in eLearning as one modality of teaching. We found they were very aware of its many advantages but identified cost of internet as a major impediment. Most would strongly recommend similar sessions to their fellow students. Stakeholders in medical education in Ethiopia now have more than enough evidence with regards to the place of technology in medical education. It might have been conventional to relegate its importance to the background prior to the year 2020 and this might simply be associated with lack of adequate appreciation of the roles of tech-nology (and maybe be lack of financial means even though I strongly disagree); but doing the same thing post the COVID-19 pandemic might simply mean blatant ignorance of the reality of the current time. In certain instances, medical schools were first shut down almost indefinitely with the hope that the covid-19 situation would suddenly go away, and the schools would re-open to resume normal activities. However, the gross inequity in vaccine distri-bution in the globe has brought in a new reality. I, therefore, would like to join several authors in advocacy for the institutionalized adaptation of eLearning and technology to the medical education arena in Ethiopia. Medical schools in Ethiopia should integrate E-learning into
1.University of Global Health Equity, Kigali, Rwanda 2Addis Ababa, University, School of Medicine, Addis Ababa, Ethiopia *Corresponding Author E-mail: [email protected]

280
their routine pedagogical strategy. Stakeholders in medical education should consider investment in the most rele-vant technology – free and strong internet connection, and personalized devices to all students and faculty to say the least. Starting with dynamic approaches such as blended learning might help for ease of adaptation. Continuous skills development trainings should be provided to faculty and students. REFERENCES 1. Prober CG, Khan S (2013). Medical education reimagined: a call to action. Acad Med. 88(10):1407-10. doi:
10.1097/ACM.0b013e3182a368bd. PMID: 23969367. 2. Goh P, Sandars J, (2020). 'A vision of the use of technology in medical education after the COVID-19 pan-
demic', MedEdPublish, 9, [1], 49, 3. Ruiz JG, Mintzer MJ, Leipzig RM. The impact of E-learning in medical education. Acad Med
2006;81:207212. 4. Remtulla R. (2020). The Present and Future Applications of Technology in Adapting Medical Education
Amidst the COVID-19 Pandemic. JMIR medical education, 6(2), e20190. https://doi.org/10.2196/20190.
281
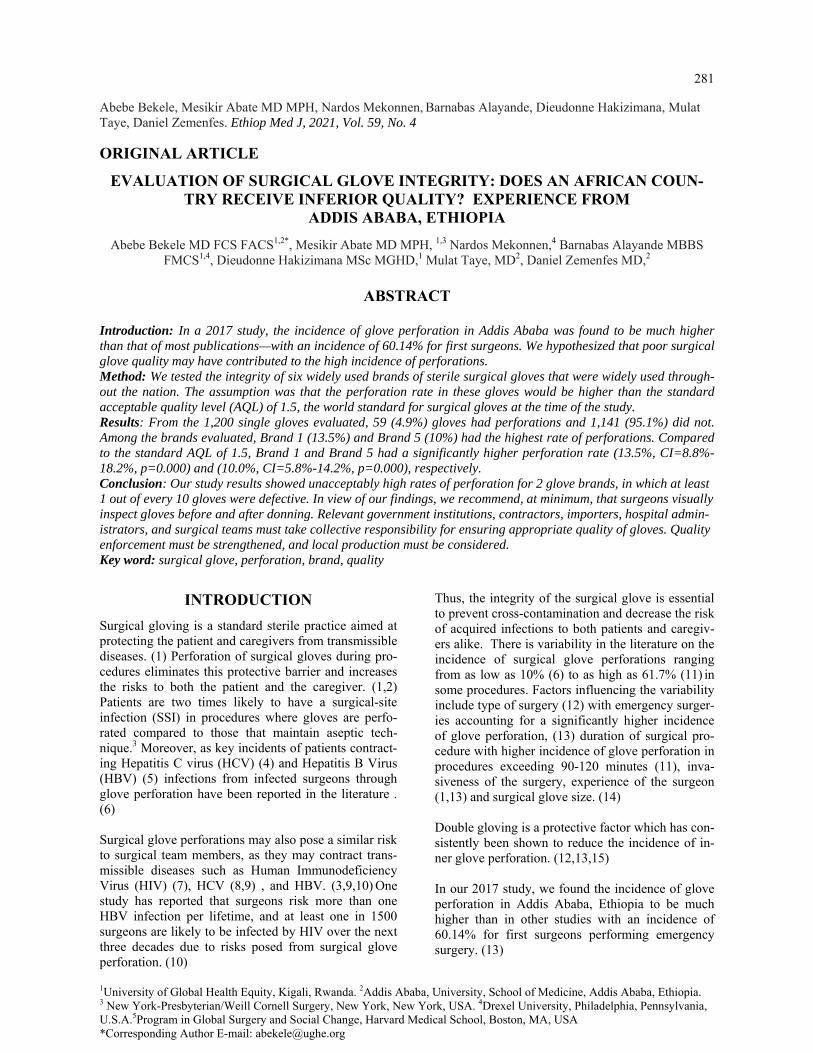
Abebe Bekele, Mesikir Abate MD MPH, Nardos Mekonnen, Barnabas Alayande, Dieudonne Hakizimana, Mulat Taye, Daniel Zemenfes. Ethiop Med J, 2021, Vol. 59, No. 4
ORIGINAL ARTICLE
EVALUATION OF SURGICAL GLOVE INTEGRITY: DOES AN AFRICAN COUN-TRY RECEIVE INFERIOR QUALITY? EXPERIENCE FROM
ADDIS ABABA, ETHIOPIA
Abebe Bekele MD FCS FACS1,2*, Mesikir Abate MD MPH, 1,3 Nardos Mekonnen,4 Barnabas Alayande MBBS FMCS1,4, Dieudonne Hakizimana MSc MGHD,1 Mulat Taye, MD2, Daniel Zemenfes MD,2
ABSTRACT
Introduction: In a 2017 study, the incidence of glove perforation in Addis Ababa was found to be much higher than that of most publications—with an incidence of 60.14% for first surgeons. We hypothesized that poor surgical glove quality may have contributed to the high incidence of perforations. Method: We tested the integrity of six widely used brands of sterile surgical gloves that were widely used through-out the nation. The assumption was that the perforation rate in these gloves would be higher than the standard acceptable quality level (AQL) of 1.5, the world standard for surgical gloves at the time of the study. Results: From the 1,200 single gloves evaluated, 59 (4.9%) gloves had perforations and 1,141 (95.1%) did not. Among the brands evaluated, Brand 1 (13.5%) and Brand 5 (10%) had the highest rate of perforations. Compared to the standard AQL of 1.5, Brand 1 and Brand 5 had a significantly higher perforation rate (13.5%, CI=8.8%-18.2%, p=0.000) and (10.0%, CI=5.8%-14.2%, p=0.000), respectively. Conclusion: Our study results showed unacceptably high rates of perforation for 2 glove brands, in which at least 1 out of every 10 gloves were defective. In view of our findings, we recommend, at minimum, that surgeons visually inspect gloves before and after donning. Relevant government institutions, contractors, importers, hospital admin-istrators, and surgical teams must take collective responsibility for ensuring appropriate quality of gloves. Quality enforcement must be strengthened, and local production must be considered. Key word: surgical glove, perforation, brand, quality
INTRODUCTION
Surgical gloving is a standard sterile practice aimed at protecting the patient and caregivers from transmissible diseases. (1) Perforation of surgical gloves during pro-cedures eliminates this protective barrier and increases the risks to both the patient and the caregiver. (1,2) Patients are two times likely to have a surgical-site infection (SSI) in procedures where gloves are perfo-rated compared to those that maintain aseptic tech-nique.3 Moreover, as key incidents of patients contract-ing Hepatitis C virus (HCV) (4) and Hepatitis B Virus (HBV) (5) infections from infected surgeons through glove perforation have been reported in the literature . (6) Surgical glove perforations may also pose a similar risk to surgical team members, as they may contract trans-missible diseases such as Human Immunodeficiency Virus (HIV) (7), HCV (8,9) , and HBV. (3,9,10) One study has reported that surgeons risk more than one HBV infection per lifetime, and at least one in 1500 surgeons are likely to be infected by HIV over the next three decades due to risks posed from surgical glove perforation. (10)
Thus, the integrity of the surgical glove is essential to prevent cross-contamination and decrease the risk of acquired infections to both patients and caregiv-ers alike. There is variability in the literature on the incidence of surgical glove perforations ranging from as low as 10% (6) to as high as 61.7% (11) in some procedures. Factors influencing the variability include type of surgery (12) with emergency surger-ies accounting for a significantly higher incidence of glove perforation, (13) duration of surgical pro-cedure with higher incidence of glove perforation in procedures exceeding 90-120 minutes (11), inva-siveness of the surgery, experience of the surgeon (1,13) and surgical glove size. (14) Double gloving is a protective factor which has con-sistently been shown to reduce the incidence of in-ner glove perforation. (12,13,15) In our 2017 study, we found the incidence of glove perforation in Addis Ababa, Ethiopia to be much higher than in other studies with an incidence of 60.14% for first surgeons performing emergency surgery. (13)
1University of Global Health Equity, Kigali, Rwanda. 2Addis Ababa, University, School of Medicine, Addis Ababa, Ethiopia. 3 New York-Presbyterian/Weill Cornell Surgery, New York, New York, USA. 4Drexel University, Philadelphia, Pennsylvania, U.S.A.5Program in Global Surgery and Social Change, Harvard Medical School, Boston, MA, USA *Corresponding Author E-mail: [email protected]

282
This poses a significant threat to both patients and the surgical workforce. Locally relevant factors that may have contributed to the higher incidence include the standard utilization of surgical residents as first sur-geons for emergency procedures, and the limited sup-ply of glove sizes resulting in a portion of the surgical team using inappropriate sized gloves. (13) In addi-tion, because Low and Middle Income Countries (LMICs) like Ethiopia depend on imports, it is possi-ble that poor surgical glove quality may have contrib-uted to the relatively high incidence of surgical glove perforations. It is imperative for relevant stakeholders and policy makers to be aware of the quality of the procured products so they can develop a safer surgical environment for patients and healthcare providers. We hypothesized that the perforation rate in these gloves would be higher than the standard acceptable quality level (AQL) 1.5, the world standard for surgi-cal gloves at the time of the study. (16,17)
METHODS Study Procedure: In this cross-sectional study, 200 powdered size 7.5 latex single gloves from each of the 6 brands of surgi-cal gloves available in pharmacies across Addis Ababa were randomly procured in June 2018. Each of the gloves studied here were manufactured by differ-ent companies, and in different countries. A total of 1,200 single gloves were examined. The characteris-tics of each brand of surgical glove including origin, constituent materials, cost, method of sterilization, quality assurance measures, available sizes, glove thickness, tensile thickness, elongation measures and storage recommendations were identified (Table 5). Since Ethiopia did not produce surgical gloves at the time of the study, local products were not included in the study. Control testing for surgical glove integrity was con-ducted for each glove using a standardized visual and a European Norm (EN) 455-1 water-leak test method.17,18 The tests were carried out by two indi-viduals who were blinded to the surgical glove brand. The visual test assessed for overt damage by inspec-tion. For the water-leak test, each glove was filled with 1L of water and methylene blue solution at room temperature followed by manual compression on the wrist of the glove for 1 minute. Leakage of blue water indicated perforation. The number and locations of the perforations were recorded for each glove. Statistical Analysis Descriptive statistics were computed for the categori-cal variables. A proportion t-test was utilized to test for difference in proportions between each brand and the null hypothesis of 0.04.
The null hypothesis was derived from what the ac-ceptable maximum is (8 defects) for an AQL of 1.5 in an n=200 random sample. (17) A difference in proportions using proportion t-test was also con-ducted for: (1) the total right versus total left hand gloves perforated in the total sample, (2) perforation in the right versus left gloves among each of the 6 brands, (3) the total perforation in the palmar versus dorsal aspects in the total sample size, and (4) the perforation in the palm versus dorsum versus both sides among each of the 6 brands. A Pearson chi-square analysis was conducted to determine an asso-ciation between the glove digits and the outcome, perforation. All p-values were two-sided with a sta-tistical significance level of p<0.05. All statistical analyses were conducted using Stata (version 14.2, Stata Corp, College Station, Texas, USA).
RESULTS
From the 1,200 single gloves evaluated, 59 (4.9%) gloves had perforations and 1,141 (95.1%) did not. Among the brands evaluated, Brand 1 (13.5%) and Brand 5 (10%) had the highest rate of perforations, followed by Brand 3 (3.0%) Brand 6 (2.0%), Brand 2 (1.0%) and Brand 4 (0%) (Table 1). Compared to the standard AQL 1.5 for surgical gloves at the time of the study,16,17 Brand 1 and Brand 5 had signifi-cantly higher perforation rate (13.5%, CI=8.8%-18.2%, p=0.000) and (10.0%, CI=5.8%-14.2%, p=0.000), respectively. There was no significant difference between the AQL and perforation rates for Brand 2 (2.0%, CI=-0.4%-2.4%, p=0.985), Brand 3 (3.0%, CI=0.6%-5.4%), p=0.985), Brand 4 (0.0%, CI=0.0%-0.0%, p=0.998) and Brand 6 (2.0%, CI=0.1%-3.9%, p=0.926) (Table 1). Among the 600 right and 600 left hand gloves evaluated, there were a total of 35 (5.8%) right hand glove perforations and 24 (4.0%) left hand glove perforations. There was no statistically significant difference between total right (5.8%, CI=3.9%-7.7%) and total left hand (4.0%, CI=2.4%-5.6%) glove perforation rates (p=0.149) (Table 2). The right-hand perforation rate (16.0%, CI=8.8%-23.2%) was significantly higher than the left-hand perforation rate (4.0%, CI=0.2%-7.8%) in Brand 5 (p=0.005) (Table 2). The left-hand perforation rate (4.0%, CI=0.2%-7.8%) was significantly higher than the right-hand perforation rate (0.0%, CI=0.0%-0.0%) in Brand 6 (p=0.043). There was no significant difference in the right and left glove perforation rates in Brand 1 (13.0% vs. 14.0%, p=0.836), Brand 2 (2.0% vs. 0.0%, p=0.155), and Brand 3 (4.0% vs. 2.0%, p=0.407). The p-value was not computed for Brand 4, which had 0 perforations (Table 2).

283
Table 1: Differences in perforation rate of surgical brands compared to the standard AQL
CI= Confidence Interval; Ha=Null hypothesis
Non-Perforated (n=200)
Perforated (n=200)
95% CI
p-value (Ha: p > 0.04)
Brands, n (%) Brand 1 173.0 (86.5%) 27.0 (13.5%) 8.8% - 18.2% 0.000 Brand 2 198.0 (99.0%) 2.0 (1.0%) -0.4% - 2.4% 0.985 Brand 3 194.0 (97.0% 6.0 (3.0%) 0.6% - 5.4% 0.765 Brand 4 200.0 (100.0%) 0.0 (0.0%) 0.0% - 0.0% 0.998 Brand 5 180.0 (90.0%) 20.0 (10.0%) 5.8% - 14.2% 0.000 Brand 6 196.0 (98.0%) 4.0 (2.0%) 0.1% - 3.9% 0.926
Table 2. Differences in glove perforation rate between right and left hands
CI=Confidence Interval
Right Hand (n=100)
95% CI
Left Hand (n=100)
95% CI, (%)
p-value
Brands, n (%)
Brand 1 13.0 (13.0%) 6.4%-19.6% 14.0 (14.0%) 7.2%-20.8% 0.836
Brand 2 2.0 (2.0%) -0.7%-4.7% 0.0 (0.0%) 0.0%-0.0% 0.155
Brand 3 4.0 (4.0%) 0.2%-7.8% 2.0 (2.0%) -0.7%-4.7% 0.407
Brand 4 0.0 (0.0%) 0.0%-0.0% 0.0 (0.0%) 0.0%- 0.0% N/A Brand 5 16.0 (16.0%) 8.8%-23.2% 4.0 (4.0%) 0.2%-7.8% 0.005
Brand 6 0.0 (0.0%) 0.0%-0.0% 4.0 (4.0%) 0.2%-7.8% 0.043
Total, n (%) (n=600)
35.0 (5.8%)
3.9%-7.7%
24.0 (4.0%)
2.4%-5.6%
0.149
Of the total 1200 gloves perforated, the palmar side was perforated at a significantly higher rate (4.5%, CI=3.3%-5.7%) than the dorsal side (0.5%, CI=0.1%-0.9%) (p=0.001). Among the brands evaluated, the palmar side was perforated at a significantly higher rate than the dorsal side in Brand 1 (12.0% vs. 0.2%, p=0.001), Brand 3 (3.0% vs. 0.0%, p=0.014) and Brand 5 (10.0% vs. 0.0%, p=0.001). There was no significant difference in the perforation rates between the palmar and dorsal side in Brand 2 (1.0% vs. 0.0%, p=0.156) and Brand 6 (1.0% vs. 1.0%, p=1.000). The p-value was not computed for Brand 4, which had 0 perforations (Table 3).
Of the total perforated gloves with single digit perfo-rations, the highest rates of perforations were found in Digit 1 (Thumb) (39.6%), followed by Digit 3 (Middle) and Digit 5 (Little) (17.0%), Digit 2 (Index) (15.1%), and Digit 4 (Ring) (11.3%). There was a statistically significant difference in the rates of per-foration among the 5 digits evaluated (p=0.009). Brand 5 had the highest rate of perforations for Digit 1 (71.4%) and Digit 5 (55.6%), Brand 1 for Digit 2 (75.0%) and Digit 3 (55.6%) and Digit 4 (100.0%) (Table 4). Only digit perforations that were inde-pendent were included in the analysis and six perfo-rated gloves which had perforations in more than 1 digit were excluded from the digit specific analysis.

284
Table 3: Differences in glove perforation rate between palmar and dorsal aspects
CI=Confidence Interval
Palmar Aspect (n=200)
95% CI
Dorsal Aspect (n=200)
95% CI
p-value
Brands, n (%) Brand 1 24.0 (12%) 7.5%-16.5% 4.0 (0.2%) 0.1%-3.9% 0.001 Brand 2 2.0 (1.0%) -0.4%-2.4% 0.0 (0.0%) 0.0%-0.0% 0.156 Brand 3 6.0 (3.0%) 0.6%-5.4% 0.0 (0.0%) 0.0%-0.0% 0.014 Brand 4 0.0 (0.0%) 0.0%-0.0% 0.0 (0.0%) 0.0%-0.0% N/A Brand 5 20.0 (10.0%) 5.8%-14.2% 0.0 (0.0%) 0.0%-0.0% 0.001 Brand 6 2 (1.0%) -0.4%-2.4% 2 (1.0%) -0.4%-2.4% 1.000 Total, n (%) (n=1200)
54 (4.5%)
3.3%-5.7%
6 (0.5%)
0.1%-0.9%
0.001
Table 4: Differences in glove perforation rate by digit among the six brands
Total Non-Perforated (n = 5947)
Total Perforated (n = 53)*
p-value
Digits, n (%)
Digit 1 (Thumb) ¨1179 (19.8%) ¨21.0 (39.6%) ^0.009
~Brand 1 Brand 2 Brand 3 Brand 4 Brand 5 Brand 6
198.0 (16.8%) 198.0 (16.8%) 198.0 (16.8%) 200.0 (17.0%) 185.0 (15.7%) 200.0 (17.0%)
2.0 (9.5%) 2.0 (9.5%) 2.0 (9.5%) 0.0 (0.0%) 15.0 (71.4%) 0.0 (0.0%)
Digit 2 (Index) ¨1192 (20.0%) ¨8.0 (15.1%) ~Brand 1 Brand 2 Brand 3 Brand 4 Brand 5 Brand 6
194.0 (16.3%) 200.0 (16.8%) 198.0 (16.6%) 200.0 (16.8%) 200.0 (16.8%) 200.0 (16.8%)
6.0 (75.0%) 0.0 (0.0%) 2.0 (25.0%) 0.0 (0.0%) 0.0 (0.0%) 0.0 (0.0%)
Digit 3 (Middle) ¨1191 (20.0%) ¨9.0 (17.0%) ~Brand 1 Brand 2 Brand 3 Brand 4 Brand 5 Brand 6
195.0 (16.4%) 200.0 (16.8%) 198.0 (16.6%) 200.0 (16.8%) 200.0 (16.8%) 198.0 (16.6%)
5.0 (55.6%) 0.0 (0.0%) 2.0 (22.2%) 0.0 (0.0%) 0.0 (0.0%) 2.0 (22.2%)
Digit 4 (Ring) ¨1194 (20.1%) ¨6.0 (11.3%) ~Brand 1 Brand 2 Brand 3 Brand 4 Brand 5 Brand 6
194.0 (16.2%) 200.0 (16.8%) 200.0 (16.8%) 200.0 (16.8%) 200.0 (16.8%) 200.0 (16.8%)
6.0 (100.0%) 0.0 (0.0%) 0.0 (0.0%) 0.0 (0.0%) 0.0 (0.0%) 0.0 (0.0%)
Digit 5 (Little) ¨1191 (20.0%) ¨9.0 (17.0%)
~Brand 1 Brand 2 Brand 3 Brand 4 Brand 5 Brand 6
196.0 (16.5%) 200.0 (16.8%) 200.0 (16.8%) 200.0 (16.8%) 195.0 (16.4%) 200.0 (16.8%)
4.0 (44.4%) 0.0 (0.0%) 0.0 (0.0%) 0.0 (0.0%) 5.0 (55.6%) 0.0 (0.0%)
CI=Confidence Interval * = Data includes only independent surgical glove perforations, ex-cludes 6 surgical gloves that had perforations in more than 1 digit ^ = p-value from the Pearson Chi Square analysis of association of rate of total perforations between the 5 digits ~ = Descriptive analy-sis of the total number of digits perforated and nonperforated in each where n =¨,the total number of perforations and non-perforations for each Digit
285
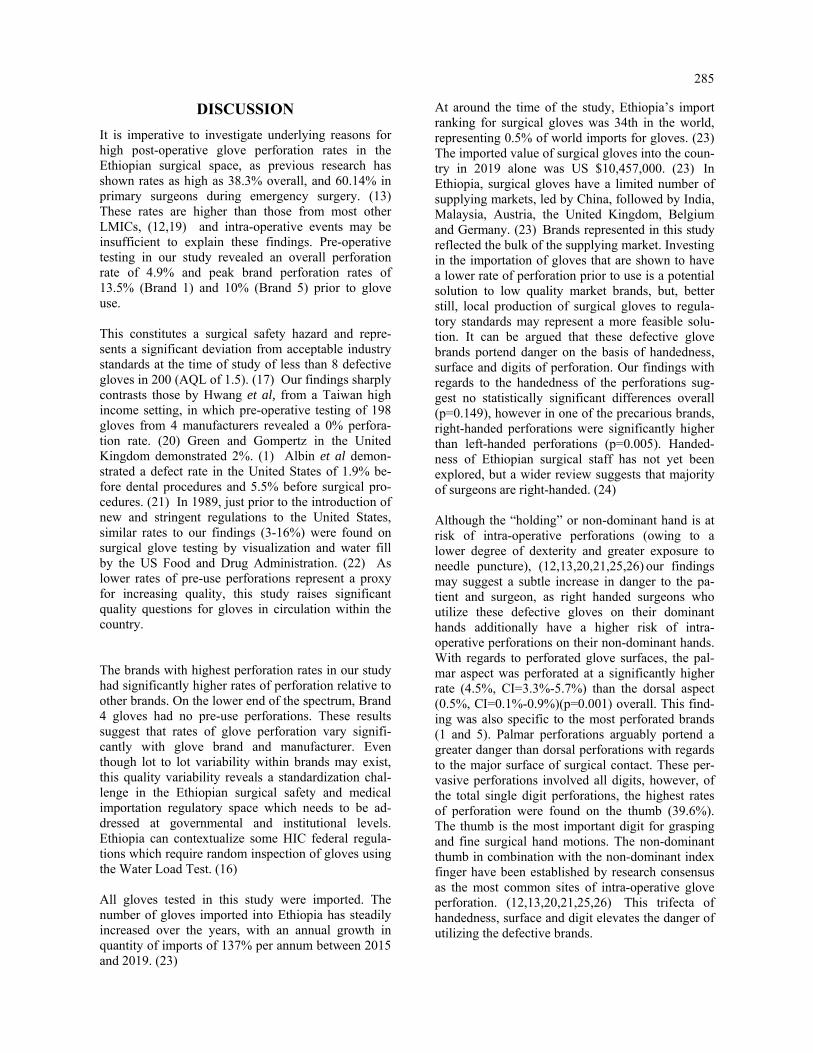
DISCUSSION
It is imperative to investigate underlying reasons for high post-operative glove perforation rates in the Ethiopian surgical space, as previous research has shown rates as high as 38.3% overall, and 60.14% in primary surgeons during emergency surgery. (13) These rates are higher than those from most other LMICs, (12,19) and intra-operative events may be insufficient to explain these findings. Pre-operative testing in our study revealed an overall perforation rate of 4.9% and peak brand perforation rates of 13.5% (Brand 1) and 10% (Brand 5) prior to glove use. This constitutes a surgical safety hazard and repre-sents a significant deviation from acceptable industry standards at the time of study of less than 8 defective gloves in 200 (AQL of 1.5). (17) Our findings sharply contrasts those by Hwang et al, from a Taiwan high income setting, in which pre-operative testing of 198 gloves from 4 manufacturers revealed a 0% perfora-tion rate. (20) Green and Gompertz in the United Kingdom demonstrated 2%. (1) Albin et al demon-strated a defect rate in the United States of 1.9% be-fore dental procedures and 5.5% before surgical pro-cedures. (21) In 1989, just prior to the introduction of new and stringent regulations to the United States, similar rates to our findings (3-16%) were found on surgical glove testing by visualization and water fill by the US Food and Drug Administration. (22) As lower rates of pre-use perforations represent a proxy for increasing quality, this study raises significant quality questions for gloves in circulation within the country.
The brands with highest perforation rates in our study had significantly higher rates of perforation relative to other brands. On the lower end of the spectrum, Brand 4 gloves had no pre-use perforations. These results suggest that rates of glove perforation vary signifi-cantly with glove brand and manufacturer. Even though lot to lot variability within brands may exist, this quality variability reveals a standardization chal-lenge in the Ethiopian surgical safety and medical importation regulatory space which needs to be ad-dressed at governmental and institutional levels. Ethiopia can contextualize some HIC federal regula-tions which require random inspection of gloves using the Water Load Test. (16)
All gloves tested in this study were imported. The number of gloves imported into Ethiopia has steadily increased over the years, with an annual growth in quantity of imports of 137% per annum between 2015 and 2019. (23)
At around the time of the study, Ethiopia’s import ranking for surgical gloves was 34th in the world, representing 0.5% of world imports for gloves. (23)
The imported value of surgical gloves into the coun-try in 2019 alone was US $10,457,000. (23) In Ethiopia, surgical gloves have a limited number of supplying markets, led by China, followed by India, Malaysia, Austria, the United Kingdom, Belgium and Germany. (23) Brands represented in this study reflected the bulk of the supplying market. Investing in the importation of gloves that are shown to have a lower rate of perforation prior to use is a potential solution to low quality market brands, but, better still, local production of surgical gloves to regula-tory standards may represent a more feasible solu-tion. It can be argued that these defective glove brands portend danger on the basis of handedness, surface and digits of perforation. Our findings with regards to the handedness of the perforations sug-gest no statistically significant differences overall (p=0.149), however in one of the precarious brands, right-handed perforations were significantly higher than left-handed perforations (p=0.005). Handed-ness of Ethiopian surgical staff has not yet been explored, but a wider review suggests that majority of surgeons are right-handed. (24) Although the “holding” or non-dominant hand is at risk of intra-operative perforations (owing to a lower degree of dexterity and greater exposure to needle puncture), (12,13,20,21,25,26) our findings may suggest a subtle increase in danger to the pa-tient and surgeon, as right handed surgeons who utilize these defective gloves on their dominant hands additionally have a higher risk of intra-operative perforations on their non-dominant hands. With regards to perforated glove surfaces, the pal-mar aspect was perforated at a significantly higher rate (4.5%, CI=3.3%-5.7%) than the dorsal aspect (0.5%, CI=0.1%-0.9%)(p=0.001) overall. This find-ing was also specific to the most perforated brands (1 and 5). Palmar perforations arguably portend a greater danger than dorsal perforations with regards to the major surface of surgical contact. These per-vasive perforations involved all digits, however, of the total single digit perforations, the highest rates of perforation were found on the thumb (39.6%). The thumb is the most important digit for grasping and fine surgical hand motions. The non-dominant thumb in combination with the non-dominant index finger have been established by research consensus as the most common sites of intra-operative glove perforation. (12,13,20,21,25,26) This trifecta of handedness, surface and digit elevates the danger of utilizing the defective brands.

286
In view of our findings of a large proportion of glove perforations prior to use, we recommend, at minimum, that surgeons visually inspect gloves before and after donning. The use of a double glove perforation indica-tor system may serve as an early warning system for pre-perforated gloves. For Ethiopian surgical teams who do not routinely use double glove for resource constraint reasons, results of our study strongly sug-gest right-sided double-gloving to mitigate risks asso-ciated with the demonstrated laterality of these pre-existing perforations. Widespread testing and Hepati-tis B vaccination of surgical staff should still be en-couraged, and Ethiopian authorities should intervene to protect surgeons and patients, to maximize invest-ments in the surgical sector, and to drive down surgi-cal site infections which now stand at a pooled preva-lence of 12.2%. (27) More importantly, possible facilitators of the entry of low-quality gloves into Ethiopia, like loose legisla-tion, irregular public procurement, and substandard quality control need to be creatively addressed. Brands not meeting up to standards should be banned from the Ethiopian space and high-quality brands should be rewarded. Brand 4 has demonstrated that conforming to quality standards are possible, as is often the case in strictly controlled HIC environments. (20) All health systems are vulnerable to corruption. (28) Ethiopia seems to be taking corruption in the health sector seriously, however, some authors have referenced poorly functioning reporting systems around hospital procurement and distribution proc-esses. (28)
Officials must ensure that there is no interference with the set standards for glove approval, compliance certi-fication, and licensing. The present findings could also serve as a call to strengthen transparency and ac-countability and increase performance measurement, monitoring, and enforcement in existing quality en-forcement agencies. Limitations of this study include our inability to test all glove brands and all sizes in use. However, we assessed the brands and size most commonly used during operations in Ethiopia. Furthermore, despite the fact that this study assessed for perforations using the standard methods utilized by quality control agen-cies, some studies suggest that newer testing methods like electrical conductance tests, may have revealed higher perforation rates (29). Furthermore, the contri-bution of additional characteristics (including thick-ness and elasticity) of the gloves to perforation rates was not measured. Finally, following conclusion of this study, progress has been made by international regulators to raise quality standards for surgical gloves by reducing the AQL to 0.65. (18)
Further studies should be carried out in Ethiopia to determine conformity to this new benchmark. (18) Conclusion Various brands of gloves manufactured in different countries are routinely imported for surgical proce-dures in Ethiopia, with high variability in quality between brands. Our study results show unaccepta-bly high rates of perforation for 2 glove brands, in which at least 1 out of every 10 gloves were defec-tive. The implications of this are staggering for surgical staff. In Ethiopia, choice of surgical glove brand may be a determinant of surgical safety. These find-ings also indicate that unrecognized pre-operative perforations may be a contributing factor to the high post-operative glove perforations identified in our previous study. Further studies are needed to under-stand how the intrinsic characteristics of gloves contribute to these rates of perforation. Relevant government institutions, contractors, importers, hospital administrators, and surgical teams must take collective responsibility for ensuring appropri-ate quality of gloves. Quality enforcement must be strengthened, and local production must be consid-ered. Fund This research was funded by the Addis Ababa Uni-versity Adaptive Research Funding Program. Conflicts of interest The authors report no conflicts of interest, financial or otherwise.
ACKNOWLEDGMENT
The authors would like thank the Addis Ababa Uni-versity for funding this research through the Adaptive Problem Solving Research Grant scheme.

287
REFERENCES 1. Green SE, Gompertz RH. Glove perforation during surgery: what are the risks? Ann R Coll Surg Engl. 1992;74(5):306-8. PMID: 1416698; PMCID: PMC2497644. 2. Harnoss JC, Partecke LI, Heidecke CD, Hübner NO, Kramer A, Assadian O. Concentration of bacteria passing through puncture holes in surgical gloves. Am J Infect Control. 2010;38(2):154-8. doi: 10.1016/ j.ajic.2009.06.013. Epub 2009 Oct 12. PMID: 19822380. 3. Misteli H, Weber WP, Reck S, Rosenthal R, Zwahlen M, Fueglistaler P, Bolli MK, Oertli D, Widmer AF, Marti WR. Surgical glove perforation and the risk of surgical site infection. Arch Surg. 2009;144(6):553- 8; discussion 558. doi: 10.1001/archsurg.2009.60. PMID: 19528389. 4. Esteban JI, Gómez J, Martell M, Cabot B, Quer J, Camps J, González A, Otero T, Moya A, Esteban R, Guardia J. Transmission of hepatitis C virus by a cardiac surgeon. N Engl J Med. 1996 Feb;334(9):555- 60. doi: 10.1056/NEJM199602293340902. PMID: 8569822. 5. Harpaz R, Von Seidlein L, Averhoff FM, Tormey MP, Sinha SD, Kotsopoulou K, Lambert SB, Robertson BH, Cherry JD, Shapiro CN. Transmission of hepatitis B virus to multiple patients from a surgeon with out evidence of inadequate infection control. N Engl J Med. 1996;334(9):549-54. doi: 10.1056/ NEJM199602293340901. PMID: 8569821. 6. Kobayashi M, Tsujimoto H, Takahata R, Einama T, Okamoto K, Kajiwara Y, Shinto E, Kishi Y, Hase K, Ueno H. Association Between the Frequency of Glove Change and the Risk of Blood and Body Fluid Exposure in Gastrointestinal Surgery. World J Surg. 2020;44(11):3695-3701. doi: 10.1007/s00268-020- 05681-1. Epub 2020 Jul 13. PMID: 32661693. 7. McKinney WP, Young MJ. The cumulative probability of occupationally-acquired HIV infection: the risks of repeated exposures during a surgical career. Infect Control Hosp Epidemiol. 1990;11(5):243-7. doi: 10.1086/646161. PMID: 2351810. 8. Kiyosawa K, Sodeyama T, Tanaka E, Nakano Y, Furuta S, Nishioka K, Purcell RH, Alter HJ. Hepatitis C in hospital employees with needlestick injuries. Ann Intern Med. 1991;115(5):367-9. doi: 10.7326/0003- 4819-115-5-367. PMID: 1907441. 9. Shapiro CN. Occupational risk of infection with hepatitis B and hepatitis C virus. Surg Clin North Am. 1995;75(6):1047-56. doi: 10.1016/s0039-6109(16)46776-9. PMID: 7482133. 10. Palmer JD, Rickett JW. The mechanisms and risks of surgical glove perforation. J Hosp Infect. 1992;22 (4):279-86. doi: 10.1016/0195-6701(92)90013-c. PMID: 1363107. 11. Tlili MA, Belgacem A, Sridi H, Akouri M, Aouicha W, Soussi S, Dabbebi F, Ben Dhiab M. Evaluation of surgical glove integrity and factors associated with glove defect. Am J Infect Control. 2018;46(1):30-33. doi: 10.1016/j.ajic.2017.07.016. Epub 2017 Sep 20. PMID: 28893444. 12. Thanni LO, Yinusa W. Incidence of glove failure during orthopedic operations and the protective effect of double gloves. J Natl Med Assoc. 2003;95(12):1184-8. PMID: 14717474; PMCID: PMC2594859. 13. Bekele A, Makonnen N, Tesfaye L, Taye M. Incidence and patterns of surgical glove perforations: experi ence from Addis Ababa, Ethiopia. BMC Surg. 2017;17(1):26. doi: 10.1186/s12893-017-0228-8. PMID: 28320370; PMCID: PMC5359816. 14. Zaatreh S, Enz A, Klinder A, König T, Mittelmeier L, Kundt G, Mittelmeier W. Prospective data collec tion and analysis of perforations and tears of latex surgical gloves during primary endoprosthetic surger ies. GMS Hyg Infect Control. 2016;11:Doc25. doi: 10.3205/dgkh000285. PMID: 28066701; PMCID: PMC5175006. 15. Tanner J, Parkinson H. Double gloving to reduce surgical cross-infection. Cochrane Database Syst Rev. 2006;2006(3):CD003087. doi: 10.1002/14651858.CD003087.pub2. PMID: 16855997; PMCID: PMC7173754. 16. Food and Drug Administration, HHS. Medical devices; patient examination and surgeons' gloves; test procedures and acceptance criteria. Final rule. Fed Regist. 2006;71(243):75865-79. PMID: 17294550. 17. CEN 455–1, European Committee for Standardization. Medical gloves for single use—Part 1: Require ments and testing for freedom from holes. 2001. 18. CEN 455-1, European Committee for Standardization. Medical gloves for single use. Part 1, Require ments and testing for freedom from holes. Berlin: Beuth Verlag GmbH; 2020. 19. Medhioub F, Jaber E, Hamrouni A, Gharbi L. Unnoticed surgical gloves intraoperative perforation: A multicentric study of the leading factors. Jr Med Res. 2020; 3(3):9-12. https://doi.org/10.32512/ jmr .3.3.2020/9.12 20. Hwang KL, Kou SJ, Lu YM, Yang NC. Evaluation of the quality of surgical gloves among four different manufactures. Ann Occup Hyg. 1999;43(4):275-81. PMID: 10432871.

288
21. Albin MS, Bunegin L, Duke ES, Ritter RR, Page CP. Anatomy of a defective barrier: sequential glove l eak detection in a surgical and dental environment. Crit Care Med. 1992;20(2):170-84. PMID: 1737454. doi:10.1097/00003246-199202000-00006 22. Medical devices; patient examination and surgeons’ gloves; adulteration--FDA. Proposed rule. Depart ment of Health and Human Services. Fed Regist. 1989; 54(223): 48218. 23. International Trade Centre. Trade statistics for international business development [Internet]. Trade Map - Trade statistics for international business development. 2021 [cited 2021Mar10]. Available from: https:// www.trademap.org/Index.aspx 24. Tchantchaleishvili V, Myers PO. Left-handedness--a handicap for training in surgery? J Surg Educ. 2010;67(4):233-6. doi: 10.1016/j.jsurg.2010.06.001. PMID: 20816359. 25. Malhotra M, Sharma JB, Wadhwa L, Arora R. Prospective study of glove perforation in obstetrical and gynecological operations: are we safe enough? J Obstet Gynaecol Res. 2004;30(4):319-22. doi: 10.1111/ j.1447-0756.2004.00201.x. PMID: 15238110. 26 Yinusa W, Li YH, Chow W, Ho WY, Leong JC. Glove punctures in orthopaedic surgery. Int Orthop. 2004;28(1):36-39. doi:10.1007/s00264-003-0510-5 27. Shiferaw WS, Aynalem YA, Akalu TY, Petrucka PM. Surgical site infection and its associated factors in Ethiopia: a systematic review and meta-analysis. BMC Surg. 2020;20(1):107. doi: 10.1186/s12893-020- 00764-1. PMID: 32423397; PMCID: PMC7236319. 28. Plummer J. Diagnosing corruption in Ethiopia: perceptions, realities, and the way forward for key sectors. Washington, D.C.: World Bank; 2012. 29. McLaughlin R, McNicholl B, Barton J. Intraoperative glove perforation. Postgrad Med J. 2002;78 (915):62. doi: 10.1136/pmj.78.915.62. PMID: 11796890; P

289
Tesfaye Kebede, Bethlehem Eyob. Ethiop Med J, 2021, Vol. 59, No. 3 ORIGINAL ARTICLE
RADIOLOGY RESIDENTS’ PERCEPTION OF WORKING AND TRAINING FROM HOME DURING COVID-19 PANDEMIC
Tesfaye Kebede, MD1*, Bethlehem Eyob, MD2
ABSTRACT
Introduction: The spread of coronavirus disease 2019 (COVID-19) pandemic disrupted the personal and profes-sional lives of many throughout the world. To mitigate the spread of the virus, Addis Ababa University introduced an online teaching/learning method which minimized the physical engagement of faculty members and residents. Online teaching is a major shift in the history of the country’s oldest and largest university. Objectives: This study aimed to investigate how trainees managed to cope up with the sudden changes in the teach-ing/learning system, and assess the ensuing satisfaction with the new method of teaching/learning. Methods: Descriptive research design was implemented and analysis of variance (ANOVA) and T-tests were used to test hypotheses. Analysis of data collected from 58 radiology residents found that, the residents appreciated the participatory nature of the newly introduced online learning method. Results: The results showed that residents have accepted the new teaching/learning method and are satisfied with it. Furthermore, tests of hypotheses revealed that there is no significant difference in level of satisfaction between female and male residents as well as throughout the three years of radiology residency training. Conclusion: The new method of teaching/learning has a positive acceptance among trainees and there was high level of satisfaction with the new method. Poor internet network, reduced in-person mentoring, failure to make engaging discussions due to large number of participants were the common challenges to online teaching in the setting. Key words:COVID-19 Pandemic, Radiology Residents’, teach and work from home
INTRODUCTION
Since its discovery in Wuhan Province of China in December, 2019, it took COVID-19 only few months to become the number one global health issue. Slow reaction from political and health sector regulators immensely contributed to the virus’ fast spread in dif-ferent parts of the globe infecting nearly more than 35 million people and claiming the lives of millions of people(1, 2). As we are in the middle of the pandemic, no authoritative source could predict the exact impact of the pandemic and remains as subject for future re-search. One thing for sure is the life of human beings surviving the pandemic will never be the same. Most importantly, despite various efforts to cure the virus, both modern/scientific and indigenous/traditional knowledge-based(3-5), neither of them brought fruit. The basic recommendations from prominent scientists and international health organiza-tions such as WHO and health sector regulators are keeping physical distance and staying at home as much as possible.
The demand for primary care physicians and medi-cal specialists in the developed world was among the outstanding research inquiries over the last sev-eral decades (6-9). Hospital-based physicians such as radiologists and anesthesiologists, who once were at the higher level of job insecurity are now among the physicians at the greatest demand (10). The issue of shortage of medical professionals, pri-mary care physicians as well as medical specialists, needs no scientific enquiry when it comes to the developing world. Over those long years, regulators and hospital administrators throughout the world have endeavored to bridge the gap through various mechanisms including working extra hours and working from home. The advent of technological innovations beginning from late 20th century has made working from home easier and comparative studies have also shown that working from home is as effective as medical center based services (11).
1 Associate professor at Department of Radiology, College of Health Sciences , Addis Ababa University. 2 Final year Radiology resident at Department of Radiology, College of Health Sciences , Addis Ababa University. *Corresponding Author E-mail: [email protected]

290
Despite its contribution in alleviating the shortage of radiologists (12, 13), working from home has also adversely affected their health, social life, and profes-sional productivity (14) resulting in stress (15) . The ever increasing need for real-time imaging interpreta-tion has forced radiologists to even work extra hours beyond their regular working hours (14). Global and national health sector organizations such as WHO and National Health Ministries promoted ‘staying at home’ among the first line preventive mechanisms to survive the pandemic. As a result, the pandemic compelled professionals around the world to stay at home and work from home. Working from home has become the ‘new normal’ for medical and non-medical professionals. For radiologists, though, working from home is not a phenomenon triggered by the COVID-19. Unlike the practices in other parts of the world, ‘working and teaching/learning from home’ is a new phenomenon for developing countries like Ethiopia. Although the change in learning modality will defi-nitely have an impact on trainees, discerning whether this impact (positive or otherwise) is worth investigat-ing. The current study aimed to investigate how train-ees managed to cope up with the sudden changes in the teaching learning process, assess the ensuing satis-faction with the new method of learning, and draw important lessons that must be either sustained or treated in the aftermath of the pandemic.
METHODOLOGY
Research Approach and Design The study followed a mixed research approach whereby quantitative data were used to measure satis-faction and its association with respondent’s attributes (specific objectives 1 & 2) and qualitative data using open ended questions were also used to identify the challenges of the new teaching and learning method introduced due to coronavirus pandemic. The study also followed descriptive research design for the level of satisfaction of radiology residents and to identify the challenges and opportunities of working and teaching from home in pandemic situation. The Research Setting The current research was conducted at Addis Ababa University, College of Health Sciences, Department of Radiology where a total of 25 academic staffs are working in the facilities of Tikur Anbessa Specialized Hospital. The Department has a Radiology Residency Teaching Program involves direct patient contact while performing radiological procedures such as ul-trasound, contrast studies of the gastrointestinal sys-tems and interventional radiology.
At undergraduate level, radiology course is given as a short course, as a result, graduate medical doc-tors have limited exposure as to the discipline. The residency, on the other hand, includes doing radio-logical procedures like Ultrasound (US), interven-tion, fluorography procedures and interpretation of the findings as well as interpreting other cross-sectional imaging like Computerized Tomography (CT) and Magnetic Resonance Imaging (MRI). This is also the practice in all radiological services throughout Ethiopia (16). In Tikur Anbesa Specialized Hospital about 200 radiographs (X-rays) are taken and more than 120 patients are scanned with US in four exam rooms on each day. More than 60 patients are scanned with CT and 20-30 patients have MRI performed daily. In addition, about 20-25 US and/or CT-guided interventions are done by the department weekly. As part of the residency training program, all cases except ultrasound studies are also dis-cussed daily in groups in each departmental unit which constitute 10-12 trainees including the con-sultants. Therefore, before the interruption follow-ing COVID-19 pandemic, in one reporting room with an area of 57.6 square meter, there will be 50-60 people discussing and reporting at a time. Besides the consultation sessions, as part of the teaching learning process, trainees have daily after-noon teaching sessions from 1:30pm–3:00pm where all residents and staffs meet together to dis-cuss on imaging of patients. The other activity of the department is daily interdepartmental joint con-ferences which take about 60-75 minutes to dis-cuss cases which need collaborative discussions for clinical management. In the department confer-ence room which is 57 sqm there will be more than 120 people. Following the pandemic beginning from March 2020, most of the residency program’s activities went online to allow faculty members and trainees to work, teach and learn from home except for minimum possible physical gathering to sustain the departmental daily routines. Data Source and Collection Methods The research subjects were trainees of a three-year residency program at Department of Radiology in College of Health Sciences, Addis Ababa Univer-sity during the academic year 2019/2020. The trainees were at first, second or third year of the residency program. In order to attain the objectives of the study, the researchers used primary source of data collected using a self-administered ques-tionnaire. Therefore, the questionnaires were ad-ministered both in print and online versions.
291
While participants were encouraged (through email and text message reminders) to fill the questionnaires online to avoid physical contact; the principal means of the virus’ spread, some willing participants pre-ferred to complete the printout version of the instru-ment. Since the face-to-face learning system was aborted in the middle of the academic year and was immediately replaced by the online learning system due to the surge of the global pandemic in Ethiopia, the study participants had the chance to recall their past experi-ences and provide feedback by comparing the two alternative systems of learning. Hence, in the survey, the residents were asked to compare the participatory nature of the newly introduced teaching learning method and to rate their satisfaction with it. They were also requested to list the challenges they face and the opportunities they explored due to the change in methods of instruction following measures to mitigate the impact of the pandemic. In order to avoid potential bias from power balance (Venaktesh et al., 2019); a bias that may happen if the survey is conducted by the trainer researcher (the first author) who is a faculty member of Department of Radiology, the survey was administered by the student researcher (the second author). Hypotheses In line with the second specific objective of the study, the researchers posit that satisfaction with the new method of learning might be affected by the partici-pant’s gender and her/his level of residency study (whether the trainee is from Year-I, Year-II or Year-III). Accordingly, the following two research hypothe-ses are formulated.
H1: There is a significant difference in the level of satisfaction between female and male radiology resi-dency program trainees.
H2: There is a significant difference in the level of satisfaction among train-ees from the three levels of radiol-ogy residency program.
Method of Data Analysis The quantitative data collected was analyzed using descriptive statistics tools. Besides the descriptive statistics analysis, T-test and ANNOVA were used to test the two hypotheses; i.e. whether there is a differ-ence in the level of satisfaction among gender groups and levels/years of residency study. Furthermore, the open-ended responses of participants were coded to extract common themes using qualitative data analysis tools.
Ethical Considerations The authors obtained ethical approval from the Re-search and Ethics Committee of the department of radiology of the College of Health Sciences at Ad-dis Ababa University and informed consent was obtained from the study participants.
RESULT
The following sub-sections provide analysis of data collected from radiology residency trainees pursu-ing their study in a developing country that intro-duced online-based learning in response to mitigat-ing the spread of COVID-19. A total of 58 respondents participated in this re-search among which 74% were male and 26% were female respondents. Forty-one percent of the re-spondents were in their first year of training, and those in second and third years of training ac-counted for 33% and 26% respectively. Satisfaction with the New Learning System Satisfaction with online learning system was meas-ured by 10 items adapted from Sun et al., 2008(12). Some of the ten items were modified by the authors to fit the residency training situations in the Univer-sity. The 10 items measuring students’ satisfaction with the new online method of learning try to cap-ture satisfaction from three different perspectives: (1) whether they support the decision (at department and at university levels) to resume the training pro-gram despite the pandemic situation, (2) whether they want to take online courses in the future or recommend the new method of teaching continued to be applied after the end of the current crisis, and (3) the nature of the courses and the way they were delivered. (Table 1) All of the ten items measuring satisfaction have above average results. Besides, the minimum aver-age satisfaction level per item was item number 10 where the average satisfaction rating was 6.15 out of 7 (Std. Dev. 1.15) (Table 2). This finding clearly indicates that on average, the new method of teach-ing/learning has a positive acceptance among radi-ology residents at Department of Radiology, Addis Ababa University.

292
Table 1: Descriptive statistics of Radiology residents’ satisfactions with presentations and case discussions at TASH, 2020
* Questions Marked with (R) mark were reverse coded
Items Mean Std. Deviation
The Department’s decision to continue residency teaching via the Internet was a wise one
6.67 0.57
If I had an opportunity to take another course via the Internet, I would gladly do so
6.52 0.71
I am satisfied with the University’s decision to resume residency classes via the online teaching modality
6.45 0.98
I was disappointed with the way the on-line courses are worked out(R) 6.24 1.08 I would recommend my Department to continue teaching my junior fel-lows on-line
6.19 1.13
I was very satisfied with the on-line courses delivered by my Department 6.19 1.05 I will take as many courses via the Internet as I can in the future 6.11 1.16 Conducting the course via the Internet made it more difficult than other courses I have taken (R)
5.79 1.37
I feel that this e-learning served my needs well 5.69 0.94 If I had it to do over, I would not take the courses I am currently taking via the Internet(R)
5.68 1.68
Overall 6.15 1.15
Table 2: Descriptive statistics of Radiology residents’ perception of Participatory nature of case discussions and seminar presentations at TASH, 2020
Items Mean Std. Deviation
I received prompt comments from instructors during my pres-entations
6.00 1.06
My instructors consider web-based online learning using differ-ent technologies useful
5.93 1.08
I received prompt comments on case consultations I seek on-line
5.17 1.48
I received prompt comments from classmates during my pres-entations
4.86 1.66
Overall 5.50 1.41
Participatory nature of the presentations and case discussions We measured the participatory nature of case and seminar presentations using four questions. The first three questions evaluated the trainer to trainee di-mension of the relationship while the fourth question focused on another important element of the relation-ship-the trainee-to-trainee relationship. In the current study, participants had a higher aver-age rating (5.50) for the participatory nature of pres-entations (Table 2) Further investigation of the indi-vidual components of the participation revealed that the trainer-to-trainee relation was a significant con-tributor of the observed higher satisfaction level. However, the trainee-to-trainee relationship has been impaired due to the introduction of the online learn-ing system (4.86 out of 7).
Based on this finding we recommend that to increase students’ satisfaction (17), trainers in Department of Radiology shall make consideration and facilitate student-to-student interactions in future online lec-tures and case presentations. The effect of Respondents’ Attributes on Level of Satisfaction Besides the higher level of satisfaction with the new online based learning method observed from the de-scriptive data, in line with the second research objec-tive, we wanted to further investigate whether there was a significant difference between different trainee attributes: the gender groups and level of residency training, by testing the two research hypotheses. The hypotheses in null and alternate/research forms are: The subsequent two subsections present the test re-sults and their interpretations.
293
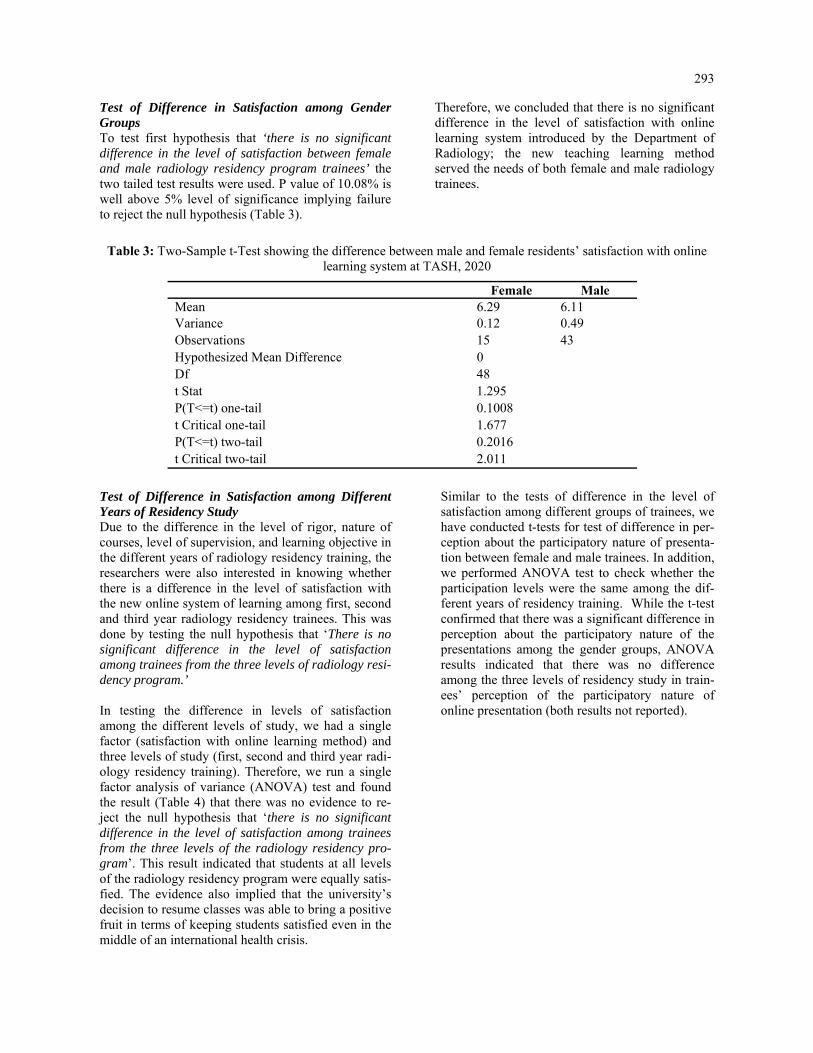
Test of Difference in Satisfaction among Gender Groups To test first hypothesis that ‘there is no significant difference in the level of satisfaction between female and male radiology residency program trainees’ the two tailed test results were used. P value of 10.08% is well above 5% level of significance implying failure to reject the null hypothesis (Table 3).
Therefore, we concluded that there is no significant difference in the level of satisfaction with online learning system introduced by the Department of Radiology; the new teaching learning method served the needs of both female and male radiology trainees.
Table 3: Two-Sample t-Test showing the difference between male and female residents’ satisfaction with online learning system at TASH, 2020
Female Male Mean 6.29 6.11 Variance 0.12 0.49 Observations 15 43 Hypothesized Mean Difference 0 Df 48 t Stat 1.295 P(T<=t) one-tail 0.1008 t Critical one-tail 1.677 P(T<=t) two-tail 0.2016 t Critical two-tail 2.011
Test of Difference in Satisfaction among Different Years of Residency Study Due to the difference in the level of rigor, nature of courses, level of supervision, and learning objective in the different years of radiology residency training, the researchers were also interested in knowing whether there is a difference in the level of satisfaction with the new online system of learning among first, second and third year radiology residency trainees. This was done by testing the null hypothesis that ‘There is no significant difference in the level of satisfaction among trainees from the three levels of radiology resi-dency program.’ In testing the difference in levels of satisfaction among the different levels of study, we had a single factor (satisfaction with online learning method) and three levels of study (first, second and third year radi-ology residency training). Therefore, we run a single factor analysis of variance (ANOVA) test and found the result (Table 4) that there was no evidence to re-ject the null hypothesis that ‘there is no significant difference in the level of satisfaction among trainees from the three levels of the radiology residency pro-gram’. This result indicated that students at all levels of the radiology residency program were equally satis-fied. The evidence also implied that the university’s decision to resume classes was able to bring a positive fruit in terms of keeping students satisfied even in the middle of an international health crisis.
Similar to the tests of difference in the level of satisfaction among different groups of trainees, we have conducted t-tests for test of difference in per-ception about the participatory nature of presenta-tion between female and male trainees. In addition, we performed ANOVA test to check whether the participation levels were the same among the dif-ferent years of residency training. While the t-test confirmed that there was a significant difference in perception about the participatory nature of the presentations among the gender groups, ANOVA results indicated that there was no difference among the three levels of residency study in train-ees’ perception of the participatory nature of online presentation (both results not reported).

294
Table 4: Single Factor ANOVA showing the difference in levels of satisfaction among the different levels of resi-dency (Resident I – Resident III) at TASH, 2020
Groups Count Sum Average Variance
R-I 15 89.04 5.94 0.4712 R-II 19 116.60 6.14 0.5836 R-III 24 151.38 6.31 0.1780
ANOVA Source of Variation SS df MS F P-value F crit Between Groups 1.28 2 0.6402 1.6612 0.1993 3.1650
Results of Qualitative Data Analysis This section presents analysis of qualitative informa-tion collected using two open ended questions in the data collection instrument. The first question requested respondents if they recommend the new system be sus-tained as part of the teaching learning system after the end of the pandemics. The second question on its part encouraged participants to list out the major challenges they had faced because of the introduction of the re-mote teaching learning system. The actual responses obtained are summarized as follows. Analysis of open-ended responses on participants’ view of whether they recommend the sustained use of the online teaching/learning system in the aftermath of the pandemic found that most trainees (72%) recom-mended continued use of the online learning system anticipating that the online teaching/learning system will ensure quality of training by (1) saving money, energy and time, (2) creating one-stop access to (audio, video and documentary) resources, (3) fostering experi-ence sharing among specialists from in-country and abroad thereby building capacity of training institu-tions, (4) enhancing knowledge sharing between train-ees and trainers in and out of the university, and (5) adding flexibility to the existing traditional face-to-face system. However the number of good reasons for rec-ommending the online modality’s use in the future, some of the participants doubted to recommend the online learning system for its disregard of in-person mentoring, failure to make engaging discussions, and neglect of practical aspects of most medical school trainings. Finally, respondents were asked to express the major challenges they faced as a result of the introduction of online teaching/learning modality. Systematic coding and analysis of responses identified that poor internet network access, compromises practicality of trainings and difficulty of assessing trainees’ engagement as the three major bottlenecks from obtaining the best out of the online teaching/learning system.
In addition, although the findings from statistical tests reveal no difference in level of satisfaction among the different levels of study, first year trainees spotted that the ‘one size fits all’ nature of presentations makes it difficult for them to identify and grasp the major focus areas of the discussions pertinent to their level.
DISCUSSIONS
‘Working and Training from home’ is a new con-cept introduced after the finding of coronavirus victims in Ethiopia. In many of the postgraduate specialty training programs in Addis Ababa Uni-versity, teaching and learning activity was un-thinkable without physical gathering of faculty and trainees before COVID-19. However, due to the spread of the virus in the country, especially in the capital city Addis Ababa (where the Uni-versity is placed) students in the College of Health Sciences are obliged to continue studying amid increased spread of the pandemic by chang-ing the mode of learning to online technology systems. Besides the health consequences (death and illness) of the pandemic, studies focusing on the psychological, socioeconomic and political consequences are beginning to emerge (18, 19). Education, including radiology training, is one of the sectors worst affected by the pandemic (16, 20) Analysis of data collected from 58 radiology resi-dency program trainees (of which 25% were fe-male) found that, the residents appreciated the participatory nature of the newly introduced online learning method. The trainer-trainee di-mension of the participatory nature of case pres-entations showed a higher rating. The result from measurement of the student-student dimension, however, provided an important feedback that Department of Radiology should take as potential area of improvement.

295
Furthermore, the result from analysis of trainees’ satis-faction with the new online based teaching/learning method which requires the trainers to work from home indicates that the residents have on average higher lev-els of satisfaction which was also the case in other radi-ology institutions where virtual learning introduced during COVID-19 pandemic resulted in a high trainee satisfaction.(21) This finding implies that the trainees accepted the new method and are satisfied with it. Hypotheses tests using t-test and analysis of variance were used to test whether there was significant differ-ence between gender groups and the levels of years of study. The results confirmed that the satisfaction levels are the same both among gender groups and levels of residency training. Taking trainees’ higher level of sat-isfaction as a wake-up call from the COVID-19 pan-demic, the University shall use this opportunity to con-sider designing a teaching-learning system that blends form of the traditional face-to-face and the online learning system which was also shown to improve per-formance, satisfaction and engagement in medical edu-cation.(22, 23) In addition, analysis of open-ended responses on whether participants recommend the continued use of the online teaching/learning system in the future found that the online teaching/learning system is recom-mended as it is believed to ensure quality of education by saving money, energy and time, ease sharing of knowledge and (audio, video and documentary) re-sources, and add flexibility to the existing traditional face-to-face system(22). However, some participants expressed their view that the new teaching/learning system might disregard in-person mentoring, may not engage all attendants into discussions, and also huge reliance on the online sys-tem neglects the practical aspects of residency train-ings.
The aforementioned points can take as potential areas of improvement for the radiology residency training program and thus would be a sufficient impetus for evaluating the weaknesses of the teaching learning system and start working to-wards a high-quality residency training program that could tap the benefits of using online teaching/learning technologies. Finally, when asked about the major challenges they encounter with the new modality, trainees spotted that poor internet network access, compro-mise of practical trainings, difficulty of assessing trainees’ level of engagement and the ‘one size fits all’ nature of presentations were the major bottle-necks of the online teaching/learning system. Besides, this study has several limitations; among which are being single institution study involving a single department and didn’t include faculty per-ceptions. It can thus be concluded that although the coro-navirus pandemic disrupted the radiology resi-dency training program at Department of Radiol-ogy in Addis Ababa University like any other training institution, it has also given to the existing training system a timely wake-up call by bringing into light the demerits of the face-to-face that could be supplemented by introduction of online learning in the aftermath of the pandemic.
ACKNOWLEDGEMENT
The authors would like to thank all residents who volunteered to participate in this research. Conflict of Interest: The authors declare that no conflict of interests.
REFERENCES 1. Djalante R, Lassa J, Setiamarga D, Sudjatma A, Indrawan M, Haryanto B, et al. Review and analysis of current responses to COVID-19 in Indonesia: Period of January to March 2020. Progress in Disaster Sci ence. 2020;6:100091. 2. Haeder SF, Gollust SE. From Poor to Worse: Health Policy and Politics Scholars’ Assessment of the U.S. COVID-19 Response and Its Implications. 2020;12(4):454-81. 3. Lu Z-H, Yang C-L, Yang G-G, Pan W-X, Tian L-G, Zheng J-X, et al. Efficacy of the combination of modern medicine and traditional Chinese medicine in pulmonary fibrosis arising as a sequelae in conva lescent COVID-19 patients: a randomized multicenter trial. Infectious Diseases of Poverty. 2021;10 (1):31. 4. Nugraha RV, Ridwansyah H, Ghozali M, Khairani AF, Atik N. Traditional Herbal Medicine Candidates as Complementary Treatments for COVID-19: A Review of Their Mechanisms, Pros and Cons. Evidence -Based Complementary and Alternative Medicine. 2020;2020:2560645. 5. Zhao Z, Li Y, Zhou L, Zhou X, Xie B, Zhang W, et al. Prevention and treatment of COVID-19 using Tra ditional Chinese Medicine: A review. Phytomedicine. 2021;85:153308-. 6. Barber P, López-Valcárcel BG. Forecasting the need for medical specialists in Spain: application of a system dynamics model. Human Resources for Health. 2010;8(1):24. 7. Cooper RA. There's a shortage of specialists: is anyone listening? Academic medicine : journal of the Association of American Medical Colleges. 2002;77(8):761-6.
296
8. Bodenheimer TS, Smith MD. Primary Care: Proposed Solutions To The Physician Shortage Without Training More Physicians. Health Affairs. 2013;32(11):1881-6. 9. Starfield B, Shi L, Macinko J. Contribution of primary care to health systems and health. Milbank Q. 2005;83(3):457-502. 10. Hawkins J. Addressing the Shortage of Radiologists. The journal of the Americal Health Care Radiology Administrators. 2001:4. 11. Steckel RJ, Batra P, Goldin JG, Zucker M, Sayre JW, Johnson SL. Supervision of residents by faculty radiologists using home workstations. Emerg Radiol. 2003;10(3):121-5. 12. Sunshine JH, Maynard CD. Update on the Diagnostic Radiology Employment Market: Findings Through 2007-2008. Journal of the American College of Radiology. 2008;5(7):827-33. 13. Meghea CI, Sunshine JH. Who's overworked and who's underworked among radiologists? An update on the radiologist shortage. Radiology. 2005;236(3):932-8. 14. Rohatgi S, Hanna TN, Sliker CW, Abbott RM, Nicola R. After-Hours Radiology: Challenges and Strate gies for the Radiologist. American Journal of Roentgenology. 2015;205(5):956-61. 15. Fishman MDC, Mehta TS, Siewert B, Bender CE, Kruskal JB. The Road to Wellness: Engagement Strate gies to Help Radiologists Achieve Joy at Work. RadioGraphics. 2018;38(6):1651-64. 16. Legesse T. Impact of CVID-19 pandemic in radiology residency training of Ethiopia. Ethiopian Medical Journal. 2020;58. 17. Croxton RA. The role of interactivity in student satisfaction and persistence in online learning. Journal of Online Learning and Teaching. 2014;10(2). 18. DW A. A Review on Psychological and Socio-Economic Impacts of Corona Virus Disease (Covid-19) the Case of Under Developing Countries. . Vol. 6 No. 4: 100. Med Clin Rev. 2020;6(4). 19. UNCT-Ethiopia. Socio-Economic Impact of COVID‑ 19 in Ethiopia. June 2020. 20. Alvin MD, George E, Deng F, Warhadpande S, Lee SI. The Impact of COVID-19 on Radiology Trainees. Radiology. 2020;296(2):246-8. 21. Larocque N, Shenoy-Bhangle A, Brook A, Eisenberg R, Chang Y-M, Mehta P. Resident Experiences With Virtual Radiology Learning During the COVID-19 Pandemic. Acad Radiol. 2021;28(5):704-10. 22. Vavasseur A, Muscari F, Meyrignac O, Nodot M, Dedouit F, Revel-Mouroz P, et al. Blended learning of radiology improves medical students’ performance, satisfaction, and engagement. Insights into Imaging. 2020;11 (1):61. 23. Durán-Guerrero JA, Ulloa-Guerrero LH, Salazar-Díaz LC. Blended learning: An effective methodology for teaching radiology to medical students %J Revista de la Facultad de Medicina. 2019;67:273-7.

297
Abebe Habtamu Tamire, Hanna Lishan, Ayalew Moges Beyene. Ethiop Med J, 2021, Vol. 59, No. 4
ORIGINAL ARTICLE
FACTORS AFFECTING THE OUTCOME OF GUILLAIN-BARRE SYNDROME AMONG PEDIATRIC PATIENTS IN TIKUR ANBESSA SPECIALIZED HOSPITAL
Abebe Habtamu Tamire, MD1, Hanna Lishan, MD1*, Ayalew Moges Beyene, MD1
ABSTRACT Introduction: Guillain-Barré syndrome is an immune mediated acute illness featured by continual weakness and loss of deep tendon reflexes. The causes that govern the variant clinical presentations and outcome of this disease are not understood well. Neither are they studied in our setup. Objectives: Assessed the factors affecting the outcomes of Guillain-Barré syndrome among children <15 years in Tikur Anbesa Specialized Hospital. Methods: Institution based retrospective study was done among 91 patients with Guillain-Barré syndrome on fol-low-up identified by chart tracing and reviewed at Tikur Anbesa specialized hospital from October 1/2012 to Janu-ary 30/2019. Required data was collected using a check list. The data was entered to computer using Ep-info and exported to Statistical Package for Social Sciences Version 23 for analysis. Results: There were 91 patients with a male to female ratio of 1.1:1 and 80 % of them were between 2-10 years of age. Respiratory infections were the commonest preceding events in 27/91(29.7%). Cranial nerve involvement was found in 24/91(26.4 %) and 36/91(39.6%) patients had dysautonomia. The commonest sub-type was acute motor axonal neuropathy, 67/91 (73%). Functional independence was achieved by 47/91(52%) patients at 3 months and 80/91(88%) at 6 months. Poor functional outcome was significantly associated with the presence of sensory symp-toms, dysautonomia, the need for mechanical ventilation, severity of weakness at nadir and longer hospital stay, P < 0.05. Conclusion: The severity of motor weakness at nadir is associated with lower likely hood of functional independ-ence signifying the requirement of longer time for self-efficient functionality. Key words: Guillain-Barré syndrome, outcome, pediatric patients.
INTRODUCTION
Guillain-Barré syndrome (GBS) is considered to be an autoimmune disease which is thought to mostly pre-sent post-infections. It affects the motor, sensory and autonomic nerves and it has a slight male preponder-ance with seasonal variation (1,2). Diagnosis of GBS is made by cerebro-spinal fluid (CSF) analysis and nerve conduction test (NCT). There are several treat-ment options like intravenous immunoglobulin (IVIg) and plasma exchange but outcomes of the disease are variable despite the uniform treatment modalities for unknown reason. Furthermore, it has variable outcomes like decreased mobility, severe long-term fatigue syndrome and chronic pain(3–5). Since the elements that govern the different clinical and laboratory profiles of GBS and outcome are poorly understood, it creates an open ground for studies.
It has been shown in several studies that GBS is preceded by bacterial and viral infections and oc-casionally by vaccinations (6,7)but there hasn’t been a strong evidence linking vaccination to GBS. Besides, it is a well-known fact that the benefits of vaccines outweigh the risk (8–10). The nerve damage caused by GBS is histopa-thologically classified as demyelinating and axonal degenerating type. Acute inflammatory demyeli-nating polyradiculoneuropathy (AIDP) accounts for 80-90% of the cases in Europe and North America making it the commonest seconded by Acute motor axonal neuropathy (AMAN) account-ing for 10-20% in the western countries and 50-60% in China and Japan (11–13). There are various grading scales for prognostica-tion of GBS based on which therapeutic strategies are planned.
1 Addis Ababa university, Department of pediatrics. *Corresponding Author E-mail: [email protected]

298
Some commonly used are Medical Research Council (MRC) score, the Erasmus GBS outcome score (EGOS), Erasmus GBS respiratory insufficiency score (EGRIS) and Hughes functional grading scale (HFGS) (12,14–16).Our study uses the HFGS which is an as-sessment of functionality of patients from their history since it is more practical for retrospective studies than the other modalities. In a study done in South Africa, bulbar dysfunction, autonomic dysfunction and upper limb paralysis sig-nificantly predicted the need for mechanical ventilation(17,18). In a previous study done in our setup, the demographic and clinical characters were determined but outcome of patients on follow-up in clinic was not assessed. Furthermore, factors associated with poor outcome were not looked into (7). Therefore, the main purpose of this study is to assess the 3rd and 6th month outcome of GBS patients in clin-ics with the available treatment modalities and to deter-mine the factors affecting poor outcome. This is impor-tant in order to prepare one in anticipation of complica-tions for better resource allocation, early intervention and better counseling of patients and care givers about the disease and future outcome.
MATERIALS AND METHODS Study Area: the study was done in TASH which is the largest tertiary hospital and one of the few with pediat-ric intensive care units (ICU) in Ethiopia. It manages many patients that require ICU and hence, many of the national GBS cases. Study design: The study was a hospital based retro-spective study, conducted between May and July 2019 in TASH, Addis Ababa, Ethiopia. Sample size: The calculated sample size using N=Z2P(1-p) /d2, where p was taken to be 15%, d=0.05 and Z=1.96 was 215, but only 94 patients with a diagnosis of GBS were identified from 0ctobor, 2012 to January 2019, from which one left against medical advice, one was referred out and the last one didn’t fulfill the inclu-sion criteria making the total sample size 91. Those children who fulfilled the diagnostic criteria for GBS as per the operational definition were enrolled into the study. Sampling procedure and data collection: A check list was prepared by using selected variables taken from patient health records and used as data collection tool.
I, the principal investigator, collected the data. Consecutive sampling was used to collect medical record numbers of patients admitted with the as-sessment of GBS from the health management information system (HMIS) in all pediatric wards and cross referenced with the pediatric neurology clinic HMIS for follow-up. Data was extracted from the retrieved cards by the medical record keeping department and it was then checked, cleared and coded. Data analysis and statistical methods: The data was entered to a computer using Ep-info and ex-ported to Statistical Package for Social Sciences Version 23.0 for analysis. Univariate analysis was used for percentage and frequency distribution of the demographic and few other variables in the check list. Factors with significant association with the outcome on univariate analysis were selected for multivariate logistic regression which was used to identify independently associated factors with the outcome. Statistically significant association was taken to be a p -value of <0.05. Operational definition 1. Pediatric patients- It is defined as children
under the age of 14 years based on the hospital protocol.
2. Features Required for diagnosis of GBS based on NINDS diagnostic criteria(14).
A. Progressive motor weakness of more than one limb with hypore flexia or areflexia (loss of tendon jerks) and B. Cerebrospinal fluid features
strongly supportive of the diagnosis or
i. CSF cells Counts of 10 or fewer mononuclear leuko-cytes/mm3.
ii. Elevated protein levels more than 0.5g/L
C. Positive electro-diagnostic test as stated on the nerve conduction test.
Areflexia: Deep tendon reflex = 0/4 Hyporeflexia: deep tendon reflex= ¼ Albumin-cytological dissociation: It is defined as elevated protein levels more than 0.5g/L with nor-mal cell counts; fewer or equal to 10 mononuclear cells in CSF. Preceding event: It is defined as the presence of respiratory, gastrointestinal, febrile illness or vac-cination in the preceded 4 weeks to the onset of illness.

299
Prolonged intubation: It is defined as intubation for more than two weeks requiring tracheostomy for ven-tilation.
Hughes scale (15,16). 1. Healthy 2. Minor symptoms/capable of running 3. Walk 5 meters without support /unable
to run 4. Able to walk with an appliance 5. Confined to bed/chair 6. Requires assisted ventilation 7. Death
3. Outcome A. Good – hughes score ≤ 2 B. Poor – hughes score ≥3
Ethical consideration: The research approval was made by the pediatric and child health department’s research and publication committee (DRPC).
RESULTS A total of 91 children were included in the final analysis. All demographic characters are well stated in Table 1. Around 62/91(68%) had a preceding event prior to the development of weakness while the remaining 29 (31.9 %) had no documented pre-ceding event. Except 3 (3.3 %) children, all the re-maining 88 (96.7%) had Hughes functional score above 2 at the time of nadir weakness.
Table1: Socio-demographic characteristics of GBS patients in TASH 2012-2019GC, AA, Ethiopia
Variables F Percent %,
Age (years) <2 7 7.7 2-5 40 44.0 5-10 33 36.3 >10 11 12.1
Sex M 47 51.6 F 44 48.4
Residence AA 39 42.9 Oromia 31 34.1 Others 11 12.1
Seasonal variation |Autumn 22 24.2 Winter 19 20.9 Spring 19 20.9 Summer 31 34.1
Preceding event Respiratory tract infections
27 29.7
Acute gastroenteritis 22 24.2
Vaccine 13 14.3 None 29 31.9
Hughes score at nadir ≤2 3 3.3 >2 88 96.7
The median duration of hospital stay is 13 days with inter-quartile range of 19 days. The maximum stay was 123 days. Patients in recovery phase were not admitted making the minimum days of stay zero. More than half of the patients, 50/91(55%) had a hospital stay of 2 weeks or less. Another 22 patients had a hospital stay of 2-4 weeks making the hospital stay less than a month in 79 % of the patients. The median duration from the onset of the weakness to hospital admission was 5 days with inter-quartile range of 2 to 7 days.
The median duration from the onset of weakness to achieve maximum weakness was 3 days with inter-quartile range of 2 to 6 days. In most of the chil-dren, as depicted in the figure below, progression from onset to nadir weakness occurred on the 2nd and 3rd days of illness. More than a third of the chil-dren, 88% reached nadir weakness by one week, and progression was rare (2.2%) after 2 weeks. The lower limb power was below 3 in 64/91 (70.4%) of the children at the time of presentation, with the remaining having a power of three to four. Lower limbs were areflexic in 47(51.5%) and hy-poreflexic in 44 (48.4%) at presentation and 57 (62.7 %) had upper limb power 3-5.
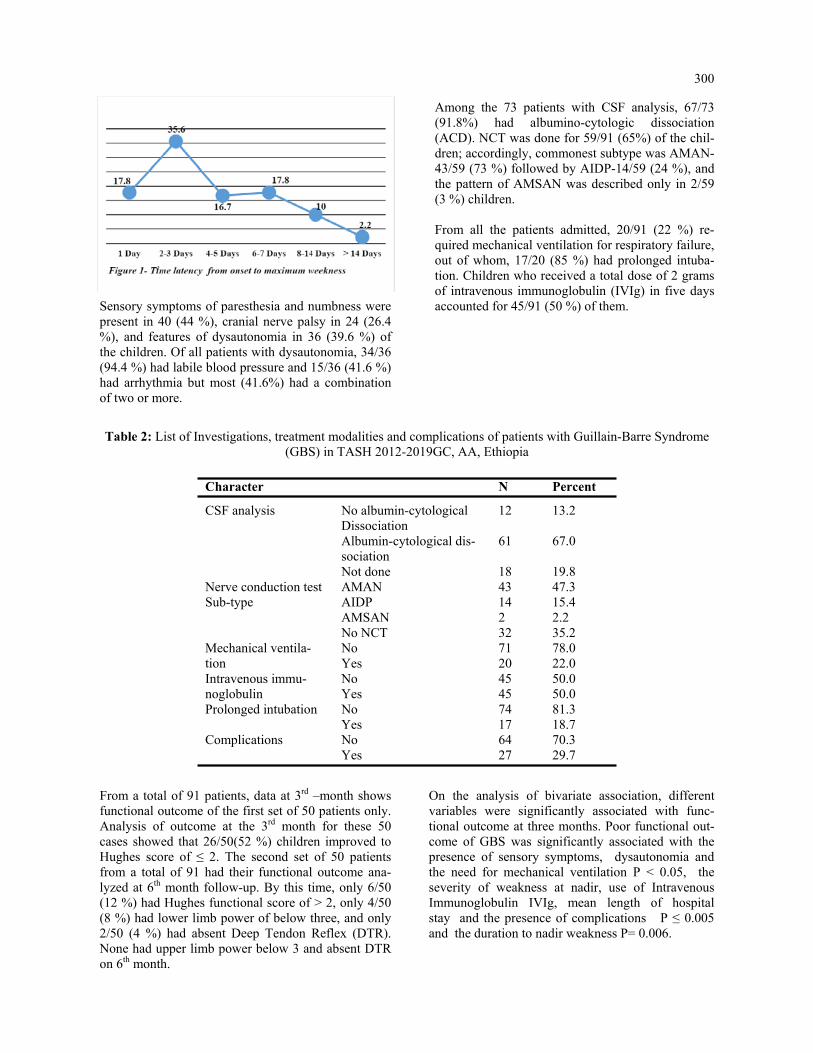
300
Sensory symptoms of paresthesia and numbness were present in 40 (44 %), cranial nerve palsy in 24 (26.4 %), and features of dysautonomia in 36 (39.6 %) of the children. Of all patients with dysautonomia, 34/36 (94.4 %) had labile blood pressure and 15/36 (41.6 %) had arrhythmia but most (41.6%) had a combination of two or more.
Among the 73 patients with CSF analysis, 67/73 (91.8%) had albumino-cytologic dissociation (ACD). NCT was done for 59/91 (65%) of the chil-dren; accordingly, commonest subtype was AMAN-43/59 (73 %) followed by AIDP-14/59 (24 %), and the pattern of AMSAN was described only in 2/59 (3 %) children. From all the patients admitted, 20/91 (22 %) re-quired mechanical ventilation for respiratory failure, out of whom, 17/20 (85 %) had prolonged intuba-tion. Children who received a total dose of 2 grams of intravenous immunoglobulin (IVIg) in five days accounted for 45/91 (50 %) of them.
Table 2: List of Investigations, treatment modalities and complications of patients with Guillain-Barre Syndrome (GBS) in TASH 2012-2019GC, AA, Ethiopia
Character N Percent
CSF analysis No albumin-cytological Dissociation
12 13.2
Albumin-cytological dis-sociation
61 67.0
Not done 18 19.8 Nerve conduction test Sub-type
AMAN 43 47.3 AIDP 14 15.4 AMSAN 2 2.2 No NCT 32 35.2
Mechanical ventila-tion
No 71 78.0 Yes 20 22.0
Intravenous immu-noglobulin
No 45 50.0 Yes 45 50.0
Prolonged intubation No 74 81.3 Yes 17 18.7
Complications No 64 70.3 Yes 27 29.7
From a total of 91 patients, data at 3rd –month shows functional outcome of the first set of 50 patients only. Analysis of outcome at the 3rd month for these 50 cases showed that 26/50(52 %) children improved to Hughes score of ≤ 2. The second set of 50 patients from a total of 91 had their functional outcome ana-lyzed at 6th month follow-up. By this time, only 6/50 (12 %) had Hughes functional score of > 2, only 4/50 (8 %) had lower limb power of below three, and only 2/50 (4 %) had absent Deep Tendon Reflex (DTR). None had upper limb power below 3 and absent DTR on 6th month.
On the analysis of bivariate association, different variables were significantly associated with func-tional outcome at three months. Poor functional out-come of GBS was significantly associated with the presence of sensory symptoms, dysautonomia and the need for mechanical ventilation P < 0.05, the severity of weakness at nadir, use of Intravenous Immunoglobulin IVIg, mean length of hospital stay and the presence of complications P ≤ 0.005 and the duration to nadir weakness P= 0.006.

301
Table 3: Functional outcome of GBS patients in TASH 2012-2019GC, AA, Ethiopia
Follow up time 3 month N (%) 6 month N (% )
Hughes score ≤ 2 26 (52.0) 44 (88.0) > 2 24 (48.0) 6 (12.0)
LLP <3 4 (8.0) 0 3-5 46 (92) 50 (100)
LLR, DTR
.00 2 (4.0) 0 1.00 28 (56.0) 13 (26.0) 2.00 20 (40.0) 37 (74.0)
ULP <3 1 (2.0) 0 3-5 49 (98) 50 (100)
ULR .00 2 (4.0) 0 1.00 20 (40.0) 10 (20.0) 2.00 28 (56.0) 40 (80.0)
Sensory No 50 (100) 49 (98.0) Yes 0 1 (2.0)
Pain No 47 (94.0) 48 (96.0) Yes 3 (6.0) 2 (4.0)
Table 4: Bivariate association of predictor variables with 3rd month functional outcome of GBS patients in TASH 2012-2019 GC, A.A, Ethiopia
Variables
Hugh’s score at 3 months N (%) P-value Good outcome ≤2 Poor outcome >2
Age in Years <2 2 (7.7) 1 (4.2) 0.959 2-5 11 (42.3) 11 (45.8)
5-10 10 (38.5) 9 (37.5) >10 3 (11.5) 3 (12.5)
Sex Male 14 (53.8) 10 (41.7) 0.389 Female 12 (46.2) 14 (58.3)
Lower Limb power
0-2 9 (34.6) 23 (95.8) 0.000 3-5 17 (65.4) 1 (4.2)
Sensory symptoms
No 16 (61.5) 8 (33.3) 0.046 Yes 10 (38.5) 16 (66.7)
Cranial Nerve palsy
No 20 (76.9) 14 (58.3) 0.159 Yes 6 (23.1) 10 (41.7)
Dysautono-mia
No 20 (76.9) 11(45.8) 0.024 Yes 6 (23.1) 13 (54.2)
Nerve con-duction test Subtype
AMAN 16 (61.5) 12 (50.0) 0.690 AIDP 3 (11.5) 3 (12.5)
Mechanical ventilation
No 23 (88.5) 15 (62.5) 0.032 Yes 3 (11.5) 9 (37.5)
IV Immu-noglobulin
No 19 (73.1) 8 (33.3) 0.005 Yes 7 (26.9) 16 (66.7)
Prolonged intubation
No 23 (88.5) 16 (66.7) 0.063 Yes 3 (11.5) 8 (33.3)
Complica-tions
No 22 (84.6) 11 (45.8) 0.004 Yes 4 (15.4) 13 (54.2)
Time to Nadir ≤ 3day 9 (34.6) 17 (65.4) 0.006 > 3 days 17 (73.9) 6 (26.1)
Hospital Stay in days (mean± SD)
11.5 ± 12 35.5 ± 30 0.001

302
Those variables which were significantly associated with poor functional outcome were computed in mul-tivariate analysis, only the severity of weakness at nadir was significantly associated with 3rd month poor functional outcome with AOR 30.115 (1.44- 628.7) at 95% CI.
Association of factors affecting outcome are only done on the 3rd month’s follow-up to avoid bias secondary to inter-individual difference in genetic polymorphism since different sets of 50 patients had the 3rd and 6th months follow-up.
Table 5: Binary logistic regression of predictor variables with 3- month poor functional outcome of GBS patients in TASH 2012-2019GC, AA, Ethiopia
Variables
Hughes score at 3 months
P-value
AOR 95 % CI
≤2 N (%) >2N (%) Lower Limb power 0-2 9 (34.6) 23 (95.8) 0.000 30.11 1.44 628.7
3-5 17 (65.4) 1 (4.2) Sensory symptoms No 16 (61.5) 8 (33.3) 0.046 .93 .13 6.61
Yes 10 (38.5) 16 (66.7) Dysautono-mia No 20 (76.9) 11(45.8) 0.024 .37 .05 2.74
Yes 6 (23.1) 13 (54.2) Mechanical ventila-tion
No 23 (88.5) 15 (62.5) 0.032 .04 .00 1.28 Yes 3 (11.5) 9 (37.5)
IV immunoglo-bulin No 19 (73.1) 8 (33.3) 0.005 4.98 .50 49.48 Yes 7 (26.9) 16 (66.7)
Complication No 22 (84.6) 11 (45.8) 0.004 5.86 .23 150.4 Yes 4 (15.4) 13 (54.2)
Time to Nadir ≤ 3 D 9 (34.6) 17 (65.4) 0.006 1.20 .14 10.23 > 3 D 17 (73.9) 6 (26.1)
Hospital Stay in days ≤2wks 22(78.5) 6(21.4) 0.001 1.10 .99 1.21 > 2wks 8(36.4) 14(63.6)
DISCUSSION
In our study, acute motor axonal neuropathy (AMAN) and ascending weakness are the commonest variants. There are relevant numbers of patients requiring me-chanical ventilation. Most of our patients showed a good functional out come with 88% functional inde-pendence at 6th month follow up. The severity of mo-tor weakness at nadir is independently associated with poor functional outcome. On the previous study in our setup, AMAN was the most common subtype accounting for 80% and AM-SAN < 10% (7). In our study, the most common vari-ant was AMAN which accounted for 73% of the cases followed by AIDP in 24% of the cases which is slightly higher than the previous study. This is in sharp contrast with western reports. AMSAN was the rarest variant which accounted for 3% of the cases strengthening the rarity of this variant in other reports (11–13).
In this study, 22% of children required mechanical ventilation for respiratory failure strengthening the general recommendation on meticulous follow up of respiratory status of GBS patients. There is an increase in use of the mechanical ventilation as compared with the previous study in our set up, 12.5% (7) which justifies the increased availability of the ICU setting. In our study, 92.3% had ascending type of weak-ness which was in line with the research done by Saroj Kumar Bhagat et al in eastern Nepal showing 93.5% predominance(19). This pattern of motor weakness also accounted for 82.1 % of the 112 patients in the former study on GBS by Tigist et al. (7) in our setup. It has been reported that, 85% of GBS patients will be functionally independent by one year, 10% will have functionally disabling weakness, and the rest 5% will die due to the GBS(15).
303
In our study, 14% became functionally independent (Hughes score ≤2) on discharge, 52% at three months and 88% at six months. In contrast, the outcome on discharge in the study by Tigist et al. with mean duration of hospital stay being 18 days showed a 27.7 % good outcome and 36.6 % poor outcome with in-hospital GBS mortality of 8% and residual weakness frequency of 37 %(7). The in hospital mortality of GBS in our study was 2.2% comparable to that reported in the study by Alshek-hlee A et al. (2.58%) in the United states of America (20) and in a study by Mahmoud Reza Ashrafi et al. (2.2%) in Iran(21). The lower mortality in our study compared to the previous study in TASH may indi-cate improvements achieved in health care quality in subsequent years, especially ICU care for respiratory failure. 38% of children did not improve completely in our study similar to the previous study (7). This observation is very similar with the general descrip-tions on the prognosis of GBS showing a relatively benign process compared to other neurologic condi-tions causing weakness (15,20,21). Some clinical variables at presentation can indirectly suggest the poor likely hood of recovery and longer hospital stay; such as the severity of weakness at nadir, the rapidity of disease course and the presence of early cranial nerve palsies(21).
In our study, one variable which became independ-ently associated with poor functional outcome on multivariate analysis was the severity of muscle weakness at nadir (p =0.028, AOR -30.115, 95%CI- 1.44-628.7). The larger confidence interval shows the lesser power of the study due to the smaller sam-ple size than calculated which signifies the require-ment of a large size study for better assessment of predictive factors of outcomes of patients with GBS. Conclusion Most patients with GBS have good prognosis with highly improving functional independence in the first 6 months after initial presentation and the severity of motor weakness at nadir is associated with lower likely hood of functional independence.
ACKNOWLEDGMENT We are grateful to the department of pediatrics and child health staffs at large for their understanding and continuous help until the completion of this paper. My heartfelt appreciation is for my advisors, Dr. Abebe Habtamu and Dr. Ayalew Moges, for their critical look up of the paper for any corrections, and amendable look-ups. Conflict of interest The authors have no conflict of interest to declare.
REFERENCES 1. Hughes RAC, Swan A V., Raphaël JC, Annane D, Van Koningsveld R, Van Doorn PA. Immunotherapy for Guillain-Barré syndrome: A systematic review. Brain. 2007;130(9):2245–57. https://doi.org/10.1093/ brain/awm004 . 2. Zhong M, Cai F-C. Current perspectives on Guillain-Barré syndrome. World J Pediatr. 2007;3(3):187– 94. https://doi.org/10.1016/j.pediatrneurol.2011.06.007. 3. Pritchard J, Hughes RA, Hadden RD, Brassington R. Pharmacological treatment other than corticoster oids, intravenous immunoglobulin and plasma exchange for Guillain-Barré syndrome. Cochrane Database Syst Rev. 2016;2016(11). https://doi.org/10.1002/14651858.cd008630.pub4. 4. Witsch J, Galldiks N, Bender A, Kollmar R, Bösel J, Hobohm C, et al. Long-term outcome in patients with Guillain-Barré syndrome requiring mechanical ventilation. J Neurol. 2013;260(5):1367–74. https:// doi.org/10.1007/s00415-012-6806-x. 5. Kuwabara S. Guillain-Barré syndrome: Epidemiology, pathophysiology and management. Drugs. 2004;64 (6):597–610. https://doi.org/10.2165/00003495-200464060-00003. 6. Sharma B, Paul M. Guillain-Barre Syndrome in 2016: The Centenary Advances. Int J Med Public Heal. 2016;6(3):111–2. http://dx.doi.org/10.5530/ijmedph.2016.3.2. 7. Heye TB. Guillain Barre Syndrome in Children at Tikur Anbessa Specialized Hospital. Res GATE. 2019;2009(April):18–25. 8. Schmidt-Ott R, Schmidt H, Feldmann S, Brass F, Krone B, Gross U. Improved serological diagnosis stresses the major role of Campylobacter jejuni in triggering Guillain-barré syndrome. Clin Vaccine Im munol. 2006;13(7):779–83. https://dx.doi.org/10.1128%2FCVI.00065-06. 9. Ang CW, Jacobs BC, Brandenburg AH, Laman JD, Van Der Meché FGA, Osterhaus ADME, et al. Cross- reactive antibodies against GM2 and CMV-infected fibroblasts in Guillain-Barre syndrome. Neurology. 2000;54(7):1453–8. https://doi.org/10.1212/wnl.54.7.1453.

304
10. Kieseier BC, Kiefer R, Gold R, Hemmer B, Willison HJ, Hartung H-P. Advances in understanding and treatment of immune-mediated disorders of the peripheral nervous system. Muscle Nerve [Internet]. 2004 Aug [cited 2021 Aug 13];30(2):131–56. Available from: https://pubmed.ncbi.nlm.nih.gov/15266629/ https://doi.org/10.1002/mus.20076 11. Zhang G, Li Q, Zhang R, Wei X, Wang J, Qin X. Subtypes and prognosis of Guillain-Barré syndrome in southwest China. PLoS One. 2015;10(7):1–8. https://doi.org/10.1371/journal.pone.0133520 12. Walgaard C, Lingsma HF, Ruts L, Van Doorn PA, Steyerberg EW, Jacobs BC. Early recognition of poor prognosis in Guillain-Barré syndrome. Neurology. 2011;76(11):968–75. https://doi.org/10.1212/ wnl.0b013e3182104407 13. Akbayram S, Dogan M, Akgün C, Peker E, Sayin R, Aktar F, et al. Clinical features and prognosis with Guillain-Barr syndrome. Ann Indian Acad Neurol. 2011;14(2):98–102. https://doi.org/10.4103/0972- 2327.82793 14. Jacobs BC, van den Berg B, Verboon C, Chavada G, Cornblath DR, Gorson KC, et al. International Guill ain-Barré Syndrome Outcome Study: protocol of a prospective observational cohort study on clinical and biological predictors of disease course and outcome in Guillain-Barré syndrome. J Peripher Nerv Syst. 2017;22(2):68–76. https://doi.org/10.1111/jns.12209 15. van Koningsveld R, Steyerberg EW, Hughes RA, Swan A V., van Doorn PA, Jacobs BC. A clinical prog nostic scoring system for Guillain-Barré syndrome. Lancet Neurol [Internet]. 2007 Jul [cited 2021 Aug 13];6(7):589–94. Available from: https://pubmed.ncbi.nlm.nih.gov/17537676/ https://doi.org/10.1016/ s1474-4422(07)70130-8 16. Walgaard C, Lingsma HF, Ruts L, Drenthen J, Koningsveld R van, Garssen MJP, et al. Prediction of res piratory insufficiency in Guillain-Barré syndrome. Ann Neurol [Internet]. 2010 Jun [cited 2021 Aug 13];67(6):NA-NA. Available from: https://onlinelibrary.wiley.com/doi/10.1002/ana.21976 https:// doi.org/10.1002/ana.21976. 17. van der Pijl J, Wilmshurst JM, van Dijk M, Argent A, Booth J, Zampoli M. Acute flaccid paralysis in South African children: Causes, respiratory complications and neurological outcome. J Paediatr Child Health [Internet]. 2018 Mar 1 [cited 2021 Aug 13];54(3):247–53. Available from: https:// p u b med.ncbi.nlm.nih.gov/28960591/ https://doi.org/10.1111/jpc.13709. 18. Ashrafi MR, Sagheb S, Mohammadi M, Vakili A, Nasirian A, Zamani GR. Clinical short term outcome of Guillain-Barré syndrome in children. Iran J Pediatr [Internet]. 2008 [cited 2021 Aug 13];18(1):11–9. Available from: https://www.researchgate.net/publication/26502512. 19. Alshekhlee A, Hussain Z, Sultan B, Katirji B. Guillain-Barré syndrome: incidence and mortality rates in US hospitals. Neurology [Internet]. 2008 Apr 29 [cited 2021 Aug 13];70(18):1608–13. Available from: h t tp : / /www.neu ro logy .o rg /cg i /do i /10 .1212 /01 .wn l .0000310983 .38724 .d4 , h t tp s : / / doi.org/10.1212/01.wnl.0000310983.38724.d4. 20. Asiri S, Altwaijri W, Ba-Armah D, Al Rumayyan A, Alrifai M, Salam M, et al. Prevalence and outcomes of Guillain-Barré syndrome among pediatrics in Saudi Arabia: a 10-year retrospective study. Neuropsy chiatr Dis Treat [Internet]. 2019 Mar [cited 2021 Aug 13];Volume 15(1):627–35. Available from: https:// pubmed.ncbi.nlm.nih.gov/30880987/, https://doi.org/10.2147/NDT.S187994. 21. Bhagat SK, Sidhant S, Bhatta M, Ghimire A, Shah B. Clinical Profile, Functional Outcome, and Mortality of Guillain-Barre Syndrome: A Five-Year Tertiary Care Experience from Nepal. Neurol Res Int [Internet]. 2019 Jun 2 [cited 2021 Aug 13];2019(2):1–5. Available from: https://www.hindawi.com/ journals/nri/2019/3867946/, https://doi.org/10.1155/2019/3867946.

305
Henok Fisseha, Hailu Abera Mulatu, Rodas A. Kassu, Senayt Nur Yimer, Esubalew Woldeyes. Ethiop Med J, 2021, Vol. 59, No. 4 ORIGINAL ARTICLE
BURNOUT AND STRESS AMONG INTERNS IN AN ETHIOPIAN TEACHING HOSPITAL: PREVALENCE AND ASSOCIATED FACTORS
Henok Fisseha, MD1 *, Hailu Abera Mulatu, MD1, Rodas A. Kassu, MD2, Senayt Nur Yimer, MD1, Esubalew Woldeyes, MD1
ABSTRACT Introduction: Burnout is a psychological condition characterized by emotional and physical exhaustion, deperson-alization, and low personal accomplishment. Workplace stress is a significant problem among physicians and is considered as a predecessor to burnout. Burnout negatively affects patient care and causes poor physician mental health. The objective of this study was to determine the level of burnout and stress among medical interns working at St. Paul’s Hospital Millennium Medical College and associated factors. Methods: A cross-sectional survey was conducted among 72 interns using a structured online survey. Burnout was assessed using Maslach Burnout Inventory. Burnout was considered when there is a high score on emotional ex-haustion (> 26 points), depersonalization (> 9 points) or low score on personal accomplishment (< 34 points) sub-scale. Stress was evaluated using Perceived Stress Scale-10 questionnaire. Statistical package for social sciences version 23 was used for data analysis. Univariate and multivariate logistic regression analysis were used to deter-mine association between variables. All variables with a p-value of < 0.05 in the multivariate regression model were considered to be statistically significant. Results: High emotional exhaustion, high depersonalization, and highly reduced sense of personal accomplish-ment were seen in 69.4%, 41.7%, and 44.4% of participants respectively. High level of stress was seen in 37% of the participants. Logistic regression analysis showed that emotional exhaustion and depersonalization were inde-pendently associated with having plans to change profession, having financial worries, and high perceived stress, while depersonalization was associated with fear of medical errors. Reduced personal accomplishment was associ-ated with high perceived stress. High level of perceived stress was associated with having plans to change profes-sion. Conclusions: The levels of burnout and stress among interns were found to be high. All concerned bodies must be aware of the findings of this study so they can help improve the mental wellbeing of interns. Support services for interns need to be enhanced. Key words: Professional burnout, psychological stress, internship, teaching hospital
INTRODUCTION
Internship is a critical point in medical students’ journey reflecting transition to independently func-tioning physician and is an important experience in a physician’s life (1,2). It is however faced with sev-eral challenges bringing a certain level of distress (1). These challenges include but not limited to long working hours, disturbances in sleep-wake cycles, excessive workload and having multiple responsibili-ties (1, 3, 4), which occur with significant lack of social support and uncertain future (1,5). These lead to high level of stress and dissatisfaction with 29 to 95% of interns and other physicians considering stress a significant problem (1, 4, 6).
High levels of workplace stress is considered precur-sor to burnout (1, 3, 4, 6).
The term ‘burnout’ was first described by the Ameri-can psychologist Herbert Freudenberger in 1974 (7) and seen mainly in professions having significant contact with other individuals, specifically those that help people such as medicine (1, 7, 8).
Burnout syndrome is a psychological condition char-acterized by emotional and physical exhaustion, de-personalization, and low personal accomplishment (1, 3). The International Classification of Diseases 11th revision (ICD-11) now has coding for burnout and recognizes it as a syndrome conceptualized as resulting from chronic workplace stress and includes several elements in common with depression and neglect of physical health giving burnout a global recognition (9, 10).
1 Department of Internal Medicine, St. Paul’s Hospital Millennium Medical College, Addis Ababa, Ethiopia 2 Department of Neurosurgery, St. Paul’s Hospital Millennium Medical College, Addis Ababa, Ethiopia *Corresponding author e-mail address: [email protected]

306
This will help further highlight the distinct nature of burnout, which traditionally had unclear distinction with other psychiatric diagnosis such as depression, adjustment disorder or chronic fatigue syndrome (11).
Burnout negatively affects patient care, desire to help, willingness to work and increases medical errors (1, 12, 13, 14). It reduces cognitive skills and affects pa-tient and physician satisfaction contributing to brain drain and strains healthcare systems (1, 3, 13, 15, 16). It causes poor physician mental health contributing to depression, anxiety, and poor quality of life (1, 14, 15). It also affects physical wellbeing resulting in in-adequate sleep, and adverse health outcomes (1, 9, 15).
The prevalence of burnout among physicians and medical students is reported to be high (15). Data from low and middle-income countries is scarce, but few studies in sub-Saharan Africa reported burnout as a major challenge (13, 16, 17). Prevalence of burnout in interns has also been studied showing levels from 16.7% in Jeddah to as high as 75% in Australia (1, 3, 5, 18). Several factors affect occurrence of burnout including lack of support, dissatisfaction with education, unde-fined work roles, sleep deprivation and high work burden (1, 3, 15). Substance use such as smoking and excessive alcohol consumptions seems to increase the risk (15). Salary was also a major contributor in stud-ies among physicians outside internship years (13). Knowing the magnitude of stress and burnout and contributing factors will help recommend possible solutions. Burnout was studied among Ethiopian phy-sicians and medical students. However, we are not aware of any previous studies that evaluated the level of stress and burnout among interns working in Ethio-pia. The aim of this study was to determine the level of burnout and stress and associated factors among medi-cal interns working at St. Paul’s Hospital Millennium Medical College (SPHMMC).
MATERIALS AND METHODS
Study setting and design The study was conducted at SPHMMC in Addis Ababa, Ethiopia; a tertiary teaching hospital estab-lished in 2007 after a medical college was opened in a hospital built in 1968 (19). Interns have rotations of 12 weeks each in of the departments of internal medi-cine, pediatrics, surgery and obstetrics and gynecol-ogy and 6 week rotation in psychiatry and emergency medicine. A cross-sectional survey was conducted from August 24 to September 20, 2020 on interns that worked in the hospital for a minimum of 6 months.
Sample size was calculated using single population proportion formula. The value of P was taken as 22%, according to a study done in similar popula-tion in India (5). A desired confidence level of 95% and margin of error of 5% was used resulting in a sample size of 264. There were 106 interns actively working in the hospital. Since this number ex-ceeded the total number of interns, it was planned to include all interns in the data collection. Survey instrument Data collection was made using structured elec-tronic online questionnaire. All interns were invited to participate in the survey via social media plat-form used for a group communication. Filling out the survey proceeded after electronic consent was given. The questionnaire had four parts. First part included sociodemographic data (age, gender, marital status, residence in college compound, and living with family or not). Second part included a group of structured questionnaires for assessing burnout us-ing Maslach Burnout Inventory (MBI), and stress using Perceived Stress scale-10 (PSS-10) (8, 20). MBI was validated in South Africa for assessment of burnout and has been used in previous studies in Ethiopia (13, 21). MBI is a 22-item questionnaire instrument assessing burnout (8). It has three components, each assessing emotional exhaustion (EE), depersonalization (DP) and personal accomplishment (PA). EE includes 9 items with a maximum score of 54 and is classified high for score > 26, moderate for scores 19-26 and low for scores below 19. DP has 5 items scored out of 30 and is classified as high if > 9 points, moder-ate for 6-9 points and low below 6 points. Finally, PA containing 8 items scored out of 48 is scored low for scores < 34, moderate for scores 34-39 and high for above 39. Since PSS-10 is recommended as a tool to assess the level of stress over the last one month and not a diagnostic instrument, there is no cut off for classifi-cation of stress. Dividing the PSS-10 values in to tertiles was done (22, 23). The highest tertile (PSS≥18) was considered to be associated with a higher degree of perceived stress while intermediate score (PSS=18-22) and low score (≤17) was consid-ered lower degree. PSS-10 is validated in Ethiopia (24). The final parts assessed factors affecting burnout, including individual and work related factors.

307
Data analysis Data were generated from the electronic questionnaire in Excel format and checked for completeness. It was then entered into Statistical Package for Social Sci-ences version 23 and analyzed. Data were summarized using percentages, mean, standard deviation (SD) and presented in tables and figures. Reliability of burnout and stress assessment tools were done. Logistic re-gression model was used to examine the independent association between burnout, stress and associated factors. Variables with P-value <0.2 in the univariate analysis were included in the multivariate logistic regression model. All variables with a p-value of < 0.05 in the multivariate model were considered statis-tically significant. Associations between variables were presented in odds ratios (OR) with 95% confi-dence interval (CI). Ethical approval The study was approved by the Institutional Review Board of SPHMMC (IRB code: PM 28/103).
Written informed consent was obtained from all participants.
Each participant’s information was collected using anonymous electronic questionnaire.
RESULTS
Socio-demographic characteristics Out of the 106 interns actively working in the hospi-tal, there were 72 responses giving a response rate of 68%. Out of the respondents, 59.7% were males and except for one married individual, all were sin-gle. The mean age (SD) was 24.57 (1.46) years and ranged from 23 to 34 years. Most of the participants (70.8 %) live inside the college compound in the dormitories. Over half (54.2%) said their families reside in the capital Addis Ababa and among them 61.5 % do not live with their families during work and reside in the dormitories (Table 1).
Table 1: Sociodemographic characteristics of interns, SPHMMC, Addis Ababa, 2020
Characteristic Number Percent
Age Group Up to 24 years 44 61.1 25 years and above 28 38.9 Gender Female 29 40.3 Male 43 59.7 Place of residence Inside college compound 51 70.8 Outside college compound 21 29.2 Family residence Addis Ababa 39 54.2 Outside of Addis Ababa 33 45.8 Current rotation Emergency medicine 10 13.9 Internal Medicine 17 23.6 Obstetrics/Gynecology 15 20.8 Pediatrics 13 18.1 Psychiatry 5 6.9 Surgery 12 16.7
Other co-morbid conditions Several individual-related factors were assessed. Six participants reported as having been diagnosed with psychiatric conditions in a healthcare setting which included three individuals with major depressive dis-order and two with generalized anxiety disorder. The average number of night duties per week ranged from 0 to 4 with 68% having 2 duty shifts while, 26% hav-ing 3 duties.
Two respondents said they smoke cigarettes or chew khat regularly and 6 individuals consumed alcohol regularly. A total of 8 (11.1%) individuals regularly used any of the mentioned substances. Eighty-three percent were not aware of any support service in the hospital. Finally, 69.4% of respon-dents had planned to leave the country and 43.1% had planned to change their profession (Table 2).

308
Factor assessed Number Percent
Regular physical activity No 61 84.7 Yes 11 15.3
Average number of duty per week
<3 51 70.8 ≥3 21 29.1
Excessively worried about COVID-19 pandemic
No 43 59.7 Yes 29 40.3
Awareness of support services No 60 83.3 Yes 12 16.7
Plans to leave the country No 22 30.6 Yes 50 69.4
Plans to change profession No 41 56.9 Yes 31 43.1
Figure 1: Burnout status of study participants, SPHMMC, Addis Ababa, 2020 Ten (13.9%) interns had high level of burnout in all three MBI components and 13 (18%) in two components. Stress The mean PSS-10 score was 21.03, which lied in the high tertile range and 37% of responses were in this range reflecting a high level of perceived stress. The rest 36.1% and 26.4% were in the mod-erate and low group respectively (Table 3).
Work related challenges faced during internship The interns were asked to rate the challenges they faced on a 5-point likert scale. The biggest chal-lenge identified from the responses was ‘Poorly defined role as an intern’ whereby 97.2% said that they ‘agree’ or ‘strongly agree’. Ninety percent agree with having excessive work load and 92.7% complained of fatigue and sleep deprivation (Table 4).
Factors associated with burnout The odds of having EE was five times higher in individuals having plans to change profession (AOR, 5.13; 95% CI, 1.31-21.11) and had exces-sive financial worries (AOR, 5.57; 95% CI, 1.23- 25.15) and six times higher in individuals who reported high level of perceived stress (AOR, 6.17; 95% CI, 1.29- 29.59) after controlling for the other variables. Similarly, all the three factors were inde-pendently associated with high DP. Fear of medi-cal errors increased the odds of DP (AOR, 4.56; 95% CI, 1.14-18.23). Participants who reported high level of perceived stress had three times in-creased odds of reporting low levels of PA (AOR, 3.09; 95% CI, 1.03-9.29). Having plans to change profession increased the odds of reporting high stress by five-fold (AOR, 5.16; 95% CI, 1.411-18.924) (Table 5).
Table 2: Other co-morbid conditions of interns, SPHMMC, Addis Ababa, 2020
COVID-19: Coronavirus Disease 2019
Reliability of survey questionnaire Evaluation of the internal consistency (cronbach’s al-pha) of the instrument was done and α-values of 0.908, 0.801, and 0.694 were obtained for EE, PA, DP sub-scale respectively. All α-values were above 0.6 and were acceptable. Similarly, a good internal consistency of α = 0.879 was seen for PSS-10 questionnaire. Burnout assessment
The burnout assessment of interns showed that 69.4%, 41.7%, and 44.4% of them reported high EE, high DP, and highly reduced sense of PA respectively. The mean scores of MBI components for EE was 33.4 (range: 4 to 54) reflecting a high level. In contrast, the mean scores for DP and PA respectively, were 9.4 (range: 0 to 25) and 34.1 (range: 16 to 48) reflecting moderate levels of DP and reduced PA (Figure 1).

309
Variable PSS-10 high Number Percent Age group in years <25 16 36.4 ≥25 11 39.3 Gender Female 15 51.7 Male 12 27.9 Place of residence Inside college compound 18 35.3 Outside college compound 9 42.9 Family residence Addis Ababa 18 46.2 Outside of Addis Ababa 9 27.3 Department Internal Medicine 10 58.8 Pediatrics 3 23.1 Obstetrics and gynecology 7 46.7 Emergency medicine 2 20 Psychiatry 0 0 Average number of duties in the last week
<3 17 33.3 ≥3 10 47.6 Regular physical activity No 22 36.1 Yes 5 45.5 Drink alcohol regularly No 23 34.8 Yes 4 66.7 Excessively stressed/worried about COVID-19 pandemic
No 17 39.5 Yes 10 52.6 Awareness of support ser-vices
No 25 41.7 Yes 2 16.7 Plans to leave the country No 5 22.7 Yes 22 44 Plans to change profession No 10 24.4 Yes 17 54.8
Table 3: Characteristics of high perceived stress, SPHMMC, Addis Ababa, 2020
Table 4: Work-related factors, SPHMMC, Addis Ababa, 2020
Challenges faced during work
Strongly agree or agree
Percent
Lack of support 44 61.1 Excess work overload 65 90.2 Difficulty integrating well with the team
5 6.9
Inadequacy of clinical skills
7 9.7
Inadequacy of clinical knowledge
5 6.9
Feeling inadequately prepared to work as a doctor
11 15.2
Difficulty balancing work with personal life
24 33.3
Difficulty interacting with senior staff
28 38.8
Having poorly defined role as an intern
70 97.2
Having financial worries 24 33.3 Having future and career uncertainty
64 88.8
Conflict with allied health professionals
49 68
Difficulty attaining edu-cation and practical skills needs
49 68
Fear of error leading to patient suffering
36 50
Fear of medico-legal consequences
30 41.6
Excess fatigue and sleep deprivation
66 91.7
Lack of recognition 64 88.9 Finding a comfortable place to sleep/rest while on duty
53 73.7

310
Table 5: Multivariate logistic regression analysis of factors associated with burnout and stress, SPHMMC, Addis Ababa, 2020
OR - odds ratio
Crude OR
95% CI P-value Adjusted OR
95% CI P-value
Emotional exhaustion Plans to change profession 5.28 1.56 – 17.85 0.005 5.13 1.31 – 21.11 0.019 Financial worries 3.0 0.88 – 10.18 0.07 5.568 1.23 – 25.15 0.026 High perceived stress 5.85 1.53 – 22.2 0.006 6.17 1.29 – 29.6 0.023 Plans to leave country 2.64 0.91 – 7.62 0.069 0.7 0.16 – 3.11 0.639 Lack of support 2.55 0.91 – 7.13 0.071 2.3 0.63 – 8.67 0.206 Fear of medical error 2.23 0.79 – 6.26 0.125 2.4 0.65 – 8.9 0.189 Finding a place to sleep 2.77 0.93 – 8.29 0.064 2 0.47 – 8.4 0.346 Difficulty with staff interac-tions
2.87 0.93 – 9.07 0.062 2.5 0.562 – 10.96 0.23
Depersonalization Plans to change profession 5.64 2.02 – 15.7 0.001 5.09 1.79-14.45 0.002 Financial worries 2.8 1.02 – 7.68 0.043 3.98 1.19 – 13.33 0.025 High perceived stress 3.22 1.19 – 8.7 0.019 4.27 1.31-13.93 0.016 Number of duties per week 2.44 0.87 – 6.9 0.091 1.57 0.36 – 6.77 0.547 Difficulty with staff interac-tions
2.86 1.07 – 7.62 0.034 2.57 0.63 – 10.6 0.19
Fear of medical error 0.41 0.15 – 1.13 0.056 4.56 1.14 – 18.23 0.032 Difficulty attaining educa-tion
0.41 0.15 – 1.13 0.08 0.247 0.06 – 1.04 0.057
Personal accomplishment High perceived stress 3.4 1.25 – 9.22 0.014 3.09 1.03 – 9.29 0.044 Difficulty attaining educa-tion
0.37 0.14 – 1.03 0.055 0.378 0.13 – 1.14 0.084
Difficulty with staff interac-tions
3 1.12 – 7.98 0.027 0.75 0.96 – 7.83 0.059
Perceived stress Plans to change profession 3.76 1.38 – 10.28 0.01 5.16 1.41-18.92 0.015 Gender 2.77 1.03 – 7.43 0.043 3.43 0.94 – 12.52 0.62 Plans to leave country 2.61 0.85 – 8.38 0.092 1.75 0.46 – 6.61 0.409 Awareness of support ser-vice
0.28 0.56 – 1.39 0.12 0.263 0.04 – 1.71 0.163
DISCUSSION
A high level of burnout was reported by the partici-pants. High EE was reported in 69.4% of the partici-pants in our study. This figure is much higher than previous reports from studies done in Ireland, Mex-ico, Saudi Arabia, India and Australia which showed high EE from 34% to the highest of 55% in an Irish study (1, 3, 5, 9, 18).
However, a study from United States of America exceeds this figure with 84% reporting high EE (12). The level of high DP (41.7%) was in the range of reports from the mentioned studies which ranged from 39% to 84.9 % (1, 3, 5, 9, 12, 18).
Highly reduced PA (44.4%) was comparable to most studies reporting figures from 41.6% to 75.5% (1, 3, 9, 12) but markedly different from an Indian study report of 77% (5) and an Australian one of 15% (18). These differences might be a reflection of the differ-ences of settings the studies were done including the types of hospitals (public or private), the difference in workload, culture, socioeconomic status, type of patients seen and availability of treatments. All of these studies reflect the significance of burn-out and the importance of addressing it not only in medical students and higher level physicians but also in interns.

311
Financial issues have been found to be significant con-tributors to burnout in all physicians (1, 25). A Saudi Arabian study reasoned that living in a self-owned house provides financial security and subsequently leads to less burnout (9). Burnout has also been found to be more common in individuals contemplating changing their careers as it reflects the level of frustra-tion with their life and career (9). An association be-tween intern stress and medical errors has been re-ported (18). In addition, medical errors can be a source of burnout while burnout by itself can increase medical errors showing that it can also affect patients and po-tentially lead to litigation (11). Not only were components of burnout high, but so was the level of perceived stress. Previous studies have shown that high level of stress poses a threat to increas-ing burnout (26, 27). This has also been reflected in interns whereby 43% in one study with high burnout reported mild to severe degrees of distress assessed by the 12-item general health questionnaire (1). Our study also supports this association by reflecting the signifi-cance of stress on all three components of burnout.
There was also significant difference with regards to gender and burnout. Previous studies show inconsisten-cies with which gender is more affected. Most studies in interns, however, reveal that gender might not be significant (1, 3, 5, 9). The same was true for dormitory residence and places of family residence. Similar to our findings, more than 80% of participants in a compara-tive study were not aware of support services which may hinder them from seeking help (1). A comparative percentage (around 70%) wish to leave their country in the future (1). This is an alarming number and contrib-utes to the high physician attrition the country faces (28). The increasing saturation of many cities with phy-sicians, particularly general practitioners, is leading to rising unemployment, which can further affect medical students and junior doctors (29). Contemplating to change profession can stem from lack of employment prospects, which was shown to be related to compo-nents of burnout on a study from Ethiopia (30). It is critical to raise awareness about the significance of stress and burnout among interns. Interns are not pro-vided with the concern given to other physicians, which is reflected by the paucity of previous studies on the subject on interns. Burnout is as common, if not more, compared to physicians who completed internships. Subsequently, the impact on mental and physical well-being can be mitigated (16). Healthy and satisfied phy-sicians are essential for providing appropriate care for patients by minimizing medical errors, reducing physi-cian fatigue, and improving patient satisfaction (3, 5, 18, 31).
Support services including psychological support that is designed to address their challenges must be made available and they should be aware of it as soon as they start internship. Mentorship by physi-cians that have passed their internship and have experience dealing with its challenges can help by addressing the issues they might have. To our knowledge, this study is the first of its kind done to assess burnout among interns in Ethiopia. An internationally validated instrument was used to assess burnout and a locally validated one was used for evaluation of stress. It will serve as an important starting point for further research. How-ever, it has some limitations. Response rate of 68% may not be representative of all interns, but is higher than 35% and 45% in other similar studies (1, 9). The number of participants is low and it is recommended that future large scale multi-center studies be done. This was a cross-sectional study and definitive conclusions about causality cannot be made. Initial baseline data collection and serial follow-up was not made.
Conclusions In summary, levels of burnout and stress in was high among interns. The results underscore the need to raise awareness on the problem. Promoting mental well-being and optimizing preventative and psychosocial support services is essential. The college must make the mental wellbeing of its phy-sicians a priority and act early. Financial and job security must be safeguarded so that junior physicians can work in a more condu-cive work environment. Further studies on the sub-ject with more detailed assessments on impacts of burnout on other components of mental health needs to be conducted.
ACKNOWLEDGMENT
The authors would like to give their kind regards to Mr. Tewodros Getinet for his valuable feedback during preparation of this manuscript. Conflict of interests All authors declare that they have no conflict of interest regarding this manuscript.

312
REFERENCES 1. Hannan E, Breslin N, Doherty E, McGreal M, Moneley D, Offiah G. Burnout and stress amongst interns in Irish hospitals: contributing factors and potential solutions. Ir J Med Sci. 2018;187: 301-307 2. Swaid AI, Elhilu AH, Mahfouz MS. Medical internship training in Saudi Arabia: interns’ views and perceptions. Adv Med Educ Pract. 2017;8:121-128 3. Miranda-Ackerman RC, Barbosa-Camacho FJ, Sander-Möller MJ, Buenrostro-Jiménez AD, Mares-Paíset R, Cortes-Flores AO, et al. Burnout syndrome prevalence during internship in public and private hospi tals: a survey study in Mexico. Med Educ Online. 2019; 24(1) :1593785 4. Lam TP, Wong JG, Ip MS, Lam KF, Pang SL. Psychological well-being of interns in Hong Kong: What causes them stress and what helps them. Med Teach. 2010;32(3):e120-e126 5. Niranjan V, Udey B, Razdan RG. Evaluation of burnout in medical interns: an institutional study. Int J Res Med Sci. 2017;5(5):2173-2175 6. Abdulghani HM, Irshad M, Zunitan MA, Sulihem AA, Dehaim MA, Esefir WA, et al. Prevalence of stress in junior doctors during their internship training: a cross-sectional study of three Saudi medical coll eges’ hospitals. Neuropsychiatr Dis Treat. 2014;10:1879-1886 7. Freudenberger HJ. Staff burnout. J Soc Issues. 1974;30(1):159–165 8. Maslach C, Jackson SE. The measurement of experienced burnout. J Org Behav. 1981;2:99-113 9. Mufarrih SH, Naseer A, Qureshi NQ, Anwar Z, Zahid N, Lakdawala RH, et al. Burnout, Job Dissatisfac tion, and Mental Health Outcomes Among Medical Students and Health Care Professionals at a Tertiary Care Hospital in Pakistan: Protocol for a Multi-Center Cross-Sectional Study. Front Psychol. 2019; 10:2552 10. The lancet. ICD-11. Lancet. 2019 Jun 8;393(10188):2275 11. Kaschka WP, Korczak D, Broich K. Burnout: a fashionable diagnosis. Dtsch Arztebl Int. 2011;108 (46):781-787 12. Doolittle BR, Windish DM. Correlation of burnout syndrome with specific coping strategies, behaviors, and spiritual attitudes among interns at Yale University, New Haven, USA. J Educ Eval Health Prof. 2015;12:41 13. Lrago T, Asefa F, Yitbarek K. Physicians’ Burnout and Factors in Southern Ethiopia Affecting It. Ethiop J Health Sci. 2018;28(5):589-598 14. Kim MH, Mazenga AC, Yu X, Simon K, Nyasulu P, Kazembe PN, et al. Factors associated with burnout amongst healthcare workers providing HIV care in Malawi. PLos One. 2019;14(9):e0222638 15. Haile Y.G, Senkute A.L, Alemu BT, Bedane DM, Kebede KB. Prevalence and associated factors of burnout among Debre Berhan University medical students: a cross-sectional study. BMC Med Educ. 2019;19(2):413 16. Dubale BW, Friedman LE, Chemali Z, Denninger JW, Mehta DH, Alem A, et al. Systematic review of burnout among healthcare providers in sub-Saharan Africa. BMC Public Health 2019; 19(1):1247 17. Selamu M, Thornicroft G, Fekadu A, Hanlon C. Conceptualisation of job-related wellbeing, stress and
burnout among healthcare workers in rural Ethiopia: a qualitative study. BMC Health Serv Res. 2017; 17 (1):412. 18. Willcock SM, Daly MG, Tennant CC, Allard B. Burnout and psychiatric morbidity new medical gradu ates. MJA 2004;181(7):357-360 19. SPHMMC SPHMMC. About – Saint Paul’s Millennium Medical College. Retrieved from: https:// sphmmc.edu.et/about/ (accessed: Aug 20) 20. Cohen S, Kamarck T, Mermelstein R, A global measure of perceived stress. J Health Soc Behav. 1983;24 (4):385-396. 21. Naude J.L, Rothmann S. The validation of the Maslach Burnout Inventory – Human Services Survey for emergency medical technicians in Gauteng. SA J Ind Psychol. 2004;30(3):21-28 22. Alosaimi FD, Alawad HS. Alamri AK, Saeed AI, Aljuaydi KA, Alotaibi AS, et al. Patterns and determi nants of stresss among consultant physicians working in Saudi Arabia. Adv Med Educ Pract. 2018;9:165- 174 23. Pangtey R, Basu S, Meena GS, Banerjee B. Perceived Stress and its Epidemiological and Behavioral Cor relates in an Urban Area of Delhi, India: A Community-Based Cross-Sectional Study. Indian J Psychol Med. 2020;42(1):80-86 24. Manzar MD, Salahuddin M, Peter S, Alghadir A, Anwer S, Bahammam AS, et al. Psychometric proper ties of the perceived stress scale in Ethiopian university students. BMC public health. 2019;19(1):41.

313
25. Wiederhold BK, Cipresso P, Pizzioli D, Wiederhold M, Riva G. Intervention for physician burnout: A systematic Review. Open Med (Wars). 2018;13:253-263 26. Yates SW. Physician Stress and Burnout. Am J Med. 2020;133(2):160-164 27. Elit L, Trim K, Mand-Bains IH, Sussman J, Grunfeld E. Job satisfaction, stress, and burnout among Cana dian gynecologic oncologists. Gynecol Oncol. 2004;94(1):134-9 28. Berhan Y. Medical doctors profile in Ethiopia: In memory of 100-years Ethiopian modern medicine and t he new Ethiopian millennium. Ethiop Med J. 2008; 46 Suppl 1:1-77 29. Assefa T, Haile Mariam D, Mekonnen W, Derbew M. Health system's response for physician workforce
shortages and the upcoming crisis in Ethiopia: a grounded theory research. Hum Resour Health. 2017;15 (1):86 30. Selamu M, Hanlon C, Medhin G, Thornicroft G, Fekadu A. Burnout among primary healthcare workers during implementation of integrated mental healthcare in rural Ethiopia: a cohort study. Hum Resour Health. 2019 Jul 18;17(1):58 31. Nason GJ, Liddy S, Murphy T, Doherty EM. A cross-sectional observation of burnout in a sample of Irish junior doctors. Ir J Med Sci. 2013;182(4):595-9

315
Eskinder Kebede, Eyasu Mesfin, Myshelle Ramlal Singh. Ethiop Med J, 2021, Vol. 59, No. 4 ORIGINAL ARTICLE
AGE AT MENARCHE, FACTORS THAT INFLUENCE IT, AND MEN-
STRUAL PATTERN OF SECONDARY SCHOOL ADOLESCENTS IN ADDIS ABABA, ETHIOPIA
Eskinder Kebede, MD1*, Eyasu Mesfin, MD1, Myshelle Ramlal Singh, MSc2
ABSTRACT
Introduction: Menarche is the first menstrual period of a girl. Age at menarche is a complex trait and has a strong genetic component. The mean age of menarche varies from population to population and is known to be a sensitive indicator of various characteristics of the population, including nutritional status, geographical location, environ-mental conditions, and magnitude of socioeconomic inequalities in society. Objectives: To determine the mean age of menarche, and assess influencing factors and menstrual patterns of sec-ondary school adolescent females in Addis Ababa, Ethiopia. Methods: This is a cross-sectional study conducted from January to May 2017 in selected high schools in Addis Ababa, Ethiopia. Female adolescents in the selected schools who were in grades 9th and 10th and who fulfilled the eligibility criteria were included. A self-administered questionnaire tool was used to collect data. Data was cleaned, entered and analyzed using SPSS version 21. Results: The mean and median ages at menarche in this study were 13.75 (±1.30) and 13 years, respectively. The mean age at menarche was 0.96 years younger for private school girls (12.82 years) compared to government school girls (13.78 years). The private school girls had about 4 times higher odds of having menarche at an earlier age (AOR 4.12; 95% CI 2.44-6.95). The most common perimenstrual symptoms experienced by the students were dysmenorrhea (abdominal cramps) 303 (75.8 %), backache 188 (47.0 %), and headache 16%. In this study, abnor-mal menstrual cycle lengths occurred in 25.1 % of our respondents. Of the total study population, 77 (19.3%) ado-lescents had a menstrual cycle length shorter than 21 days. Conclusion: The mean age at menarche in this study was 13.26 ±1.319 years. This age at menarche was ear-lier than prior reports from Ethiopia. Socioeconomic status was identified as a factor significantly associated with the age at menarche. Dysmenorrhea was the commonest perimenstrual symptom. Key words: Age at menarche, adolescents, perimenstrual symptom.
INTRODUCTION
Menarche is the first menstrual bleeding and repre-sents a major landmark event in the reproductive life of an adolescent girl. (1) It is the most accurately recalled indicator of puberty. (2) Age at menarche (AAM), as a result, is one of the most significant traits, which is commonly used in retrospective epi-demiological studies of female sexual maturation. (3) Menarche is part of the complex process of growing up. Its onset is preceded by a complex cascade of hormonal changes during puberty which is suscepti-ble to various factors from the very beginning of prenatal life. (4) The mean age at menarche varies from population to population and is known to be a sensitive indicator of various characteristics of the population including nutritional status, geographical location, environmental conditions, and socio-economic status. (5-7)
Studies suggest that menarche tends to appear earlier in life as the sanitary, nutritional, and economic condi-tions of a society improve. (8) Over time, the age at menarche has been found to show a steady decline of about two to three months per decade in developed countries (9), and about six months per decade in developing countries. (10) The mean age at menarche in the United States of America is 12.55 and 12.0 years among black and white girls, respectively. (5) The reported ages at menarche in India were 15.9 and 15.6 years for rural and urban girls respectively. (11) Two studies done in rural Ethiopia revealed the mean age at menarche to be 15.8 ± 1 and 13.9 ± 1.2 years. (3, 12) The normal range for menstrual cycles is between 21 and 35 days while the duration of menstrual flow ranges from two to seven days.
1 Department of Obstetrics and Gynecology, School of Medicine, CHS, Addis Ababa University, Addis Ababa, 2 Department of Health Behaviour and Health Education, University of Michigan *Correspondence author e-mail address: [email protected]

316
Menstrual abnormalities are more common among younger girls, becoming less frequent as they grow older, 3–5 years after menarche. (13-17) For the first few years after menarche, irregular and longer cycles are common. (15-18) Menstruation may also be asso-ciated with various symptoms occurring before or during menstrual flow. A significant number of young students complain of dysmenorrhea, and this is more common among older girls with longer bleeding peri-ods. (18) Knowledge on age at menarche and pattern in men-strual cycles is necessary for patient education and to guide individualized clinical care. To our knowledge there is no published study in our country comparing age at menarche and menstrual patterns between dif-ferent socioeconomic groups. The purpose of this study, hence, was to determine the age at menarche and patterns of menstruation among secondary school girls of different socioeconomic status in Addis Ababa.
METHODS
Study design: This is a cross-sectional study con-ducted from January through May 2017 in selected high schools in Addis Ababa, Ethiopia. Study setting: Addis Ababa has 10 administrative districts and sub-cities. The total number of secondary schools in the city was 212. Study population: Secondary school adolescents who have started to menstruate and at-tending secondary schools in Addis Ababa, Ethiopia. Sample size: The sample size was determined using a single proportion formula with a level of significance of 5%, Z = 1.96 (confidence level at 95%), and the absolute precision or margin of error d=0.05. The 50% proportion (P=0.5) was taken for the sake of having a larger sample size. Sampling procedure: A two-stage sampling was used. In the first stage, one administra-tive district was selected randomly. In the second stage, four high schools, two from government and two from non-governmental schools, were selected randomly from the selected district. The two study government schools were Tikur Anbessa and Atse Naod High schools. The two non-governmental schools were Lycée Guebre Mariam (an international school) and the Nativity Girls School (a missionary school). The study sites also presented a comparative advantage in that each group of schools represented children from low and high socioeconomic groups. Operational definition: The age at menarche was determined by questioning the age of the girl at having her first menstruation.
Data collection: Data was collected using a self-administered pre-tested questionnaire during school hours. Grades 9 to 11 students who already had menarche were included in the study using quota sampling on convenience till the sample size is reached. Of the total sampled 422 adolescents, 400 (95%) had their menarche and were eligible for analysis. Data compilation and analysis: The collected data was coded, cleaned, and analyzed using SPSS ver-sion 21 statistical software. Descriptive statistics were used to present the results. Tables and differ-ent graphs were used to assist data presentation. The chi-square test of independence was done be-tween the independent (socio-demographic vari-ables) and dependent variables (age of menarche). The tested independent variables were the type of school, place of residence, religion, paternal and maternal educational levels, maternal and paternal occupation, and family size. The dependent vari-able was the age of menarche. A stepwise analysis was conducted to explore the presence and strength of the association between the independent variables and age at menarche. Regression analysis was implemented between selected independent variables and age at men-arche as a dichotomous variable (≤13 and >13 years). Earlier age at menarche was taken as age at menarche of below the identified mean age at men-arche in the present study. Initially, bivariate re-gression analysis was conducted for each inde-pendent variable with a chi-square value of <0.2 on cross-tabulation for the test of independence. Multiple regression analysis was then employed for those with a significant association (P<0.05) on bivariate analysis to control for confounding ef-fects among the variables. Odds ratios (ORs) with their 95% confidence intervals were computed to identify the presence and strength of association and P-values<0.05 were taken as statistically sig-nificant. Ethical considerations: Ethical approval was ob-tained from the Institutional Review Board of the College of Medicine and Health Sciences of the AAU. Permission to conduct the study was also obtained from the principals of participating schools. Participation in the assessment was com-pletely voluntary with ascent and written informed consent was acquired from every participant and their parents before participation. No names were recorded to keep the identity of respondents anonymous.

317
RESULTS
Data for the present study was collected from 400 eligible schoolgirl study participants. The current age of the study participants ranged from 14 to 18 years, while the mean age was 15.98 (±1.14) years. Sociodemographic variables As shown in table-1 below, 230 (57.5%) of the partici-pants were from private schools.
The majority of the study participants were from Addis Ababa and Orthodox in religion with propor-tions of 367 (91.8%) and 303 (75.8%), respectively. About two-thirds, 276 (69%) were grade 9 students. The paternal and maternal education level was higher education (above high school) for 184 (46%) and 148 (37%) of the participants, respectively.
Table 1: Socio-demographic characteristics of adolescents at selected high schools in Addis Ababa, Ethiopia, January - May 2017GC.
Characteristics Frequency n (%) Current age in years (n=400) 14 years 35 (8.8) 15 years 115 (28.7) 16 years 117 (29.3) 17 years 89 (22.3) 18 years 44 (11.0)
Type of school (n=400) Private 230 (57.5) Government 170 (42.5) Residence (n=400) Addis Ababa 367 (91.8) Outside Addis Ababa 33 (8.2)
Education level (Grade) (n=400) 9 276 (69) 10 3 (0.8) 11 121 (30.2)
Religion (n=400) Catholic 12 (3.0) Muslim 40 (10.0) Orthodox 303 (75.8) Protestant 41 (10.2) Others 4 (1.0)
Paternal Education (n=389) Elementary or less 98 (24.5) High school complete 107 (26.7) Higher education 184 (46.0) Unknown 11 (2.8)
Maternal Education (n=384) Elementary or less 118 (29.5) High school complete 118 (29.5) Higher education 148 (37.0) Unknown 16 (4.0)
Family size (n=400) 1-3 46 (11.5) 4-6 288 (72.0) >6 66 (16.5)

318
Age at menarche The mean and median ages at menarche in the present study were 13.75 (±1.30) and 13 (IQR 2) years, re-spectively. Demonstrated below in Figure 1 is the age at menarche of the study participants. The age at men-arche ranged from 10 to 16 years. Nearly all, 392 (98%) had their menarche by 15 years.
Figure 1: Age at menarche of schoolgirls at selected high schools in Addis Ababa, Ethiopia, January - May 2017GC. (n=400) Regression analysis was implemented between se-lected independent variables and age at menarche as a dichotomous variable (≤13 and >13 years). Earlier age at menarche was taken as age at menarche of below the identified mean age at menarche in the present study. A stepwise analysis was conducted to explore the presence and strength of the association between the independent variables and age at menarche. Initially, bivariate regression analysis was conducted for each independent variable with a chi-square value of <0.2 on cross-tabulation for the test of independence. Bivariate regression analysis implemented using age at menarche as a dichotomous variable above and be-low the mean age at menarche (≤13 years and >13 years) revealed associations between earlier age at menarche (≤13 years) and selected independent vari-ables. On multivariate analysis, however, only type of school and religion remained to be significantly asso-ciated (P<0.05) with earlier age at menarche (≤13 years). Table 2 shows the results of the logistic regression model of selected socio-demographic variables vs. earlier age at menarche for adolescents.
The mean age at menarche was 0.96 years younger for private school girls (12.82 years) compared to government school girls (13.78 years). The private school girls had about 4 times higher odds of hav-ing menarche at an earlier age (AOR 4.12; 95% CI 2.44-6.95). The study subjects who were Catholic in religion had a mean age of 12.6 years, which is 1.15 years earlier than the overall mean age at menarche (13.75 years). The Catholics had about 10 times higher odds of having menarche at an earlier age compared to protestants (AOR 9.5; 95% CI 1.04-86.76). As shown in the table, study participants whose paternal and maternal education levels were ele-mentary and high school had a significant associa-tion with earlier age at menarche in the bivariate analysis (P<0.05), while the association was lost in multiple regression models. Menstrual cycle pattern Table 3 below demonstrates the menstrual cycle pattern of the study participants. Of the total study population, 77 (19.3%) adolescents had a men-strual cycle length shorter than 21 days. More than half, 211 (52.8%) had a cycle length between 21 and 28 days. In 23 of them (5.8%), the menstrual cycle interval was longer than 35 days. The major-ity, 282 (70.5%), had a menstrual duration of flow of 3-5 days, while only 4 (1.0%) had a duration of fewer than 3 days. The menstrual cycles were de-scribed as regular by half and 203 (50.7%) of the participants. Nearly half of the participants, 199 (49.7%), used 3-4 sanitary pads per day during menstruation. Only 22 (5.5%) used > 4 pads per day.
Peri-menstrual symptoms Table 4 below demonstrates the perimenstrual symptoms reported by the study participants. Ab-dominal cramps and backaches were the shared reported symptoms experienced by 303 (75.8%) and 188 (47%) of the participants, respectively. A quarter of them, 102 (25, 5%), reported having been absent from school due to perimenstrual symptoms. The use of medication for the symp-toms was practiced by 98 (24.5%) of the partici-pant girls.

319
Table 2: Regression analysis of selected socio-demographic variables vs earlier age at menarche of Adolescents at selected high schools in Addis Ababa, Ethiopia, January - May 2017GC
Characteristics Mean age at menarche
OR for earlier age at menarche (≤13 years) COR** AOR*** P-value 95% CI P-value 95% CI
Type of school (n=400) Private 12.83 0.000 3.88 (2.55-5.90) 0.000 4.12 (2.44-6.95)* Government 13.78 1 1 Religion (n=400)
Catholic 12.67 0.031
10.48 (1.24-88.75)
0.046 9.50 (1.04-86.76)
Muslim 13.48 0.908 1.05 (0.44-2.52) 0.097 2.24 (0.86-5.79) Orthodox 13.21 0.610 1.19 (0.62-2.28) 0.545 1.24 (0.62-2.50) Others 13.37 0.963 0.95 (0.12-7.42) 0.779 0.73 (0.08-6.42) Protestant 13.00 1 1 Paternal Education (n=389) Unknown 13.64 0.499 1.53 (0.45-5.19) 0.818 0.86 (0.23-3.15) Elementary or less 13.48 0.002 2.24 (1.36-3.70) 0.836 0.93 (0.44-1.94) High school complete 13.36 0.028 1.80 (1.11-2.92) 0`.341 0.74 (0.40-1.39) Higher education 13.00 1 1 Maternal Education (n=384) Unknown 13.25 0.429 1.52 (0.54-4.33) 0.53 9.70 (0.24-2.11) Elementary or less 13.53 0.000 2.49 (1.51-4.09) 0.97 8.99 (0.46-2.11) High school complete 13.28 0.047 1.65 (1.01-2.72) 0.88 1.05 (0.56-1.97) Higher education 12.96 1 1
Table 3: Menstrual cycle pattern of adolescents at selected high schools in Addis Ababa, Ethiopia, January - May 2017 GC (n=400)
Age (years) Frequency Percent Cumulative Percent
Length of Menstrual cycle (days) < 21 77 19.3 19.3 21-28 211 52.8 72.0 29-35 89 22.3 94.3 >35 23 5.8 100.0 Duration of flow (days) < 3 4 1.0 1.0 3 – 5 282 70.5 71.5 6-8 114 28.5 100 Regularity of menstrual cycle Regular 203 50.7 50.7 Not regular 197 49.3 100.0 Number of sanitary pads used per day 1-2 179 44.8 44.8 3-4 199 49.7 94.6 >4 22 5.5 100
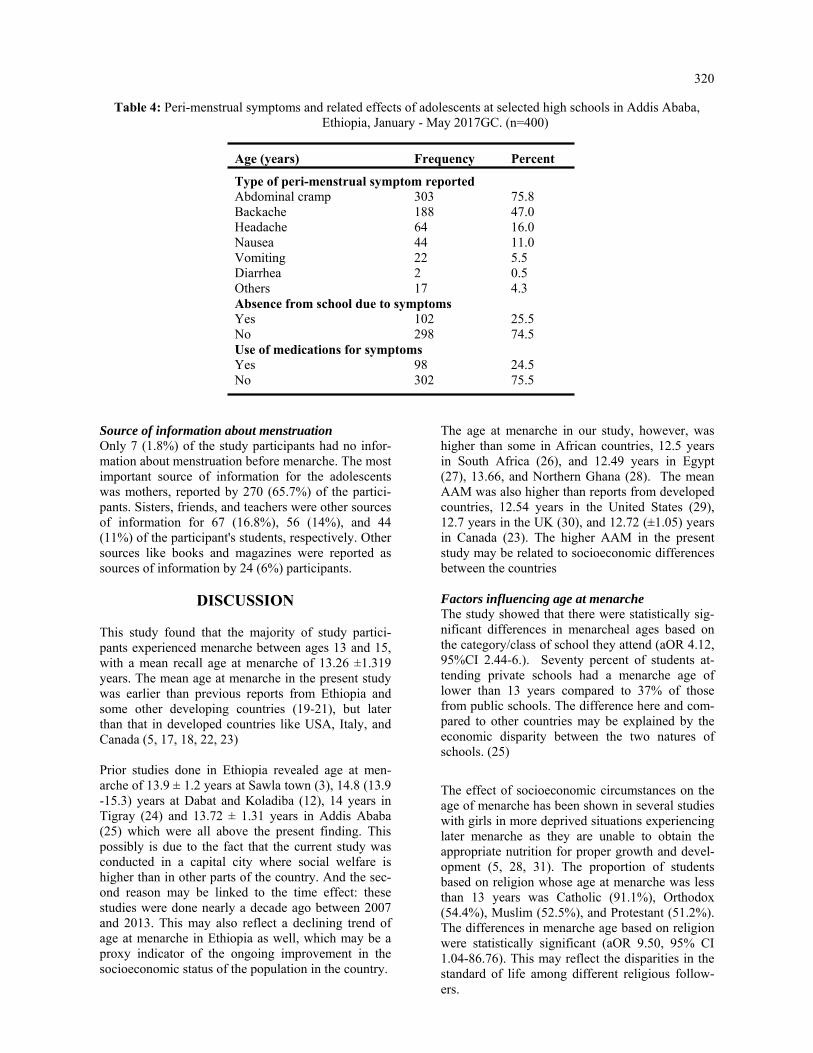
320
Table 4: Peri-menstrual symptoms and related effects of adolescents at selected high schools in Addis Ababa, Ethiopia, January - May 2017GC. (n=400)
Age (years) Frequency Percent
Type of peri-menstrual symptom reported Abdominal cramp 303 75.8 Backache 188 47.0 Headache 64 16.0 Nausea 44 11.0 Vomiting 22 5.5 Diarrhea 2 0.5 Others 17 4.3 Absence from school due to symptoms Yes 102 25.5 No 298 74.5 Use of medications for symptoms Yes 98 24.5 No 302 75.5
Source of information about menstruation Only 7 (1.8%) of the study participants had no infor-mation about menstruation before menarche. The most important source of information for the adolescents was mothers, reported by 270 (65.7%) of the partici-pants. Sisters, friends, and teachers were other sources of information for 67 (16.8%), 56 (14%), and 44 (11%) of the participant's students, respectively. Other sources like books and magazines were reported as sources of information by 24 (6%) participants.
DISCUSSION This study found that the majority of study partici-pants experienced menarche between ages 13 and 15, with a mean recall age at menarche of 13.26 ±1.319 years. The mean age at menarche in the present study was earlier than previous reports from Ethiopia and some other developing countries (19-21), but later than that in developed countries like USA, Italy, and Canada (5, 17, 18, 22, 23) Prior studies done in Ethiopia revealed age at men-arche of 13.9 ± 1.2 years at Sawla town (3), 14.8 (13.9-15.3) years at Dabat and Koladiba (12), 14 years in Tigray (24) and 13.72 ± 1.31 years in Addis Ababa (25) which were all above the present finding. This possibly is due to the fact that the current study was conducted in a capital city where social welfare is higher than in other parts of the country. And the sec-ond reason may be linked to the time effect: these studies were done nearly a decade ago between 2007 and 2013. This may also reflect a declining trend of age at menarche in Ethiopia as well, which may be a proxy indicator of the ongoing improvement in the socioeconomic status of the population in the country.
The age at menarche in our study, however, was higher than some in African countries, 12.5 years in South Africa (26), and 12.49 years in Egypt (27), 13.66, and Northern Ghana (28). The mean AAM was also higher than reports from developed countries, 12.54 years in the United States (29), 12.7 years in the UK (30), and 12.72 (±1.05) years in Canada (23). The higher AAM in the present study may be related to socioeconomic differences between the countries Factors influencing age at menarche The study showed that there were statistically sig-nificant differences in menarcheal ages based on the category/class of school they attend (aOR 4.12, 95%CI 2.44-6.). Seventy percent of students at-tending private schools had a menarche age of lower than 13 years compared to 37% of those from public schools. The difference here and com-pared to other countries may be explained by the economic disparity between the two natures of schools. (25)
The effect of socioeconomic circumstances on the age of menarche has been shown in several studies with girls in more deprived situations experiencing later menarche as they are unable to obtain the appropriate nutrition for proper growth and devel-opment (5, 28, 31). The proportion of students based on religion whose age at menarche was less than 13 years was Catholic (91.1%), Orthodox (54.4%), Muslim (52.5%), and Protestant (51.2%). The differences in menarche age based on religion were statistically significant (aOR 9.50, 95% CI 1.04-86.76). This may reflect the disparities in the standard of life among different religious follow-ers.

321
Menstrual pattern Menstruation may be associated with various kinds of symptoms occurring before and during menses. In this study, the most common symptoms experienced by the students were dysmenorhea (abdominal cramps) 75.8 %, backache 47.0 %, and headache 16%. This finding is comparable to studies done in Ethiopia (3), India (32) and Malasya (33). Dysmenorrhea was a major cause of school absenteeism 25.5%). The school absen-teeism due to dysmenorhea in this study was higher than in Indian study (34), comparable to a Saudi Ara-bian study (35), but less than reports from Ethiopia (12)), Malaysia 33 and USA (36) It is important that school girls are given adequate counselling and offered proper guidance on dysmenorhea and other perimen-strual symptoms.. Menstrual cycle abnormalities (irregular and longer cycles) are more common among younger girls in the first few years after menarche. 12 = (10) In this study abnormal menstrual cycle lengths occurred in 25.1 % of our respondents, which is in the range of 13.2 % to 37.2 % noted in some studies. (33, 37) Conclusion and implications The mean age at menarche of the respondents in this study was 13.26 ±1.319 years. This age at menarche was earlier than prior reports from Ethiopia. Socioeco-nomic status was identified as a factor significantly associated with the age at menarche. Dysmenorrhea was the commonest perimenstrual symptom. Sociodemographic attributes may be a marker for the age of menarche and symptoms. Prospective studies are needed to better understand the influence of bio-logical markers and the age at which young girls begin their menstrual cycle and the symptoms they experi-ence.
Limitation of the study The study population is not representative of the population of the country. Thus outcomes of the study may not be generalizable to the general population. Availability of Data The datasets used and/or analyzed during the cur-rent study are available from the corresponding author upon reasonable request. Conflict of Interest All authors declare that they have no competing interests. Contribution of Authorship EK designed and implemented the study. This included seeking IRB approval, collecting data, and cleaning data. EK reviewed the reference articles and wrote the initial manuscript. EM contributed to data analysis, constructed summary tables, and wrote the final manuscript. MS con-tributed to initial manuscript writing and data analysis.
ACKNOWLEDGMENT
We extend our special thanks to the Centre for International Reproductive Health Training (CIRHT) at the University of Michigan, USA, for providing financial support to undertake the study. Its contents are solely the responsibilities of the authors and do not necessarily reflect the official views of the CIRHT.
REFERENCES 1. Ersoy B, Balkan C, Gunay T, Egemen A. The factors affecting the relation between the menarcheal age of
mother and daughter. Child: care, health and development. 2005 May 1; 31(3):303–8. 2. Cole TJ: The secular trend in human physical growth: a biological view. Economics and Human Biology
2003, 1:161-68. 3. Ayele E, Berhan Y. Age at menarche among in-school adolescents in Sawla Town, South Ethiopia. Ethiop J
Health Sci. 2013;23(3):189-200. 4. Amir DJ, M. R.Bribiescas, R. G. A Longitudinal Assessment of Associations between Adolescent Environ-
ment, Adversity Perception, and Economic Status on Fertility and Age of Menarche. PLoS One. 2016;11(6). 5. Chumlea WC, Schubert CM, Roche AF, Kulin HE, Lee PA, Himes JH, et al. Age at menarche and racial com-
parisons in US girls. Pediatrics. 2003 Jan 1; 111(1):110–13. PMID: 12509562 6. Swenson I, Havens B. Menarche and menstruation: a review of the literature. J Community Health Nurs.
1987;4(4):199–210.
7. Thomas F, Renard F, Benefice E, de Meeüs T, Guegan JF. International variability of ages at menarche and menopause: patterns and main determinants. Hum Biol.2001;73(2):271–90.

322
8. P K. Pubertal development in girls: secular trends. Current Opinion in Obstetrics & Gynecology. 2006; 18(5):487-491.
9. Wyshak G, Frisch RE. Evidence for a secular trend in age of menarche. N Engl J Med. 1982; 306:1033–5. 10. Bagga A, Kulkarni S. Age at menarche and secular trend in Maharashtrian (Indian) girls. Acta Biologica
Szeged. 2000;44(1-4):53–7. 11. Ambade R, Sagdeo M. Age at menarche and the menstrual pattern of secondary school adolescents in central
India. Int J Res Med Sci 2017; 5:3610-4. 12. Zegeye DT, Megabiaw B, Mulu A. Age at menarche and the menstrual pattern of secondary school adoles-
cents in northwest Ethiopia. BMC women's health. 2009; 9(1):29. 13. Apter D, Viinikka L, Vihko R: Hormonal pattern of adolescent menstrual cycles. J Clin Endocrinol Metab
1978, 47(5):944–954. 14. Chan SS, Yiu KW, Yuen PM, Sahota DS, Chung TK: Menstrual problems and health-seeking behaviour in
Hong Kong Chinese girls. Hong Kong Med J 2009, 15(1):18–23. 15. Treloar AE, Boynton RE, Behn BG, Brown BW: Variation of the human menstrual cycle through reproductive
life. Int J Fertil 1967, 12(1 Pt 2):77–126. 16. Vollman RF: The menstrual cycle. Major Probl Obstet Gynecol 1977, 7:1–193. 17. Rigon F, Bianchin L, Bernasconi S, Bona G, Bozzola M, Buzi F, Cicognani A, De Sanctis C, De Sanctis V,
Radetti G, Tatò L, Tonini G, Perissinotto E: Update on age at menarche in Italy: toward the leveling off of the secular trend. J Adolesc Health 2010, 46(3):238–244.
18. Rigon F, De Sanctis V, Bernasconi S, Bianchin L, Bona G, Bozzola M, et al. Menstrual pattern and menstrual disorders among adolescents: an update of the Italian data. Ital J Pediatr. 2012; 38-38.
19. Ameade EPK, Garti HA (2016) Age at Menarche and Factors that Influence It: A Study among Female Uni-versity Students in Tamale, Northern Ghana. PLoS ONE 11(5): e0155310. doi:10.1371/journal.pone.0155310,
20. Tunau KA, Adamu AN, Hassan MA, Ahmed Y, Ekele BA. Age at menarche among school girls in Sokoto, Northern Nigeria. Annals of African medicine. 2012; 11(2):103–7. doi: 10.4103/1596-3519. 93533 PMID: 22406670.
21. Padez C. Age at menarche of schoolgirls in Maputo, Mozambique. Annals of human biology. 2003 Jan 1; 30(4):487–95. PMID: 12881146
22. Carfagna M, Figurelli E, Matarese G, Matarese S. Menarcheal age of schoolgirls in the district of Naples, It-aly, in 1969–70. Human Biology. 1972 Feb 1:117–25.
23. Al-Sahab B, Ardern CI, Hamadeh MJ, Tamim H. Age at menarche in Canada: results from the National Lon-gitudinal Survey of Children & Youth. BMC Public Health. 2010 Nov 28; 10(1):736.
24. Bayray A. Assessment of Menstrual Perceptions and Preparation of Rural Adolescent Females, South Eastern Zone of Tigray, Ethiopia. Scholarly Journal of Medicine. 2011;1:12-21.
25. Abera Y. Menarche, Menstruation related Problems and Practices among Adolescent High School Girls in Addis Ababa. Medicine. 2003;Corpus ID: 78417016.
26. Laura L, Jones PLG, Shane A Norris, John M Pettifor, Noël Cameron Age at Menarche and the Evidence for a Positive Secular Trend in Urban South Africa. Am J Hum Biol. 2009; 21(1):130-2.
27. Hatem I. Abdelmoty MY, corresponding author Shimaa abdallah, Khaled Abdel-Malak, Nawara M. Hashish, Dalia Samir, Moutafa Abdelbar, Ahmed Naguib Hosni, Mohamed Abd-El Ghafar, Yasser Khamis, and Mo-stafa Seleem. Menstrual patterns and disorders among secondary school adolescents in Egypt. A cross-sectional survey. BMC women's health. 2015; 15: 70.
28. Evans Paul Kwame AG, Helene Akpene. Age at Menarche and Factors that Influence It: A Study among Fe-male University Students in Tamale, Northern Ghana. PLoS ONE 2016; 11(5).
29. Demerath EW, Towne B, Chumlea WC, Sun SS, Czerwinski SA, Remsberg KE, et al. Recent decline in age at menarche: The Fels Longitudinal Study. American Journal of Human Biology. 2004; 16(4): 453-7.
30. Morris DH, Jones ME, Schoemaker MJ, Ashworth A, Swerdlow AJ. Determinants of age at menarche in the UK: analyses from the Breakthrough Generations Study. Br J Cancer. 2010; 103 (11): 1760-4.
31. KarapanouO PA. Determinants of menarche. Reprod Biol Endocrinol. 2010;30;8 (115):20920296. 32. Singh A, Kiran D, Singh H, Nel B, Singh P, Tiwari P: Prevalence and severity of dysmenorrhea: a problem
related to menstruation, among first and second year female medical students. Indian J Physiol Pharmacol 2008, 52(4): 389–397.)
33. Lee LK CP, Le KK, Kaur J. Menstruation among adolescent girls in Malaysia: a cross sectional survey. Singa-pore Med J. 2006; 47(10):869-74.
34. Dharampal G. D., Sanjay V. W., Jayesh Y. D. Age at Menarche and Menstrual Cycle Pattern among School Adolescent Girls in Central India. Global Journal of Health Science Vol. 4, No. 1; January 2012. doi:10.5539/gjhs.v4n1p105 URL: http://dx.doi.org/10.5539/gjhs.v4n1p105 ).

323
35. Ibrahim N AM, Al-Shaibani A, AlAmri F, Alharbi H, Al-Jadani A, Alfaidi R. Dysmenorrhea among female medical students in king Abdulaziz University: prevalence, predictors and outcome. Pak J Med Sci. 2015; 31(6): 1312-7.
36. Banikarim C, Chacko MR, Kelder SH: Prevalence and Impact of Dysmenorrhea on Hispanic Female Adoles-cents. Arch Pediatr Adolesc Med 2000, 154(12):1226-1229.
37. Houston AM AA, Huang Z, D'Angelo LJ. Knowledge, attitudes, and consequences of menstrual health in ur-ban adolescent females. Pediatr Adolesc Gynecol. 2006;19(4):271-5.

325
Tassew Tefera, Dessie Abera, Dejenie Shiferaw Teklu, Mistire Wolde. Ethiop Med J, 2021, Vol. 59, No. 4
ORIGINAL ARTICLE
INTESTINAL PARASITES AND RISK AWARENESS OF PEOPLE LIVING WITH HIV/AIDS IN DEBRE BREHAN REFERRAL HOSPITAL,
DEBRE BREHAN, ETHIOPIA
Tassew Tefera1*, Dessie Abera2, Dejenie Shiferaw Teklu3, MistireWolde2
ABSTRACT
Introduction: Intestinal parasites are a significant cause of morbidity and mortality in most developing countries which affected more than 3.5 billion people throughout the world. The prevalence of intestinal parasites is rela-tively high in people living with HIV/AIDS. However, data on the prevalence of intestinal parasites among people living with HIV/ AIDS are insufficient in the study area. Hence, this study aimed to determine the prevalence of intestinal parasites and associated risk factors among people living with HIV/AIDS at Debre Brehan Referral Hos-pital, Central Ethiopia. Methods: A cross-sectional study was conducted among 350 people living with HIV/AIDS from March to August 2019. Stool samples were collected with clean screw cupped containers and processed using direct microscopy, formol-ether concentration and modified acid-fast staining laboratory techniques. Results: The overall prevalence of intestinal parasites among HIV/AIDS patients was 20.3% (71/350). Among these, Entamoeba histolytica/dispar takes the highest rank (13.4%) followed by Gardia lamblia (2.9%). Lack of latrine, high viral load count, and bad health practice of the participants were significantly associated with intesti-nal parasitosis. Conclusion: The prevalence of intestinal parasites in this study was high. Thus to reduce the disease burden; gov-ernment officials and stakeholders should work on reducing risk factors and increase awareness how to prevent and control of acquiring the disease. Key words: Intestinal parasites, HIV/AIDS, Prevalence, Debre Brehan, Ethiopia.
INTRODUCTION
Intestinal parasitosis (IPs) is a gastrointestinal infection caused by helminthes (multicellular) and protozoa (unicellular) (1, 2). Epidemiological studies indicate that both helminthes and protozoa are prevalent in de-veloping countries whereas protozoan parasites are more dominant in developed countries (3, 4). More than 3.5 billion people are affected with intestinal para-sites (IP) in the world, among which 450 million are in sub-Saharan Africa, affected by associated morbidities (5-7). Parasitic co-infection with Human Immunodefi-ciency Virus/Acquired Immunodeficiency Syndrome (HIV/AIDS) is the major public health crisis of the world, mainly in Sub-Saharan Africa (8). The most common type of helminthes that are strongly associated with morbidity and mortality of HIV/AIDS patients are: Ascaris lumbricoides, Trichuris trichiuria, Hookworm and Strongyloid stercoralis that occupy the human intestine (9-11), whereas Entamoeba histo-lytica/dispar and Giardia lambellia are the dominant species among protozoans (1).
Protozoan parasites are also the foremost prevalent in tropical and subtropical regions of the develop-ing world where water and sanitation facilities are insufficient (12-16). The main transmission mode of IPs is feco-oral route due to poor personal hy-giene and environmental contaminations (17). More importantly, improper disposal of human excreta in Sub-Saharan countries like Ethiopia is the major contributing factor for the increased dis-tribution of IPs (18). HIV/AIDS patients with poor knowledge, and bad health practices for IP infec-tion prevention and control are more susceptible to opportunistic and non-opportunistic parasitic infec-tions (19, 20).
There are about 36.9 million people infected with HIV/AIDS globally; among these Sub-Saharan Africa accounts for more than half (22.4 million) (14, 21), and where Ethiopia had a prevalence of 2.4% (8, 22). Moreover, HIV infection results in weakening of the human immune system which leads to the occurrence of opportunistic infections (OIs) (21-25).
1Department of Medical Laboratory Sciences, College of Medicine, Debre Brehan University, Debre Brehan, Ethiopia. 2Department of Medical Laboratory Sciences, College of Health Sciences, Addis Ababa University, Ad-dis Ababa, Ethiopia. 3Department of Clinical Bacteriology and Mycology National Reference Laboratory, Ethiopian Public Health Institute, Addis Ababa, Ethiopia. *Corresponding Author E-mail: [email protected]
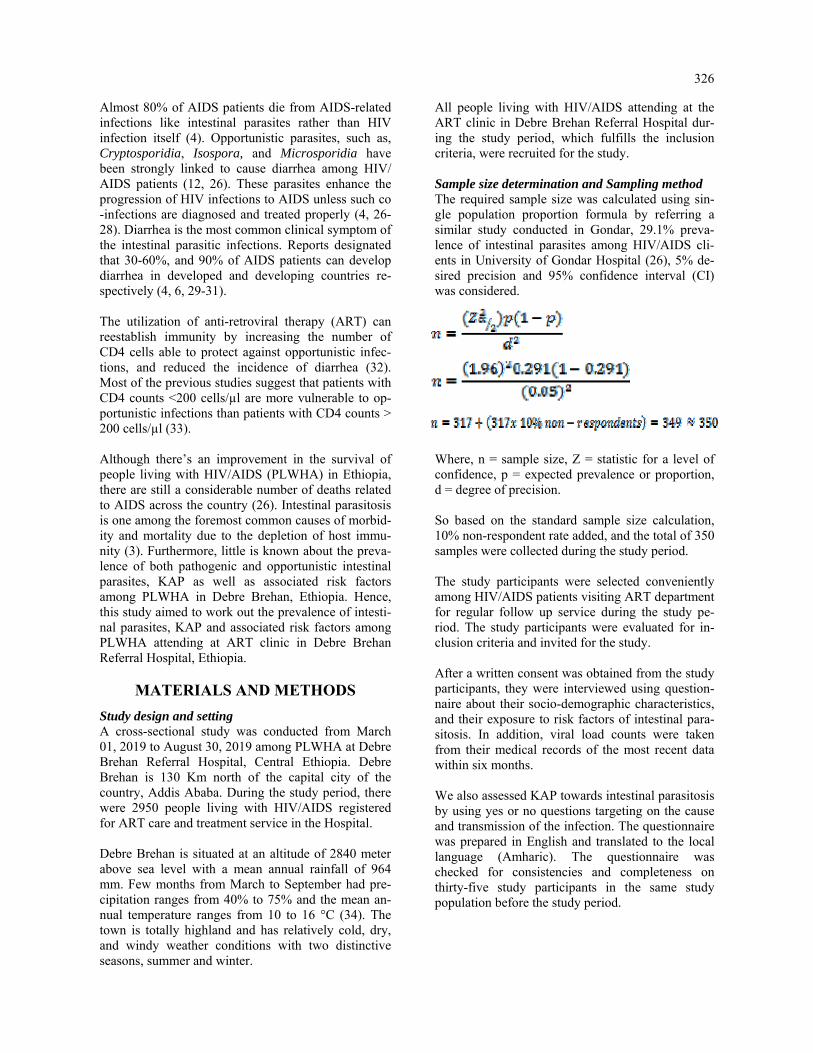
326
Almost 80% of AIDS patients die from AIDS-related infections like intestinal parasites rather than HIV infection itself (4). Opportunistic parasites, such as, Cryptosporidia, Isospora, and Microsporidia have been strongly linked to cause diarrhea among HIV/AIDS patients (12, 26). These parasites enhance the progression of HIV infections to AIDS unless such co-infections are diagnosed and treated properly (4, 26-28). Diarrhea is the most common clinical symptom of the intestinal parasitic infections. Reports designated that 30-60%, and 90% of AIDS patients can develop diarrhea in developed and developing countries re-spectively (4, 6, 29-31). The utilization of anti-retroviral therapy (ART) can reestablish immunity by increasing the number of CD4 cells able to protect against opportunistic infec-tions, and reduced the incidence of diarrhea (32). Most of the previous studies suggest that patients with CD4 counts <200 cells/µl are more vulnerable to op-portunistic infections than patients with CD4 counts > 200 cells/µl (33). Although there’s an improvement in the survival of people living with HIV/AIDS (PLWHA) in Ethiopia, there are still a considerable number of deaths related to AIDS across the country (26). Intestinal parasitosis is one among the foremost common causes of morbid-ity and mortality due to the depletion of host immu-nity (3). Furthermore, little is known about the preva-lence of both pathogenic and opportunistic intestinal parasites, KAP as well as associated risk factors among PLWHA in Debre Brehan, Ethiopia. Hence, this study aimed to work out the prevalence of intesti-nal parasites, KAP and associated risk factors among PLWHA attending at ART clinic in Debre Brehan Referral Hospital, Ethiopia.
MATERIALS AND METHODS
Study design and setting A cross-sectional study was conducted from March 01, 2019 to August 30, 2019 among PLWHA at Debre Brehan Referral Hospital, Central Ethiopia. Debre Brehan is 130 Km north of the capital city of the country, Addis Ababa. During the study period, there were 2950 people living with HIV/AIDS registered for ART care and treatment service in the Hospital. Debre Brehan is situated at an altitude of 2840 meter above sea level with a mean annual rainfall of 964 mm. Few months from March to September had pre-cipitation ranges from 40% to 75% and the mean an-nual temperature ranges from 10 to 16 °C (34). The town is totally highland and has relatively cold, dry, and windy weather conditions with two distinctive seasons, summer and winter.
All people living with HIV/AIDS attending at the ART clinic in Debre Brehan Referral Hospital dur-ing the study period, which fulfills the inclusion criteria, were recruited for the study. Sample size determination and Sampling method The required sample size was calculated using sin-gle population proportion formula by referring a similar study conducted in Gondar, 29.1% preva-lence of intestinal parasites among HIV/AIDS cli-ents in University of Gondar Hospital (26), 5% de-sired precision and 95% confidence interval (CI) was considered.
Where, n = sample size, Z = statistic for a level of confidence, p = expected prevalence or proportion, d = degree of precision. So based on the standard sample size calculation, 10% non-respondent rate added, and the total of 350 samples were collected during the study period. The study participants were selected conveniently among HIV/AIDS patients visiting ART department for regular follow up service during the study pe-riod. The study participants were evaluated for in-clusion criteria and invited for the study. After a written consent was obtained from the study participants, they were interviewed using question-naire about their socio-demographic characteristics, and their exposure to risk factors of intestinal para-sitosis. In addition, viral load counts were taken from their medical records of the most recent data within six months. We also assessed KAP towards intestinal parasitosis by using yes or no questions targeting on the cause and transmission of the infection. The questionnaire was prepared in English and translated to the local language (Amharic). The questionnaire was checked for consistencies and completeness on thirty-five study participants in the same study population before the study period.
327
Inclusion and exclusion criteria All HIV/AIDS patients registered for ART follow up program and volunteer to participate in the study were included, while those who were on anti-parasitic ther-apy within the last two weeks, those who registered for ART service with less than six months and didn’t have viral load count within the last six (6) months were excluded from the study. Laboratory Diagnosis Methods for Stool Sample Stool sample collection Instruction was given to each study participant not to contaminate the stool with urine, water and soil. In addition, they are also informed to collect forty gram of fresh stool sample or 10 ml of diarrheic sample with clean, wide mouthed, grease free and screw cupped plastic containers. Moreover, emphasis was given to diarrhea stool samples by giving priority due to its less time stability of trophozoites in the diarrheal stool sample. Besides, formed and semi-formed stool samples were preserved by 10% formalin for further examination by microscope and concentration tech-niques in case of unavoidable delay. Direct wet mount, Formol-ether concentration and smear for modified acid-fast staining techniques were performed as per the standard operating procedures (SOP) of each method soon after collection within 30 minutes (35) (see supporting information for detail of SOP). Direct microscopy A stool sample was collected in a labeled cup from all study participants and a direct saline wet mount of each sample was done immediately at the laboratory for motile trophozoites, ova, cyst, and larvae stage of intestinal parasites. The wet mounts were examined under a light microscope at 10X eye pieces and 40X objective (36). Formol- Ether concentration technique Formol-ether sedimentation technique, in which para-sites are concentrated by centrifugal force, was ap-plied to concentrate the parasite. Briefly, one gram of stool sample was placed in a clean 15ml volume ca-pacity conical centrifuge tube containing 7ml 10% formalin and stirred with an applicator stick. The re-sulting suspension was filtered through a sieve into another conical centrifuge tube. After adding 3ml of diethyl ether to the stool containing formalin suspen-sion, it was centrifuged at 3200 rpm for 3 minutes. The supernatant was poured away and the tube was being placed in its rack. Finally, the smear was pre-pared on clean grease-free microscope slide from the sediment, covered with cover slide and observed un-der a microscope with a magnification of 10x eye-pieces and 40x objective (12, 35).
Modified Ziehl Nelson method A small portion of the fresh stool sample was proc-essed for the detection of opportunistic parasites using the modified Ziehl Nielsen method. Briefly, the thin smear was prepared directly from the sedi-ment of concentrated stool and allowed to air dry. Then the slides were fixed with methanol for 5 min-utes and it was stained with 1% carbol fuchsine for 30 minutes. After washing the slides with tap water, slides were being decolorized with 1% acid alcohol for 1–3 minutes and stained with 0.5% methylene blue for 1 minute. The slides were then washed with tap water and observed under a light microscope with a total magnification of 1000X (12). Slides were rechecked by senior experts at the Ethiopian public health institute (EPHI). Data Analysis The data were entered and analyzed using SPSS version-20 software. Descriptive and logistic regres-sion statistics were used for data analysis. The mean, percentage, and frequency were used to see the distribution. The relative contribution of inde-pendent variables for the outcome variables was assessed using logistic regression. A P-value of less than 0.05 was considered as a statistically signifi-cant association between the presence of intestinal parasites and each contributing factor. The results of our findings were presented in text, graphs, and tables. Quality Assurance The questionnaires were checked for their consis-tencies and completeness on thirty-five study par-ticipants in the same study population before the study period. Internal quality control was also per-formed for each of laboratory techniques based on the quality control policy of Debre Brehan Referral Hospital Laboratory.
Operational Definition Good knowledge: Individuals who answered ≥50% of the knowledge questions in the questionnaire. Poor knowledge: Individuals who answered <50% of the knowledge questions. Positive attitude: Individuals who answered ≥50% of the attitude questions. Negative attitude: Individuals who answered <50% of the attitude questions. Good practice: Individuals who answered ≥50% of the practice questions that supports IP prevention activities. Bad practice: Individuals who answered <50% of the practice questions. Intestinal parasitosis: A gastrointestinal infection caused by intestinal parasites

328
Ethical consideration Ethical approval was obtained from ethical review committee of the Department of Medical Laboratory Sciences, College of Health Sciences, Addis Ababa University with a reference number MLS/02/2019. Permission letter was obtained from the institutional review board of Debre Brehan Referral Hospital. Written informed consent was taken from each study participants, and for children between 12 and 18 years old, both consent and assent were taken from their parents / guardians and children themselves respec-tively. The study participants were informed about their right to refuse or participate in the study, and withdraw at any time during the study period without affecting their right to access other health services. All personal information was kept confidential, and those who were positive for intestinal parasite were linked to the attending physician for further clinical manage-ment.
RESULTS
Socio-demographic characteristics of the study population A total of 350 study participants living with HIV/AIDS were enrolled in the study. Of which 46.6% were males and 77.7% were urban residents. The mean ± SD age of study participants’ was 37.04 ±12.99 years, ranged from 6-80 years (Table 1). Prevalence of intestinal parasites The overall prevalence of IP among people living with HIV/AIDS attending at the ART clinic in Debre Bre-han Referral Hospital was 20.3% (71/350). Among these, E. histolytica/dispar accounted for the highest rank 47 (13.4%) followed by G. lamblia 10 (2.9%). Hookworm, Ascaris lumburcoids, Hymenolepis nana, Tanea species and Strongyloid stercoralis accounted the least frequency of infection having proportion of 3 (0.8%), 3 (0.8%), 2 (0.6%), 2 (0.6%) and 1 (0.3%) respectively. Distribution of helminthes was dominated by proto-zoan parasites which accounted for protozoa 61 (82.4%) and helminthes 13 (17.6%). Most of the intes-tinal parasitic infections were single infections 68 (95.8%). On the other hand, multiple infections were seen in 3 (4.2%) of the study participants. Two of the co-infections were E. histolytica/dispar with Hook-worm and one was E. histolytica/dispar with G. lamblia. In this study, no opportunistic parasite was identified (Fig. 1).
Variables Frequency Percent Gender
Male
163
46.6
Female 187 53.4 Residence Urban 272 77.7
Rural 78 22.3 Age group <= 15 8 2.3
16-30 123 35.1 31-45 138 39.4 46-60 67 19.1 >= 60 14 4.0
Marital status
Married 220 62.9 Single 91 26 Divorced 31 8.9 Wid-owed
8 2.3
Educa-tional status
No read-ing and writing
34 9.7
Reading and writ-ing
41 11.7
Grade 1 - 8 com-plete
110 31.4
Grade 9 - 12 com-plete
96 27.4
College and above complete
69 19.7
Occupation Agricul-ture
52 14.9
Merchant 59 16.9 Office work
58 16.6
Daily wage laborer
49 14
Student 44 12.6 Driver 29 8.3 House wife
47 13.4
Table 1: Socio-demographic characteristics of PLWHA at Debre Brehan, Ethiopia, 2019.

329
Association of intestinal parasite infection with socio-demographic and other risk factors As shown in the socio-demographic characteristics features of our study participants (Table 1) most of the study participants were urban residents (77.7%) and had the occupational status of trade and office work, 16.9% and 16.6% respectively. From all study participants, 334 (97.7%) had regular hand washing habit with soap before and after the meal, and 323 (94.6%) of them had latrine. Among all participants, 319 (93.4%) had regular water supply and washed their hands after the toilet frequently. Most of the study participants had pure/tape water supply (88.8%), vegetable feeding habits (68.9%), raw meat eating habits (58.3%), and animal contacts in their living settings (60%) (Table 2). Multivariate analysis was done to know the associa-tion of the potential confounding factors such as place of residence, type of occupation, presence of latrine/toilet, source of water supply, and viral load levels with intestinal parasitosis. As a result, only the viral load level and availability of latrine showed a signifi-cant association. People living with HIV/AIDS who had viral load count >1000 cps/ml were almost four times more likely to develop parasitic infection than those who had viral load count results TND (target not detected) (AOR = 4.2, 95% CI: 1.4, 12.4) and those who did not have latrine were four times more likely to acquire intestinal parasite infection than those who had latrine in their home (AOR = 3.97, 95% CI: 1.3, 11.84) (Table 2).
Knowledge, attitude and practice of study partici-pants towards intestinal parasitosis Among all study participants, those whose age was greater than 15 years were interviewed for their knowledge, attitude, and practice towards intestinal parasitosis, N= 342 (97.7%). In general from these interviewed participants; 182 (53.2) had good knowledge about intestinal parasitosis, its transmis-sion, and prevention mechanisms. Only 66 (19.3%) of the study participant understood the relationship between intestinal parasitosis and HIV/AIDS that all responded as HIV/AIDS increases the morbidity due to intestinal parasitosis (table 3). Among 342 study participants, 260 (76%) consid-ered IP infection as a communicable disease. The majority of them, 255 (72.9%) agreed on the trans-mission from person to person. From all respon-dents, 199 (58.2%) believed that HIV/AIDS in-creases the risk of acquiring intestinal parasite in-fection, and 147 (43%) believed that using antiretro-viral treatment prevents intestinal parasite infection (table 4). From study participants who responded for practice questions, 337 (98.5%) had regular hand washing habit with soap before and after the meal. The par-ticipants who had latrine were 323 (94.4%). Among all respondents, 303 (88.6%) had pure/tape water supply for drinking and sanitary use. The proportion of vegetable feeding habits of the study participant were about 237 (68.9%); of them, 211 (89%) ate vegetable by cooking (table 5).

330
Table 2: Prevalence of Intestinal parasitic infections with regards to socio-demographic information and other associated risk factors among PLWHA, Debre Brehan, Ethiopia, 2019.
TND: Target not detected, cps/ml: copies/milliliter, COR: Crude odd ratio, AOR: Adjusted odd ratio, CI: confi-dence interval, * statistically significant
Characteristics Intestinal parasite COR (95% CI)
P-value AOR (95% CI)
P- value Positive (%)
Negative (%)
Sex Male 36 (22.1) 127 (77.9) 1
Female 35 (18.7) 152 (81.3) 0.81(0.48, 1.37)
0.43
Age group ≤15 2 (25) 6 (75) 1.24(0.24, 6.53)
0.79
16-30 26 (21.1) 97 (78.9) 1
31-45 25 (18.1) 113 (81.9) 0.83(0.45, 1.5) 0.54
46-60 14 (20.9) 53 (79.1) 0.98(0.47, .05) 0.97
≥60 4 (28.6) 10 (71.4) 1.49(0.43, 5.1) 0.53 Residence Urban 46 (16.9) 226 (83.1) 1 1
Rural 25 (32.1) 53 (67.9) 2.3(1.3, 4.1) 0.004 1.45(0.55,3.86)
0.45
Educational status
Unable to read and write
8 (23.5) 26 (76.5) 1.21(0.45, 3.24)
0.71
Read and write 9 (22) 32 (78) 1.1(0.43, 2.84) 0.83
Grade 1-8 22 (20) 88 (80) 0.98(0.46, 2.1) 0.96 Grade 9-12 18 (18.8) 78 (81.2) 0.9(0.42, 1.97) 0.8
College and above
14 (20.3) 55 (79.7) 1
Occupational status
Farmer 19 (36.5) 33 (63.5) 3.13(1.3, 7.8) 0.014 1.5(0.45, 5.1) 0.5
Merchant 13 (22) 46 (78) 1.54(0.6, 3.94) 0.37 1.33(0.5, 3.6) 0.57
Daily worker 5 (10.2) 44 (89.8) 0.62(0.19, 1.99)
0.42 0.5(0.15, 1.6) 0.25
Student 10 (22.7) 34 (77.3) 1.6(0.59, 4.36) 0.357 1.37(0.48, 4.0)
0.56
Driver 6 (20.7) 23 (79.3) 1.42(0.45, 4.47)
0.55 1.5(0.48, 4.99)
0.47
House wife 9 (19.1) 38 (80.9) 1.29(0.47, 3.56)
0.62 0.85(0.28, 2.58)
0.78
Office work 9 (15.5) 49 (84.5) 1 1 Availability of latrine
Yes 58 (18) 265 (82) 1 1 No 11 (57.9) 8 (42.1) 6.21(2.4, 16.1) <0.001 3.97(1.33,
11.84) 0.013*
Source of water supply
Pipe 55(18.3) 248(81.7) 1 1
Pond 11(35.5) 20(64.5) 2.45(1.11,5.4) 0.026 1.1(0.4, 3.24) 0.83
Spring 3(37.5) 5(62.5) 2.67(0.62,11.5)
0.19 1.1(0.18, 6.1) 0.95
Viral load TND 44(17.7) 205(82.3) 1 1
<20 cps/ml 10(19.2) 42(80.8) 1.1(0.52, 2.4) 0.79 1.0(0.45, 2.27)
0.99
20-1000 cps/ml 9(30) 21(70) 1.99(0.86, 4.65)
0.11 2.4(0.94, 6.1) 0.07
>1000 cps/ml 8(42.1) 11(57.9) 3.4(1.3, 8.9) 0.013 4.2(1.4, 12.4) 0.009*

331
Table 3: Knowledge of PLWHA about transmission and prevention of intestinal parasitosis, Debre Brehan, Ethiopia, 2019.
Knowledge variables (Total no N) Yes number (%)
No number (%)
Knowledge about intestinal parasitosis (342) 200 (58) 142 (42) Knowledge about the relationship between intestinal parasitosis and HIV/AIDS (342)
66 (19.3) 276 (80.7)
Knowledge about the transmission ways of intestinal parasitosis (342) 189 (55.3) 153 (44.7) Source of information about intestinal parasitosis (200): Parent 20 (10) Friends 44 (22) Reading books and journals 95 (47.5) Mass media 41 (20.5) Response for the most common transmission ways of IP (189): By eating contaminated food 172 (91) By drinking contaminated water 16 (8.5) By lack of personal hygiene 1 (0.5) Knowledge about the best treatment for intestinal parasitosis (342): Medicine prescribed by Doctors 326 (95.3) Traditional medicine 13 (3.8) No treatment required 3 (0.9) Overall knowledge level Good knowledge(N=342) 182 (53.2) Poor knowledge (N=342) 160 (46.8)
Table 4: Attitude of PLWHA about transmission and prevention ways of IP infection, Debre Brehan, Ethiopia, 2019.
Attitude variables (N=342) Agree (No (%))
Disagree (No (%))
No idea (No (%))
IP infection is communicable disease. 260 (76) 9 (2.6) 73 (21.3)
IP infection can be transmitted from person to person 255 (72.9) 8 (2.3) 79 (22.6)
HIV/AIDS increases the risk of IP infection 199 (58.2) 15 (4.4) 128 (37.4)
IPI can cause severe complications and death if not treated 264 (77.2) 25 (7.3) 53 (15.5)
Use of antiretroviral treatment prevents IP infection 147 (43) 36 (10.5) 159 (46.5)
Use of toilet and good personal hygiene practice protects from IP infection
317 (92.7) 4 (1.2) 21 (6.1)
If not protected well, water can be a potential source of IPI 312 (91.2) 7 (2) 23 (6.8)
Raw meat should not be eaten, since it can transmit IPI 226 (66.1) 54 (15.8) 62 (18.1)
Without cooking, washing vegetables is enough to prevent IPI
63 (18.4) 240 (70.2) 39 (11.4)
IP infection can be acquired from animal and animal prod-ucts
266 (77.8) 4 (1.2) 72 (21)
Overall attitude level
Positive attitude (N=342) 289 (84.5)
Negative attitude (N=342) 53 (15.5)

332
Table 5: Practices of PLWHA related to prevention and control of IP infections, Debre Brehan, Ethiopia, 2019.
Practice variables (342) Yes (no(%) No (no(%)
Hand washing before and after meal (342) 337 (98.5) 5 (1.5) Availability of latrine (342) 323 (94.4) 19 (5.6) Type of latrine (323) Private 282 (87.3) Public 41 (12.7) Source of water supply (342) Pipe water 303 (88.6) Pond 31 (9.0) Spring 8 ( 2.4) Vegetable eating habit (342) 237 (69.3) 105 (30.7) Vegetable feeding methods (237) Raw vegetable without washing. 3 (1.3) By washing 23 (9.7) By cooking 211 (89) Raw meat eating habit (342) 145 (42.4) 197 (57.6) Animals living with humans (342) 206 (60.2) 136 39.8) Overall practice level Good practice (N=342) 314 (91.8) Bad practice (N=342) 28 (8.2)
This study showed that 182 (53.2%) of the study par-ticipants had good knowledge and 160 (46.8%) of the participants had poor knowledge, 289 (84.5%) had a positive attitude while 53 (15.5%) had a negative atti-tude and study participants also had good practice 314 (89.7%) and poor practice 28 (10.3%) about transmis-sion, prevention and control of intestinal parasites. Al-though the knowledge and attitude of study participants didn’t show an association, the overall performance of health practices was significantly associated with intes-tinal parasitosis. Persons who had poor health practices towards intestinal parasitosis were almost three times more likely to develop intestinal parasitosis than per-sons with good health practices related to transmission and prevention of IPI (AOR = 2.88, 95% CI: 1.2, 6.88).
DISCUSSION
This study determined the prevalence of intestinal para-sites, assessed potential associated risk factors and awareness of the study participants about the transmis-sion, prevention, and control of the disease in Debre Brehan, Central Ethiopia. In the present study, the overall prevalence of IP among PLWHA following ART treatment and care programs in the study area was 20.3% (71/350). This was relatively consistent with studies performed in Dessie Hospital on ART patients, Ethiopia (17.6%) (12), in Abuja, Nigeria (24.7%) (14), and Hospital of Kathmandu, Nepal (19.17%) (4). On the other hand, our finding was much lower compared to studies conducted in different parts of Ethiopia; Ar-baminch Hospital, (45.4%), East Gojjam, (36.8%), Bu-tajira, (35.9%) and Gondar Hospital, (28%) (3, 18, 26, 37).
Our findings were higher when it also compared with previous studies among non-HIV persons, revealed as IP infection in Kobo Health Center, 10%, 2014 (38), Debre Brehan Referral Hospital, 17.4%, 2014 (34) and Debre Brehan, 9.8%, 2016 (39) in Ethiopia. This variation in the magnitude of parasitic infection might be due to the difference in the geographical location of the study site, en-demicity of parasite, HIV status of the study par-ticipants, methodology, time gaps of the studies, and climatic conditions at different study sites. Also, the lower IP prevalence in our findings might be due to increment in awareness of PLWHA and improvements in the clinical man-agement system. The parasite distribution of single infections was observed in which E. histolytica/dispar (69.1%) showed higher proportion when compared to other studies in Dessie, Ethiopia (45.5%), East Gojjam, Ethiopia (24%), and Arbaminch, Ethiopia (7.4%) (3, 12, 18). However, the other parasite’s fre-quency in our study G. lamblia (14.7%), A.lumburcoids (4.4%), and S. stercoralis (1.5%) were lower than a study conducted in Dessie, East Gojjam, and Arbaminch(3, 12, 18). There was no opportunistic parasite in this study similar with the study conducted in Dessie (12), but studies in Ar-baminch, East Gojjam, and Butajira revealed the highest number of opportunistic parasitic infec-tions observed as 20%, 4.9%, and 8.7% respec-tively (3, 12, 18).

333
The difference in frequency of individual parasites might be due to the difference in geographical loca-tion, altitude, the climatic condition of study areas, and hygiene and sanitation practice of study popula-tion. Furthermore, the decrement of opportunistic in-fections especially Cryptosporidium species and I. belli suggested an increase in the health-seeking be-havior of the community. Intern resulted in good adherence of HIV/AIDS cli-ents to ART treatment and care programs. An im-provement in the immunologic conditions of the pa-tients and better response to infections also might be the reason. Opportunistic parasites were known to be resolved spontaneously with immune restoration among HIV/AIDS patients on ART (1). Study participants who had a viral load count >1000 cps/ml had higher IP infections when compared to patients with <1000 cps/ml viral load counts. In this study, study participants who had viral load count of > 1000 cps/ml were about four times more likely to be infected with intestinal parasites than those who had a viral load counts Target not detected (AOR = 4.2, 95% CI: 1.4, 12.4). This showed that increased viral load counts of the study participants contributed to the acquisition of intestinal parasite infections. The other association was with the availability of la-trine, where our study indicated that 323 (94.6%) of the study participants had latrine in their home. This study revealed that participants who did not have la-trine were four times more likely to be infected with intestinal parasite than those having latrine (AOR = 3.97, 95% CI: 1.33, 11.84). This result was in line with a study in Gondar, Ethiopia that study partici-pants didn’t have latrine were six times more likely infected with IP than those having latrine (AOR = 6.2, 95% CI: 1.75, 22.06) and also supported by a similar study in Dessie, Ethiopia that patients who did not have latrine had IP infections almost 8 times more likely than those having latrine (AOR = 7.56, 95% CI: 1.3, 44.2) (12). These relative comparable results sug-gested the similarities in accessibility and using habit of the toilet in those study sites. In this study, knowledge, attitude, and practice of the individual participants towards intestinal parasitosis were assessed using a structured questionnaire. As a result, 53.2% of study participants had good knowl-edge about transmission, distribution, and prevention of intestinal parasitosis and its association with HIV/AIDS whereas the remaining 46.8% had poor knowl-edge. About 189 (55.3%) of study participants knew the transmission ways of intestinal parasitosis. Of which, 172 (91%) understood that it was through eat-ing contaminated foods.
This result was slightly higher than the study con-ducted in Addis Ababa, Ethiopia in which 49.4% understood the transmission ways and 63.5% of them believed transmission was through contami-nated foods (40). This variation might be due to the socio-demographic difference of study participants and the time gap of studies. About 92.7% of study participants agreed that the use of toilets contributes to protecting individuals from intestinal parasitic infections or failure to use toilet exposes for the infection. This result was higher compared to the study in Asmara, Eritrea provided that 60.3% of study participants agreed that defecating in the open air or fail to use toilet contributes to intestinal para-sitic infections (20). The difference might be due to the difference in the pathological outcome of the endemic intestinal parasite species in the study sites. The current study revealed that 98.5% (337/342) of study participants had practiced hand washing be-fore a meal and 94.4% (323/342) of study partici-pants had a latrine. Of latrine users, 87.3% (282/323) had private latrine while 12.7% (41/323) had a public latrine. This result was higher com-pared to another study among street dwellers con-ducted in Addis Ababa, Ethiopia shown that 15.6% of the study participants practiced regular hand washing before a meal and 95% had a latrine. Of these latrine users, 56.5% had private latrine and 38.5% had public latrine (40). The difference might be due to variation in the economic and educational level of the study participants. Health practices of the study participants were sig-nificantly associated with intestinal parasitosis. Per-sons who had poor health practices towards intesti-nal parasitosis were almost three times more likely to develop intestinal parasitosis than persons with good health practices related to transmission and prevention of IPI (AOR = 2.88, 95% CI: 1.2, 6.88). Limitation of the study According to the current national treatment
protocol every person tested for HIV and re-sults become positive needs to start treatments immediately. Due to this reason, it was difficult to get any ART naïve PLWHA during the study period and unable to analyze the outcomes comparatively for both groups of ART status.
There was no CD4 count data available during the study period instead only viral load count had been used and analyzed.
Advanced molecular diagnostic methods were not implemented that would increase the detec-tion of opportunistic parasites.
Non-probability sampling method has been used in this study that limits the chance of get-ting equal opportunity of the participants to involve in the study.

334
Conclusion This study updated the prevalence of intestinal para-sites and associated risk factors among people living with HIV/AIDS following ART treatment in the study area. In the study E. histolytica/dispar and G. lamblia showed greater proportion of parasite distribution. The absence of latrine and increased viral load count for PLWHA were identified as the potential risk factors for the acquisition of intestinal parasitic infections. The study showed that most of the study participants had positive attitude, good practices and poor knowl-edge related to the transmission and prevention activi-ties of intestinal parasitosis. Health practices of the study participants related to transmission and preven-tion showed significant association with intestinal parasitosis. Thus to reduce the disease burden, the community health workers, other government offi-cials, and related stakeholder give attention on in-crease awareness of latrine use, importance of strict follow up of clinician advice which help to reduce viral load count, and avoid bad health practice, as well as encourage frequent diagnosis of patients to de-crease the burden of intestinal parasites among PLWHA.
ACKNOWLEDGMENTS
The authors acknowledge Addis Ababa University, College of Health Sciences, Department of Medical Laboratory Science that provides us ethical approval of the study.
Our gratitude also goes to Debre Brehan Referral Hospital administration for allowing the study in the institution, all DBRH Laboratory managers and staffs for their commitment to provide reagent and technical support, EPHI parasitology department staffs who did further confirmation of the stained slides willingly and Addis Ababa University library workers for their sincerely cooperation to provide any important reading materials and internet service that was very vital for this work. Our last but not the least recognition is to all study participants who were agreed to give their information as per the questionnaire and stool sample voluntarily. Supplementary Materials All supplementary materials used during the study are archived with this manuscript. These are: infor-mation sheet that enables the study participants to be introduced about the study, questionnaires that used to gather information from study participants, informed consent/assents that guarantees the per-mission of the participants to use their information/sample for the study and SOPs are the short descrip-tions of the procedures and principles of the labora-tory methods. Conflict of interest: The authors has no conflict of interest to declare.
REFERENCES
1. Cerveja BZ, Tucuzo RM, Madureira A, et al. Prevalence of Intestinal Parasites Among HIV Infected and HIV Uninfected Patients Treated at the 1 De Maio Health Centre in Maputo, Mozambique. EC Microbiol. 2017;9(6):231-40. 2. Norhayati M, Fatmah M, Yusof S, Edariah A. Intestinal parasitic infections in man: a review. Med J Ma laysia. 2003;58(2):296-305. 3. Tadesse A, Worku A, Girma A. Prevalence of intestinal parasites and associated factors among adult pre- ART and ART patients in Goncha Siso Enesie Woreda, East Gojjam, Northwest Ethiopia, 2014. J AIDS Clin Res. 2017;8(10):1-8. 4. Sharma HN, Chalise BS, Rai G, Adhikari N, Bastola A, Singh A. Prevalence of intestinal parasitic infec tions among people living with HIV/AIDS visiting a central hospital of Kathmandu Nepal. Asian J Med Sci. 2017;8(5):87-92. 5. Hailegebriel T. Prevalence of intestinal parasitic infections and associated risk factors among students at Dona Berber primary school, Bahir Dar, Ethiopia. BMC Infect Dis. 2017;17(1):362. 6. Jaiswal S, Sharma S, Bhat SR, Pokhrel T, Chaudhary N, Sharma I. Distribution of intestinal parasite in people living with HIV/AIDS of different care centre of Pokhara Valley, Nepal. Scholars J Appl Med Sci. 2014;2(6G):3366-9. 7. Wegayehu T, Tsalla T, Seifu B, Teklu T. Prevalence of intestinal parasitic infections among highland and owland dwellers in Gamo area, South Ethiopia. BMC Public Health. 2013;13(1):151. 8. Fekadu S, Taye K, Teshome W, Asnake S. Prevalence of parasitic infections in HIV-positive patients in southern Ethiopia: a cross-sectional study. J Infect Dev Ctries. 2013;7(11):868-72. 9. Haque R. Human intestinal parasites. J Health Popul Nutr. 2007;25:387-91. 10. Bar-Yoseph H, Zohar Y, Lorber M. Strongyloidiasis-Related IRIS: A Case Report and Literature Review. J Inter Assoc prov AIDS Care (JIAPAC). 2017;16(1):8-10.

335
11. Marami D, Hailu K, Tolera M. Prevalence and associated factors of intestinal parasitic infections among asymptomatic food handlers working at Haramaya University cafeterias, eastern Ethiopia. Ann Occup Environ Med. 2018;30(1):53. 12. Missaye A, Dagnew M, Alemu A, Alemu A. Prevalence of intestinal parasites and associated risk factors among HIV/AIDS patients with pre-ART and on-ART attending dessie hospital ART clinic, Northeast Ethiopia. AIDS Res Ther. 2013;10(1):7. 13. Tandukar S, Ansari S, Adhikari N, et al. Intestinal parasitosis in school children of Lalitpur district of Nepal. BMC Res Notes. 2013;6(1):1-6. 14. Abaver D, Nwobegahay J, Goon D, Iweriebor B, Anye D. Prevalence of intestinal parasitic infections among HIV/AIDS patients from two health institutions in Abuja, Nigeria. Afr Health Sci. 2011;11(3):24- 7. 15. Abossie A, Seid M. Assessment of the prevalence of intestinal parasitosis and associated risk factors among primary school children in Chencha town, Southern Ethiopia. BMC Public Health. 2014;14 (1):166. 16. Ramos JM, Rodríguez-Valero N, Tisiano G, et al. Research Note Different profile of intestinal protozoa and helminthic infections among patients with diarrhoea according to age attending a rural hospital in southern Ethiopia. Trop Bio. 2014;31(2):392-7. 17. Kipyegen CK, Shivairo RS, Odhiambo RO. Prevalence of intestinal parasites among HIV patients in Bari ngo, Kenya. Pan African Medical Journal. 2012;13(1). 18. Gerzmu T, Fantahun E, Hailu E, Kibe H, Fesseha O, Godana W. Prevalence of intestinal parasitosis among HIV/AIDS patients attending ART clinic of Arbaminch Hospital. Afr J Sci Res. 2015;4(5):13-7. 19. Barcelos NB, Dias RFG, Menezes Filho HRd, Rodrigues RM. Opportunistic and non-opportunistic intes tinal parasites in HIV/AIDS patients in relation to their clinical and epidemiological status in a specialized medical service in Goiás, Brazil. Rev Inst Med Trop Sao Paulo. 2018;60:1-9. 20. Ahmed KS, Siraj NM, Fitsumberhan H, et al. Knowledge, Attitude and Practice (KAP) Assessment of Intestinal Parasitic Infection among School Children in Asmara, Eritrea. Health. 2016;9(1):57-68. 21. Solomon FB, Angore BN, Koyra HC, Tufa EG, Berheto TM, Admasu M. Spectrum of opportunistic in fections and associated factors among people living with HIV/AIDS in the era of highly active anti- retroviral treatment in Dawro Zone hospital: a retrospective study. BMC Res Notes. 2018;11(1):604. 22. Adeleke OA, Yogeswaran P, Wright G. Intestinal helminth infections amongst HIV-infected adults in Mthatha General Hospital, South Africa. Afr J Prim Health Care Fam Med. 2015;7(1):1-7. 23. Nissapatorn V, Sawangjaroen N. Parasitic infections in HIV infected individuals: diagnostic & therapeutic challenges. Indian J Med Res. 2011;134(6):878. 24. Kulkarni S, Kairon R, Sane S, et al. Opportunistic parasitic infections in HIV/AIDS patients presenting with diarrhoea by the level of immunesuppression. Indian J Med Res. 2009;130(1):63. 25. Amoo JK, Akindele AA, Amoo AOJ, et al. Prevalence of enteric parasitic infections among people living with HIV in Abeokuta, Nigeria. Pan Afr Med J. 2018;30:1-9. 26. Eshetu T, Sibhatu G, Megiso M, et al. Intestinal parasitosis and their associated factors among people living with HIV at University of Gondar Hospital, Northwest-Ethiopia. Ethiop J Health Sci. 2017;27 (4):411-20. 27. Wolday D, Mayaan S, Mariam ZG, et al. Treatment of intestinal worms is associated with decreased HIV plasma viral load. J Acquir Immune Defic Syndr 2002;31(1):56-62. 28. Tian L-G, Chen J-X, Wang T-P, et al. Co-infection of HIV and intestinal parasites in rural area of China. Parasit Vectors. 2012;5(1):36. 29. Cimerman S, Cimerman B, Lewi DS. Prevalence of intestinal parasitic infections in patients with acquired immunodeficiency syndrome in Brazil. Int J Infect Dis. 1999;3(4):203-6. 30. Paboriboune P, Phoumindr N, Borel E, et al. Intestinal parasitic infections in HIV-infected patients, Lao People’s Democratic Republic. PLoS One. 2014;9(3):e91452. 31. Kiros H, Nibret E, Munshea A, Kerisew B, Adal M. Prevalence of intestinal protozoan infections among I ndividuals living with HIV/AIDS at Felegehiwot Referral Hospital, Bahir Dar, Ethiopia. Int J Infect Dis. 2015;35:80-6. 32. Khalil S, Mirdha BR, Sinha S, et al. Intestinal parasitosis in relation to anti-retroviral therapy, CD4+ T- cell count and diarrhea in HIV patients. The Korean journal of parasitology. 2015;53(6):705.

336
33. Gebretsadik D, Haileslasie H, Feleke DG. Intestinal parasitosis among HIV/AIDS patients who are on anti-retroviral therapy in Kombolcha, North Central, Ethiopia: a cross-sectional study. BMC research notes. 2018;11(1):613. 34. Zemene T, Shiferaw MB. Prevalence of intestinal parasitic infections in children under the age of 5 years attending the Debre Birhan referral hospital, North Shoa, Ethiopia. BMC Res Notes. 2018;11(1):58. 35. Cheesbrough M. District laboratory practice in tropical countries. 2nd ed. New York: Cambridge univer sity press; 2006. 36. Anteneh T, Giday A, Alano A, Awoke A. Intestinal Parasitosis. Hawassa University, Ethiopian Health Center Team; 2008. 37. Gedle D, Kumera G, Eshete T, Ketema K, Adugna H, Feyera F. Intestinal parasitic infections and its asso ciation with undernutrition and CD4 T cell levels among HIV/AIDS patients on HAART in Butajira, Ethiopia. J Health Popul Nutr. 2017;36(1):15. 38. Bugssa G DB, Tarekegn H, Kassaw M, Tafete A. The Prevalence of Intestinal Parasites in HIV Positive and HIV Negative Individuals in Kobo Health Center, Northeastern Ethiopia: Comparative Cross Sectional. BRITISH BIOMEDICAL BULLETIN. 2014;2 (3):569-76. 39. Zelelie TZ, Gebreyes DS, Tilahun AT, Craddock HA, Gishen NZ. Enteropathogens in Under-Five Chil dren with Diarrhea in Health Facilities of Debre Berhan Town, North Shoa, Ethiopia. Ethiopian journal of health sciences. 2019;29(2). 40. Mekonnen B, Erko B, Legesse M. Prevalence of intestinal parasitic infections and related risk factors among Street Dwellers in Addis Ababa, Ethiopia. J Trop Dis 2014;2(2):1-7.

338
Esayas Berhanu, Carolyn M. Johnston. Ethiop Med J, 2021, Vol. 59, No. 4
ORIGINAL ARTICLE
DEMOGRAPHIC CHARACTERISTICS AND THE CLINICAL PROFILE OF VULVAR CANCER PATIENTS TREATED ATTIKURANBESSA SPECIALIZED
HOSPITAL, A FIVE YEARS RETROSPECTIVE STUDY
Esayas Berhanu, MD1, Carolyn M. Johnston, MD2
ABSTRACT
Introduction: Vulvar cancer is a rare disease that occurs most often in older women; however, this is not seen in clinical practice at TikurAnbessa Specialized Hospital (TASH). Overall there is limited information regarding vul-var cancer in Ethiopia. Aim: The aim of this study was to describe demographic characteristics and the clinical profile of Vulvar Cancer patients treated at TASH. Methods: This is a retrospective study. Data on primary vulvar cancer patients were collected from patients’ chart between August 2012 and July 2017 and analyzed. Results: A total of 118 study participants’ charts were reviewed. The median/mean age was 39/43.17 ranging from 22 to 85 years. The patients presented with more than one symptom. The mean duration of the symptoms was about 2 years. Labium majus(91.5%), labium minus (89%) were mainly affected. In most (79.7%) patients the disease was locally advanced. Sixty six percent of the cases were positive for HIV.The mean/ median duration of HIV in-fection was 72.14/72 months. All of them were taking HAART. The majority 38 (32.2%) were treated with chemo-radiation followed by surgery alone (16.9%). A Surgical procedure was done for 22 patients. Few patients devel-oped complications. Conclusions: In this study the burden of VC is higher among young and HIV positive women. Most women present in late stage of the disease despite visiting a health care facility for HIV care/HAART and long standing symptoms. Recommendations: Creating awareness of patirnts on vulvar cancer, particularly HIV positive ones, and health care providers may ameliorate the disease burden in Ethiopia. Key words: Cancer, vulva cancer, demographic aspect, clinical profile, HIV
INTRODUCTION
Vulvar cancer is a rare gynecological cancer, account-ing for 3 to 5 % of gynecological cancers(1, 2). The disease occurs mainly among women in the age of 50s or 60s(3-5). About 15% of vulva cancers occur in women <40 years and could be due to human papil-loma virus infection (HPV)(6). Unlike in developed nations, it is diagnosed in late stage in less developed countries(5, 7). The main presenting symptoms of patients are genital mass, genital or vulvar pruritis, genital ulceration, vulvar pain; of which genital tumor and genital itching are most common, accounting for 70.59% and 56.47% (8-10), respectively. The occurrence of Vulvar cancer in younger women is increasing all over the world due to High Risk-HPV (HR-HPV) infection. Human immunodeficiency virus (HIV)-positive women are at increased risk for persis-tent HPV infection.
In the advent of highly active antiretroviral therapy (HAART) in the recent decades, HIV positive pa-tients live long and acquire HPV related cancers including vulvar cancer(11).To the best of our knowledge, there has been no specific study about vulvar cancer in Ethiopia. This study was done to describe the demographic characteristics and clini-cal profile of vulvar cancer.
METHODOLOGY
Study design: Is a retrospective case-series study. Study area and period The study was done over the period of August 2012 to July 2017. It was conducted in Tikur Anbessa Specialized Hospital, a teaching University Hospital found in the capital city of Ethiopia. It has different departments and specialized units including gyne-cology oncology, and radiation and medical oncol-ogy units.
1 Gynecologic Oncologist, Addis Ababa University, Ethiopia. 2 Department of Obstetrics and Gynecology, University of Michigan, USA *Corresponding Author E-mail: [email protected]

339
The radiation unit is the only center for the country. Study Population All patients with a diagnosis of primary vulvar cancer managed at either the gynecology oncology unit or the radiotherapy unit at TASH during the study period. Inclusion and Exclusion Criteria All the patients who had histologically confirmed pri-mary vulvar cancers were included in the study. Those with secondary vulvar carcinoma were excluded. Data collection tools and procedures Data were collected using a self-prepared and anony-mous questionnaire to gather relevant data from the patients’ files. The questionnaire had two parts, namely, the sociodemographic characteristics and the clinical profiles of the patients. The tool was pretested at Zewditu Memorial Hospital. Data were collected by Interns, who were trained for a half-day on the objec-tive of the study and the data collection tool. At each step, the principal investigator checked for the com-pleteness of data. Data were cleaned, coded, and en-tered using SPSS. Results were presented using pro-portions and percentages.
RESULTS
Socio-demographic profiles One hundred eighteen charts of primary vulvar cancer patients were able to be retrieved. . Table1 shows the socio-demographic characteristics of the 118 VC cases. The median/mean age was 39/43.17 ranging from 22 to 85 years. Presenting symptomsand HIV Status As shown in table 2, the patients often presented with more than one symptom, the commonest being vulvar mass (76.3%) followed by ulcer (47.5%). In most (79.7%) patients, the disease extended to the adjacent involved organs beyond the vulva, including vagina (46.6%), anus (29.7%), urethra (22.9%) and inguinal lymph nodes (45.8%). The mean diameter of the le-sion was 5.89cm (range 1 to 20cm). The mean dura-tion of the interval between the onset of the symptoms and first medical consultation was 25.43 months (range 1 month to 168 month). Seventy eight (66.1%) patients were HIV positive. Most (83%) of the HIV positive patients were lying between the age of 22 and 40 years. The duration of HIV infection ranged between 5 and 204 months. Of note, 52.5% of patients had HIV infection for 1-24 months. All(78) of them were on HAART.
Table 1: Socio-demographic characteristics of the patients (n=118)
Treatment modalities and complications Of 118 patients, shown in table 3, 30 (25.4%) were scheduled for treatments that were not provided, including 12.7% scheduled for radiotherapy, 10.2% for chemo-radiation and 2.5% for surgery. A surgical procedure was done for 18.6 % of the patients, consisting of Local vulvectomy and bilat-eral inguinofemoral lymphadenectomy 12(54.5%), radical vulvectomy and bilateral inguinofemoral lymphadenectomy 9(41%) and excisional vulvecto-my1(4.5%). Five (23.7%) of the women developed complications including wound infection. Of this women, 2(9%) patients, vaginal stenosis 2(9%) and 1(4.5%) developed wound break down, delayed healing, lymphocyst and altered skin pigmentation.
Variable Frequency Percent
Age (years) Mean 43.17 Median 39.00 22-29 18 15.3 30-39 42 35.6 40-49 23 19.5 50-59 16 13.6 60-69 11 9.3 70+ 8 6.8 Total 118 100 Residence (Regions)
Addis Ababa (Capital city)
44 37.3
Oromia 34 28.8 Amahara 26 22 Tigray 8 6.8 Others 6 5.1 Marital Status Single 4 3.4 Married 101 85.6 Divorced 8 6.8 Widowed 1 .8 Unknown 4 3.4 Parity Mean No of chil-dren
2.66
Nullipsrous 19 16.1 1-4 81 68.6 5+ 18 15.3

340
Table 2: Clinical characteristics and HIV status of the patients (n=118)
Table 3: Types of Treatment (N=118)
Variable Frequency percent
Symptoms Vulvar mass 90 76.3 Ulcer 56 47.5 Pruritus 50 42.4 Pain 40 33.9 Discharge 54 45.8 Bleeding 32 27.1 Others 7 5.9 Mean duration (months)
25.43
Sites of lesion Confined to vulva 24 20.3 Extension to adjacent organs
94 79.7
Mean largest diameter (cm)
5.89
HIV status Negative 38 32.2 Positive 78 66.1 Unknown 2 1.7 HIV Pos age category 22-30 16 20 31-40 49 63 41+ 13 17 HIV duration (months) Mean duration
72.14
1 month - 24 month 62 52.5 25month – 48 month 4 3.4 49 month – 72 month 19 16.1 73 month – 96 month 10 8.5 97+ 23 19.5
DISCUSSION Vulvar cancer is typically a disease of elderly women. The median age in some developed coun-tries were between 65 to 70 years(3,5, 7). Studies in two West African countries showed a higher inci-dence of the disease in older women; in Burkina Faso the mean age was 57, and it was 56.3 in Ghana (5). The median/mean age was 39/43.17 in our patients. Similarly, other authors in both hemispheres have noted a lower age of onset(12, 13, 15). In this study, as most of the women are HIV positive and most (91%) of those women are in the younger age group (less than 50); this probably explains the difference in the age distribution with other studies. The age distribution of vulvar cancer in this study is also similar with that of cervical cancer in this country(24), and may have similar etiologic factors. The young age at presentation of our population, and the stage at presentation lend a huge challenge to the management and subsequent adverse out-comes for these women with respect to familial, sexuality, fertility and psychosocial outcomes. The high rate of HIV positivity in our vulvar cancer population is not surprising given their young age, and Ethiopia’s high adult HIV infection prevalence (30) as compared to that of developed countries and West Africa. It is, however, surprising that those women are doing well on HAART and are receiving long term facilities care at HIV/HAART health. We propose that a first steps towards awareness and potential of earlier diagnosis would be the education of Health care workers at these facilities and the inclusion of an assessment of gynecologic symp-toms at each visit with direct referral to a gynecolo-gist as indicated. HIV positive patients have been shown to be at in-creased risk of persistent HPV infection. Persistent high risk-HPV infection is associated with essen-tially all squamous cell carcinoma of the cervix, 80% to 90% of anal cancers, a higher proportion of vaginal and vulvar cancers and with oropharyngeal-cancer(23). In the review of the literature assessing the relation-ship between HR-HPV and vulvar cancer, Smith et al (27), noted 40.1 % prevalence in vulvar cancer. Faber et al also noted a similar pooled prevalence of HPV at 39.7% (CI: 35-44.4%) (28) in their updated review of 64 papers with 5015 cases of vulvar can-cer. Siriaunksul et al noted a 40% prevalence of vulvar cancer in Thailand(29).
Variable Frequency percent
Type of treatment Surgery scheduled that were not done
3 2.5
Radiotherapy scheduled that were not given
15 12.7
Chemoradiation sched-uled that were not given
12 10.2
Chemoradiation given 38 32.2 Radiation alone given 17 14.4 Chemotherapy alone 11 9.3 Surgery done 20 16.9 Surgery followed by chemoradiation
2 1.7
341
Our study could not assess HPV prevalence, but we showed that most of the patients were younger and HIV positive. As in other studies (90%-95%) squamous histology was the most common type of vulvar carcinoma in this study(5, 7, 13, 19). This study indicates that most patients were from Ad-dis Ababa, the capital city of Ethiopia, where this hos-pital is located. This is again similar to the pattern noted with cervical cancer(24). A number of factors could account for this including the ability to travel for care, poor knowledge of VC in outlying areas and misidentification of the actual place of residence at the time of registration due to staying with family who reside in Addis Ababa. In literature pruritis is the most common and long lasting reported symptom of vulvar cancer, followed by vulvar bleeding, discharge, dy-suria and pain(25). In our patients genital mass is the most common presenting symptom (76.3%) followed by ulcer (47.5%). Pruritus is still the significant pre-senting symptom.
The difference may be due to the associated lichen sclerosis in older patients in the other studies. In Burk-ina Faso, pain and ulceration are also the main pre-senting symptoms(5) while in Ghana(7) swelling and ulceration are most common. The larger size, mean diameter of the largest ulcer and mass is 5.89 cm (range 1 cm to 20 cm), the multiple lesion and bilateral involvement of the vulva are strik-ingly important finding in these patients which would be consistent with HPV related cancers. It also con-tributes to the challenge of an adequate primary surgi-cal resection even if not metastatic which is why most of the patients were not treated with surgical resection. In the USA, 90% of cases of vulvar cancer are diag-nosed with in situ or early invasive stage(22). How-ever, this study is consistent with the findings of stud-ies in Burkina Faso and Ghana in which most of the patients presented with locally advanced stage (4,5,7). This has a deleterious effect on the outcome of the disease. Most of our patients sought medical care after several months of the onset of the symptoms. Similarly the Ghana women consulted professionals after failure of improvement following consultations of other alternatives that led to advanced stage. We plan to determine the primary factors that contrib-ute to late presentation and to make recommendations to address them. Surgical removal of the primary tu-mor and inginal lymph nodes remains the corner stone of the treatment of vulvar cancer with strong trends towards a less radical more conservative, and more individualized approach in early stage disease.
Radical partial vulvectomy in localized lesion with SLN biopsy is suggested with favorable outcomes but not an option in Ethiopia. Chemoradiation is indicated for advanced cases(7, 13, 19, 22). In our study, 9 out of 22 patients underwent radical vul-vectomy and bilateral inguinofemoral lymphadenec-tomy due to large tumor size and multiple localities while 12 underwent a smaller vulvectomy and bilat-eral inguinal lymphadenectomy. Post operative sur-gical complication rate and severity were relatively low, 5 out of 22 patients. This could be due to the retrospective nature of the study and post operative follow up is not always consistent in our population. Conclusions In this study, the burden of vulvar cancer is higher among young and HIV positive women. Most of them present at a late stage of the disease despite visiting health care facilities for HIV care/HAART and long standing multiple symptoms. Recommendations Creation of awareness of patients onvulvar cancer, particularly those who are HIV positive and health care providers and the inclusion of a gynecologic assessment of symptoms at each visit with direct referral to a gynecologist as indicated would allow earlier diagnosis, either at premalignant or early stage of the disease, and may ameliorate the disease burden in Ethiopia. HPV serotype study and HPV vaccination, which has been provened to be highly effective against ano-genital disease, could make an important contribution to the reduction of the risk of VC in these young women.
Ethics Considerations The study was approved by the Department of Ob-stetrics and Gynecology Research and Publication Committee and Institutional Review Board (IRB) of College of Health Sciences, Addis Ababa Univer-sity for ethical clearance (Protocol number AAUMF 03-008). All procedures were followed in accor-dance with the ethical standards. Permission was obtained from the department of medical and radia-tion oncology, and an outpatient department to ac-cess the patient medical records.
Competing Interests There is no conflict of interests to declare.
Funding No funding
ACKNOWLEDGMENTS
We would like to thank the Head of Department of Medical and Radiation Oncology, Dr Wondi-magegn, and the staff of the record office for the retrieval of the patients’ files during data collection.
342
REFERENCES 1. de Martel C, Ferlay J, Franceschi S, al. e. Global burden of cancers attributable to infections in 2008: a review and synthetic analysis. Lancet Oncol. 2012;13(6):607-15. 2. Hacker NF,et al. Cancer of the vulva. Int J Gynaecol Obstet. 2015;131 76-8. 3. Hampl M, al. e. New aspects of vulvar cancer: changes in localization and age of onset. Vulvar cancer in women less than fifty in United States, 1980-2005. Gynecol Oncol. 2009. 4. Mary Ann Dadzie, al. e. Vulva cancer in Ghana - Review of a hospital based data. Gynecologic Oncology Reports. 2017; 108-111. 5. Zongo, et al. Cancer of the vulva in Burkina Faso: a hospital-based case series. Infect Agents and Cancer 2016;11:33. 6. Siddiqui N. The management of vulval cancer. Obstet Gynaecol. 2002;12 (2): 97-103. 7. Mary Ann Dadzie et al. Vulva cancer in Ghana – Review of a hospital based data. Gynecologic Oncology Reports 2017;108-111. 8. Thakur, et al. Clinical analysis of vulvar carcinoma. . Gynecology 2013. 2013. 9. Singh DK, Anastos K, Hoover DR, ;. ea. Human papillomavirus infection and cervical cytology in HIV- infected and HIV-uninfected Rwandan women. J Infect Dis. 2009;199:1851-61. 10. Denny L, Boa R, Williamson AL, al. e. Human papillomavirus infection and cervical disease in human immunodeficiency virus-1-infected women. Obstet Gynecol. 2008;111:1380-7. 11. Brickman C, JM P. Human papillomavirus in the HIV-infected host: epidemiology and pathogenesis in the antiretroviral era. 2015. 12. Hampl M, Deckers-Figiel S, Hampl JA, et al. aspects of vulvar cancer: changes in localization and age of onset. Gynecol Oncol. 2009. 13. Singh, et al. A cohort study of vulvar cancer. Indian Journal of Cancer 2016;53 (3). 14. Hacker NF, Eifel PJ, J vdV. FIGO cancer report 2012. Cancer of the vulva. Int J Gynecol Obstet. 2012;119 90‑6. 15. Okolo CA, Odubanjo MO, Awolude OA, et al. A review of vulvar and vaginal cancers in Ibadan, Nigeria. . Am J Med Sci 2013;6:76‑81. 16. Madeleine MM, Daling JR, Carter JJ, Wipf GC, Schwartz SM, McKnight B, et al. Cofactors with human papillomavirus in a population-based study of vulvar cancer. J Natl Cancer Inst. 1997;89:1516- 23. 17. Canavan TP, D. C. Vulvar cancer. Am Fam Physician. 2002;66:1269-74. 18. Al-Ghamdi A et al. Vulvar squamous cell carcinoma in young women: a clinicopathologic study of 21 cases. . Gynecol Oncol. 2002 84(1):94-101. 19. Alkatout, et al. Vulvar cancer: epidemiology, clinical presentation, and management options International Journal of Women’s Health. 2015;7. 20. Ahizechukwu C Eke et al. Management options for vulvar carcinoma in a low resource setting. World J Surg Oncol. 2010;8:94. 21. Nkyekyer, K. Pattern of gynaecological cancers in Ghana. . East Afr Med J. 2000;77 10. 22. Stroup AM et al. Demographic, Clinical, and Treatment Trends among Women Diagnosed with Vulvar Cancer in the U.S. Gynecol Oncol. 2008 108(3):577-83. 23. Clemente et al. Multiple preinvasive and invasive HPV-related lesions of the anogenital tract in a female patient with HIV infection:A case report Medicine (2017) 96:4 Cervical Cancer, an open access journal. 24. Sefinew Migbaru Abate https://www.omicsonline.org/open-access/trends-of-cervical-cancer in Ethiopia for the years 1997-2012. 25. Alkatout et al. Vulvar cancer: epidemiology, clinical presentation, and management options International Journal of Women’s Health 2015:7. 26. Stoup AM et, al. Demographic, Clinical, and Treatment Trends Among Women Diagnosed with Vulvar Cancer in the U.S. Gynecol Oncol. 2008 March; 108(3): 577–583. 27. Smith et al. Human Papillomavirus Type-Distribution in Vulvar and Vaginal Cancers and Their Associated Precursors. 28. Faberetal. Prevalence and type distribution of human papillomavirus in squamous cell carcinoma and in traepithelial neoplasia of the vulva.Int J Cancer. 2017 Sep 15; 141(6):1161-1169. 29. Siriaunkgul et al. HPV Detection and Genotyping in Vulvar Squamous Cell Carcinoma in Northern Thai land. Asianpacific Journal of Cancer Prevention. 2014, 15 (8), 3773-3778. 30. Ethiopia HIV country profile. WHO 2016.

343
Yeshambel Agumas Ambelie, Getu Degu Alene, Damen Hailemariam Gebrekiros. Ethiop Med J, 2021, Vol. 59, No. 4
ORIGINAL ARTICLE
CULTIVATING COMPETENT LEADERS WHO CAN MANAGE AND GOVERN THE HEALTH DELIVERY SYSTEM IN NORTHWEST ETHIOPIAN: QUASI-
EXPERIMENTAL STUDY
Yeshambel Agumas Ambelie, PhD*1, Getu Degu Alene, PhD1, Damen Hailemariam Gebrekiros, MD, PhD2
ABSTRACT
Introduction: Nurturing leadership and governance is salient to strengthen health systems. However, literature that reports the effect of programs related to this, particularly in low and middle-income countries’ health systems is limited. Aim: To examine the effect of integrated health system leadership, management, and governance capacity-building program on institutional delivery performance. Methods: A prospective quasi-experimental study, on one-hundred-thirty-four health facility teams,was conducted in northwest Ethiopia. Teams were allocated to intervention and control groups in a 1:1 ratio, non-randomly. Inte-grated leadership, management, and governance capacity-building program was employed in teams of the inter-vention group over six months. Using a challenge model, they implemented a six-month project on institutional delivery performance. The outcome of interest was mean institutional delivery performance. Data from each group were collected at baseline and end line. Data were analyzed using analysis of covariance. Statistical significance was determined at p-value<0.05. The program’s effect size was reported using partial eta squared. Results: Integrated leadership, management, and governance capacity-building program had a statistically sig-nificant effect on mean institutional delivery performance (p-value<0.001). The program’s effect size was 65%. Conclusions: Integrated leadership, management, and governance capacity-building program is a plausible cause of improved mean institutional delivery performance. The current findings could make the program sustainable across time and scalable across similar settings. To identify the program’s true causation, further research could be done using a randomized control trial. Keywords: Effect, Integrated, Leadership, Management, Governance, Institutional delivery
INTRODUCTION
A strong health system is required to address univer-sal health coverage (1, 2). Leadership and governance is identified as the health system building block that directly impact the health outcomes (3, 4). However, it remains challenging to implement and measure, particularly in low and middle-income countries’ health systems (4, 5). Yet, nurturing this building block is salient to improve the health system perform-ance and health outcomes. This has enforced the development of integrated Leadership, Management, and Governance (LMG) capacity-building program (4, 6). Contemporarily, this program centers the integrated leadership, manage-ment, and governance for results framework (Figure 1).
Figure 1: Integrated leadership, management and governance for results framework (Source: MSH, 2017)
1 Bahir Dar University 2 Addis Ababa university *Corresponding Author E-mail: [email protected]
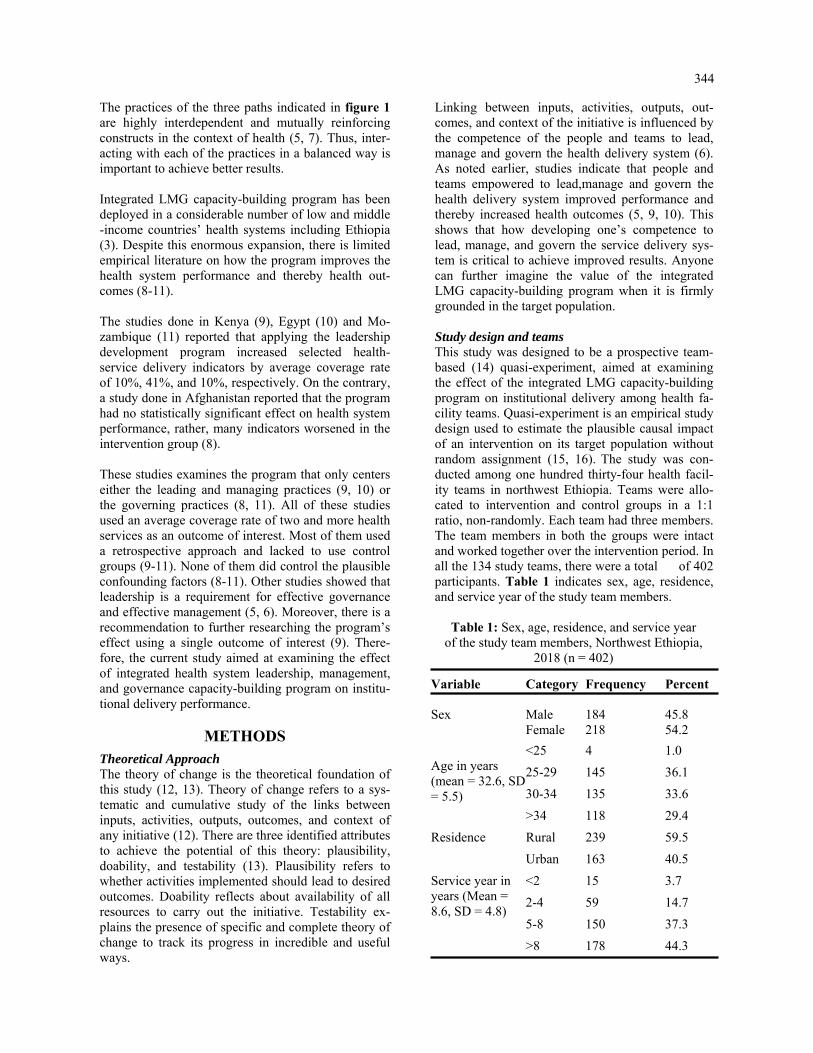
344
The practices of the three paths indicated in figure 1 are highly interdependent and mutually reinforcing constructs in the context of health (5, 7). Thus, inter-acting with each of the practices in a balanced way is important to achieve better results. Integrated LMG capacity-building program has been deployed in a considerable number of low and middle-income countries’ health systems including Ethiopia (3). Despite this enormous expansion, there is limited empirical literature on how the program improves the health system performance and thereby health out-comes (8-11). The studies done in Kenya (9), Egypt (10) and Mo-zambique (11) reported that applying the leadership development program increased selected health-service delivery indicators by average coverage rate of 10%, 41%, and 10%, respectively. On the contrary, a study done in Afghanistan reported that the program had no statistically significant effect on health system performance, rather, many indicators worsened in the intervention group (8). These studies examines the program that only centers either the leading and managing practices (9, 10) or the governing practices (8, 11). All of these studies used an average coverage rate of two and more health services as an outcome of interest. Most of them used a retrospective approach and lacked to use control groups (9-11). None of them did control the plausible confounding factors (8-11). Other studies showed that leadership is a requirement for effective governance and effective management (5, 6). Moreover, there is a recommendation to further researching the program’s effect using a single outcome of interest (9). There-fore, the current study aimed at examining the effect of integrated health system leadership, management, and governance capacity-building program on institu-tional delivery performance.
METHODS
Theoretical Approach The theory of change is the theoretical foundation of this study (12, 13). Theory of change refers to a sys-tematic and cumulative study of the links between inputs, activities, outputs, outcomes, and context of any initiative (12). There are three identified attributes to achieve the potential of this theory: plausibility, doability, and testability (13). Plausibility refers to whether activities implemented should lead to desired outcomes. Doability reflects about availability of all resources to carry out the initiative. Testability ex-plains the presence of specific and complete theory of change to track its progress in incredible and useful ways.
Linking between inputs, activities, outputs, out-comes, and context of the initiative is influenced by the competence of the people and teams to lead, manage and govern the health delivery system (6). As noted earlier, studies indicate that people and teams empowered to lead,manage and govern the health delivery system improved performance and thereby increased health outcomes (5, 9, 10). This shows that how developing one’s competence to lead, manage, and govern the service delivery sys-tem is critical to achieve improved results. Anyone can further imagine the value of the integrated LMG capacity-building program when it is firmly grounded in the target population. Study design and teams This study was designed to be a prospective team-based (14) quasi-experiment, aimed at examining the effect of the integrated LMG capacity-building program on institutional delivery among health fa-cility teams. Quasi-experiment is an empirical study design used to estimate the plausible causal impact of an intervention on its target population without random assignment (15, 16). The study was con-ducted among one hundred thirty-four health facil-ity teams in northwest Ethiopia. Teams were allo-cated to intervention and control groups in a 1:1 ratio, non-randomly. Each team had three members. The team members in both the groups were intact and worked together over the intervention period. In all the 134 study teams, there were a total of 402 participants. Table 1 indicates sex, age, residence, and service year of the study team members.
Table 1: Sex, age, residence, and service year of the study team members, Northwest Ethiopia,
2018 (n = 402)
Variable Category Frequency Percent Sex
Male
184
45.8
Female 218 54.2
Age in years (mean = 32.6, SD = 5.5)
<25 4 1.0
25-29 145 36.1
30-34 135 33.6
>34 118 29.4
Residence Rural 239 59.5
Urban 163 40.5
Service year in years (Mean = 8.6, SD = 4.8)
<2 15 3.7
2-4 59 14.7
5-8 150 37.3
>8 178 44.3
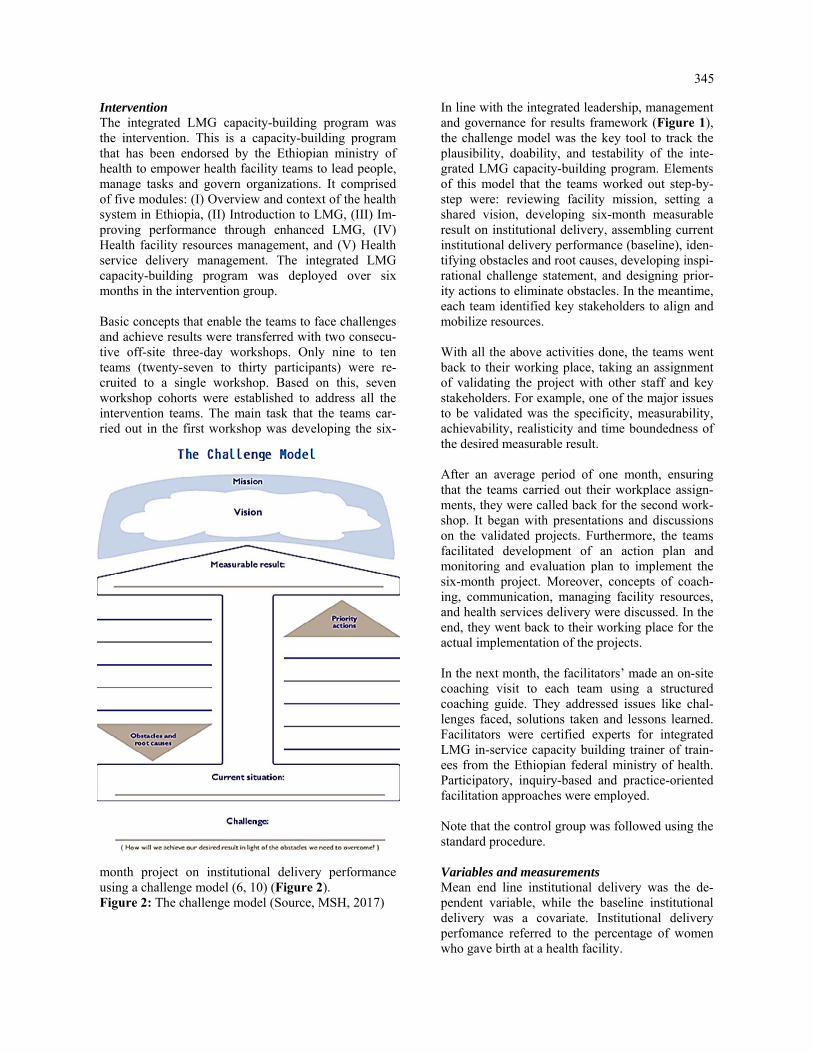
345
Intervention The integrated LMG capacity-building program was the intervention. This is a capacity-building program that has been endorsed by the Ethiopian ministry of health to empower health facility teams to lead people, manage tasks and govern organizations. It comprised of five modules: (I) Overview and context of the health system in Ethiopia, (II) Introduction to LMG, (III) Im-proving performance through enhanced LMG, (IV) Health facility resources management, and (V) Health service delivery management. The integrated LMG capacity-building program was deployed over six months in the intervention group. Basic concepts that enable the teams to face challenges and achieve results were transferred with two consecu-tive off-site three-day workshops. Only nine to ten teams (twenty-seven to thirty participants) were re-cruited to a single workshop. Based on this, seven workshop cohorts were established to address all the intervention teams. The main task that the teams car-ried out in the first workshop was developing the six-
month project on institutional delivery performance using a challenge model (6, 10) (Figure 2). Figure 2: The challenge model (Source, MSH, 2017)
In line with the integrated leadership, management and governance for results framework (Figure 1), the challenge model was the key tool to track the plausibility, doability, and testability of the inte-grated LMG capacity-building program. Elements of this model that the teams worked out step-by-step were: reviewing facility mission, setting a shared vision, developing six-month measurable result on institutional delivery, assembling current institutional delivery performance (baseline), iden-tifying obstacles and root causes, developing inspi-rational challenge statement, and designing prior-ity actions to eliminate obstacles. In the meantime, each team identified key stakeholders to align and mobilize resources. With all the above activities done, the teams went back to their working place, taking an assignment of validating the project with other staff and key stakeholders. For example, one of the major issues to be validated was the specificity, measurability, achievability, realisticity and time boundedness of the desired measurable result. After an average period of one month, ensuring that the teams carried out their workplace assign-ments, they were called back for the second work-shop. It began with presentations and discussions on the validated projects. Furthermore, the teams facilitated development of an action plan and monitoring and evaluation plan to implement the six-month project. Moreover, concepts of coach-ing, communication, managing facility resources, and health services delivery were discussed. In the end, they went back to their working place for the actual implementation of the projects. In the next month, the facilitators’ made an on-site coaching visit to each team using a structured coaching guide. They addressed issues like chal-lenges faced, solutions taken and lessons learned. Facilitators were certified experts for integrated LMG in-service capacity building trainer of train-ees from the Ethiopian federal ministry of health. Participatory, inquiry-based and practice-oriented facilitation approaches were employed. Note that the control group was followed using the standard procedure. Variables and measurements Mean end line institutional delivery was the de-pendent variable, while the baseline institutional delivery was a covariate. Institutional delivery perfomance referred to the percentage of women who gave birth at a health facility.

346
It was a continuous scale variable measured by per-centage. The expected pregnant women were denomi-nators, while the women who gave birth at the facility were nominators. The main independent variable was the group. Note that any statement of mean institu-tional delivery performance in this study refers to the end line mean institutional delivery performance. Data collection and analysis Data were collected at baseline and end line using a checklist. Analysis of covariance was unlocked to analyze the data. Before the final analysis, five stages of analyses were conducted using the statistical pack-age for the social sciences version 20. First, descrip-tive analysis was carried out to characterize the study teams and the ordinary mean institutional delivery performance. Second, assumptions of no presence of significant outliers, and approximately normally dis-tributed data for each group were assessed by boxplot and Shapiro-Wilk test (p<0.05), respectively. Third, in the absence of the covariate, the effect of the group on the mean institutional delivery (dependent variable) was tested using analysis of variance. It gave signifi-cant result: partial eta squared (η2) = 0.37, and p-value<0.001. The η2 measured the proportion of the total variance (effect size) on the dependent variable that was asso-ciated with the membership of different groups de-fined by a group (17). Fourth, the group-covariate interaction effect was checked using a custom model of analysis of covariance. This analysis technique tested differences between the group means when we knew that an extraneous variable affected the depend-ent variable (18, 19). It provided non-significant out-put: η2 = 0.01 and p-value = 0.21. The other important output displayed from this analysis was the result of Levene's test: p-value<0.001. This result indicated that the group variances were not equal and hence the assumption of homogeneity of variance was violated. This further showed that we failed to reject the null hypothesis in that there was no group by covariate effect on the dependent variable (19). Last, the effect of the group on the covariate was also tested using analysis of variance and gave non-significant result: η2 = 0.02 and p-value = 0.09. Considering the above outlooks, analysis of covari-ance with the full factorial model was unlocked to evaluate the effect of the group on the dependent vari-able. This analysis technique is developed to increase the power of the test of the predictor variable, by re-moving error variance in the dependent variable that is associated with the covariate (18). Statistical sig-nificance was determined at p-value<0.05. The group’s effect size on the dependent variable was measured using η2.
Ethical considerations The study was registered at Clinicaltrials.gov, NCT03639961 on 27 May 2017. Ethical clearance was secured from the corresponding author’s insti-tute with a protocol record 090/18-04. Written con-sent was obtained from each member of the study teams, and data were protected. This work is an extension of our previous work (20).
RESULTS Ordinary means Table 2 displays the ordinary mean and standard deviation of institutional delivery performances with 95% CI. The ordinary mean (+SD) difference between the baseline and end line institutional de-livery performances were 14.6+7.2 and 1.1+2.2 in the intervention group and the control group, re-spectively.
Gro
up
Ord
inar
y m
ean
an
d S
D in
stit
utio
nal d
eliv
ery
per
form
ance
B
asel
ine
En
d li
ne
Mea
sure
S
tati
stic
95
% C
I S
tati
stic
95
% C
I L
ower
Upp
er
Low
er U
pper
Inte
rven
tion
Mea
n 34
.2
30.7
37
.5
48.8
46
.2
51.9
SD
12
.8
10.6
14
.8
12.6
10
.4
14.4
Con
trol
M
ean
30.9
28
.6
33.2
32
.0
29.5
34
.6
SD
9.
5 7.
1 11
.5
9.1
6.9
11.2
Tab
le 2
: O
rdin
ary
mea
n an
d S
tand
ard
Dev
iatio
n (S
D)
inst
itutio
nal
deliv
ery
perf
orm
ance
s, N
orth
wes
t Eth
iopi
a, 2
018
(n=
134
)
Estimated means Table 3 presents the adjusted mean institutional delivery performances that were the original means adjusted for the covariate. The means had changed compared to those found in the ordinary means.

347
Table 3: Adjusted mean institutional delivery performances, Northwest Ethiopia, 2018 (n= 134)
Note: The covariate appearing in the model was evaluated at the following value: baseline institutional delivery performance = 32.6.
Group Mean Std. Error 95% CI
Lower Bound Upper Bound
Intervention 47.4 0.627 46.2 48.6
Control 33.4 0.627 32.2 34.6
Effect of integrated LMG capacity-building program Table 4 shows that there was an overall statistically significant difference in the mean institutional deliv-ery performance between the groups once their means had been adjusted for the covariate (p-value<0.001).
The output also displayed a 65% (η2 = 0.65) effect size of the group on the mean institutional delivery performance. This showed that including the co-variate in the analysis increased the group’s (intervention’s) effect size from 37% (noted in the methods part) to 65%.
Table 4: Outputs of between-subjects effects on adjusted means, Northwest Ethiopia, 2018 (n = 134)
Source Type III Sum of Squares
Df Mean Square
Sig. Partial Eta Squared
Corrected Model
21955.8 2 10977.9 0.000 0.87
Intercept 2169.6 1 2169.6 0.000 0.39
Covariate 12460.4 1 12460.4 0.000 0.79
Group 6435.3 1 6435.3 0.000 0.65
Error 3410.4 131 26.0
Total 244108.0 134
Corrected Total
25366.2 133
Note: R Squared = 0.87, Adjusted R Squared = 0.86
DISCUSSION
The current study findings inform that the integrated LMG capacity-building program intervention causes a statistically significant difference in the mean insti-tutional delivery performance between the groups. The intervention is led by the theory of change to signify the expected relationships between inputs, activities, outputs, and outcomes in a given context (12). This theory has three important attributes: plau-sibility, doability, and testability that support achievement of the expected outcome of any initia-tive (13). In the current case, this could be compre-hended as a reasonable narrative of the interactions between the various components of the integrated LMG capacity-building program and the plausible pathways through which they have related with the elements of the health facility system to achieve the expected outcome.
The current and few previous studies (9, 10) use the challenge model, in common, to show the logical relationships between facility mission, shared vi-sion, measurable result, current situation, obstacles and root causes, challenge statement, and priority actions. Alongside these relationships, the teams identify key stakeholders to align and mobilize re-sources and develop an action plan and monitoring and evaluation plan to achieve better results. These pathways can support to track the scientific reliabil-ity and empirical scalability of the program. Differently, the current study examined the inte-grated LMG capacity-building program that centers the integrated leadership, management, and govern-ance for results model (5). In resource-limited set-tings including Ethiopia, empowering people and teams using such a model is crucial.

348
This is comparable with stabilizing a three-legged stool to get a balanced sit on a rough ground (21, 22). The other unique characteristics of the current study are adjusting the original means for the covariate, and including the control group. These have five-fold benefits (19): (I) it reduces the within-group error variance; (II) it eliminates potential confounders; (III) it provides additional evidence of causality; (IV) it identifies assumption attributes in trends between the groups; and (V) it determines the effect size of the program. In the current study, the adjusted mean institutional delivery performance (Table 3) compared with the ordinary mean institutional delivery performance (Table 2) is less in the intervention group, but greater in the control group. This shows that adjusting the mean by removing error variance in the dependent variable that associates with the covariate provides unbiased or uncontaminated mean. Additionally, the adjusted mean institutional delivery performances in both the groups are greater compared with the 2016 Ethiopian demographic health survey institutional delivery performance report (26%). Whereas, com-pared with the 2019 survey report (48%), the result in the intervention group is comparable, but the result in the control group is less. This finding is supported by a recently published field action report from Ethiopia that reported a 40% institutional delivery performance increase (23). These magnifies the importance of im-plementing the integrated LMG capacity-building program in improving performances and health out-comes. The current ordinary mean achievement increased in the intervention group, 14.6%, is slightly greater com-pared to the average achievement increase reported in the studies done in Kenya, 10% (9) and Mozam-bique,10% (11). Whereas, it is lower compared with the average achievement increase reported in the study done in Egypt, 41% (10). These increments in general, and the differences, in particular, might be due to that people and teams more empowered to lead, manage, and govern improves the workgroup environ-ment, management system, and responsiveness of the health system (24, 25). Generally, the current study has important implica-tions for policymaking, planning, implementing and researching in the context of the low and middle-income countries’ health systems. Health authorities who lead and manage and govern in these countries and who wish to achieve better results could consider a contextualized integrated LMG capacity-building program(5, 26).
Away from the implications, there were potential limitations in conducting this study. The first draw-back was absence of randomization pocedure (15) leading to the second limitation of whether analysis of covariance is used in alike data. Nonetheless, this was applied since there was no preexisted group affecting the covariate (19, 22). The third limitation was use of the statistical principle of regression to the mean in establishing causality (18). This widespread statistical phenomenon can result in wrong conclusion that an effect is due to the in-tervention when in reality it is due to chance. The degree of this caution was diminished by imple-menting the intervention in a real-world setting. The last limitation was the short duration of the inter-vention in which six months may not be enough to overcome barriers and achieve a significant result. Conclusions The integrated LMG capacity-building program is a plausible cause of improved institutional delivery. The program brings a statistically significant differ-ence in the mean institutional delivery between the groups once their means adjusted for the covariate. The program’s effect size is 65%. The findings pro-vided from this study might make the program sus-tainable across time and scalable across similar countries’ health systems. To identify the program’s true causation, further research could be done con-sidering a randomized control trial. Acknowledgments Our sincere appreciation goes to the study partici-pants, intervention facilitators, data collectors, and data supervisors for their valuable contribution. Our gratitude also extends to Bahir Dar University for funding this study. Conflict of interest All the authors declare that they have no both finan-cial and non-financial competing interests. Funding Bahir Dar University funded the research. It had no role in the design of the study and collection, analy-sis, and interpretation of data and in writing the manuscript.

349
REFERENCES
1. Murray CJ, Frenk J. A framework for assessing the performance of health systems. Bulletin of the world Health Organization. 2000;78:717-31.
2. Peters DH, El-Saharty S, Siadat B, Janovsky K, Vujicic M. Improving health service delivery in develop ing countries: from evidence to action: The World Bank; 2009.
3. Daire J, Gilson L, Cleary S. Developing leadership and management competencies in low and middle- income country health systems: a review of the literature. Cape Town: Resilient and Responsive Health Systems (RESYST). 2014.
4. Rauscher M, Walkowiak H, Djara MB. Leadership, Management, and Governance Evidence Compen dium. 2018.
5. Rice JA. Synthesis paper on effective governance for health. 2012. 6. Management Sciences for Health. Rice JA, Shukla, Mahesh, Johnson Lassner, Karen et al. Leaders Who
Govern. 2015. 7. Vriesendorp S, De La Peza L, Perry C, Seltzer J, ONeil M. Health systems in action: an ehandbook for
leaders and managers. 2010. 8. Anwari Z, Shukla M, Maseed BA, Wardak GFM, Sardar S, Matin J, et al. Implementing people-centred
health systems governance in 3 provinces and 11 districts of Afghanistan: a case study. Conflict and health. 2015;9(1):2.
9. La Rue KS, Alegre JC, Murei L, Bragar J, Thatte N, Kibunga P, et al. Strengthening management and leadership practices to increase health-service delivery in Kenya: an evidence-based approach. Human resources for health. 2012;10(1):25.
10. Mansour M, Mansour JB, El Swesy AH. Scaling up proven public health interventions through a locally owned and sustained leadership development programme in rural Upper Egypt. Human Resources for Health. 2010;8(1):1.
11. Perry C. Empowering primary care workers to improve health services: results from Mozambique's lead ership and management development program. Human resources for health. 2008;6(1):14.
12. Connell JP. New Approaches to Evaluating Community Initiatives. Concepts, Methods, and Contexts. Roundtable on Comperhensive Community Initiatives for Children and Families: ERIC; 1995.
13. Connell JP, Kubisch AC. Applying a theory of change approach to the evaluation of comprehensive com munity initiatives: progress, prospects, and problems. New approaches to evaluating community initia tives. 1998;2(15-44):1-16.
14. Salas E, DiazGranados D, Klein C, Burke CS, Stagl KC, Goodwin GF, et al. Does team training improve team performance? A meta-analysis. Human factors. 2008;50(6):903-33.
15. Harris AD, McGregor JC, Perencevich EN, Furuno JP, Zhu J, Peterson DE, et al. The use and interpreta tion of quasi-experimental studies in medical informatics. Journal of the American Medical Informatics Association. 2006;13(1):16-23.
16. DiNardo J. Natural experiments and quasi-natural experiments. Microeconometrics: Springer; 2010. p. 139-53.
17. Richardson JT. Eta squared and partial eta squared as measures of effect size in educational research. Educational Research Review. 2011;6(2):135-47.
18. Cochran WG. Analysis of covariance: its nature and uses. Biometrics. 1957;13(3):261-81. 19. Miller GA, Chapman JP. Misunderstanding analysis of covariance. Journal of abnormal psychology.
2001;110(1):40. 20. Ambelie YA, Alene GD, Gebrekiros DH. Effect of integrated health system leading-managing-and-
governing for results model on institutional delivery: Team-based quasi-experiment. bioRxiv. 2019:775858.
21. Johnson RL. CEO must have authority to coordinate governance, management, medical staff. Hospital progress. 1984;65(4):49-53.
22. Levey S, Vaughn T, Koepke M, Moore D, Lehrman W, Sinha S. Hospital leadership and quality improve ment: rhetoric versus reality. Journal of Patient Safety. 2007;3(1):9-15.
23. Bayou B, Hailu T, Jenberie A, Minalu Y, Tesfamichael T. Transforming primary health care unit service delivery through leadership, management and governance (LMG) training: A field action report from Ethiopia. The Ethiopian Journal of Health Development (EJHD). 2020;34(2).
24. Rajkumar AS, Swaroop V. Public spending and outcomes: Does governance matter? Journal of develop ment economics. 2008;86(1):96-111.
25. Delavallade C. Corruption and distribution of public spending in developing countries. Journal of eco nomics and finance. 2006;30(2):222-39.
26. Ambelie Y, Alene G, Gebrekiros D. Modeling a reliable and valid framework for building and measuring the health system workforce’s competence to lead, manage and govern in Ethiopia: Factor analysis ap proach. 2020.

351
HT Bello-Ajao, AS Adeyemi, OO Aworinde, KM Owonikoko, AO Olabinjo. Ethiop Med J, 2021, Vol. 59, No. 4 ORIGINAL ARTICLE
ORAL PARACETAMOL VERSUS ORAL DICLOFENAC IN THE CONTROL OF UTERINE CRAMPING PAIN AFTER VAGINAL BIRTH
HT Bello-Ajao FMCOG1, AS Adeyemi FWACS1, OO Aworinde FMCOG, FWACS1*, KM Owonikoko FMCOG,
FWACS1, AO Olabinjo MWACS1
ABSTRACT
Introduction: Uterine cramping pain is a documented morbidity in the immediate postpartum period but there is no protocol for its management. The study aims to compare the effectiveness of multiple doses of oral paracetamol and diclofenac in the control of uterine cramping pain in women that had spontaneous vaginal delivery Methods: It is a randomized controlled study among 291 women that had spontaneous vaginal delivery at LAU-TECH Teaching Hospital Ogbomoso. They were recruited in the labour ward and randomized into Paracetamol, Diclofenac or Placebo groups. Initial pain intensity was assessed followed by administration of the drugs within 1hour of delivery and then 8 hourly until 24 hours. The instrument of survey was a proforma, and data were ana-lyzed using SPSS 22. Primary outcomes were adequacy of pain relief, onset of breastfeeding and maternal satisfac-tion. Secondary outcome was potential maternal side effects of the drugs. Results: The incidence of after-pain was found to be 100% with a large proportion (97.9%) being severe. Respon-dents’ age, gestational age, duration of labour and oxytocin augmentation of labour correlated significantly with severity of pain. Diclofenac was significantly better than paracetamol which in turn was better than placebo in relieving the pain, mean SPID- 8.71 (SD-1.17; CI-8.48-8.95), 6.78 (SD-2.25; CI-6.33-7.24) and 1.54(SD-1.35, CI-1.26-1.31), F-487.31; p< 0.001 for diclofenac, paracetamol and placebo, respectively. Side effects were seen only in diclofenac group. Conclusion: Multiple doses of oral Diclofenac and Paracetamol were effective in relieving uterine cramping after-pain although pain relief was more with diclofenac. Key words: uterine cramp, after-pain, postpartum analgesia, Diclofenac and Paracetamol
INTRODUCTION
Child birth is known to be a pain-associated event which gives considerable physical and psychological distress to the parturient and her care giver and if im-properly managed could jeopardise the woman’s re-productive career. (1-3) Apart from the pain experi-enced during labour and delivery, new mothers may experience pain following child birth from incision of caesarean delivery, perineal lacerations including epi-siotomy, the nipple while breastfeeding and uterine contractions associated with uterine involution. (3,4)
Shift of attention from the mother to her newborn makes the management of after birth pains to be less researched unlike the management of labour pains. (5, 6) A significant event of the puerperium is uterine invo-lution which is the physiological process by which the uterus returns to the pre-pregnancy state after delivery through cytoplasmic autolysis aided by uterine con-traction.
(6, 7) This uterine contraction is what is perceived as uterine cramping after pain and has been found to be more in multipara than primipara. (2,7,8) Al-though this pain is subjective and can be confusing to new mothers, it has invariably been described as being similar to menstrual pain, felt in the lower abdomen and back with severity likened to that of labour pain. (7,8) This pain has been described as being severe enough to require the most potent anal-gesia.(7-9,10,11) The justification for this study is based on the fact that uterine cramping pain can impair successful breastfeeding, the mother’s ability to care for her newborn and the establishment of good-quality mother-baby interaction. (11-13) it can also result in maternal neuro-hormonal stress responses, sleep and emotional disorders, anxiety, depression and mother’s inability to perform her daily routine. (3,12,14,15) Hence, the goals of safe motherhood cannot be achieved without effective management of after-pain from uterine cramps. (16,17)
1 Department of Obstetrics and Gynaecology, LAUTECH Teaching Hospital, Ogbomoso, Nigeria *Corresponding author’s email address: [email protected]; https://orcid.org/0000-0003-0771-616X

352
The study aimed to determine the incidence, pattern and determinants of after pain and to compare the efficacy of multiple doses of oral paracetamol 1000mg, diclofenac potassium 50mg and that of pla-cebo in relieving it.
MATERIALS AND METHODS
It was a randomized controlled study among consent-ing women that had spontaneous vaginal delivery in the labour ward of LAUTECH Teaching Hospital Ogbomoso, South-Western Nigeria. Exclusion criteria were women that had postpartum haemorrhage, women on drugs with known or possible analgesic or anxiolytic effects including women who had epidural analgesia in labour, women with history of peptic ul-cer disease or bleeding disorders, significant renal or liver impairment, preeclampsia, asthma, women with intrauterine fetal death or stillbirth and women on anticoagulants. Approval was obtained from the ethical committee of the hospital with protocol number LTH/OGB/EC/2016/118. Consenting participants were random-ized into intervention (diclofenac or paracetamol) or control (placebo) groups using simple random sam-pling. The interventional group was either diclofenac potassium tablets (Cataflam® by Novartis pharmaceu-ticals) administered at the dose of 50mg 8hourly or paracetamol tablets (Easadol® by May & Baker phar-maceuticals) administered at the dose of 1000mg 8hourly. The control group had placebo administered in two tablets 8 hourly. Sample size for the study was 291 (n=97 in each group) calculated using formula for multiple arm ran-domized control trial for continuous variable.(18) The social class of the patients was determined by the pa-tient’s level of education and her husband’s occupa-tion using Olusanya and co-workers classification system. (19) The mean Summed Pain Intensity Difference em-ployed was obtained from a pilot study assuming ef-fect size of 0.54, power of 90% at 95% confidence level and attrition rate of 10%. Women attending ante-natal clinic were informed about the study but recruit-ment was done when they presented in labour. The management of labour, delivery and postpartum pe-riod was done according to the departmental protocol. This included active management of labour, partho-graphic monitoring of labour and administration of intramuscular pethidine 100mg 4hourly until cervical dilatation was 6cm.
Immediately after vaginal delivery, (within 1 hour of initiating breastfeeding or within 1hour post-delivery, for parturients that could not breastfeed), all the women that met the inclusion criteria were counselled and written consent was obtained fol-lowed by baseline pain evaluation and then ran-domisation into the study groups. The chosen drug was then administered. Thus Easadol® 1000mg or Cataflam® 50mg or Placebo was administered orally, after food, to the assigned group. Subse-quently, at 8th, 16th and 24thhour or at discharge, whichever came first, administration of drug was repeated and other aspects of the proforma were appropriately administered. The study was discon-tinued in any respondent who developed known side effects associated with any of the drugs. Any par-ticipant that expressed uncontrolled pain in between the stipulated hours of drug administration was given tramadol tablet 50mg, per oris, statim for the break through pain. The baseline pain intensity within 1 hour post-delivery and at each of 8th, 16th and 24th hour was assessed using 11-point numeric pain intensity scale with zero indicating no pain and 10 the worst pain. For the extent of pain relief, the difference between two consecutive pain intensity measurements was calculated. The resultant pain intensity difference at each time was summed to give one numerical value, the Summed Pain Intensity Difference (SPID), for each subject. The higher the SPID the greater is the pain relief. Maternal satisfaction about pain relief was also assessed using Pain Relief Satisfaction Scale.
Primary outcomes were adequacy of pain relief, onset of breastfeeding and maternal satisfaction. Secondary outcome was potential side effects of the study drugs.
IBM SPSS version 22(20) was used for data entry and analysis. To determine significance, chi square test was used for categorical variables while ANOVA test was used when comparing difference in more than two means. Post Hoc test was per-formed to confirm any difference that occurred be-tween two groups whenever ANOVA test showed overall statistical difference in the group means. Correlation analysis (Spearman rho and Pearson) were used to test relationships. Logistic regression analysis was also performed to check the effect of the need for additional analgesia among the groups. Level of significance was set at p value ≤0.05.
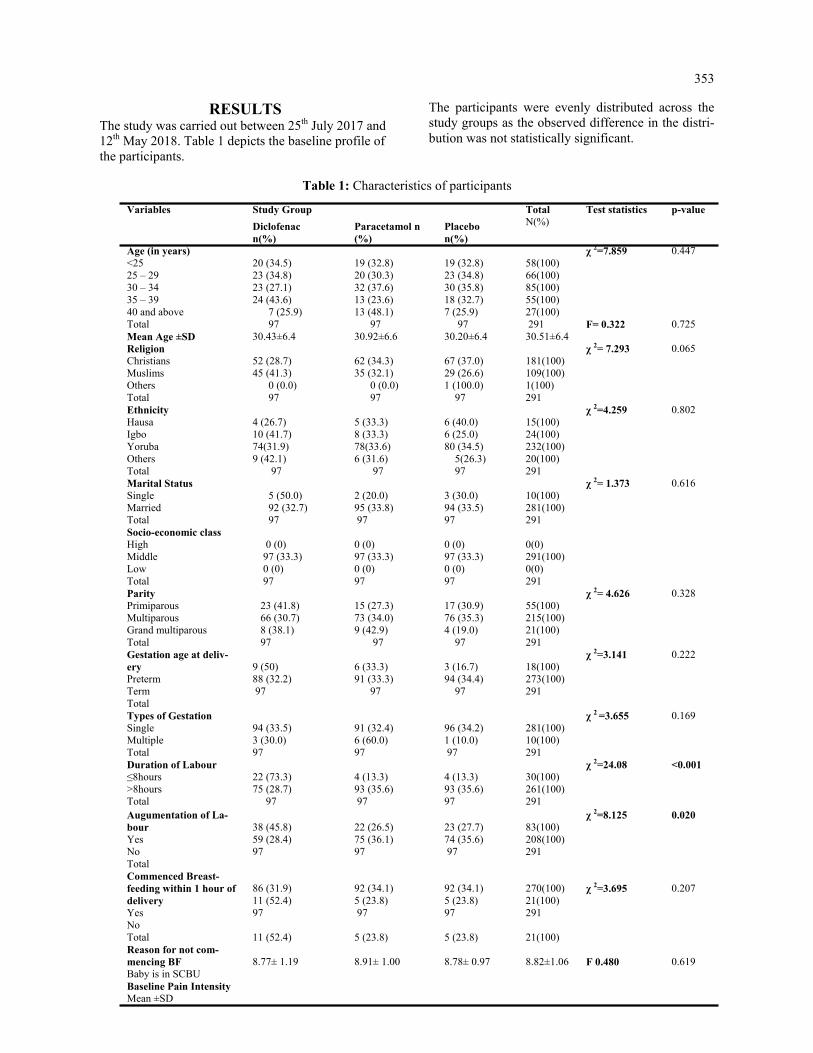
353
RESULTS The study was carried out between 25th July 2017 and 12th May 2018. Table 1 depicts the baseline profile of the participants.
The participants were evenly distributed across the study groups as the observed difference in the distri-bution was not statistically significant.
Table 1: Characteristics of participants
Variables Study Group Total N(%)
Test statistics p-value
Diclofenac n(%)
Paracetamol n(%)
Placebo n(%)
Age (in years) <25 25 – 29 30 – 34 35 – 39 40 and above Total Mean Age ±SD
20 (34.5) 23 (34.8) 23 (27.1) 24 (43.6) 7 (25.9) 97 30.43±6.4
19 (32.8) 20 (30.3) 32 (37.6) 13 (23.6) 13 (48.1) 97 30.92±6.6
19 (32.8) 23 (34.8) 30 (35.8) 18 (32.7) 7 (25.9) 97 30.20±6.4
58(100) 66(100) 85(100) 55(100) 27(100) 291 30.51±6.4
χ 2=7.859 F= 0.322
0.447 0.725
Religion Christians Muslims Others Total
52 (28.7) 45 (41.3) 0 (0.0) 97
62 (34.3) 35 (32.1) 0 (0.0) 97
67 (37.0) 29 (26.6) 1 (100.0) 97
181(100) 109(100) 1(100) 291
χ 2= 7.293 0.065
Ethnicity Hausa Igbo Yoruba Others Total
4 (26.7) 10 (41.7) 74(31.9) 9 (42.1) 97
5 (33.3) 8 (33.3) 78(33.6) 6 (31.6) 97
6 (40.0) 6 (25.0) 80 (34.5) 5(26.3) 97
15(100) 24(100) 232(100) 20(100) 291
χ 2=4.259 0.802
Marital Status Single Married Total
5 (50.0) 92 (32.7) 97
2 (20.0) 95 (33.8) 97
3 (30.0) 94 (33.5) 97
10(100) 281(100) 291
χ 2= 1.373 0.616
Socio-economic class High Middle Low Total
0 (0) 97 (33.3) 0 (0) 97
0 (0) 97 (33.3) 0 (0) 97
0 (0) 97 (33.3) 0 (0) 97
0(0) 291(100) 0(0) 291
Parity Primiparous Multiparous Grand multiparous Total
23 (41.8) 66 (30.7) 8 (38.1) 97
15 (27.3) 73 (34.0) 9 (42.9) 97
17 (30.9) 76 (35.3) 4 (19.0) 97
55(100) 215(100) 21(100) 291
χ 2= 4.626 0.328
Gestation age at deliv-ery Preterm Term Total
9 (50) 88 (32.2) 97
6 (33.3) 91 (33.3) 97
3 (16.7) 94 (34.4) 97
18(100) 273(100) 291
χ 2=3.141 0.222
Types of Gestation Single Multiple Total
94 (33.5) 3 (30.0) 97
91 (32.4) 6 (60.0) 97
96 (34.2) 1 (10.0) 97
281(100) 10(100) 291
χ 2 =3.655 0.169
Duration of Labour ≤8hours >8hours Total
22 (73.3) 75 (28.7) 97
4 (13.3) 93 (35.6) 97
4 (13.3) 93 (35.6) 97
30(100) 261(100) 291
χ 2=24.08 <0.001
Augumentation of La-bour Yes No Total Commenced Breast-feeding within 1 hour of delivery Yes No Total Reason for not com-mencing BF Baby is in SCBU Baseline Pain Intensity Mean ±SD
38 (45.8) 59 (28.4) 97 86 (31.9) 11 (52.4) 97 11 (52.4) 8.77± 1.19
22 (26.5) 75 (36.1) 97 92 (34.1) 5 (23.8) 97 5 (23.8) 8.91± 1.00
23 (27.7) 74 (35.6) 97 92 (34.1) 5 (23.8) 97 5 (23.8) 8.78± 0.97
83(100) 208(100) 291 270(100) 21(100) 291 21(100) 8.82±1.06
χ 2=8.125 χ 2=3.695 F 0.480
0.020 0.207 0.619
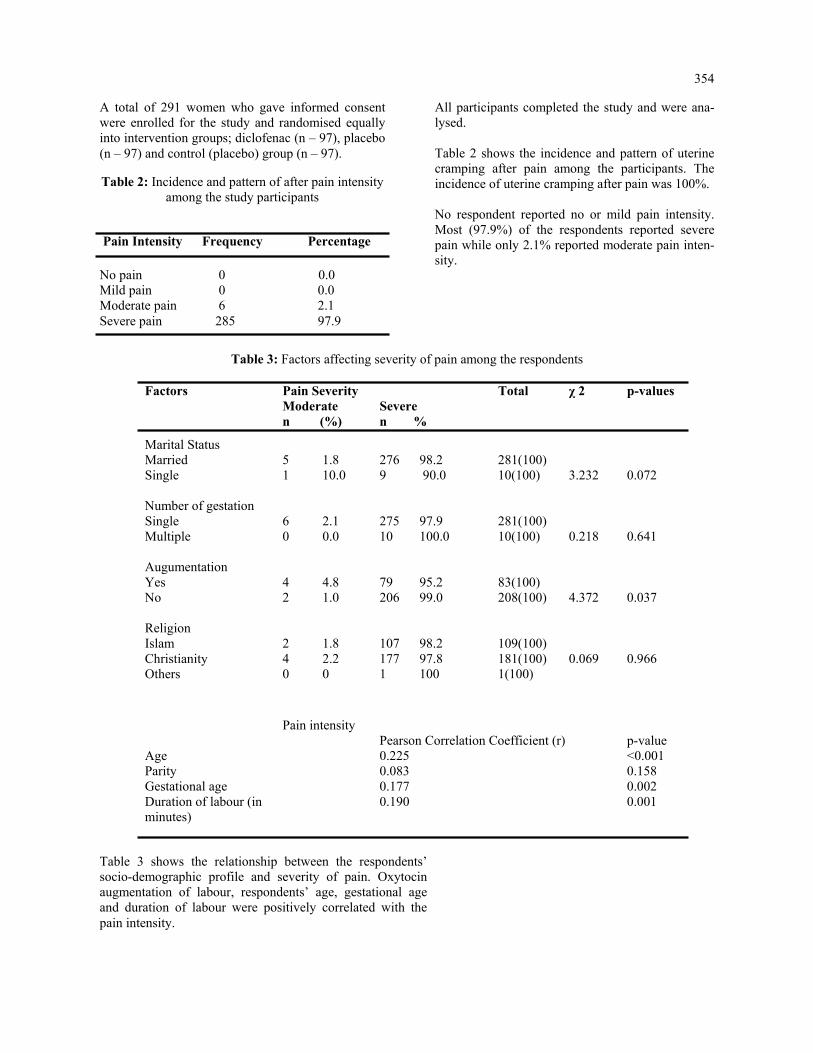
354
A total of 291 women who gave informed consent were enrolled for the study and randomised equally into intervention groups; diclofenac (n – 97), placebo (n – 97) and control (placebo) group (n – 97).
Table 2: Incidence and pattern of after pain intensity among the study participants
All participants completed the study and were ana-lysed. Table 2 shows the incidence and pattern of uterine cramping after pain among the participants. The incidence of uterine cramping after pain was 100%. No respondent reported no or mild pain intensity. Most (97.9%) of the respondents reported severe pain while only 2.1% reported moderate pain inten-sity.
Pain Intensity Frequency Percentage
No pain 0 0.0 Mild pain 0 0.0 Moderate pain 6 2.1 Severe pain 285 97.9
Table 3: Factors affecting severity of pain among the respondents
Factors Pain Severity Total χ 2 p-values Moderate Severe n (%) n %
Marital Status Married Single Number of gestation Single Multiple Augumentation Yes No Religion Islam Christianity Others
5 1.8 1 10.0 6 2.1 0 0.0 4 4.8 2 1.0 2 1.8 4 2.2 0 0
276 98.2 9 90.0 275 97.9 10 100.0 79 95.2 206 99.0 107 98.2 177 97.8 1 100
281(100) 10(100) 281(100) 10(100) 83(100) 208(100) 109(100) 181(100) 1(100)
3.232 0.218 4.372 0.069
0.072 0.641 0.037 0.966
Pain intensity
Pearson Correlation Coefficient (r) p-value Age Parity Gestational age Duration of labour (in minutes)
0.225 0.083 0.177 0.190
<0.001 0.158 0.002 0.001
Table 3 shows the relationship between the respondents’ socio-demographic profile and severity of pain. Oxytocin augmentation of labour, respondents’ age, gestational age and duration of labour were positively correlated with the pain intensity.
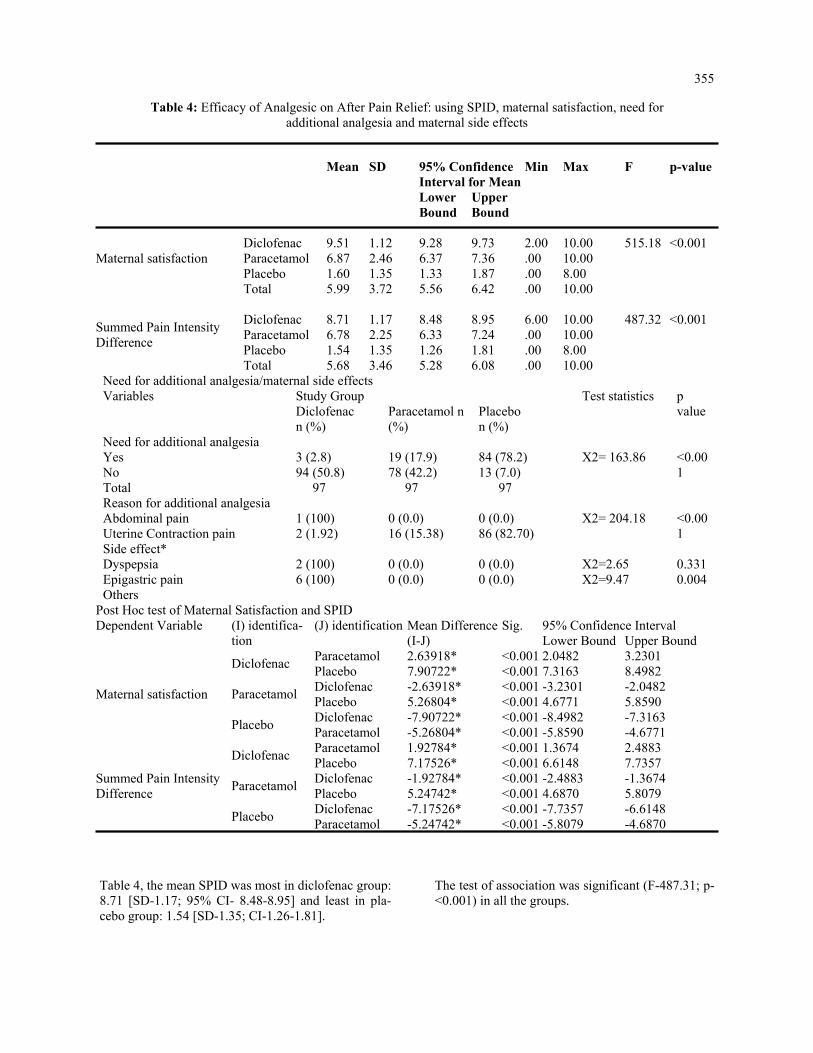
355
Table 4: Efficacy of Analgesic on After Pain Relief: using SPID, maternal satisfaction, need for additional analgesia and maternal side effects
Mean SD 95% Confidence
Interval for Mean Min Max F p-value
Lower Bound
Upper Bound
Maternal satisfaction
Diclofenac
9.51
1.12
9.28
9.73
2.00
10.00
515.18
<0.001
Paracetamol 6.87 2.46 6.37 7.36 .00 10.00 Placebo 1.60 1.35 1.33 1.87 .00 8.00 Total 5.99 3.72 5.56 6.42 .00 10.00
Summed Pain Intensity Difference
Diclofenac
8.71
1.17
8.48
8.95
6.00
10.00
487.32
<0.001
Paracetamol 6.78 2.25 6.33 7.24 .00 10.00 Placebo 1.54 1.35 1.26 1.81 .00 8.00 Total 5.68 3.46 5.28 6.08 .00 10.00
Need for additional analgesia/maternal side effects Variables Study Group Test statistics p
value Diclofenac n (%)
Paracetamol n (%)
Placebo n (%)
Need for additional analgesia Yes No Total
3 (2.8) 94 (50.8) 97
19 (17.9) 78 (42.2) 97
84 (78.2) 13 (7.0) 97
X2= 163.86
<0.001
Reason for additional analgesia Abdominal pain Uterine Contraction pain
1 (100) 2 (1.92)
0 (0.0) 16 (15.38)
0 (0.0) 86 (82.70)
X2= 204.18
<0.001
Side effect* Dyspepsia Epigastric pain Others
2 (100) 6 (100)
0 (0.0) 0 (0.0)
0 (0.0) 0 (0.0)
X2=2.65 X2=9.47
0.331 0.004
Post Hoc test of Maternal Satisfaction and SPID Dependent Variable (I) identifica-
tion (J) identification Mean Difference
(I-J) Sig. 95% Confidence Interval
Lower Bound Upper Bound
Maternal satisfaction
Diclofenac Paracetamol 2.63918* <0.001 2.0482 3.2301 Placebo 7.90722* <0.001 7.3163 8.4982
Paracetamol Diclofenac -2.63918* <0.001 -3.2301 -2.0482 Placebo 5.26804* <0.001 4.6771 5.8590
Placebo Diclofenac -7.90722* <0.001 -8.4982 -7.3163 Paracetamol -5.26804* <0.001 -5.8590 -4.6771
Summed Pain Intensity Difference
Diclofenac Paracetamol 1.92784* <0.001 1.3674 2.4883 Placebo 7.17526* <0.001 6.6148 7.7357
Paracetamol Diclofenac -1.92784* <0.001 -2.4883 -1.3674 Placebo 5.24742* <0.001 4.6870 5.8079
Placebo Diclofenac -7.17526* <0.001 -7.7357 -6.6148 Paracetamol -5.24742* <0.001 -5.8079 -4.6870
Table 4, the mean SPID was most in diclofenac group: 8.71 [SD-1.17; 95% CI- 8.48-8.95] and least in pla-cebo group: 1.54 [SD-1.35; CI-1.26-1.81].
The test of association was significant (F-487.31; p-<0.001) in all the groups.

356
DISCUSSION
The participants were evenly distributed across the study groups. The mean age of the respondents was 30.6 ± 6.5years which is similar to the mean age (30.4 ± 4.8years) of the women in Imarengiaye and co-workers’ study. (10) This could be due to similar geo-graphical location, Nigeria. However, this mean age is higher than the mean age (27.9 ± 4.2 years) obtained by Mahin and co –workers in Iran.21 This could be due to lower age of marriage among Arab women. (21) Yoruba ethnic group constituted majority (80%) of the study population, this is because of the geographical location of the study setting, Ogbomoso south-western Nigeria, which is a Yoruba land. Although all the women in this study belonged to the middle socioeco-nomic class, majority of them (57%) had tertiary level of education, 30% of them had secondary level of edu-cation and only 13% of them had primary level or no formal education. This is similar to the finding of Olayemi and co-workers which showed that the Yoruba ethnic group has high educational status. (22)
The incidence of uterine cramping after-pain was 100%, similar to the finding of Holdcroft and co-workers in which 96% of the respondents reported after- pain. (11) Also, Imarengiaye and co-workers found a large percentage (82.8%) of their respondents reporting after-pain. (10) In the present study, the mean baseline pain intensity was 8.82 [SD- 1.06; 95% CI-8.69-8.94; F-0.480; p-0.619] which is similar to the baseline pain intensity obtained in the pilot study, 8.24. This could be due to similar geographical region and hence, similar population study. In this study, a larger proportion (97.9%) reported severe pain, while only 2.1% reported mild pain, and no respondent reported mild or no pain. This could be because majority of the study population were of high educational status in similarity to the find-ing of other studies in which high educational status was shown to correlate positively with increased west-ernization and hence increased perception and desire for pain relief.(22,23) This is also similar to Thompson and co-workers’ finding of larger proportion (52.1%) of their respondents reporting severe pain. (24) How-ever, Declercq and co-workers found more respondents (50-80%) reporting moderate pain and less (10-18%) reporting severe pain; this could be due to difference in the study population as the participants were mostly of low parity and the study was limited to women who gave birth to single baby and could participate in Eng-lish. (25) In this study, correlation analysis shows that increasing parity correlated positively with pain intensity which agrees to the findings of Holdcroft and Eshkevari, De-clerq and co-workers in which parity correlated posi-tively with severity of pain intensity. (11,25,26).
Moreover, respondents’ age, gestational age, dura-tion of labour and oxytocin augmentation of labour were found to correlate significantly with severity of pain intensity. This is similar to previous docu-mentations in literature that longer duration of la-bour and delivery cause more stress and fatigue for mothers and this correlated positively with need for additional narcotics after delivery. (11-13) However, Taffazoli and co-workers found no sig-nificant association between socioeconomic factor, oxytocin augmentation, duration of labour and severity of after-pain. This could be due to differ-ence in sampling method and study population. (21) Taffazoli and co-workers used convenience sampling and the study group was composed, mainly, of younger age group and housewives. Also, breastfeeding was an exclusion criterion. In this study, test of significance could not be applied to socioeconomic class as all the respondents were of middle class; this could be due to the study set-ting (tertiary health facility). In this study, analysis of post intervention pain intensity, using ANOVA, showed significance in the three groups at each of 8th, 16th and 24th hour post-delivery (p = 0.000). Post Hoc analysis of these variables revealed that placebo and paraceta-mol groups were responsible for the difference in pain intensities. Placebo group had higher pain intensity than paracetamol group, the pain intensity of which in turn was more than that of diclofenac group. This is similar to the finding of Skovlund and co-workers, (27) in which placebo group had higher pain intensity compared to paracetamol group at 2 hour post intervention. Moreover, ANOVA showed statistical significance in pain relief evaluation among the three study groups. The Post Hoc analysis revealed that the signifi-cance was in the diclofenac and paracetamol group (p<0.001). Diclofenac was significantly better than paracetamol which in turn was better than placebo in relieving uterine cramping after-pain. This is similar to the conclusion in the study by Huang et al and the Cochrane review which stated that NSAIDS were significantly better than placebo in the control of uterine cramping after pain.(28,29) It is also similar to Skovlund and co-workers’ find-ing of oral paracetamol 1000mg being significantly better than placebo in the control of uterine involu-tion pain. (27) Majority (92.7%) of the respondents in this study commenced breastfeeding within one hour of de-livery, while only 7.3% did not.

357
The reason reported for not commencing breastfeed-ing was that baby was admitted into the special care baby unit. Uterine cramping after pain was not asso-ciated with breastfeeding in this study, unlike the finding in a survey of childbearing experiences in USA in which 71% of the women reported difficulty in breastfeeding mainly due to uterine cramping pain. This could be because the latter study was an obser-vational study which enabled unmodified assessment of the effect of breastfeeding on uterine cramping after-pain.(17) Side effects were significantly higher in diclofenac when compared to the paracetamol and placebo groups but similar in paracetamol and placebo groups. The side effect was mainly epigastric pain which was ameliorated with the administration of antacid. None of the respondents with side effects expressed concern to necessitate the need to discon-tinue the study on account of the side effects.
This is in keeping with the conclusion of the Coch-rane review in which paracetamol 1000mg had simi-lar maternal side effects as placebo. (29)
Conclusion Multiple doses of either oral Diclofenac or oral Paracetamol were effective in significantly relieving uterine cramping after-pain, although more with di-clofenac at the risk of more maternal side effect com-pared to paracetamol or placebo. Conflict of interest: All authors declare that they have no competing interests.
ACKNOWLEDGEMENT
We hereby acknowledge the contributions of the staff of department of Obstetrics and Gynaecology, LAU-TECH Teaching Hospital, Ogbomoso.
REFERENCES 1. Pirdel M, Pirdel L. Perceived environmental stressors and pain perception during labor among primiparous
and multiparous women.J Reprod Infertil. 2009;10:217-23. 2. Fawole AO, Adesina OA. Complaints in the puerperium. In: Ebeigbe PN. editor. Foundations of clinical ob-
stetrics in the tropics.Benin: Fodah Global Ultimate Limited; 2012. p. 232-6. 3. Onasoga OA, Opiah MM, Osaji TA, Iwolisi A. Perceived effects of midwives attitude towards women in la-
bour in Bayelsa State, Nigeria. Arch. Appl. Sci. Res. 2012;4:960-4. 4. James J, Prakash K, Ponniah M. Awareness and attitudes towards labour pain and labour pain relief of urban
women attending a private antenatal clinic in Chennai, India. Indian J Anesth. 2012;56:195. 5. Al-hakim NH, Alidreesi ZM. The effect of local anaesthetic wound infiltration on postoperative pain after
caesarean section. J Surg Pakistan. 2010;15:131-4. 6. Ebirim LN, Buowari OY, Ghosh S, editors. Physical and psychological aspects of pain in obstetrics. [Internet].
INTECH: Open Access Publisher; 2012 [cited 2016 April 26]. Available from: http://www.intechopen.com./…/pain.
7. Anne EM. The effect of pain and its management on mother and foetus. Clin Obstet Gynaecol. 1998;12:423. 8. Jacob A. A comprehensive textbook of midwifery. 3rded. New Delhi: Jaypee Brothers Publications; 2012.
p.208-16. 9. Iliadou M. Labour pain and pharmacological pain relief practice points. Health Sci J. 2009;3:197-201. 10. Imarengiaye CO, Akhideno I, Omoifo EC. Characteristics of postpartum pain associated with vaginal and cae-
sarean births. West Afr J Med. 2013;33:3-6. 11. Holdcroft A, Snidvongs S, Cason A, Doré CJ, Berkley KJ. Pain and uterine contractions during breast feeding
in the immediate post-partum period increase with parity. J Pain. 2003;104:589-96. 12. McKinney ES, James SR. Maternal child health nursing. 3rd ed. London: Elsevier Publishers; 2009. p.474-95. 13. Sleep J. Perineal care: A series of five randomised controlled trials. In: Robinson S. Thompson A, editors.
Midwives, Research and Childbirth. London: Chapman and Hall; 1991. p.199-251. 14. Loubert C, Hinova A, Fernando R. Update on modern neuraxial analgesia in labour: a review of the literature
of the last 5 years. Br J Anaesth. 2011;66:191-212. 15. Audu B, Yahaya U, Bukar M, El-Nafaty A, Abdullahi H, Kyari O. Desire for pain relief in labour in North-
eastern Nigeria. J Public Health Epid. 2009;1:053-7. 16. Bloomfield SS, Mitchell J, Cissell G, Barden TP. Analgesic sensitivity of two post-partum pain models. J
Pain. 1986;27:171-9.

358
17. Windle ML, Booker LA, Rayburn WF. Postpartum pain after vaginal delivery. A review of comparative analgesic trials. J Reprod Med. 1989;34:891-5. 18. Chow S, Shao J, Wang H. Sample Size Calculations in Clinical Research. In: CRC Biostatistics Series. London: Chapman & Hall; 2008. p. 58. 19. Olusanya O, Okpere E, Ezinmokhai M. The importance of social class in voluntary fertility control in a developing country. West Afr J Med 1985; 4:205-212. 20. IBM Corp. IBM SPSS statistics for windows, version 22.0. Armonk, NY: IBM Corp;2013. 21. Taffazoli M, Khadem Ahmadabadi M. Assessment of factors affecting afterpain in multiparous women delivered in Mashhad 17-Shahrivar Hospital, Mashhad, Iran. J midwifery reproductive health. 2013;2:60- 5. 22. Olayemi O, Aimakhu CO, Akinyemi OA. The influence of westernisation on pain perception in labour among parturients at the University College Hospital, Ibadan. J Obstet Gynaecol. 2006; 26: 329–31. 23. Faponle AF, Kuti O. Perception of labour pain by pregnant women in Southwestern Nigeria. Trop. J. Ob stet. Gynaecol. 2004; 21:153-5. 24. Thompson JF, Roberts CL, Currie M, Ellwood DA. Prevalence and persistence of health problems after childbirth: associations with parity and method of birth. Birth. 2002;29:83-94. 25. Declercq ER, Sakala C, Corry MP, Applebaum S, Herrlich A. Major Survey Findings of Listening to Mothers III: New Mothers Speak Out. J Perinat Educ. 2014;23:17. 26. Eshkevari L, Trout KK, Damore J. Management of postpartum pain. J Midwifery Womens Health. 2013;58:622-31. 27. Skovlund E, Fyllingen G, Landre H, Nesheim BI. Comparison of postpartum pain treatments using a se quential trial design. I. Paracetamol versus placebo. Eur J Clin Pharmacol. 1991;40:343-7. 28. Huang YC, Tsai SK, Huang CH, Wang MH, Lin PL, Chen LK, et al. Intravenous tenoxicam reduces uter ine cramps after Cesarean delivery. Can J Anesth.2002;49:384-7. 29. Deussen AR, Ashwood P, Martis R. Analgesia for relief of pain due to uterine cramping/involution af ter birth. The Cochrane Library. 2011.
359
Tigist Hailu, Bekureledet M.Dingle, Nicole Bodo, Tegbar Yigzaw, Workeabeba Abebe, Tigist Mekonnen, Enaw-gaw Mehari, Kassa Darge. Ethiop Med J, 2021, Vol. 59, No. 4
BRIEF COMMUNICATIONS
BUILDING A COVID-19 REPOSITORY WEBSITE FOR HEALTHCARE PROFESSIONALS IN ETHIOPIA
Tigist Hailu, MPH1,5, Bekureledet M.Dingle, BSc2, Nicole Bodo, BA1, Tegbar Yigzaw, MD, MPH, PhD2, Workea-beba Abebe, MD, MPH3, Tigist Mekonnen, MPH2, Enawgaw Mehari, MD4, Kassa Darge, MD, PhD1,5
ABSTRACT Health professionals dealing with the COVID-19, both in clinical care and in the public health domain, require up-to-date and relevant scientific information. The Diaspora and Ethiopian Advisory Councils on the COVID-19 pandemic in Ethiopia joined forces with the Ethiopian Medical Association to create a local repository of compre-hensive peer-screened information on COVID-19. We describe the motivating factors for such a repository, the process of creating the website, and the utilization of this information resource for Ethiopian healthcare profes-sionals.
INTRODUCTION
The international medical community has had mini-mal experience with the fast-evolving COVID-19 pan-demic (1). For medical professionals in low-resource countries such as Ethiopia, the learning curve is even steeper due to the lack of an authoritative, comprehen-sive COVID-19 information resource specifically tar-geted for the country. In response to this deficit, the Children’s Hospital of Philadelphia (CHOP) Depart-ment of Radiology’s Global Radiology Outreach and Education team collaborated with the Ethiopian Dias-pora High-Level Advisory Council on the COVID-19 Pandemic in Ethiopia, the Ethiopian Health Profes-sionals Advisory Council on the COVID-19 Pandemic in Ethiopia, People to People (P2P), and the Ethiopian Medical Association (EMA) to establish a comprehen-sive COVID-19 medical information website (2). Ethiopian healthcare professionals can access and navigate this repository to find up-to-date COVID-19 resources that will inform clinical and public health practices. Each publication, guideline, or webinar on the website is peer-screened to ensure its relevance for medical and public health practice in the country. The project was initiated in April 2020 and the webpage was launched on June 19, 2020. In this paper, we de-scribe the background for initiating this project, the process of creating it, and the outcome of our effort. Lack of a local comprehensive COVID-19 informa-tion resource for Ethiopian healthcare profession-als : The volume of information on COVID-19 on the internet is staggering (3, 4, 5). In a Google search on April 19, 2020, the term “COVID-19” generated 2.3 billion entries (6).
In comparison, the word “Ebola” garnered only 59.9 million entries (6). On the same day, the central resource for scientific medical publications, Pub-Med, showed 5,279 publications on COVID-19 since January 2020, i.e., published within fewer than 4 months (7). In contrast, on PubMed there are only 9,045 publications on Ebola spanning the past 43 years. These numbers illustrate how daunting it can be for busy healthcare professionals to navigate through the myriad of scientific and non-scientific information on COVID-19. In a matter of weeks, the COVID-19 pandemic be-came a worldwide crisis (8). The dearth of knowl-edge has spurred a flurry of research activities lead-ing to publications in unprecedented numbers and at a breakneck pace (9). For the first time, publications are bypassing formal online or print processes and being circulated in early formats in order to acceler-ate the sharing of new scientific information (10). Furthermore, most journals have made COVID-19 publications available as free downloads. In addi-tion to the scientific publications, epidemiological reports from a multitude of sources are appearing in real time (11). Healthcare institutions and govern-ment agencies are quickly generating COVID-19 guidelines and recommendations, which are fre-quently revised as our understanding of the virus develops. In Ethiopia there was no authoritative local resource of comprehensive information on COVID-19 that had been designed specifically to support healthcare professionals. In the early months of the pandemic, as medical knowledge about the new virus rapidly evolved, it was imperative to provide a central, well-organized,
1Children’s Hospital of Philadelphia, Philadelphia, PA, USA. 2Ethiopian Medical Association (EMA), Addis Ababa, Ethiopia. 3Department of Pediatrics and Child Health, Tikur Anbessa Specialized Hospital, College of Health Sciences, Addis Ababa University, Addis Ababa, Ethiopia. 4People2People, Washington, DC, USA. 5Perelman School of Medicine, University of Pennsylvania, Philadelphia, PA, USA. *Corresponding Author E-mail: [email protected]

360
easily accessible source of information with peer-selected clinical, research, and educational materials that would support Ethiopian healthcare professionals in combatting the spread of COVID-19. The Ethiopian Ministry of Health (MOH) was providing information primarily targeted to the public. On accessing its web-site on April 19, 2020, we found 19 posters, 2 bro-chures, 2 videos, 2 documents, and 3 online courses that required login access (12). Only the latter two resources were meant for healthcare professionals. Similarly, EMA had on the front page of its website some information about “Do’s and Don’ts regarding COVID-19” and a resource tab with a COVID-19 page. On April 19, 2020, this page contained 19 COVID-19 protocols, which were mostly local resources (13). EMA and the Diaspora COVID-19 Advisory Councils collaborated to address the discrepancy between the abundance of COVID-19 information worldwide and what was easily accessible to Ethiopian healthcare professionals. In response, we developed an organ-ized, comprehensive medical information resource targeting healthcare professionals. The development of the COVID-19 repository website: The development of the website was a col-laboration between CHOP’s Department of Radiol-ogy’s Global Radiology Outreach and Education team and EMA. The repository lives on the main website (www.ethiopianmedicalass.org) of EMA (Figure 1). This publicly accessible site serves as a local and cen-tralized resource center with a repository for compre-hensive and peer-screened information on COVID-19 which is available as full pdf files or videos. It also houses COVID-19 oriented diagnostic and treatment protocols selected for local healthcare professionals. Other professional societies and agencies, including those of all ancillary health services, are encouraged to establish links on their websites that would direct users to this central EMA COVID-19 repository. The first task in developing the repository was to des-ignate a coordinator. The person in this role communi-cated with peer screeners, facilitated selection of documents, and sent documents to the EMA webmas-ter. A webmaster was necessary to create and maintain the webpage, organize documents into pre-determined categories, and provide webpage access data. In order to ensure that the repository did not become an indis-criminate “dumping place” of COVID-19 information, 49 medical specialists and sub-specialists served as peer-screeners to share publications they deemed im-portant for their specialty and to review the documents in their category for suitability.
Most relevant subspecialties related to COVID-19 were represented from both the clinical and public health aspects. Included in the clinical subspecial-ties were the following: Anesthesiology, Cardiol-ogy, Emergency Medicine, Hematology, Intensive Care Medicine, Internal Medicine, Neurology, Ob-stetrics, Palliative Medicine, Pulmonology, Pathol-ogy, Pediatrics, Radiology, Primary Health Care/Family Medicine, Surgery, and Treatment. The pub-lic health sector encompassed Epidemiology, Infec-tion Prevention & Control, Mental Health, Model-ling, Pharmaceuticals, Personal Protective Equip-ment, Testing, and Vaccination. Nursing was incor-porated as well. The peer screeners were from Ethiopia (28) and the diaspora (21). Most of the peer screeners from Ethiopia and the diaspora were paired in their respective subspecialties to ensure a smooth transition when the website is eventually taken over by EMA. The management of the COVID-19 repository website: Management of the website includes the following components: the coordinator contacts peer-screeners bi-weekly for any publications needed to be uploaded to the webpage, requests peer screeners to review entries in their designated cate-gory, searches for new scientific literature, and sends new publications to the webmaster to upload to the site. The coordinator ensures documents are saved using a uniform naming system and keeps track of submitted documents. The website contains a wide range of clinical con-tent under the most important subspecialties regard-ing COVID-19, encompassing important public health sub-categories, nursing, and a section for recorded webinars on various clinical and public health topics. It also provides clearly visible sec-tions for guidelines and recommendations from the Ethiopian Diaspora and Local High-Level Advisory Council on the COVID-19 Pandemic in Ethiopia, the MOH, and the World Health Organization (WHO) COVID-19 websites. The repository website was not meant to replace PubMed or other similar resources. Instead, the unique offerings of this website are the disease fo-cus, the fact that the documents have been peer-screened and are relevant specifically for clinical care and public health practice in Ethiopia, that its PDFs are directly available for fast resource download, and its easy webpage navigation and search function. Finally, a key feature is that this is a locally maintained website easily accessible to Ethiopian healthcare professionals.

361
COVID-19 repository website traffic outcome and sustainability: A webinar launch was held on June 19, 2020 to inaugurate the COVID-19 repository web-page. The leadership of all the medical and public health professional societies in Ethiopia were invited to attend this virtual meeting. The webinar was also livestreamed on the EMA’s Facebook page to reach a broader audience. By April 2021, 584 documents were uploaded on the website and over 31,000 people accessed it. On average, documents have been downloaded 2,856 times monthly by site visitors (Figure 2). Since the release of the website, site visi-tors from Ethiopia have downloaded documents 20,230 times.
In fact, the publications have also been downloaded from other countries, including the USA, India, and China (Figure 3). The goal is for the repository website to be sus-tained by local stakeholders. The collaboration be-tween CHOP and the EMA is meant to initiate the first phase of this repository. Soon, there will be a transition of the coordination from CHOP to EMA, and EMA will take on the responsibility of main-taining the site and curating up-to-date resources.
Figure 1: The front webpage of COVID-19 Central on the website of the Ethiopian Medical Association (EMA).

362
Figure 2: The number of monthly downloads from the COVID-19 Central web-page on the Website of the Ethiopian Medical Associa-tion (EMA).
Figure 3: Geographic distribution of downloads from the COVID-19 Central webpage on the website of the Ethiopian Medical Association (EMA).
ACKNOWLEDGMENT We thank our medical science writer Lydia Sheldon for her editing support.
Conflict of interest: All authors declare that they have no competing interests

363
REFERENCES 1. Kupferschmidt K. Preprints bring 'firehose' of outbreak data. Science. 2020 Feb 28;367(6481):963-964.
doi: 10.1126/science.367.6481.963. 2. Ethiopian Medical Association (Internet). (cited 2020 Jun 19). Available from:
www.emacovid19resourcecenter.org. 3. Teixeira da Silva JA, Tsigaris P, Erfanmanesh M. Publishing volumes in major databases related to Covid
-19. Scientometrics. 2020 Aug 28:1-12. doi: 10.1007/s11192-020-03675-3. 4. Chen, Q., Allot, A., & Lu, Z. (2020). Keep up with the latest coronavirus research. Nature, 579(7798),
193. doi: 10.1038/d4158 6-020-00694 -1. 5. Fry, C. V., Cai, X., Zhang, Y., & Wagner, C. S. (2020). Consolidation in a crisis: Patterns of international
collaboration in early COVID-19 research. PLoS ONE, 15(7), e0236307. 6. Google (Internet). (cited 2020 Apr 19). Available from: www.google.com 7. PubMed (Internet). (cited 2020 Apr 19). Available from: www.pubmed.ncbi.nlm.nih.gov 8. Nowakowska J, Sobocińska J, Lewicki M, Lemańska Ż, Rzymski P. When science goes viral: The re
search response during three months of the COVID-19 outbreak. Biomed Pharmacother. 2020 Sep; 129:110451. doi: 10.1016/j.biopha.2020.110451.
9. Else H. How a torrent of COVID science changed research publishing - in seven charts. Nature. 2020 Dec;588(7839):553. doi: 10.1038/d41586-020-03564-y.
10. Aviv-Reuven, S., & Rosenfeld, A. (2020). Publication patterns' changes due to the COVID-19 pandemic: A longitudinal and short-term scientometric analysis. arXiv preprint arXiv:2010.02594.
11. Prieto-Alhambra D, et al. Unraveling COVID-19: a large-scale characterization of 4.5 million COVID-19 cases using CHARYBDIS. Res Sq (Preprint). 2021 Mar 1s44. doi: 10.21203/rs.3.rs-279400/v1.
12. The Ethiopian Ministry of Health (Internet). (cited 2020 Apr 19). Available from: www.moh.gov.et/ejcc/. 13. Ethiopian Medical Association (Internet). (cited 2020 Apr 19). Available from:
www.ethiopianmedicalass.org.

365
Hailemichael Desalegn Mekonnen, Hari Conjeevaram. Ethiop Med J, 2021, Vol. 59, No. 4
CASE REPORT
INABILITY TO SWALLOW TABLETS OFFERS AN OPPORTUNITY FOR DETEC-TION AND SUCCESSFUL TREATMENT FOR A RARE LIFETIME CAUSE OF
DYSPHAGIA
Hailemichael Desalegn Mekonnen, MD, PhD1*, Hari Conjeevaram, MD,2
ABSTRACT
Introduction: This case presents an adult who was diagnosed with viral hepatitis C, and offering treatment for this potentially life-threatening illness provided an opportunity for diagnosis and therapy of a previously unrecognized long-standing cause of dysphagia. Case Presentation: A 37-year-old female was diagnosed to have Hepatitis C virus (HCV) infection. Non-invasive assessment showed that she had moderate fibrosis and was recommended treatment with oral direct-acting antivi-ral (DAA) drugs. However, the patient was hesitant claiming that she had not been able to swallow any tablets for the last 30 years. Prior evaluation for her dysphagia was done with a barium swallow, which was reportedly nor-mal. She was advised to have an upper endoscopy (EGD) evaluation, and it revealed a prominent proximal eso-phageal web. This was that treated endoscopically and resulted in resolution of her long-standing dysphagia. Conclusion: Causes of dysphagia can be obscure and lead to significant compromise in quality of life and inability to take life saving drug treatment. Esophageal webs can present with a long history of dysphagia and due to the proximal nature, could be missed by routine investigations. High index of suspicion is important to persuade for an endoscopy procedure in undiagnosed long-standing cause of dysphagia. Keywords: Esophageal web; Dysphagia; Barium swallow; Upper GI Endoscopy
INTRODUCTION
This is a case of an adult patient with a long history of dysphagia whose diagnosis has been delayed due to a false reassurance by normal barium swallow study. The case was subsequently diagnosed as the patient was persuaded to undergo an upper gastrointestinal endoscopy (EGD) as she was unable to swallow tab-let. The investigation revealed a proximal circumfer-ential esophageal web.
CASE PRESENTATION
A 37-year-old female patient presented to our medical institution with a history of chronic fatigue and weight loss. The weight loss had been longstanding and she claimed that she has been basically consuming liquid diets and has trouble eating solid food including medi-cations, for the last 30 years. The patient and her fam-ily believed the symptoms started since childhood, but the diagnosis was obscured for a long period. During her childhood, she has been evaluated at different cen-ters, but to no avail, and the patients said that she started to ‘live with it’ being dependent on liquid and semisolid diets. General appearance showed a chroni-cally ill-appearing woman with a BMI 0f 18kg/m2.
On routine investigation, she was found to have a positive hepatitis C virus (HCV) antibody and sub-sequently was diagnosed to have ongoing viremia with a viral load of 582, 000 copies/ml. Further in-vestigations revealed that she has HCV genotype 4 infections and an abdominal ultrasound showed no obvious signs of cirrhosis. Other laboratory parame-ters showed hemoglobin of 11 gm/dl: all other labo-ratory evaluations (Liver chemistry tests, renal func-tion tests, electrolytes) were unremarkable. HBsAg and HIV antibody test were negative. Fibroscan (Echosens 402) was done as non-invasive marker of assessing fibrosis severity and it was 9.0 suggesting moderate/severe fibrosis. The patient was advised to undergo an upper GI endoscopy (EGD), which she strongly refused. For this reason, she was investigated with a barium swallow which showed a normal finding. This gave a false reassurance that her condition might be re-lated to a globus sensation or some type of psycho-logical stress. On the other hand, because of con-cern that she has significant hepatic fibrosis, it was recommended to treat with oral direct-acting antivi-ral (DAA) agents for her chronic hepatitis C.
1Department of Internal Medicine, St. Paul’s Hospital Millennium Medical College. 2 University of Michigan. *Corresponding Author - [email protected]

366
The patient, however, was very reluctant and declined therapy repeatedly claiming that she could not swal-low any medication pills. She was finally persuaded to have an upper GI endoscopy with anesthesia support. The endoscope was difficult to pass down beyond the upper esophageal sphincter as there was a circumfer-ential web, which was causing lumen narrowing and even the scope with a surrounding diameter of 8 mm could not pass [Figure 1]. This led to the diagnosis of a proximal esophageal web.
Figure 1: An upper esophageal web revealed on EGD in our 37-year old Ethiopian patient
The esophageal ring was then dilated with a pneu-matic dilator cautiously to avoid aspiration and it was successful leading to rupture of the membranous ring (See Figure 2).
Figure 2: The image after an esophageal balloon dila-tation has been done showing a rupture of the eso-
phageal web
After the procedure, the patient was complaining of some discomfort while swallowing, which resolved slowly, but could not get herself to be convinced that she can swallow and be able to take her drugs. A subsequent pneumatic dilatation was performed after a week and at this time, the scope was able to pass and the remnant ring ruptured easily and the patient was given psychological support and reas-surance. After this second therapy, the patient started eating solid food and she also started taking her drugs. She then showed marked improvement of her nutritional status. She successfully completed three months of DAA therapy (Velpatasvir + Sofos-buvir) and had a successful response with virologi-cal cure (sustained virological response/SVR) with undetectable virus at week 12 follow-up (SVR 12). She also slowly improved in her overall wellbeing with gratitude and has gained weight. It has been more than a year since she was put off follow up, and there are no complains of dysphagia.
DISCUSSION AND CONCLUSION
Esophageal web is an eccentric, thin < 2mm hori-zontal membrane and protrudes into the lumen of the esophagus. It is covered with stratified squamous epithelium and occurs anteriorly com-monly in the cervical and middle esophagus. (1) It is associated with focal narrowing in the post-cricoid area and mainly affects middle-aged females (2). Patients are usually asymptomatic and the true prevalence is not clearly known. Patients may have dysphagia and regurgitation based on the site of the stenosis and especially when the stenosis is severe. Hepatitis C Virus is one of the hepatotoxic viruses that could lead to chronic liver disease with liver failure, decompensation and lier cancer. It has af-fected 71 million of the world population and cur-rently has effective therapies that can lead to cure within 2-3 months of treatment. (3) Hepatitis C has also an extrahepatic manifestations involving differ-ent organs of the body, but there was no reports of esophageal web in the literature. (4) In patients undergoing barium esophagogram for dysphagia, 5 to 15 % of patients could have an eso-phageal web. In different literatures, it has been noted that patients usually do not become sympto-matic until after 40 years of age (5). Our patient came to our attention at the age of 37 years, even though, she has had long standing intermittent symptoms. Her case could be explained as one of the postulated mechanisms, the developmental the-ory, where the webs are expected to occur when a pleat of mucosa is formed by in-folding of redun-dant esophageal mucosa due to shortening of the esophagus.
367
Esophageal webs are developmental anomalies with unknown pathogenesis. Unlike rings these anomalies rarely encircle the lumen but instead protrude from the anterior wall, extending laterally but not to the poste-rior wall (6). Webs are common in the cervical esophagus and are best demonstrated on an esophago-gram with the lateral view. In up to 5% of cases, they are identified in an asymptomatic state, but when they are symptomatic they cause dysphagia for solids. Webs are fragile membranes and so respond well to esophageal bougienage with mercury weighted dila-tors (7). Symptomatic patients usually present with dysphagia to solids particularly hard ones (e.g., meat/bread), often intermittent, and patients may modify how they eat (chewing more thoroughly, etc.). In our patient, she had been avoiding swallowing hard solid foods including tablets and she was taking longer to chew before attempting to swallow foods. Esophageal webs are associated with Zenker’s diver-ticulum, dermatologic and immunological disorders, and iron deficiency anemia. There has also been a case report of celiac disease in association with eso-phageal web (8). In this current case, the patient’s evaluation did not reveal any of the above associations or findings, although she was incidentally noted to have presence of chronic Hepatitis C Virus infection. Literatures have shown that most children are asymp-tomatic, and, thus, they are far less detected and could adjust their life style and dietary habits as found in this case. This has been described as esophageal webs can present as a congenital manifestation and can stay until fourth decade without being diagnosed. The diagnosis of esophageal web can be made by bar-ium swallow study, however, if the esophagus is not distended adequately, it will give the appearance of subtle narrowing and can easily be missed (1). In a study published in 1985, the investigators found that barium detection rate can be evident in only 17 to 49 when proper techniques are not followed (9). Our pa-tient had a normal barium swallow and this is an im-portant lesson to improve our techniques in detection of esophageal webs and rings. It also showed that a normal barium swallow should not rule out upper eso-phageal pathology and additional investigations such as an upper endoscopy (EGD) may need to be done, especially in patients with long-standing symptoms. EGD shows a smooth, thin membrane that is usually non-circumferential and caution should be taken due to proximity to the upper esophageal sphincter. Once the diagnosis is made, management is usually per-formed with esophageal dilation and small webs usu-ally rupture during the endoscope traverses the web. The goals of management are relief of dysphagia and the prevention of recurrent symptoms and patients usually have an excellent improvement on follow-up (10).
Our patient required sequential sessions of pneumatic dilations after which she had marked improvement of her symptoms and was able to complete taking her oral DAA drugs for her chronic hepatitis C infection resulting in successful treatment and achieving sus-tained virological response (virological cure). She was also able to have improved sense of well-being and she was able to eat more sold diets and also gained weight. In conclusion, we would like to state that patients with long standing dysphagia should be investigated for rare causes that can be easily treated with an upper GI endoscopy resulting in sympto-matic relief and improved quality of life. In the case of our patient who was only 37 years old, unless an upper GI endoscopy had been done, the patient would have likely gone undiagnosed with persistent symptoms of her dysphagia and poor quality of life and potentially continued progression of her underly-ing chronic Hepatitis C virus infection. Abbreviations: GI-Gastrointestinal, DAA-Direct Acting Antiviral, EGD- EsophagoGastroduodeno-scopy, SVR-Sustained Virological Response, HCV-Hepatitis C Virus Informed Consent:- The patient gave an informed consent about the publication; PATIENT PERSPECTIVE :- Patient feels marked improvement from the intervention and happy that persuasion for the HCV treatment helped the diagno-sis which will otherwise never be attempted. Ethics approval and consent to Participate Waiver request was secured from the Institutional Review Board at St. Paul’s Hospital Millennium Medical College.
Consent for Publication: A written informed con-sent to publish this information was obtained from study participant. Availability of Data and material:- The data is avail-able from the corresponding author upon a reason-able request.
Competing Interest:-None
Funding: The authors declare that no conflict of interests. Authors’ Contributions HD is the primary treating physician and responsible for writing the primary draft. HC has been a consult-ant in the case, reviewed the draft and both have agreed to submit the manuscript.
ACKNOWLEDGEMENTS
We are thankful to the patient who is willing to share the case.

368
REFERENCES 1. Wanamaker R, Grimm I. Encyclopedia of Gastroenterology. Gastroenterology. 2004 Oct 1;127(4):1274-5. 2. Gouda MS, Al-lakani AI, Bedewy MM. Endoscopic findings in Egyptian patients with oesophageal dys-
phagia at different age groups. Am J Internal Med. 2015;3:224-30. 3. Mohamed AA, El-Toukhy NER, Said EM, et al. Hepatitis C Virus: Efficacy of New DAAs Regimens. Infect
Disord Drug Targets. 2020;20(2):143-149). 4. Younossi Z, Park H, Henry L, Adeyemi A, Stepanova M. Extrahepatic Manifestations of Hepatitis C: A Meta-
analysis of Prevalence, Quality of Life, and Economic Burden. Gastroenterology. 2016;150:1599-1608.) 5. Nosher JL, Campbell WL, Seaman WB. The clinical significance of cervical esophageal and hypopharyngeal
webs. Radiology. 1975 Oct;117(1):45-7. 6. Feldman M, Friedman LS, Brandt LJ, editors. Sleisenger and Fordtran's Gastrointestinal and Liver Disease E-
Book: Pathophysiology, Diagnosis, Management. Elsevier; 2020 Jun 9. 7. Atmatzidis K, Papaziogas B, Pavlidis T, Mirelis CH, Papaziogas T. Plummer–Vinson syndrome. Diseases of
the Esophagus. 2003 Jun 1;16(2):154-7. 8. Sinha SK, Nain CK, Udawat HP, Prasad KK, Das R, Nagi B, Singh K. Cervical esophageal web and celiac
disease. Journal of gastroenterology and hepatology. 2008 Jul;23(7pt1):1149-52. 9. Chen YM, Ott DJ, Gelfand DW, Munitz HA. Multiphasic examination of the esophagogastric region for stric-
tures, rings, and hiatal hernia: evaluation of the individual techniques. Gastrointestinal radiology. 1985 Dec 1;10(1):311-6
10. Beyler AR, Yurdaydin C, Bahar K, Gören A, Soykan I, Uzunalimoğlu Ö. Dilation therapy of upper esophageal webs in two cases of Plummer-Vinson syndrome. Endoscopy. 1996 Feb;28(02):266-7.

369
Alemayehu Ginbo Bedada, Imran Fizzah, Sesay Sheikha, Georges Azzie. Ethiop Med J, 2021, Vol. 59, No. 4
CASE REPORT TRAUMATIC TENSION PNEUMOCEPHALUS IN A 16 MONTH OLD CHILD: CASE
REPORT AND REVIEW OF THE LITERATURE
Alemayehu Ginbo Bedada, MD1*, Imran Fizzah, MOI2, Sesay Sheikha, MD3, Georges Azzie, MD4
ABSTRACT
Traumatic Tension Pneumocephalus is a rare condition especially in children. It occurs most often as a result of temporal or basal skull fracture, and may cause neurological deterioration. CT scan findings are considered pathognomonic. A 16-month-old girl presented with unstable vital signs and a seizure episode after being struck by a reversing car. A day later she developed rhinorrhea and high grade fever. CT scan of the brain demonstrated a Mount Fuji sign. Her neurological status remained essentially normal. She was managed non-operatively and was discharged uneventfully eight days after the accident. In selected paediatric cases, traumatic tension pneumo-cephalus may be managed non-operatively. Key words: Child, Mount Fuji sign, Non-surgical treatment, Traumatic tension pneumocephalus Work done: At Princess Marina Hospital, Department of Surgery, Gaborone, Botswana
INTRODUCTION
Traumatic Pneumocephalus (TP) is characterized by the abnormal presence of air in the cranial cavity fol-lowing traumatic injury (1-6). It has been reported in 3.9% 9.7% of head injuries (1-3). Trauma is incrimi-nated in 67% - 74% of pneumocaphalus cases (4-7). Tension traumatic pneumocephalus (TTP) is a clinical entity characterized by continued buildup of air within the cranial cavity, leading to abnormal pressure ex-erted on the brain and subsequent neurologic deterio-ration (2-4). TTP is classified as acute when it occurs within 72 hours of the traumatic event and as delayed when it occurs thereafter (1,2,4,5). Two mechanisms are postulated TP: the ’inverted soda bottle effect’, where CSF loss creates negative intracranial pressure, drawing air into the subarach-noid space (1-5,8), and the “ball-valve” theory where there is a unidirectional movement of air into the cra-nial cavity, most often the extradural space (1,2,4-7).
Clinical presentations of TP include nausea, vomiting, poor feeding in children, irritability, dizziness, head-ache, seizure, depressed mental status, cerebrospinal fluid rhinorrhea, pupillary abnormalities and hemody-namic changes (1,2,4,7). More serious presentations include cardiac arrest and blindness (4). Head CT remains the most accurate imaging study with the ability to detect as little as 0.5 cm3 of air (1,2,4-8).
The CT finding of bilateral compression of the fron-tal lobes is called the peaking sign (5). When there is progression to TTP the increased pressure not only compresses, but separates the frontal lobes, thus creating the so-called “Mount Fuji” sign (1,2,4-7). This finding is considered virtually pathogno-monic of TTP.
Uncomplicated TP tends to resolve spontaneously (2-5). Evidence of progression to TTP based on deteriorating neurological status or the Mount Fuji sign on CT scan usually mandates surgical interven-tion. Out team describes the rare case of traumatic tension pneumocephalus in a 16-month-old child (the “youngest” in literature), and reviewed and summarized the current knowledge on TTP.
Case Presentation A 16-month-old girl presented to the hospital after being struck by a reversing car. The mother reported an episode of generalized seizure, however, There was no vomiting or loss of consciousness. On ex-amination, she was alert, with a heart rate of 193 beats/min, respiratory rate 36 breaths/min, tempera-ture 37.5 0C and oxygen saturation 99% on room air. Her Glasgow coma scale (GCS) score was 15/15 with no focal neurological deficits, and no other abnormalities. Her laboratory tests, chest, cer-vical and pelvic-rays were all normal. CT scan of the head demonstrated a right temporoparietal linear skull fracture, as well as cerebral edema and a right scalp hematoma.
1Department of Surgery, Princess Marina Hospital, Faculty of Medicine, University of Botswana, Gaborone, Bot-swana. 2 Medical Officer Intern, Princess Marina Hospital, Gaborone, Botswana. 3Department of radiology, Prin-cess Marina Hospital, Gaborone, Botswana. 4Division of General and Thoracic Surgery, Hospital for Sick Chil-dren, Toronto Canada. *Corresponding Author E-mail: [email protected]

370
She received analgesics, antibiotics and seizure pro-phylaxis. On day two of admission, she was noted to have rhinorrhea. Her temperature rose to 39.4 0C, and her pulse rate increased to 210 beats/min. There was no hypotension, and her oxygen saturation was 98% on room air. A repeat CT scan of the head was done which demonstrated pneumocephalus, a Mount Fuji sign (Figure 1) and a basal skull fracture (not detected on the initial CT). A diagnosis of TTP was made. Despite this, her neurologic condition did not deterio-rate. Cefotaxime (Claforan, Sanofi-Aventis) was in-creased to meningitis dose as there was no other ex-planation for the raised temperature. She was nursed in a Fowler’s position (30 degrees head up). In spite of the Mount Fuji sign on CT head, we opted for a non-operative approach given her stable and otherwise normal neurological condition.
Figure 1: The second CT head demonstrating “Mount Fuji sign” (see arrow). The patient improved: her heart rate and temperature normalized. Her rhinorrhea completely resolved by the 6th day of admission. She was discharged on the 8th day of admission. She was formally re-evaluated one and four months post discharge: she was asympto-matic and had a normal neurologic examination. The follow up CT brain at four months after discharge was within normal limits. (Figure 2)
Figure 2:. The third CT head demonstrating a normal finding.
DISCUSSION
Our one year old patient is the youngest reported in the literature, and the second case reported in Af-rica. In the largest series reported, of 101 patients, the youngest was three and the oldest 91years (3).
The air in TP is commonly located in the subdural space (5,7) but can be found in the epidural, intra-ventricular and intracerebral spaces (3,5-7). The etiologic factors were motor vehicle collision in 30%, blunt assault in 25%, fall in 20% motorcycle accident in 15%, gunshot in 5%, and stabbing in 5% (4). Our patient was struck by a reversing car.
The most common symptom reported in the litera-ture is headache (1,2,4,7). Given the age of our pa-tient, we could not appreciate this with certainty. The predominant symptoms in our patient were agitation and feeding intolerance. The major sign was rhinorrhea. The pathognomonic finding on CT of the head was the Mount Fuji sign. In the setting of trauma, the most common source of pneumocephalus is thought to be a temporal bone fracture (6,8). The second CT scan demonstrated a significant Mount Fuji sign, which is considered strongly suggestive of TTP. Of particular interest in this case, the alarming CT scan finding was not ac-companied by any obvious deterioration in neuro-logical status. In the eyes of many, the finding of a Mount Fuji sign on the CT scan of a patient with a history of head trauma constitutes a neurosurgical emergency and mandates prompt operative management. There are, however, a few cases reported with Mount Fuji sign who did not require surgical intervention (1,2,5,6). Elements described in the non-operative management include adequate analgesia, Fowler position of 300, avoiding Valsalva maneuver, 100% oxygen, prophylactic antimicrobial therapy (especially in posttraumatic cases), frequent neu-rologic checks, and repeat CT scans (1,2,4). Be-cause our patient did not have neurological deterio-ration, we opted for close observation and non-operative management. She was given antibiotics and pain medication, and she was placed in a Fowler position (300 head-up (5).
Surgical intervention is required when the air within the cranial vault causes increased pressure and dete-rioration in the level of consciousness (5). Surgical management targets removal of intracranial air. This may be accomplished through a burr hole, a craniot-omy or a needle aspiration (3-5). Outcomes seem best when the TP occurs solely in combination with a bony fracture of the vault (3).

371
This was the case in our patient. When TP occurs in combination with an acute subdural hematoma or is diagnosed in association with the presence of multiple air bubbles scattered over the basal cisterns and the posterior fossa, outcomes are less favorable (3).
Conclusion Although vary rare, a diagnosis of TTP should be con-sidered even in very young trauma patients. TTP may be treated non-surgically in selected patients, espe-cially if there is no neurological deterioration. While many consider the presence of a Mount Fuji sign on CT head to be strongly suggestive of TTP, this finding in and of itself may not necessarily mandate surgical intervention.
ACKNOWLEDGMENT
We are thankful to the patient’s mother who kindly agreed to share our experience with the medical frater-nity.
Conflict of interest: The authors declare no con-flict of interest.
Funding: No fund involved.
Ethical consideration: The mother to the child consented to the publication of this report for the purpose of education without patient identifier.
Authors’ contribution: All four authors did litera-ture review. The first draft of the manuscript was prepared by AGB, and critically revised by AGB and GA. SS reported on all CT head films. AGB and IF followed the patient. All four authors revie-wed the final version of the manuscript and agreed to submit to Ethiopian Medical Journal for publi-cation.
REFERENCES 1. Solomiichuk VO, Lebed VO, Drizhdov KI. Posttraumatic delayed subdural tension pneumocephalus. Surgical
neurology international. 2013;4. 2. Kankane VK, Jaiswal G, Gupta TK. Posttraumatic delayed tension pneumocephalus: Rare case with review of
literature. Asian journal of neurosurgery. 2016;11(4):343. 3. Steudel WI, Hacker H. Acute intracranial pneumocephalus: Prognosis and management-a retrospective analy-
sis of 101 cases. Neurosurgical review. 1989;12(1):125-36. 4. Pillai P, Sharma R, MacKenzie L, Reilly EF, Beery PR. Traumatic tension pneumocephalus–Two cases and
comprehensive review of literature. International journal of critical illness and injury science. 2017;7(1):58. 5. Dabdoub CB, Salas G, Silveira ED, Dabdoub CF. Review of the management of pneumocephalus. Surgical
neurology international. 2015;6. 6. Gill HS, van As AB. Tension pneumocranium in childhood trauma. World Journal of Pediatrics. 2008;4
(3):231-3. 7. Raza R, Shakil A, Anwar M. Tension Pneumocranium: The Largest Case Series. PJR. 2016;26(3). 8. Martin RJ, Holthouse DJ, Wayne TG. Localising the source of pneumocephalus: a diagnostic problem. Journal
of clinical neuroscience. 2002;9(2):216-8.

373
Tan Shong Sheng, Mohamed Ashraf Mohamed Daud, Wan Mokhzani Wan Mokhter, Rosnelifaizur Ramely, Nik Mohd Nurhafizi Nik Anuar. Ethiop Med J, 2021, Vol. 59, No. 4
CASE REPORT
UNDIAGNOSED URETEROVAGINAL FISTULA IN CONGENITAL DUPLEX KIDNEY WITH ECTOPIC URETERIC INSERTION TO URETHRA; SOMETHING
TO LOOK FOR?
Tan Shong Sheng, MD, MRCS1,3, Mohamed Ashraf Mohamed Daud, MBBS, FEBU3*, Wan Mokhzani Wan Mok-hter, MD, MMed1,3*, Rosnelifaizur Ramely, MD, MMed1,3, Nik Mohd Nurhafizi Nik Anuar, MD, MMed2,3
ABSTRACT
Continuous urinary incontinence in young female with normal voiding pattern should prompt proper assessment for ectopic ureter. We report a young female who presents with continuous urinary incontinence and malodourous urine. She was frequently treated as recurrent urinary tract infection and subsequently referred to our urology unit. Initial imag-ing revealed right duplex kidney with ectopic ureter, hence she had undergone right heminephrectomy. However her symptoms does not improve significantly. Further evaluation revealed uretero–urethral fistula and uretero–vaginal fistula. She then underwent urethroureteral and ureterovaginal fistula repair, which resolved her distress-ing urinary incontinence. Keywords: Ectopic ureter; urinary incontinence; female; urinary tract fistula
INTRODUCTION
The term “ectopic ureter” denotes a ureter that inserts at or distal to the bladder neck. Ectopic ureters most commonly occur in females and often drain into upper moiety of a duplex kidney (1). In most females with an ectopic ureter, the ureter has its insertion either into genital tract or urethra (2). This leads to typical symp-tom of continuous urinary incontinence with an other-wise normal voiding pattern. Screening with ultra-sonography and/or intravenous urography (IVU) could assist in confirming the affected system which likely to be upper pole moiety of a duplex collecting system (3,4). We report a case of young lady who presents with urinary incontinence since childhood and fre-quent urinary tract infection, then found out to have ectopic ureter with uretero–urethral fistula and uretero–vaginal fistula. Case Presentation We report a 31-year-old lady presented to us with a complaint of urinary incontinence since the age of 8, without any prior history of trauma or fall. She denied having bowel or neurological symptoms. She had fre-quent visits to the hospital and was treated as a recur-rent urinary tract infection. Micturition cystourethro-gram (MCUG) revealed right distal ureteric bulbous distension and right duplex kidney, with no demon-strable fistulous connection. Contrasted enhanced computed tomography (CT) of the abdomen/pelvis revealed complex right duplex kidney.
Right upper moiety revealed hydronephrosis and hydroureter with possible ectopic ureteric insertion. Subsequently intravenous urography (IVU) revealed the poorly function of the right upper moiety with normal function of right lower moiety. She had undergone right retrograde pyelogram with ureterorenoscope and right ureteric stenting, fol-lowed by right heminephrectomy and ureterectomy at the age of 24. Histopathological examination re-port revealed ureteritis in right upper moiety ureter and chronic pyelonephritis in right upper moiety nephrectomy. Postoperatively she continued to complain of foul–smelling urine dribbling from the vagina that per-sisted for many years. Repeated MCUG revealed residual right ureteric stump with evidence of reflux from the urethra during micturition phase and likely urethrovaginal fistula (Figure 1). Rigid cystoscopy and contrast study revealed ure-throrectal fistula at 7 o'clock just distal to the bladder neck. There were 2 openings seen at 4 o'clock and 10 o’clock location in the ectopic ureter, contrast injec-tion showed communication with the vagina (Figure 2A and 2B). On table retrograde urethrography done through the urethroureteral fistula revealed remaining right ectopic ureter up to mid part of ureter.
1Department of Surgery, School of Medical Sciences, Universiti Sains Malaysia Health Campus, Kelantan, Malaysia 2Department of Surgery, Faculty of Medicine, Universiti Sultan Zainal Abidin (UniSZA), Terengganu, Malaysia 3Hospital Universiti Sains Malaysia, Kelantan, Malaysia *Corresponding authors’ email addresses: [email protected] & [email protected]

374
At the age of 30-years, she was subjected to ure-throureteral and ureterovaginal fistula repair by trans-vaginal approach. Intraoperatively the opening of urethroureteral fistula was identified just below the bladder neck and sepa-rated from the normal urethra opening.
The fistula was ligated and closed with four layers followed by Martius Flap to prevent recurrence (Figure 3). Postoperatively, she did not complain of urinary incontinence anymore during clinic follow up.
Figure 1: Repeated MCUG after initial surgery revealed reflux to the remnant of stump on the right side. The stump is seen arising from the urethra and extending superiorly into the lower border of sacral ala. Posteriorly, there is fistulous communication between the urethra and vagina with opacification
of the vagina and uterine cavity.
Figure 2 (A): Cystoscopy view showing (arrow) opening of right ectopic ureter below the bladder
neck.
Figure 2 (B): Cystoscopy view showing image in-side the right ectopic ureter, there is ureterovaginal
fistula with 2 opening (arrow).
Figure 3: Intraoperative view: right ectopic ureter was separated from urethra and ligated, primary
repair of urethra with Martius fat Flap done. (A)Ectopic ureter with urethroureteral fistula,
(B)Normal urethra opening

375
DISCUSSION
An ectopic ureter is known as a ureter that abnormally place at or distal to the bladder neck, or outside of the urinary tract entirely. This is commonly due to em-bryological malformation, where the ureteric bud arises more cephalad than usual on the mesonephric duct, leading to distal ectopic ureteric insertion. The ureter remains attached to the mesonephric duct for longer, migrates more caudally than usual and inserts into either the urinary tract distal to the bladder or the genital tract (5).
The mesonephric duct remnant will turn into the epoo-phoron, oophoron and Gartner’s duct in the female. When the ectopic ureteric bud included into the adja-cent structures of paramesonephric duct origin, this will lead to urinary drainage into the female genital tract (1,5). Usual sites of ectopic ureter in the female include urethra (35%), vestibule (34%) and vagina (25%) (2), which is demonstrated in our case who was found to have urethra – ureter fistula and uretero vagi-nal fistula. She complained of continuous urinary in-continence due to the insertion of ectopic ureter distal to the urethral sphincter as well as into vagina. The female with an ectopic ureter has continuous uri-nary incontinence with otherwise normal urinary pat-tern, often associated with abnormal urine odour which warrants a thorough assessment. They often suffer from wet and erythematous perineal rash due to persistent incontinence from an ectopic ureter. De-tailed inspection may demonstrate urine leak from the vestibule and / or vaginal orifice (1).
The imaging studies should aim to recognize any ad-ditional poorly functioning renal parenchyma, particu-larly when initial imaging reported a “solitary” kid-ney. IVU is useful to demonstrate if duplex system is present, though occasionally required a delayed phase (6).
Studies had showed that laparoscopic nephroureter-ectomy is comparable to its open counterpart (6 – 8). Irrespective of the technique used, it is impera-tive to identify the ectopic / dysplastic kidney and / or ureter involved. Urinary incontinence can be cured with removal of poorly functioning ectopic kidney and its ectopic ureter. Conclusions An ectopic ureter assessment should be considered in females with continuous urinary incontinence with normal voiding patterns, irrespective of age. Imaging studies can be helpful, from initial ultra-sonography and/or IVU, followed by detailed imag-ing such as CT or fluoroscopy. Once the ectopic ureter and affected renal unit are identified, we can offer a cure for this disturbing symptom and provide a better quality of life in these affected patients. Competing interests There was no funding for the study and no conflicts of interest to disclose.
ACKNOWLEDGEMENT
We would like to thank Dr. Ahmad Amir Ismail, Department of Obstetrics and Gynaecology, Univer-siti Sains Malaysia for identification of patient’s concern and referring her to us when she still com-plained of having urinary incontinence. We also like to extend our appreciation to Department of Pathol-ogy, Radiology and Surgery, Universiti Sains Ma-laysia for their administrative support, and the pa-tient for her cooperation.
REFERENCES 1. J.G. Borer et al. A Single – system ectopic ureter draining an ectopic dysplastic kidney: delayed diagno sis in the young female with continuous urinary incontinence. British Journal of Urology. 1998; 81, 474– 78. 2. Ellerker AG. The extravesical ectopic ureter. Br J Surg. 1958; 45, 344 – 53 3. Borer JG, Corgan FJ, Krantz R, Gordon DH, Maiman M, Glassberg K. Unilateral single vaginal ectopic ureter with ipsilateral hypoplastic pelvic kidney and bicornuate uterus. J Urol 1993; 149: 1124–7 4. Gharagozloo AM, Lebowitz RL. Detection of a poorly functioning malpositioned kidney with single ec topic ureter in girls with urinary dribbling: imaging evaluation in five patients. Am J Roentgen 1995; 164: 957–61. 5. Schlussel RN, Retik AB. Anomalies of the ureter. In Walsh PC, Retik AB, Vaughan ED Jr, Wein AJ, eds, Campbell’s Urology, 7th edn, Vol. 2. Philadelphia: WB Saunders, 1997: 1820–9

376
6. Liu KKW, Yeung CK, Lee KH, Ku KW. Ectopic ureter as a cause of wetting: the role of laparoscopy in its management. Aust NZ J Surg 1996; 66: 325–6. 7. Suzuki K, Ihara H, Kurita Y et al. Laparoscopic nephrectomy for atrophic kidney associated with ectopic ureter in a child. Eur Urol 1993; 23: 463–5. 8. Moores D, Cohen R, Hayden L. Laparoscopic excision of pelvic kidney with single vaginal ectopic ureter. J Pediatr Surg 1997; 32: 634–5.

377
EDITORIAL POLICY
Overview Ethiopia’s oldest medical journal, The Ethiopian Medical Journal (EMJ) is the official organ of the Ethiopian Medical Association (EMA). The EMJ is devoted to the advancement and dissemination of knowledge pertaining to the broad field of medicine in Ethiopia and other developing countries. The journal first appeared in July 1962 and has been published quarterly (January, April, July, October) without fail since then. It has been published in both online (www.emjema.org) and hard copy (ISSN0014-1755) versions. The EMJ continues to play an important role in documenting and disseminating the progress of scientific medicine, and in providing evidence base for health policy and clinical practice in Ethiopia and Africa at large. Our online journal is open access. The hard copies are distributed to members of the Ethiopian Medical Associa-tion. Hard copies of the Journal are distributed to institutions and organizations (internal and external) based on subscription. Reviewing procedure Peer reviewers The Ethiopian Medical Journal uses a double-blind review system for all manuscripts. Each manuscript is reviewed by at least two reviewers. The reviewers act independently, and they are not aware of each other’s identities. The reviewers are selected solely based on their relevant expertise for evaluating a manuscript. They must not be from the same institution as the author(s) of the manuscript, nor be their co-authors in the recent past. The purpose of peer review is to assist the author in improving papers and the Editorial Board in making decision on whether to accept or reject a manuscript. Reviewers are requested to decline if they have a conflict of interest or if the work does not fall within their expertise. Peer review process Manuscripts are sent for review only if they pass the initial evaluation (pre-review by the Editorial Board) regard-ing their style, methodological accuracy, ethical review documentation and thematic scope. A special care is taken that the initial (pre-review) evaluation is done in 3-5 days. The Journal policy is to minimize time from submission to publication without reducing peer review quality. Cur-rently the total period from the submission of a manuscript until its publication takes an average of six months. Peer reviewers are requested to respond within four weeks. During the review process, the Editor-in-Chief may require authors to provide additional information (including raw data) if they are necessary for the evaluation of the manuscript. These materials shall be kept confidential and must not be used for any other purposes. The entire review process takes place under the supervision of the Editor-in-Chief in an online environment, with the assistance of the Journal Secretariat. The online system also allows authors to track the manuscript review pro-gress. Resolving inconsistencies In case that the authors have serious and reasonable objections to the reviews, the Editorial Board assesses whether a review is objective and whether it meets academic standards. If there is a doubt about the objectivity or quality of review, the Editor-in-Chief will assign additional reviewer(s). Additional reviewers may also be assigned when reviewers’ decisions (accept or reject) are contrary to each other or otherwise substantially incompatible. The final decision on the acceptance of the manuscript for publication rests solely with the Editor-in-Chief.

378
Responsibilities Authors' responsibilities This is provided in the ‘Guidelines to Authors’ which appear in each issue of the Journal. Authors must guarantee that their manuscripts are their original work, that they have not been published before, and are not under consid-eration for publication elsewhere. Parallel submission of the same paper to another journal constitutes misconduct and eliminates the manuscript from further consideration. Work that has already been published elsewhere cannot be reprinted in the Ethiopian Medical Journal Authors are exclusively responsible for the contents of their submissions and must make sure that the authors listed in the manuscript include all and only those authors who have significantly contributed to the submitted manu-script. If persons other than authors were involved in important aspects of the research project and the preparation of the manuscript, their contribution should be acknowledged in the Acknowledgments section. It is the responsibility of the authors to specify the title and code label of the research project within which the work was created, as well as the full title of the funding institution. In case a submitted manuscript has been pre-sented at a conference in the form of an oral presentation (under the same or similar title), detailed information about what was published in proceedings of the conference shall be provided to the Editor-in-Chief upon submis-sion. Authors are required to properly cite sources that have significantly influenced their research and their manuscript. Parts of the manuscript, including text, equations, pictures, tables and graphs that are taken verbatim from other works must be clearly marked, e.g. by quotation marks accompanied by their location in the original document (page number), or, if more extensive, given in a separate paragraph. Full references of each quotation (in-text citation) must be listed in the separate reference section in a uniform manner, according to the citation style used by the journal. References section should list only quoted/cited, and not all sources used for the preparation of a manuscript. When authors discover a significant error or inaccuracy in their own published work, it is their obligation to promptly notify the Editor-in-Chief and cooperate with him/her to retract or correct the paper. Authors should disclose in their manuscript any financial or other substantive conflict of interest that might have influenced the presented results or their interpretation. By submitting a manuscript, the authors agree to abide by the Editorial Policies of the Ethiopian Medical Journal . Editorial responsibilities The Editor-in-Chief is responsible for deciding which articles submitted to the journal will be published. The deci-sions are made based exclusively on the manuscript's merit. They must be free from any racial, gender, sexual, religious, ethnic, or political bias. When making decisions the Editor-in-Chief is also guided by the editorial policy and legal provisions relating to defamation, copyright infringement and plagiarism. Members of the Editorial Board including the Editor-in-Chief must hold no conflict of interest about the articles they consider for publication. Members who feel they might be perceived as being involved in such a conflict do not participate in the decision process for a manuscript. The information and ideas presented in submitted manuscripts shall be kept confidential. Editors and the editorial staff shall take all reasonable measures to ensure that the authors/reviewers remain anony-mous during and after the evaluation process in accordance with the type of reviewing in use. The Editorial Board is obliged to assist reviewers with additional information on the manuscript, including the re-sults of checking manuscript for plagiarism. Reviewers' responsibilities Reviewers are required to provide the qualified and timely assessment of the scholarly merits of the manuscript. The reviewer takes special care of the real contribution and originality of the manuscript. The review must be fully objective, and the judgment of the reviewers must be clear and substantiated by arguments. The reviewers assess manuscript for the compliance with the profile of the journal, the relevance of the investi-gated topic and applied methods, the scientific relevance of information presented in the manuscript, and the pres-

379
entation style. The review has a standard format. It is submitted through the online journal management system where it is stored permanently. The reviewer must not be in a conflict of interest with the authors or funders of research. If such a conflict exists, the reviewer is obliged to promptly notify the Editor-in-Chief. The reviewer shall not accept for reviewing papers beyond the field of his/her full competence. Reviewers should alert the Editor-in-Chief to any well-founded suspicions or the knowledge of possible violations of ethical standards by the authors. Reviewers should recognize relevant published works that have not been con-sidered in the manuscript. They may recommend specific references for citation but shall not require citing papers published in the Ethiopian Medical Journal, or their own papers, unless it is justified. The reviewers are expected to improve the quality of the manuscript through their suggestions. If they recommend correction of the manuscript prior to publication, they are obliged to specify the way this can be achieved. Any manuscript received for review must be treated as confidential document. Ethical Considerations Dealing with unethical behavior Anyone may inform the Editor-in-Chief at any time of suspected unethical behavior or any type of misconduct by giving the necessary credible information/evidence to start an investigation.
Editor-in-Chief makes the decision regarding the initiation of an investigation.
During an investigation, any evidence should be treated as confidential and only made available to those strictly involved in the process.
The accused will always be given the chance to respond to any charges made against them. If it is judged at the end of the investigation that misconduct has occurred, then it will be classified as either minor or serious.
Minor misconduct (with no influence on the integrity of the paper and the journal, for example, when it comes to misunderstanding or wrong application of publishing standards) will be dealt with directly with authors and re-viewers without involving any other parties. Outcomes include:
Sending a warning letter to authors and/or reviewers.
Publishing correction of a paper, e.g. when sources properly quoted in the text are omitted from the reference list.
Publishing an erratum, e.g. if the error was made by editorial staff.
In the case of major misconduct, the Editor-in-Chief may adopt different measures:
Publication of a formal announcement or editorial describing the misconduct.
Informing officially the author's/reviewer's affiliating institution. The formal, announced retraction of publications from the journal in accordance with the Retraction Policy.
A ban on submissions from an individual for a defined period. Referring a case to a professional organization or legal authority for further investigation and action.
The above actions may be taken separately or jointly. If necessary, in the process of resolving the case relevant expert organizations, bodies, or individuals may be consulted. When dealing with unethical behavior, the Editorial Board will rely on the guidelines and recommendations pro-vided by the Committee on Publication Ethics (COPE).

380
Plagiarism prevention The Ethiopian Medical Journal does not publish plagiarized papers. The Editorial Board has adopted the stance that plagiarism, where someone assumes another's ideas, words, or other creative expression as one's own, is a clear violation of scientific ethics. Plagiarism may also involve a violation of copyright law, punishable by legal action. Plagiarism includes the following:
Self-plagiarism, which is using one's own previous work in another context without citing that it was used previously
Verbatim (word for word), or almost verbatim copying, or purposely paraphrasing portions of another author's work without clearly indicating the source or marking the copied fragment (for example, using quotation marks) in a way described under Authors’ responsibilities;
Copying equations, figures or tables from someone else's paper without properly citing the source and/or without permission from the original author or the copyright holder.
Any manuscript which shows obvious signs of plagiarism will be automatically rejected. In case plagiarism is dis-covered in a paper that has already been published by the journal, it will be retracted in accordance with the proce-dure described under Retraction policy, including blacklisting the author(s) . To prevent plagiarism, the manuscripts are submitted to a plagiarism detection process. The results obtained are verified by the Editorial Board in accordance with the guidelines and recommendations of the Committee on Publi-cation Ethics (COPE). Retraction policy Legal limitations of the publisher, copyright holder or author(s), infringements of professional ethical codes, such as multiple submissions, bogus claims of authorship, plagiarism, fraudulent use of data or any major misconduct require retraction of an article. Occasionally, a retraction can be used to correct numerous serious errors, which cannot be covered by publishing corrections. A retraction may be published by the Editor-in-Chief, the author(s), or both parties consensually. The retraction takes the form of a separate item listed in the contents and labeled as "Retraction". The original article is retained unchanged, except for a watermark on the PDF indicating on each page that it is “retracted”. Open access Open access policy The Ethiopian Medical Journal is published under an Open Access license. All its content is available free of charge. Users can read, download, copy, distribute, print, search the full text of articles, as well as to establish HTML links to them, without having to seek the consent of the author or publisher. The right to use content without consent does not release the users from the obligation to give the credit to the jour-nal and its content in a manner described under Licensing. Article processing charge The Ethiopian Medical Journal does not charge authors or any third party for publication in its regular quarterly Issues. Both manuscript submission and processing services, and article publishing services are free of charge. There are no hidden costs whatsoever.
381
Copyright & Licensing Copyright Authors retain copyright of the published papers and grant to the publisher the non-exclusive right to publish the article, to be cited as its original publisher in case of reuse, and to distribute it in all forms and media. Users are required to provide full bibliographic description of the original publication (authors, article title, journal title, volume, issue, pages), as well as its DOI code. In electronic publishing, users are also required to link the content with both the original article published in the Ethiopian Medical Journal. Authors can enter into separate, additional contractual arrangements for the non-exclusive distribution of the jour-nal's published version of the work (e.g., post it to an institutional repository or publish it in a book), with an ac-knowledgement of its initial publication in this journal. Self-archiving policy Authors are permitted to deposit publisher's version (PDF) of their work in an institutional repository, subject-based repository, author's personal website (including social networking sites, such departmental websites at any time after publication. Full bibliographic information (authors, article title, journal title, volume, issue, pages) about the original publica-tion must be provided and links must be made to the article's DOI and the license. Disclaimer The views expressed in the published works do not express the views of the Editors and the Editorial Staff of the Ethiopian Medical Journal. The authors take legal and moral responsibility for the ideas expressed in the articles. The Publisher (The Ethiopian Medical Association) shall have no liability in the event of issuance of any claims for damages. The Publisher will not be held legally responsible should there be any claims for compensation.

383
GUIDELINES FOR AUTHORS The Ethiopian Medical Journal (EMJ) is the official Journal of the Ethiopian Medical Association (EMA) devoted to the advancement and dissemination of knowledge pertaining to the broad field of medicine in Ethiopia and other developing countries. Prospective contributors to the Journal should take note of the instructions of Manuscript preparation and submission to EMJ as outlined below. Article types acceptable by EMJ
Original Articles (vide infra) on experimental and observational studies with clinical relevance Brief Communications Case Series Case Reports Editorials, Review or Teaching Articles: by invitation of the Editorial Board. Correspondences/Letters to the Editor Monographs or set of articles on specific themes appearing in a Special Issues of the Journal Book reviews Perspectives, Viewpoints Hypothesis or discussion of an issue important to medical practice Letter to the Editor Commentaries Advertisements Obituaries
N.B. Articles are not acceptable if previously published or submitted elsewhere in print or electronic format,
except in the form of abstracts in proceedings of conferences. Content and format of articles: Title: The title should be on a separate page. It should not have acronyms or abbreviations. The title should be
descriptive and should `not exceed 20 words or 120 characters including space. The title page should include the name(s) and qualification of the author(s); the department or Institution to which the study/research is attributed and address of the corresponding Author. If the author has multiple affiliations only use the most preferred one.
1. Original Articles
2,500 words, excluding Abstracts, References, Figures and Tables. The manuscript of the Article, should ap-pear under the following headings: a) Abstract: The abstract of the Article is prepared on a separate paper, a maximum of 250 words; it should
be structured under the titles: a) Background; b) Methods; c) Results; d) Conclusions. Briefly summarize the essential features of the article under above headings, respectively. Mention the problem being ad-dressed in the study; how the study was conducted; the results and what the author(s) concluded from the results. Statistical method used can appear under Methods paragraph of the Abstract, but do not insert abbreviations or references in the Abstract section. Keywords: Provide three to six key words, or short phrases at the end of abstract page. Use terms from medical subject heading of Index Medicus to assist in cross indexing the Article.
b) Introduction : Should provide a short background and context of the study and provide the rationale for doing the study. It should not be a detailed review of the subject and should not include conclusions from the paper.

384
c) Patients or (Materials) and Methods: should contain details to enable reproducibility of the study by others. This section must include a clear statement specifying that a free and informed consent of the subjects or their legal guardians was obtained. Corresponding author should submit a copy of institution review Board (IRB) clearance or letter of permission from the hospital or department (if IRB exempt) with the manuscript. For manuscripts on clinical trials, a copy of ethical approval letter from the con-cerned body should be submitted with the Manuscript. If confidential data is being used for publication (such as student grades, medical board data, or federal ethics board data), then appropriate support/agreement letter should be included. Photos of patients should disguise the identity or must have obtained their written consent. Reference number for ethical approval given by ethics committee should be stated. In general, the section should include only information that was available at the time the plan or protocol for the study was being written; all information obtained during the study belongs in the Results section.
d) Results: This section should present the experimental or observational data in text, tables or figures. The data in Tables and Figures should not be described extensively in the text.
e) Discussion: The first paragraph should provide a summary of key finding that will then be discussed one by one in the paragraphs to follow. The discussion should focus on the interpretation and significance of the results of the study with comments that compare and describe their relation to the work of others (with references) to the topic. Do not repeat information of Results in this section. Make sure the limitations of the study are clearly stated.
f) Tables and Figures: These should not be more than six. Tables should be typed in triplicate on separate sheets and given serial Arabic numbers. Titles should be clearly place underneath Tables and above Fig-ures. Unnecessary and lengthy tables and figures are discouraged. Same results should not be presented in more than one form (choose either figure or table). Units should appear in parentheses in captions but not in the body of the table. Statistical procedures, if not in common use, should be detailed in the METH-ODS section or supported by references. Legends for figures should be typed on separate sheets, not stapled to the figures. Three dimensional histograms are discouraged. Recognizable photographs of patients should be disguised. Authors should submit editable soft versions of the tables and figures.
g) Acknowledgement: Appropriate recognition of contributors to the research, not included under Authors should be mentioned here; also add a note about source of the financial support or research funding, when applicable.
h) References: The titles of journals should be abbreviated according to the style used for MEDLINE
(www.ncbi.nlm.nih.gov/nlmcatalog/journals). References should be numbered consecutively in the order in which they are first mentioned in the
text and identify references in text, tables, and legends by Arabic numerals in parentheses.
Type the References on a separate sheet, double spaced and keyed to the text.
Personal communications should be placed NOT in the list of references but in the text in parentheses, giving name, date and place where the information was gathered or the work carried out (e.g. personal communication, Alasebu Berhanu, MD, 1984, Gondar College of Medical Sciences). Unpublished data should also be referred to in the text.
References with six or less authors should all be listed. If more than six names, list the first three, followed by et al.
Listing of a reference to a journal should be according to the guidelines of the International Committee of Medical Journal Editors ("Vancouver Style') and should include authors' name(s) and initial(s) sepa-rated by commas, full title of the article, correctly abbreviated name of the journal, year, volume number and first and last page numbers.
Reference to a book should contain author's or authors’ name(s) and initials, title of chapter, names of editors, title or book, city and name of publisher, year, first and last page numbers.
385
The following examples demonstrate the acceptable reference styles. Articles:
Gilbert C, Foster A. Childhood blindness in the context of Vision 2020: the right to sight. Bull World Health Org 2001;79:227-32
Teklu B. Disease patterns amongst civil servants in Addis Ababa: an analysis of outpatient visits to a Bank employee’s clinic. Ethiop Med J 1980;18:1-6
Tsega E, Mengesha B, Nordenfelt E, Hansen B-G; Lindberg J. Serological survey of human immuno-deficiency virus infection in Ethiopia. Ethiop Med J 1988; 26(4): 179-84
Laird M, Deen M, Brooks S, et al. Telemedicine diagnosis of diabetic retinopathy and glaucoma by direct ophthalmoscopy (Abstract). Invest Ophthalmol Vis Sci 1996; 37:104-5
Books and chapters from books: Henderson JW. Orbital Tumors, 3rd ed. Raven Press New York, 1994. Pp 125-136.
Clipard JP. Dry Eye disorders. In Albert DM, Jakobiec FA (Eds). Principles and Practice of Ophthal-mology. W.B Saunders: Philadelphia, PA 1994 pp257-76.
Website: David K Lynch; laser History: Masers and lasers. http://home.achilles.net/jtalbot/history/massers.htmAccessed 19/04/2001
2. Brief Communication Short versions of Research and Applications articles, often describing focused approaches to solve a health
problem, or prelnary evaluation of a novel system or methodology
Word count: up to 2000 words
Abstract up to 200 words; excluding: Abstract, Title, Tables/Figures and References
Tables and Figures up to 5
References (vide supra – Original Article) 3. Case Series
Minimum of three and maximum of 20 cases Up to 1,000 words; excluding: Abstract, Title, Tables/Figures and References
Abstract of up to 200 words; structured; (vide supra)
Statistical statements here are expressed as 5/8 (62.5%)
Tables and Figures: no more than three
References: maximum of 20 4. Case Report
Report on a rare case or uncommon manifestation of a disease of academic or practical significance Up to 750 words; excluding: Abstract, Title, Tables/Figures and References
Abstract of up to 100 words; unstructured;
Tables and Figures: no more than three References: maximum of 10
5. Systematic review Review of the literature on topics of broad scientific interest and relevant to EMJ readers
Abstract structured with headings as for an Original Article (vide supra)
Text should follow the same format as what is required of an Original Article
Word count: up to 8,000 words, excluding abstract, tables/Figures and references
Structured abstract up to 250 words
Tables and Figures up to 8 6. Teaching Article A comprehensive treatise of a specific topic/subject, considered as relevant to clinical medicine and public
health targeting EMJ readers

386
By invitation of the Editorial Board; but an outline of proposal can be submitted
Word limit of 8,000; excluding abstract, tables/Figures and references
Unstructured Abstract up to 250 words 7. Editorial
By invitation of the Editorial Board, but an editorial topic can be proposed and submitted
Word limit of 1,000 words: excluding references and title; no Abstract
References up to 15. 8. Perspectives
By invitation of the Editorial board, but a topic can be proposed and submitted
Word limit of 1,500
References up to six 9. Obituaries
By invitation of the Editorial board, but readers are welcome to suggest individuals (members of the EMA) to be featured.
Preparation of manuscripts
Manuscripts must be prepared in English, the official language of the Journal.
On a single separate sheet, there must be the title of the paper, with key words for indexing if required, and each author's full name and professional degrees, department where work was done, present address of any author if different from that where work was done, the name and full mailing address of the cor-responding author, including email, and word count of the manuscript (excluding title page, abstract, references, figures and tables). Each table/figures/boxes or other illustrations, complete with title and footnotes, should be on a separate page.
All pages should be numbered consecutively in the following order: Title page; Abstract and key-words page; main manuscript text pages; References pages; acknowledgment page; Figure-legends and Tables
The Metric system of weights and measures must be used; temperature is indicated in degrees Centi-grade.
Generic names should be used for drugs, followed by propriety brand name; the manufacturer name in parenthesis, e.g. diazepam (Valium, Roche UK)
Statistical estimates e.g. mean, median proportions and percentages should be given to one decimal place; standard deviations, odds ratios or relative risks and confidence intervals to two decimal places.
Acronyms/Abbreviations should be used sparingly and must be given in full, at first mention in the text and at the head of Tables/foot of Figure, if used in tables/figures.eg. Blood Urea Nitrogen (BUN). Interstitial lung disease (ILD).
Use the binomial nomenclature, reference to a bacterium must be given in full and underlined - under-lining in typescript becomes italics in print (e.g. Hemophilus influenzae), and later reference may show a capitalised initial for the genus (e.g. H. influenzae)
In the text of an article, the first reference to any medical phrase must be given in full, with the initials following in parentheses, e.g., blood urea nitrogen (BUN); in later references, the initials may be used.
Manuscripts for submission should be prepared in Microsoft Word document file format Submission of manuscripts
As part of the submission process, authors are required to check off their submission's compliance with journals requirements

387
All manuscripts must be submitted to the Editor-in-Chief of the Journal with a statement signed by each author that the paper has not been published elsewhere in whole or in part and is not submitted elsewhere while offered to the Ethiopian Medical Journal. This does not refer to abstracts of oral com-munications at conferences/symposia or other proceedings.
It is the author's responsibility to proof-read the typescript or off-print before submitting or re-submitting it to the Journal, and to ensure that the spelling and numerals in the text and tables are accu-rate.
Authors should submit their work through the Ethiopian Medical Journal website; [email protected].
Conflict of interest Authors should disclose at the time of submission of manuscripts any conflict of interest, which refers to situations in which financial or other personal considerations may compromise, or have the appearance of compromising their professional judgment in conducting or reporting the research results They should declare that there is no conflict of interest to declare if there is none, Manuscripts review procedures The procedures for manuscripts review include:
Within one week of receipt of a manuscript, the Editorial Board will review it in reference to (i) conformity with the Journal's "guidelines to authors (revised version available in all issues starting January 2020)", (ii) relevance of the article to the objectives of the EMJ, (iii) clarity of presentation, and (iv) plagiarism by using appropriate software
The Editorial Board has three options: accept manuscripts for external review, return it to author for revision, or reject it. A manuscript not accepted by a board member is blindly reviewed by another board member. If not accepted by both, the manuscript is rejected by the Editorial Board. Decision will be made by the sug-gestion of a third Editorial Board member if the decisions of first two do not concur.
Once accepted for external review, the Editorial Board identifies one (for brief communication, case reports, and teaching articles) or two (for original articles) reviewers with appropriate expertise. The reviewers will be asked to review and return manuscripts with their comments online within two weeks of their receipt. Reviewers have four options; accept, accept with major revision, accept with minor revision, or reject.
A Manuscript accepted subject revision as suggested by reviewers will be returned to the corresponding au-thor. Author(s) will be given four weeks to respond to reviewers' comments, make necessary changes, and return the manuscript to the Editorial Board. A Manuscript not returned within the specified time will be considered withdrawn by the author(s).
Manuscripts with minor revisions will be cleared by the Editorial Board and accepted for publication. Those with major revisions will be returned to external reviewers and follow the procedures as outlined for the ini-tial review.
General information
The Editorial Board reserves the right for final acceptance, rejection or editorial correction of papers submitted. However, authors are encouraged to write an appeal to the Editor-in-Chief for reconsideration of rejected manu-scripts or any other complaints they might have.
Accepted papers are subject to Editorial revision as required and become the copy-right of the EMA Twenty-five reprints of published articles are supplied free to the first/corresponding author.
The Editorial Board welcomes comments on the guidelines from Journal readers.
Privacy statement The names and email addresses entered in this journal site will be used exclusively for the stated purposes of this journal and will not be made available for any other purpose or to any other party.

388
Acknowledgment We gratefully acknowledge the financial support of the U.S. Centers for Disease Control and Prevention (CDC) ob-tained through the CDC-EMA Cooperative Agreement No. 5U2GPS000834. We also warmly thank those who gener-ously give donations to meet the Journal's cost.
THE ETHIOPIAN MEDICAL JOURNAL
The Ethiopian Medical Journal, founded in 1962, appears four times a year and is available from the Secretary, EMA House, Addis Ababa, or by mail P. O. Box 3472, Addis Ababa, Ethiopia. Request for previous issues is wel-comed. For this and any other information, please contact us through: e-mail: [email protected] Tel. 251-1-158174 or 251-1-533742; Fax: 251-1-533742
The Journal contains original articles and research of special relevance to the broad issue of medicine in Ethiopia and in other developing countries. It is listed in the Index Medicus and Current Contents. Its ISSN number is ISSN 0014–1755. If you wish to subscribe to the Journal, please complete the section below and return it to the Secretary. The Subscrip-tion rates are:
Ethiopia: Eth. Birr 372 annually, postage included; World-wide: US$ 120, airmail postage included …………………………………………………………………………………………………………………………. Request to: The Secretary, Ethiopian Medical Journal, P. O. Box 3472, Addis Ababa, Ethiopia. I wish to subscribe to the Ethiopian Medical Journal for the Year(s) …………. to ……………. Name .....................................................................................................................…….. Address ................................................................................................................……… I enclose my subscription fee of ...................................................................................
Signed ................................ Cheques should be made payable to the Ethiopian Medical Journal. If payment is made by Bank Transfer (A/C No. 0172018004100, Commercial Bank of Ethiopia, Addis Ababa Branch), please ensure that the Secretary of the Ethio-pian Medical Journal is notified of the transfer.
NOTICE TO MEMBERS OF THE ETHIOPIAN MEDICAL ASSOCIATION If you are a paid–up member of EMA, and have not received your copy of EMJ, please notify the secretary, with the support of your ID card or letter from your hospital. Also, if you are transferred to a different hospital or institution, please return the following change of address form PROMPTLY. NAME (in block) ...................................................................................................……... FORMER ADDRESS: ............................................................................................…….. P. O. BOX .................................. CITY/TOWN ............................................................. NEW ADDRESS ................................................................................................………… INSTITUTION ..........................................................................................................……. P. O. BOX ....................... CITY/TOWN ..................................................................…..

The Ethiopian Medical Journal is the official quarterly publication of the Ethiopian Medical As-sociation. It is devoted to the advancement and dissemination of knowledge pertaining to medi-cine in Ethiopia and other developing countries.
EDITORIAL BOARD
Editor-in-Chief Mirkuzie Woldie
Associate Editors-in-Chief
Yeshigeta Gelaw
Editors Eyasu Makonnen
Abebe Bekele Markos Tesfaye
Alemayehu Worku Workeabeba Abebe Tekalign Deressa
Wondwossen Amogne Wendemagegn Enbiale
Esayas Kebede Genet Gebremedhin Fasika Amdeselasie
Fiker Bekele
Corresponding Editors Kassa Darge
Charles Larson Frances Lester Paulos Quana’a
Solomon Tesfaye Carmela G. Abate Henry Blumberg Russell Kempker
Journal Manager
Meaza Aklilu
Senior Researcher Mohammed Feyisso Shaka

ETHIOPIAN MEDICAL JOURNAL October 2021
EDITORIAL Integration of technology and e-learning into medical education in Ethiopia: The COVID-19 silver lining? Abebe Bekele 279
ORIGINAL ARTICLES Evaluation of surgical glove integrity: Does an African country receive inferior quality? Experience from Addis Ababa, Ethiopia
Abebe Bekele, , Mesikir Abate, Nardos Mekonnen, Barnabas Alayande, Dieudonne Hakizimana, Mulat Taye, Daniel Zemenfe 281
Radiology residents’ perception of working and training from home during COVID-19 pandemic Tesfaye Kebede, Bethlehem Eyob 289
Factors affecting the outcome of Guillain-Barre syndrome among pediatric patients in Tikur Anbessa Specialized Hospital Abebe Habtamu Tamire, Hanna Lishan, Ayalew Moges Beyene 297
Burnout and stress among interns in an Ethiopian teaching hospital: Prevalence and associated factors Henok Fisseha, Hailu Abera Mulatu, Rodas A. Kassu, Senayt Nur Yimer, Esubalew Woldeyes 305
Age at menarche, factors that influence it, and menstrual pattern of secondary school adolescents in Addis Ababa, Ethiopia
Eskinder Kebede, Eyasu Mesfin, Myshelle Ramlal Singh 315
Intestinal parasites and risk awareness of people living with HIV/AIDS in Debre Brehan Referral Hospital, Debre Brehan, Ethiopia Tassew Tefera, Dessie Abera, Dejenie Shiferaw Teklu, Mistire Wolde 325
Demographic characteristics and the clinical profile of Vulvar cancer patients treated at Tikur Anbessa Specialized Hospital, a five years retrospective study Esayas Berhanu, Carolyn M. Johnston 337
Cultivating competent leaders who can manage and govern the health delivery system in northwest Ethiopian: Quasi-experimental study
Yeshambel Agumas Ambelie, Getu Degu Alene, Damen Hailemariam Gebrekiros 343
Oral Paracetamol versus oral Diclofenac in the control of uterine cramping pain after vaginal birth HT Bello-Ajao, AS Adeyemi, OO Aworinde, KM Owonikoko, AO Olabinjo 351
BRIEF COMMUNICATIONS Building a COVID-19 repository website for healthcare professionals in Ethiopia Tigist Hailu, Bekureledet M.Dingle, Nicole Bodo, Tegbar Yigzaw, Workeabeba Abebe, Tigist Mekonnen, Enawgaw Mehari, Kassa Darge 359
CASE REPORT Inability to swallow tablets offers an opportunity for detection and successful treatment for a rare lifetime cause of Dysphagia Hailemichael Desalegn Mekonnen, Hari Conjeevaram 365
Traumatic tension Pneumocephalus in a 16 month old child: Case report and review of the literature Alemayehu Ginbo Bedada, Imran Fizzah, Sesay Sheikha, Georges Azzie 369
Undiagnosed Ureterovaginal fistula in congenital duplex kidney with ectopic ureteric insertion to urethra; something to look for?
Tan Shong Sheng, Mohamed Ashraf Mohamed Daud, Wan Mokhzani Wan Mokhter, Rosnelifaizur Ramely, Nik Mohd Nurhafizi Nik Anuar 373
EDITORIAL POLICY 377 GUIDELINES FOR AUTHORS 383 ACKNOWLEDGMENT 388 SUBSCRIPTION 388 NOTICE TO MEMBERS OF THE ETHIOPIAN MEDICAL ASSOCIATION 388

279
Abebe Bekele. Ethiop Med J, 2021, Vol. 59, No. 4 EDITORIAL
INTEGRATION OF TECHNOLOGY AND ELEARNING INTO MEDICAL
EDUCATION IN ETHIOPIA: THE COVID-19 SILVER LINING?
Abebe Bekele, MD, FCS, FACS For quite some time, it has become very clear that the most realistic way to achieve sustainable development in a country is through quality education, and by extension through research and innovation. Unfortunately, Africa has not benefited optimally from quality education due to various factors, several of which are obvious. One such fac-tors is the very poor adaptation and integration of technology and eLearning into the education system in Africa (and Ethiopia). Health professional’s education in the continent is one clear example of such a situation. E-learning has several advantages over traditional learning. Digitalization of teaching and learning ensures avail-ability of huge and filtered information, allows easy manipulation of contents, offers possibility of real-time update and exchange, and it also allows for recording of lessons for possible repetition in the future. Formative and sum-mative assessment, student mentorship and support can also be easily integrated to it. Additionally, E-learning al-lows easy communication between the teacher and students that overcomes distance in space. In today’s globalized world, the possibility of sharing of resources across partners (for free or procured) has also emerged as one advan-tage of eLearning. Prior to the COVID epidemic, the full potential of technology and innovations in medical education in African and Ethiopia might not have been fully appreciated. However, it might not be out of place to say that technology and innovation saved medical education in the year 2020-21 all over the globe. The world witnessed the reality that educational technology and innovation could contribute significantly to medical education more than we probably had ever imagined. From the delivery of didactic teaching (lectures) remotely, simulation, clinical teaching, labora-tory teaching, student mentorship and assessment (MCQs and clinical examinations), and the need to provide a hybrid form of teaching and training - the integration of technology played key role in many instances to support medical education. One major point to emphasize at this juncture is that medical educators (and trainees) need to acquire new skills and competencies on how to use medical education technology and innovations. However, inappropriate, and reck-less deployment of technology and innovation have the potential to do more harm than good. With emphasis on competency-based medical education, there is clear indication that when technology and innovations are used, there must be evidence that this is helping trainee achieve the desired goal: i.e. enhanced performance. From our limited experience with eLearning (mostly Case Based Collaborative Learning) at the department of sur-gery of the Addis Ababa University, we have clearly seen that most medical students involved were very interested in eLearning as one modality of teaching. We found they were very aware of its many advantages but identified cost of internet as a major impediment. Most would strongly recommend similar sessions to their fellow students. Stakeholders in medical education in Ethiopia now have more than enough evidence with regards to the place of technology in medical education. It might have been conventional to relegate its importance to the background prior to the year 2020 and this might simply be associated with lack of adequate appreciation of the roles of tech-nology (and maybe be lack of financial means even though I strongly disagree); but doing the same thing post the COVID-19 pandemic might simply mean blatant ignorance of the reality of the current time. In certain instances, medical schools were first shut down almost indefinitely with the hope that the covid-19 situation would suddenly go away, and the schools would re-open to resume normal activities. However, the gross inequity in vaccine distri-bution in the globe has brought in a new reality. I, therefore, would like to join several authors in advocacy for the institutionalized adaptation of eLearning and technology to the medical education arena in Ethiopia. Medical schools in Ethiopia should integrate E-learning into
1.University of Global Health Equity, Kigali, Rwanda 2Addis Ababa, University, School of Medicine, Addis Ababa, Ethiopia *Corresponding Author E-mail: [email protected]
280
their routine pedagogical strategy. Stakeholders in medical education should consider investment in the most rele-vant technology – free and strong internet connection, and personalized devices to all students and faculty to say the least. Starting with dynamic approaches such as blended learning might help for ease of adaptation. Continuous skills development trainings should be provided to faculty and students. REFERENCES 1. Prober CG, Khan S (2013). Medical education reimagined: a call to action. Acad Med. 88(10):1407-10. doi:
10.1097/ACM.0b013e3182a368bd. PMID: 23969367. 2. Goh P, Sandars J, (2020). 'A vision of the use of technology in medical education after the COVID-19 pan-
demic', MedEdPublish, 9, [1], 49, 3. Ruiz JG, Mintzer MJ, Leipzig RM. The impact of E-learning in medical education. Acad Med
2006;81:207212. 4. Remtulla R. (2020). The Present and Future Applications of Technology in Adapting Medical Education
Amidst the COVID-19 Pandemic. JMIR medical education, 6(2), e20190. https://doi.org/10.2196/20190.

281
Abebe Bekele, Mesikir Abate MD MPH, Nardos Mekonnen, Barnabas Alayande, Dieudonne Hakizimana, Mulat Taye, Daniel Zemenfes. Ethiop Med J, 2021, Vol. 59, No. 4
ORIGINAL ARTICLE
EVALUATION OF SURGICAL GLOVE INTEGRITY: DOES AN AFRICAN COUN-TRY RECEIVE INFERIOR QUALITY? EXPERIENCE FROM
ADDIS ABABA, ETHIOPIA
Abebe Bekele MD FCS FACS1,2*, Mesikir Abate MD MPH, 1,3 Nardos Mekonnen,4 Barnabas Alayande MBBS FMCS1,4, Dieudonne Hakizimana MSc MGHD,1 Mulat Taye, MD2, Daniel Zemenfes MD,2
ABSTRACT
Introduction: In a 2017 study, the incidence of glove perforation in Addis Ababa was found to be much higher than that of most publications—with an incidence of 60.14% for first surgeons. We hypothesized that poor surgical glove quality may have contributed to the high incidence of perforations. Method: We tested the integrity of six widely used brands of sterile surgical gloves that were widely used through-out the nation. The assumption was that the perforation rate in these gloves would be higher than the standard acceptable quality level (AQL) of 1.5, the world standard for surgical gloves at the time of the study. Results: From the 1,200 single gloves evaluated, 59 (4.9%) gloves had perforations and 1,141 (95.1%) did not. Among the brands evaluated, Brand 1 (13.5%) and Brand 5 (10%) had the highest rate of perforations. Compared to the standard AQL of 1.5, Brand 1 and Brand 5 had a significantly higher perforation rate (13.5%, CI=8.8%-18.2%, p=0.000) and (10.0%, CI=5.8%-14.2%, p=0.000), respectively. Conclusion: Our study results showed unacceptably high rates of perforation for 2 glove brands, in which at least 1 out of every 10 gloves were defective. In view of our findings, we recommend, at minimum, that surgeons visually inspect gloves before and after donning. Relevant government institutions, contractors, importers, hospital admin-istrators, and surgical teams must take collective responsibility for ensuring appropriate quality of gloves. Quality enforcement must be strengthened, and local production must be considered. Key word: surgical glove, perforation, brand, quality
INTRODUCTION
Surgical gloving is a standard sterile practice aimed at protecting the patient and caregivers from transmissible diseases. (1) Perforation of surgical gloves during pro-cedures eliminates this protective barrier and increases the risks to both the patient and the caregiver. (1,2) Patients are two times likely to have a surgical-site infection (SSI) in procedures where gloves are perfo-rated compared to those that maintain aseptic tech-nique.3 Moreover, as key incidents of patients contract-ing Hepatitis C virus (HCV) (4) and Hepatitis B Virus (HBV) (5) infections from infected surgeons through glove perforation have been reported in the literature . (6) Surgical glove perforations may also pose a similar risk to surgical team members, as they may contract trans-missible diseases such as Human Immunodeficiency Virus (HIV) (7), HCV (8,9) , and HBV. (3,9,10) One study has reported that surgeons risk more than one HBV infection per lifetime, and at least one in 1500 surgeons are likely to be infected by HIV over the next three decades due to risks posed from surgical glove perforation. (10)
Thus, the integrity of the surgical glove is essential to prevent cross-contamination and decrease the risk of acquired infections to both patients and caregiv-ers alike. There is variability in the literature on the incidence of surgical glove perforations ranging from as low as 10% (6) to as high as 61.7% (11) in some procedures. Factors influencing the variability include type of surgery (12) with emergency surger-ies accounting for a significantly higher incidence of glove perforation, (13) duration of surgical pro-cedure with higher incidence of glove perforation in procedures exceeding 90-120 minutes (11), inva-siveness of the surgery, experience of the surgeon (1,13) and surgical glove size. (14) Double gloving is a protective factor which has con-sistently been shown to reduce the incidence of in-ner glove perforation. (12,13,15) In our 2017 study, we found the incidence of glove perforation in Addis Ababa, Ethiopia to be much higher than in other studies with an incidence of 60.14% for first surgeons performing emergency surgery. (13)
1University of Global Health Equity, Kigali, Rwanda. 2Addis Ababa, University, School of Medicine, Addis Ababa, Ethiopia. 3 New York-Presbyterian/Weill Cornell Surgery, New York, New York, USA. 4Drexel University, Philadelphia, Pennsylvania, U.S.A.5Program in Global Surgery and Social Change, Harvard Medical School, Boston, MA, USA *Corresponding Author E-mail: [email protected]

282
This poses a significant threat to both patients and the surgical workforce. Locally relevant factors that may have contributed to the higher incidence include the standard utilization of surgical residents as first sur-geons for emergency procedures, and the limited sup-ply of glove sizes resulting in a portion of the surgical team using inappropriate sized gloves. (13) In addi-tion, because Low and Middle Income Countries (LMICs) like Ethiopia depend on imports, it is possi-ble that poor surgical glove quality may have contrib-uted to the relatively high incidence of surgical glove perforations. It is imperative for relevant stakeholders and policy makers to be aware of the quality of the procured products so they can develop a safer surgical environment for patients and healthcare providers. We hypothesized that the perforation rate in these gloves would be higher than the standard acceptable quality level (AQL) 1.5, the world standard for surgi-cal gloves at the time of the study. (16,17)
METHODS Study Procedure: In this cross-sectional study, 200 powdered size 7.5 latex single gloves from each of the 6 brands of surgi-cal gloves available in pharmacies across Addis Ababa were randomly procured in June 2018. Each of the gloves studied here were manufactured by differ-ent companies, and in different countries. A total of 1,200 single gloves were examined. The characteris-tics of each brand of surgical glove including origin, constituent materials, cost, method of sterilization, quality assurance measures, available sizes, glove thickness, tensile thickness, elongation measures and storage recommendations were identified (Table 5). Since Ethiopia did not produce surgical gloves at the time of the study, local products were not included in the study. Control testing for surgical glove integrity was con-ducted for each glove using a standardized visual and a European Norm (EN) 455-1 water-leak test method.17,18 The tests were carried out by two indi-viduals who were blinded to the surgical glove brand. The visual test assessed for overt damage by inspec-tion. For the water-leak test, each glove was filled with 1L of water and methylene blue solution at room temperature followed by manual compression on the wrist of the glove for 1 minute. Leakage of blue water indicated perforation. The number and locations of the perforations were recorded for each glove. Statistical Analysis Descriptive statistics were computed for the categori-cal variables. A proportion t-test was utilized to test for difference in proportions between each brand and the null hypothesis of 0.04.
The null hypothesis was derived from what the ac-ceptable maximum is (8 defects) for an AQL of 1.5 in an n=200 random sample. (17) A difference in proportions using proportion t-test was also con-ducted for: (1) the total right versus total left hand gloves perforated in the total sample, (2) perforation in the right versus left gloves among each of the 6 brands, (3) the total perforation in the palmar versus dorsal aspects in the total sample size, and (4) the perforation in the palm versus dorsum versus both sides among each of the 6 brands. A Pearson chi-square analysis was conducted to determine an asso-ciation between the glove digits and the outcome, perforation. All p-values were two-sided with a sta-tistical significance level of p<0.05. All statistical analyses were conducted using Stata (version 14.2, Stata Corp, College Station, Texas, USA).
RESULTS
From the 1,200 single gloves evaluated, 59 (4.9%) gloves had perforations and 1,141 (95.1%) did not. Among the brands evaluated, Brand 1 (13.5%) and Brand 5 (10%) had the highest rate of perforations, followed by Brand 3 (3.0%) Brand 6 (2.0%), Brand 2 (1.0%) and Brand 4 (0%) (Table 1). Compared to the standard AQL 1.5 for surgical gloves at the time of the study,16,17 Brand 1 and Brand 5 had signifi-cantly higher perforation rate (13.5%, CI=8.8%-18.2%, p=0.000) and (10.0%, CI=5.8%-14.2%, p=0.000), respectively. There was no significant difference between the AQL and perforation rates for Brand 2 (2.0%, CI=-0.4%-2.4%, p=0.985), Brand 3 (3.0%, CI=0.6%-5.4%), p=0.985), Brand 4 (0.0%, CI=0.0%-0.0%, p=0.998) and Brand 6 (2.0%, CI=0.1%-3.9%, p=0.926) (Table 1). Among the 600 right and 600 left hand gloves evaluated, there were a total of 35 (5.8%) right hand glove perforations and 24 (4.0%) left hand glove perforations. There was no statistically significant difference between total right (5.8%, CI=3.9%-7.7%) and total left hand (4.0%, CI=2.4%-5.6%) glove perforation rates (p=0.149) (Table 2). The right-hand perforation rate (16.0%, CI=8.8%-23.2%) was significantly higher than the left-hand perforation rate (4.0%, CI=0.2%-7.8%) in Brand 5 (p=0.005) (Table 2). The left-hand perforation rate (4.0%, CI=0.2%-7.8%) was significantly higher than the right-hand perforation rate (0.0%, CI=0.0%-0.0%) in Brand 6 (p=0.043). There was no significant difference in the right and left glove perforation rates in Brand 1 (13.0% vs. 14.0%, p=0.836), Brand 2 (2.0% vs. 0.0%, p=0.155), and Brand 3 (4.0% vs. 2.0%, p=0.407). The p-value was not computed for Brand 4, which had 0 perforations (Table 2).

283
Table 1: Differences in perforation rate of surgical brands compared to the standard AQL
CI= Confidence Interval; Ha=Null hypothesis
Non-Perforated (n=200)
Perforated (n=200)
95% CI
p-value (Ha: p > 0.04)
Brands, n (%) Brand 1 173.0 (86.5%) 27.0 (13.5%) 8.8% - 18.2% 0.000 Brand 2 198.0 (99.0%) 2.0 (1.0%) -0.4% - 2.4% 0.985 Brand 3 194.0 (97.0% 6.0 (3.0%) 0.6% - 5.4% 0.765 Brand 4 200.0 (100.0%) 0.0 (0.0%) 0.0% - 0.0% 0.998 Brand 5 180.0 (90.0%) 20.0 (10.0%) 5.8% - 14.2% 0.000 Brand 6 196.0 (98.0%) 4.0 (2.0%) 0.1% - 3.9% 0.926
Table 2. Differences in glove perforation rate between right and left hands
CI=Confidence Interval
Right Hand (n=100)
95% CI
Left Hand (n=100)
95% CI, (%)
p-value
Brands, n (%)
Brand 1 13.0 (13.0%) 6.4%-19.6% 14.0 (14.0%) 7.2%-20.8% 0.836
Brand 2 2.0 (2.0%) -0.7%-4.7% 0.0 (0.0%) 0.0%-0.0% 0.155
Brand 3 4.0 (4.0%) 0.2%-7.8% 2.0 (2.0%) -0.7%-4.7% 0.407
Brand 4 0.0 (0.0%) 0.0%-0.0% 0.0 (0.0%) 0.0%- 0.0% N/A Brand 5 16.0 (16.0%) 8.8%-23.2% 4.0 (4.0%) 0.2%-7.8% 0.005
Brand 6 0.0 (0.0%) 0.0%-0.0% 4.0 (4.0%) 0.2%-7.8% 0.043
Total, n (%) (n=600)
35.0 (5.8%)
3.9%-7.7%
24.0 (4.0%)
2.4%-5.6%
0.149
Of the total 1200 gloves perforated, the palmar side was perforated at a significantly higher rate (4.5%, CI=3.3%-5.7%) than the dorsal side (0.5%, CI=0.1%-0.9%) (p=0.001). Among the brands evaluated, the palmar side was perforated at a significantly higher rate than the dorsal side in Brand 1 (12.0% vs. 0.2%, p=0.001), Brand 3 (3.0% vs. 0.0%, p=0.014) and Brand 5 (10.0% vs. 0.0%, p=0.001). There was no significant difference in the perforation rates between the palmar and dorsal side in Brand 2 (1.0% vs. 0.0%, p=0.156) and Brand 6 (1.0% vs. 1.0%, p=1.000). The p-value was not computed for Brand 4, which had 0 perforations (Table 3).
Of the total perforated gloves with single digit perfo-rations, the highest rates of perforations were found in Digit 1 (Thumb) (39.6%), followed by Digit 3 (Middle) and Digit 5 (Little) (17.0%), Digit 2 (Index) (15.1%), and Digit 4 (Ring) (11.3%). There was a statistically significant difference in the rates of per-foration among the 5 digits evaluated (p=0.009). Brand 5 had the highest rate of perforations for Digit 1 (71.4%) and Digit 5 (55.6%), Brand 1 for Digit 2 (75.0%) and Digit 3 (55.6%) and Digit 4 (100.0%) (Table 4). Only digit perforations that were inde-pendent were included in the analysis and six perfo-rated gloves which had perforations in more than 1 digit were excluded from the digit specific analysis.

284
Table 3: Differences in glove perforation rate between palmar and dorsal aspects
CI=Confidence Interval
Palmar Aspect (n=200)
95% CI
Dorsal Aspect (n=200)
95% CI
p-value
Brands, n (%) Brand 1 24.0 (12%) 7.5%-16.5% 4.0 (0.2%) 0.1%-3.9% 0.001 Brand 2 2.0 (1.0%) -0.4%-2.4% 0.0 (0.0%) 0.0%-0.0% 0.156 Brand 3 6.0 (3.0%) 0.6%-5.4% 0.0 (0.0%) 0.0%-0.0% 0.014 Brand 4 0.0 (0.0%) 0.0%-0.0% 0.0 (0.0%) 0.0%-0.0% N/A Brand 5 20.0 (10.0%) 5.8%-14.2% 0.0 (0.0%) 0.0%-0.0% 0.001 Brand 6 2 (1.0%) -0.4%-2.4% 2 (1.0%) -0.4%-2.4% 1.000 Total, n (%) (n=1200)
54 (4.5%)
3.3%-5.7%
6 (0.5%)
0.1%-0.9%
0.001
Table 4: Differences in glove perforation rate by digit among the six brands
Total Non-Perforated (n = 5947)
Total Perforated (n = 53)*
p-value
Digits, n (%)
Digit 1 (Thumb) ¨1179 (19.8%) ¨21.0 (39.6%) ^0.009
~Brand 1 Brand 2 Brand 3 Brand 4 Brand 5 Brand 6
198.0 (16.8%) 198.0 (16.8%) 198.0 (16.8%) 200.0 (17.0%) 185.0 (15.7%) 200.0 (17.0%)
2.0 (9.5%) 2.0 (9.5%) 2.0 (9.5%) 0.0 (0.0%) 15.0 (71.4%) 0.0 (0.0%)
Digit 2 (Index) ¨1192 (20.0%) ¨8.0 (15.1%) ~Brand 1 Brand 2 Brand 3 Brand 4 Brand 5 Brand 6
194.0 (16.3%) 200.0 (16.8%) 198.0 (16.6%) 200.0 (16.8%) 200.0 (16.8%) 200.0 (16.8%)
6.0 (75.0%) 0.0 (0.0%) 2.0 (25.0%) 0.0 (0.0%) 0.0 (0.0%) 0.0 (0.0%)
Digit 3 (Middle) ¨1191 (20.0%) ¨9.0 (17.0%) ~Brand 1 Brand 2 Brand 3 Brand 4 Brand 5 Brand 6
195.0 (16.4%) 200.0 (16.8%) 198.0 (16.6%) 200.0 (16.8%) 200.0 (16.8%) 198.0 (16.6%)
5.0 (55.6%) 0.0 (0.0%) 2.0 (22.2%) 0.0 (0.0%) 0.0 (0.0%) 2.0 (22.2%)
Digit 4 (Ring) ¨1194 (20.1%) ¨6.0 (11.3%) ~Brand 1 Brand 2 Brand 3 Brand 4 Brand 5 Brand 6
194.0 (16.2%) 200.0 (16.8%) 200.0 (16.8%) 200.0 (16.8%) 200.0 (16.8%) 200.0 (16.8%)
6.0 (100.0%) 0.0 (0.0%) 0.0 (0.0%) 0.0 (0.0%) 0.0 (0.0%) 0.0 (0.0%)
Digit 5 (Little) ¨1191 (20.0%) ¨9.0 (17.0%)
~Brand 1 Brand 2 Brand 3 Brand 4 Brand 5 Brand 6
196.0 (16.5%) 200.0 (16.8%) 200.0 (16.8%) 200.0 (16.8%) 195.0 (16.4%) 200.0 (16.8%)
4.0 (44.4%) 0.0 (0.0%) 0.0 (0.0%) 0.0 (0.0%) 5.0 (55.6%) 0.0 (0.0%)
CI=Confidence Interval * = Data includes only independent surgical glove perforations, ex-cludes 6 surgical gloves that had perforations in more than 1 digit ^ = p-value from the Pearson Chi Square analysis of association of rate of total perforations between the 5 digits ~ = Descriptive analy-sis of the total number of digits perforated and nonperforated in each where n =¨,the total number of perforations and non-perforations for each Digit

285
DISCUSSION
It is imperative to investigate underlying reasons for high post-operative glove perforation rates in the Ethiopian surgical space, as previous research has shown rates as high as 38.3% overall, and 60.14% in primary surgeons during emergency surgery. (13) These rates are higher than those from most other LMICs, (12,19) and intra-operative events may be insufficient to explain these findings. Pre-operative testing in our study revealed an overall perforation rate of 4.9% and peak brand perforation rates of 13.5% (Brand 1) and 10% (Brand 5) prior to glove use. This constitutes a surgical safety hazard and repre-sents a significant deviation from acceptable industry standards at the time of study of less than 8 defective gloves in 200 (AQL of 1.5). (17) Our findings sharply contrasts those by Hwang et al, from a Taiwan high income setting, in which pre-operative testing of 198 gloves from 4 manufacturers revealed a 0% perfora-tion rate. (20) Green and Gompertz in the United Kingdom demonstrated 2%. (1) Albin et al demon-strated a defect rate in the United States of 1.9% be-fore dental procedures and 5.5% before surgical pro-cedures. (21) In 1989, just prior to the introduction of new and stringent regulations to the United States, similar rates to our findings (3-16%) were found on surgical glove testing by visualization and water fill by the US Food and Drug Administration. (22) As lower rates of pre-use perforations represent a proxy for increasing quality, this study raises significant quality questions for gloves in circulation within the country.
The brands with highest perforation rates in our study had significantly higher rates of perforation relative to other brands. On the lower end of the spectrum, Brand 4 gloves had no pre-use perforations. These results suggest that rates of glove perforation vary signifi-cantly with glove brand and manufacturer. Even though lot to lot variability within brands may exist, this quality variability reveals a standardization chal-lenge in the Ethiopian surgical safety and medical importation regulatory space which needs to be ad-dressed at governmental and institutional levels. Ethiopia can contextualize some HIC federal regula-tions which require random inspection of gloves using the Water Load Test. (16)
All gloves tested in this study were imported. The number of gloves imported into Ethiopia has steadily increased over the years, with an annual growth in quantity of imports of 137% per annum between 2015 and 2019. (23)
At around the time of the study, Ethiopia’s import ranking for surgical gloves was 34th in the world, representing 0.5% of world imports for gloves. (23)
The imported value of surgical gloves into the coun-try in 2019 alone was US $10,457,000. (23) In Ethiopia, surgical gloves have a limited number of supplying markets, led by China, followed by India, Malaysia, Austria, the United Kingdom, Belgium and Germany. (23) Brands represented in this study reflected the bulk of the supplying market. Investing in the importation of gloves that are shown to have a lower rate of perforation prior to use is a potential solution to low quality market brands, but, better still, local production of surgical gloves to regula-tory standards may represent a more feasible solu-tion. It can be argued that these defective glove brands portend danger on the basis of handedness, surface and digits of perforation. Our findings with regards to the handedness of the perforations sug-gest no statistically significant differences overall (p=0.149), however in one of the precarious brands, right-handed perforations were significantly higher than left-handed perforations (p=0.005). Handed-ness of Ethiopian surgical staff has not yet been explored, but a wider review suggests that majority of surgeons are right-handed. (24) Although the “holding” or non-dominant hand is at risk of intra-operative perforations (owing to a lower degree of dexterity and greater exposure to needle puncture), (12,13,20,21,25,26) our findings may suggest a subtle increase in danger to the pa-tient and surgeon, as right handed surgeons who utilize these defective gloves on their dominant hands additionally have a higher risk of intra-operative perforations on their non-dominant hands. With regards to perforated glove surfaces, the pal-mar aspect was perforated at a significantly higher rate (4.5%, CI=3.3%-5.7%) than the dorsal aspect (0.5%, CI=0.1%-0.9%)(p=0.001) overall. This find-ing was also specific to the most perforated brands (1 and 5). Palmar perforations arguably portend a greater danger than dorsal perforations with regards to the major surface of surgical contact. These per-vasive perforations involved all digits, however, of the total single digit perforations, the highest rates of perforation were found on the thumb (39.6%). The thumb is the most important digit for grasping and fine surgical hand motions. The non-dominant thumb in combination with the non-dominant index finger have been established by research consensus as the most common sites of intra-operative glove perforation. (12,13,20,21,25,26) This trifecta of handedness, surface and digit elevates the danger of utilizing the defective brands.

286
In view of our findings of a large proportion of glove perforations prior to use, we recommend, at minimum, that surgeons visually inspect gloves before and after donning. The use of a double glove perforation indica-tor system may serve as an early warning system for pre-perforated gloves. For Ethiopian surgical teams who do not routinely use double glove for resource constraint reasons, results of our study strongly sug-gest right-sided double-gloving to mitigate risks asso-ciated with the demonstrated laterality of these pre-existing perforations. Widespread testing and Hepati-tis B vaccination of surgical staff should still be en-couraged, and Ethiopian authorities should intervene to protect surgeons and patients, to maximize invest-ments in the surgical sector, and to drive down surgi-cal site infections which now stand at a pooled preva-lence of 12.2%. (27) More importantly, possible facilitators of the entry of low-quality gloves into Ethiopia, like loose legisla-tion, irregular public procurement, and substandard quality control need to be creatively addressed. Brands not meeting up to standards should be banned from the Ethiopian space and high-quality brands should be rewarded. Brand 4 has demonstrated that conforming to quality standards are possible, as is often the case in strictly controlled HIC environments. (20) All health systems are vulnerable to corruption. (28) Ethiopia seems to be taking corruption in the health sector seriously, however, some authors have referenced poorly functioning reporting systems around hospital procurement and distribution proc-esses. (28)
Officials must ensure that there is no interference with the set standards for glove approval, compliance certi-fication, and licensing. The present findings could also serve as a call to strengthen transparency and ac-countability and increase performance measurement, monitoring, and enforcement in existing quality en-forcement agencies. Limitations of this study include our inability to test all glove brands and all sizes in use. However, we assessed the brands and size most commonly used during operations in Ethiopia. Furthermore, despite the fact that this study assessed for perforations using the standard methods utilized by quality control agen-cies, some studies suggest that newer testing methods like electrical conductance tests, may have revealed higher perforation rates (29). Furthermore, the contri-bution of additional characteristics (including thick-ness and elasticity) of the gloves to perforation rates was not measured. Finally, following conclusion of this study, progress has been made by international regulators to raise quality standards for surgical gloves by reducing the AQL to 0.65. (18)
Further studies should be carried out in Ethiopia to determine conformity to this new benchmark. (18) Conclusion Various brands of gloves manufactured in different countries are routinely imported for surgical proce-dures in Ethiopia, with high variability in quality between brands. Our study results show unaccepta-bly high rates of perforation for 2 glove brands, in which at least 1 out of every 10 gloves were defec-tive. The implications of this are staggering for surgical staff. In Ethiopia, choice of surgical glove brand may be a determinant of surgical safety. These find-ings also indicate that unrecognized pre-operative perforations may be a contributing factor to the high post-operative glove perforations identified in our previous study. Further studies are needed to under-stand how the intrinsic characteristics of gloves contribute to these rates of perforation. Relevant government institutions, contractors, importers, hospital administrators, and surgical teams must take collective responsibility for ensuring appropri-ate quality of gloves. Quality enforcement must be strengthened, and local production must be consid-ered. Fund This research was funded by the Addis Ababa Uni-versity Adaptive Research Funding Program. Conflicts of interest The authors report no conflicts of interest, financial or otherwise.
ACKNOWLEDGMENT
The authors would like thank the Addis Ababa Uni-versity for funding this research through the Adaptive Problem Solving Research Grant scheme.

287
REFERENCES 1. Green SE, Gompertz RH. Glove perforation during surgery: what are the risks? Ann R Coll Surg Engl. 1992;74(5):306-8. PMID: 1416698; PMCID: PMC2497644. 2. Harnoss JC, Partecke LI, Heidecke CD, Hübner NO, Kramer A, Assadian O. Concentration of bacteria passing through puncture holes in surgical gloves. Am J Infect Control. 2010;38(2):154-8. doi: 10.1016/ j.ajic.2009.06.013. Epub 2009 Oct 12. PMID: 19822380. 3. Misteli H, Weber WP, Reck S, Rosenthal R, Zwahlen M, Fueglistaler P, Bolli MK, Oertli D, Widmer AF, Marti WR. Surgical glove perforation and the risk of surgical site infection. Arch Surg. 2009;144(6):553- 8; discussion 558. doi: 10.1001/archsurg.2009.60. PMID: 19528389. 4. Esteban JI, Gómez J, Martell M, Cabot B, Quer J, Camps J, González A, Otero T, Moya A, Esteban R, Guardia J. Transmission of hepatitis C virus by a cardiac surgeon. N Engl J Med. 1996 Feb;334(9):555- 60. doi: 10.1056/NEJM199602293340902. PMID: 8569822. 5. Harpaz R, Von Seidlein L, Averhoff FM, Tormey MP, Sinha SD, Kotsopoulou K, Lambert SB, Robertson BH, Cherry JD, Shapiro CN. Transmission of hepatitis B virus to multiple patients from a surgeon with out evidence of inadequate infection control. N Engl J Med. 1996;334(9):549-54. doi: 10.1056/ NEJM199602293340901. PMID: 8569821. 6. Kobayashi M, Tsujimoto H, Takahata R, Einama T, Okamoto K, Kajiwara Y, Shinto E, Kishi Y, Hase K, Ueno H. Association Between the Frequency of Glove Change and the Risk of Blood and Body Fluid Exposure in Gastrointestinal Surgery. World J Surg. 2020;44(11):3695-3701. doi: 10.1007/s00268-020- 05681-1. Epub 2020 Jul 13. PMID: 32661693. 7. McKinney WP, Young MJ. The cumulative probability of occupationally-acquired HIV infection: the risks of repeated exposures during a surgical career. Infect Control Hosp Epidemiol. 1990;11(5):243-7. doi: 10.1086/646161. PMID: 2351810. 8. Kiyosawa K, Sodeyama T, Tanaka E, Nakano Y, Furuta S, Nishioka K, Purcell RH, Alter HJ. Hepatitis C in hospital employees with needlestick injuries. Ann Intern Med. 1991;115(5):367-9. doi: 10.7326/0003- 4819-115-5-367. PMID: 1907441. 9. Shapiro CN. Occupational risk of infection with hepatitis B and hepatitis C virus. Surg Clin North Am. 1995;75(6):1047-56. doi: 10.1016/s0039-6109(16)46776-9. PMID: 7482133. 10. Palmer JD, Rickett JW. The mechanisms and risks of surgical glove perforation. J Hosp Infect. 1992;22 (4):279-86. doi: 10.1016/0195-6701(92)90013-c. PMID: 1363107. 11. Tlili MA, Belgacem A, Sridi H, Akouri M, Aouicha W, Soussi S, Dabbebi F, Ben Dhiab M. Evaluation of surgical glove integrity and factors associated with glove defect. Am J Infect Control. 2018;46(1):30-33. doi: 10.1016/j.ajic.2017.07.016. Epub 2017 Sep 20. PMID: 28893444. 12. Thanni LO, Yinusa W. Incidence of glove failure during orthopedic operations and the protective effect of double gloves. J Natl Med Assoc. 2003;95(12):1184-8. PMID: 14717474; PMCID: PMC2594859. 13. Bekele A, Makonnen N, Tesfaye L, Taye M. Incidence and patterns of surgical glove perforations: experi ence from Addis Ababa, Ethiopia. BMC Surg. 2017;17(1):26. doi: 10.1186/s12893-017-0228-8. PMID: 28320370; PMCID: PMC5359816. 14. Zaatreh S, Enz A, Klinder A, König T, Mittelmeier L, Kundt G, Mittelmeier W. Prospective data collec tion and analysis of perforations and tears of latex surgical gloves during primary endoprosthetic surger ies. GMS Hyg Infect Control. 2016;11:Doc25. doi: 10.3205/dgkh000285. PMID: 28066701; PMCID: PMC5175006. 15. Tanner J, Parkinson H. Double gloving to reduce surgical cross-infection. Cochrane Database Syst Rev. 2006;2006(3):CD003087. doi: 10.1002/14651858.CD003087.pub2. PMID: 16855997; PMCID: PMC7173754. 16. Food and Drug Administration, HHS. Medical devices; patient examination and surgeons' gloves; test procedures and acceptance criteria. Final rule. Fed Regist. 2006;71(243):75865-79. PMID: 17294550. 17. CEN 455–1, European Committee for Standardization. Medical gloves for single use—Part 1: Require ments and testing for freedom from holes. 2001. 18. CEN 455-1, European Committee for Standardization. Medical gloves for single use. Part 1, Require ments and testing for freedom from holes. Berlin: Beuth Verlag GmbH; 2020. 19. Medhioub F, Jaber E, Hamrouni A, Gharbi L. Unnoticed surgical gloves intraoperative perforation: A multicentric study of the leading factors. Jr Med Res. 2020; 3(3):9-12. https://doi.org/10.32512/ jmr .3.3.2020/9.12 20. Hwang KL, Kou SJ, Lu YM, Yang NC. Evaluation of the quality of surgical gloves among four different manufactures. Ann Occup Hyg. 1999;43(4):275-81. PMID: 10432871.

288
21. Albin MS, Bunegin L, Duke ES, Ritter RR, Page CP. Anatomy of a defective barrier: sequential glove l eak detection in a surgical and dental environment. Crit Care Med. 1992;20(2):170-84. PMID: 1737454. doi:10.1097/00003246-199202000-00006 22. Medical devices; patient examination and surgeons’ gloves; adulteration--FDA. Proposed rule. Depart ment of Health and Human Services. Fed Regist. 1989; 54(223): 48218. 23. International Trade Centre. Trade statistics for international business development [Internet]. Trade Map - Trade statistics for international business development. 2021 [cited 2021Mar10]. Available from: https:// www.trademap.org/Index.aspx 24. Tchantchaleishvili V, Myers PO. Left-handedness--a handicap for training in surgery? J Surg Educ. 2010;67(4):233-6. doi: 10.1016/j.jsurg.2010.06.001. PMID: 20816359. 25. Malhotra M, Sharma JB, Wadhwa L, Arora R. Prospective study of glove perforation in obstetrical and gynecological operations: are we safe enough? J Obstet Gynaecol Res. 2004;30(4):319-22. doi: 10.1111/ j.1447-0756.2004.00201.x. PMID: 15238110. 26 Yinusa W, Li YH, Chow W, Ho WY, Leong JC. Glove punctures in orthopaedic surgery. Int Orthop. 2004;28(1):36-39. doi:10.1007/s00264-003-0510-5 27. Shiferaw WS, Aynalem YA, Akalu TY, Petrucka PM. Surgical site infection and its associated factors in Ethiopia: a systematic review and meta-analysis. BMC Surg. 2020;20(1):107. doi: 10.1186/s12893-020- 00764-1. PMID: 32423397; PMCID: PMC7236319. 28. Plummer J. Diagnosing corruption in Ethiopia: perceptions, realities, and the way forward for key sectors. Washington, D.C.: World Bank; 2012. 29. McLaughlin R, McNicholl B, Barton J. Intraoperative glove perforation. Postgrad Med J. 2002;78 (915):62. doi: 10.1136/pmj.78.915.62. PMID: 11796890; P

289
Tesfaye Kebede, Bethlehem Eyob. Ethiop Med J, 2021, Vol. 59, No. 3 ORIGINAL ARTICLE
RADIOLOGY RESIDENTS’ PERCEPTION OF WORKING AND TRAINING FROM HOME DURING COVID-19 PANDEMIC
Tesfaye Kebede, MD1*, Bethlehem Eyob, MD2
ABSTRACT
Introduction: The spread of coronavirus disease 2019 (COVID-19) pandemic disrupted the personal and profes-sional lives of many throughout the world. To mitigate the spread of the virus, Addis Ababa University introduced an online teaching/learning method which minimized the physical engagement of faculty members and residents. Online teaching is a major shift in the history of the country’s oldest and largest university. Objectives: This study aimed to investigate how trainees managed to cope up with the sudden changes in the teach-ing/learning system, and assess the ensuing satisfaction with the new method of teaching/learning. Methods: Descriptive research design was implemented and analysis of variance (ANOVA) and T-tests were used to test hypotheses. Analysis of data collected from 58 radiology residents found that, the residents appreciated the participatory nature of the newly introduced online learning method. Results: The results showed that residents have accepted the new teaching/learning method and are satisfied with it. Furthermore, tests of hypotheses revealed that there is no significant difference in level of satisfaction between female and male residents as well as throughout the three years of radiology residency training. Conclusion: The new method of teaching/learning has a positive acceptance among trainees and there was high level of satisfaction with the new method. Poor internet network, reduced in-person mentoring, failure to make engaging discussions due to large number of participants were the common challenges to online teaching in the setting. Key words:COVID-19 Pandemic, Radiology Residents’, teach and work from home
INTRODUCTION
Since its discovery in Wuhan Province of China in December, 2019, it took COVID-19 only few months to become the number one global health issue. Slow reaction from political and health sector regulators immensely contributed to the virus’ fast spread in dif-ferent parts of the globe infecting nearly more than 35 million people and claiming the lives of millions of people(1, 2). As we are in the middle of the pandemic, no authoritative source could predict the exact impact of the pandemic and remains as subject for future re-search. One thing for sure is the life of human beings surviving the pandemic will never be the same. Most importantly, despite various efforts to cure the virus, both modern/scientific and indigenous/traditional knowledge-based(3-5), neither of them brought fruit. The basic recommendations from prominent scientists and international health organiza-tions such as WHO and health sector regulators are keeping physical distance and staying at home as much as possible.
The demand for primary care physicians and medi-cal specialists in the developed world was among the outstanding research inquiries over the last sev-eral decades (6-9). Hospital-based physicians such as radiologists and anesthesiologists, who once were at the higher level of job insecurity are now among the physicians at the greatest demand (10). The issue of shortage of medical professionals, pri-mary care physicians as well as medical specialists, needs no scientific enquiry when it comes to the developing world. Over those long years, regulators and hospital administrators throughout the world have endeavored to bridge the gap through various mechanisms including working extra hours and working from home. The advent of technological innovations beginning from late 20th century has made working from home easier and comparative studies have also shown that working from home is as effective as medical center based services (11).
1 Associate professor at Department of Radiology, College of Health Sciences , Addis Ababa University. 2 Final year Radiology resident at Department of Radiology, College of Health Sciences , Addis Ababa University. *Corresponding Author E-mail: [email protected]

290
Despite its contribution in alleviating the shortage of radiologists (12, 13), working from home has also adversely affected their health, social life, and profes-sional productivity (14) resulting in stress (15) . The ever increasing need for real-time imaging interpreta-tion has forced radiologists to even work extra hours beyond their regular working hours (14). Global and national health sector organizations such as WHO and National Health Ministries promoted ‘staying at home’ among the first line preventive mechanisms to survive the pandemic. As a result, the pandemic compelled professionals around the world to stay at home and work from home. Working from home has become the ‘new normal’ for medical and non-medical professionals. For radiologists, though, working from home is not a phenomenon triggered by the COVID-19. Unlike the practices in other parts of the world, ‘working and teaching/learning from home’ is a new phenomenon for developing countries like Ethiopia. Although the change in learning modality will defi-nitely have an impact on trainees, discerning whether this impact (positive or otherwise) is worth investigat-ing. The current study aimed to investigate how train-ees managed to cope up with the sudden changes in the teaching learning process, assess the ensuing satis-faction with the new method of learning, and draw important lessons that must be either sustained or treated in the aftermath of the pandemic.
METHODOLOGY
Research Approach and Design The study followed a mixed research approach whereby quantitative data were used to measure satis-faction and its association with respondent’s attributes (specific objectives 1 & 2) and qualitative data using open ended questions were also used to identify the challenges of the new teaching and learning method introduced due to coronavirus pandemic. The study also followed descriptive research design for the level of satisfaction of radiology residents and to identify the challenges and opportunities of working and teaching from home in pandemic situation. The Research Setting The current research was conducted at Addis Ababa University, College of Health Sciences, Department of Radiology where a total of 25 academic staffs are working in the facilities of Tikur Anbessa Specialized Hospital. The Department has a Radiology Residency Teaching Program involves direct patient contact while performing radiological procedures such as ul-trasound, contrast studies of the gastrointestinal sys-tems and interventional radiology.
At undergraduate level, radiology course is given as a short course, as a result, graduate medical doc-tors have limited exposure as to the discipline. The residency, on the other hand, includes doing radio-logical procedures like Ultrasound (US), interven-tion, fluorography procedures and interpretation of the findings as well as interpreting other cross-sectional imaging like Computerized Tomography (CT) and Magnetic Resonance Imaging (MRI). This is also the practice in all radiological services throughout Ethiopia (16). In Tikur Anbesa Specialized Hospital about 200 radiographs (X-rays) are taken and more than 120 patients are scanned with US in four exam rooms on each day. More than 60 patients are scanned with CT and 20-30 patients have MRI performed daily. In addition, about 20-25 US and/or CT-guided interventions are done by the department weekly. As part of the residency training program, all cases except ultrasound studies are also dis-cussed daily in groups in each departmental unit which constitute 10-12 trainees including the con-sultants. Therefore, before the interruption follow-ing COVID-19 pandemic, in one reporting room with an area of 57.6 square meter, there will be 50-60 people discussing and reporting at a time. Besides the consultation sessions, as part of the teaching learning process, trainees have daily after-noon teaching sessions from 1:30pm–3:00pm where all residents and staffs meet together to dis-cuss on imaging of patients. The other activity of the department is daily interdepartmental joint con-ferences which take about 60-75 minutes to dis-cuss cases which need collaborative discussions for clinical management. In the department confer-ence room which is 57 sqm there will be more than 120 people. Following the pandemic beginning from March 2020, most of the residency program’s activities went online to allow faculty members and trainees to work, teach and learn from home except for minimum possible physical gathering to sustain the departmental daily routines. Data Source and Collection Methods The research subjects were trainees of a three-year residency program at Department of Radiology in College of Health Sciences, Addis Ababa Univer-sity during the academic year 2019/2020. The trainees were at first, second or third year of the residency program. In order to attain the objectives of the study, the researchers used primary source of data collected using a self-administered ques-tionnaire. Therefore, the questionnaires were ad-ministered both in print and online versions.

291
While participants were encouraged (through email and text message reminders) to fill the questionnaires online to avoid physical contact; the principal means of the virus’ spread, some willing participants pre-ferred to complete the printout version of the instru-ment. Since the face-to-face learning system was aborted in the middle of the academic year and was immediately replaced by the online learning system due to the surge of the global pandemic in Ethiopia, the study participants had the chance to recall their past experi-ences and provide feedback by comparing the two alternative systems of learning. Hence, in the survey, the residents were asked to compare the participatory nature of the newly introduced teaching learning method and to rate their satisfaction with it. They were also requested to list the challenges they face and the opportunities they explored due to the change in methods of instruction following measures to mitigate the impact of the pandemic. In order to avoid potential bias from power balance (Venaktesh et al., 2019); a bias that may happen if the survey is conducted by the trainer researcher (the first author) who is a faculty member of Department of Radiology, the survey was administered by the student researcher (the second author). Hypotheses In line with the second specific objective of the study, the researchers posit that satisfaction with the new method of learning might be affected by the partici-pant’s gender and her/his level of residency study (whether the trainee is from Year-I, Year-II or Year-III). Accordingly, the following two research hypothe-ses are formulated.
H1: There is a significant difference in the level of satisfaction between female and male radiology resi-dency program trainees.
H2: There is a significant difference in the level of satisfaction among train-ees from the three levels of radiol-ogy residency program.
Method of Data Analysis The quantitative data collected was analyzed using descriptive statistics tools. Besides the descriptive statistics analysis, T-test and ANNOVA were used to test the two hypotheses; i.e. whether there is a differ-ence in the level of satisfaction among gender groups and levels/years of residency study. Furthermore, the open-ended responses of participants were coded to extract common themes using qualitative data analysis tools.
Ethical Considerations The authors obtained ethical approval from the Re-search and Ethics Committee of the department of radiology of the College of Health Sciences at Ad-dis Ababa University and informed consent was obtained from the study participants.
RESULT
The following sub-sections provide analysis of data collected from radiology residency trainees pursu-ing their study in a developing country that intro-duced online-based learning in response to mitigat-ing the spread of COVID-19. A total of 58 respondents participated in this re-search among which 74% were male and 26% were female respondents. Forty-one percent of the re-spondents were in their first year of training, and those in second and third years of training ac-counted for 33% and 26% respectively. Satisfaction with the New Learning System Satisfaction with online learning system was meas-ured by 10 items adapted from Sun et al., 2008(12). Some of the ten items were modified by the authors to fit the residency training situations in the Univer-sity. The 10 items measuring students’ satisfaction with the new online method of learning try to cap-ture satisfaction from three different perspectives: (1) whether they support the decision (at department and at university levels) to resume the training pro-gram despite the pandemic situation, (2) whether they want to take online courses in the future or recommend the new method of teaching continued to be applied after the end of the current crisis, and (3) the nature of the courses and the way they were delivered. (Table 1) All of the ten items measuring satisfaction have above average results. Besides, the minimum aver-age satisfaction level per item was item number 10 where the average satisfaction rating was 6.15 out of 7 (Std. Dev. 1.15) (Table 2). This finding clearly indicates that on average, the new method of teach-ing/learning has a positive acceptance among radi-ology residents at Department of Radiology, Addis Ababa University.

292
Table 1: Descriptive statistics of Radiology residents’ satisfactions with presentations and case discussions at TASH, 2020
* Questions Marked with (R) mark were reverse coded
Items Mean Std. Deviation
The Department’s decision to continue residency teaching via the Internet was a wise one
6.67 0.57
If I had an opportunity to take another course via the Internet, I would gladly do so
6.52 0.71
I am satisfied with the University’s decision to resume residency classes via the online teaching modality
6.45 0.98
I was disappointed with the way the on-line courses are worked out(R) 6.24 1.08 I would recommend my Department to continue teaching my junior fel-lows on-line
6.19 1.13
I was very satisfied with the on-line courses delivered by my Department 6.19 1.05 I will take as many courses via the Internet as I can in the future 6.11 1.16 Conducting the course via the Internet made it more difficult than other courses I have taken (R)
5.79 1.37
I feel that this e-learning served my needs well 5.69 0.94 If I had it to do over, I would not take the courses I am currently taking via the Internet(R)
5.68 1.68
Overall 6.15 1.15
Table 2: Descriptive statistics of Radiology residents’ perception of Participatory nature of case discussions and seminar presentations at TASH, 2020
Items Mean Std. Deviation
I received prompt comments from instructors during my pres-entations
6.00 1.06
My instructors consider web-based online learning using differ-ent technologies useful
5.93 1.08
I received prompt comments on case consultations I seek on-line
5.17 1.48
I received prompt comments from classmates during my pres-entations
4.86 1.66
Overall 5.50 1.41
Participatory nature of the presentations and case discussions We measured the participatory nature of case and seminar presentations using four questions. The first three questions evaluated the trainer to trainee di-mension of the relationship while the fourth question focused on another important element of the relation-ship-the trainee-to-trainee relationship. In the current study, participants had a higher aver-age rating (5.50) for the participatory nature of pres-entations (Table 2) Further investigation of the indi-vidual components of the participation revealed that the trainer-to-trainee relation was a significant con-tributor of the observed higher satisfaction level. However, the trainee-to-trainee relationship has been impaired due to the introduction of the online learn-ing system (4.86 out of 7).
Based on this finding we recommend that to increase students’ satisfaction (17), trainers in Department of Radiology shall make consideration and facilitate student-to-student interactions in future online lec-tures and case presentations. The effect of Respondents’ Attributes on Level of Satisfaction Besides the higher level of satisfaction with the new online based learning method observed from the de-scriptive data, in line with the second research objec-tive, we wanted to further investigate whether there was a significant difference between different trainee attributes: the gender groups and level of residency training, by testing the two research hypotheses. The hypotheses in null and alternate/research forms are: The subsequent two subsections present the test re-sults and their interpretations.

293
Test of Difference in Satisfaction among Gender Groups To test first hypothesis that ‘there is no significant difference in the level of satisfaction between female and male radiology residency program trainees’ the two tailed test results were used. P value of 10.08% is well above 5% level of significance implying failure to reject the null hypothesis (Table 3).
Therefore, we concluded that there is no significant difference in the level of satisfaction with online learning system introduced by the Department of Radiology; the new teaching learning method served the needs of both female and male radiology trainees.
Table 3: Two-Sample t-Test showing the difference between male and female residents’ satisfaction with online learning system at TASH, 2020
Female Male Mean 6.29 6.11 Variance 0.12 0.49 Observations 15 43 Hypothesized Mean Difference 0 Df 48 t Stat 1.295 P(T<=t) one-tail 0.1008 t Critical one-tail 1.677 P(T<=t) two-tail 0.2016 t Critical two-tail 2.011
Test of Difference in Satisfaction among Different Years of Residency Study Due to the difference in the level of rigor, nature of courses, level of supervision, and learning objective in the different years of radiology residency training, the researchers were also interested in knowing whether there is a difference in the level of satisfaction with the new online system of learning among first, second and third year radiology residency trainees. This was done by testing the null hypothesis that ‘There is no significant difference in the level of satisfaction among trainees from the three levels of radiology resi-dency program.’ In testing the difference in levels of satisfaction among the different levels of study, we had a single factor (satisfaction with online learning method) and three levels of study (first, second and third year radi-ology residency training). Therefore, we run a single factor analysis of variance (ANOVA) test and found the result (Table 4) that there was no evidence to re-ject the null hypothesis that ‘there is no significant difference in the level of satisfaction among trainees from the three levels of the radiology residency pro-gram’. This result indicated that students at all levels of the radiology residency program were equally satis-fied. The evidence also implied that the university’s decision to resume classes was able to bring a positive fruit in terms of keeping students satisfied even in the middle of an international health crisis.
Similar to the tests of difference in the level of satisfaction among different groups of trainees, we have conducted t-tests for test of difference in per-ception about the participatory nature of presenta-tion between female and male trainees. In addition, we performed ANOVA test to check whether the participation levels were the same among the dif-ferent years of residency training. While the t-test confirmed that there was a significant difference in perception about the participatory nature of the presentations among the gender groups, ANOVA results indicated that there was no difference among the three levels of residency study in train-ees’ perception of the participatory nature of online presentation (both results not reported).

294
Table 4: Single Factor ANOVA showing the difference in levels of satisfaction among the different levels of resi-dency (Resident I – Resident III) at TASH, 2020
Groups Count Sum Average Variance
R-I 15 89.04 5.94 0.4712 R-II 19 116.60 6.14 0.5836 R-III 24 151.38 6.31 0.1780
ANOVA Source of Variation SS df MS F P-value F crit Between Groups 1.28 2 0.6402 1.6612 0.1993 3.1650
Results of Qualitative Data Analysis This section presents analysis of qualitative informa-tion collected using two open ended questions in the data collection instrument. The first question requested respondents if they recommend the new system be sus-tained as part of the teaching learning system after the end of the pandemics. The second question on its part encouraged participants to list out the major challenges they had faced because of the introduction of the re-mote teaching learning system. The actual responses obtained are summarized as follows. Analysis of open-ended responses on participants’ view of whether they recommend the sustained use of the online teaching/learning system in the aftermath of the pandemic found that most trainees (72%) recom-mended continued use of the online learning system anticipating that the online teaching/learning system will ensure quality of training by (1) saving money, energy and time, (2) creating one-stop access to (audio, video and documentary) resources, (3) fostering experi-ence sharing among specialists from in-country and abroad thereby building capacity of training institu-tions, (4) enhancing knowledge sharing between train-ees and trainers in and out of the university, and (5) adding flexibility to the existing traditional face-to-face system. However the number of good reasons for rec-ommending the online modality’s use in the future, some of the participants doubted to recommend the online learning system for its disregard of in-person mentoring, failure to make engaging discussions, and neglect of practical aspects of most medical school trainings. Finally, respondents were asked to express the major challenges they faced as a result of the introduction of online teaching/learning modality. Systematic coding and analysis of responses identified that poor internet network access, compromises practicality of trainings and difficulty of assessing trainees’ engagement as the three major bottlenecks from obtaining the best out of the online teaching/learning system.
In addition, although the findings from statistical tests reveal no difference in level of satisfaction among the different levels of study, first year trainees spotted that the ‘one size fits all’ nature of presentations makes it difficult for them to identify and grasp the major focus areas of the discussions pertinent to their level.
DISCUSSIONS
‘Working and Training from home’ is a new con-cept introduced after the finding of coronavirus victims in Ethiopia. In many of the postgraduate specialty training programs in Addis Ababa Uni-versity, teaching and learning activity was un-thinkable without physical gathering of faculty and trainees before COVID-19. However, due to the spread of the virus in the country, especially in the capital city Addis Ababa (where the Uni-versity is placed) students in the College of Health Sciences are obliged to continue studying amid increased spread of the pandemic by chang-ing the mode of learning to online technology systems. Besides the health consequences (death and illness) of the pandemic, studies focusing on the psychological, socioeconomic and political consequences are beginning to emerge (18, 19). Education, including radiology training, is one of the sectors worst affected by the pandemic (16, 20) Analysis of data collected from 58 radiology resi-dency program trainees (of which 25% were fe-male) found that, the residents appreciated the participatory nature of the newly introduced online learning method. The trainer-trainee di-mension of the participatory nature of case pres-entations showed a higher rating. The result from measurement of the student-student dimension, however, provided an important feedback that Department of Radiology should take as potential area of improvement.

295
Furthermore, the result from analysis of trainees’ satis-faction with the new online based teaching/learning method which requires the trainers to work from home indicates that the residents have on average higher lev-els of satisfaction which was also the case in other radi-ology institutions where virtual learning introduced during COVID-19 pandemic resulted in a high trainee satisfaction.(21) This finding implies that the trainees accepted the new method and are satisfied with it. Hypotheses tests using t-test and analysis of variance were used to test whether there was significant differ-ence between gender groups and the levels of years of study. The results confirmed that the satisfaction levels are the same both among gender groups and levels of residency training. Taking trainees’ higher level of sat-isfaction as a wake-up call from the COVID-19 pan-demic, the University shall use this opportunity to con-sider designing a teaching-learning system that blends form of the traditional face-to-face and the online learning system which was also shown to improve per-formance, satisfaction and engagement in medical edu-cation.(22, 23) In addition, analysis of open-ended responses on whether participants recommend the continued use of the online teaching/learning system in the future found that the online teaching/learning system is recom-mended as it is believed to ensure quality of education by saving money, energy and time, ease sharing of knowledge and (audio, video and documentary) re-sources, and add flexibility to the existing traditional face-to-face system(22). However, some participants expressed their view that the new teaching/learning system might disregard in-person mentoring, may not engage all attendants into discussions, and also huge reliance on the online sys-tem neglects the practical aspects of residency train-ings.
The aforementioned points can take as potential areas of improvement for the radiology residency training program and thus would be a sufficient impetus for evaluating the weaknesses of the teaching learning system and start working to-wards a high-quality residency training program that could tap the benefits of using online teaching/learning technologies. Finally, when asked about the major challenges they encounter with the new modality, trainees spotted that poor internet network access, compro-mise of practical trainings, difficulty of assessing trainees’ level of engagement and the ‘one size fits all’ nature of presentations were the major bottle-necks of the online teaching/learning system. Besides, this study has several limitations; among which are being single institution study involving a single department and didn’t include faculty per-ceptions. It can thus be concluded that although the coro-navirus pandemic disrupted the radiology resi-dency training program at Department of Radiol-ogy in Addis Ababa University like any other training institution, it has also given to the existing training system a timely wake-up call by bringing into light the demerits of the face-to-face that could be supplemented by introduction of online learning in the aftermath of the pandemic.
ACKNOWLEDGEMENT
The authors would like to thank all residents who volunteered to participate in this research. Conflict of Interest: The authors declare that no conflict of interests.
REFERENCES 1. Djalante R, Lassa J, Setiamarga D, Sudjatma A, Indrawan M, Haryanto B, et al. Review and analysis of current responses to COVID-19 in Indonesia: Period of January to March 2020. Progress in Disaster Sci ence. 2020;6:100091. 2. Haeder SF, Gollust SE. From Poor to Worse: Health Policy and Politics Scholars’ Assessment of the U.S. COVID-19 Response and Its Implications. 2020;12(4):454-81. 3. Lu Z-H, Yang C-L, Yang G-G, Pan W-X, Tian L-G, Zheng J-X, et al. Efficacy of the combination of modern medicine and traditional Chinese medicine in pulmonary fibrosis arising as a sequelae in conva lescent COVID-19 patients: a randomized multicenter trial. Infectious Diseases of Poverty. 2021;10 (1):31. 4. Nugraha RV, Ridwansyah H, Ghozali M, Khairani AF, Atik N. Traditional Herbal Medicine Candidates as Complementary Treatments for COVID-19: A Review of Their Mechanisms, Pros and Cons. Evidence -Based Complementary and Alternative Medicine. 2020;2020:2560645. 5. Zhao Z, Li Y, Zhou L, Zhou X, Xie B, Zhang W, et al. Prevention and treatment of COVID-19 using Tra ditional Chinese Medicine: A review. Phytomedicine. 2021;85:153308-. 6. Barber P, López-Valcárcel BG. Forecasting the need for medical specialists in Spain: application of a system dynamics model. Human Resources for Health. 2010;8(1):24. 7. Cooper RA. There's a shortage of specialists: is anyone listening? Academic medicine : journal of the Association of American Medical Colleges. 2002;77(8):761-6.

296
8. Bodenheimer TS, Smith MD. Primary Care: Proposed Solutions To The Physician Shortage Without Training More Physicians. Health Affairs. 2013;32(11):1881-6. 9. Starfield B, Shi L, Macinko J. Contribution of primary care to health systems and health. Milbank Q. 2005;83(3):457-502. 10. Hawkins J. Addressing the Shortage of Radiologists. The journal of the Americal Health Care Radiology Administrators. 2001:4. 11. Steckel RJ, Batra P, Goldin JG, Zucker M, Sayre JW, Johnson SL. Supervision of residents by faculty radiologists using home workstations. Emerg Radiol. 2003;10(3):121-5. 12. Sunshine JH, Maynard CD. Update on the Diagnostic Radiology Employment Market: Findings Through 2007-2008. Journal of the American College of Radiology. 2008;5(7):827-33. 13. Meghea CI, Sunshine JH. Who's overworked and who's underworked among radiologists? An update on the radiologist shortage. Radiology. 2005;236(3):932-8. 14. Rohatgi S, Hanna TN, Sliker CW, Abbott RM, Nicola R. After-Hours Radiology: Challenges and Strate gies for the Radiologist. American Journal of Roentgenology. 2015;205(5):956-61. 15. Fishman MDC, Mehta TS, Siewert B, Bender CE, Kruskal JB. The Road to Wellness: Engagement Strate gies to Help Radiologists Achieve Joy at Work. RadioGraphics. 2018;38(6):1651-64. 16. Legesse T. Impact of CVID-19 pandemic in radiology residency training of Ethiopia. Ethiopian Medical Journal. 2020;58. 17. Croxton RA. The role of interactivity in student satisfaction and persistence in online learning. Journal of Online Learning and Teaching. 2014;10(2). 18. DW A. A Review on Psychological and Socio-Economic Impacts of Corona Virus Disease (Covid-19) the Case of Under Developing Countries. . Vol. 6 No. 4: 100. Med Clin Rev. 2020;6(4). 19. UNCT-Ethiopia. Socio-Economic Impact of COVID‑ 19 in Ethiopia. June 2020. 20. Alvin MD, George E, Deng F, Warhadpande S, Lee SI. The Impact of COVID-19 on Radiology Trainees. Radiology. 2020;296(2):246-8. 21. Larocque N, Shenoy-Bhangle A, Brook A, Eisenberg R, Chang Y-M, Mehta P. Resident Experiences With Virtual Radiology Learning During the COVID-19 Pandemic. Acad Radiol. 2021;28(5):704-10. 22. Vavasseur A, Muscari F, Meyrignac O, Nodot M, Dedouit F, Revel-Mouroz P, et al. Blended learning of radiology improves medical students’ performance, satisfaction, and engagement. Insights into Imaging. 2020;11 (1):61. 23. Durán-Guerrero JA, Ulloa-Guerrero LH, Salazar-Díaz LC. Blended learning: An effective methodology for teaching radiology to medical students %J Revista de la Facultad de Medicina. 2019;67:273-7.
297
Abebe Habtamu Tamire, Hanna Lishan, Ayalew Moges Beyene. Ethiop Med J, 2021, Vol. 59, No. 4
ORIGINAL ARTICLE
FACTORS AFFECTING THE OUTCOME OF GUILLAIN-BARRE SYNDROME AMONG PEDIATRIC PATIENTS IN TIKUR ANBESSA SPECIALIZED HOSPITAL
Abebe Habtamu Tamire, MD1, Hanna Lishan, MD1*, Ayalew Moges Beyene, MD1
ABSTRACT Introduction: Guillain-Barré syndrome is an immune mediated acute illness featured by continual weakness and loss of deep tendon reflexes. The causes that govern the variant clinical presentations and outcome of this disease are not understood well. Neither are they studied in our setup. Objectives: Assessed the factors affecting the outcomes of Guillain-Barré syndrome among children <15 years in Tikur Anbesa Specialized Hospital. Methods: Institution based retrospective study was done among 91 patients with Guillain-Barré syndrome on fol-low-up identified by chart tracing and reviewed at Tikur Anbesa specialized hospital from October 1/2012 to Janu-ary 30/2019. Required data was collected using a check list. The data was entered to computer using Ep-info and exported to Statistical Package for Social Sciences Version 23 for analysis. Results: There were 91 patients with a male to female ratio of 1.1:1 and 80 % of them were between 2-10 years of age. Respiratory infections were the commonest preceding events in 27/91(29.7%). Cranial nerve involvement was found in 24/91(26.4 %) and 36/91(39.6%) patients had dysautonomia. The commonest sub-type was acute motor axonal neuropathy, 67/91 (73%). Functional independence was achieved by 47/91(52%) patients at 3 months and 80/91(88%) at 6 months. Poor functional outcome was significantly associated with the presence of sensory symp-toms, dysautonomia, the need for mechanical ventilation, severity of weakness at nadir and longer hospital stay, P < 0.05. Conclusion: The severity of motor weakness at nadir is associated with lower likely hood of functional independ-ence signifying the requirement of longer time for self-efficient functionality. Key words: Guillain-Barré syndrome, outcome, pediatric patients.
INTRODUCTION
Guillain-Barré syndrome (GBS) is considered to be an autoimmune disease which is thought to mostly pre-sent post-infections. It affects the motor, sensory and autonomic nerves and it has a slight male preponder-ance with seasonal variation (1,2). Diagnosis of GBS is made by cerebro-spinal fluid (CSF) analysis and nerve conduction test (NCT). There are several treat-ment options like intravenous immunoglobulin (IVIg) and plasma exchange but outcomes of the disease are variable despite the uniform treatment modalities for unknown reason. Furthermore, it has variable outcomes like decreased mobility, severe long-term fatigue syndrome and chronic pain(3–5). Since the elements that govern the different clinical and laboratory profiles of GBS and outcome are poorly understood, it creates an open ground for studies.
It has been shown in several studies that GBS is preceded by bacterial and viral infections and oc-casionally by vaccinations (6,7)but there hasn’t been a strong evidence linking vaccination to GBS. Besides, it is a well-known fact that the benefits of vaccines outweigh the risk (8–10). The nerve damage caused by GBS is histopa-thologically classified as demyelinating and axonal degenerating type. Acute inflammatory demyeli-nating polyradiculoneuropathy (AIDP) accounts for 80-90% of the cases in Europe and North America making it the commonest seconded by Acute motor axonal neuropathy (AMAN) account-ing for 10-20% in the western countries and 50-60% in China and Japan (11–13). There are various grading scales for prognostica-tion of GBS based on which therapeutic strategies are planned.
1 Addis Ababa university, Department of pediatrics. *Corresponding Author E-mail: [email protected]

298
Some commonly used are Medical Research Council (MRC) score, the Erasmus GBS outcome score (EGOS), Erasmus GBS respiratory insufficiency score (EGRIS) and Hughes functional grading scale (HFGS) (12,14–16).Our study uses the HFGS which is an as-sessment of functionality of patients from their history since it is more practical for retrospective studies than the other modalities. In a study done in South Africa, bulbar dysfunction, autonomic dysfunction and upper limb paralysis sig-nificantly predicted the need for mechanical ventilation(17,18). In a previous study done in our setup, the demographic and clinical characters were determined but outcome of patients on follow-up in clinic was not assessed. Furthermore, factors associated with poor outcome were not looked into (7). Therefore, the main purpose of this study is to assess the 3rd and 6th month outcome of GBS patients in clin-ics with the available treatment modalities and to deter-mine the factors affecting poor outcome. This is impor-tant in order to prepare one in anticipation of complica-tions for better resource allocation, early intervention and better counseling of patients and care givers about the disease and future outcome.
MATERIALS AND METHODS Study Area: the study was done in TASH which is the largest tertiary hospital and one of the few with pediat-ric intensive care units (ICU) in Ethiopia. It manages many patients that require ICU and hence, many of the national GBS cases. Study design: The study was a hospital based retro-spective study, conducted between May and July 2019 in TASH, Addis Ababa, Ethiopia. Sample size: The calculated sample size using N=Z2P(1-p) /d2, where p was taken to be 15%, d=0.05 and Z=1.96 was 215, but only 94 patients with a diagnosis of GBS were identified from 0ctobor, 2012 to January 2019, from which one left against medical advice, one was referred out and the last one didn’t fulfill the inclu-sion criteria making the total sample size 91. Those children who fulfilled the diagnostic criteria for GBS as per the operational definition were enrolled into the study. Sampling procedure and data collection: A check list was prepared by using selected variables taken from patient health records and used as data collection tool.
I, the principal investigator, collected the data. Consecutive sampling was used to collect medical record numbers of patients admitted with the as-sessment of GBS from the health management information system (HMIS) in all pediatric wards and cross referenced with the pediatric neurology clinic HMIS for follow-up. Data was extracted from the retrieved cards by the medical record keeping department and it was then checked, cleared and coded. Data analysis and statistical methods: The data was entered to a computer using Ep-info and ex-ported to Statistical Package for Social Sciences Version 23.0 for analysis. Univariate analysis was used for percentage and frequency distribution of the demographic and few other variables in the check list. Factors with significant association with the outcome on univariate analysis were selected for multivariate logistic regression which was used to identify independently associated factors with the outcome. Statistically significant association was taken to be a p -value of <0.05. Operational definition 1. Pediatric patients- It is defined as children
under the age of 14 years based on the hospital protocol.
2. Features Required for diagnosis of GBS based on NINDS diagnostic criteria(14).
A. Progressive motor weakness of more than one limb with hypore flexia or areflexia (loss of tendon jerks) and B. Cerebrospinal fluid features
strongly supportive of the diagnosis or
i. CSF cells Counts of 10 or fewer mononuclear leuko-cytes/mm3.
ii. Elevated protein levels more than 0.5g/L
C. Positive electro-diagnostic test as stated on the nerve conduction test.
Areflexia: Deep tendon reflex = 0/4 Hyporeflexia: deep tendon reflex= ¼ Albumin-cytological dissociation: It is defined as elevated protein levels more than 0.5g/L with nor-mal cell counts; fewer or equal to 10 mononuclear cells in CSF. Preceding event: It is defined as the presence of respiratory, gastrointestinal, febrile illness or vac-cination in the preceded 4 weeks to the onset of illness.

299
Prolonged intubation: It is defined as intubation for more than two weeks requiring tracheostomy for ven-tilation.
Hughes scale (15,16). 1. Healthy 2. Minor symptoms/capable of running 3. Walk 5 meters without support /unable
to run 4. Able to walk with an appliance 5. Confined to bed/chair 6. Requires assisted ventilation 7. Death
3. Outcome A. Good – hughes score ≤ 2 B. Poor – hughes score ≥3
Ethical consideration: The research approval was made by the pediatric and child health department’s research and publication committee (DRPC).
RESULTS A total of 91 children were included in the final analysis. All demographic characters are well stated in Table 1. Around 62/91(68%) had a preceding event prior to the development of weakness while the remaining 29 (31.9 %) had no documented pre-ceding event. Except 3 (3.3 %) children, all the re-maining 88 (96.7%) had Hughes functional score above 2 at the time of nadir weakness.
Table1: Socio-demographic characteristics of GBS patients in TASH 2012-2019GC, AA, Ethiopia
Variables F Percent %,
Age (years) <2 7 7.7 2-5 40 44.0 5-10 33 36.3 >10 11 12.1
Sex M 47 51.6 F 44 48.4
Residence AA 39 42.9 Oromia 31 34.1 Others 11 12.1
Seasonal variation |Autumn 22 24.2 Winter 19 20.9 Spring 19 20.9 Summer 31 34.1
Preceding event Respiratory tract infections
27 29.7
Acute gastroenteritis 22 24.2
Vaccine 13 14.3 None 29 31.9
Hughes score at nadir ≤2 3 3.3 >2 88 96.7
The median duration of hospital stay is 13 days with inter-quartile range of 19 days. The maximum stay was 123 days. Patients in recovery phase were not admitted making the minimum days of stay zero. More than half of the patients, 50/91(55%) had a hospital stay of 2 weeks or less. Another 22 patients had a hospital stay of 2-4 weeks making the hospital stay less than a month in 79 % of the patients. The median duration from the onset of the weakness to hospital admission was 5 days with inter-quartile range of 2 to 7 days.
The median duration from the onset of weakness to achieve maximum weakness was 3 days with inter-quartile range of 2 to 6 days. In most of the chil-dren, as depicted in the figure below, progression from onset to nadir weakness occurred on the 2nd and 3rd days of illness. More than a third of the chil-dren, 88% reached nadir weakness by one week, and progression was rare (2.2%) after 2 weeks. The lower limb power was below 3 in 64/91 (70.4%) of the children at the time of presentation, with the remaining having a power of three to four. Lower limbs were areflexic in 47(51.5%) and hy-poreflexic in 44 (48.4%) at presentation and 57 (62.7 %) had upper limb power 3-5.

300
Sensory symptoms of paresthesia and numbness were present in 40 (44 %), cranial nerve palsy in 24 (26.4 %), and features of dysautonomia in 36 (39.6 %) of the children. Of all patients with dysautonomia, 34/36 (94.4 %) had labile blood pressure and 15/36 (41.6 %) had arrhythmia but most (41.6%) had a combination of two or more.
Among the 73 patients with CSF analysis, 67/73 (91.8%) had albumino-cytologic dissociation (ACD). NCT was done for 59/91 (65%) of the chil-dren; accordingly, commonest subtype was AMAN-43/59 (73 %) followed by AIDP-14/59 (24 %), and the pattern of AMSAN was described only in 2/59 (3 %) children. From all the patients admitted, 20/91 (22 %) re-quired mechanical ventilation for respiratory failure, out of whom, 17/20 (85 %) had prolonged intuba-tion. Children who received a total dose of 2 grams of intravenous immunoglobulin (IVIg) in five days accounted for 45/91 (50 %) of them.
Table 2: List of Investigations, treatment modalities and complications of patients with Guillain-Barre Syndrome (GBS) in TASH 2012-2019GC, AA, Ethiopia
Character N Percent
CSF analysis No albumin-cytological Dissociation
12 13.2
Albumin-cytological dis-sociation
61 67.0
Not done 18 19.8 Nerve conduction test Sub-type
AMAN 43 47.3 AIDP 14 15.4 AMSAN 2 2.2 No NCT 32 35.2
Mechanical ventila-tion
No 71 78.0 Yes 20 22.0
Intravenous immu-noglobulin
No 45 50.0 Yes 45 50.0
Prolonged intubation No 74 81.3 Yes 17 18.7
Complications No 64 70.3 Yes 27 29.7
From a total of 91 patients, data at 3rd –month shows functional outcome of the first set of 50 patients only. Analysis of outcome at the 3rd month for these 50 cases showed that 26/50(52 %) children improved to Hughes score of ≤ 2. The second set of 50 patients from a total of 91 had their functional outcome ana-lyzed at 6th month follow-up. By this time, only 6/50 (12 %) had Hughes functional score of > 2, only 4/50 (8 %) had lower limb power of below three, and only 2/50 (4 %) had absent Deep Tendon Reflex (DTR). None had upper limb power below 3 and absent DTR on 6th month.
On the analysis of bivariate association, different variables were significantly associated with func-tional outcome at three months. Poor functional out-come of GBS was significantly associated with the presence of sensory symptoms, dysautonomia and the need for mechanical ventilation P < 0.05, the severity of weakness at nadir, use of Intravenous Immunoglobulin IVIg, mean length of hospital stay and the presence of complications P ≤ 0.005 and the duration to nadir weakness P= 0.006.

301
Table 3: Functional outcome of GBS patients in TASH 2012-2019GC, AA, Ethiopia
Follow up time 3 month N (%) 6 month N (% )
Hughes score ≤ 2 26 (52.0) 44 (88.0) > 2 24 (48.0) 6 (12.0)
LLP <3 4 (8.0) 0 3-5 46 (92) 50 (100)
LLR, DTR
.00 2 (4.0) 0 1.00 28 (56.0) 13 (26.0) 2.00 20 (40.0) 37 (74.0)
ULP <3 1 (2.0) 0 3-5 49 (98) 50 (100)
ULR .00 2 (4.0) 0 1.00 20 (40.0) 10 (20.0) 2.00 28 (56.0) 40 (80.0)
Sensory No 50 (100) 49 (98.0) Yes 0 1 (2.0)
Pain No 47 (94.0) 48 (96.0) Yes 3 (6.0) 2 (4.0)
Table 4: Bivariate association of predictor variables with 3rd month functional outcome of GBS patients in TASH 2012-2019 GC, A.A, Ethiopia
Variables
Hugh’s score at 3 months N (%) P-value Good outcome ≤2 Poor outcome >2
Age in Years <2 2 (7.7) 1 (4.2) 0.959 2-5 11 (42.3) 11 (45.8)
5-10 10 (38.5) 9 (37.5) >10 3 (11.5) 3 (12.5)
Sex Male 14 (53.8) 10 (41.7) 0.389 Female 12 (46.2) 14 (58.3)
Lower Limb power
0-2 9 (34.6) 23 (95.8) 0.000 3-5 17 (65.4) 1 (4.2)
Sensory symptoms
No 16 (61.5) 8 (33.3) 0.046 Yes 10 (38.5) 16 (66.7)
Cranial Nerve palsy
No 20 (76.9) 14 (58.3) 0.159 Yes 6 (23.1) 10 (41.7)
Dysautono-mia
No 20 (76.9) 11(45.8) 0.024 Yes 6 (23.1) 13 (54.2)
Nerve con-duction test Subtype
AMAN 16 (61.5) 12 (50.0) 0.690 AIDP 3 (11.5) 3 (12.5)
Mechanical ventilation
No 23 (88.5) 15 (62.5) 0.032 Yes 3 (11.5) 9 (37.5)
IV Immu-noglobulin
No 19 (73.1) 8 (33.3) 0.005 Yes 7 (26.9) 16 (66.7)
Prolonged intubation
No 23 (88.5) 16 (66.7) 0.063 Yes 3 (11.5) 8 (33.3)
Complica-tions
No 22 (84.6) 11 (45.8) 0.004 Yes 4 (15.4) 13 (54.2)
Time to Nadir ≤ 3day 9 (34.6) 17 (65.4) 0.006 > 3 days 17 (73.9) 6 (26.1)
Hospital Stay in days (mean± SD)
11.5 ± 12 35.5 ± 30 0.001

302
Those variables which were significantly associated with poor functional outcome were computed in mul-tivariate analysis, only the severity of weakness at nadir was significantly associated with 3rd month poor functional outcome with AOR 30.115 (1.44- 628.7) at 95% CI.
Association of factors affecting outcome are only done on the 3rd month’s follow-up to avoid bias secondary to inter-individual difference in genetic polymorphism since different sets of 50 patients had the 3rd and 6th months follow-up.
Table 5: Binary logistic regression of predictor variables with 3- month poor functional outcome of GBS patients in TASH 2012-2019GC, AA, Ethiopia
Variables
Hughes score at 3 months
P-value
AOR 95 % CI
≤2 N (%) >2N (%) Lower Limb power 0-2 9 (34.6) 23 (95.8) 0.000 30.11 1.44 628.7
3-5 17 (65.4) 1 (4.2) Sensory symptoms No 16 (61.5) 8 (33.3) 0.046 .93 .13 6.61
Yes 10 (38.5) 16 (66.7) Dysautono-mia No 20 (76.9) 11(45.8) 0.024 .37 .05 2.74
Yes 6 (23.1) 13 (54.2) Mechanical ventila-tion
No 23 (88.5) 15 (62.5) 0.032 .04 .00 1.28 Yes 3 (11.5) 9 (37.5)
IV immunoglo-bulin No 19 (73.1) 8 (33.3) 0.005 4.98 .50 49.48 Yes 7 (26.9) 16 (66.7)
Complication No 22 (84.6) 11 (45.8) 0.004 5.86 .23 150.4 Yes 4 (15.4) 13 (54.2)
Time to Nadir ≤ 3 D 9 (34.6) 17 (65.4) 0.006 1.20 .14 10.23 > 3 D 17 (73.9) 6 (26.1)
Hospital Stay in days ≤2wks 22(78.5) 6(21.4) 0.001 1.10 .99 1.21 > 2wks 8(36.4) 14(63.6)
DISCUSSION
In our study, acute motor axonal neuropathy (AMAN) and ascending weakness are the commonest variants. There are relevant numbers of patients requiring me-chanical ventilation. Most of our patients showed a good functional out come with 88% functional inde-pendence at 6th month follow up. The severity of mo-tor weakness at nadir is independently associated with poor functional outcome. On the previous study in our setup, AMAN was the most common subtype accounting for 80% and AM-SAN < 10% (7). In our study, the most common vari-ant was AMAN which accounted for 73% of the cases followed by AIDP in 24% of the cases which is slightly higher than the previous study. This is in sharp contrast with western reports. AMSAN was the rarest variant which accounted for 3% of the cases strengthening the rarity of this variant in other reports (11–13).
In this study, 22% of children required mechanical ventilation for respiratory failure strengthening the general recommendation on meticulous follow up of respiratory status of GBS patients. There is an increase in use of the mechanical ventilation as compared with the previous study in our set up, 12.5% (7) which justifies the increased availability of the ICU setting. In our study, 92.3% had ascending type of weak-ness which was in line with the research done by Saroj Kumar Bhagat et al in eastern Nepal showing 93.5% predominance(19). This pattern of motor weakness also accounted for 82.1 % of the 112 patients in the former study on GBS by Tigist et al. (7) in our setup. It has been reported that, 85% of GBS patients will be functionally independent by one year, 10% will have functionally disabling weakness, and the rest 5% will die due to the GBS(15).

303
In our study, 14% became functionally independent (Hughes score ≤2) on discharge, 52% at three months and 88% at six months. In contrast, the outcome on discharge in the study by Tigist et al. with mean duration of hospital stay being 18 days showed a 27.7 % good outcome and 36.6 % poor outcome with in-hospital GBS mortality of 8% and residual weakness frequency of 37 %(7). The in hospital mortality of GBS in our study was 2.2% comparable to that reported in the study by Alshek-hlee A et al. (2.58%) in the United states of America (20) and in a study by Mahmoud Reza Ashrafi et al. (2.2%) in Iran(21). The lower mortality in our study compared to the previous study in TASH may indi-cate improvements achieved in health care quality in subsequent years, especially ICU care for respiratory failure. 38% of children did not improve completely in our study similar to the previous study (7). This observation is very similar with the general descrip-tions on the prognosis of GBS showing a relatively benign process compared to other neurologic condi-tions causing weakness (15,20,21). Some clinical variables at presentation can indirectly suggest the poor likely hood of recovery and longer hospital stay; such as the severity of weakness at nadir, the rapidity of disease course and the presence of early cranial nerve palsies(21).
In our study, one variable which became independ-ently associated with poor functional outcome on multivariate analysis was the severity of muscle weakness at nadir (p =0.028, AOR -30.115, 95%CI- 1.44-628.7). The larger confidence interval shows the lesser power of the study due to the smaller sam-ple size than calculated which signifies the require-ment of a large size study for better assessment of predictive factors of outcomes of patients with GBS. Conclusion Most patients with GBS have good prognosis with highly improving functional independence in the first 6 months after initial presentation and the severity of motor weakness at nadir is associated with lower likely hood of functional independence.
ACKNOWLEDGMENT We are grateful to the department of pediatrics and child health staffs at large for their understanding and continuous help until the completion of this paper. My heartfelt appreciation is for my advisors, Dr. Abebe Habtamu and Dr. Ayalew Moges, for their critical look up of the paper for any corrections, and amendable look-ups. Conflict of interest The authors have no conflict of interest to declare.
REFERENCES 1. Hughes RAC, Swan A V., Raphaël JC, Annane D, Van Koningsveld R, Van Doorn PA. Immunotherapy for Guillain-Barré syndrome: A systematic review. Brain. 2007;130(9):2245–57. https://doi.org/10.1093/ brain/awm004 . 2. Zhong M, Cai F-C. Current perspectives on Guillain-Barré syndrome. World J Pediatr. 2007;3(3):187– 94. https://doi.org/10.1016/j.pediatrneurol.2011.06.007. 3. Pritchard J, Hughes RA, Hadden RD, Brassington R. Pharmacological treatment other than corticoster oids, intravenous immunoglobulin and plasma exchange for Guillain-Barré syndrome. Cochrane Database Syst Rev. 2016;2016(11). https://doi.org/10.1002/14651858.cd008630.pub4. 4. Witsch J, Galldiks N, Bender A, Kollmar R, Bösel J, Hobohm C, et al. Long-term outcome in patients with Guillain-Barré syndrome requiring mechanical ventilation. J Neurol. 2013;260(5):1367–74. https:// doi.org/10.1007/s00415-012-6806-x. 5. Kuwabara S. Guillain-Barré syndrome: Epidemiology, pathophysiology and management. Drugs. 2004;64 (6):597–610. https://doi.org/10.2165/00003495-200464060-00003. 6. Sharma B, Paul M. Guillain-Barre Syndrome in 2016: The Centenary Advances. Int J Med Public Heal. 2016;6(3):111–2. http://dx.doi.org/10.5530/ijmedph.2016.3.2. 7. Heye TB. Guillain Barre Syndrome in Children at Tikur Anbessa Specialized Hospital. Res GATE. 2019;2009(April):18–25. 8. Schmidt-Ott R, Schmidt H, Feldmann S, Brass F, Krone B, Gross U. Improved serological diagnosis stresses the major role of Campylobacter jejuni in triggering Guillain-barré syndrome. Clin Vaccine Im munol. 2006;13(7):779–83. https://dx.doi.org/10.1128%2FCVI.00065-06. 9. Ang CW, Jacobs BC, Brandenburg AH, Laman JD, Van Der Meché FGA, Osterhaus ADME, et al. Cross- reactive antibodies against GM2 and CMV-infected fibroblasts in Guillain-Barre syndrome. Neurology. 2000;54(7):1453–8. https://doi.org/10.1212/wnl.54.7.1453.

304
10. Kieseier BC, Kiefer R, Gold R, Hemmer B, Willison HJ, Hartung H-P. Advances in understanding and treatment of immune-mediated disorders of the peripheral nervous system. Muscle Nerve [Internet]. 2004 Aug [cited 2021 Aug 13];30(2):131–56. Available from: https://pubmed.ncbi.nlm.nih.gov/15266629/ https://doi.org/10.1002/mus.20076 11. Zhang G, Li Q, Zhang R, Wei X, Wang J, Qin X. Subtypes and prognosis of Guillain-Barré syndrome in southwest China. PLoS One. 2015;10(7):1–8. https://doi.org/10.1371/journal.pone.0133520 12. Walgaard C, Lingsma HF, Ruts L, Van Doorn PA, Steyerberg EW, Jacobs BC. Early recognition of poor prognosis in Guillain-Barré syndrome. Neurology. 2011;76(11):968–75. https://doi.org/10.1212/ wnl.0b013e3182104407 13. Akbayram S, Dogan M, Akgün C, Peker E, Sayin R, Aktar F, et al. Clinical features and prognosis with Guillain-Barr syndrome. Ann Indian Acad Neurol. 2011;14(2):98–102. https://doi.org/10.4103/0972- 2327.82793 14. Jacobs BC, van den Berg B, Verboon C, Chavada G, Cornblath DR, Gorson KC, et al. International Guill ain-Barré Syndrome Outcome Study: protocol of a prospective observational cohort study on clinical and biological predictors of disease course and outcome in Guillain-Barré syndrome. J Peripher Nerv Syst. 2017;22(2):68–76. https://doi.org/10.1111/jns.12209 15. van Koningsveld R, Steyerberg EW, Hughes RA, Swan A V., van Doorn PA, Jacobs BC. A clinical prog nostic scoring system for Guillain-Barré syndrome. Lancet Neurol [Internet]. 2007 Jul [cited 2021 Aug 13];6(7):589–94. Available from: https://pubmed.ncbi.nlm.nih.gov/17537676/ https://doi.org/10.1016/ s1474-4422(07)70130-8 16. Walgaard C, Lingsma HF, Ruts L, Drenthen J, Koningsveld R van, Garssen MJP, et al. Prediction of res piratory insufficiency in Guillain-Barré syndrome. Ann Neurol [Internet]. 2010 Jun [cited 2021 Aug 13];67(6):NA-NA. Available from: https://onlinelibrary.wiley.com/doi/10.1002/ana.21976 https:// doi.org/10.1002/ana.21976. 17. van der Pijl J, Wilmshurst JM, van Dijk M, Argent A, Booth J, Zampoli M. Acute flaccid paralysis in South African children: Causes, respiratory complications and neurological outcome. J Paediatr Child Health [Internet]. 2018 Mar 1 [cited 2021 Aug 13];54(3):247–53. Available from: https:// p u b med.ncbi.nlm.nih.gov/28960591/ https://doi.org/10.1111/jpc.13709. 18. Ashrafi MR, Sagheb S, Mohammadi M, Vakili A, Nasirian A, Zamani GR. Clinical short term outcome of Guillain-Barré syndrome in children. Iran J Pediatr [Internet]. 2008 [cited 2021 Aug 13];18(1):11–9. Available from: https://www.researchgate.net/publication/26502512. 19. Alshekhlee A, Hussain Z, Sultan B, Katirji B. Guillain-Barré syndrome: incidence and mortality rates in US hospitals. Neurology [Internet]. 2008 Apr 29 [cited 2021 Aug 13];70(18):1608–13. Available from: h t tp : / /www.neu ro logy .o rg /cg i /do i /10 .1212 /01 .wn l .0000310983 .38724 .d4 , h t tp s : / / doi.org/10.1212/01.wnl.0000310983.38724.d4. 20. Asiri S, Altwaijri W, Ba-Armah D, Al Rumayyan A, Alrifai M, Salam M, et al. Prevalence and outcomes of Guillain-Barré syndrome among pediatrics in Saudi Arabia: a 10-year retrospective study. Neuropsy chiatr Dis Treat [Internet]. 2019 Mar [cited 2021 Aug 13];Volume 15(1):627–35. Available from: https:// pubmed.ncbi.nlm.nih.gov/30880987/, https://doi.org/10.2147/NDT.S187994. 21. Bhagat SK, Sidhant S, Bhatta M, Ghimire A, Shah B. Clinical Profile, Functional Outcome, and Mortality of Guillain-Barre Syndrome: A Five-Year Tertiary Care Experience from Nepal. Neurol Res Int [Internet]. 2019 Jun 2 [cited 2021 Aug 13];2019(2):1–5. Available from: https://www.hindawi.com/ journals/nri/2019/3867946/, https://doi.org/10.1155/2019/3867946.

305
Henok Fisseha, Hailu Abera Mulatu, Rodas A. Kassu, Senayt Nur Yimer, Esubalew Woldeyes. Ethiop Med J, 2021, Vol. 59, No. 4 ORIGINAL ARTICLE
BURNOUT AND STRESS AMONG INTERNS IN AN ETHIOPIAN TEACHING HOSPITAL: PREVALENCE AND ASSOCIATED FACTORS
Henok Fisseha, MD1 *, Hailu Abera Mulatu, MD1, Rodas A. Kassu, MD2, Senayt Nur Yimer, MD1, Esubalew Woldeyes, MD1
ABSTRACT Introduction: Burnout is a psychological condition characterized by emotional and physical exhaustion, deperson-alization, and low personal accomplishment. Workplace stress is a significant problem among physicians and is considered as a predecessor to burnout. Burnout negatively affects patient care and causes poor physician mental health. The objective of this study was to determine the level of burnout and stress among medical interns working at St. Paul’s Hospital Millennium Medical College and associated factors. Methods: A cross-sectional survey was conducted among 72 interns using a structured online survey. Burnout was assessed using Maslach Burnout Inventory. Burnout was considered when there is a high score on emotional ex-haustion (> 26 points), depersonalization (> 9 points) or low score on personal accomplishment (< 34 points) sub-scale. Stress was evaluated using Perceived Stress Scale-10 questionnaire. Statistical package for social sciences version 23 was used for data analysis. Univariate and multivariate logistic regression analysis were used to deter-mine association between variables. All variables with a p-value of < 0.05 in the multivariate regression model were considered to be statistically significant. Results: High emotional exhaustion, high depersonalization, and highly reduced sense of personal accomplish-ment were seen in 69.4%, 41.7%, and 44.4% of participants respectively. High level of stress was seen in 37% of the participants. Logistic regression analysis showed that emotional exhaustion and depersonalization were inde-pendently associated with having plans to change profession, having financial worries, and high perceived stress, while depersonalization was associated with fear of medical errors. Reduced personal accomplishment was associ-ated with high perceived stress. High level of perceived stress was associated with having plans to change profes-sion. Conclusions: The levels of burnout and stress among interns were found to be high. All concerned bodies must be aware of the findings of this study so they can help improve the mental wellbeing of interns. Support services for interns need to be enhanced. Key words: Professional burnout, psychological stress, internship, teaching hospital
INTRODUCTION
Internship is a critical point in medical students’ journey reflecting transition to independently func-tioning physician and is an important experience in a physician’s life (1,2). It is however faced with sev-eral challenges bringing a certain level of distress (1). These challenges include but not limited to long working hours, disturbances in sleep-wake cycles, excessive workload and having multiple responsibili-ties (1, 3, 4), which occur with significant lack of social support and uncertain future (1,5). These lead to high level of stress and dissatisfaction with 29 to 95% of interns and other physicians considering stress a significant problem (1, 4, 6).
High levels of workplace stress is considered precur-sor to burnout (1, 3, 4, 6).
The term ‘burnout’ was first described by the Ameri-can psychologist Herbert Freudenberger in 1974 (7) and seen mainly in professions having significant contact with other individuals, specifically those that help people such as medicine (1, 7, 8).
Burnout syndrome is a psychological condition char-acterized by emotional and physical exhaustion, de-personalization, and low personal accomplishment (1, 3). The International Classification of Diseases 11th revision (ICD-11) now has coding for burnout and recognizes it as a syndrome conceptualized as resulting from chronic workplace stress and includes several elements in common with depression and neglect of physical health giving burnout a global recognition (9, 10).
1 Department of Internal Medicine, St. Paul’s Hospital Millennium Medical College, Addis Ababa, Ethiopia 2 Department of Neurosurgery, St. Paul’s Hospital Millennium Medical College, Addis Ababa, Ethiopia *Corresponding author e-mail address: [email protected]

306
This will help further highlight the distinct nature of burnout, which traditionally had unclear distinction with other psychiatric diagnosis such as depression, adjustment disorder or chronic fatigue syndrome (11).
Burnout negatively affects patient care, desire to help, willingness to work and increases medical errors (1, 12, 13, 14). It reduces cognitive skills and affects pa-tient and physician satisfaction contributing to brain drain and strains healthcare systems (1, 3, 13, 15, 16). It causes poor physician mental health contributing to depression, anxiety, and poor quality of life (1, 14, 15). It also affects physical wellbeing resulting in in-adequate sleep, and adverse health outcomes (1, 9, 15).
The prevalence of burnout among physicians and medical students is reported to be high (15). Data from low and middle-income countries is scarce, but few studies in sub-Saharan Africa reported burnout as a major challenge (13, 16, 17). Prevalence of burnout in interns has also been studied showing levels from 16.7% in Jeddah to as high as 75% in Australia (1, 3, 5, 18). Several factors affect occurrence of burnout including lack of support, dissatisfaction with education, unde-fined work roles, sleep deprivation and high work burden (1, 3, 15). Substance use such as smoking and excessive alcohol consumptions seems to increase the risk (15). Salary was also a major contributor in stud-ies among physicians outside internship years (13). Knowing the magnitude of stress and burnout and contributing factors will help recommend possible solutions. Burnout was studied among Ethiopian phy-sicians and medical students. However, we are not aware of any previous studies that evaluated the level of stress and burnout among interns working in Ethio-pia. The aim of this study was to determine the level of burnout and stress and associated factors among medi-cal interns working at St. Paul’s Hospital Millennium Medical College (SPHMMC).
MATERIALS AND METHODS
Study setting and design The study was conducted at SPHMMC in Addis Ababa, Ethiopia; a tertiary teaching hospital estab-lished in 2007 after a medical college was opened in a hospital built in 1968 (19). Interns have rotations of 12 weeks each in of the departments of internal medi-cine, pediatrics, surgery and obstetrics and gynecol-ogy and 6 week rotation in psychiatry and emergency medicine. A cross-sectional survey was conducted from August 24 to September 20, 2020 on interns that worked in the hospital for a minimum of 6 months.
Sample size was calculated using single population proportion formula. The value of P was taken as 22%, according to a study done in similar popula-tion in India (5). A desired confidence level of 95% and margin of error of 5% was used resulting in a sample size of 264. There were 106 interns actively working in the hospital. Since this number ex-ceeded the total number of interns, it was planned to include all interns in the data collection. Survey instrument Data collection was made using structured elec-tronic online questionnaire. All interns were invited to participate in the survey via social media plat-form used for a group communication. Filling out the survey proceeded after electronic consent was given. The questionnaire had four parts. First part included sociodemographic data (age, gender, marital status, residence in college compound, and living with family or not). Second part included a group of structured questionnaires for assessing burnout us-ing Maslach Burnout Inventory (MBI), and stress using Perceived Stress scale-10 (PSS-10) (8, 20). MBI was validated in South Africa for assessment of burnout and has been used in previous studies in Ethiopia (13, 21). MBI is a 22-item questionnaire instrument assessing burnout (8). It has three components, each assessing emotional exhaustion (EE), depersonalization (DP) and personal accomplishment (PA). EE includes 9 items with a maximum score of 54 and is classified high for score > 26, moderate for scores 19-26 and low for scores below 19. DP has 5 items scored out of 30 and is classified as high if > 9 points, moder-ate for 6-9 points and low below 6 points. Finally, PA containing 8 items scored out of 48 is scored low for scores < 34, moderate for scores 34-39 and high for above 39. Since PSS-10 is recommended as a tool to assess the level of stress over the last one month and not a diagnostic instrument, there is no cut off for classifi-cation of stress. Dividing the PSS-10 values in to tertiles was done (22, 23). The highest tertile (PSS≥18) was considered to be associated with a higher degree of perceived stress while intermediate score (PSS=18-22) and low score (≤17) was consid-ered lower degree. PSS-10 is validated in Ethiopia (24). The final parts assessed factors affecting burnout, including individual and work related factors.
307
Data analysis Data were generated from the electronic questionnaire in Excel format and checked for completeness. It was then entered into Statistical Package for Social Sci-ences version 23 and analyzed. Data were summarized using percentages, mean, standard deviation (SD) and presented in tables and figures. Reliability of burnout and stress assessment tools were done. Logistic re-gression model was used to examine the independent association between burnout, stress and associated factors. Variables with P-value <0.2 in the univariate analysis were included in the multivariate logistic regression model. All variables with a p-value of < 0.05 in the multivariate model were considered statis-tically significant. Associations between variables were presented in odds ratios (OR) with 95% confi-dence interval (CI). Ethical approval The study was approved by the Institutional Review Board of SPHMMC (IRB code: PM 28/103).
Written informed consent was obtained from all participants.
Each participant’s information was collected using anonymous electronic questionnaire.
RESULTS
Socio-demographic characteristics Out of the 106 interns actively working in the hospi-tal, there were 72 responses giving a response rate of 68%. Out of the respondents, 59.7% were males and except for one married individual, all were sin-gle. The mean age (SD) was 24.57 (1.46) years and ranged from 23 to 34 years. Most of the participants (70.8 %) live inside the college compound in the dormitories. Over half (54.2%) said their families reside in the capital Addis Ababa and among them 61.5 % do not live with their families during work and reside in the dormitories (Table 1).
Table 1: Sociodemographic characteristics of interns, SPHMMC, Addis Ababa, 2020
Characteristic Number Percent
Age Group Up to 24 years 44 61.1 25 years and above 28 38.9 Gender Female 29 40.3 Male 43 59.7 Place of residence Inside college compound 51 70.8 Outside college compound 21 29.2 Family residence Addis Ababa 39 54.2 Outside of Addis Ababa 33 45.8 Current rotation Emergency medicine 10 13.9 Internal Medicine 17 23.6 Obstetrics/Gynecology 15 20.8 Pediatrics 13 18.1 Psychiatry 5 6.9 Surgery 12 16.7
Other co-morbid conditions Several individual-related factors were assessed. Six participants reported as having been diagnosed with psychiatric conditions in a healthcare setting which included three individuals with major depressive dis-order and two with generalized anxiety disorder. The average number of night duties per week ranged from 0 to 4 with 68% having 2 duty shifts while, 26% hav-ing 3 duties.
Two respondents said they smoke cigarettes or chew khat regularly and 6 individuals consumed alcohol regularly. A total of 8 (11.1%) individuals regularly used any of the mentioned substances. Eighty-three percent were not aware of any support service in the hospital. Finally, 69.4% of respon-dents had planned to leave the country and 43.1% had planned to change their profession (Table 2).

308
Factor assessed Number Percent
Regular physical activity No 61 84.7 Yes 11 15.3
Average number of duty per week
<3 51 70.8 ≥3 21 29.1
Excessively worried about COVID-19 pandemic
No 43 59.7 Yes 29 40.3
Awareness of support services No 60 83.3 Yes 12 16.7
Plans to leave the country No 22 30.6 Yes 50 69.4
Plans to change profession No 41 56.9 Yes 31 43.1
Figure 1: Burnout status of study participants, SPHMMC, Addis Ababa, 2020 Ten (13.9%) interns had high level of burnout in all three MBI components and 13 (18%) in two components. Stress The mean PSS-10 score was 21.03, which lied in the high tertile range and 37% of responses were in this range reflecting a high level of perceived stress. The rest 36.1% and 26.4% were in the mod-erate and low group respectively (Table 3).
Work related challenges faced during internship The interns were asked to rate the challenges they faced on a 5-point likert scale. The biggest chal-lenge identified from the responses was ‘Poorly defined role as an intern’ whereby 97.2% said that they ‘agree’ or ‘strongly agree’. Ninety percent agree with having excessive work load and 92.7% complained of fatigue and sleep deprivation (Table 4).
Factors associated with burnout The odds of having EE was five times higher in individuals having plans to change profession (AOR, 5.13; 95% CI, 1.31-21.11) and had exces-sive financial worries (AOR, 5.57; 95% CI, 1.23- 25.15) and six times higher in individuals who reported high level of perceived stress (AOR, 6.17; 95% CI, 1.29- 29.59) after controlling for the other variables. Similarly, all the three factors were inde-pendently associated with high DP. Fear of medi-cal errors increased the odds of DP (AOR, 4.56; 95% CI, 1.14-18.23). Participants who reported high level of perceived stress had three times in-creased odds of reporting low levels of PA (AOR, 3.09; 95% CI, 1.03-9.29). Having plans to change profession increased the odds of reporting high stress by five-fold (AOR, 5.16; 95% CI, 1.411-18.924) (Table 5).
Table 2: Other co-morbid conditions of interns, SPHMMC, Addis Ababa, 2020
COVID-19: Coronavirus Disease 2019
Reliability of survey questionnaire Evaluation of the internal consistency (cronbach’s al-pha) of the instrument was done and α-values of 0.908, 0.801, and 0.694 were obtained for EE, PA, DP sub-scale respectively. All α-values were above 0.6 and were acceptable. Similarly, a good internal consistency of α = 0.879 was seen for PSS-10 questionnaire. Burnout assessment
The burnout assessment of interns showed that 69.4%, 41.7%, and 44.4% of them reported high EE, high DP, and highly reduced sense of PA respectively. The mean scores of MBI components for EE was 33.4 (range: 4 to 54) reflecting a high level. In contrast, the mean scores for DP and PA respectively, were 9.4 (range: 0 to 25) and 34.1 (range: 16 to 48) reflecting moderate levels of DP and reduced PA (Figure 1).

309
Variable PSS-10 high Number Percent Age group in years <25 16 36.4 ≥25 11 39.3 Gender Female 15 51.7 Male 12 27.9 Place of residence Inside college compound 18 35.3 Outside college compound 9 42.9 Family residence Addis Ababa 18 46.2 Outside of Addis Ababa 9 27.3 Department Internal Medicine 10 58.8 Pediatrics 3 23.1 Obstetrics and gynecology 7 46.7 Emergency medicine 2 20 Psychiatry 0 0 Average number of duties in the last week
<3 17 33.3 ≥3 10 47.6 Regular physical activity No 22 36.1 Yes 5 45.5 Drink alcohol regularly No 23 34.8 Yes 4 66.7 Excessively stressed/worried about COVID-19 pandemic
No 17 39.5 Yes 10 52.6 Awareness of support ser-vices
No 25 41.7 Yes 2 16.7 Plans to leave the country No 5 22.7 Yes 22 44 Plans to change profession No 10 24.4 Yes 17 54.8
Table 3: Characteristics of high perceived stress, SPHMMC, Addis Ababa, 2020
Table 4: Work-related factors, SPHMMC, Addis Ababa, 2020
Challenges faced during work
Strongly agree or agree
Percent
Lack of support 44 61.1 Excess work overload 65 90.2 Difficulty integrating well with the team
5 6.9
Inadequacy of clinical skills
7 9.7
Inadequacy of clinical knowledge
5 6.9
Feeling inadequately prepared to work as a doctor
11 15.2
Difficulty balancing work with personal life
24 33.3
Difficulty interacting with senior staff
28 38.8
Having poorly defined role as an intern
70 97.2
Having financial worries 24 33.3 Having future and career uncertainty
64 88.8
Conflict with allied health professionals
49 68
Difficulty attaining edu-cation and practical skills needs
49 68
Fear of error leading to patient suffering
36 50
Fear of medico-legal consequences
30 41.6
Excess fatigue and sleep deprivation
66 91.7
Lack of recognition 64 88.9 Finding a comfortable place to sleep/rest while on duty
53 73.7
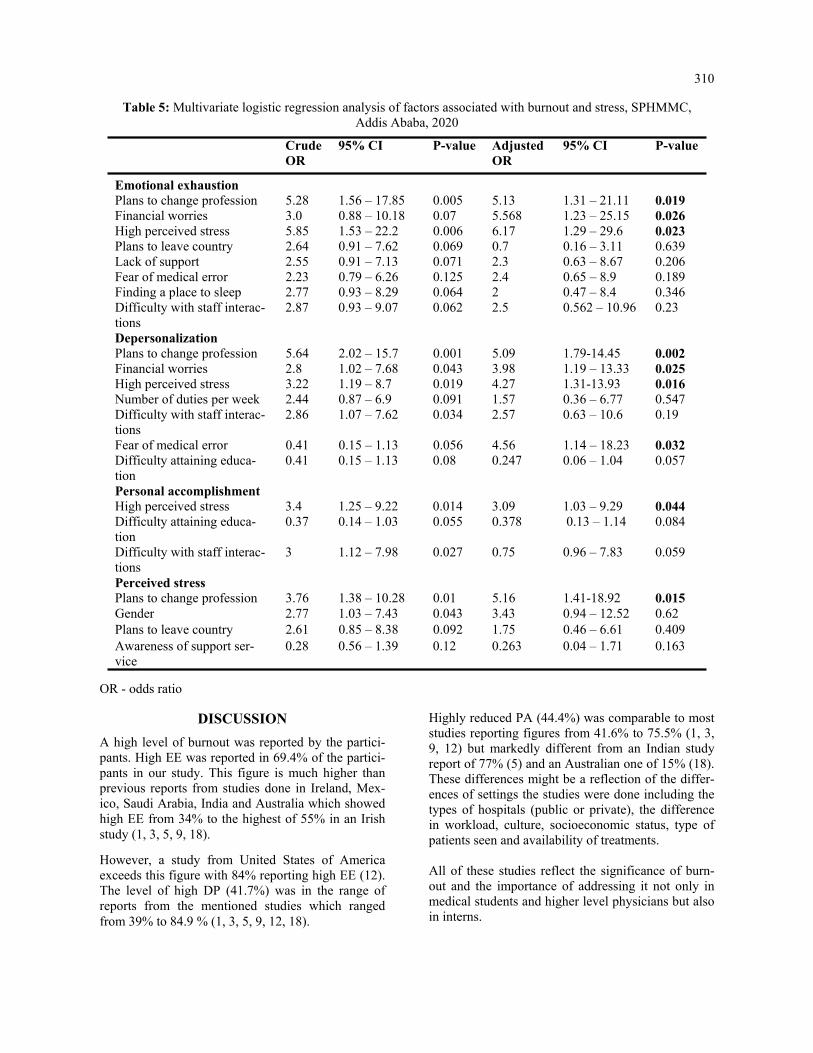
310
Table 5: Multivariate logistic regression analysis of factors associated with burnout and stress, SPHMMC, Addis Ababa, 2020
OR - odds ratio
Crude OR
95% CI P-value Adjusted OR
95% CI P-value
Emotional exhaustion Plans to change profession 5.28 1.56 – 17.85 0.005 5.13 1.31 – 21.11 0.019 Financial worries 3.0 0.88 – 10.18 0.07 5.568 1.23 – 25.15 0.026 High perceived stress 5.85 1.53 – 22.2 0.006 6.17 1.29 – 29.6 0.023 Plans to leave country 2.64 0.91 – 7.62 0.069 0.7 0.16 – 3.11 0.639 Lack of support 2.55 0.91 – 7.13 0.071 2.3 0.63 – 8.67 0.206 Fear of medical error 2.23 0.79 – 6.26 0.125 2.4 0.65 – 8.9 0.189 Finding a place to sleep 2.77 0.93 – 8.29 0.064 2 0.47 – 8.4 0.346 Difficulty with staff interac-tions
2.87 0.93 – 9.07 0.062 2.5 0.562 – 10.96 0.23
Depersonalization Plans to change profession 5.64 2.02 – 15.7 0.001 5.09 1.79-14.45 0.002 Financial worries 2.8 1.02 – 7.68 0.043 3.98 1.19 – 13.33 0.025 High perceived stress 3.22 1.19 – 8.7 0.019 4.27 1.31-13.93 0.016 Number of duties per week 2.44 0.87 – 6.9 0.091 1.57 0.36 – 6.77 0.547 Difficulty with staff interac-tions
2.86 1.07 – 7.62 0.034 2.57 0.63 – 10.6 0.19
Fear of medical error 0.41 0.15 – 1.13 0.056 4.56 1.14 – 18.23 0.032 Difficulty attaining educa-tion
0.41 0.15 – 1.13 0.08 0.247 0.06 – 1.04 0.057
Personal accomplishment High perceived stress 3.4 1.25 – 9.22 0.014 3.09 1.03 – 9.29 0.044 Difficulty attaining educa-tion
0.37 0.14 – 1.03 0.055 0.378 0.13 – 1.14 0.084
Difficulty with staff interac-tions
3 1.12 – 7.98 0.027 0.75 0.96 – 7.83 0.059
Perceived stress Plans to change profession 3.76 1.38 – 10.28 0.01 5.16 1.41-18.92 0.015 Gender 2.77 1.03 – 7.43 0.043 3.43 0.94 – 12.52 0.62 Plans to leave country 2.61 0.85 – 8.38 0.092 1.75 0.46 – 6.61 0.409 Awareness of support ser-vice
0.28 0.56 – 1.39 0.12 0.263 0.04 – 1.71 0.163
DISCUSSION
A high level of burnout was reported by the partici-pants. High EE was reported in 69.4% of the partici-pants in our study. This figure is much higher than previous reports from studies done in Ireland, Mex-ico, Saudi Arabia, India and Australia which showed high EE from 34% to the highest of 55% in an Irish study (1, 3, 5, 9, 18).
However, a study from United States of America exceeds this figure with 84% reporting high EE (12). The level of high DP (41.7%) was in the range of reports from the mentioned studies which ranged from 39% to 84.9 % (1, 3, 5, 9, 12, 18).
Highly reduced PA (44.4%) was comparable to most studies reporting figures from 41.6% to 75.5% (1, 3, 9, 12) but markedly different from an Indian study report of 77% (5) and an Australian one of 15% (18). These differences might be a reflection of the differ-ences of settings the studies were done including the types of hospitals (public or private), the difference in workload, culture, socioeconomic status, type of patients seen and availability of treatments. All of these studies reflect the significance of burn-out and the importance of addressing it not only in medical students and higher level physicians but also in interns.

311
Financial issues have been found to be significant con-tributors to burnout in all physicians (1, 25). A Saudi Arabian study reasoned that living in a self-owned house provides financial security and subsequently leads to less burnout (9). Burnout has also been found to be more common in individuals contemplating changing their careers as it reflects the level of frustra-tion with their life and career (9). An association be-tween intern stress and medical errors has been re-ported (18). In addition, medical errors can be a source of burnout while burnout by itself can increase medical errors showing that it can also affect patients and po-tentially lead to litigation (11). Not only were components of burnout high, but so was the level of perceived stress. Previous studies have shown that high level of stress poses a threat to increas-ing burnout (26, 27). This has also been reflected in interns whereby 43% in one study with high burnout reported mild to severe degrees of distress assessed by the 12-item general health questionnaire (1). Our study also supports this association by reflecting the signifi-cance of stress on all three components of burnout.
There was also significant difference with regards to gender and burnout. Previous studies show inconsisten-cies with which gender is more affected. Most studies in interns, however, reveal that gender might not be significant (1, 3, 5, 9). The same was true for dormitory residence and places of family residence. Similar to our findings, more than 80% of participants in a compara-tive study were not aware of support services which may hinder them from seeking help (1). A comparative percentage (around 70%) wish to leave their country in the future (1). This is an alarming number and contrib-utes to the high physician attrition the country faces (28). The increasing saturation of many cities with phy-sicians, particularly general practitioners, is leading to rising unemployment, which can further affect medical students and junior doctors (29). Contemplating to change profession can stem from lack of employment prospects, which was shown to be related to compo-nents of burnout on a study from Ethiopia (30). It is critical to raise awareness about the significance of stress and burnout among interns. Interns are not pro-vided with the concern given to other physicians, which is reflected by the paucity of previous studies on the subject on interns. Burnout is as common, if not more, compared to physicians who completed internships. Subsequently, the impact on mental and physical well-being can be mitigated (16). Healthy and satisfied phy-sicians are essential for providing appropriate care for patients by minimizing medical errors, reducing physi-cian fatigue, and improving patient satisfaction (3, 5, 18, 31).
Support services including psychological support that is designed to address their challenges must be made available and they should be aware of it as soon as they start internship. Mentorship by physi-cians that have passed their internship and have experience dealing with its challenges can help by addressing the issues they might have. To our knowledge, this study is the first of its kind done to assess burnout among interns in Ethiopia. An internationally validated instrument was used to assess burnout and a locally validated one was used for evaluation of stress. It will serve as an important starting point for further research. How-ever, it has some limitations. Response rate of 68% may not be representative of all interns, but is higher than 35% and 45% in other similar studies (1, 9). The number of participants is low and it is recommended that future large scale multi-center studies be done. This was a cross-sectional study and definitive conclusions about causality cannot be made. Initial baseline data collection and serial follow-up was not made.
Conclusions In summary, levels of burnout and stress in was high among interns. The results underscore the need to raise awareness on the problem. Promoting mental well-being and optimizing preventative and psychosocial support services is essential. The college must make the mental wellbeing of its phy-sicians a priority and act early. Financial and job security must be safeguarded so that junior physicians can work in a more condu-cive work environment. Further studies on the sub-ject with more detailed assessments on impacts of burnout on other components of mental health needs to be conducted.
ACKNOWLEDGMENT
The authors would like to give their kind regards to Mr. Tewodros Getinet for his valuable feedback during preparation of this manuscript. Conflict of interests All authors declare that they have no conflict of interest regarding this manuscript.
312
REFERENCES 1. Hannan E, Breslin N, Doherty E, McGreal M, Moneley D, Offiah G. Burnout and stress amongst interns in Irish hospitals: contributing factors and potential solutions. Ir J Med Sci. 2018;187: 301-307 2. Swaid AI, Elhilu AH, Mahfouz MS. Medical internship training in Saudi Arabia: interns’ views and perceptions. Adv Med Educ Pract. 2017;8:121-128 3. Miranda-Ackerman RC, Barbosa-Camacho FJ, Sander-Möller MJ, Buenrostro-Jiménez AD, Mares-Paíset R, Cortes-Flores AO, et al. Burnout syndrome prevalence during internship in public and private hospi tals: a survey study in Mexico. Med Educ Online. 2019; 24(1) :1593785 4. Lam TP, Wong JG, Ip MS, Lam KF, Pang SL. Psychological well-being of interns in Hong Kong: What causes them stress and what helps them. Med Teach. 2010;32(3):e120-e126 5. Niranjan V, Udey B, Razdan RG. Evaluation of burnout in medical interns: an institutional study. Int J Res Med Sci. 2017;5(5):2173-2175 6. Abdulghani HM, Irshad M, Zunitan MA, Sulihem AA, Dehaim MA, Esefir WA, et al. Prevalence of stress in junior doctors during their internship training: a cross-sectional study of three Saudi medical coll eges’ hospitals. Neuropsychiatr Dis Treat. 2014;10:1879-1886 7. Freudenberger HJ. Staff burnout. J Soc Issues. 1974;30(1):159–165 8. Maslach C, Jackson SE. The measurement of experienced burnout. J Org Behav. 1981;2:99-113 9. Mufarrih SH, Naseer A, Qureshi NQ, Anwar Z, Zahid N, Lakdawala RH, et al. Burnout, Job Dissatisfac tion, and Mental Health Outcomes Among Medical Students and Health Care Professionals at a Tertiary Care Hospital in Pakistan: Protocol for a Multi-Center Cross-Sectional Study. Front Psychol. 2019; 10:2552 10. The lancet. ICD-11. Lancet. 2019 Jun 8;393(10188):2275 11. Kaschka WP, Korczak D, Broich K. Burnout: a fashionable diagnosis. Dtsch Arztebl Int. 2011;108 (46):781-787 12. Doolittle BR, Windish DM. Correlation of burnout syndrome with specific coping strategies, behaviors, and spiritual attitudes among interns at Yale University, New Haven, USA. J Educ Eval Health Prof. 2015;12:41 13. Lrago T, Asefa F, Yitbarek K. Physicians’ Burnout and Factors in Southern Ethiopia Affecting It. Ethiop J Health Sci. 2018;28(5):589-598 14. Kim MH, Mazenga AC, Yu X, Simon K, Nyasulu P, Kazembe PN, et al. Factors associated with burnout amongst healthcare workers providing HIV care in Malawi. PLos One. 2019;14(9):e0222638 15. Haile Y.G, Senkute A.L, Alemu BT, Bedane DM, Kebede KB. Prevalence and associated factors of burnout among Debre Berhan University medical students: a cross-sectional study. BMC Med Educ. 2019;19(2):413 16. Dubale BW, Friedman LE, Chemali Z, Denninger JW, Mehta DH, Alem A, et al. Systematic review of burnout among healthcare providers in sub-Saharan Africa. BMC Public Health 2019; 19(1):1247 17. Selamu M, Thornicroft G, Fekadu A, Hanlon C. Conceptualisation of job-related wellbeing, stress and
burnout among healthcare workers in rural Ethiopia: a qualitative study. BMC Health Serv Res. 2017; 17 (1):412. 18. Willcock SM, Daly MG, Tennant CC, Allard B. Burnout and psychiatric morbidity new medical gradu ates. MJA 2004;181(7):357-360 19. SPHMMC SPHMMC. About – Saint Paul’s Millennium Medical College. Retrieved from: https:// sphmmc.edu.et/about/ (accessed: Aug 20) 20. Cohen S, Kamarck T, Mermelstein R, A global measure of perceived stress. J Health Soc Behav. 1983;24 (4):385-396. 21. Naude J.L, Rothmann S. The validation of the Maslach Burnout Inventory – Human Services Survey for emergency medical technicians in Gauteng. SA J Ind Psychol. 2004;30(3):21-28 22. Alosaimi FD, Alawad HS. Alamri AK, Saeed AI, Aljuaydi KA, Alotaibi AS, et al. Patterns and determi nants of stresss among consultant physicians working in Saudi Arabia. Adv Med Educ Pract. 2018;9:165- 174 23. Pangtey R, Basu S, Meena GS, Banerjee B. Perceived Stress and its Epidemiological and Behavioral Cor relates in an Urban Area of Delhi, India: A Community-Based Cross-Sectional Study. Indian J Psychol Med. 2020;42(1):80-86 24. Manzar MD, Salahuddin M, Peter S, Alghadir A, Anwer S, Bahammam AS, et al. Psychometric proper ties of the perceived stress scale in Ethiopian university students. BMC public health. 2019;19(1):41.

313
25. Wiederhold BK, Cipresso P, Pizzioli D, Wiederhold M, Riva G. Intervention for physician burnout: A systematic Review. Open Med (Wars). 2018;13:253-263 26. Yates SW. Physician Stress and Burnout. Am J Med. 2020;133(2):160-164 27. Elit L, Trim K, Mand-Bains IH, Sussman J, Grunfeld E. Job satisfaction, stress, and burnout among Cana dian gynecologic oncologists. Gynecol Oncol. 2004;94(1):134-9 28. Berhan Y. Medical doctors profile in Ethiopia: In memory of 100-years Ethiopian modern medicine and t he new Ethiopian millennium. Ethiop Med J. 2008; 46 Suppl 1:1-77 29. Assefa T, Haile Mariam D, Mekonnen W, Derbew M. Health system's response for physician workforce
shortages and the upcoming crisis in Ethiopia: a grounded theory research. Hum Resour Health. 2017;15 (1):86 30. Selamu M, Hanlon C, Medhin G, Thornicroft G, Fekadu A. Burnout among primary healthcare workers during implementation of integrated mental healthcare in rural Ethiopia: a cohort study. Hum Resour Health. 2019 Jul 18;17(1):58 31. Nason GJ, Liddy S, Murphy T, Doherty EM. A cross-sectional observation of burnout in a sample of Irish junior doctors. Ir J Med Sci. 2013;182(4):595-9

315
Eskinder Kebede, Eyasu Mesfin, Myshelle Ramlal Singh. Ethiop Med J, 2021, Vol. 59, No. 4 ORIGINAL ARTICLE
AGE AT MENARCHE, FACTORS THAT INFLUENCE IT, AND MEN-
STRUAL PATTERN OF SECONDARY SCHOOL ADOLESCENTS IN ADDIS ABABA, ETHIOPIA
Eskinder Kebede, MD1*, Eyasu Mesfin, MD1, Myshelle Ramlal Singh, MSc2
ABSTRACT
Introduction: Menarche is the first menstrual period of a girl. Age at menarche is a complex trait and has a strong genetic component. The mean age of menarche varies from population to population and is known to be a sensitive indicator of various characteristics of the population, including nutritional status, geographical location, environ-mental conditions, and magnitude of socioeconomic inequalities in society. Objectives: To determine the mean age of menarche, and assess influencing factors and menstrual patterns of sec-ondary school adolescent females in Addis Ababa, Ethiopia. Methods: This is a cross-sectional study conducted from January to May 2017 in selected high schools in Addis Ababa, Ethiopia. Female adolescents in the selected schools who were in grades 9th and 10th and who fulfilled the eligibility criteria were included. A self-administered questionnaire tool was used to collect data. Data was cleaned, entered and analyzed using SPSS version 21. Results: The mean and median ages at menarche in this study were 13.75 (±1.30) and 13 years, respectively. The mean age at menarche was 0.96 years younger for private school girls (12.82 years) compared to government school girls (13.78 years). The private school girls had about 4 times higher odds of having menarche at an earlier age (AOR 4.12; 95% CI 2.44-6.95). The most common perimenstrual symptoms experienced by the students were dysmenorrhea (abdominal cramps) 303 (75.8 %), backache 188 (47.0 %), and headache 16%. In this study, abnor-mal menstrual cycle lengths occurred in 25.1 % of our respondents. Of the total study population, 77 (19.3%) ado-lescents had a menstrual cycle length shorter than 21 days. Conclusion: The mean age at menarche in this study was 13.26 ±1.319 years. This age at menarche was ear-lier than prior reports from Ethiopia. Socioeconomic status was identified as a factor significantly associated with the age at menarche. Dysmenorrhea was the commonest perimenstrual symptom. Key words: Age at menarche, adolescents, perimenstrual symptom.
INTRODUCTION
Menarche is the first menstrual bleeding and repre-sents a major landmark event in the reproductive life of an adolescent girl. (1) It is the most accurately recalled indicator of puberty. (2) Age at menarche (AAM), as a result, is one of the most significant traits, which is commonly used in retrospective epi-demiological studies of female sexual maturation. (3) Menarche is part of the complex process of growing up. Its onset is preceded by a complex cascade of hormonal changes during puberty which is suscepti-ble to various factors from the very beginning of prenatal life. (4) The mean age at menarche varies from population to population and is known to be a sensitive indicator of various characteristics of the population including nutritional status, geographical location, environmental conditions, and socio-economic status. (5-7)
Studies suggest that menarche tends to appear earlier in life as the sanitary, nutritional, and economic condi-tions of a society improve. (8) Over time, the age at menarche has been found to show a steady decline of about two to three months per decade in developed countries (9), and about six months per decade in developing countries. (10) The mean age at menarche in the United States of America is 12.55 and 12.0 years among black and white girls, respectively. (5) The reported ages at menarche in India were 15.9 and 15.6 years for rural and urban girls respectively. (11) Two studies done in rural Ethiopia revealed the mean age at menarche to be 15.8 ± 1 and 13.9 ± 1.2 years. (3, 12) The normal range for menstrual cycles is between 21 and 35 days while the duration of menstrual flow ranges from two to seven days.
1 Department of Obstetrics and Gynecology, School of Medicine, CHS, Addis Ababa University, Addis Ababa, 2 Department of Health Behaviour and Health Education, University of Michigan *Correspondence author e-mail address: [email protected]

316
Menstrual abnormalities are more common among younger girls, becoming less frequent as they grow older, 3–5 years after menarche. (13-17) For the first few years after menarche, irregular and longer cycles are common. (15-18) Menstruation may also be asso-ciated with various symptoms occurring before or during menstrual flow. A significant number of young students complain of dysmenorrhea, and this is more common among older girls with longer bleeding peri-ods. (18) Knowledge on age at menarche and pattern in men-strual cycles is necessary for patient education and to guide individualized clinical care. To our knowledge there is no published study in our country comparing age at menarche and menstrual patterns between dif-ferent socioeconomic groups. The purpose of this study, hence, was to determine the age at menarche and patterns of menstruation among secondary school girls of different socioeconomic status in Addis Ababa.
METHODS
Study design: This is a cross-sectional study con-ducted from January through May 2017 in selected high schools in Addis Ababa, Ethiopia. Study setting: Addis Ababa has 10 administrative districts and sub-cities. The total number of secondary schools in the city was 212. Study population: Secondary school adolescents who have started to menstruate and at-tending secondary schools in Addis Ababa, Ethiopia. Sample size: The sample size was determined using a single proportion formula with a level of significance of 5%, Z = 1.96 (confidence level at 95%), and the absolute precision or margin of error d=0.05. The 50% proportion (P=0.5) was taken for the sake of having a larger sample size. Sampling procedure: A two-stage sampling was used. In the first stage, one administra-tive district was selected randomly. In the second stage, four high schools, two from government and two from non-governmental schools, were selected randomly from the selected district. The two study government schools were Tikur Anbessa and Atse Naod High schools. The two non-governmental schools were Lycée Guebre Mariam (an international school) and the Nativity Girls School (a missionary school). The study sites also presented a comparative advantage in that each group of schools represented children from low and high socioeconomic groups. Operational definition: The age at menarche was determined by questioning the age of the girl at having her first menstruation.
Data collection: Data was collected using a self-administered pre-tested questionnaire during school hours. Grades 9 to 11 students who already had menarche were included in the study using quota sampling on convenience till the sample size is reached. Of the total sampled 422 adolescents, 400 (95%) had their menarche and were eligible for analysis. Data compilation and analysis: The collected data was coded, cleaned, and analyzed using SPSS ver-sion 21 statistical software. Descriptive statistics were used to present the results. Tables and differ-ent graphs were used to assist data presentation. The chi-square test of independence was done be-tween the independent (socio-demographic vari-ables) and dependent variables (age of menarche). The tested independent variables were the type of school, place of residence, religion, paternal and maternal educational levels, maternal and paternal occupation, and family size. The dependent vari-able was the age of menarche. A stepwise analysis was conducted to explore the presence and strength of the association between the independent variables and age at menarche. Regression analysis was implemented between selected independent variables and age at men-arche as a dichotomous variable (≤13 and >13 years). Earlier age at menarche was taken as age at menarche of below the identified mean age at men-arche in the present study. Initially, bivariate re-gression analysis was conducted for each inde-pendent variable with a chi-square value of <0.2 on cross-tabulation for the test of independence. Multiple regression analysis was then employed for those with a significant association (P<0.05) on bivariate analysis to control for confounding ef-fects among the variables. Odds ratios (ORs) with their 95% confidence intervals were computed to identify the presence and strength of association and P-values<0.05 were taken as statistically sig-nificant. Ethical considerations: Ethical approval was ob-tained from the Institutional Review Board of the College of Medicine and Health Sciences of the AAU. Permission to conduct the study was also obtained from the principals of participating schools. Participation in the assessment was com-pletely voluntary with ascent and written informed consent was acquired from every participant and their parents before participation. No names were recorded to keep the identity of respondents anonymous.
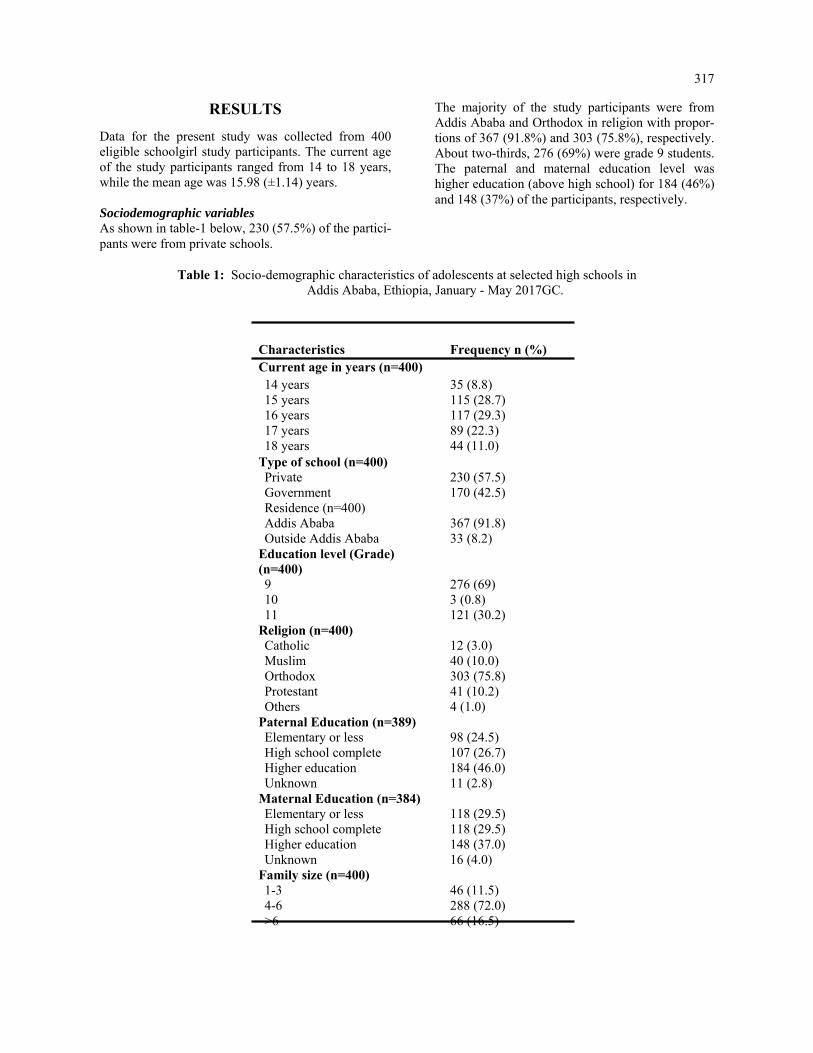
317
RESULTS
Data for the present study was collected from 400 eligible schoolgirl study participants. The current age of the study participants ranged from 14 to 18 years, while the mean age was 15.98 (±1.14) years. Sociodemographic variables As shown in table-1 below, 230 (57.5%) of the partici-pants were from private schools.
The majority of the study participants were from Addis Ababa and Orthodox in religion with propor-tions of 367 (91.8%) and 303 (75.8%), respectively. About two-thirds, 276 (69%) were grade 9 students. The paternal and maternal education level was higher education (above high school) for 184 (46%) and 148 (37%) of the participants, respectively.
Table 1: Socio-demographic characteristics of adolescents at selected high schools in Addis Ababa, Ethiopia, January - May 2017GC.
Characteristics Frequency n (%) Current age in years (n=400) 14 years 35 (8.8) 15 years 115 (28.7) 16 years 117 (29.3) 17 years 89 (22.3) 18 years 44 (11.0)
Type of school (n=400) Private 230 (57.5) Government 170 (42.5) Residence (n=400) Addis Ababa 367 (91.8) Outside Addis Ababa 33 (8.2)
Education level (Grade) (n=400) 9 276 (69) 10 3 (0.8) 11 121 (30.2)
Religion (n=400) Catholic 12 (3.0) Muslim 40 (10.0) Orthodox 303 (75.8) Protestant 41 (10.2) Others 4 (1.0)
Paternal Education (n=389) Elementary or less 98 (24.5) High school complete 107 (26.7) Higher education 184 (46.0) Unknown 11 (2.8)
Maternal Education (n=384) Elementary or less 118 (29.5) High school complete 118 (29.5) Higher education 148 (37.0) Unknown 16 (4.0)
Family size (n=400) 1-3 46 (11.5) 4-6 288 (72.0) >6 66 (16.5)
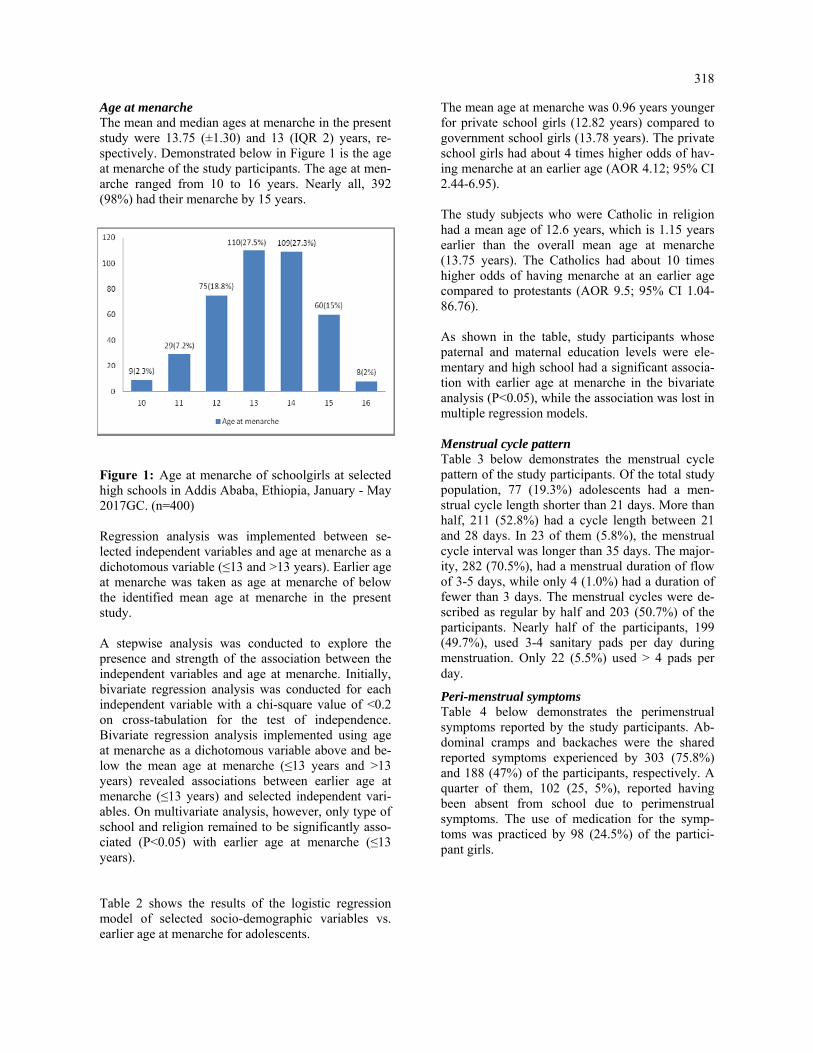
318
Age at menarche The mean and median ages at menarche in the present study were 13.75 (±1.30) and 13 (IQR 2) years, re-spectively. Demonstrated below in Figure 1 is the age at menarche of the study participants. The age at men-arche ranged from 10 to 16 years. Nearly all, 392 (98%) had their menarche by 15 years.
Figure 1: Age at menarche of schoolgirls at selected high schools in Addis Ababa, Ethiopia, January - May 2017GC. (n=400) Regression analysis was implemented between se-lected independent variables and age at menarche as a dichotomous variable (≤13 and >13 years). Earlier age at menarche was taken as age at menarche of below the identified mean age at menarche in the present study. A stepwise analysis was conducted to explore the presence and strength of the association between the independent variables and age at menarche. Initially, bivariate regression analysis was conducted for each independent variable with a chi-square value of <0.2 on cross-tabulation for the test of independence. Bivariate regression analysis implemented using age at menarche as a dichotomous variable above and be-low the mean age at menarche (≤13 years and >13 years) revealed associations between earlier age at menarche (≤13 years) and selected independent vari-ables. On multivariate analysis, however, only type of school and religion remained to be significantly asso-ciated (P<0.05) with earlier age at menarche (≤13 years). Table 2 shows the results of the logistic regression model of selected socio-demographic variables vs. earlier age at menarche for adolescents.
The mean age at menarche was 0.96 years younger for private school girls (12.82 years) compared to government school girls (13.78 years). The private school girls had about 4 times higher odds of hav-ing menarche at an earlier age (AOR 4.12; 95% CI 2.44-6.95). The study subjects who were Catholic in religion had a mean age of 12.6 years, which is 1.15 years earlier than the overall mean age at menarche (13.75 years). The Catholics had about 10 times higher odds of having menarche at an earlier age compared to protestants (AOR 9.5; 95% CI 1.04-86.76). As shown in the table, study participants whose paternal and maternal education levels were ele-mentary and high school had a significant associa-tion with earlier age at menarche in the bivariate analysis (P<0.05), while the association was lost in multiple regression models. Menstrual cycle pattern Table 3 below demonstrates the menstrual cycle pattern of the study participants. Of the total study population, 77 (19.3%) adolescents had a men-strual cycle length shorter than 21 days. More than half, 211 (52.8%) had a cycle length between 21 and 28 days. In 23 of them (5.8%), the menstrual cycle interval was longer than 35 days. The major-ity, 282 (70.5%), had a menstrual duration of flow of 3-5 days, while only 4 (1.0%) had a duration of fewer than 3 days. The menstrual cycles were de-scribed as regular by half and 203 (50.7%) of the participants. Nearly half of the participants, 199 (49.7%), used 3-4 sanitary pads per day during menstruation. Only 22 (5.5%) used > 4 pads per day.
Peri-menstrual symptoms Table 4 below demonstrates the perimenstrual symptoms reported by the study participants. Ab-dominal cramps and backaches were the shared reported symptoms experienced by 303 (75.8%) and 188 (47%) of the participants, respectively. A quarter of them, 102 (25, 5%), reported having been absent from school due to perimenstrual symptoms. The use of medication for the symp-toms was practiced by 98 (24.5%) of the partici-pant girls.

319
Table 2: Regression analysis of selected socio-demographic variables vs earlier age at menarche of Adolescents at selected high schools in Addis Ababa, Ethiopia, January - May 2017GC
Characteristics Mean age at menarche
OR for earlier age at menarche (≤13 years) COR** AOR*** P-value 95% CI P-value 95% CI
Type of school (n=400) Private 12.83 0.000 3.88 (2.55-5.90) 0.000 4.12 (2.44-6.95)* Government 13.78 1 1 Religion (n=400)
Catholic 12.67 0.031
10.48 (1.24-88.75)
0.046 9.50 (1.04-86.76)
Muslim 13.48 0.908 1.05 (0.44-2.52) 0.097 2.24 (0.86-5.79) Orthodox 13.21 0.610 1.19 (0.62-2.28) 0.545 1.24 (0.62-2.50) Others 13.37 0.963 0.95 (0.12-7.42) 0.779 0.73 (0.08-6.42) Protestant 13.00 1 1 Paternal Education (n=389) Unknown 13.64 0.499 1.53 (0.45-5.19) 0.818 0.86 (0.23-3.15) Elementary or less 13.48 0.002 2.24 (1.36-3.70) 0.836 0.93 (0.44-1.94) High school complete 13.36 0.028 1.80 (1.11-2.92) 0`.341 0.74 (0.40-1.39) Higher education 13.00 1 1 Maternal Education (n=384) Unknown 13.25 0.429 1.52 (0.54-4.33) 0.53 9.70 (0.24-2.11) Elementary or less 13.53 0.000 2.49 (1.51-4.09) 0.97 8.99 (0.46-2.11) High school complete 13.28 0.047 1.65 (1.01-2.72) 0.88 1.05 (0.56-1.97) Higher education 12.96 1 1
Table 3: Menstrual cycle pattern of adolescents at selected high schools in Addis Ababa, Ethiopia, January - May 2017 GC (n=400)
Age (years) Frequency Percent Cumulative Percent
Length of Menstrual cycle (days) < 21 77 19.3 19.3 21-28 211 52.8 72.0 29-35 89 22.3 94.3 >35 23 5.8 100.0 Duration of flow (days) < 3 4 1.0 1.0 3 – 5 282 70.5 71.5 6-8 114 28.5 100 Regularity of menstrual cycle Regular 203 50.7 50.7 Not regular 197 49.3 100.0 Number of sanitary pads used per day 1-2 179 44.8 44.8 3-4 199 49.7 94.6 >4 22 5.5 100

320
Table 4: Peri-menstrual symptoms and related effects of adolescents at selected high schools in Addis Ababa, Ethiopia, January - May 2017GC. (n=400)
Age (years) Frequency Percent
Type of peri-menstrual symptom reported Abdominal cramp 303 75.8 Backache 188 47.0 Headache 64 16.0 Nausea 44 11.0 Vomiting 22 5.5 Diarrhea 2 0.5 Others 17 4.3 Absence from school due to symptoms Yes 102 25.5 No 298 74.5 Use of medications for symptoms Yes 98 24.5 No 302 75.5
Source of information about menstruation Only 7 (1.8%) of the study participants had no infor-mation about menstruation before menarche. The most important source of information for the adolescents was mothers, reported by 270 (65.7%) of the partici-pants. Sisters, friends, and teachers were other sources of information for 67 (16.8%), 56 (14%), and 44 (11%) of the participant's students, respectively. Other sources like books and magazines were reported as sources of information by 24 (6%) participants.
DISCUSSION This study found that the majority of study partici-pants experienced menarche between ages 13 and 15, with a mean recall age at menarche of 13.26 ±1.319 years. The mean age at menarche in the present study was earlier than previous reports from Ethiopia and some other developing countries (19-21), but later than that in developed countries like USA, Italy, and Canada (5, 17, 18, 22, 23) Prior studies done in Ethiopia revealed age at men-arche of 13.9 ± 1.2 years at Sawla town (3), 14.8 (13.9-15.3) years at Dabat and Koladiba (12), 14 years in Tigray (24) and 13.72 ± 1.31 years in Addis Ababa (25) which were all above the present finding. This possibly is due to the fact that the current study was conducted in a capital city where social welfare is higher than in other parts of the country. And the sec-ond reason may be linked to the time effect: these studies were done nearly a decade ago between 2007 and 2013. This may also reflect a declining trend of age at menarche in Ethiopia as well, which may be a proxy indicator of the ongoing improvement in the socioeconomic status of the population in the country.
The age at menarche in our study, however, was higher than some in African countries, 12.5 years in South Africa (26), and 12.49 years in Egypt (27), 13.66, and Northern Ghana (28). The mean AAM was also higher than reports from developed countries, 12.54 years in the United States (29), 12.7 years in the UK (30), and 12.72 (±1.05) years in Canada (23). The higher AAM in the present study may be related to socioeconomic differences between the countries Factors influencing age at menarche The study showed that there were statistically sig-nificant differences in menarcheal ages based on the category/class of school they attend (aOR 4.12, 95%CI 2.44-6.). Seventy percent of students at-tending private schools had a menarche age of lower than 13 years compared to 37% of those from public schools. The difference here and com-pared to other countries may be explained by the economic disparity between the two natures of schools. (25)
The effect of socioeconomic circumstances on the age of menarche has been shown in several studies with girls in more deprived situations experiencing later menarche as they are unable to obtain the appropriate nutrition for proper growth and devel-opment (5, 28, 31). The proportion of students based on religion whose age at menarche was less than 13 years was Catholic (91.1%), Orthodox (54.4%), Muslim (52.5%), and Protestant (51.2%). The differences in menarche age based on religion were statistically significant (aOR 9.50, 95% CI 1.04-86.76). This may reflect the disparities in the standard of life among different religious follow-ers.

321
Menstrual pattern Menstruation may be associated with various kinds of symptoms occurring before and during menses. In this study, the most common symptoms experienced by the students were dysmenorhea (abdominal cramps) 75.8 %, backache 47.0 %, and headache 16%. This finding is comparable to studies done in Ethiopia (3), India (32) and Malasya (33). Dysmenorrhea was a major cause of school absenteeism 25.5%). The school absen-teeism due to dysmenorhea in this study was higher than in Indian study (34), comparable to a Saudi Ara-bian study (35), but less than reports from Ethiopia (12)), Malaysia 33 and USA (36) It is important that school girls are given adequate counselling and offered proper guidance on dysmenorhea and other perimen-strual symptoms.. Menstrual cycle abnormalities (irregular and longer cycles) are more common among younger girls in the first few years after menarche. 12 = (10) In this study abnormal menstrual cycle lengths occurred in 25.1 % of our respondents, which is in the range of 13.2 % to 37.2 % noted in some studies. (33, 37) Conclusion and implications The mean age at menarche of the respondents in this study was 13.26 ±1.319 years. This age at menarche was earlier than prior reports from Ethiopia. Socioeco-nomic status was identified as a factor significantly associated with the age at menarche. Dysmenorrhea was the commonest perimenstrual symptom. Sociodemographic attributes may be a marker for the age of menarche and symptoms. Prospective studies are needed to better understand the influence of bio-logical markers and the age at which young girls begin their menstrual cycle and the symptoms they experi-ence.
Limitation of the study The study population is not representative of the population of the country. Thus outcomes of the study may not be generalizable to the general population. Availability of Data The datasets used and/or analyzed during the cur-rent study are available from the corresponding author upon reasonable request. Conflict of Interest All authors declare that they have no competing interests. Contribution of Authorship EK designed and implemented the study. This included seeking IRB approval, collecting data, and cleaning data. EK reviewed the reference articles and wrote the initial manuscript. EM contributed to data analysis, constructed summary tables, and wrote the final manuscript. MS con-tributed to initial manuscript writing and data analysis.
ACKNOWLEDGMENT
We extend our special thanks to the Centre for International Reproductive Health Training (CIRHT) at the University of Michigan, USA, for providing financial support to undertake the study. Its contents are solely the responsibilities of the authors and do not necessarily reflect the official views of the CIRHT.
REFERENCES 1. Ersoy B, Balkan C, Gunay T, Egemen A. The factors affecting the relation between the menarcheal age of
mother and daughter. Child: care, health and development. 2005 May 1; 31(3):303–8. 2. Cole TJ: The secular trend in human physical growth: a biological view. Economics and Human Biology
2003, 1:161-68. 3. Ayele E, Berhan Y. Age at menarche among in-school adolescents in Sawla Town, South Ethiopia. Ethiop J
Health Sci. 2013;23(3):189-200. 4. Amir DJ, M. R.Bribiescas, R. G. A Longitudinal Assessment of Associations between Adolescent Environ-
ment, Adversity Perception, and Economic Status on Fertility and Age of Menarche. PLoS One. 2016;11(6). 5. Chumlea WC, Schubert CM, Roche AF, Kulin HE, Lee PA, Himes JH, et al. Age at menarche and racial com-
parisons in US girls. Pediatrics. 2003 Jan 1; 111(1):110–13. PMID: 12509562 6. Swenson I, Havens B. Menarche and menstruation: a review of the literature. J Community Health Nurs.
1987;4(4):199–210.
7. Thomas F, Renard F, Benefice E, de Meeüs T, Guegan JF. International variability of ages at menarche and menopause: patterns and main determinants. Hum Biol.2001;73(2):271–90.

322
8. P K. Pubertal development in girls: secular trends. Current Opinion in Obstetrics & Gynecology. 2006; 18(5):487-491.
9. Wyshak G, Frisch RE. Evidence for a secular trend in age of menarche. N Engl J Med. 1982; 306:1033–5. 10. Bagga A, Kulkarni S. Age at menarche and secular trend in Maharashtrian (Indian) girls. Acta Biologica
Szeged. 2000;44(1-4):53–7. 11. Ambade R, Sagdeo M. Age at menarche and the menstrual pattern of secondary school adolescents in central
India. Int J Res Med Sci 2017; 5:3610-4. 12. Zegeye DT, Megabiaw B, Mulu A. Age at menarche and the menstrual pattern of secondary school adoles-
cents in northwest Ethiopia. BMC women's health. 2009; 9(1):29. 13. Apter D, Viinikka L, Vihko R: Hormonal pattern of adolescent menstrual cycles. J Clin Endocrinol Metab
1978, 47(5):944–954. 14. Chan SS, Yiu KW, Yuen PM, Sahota DS, Chung TK: Menstrual problems and health-seeking behaviour in
Hong Kong Chinese girls. Hong Kong Med J 2009, 15(1):18–23. 15. Treloar AE, Boynton RE, Behn BG, Brown BW: Variation of the human menstrual cycle through reproductive
life. Int J Fertil 1967, 12(1 Pt 2):77–126. 16. Vollman RF: The menstrual cycle. Major Probl Obstet Gynecol 1977, 7:1–193. 17. Rigon F, Bianchin L, Bernasconi S, Bona G, Bozzola M, Buzi F, Cicognani A, De Sanctis C, De Sanctis V,
Radetti G, Tatò L, Tonini G, Perissinotto E: Update on age at menarche in Italy: toward the leveling off of the secular trend. J Adolesc Health 2010, 46(3):238–244.
18. Rigon F, De Sanctis V, Bernasconi S, Bianchin L, Bona G, Bozzola M, et al. Menstrual pattern and menstrual disorders among adolescents: an update of the Italian data. Ital J Pediatr. 2012; 38-38.
19. Ameade EPK, Garti HA (2016) Age at Menarche and Factors that Influence It: A Study among Female Uni-versity Students in Tamale, Northern Ghana. PLoS ONE 11(5): e0155310. doi:10.1371/journal.pone.0155310,
20. Tunau KA, Adamu AN, Hassan MA, Ahmed Y, Ekele BA. Age at menarche among school girls in Sokoto, Northern Nigeria. Annals of African medicine. 2012; 11(2):103–7. doi: 10.4103/1596-3519. 93533 PMID: 22406670.
21. Padez C. Age at menarche of schoolgirls in Maputo, Mozambique. Annals of human biology. 2003 Jan 1; 30(4):487–95. PMID: 12881146
22. Carfagna M, Figurelli E, Matarese G, Matarese S. Menarcheal age of schoolgirls in the district of Naples, It-aly, in 1969–70. Human Biology. 1972 Feb 1:117–25.
23. Al-Sahab B, Ardern CI, Hamadeh MJ, Tamim H. Age at menarche in Canada: results from the National Lon-gitudinal Survey of Children & Youth. BMC Public Health. 2010 Nov 28; 10(1):736.
24. Bayray A. Assessment of Menstrual Perceptions and Preparation of Rural Adolescent Females, South Eastern Zone of Tigray, Ethiopia. Scholarly Journal of Medicine. 2011;1:12-21.
25. Abera Y. Menarche, Menstruation related Problems and Practices among Adolescent High School Girls in Addis Ababa. Medicine. 2003;Corpus ID: 78417016.
26. Laura L, Jones PLG, Shane A Norris, John M Pettifor, Noël Cameron Age at Menarche and the Evidence for a Positive Secular Trend in Urban South Africa. Am J Hum Biol. 2009; 21(1):130-2.
27. Hatem I. Abdelmoty MY, corresponding author Shimaa abdallah, Khaled Abdel-Malak, Nawara M. Hashish, Dalia Samir, Moutafa Abdelbar, Ahmed Naguib Hosni, Mohamed Abd-El Ghafar, Yasser Khamis, and Mo-stafa Seleem. Menstrual patterns and disorders among secondary school adolescents in Egypt. A cross-sectional survey. BMC women's health. 2015; 15: 70.
28. Evans Paul Kwame AG, Helene Akpene. Age at Menarche and Factors that Influence It: A Study among Fe-male University Students in Tamale, Northern Ghana. PLoS ONE 2016; 11(5).
29. Demerath EW, Towne B, Chumlea WC, Sun SS, Czerwinski SA, Remsberg KE, et al. Recent decline in age at menarche: The Fels Longitudinal Study. American Journal of Human Biology. 2004; 16(4): 453-7.
30. Morris DH, Jones ME, Schoemaker MJ, Ashworth A, Swerdlow AJ. Determinants of age at menarche in the UK: analyses from the Breakthrough Generations Study. Br J Cancer. 2010; 103 (11): 1760-4.
31. KarapanouO PA. Determinants of menarche. Reprod Biol Endocrinol. 2010;30;8 (115):20920296. 32. Singh A, Kiran D, Singh H, Nel B, Singh P, Tiwari P: Prevalence and severity of dysmenorrhea: a problem
related to menstruation, among first and second year female medical students. Indian J Physiol Pharmacol 2008, 52(4): 389–397.)
33. Lee LK CP, Le KK, Kaur J. Menstruation among adolescent girls in Malaysia: a cross sectional survey. Singa-pore Med J. 2006; 47(10):869-74.
34. Dharampal G. D., Sanjay V. W., Jayesh Y. D. Age at Menarche and Menstrual Cycle Pattern among School Adolescent Girls in Central India. Global Journal of Health Science Vol. 4, No. 1; January 2012. doi:10.5539/gjhs.v4n1p105 URL: http://dx.doi.org/10.5539/gjhs.v4n1p105 ).

323
35. Ibrahim N AM, Al-Shaibani A, AlAmri F, Alharbi H, Al-Jadani A, Alfaidi R. Dysmenorrhea among female medical students in king Abdulaziz University: prevalence, predictors and outcome. Pak J Med Sci. 2015; 31(6): 1312-7.
36. Banikarim C, Chacko MR, Kelder SH: Prevalence and Impact of Dysmenorrhea on Hispanic Female Adoles-cents. Arch Pediatr Adolesc Med 2000, 154(12):1226-1229.
37. Houston AM AA, Huang Z, D'Angelo LJ. Knowledge, attitudes, and consequences of menstrual health in ur-ban adolescent females. Pediatr Adolesc Gynecol. 2006;19(4):271-5.
325
Tassew Tefera, Dessie Abera, Dejenie Shiferaw Teklu, Mistire Wolde. Ethiop Med J, 2021, Vol. 59, No. 4
ORIGINAL ARTICLE
INTESTINAL PARASITES AND RISK AWARENESS OF PEOPLE LIVING WITH HIV/AIDS IN DEBRE BREHAN REFERRAL HOSPITAL,
DEBRE BREHAN, ETHIOPIA
Tassew Tefera1*, Dessie Abera2, Dejenie Shiferaw Teklu3, MistireWolde2
ABSTRACT
Introduction: Intestinal parasites are a significant cause of morbidity and mortality in most developing countries which affected more than 3.5 billion people throughout the world. The prevalence of intestinal parasites is rela-tively high in people living with HIV/AIDS. However, data on the prevalence of intestinal parasites among people living with HIV/ AIDS are insufficient in the study area. Hence, this study aimed to determine the prevalence of intestinal parasites and associated risk factors among people living with HIV/AIDS at Debre Brehan Referral Hos-pital, Central Ethiopia. Methods: A cross-sectional study was conducted among 350 people living with HIV/AIDS from March to August 2019. Stool samples were collected with clean screw cupped containers and processed using direct microscopy, formol-ether concentration and modified acid-fast staining laboratory techniques. Results: The overall prevalence of intestinal parasites among HIV/AIDS patients was 20.3% (71/350). Among these, Entamoeba histolytica/dispar takes the highest rank (13.4%) followed by Gardia lamblia (2.9%). Lack of latrine, high viral load count, and bad health practice of the participants were significantly associated with intesti-nal parasitosis. Conclusion: The prevalence of intestinal parasites in this study was high. Thus to reduce the disease burden; gov-ernment officials and stakeholders should work on reducing risk factors and increase awareness how to prevent and control of acquiring the disease. Key words: Intestinal parasites, HIV/AIDS, Prevalence, Debre Brehan, Ethiopia.
INTRODUCTION
Intestinal parasitosis (IPs) is a gastrointestinal infection caused by helminthes (multicellular) and protozoa (unicellular) (1, 2). Epidemiological studies indicate that both helminthes and protozoa are prevalent in de-veloping countries whereas protozoan parasites are more dominant in developed countries (3, 4). More than 3.5 billion people are affected with intestinal para-sites (IP) in the world, among which 450 million are in sub-Saharan Africa, affected by associated morbidities (5-7). Parasitic co-infection with Human Immunodefi-ciency Virus/Acquired Immunodeficiency Syndrome (HIV/AIDS) is the major public health crisis of the world, mainly in Sub-Saharan Africa (8). The most common type of helminthes that are strongly associated with morbidity and mortality of HIV/AIDS patients are: Ascaris lumbricoides, Trichuris trichiuria, Hookworm and Strongyloid stercoralis that occupy the human intestine (9-11), whereas Entamoeba histo-lytica/dispar and Giardia lambellia are the dominant species among protozoans (1).
Protozoan parasites are also the foremost prevalent in tropical and subtropical regions of the develop-ing world where water and sanitation facilities are insufficient (12-16). The main transmission mode of IPs is feco-oral route due to poor personal hy-giene and environmental contaminations (17). More importantly, improper disposal of human excreta in Sub-Saharan countries like Ethiopia is the major contributing factor for the increased dis-tribution of IPs (18). HIV/AIDS patients with poor knowledge, and bad health practices for IP infec-tion prevention and control are more susceptible to opportunistic and non-opportunistic parasitic infec-tions (19, 20).
There are about 36.9 million people infected with HIV/AIDS globally; among these Sub-Saharan Africa accounts for more than half (22.4 million) (14, 21), and where Ethiopia had a prevalence of 2.4% (8, 22). Moreover, HIV infection results in weakening of the human immune system which leads to the occurrence of opportunistic infections (OIs) (21-25).
1Department of Medical Laboratory Sciences, College of Medicine, Debre Brehan University, Debre Brehan, Ethiopia. 2Department of Medical Laboratory Sciences, College of Health Sciences, Addis Ababa University, Ad-dis Ababa, Ethiopia. 3Department of Clinical Bacteriology and Mycology National Reference Laboratory, Ethiopian Public Health Institute, Addis Ababa, Ethiopia. *Corresponding Author E-mail: [email protected]
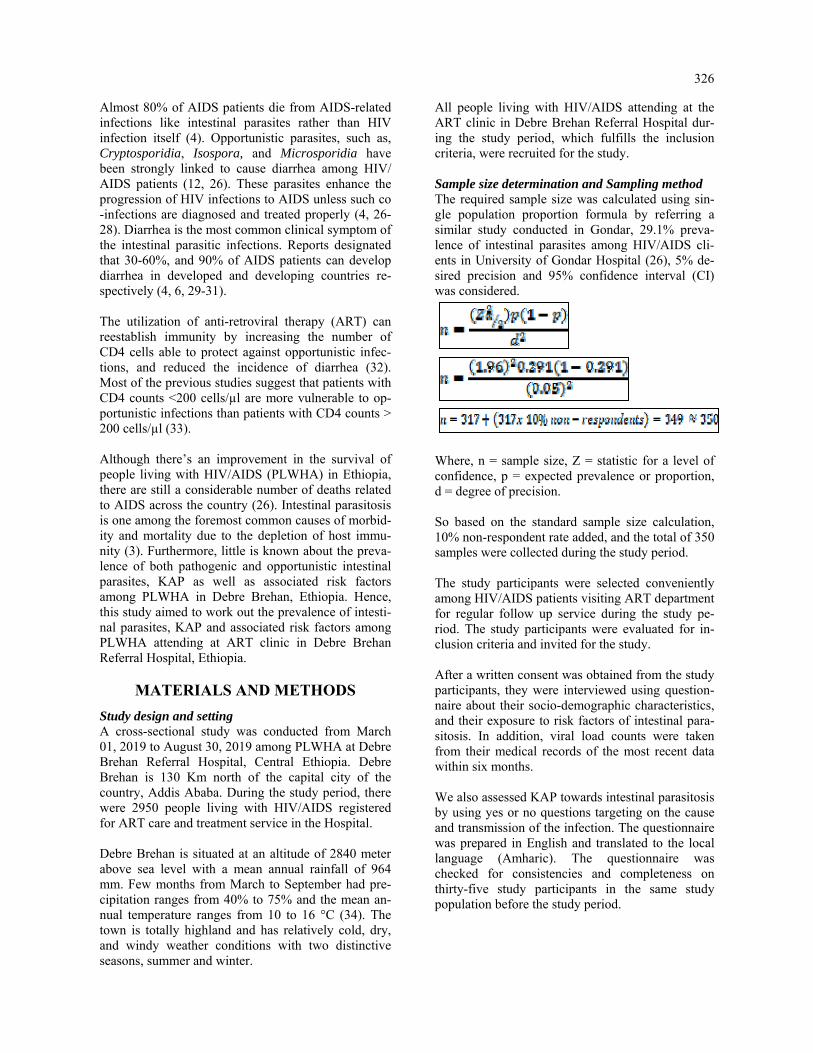
326
Almost 80% of AIDS patients die from AIDS-related infections like intestinal parasites rather than HIV infection itself (4). Opportunistic parasites, such as, Cryptosporidia, Isospora, and Microsporidia have been strongly linked to cause diarrhea among HIV/AIDS patients (12, 26). These parasites enhance the progression of HIV infections to AIDS unless such co-infections are diagnosed and treated properly (4, 26-28). Diarrhea is the most common clinical symptom of the intestinal parasitic infections. Reports designated that 30-60%, and 90% of AIDS patients can develop diarrhea in developed and developing countries re-spectively (4, 6, 29-31). The utilization of anti-retroviral therapy (ART) can reestablish immunity by increasing the number of CD4 cells able to protect against opportunistic infec-tions, and reduced the incidence of diarrhea (32). Most of the previous studies suggest that patients with CD4 counts <200 cells/µl are more vulnerable to op-portunistic infections than patients with CD4 counts > 200 cells/µl (33). Although there’s an improvement in the survival of people living with HIV/AIDS (PLWHA) in Ethiopia, there are still a considerable number of deaths related to AIDS across the country (26). Intestinal parasitosis is one among the foremost common causes of morbid-ity and mortality due to the depletion of host immu-nity (3). Furthermore, little is known about the preva-lence of both pathogenic and opportunistic intestinal parasites, KAP as well as associated risk factors among PLWHA in Debre Brehan, Ethiopia. Hence, this study aimed to work out the prevalence of intesti-nal parasites, KAP and associated risk factors among PLWHA attending at ART clinic in Debre Brehan Referral Hospital, Ethiopia.
MATERIALS AND METHODS
Study design and setting A cross-sectional study was conducted from March 01, 2019 to August 30, 2019 among PLWHA at Debre Brehan Referral Hospital, Central Ethiopia. Debre Brehan is 130 Km north of the capital city of the country, Addis Ababa. During the study period, there were 2950 people living with HIV/AIDS registered for ART care and treatment service in the Hospital. Debre Brehan is situated at an altitude of 2840 meter above sea level with a mean annual rainfall of 964 mm. Few months from March to September had pre-cipitation ranges from 40% to 75% and the mean an-nual temperature ranges from 10 to 16 °C (34). The town is totally highland and has relatively cold, dry, and windy weather conditions with two distinctive seasons, summer and winter.
All people living with HIV/AIDS attending at the ART clinic in Debre Brehan Referral Hospital dur-ing the study period, which fulfills the inclusion criteria, were recruited for the study. Sample size determination and Sampling method The required sample size was calculated using sin-gle population proportion formula by referring a similar study conducted in Gondar, 29.1% preva-lence of intestinal parasites among HIV/AIDS cli-ents in University of Gondar Hospital (26), 5% de-sired precision and 95% confidence interval (CI) was considered.
Where, n = sample size, Z = statistic for a level of confidence, p = expected prevalence or proportion, d = degree of precision. So based on the standard sample size calculation, 10% non-respondent rate added, and the total of 350 samples were collected during the study period. The study participants were selected conveniently among HIV/AIDS patients visiting ART department for regular follow up service during the study pe-riod. The study participants were evaluated for in-clusion criteria and invited for the study. After a written consent was obtained from the study participants, they were interviewed using question-naire about their socio-demographic characteristics, and their exposure to risk factors of intestinal para-sitosis. In addition, viral load counts were taken from their medical records of the most recent data within six months. We also assessed KAP towards intestinal parasitosis by using yes or no questions targeting on the cause and transmission of the infection. The questionnaire was prepared in English and translated to the local language (Amharic). The questionnaire was checked for consistencies and completeness on thirty-five study participants in the same study population before the study period.

327
Inclusion and exclusion criteria All HIV/AIDS patients registered for ART follow up program and volunteer to participate in the study were included, while those who were on anti-parasitic ther-apy within the last two weeks, those who registered for ART service with less than six months and didn’t have viral load count within the last six (6) months were excluded from the study. Laboratory Diagnosis Methods for Stool Sample Stool sample collection Instruction was given to each study participant not to contaminate the stool with urine, water and soil. In addition, they are also informed to collect forty gram of fresh stool sample or 10 ml of diarrheic sample with clean, wide mouthed, grease free and screw cupped plastic containers. Moreover, emphasis was given to diarrhea stool samples by giving priority due to its less time stability of trophozoites in the diarrheal stool sample. Besides, formed and semi-formed stool samples were preserved by 10% formalin for further examination by microscope and concentration tech-niques in case of unavoidable delay. Direct wet mount, Formol-ether concentration and smear for modified acid-fast staining techniques were performed as per the standard operating procedures (SOP) of each method soon after collection within 30 minutes (35) (see supporting information for detail of SOP). Direct microscopy A stool sample was collected in a labeled cup from all study participants and a direct saline wet mount of each sample was done immediately at the laboratory for motile trophozoites, ova, cyst, and larvae stage of intestinal parasites. The wet mounts were examined under a light microscope at 10X eye pieces and 40X objective (36). Formol- Ether concentration technique Formol-ether sedimentation technique, in which para-sites are concentrated by centrifugal force, was ap-plied to concentrate the parasite. Briefly, one gram of stool sample was placed in a clean 15ml volume ca-pacity conical centrifuge tube containing 7ml 10% formalin and stirred with an applicator stick. The re-sulting suspension was filtered through a sieve into another conical centrifuge tube. After adding 3ml of diethyl ether to the stool containing formalin suspen-sion, it was centrifuged at 3200 rpm for 3 minutes. The supernatant was poured away and the tube was being placed in its rack. Finally, the smear was pre-pared on clean grease-free microscope slide from the sediment, covered with cover slide and observed un-der a microscope with a magnification of 10x eye-pieces and 40x objective (12, 35).
Modified Ziehl Nelson method A small portion of the fresh stool sample was proc-essed for the detection of opportunistic parasites using the modified Ziehl Nielsen method. Briefly, the thin smear was prepared directly from the sedi-ment of concentrated stool and allowed to air dry. Then the slides were fixed with methanol for 5 min-utes and it was stained with 1% carbol fuchsine for 30 minutes. After washing the slides with tap water, slides were being decolorized with 1% acid alcohol for 1–3 minutes and stained with 0.5% methylene blue for 1 minute. The slides were then washed with tap water and observed under a light microscope with a total magnification of 1000X (12). Slides were rechecked by senior experts at the Ethiopian public health institute (EPHI). Data Analysis The data were entered and analyzed using SPSS version-20 software. Descriptive and logistic regres-sion statistics were used for data analysis. The mean, percentage, and frequency were used to see the distribution. The relative contribution of inde-pendent variables for the outcome variables was assessed using logistic regression. A P-value of less than 0.05 was considered as a statistically signifi-cant association between the presence of intestinal parasites and each contributing factor. The results of our findings were presented in text, graphs, and tables. Quality Assurance The questionnaires were checked for their consis-tencies and completeness on thirty-five study par-ticipants in the same study population before the study period. Internal quality control was also per-formed for each of laboratory techniques based on the quality control policy of Debre Brehan Referral Hospital Laboratory.
Operational Definition Good knowledge: Individuals who answered ≥50% of the knowledge questions in the questionnaire. Poor knowledge: Individuals who answered <50% of the knowledge questions. Positive attitude: Individuals who answered ≥50% of the attitude questions. Negative attitude: Individuals who answered <50% of the attitude questions. Good practice: Individuals who answered ≥50% of the practice questions that supports IP prevention activities. Bad practice: Individuals who answered <50% of the practice questions. Intestinal parasitosis: A gastrointestinal infection caused by intestinal parasites
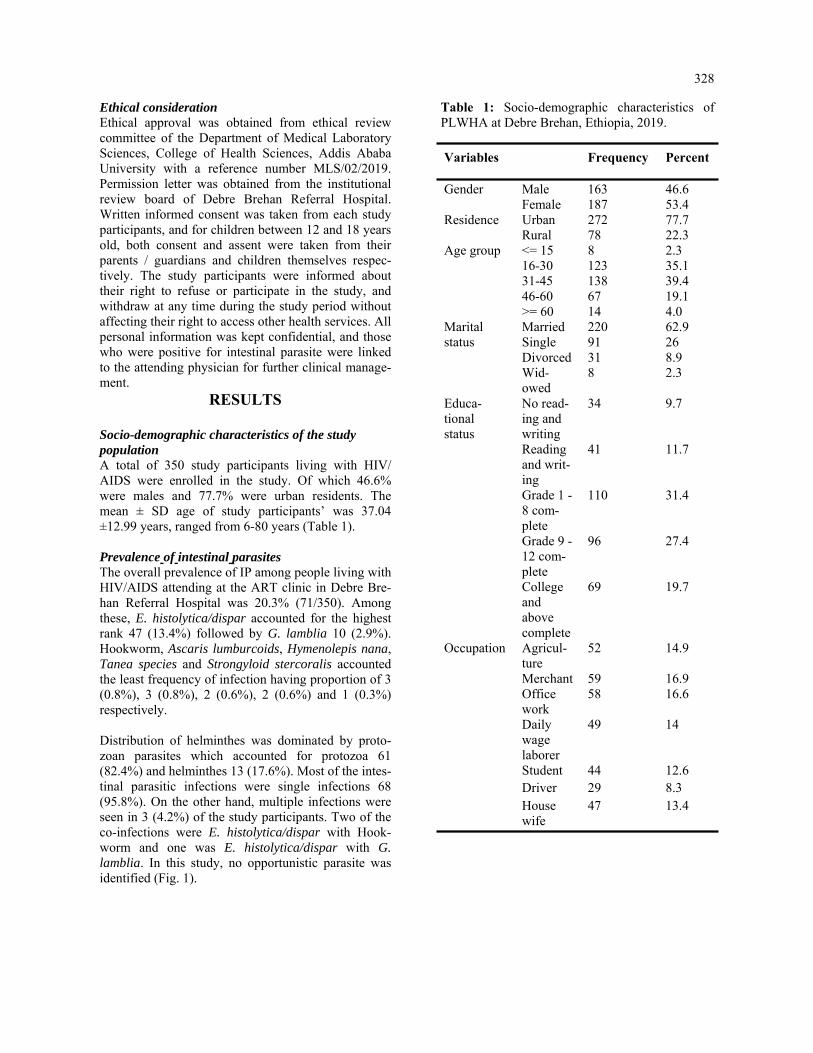
328
Ethical consideration Ethical approval was obtained from ethical review committee of the Department of Medical Laboratory Sciences, College of Health Sciences, Addis Ababa University with a reference number MLS/02/2019. Permission letter was obtained from the institutional review board of Debre Brehan Referral Hospital. Written informed consent was taken from each study participants, and for children between 12 and 18 years old, both consent and assent were taken from their parents / guardians and children themselves respec-tively. The study participants were informed about their right to refuse or participate in the study, and withdraw at any time during the study period without affecting their right to access other health services. All personal information was kept confidential, and those who were positive for intestinal parasite were linked to the attending physician for further clinical manage-ment.
RESULTS
Socio-demographic characteristics of the study population A total of 350 study participants living with HIV/AIDS were enrolled in the study. Of which 46.6% were males and 77.7% were urban residents. The mean ± SD age of study participants’ was 37.04 ±12.99 years, ranged from 6-80 years (Table 1). Prevalence of intestinal parasites The overall prevalence of IP among people living with HIV/AIDS attending at the ART clinic in Debre Bre-han Referral Hospital was 20.3% (71/350). Among these, E. histolytica/dispar accounted for the highest rank 47 (13.4%) followed by G. lamblia 10 (2.9%). Hookworm, Ascaris lumburcoids, Hymenolepis nana, Tanea species and Strongyloid stercoralis accounted the least frequency of infection having proportion of 3 (0.8%), 3 (0.8%), 2 (0.6%), 2 (0.6%) and 1 (0.3%) respectively. Distribution of helminthes was dominated by proto-zoan parasites which accounted for protozoa 61 (82.4%) and helminthes 13 (17.6%). Most of the intes-tinal parasitic infections were single infections 68 (95.8%). On the other hand, multiple infections were seen in 3 (4.2%) of the study participants. Two of the co-infections were E. histolytica/dispar with Hook-worm and one was E. histolytica/dispar with G. lamblia. In this study, no opportunistic parasite was identified (Fig. 1).
Variables Frequency Percent Gender
Male
163
46.6
Female 187 53.4 Residence Urban 272 77.7
Rural 78 22.3 Age group <= 15 8 2.3
16-30 123 35.1 31-45 138 39.4 46-60 67 19.1 >= 60 14 4.0
Marital status
Married 220 62.9 Single 91 26 Divorced 31 8.9 Wid-owed
8 2.3
Educa-tional status
No read-ing and writing
34 9.7
Reading and writ-ing
41 11.7
Grade 1 - 8 com-plete
110 31.4
Grade 9 - 12 com-plete
96 27.4
College and above complete
69 19.7
Occupation Agricul-ture
52 14.9
Merchant 59 16.9 Office work
58 16.6
Daily wage laborer
49 14
Student 44 12.6 Driver 29 8.3 House wife
47 13.4
Table 1: Socio-demographic characteristics of PLWHA at Debre Brehan, Ethiopia, 2019.

329
Association of intestinal parasite infection with socio-demographic and other risk factors As shown in the socio-demographic characteristics features of our study participants (Table 1) most of the study participants were urban residents (77.7%) and had the occupational status of trade and office work, 16.9% and 16.6% respectively. From all study participants, 334 (97.7%) had regular hand washing habit with soap before and after the meal, and 323 (94.6%) of them had latrine. Among all participants, 319 (93.4%) had regular water supply and washed their hands after the toilet frequently. Most of the study participants had pure/tape water supply (88.8%), vegetable feeding habits (68.9%), raw meat eating habits (58.3%), and animal contacts in their living settings (60%) (Table 2). Multivariate analysis was done to know the associa-tion of the potential confounding factors such as place of residence, type of occupation, presence of latrine/toilet, source of water supply, and viral load levels with intestinal parasitosis. As a result, only the viral load level and availability of latrine showed a signifi-cant association. People living with HIV/AIDS who had viral load count >1000 cps/ml were almost four times more likely to develop parasitic infection than those who had viral load count results TND (target not detected) (AOR = 4.2, 95% CI: 1.4, 12.4) and those who did not have latrine were four times more likely to acquire intestinal parasite infection than those who had latrine in their home (AOR = 3.97, 95% CI: 1.3, 11.84) (Table 2).
Knowledge, attitude and practice of study partici-pants towards intestinal parasitosis Among all study participants, those whose age was greater than 15 years were interviewed for their knowledge, attitude, and practice towards intestinal parasitosis, N= 342 (97.7%). In general from these interviewed participants; 182 (53.2) had good knowledge about intestinal parasitosis, its transmis-sion, and prevention mechanisms. Only 66 (19.3%) of the study participant understood the relationship between intestinal parasitosis and HIV/AIDS that all responded as HIV/AIDS increases the morbidity due to intestinal parasitosis (table 3). Among 342 study participants, 260 (76%) consid-ered IP infection as a communicable disease. The majority of them, 255 (72.9%) agreed on the trans-mission from person to person. From all respon-dents, 199 (58.2%) believed that HIV/AIDS in-creases the risk of acquiring intestinal parasite in-fection, and 147 (43%) believed that using antiretro-viral treatment prevents intestinal parasite infection (table 4). From study participants who responded for practice questions, 337 (98.5%) had regular hand washing habit with soap before and after the meal. The par-ticipants who had latrine were 323 (94.4%). Among all respondents, 303 (88.6%) had pure/tape water supply for drinking and sanitary use. The proportion of vegetable feeding habits of the study participant were about 237 (68.9%); of them, 211 (89%) ate vegetable by cooking (table 5).
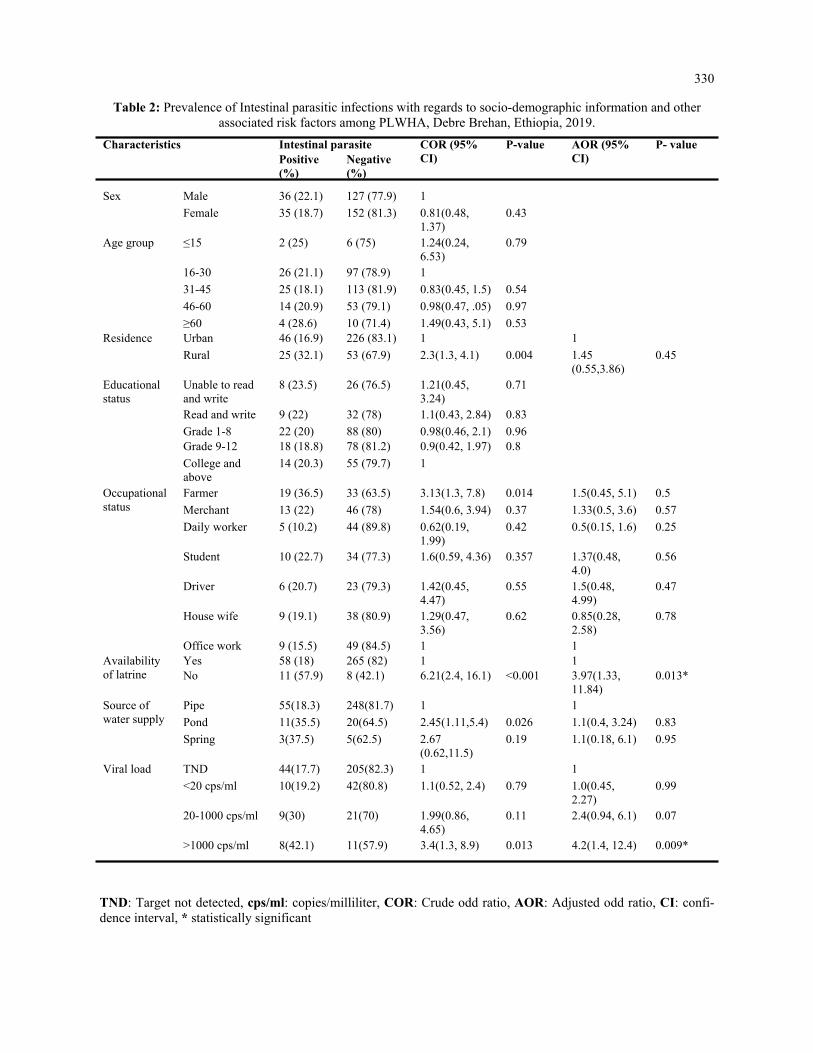
330
Table 2: Prevalence of Intestinal parasitic infections with regards to socio-demographic information and other associated risk factors among PLWHA, Debre Brehan, Ethiopia, 2019.
TND: Target not detected, cps/ml: copies/milliliter, COR: Crude odd ratio, AOR: Adjusted odd ratio, CI: confi-dence interval, * statistically significant
Characteristics Intestinal parasite COR (95% CI)
P-value AOR (95% CI)
P- value Positive (%)
Negative (%)
Sex Male 36 (22.1) 127 (77.9) 1
Female 35 (18.7) 152 (81.3) 0.81(0.48, 1.37)
0.43
Age group ≤15 2 (25) 6 (75) 1.24(0.24, 6.53)
0.79
16-30 26 (21.1) 97 (78.9) 1
31-45 25 (18.1) 113 (81.9) 0.83(0.45, 1.5) 0.54
46-60 14 (20.9) 53 (79.1) 0.98(0.47, .05) 0.97
≥60 4 (28.6) 10 (71.4) 1.49(0.43, 5.1) 0.53 Residence Urban 46 (16.9) 226 (83.1) 1 1
Rural 25 (32.1) 53 (67.9) 2.3(1.3, 4.1) 0.004 1.45(0.55,3.86)
0.45
Educational status
Unable to read and write
8 (23.5) 26 (76.5) 1.21(0.45, 3.24)
0.71
Read and write 9 (22) 32 (78) 1.1(0.43, 2.84) 0.83
Grade 1-8 22 (20) 88 (80) 0.98(0.46, 2.1) 0.96 Grade 9-12 18 (18.8) 78 (81.2) 0.9(0.42, 1.97) 0.8
College and above
14 (20.3) 55 (79.7) 1
Occupational status
Farmer 19 (36.5) 33 (63.5) 3.13(1.3, 7.8) 0.014 1.5(0.45, 5.1) 0.5
Merchant 13 (22) 46 (78) 1.54(0.6, 3.94) 0.37 1.33(0.5, 3.6) 0.57
Daily worker 5 (10.2) 44 (89.8) 0.62(0.19, 1.99)
0.42 0.5(0.15, 1.6) 0.25
Student 10 (22.7) 34 (77.3) 1.6(0.59, 4.36) 0.357 1.37(0.48, 4.0)
0.56
Driver 6 (20.7) 23 (79.3) 1.42(0.45, 4.47)
0.55 1.5(0.48, 4.99)
0.47
House wife 9 (19.1) 38 (80.9) 1.29(0.47, 3.56)
0.62 0.85(0.28, 2.58)
0.78
Office work 9 (15.5) 49 (84.5) 1 1 Availability of latrine
Yes 58 (18) 265 (82) 1 1 No 11 (57.9) 8 (42.1) 6.21(2.4, 16.1) <0.001 3.97(1.33,
11.84) 0.013*
Source of water supply
Pipe 55(18.3) 248(81.7) 1 1
Pond 11(35.5) 20(64.5) 2.45(1.11,5.4) 0.026 1.1(0.4, 3.24) 0.83
Spring 3(37.5) 5(62.5) 2.67(0.62,11.5)
0.19 1.1(0.18, 6.1) 0.95
Viral load TND 44(17.7) 205(82.3) 1 1
<20 cps/ml 10(19.2) 42(80.8) 1.1(0.52, 2.4) 0.79 1.0(0.45, 2.27)
0.99
20-1000 cps/ml 9(30) 21(70) 1.99(0.86, 4.65)
0.11 2.4(0.94, 6.1) 0.07
>1000 cps/ml 8(42.1) 11(57.9) 3.4(1.3, 8.9) 0.013 4.2(1.4, 12.4) 0.009*
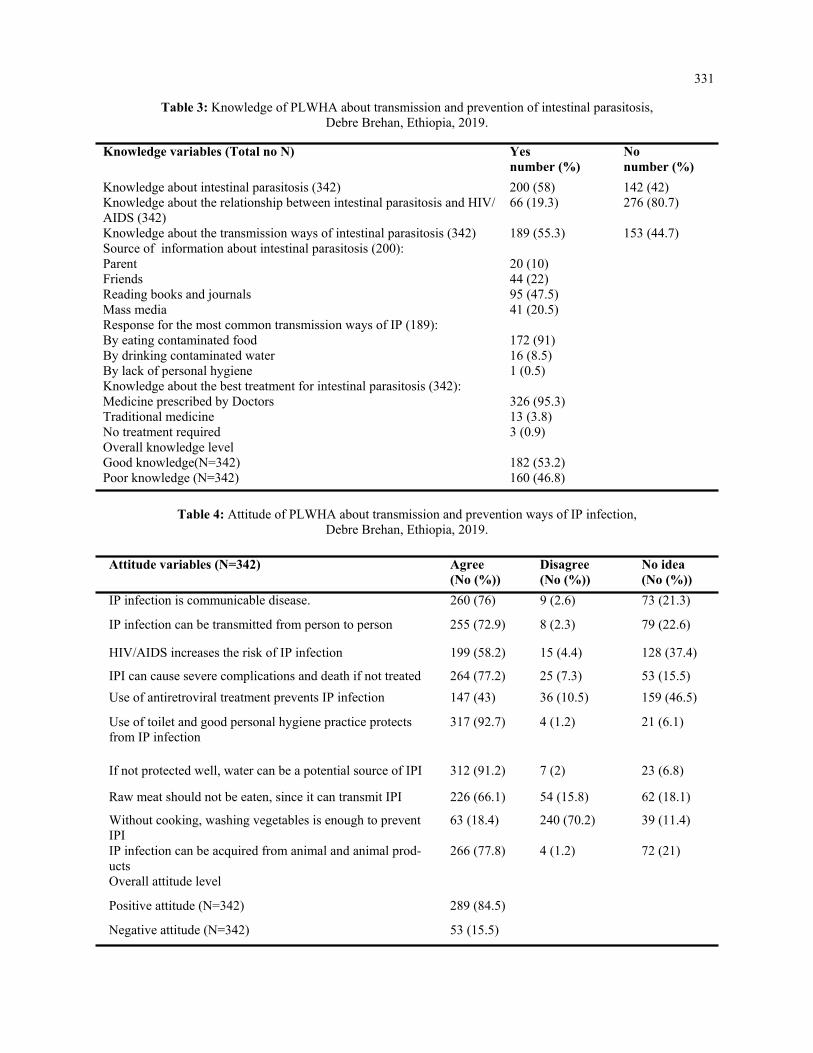
331
Table 3: Knowledge of PLWHA about transmission and prevention of intestinal parasitosis, Debre Brehan, Ethiopia, 2019.
Knowledge variables (Total no N) Yes number (%)
No number (%)
Knowledge about intestinal parasitosis (342) 200 (58) 142 (42) Knowledge about the relationship between intestinal parasitosis and HIV/AIDS (342)
66 (19.3) 276 (80.7)
Knowledge about the transmission ways of intestinal parasitosis (342) 189 (55.3) 153 (44.7) Source of information about intestinal parasitosis (200): Parent 20 (10) Friends 44 (22) Reading books and journals 95 (47.5) Mass media 41 (20.5) Response for the most common transmission ways of IP (189): By eating contaminated food 172 (91) By drinking contaminated water 16 (8.5) By lack of personal hygiene 1 (0.5) Knowledge about the best treatment for intestinal parasitosis (342): Medicine prescribed by Doctors 326 (95.3) Traditional medicine 13 (3.8) No treatment required 3 (0.9) Overall knowledge level Good knowledge(N=342) 182 (53.2) Poor knowledge (N=342) 160 (46.8)
Table 4: Attitude of PLWHA about transmission and prevention ways of IP infection, Debre Brehan, Ethiopia, 2019.
Attitude variables (N=342) Agree (No (%))
Disagree (No (%))
No idea (No (%))
IP infection is communicable disease. 260 (76) 9 (2.6) 73 (21.3)
IP infection can be transmitted from person to person 255 (72.9) 8 (2.3) 79 (22.6)
HIV/AIDS increases the risk of IP infection 199 (58.2) 15 (4.4) 128 (37.4)
IPI can cause severe complications and death if not treated 264 (77.2) 25 (7.3) 53 (15.5)
Use of antiretroviral treatment prevents IP infection 147 (43) 36 (10.5) 159 (46.5)
Use of toilet and good personal hygiene practice protects from IP infection
317 (92.7) 4 (1.2) 21 (6.1)
If not protected well, water can be a potential source of IPI 312 (91.2) 7 (2) 23 (6.8)
Raw meat should not be eaten, since it can transmit IPI 226 (66.1) 54 (15.8) 62 (18.1)
Without cooking, washing vegetables is enough to prevent IPI
63 (18.4) 240 (70.2) 39 (11.4)
IP infection can be acquired from animal and animal prod-ucts
266 (77.8) 4 (1.2) 72 (21)
Overall attitude level
Positive attitude (N=342) 289 (84.5)
Negative attitude (N=342) 53 (15.5)

332
Table 5: Practices of PLWHA related to prevention and control of IP infections, Debre Brehan, Ethiopia, 2019.
Practice variables (342) Yes (no(%) No (no(%)
Hand washing before and after meal (342) 337 (98.5) 5 (1.5) Availability of latrine (342) 323 (94.4) 19 (5.6) Type of latrine (323) Private 282 (87.3) Public 41 (12.7) Source of water supply (342) Pipe water 303 (88.6) Pond 31 (9.0) Spring 8 ( 2.4) Vegetable eating habit (342) 237 (69.3) 105 (30.7) Vegetable feeding methods (237) Raw vegetable without washing. 3 (1.3) By washing 23 (9.7) By cooking 211 (89) Raw meat eating habit (342) 145 (42.4) 197 (57.6) Animals living with humans (342) 206 (60.2) 136 39.8) Overall practice level Good practice (N=342) 314 (91.8) Bad practice (N=342) 28 (8.2)
This study showed that 182 (53.2%) of the study par-ticipants had good knowledge and 160 (46.8%) of the participants had poor knowledge, 289 (84.5%) had a positive attitude while 53 (15.5%) had a negative atti-tude and study participants also had good practice 314 (89.7%) and poor practice 28 (10.3%) about transmis-sion, prevention and control of intestinal parasites. Al-though the knowledge and attitude of study participants didn’t show an association, the overall performance of health practices was significantly associated with intes-tinal parasitosis. Persons who had poor health practices towards intestinal parasitosis were almost three times more likely to develop intestinal parasitosis than per-sons with good health practices related to transmission and prevention of IPI (AOR = 2.88, 95% CI: 1.2, 6.88).
DISCUSSION
This study determined the prevalence of intestinal para-sites, assessed potential associated risk factors and awareness of the study participants about the transmis-sion, prevention, and control of the disease in Debre Brehan, Central Ethiopia. In the present study, the overall prevalence of IP among PLWHA following ART treatment and care programs in the study area was 20.3% (71/350). This was relatively consistent with studies performed in Dessie Hospital on ART patients, Ethiopia (17.6%) (12), in Abuja, Nigeria (24.7%) (14), and Hospital of Kathmandu, Nepal (19.17%) (4). On the other hand, our finding was much lower compared to studies conducted in different parts of Ethiopia; Ar-baminch Hospital, (45.4%), East Gojjam, (36.8%), Bu-tajira, (35.9%) and Gondar Hospital, (28%) (3, 18, 26, 37).
Our findings were higher when it also compared with previous studies among non-HIV persons, revealed as IP infection in Kobo Health Center, 10%, 2014 (38), Debre Brehan Referral Hospital, 17.4%, 2014 (34) and Debre Brehan, 9.8%, 2016 (39) in Ethiopia. This variation in the magnitude of parasitic infection might be due to the difference in the geographical location of the study site, en-demicity of parasite, HIV status of the study par-ticipants, methodology, time gaps of the studies, and climatic conditions at different study sites. Also, the lower IP prevalence in our findings might be due to increment in awareness of PLWHA and improvements in the clinical man-agement system. The parasite distribution of single infections was observed in which E. histolytica/dispar (69.1%) showed higher proportion when compared to other studies in Dessie, Ethiopia (45.5%), East Gojjam, Ethiopia (24%), and Arbaminch, Ethiopia (7.4%) (3, 12, 18). However, the other parasite’s fre-quency in our study G. lamblia (14.7%), A.lumburcoids (4.4%), and S. stercoralis (1.5%) were lower than a study conducted in Dessie, East Gojjam, and Arbaminch(3, 12, 18). There was no opportunistic parasite in this study similar with the study conducted in Dessie (12), but studies in Ar-baminch, East Gojjam, and Butajira revealed the highest number of opportunistic parasitic infec-tions observed as 20%, 4.9%, and 8.7% respec-tively (3, 12, 18).
333
The difference in frequency of individual parasites might be due to the difference in geographical loca-tion, altitude, the climatic condition of study areas, and hygiene and sanitation practice of study popula-tion. Furthermore, the decrement of opportunistic in-fections especially Cryptosporidium species and I. belli suggested an increase in the health-seeking be-havior of the community. Intern resulted in good adherence of HIV/AIDS cli-ents to ART treatment and care programs. An im-provement in the immunologic conditions of the pa-tients and better response to infections also might be the reason. Opportunistic parasites were known to be resolved spontaneously with immune restoration among HIV/AIDS patients on ART (1). Study participants who had a viral load count >1000 cps/ml had higher IP infections when compared to patients with <1000 cps/ml viral load counts. In this study, study participants who had viral load count of > 1000 cps/ml were about four times more likely to be infected with intestinal parasites than those who had a viral load counts Target not detected (AOR = 4.2, 95% CI: 1.4, 12.4). This showed that increased viral load counts of the study participants contributed to the acquisition of intestinal parasite infections. The other association was with the availability of la-trine, where our study indicated that 323 (94.6%) of the study participants had latrine in their home. This study revealed that participants who did not have la-trine were four times more likely to be infected with intestinal parasite than those having latrine (AOR = 3.97, 95% CI: 1.33, 11.84). This result was in line with a study in Gondar, Ethiopia that study partici-pants didn’t have latrine were six times more likely infected with IP than those having latrine (AOR = 6.2, 95% CI: 1.75, 22.06) and also supported by a similar study in Dessie, Ethiopia that patients who did not have latrine had IP infections almost 8 times more likely than those having latrine (AOR = 7.56, 95% CI: 1.3, 44.2) (12). These relative comparable results sug-gested the similarities in accessibility and using habit of the toilet in those study sites. In this study, knowledge, attitude, and practice of the individual participants towards intestinal parasitosis were assessed using a structured questionnaire. As a result, 53.2% of study participants had good knowl-edge about transmission, distribution, and prevention of intestinal parasitosis and its association with HIV/AIDS whereas the remaining 46.8% had poor knowl-edge. About 189 (55.3%) of study participants knew the transmission ways of intestinal parasitosis. Of which, 172 (91%) understood that it was through eat-ing contaminated foods.
This result was slightly higher than the study con-ducted in Addis Ababa, Ethiopia in which 49.4% understood the transmission ways and 63.5% of them believed transmission was through contami-nated foods (40). This variation might be due to the socio-demographic difference of study participants and the time gap of studies. About 92.7% of study participants agreed that the use of toilets contributes to protecting individuals from intestinal parasitic infections or failure to use toilet exposes for the infection. This result was higher compared to the study in Asmara, Eritrea provided that 60.3% of study participants agreed that defecating in the open air or fail to use toilet contributes to intestinal para-sitic infections (20). The difference might be due to the difference in the pathological outcome of the endemic intestinal parasite species in the study sites. The current study revealed that 98.5% (337/342) of study participants had practiced hand washing be-fore a meal and 94.4% (323/342) of study partici-pants had a latrine. Of latrine users, 87.3% (282/323) had private latrine while 12.7% (41/323) had a public latrine. This result was higher com-pared to another study among street dwellers con-ducted in Addis Ababa, Ethiopia shown that 15.6% of the study participants practiced regular hand washing before a meal and 95% had a latrine. Of these latrine users, 56.5% had private latrine and 38.5% had public latrine (40). The difference might be due to variation in the economic and educational level of the study participants. Health practices of the study participants were sig-nificantly associated with intestinal parasitosis. Per-sons who had poor health practices towards intesti-nal parasitosis were almost three times more likely to develop intestinal parasitosis than persons with good health practices related to transmission and prevention of IPI (AOR = 2.88, 95% CI: 1.2, 6.88). Limitation of the study According to the current national treatment
protocol every person tested for HIV and re-sults become positive needs to start treatments immediately. Due to this reason, it was difficult to get any ART naïve PLWHA during the study period and unable to analyze the outcomes comparatively for both groups of ART status.
There was no CD4 count data available during the study period instead only viral load count had been used and analyzed.
Advanced molecular diagnostic methods were not implemented that would increase the detec-tion of opportunistic parasites.
Non-probability sampling method has been used in this study that limits the chance of get-ting equal opportunity of the participants to involve in the study.

334
Conclusion This study updated the prevalence of intestinal para-sites and associated risk factors among people living with HIV/AIDS following ART treatment in the study area. In the study E. histolytica/dispar and G. lamblia showed greater proportion of parasite distribution. The absence of latrine and increased viral load count for PLWHA were identified as the potential risk factors for the acquisition of intestinal parasitic infections. The study showed that most of the study participants had positive attitude, good practices and poor knowl-edge related to the transmission and prevention activi-ties of intestinal parasitosis. Health practices of the study participants related to transmission and preven-tion showed significant association with intestinal parasitosis. Thus to reduce the disease burden, the community health workers, other government offi-cials, and related stakeholder give attention on in-crease awareness of latrine use, importance of strict follow up of clinician advice which help to reduce viral load count, and avoid bad health practice, as well as encourage frequent diagnosis of patients to de-crease the burden of intestinal parasites among PLWHA.
ACKNOWLEDGMENTS
The authors acknowledge Addis Ababa University, College of Health Sciences, Department of Medical Laboratory Science that provides us ethical approval of the study.
Our gratitude also goes to Debre Brehan Referral Hospital administration for allowing the study in the institution, all DBRH Laboratory managers and staffs for their commitment to provide reagent and technical support, EPHI parasitology department staffs who did further confirmation of the stained slides willingly and Addis Ababa University library workers for their sincerely cooperation to provide any important reading materials and internet service that was very vital for this work. Our last but not the least recognition is to all study participants who were agreed to give their information as per the questionnaire and stool sample voluntarily. Supplementary Materials All supplementary materials used during the study are archived with this manuscript. These are: infor-mation sheet that enables the study participants to be introduced about the study, questionnaires that used to gather information from study participants, informed consent/assents that guarantees the per-mission of the participants to use their information/sample for the study and SOPs are the short descrip-tions of the procedures and principles of the labora-tory methods. Conflict of interest: XXXXXXXXXXXXXXXXXXXXXXXXXXXXXXXXXXX.
REFERENCES
1. Cerveja BZ, Tucuzo RM, Madureira A, et al. Prevalence of Intestinal Parasites Among HIV Infected and HIV Uninfected Patients Treated at the 1 De Maio Health Centre in Maputo, Mozambique. EC Microbiol. 2017;9(6):231-40. 2. Norhayati M, Fatmah M, Yusof S, Edariah A. Intestinal parasitic infections in man: a review. Med J Ma laysia. 2003;58(2):296-305. 3. Tadesse A, Worku A, Girma A. Prevalence of intestinal parasites and associated factors among adult pre- ART and ART patients in Goncha Siso Enesie Woreda, East Gojjam, Northwest Ethiopia, 2014. J AIDS Clin Res. 2017;8(10):1-8. 4. Sharma HN, Chalise BS, Rai G, Adhikari N, Bastola A, Singh A. Prevalence of intestinal parasitic infec tions among people living with HIV/AIDS visiting a central hospital of Kathmandu Nepal. Asian J Med Sci. 2017;8(5):87-92. 5. Hailegebriel T. Prevalence of intestinal parasitic infections and associated risk factors among students at Dona Berber primary school, Bahir Dar, Ethiopia. BMC Infect Dis. 2017;17(1):362. 6. Jaiswal S, Sharma S, Bhat SR, Pokhrel T, Chaudhary N, Sharma I. Distribution of intestinal parasite in people living with HIV/AIDS of different care centre of Pokhara Valley, Nepal. Scholars J Appl Med Sci. 2014;2(6G):3366-9. 7. Wegayehu T, Tsalla T, Seifu B, Teklu T. Prevalence of intestinal parasitic infections among highland and owland dwellers in Gamo area, South Ethiopia. BMC Public Health. 2013;13(1):151. 8. Fekadu S, Taye K, Teshome W, Asnake S. Prevalence of parasitic infections in HIV-positive patients in southern Ethiopia: a cross-sectional study. J Infect Dev Ctries. 2013;7(11):868-72. 9. Haque R. Human intestinal parasites. J Health Popul Nutr. 2007;25:387-91. 10. Bar-Yoseph H, Zohar Y, Lorber M. Strongyloidiasis-Related IRIS: A Case Report and Literature Review. J Inter Assoc prov AIDS Care (JIAPAC). 2017;16(1):8-10.

335
11. Marami D, Hailu K, Tolera M. Prevalence and associated factors of intestinal parasitic infections among asymptomatic food handlers working at Haramaya University cafeterias, eastern Ethiopia. Ann Occup Environ Med. 2018;30(1):53. 12. Missaye A, Dagnew M, Alemu A, Alemu A. Prevalence of intestinal parasites and associated risk factors among HIV/AIDS patients with pre-ART and on-ART attending dessie hospital ART clinic, Northeast Ethiopia. AIDS Res Ther. 2013;10(1):7. 13. Tandukar S, Ansari S, Adhikari N, et al. Intestinal parasitosis in school children of Lalitpur district of Nepal. BMC Res Notes. 2013;6(1):1-6. 14. Abaver D, Nwobegahay J, Goon D, Iweriebor B, Anye D. Prevalence of intestinal parasitic infections among HIV/AIDS patients from two health institutions in Abuja, Nigeria. Afr Health Sci. 2011;11(3):24- 7. 15. Abossie A, Seid M. Assessment of the prevalence of intestinal parasitosis and associated risk factors among primary school children in Chencha town, Southern Ethiopia. BMC Public Health. 2014;14 (1):166. 16. Ramos JM, Rodríguez-Valero N, Tisiano G, et al. Research Note Different profile of intestinal protozoa and helminthic infections among patients with diarrhoea according to age attending a rural hospital in southern Ethiopia. Trop Bio. 2014;31(2):392-7. 17. Kipyegen CK, Shivairo RS, Odhiambo RO. Prevalence of intestinal parasites among HIV patients in Bari ngo, Kenya. Pan African Medical Journal. 2012;13(1). 18. Gerzmu T, Fantahun E, Hailu E, Kibe H, Fesseha O, Godana W. Prevalence of intestinal parasitosis among HIV/AIDS patients attending ART clinic of Arbaminch Hospital. Afr J Sci Res. 2015;4(5):13-7. 19. Barcelos NB, Dias RFG, Menezes Filho HRd, Rodrigues RM. Opportunistic and non-opportunistic intes tinal parasites in HIV/AIDS patients in relation to their clinical and epidemiological status in a specialized medical service in Goiás, Brazil. Rev Inst Med Trop Sao Paulo. 2018;60:1-9. 20. Ahmed KS, Siraj NM, Fitsumberhan H, et al. Knowledge, Attitude and Practice (KAP) Assessment of Intestinal Parasitic Infection among School Children in Asmara, Eritrea. Health. 2016;9(1):57-68. 21. Solomon FB, Angore BN, Koyra HC, Tufa EG, Berheto TM, Admasu M. Spectrum of opportunistic in fections and associated factors among people living with HIV/AIDS in the era of highly active anti- retroviral treatment in Dawro Zone hospital: a retrospective study. BMC Res Notes. 2018;11(1):604. 22. Adeleke OA, Yogeswaran P, Wright G. Intestinal helminth infections amongst HIV-infected adults in Mthatha General Hospital, South Africa. Afr J Prim Health Care Fam Med. 2015;7(1):1-7. 23. Nissapatorn V, Sawangjaroen N. Parasitic infections in HIV infected individuals: diagnostic & therapeutic challenges. Indian J Med Res. 2011;134(6):878. 24. Kulkarni S, Kairon R, Sane S, et al. Opportunistic parasitic infections in HIV/AIDS patients presenting with diarrhoea by the level of immunesuppression. Indian J Med Res. 2009;130(1):63. 25. Amoo JK, Akindele AA, Amoo AOJ, et al. Prevalence of enteric parasitic infections among people living with HIV in Abeokuta, Nigeria. Pan Afr Med J. 2018;30:1-9. 26. Eshetu T, Sibhatu G, Megiso M, et al. Intestinal parasitosis and their associated factors among people living with HIV at University of Gondar Hospital, Northwest-Ethiopia. Ethiop J Health Sci. 2017;27 (4):411-20. 27. Wolday D, Mayaan S, Mariam ZG, et al. Treatment of intestinal worms is associated with decreased HIV plasma viral load. J Acquir Immune Defic Syndr 2002;31(1):56-62. 28. Tian L-G, Chen J-X, Wang T-P, et al. Co-infection of HIV and intestinal parasites in rural area of China. Parasit Vectors. 2012;5(1):36. 29. Cimerman S, Cimerman B, Lewi DS. Prevalence of intestinal parasitic infections in patients with acquired immunodeficiency syndrome in Brazil. Int J Infect Dis. 1999;3(4):203-6. 30. Paboriboune P, Phoumindr N, Borel E, et al. Intestinal parasitic infections in HIV-infected patients, Lao People’s Democratic Republic. PLoS One. 2014;9(3):e91452. 31. Kiros H, Nibret E, Munshea A, Kerisew B, Adal M. Prevalence of intestinal protozoan infections among I ndividuals living with HIV/AIDS at Felegehiwot Referral Hospital, Bahir Dar, Ethiopia. Int J Infect Dis. 2015;35:80-6. 32. Khalil S, Mirdha BR, Sinha S, et al. Intestinal parasitosis in relation to anti-retroviral therapy, CD4+ T- cell count and diarrhea in HIV patients. The Korean journal of parasitology. 2015;53(6):705.

336
33. Gebretsadik D, Haileslasie H, Feleke DG. Intestinal parasitosis among HIV/AIDS patients who are on anti-retroviral therapy in Kombolcha, North Central, Ethiopia: a cross-sectional study. BMC research notes. 2018;11(1):613. 34. Zemene T, Shiferaw MB. Prevalence of intestinal parasitic infections in children under the age of 5 years attending the Debre Birhan referral hospital, North Shoa, Ethiopia. BMC Res Notes. 2018;11(1):58. 35. Cheesbrough M. District laboratory practice in tropical countries. 2nd ed. New York: Cambridge univer sity press; 2006. 36. Anteneh T, Giday A, Alano A, Awoke A. Intestinal Parasitosis. Hawassa University, Ethiopian Health Center Team; 2008. 37. Gedle D, Kumera G, Eshete T, Ketema K, Adugna H, Feyera F. Intestinal parasitic infections and its asso ciation with undernutrition and CD4 T cell levels among HIV/AIDS patients on HAART in Butajira, Ethiopia. J Health Popul Nutr. 2017;36(1):15. 38. Bugssa G DB, Tarekegn H, Kassaw M, Tafete A. The Prevalence of Intestinal Parasites in HIV Positive and HIV Negative Individuals in Kobo Health Center, Northeastern Ethiopia: Comparative Cross Sectional. BRITISH BIOMEDICAL BULLETIN. 2014;2 (3):569-76. 39. Zelelie TZ, Gebreyes DS, Tilahun AT, Craddock HA, Gishen NZ. Enteropathogens in Under-Five Chil dren with Diarrhea in Health Facilities of Debre Berhan Town, North Shoa, Ethiopia. Ethiopian journal of health sciences. 2019;29(2). 40. Mekonnen B, Erko B, Legesse M. Prevalence of intestinal parasitic infections and related risk factors among Street Dwellers in Addis Ababa, Ethiopia. J Trop Dis 2014;2(2):1-7.
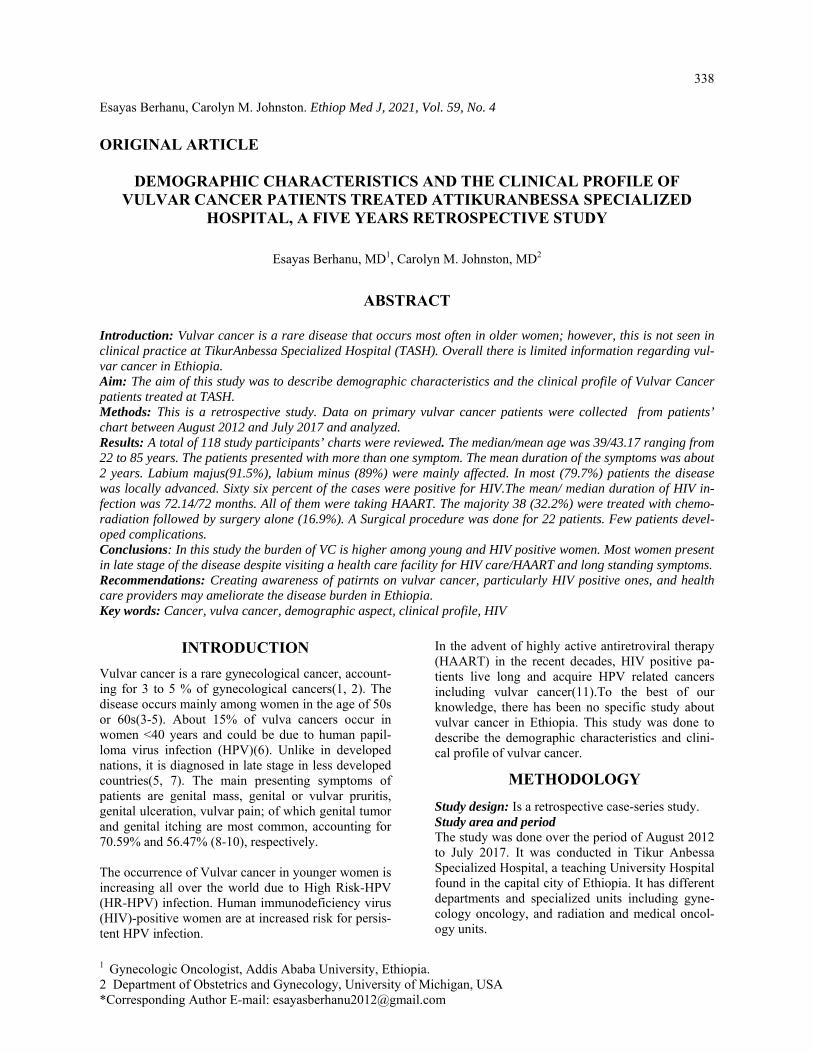
338
Esayas Berhanu, Carolyn M. Johnston. Ethiop Med J, 2021, Vol. 59, No. 4
ORIGINAL ARTICLE
DEMOGRAPHIC CHARACTERISTICS AND THE CLINICAL PROFILE OF VULVAR CANCER PATIENTS TREATED ATTIKURANBESSA SPECIALIZED
HOSPITAL, A FIVE YEARS RETROSPECTIVE STUDY
Esayas Berhanu, MD1, Carolyn M. Johnston, MD2
ABSTRACT
Introduction: Vulvar cancer is a rare disease that occurs most often in older women; however, this is not seen in clinical practice at TikurAnbessa Specialized Hospital (TASH). Overall there is limited information regarding vul-var cancer in Ethiopia. Aim: The aim of this study was to describe demographic characteristics and the clinical profile of Vulvar Cancer patients treated at TASH. Methods: This is a retrospective study. Data on primary vulvar cancer patients were collected from patients’ chart between August 2012 and July 2017 and analyzed. Results: A total of 118 study participants’ charts were reviewed. The median/mean age was 39/43.17 ranging from 22 to 85 years. The patients presented with more than one symptom. The mean duration of the symptoms was about 2 years. Labium majus(91.5%), labium minus (89%) were mainly affected. In most (79.7%) patients the disease was locally advanced. Sixty six percent of the cases were positive for HIV.The mean/ median duration of HIV in-fection was 72.14/72 months. All of them were taking HAART. The majority 38 (32.2%) were treated with chemo-radiation followed by surgery alone (16.9%). A Surgical procedure was done for 22 patients. Few patients devel-oped complications. Conclusions: In this study the burden of VC is higher among young and HIV positive women. Most women present in late stage of the disease despite visiting a health care facility for HIV care/HAART and long standing symptoms. Recommendations: Creating awareness of patirnts on vulvar cancer, particularly HIV positive ones, and health care providers may ameliorate the disease burden in Ethiopia. Key words: Cancer, vulva cancer, demographic aspect, clinical profile, HIV
INTRODUCTION
Vulvar cancer is a rare gynecological cancer, account-ing for 3 to 5 % of gynecological cancers(1, 2). The disease occurs mainly among women in the age of 50s or 60s(3-5). About 15% of vulva cancers occur in women <40 years and could be due to human papil-loma virus infection (HPV)(6). Unlike in developed nations, it is diagnosed in late stage in less developed countries(5, 7). The main presenting symptoms of patients are genital mass, genital or vulvar pruritis, genital ulceration, vulvar pain; of which genital tumor and genital itching are most common, accounting for 70.59% and 56.47% (8-10), respectively. The occurrence of Vulvar cancer in younger women is increasing all over the world due to High Risk-HPV (HR-HPV) infection. Human immunodeficiency virus (HIV)-positive women are at increased risk for persis-tent HPV infection.
In the advent of highly active antiretroviral therapy (HAART) in the recent decades, HIV positive pa-tients live long and acquire HPV related cancers including vulvar cancer(11).To the best of our knowledge, there has been no specific study about vulvar cancer in Ethiopia. This study was done to describe the demographic characteristics and clini-cal profile of vulvar cancer.
METHODOLOGY
Study design: Is a retrospective case-series study. Study area and period The study was done over the period of August 2012 to July 2017. It was conducted in Tikur Anbessa Specialized Hospital, a teaching University Hospital found in the capital city of Ethiopia. It has different departments and specialized units including gyne-cology oncology, and radiation and medical oncol-ogy units.
1 Gynecologic Oncologist, Addis Ababa University, Ethiopia. 2 Department of Obstetrics and Gynecology, University of Michigan, USA *Corresponding Author E-mail: [email protected]
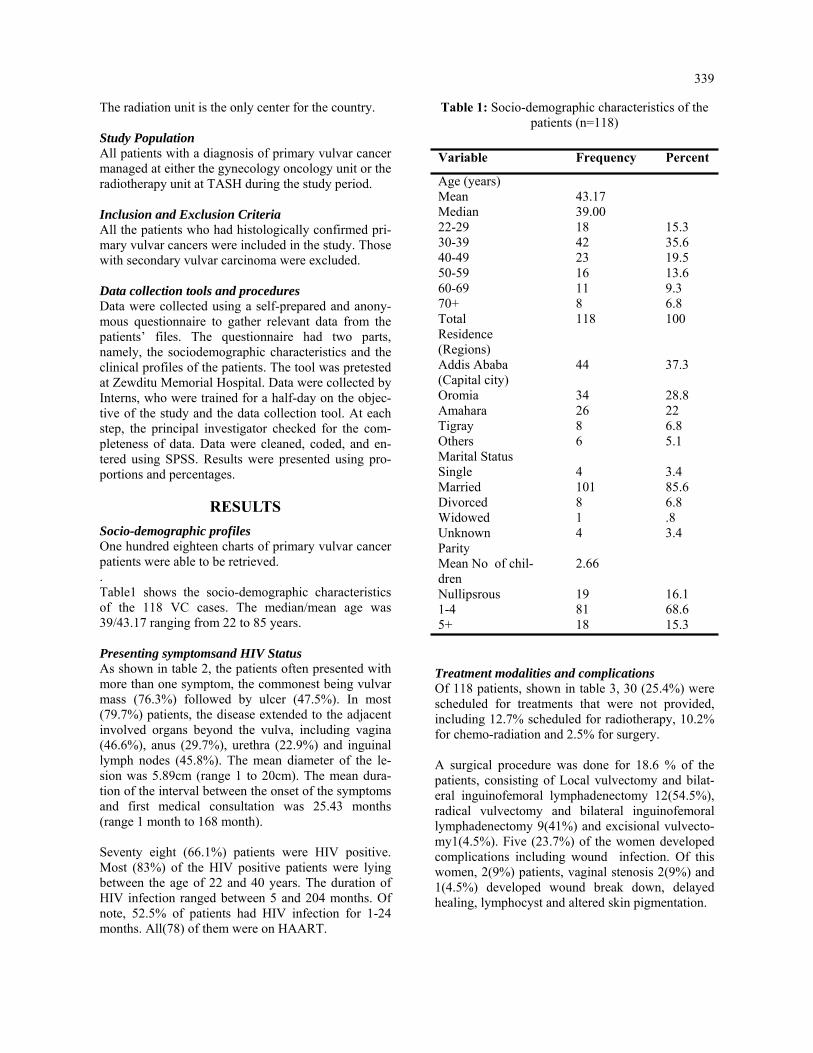
339
The radiation unit is the only center for the country. Study Population All patients with a diagnosis of primary vulvar cancer managed at either the gynecology oncology unit or the radiotherapy unit at TASH during the study period. Inclusion and Exclusion Criteria All the patients who had histologically confirmed pri-mary vulvar cancers were included in the study. Those with secondary vulvar carcinoma were excluded. Data collection tools and procedures Data were collected using a self-prepared and anony-mous questionnaire to gather relevant data from the patients’ files. The questionnaire had two parts, namely, the sociodemographic characteristics and the clinical profiles of the patients. The tool was pretested at Zewditu Memorial Hospital. Data were collected by Interns, who were trained for a half-day on the objec-tive of the study and the data collection tool. At each step, the principal investigator checked for the com-pleteness of data. Data were cleaned, coded, and en-tered using SPSS. Results were presented using pro-portions and percentages.
RESULTS
Socio-demographic profiles One hundred eighteen charts of primary vulvar cancer patients were able to be retrieved. . Table1 shows the socio-demographic characteristics of the 118 VC cases. The median/mean age was 39/43.17 ranging from 22 to 85 years. Presenting symptomsand HIV Status As shown in table 2, the patients often presented with more than one symptom, the commonest being vulvar mass (76.3%) followed by ulcer (47.5%). In most (79.7%) patients, the disease extended to the adjacent involved organs beyond the vulva, including vagina (46.6%), anus (29.7%), urethra (22.9%) and inguinal lymph nodes (45.8%). The mean diameter of the le-sion was 5.89cm (range 1 to 20cm). The mean dura-tion of the interval between the onset of the symptoms and first medical consultation was 25.43 months (range 1 month to 168 month). Seventy eight (66.1%) patients were HIV positive. Most (83%) of the HIV positive patients were lying between the age of 22 and 40 years. The duration of HIV infection ranged between 5 and 204 months. Of note, 52.5% of patients had HIV infection for 1-24 months. All(78) of them were on HAART.
Table 1: Socio-demographic characteristics of the patients (n=118)
Treatment modalities and complications Of 118 patients, shown in table 3, 30 (25.4%) were scheduled for treatments that were not provided, including 12.7% scheduled for radiotherapy, 10.2% for chemo-radiation and 2.5% for surgery. A surgical procedure was done for 18.6 % of the patients, consisting of Local vulvectomy and bilat-eral inguinofemoral lymphadenectomy 12(54.5%), radical vulvectomy and bilateral inguinofemoral lymphadenectomy 9(41%) and excisional vulvecto-my1(4.5%). Five (23.7%) of the women developed complications including wound infection. Of this women, 2(9%) patients, vaginal stenosis 2(9%) and 1(4.5%) developed wound break down, delayed healing, lymphocyst and altered skin pigmentation.
Variable Frequency Percent
Age (years) Mean 43.17 Median 39.00 22-29 18 15.3 30-39 42 35.6 40-49 23 19.5 50-59 16 13.6 60-69 11 9.3 70+ 8 6.8 Total 118 100 Residence (Regions)
Addis Ababa (Capital city)
44 37.3
Oromia 34 28.8 Amahara 26 22 Tigray 8 6.8 Others 6 5.1 Marital Status Single 4 3.4 Married 101 85.6 Divorced 8 6.8 Widowed 1 .8 Unknown 4 3.4 Parity Mean No of chil-dren
2.66
Nullipsrous 19 16.1 1-4 81 68.6 5+ 18 15.3

340
Table 2: Clinical characteristics and HIV status of the patients (n=118)
Table 3: Types of Treatment (N=118)
Variable Frequency percent
Symptoms Vulvar mass 90 76.3 Ulcer 56 47.5 Pruritus 50 42.4 Pain 40 33.9 Discharge 54 45.8 Bleeding 32 27.1 Others 7 5.9 Mean duration (months)
25.43
Sites of lesion Confined to vulva 24 20.3 Extension to adjacent organs
94 79.7
Mean largest diameter (cm)
5.89
HIV status Negative 38 32.2 Positive 78 66.1 Unknown 2 1.7 HIV Pos age category 22-30 16 20 31-40 49 63 41+ 13 17 HIV duration (months) Mean duration
72.14
1 month - 24 month 62 52.5 25month – 48 month 4 3.4 49 month – 72 month 19 16.1 73 month – 96 month 10 8.5 97+ 23 19.5
DISCUSSION Vulvar cancer is typically a disease of elderly women. The median age in some developed coun-tries were between 65 to 70 years(3,5, 7). Studies in two West African countries showed a higher inci-dence of the disease in older women; in Burkina Faso the mean age was 57, and it was 56.3 in Ghana (5). The median/mean age was 39/43.17 in our patients. Similarly, other authors in both hemispheres have noted a lower age of onset(12, 13, 15). In this study, as most of the women are HIV positive and most (91%) of those women are in the younger age group (less than 50); this probably explains the difference in the age distribution with other studies. The age distribution of vulvar cancer in this study is also similar with that of cervical cancer in this country(24), and may have similar etiologic factors. The young age at presentation of our population, and the stage at presentation lend a huge challenge to the management and subsequent adverse out-comes for these women with respect to familial, sexuality, fertility and psychosocial outcomes. The high rate of HIV positivity in our vulvar cancer population is not surprising given their young age, and Ethiopia’s high adult HIV infection prevalence (30) as compared to that of developed countries and West Africa. It is, however, surprising that those women are doing well on HAART and are receiving long term facilities care at HIV/HAART health. We propose that a first steps towards awareness and potential of earlier diagnosis would be the education of Health care workers at these facilities and the inclusion of an assessment of gynecologic symp-toms at each visit with direct referral to a gynecolo-gist as indicated. HIV positive patients have been shown to be at in-creased risk of persistent HPV infection. Persistent high risk-HPV infection is associated with essen-tially all squamous cell carcinoma of the cervix, 80% to 90% of anal cancers, a higher proportion of vaginal and vulvar cancers and with oropharyngeal-cancer(23). In the review of the literature assessing the relation-ship between HR-HPV and vulvar cancer, Smith et al (27), noted 40.1 % prevalence in vulvar cancer. Faber et al also noted a similar pooled prevalence of HPV at 39.7% (CI: 35-44.4%) (28) in their updated review of 64 papers with 5015 cases of vulvar can-cer. Siriaunksul et al noted a 40% prevalence of vulvar cancer in Thailand(29).
Variable Frequency percent
Type of treatment Surgery scheduled that were not done
3 2.5
Radiotherapy scheduled that were not given
15 12.7
Chemoradiation sched-uled that were not given
12 10.2
Chemoradiation given 38 32.2 Radiation alone given 17 14.4 Chemotherapy alone 11 9.3 Surgery done 20 16.9 Surgery followed by chemoradiation
2 1.7

341
Our study could not assess HPV prevalence, but we showed that most of the patients were younger and HIV positive. As in other studies (90%-95%) squamous histology was the most common type of vulvar carcinoma in this study(5, 7, 13, 19). This study indicates that most patients were from Ad-dis Ababa, the capital city of Ethiopia, where this hos-pital is located. This is again similar to the pattern noted with cervical cancer(24). A number of factors could account for this including the ability to travel for care, poor knowledge of VC in outlying areas and misidentification of the actual place of residence at the time of registration due to staying with family who reside in Addis Ababa. In literature pruritis is the most common and long lasting reported symptom of vulvar cancer, followed by vulvar bleeding, discharge, dy-suria and pain(25). In our patients genital mass is the most common presenting symptom (76.3%) followed by ulcer (47.5%). Pruritus is still the significant pre-senting symptom.
The difference may be due to the associated lichen sclerosis in older patients in the other studies. In Burk-ina Faso, pain and ulceration are also the main pre-senting symptoms(5) while in Ghana(7) swelling and ulceration are most common. The larger size, mean diameter of the largest ulcer and mass is 5.89 cm (range 1 cm to 20 cm), the multiple lesion and bilateral involvement of the vulva are strik-ingly important finding in these patients which would be consistent with HPV related cancers. It also con-tributes to the challenge of an adequate primary surgi-cal resection even if not metastatic which is why most of the patients were not treated with surgical resection. In the USA, 90% of cases of vulvar cancer are diag-nosed with in situ or early invasive stage(22). How-ever, this study is consistent with the findings of stud-ies in Burkina Faso and Ghana in which most of the patients presented with locally advanced stage (4,5,7). This has a deleterious effect on the outcome of the disease. Most of our patients sought medical care after several months of the onset of the symptoms. Similarly the Ghana women consulted professionals after failure of improvement following consultations of other alternatives that led to advanced stage. We plan to determine the primary factors that contrib-ute to late presentation and to make recommendations to address them. Surgical removal of the primary tu-mor and inginal lymph nodes remains the corner stone of the treatment of vulvar cancer with strong trends towards a less radical more conservative, and more individualized approach in early stage disease.
Radical partial vulvectomy in localized lesion with SLN biopsy is suggested with favorable outcomes but not an option in Ethiopia. Chemoradiation is indicated for advanced cases(7, 13, 19, 22). In our study, 9 out of 22 patients underwent radical vul-vectomy and bilateral inguinofemoral lymphadenec-tomy due to large tumor size and multiple localities while 12 underwent a smaller vulvectomy and bilat-eral inguinal lymphadenectomy. Post operative sur-gical complication rate and severity were relatively low, 5 out of 22 patients. This could be due to the retrospective nature of the study and post operative follow up is not always consistent in our population. Conclusions In this study, the burden of vulvar cancer is higher among young and HIV positive women. Most of them present at a late stage of the disease despite visiting health care facilities for HIV care/HAART and long standing multiple symptoms. Recommendations Creation of awareness of patients onvulvar cancer, particularly those who are HIV positive and health care providers and the inclusion of a gynecologic assessment of symptoms at each visit with direct referral to a gynecologist as indicated would allow earlier diagnosis, either at premalignant or early stage of the disease, and may ameliorate the disease burden in Ethiopia. HPV serotype study and HPV vaccination, which has been provened to be highly effective against ano-genital disease, could make an important contribution to the reduction of the risk of VC in these young women.
Ethics Considerations The study was approved by the Department of Ob-stetrics and Gynecology Research and Publication Committee and Institutional Review Board (IRB) of College of Health Sciences, Addis Ababa Univer-sity for ethical clearance (Protocol number AAUMF 03-008). All procedures were followed in accor-dance with the ethical standards. Permission was obtained from the department of medical and radia-tion oncology, and an outpatient department to ac-cess the patient medical records.
Competing Interests There is no conflict of interests to declare.
Funding No funding
ACKNOWLEDGMENTS
We would like to thank the Head of Department of Medical and Radiation Oncology, Dr Wondi-magegn, and the staff of the record office for the retrieval of the patients’ files during data collection.

342
REFERENCES 1. de Martel C, Ferlay J, Franceschi S, al. e. Global burden of cancers attributable to infections in 2008: a review and synthetic analysis. Lancet Oncol. 2012;13(6):607-15. 2. Hacker NF,et al. Cancer of the vulva. Int J Gynaecol Obstet. 2015;131 76-8. 3. Hampl M, al. e. New aspects of vulvar cancer: changes in localization and age of onset. Vulvar cancer in women less than fifty in United States, 1980-2005. Gynecol Oncol. 2009. 4. Mary Ann Dadzie, al. e. Vulva cancer in Ghana - Review of a hospital based data. Gynecologic Oncology Reports. 2017; 108-111. 5. Zongo, et al. Cancer of the vulva in Burkina Faso: a hospital-based case series. Infect Agents and Cancer 2016;11:33. 6. Siddiqui N. The management of vulval cancer. Obstet Gynaecol. 2002;12 (2): 97-103. 7. Mary Ann Dadzie et al. Vulva cancer in Ghana – Review of a hospital based data. Gynecologic Oncology Reports 2017;108-111. 8. Thakur, et al. Clinical analysis of vulvar carcinoma. . Gynecology 2013. 2013. 9. Singh DK, Anastos K, Hoover DR, ;. ea. Human papillomavirus infection and cervical cytology in HIV- infected and HIV-uninfected Rwandan women. J Infect Dis. 2009;199:1851-61. 10. Denny L, Boa R, Williamson AL, al. e. Human papillomavirus infection and cervical disease in human immunodeficiency virus-1-infected women. Obstet Gynecol. 2008;111:1380-7. 11. Brickman C, JM P. Human papillomavirus in the HIV-infected host: epidemiology and pathogenesis in the antiretroviral era. 2015. 12. Hampl M, Deckers-Figiel S, Hampl JA, et al. aspects of vulvar cancer: changes in localization and age of onset. Gynecol Oncol. 2009. 13. Singh, et al. A cohort study of vulvar cancer. Indian Journal of Cancer 2016;53 (3). 14. Hacker NF, Eifel PJ, J vdV. FIGO cancer report 2012. Cancer of the vulva. Int J Gynecol Obstet. 2012;119 90‑6. 15. Okolo CA, Odubanjo MO, Awolude OA, et al. A review of vulvar and vaginal cancers in Ibadan, Nigeria. . Am J Med Sci 2013;6:76‑81. 16. Madeleine MM, Daling JR, Carter JJ, Wipf GC, Schwartz SM, McKnight B, et al. Cofactors with human papillomavirus in a population-based study of vulvar cancer. J Natl Cancer Inst. 1997;89:1516- 23. 17. Canavan TP, D. C. Vulvar cancer. Am Fam Physician. 2002;66:1269-74. 18. Al-Ghamdi A et al. Vulvar squamous cell carcinoma in young women: a clinicopathologic study of 21 cases. . Gynecol Oncol. 2002 84(1):94-101. 19. Alkatout, et al. Vulvar cancer: epidemiology, clinical presentation, and management options International Journal of Women’s Health. 2015;7. 20. Ahizechukwu C Eke et al. Management options for vulvar carcinoma in a low resource setting. World J Surg Oncol. 2010;8:94. 21. Nkyekyer, K. Pattern of gynaecological cancers in Ghana. . East Afr Med J. 2000;77 10. 22. Stroup AM et al. Demographic, Clinical, and Treatment Trends among Women Diagnosed with Vulvar Cancer in the U.S. Gynecol Oncol. 2008 108(3):577-83. 23. Clemente et al. Multiple preinvasive and invasive HPV-related lesions of the anogenital tract in a female patient with HIV infection:A case report Medicine (2017) 96:4 Cervical Cancer, an open access journal. 24. Sefinew Migbaru Abate https://www.omicsonline.org/open-access/trends-of-cervical-cancer in Ethiopia for the years 1997-2012. 25. Alkatout et al. Vulvar cancer: epidemiology, clinical presentation, and management options International Journal of Women’s Health 2015:7. 26. Stoup AM et, al. Demographic, Clinical, and Treatment Trends Among Women Diagnosed with Vulvar Cancer in the U.S. Gynecol Oncol. 2008 March; 108(3): 577–583. 27. Smith et al. Human Papillomavirus Type-Distribution in Vulvar and Vaginal Cancers and Their Associated Precursors. 28. Faberetal. Prevalence and type distribution of human papillomavirus in squamous cell carcinoma and in traepithelial neoplasia of the vulva.Int J Cancer. 2017 Sep 15; 141(6):1161-1169. 29. Siriaunkgul et al. HPV Detection and Genotyping in Vulvar Squamous Cell Carcinoma in Northern Thai land. Asianpacific Journal of Cancer Prevention. 2014, 15 (8), 3773-3778. 30. Ethiopia HIV country profile. WHO 2016.

343
Yeshambel Agumas Ambelie, Getu Degu Alene, Damen Hailemariam Gebrekiros. Ethiop Med J, 2021, Vol. 59, No. 4
ORIGINAL ARTICLE
CULTIVATING COMPETENT LEADERS WHO CAN MANAGE AND GOVERN THE HEALTH DELIVERY SYSTEM IN NORTHWEST ETHIOPIAN: QUASI-
EXPERIMENTAL STUDY
Yeshambel Agumas Ambelie, PhD*1, Getu Degu Alene, PhD1, Damen Hailemariam Gebrekiros, MD, PhD2
ABSTRACT
Introduction: Nurturing leadership and governance is salient to strengthen health systems. However, literature that reports the effect of programs related to this, particularly in low and middle-income countries’ health systems is limited. Aim: To examine the effect of integrated health system leadership, management, and governance capacity-building program on institutional delivery performance. Methods: A prospective quasi-experimental study, on one-hundred-thirty-four health facility teams,was conducted in northwest Ethiopia. Teams were allocated to intervention and control groups in a 1:1 ratio, non-randomly. Inte-grated leadership, management, and governance capacity-building program was employed in teams of the inter-vention group over six months. Using a challenge model, they implemented a six-month project on institutional delivery performance. The outcome of interest was mean institutional delivery performance. Data from each group were collected at baseline and end line. Data were analyzed using analysis of covariance. Statistical significance was determined at p-value<0.05. The program’s effect size was reported using partial eta squared. Results: Integrated leadership, management, and governance capacity-building program had a statistically sig-nificant effect on mean institutional delivery performance (p-value<0.001). The program’s effect size was 65%. Conclusions: Integrated leadership, management, and governance capacity-building program is a plausible cause of improved mean institutional delivery performance. The current findings could make the program sustainable across time and scalable across similar settings. To identify the program’s true causation, further research could be done using a randomized control trial. Keywords: Effect, Integrated, Leadership, Management, Governance, Institutional delivery
INTROCUDCTION
A strong health system is required to address univer-sal health coverage (1, 2). Leadership and governance is identified as the health system building block that directly impact the health outcomes (3, 4). However, it remains challenging to implement and measure, particularly in low and middle-income countries’ health systems (4, 5). Yet, nurturing this building block is salient to improve the health system perform-ance and health outcomes. This has enforced the development of integrated Leadership, Management, and Governance (LMG) capacity-building program (4, 6). Contemporarily, this program centers the integrated leadership, manage-ment, and governance for results framework (Figure 1).
Figure 1: Integrated leadership, management and governance for results framework (Source: MSH, 2017)
1 Bahir Dar University 2 Addis Ababa university *Corresponding Author E-mail: [email protected]

344
The practices of the three paths indicated in figure 1 are highly interdependent and mutually reinforcing constructs in the context of health (5, 7). Thus, inter-acting with each of the practices in a balanced way is important to achieve better results. Integrated LMG capacity-building program has been deployed in a considerable number of low and middle-income countries’ health systems including Ethiopia (3). Despite this enormous expansion, there is limited empirical literature on how the program improves the health system performance and thereby health out-comes (8-11). The studies done in Kenya (9), Egypt (10) and Mo-zambique (11) reported that applying the leadership development program increased selected health-service delivery indicators by average coverage rate of 10%, 41%, and 10%, respectively. On the contrary, a study done in Afghanistan reported that the program had no statistically significant effect on health system performance, rather, many indicators worsened in the intervention group (8). These studies examines the program that only centers either the leading and managing practices (9, 10) or the governing practices (8, 11). All of these studies used an average coverage rate of two and more health services as an outcome of interest. Most of them used a retrospective approach and lacked to use control groups (9-11). None of them did control the plausible confounding factors (8-11). Other studies showed that leadership is a requirement for effective governance and effective management (5, 6). Moreover, there is a recommendation to further researching the program’s effect using a single outcome of interest (9). There-fore, the current study aimed at examining the effect of integrated health system leadership, management, and governance capacity-building program on institu-tional delivery performance.
METHODS
Theoretical Approach The theory of change is the theoretical foundation of this study (12, 13). Theory of change refers to a sys-tematic and cumulative study of the links between inputs, activities, outputs, outcomes, and context of any initiative (12). There are three identified attributes to achieve the potential of this theory: plausibility, doability, and testability (13). Plausibility refers to whether activities implemented should lead to desired outcomes. Doability reflects about availability of all resources to carry out the initiative. Testability ex-plains the presence of specific and complete theory of change to track its progress in incredible and useful ways.
Linking between inputs, activities, outputs, out-comes, and context of the initiative is influenced by the competence of the people and teams to lead, manage and govern the health delivery system (6). As noted earlier, studies indicate that people and teams empowered to lead,manage and govern the health delivery system improved performance and thereby increased health outcomes (5, 9, 10). This shows that how developing one’s competence to lead, manage, and govern the service delivery sys-tem is critical to achieve improved results. Anyone can further imagine the value of the integrated LMG capacity-building program when it is firmly grounded in the target population. Study design and teams This study was designed to be a prospective team-based (14) quasi-experiment, aimed at examining the effect of the integrated LMG capacity-building program on institutional delivery among health fa-cility teams. Quasi-experiment is an empirical study design used to estimate the plausible causal impact of an intervention on its target population without random assignment (15, 16). The study was con-ducted among one hundred thirty-four health facil-ity teams in northwest Ethiopia. Teams were allo-cated to intervention and control groups in a 1:1 ratio, non-randomly. Each team had three members. The team members in both the groups were intact and worked together over the intervention period. In all the 134 study teams, there were a total of 402 participants. Table 1 indicates sex, age, residence, and service year of the study team members.
Table 1: Sex, age, residence, and service year of the study team members, Northwest Ethiopia,
2018 (n = 402)
Variable Category Frequency Percent Sex
Male
184
45.8
Female 218 54.2
Age in years (mean = 32.6, SD = 5.5)
<25 4 1.0
25-29 145 36.1
30-34 135 33.6
>34 118 29.4
Residence Rural 239 59.5
Urban 163 40.5
Service year in years (Mean = 8.6, SD = 4.8)
<2 15 3.7
2-4 59 14.7
5-8 150 37.3
>8 178 44.3

345
Intervention The integrated LMG capacity-building program was the intervention. This is a capacity-building program that has been endorsed by the Ethiopian ministry of health to empower health facility teams to lead people, manage tasks and govern organizations. It comprised of five modules: (I) Overview and context of the health system in Ethiopia, (II) Introduction to LMG, (III) Im-proving performance through enhanced LMG, (IV) Health facility resources management, and (V) Health service delivery management. The integrated LMG capacity-building program was deployed over six months in the intervention group. Basic concepts that enable the teams to face challenges and achieve results were transferred with two consecu-tive off-site three-day workshops. Only nine to ten teams (twenty-seven to thirty participants) were re-cruited to a single workshop. Based on this, seven workshop cohorts were established to address all the intervention teams. The main task that the teams car-ried out in the first workshop was developing the six-
month project on institutional delivery performance using a challenge model (6, 10) (Figure 2). Figure 2: The challenge model (Source, MSH, 2017)
In line with the integrated leadership, management and governance for results framework (Figure 1), the challenge model was the key tool to track the plausibility, doability, and testability of the inte-grated LMG capacity-building program. Elements of this model that the teams worked out step-by-step were: reviewing facility mission, setting a shared vision, developing six-month measurable result on institutional delivery, assembling current institutional delivery performance (baseline), iden-tifying obstacles and root causes, developing inspi-rational challenge statement, and designing prior-ity actions to eliminate obstacles. In the meantime, each team identified key stakeholders to align and mobilize resources. With all the above activities done, the teams went back to their working place, taking an assignment of validating the project with other staff and key stakeholders. For example, one of the major issues to be validated was the specificity, measurability, achievability, realisticity and time boundedness of the desired measurable result. After an average period of one month, ensuring that the teams carried out their workplace assign-ments, they were called back for the second work-shop. It began with presentations and discussions on the validated projects. Furthermore, the teams facilitated development of an action plan and monitoring and evaluation plan to implement the six-month project. Moreover, concepts of coach-ing, communication, managing facility resources, and health services delivery were discussed. In the end, they went back to their working place for the actual implementation of the projects. In the next month, the facilitators’ made an on-site coaching visit to each team using a structured coaching guide. They addressed issues like chal-lenges faced, solutions taken and lessons learned. Facilitators were certified experts for integrated LMG in-service capacity building trainer of train-ees from the Ethiopian federal ministry of health. Participatory, inquiry-based and practice-oriented facilitation approaches were employed. Note that the control group was followed using the standard procedure. Variables and measurements Mean end line institutional delivery was the de-pendent variable, while the baseline institutional delivery was a covariate. Institutional delivery perfomance referred to the percentage of women who gave birth at a health facility.
346
It was a continuous scale variable measured by per-centage. The expected pregnant women were denomi-nators, while the women who gave birth at the facility were nominators. The main independent variable was the group. Note that any statement of mean institu-tional delivery performance in this study refers to the end line mean institutional delivery performance. Data collection and analysis Data were collected at baseline and end line using a checklist. Analysis of covariance was unlocked to analyze the data. Before the final analysis, five stages of analyses were conducted using the statistical pack-age for the social sciences version 20. First, descrip-tive analysis was carried out to characterize the study teams and the ordinary mean institutional delivery performance. Second, assumptions of no presence of significant outliers, and approximately normally dis-tributed data for each group were assessed by boxplot and Shapiro-Wilk test (p<0.05), respectively. Third, in the absence of the covariate, the effect of the group on the mean institutional delivery (dependent variable) was tested using analysis of variance. It gave signifi-cant result: partial eta squared (η2) = 0.37, and p-value<0.001. The η2 measured the proportion of the total variance (effect size) on the dependent variable that was asso-ciated with the membership of different groups de-fined by a group (17). Fourth, the group-covariate interaction effect was checked using a custom model of analysis of covariance. This analysis technique tested differences between the group means when we knew that an extraneous variable affected the depend-ent variable (18, 19). It provided non-significant out-put: η2 = 0.01 and p-value = 0.21. The other important output displayed from this analysis was the result of Levene's test: p-value<0.001. This result indicated that the group variances were not equal and hence the assumption of homogeneity of variance was violated. This further showed that we failed to reject the null hypothesis in that there was no group by covariate effect on the dependent variable (19). Last, the effect of the group on the covariate was also tested using analysis of variance and gave non-significant result: η2 = 0.02 and p-value = 0.09. Considering the above outlooks, analysis of covari-ance with the full factorial model was unlocked to evaluate the effect of the group on the dependent vari-able. This analysis technique is developed to increase the power of the test of the predictor variable, by re-moving error variance in the dependent variable that is associated with the covariate (18). Statistical sig-nificance was determined at p-value<0.05. The group’s effect size on the dependent variable was measured using η2.
Ethical considerations The study was registered at Clinicaltrials.gov, NCT03639961 on 27 May 2017. Ethical clearance was secured from the corresponding author’s insti-tute with a protocol record 090/18-04. Written con-sent was obtained from each member of the study teams, and data were protected. This work is an extension of our previous work (20).
RESULTS Ordinary means Table 2 displays the ordinary mean and standard deviation of institutional delivery performances with 95% CI. The ordinary mean (+SD) difference between the baseline and end line institutional de-livery performances were 14.6+7.2 and 1.1+2.2 in the intervention group and the control group, re-spectively.
Gro
up
Ord
inar
y m
ean
an
d S
D in
stit
utio
nal d
eliv
ery
per
form
ance
B
asel
ine
En
d li
ne
Mea
sure
S
tati
stic
95
% C
I S
tati
stic
95
% C
I L
ower
Upp
er
Low
er U
pper
Inte
rven
tion
Mea
n 34
.2
30.7
37
.5
48.8
46
.2
51.9
SD
12
.8
10.6
14
.8
12.6
10
.4
14.4
Con
trol
M
ean
30.9
28
.6
33.2
32
.0
29.5
34
.6
SD
9.
5 7.
1 11
.5
9.1
6.9
11.2
Tab
le 2
: O
rdin
ary
mea
n an
d S
tand
ard
Dev
iatio
n (S
D)
inst
itutio
nal
deliv
ery
perf
orm
ance
s, N
orth
wes
t Eth
iopi
a, 2
018
(n=
134
)
Estimated means Table 3 presents the adjusted mean institutional delivery performances that were the original means adjusted for the covariate. The means had changed compared to those found in the ordinary means.

347
Table 3: Adjusted mean institutional delivery performances, Northwest Ethiopia, 2018 (n= 134)
Note: The covariate appearing in the model was evaluated at the following value: baseline institutional delivery performance = 32.6.
Group Mean Std. Error 95% CI
Lower Bound Upper Bound
Intervention 47.4 0.627 46.2 48.6
Control 33.4 0.627 32.2 34.6
Effect of integrated LMG capacity-building program Table 4 shows that there was an overall statistically significant difference in the mean institutional deliv-ery performance between the groups once their means had been adjusted for the covariate (p-value<0.001).
The output also displayed a 65% (η2 = 0.65) effect size of the group on the mean institutional delivery performance. This showed that including the co-variate in the analysis increased the group’s (intervention’s) effect size from 37% (noted in the methods part) to 65%.
Table 4: Outputs of between-subjects effects on adjusted means, Northwest Ethiopia, 2018 (n = 134)
Source Type III Sum of Squares
Df Mean Square
Sig. Partial Eta Squared
Corrected Model
21955.8 2 10977.9 0.000 0.87
Intercept 2169.6 1 2169.6 0.000 0.39
Covariate 12460.4 1 12460.4 0.000 0.79
Group 6435.3 1 6435.3 0.000 0.65
Error 3410.4 131 26.0
Total 244108.0 134
Corrected Total
25366.2 133
Note: R Squared = 0.87, Adjusted R Squared = 0.86
DISCUSSION
The current study findings inform that the integrated LMG capacity-building program intervention causes a statistically significant difference in the mean insti-tutional delivery performance between the groups. The intervention is led by the theory of change to signify the expected relationships between inputs, activities, outputs, and outcomes in a given context (12). This theory has three important attributes: plau-sibility, doability, and testability that support achievement of the expected outcome of any initia-tive (13). In the current case, this could be compre-hended as a reasonable narrative of the interactions between the various components of the integrated LMG capacity-building program and the plausible pathways through which they have related with the elements of the health facility system to achieve the expected outcome.
The current and few previous studies (9, 10) use the challenge model, in common, to show the logical relationships between facility mission, shared vi-sion, measurable result, current situation, obstacles and root causes, challenge statement, and priority actions. Alongside these relationships, the teams identify key stakeholders to align and mobilize re-sources and develop an action plan and monitoring and evaluation plan to achieve better results. These pathways can support to track the scientific reliabil-ity and empirical scalability of the program. Differently, the current study examined the inte-grated LMG capacity-building program that centers the integrated leadership, management, and govern-ance for results model (5). In resource-limited set-tings including Ethiopia, empowering people and teams using such a model is crucial.

348
This is comparable with stabilizing a three-legged stool to get a balanced sit on a rough ground (21, 22). The other unique characteristics of the current study are adjusting the original means for the covariate, and including the control group. These have five-fold benefits (19): (I) it reduces the within-group error variance; (II) it eliminates potential confounders; (III) it provides additional evidence of causality; (IV) it identifies assumption attributes in trends between the groups; and (V) it determines the effect size of the program. In the current study, the adjusted mean institutional delivery performance (Table 3) compared with the ordinary mean institutional delivery performance (Table 2) is less in the intervention group, but greater in the control group. This shows that adjusting the mean by removing error variance in the dependent variable that associates with the covariate provides unbiased or uncontaminated mean. Additionally, the adjusted mean institutional delivery performances in both the groups are greater compared with the 2016 Ethiopian demographic health survey institutional delivery performance report (26%). Whereas, com-pared with the 2019 survey report (48%), the result in the intervention group is comparable, but the result in the control group is less. This finding is supported by a recently published field action report from Ethiopia that reported a 40% institutional delivery performance increase (23). These magnifies the importance of im-plementing the integrated LMG capacity-building program in improving performances and health out-comes. The current ordinary mean achievement increased in the intervention group, 14.6%, is slightly greater com-pared to the average achievement increase reported in the studies done in Kenya, 10% (9) and Mozam-bique,10% (11). Whereas, it is lower compared with the average achievement increase reported in the study done in Egypt, 41% (10). These increments in general, and the differences, in particular, might be due to that people and teams more empowered to lead, manage, and govern improves the workgroup environ-ment, management system, and responsiveness of the health system (24, 25). Generally, the current study has important implica-tions for policymaking, planning, implementing and researching in the context of the low and middle-income countries’ health systems. Health authorities who lead and manage and govern in these countries and who wish to achieve better results could consider a contextualized integrated LMG capacity-building program(5, 26).
Away from the implications, there were potential limitations in conducting this study. The first draw-back was absence of randomization pocedure (15) leading to the second limitation of whether analysis of covariance is used in alike data. Nonetheless, this was applied since there was no preexisted group affecting the covariate (19, 22). The third limitation was use of the statistical principle of regression to the mean in establishing causality (18). This widespread statistical phenomenon can result in wrong conclusion that an effect is due to the in-tervention when in reality it is due to chance. The degree of this caution was diminished by imple-menting the intervention in a real-world setting. The last limitation was the short duration of the inter-vention in which six months may not be enough to overcome barriers and achieve a significant result. Conclusions The integrated LMG capacity-building program is a plausible cause of improved institutional delivery. The program brings a statistically significant differ-ence in the mean institutional delivery between the groups once their means adjusted for the covariate. The program’s effect size is 65%. The findings pro-vided from this study might make the program sus-tainable across time and scalable across similar countries’ health systems. To identify the program’s true causation, further research could be done con-sidering a randomized control trial. Acknowledgments Our sincere appreciation goes to the study partici-pants, intervention facilitators, data collectors, and data supervisors for their valuable contribution. Our gratitude also extends to Bahir Dar University for funding this study. Conflict of interest All the authors declare that they have no both finan-cial and non-financial competing interests. Funding Bahir Dar University funded the research. It had no role in the design of the study and collection, analy-sis, and interpretation of data and in writing the manuscript.

349
REFERENCES
1. Murray CJ, Frenk J. A framework for assessing the performance of health systems. Bulletin of the world Health Organization. 2000;78:717-31.
2. Peters DH, El-Saharty S, Siadat B, Janovsky K, Vujicic M. Improving health service delivery in develop ing countries: from evidence to action: The World Bank; 2009.
3. Daire J, Gilson L, Cleary S. Developing leadership and management competencies in low and middle- income country health systems: a review of the literature. Cape Town: Resilient and Responsive Health Systems (RESYST). 2014.
4. Rauscher M, Walkowiak H, Djara MB. Leadership, Management, and Governance Evidence Compen dium. 2018.
5. Rice JA. Synthesis paper on effective governance for health. 2012. 6. Management Sciences for Health. Rice JA, Shukla, Mahesh, Johnson Lassner, Karen et al. Leaders Who
Govern. 2015. 7. Vriesendorp S, De La Peza L, Perry C, Seltzer J, ONeil M. Health systems in action: an ehandbook for
leaders and managers. 2010. 8. Anwari Z, Shukla M, Maseed BA, Wardak GFM, Sardar S, Matin J, et al. Implementing people-centred
health systems governance in 3 provinces and 11 districts of Afghanistan: a case study. Conflict and health. 2015;9(1):2.
9. La Rue KS, Alegre JC, Murei L, Bragar J, Thatte N, Kibunga P, et al. Strengthening management and leadership practices to increase health-service delivery in Kenya: an evidence-based approach. Human resources for health. 2012;10(1):25.
10. Mansour M, Mansour JB, El Swesy AH. Scaling up proven public health interventions through a locally owned and sustained leadership development programme in rural Upper Egypt. Human Resources for Health. 2010;8(1):1.
11. Perry C. Empowering primary care workers to improve health services: results from Mozambique's lead ership and management development program. Human resources for health. 2008;6(1):14.
12. Connell JP. New Approaches to Evaluating Community Initiatives. Concepts, Methods, and Contexts. Roundtable on Comperhensive Community Initiatives for Children and Families: ERIC; 1995.
13. Connell JP, Kubisch AC. Applying a theory of change approach to the evaluation of comprehensive com munity initiatives: progress, prospects, and problems. New approaches to evaluating community initia tives. 1998;2(15-44):1-16.
14. Salas E, DiazGranados D, Klein C, Burke CS, Stagl KC, Goodwin GF, et al. Does team training improve team performance? A meta-analysis. Human factors. 2008;50(6):903-33.
15. Harris AD, McGregor JC, Perencevich EN, Furuno JP, Zhu J, Peterson DE, et al. The use and interpreta tion of quasi-experimental studies in medical informatics. Journal of the American Medical Informatics Association. 2006;13(1):16-23.
16. DiNardo J. Natural experiments and quasi-natural experiments. Microeconometrics: Springer; 2010. p. 139-53.
17. Richardson JT. Eta squared and partial eta squared as measures of effect size in educational research. Educational Research Review. 2011;6(2):135-47.
18. Cochran WG. Analysis of covariance: its nature and uses. Biometrics. 1957;13(3):261-81. 19. Miller GA, Chapman JP. Misunderstanding analysis of covariance. Journal of abnormal psychology.
2001;110(1):40. 20. Ambelie YA, Alene GD, Gebrekiros DH. Effect of integrated health system leading-managing-and-
governing for results model on institutional delivery: Team-based quasi-experiment. bioRxiv. 2019:775858.
21. Johnson RL. CEO must have authority to coordinate governance, management, medical staff. Hospital progress. 1984;65(4):49-53.
22. Levey S, Vaughn T, Koepke M, Moore D, Lehrman W, Sinha S. Hospital leadership and quality improve ment: rhetoric versus reality. Journal of Patient Safety. 2007;3(1):9-15.
23. Bayou B, Hailu T, Jenberie A, Minalu Y, Tesfamichael T. Transforming primary health care unit service delivery through leadership, management and governance (LMG) training: A field action report from Ethiopia. The Ethiopian Journal of Health Development (EJHD). 2020;34(2).
24. Rajkumar AS, Swaroop V. Public spending and outcomes: Does governance matter? Journal of develop ment economics. 2008;86(1):96-111.
25. Delavallade C. Corruption and distribution of public spending in developing countries. Journal of eco nomics and finance. 2006;30(2):222-39.
26. Ambelie Y, Alene G, Gebrekiros D. Modeling a reliable and valid framework for building and measuring the health system workforce’s competence to lead, manage and govern in Ethiopia: Factor analysis ap proach. 2020.
351
HT Bello-Ajao, AS Adeyemi, OO Aworinde, KM Owonikoko, AO Olabinjo. Ethiop Med J, 2021, Vol. 59, No. 4 ORIGINAL ARTICLE
ORAL PARACETAMOL VERSUS ORAL DICLOFENAC IN THE CONTROL OF UTERINE CRAMPING PAIN AFTER VAGINAL BIRTH
HT Bello-Ajao FMCOG1, AS Adeyemi FWACS1, OO Aworinde FMCOG, FWACS1*, KM Owonikoko FMCOG,
FWACS1, AO Olabinjo MWACS1
ABSTRACT
Introduction: Uterine cramping pain is a documented morbidity in the immediate postpartum period but there is no protocol for its management. The study aims to compare the effectiveness of multiple doses of oral paracetamol and diclofenac in the control of uterine cramping pain in women that had spontaneous vaginal delivery Methods: It is a randomized controlled study among 291 women that had spontaneous vaginal delivery at LAU-TECH Teaching Hospital Ogbomoso. They were recruited in the labour ward and randomized into Paracetamol, Diclofenac or Placebo groups. Initial pain intensity was assessed followed by administration of the drugs within 1hour of delivery and then 8 hourly until 24 hours. The instrument of survey was a proforma, and data were ana-lyzed using SPSS 22. Primary outcomes were adequacy of pain relief, onset of breastfeeding and maternal satisfac-tion. Secondary outcome was potential maternal side effects of the drugs. Results: The incidence of after-pain was found to be 100% with a large proportion (97.9%) being severe. Respon-dents’ age, gestational age, duration of labour and oxytocin augmentation of labour correlated significantly with severity of pain. Diclofenac was significantly better than paracetamol which in turn was better than placebo in relieving the pain, mean SPID- 8.71 (SD-1.17; CI-8.48-8.95), 6.78 (SD-2.25; CI-6.33-7.24) and 1.54(SD-1.35, CI-1.26-1.31), F-487.31; p< 0.001 for diclofenac, paracetamol and placebo, respectively. Side effects were seen only in diclofenac group. Conclusion: Multiple doses of oral Diclofenac and Paracetamol were effective in relieving uterine cramping after-pain although pain relief was more with diclofenac. Key words: uterine cramp, after-pain, postpartum analgesia, Diclofenac and Paracetamol
INTRODUCTION
Child birth is known to be a pain-associated event which gives considerable physical and psychological distress to the parturient and her care giver and if im-properly managed could jeopardise the woman’s re-productive career. (1-3) Apart from the pain experi-enced during labour and delivery, new mothers may experience pain following child birth from incision of caesarean delivery, perineal lacerations including epi-siotomy, the nipple while breastfeeding and uterine contractions associated with uterine involution. (3,4)
Shift of attention from the mother to her newborn makes the management of after birth pains to be less researched unlike the management of labour pains. (5, 6) A significant event of the puerperium is uterine invo-lution which is the physiological process by which the uterus returns to the pre-pregnancy state after delivery through cytoplasmic autolysis aided by uterine con-traction.
(6, 7) This uterine contraction is what is perceived as uterine cramping after pain and has been found to be more in multipara than primipara. (2,7,8) Al-though this pain is subjective and can be confusing to new mothers, it has invariably been described as being similar to menstrual pain, felt in the lower abdomen and back with severity likened to that of labour pain. (7,8) This pain has been described as being severe enough to require the most potent anal-gesia.(7-9,10,11) The justification for this study is based on the fact that uterine cramping pain can impair successful breastfeeding, the mother’s ability to care for her newborn and the establishment of good-quality mother-baby interaction. (11-13) it can also result in maternal neuro-hormonal stress responses, sleep and emotional disorders, anxiety, depression and mother’s inability to perform her daily routine. (3,12,14,15) Hence, the goals of safe motherhood cannot be achieved without effective management of after-pain from uterine cramps. (16,17)
1 Department of Obstetrics and Gynaecology, LAUTECH Teaching Hospital, Ogbomoso, Nigeria *Corresponding author’s email address: [email protected]; https://orcid.org/0000-0003-0771-616X

352
The study aimed to determine the incidence, pattern and determinants of after pain and to compare the efficacy of multiple doses of oral paracetamol 1000mg, diclofenac potassium 50mg and that of pla-cebo in relieving it.
MATERIALS AND METHODS
It was a randomized controlled study among consent-ing women that had spontaneous vaginal delivery in the labour ward of LAUTECH Teaching Hospital Ogbomoso, South-Western Nigeria. Exclusion criteria were women that had postpartum haemorrhage, women on drugs with known or possible analgesic or anxiolytic effects including women who had epidural analgesia in labour, women with history of peptic ul-cer disease or bleeding disorders, significant renal or liver impairment, preeclampsia, asthma, women with intrauterine fetal death or stillbirth and women on anticoagulants. Approval was obtained from the ethical committee of the hospital with protocol number LTH/OGB/EC/2016/118. Consenting participants were random-ized into intervention (diclofenac or paracetamol) or control (placebo) groups using simple random sam-pling. The interventional group was either diclofenac potassium tablets (Cataflam® by Novartis pharmaceu-ticals) administered at the dose of 50mg 8hourly or paracetamol tablets (Easadol® by May & Baker phar-maceuticals) administered at the dose of 1000mg 8hourly. The control group had placebo administered in two tablets 8 hourly. Sample size for the study was 291 (n=97 in each group) calculated using formula for multiple arm ran-domized control trial for continuous variable.(18) The social class of the patients was determined by the pa-tient’s level of education and her husband’s occupa-tion using Olusanya and co-workers classification system. (19) The mean Summed Pain Intensity Difference em-ployed was obtained from a pilot study assuming ef-fect size of 0.54, power of 90% at 95% confidence level and attrition rate of 10%. Women attending ante-natal clinic were informed about the study but recruit-ment was done when they presented in labour. The management of labour, delivery and postpartum pe-riod was done according to the departmental protocol. This included active management of labour, partho-graphic monitoring of labour and administration of intramuscular pethidine 100mg 4hourly until cervical dilatation was 6cm.
Immediately after vaginal delivery, (within 1 hour of initiating breastfeeding or within 1hour post-delivery, for parturients that could not breastfeed), all the women that met the inclusion criteria were counselled and written consent was obtained fol-lowed by baseline pain evaluation and then ran-domisation into the study groups. The chosen drug was then administered. Thus Easadol® 1000mg or Cataflam® 50mg or Placebo was administered orally, after food, to the assigned group. Subse-quently, at 8th, 16th and 24thhour or at discharge, whichever came first, administration of drug was repeated and other aspects of the proforma were appropriately administered. The study was discon-tinued in any respondent who developed known side effects associated with any of the drugs. Any par-ticipant that expressed uncontrolled pain in between the stipulated hours of drug administration was given tramadol tablet 50mg, per oris, statim for the break through pain. The baseline pain intensity within 1 hour post-delivery and at each of 8th, 16th and 24th hour was assessed using 11-point numeric pain intensity scale with zero indicating no pain and 10 the worst pain. For the extent of pain relief, the difference between two consecutive pain intensity measurements was calculated. The resultant pain intensity difference at each time was summed to give one numerical value, the Summed Pain Intensity Difference (SPID), for each subject. The higher the SPID the greater is the pain relief. Maternal satisfaction about pain relief was also assessed using Pain Relief Satisfaction Scale.
Primary outcomes were adequacy of pain relief, onset of breastfeeding and maternal satisfaction. Secondary outcome was potential side effects of the study drugs.
IBM SPSS version 22(20) was used for data entry and analysis. To determine significance, chi square test was used for categorical variables while ANOVA test was used when comparing difference in more than two means. Post Hoc test was per-formed to confirm any difference that occurred be-tween two groups whenever ANOVA test showed overall statistical difference in the group means. Correlation analysis (Spearman rho and Pearson) were used to test relationships. Logistic regression analysis was also performed to check the effect of the need for additional analgesia among the groups. Level of significance was set at p value ≤0.05.

353
RESULTS The study was carried out between 25th July 2017 and 12th May 2018. Table 1 depicts the baseline profile of the participants.
The participants were evenly distributed across the study groups as the observed difference in the distri-bution was not statistically significant.
Table 1: Characteristics of participants
Variables Study Group Total N(%)
Test statistics p-value
Diclofenac n(%)
Paracetamol n(%)
Placebo n(%)
Age (in years) <25 25 – 29 30 – 34 35 – 39 40 and above Total Mean Age ±SD
20 (34.5) 23 (34.8) 23 (27.1) 24 (43.6) 7 (25.9) 97 30.43±6.4
19 (32.8) 20 (30.3) 32 (37.6) 13 (23.6) 13 (48.1) 97 30.92±6.6
19 (32.8) 23 (34.8) 30 (35.8) 18 (32.7) 7 (25.9) 97 30.20±6.4
58(100) 66(100) 85(100) 55(100) 27(100) 291 30.51±6.4
χ 2=7.859 F= 0.322
0.447 0.725
Religion Christians Muslims Others Total
52 (28.7) 45 (41.3) 0 (0.0) 97
62 (34.3) 35 (32.1) 0 (0.0) 97
67 (37.0) 29 (26.6) 1 (100.0) 97
181(100) 109(100) 1(100) 291
χ 2= 7.293 0.065
Ethnicity Hausa Igbo Yoruba Others Total
4 (26.7) 10 (41.7) 74(31.9) 9 (42.1) 97
5 (33.3) 8 (33.3) 78(33.6) 6 (31.6) 97
6 (40.0) 6 (25.0) 80 (34.5) 5(26.3) 97
15(100) 24(100) 232(100) 20(100) 291
χ 2=4.259 0.802
Marital Status Single Married Total
5 (50.0) 92 (32.7) 97
2 (20.0) 95 (33.8) 97
3 (30.0) 94 (33.5) 97
10(100) 281(100) 291
χ 2= 1.373 0.616
Socio-economic class High Middle Low Total
0 (0) 97 (33.3) 0 (0) 97
0 (0) 97 (33.3) 0 (0) 97
0 (0) 97 (33.3) 0 (0) 97
0(0) 291(100) 0(0) 291
Parity Primiparous Multiparous Grand multiparous Total
23 (41.8) 66 (30.7) 8 (38.1) 97
15 (27.3) 73 (34.0) 9 (42.9) 97
17 (30.9) 76 (35.3) 4 (19.0) 97
55(100) 215(100) 21(100) 291
χ 2= 4.626 0.328
Gestation age at deliv-ery Preterm Term Total
9 (50) 88 (32.2) 97
6 (33.3) 91 (33.3) 97
3 (16.7) 94 (34.4) 97
18(100) 273(100) 291
χ 2=3.141 0.222
Types of Gestation Single Multiple Total
94 (33.5) 3 (30.0) 97
91 (32.4) 6 (60.0) 97
96 (34.2) 1 (10.0) 97
281(100) 10(100) 291
χ 2 =3.655 0.169
Duration of Labour ≤8hours >8hours Total
22 (73.3) 75 (28.7) 97
4 (13.3) 93 (35.6) 97
4 (13.3) 93 (35.6) 97
30(100) 261(100) 291
χ 2=24.08 <0.001
Augumentation of La-bour Yes No Total Commenced Breast-feeding within 1 hour of delivery Yes No Total Reason for not com-mencing BF Baby is in SCBU Baseline Pain Intensity Mean ±SD
38 (45.8) 59 (28.4) 97 86 (31.9) 11 (52.4) 97 11 (52.4) 8.77± 1.19
22 (26.5) 75 (36.1) 97 92 (34.1) 5 (23.8) 97 5 (23.8) 8.91± 1.00
23 (27.7) 74 (35.6) 97 92 (34.1) 5 (23.8) 97 5 (23.8) 8.78± 0.97
83(100) 208(100) 291 270(100) 21(100) 291 21(100) 8.82±1.06
χ 2=8.125 χ 2=3.695 F 0.480
0.020 0.207 0.619

354
A total of 291 women who gave informed consent were enrolled for the study and randomised equally into intervention groups; diclofenac (n – 97), placebo (n – 97) and control (placebo) group (n – 97).
Table 2: Incidence and pattern of after pain intensity among the study participants
All participants completed the study and were ana-lysed. Table 2 shows the incidence and pattern of uterine cramping after pain among the participants. The incidence of uterine cramping after pain was 100%. No respondent reported no or mild pain intensity. Most (97.9%) of the respondents reported severe pain while only 2.1% reported moderate pain inten-sity.
Pain Intensity Frequency Percentage
No pain 0 0.0 Mild pain 0 0.0 Moderate pain 6 2.1 Severe pain 285 97.9
Table 3: Factors affecting severity of pain among the respondents
Factors Pain Severity Total χ 2 p-values Moderate Severe n (%) n %
Marital Status Married Single Number of gestation Single Multiple Augumentation Yes No Religion Islam Christianity Others
5 1.8 1 10.0 6 2.1 0 0.0 4 4.8 2 1.0 2 1.8 4 2.2 0 0
276 98.2 9 90.0 275 97.9 10 100.0 79 95.2 206 99.0 107 98.2 177 97.8 1 100
281(100) 10(100) 281(100) 10(100) 83(100) 208(100) 109(100) 181(100) 1(100)
3.232 0.218 4.372 0.069
0.072 0.641 0.037 0.966
Pain intensity
Pearson Correlation Coefficient (r) p-value Age Parity Gestational age Duration of labour (in minutes)
0.225 0.083 0.177 0.190
<0.001 0.158 0.002 0.001
Table 3 shows the relationship between the respondents’ socio-demographic profile and severity of pain. Oxytocin augmentation of labour, respondents’ age, gestational age and duration of labour were positively correlated with the pain intensity.

355
Table 4: Efficacy of Analgesic on After Pain Relief: using SPID, maternal satisfaction, need for additional analgesia and maternal side effects
Mean SD 95% Confidence
Interval for Mean Min Max F p-value
Lower Bound
Upper Bound
Maternal satisfaction
Diclofenac
9.51
1.12
9.28
9.73
2.00
10.00
515.18
<0.001
Paracetamol 6.87 2.46 6.37 7.36 .00 10.00 Placebo 1.60 1.35 1.33 1.87 .00 8.00 Total 5.99 3.72 5.56 6.42 .00 10.00
Summed Pain Intensity Difference
Diclofenac
8.71
1.17
8.48
8.95
6.00
10.00
487.32
<0.001
Paracetamol 6.78 2.25 6.33 7.24 .00 10.00 Placebo 1.54 1.35 1.26 1.81 .00 8.00 Total 5.68 3.46 5.28 6.08 .00 10.00
Need for additional analgesia/maternal side effects Variables Study Group Test statistics p
value Diclofenac n (%)
Paracetamol n (%)
Placebo n (%)
Need for additional analgesia Yes No Total
3 (2.8) 94 (50.8) 97
19 (17.9) 78 (42.2) 97
84 (78.2) 13 (7.0) 97
X2= 163.86
<0.001
Reason for additional analgesia Abdominal pain Uterine Contraction pain
1 (100) 2 (1.92)
0 (0.0) 16 (15.38)
0 (0.0) 86 (82.70)
X2= 204.18
<0.001
Side effect* Dyspepsia Epigastric pain Others
2 (100) 6 (100)
0 (0.0) 0 (0.0)
0 (0.0) 0 (0.0)
X2=2.65 X2=9.47
0.331 0.004
Post Hoc test of Maternal Satisfaction and SPID Dependent Variable (I) identifica-
tion (J) identification Mean Difference
(I-J) Sig. 95% Confidence Interval
Lower Bound Upper Bound
Maternal satisfaction
Diclofenac Paracetamol 2.63918* <0.001 2.0482 3.2301 Placebo 7.90722* <0.001 7.3163 8.4982
Paracetamol Diclofenac -2.63918* <0.001 -3.2301 -2.0482 Placebo 5.26804* <0.001 4.6771 5.8590
Placebo Diclofenac -7.90722* <0.001 -8.4982 -7.3163 Paracetamol -5.26804* <0.001 -5.8590 -4.6771
Summed Pain Intensity Difference
Diclofenac Paracetamol 1.92784* <0.001 1.3674 2.4883 Placebo 7.17526* <0.001 6.6148 7.7357
Paracetamol Diclofenac -1.92784* <0.001 -2.4883 -1.3674 Placebo 5.24742* <0.001 4.6870 5.8079
Placebo Diclofenac -7.17526* <0.001 -7.7357 -6.6148 Paracetamol -5.24742* <0.001 -5.8079 -4.6870
Table 4, the mean SPID was most in diclofenac group: 8.71 [SD-1.17; 95% CI- 8.48-8.95] and least in pla-cebo group: 1.54 [SD-1.35; CI-1.26-1.81].
The test of association was significant (F-487.31; p-<0.001) in all the groups.

356
DISCUSSION
The participants were evenly distributed across the study groups. The mean age of the respondents was 30.6 ± 6.5years which is similar to the mean age (30.4 ± 4.8years) of the women in Imarengiaye and co-workers’ study. (10) This could be due to similar geo-graphical location, Nigeria. However, this mean age is higher than the mean age (27.9 ± 4.2 years) obtained by Mahin and co –workers in Iran.21 This could be due to lower age of marriage among Arab women. (21) Yoruba ethnic group constituted majority (80%) of the study population, this is because of the geographical location of the study setting, Ogbomoso south-western Nigeria, which is a Yoruba land. Although all the women in this study belonged to the middle socioeco-nomic class, majority of them (57%) had tertiary level of education, 30% of them had secondary level of edu-cation and only 13% of them had primary level or no formal education. This is similar to the finding of Olayemi and co-workers which showed that the Yoruba ethnic group has high educational status. (22)
The incidence of uterine cramping after-pain was 100%, similar to the finding of Holdcroft and co-workers in which 96% of the respondents reported after- pain. (11) Also, Imarengiaye and co-workers found a large percentage (82.8%) of their respondents reporting after-pain. (10) In the present study, the mean baseline pain intensity was 8.82 [SD- 1.06; 95% CI-8.69-8.94; F-0.480; p-0.619] which is similar to the baseline pain intensity obtained in the pilot study, 8.24. This could be due to similar geographical region and hence, similar population study. In this study, a larger proportion (97.9%) reported severe pain, while only 2.1% reported mild pain, and no respondent reported mild or no pain. This could be because majority of the study population were of high educational status in similarity to the find-ing of other studies in which high educational status was shown to correlate positively with increased west-ernization and hence increased perception and desire for pain relief.(22,23) This is also similar to Thompson and co-workers’ finding of larger proportion (52.1%) of their respondents reporting severe pain. (24) How-ever, Declercq and co-workers found more respondents (50-80%) reporting moderate pain and less (10-18%) reporting severe pain; this could be due to difference in the study population as the participants were mostly of low parity and the study was limited to women who gave birth to single baby and could participate in Eng-lish. (25) In this study, correlation analysis shows that increasing parity correlated positively with pain intensity which agrees to the findings of Holdcroft and Eshkevari, De-clerq and co-workers in which parity correlated posi-tively with severity of pain intensity. (11,25,26).
Moreover, respondents’ age, gestational age, dura-tion of labour and oxytocin augmentation of labour were found to correlate significantly with severity of pain intensity. This is similar to previous docu-mentations in literature that longer duration of la-bour and delivery cause more stress and fatigue for mothers and this correlated positively with need for additional narcotics after delivery. (11-13) However, Taffazoli and co-workers found no sig-nificant association between socioeconomic factor, oxytocin augmentation, duration of labour and severity of after-pain. This could be due to differ-ence in sampling method and study population. (21) Taffazoli and co-workers used convenience sampling and the study group was composed, mainly, of younger age group and housewives. Also, breastfeeding was an exclusion criterion. In this study, test of significance could not be applied to socioeconomic class as all the respondents were of middle class; this could be due to the study set-ting (tertiary health facility). In this study, analysis of post intervention pain intensity, using ANOVA, showed significance in the three groups at each of 8th, 16th and 24th hour post-delivery (p = 0.000). Post Hoc analysis of these variables revealed that placebo and paraceta-mol groups were responsible for the difference in pain intensities. Placebo group had higher pain intensity than paracetamol group, the pain intensity of which in turn was more than that of diclofenac group. This is similar to the finding of Skovlund and co-workers, (27) in which placebo group had higher pain intensity compared to paracetamol group at 2 hour post intervention. Moreover, ANOVA showed statistical significance in pain relief evaluation among the three study groups. The Post Hoc analysis revealed that the signifi-cance was in the diclofenac and paracetamol group (p<0.001). Diclofenac was significantly better than paracetamol which in turn was better than placebo in relieving uterine cramping after-pain. This is similar to the conclusion in the study by Huang et al and the Cochrane review which stated that NSAIDS were significantly better than placebo in the control of uterine cramping after pain.(28,29) It is also similar to Skovlund and co-workers’ find-ing of oral paracetamol 1000mg being significantly better than placebo in the control of uterine involu-tion pain. (27) Majority (92.7%) of the respondents in this study commenced breastfeeding within one hour of de-livery, while only 7.3% did not.
357
The reason reported for not commencing breastfeed-ing was that baby was admitted into the special care baby unit. Uterine cramping after pain was not asso-ciated with breastfeeding in this study, unlike the finding in a survey of childbearing experiences in USA in which 71% of the women reported difficulty in breastfeeding mainly due to uterine cramping pain. This could be because the latter study was an obser-vational study which enabled unmodified assessment of the effect of breastfeeding on uterine cramping after-pain.(17) Side effects were significantly higher in diclofenac when compared to the paracetamol and placebo groups but similar in paracetamol and placebo groups. The side effect was mainly epigastric pain which was ameliorated with the administration of antacid. None of the respondents with side effects expressed concern to necessitate the need to discon-tinue the study on account of the side effects.
This is in keeping with the conclusion of the Coch-rane review in which paracetamol 1000mg had simi-lar maternal side effects as placebo. (29)
Conclusion Multiple doses of either oral Diclofenac or oral Paracetamol were effective in significantly relieving uterine cramping after-pain, although more with di-clofenac at the risk of more maternal side effect com-pared to paracetamol or placebo. Conflict of interest: All authors declare that they have no competing interests.
ACKNOWLEDGEMENT
We hereby acknowledge the contributions of the staff of department of Obstetrics and Gynaecology, LAU-TECH Teaching Hospital, Ogbomoso.
REFERENCES 1. Pirdel M, Pirdel L. Perceived environmental stressors and pain perception during labor among primiparous
and multiparous women.J Reprod Infertil. 2009;10:217-23. 2. Fawole AO, Adesina OA. Complaints in the puerperium. In: Ebeigbe PN. editor. Foundations of clinical ob-
stetrics in the tropics.Benin: Fodah Global Ultimate Limited; 2012. p. 232-6. 3. Onasoga OA, Opiah MM, Osaji TA, Iwolisi A. Perceived effects of midwives attitude towards women in la-
bour in Bayelsa State, Nigeria. Arch. Appl. Sci. Res. 2012;4:960-4. 4. James J, Prakash K, Ponniah M. Awareness and attitudes towards labour pain and labour pain relief of urban
women attending a private antenatal clinic in Chennai, India. Indian J Anesth. 2012;56:195. 5. Al-hakim NH, Alidreesi ZM. The effect of local anaesthetic wound infiltration on postoperative pain after
caesarean section. J Surg Pakistan. 2010;15:131-4. 6. Ebirim LN, Buowari OY, Ghosh S, editors. Physical and psychological aspects of pain in obstetrics. [Internet].
INTECH: Open Access Publisher; 2012 [cited 2016 April 26]. Available from: http://www.intechopen.com./…/pain.
7. Anne EM. The effect of pain and its management on mother and foetus. Clin Obstet Gynaecol. 1998;12:423. 8. Jacob A. A comprehensive textbook of midwifery. 3rded. New Delhi: Jaypee Brothers Publications; 2012.
p.208-16. 9. Iliadou M. Labour pain and pharmacological pain relief practice points. Health Sci J. 2009;3:197-201. 10. Imarengiaye CO, Akhideno I, Omoifo EC. Characteristics of postpartum pain associated with vaginal and cae-
sarean births. West Afr J Med. 2013;33:3-6. 11. Holdcroft A, Snidvongs S, Cason A, Doré CJ, Berkley KJ. Pain and uterine contractions during breast feeding
in the immediate post-partum period increase with parity. J Pain. 2003;104:589-96. 12. McKinney ES, James SR. Maternal child health nursing. 3rd ed. London: Elsevier Publishers; 2009. p.474-95. 13. Sleep J. Perineal care: A series of five randomised controlled trials. In: Robinson S. Thompson A, editors.
Midwives, Research and Childbirth. London: Chapman and Hall; 1991. p.199-251. 14. Loubert C, Hinova A, Fernando R. Update on modern neuraxial analgesia in labour: a review of the literature
of the last 5 years. Br J Anaesth. 2011;66:191-212. 15. Audu B, Yahaya U, Bukar M, El-Nafaty A, Abdullahi H, Kyari O. Desire for pain relief in labour in North-
eastern Nigeria. J Public Health Epid. 2009;1:053-7. 16. Bloomfield SS, Mitchell J, Cissell G, Barden TP. Analgesic sensitivity of two post-partum pain models. J
Pain. 1986;27:171-9.

358
17. Windle ML, Booker LA, Rayburn WF. Postpartum pain after vaginal delivery. A review of comparative analgesic trials. J Reprod Med. 1989;34:891-5. 18. Chow S, Shao J, Wang H. Sample Size Calculations in Clinical Research. In: CRC Biostatistics Series. London: Chapman & Hall; 2008. p. 58. 19. Olusanya O, Okpere E, Ezinmokhai M. The importance of social class in voluntary fertility control in a developing country. West Afr J Med 1985; 4:205-212. 20. IBM Corp. IBM SPSS statistics for windows, version 22.0. Armonk, NY: IBM Corp;2013. 21. Taffazoli M, Khadem Ahmadabadi M. Assessment of factors affecting afterpain in multiparous women delivered in Mashhad 17-Shahrivar Hospital, Mashhad, Iran. J midwifery reproductive health. 2013;2:60- 5. 22. Olayemi O, Aimakhu CO, Akinyemi OA. The influence of westernisation on pain perception in labour among parturients at the University College Hospital, Ibadan. J Obstet Gynaecol. 2006; 26: 329–31. 23. Faponle AF, Kuti O. Perception of labour pain by pregnant women in Southwestern Nigeria. Trop. J. Ob stet. Gynaecol. 2004; 21:153-5. 24. Thompson JF, Roberts CL, Currie M, Ellwood DA. Prevalence and persistence of health problems after childbirth: associations with parity and method of birth. Birth. 2002;29:83-94. 25. Declercq ER, Sakala C, Corry MP, Applebaum S, Herrlich A. Major Survey Findings of Listening to Mothers III: New Mothers Speak Out. J Perinat Educ. 2014;23:17. 26. Eshkevari L, Trout KK, Damore J. Management of postpartum pain. J Midwifery Womens Health. 2013;58:622-31. 27. Skovlund E, Fyllingen G, Landre H, Nesheim BI. Comparison of postpartum pain treatments using a se quential trial design. I. Paracetamol versus placebo. Eur J Clin Pharmacol. 1991;40:343-7. 28. Huang YC, Tsai SK, Huang CH, Wang MH, Lin PL, Chen LK, et al. Intravenous tenoxicam reduces uter ine cramps after Cesarean delivery. Can J Anesth.2002;49:384-7. 29. Deussen AR, Ashwood P, Martis R. Analgesia for relief of pain due to uterine cramping/involution af ter birth. The Cochrane Library. 2011.

359
Tigist Hailu, Bekureledet M.Dingle, Nicole Bodo, Tegbar Yigzaw, Workeabeba Abebe, Tigist Mekonnen, Enaw-gaw Mehari, Kassa Darge. Ethiop Med J, 2021, Vol. 59, No. 4
BRIEF COMMUNICATIONS
BUILDING A COVID-19 REPOSITORY WEBSITE FOR HEALTHCARE PROFESSIONALS IN ETHIOPIA
Tigist Hailu, MPH1,5, Bekureledet M.Dingle, BSc2, Nicole Bodo, BA1, Tegbar Yigzaw, MD, MPH, PhD2, Workea-beba Abebe, MD, MPH3, Tigist Mekonnen, MPH2, Enawgaw Mehari, MD4, Kassa Darge, MD, PhD1,5
ABSTRACT Health professionals dealing with the COVID-19, both in clinical care and in the public health domain, require up-to-date and relevant scientific information. The Diaspora and Ethiopian Advisory Councils on the COVID-19 pandemic in Ethiopia joined forces with the Ethiopian Medical Association to create a local repository of compre-hensive peer-screened information on COVID-19. We describe the motivating factors for such a repository, the process of creating the website, and the utilization of this information resource for Ethiopian healthcare profes-sionals.
INTRODUCTION
The international medical community has had mini-mal experience with the fast-evolving COVID-19 pan-demic (1). For medical professionals in low-resource countries such as Ethiopia, the learning curve is even steeper due to the lack of an authoritative, comprehen-sive COVID-19 information resource specifically tar-geted for the country. In response to this deficit, the Children’s Hospital of Philadelphia (CHOP) Depart-ment of Radiology’s Global Radiology Outreach and Education team collaborated with the Ethiopian Dias-pora High-Level Advisory Council on the COVID-19 Pandemic in Ethiopia, the Ethiopian Health Profes-sionals Advisory Council on the COVID-19 Pandemic in Ethiopia, People to People (P2P), and the Ethiopian Medical Association (EMA) to establish a comprehen-sive COVID-19 medical information website (2). Ethiopian healthcare professionals can access and navigate this repository to find up-to-date COVID-19 resources that will inform clinical and public health practices. Each publication, guideline, or webinar on the website is peer-screened to ensure its relevance for medical and public health practice in the country. The project was initiated in April 2020 and the webpage was launched on June 19, 2020. In this paper, we de-scribe the background for initiating this project, the process of creating it, and the outcome of our effort. Lack of a local comprehensive COVID-19 informa-tion resource for Ethiopian healthcare profession-als : The volume of information on COVID-19 on the internet is staggering (3, 4, 5). In a Google search on April 19, 2020, the term “COVID-19” generated 2.3 billion entries (6).
In comparison, the word “Ebola” garnered only 59.9 million entries (6). On the same day, the central resource for scientific medical publications, Pub-Med, showed 5,279 publications on COVID-19 since January 2020, i.e., published within fewer than 4 months (7). In contrast, on PubMed there are only 9,045 publications on Ebola spanning the past 43 years. These numbers illustrate how daunting it can be for busy healthcare professionals to navigate through the myriad of scientific and non-scientific information on COVID-19. In a matter of weeks, the COVID-19 pandemic be-came a worldwide crisis (8). The dearth of knowl-edge has spurred a flurry of research activities lead-ing to publications in unprecedented numbers and at a breakneck pace (9). For the first time, publications are bypassing formal online or print processes and being circulated in early formats in order to acceler-ate the sharing of new scientific information (10). Furthermore, most journals have made COVID-19 publications available as free downloads. In addi-tion to the scientific publications, epidemiological reports from a multitude of sources are appearing in real time (11). Healthcare institutions and govern-ment agencies are quickly generating COVID-19 guidelines and recommendations, which are fre-quently revised as our understanding of the virus develops. In Ethiopia there was no authoritative local resource of comprehensive information on COVID-19 that had been designed specifically to support healthcare professionals. In the early months of the pandemic, as medical knowledge about the new virus rapidly evolved, it was imperative to provide a central, well-organized,
1Children’s Hospital of Philadelphia, Philadelphia, PA, USA. 2Ethiopian Medical Association (EMA), Addis Ababa, Ethiopia. 3Department of Pediatrics and Child Health, Tikur Anbessa Specialized Hospital, College of Health Sciences, Addis Ababa University, Addis Ababa, Ethiopia. 4People2People, Washington, DC, USA. 5Perelman School of Medicine, University of Pennsylvania, Philadelphia, PA, USA. *Corresponding Author E-mail: [email protected]

360
easily accessible source of information with peer-selected clinical, research, and educational materials that would support Ethiopian healthcare professionals in combatting the spread of COVID-19. The Ethiopian Ministry of Health (MOH) was providing information primarily targeted to the public. On accessing its web-site on April 19, 2020, we found 19 posters, 2 bro-chures, 2 videos, 2 documents, and 3 online courses that required login access (12). Only the latter two resources were meant for healthcare professionals. Similarly, EMA had on the front page of its website some information about “Do’s and Don’ts regarding COVID-19” and a resource tab with a COVID-19 page. On April 19, 2020, this page contained 19 COVID-19 protocols, which were mostly local resources (13). EMA and the Diaspora COVID-19 Advisory Councils collaborated to address the discrepancy between the abundance of COVID-19 information worldwide and what was easily accessible to Ethiopian healthcare professionals. In response, we developed an organ-ized, comprehensive medical information resource targeting healthcare professionals. The development of the COVID-19 repository website: The development of the website was a col-laboration between CHOP’s Department of Radiol-ogy’s Global Radiology Outreach and Education team and EMA. The repository lives on the main website (www.ethiopianmedicalass.org) of EMA (Figure 1). This publicly accessible site serves as a local and cen-tralized resource center with a repository for compre-hensive and peer-screened information on COVID-19 which is available as full pdf files or videos. It also houses COVID-19 oriented diagnostic and treatment protocols selected for local healthcare professionals. Other professional societies and agencies, including those of all ancillary health services, are encouraged to establish links on their websites that would direct users to this central EMA COVID-19 repository. The first task in developing the repository was to des-ignate a coordinator. The person in this role communi-cated with peer screeners, facilitated selection of documents, and sent documents to the EMA webmas-ter. A webmaster was necessary to create and maintain the webpage, organize documents into pre-determined categories, and provide webpage access data. In order to ensure that the repository did not become an indis-criminate “dumping place” of COVID-19 information, 49 medical specialists and sub-specialists served as peer-screeners to share publications they deemed im-portant for their specialty and to review the documents in their category for suitability.
Most relevant subspecialties related to COVID-19 were represented from both the clinical and public health aspects. Included in the clinical subspecial-ties were the following: Anesthesiology, Cardiol-ogy, Emergency Medicine, Hematology, Intensive Care Medicine, Internal Medicine, Neurology, Ob-stetrics, Palliative Medicine, Pulmonology, Pathol-ogy, Pediatrics, Radiology, Primary Health Care/Family Medicine, Surgery, and Treatment. The pub-lic health sector encompassed Epidemiology, Infec-tion Prevention & Control, Mental Health, Model-ling, Pharmaceuticals, Personal Protective Equip-ment, Testing, and Vaccination. Nursing was incor-porated as well. The peer screeners were from Ethiopia (28) and the diaspora (21). Most of the peer screeners from Ethiopia and the diaspora were paired in their respective subspecialties to ensure a smooth transition when the website is eventually taken over by EMA. The management of the COVID-19 repository website: Management of the website includes the following components: the coordinator contacts peer-screeners bi-weekly for any publications needed to be uploaded to the webpage, requests peer screeners to review entries in their designated cate-gory, searches for new scientific literature, and sends new publications to the webmaster to upload to the site. The coordinator ensures documents are saved using a uniform naming system and keeps track of submitted documents. The website contains a wide range of clinical con-tent under the most important subspecialties regard-ing COVID-19, encompassing important public health sub-categories, nursing, and a section for recorded webinars on various clinical and public health topics. It also provides clearly visible sec-tions for guidelines and recommendations from the Ethiopian Diaspora and Local High-Level Advisory Council on the COVID-19 Pandemic in Ethiopia, the MOH, and the World Health Organization (WHO) COVID-19 websites. The repository website was not meant to replace PubMed or other similar resources. Instead, the unique offerings of this website are the disease fo-cus, the fact that the documents have been peer-screened and are relevant specifically for clinical care and public health practice in Ethiopia, that its PDFs are directly available for fast resource download, and its easy webpage navigation and search function. Finally, a key feature is that this is a locally maintained website easily accessible to Ethiopian healthcare professionals.
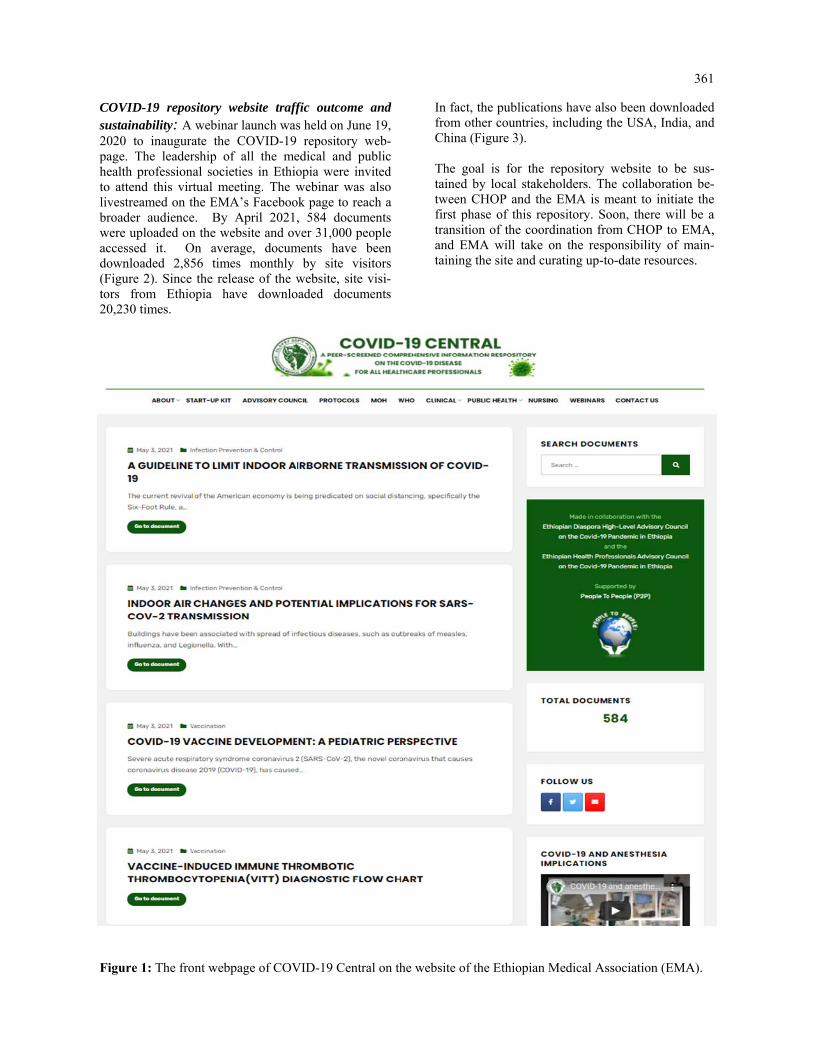
361
COVID-19 repository website traffic outcome and sustainability: A webinar launch was held on June 19, 2020 to inaugurate the COVID-19 repository web-page. The leadership of all the medical and public health professional societies in Ethiopia were invited to attend this virtual meeting. The webinar was also livestreamed on the EMA’s Facebook page to reach a broader audience. By April 2021, 584 documents were uploaded on the website and over 31,000 people accessed it. On average, documents have been downloaded 2,856 times monthly by site visitors (Figure 2). Since the release of the website, site visi-tors from Ethiopia have downloaded documents 20,230 times.
In fact, the publications have also been downloaded from other countries, including the USA, India, and China (Figure 3). The goal is for the repository website to be sus-tained by local stakeholders. The collaboration be-tween CHOP and the EMA is meant to initiate the first phase of this repository. Soon, there will be a transition of the coordination from CHOP to EMA, and EMA will take on the responsibility of main-taining the site and curating up-to-date resources.
Figure 1: The front webpage of COVID-19 Central on the website of the Ethiopian Medical Association (EMA).
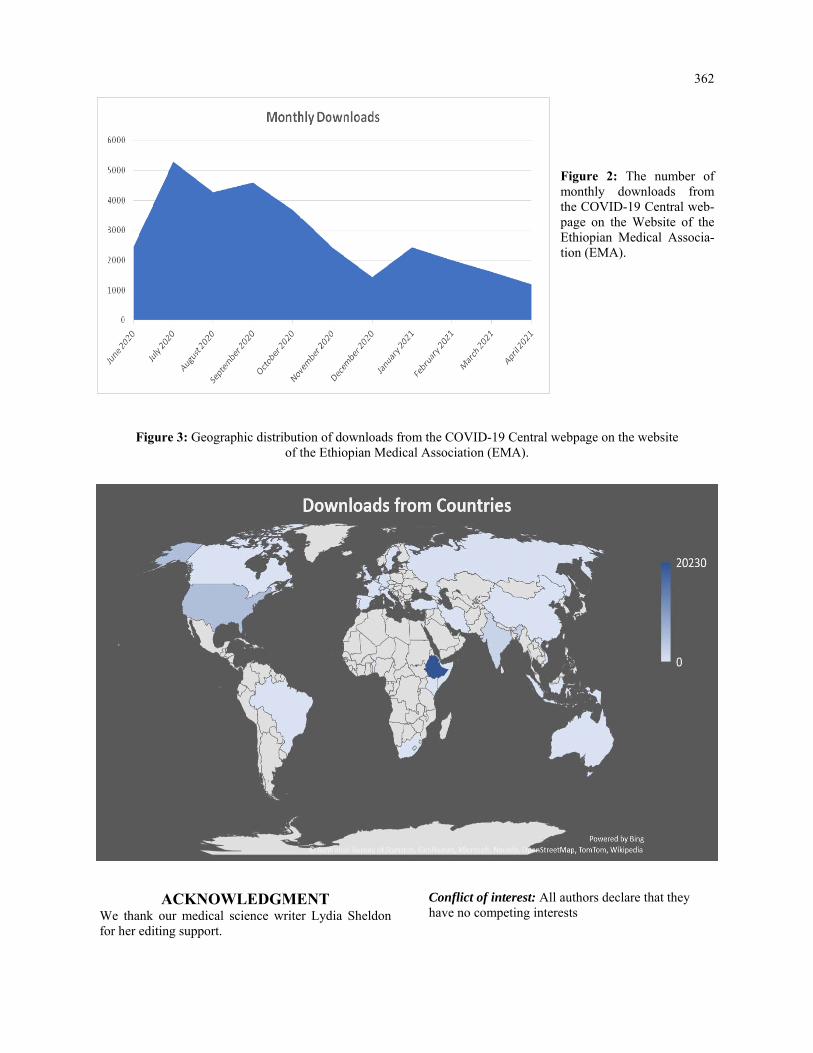
362
Figure 2: The number of monthly downloads from the COVID-19 Central web-page on the Website of the Ethiopian Medical Associa-tion (EMA).
Figure 3: Geographic distribution of downloads from the COVID-19 Central webpage on the website of the Ethiopian Medical Association (EMA).
ACKNOWLEDGMENT We thank our medical science writer Lydia Sheldon for her editing support.
Conflict of interest: All authors declare that they have no competing interests

363
REFERENCES 1. Kupferschmidt K. Preprints bring 'firehose' of outbreak data. Science. 2020 Feb 28;367(6481):963-964.
doi: 10.1126/science.367.6481.963. 2. Ethiopian Medical Association (Internet). (cited 2020 Jun 19). Available from:
www.emacovid19resourcecenter.org. 3. Teixeira da Silva JA, Tsigaris P, Erfanmanesh M. Publishing volumes in major databases related to Covid
-19. Scientometrics. 2020 Aug 28:1-12. doi: 10.1007/s11192-020-03675-3. 4. Chen, Q., Allot, A., & Lu, Z. (2020). Keep up with the latest coronavirus research. Nature, 579(7798),
193. doi: 10.1038/d4158 6-020-00694 -1. 5. Fry, C. V., Cai, X., Zhang, Y., & Wagner, C. S. (2020). Consolidation in a crisis: Patterns of international
collaboration in early COVID-19 research. PLoS ONE, 15(7), e0236307. 6. Google (Internet). (cited 2020 Apr 19). Available from: www.google.com 7. PubMed (Internet). (cited 2020 Apr 19). Available from: www.pubmed.ncbi.nlm.nih.gov 8. Nowakowska J, Sobocińska J, Lewicki M, Lemańska Ż, Rzymski P. When science goes viral: The re
search response during three months of the COVID-19 outbreak. Biomed Pharmacother. 2020 Sep; 129:110451. doi: 10.1016/j.biopha.2020.110451.
9. Else H. How a torrent of COVID science changed research publishing - in seven charts. Nature. 2020 Dec;588(7839):553. doi: 10.1038/d41586-020-03564-y.
10. Aviv-Reuven, S., & Rosenfeld, A. (2020). Publication patterns' changes due to the COVID-19 pandemic: A longitudinal and short-term scientometric analysis. arXiv preprint arXiv:2010.02594.
11. Prieto-Alhambra D, et al. Unraveling COVID-19: a large-scale characterization of 4.5 million COVID-19 cases using CHARYBDIS. Res Sq (Preprint). 2021 Mar 1s44. doi: 10.21203/rs.3.rs-279400/v1.
12. The Ethiopian Ministry of Health (Internet). (cited 2020 Apr 19). Available from: www.moh.gov.et/ejcc/. 13. Ethiopian Medical Association (Internet). (cited 2020 Apr 19). Available from:
www.ethiopianmedicalass.org.

365
Hailemichael Desalegn Mekonnen, Hari Conjeevaram. Ethiop Med J, 2021, Vol. 59, No. 4
CASE REPORT
INABILITY TO SWALLOW TABLETS OFFERS AN OPPORTUNITY FOR DETEC-TION AND SUCCESSFUL TREATMENT FOR A RARE LIFETIME CAUSE OF
DYSPHAGIA
Hailemichael Desalegn Mekonnen, MD, PhD1*, Hari Conjeevaram, MD,2
ABSTRACT
Introduction: This case presents an adult who was diagnosed with viral hepatitis C, and offering treatment for this potentially life-threatening illness provided an opportunity for diagnosis and therapy of a previously unrecognized long-standing cause of dysphagia. Case Presentation: A 37-year-old female was diagnosed to have Hepatitis C virus (HCV) infection. Non-invasive assessment showed that she had moderate fibrosis and was recommended treatment with oral direct-acting antivi-ral (DAA) drugs. However, the patient was hesitant claiming that she had not been able to swallow any tablets for the last 30 years. Prior evaluation for her dysphagia was done with a barium swallow, which was reportedly nor-mal. She was advised to have an upper endoscopy (EGD) evaluation, and it revealed a prominent proximal eso-phageal web. This was that treated endoscopically and resulted in resolution of her long-standing dysphagia. Conclusion: Causes of dysphagia can be obscure and lead to significant compromise in quality of life and inability to take life saving drug treatment. Esophageal webs can present with a long history of dysphagia and due to the proximal nature, could be missed by routine investigations. High index of suspicion is important to persuade for an endoscopy procedure in undiagnosed long-standing cause of dysphagia. Keywords: Esophageal web; Dysphagia; Barium swallow; Upper GI Endoscopy
INTRODUCTION
This is a case of an adult patient with a long history of dysphagia whose diagnosis has been delayed due to a false reassurance by normal barium swallow study. The case was subsequently diagnosed as the patient was persuaded to undergo an upper gastrointestinal endoscopy (EGD) as she was unable to swallow tab-let. The investigation revealed a proximal circumfer-ential esophageal web.
CASE PRESENTATION
A 37-year-old female patient presented to our medical institution with a history of chronic fatigue and weight loss. The weight loss had been longstanding and she claimed that she has been basically consuming liquid diets and has trouble eating solid food including medi-cations, for the last 30 years. The patient and her fam-ily believed the symptoms started since childhood, but the diagnosis was obscured for a long period. During her childhood, she has been evaluated at different cen-ters, but to no avail, and the patients said that she started to ‘live with it’ being dependent on liquid and semisolid diets. General appearance showed a chroni-cally ill-appearing woman with a BMI 0f 18kg/m2.
On routine investigation, she was found to have a positive hepatitis C virus (HCV) antibody and sub-sequently was diagnosed to have ongoing viremia with a viral load of 582, 000 copies/ml. Further in-vestigations revealed that she has HCV genotype 4 infections and an abdominal ultrasound showed no obvious signs of cirrhosis. Other laboratory parame-ters showed hemoglobin of 11 gm/dl: all other labo-ratory evaluations (Liver chemistry tests, renal func-tion tests, electrolytes) were unremarkable. HBsAg and HIV antibody test were negative. Fibroscan (Echosens 402) was done as non-invasive marker of assessing fibrosis severity and it was 9.0 suggesting moderate/severe fibrosis. The patient was advised to undergo an upper GI endoscopy (EGD), which she strongly refused. For this reason, she was investigated with a barium swallow which showed a normal finding. This gave a false reassurance that her condition might be re-lated to a globus sensation or some type of psycho-logical stress. On the other hand, because of con-cern that she has significant hepatic fibrosis, it was recommended to treat with oral direct-acting antivi-ral (DAA) agents for her chronic hepatitis C.
1Department of Internal Medicine, St. Paul’s Hospital Millennium Medical College. 2 University of Michigan. *Corresponding Author - [email protected]

366
The patient, however, was very reluctant and declined therapy repeatedly claiming that she could not swal-low any medication pills. She was finally persuaded to have an upper GI endoscopy with anesthesia support. The endoscope was difficult to pass down beyond the upper esophageal sphincter as there was a circumfer-ential web, which was causing lumen narrowing and even the scope with a surrounding diameter of 8 mm could not pass [Figure 1]. This led to the diagnosis of a proximal esophageal web.
Figure 1: An upper esophageal web revealed on EGD in our 37-year old Ethiopian patient
The esophageal ring was then dilated with a pneu-matic dilator cautiously to avoid aspiration and it was successful leading to rupture of the membranous ring (See Figure 2).
Figure 2: The image after an esophageal balloon dila-tation has been done showing a rupture of the eso-
phageal web
After the procedure, the patient was complaining of some discomfort while swallowing, which resolved slowly, but could not get herself to be convinced that she can swallow and be able to take her drugs. A subsequent pneumatic dilatation was performed after a week and at this time, the scope was able to pass and the remnant ring ruptured easily and the patient was given psychological support and reas-surance. After this second therapy, the patient started eating solid food and she also started taking her drugs. She then showed marked improvement of her nutritional status. She successfully completed three months of DAA therapy (Velpatasvir + Sofos-buvir) and had a successful response with virologi-cal cure (sustained virological response/SVR) with undetectable virus at week 12 follow-up (SVR 12). She also slowly improved in her overall wellbeing with gratitude and has gained weight. It has been more than a year since she was put off follow up, and there are no complains of dysphagia.
DISCUSSION AND CONCLUSION
Esophageal web is an eccentric, thin < 2mm hori-zontal membrane and protrudes into the lumen of the esophagus. It is covered with stratified squamous epithelium and occurs anteriorly com-monly in the cervical and middle esophagus. (1) It is associated with focal narrowing in the post-cricoid area and mainly affects middle-aged females (2). Patients are usually asymptomatic and the true prevalence is not clearly known. Patients may have dysphagia and regurgitation based on the site of the stenosis and especially when the stenosis is severe. Hepatitis C Virus is one of the hepatotoxic viruses that could lead to chronic liver disease with liver failure, decompensation and lier cancer. It has af-fected 71 million of the world population and cur-rently has effective therapies that can lead to cure within 2-3 months of treatment. (3) Hepatitis C has also an extrahepatic manifestations involving differ-ent organs of the body, but there was no reports of esophageal web in the literature. (4) In patients undergoing barium esophagogram for dysphagia, 5 to 15 % of patients could have an eso-phageal web. In different literatures, it has been noted that patients usually do not become sympto-matic until after 40 years of age (5). Our patient came to our attention at the age of 37 years, even though, she has had long standing intermittent symptoms. Her case could be explained as one of the postulated mechanisms, the developmental the-ory, where the webs are expected to occur when a pleat of mucosa is formed by in-folding of redun-dant esophageal mucosa due to shortening of the esophagus.

367
Esophageal webs are developmental anomalies with unknown pathogenesis. Unlike rings these anomalies rarely encircle the lumen but instead protrude from the anterior wall, extending laterally but not to the poste-rior wall (6). Webs are common in the cervical esophagus and are best demonstrated on an esophago-gram with the lateral view. In up to 5% of cases, they are identified in an asymptomatic state, but when they are symptomatic they cause dysphagia for solids. Webs are fragile membranes and so respond well to esophageal bougienage with mercury weighted dila-tors (7). Symptomatic patients usually present with dysphagia to solids particularly hard ones (e.g., meat/bread), often intermittent, and patients may modify how they eat (chewing more thoroughly, etc.). In our patient, she had been avoiding swallowing hard solid foods including tablets and she was taking longer to chew before attempting to swallow foods. Esophageal webs are associated with Zenker’s diver-ticulum, dermatologic and immunological disorders, and iron deficiency anemia. There has also been a case report of celiac disease in association with eso-phageal web (8). In this current case, the patient’s evaluation did not reveal any of the above associations or findings, although she was incidentally noted to have presence of chronic Hepatitis C Virus infection. Literatures have shown that most children are asymp-tomatic, and, thus, they are far less detected and could adjust their life style and dietary habits as found in this case. This has been described as esophageal webs can present as a congenital manifestation and can stay until fourth decade without being diagnosed. The diagnosis of esophageal web can be made by bar-ium swallow study, however, if the esophagus is not distended adequately, it will give the appearance of subtle narrowing and can easily be missed (1). In a study published in 1985, the investigators found that barium detection rate can be evident in only 17 to 49 when proper techniques are not followed (9). Our pa-tient had a normal barium swallow and this is an im-portant lesson to improve our techniques in detection of esophageal webs and rings. It also showed that a normal barium swallow should not rule out upper eso-phageal pathology and additional investigations such as an upper endoscopy (EGD) may need to be done, especially in patients with long-standing symptoms. EGD shows a smooth, thin membrane that is usually non-circumferential and caution should be taken due to proximity to the upper esophageal sphincter. Once the diagnosis is made, management is usually per-formed with esophageal dilation and small webs usu-ally rupture during the endoscope traverses the web. The goals of management are relief of dysphagia and the prevention of recurrent symptoms and patients usually have an excellent improvement on follow-up (10).
Our patient required sequential sessions of pneumatic dilations after which she had marked improvement of her symptoms and was able to complete taking her oral DAA drugs for her chronic hepatitis C infection resulting in successful treatment and achieving sus-tained virological response (virological cure). She was also able to have improved sense of well-being and she was able to eat more sold diets and also gained weight. In conclusion, we would like to state that patients with long standing dysphagia should be investigated for rare causes that can be easily treated with an upper GI endoscopy resulting in sympto-matic relief and improved quality of life. In the case of our patient who was only 37 years old, unless an upper GI endoscopy had been done, the patient would have likely gone undiagnosed with persistent symptoms of her dysphagia and poor quality of life and potentially continued progression of her underly-ing chronic Hepatitis C virus infection. Abbreviations: GI-Gastrointestinal, DAA-Direct Acting Antiviral, EGD- EsophagoGastroduodeno-scopy, SVR-Sustained Virological Response, HCV-Hepatitis C Virus Informed Consent:- The patient gave an informed consent about the publication; PATIENT PERSPECTIVE :- Patient feels marked improvement from the intervention and happy that persuasion for the HCV treatment helped the diagno-sis which will otherwise never be attempted. Ethics approval and consent to Participate Waiver request was secured from the Institutional Review Board at St. Paul’s Hospital Millennium Medical College.
Consent for Publication: A written informed con-sent to publish this information was obtained from study participant. Availability of Data and material:- The data is avail-able from the corresponding author upon a reason-able request.
Competing Interest:-None
Funding: The authors declare that no conflict of interests. Authors’ Contributions HD is the primary treating physician and responsible for writing the primary draft. HC has been a consult-ant in the case, reviewed the draft and both have agreed to submit the manuscript.
ACKNOWLEDGEMENTS
We are thankful to the patient who is willing to share the case.
368
REFERENCES 1. Wanamaker R, Grimm I. Encyclopedia of Gastroenterology. Gastroenterology. 2004 Oct 1;127(4):1274-5. 2. Gouda MS, Al-lakani AI, Bedewy MM. Endoscopic findings in Egyptian patients with oesophageal dys-
phagia at different age groups. Am J Internal Med. 2015;3:224-30. 3. Mohamed AA, El-Toukhy NER, Said EM, et al. Hepatitis C Virus: Efficacy of New DAAs Regimens. Infect
Disord Drug Targets. 2020;20(2):143-149). 4. Younossi Z, Park H, Henry L, Adeyemi A, Stepanova M. Extrahepatic Manifestations of Hepatitis C: A Meta-
analysis of Prevalence, Quality of Life, and Economic Burden. Gastroenterology. 2016;150:1599-1608.) 5. Nosher JL, Campbell WL, Seaman WB. The clinical significance of cervical esophageal and hypopharyngeal
webs. Radiology. 1975 Oct;117(1):45-7. 6. Feldman M, Friedman LS, Brandt LJ, editors. Sleisenger and Fordtran's Gastrointestinal and Liver Disease E-
Book: Pathophysiology, Diagnosis, Management. Elsevier; 2020 Jun 9. 7. Atmatzidis K, Papaziogas B, Pavlidis T, Mirelis CH, Papaziogas T. Plummer–Vinson syndrome. Diseases of
the Esophagus. 2003 Jun 1;16(2):154-7. 8. Sinha SK, Nain CK, Udawat HP, Prasad KK, Das R, Nagi B, Singh K. Cervical esophageal web and celiac
disease. Journal of gastroenterology and hepatology. 2008 Jul;23(7pt1):1149-52. 9. Chen YM, Ott DJ, Gelfand DW, Munitz HA. Multiphasic examination of the esophagogastric region for stric-
tures, rings, and hiatal hernia: evaluation of the individual techniques. Gastrointestinal radiology. 1985 Dec 1;10(1):311-6
10. Beyler AR, Yurdaydin C, Bahar K, Gören A, Soykan I, Uzunalimoğlu Ö. Dilation therapy of upper esophageal webs in two cases of Plummer-Vinson syndrome. Endoscopy. 1996 Feb;28(02):266-7.

369
Alemayehu Ginbo Bedada, Imran Fizzah, Sesay Sheikha, Georges Azzie. Ethiop Med J, 2021, Vol. 59, No. 4
CASE REPORT TRAUMATIC TENSION PNEUMOCEPHALUS IN A 16 MONTH OLD CHILD: CASE
REPORT AND REVIEW OF THE LITERATURE
Alemayehu Ginbo Bedada, MD1*, Imran Fizzah, MOI2, Sesay Sheikha, MD3, Georges Azzie, MD4
ABSTRACT
Traumatic Tension Pneumocephalus is a rare condition especially in children. It occurs most often as a result of temporal or basal skull fracture, and may cause neurological deterioration. CT scan findings are considered pathognomonic. A 16-month-old girl presented with unstable vital signs and a seizure episode after being struck by a reversing car. A day later she developed rhinorrhea and high grade fever. CT scan of the brain demonstrated a Mount Fuji sign. Her neurological status remained essentially normal. She was managed non-operatively and was discharged uneventfully eight days after the accident. In selected paediatric cases, traumatic tension pneumo-cephalus may be managed non-operatively. Key words: Child, Mount Fuji sign, Non-surgical treatment, Traumatic tension pneumocephalus Work done: At Princess Marina Hospital, Department of Surgery, Gaborone, Botswana
INTRODUCTION
Traumatic Pneumocephalus (TP) is characterized by the abnormal presence of air in the cranial cavity fol-lowing traumatic injury (1-6). It has been reported in 3.9% 9.7% of head injuries (1-3). Trauma is incrimi-nated in 67% - 74% of pneumocaphalus cases (4-7). Tension traumatic pneumocephalus (TTP) is a clinical entity characterized by continued buildup of air within the cranial cavity, leading to abnormal pressure ex-erted on the brain and subsequent neurologic deterio-ration (2-4). TTP is classified as acute when it occurs within 72 hours of the traumatic event and as delayed when it occurs thereafter (1,2,4,5). Two mechanisms are postulated TP: the ’inverted soda bottle effect’, where CSF loss creates negative intracranial pressure, drawing air into the subarach-noid space (1-5,8), and the “ball-valve” theory where there is a unidirectional movement of air into the cra-nial cavity, most often the extradural space (1,2,4-7).
Clinical presentations of TP include nausea, vomiting, poor feeding in children, irritability, dizziness, head-ache, seizure, depressed mental status, cerebrospinal fluid rhinorrhea, pupillary abnormalities and hemody-namic changes (1,2,4,7). More serious presentations include cardiac arrest and blindness (4). Head CT remains the most accurate imaging study with the ability to detect as little as 0.5 cm3 of air (1,2,4-8).
The CT finding of bilateral compression of the fron-tal lobes is called the peaking sign (5). When there is progression to TTP the increased pressure not only compresses, but separates the frontal lobes, thus creating the so-called “Mount Fuji” sign (1,2,4-7). This finding is considered virtually pathogno-monic of TTP.
Uncomplicated TP tends to resolve spontaneously (2-5). Evidence of progression to TTP based on deteriorating neurological status or the Mount Fuji sign on CT scan usually mandates surgical interven-tion. Out team describes the rare case of traumatic tension pneumocephalus in a 16-month-old child (the “youngest” in literature), and reviewed and summarized the current knowledge on TTP.
Case Presentation A 16-month-old girl presented to the hospital after being struck by a reversing car. The mother reported an episode of generalized seizure, however, There was no vomiting or loss of consciousness. On ex-amination, she was alert, with a heart rate of 193 beats/min, respiratory rate 36 breaths/min, tempera-ture 37.5 0C and oxygen saturation 99% on room air. Her Glasgow coma scale (GCS) score was 15/15 with no focal neurological deficits, and no other abnormalities. Her laboratory tests, chest, cer-vical and pelvic-rays were all normal. CT scan of the head demonstrated a right temporoparietal linear skull fracture, as well as cerebral edema and a right scalp hematoma.
1Department of Surgery, Princess Marina Hospital, Faculty of Medicine, University of Botswana, Gaborone, Bot-swana. 2 Medical Officer Intern, Princess Marina Hospital, Gaborone, Botswana. 3Department of radiology, Prin-cess Marina Hospital, Gaborone, Botswana. 4Division of General and Thoracic Surgery, Hospital for Sick Chil-dren, Toronto Canada. *Corresponding Author E-mail: [email protected]
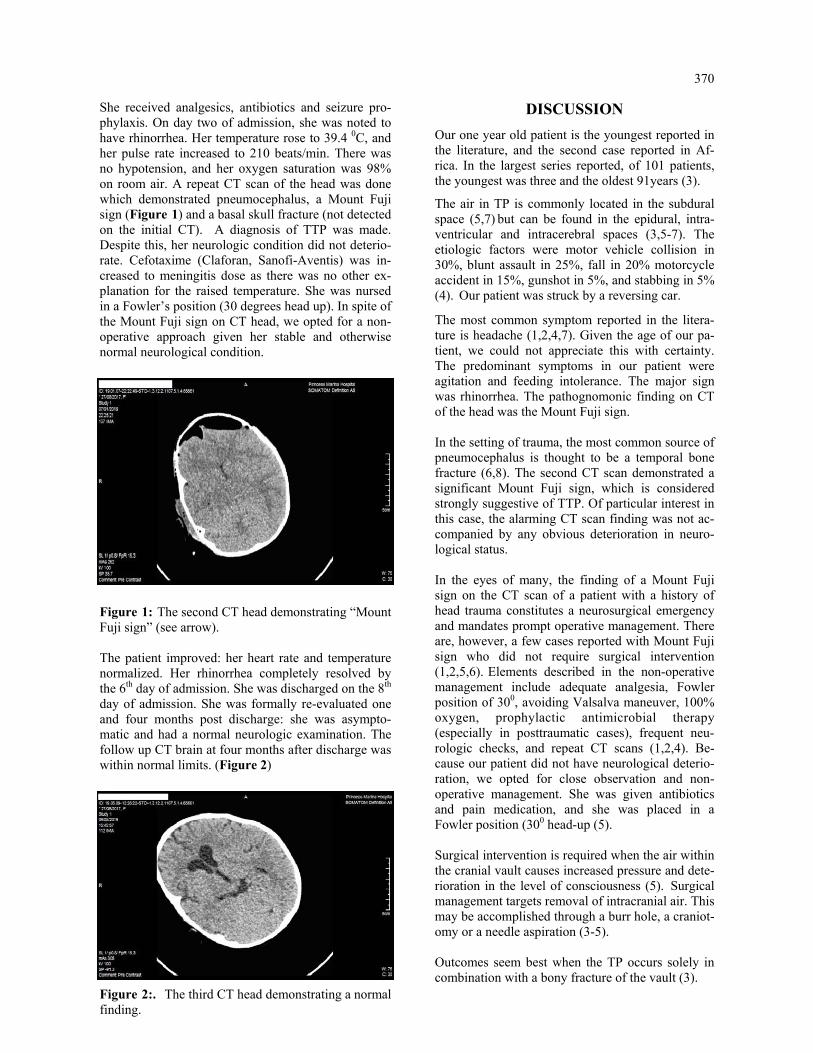
370
She received analgesics, antibiotics and seizure pro-phylaxis. On day two of admission, she was noted to have rhinorrhea. Her temperature rose to 39.4 0C, and her pulse rate increased to 210 beats/min. There was no hypotension, and her oxygen saturation was 98% on room air. A repeat CT scan of the head was done which demonstrated pneumocephalus, a Mount Fuji sign (Figure 1) and a basal skull fracture (not detected on the initial CT). A diagnosis of TTP was made. Despite this, her neurologic condition did not deterio-rate. Cefotaxime (Claforan, Sanofi-Aventis) was in-creased to meningitis dose as there was no other ex-planation for the raised temperature. She was nursed in a Fowler’s position (30 degrees head up). In spite of the Mount Fuji sign on CT head, we opted for a non-operative approach given her stable and otherwise normal neurological condition.
Figure 1: The second CT head demonstrating “Mount Fuji sign” (see arrow). The patient improved: her heart rate and temperature normalized. Her rhinorrhea completely resolved by the 6th day of admission. She was discharged on the 8th day of admission. She was formally re-evaluated one and four months post discharge: she was asympto-matic and had a normal neurologic examination. The follow up CT brain at four months after discharge was within normal limits. (Figure 2)
Figure 2:. The third CT head demonstrating a normal finding.
DISCUSSION
Our one year old patient is the youngest reported in the literature, and the second case reported in Af-rica. In the largest series reported, of 101 patients, the youngest was three and the oldest 91years (3).
The air in TP is commonly located in the subdural space (5,7) but can be found in the epidural, intra-ventricular and intracerebral spaces (3,5-7). The etiologic factors were motor vehicle collision in 30%, blunt assault in 25%, fall in 20% motorcycle accident in 15%, gunshot in 5%, and stabbing in 5% (4). Our patient was struck by a reversing car.
The most common symptom reported in the litera-ture is headache (1,2,4,7). Given the age of our pa-tient, we could not appreciate this with certainty. The predominant symptoms in our patient were agitation and feeding intolerance. The major sign was rhinorrhea. The pathognomonic finding on CT of the head was the Mount Fuji sign. In the setting of trauma, the most common source of pneumocephalus is thought to be a temporal bone fracture (6,8). The second CT scan demonstrated a significant Mount Fuji sign, which is considered strongly suggestive of TTP. Of particular interest in this case, the alarming CT scan finding was not ac-companied by any obvious deterioration in neuro-logical status. In the eyes of many, the finding of a Mount Fuji sign on the CT scan of a patient with a history of head trauma constitutes a neurosurgical emergency and mandates prompt operative management. There are, however, a few cases reported with Mount Fuji sign who did not require surgical intervention (1,2,5,6). Elements described in the non-operative management include adequate analgesia, Fowler position of 300, avoiding Valsalva maneuver, 100% oxygen, prophylactic antimicrobial therapy (especially in posttraumatic cases), frequent neu-rologic checks, and repeat CT scans (1,2,4). Be-cause our patient did not have neurological deterio-ration, we opted for close observation and non-operative management. She was given antibiotics and pain medication, and she was placed in a Fowler position (300 head-up (5).
Surgical intervention is required when the air within the cranial vault causes increased pressure and dete-rioration in the level of consciousness (5). Surgical management targets removal of intracranial air. This may be accomplished through a burr hole, a craniot-omy or a needle aspiration (3-5). Outcomes seem best when the TP occurs solely in combination with a bony fracture of the vault (3).

371
This was the case in our patient. When TP occurs in combination with an acute subdural hematoma or is diagnosed in association with the presence of multiple air bubbles scattered over the basal cisterns and the posterior fossa, outcomes are less favorable (3).
Conclusion Although vary rare, a diagnosis of TTP should be con-sidered even in very young trauma patients. TTP may be treated non-surgically in selected patients, espe-cially if there is no neurological deterioration. While many consider the presence of a Mount Fuji sign on CT head to be strongly suggestive of TTP, this finding in and of itself may not necessarily mandate surgical intervention.
ACKNOWLEDGMENT
We are thankful to the patient’s mother who kindly agreed to share our experience with the medical frater-nity.
Conflict of interest: The authors declare no con-flict of interest.
Funding: No fund involved.
Ethical consideration: The mother to the child consented to the publication of this report for the purpose of education without patient identifier.
Authors’ contribution: All four authors did litera-ture review. The first draft of the manuscript was prepared by AGB, and critically revised by AGB and GA. SS reported on all CT head films. AGB and IF followed the patient. All four authors revie-wed the final version of the manuscript and agreed to submit to Ethiopian Medical Journal for publi-cation.
REFERENCES 1. Solomiichuk VO, Lebed VO, Drizhdov KI. Posttraumatic delayed subdural tension pneumocephalus. Surgical
neurology international. 2013;4. 2. Kankane VK, Jaiswal G, Gupta TK. Posttraumatic delayed tension pneumocephalus: Rare case with review of
literature. Asian journal of neurosurgery. 2016;11(4):343. 3. Steudel WI, Hacker H. Acute intracranial pneumocephalus: Prognosis and management-a retrospective analy-
sis of 101 cases. Neurosurgical review. 1989;12(1):125-36. 4. Pillai P, Sharma R, MacKenzie L, Reilly EF, Beery PR. Traumatic tension pneumocephalus–Two cases and
comprehensive review of literature. International journal of critical illness and injury science. 2017;7(1):58. 5. Dabdoub CB, Salas G, Silveira ED, Dabdoub CF. Review of the management of pneumocephalus. Surgical
neurology international. 2015;6. 6. Gill HS, van As AB. Tension pneumocranium in childhood trauma. World Journal of Pediatrics. 2008;4
(3):231-3. 7. Raza R, Shakil A, Anwar M. Tension Pneumocranium: The Largest Case Series. PJR. 2016;26(3). 8. Martin RJ, Holthouse DJ, Wayne TG. Localising the source of pneumocephalus: a diagnostic problem. Journal
of clinical neuroscience. 2002;9(2):216-8.

373
Tan Shong Sheng, Mohamed Ashraf Mohamed Daud, Wan Mokhzani Wan Mokhter, Rosnelifaizur Ramely, Nik Mohd Nurhafizi Nik Anuar. Ethiop Med J, 2021, Vol. 59, No. 4
CASE REPORT
UNDIAGNOSED URETEROVAGINAL FISTULA IN CONGENITAL DUPLEX KIDNEY WITH ECTOPIC URETERIC INSERTION TO URETHRA; SOMETHING
TO LOOK FOR?
Tan Shong Sheng, MD, MRCS1,3, Mohamed Ashraf Mohamed Daud, MBBS, FEBU3*, Wan Mokhzani Wan Mok-hter, MD, MMed1,3*, Rosnelifaizur Ramely, MD, MMed1,3, Nik Mohd Nurhafizi Nik Anuar, MD, MMed2,3
ABSTRACT
Continuous urinary incontinence in young female with normal voiding pattern should prompt proper assessment for ectopic ureter. We report a young female who presents with continuous urinary incontinence and malodourous urine. She was frequently treated as recurrent urinary tract infection and subsequently referred to our urology unit. Initial imag-ing revealed right duplex kidney with ectopic ureter, hence she had undergone right heminephrectomy. However her symptoms does not improve significantly. Further evaluation revealed uretero–urethral fistula and uretero–vaginal fistula. She then underwent urethroureteral and ureterovaginal fistula repair, which resolved her distress-ing urinary incontinence. Keywords: Ectopic ureter; urinary incontinence; female; urinary tract fistula
INTRODUCTION
The term “ectopic ureter” denotes a ureter that inserts at or distal to the bladder neck. Ectopic ureters most commonly occur in females and often drain into upper moiety of a duplex kidney (1). In most females with an ectopic ureter, the ureter has its insertion either into genital tract or urethra (2). This leads to typical symp-tom of continuous urinary incontinence with an other-wise normal voiding pattern. Screening with ultra-sonography and/or intravenous urography (IVU) could assist in confirming the affected system which likely to be upper pole moiety of a duplex collecting system (3,4). We report a case of young lady who presents with urinary incontinence since childhood and fre-quent urinary tract infection, then found out to have ectopic ureter with uretero–urethral fistula and uretero–vaginal fistula. Case Presentation We report a 31-year-old lady presented to us with a complaint of urinary incontinence since the age of 8, without any prior history of trauma or fall. She denied having bowel or neurological symptoms. She had fre-quent visits to the hospital and was treated as a recur-rent urinary tract infection. Micturition cystourethro-gram (MCUG) revealed right distal ureteric bulbous distension and right duplex kidney, with no demon-strable fistulous connection. Contrasted enhanced computed tomography (CT) of the abdomen/pelvis revealed complex right duplex kidney.
Right upper moiety revealed hydronephrosis and hydroureter with possible ectopic ureteric insertion. Subsequently intravenous urography (IVU) revealed the poorly function of the right upper moiety with normal function of right lower moiety. She had undergone right retrograde pyelogram with ureterorenoscope and right ureteric stenting, fol-lowed by right heminephrectomy and ureterectomy at the age of 24. Histopathological examination re-port revealed ureteritis in right upper moiety ureter and chronic pyelonephritis in right upper moiety nephrectomy. Postoperatively she continued to complain of foul–smelling urine dribbling from the vagina that per-sisted for many years. Repeated MCUG revealed residual right ureteric stump with evidence of reflux from the urethra during micturition phase and likely urethrovaginal fistula (Figure 1). Rigid cystoscopy and contrast study revealed ure-throrectal fistula at 7 o'clock just distal to the bladder neck. There were 2 openings seen at 4 o'clock and 10 o’clock location in the ectopic ureter, contrast injec-tion showed communication with the vagina (Figure 2A and 2B). On table retrograde urethrography done through the urethroureteral fistula revealed remaining right ectopic ureter up to mid part of ureter.
1Department of Surgery, School of Medical Sciences, Universiti Sains Malaysia Health Campus, Kelantan, Malaysia 2Department of Surgery, Faculty of Medicine, Universiti Sultan Zainal Abidin (UniSZA), Terengganu, Malaysia 3Hospital Universiti Sains Malaysia, Kelantan, Malaysia *Corresponding authors’ email addresses: [email protected] & [email protected]
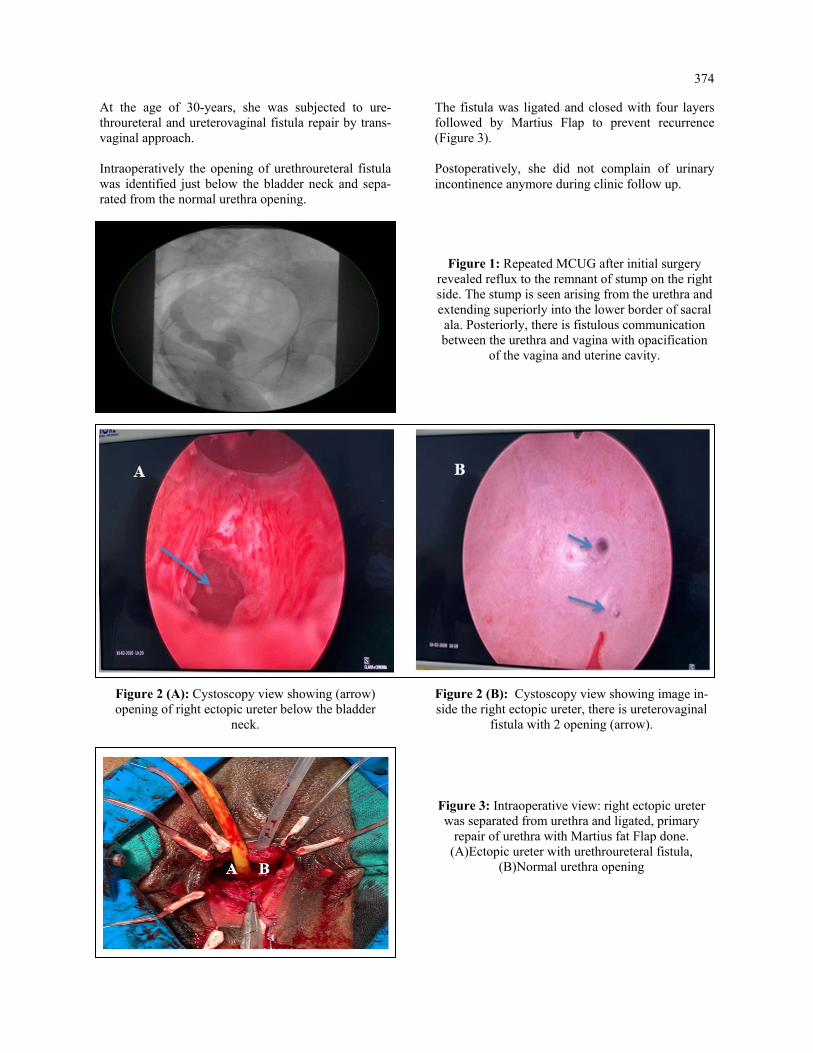
374
At the age of 30-years, she was subjected to ure-throureteral and ureterovaginal fistula repair by trans-vaginal approach. Intraoperatively the opening of urethroureteral fistula was identified just below the bladder neck and sepa-rated from the normal urethra opening.
The fistula was ligated and closed with four layers followed by Martius Flap to prevent recurrence (Figure 3). Postoperatively, she did not complain of urinary incontinence anymore during clinic follow up.
Figure 1: Repeated MCUG after initial surgery revealed reflux to the remnant of stump on the right side. The stump is seen arising from the urethra and extending superiorly into the lower border of sacral ala. Posteriorly, there is fistulous communication between the urethra and vagina with opacification
of the vagina and uterine cavity.
Figure 2 (A): Cystoscopy view showing (arrow) opening of right ectopic ureter below the bladder
neck.
Figure 2 (B): Cystoscopy view showing image in-side the right ectopic ureter, there is ureterovaginal
fistula with 2 opening (arrow).
Figure 3: Intraoperative view: right ectopic ureter was separated from urethra and ligated, primary
repair of urethra with Martius fat Flap done. (A)Ectopic ureter with urethroureteral fistula,
(B)Normal urethra opening

375
DISCUSSION
An ectopic ureter is known as a ureter that abnormally place at or distal to the bladder neck, or outside of the urinary tract entirely. This is commonly due to em-bryological malformation, where the ureteric bud arises more cephalad than usual on the mesonephric duct, leading to distal ectopic ureteric insertion. The ureter remains attached to the mesonephric duct for longer, migrates more caudally than usual and inserts into either the urinary tract distal to the bladder or the genital tract (5).
The mesonephric duct remnant will turn into the epoo-phoron, oophoron and Gartner’s duct in the female. When the ectopic ureteric bud included into the adja-cent structures of paramesonephric duct origin, this will lead to urinary drainage into the female genital tract (1,5). Usual sites of ectopic ureter in the female include urethra (35%), vestibule (34%) and vagina (25%) (2), which is demonstrated in our case who was found to have urethra – ureter fistula and uretero vagi-nal fistula. She complained of continuous urinary in-continence due to the insertion of ectopic ureter distal to the urethral sphincter as well as into vagina. The female with an ectopic ureter has continuous uri-nary incontinence with otherwise normal urinary pat-tern, often associated with abnormal urine odour which warrants a thorough assessment. They often suffer from wet and erythematous perineal rash due to persistent incontinence from an ectopic ureter. De-tailed inspection may demonstrate urine leak from the vestibule and / or vaginal orifice (1).
The imaging studies should aim to recognize any ad-ditional poorly functioning renal parenchyma, particu-larly when initial imaging reported a “solitary” kid-ney. IVU is useful to demonstrate if duplex system is present, though occasionally required a delayed phase (6).
Studies had showed that laparoscopic nephroureter-ectomy is comparable to its open counterpart (6 – 8). Irrespective of the technique used, it is impera-tive to identify the ectopic / dysplastic kidney and / or ureter involved. Urinary incontinence can be cured with removal of poorly functioning ectopic kidney and its ectopic ureter. Conclusions An ectopic ureter assessment should be considered in females with continuous urinary incontinence with normal voiding patterns, irrespective of age. Imaging studies can be helpful, from initial ultra-sonography and/or IVU, followed by detailed imag-ing such as CT or fluoroscopy. Once the ectopic ureter and affected renal unit are identified, we can offer a cure for this disturbing symptom and provide a better quality of life in these affected patients. Competing interests There was no funding for the study and no conflicts of interest to disclose.
ACKNOWLEDGEMENT
We would like to thank Dr. Ahmad Amir Ismail, Department of Obstetrics and Gynaecology, Univer-siti Sains Malaysia for identification of patient’s concern and referring her to us when she still com-plained of having urinary incontinence. We also like to extend our appreciation to Department of Pathol-ogy, Radiology and Surgery, Universiti Sains Ma-laysia for their administrative support, and the pa-tient for her cooperation.
REFERENCES 1. J.G. Borer et al. A Single – system ectopic ureter draining an ectopic dysplastic kidney: delayed diagno sis in the young female with continuous urinary incontinence. British Journal of Urology. 1998; 81, 474– 78. 2. Ellerker AG. The extravesical ectopic ureter. Br J Surg. 1958; 45, 344 – 53 3. Borer JG, Corgan FJ, Krantz R, Gordon DH, Maiman M, Glassberg K. Unilateral single vaginal ectopic ureter with ipsilateral hypoplastic pelvic kidney and bicornuate uterus. J Urol 1993; 149: 1124–7 4. Gharagozloo AM, Lebowitz RL. Detection of a poorly functioning malpositioned kidney with single ec topic ureter in girls with urinary dribbling: imaging evaluation in five patients. Am J Roentgen 1995; 164: 957–61. 5. Schlussel RN, Retik AB. Anomalies of the ureter. In Walsh PC, Retik AB, Vaughan ED Jr, Wein AJ, eds, Campbell’s Urology, 7th edn, Vol. 2. Philadelphia: WB Saunders, 1997: 1820–9

376
6. Liu KKW, Yeung CK, Lee KH, Ku KW. Ectopic ureter as a cause of wetting: the role of laparoscopy in its management. Aust NZ J Surg 1996; 66: 325–6. 7. Suzuki K, Ihara H, Kurita Y et al. Laparoscopic nephrectomy for atrophic kidney associated with ectopic ureter in a child. Eur Urol 1993; 23: 463–5. 8. Moores D, Cohen R, Hayden L. Laparoscopic excision of pelvic kidney with single vaginal ectopic ureter. J Pediatr Surg 1997; 32: 634–5.
377
EDITORIAL POLICY
Overview Ethiopia’s oldest medical journal, The Ethiopian Medical Journal (EMJ) is the official organ of the Ethiopian Medical Association (EMA). The EMJ is devoted to the advancement and dissemination of knowledge pertaining to the broad field of medicine in Ethiopia and other developing countries. The journal first appeared in July 1962 and has been published quarterly (January, April, July, October) without fail since then. It has been published in both online (www.emjema.org) and hard copy (ISSN0014-1755) versions. The EMJ continues to play an important role in documenting and disseminating the progress of scientific medicine, and in providing evidence base for health policy and clinical practice in Ethiopia and Africa at large. Our online journal is open access. The hard copies are distributed to members of the Ethiopian Medical Associa-tion. Hard copies of the Journal are distributed to institutions and organizations (internal and external) based on subscription. Reviewing procedure Peer reviewers The Ethiopian Medical Journal uses a double-blind review system for all manuscripts. Each manuscript is reviewed by at least two reviewers. The reviewers act independently, and they are not aware of each other’s identities. The reviewers are selected solely based on their relevant expertise for evaluating a manuscript. They must not be from the same institution as the author(s) of the manuscript, nor be their co-authors in the recent past. The purpose of peer review is to assist the author in improving papers and the Editorial Board in making decision on whether to accept or reject a manuscript. Reviewers are requested to decline if they have a conflict of interest or if the work does not fall within their expertise. Peer review process Manuscripts are sent for review only if they pass the initial evaluation (pre-review by the Editorial Board) regard-ing their style, methodological accuracy, ethical review documentation and thematic scope. A special care is taken that the initial (pre-review) evaluation is done in 3-5 days. The Journal policy is to minimize time from submission to publication without reducing peer review quality. Cur-rently the total period from the submission of a manuscript until its publication takes an average of six months. Peer reviewers are requested to respond within four weeks. During the review process, the Editor-in-Chief may require authors to provide additional information (including raw data) if they are necessary for the evaluation of the manuscript. These materials shall be kept confidential and must not be used for any other purposes. The entire review process takes place under the supervision of the Editor-in-Chief in an online environment, with the assistance of the Journal Secretariat. The online system also allows authors to track the manuscript review pro-gress. Resolving inconsistencies In case that the authors have serious and reasonable objections to the reviews, the Editorial Board assesses whether a review is objective and whether it meets academic standards. If there is a doubt about the objectivity or quality of review, the Editor-in-Chief will assign additional reviewer(s). Additional reviewers may also be assigned when reviewers’ decisions (accept or reject) are contrary to each other or otherwise substantially incompatible. The final decision on the acceptance of the manuscript for publication rests solely with the Editor-in-Chief.

378
Responsibilities Authors' responsibilities This is provided in the ‘Guidelines to Authors’ which appear in each issue of the Journal. Authors must guarantee that their manuscripts are their original work, that they have not been published before, and are not under consid-eration for publication elsewhere. Parallel submission of the same paper to another journal constitutes misconduct and eliminates the manuscript from further consideration. Work that has already been published elsewhere cannot be reprinted in the Ethiopian Medical Journal Authors are exclusively responsible for the contents of their submissions and must make sure that the authors listed in the manuscript include all and only those authors who have significantly contributed to the submitted manu-script. If persons other than authors were involved in important aspects of the research project and the preparation of the manuscript, their contribution should be acknowledged in the Acknowledgments section. It is the responsibility of the authors to specify the title and code label of the research project within which the work was created, as well as the full title of the funding institution. In case a submitted manuscript has been pre-sented at a conference in the form of an oral presentation (under the same or similar title), detailed information about what was published in proceedings of the conference shall be provided to the Editor-in-Chief upon submis-sion. Authors are required to properly cite sources that have significantly influenced their research and their manuscript. Parts of the manuscript, including text, equations, pictures, tables and graphs that are taken verbatim from other works must be clearly marked, e.g. by quotation marks accompanied by their location in the original document (page number), or, if more extensive, given in a separate paragraph. Full references of each quotation (in-text citation) must be listed in the separate reference section in a uniform manner, according to the citation style used by the journal. References section should list only quoted/cited, and not all sources used for the preparation of a manuscript. When authors discover a significant error or inaccuracy in their own published work, it is their obligation to promptly notify the Editor-in-Chief and cooperate with him/her to retract or correct the paper. Authors should disclose in their manuscript any financial or other substantive conflict of interest that might have influenced the presented results or their interpretation. By submitting a manuscript, the authors agree to abide by the Editorial Policies of the Ethiopian Medical Journal . Editorial responsibilities The Editor-in-Chief is responsible for deciding which articles submitted to the journal will be published. The deci-sions are made based exclusively on the manuscript's merit. They must be free from any racial, gender, sexual, religious, ethnic, or political bias. When making decisions the Editor-in-Chief is also guided by the editorial policy and legal provisions relating to defamation, copyright infringement and plagiarism. Members of the Editorial Board including the Editor-in-Chief must hold no conflict of interest about the articles they consider for publication. Members who feel they might be perceived as being involved in such a conflict do not participate in the decision process for a manuscript. The information and ideas presented in submitted manuscripts shall be kept confidential. Editors and the editorial staff shall take all reasonable measures to ensure that the authors/reviewers remain anony-mous during and after the evaluation process in accordance with the type of reviewing in use. The Editorial Board is obliged to assist reviewers with additional information on the manuscript, including the re-sults of checking manuscript for plagiarism. Reviewers' responsibilities Reviewers are required to provide the qualified and timely assessment of the scholarly merits of the manuscript. The reviewer takes special care of the real contribution and originality of the manuscript. The review must be fully objective, and the judgment of the reviewers must be clear and substantiated by arguments. The reviewers assess manuscript for the compliance with the profile of the journal, the relevance of the investi-gated topic and applied methods, the scientific relevance of information presented in the manuscript, and the pres-

379
entation style. The review has a standard format. It is submitted through the online journal management system where it is stored permanently. The reviewer must not be in a conflict of interest with the authors or funders of research. If such a conflict exists, the reviewer is obliged to promptly notify the Editor-in-Chief. The reviewer shall not accept for reviewing papers beyond the field of his/her full competence. Reviewers should alert the Editor-in-Chief to any well-founded suspicions or the knowledge of possible violations of ethical standards by the authors. Reviewers should recognize relevant published works that have not been con-sidered in the manuscript. They may recommend specific references for citation but shall not require citing papers published in the Ethiopian Medical Journal, or their own papers, unless it is justified. The reviewers are expected to improve the quality of the manuscript through their suggestions. If they recommend correction of the manuscript prior to publication, they are obliged to specify the way this can be achieved. Any manuscript received for review must be treated as confidential document. Ethical Considerations Dealing with unethical behavior Anyone may inform the Editor-in-Chief at any time of suspected unethical behavior or any type of misconduct by giving the necessary credible information/evidence to start an investigation.
Editor-in-Chief makes the decision regarding the initiation of an investigation.
During an investigation, any evidence should be treated as confidential and only made available to those strictly involved in the process.
The accused will always be given the chance to respond to any charges made against them. If it is judged at the end of the investigation that misconduct has occurred, then it will be classified as either minor or serious.
Minor misconduct (with no influence on the integrity of the paper and the journal, for example, when it comes to misunderstanding or wrong application of publishing standards) will be dealt with directly with authors and re-viewers without involving any other parties. Outcomes include:
Sending a warning letter to authors and/or reviewers.
Publishing correction of a paper, e.g. when sources properly quoted in the text are omitted from the reference list.
Publishing an erratum, e.g. if the error was made by editorial staff.
In the case of major misconduct, the Editor-in-Chief may adopt different measures:
Publication of a formal announcement or editorial describing the misconduct.
Informing officially the author's/reviewer's affiliating institution. The formal, announced retraction of publications from the journal in accordance with the Retraction Policy.
A ban on submissions from an individual for a defined period. Referring a case to a professional organization or legal authority for further investigation and action.
The above actions may be taken separately or jointly. If necessary, in the process of resolving the case relevant expert organizations, bodies, or individuals may be consulted. When dealing with unethical behavior, the Editorial Board will rely on the guidelines and recommendations pro-vided by the Committee on Publication Ethics (COPE).

380
Plagiarism prevention The Ethiopian Medical Journal does not publish plagiarized papers. The Editorial Board has adopted the stance that plagiarism, where someone assumes another's ideas, words, or other creative expression as one's own, is a clear violation of scientific ethics. Plagiarism may also involve a violation of copyright law, punishable by legal action. Plagiarism includes the following:
Self-plagiarism, which is using one's own previous work in another context without citing that it was used previously
Verbatim (word for word), or almost verbatim copying, or purposely paraphrasing portions of another author's work without clearly indicating the source or marking the copied fragment (for example, using quotation marks) in a way described under Authors’ responsibilities;
Copying equations, figures or tables from someone else's paper without properly citing the source and/or without permission from the original author or the copyright holder.
Any manuscript which shows obvious signs of plagiarism will be automatically rejected. In case plagiarism is dis-covered in a paper that has already been published by the journal, it will be retracted in accordance with the proce-dure described under Retraction policy, including blacklisting the author(s) . To prevent plagiarism, the manuscripts are submitted to a plagiarism detection process. The results obtained are verified by the Editorial Board in accordance with the guidelines and recommendations of the Committee on Publi-cation Ethics (COPE). Retraction policy Legal limitations of the publisher, copyright holder or author(s), infringements of professional ethical codes, such as multiple submissions, bogus claims of authorship, plagiarism, fraudulent use of data or any major misconduct require retraction of an article. Occasionally, a retraction can be used to correct numerous serious errors, which cannot be covered by publishing corrections. A retraction may be published by the Editor-in-Chief, the author(s), or both parties consensually. The retraction takes the form of a separate item listed in the contents and labeled as "Retraction". The original article is retained unchanged, except for a watermark on the PDF indicating on each page that it is “retracted”. Open access Open access policy The Ethiopian Medical Journal is published under an Open Access license. All its content is available free of charge. Users can read, download, copy, distribute, print, search the full text of articles, as well as to establish HTML links to them, without having to seek the consent of the author or publisher. The right to use content without consent does not release the users from the obligation to give the credit to the jour-nal and its content in a manner described under Licensing. Article processing charge The Ethiopian Medical Journal does not charge authors or any third party for publication in its regular quarterly Issues. Both manuscript submission and processing services, and article publishing services are free of charge. There are no hidden costs whatsoever.

381
Copyright & Licensing Copyright Authors retain copyright of the published papers and grant to the publisher the non-exclusive right to publish the article, to be cited as its original publisher in case of reuse, and to distribute it in all forms and media. Users are required to provide full bibliographic description of the original publication (authors, article title, journal title, volume, issue, pages), as well as its DOI code. In electronic publishing, users are also required to link the content with both the original article published in the Ethiopian Medical Journal. Authors can enter into separate, additional contractual arrangements for the non-exclusive distribution of the jour-nal's published version of the work (e.g., post it to an institutional repository or publish it in a book), with an ac-knowledgement of its initial publication in this journal. Self-archiving policy Authors are permitted to deposit publisher's version (PDF) of their work in an institutional repository, subject-based repository, author's personal website (including social networking sites, such departmental websites at any time after publication. Full bibliographic information (authors, article title, journal title, volume, issue, pages) about the original publica-tion must be provided and links must be made to the article's DOI and the license. Disclaimer The views expressed in the published works do not express the views of the Editors and the Editorial Staff of the Ethiopian Medical Journal. The authors take legal and moral responsibility for the ideas expressed in the articles. The Publisher (The Ethiopian Medical Association) shall have no liability in the event of issuance of any claims for damages. The Publisher will not be held legally responsible should there be any claims for compensation.

383
GUIDELINES FOR AUTHORS The Ethiopian Medical Journal (EMJ) is the official Journal of the Ethiopian Medical Association (EMA) devoted to the advancement and dissemination of knowledge pertaining to the broad field of medicine in Ethiopia and other developing countries. Prospective contributors to the Journal should take note of the instructions of Manuscript preparation and submission to EMJ as outlined below. Article types acceptable by EMJ
Original Articles (vide infra) on experimental and observational studies with clinical relevance Brief Communications Case Series Case Reports Editorials, Review or Teaching Articles: by invitation of the Editorial Board. Correspondences/Letters to the Editor Monographs or set of articles on specific themes appearing in a Special Issues of the Journal Book reviews Perspectives, Viewpoints Hypothesis or discussion of an issue important to medical practice Letter to the Editor Commentaries Advertisements Obituaries
N.B. Articles are not acceptable if previously published or submitted elsewhere in print or electronic format,
except in the form of abstracts in proceedings of conferences. Content and format of articles: Title: The title should be on a separate page. It should not have acronyms or abbreviations. The title should be
descriptive and should `not exceed 20 words or 120 characters including space. The title page should include the name(s) and qualification of the author(s); the department or Institution to which the study/research is attributed and address of the corresponding Author. If the author has multiple affiliations only use the most preferred one.
1. Original Articles
2,500 words, excluding Abstracts, References, Figures and Tables. The manuscript of the Article, should ap-pear under the following headings: a) Abstract: The abstract of the Article is prepared on a separate paper, a maximum of 250 words; it should
be structured under the titles: a) Background; b) Methods; c) Results; d) Conclusions. Briefly summarize the essential features of the article under above headings, respectively. Mention the problem being ad-dressed in the study; how the study was conducted; the results and what the author(s) concluded from the results. Statistical method used can appear under Methods paragraph of the Abstract, but do not insert abbreviations or references in the Abstract section. Keywords: Provide three to six key words, or short phrases at the end of abstract page. Use terms from medical subject heading of Index Medicus to assist in cross indexing the Article.
b) Introduction : Should provide a short background and context of the study and provide the rationale for doing the study. It should not be a detailed review of the subject and should not include conclusions from the paper.
384
c) Patients or (Materials) and Methods: should contain details to enable reproducibility of the study by others. This section must include a clear statement specifying that a free and informed consent of the subjects or their legal guardians was obtained. Corresponding author should submit a copy of institution review Board (IRB) clearance or letter of permission from the hospital or department (if IRB exempt) with the manuscript. For manuscripts on clinical trials, a copy of ethical approval letter from the con-cerned body should be submitted with the Manuscript. If confidential data is being used for publication (such as student grades, medical board data, or federal ethics board data), then appropriate support/agreement letter should be included. Photos of patients should disguise the identity or must have obtained their written consent. Reference number for ethical approval given by ethics committee should be stated. In general, the section should include only information that was available at the time the plan or protocol for the study was being written; all information obtained during the study belongs in the Results section.
d) Results: This section should present the experimental or observational data in text, tables or figures. The data in Tables and Figures should not be described extensively in the text.
e) Discussion: The first paragraph should provide a summary of key finding that will then be discussed one by one in the paragraphs to follow. The discussion should focus on the interpretation and significance of the results of the study with comments that compare and describe their relation to the work of others (with references) to the topic. Do not repeat information of Results in this section. Make sure the limitations of the study are clearly stated.
f) Tables and Figures: These should not be more than six. Tables should be typed in triplicate on separate sheets and given serial Arabic numbers. Titles should be clearly place underneath Tables and above Fig-ures. Unnecessary and lengthy tables and figures are discouraged. Same results should not be presented in more than one form (choose either figure or table). Units should appear in parentheses in captions but not in the body of the table. Statistical procedures, if not in common use, should be detailed in the METH-ODS section or supported by references. Legends for figures should be typed on separate sheets, not stapled to the figures. Three dimensional histograms are discouraged. Recognizable photographs of patients should be disguised. Authors should submit editable soft versions of the tables and figures.
g) Acknowledgement: Appropriate recognition of contributors to the research, not included under Authors should be mentioned here; also add a note about source of the financial support or research funding, when applicable.
h) References: The titles of journals should be abbreviated according to the style used for MEDLINE
(www.ncbi.nlm.nih.gov/nlmcatalog/journals). References should be numbered consecutively in the order in which they are first mentioned in the
text and identify references in text, tables, and legends by Arabic numerals in parentheses.
Type the References on a separate sheet, double spaced and keyed to the text.
Personal communications should be placed NOT in the list of references but in the text in parentheses, giving name, date and place where the information was gathered or the work carried out (e.g. personal communication, Alasebu Berhanu, MD, 1984, Gondar College of Medical Sciences). Unpublished data should also be referred to in the text.
References with six or less authors should all be listed. If more than six names, list the first three, followed by et al.
Listing of a reference to a journal should be according to the guidelines of the International Committee of Medical Journal Editors ("Vancouver Style') and should include authors' name(s) and initial(s) sepa-rated by commas, full title of the article, correctly abbreviated name of the journal, year, volume number and first and last page numbers.
Reference to a book should contain author's or authors’ name(s) and initials, title of chapter, names of editors, title or book, city and name of publisher, year, first and last page numbers.

385
The following examples demonstrate the acceptable reference styles. Articles:
Gilbert C, Foster A. Childhood blindness in the context of Vision 2020: the right to sight. Bull World Health Org 2001;79:227-32
Teklu B. Disease patterns amongst civil servants in Addis Ababa: an analysis of outpatient visits to a Bank employee’s clinic. Ethiop Med J 1980;18:1-6
Tsega E, Mengesha B, Nordenfelt E, Hansen B-G; Lindberg J. Serological survey of human immuno-deficiency virus infection in Ethiopia. Ethiop Med J 1988; 26(4): 179-84
Laird M, Deen M, Brooks S, et al. Telemedicine diagnosis of diabetic retinopathy and glaucoma by direct ophthalmoscopy (Abstract). Invest Ophthalmol Vis Sci 1996; 37:104-5
Books and chapters from books: Henderson JW. Orbital Tumors, 3rd ed. Raven Press New York, 1994. Pp 125-136.
Clipard JP. Dry Eye disorders. In Albert DM, Jakobiec FA (Eds). Principles and Practice of Ophthal-mology. W.B Saunders: Philadelphia, PA 1994 pp257-76.
Website: David K Lynch; laser History: Masers and lasers. http://home.achilles.net/jtalbot/history/massers.htmAccessed 19/04/2001
2. Brief Communication Short versions of Research and Applications articles, often describing focused approaches to solve a health
problem, or prelnary evaluation of a novel system or methodology
Word count: up to 2000 words
Abstract up to 200 words; excluding: Abstract, Title, Tables/Figures and References
Tables and Figures up to 5
References (vide supra – Original Article) 3. Case Series
Minimum of three and maximum of 20 cases Up to 1,000 words; excluding: Abstract, Title, Tables/Figures and References
Abstract of up to 200 words; structured; (vide supra)
Statistical statements here are expressed as 5/8 (62.5%)
Tables and Figures: no more than three
References: maximum of 20 4. Case Report
Report on a rare case or uncommon manifestation of a disease of academic or practical significance Up to 750 words; excluding: Abstract, Title, Tables/Figures and References
Abstract of up to 100 words; unstructured;
Tables and Figures: no more than three References: maximum of 10
5. Systematic review Review of the literature on topics of broad scientific interest and relevant to EMJ readers
Abstract structured with headings as for an Original Article (vide supra)
Text should follow the same format as what is required of an Original Article
Word count: up to 8,000 words, excluding abstract, tables/Figures and references
Structured abstract up to 250 words
Tables and Figures up to 8 6. Teaching Article A comprehensive treatise of a specific topic/subject, considered as relevant to clinical medicine and public
health targeting EMJ readers

386
By invitation of the Editorial Board; but an outline of proposal can be submitted
Word limit of 8,000; excluding abstract, tables/Figures and references
Unstructured Abstract up to 250 words 7. Editorial
By invitation of the Editorial Board, but an editorial topic can be proposed and submitted
Word limit of 1,000 words: excluding references and title; no Abstract
References up to 15. 8. Perspectives
By invitation of the Editorial board, but a topic can be proposed and submitted
Word limit of 1,500
References up to six 9. Obituaries
By invitation of the Editorial board, but readers are welcome to suggest individuals (members of the EMA) to be featured.
Preparation of manuscripts
Manuscripts must be prepared in English, the official language of the Journal.
On a single separate sheet, there must be the title of the paper, with key words for indexing if required, and each author's full name and professional degrees, department where work was done, present address of any author if different from that where work was done, the name and full mailing address of the cor-responding author, including email, and word count of the manuscript (excluding title page, abstract, references, figures and tables). Each table/figures/boxes or other illustrations, complete with title and footnotes, should be on a separate page.
All pages should be numbered consecutively in the following order: Title page; Abstract and key-words page; main manuscript text pages; References pages; acknowledgment page; Figure-legends and Tables
The Metric system of weights and measures must be used; temperature is indicated in degrees Centi-grade.
Generic names should be used for drugs, followed by propriety brand name; the manufacturer name in parenthesis, e.g. diazepam (Valium, Roche UK)
Statistical estimates e.g. mean, median proportions and percentages should be given to one decimal place; standard deviations, odds ratios or relative risks and confidence intervals to two decimal places.
Acronyms/Abbreviations should be used sparingly and must be given in full, at first mention in the text and at the head of Tables/foot of Figure, if used in tables/figures.eg. Blood Urea Nitrogen (BUN). Interstitial lung disease (ILD).
Use the binomial nomenclature, reference to a bacterium must be given in full and underlined - under-lining in typescript becomes italics in print (e.g. Hemophilus influenzae), and later reference may show a capitalised initial for the genus (e.g. H. influenzae)
In the text of an article, the first reference to any medical phrase must be given in full, with the initials following in parentheses, e.g., blood urea nitrogen (BUN); in later references, the initials may be used.
Manuscripts for submission should be prepared in Microsoft Word document file format Submission of manuscripts
As part of the submission process, authors are required to check off their submission's compliance with journals requirements

387
All manuscripts must be submitted to the Editor-in-Chief of the Journal with a statement signed by each author that the paper has not been published elsewhere in whole or in part and is not submitted elsewhere while offered to the Ethiopian Medical Journal. This does not refer to abstracts of oral com-munications at conferences/symposia or other proceedings.
It is the author's responsibility to proof-read the typescript or off-print before submitting or re-submitting it to the Journal, and to ensure that the spelling and numerals in the text and tables are accu-rate.
Authors should submit their work through the Ethiopian Medical Journal website; [email protected].
Conflict of interest Authors should disclose at the time of submission of manuscripts any conflict of interest, which refers to situations in which financial or other personal considerations may compromise, or have the appearance of compromising their professional judgment in conducting or reporting the research results They should declare that there is no conflict of interest to declare if there is none, Manuscripts review procedures The procedures for manuscripts review include:
Within one week of receipt of a manuscript, the Editorial Board will review it in reference to (i) conformity with the Journal's "guidelines to authors (revised version available in all issues starting January 2020)", (ii) relevance of the article to the objectives of the EMJ, (iii) clarity of presentation, and (iv) plagiarism by using appropriate software
The Editorial Board has three options: accept manuscripts for external review, return it to author for revision, or reject it. A manuscript not accepted by a board member is blindly reviewed by another board member. If not accepted by both, the manuscript is rejected by the Editorial Board. Decision will be made by the sug-gestion of a third Editorial Board member if the decisions of first two do not concur.
Once accepted for external review, the Editorial Board identifies one (for brief communication, case reports, and teaching articles) or two (for original articles) reviewers with appropriate expertise. The reviewers will be asked to review and return manuscripts with their comments online within two weeks of their receipt. Reviewers have four options; accept, accept with major revision, accept with minor revision, or reject.
A Manuscript accepted subject revision as suggested by reviewers will be returned to the corresponding au-thor. Author(s) will be given four weeks to respond to reviewers' comments, make necessary changes, and return the manuscript to the Editorial Board. A Manuscript not returned within the specified time will be considered withdrawn by the author(s).
Manuscripts with minor revisions will be cleared by the Editorial Board and accepted for publication. Those with major revisions will be returned to external reviewers and follow the procedures as outlined for the ini-tial review.
General information
The Editorial Board reserves the right for final acceptance, rejection or editorial correction of papers submitted. However, authors are encouraged to write an appeal to the Editor-in-Chief for reconsideration of rejected manu-scripts or any other complaints they might have.
Accepted papers are subject to Editorial revision as required and become the copy-right of the EMA Twenty-five reprints of published articles are supplied free to the first/corresponding author.
The Editorial Board welcomes comments on the guidelines from Journal readers.
Privacy statement The names and email addresses entered in this journal site will be used exclusively for the stated purposes of this journal and will not be made available for any other purpose or to any other party.
388
Acknowledgment We gratefully acknowledge the financial support of the U.S. Centers for Disease Control and Prevention (CDC) ob-tained through the CDC-EMA Cooperative Agreement No. 5U2GPS000834. We also warmly thank those who gener-ously give donations to meet the Journal's cost.
THE ETHIOPIAN MEDICAL JOURNAL
The Ethiopian Medical Journal, founded in 1962, appears four times a year and is available from the Secretary, EMA House, Addis Ababa, or by mail P. O. Box 3472, Addis Ababa, Ethiopia. Request for previous issues is wel-comed. For this and any other information, please contact us through: e-mail: [email protected] Tel. 251-1-158174 or 251-1-533742; Fax: 251-1-533742
The Journal contains original articles and research of special relevance to the broad issue of medicine in Ethiopia and in other developing countries. It is listed in the Index Medicus and Current Contents. Its ISSN number is ISSN 0014–1755. If you wish to subscribe to the Journal, please complete the section below and return it to the Secretary. The Subscrip-tion rates are:
Ethiopia: Eth. Birr 372 annually, postage included; World-wide: US$ 120, airmail postage included …………………………………………………………………………………………………………………………. Request to: The Secretary, Ethiopian Medical Journal, P. O. Box 3472, Addis Ababa, Ethiopia. I wish to subscribe to the Ethiopian Medical Journal for the Year(s) …………. to ……………. Name .....................................................................................................................…….. Address ................................................................................................................……… I enclose my subscription fee of ...................................................................................
Signed ................................ Cheques should be made payable to the Ethiopian Medical Journal. If payment is made by Bank Transfer (A/C No. 0172018004100, Commercial Bank of Ethiopia, Addis Ababa Branch), please ensure that the Secretary of the Ethio-pian Medical Journal is notified of the transfer.
NOTICE TO MEMBERS OF THE ETHIOPIAN MEDICAL ASSOCIATION If you are a paid–up member of EMA, and have not received your copy of EMJ, please notify the secretary, with the support of your ID card or letter from your hospital. Also, if you are transferred to a different hospital or institution, please return the following change of address form PROMPTLY. NAME (in block) ...................................................................................................……... FORMER ADDRESS: ............................................................................................…….. P. O. BOX .................................. CITY/TOWN ............................................................. NEW ADDRESS ................................................................................................………… INSTITUTION ..........................................................................................................……. P. O. BOX ....................... CITY/TOWN ..................................................................…..