• The airway diameter affects the aerodynamics of the air flow ...
100
p . 1 Extrath oracic Inspirable Mass Region Fraction (Enters via nose or mouth) Thoracic Mass Fraction (Penetration past terminal larynx) Tracheobronchial Region Respirable Mass Fractio n (Penetrati on past terminal bronchioles) Pulmonary Region Figure 3-1 . Diagrammatic representation of three respiratory tract regions . • The airway diameter affects the aerodynamics of the air flow and the distance from the agent molecule or particle to the airway surface . • The cross-sectional area of the airway determines the airflow velocity for a given volumetric flow . • Airway length, airway diameter, and branching pattern variations affect the mixing between tidal and reserve air . Differences in airway sizes and branching among species therefore may result in significantly different patterns of transport and deposition for both particles and gases . Alveolar size also differs between species, which may affect deposition efficiency due to variations on the distance between the airborne particle or molecule and alveolar walls (Dahl et al ., 1991a) . 3-5
-
Upload
khangminh22 -
Category
Documents
-
view
3 -
download
0
Transcript of • The airway diameter affects the aerodynamics of the air flow ...

p. 1
Extrathoracic Inspirable MassRegion Fraction
(Enters via noseor mouth)
Thoracic MassFraction
(Penetration pastterminal larynx)
TracheobronchialRegion
Respirable MassFractio n(Penetrati on pastterminal bronchioles)
PulmonaryRegion
Figure 3-1. Diagrammatic representation of three respiratory tract regions .
• The airway diameter affects the aerodynamics of the air flow and the distance fromthe agent molecule or particle to the airway surface .
• The cross-sectional area of the airway determines the airflow velocity for a givenvolumetric flow .
• Airway length, airway diameter, and branching pattern variations affect the mixingbetween tidal and reserve air.
Differences in airway sizes and branching among species therefore may result in significantly
different patterns of transport and deposition for both particles and gases . Alveolar size also
differs between species, which may affect deposition efficiency due to variations on the
distance between the airborne particle or molecule and alveolar walls (Dahl et al ., 1991a) .
3-5

p. 2
Effect on Particle Deposition Mechanisms
Air flow in the extrathoracic region is characterized by high velocity and abrupt
directional changes . Therefore, the predominant deposition mechanism in the ET region is
inertial impaction . In this process, changes in the inhaled airstream direction or magnitude of
air velocity streamlines or eddy components are not followed by airborne particles because of
their inertia . Large particles (> 5 µm in humans) are more efficiently removed from the
airstream in this region .
Impaction remains a significant deposition mechanism for particles larger than 2 .5 µm
aerodynamic equivalent diameter (dadin the larger airways of the TB region in humans and
competes with sedimentation, with each mechanism being influenced by mean flow rate and
residence time, respectively . As the airways successively bifurcate, the total cross-sectional
area increases . This increases airway volume in the region, and the air velocity is decreased .
With decreases in velocity and more gradual changes in air flow direction as the branching
continues, there is more time for gravitational forces (sedimentation) to deposit the particle .
Sedimentation occurs because of the influence of the earth's gravity on airborne particles .
Deposition by this mechanism can occur in all airways except those very few that are
vertical. For particles =4 µm dae, a transition zone between the two mechanisms, from
impaction to predominantly sedimentation, has been observed (U .S. Environmental Protection
Agency, 1982b) . This transition zone shifts toward smaller particles for nose breathing .
Differences in airway size and branching pattern are a major source of interspecies
variability in inhaled dose for the TB region . Larger airway diameter results in greater
turbulence for the same relative flow velocity (e .g., between a particle and air) . Therefore,
flow may be turbulent in the large airways of humans, whereas for an identical flow velocity,
it would be laminar in the smaller experimental animal . Relative to humans, experimental
animals also tend to have tracheas that are much longer in relation to their diameter . This
could result in increased relative deposition in humans because of the increased likelihood of
laryngeal jet flow extending into the bronchi . Human airways are characterized by a more
symmetrical dichotomous branching than that found in most laboratory mammals, which have
highly asymmetrical airway branching (monopodial) . The more symmetrical dichotomous
pattern in humans is susceptible to deposition at the carina because of its exposure to high ai r
3-6

p. 3
flow velocities toward the center of the air flow profile. These comparative airway anatomy
differences are summarized in Table 3-2 .
Sedimentation becomes insignificant relative to diffusion as the particles become
smaller . Deposition by diffusion results from the random (Brownian) motion of very small
particles caused by the collision of gas molecules in air . The terminal settling velocity of a
particle approaches 0 .001 cm/s for a unit density sphere with a physical diameter of 0 .5 µm,
so that gravitational forces become negligible at smaller diameters . The main deposition
mechanism is diffusion for a particle whose physical (geometric) size is <0 .5 µm .
Impaction and sedimentation are the main deposition mechanisms for a particle whose size is
greater than 0.5 µm. Hence, dae = 0 .5 µm is convenient for use as the boundary between
the diffusion and aerodynamic regimes . Although this convention may lead to confusion in
the case of very dense particles, most environmental aerosols have densities below 3 g/cm3
(U.S . Environmental Protection Agency, 1982b) . Diffusional deposition is important in the
small airways and in the PU region where distances between the particles and airway
epithelium are small. Diffusion has also been shown to be an important deposition
mechanism in the ET region for small particles (Cheng et al ., 1988, 1990) .
These mechanisms for particle deposition in the respiratory tract are schematically
represented in Figure 3-2. Experimental deposition data and extrapolated estimates on
humans that illustrate these same concepts are shown by the curves for PU (alveolar) and TB
deposition in Figure 3-3 . Deposition fraction is shown plotted against particle diameter . It is
important to note that over half of the total mass of a typical ambient mass distribution would
be deposited in the ET region during normal nasal breathing, with most of this being coarse
particles (U.S. Environmental Protection Agency, 1986c) . With mouth-only breathing, the
regional deposition pattern changes dramatically compared to nasal breathing, with ET
deposition being reduced and both TB and PU deposition enhanced . Oronasal breathing
(partly via the mouth and partly nasally), however, typically occurs in healthy adults while
undergoing moderate to heavy exercise. Therefore, the appropriate activity pattern of
subjects for risk assessment estimation remains an important issue . Miller et al . (1988)
examined ET and thoracic deposition as a function of particle size for ventilation rates
ranging from normal respiration to heavy exercise . A family of estimated deposition curves
were generated as a function of breathing pattern . Anatomical and functional differences
3-7

p. 4
•Vi p f+1 7 M f+1 .r .i y .-.N F.
a~ O O O O O O ~O O
t- 00N
C) 0N
0N ~
cc o~aH d• %n t,4 C~ cq ~ C.Vz H0
a -Zi~w q~ ~P,6 co C11
f~' ~ r: •m C_ v
H v ~~~ O N ~O M O t~ G, W~CI~ a~ N N .•+ N •••~ .•-~ ••+ ..
~
F w pi O O Vdl pca
W a a Q'
~ 04
cc uco •5 eo ~' A a CO .0 o U) > co v) 9 > •5 >
P~I o
F~ ~N y N M ~O h •~ y.~ N N
U F, O O O O O
W F b cn ~ O ~ `O N N
O 00 A,C b ~N m atl ~ ia m
a Qg pca a Q~ 00 0 0a r°. N Q C !f q Q Q ~• q Q
F o 0o x~ 0 e a e4
W
°
d R1 W e6 R N
N C id U~~., " ia~~ ~ wa ° p a ~N 'O W ° 0 m « ia cd c~ •~ c6 > _
'G •~ ,~ N d~C" W . .V. d~ ~ •d N C U O ~ U OO c~ w d av w c~ a~ o av w ai a a ~, o °Oao d C a v a a3 a a o .~ U u o a °a 00
cc
M Q "W Ma b b ~ 00
o ir o o
co ~~ ~~ -° ~'0dp ~a . ~ ° e
`n O `~ p
o w
eo
Cc$ N •a ,X z ew
E~ ~ ~ae°q W ~ao o aw)x II8 00
~o~ x 6 r~° wo C~ ,~ o4v a C7 ~co ~ o
3-8
p. 5
AirDirectional Velocity
ChangeI --------*~Very
Abrupt Impaction
Impaction
Sedimentation
Less -~-~-Abrupt
InterceptionImpaction ~
~ .. . . - •MildDiffusion 0
ElectrostaticPrecipitation
Figure 3-2 . Schematic representation of selected parameters influencing regionaldeposition of particles in the respiratory tract .
Source : Adapted from Casarett (1975) ; Raabe (1979) ; Lippmann and Schlesinger (1984) .
between adults and children are likely to yield complex interactions with the major
mechanisms affecting respiratory tract deposition, again with implications for risk assessment .
Age-dependent dosimetric adjustments may be possible, pending data availability for children .
3-9

p. 6
1 .0
Range of Pulmonary Deposition,0 .9 :::<:•;:::: Mouth Breathing
--••-• Estimate of Pulmona ry Deposition, Nose Breathing0.8
IN
Range of Tracheobronchiai Deposition, -Mouth Breathin g
0.7 .. . . . . . Extrapolation of Above to Point (E ) Predictedby Miller et al . (1979) <:>::>~:>~•:
C 0 . 60 00 Emmett et al . (1982) ; 337cm $ s•+, 6-s Breathing Cycle
❑■ Heyder et al . (1986) ; 750 cn, s s•+ ,4-s Breathing Clyde0.5 A ♦ Heyder et al . 1986 : 250 an s s 4-s Breathing '' '. -~4~~ ;?::::: ;:<;O ♦ Svartengren (1986)O ~• .~~
•~ `'•' •'-\ ~ :~•:L:v~:i:~'>..:Open Symbols: Tracheobronchial Deposition :: ::~-
_ 0.4 Solid Symbols: Alveolar Deposition 0- ~ ~~~`~~•:•::•~.~ . : ~. <• -.•;~:;~:~,::>~:,::~~:::.,~~.x~~.~;.::<:>•~•• ~~ ~:.:.; . •~• •~ •.~ -<-~s>:•~:;.:::~.;~:>~,;~:.;:::~•<<\<.>.;;::::;" 0
\/~ • \ w. :;;.:;;:>+..:w:ti•. ~:~ ~:\\,. ;'++ .... ~:.:::::::: 0W 0
.7 4~ ~4'C•Gi:{>ti~~k`'v, . : .
. ` -~°' N.~
.{i:~ :::tii•4avry•\~\\~ti: •k~t•k.~.i•
. . . :..iti`~~M14ti.~~~kv...: 4v . . . .. . :: -:. .:<~;~::̀::w;.;~,. \~ «~~''.'•••>:;•::~::>::>:':;z:>:•: :::.>•:•>.,~t:•~ :. .,•:;::<>:::;:;;:::::;::::;:::::::;::;>.::>::>;:::>:>.:'z~~ : ::::; ::•:;:::~: •:. ..\, ~::::•::• ' ->:•>s:•::::::z-::::~•:::::::•>::::::<:::•>:~<;:::::::;:: ~::::.;x::: :-:;:::~ ;̀».:• ~:•~:w•: ~:::::: :~ w •:. .. ~. :. .. }:.;~:~\,., :\\ . . ;\->::..::: _;•~:..: ;;:.::::.;::.::\t-.,,.,::.:-..:y::-::.:•`::::::~: tl•
. ;::;;>.0.2 ::~.:~::.: •:: •: ;•:: -:<-~.-, ..:.::.:::>:; o.`,•::>..:ti~`-:;?:?:::::;:?_?::~::;::?;:::c?:;:~:2~::i:~:~;:;:;;:::`:~:~;:J:~:=:~;:$:-:~: - ?~?!:-:-~::-;~::: •
4]YifiCKitiCiii VNfiL•T•.•ih•:{x::n•y::•• ❑~\.i`:3}.Ai.iiiii:::i:y::-::-i-:::. .:i:~:ti•iy 'ti?•} . . :: :• • :
•0.1 ❑
0
0.1 0.2 0.3 0.4 0.5 1.0 2.0 3.0 4.0 5.0 10 12141620
Physical Diameter (µm) Aerodynamic Diameter (Nxn)
Figure 3-3 . Regional deposition in humans of monodisperse particles by indicatedpart icle diameter for mouth breathing (pulmonary and tracheobronchial)and nose breathing (pulmonary) . Deposition is expressed as fraction ofparticles entering the mouth or nose. The PU band indicates the range ofresults found by different investigators using different subjects and flowparameters for PU deposition fo llowing mouth breathing . The TB bandindicates intersubject variabi lity in deposition over the size range measuredby Chan and Lippmann (1980) . The extrapolation of the upper bound ofthe TB curve in the larger particle size range also is shown and appears tobe substantiated by data listed in the legend .
Source: U.S. Environmental Protection Agency (1986c) .
Effect on Gas Deposition and Uptake
The major processes affecting gas transport involve convection, diffusion, absorption,
dissolution, and chemical reactions . These mechanisms are schematically represented in
Figure 3-4 . Predictions of lower respiratory tract distribution of ozone from a detailed
dosimetry model that accounts for many of these processes is -shown in Figure 3-5 .
3-10

p. 7
Velocity
Inspiration
Expiration
~ ~.<O
Inspiration , , Jd'J~~~JO ~~oo
AlveolarSacs
Diffusion
FijLayer
Figure 3-4. Schematic representation of selected parameters influencing regionaldeposition of gases in the respiratory tract .
Source: Overton (1984) .
Beginning at the trachea, the model predicts the net ozone dose (flux to air-liquid interface)
slowly decreases distally in the tracheobronchial region and rapidly decreases in the
pulmonary region (U .S . Environmental Protection Agency, 1993b) .
3-11

p. 8
~ 10
Mllal
C9O - ,
C •' . .
10-7 • ~ 'EalCM VT (mL) f (bpm
) = Human 800.0 15.0c 10$ Rat '"' - 1 .98 66.0 .'.•- Guinea Pip . . .,, .. . . . . .. 2.63 60.9 •- ~ ~•E Rabbit 13.20 38.8
~ (No absorption in the URT)
=L 10'...
OaZ 1 do
I TB PU-~•I
Zone 0 2 3 4 5 6 7 8 RabbitOrder 0 2 3 4 5 6 7 8 91011 12 13 14 Guinea Pig
Generation 0 2 4 6 8 10 12 14 151617 19 21 23 RatGeneration 0 2 4 6 8 10 12 14 161718 20 22 23 Human
Figure 3-5 . Net dose of ozone versus sequential segments along anatomical model lowerrespiratory tract paths for human, rat, guinea pig, and rabbit . In general,each segment represents a group of airways or ducts, with common featuresas defined by the designers of the anatomical model (human and rat :generation; guinea pig: order; rabbit: zone) . For a given species theplotted dots represent a predicted dose that corresponds to a given segment .The dots have been joined by lines for ease of interpreting the plots ; theselines do not represent predicted values except where they intercept the dots .TB = tracheobronchial region. PU = pulmonary region .
Source: Overton and Miller ( 1988) .
The bulk movement of inspired gas in the respiratory tract is induced by a pressure
gradient and is termed convection (U.S . Environmental Protection Agency, 1982b) .
Convection can be broken down into components of advection (horizontal movement of a
mass of air relative to the airway wall) and eddy dispersion (air mixing by turbulence so that
individual fluid elements transport the gas and generate flux) . Molecular diffusion is
superimposed at all times on convection (bulk flow) due to local concentration gradients .
Absorption removes gases from the lumen and affects concentration gradients .
3-12

P . 9
The average concentration of a gas in a tube (i .e., an "idealized" airway) can be
described by one-dimensional convection and dispersion . A pulse of substance moves down a
tube with an average air velocity equal to the medium's (air's) average velocity, and its
spread in the axial direction is governed by an effective dispersion coefficient that can be
described by Fick's law of diffusion (Overton, 1984) . This effective dispersion coefficient is
larger than the molecular diffusion coefficient except in the PU region . As illustrated in
Figure 3-4, perpendicular transport in this region can carry a gas molecule into the alveoli,
but because of the alveolar walls, there is minimal net axial transport with respect to that in
the central channel . The average axial transport is slowed because only a fraction of the
molecules in the cross-sectional average can move axially, generally resulting in a dispersion
process with a dispersion coefficient less than the molecular diffusion coefficient, although it
is possible for longitudinal mixing to be enhanced by the presence of alveolar septa leading to
dispersion coefficients that are actually greater than the molecular diffusivity (Federspiel and
Fredberg, 1989) . The dispersion coefficient is a function of the molecular diffusion
coefficient, the total air volume, and the generation's alveolar airspace volume (Overton,
1984) . The dispersion coefficient is also influenced by the absorption process (Dayan and
Levenspiel, 1969) .
Molecules are transferred from the flowing gas into the liquid layer lining the airway
wall by molecular diffusion . A simple description for this process postulates a thin, stagnant
air layer based on the assumption that the air velocity becomes very small as the air-liquid
interface is approached . Transfer through this layer depends on the gas-phase diffusion
coefficient, layer thickness, and the gas concentrations at the boundaries of the layer . If the
molecules are absorbed, then the concentration of the gas in the diffusion layer is decreased
at the liquid boundary. As the ability of the liquid to remove the gas increases, the relative
concentration at the gas-liquid boundary decreases, and the mass transfer from the gas phase
to the liquid phase increases . For poorly soluble, hydrophobic, and nonreactive gases, little
gas is removed by the airways . The transport into and chemistry of the adjacent surface
liquid and tissue layers will be described in Section 3 .1 .2 .2, which describes the
physicochemical characteristics of gases and vapors . These next layers can serve as a "sink"
to help "drive" the delivery of gas across this layer . Capillary blood flow (i .e., perfusion) is
important to the gas uptake in that it removes the gas or its chemical reaction products on th e
3-13

P. 10
other side of these liquid and tissue layers . Therefore, addressing species differences in
alveolar ventilation, regional perfusion rates, and cardiac output is critical to estimating initial
absorbed dose . The importance of regional differences (e .g ., the distance from the air to the
capillaries in the tracheobronchial region is 7 to 20 times that in the pulmonary region
[Overton and Miller, 1988]) and interspecies differences in the anatomic relationship of the
airspace to capillary blood should be considered . Transfer also is enhanced by a reduction in
diffusion layer thickness that is dependent on the nearby rate of airflow ; the higher the flow
velocity, the thinner the layer, again emphasizing the significance of airway morphology .
Although the preceding figures have only illustrated these concepts for the lower
respiratory tract, the influence of anatomy on comparative deposited dose is also important in
the ET region. Species differences in gross anatomy, nasal airway epithelia (e .g., cell types
and location) and the distribution and composition of mucous secretory products have been
noted (Harkema, 1991 ; Guilmette, 1989) . The geometry of the upper respiratory tract
exhibits major interspecies differences (Gross and Morgan, 1992) . Figures 3-6 and 3-7 show
diagrams of the ET region that illustrate the differences between Rhesus monkeys and F344
rats. Cross-sections for the four levels shown on the transverse section are at comparable
locations in the monkey and rat . Figure 3-8 shows the influence these differences have on
airflow patterns in the region. In both species shown in Figure 3-8, studies have
demonstrated complex inspiratory flow streams, exhibiting regions of simple laminar,
complex secondary (vortices, eddies, swirling), and turbulent flows (Morgan et al ., 1991) .
Differences in nasal air flow patterns between these two species and humans (Hahn et al .,
1993) is an important consideration for extrapolation of dose associated with nasal toxicity .
Good correlation has been shown between routes of flow, regional secondary flows,
turbulence, and impaction of airstreams on the airway wall, with the reported distribution of
formaldehyde-induced nasal lesions in these species, illustrating the influence of the nasal
anatomy on gas deposition for this reactive and soluble gas (Morgan et al ., 1991 ; Kimbel l
et al ., 1993) .
In order to model the effects that the intricate morphological structure of the respiratory
tract have on the nature of gas mixing and flows, representations of the mechanical mixing
imparted by tube bifurcations, turbulence, and secondary flows due to molecular diffusion
must be formulated . Location, diameter, and length of airways are considered to be the
3-14

P. 11
. -:::`~,i,.•::1 2 ~ 4 . .,: .y
.t• . y .;:.,~~-.yy{ y .,•.
.>-:.:.
, :• ~1 • 4ti v`',•.•.• ~vyy},: ~` vv `~ •4y`~.,t'. tiv.{•'r' . 4.4at~ti.v ~t. ~ y• \\ '~`v ~~~ ~ti~;.\;•::: '•::\t•~ ~ -~~. ~.\`\ti.~+:?~;;~,,;t':.ti.` • ,iv~4~M1,+~ I ';.' \k4~.^y~`.
+ \T~
. . . u•{.}ix}y~}yi ~.. X+~:'`-•
. :X+ .: . . . : . .:%i:'i:•.. .. :n . ... . .,~ .~':
,:i}~+.}:• -•.:. .•..v ..:. :
:n . .: . .. . . ~,• ~ . .-:.v-:. .vv.v y.•:~.t•,`v w y.
•\.ti':•::~:.̀:{-iv-'-,-. :;+ --•' 4.':•y'
. . . . .,.y. . . :. . . : .
`1•i:ti•C`+~v`,t;i}, i"::;~{y `::A ~::~ {yv:i:~]T
~v-'y,?Ji~:••,+{:tiv 4 ~v - `~-;'•:y , w, ;.,,:~: •<:::;... :>.::-~ •::: : y;;::::•>:=~ ~ :::s;:::
.~~ . `:::{.::'• ;:
- ~. .~ ,• ~ :~~~ <;~ •a:>.:>:,`• ~ ~ti.
4 ::: •:.~i:•:ti::; . \• ..u .,.:• .`ti.,:: . .+-: '
k~+̀.''-•~.v'w•p. •u:i:::{5 '~+ h~:{*.
•i •hv ` :j~>:iti'ii~ •4}h~ v. v •;} r.i. y~ :v:
{`{, ..`•{•t•" '{. ,`tn;:`•`~ '♦̀;4`y'. ., 4 •:4'::..{,::. v
:\\.~;. •' :{, . ti: v.̀~' ' .̀~4:{~iY .;'t.{~. vv}.~'Y k::.tin•iti ~\- ':'•i:+ ~•v
. .t•.iii;::,~ :::
:Y{, :~ • ~i i`~,yt.{ ~\,~ '`v.'•..`~~`4.̀y., ~'v'+' ~~
:v^y+.`-+{.
~ ,:{`ti :ti 'r.y~4 v "2\`~ •`~~. ;•M1y.4{..
. \`•\k<::+• vv.
@. •`v~k. ~:i;.y`~V_i~ ~\~ \~6\• ,~+:.~ - ~
Y?:Vi "
'{;:•.̀\'".:: .. `;.'•. '
2
, 4,~ 4L .Arp- .
. M~ ~~V~ 3Uq.e11 lF~.
andorgan et at.
Figure 3-6. Diagram of the nasal passages for the F344 rat
f indica(1984). Cross-sections are shown at the our
correspond to comparable locations forthe ~~o~ ~~e~e illustrated
region ofFigure 3-7. Note the greater complexity
posterior ion
the rat nose compared to that of the monkey 'the macro
ofsmatc nature of
covered by olfactory epithelium, reflecting
rodents.
Because of the morphology of the1984) .relevant measurements for gas transpo
rt (Overton,
respiratory tract and air flow patterns, the relative contribu tion of these gas transport
processes is a function of location in the respiratory tract and point in the breathing cycle
• Overton, 1984) . The
(i .e., depth and rate) (U.S . Environmental Protection Agency, 1982b ;
interspecies differences in the nature and structure of the respiratory tract, as summarized in
Table 3-2, c ritically influence the differences intransport and deposi tion of gases across
3-15

p. 12
2 g 4~ ..,+•~: . ;..:-:,~, .::.: ..•_
. ::u~.<.. ~::s:s?.•:: ~ ' - . :::•%. .:T:--. . .::: . 4
:h4ji"::•n. ~:Eti:':-%:i%\`~%iv:[:i::;?..~{~:i:3T:j! i• ~} ~::•~
;?-ti • `+4-~~ti \,u•\4ti~Y:.~.
~:i\;`:;`:;. !:{:22i:y%'+.L. •: •;:-v-:T:..\%••.:+-•:•x:.:. _,: ~ Ni~:u
.t . .:..u+..v+:+•. \'•...•.\~:-~:.;•..+v\-)•3v `v
•••~~' •~••~ :j:%iT'i.iti:ti:$u••:.'~~:1:•:':.: •Tv3iv.:' .4'::.
•:~u\\%: ~:ti\y~:l~~
~•iv:
:- •~:}~.\.C+~-;.
v~tiv
J •J i:j~•;~,\•
J T;itiii4:%+v.•`i.+.+%~\'v<'•:
:::~
:i•u_~< 4••: . .' V\\:ti+,+
::•:x~Y
:-,'f~.\vi
:"•
u•"u~Ti'~+~
•.~}• : k••'v:i'•%:' u-;:u ~ .•\., \. . .:.'u \, . .. ':::+'%•-u.~.+\•• '\ \•. .1 u`:• \ \ .+ .•'•\-- :n\..u. . •v:~\v,•••: ~\.:u . .•.•. . . u•"::::::. 4 .. .~•'•4 u~•t.;~if;.•%'\u:i•'?::• iu-u •.
. +\ : •. :'t'uu•. ti~\:i':'i:: . u•+.\•:%.+::.~'~t' ,• ~-.-\• . .T::\:•::i ~`~+'•:• u \ •:: .uu•\ .•':•~ ~`:-:;v .u . •u . . .~ut• •,-+ u;1{ 'ii^:'_ T+::•';;j. j•::. ` .. ... \ . . . .. . . \. •:
:"\ . .v • _: . \ u u+.+ .u'•. .v~ ....Q•
:
\ . ...: .: ~,:n•~\ .•' ~!~`•~•~•~•~'•'+`%•~• ~':. •\ .~:i->:l • . .u .vv: h•:.:v~si'%:i:~'~:'v •..+•u. . .-:u •,. . uv._.:•.:: .: . .:. . . .:. ,;:. .: . .: + .. ::-:+"••. . \•:;.' '::
+•: •1.i•:•%: :i\•%T:•i~ . 4it%u.••:•'A .•\.••A.v .v . •\u..-•.u~. .::: \n .v\: u•.u~.,+,;.\v ..y.\•:\nLuv. . .
::.'tii'Xv:~~•: •̀:•:̀::i Lovd 4::;::+:. T':: <` •:.;":: - <:; ~; < ~ ~;; ~ <:;'' '::::
Love13Lovel 2
L,eye11us monkey modified from
passages for the Rhesusof the nasal p on the transverse section indicate
Figure 3-7 . Diagram Broken lines respiratory (anterior fine)M.onticello et al . (1989)
• epithelium (dorsal line)unction of squamouswith the
the olfact°ry~ ond tothe '~ ~ratory with indicated and corr Pepithelia and the resp'
.
illustratedcross sections are shown at the four ~~re 3-6.
comparable locations for rat
degree of within species size variability and
The airways also show a considerable osition variability seen withinspecies. onsible for the del
) the primaryfactor resp anatomy Additionally, agethis is most likely 1985) Sex also ~fluences airway
single species (Schlesinger,summarized in this Section 3 .1 1. are the
has dramatic influences on respiratory dYnamics.
theThe differences in respiratory tract anatomy particle deposition. In addition to
species differences in gas and P~ composition of the airway
respiratory tract, the regional thickness and comp as absorption
structur
e structural o f basis the for the sl
erespm a function of cell types and distributions) is an important factor in g
epithehu (3-16

p. 13
Male F344 Rat Male Rhesus MonkeySuperior Dorsa,
StreamA Dorsal Medial M . Me 6el A
3tmam Stream
. - `- -_-~-~Interior Dowel
Stream
J~r--
SuFw'wr Ventral flexor V.ntrat Mrddle StreamStream Stream
Medial AnteriorJet
Ventral AnteriorVortex
MWOm Ut.re lB Oursal Lateral Stream
Slraum ------------
X
_. . . Dorsal Anterio r - "'----• -.------ .•,40 ----- vortex Superior Ventral Lateral
Ventral Lateral Stream
~reDm tnlenor Ventrel LateralMiddleLateral Stream
Vortex Middle Streem
Ventral Lateralvortex
Ventral AANeiorVortex
Figure 3-8 . Inspiratory airflow patterns in upper respiratory tract of F344 rat andRhesus monkey. A = major medial streams; B = major lateral streams.Black and white arrows depict high and low velocity airstreams,respectively.
Source: Morgan et al . (1991) .
and contributes to the solubility and extent of reaction of the gas . Other anatomic and
physiologic factors that influence gas uptake include (1) ventilation, which affects the tidal
volume and ventilation to perfusion ratios ; (2) body build, which affects the volume of
distribution (including cardiac output and tissue volume) ; and (3) metabolic capacities . These
are all factors to evaluate when estimating inhaled dose, interpreting injury response, and
extrapolating effects between species .
3-17

p. 14
3.1 .1.2 Clearance Mechanisms
Deposited material is removed from the respiratory tract by clearance mechanisms,
which vary depending on the site of deposition and the properties of the inhaled toxicant .
The speed and efficiency by which the inhaled toxicants are cleared can be critica l
determinants of their toxic potential . Rapid removal lessens the time available to cause
critical damage to the respiratory tract tissue and to permit systemic absorption of agents that
have target organs other than the respiratory tract (Menzel and Amdur, 1986) . The clearance
mechanisms involved include (1) exhalation of volatiles ; (2) mucociliary transport;
(3) macrophage phagocytosis ; (4) chemical reactions; (5) metabolism by various cell types ;
and (6) dissolution and absorption into the blood, lymphatic, or lung fluids.
Inhalation represents a route of exposure in which a variety of interrelated factors
influence not only the nature of the effects (respiratory versus systemic) but also the manner
by which they occur. The influence of target cell populations in the respiratory tract on the
nature of the response is a factor unique to the inhalation route of exposure . Unlike the liver,
a first-pass organ in oral exposures that has a more homogenous population of limited types
of cells, the respiratory tract has more than 40 cell types (Sorokin, 1970) . Xenobiotics,
which exert their action by direct effects of the parent compound or by metabolites, can
manifest profound differences in the nature and degree of response, depending on the route of
exposure and subsequent availability to interact with various cell populations .
The likelihood of adverse effects in the respiratory tract can be affected b y
(1) production, distribution, and reactivity of metabolites by and among specific cell types ;
(2) the degree to which detoxication systems are overwhelmed (e.g ., glutathione depletion) ;
(3) efficiency and sensitivity of repair processes (e .g., type II cell proliferation) ;
(4) efficiency of clearance processes ; (5) airway mechanics ; and (6) mechanism of action
(e.g ., pharmacologic or immunologic) (Bond, 1989 ; Boyd, 1980 ; Calabrese, 1983; Gram
et al ., 1986; Trush et al ., 1982; Nadel et al ., 1986; Marin, 1986) .
Exhalation of volatile agents (including from administration routes other than inhalation)
is an important excretory pathway that is dependent on tissue levels and exposure regimen .
For inhalation exposures, the exposure duration influences the amount of chemical entering
the systemic circulation, the amount metabolized, and the concentration of the chemical in
tissues. Using a simulation model, Fiserova-Bergerova et al . (1984) demonstrated that for
3-18

p. 15
chemicals that are not metabolized, tissue concentrations of "poorly soluble" (Hoil/gas< 10)
chemicals change very minimally after 2 h of exposure . The pulmonary uptake rate
approaches zero at the end of a 2-h exposure and apparent equilibrium is established. "Easilysoluble" chemicals (10 < Hoil/gs !g 10,000) require more than 1 day of exposure to reach
apparent equilibrium and "highly soluble" chemicals (Hoil/gs > 10,000) require more than1 year of exposure. If the chemical is metabolized, pulmonary uptake and the amount
metabolized increase with exposure duration, but the effect of metabolism may be more
complex if exposure concentrations are so high that metabolic pathways approach saturation
kinetics and cause metabolism to deviate from first order kinetics .
Conversely, pulmonary clearance decreases with increasing biosolubility (refers to
solubility of gases and vapors in biologic materials) and thereby affects the accumulation of
chemicals during intermittent exposure regimens . Simulation of an 8 h/day, 5 days/week
schedule for a 3-week exposure duration to a 70 kg man showed that poorly soluble
chemicals (as defined previously) have no tendency to accumulate in the body, although
easily and highly soluble chemicals do have a tendency to accumulate because the
intermissions between exposures are not long enough to allow the chemical to be removed
from adipose tissue (Fiserova-Bergerova et al ., 1984) . Excursions in exposure concentrations
had a great effect on tissue concentrations of poorly soluble chemicals, but had little effect on
tissue concentrations of highly soluble chemicals . Concentrations in well-perfused tissues
were more affected by excursions in exposure concentrations than concentrations in muscle or
adipose tissues .
The results of these simulation efforts emphasize the uncertainty that the dual function
(i .e., uptake and exhalation) of the respiratory system adds to any attempt to estimate either
respiratory tract or extrarespiratory (remote) "dose" of volatile agents . These simulations
also emphasize the need for careful consideration of the uptake, metabolism, and excretion
parameters for these agents when attempting the exposure duration and concentration
conversions discussed in Chapter 4, and when ruling out the possibility of a respiratory tract
endpoint when using oral data as part of the data base .
There are numerous defense systems that protect the respiratory tract . While some
defense systems are truly protective, it must be kept in mind that many "activate" inhaled
agents and may be responsible for adverse effects . Defense systems can be physical in nature
3-19
p. 16
(e.g ., filtration of particles by nasal hair), mechanical (e .g., expiration), enzymatic, or
cellular (e .g., phagocytosis) .
Nasal hair can be envisioned as a first line of defense since it can help prevent contact
of toxicants (e.g ., particles) with underlying epithelia . However, trapping of agents in the
diffusion layer underlying cilia in the nose can serve as a source of irritation and more
serious adverse effects . Some agents (e .g., formaldehyde, acrolein) have been shown to
cause severe lesions in nasal epithelial cells (Morgan et al ., 1986). The mouth also can be
envisioned as another first-line defense system . Mouth-breathing in humans can result in
solubiliza.tion of vapors in saliva and deposition of particles . Swallowing can reduce
pulmonary exposure but increase presentation of the agent systemically via . gastrointestinal
tract absorption . Once an agent penetrates to the tracheobronchial region, agent deposition
and/or solubilization occurs in the mucous blanket covering the surface epithelium .
Deposited particles can be cleared from the respiratory tract completely or they may be
translocated to other sites within this system . Clearance mechanisms are regionally distinct,
in terms of both routes and kinetics (Dahl et al ., 1991a) . Particles deposited on the anterior
nares are cleared by mechanical processes such as nose wiping, blowing (humans), o r
sneezing (animals/humans) . Particles in this area can have long biological half-lives . Those
deposited in the nasopharynx or oropharynx, however, are swallowed within minutes and
passed through the esophagus down to the gastrointestinal tract .
Particles deposited in the TB region are transported out of the respiratory tract by the
mucociliary system, an interaction between the mucous secretions and the cilia that provide
the mechanisms of movement . Such transport occurs along the area from the larynx to the
terminal bronchioles . Insoluble particles are transported up to the esophagus where they are
swallowed. Soluble particles may dissolve in the mucus. Generally, the biological half-lives
of insoluble particles deposited in the TB region are on the order of hours .
Clearance of particles from the PU region of the lung generally takes the longest,
usually a rapid phase of hours, and slower phases with biological half-lives of days, months,
or years, depending on particle size and solubility . A major clearance process for "insoluble"
particles is phagocytosis by alveolar macrophages . These cells then may be removed from
the PU region after reaching the distal terminus of the mucociliary transport system or by
migrating through the interstitium to the lymphatic system. Highly soluble particles wil l
3-20

p. 17
dissolve in alveolar lining fluid and enter the blood or lymph directly (Johanson and Gould ,
1977; Dahl et al ., 1991a) .
It is likely that dissolution rates and rates by which dissolved substances are transferred
into blood are related mostly to the physicochemical properties of the material being cleared
and are essentially independent of species . On the other hand, different rates of mucociliary
transport in the conducting airways or of macrophage-mediated clearance from the PU region
may result in species-dependent rate constants for these pathways (Dahl et al ., 1991a) . For
example, clearance of insoluble particles from the PU region of mice and rats is much faster
than that in dogs and humans, which have similar clearance rates of inhaled particles (Snipes,
1989a,b) .
As discussed in Chapter 2, an overload phenomenon can occur with excessive particle
exposures that can alter the clearance kinetics of lung dust burdens and confound the
interpretation of toxicological effects (Morrow, 1992) .
Conceptually, uptake of a gas requires that it move from the airway lumen through the
surface-liquid lining layer, the tissue layer, and the capillary endothelium, to reach the blood.
This passage is influenced by the physiochemical properties of the gas as well as the
biochemistry and thickness of the layers between the lumen and blood. For reactive gases,
the sequence in which anatomic sites are affected appears to be more dependent on
concentration than on exposure duration. However, at a given local anatomic site and at a
specific concentration, the stages in the pathogenesis of the lesion relate to the duration of
exposure (U.S . Environmental Protection Agency, 1986d, 1993b) . The rate of mucous
transport also affects the gas transport mechanisms in the diffusion layer at the gas/liquid
interface along the airways. The rate varies with the depth of the airways (greater velocities
in the proximal airways) and across species . For example, a very highly reactive gas may
not reach the blood if it reacts biochemically with mucus and the mucus layer has sufficient
volume (thickness) to serve as a sink . This same gas may not react with the saturated lipid of
surfactant; and if deposited significantly in the PU region, could reach alveolar tissue . The
thickness and efficiency of the epithelial barrier also influences absorption . Both of these
main factors (liquid lining and epithelial barrier) are present in all species but have
species-specific differences, only a few of which have been quantified . Mucus is a complex
secretion with contributions from various epithelial cells . The numbers and distribution of
3-21

p. 18
these cells may affect the composition and properties of the mucus, which in turn interacts
with the physicochemical properties of the agent . The species differences in the thickness of
the alveolar epithelial cells could account for variations obse rved in the diffusion of gases into
the bloodstream (Crapo et al ., 1983) . The lung also is a very efficient excretory organ for
volatile organic chemicals after the exposure ceases or is lowered . The efficacy of PU
excretion correlates directly with the saturated vapor pressure of the chemical and indirectly
to water solubility .
Cell Types
A variety of other cellular defense mechanisms can be marshaled, which c an diminish
or sometimes exacerbate toxic insult . The numerous cell types found in different species
contribute to the varying clearance patterns from the respiratory regions and differences in the
nature of the response . Table 3-3 presents the distributions of various cell types across
species commonly used in inhalation toxicologic investigations. Different mammali an species
have different amounts and isozyme distribution of cytochrome P-450 in their Clara cells,
which could account for differences in metabolism of some agents . Recent investigations
have also shown species differences in cellular org an ization at the terminal respiratory
bronchioles/alveolar duct junctions and in the ultrastructure of the same cell type across
species (St. George et al., 1988) . The possible functions of these cell types are provided in
Table 3-4, and the differences seen in the cell types across species are summarized i n
Table 3-5 . Such species differences are important to consider when determining if the
laboratory animal is an approp riate model for the chemical's mech an ism of action . For
example, the rat may be an inappropriate species for the evaluation of hypersensitivity
because of its lack of mast cells .
Alveolar macrophages are the predomin ant cell type responsible for clearance of
particles from the PU region . Particles are phagocytized and transported within macrophages
to the mucociliary escalator . This alveolar macrophage clearance of the PU region is
considerably slower (weeks to years) than clearance in the TB region. Gases and soluble
particles that escape phagocytosis by alveolar macrophages c an be dissolved in the lining
fluid . This dissolution would be governed by physicochemical characteristics such as
3-22

P. 19
4)
+ + . + + + + . . + -F- + + +
+ + o + + + + ~ ~ ~ + + + +
x v
+ + .n + + + + ~ + + + + + ~ + + + y
W O
W wV + + ~ + + + + ~ + + + V + +
0
;0~
' ~ oaa +
W ~ U
;04i i F + ~w + + + + + ~ + + + ~
0 .0-v~ v z ~
u u u II II u u( ~ ^ + + + + + ~ + + + Q) V-I dQ "+V •••q •r+
'0
+ + + + + +
z ++ ~++++b .~M x
00
o ~ o
to.
'G y cd CO°M°CDN
789 Z ~Da° o 0 a 0
i a ~ ~ ~ m -~ ~ 0 II II II II II II~ 0 wHHH 'n w ga zz ..w ~~ z +`+, c0 ~ U p~
3-23

p. 20
TABLE 3-4. SOME SPECIFIC LUNG CELL TYPES AND THEIR FUNCTIONS
Cell Types Location and Function
Epithelium
Clara cells Nonciliated cells of the tracheobronchial region ; high xenobioticmetabolic activity; secretory; function not well-defined ; may serve as
precursor of goblet and ciliated cell s
Ciliated cells Most common epithelial cells in airways; may secrete mucous-likesubstances ; controls perciliary fluid
Type II alveolar Generally covers <5% of alveolar surface ; secrete surfactant ; replace
injured Type I cells ; high xenobiotic metabolic activit y
Type I alveolar Large and covers considerable surface area per cell ; covers >95% of
alveolar surface; forms the alveolar epithelium and facilitates gas
exchange; low metabolic activity ; incapable of self-reproduction
Mucous Mucus-secreting
Serous Mucus-secreting ; perciliary fluid; stem cell
Brush cells Chemoreceptor cells ; preciliated
Globule Immunoglobulin transportation ; releases inflammatory mediators
leukocyte
Endocrine Secreto- and vaso-regulatory
Submucosal
Goblet (mucus) Epithelial linings ; common in trachea and bronchioles ; contribute
cells to mucus production
Serous cells Mucus-secreting ; perciliary fluid ; stem cell/proliferative
Endocrine cells Secretes amines and neuropeptide s
Lymphocytes Immunoresponsive
Myoepithelial Expulsion of mucu s
Bronchoalveolar Migratory cells located throughout respiratory tract ; release mediatorsmast cells of bronchoconstriction when antigens bind to IgE antibodies on surface
Macrophage Phagocytic ; secrete mediators of inflammatory reactions ; modulate
lymphocytes and otherwise participate in immune respons e
Endothelial cells Approximately 40% of lung parenchyma cells ; metabolize blood-borne
substances ; proliferative
Fibroblasts Predominant in alveolar wall and constitutes the basement membrane ;
(interstitial) become activated during disease states and produce elastin andcollagen; proliferation leads to fibrosis, modulation of growth,bronchial tone, and mucosal secretion
Source: Jeffery (1983), Bowden (1983), Marin (1986), Nadel et al . (1986), Plopper et al . (1983), Burri (1985),
Brain (1986) .
3-24

p. 21
TABLE 3-5. MAIN SPECIES DIFFERENCES IN EPITHELIAL CELLSAND GLANDS
Epithelial Morpholog y
Thickness and pseudostratificationThickness and st ructure of "basement membrane"
Mucus-secreting cells
NumberHistochemistryPredominant ultrastructure type
Clara cells
Morphology (smooth endoplasmic reticulum)Dist ribution
Endocrine cell frequency
Ciliated cells
Extent of coverageStructure of rootletLamellar bodiesGlycogen stores
Presence of b rush cell
Basal cells
NumberShapeTonofilaments
Presence of Globule Leukocytes
Innervation
ExtentDistributionType
Gland Morphology
AmountDistributionMain histochemical cell typePresence of collecting ductInnervation
Source: Jeffery (1983) .
3-25

p. 22
reactivity, water solubility, lipophilicity, and ability to serve as substrate for activation and/or
detoxification enzymes .
Certain cell types can be stimulated to release mediators, such as mast cell release of
histamine. Histamine can cause bronchoconstriction, which can be protective, by limiting the
amount of pollutant inhaled, or can be toxic, by limiting oxygen uptake. Synthesis or
metabolism of prostaglandins (leukotrienes) also can affect airway and vascular caliber . The
chemotactic factors released can recruit phagocytic cells involved in clearance . It should be
recognized that the respiratory tract contains a variety of different cell types that possess
different metabolizing potential and are distributed in a manner that varies among species .
Lists of common cell types and their functions are provided in Tables 3-3 and 3-4 .
Macrophages, for example, constitute a cellular protection system and not only protect inner
surfaces of the respiratory tract from damage caused by particles and microorganisms, but
also have the potential to cause damage themselves because the proteases and mediators that
are useful in destroying microbes or physical agents can also destroy healthy tissue (Rossi,
1986) (Brain, 1986) . Although recruitment of macrophages to the lung is related to the
toxicant dose, the adaptive increase in macrophages can be exceeded (Bowden, 1986) . This
threshold may vary among species . The alteration of macrophage functioning has the
potential to shift the balance between protective and adverse effects .
Epithelial secretions in response to injury may recruit scavenger cells such as
polymorphonuclear leukocytes, which can biotransform inhaled agents . More recent data on
cellular morphometrics and interspecies differences in cell populations (Mercer and Crapo,
1987; St . George et al ., 1988) will aid in dosimetry adjustments for clearance, metabolism,
and uptake. As an example, modeling for the metabolic capacity of the human lung instead
of considering it only as a physical barrier can result in disparate estimates of extrapulmonary
dose (see Section 3 .2) . Estimates from models that account for respiratory tract metabolism
may better fit experimental data on systemic dose surrogates for some chemicals .
Concurrent with the action of inhaled agents upon critical cell types in the respiratory
tract, a portion of the dose in the PU region is likely to be transported across the alveolar
epithelium and enter systemic circulation . Changes in permeability can result from the action
of some of the mediators and proteases mentioned . The greater the amount reaching the
systemic circulation, the greater the likelihood for adverse effects in other systems (e .g. ,
3-26

p. 23
liver, kidney, central nervous system) . The rapidity and extent to which systemic absorption
occurs and the time-to-steady-state blood levels are influenced by (1) ventilation rates and
airway mechanics, (2) blood transit time in capillary beds (i .e., perfusion limited) ,
(3) metabolic conversion in the respiratory tract and other organs, (4) alveolar surface area,
(5) thickness of the air-blood barrier, and (6) the blood :air and blood :tissue partitioncoefficients. Many of these factors vary among species and, therefore, should be considered
in key study identification .
After the inhaled agent enters systemic circulation, the liver may produce additional
metabolites that, if the half-life is sufficiently long, may re-enter the lungs and exacerbate the
portal-of-entry effects or produce additional adverse effects (Boyd and Statham, 1983 ; Yostet al ., 1989) . Some other agents, that do not require bioactivation, have been shown to
damage the lung when applied systemically (Kehrer and Kacew, 1985) .
Metabolism
The effect of respiratory tract metabolism on the toxicity of inhaled materials is thought
to be important for many chemicals because (1) high concentrations of xenobiotic
metabolizing enzymes occur in the nose and substantial concentrations occur in the lower
respiratory tract ; (2) the respiratory tract tissues are the first exposed to inhaled chemicals and
are exposed to the highest concentrations (barring tissue-specific uptake) ; (3) the products of
respiratory metabolism may have different toxicities from those of hepatic metabolism ; and
(4) tissues at risk to toxic metabolites formed in the respiratory tract are different from those
formed in the liver (Dahl et al ., 1988) . The metabolic capacity of the lower respiratory tract
has been recognized for many years and nasal metabolism has recently been shown to be
significant for some compounds (Dahl et al ., 1988) . Accordingly, it is useful to consider that
inhaled chemicals may be extensively metabolized in the nose or in the lower respiratory tract
and both the metabolites and the parent compound may be cleared via the blood or by
mucociliary clearance .
Metabolism of potentially toxic inhaled compounds is achieved by a variety of enzyme
reactions involving oxidation, reduction, hydrolysis, and conjugation . The enzymes may
work individually, concurrently, or consecutively to detoxicate or, in some cases, activate
inhaled foreign compounds (Ohmiya and Mehendale, 1984 ; Minchin and Boyd, 1983 ; Dahl
3-27

p. 24
et al ., 1987) . These enzymes may vary in activity across species and organs (Ohmiya and
Mehendale, 1984 ; Ziegler, 1980; Tynes and Hodgson, 1985 ; Plopper et al ., 1983; Litterst
et al ., 1975) . Depending on the chemical being metabolized, each of these enzymes may
play a role in either an activation or detoxication pathway. The balance between activation
and detoxification governs the rate of delivery of bioactive metabolite to the macromolecular
target site (Dahl et al ., 1991a) .
The oxidation and reduction reactions are catalyzed primarily by the cytochrome P-450
and flavin-containing monooxygenases (FAD-MO) . The cytochrome P-450 isoenzymes are
ubiquitous hemoproteins located in the endoplasmic reticulum of a variety of cells and are
responsible for the oxidation of foreign compounds . Isoenzyme specificity, inducibility,
catalytic activity, and localization in the rabbit and rat lung (Domin and Philpot, 1986 ;
Vanderslice et al ., 1987) have been elucidated . Until recently, it was thought that the
cytochrome P-450 isoenzymes were the only primary monooxygenases in the lung .
However, recent studies have shown that the FAD-MO play an important role in detoxication
of foreign compounds . FAD-MO have also been demonstrated to exist in various isoenzymic
forms, with substrate specificity and mechanisms different from those of cytochrome P-450
(Ziegler, 1988) .
The Clara cells lining the respiratory and terminal bronchioles are thought to be the
primary site of cytochrome P-450 because of the presence of endoplasmic reticulum .
However, the ultrastructure of the Clara cell varies across species (Plopper et al ., 1980) .
In the ox, cat, and dog, more than 60% of the cytoplasmic volume is glycogen with a
relatively small proportion of the cell volume containing endoplasmic reticulum or
mitochondria . Therefore, species differences in Clara cell ultrastructure can be reflected in
significant differences in xenobiotic metabolism potential (Plopper et al ., 1983; St . George
et al ., 1988) . Differences in localization of cytochrome P-450 activity have been suggested
as a likely basis for some differences in respiratory tract toxicity (O'Brien et al ., 1985) .
Epoxide hydrolases and carboxy esterases are hydrolytic enzymes found in both the
nasal cavity and lower respiratory tract tissues . The epoxide hydrolases further metabolize
potentially toxic oxidation products after initial cytochrome P-450-dependent metabolism of
aromatic compounds or alkenes . The carboxy esterases hydrolyze carboxylic esters to the
respective alcohols and carboxylic acids . At least two types of aldehyde dehydrogenases have
3-28

p. 25
been detected in the nasal cavity and may be important in modifying the toxicity of volatile
aldehydes such as formaldehyde and acetaldehyde (Casanova-Schmitz et al ., 1984) .
Aldehyde dehydrogenase also occurs in the lower respiratory tract, particularly in the Clara
cells of the distal bronchioles .
Individually or in concert with the cytochrome P-450 isoenzymes, conjugation reactions
are catalyzed by the glutathione-S-transferases that transform potentially toxic parent
compounds or activated metabolites into nontoxic water soluble compounds . The glutathione-
S-transferases may catalyze conjugation reactions with toxic metabolites formed by the
cytochrome P-450, rendering them harmless and easier to excrete from the body . However,
GSH conjugation with certain substrates (e .g., 1,2-dibromoethane and several other related
haloalkenes) has been shown to provide reactive species capable of producing nephrotoxicity
(Monks and Lau, 1989). The cofactor required for these reactions is glutathione (GSH) .
The GSH is synthesized in the lung, as well as in other major organs, and also is reduced
from the oxidized state (GSSG) to the reduced state (GSH) by GSH reductase . Under
extreme conditions of GSH depletion in the lung, it has been hypothesized that
extrapulmonary GSH is mobilized and transported to the lung from the liver (Berggren et al .,
1984) . The GSH has been identified in isolated Type II epithelial cells, Clara cells, and
ciliated cells of the lung, but it is not known if it is present in all pulmonary cells . The GSH
also is the cofactor utilized by the enzyme GSH peroxidase . The GSH peroxidase catalyzes
the metabolism of hydrogen peroxide and organic peroxides formed by the ozonization of
unsaturated fatty acids. Other key antioxidant components in the lung include ascorbic acid,
a-tocopherol, superoxide dismutase, and catalase (Massaro et at, 1988) .
3.1 .2 Physicochemical Characteristics of the Inhaled Toxicant
The physicochemical characteristics of the inhaled agent will influence the deposition
and retention within the respiratory tract, translocation within the respiratory system,
distribution to other tissues, and ultimately, the toxic effect . Therefore, it is important to
consider characteristics of the inhaled agent as well when attempting to evaluate and
extrapolate the effects of a particular exposure .
3-29

p. 26
3.1.2.1 Particles
For a given particle exposure, the two most important parameters determining
deposition are the mean diameter and the distribution of the particle diameters . The size,
density, and shape of the particles influence their aerodynamic behavior and, therefore, their
deposition (Raabe, 1979 ; U .S. Environmental Protection Agency, 1982b, 1986c) . The
definition of diameter for a spherical particle is unambiguous, but for irregularly shaped
particles, a variety of definitions exist . Nonspherical particle size often is described by its
aerodynamic properties . Fibrous material may be described by actual length, actual diameter,
coil length, coil diameter, aspect ratio, or coil-to-aspect ratio .
Information about particle size distribution aids in the evaluation of the effective inhaled
dose (Hofmann, 1982) . Recommendations defining the particle size ranges for inspirability to
the various regions have been published by an ad hoc working group of the International
Standards Organization (1981) . Particle diameter and size distribution should be provided to
the risk assessor to completely characterize the aerosol in order to estimate respiratory tract
deposition with any confidence and to evaluate relevance to toxicologic potential . Appendix
H provides definitions of particle size diameters and distributions . Appendix G presents a
dosimetry model that accounts for interspecies differences in regional respiratory tract
deposition and illustrates the influence of particle size and distribution on deposition .
3.1.2.2 Gases and Vapors
The deposition site and rate of uptake of a volatile chemical are determined by its
reactivity and solubility characteristics . Therefore, the pharmacokinetics of gases and vapors
are governed b y
• Rate of transfer from the environment to the tissue,
• Capacity of the body to retain the material, and
• Elimination of the parent compound and metabolites by chemical reaction,metabolism, exhalation, or excretion .
As mentioned in Section 3 .1 .1 .1, the transport processes in the liquid and tissue layers
adjacent to the airway lumen influence the relationship of the gas with the air-liqui d
3-30

p. 27
boundary. Physicochemical characteristics of the gas that contribute to the relativ e
importance of these processes include its chemical reactivity and solubility .
The chemical reactions of the gas with both the liquid and tissue layers may be
important. For example, reactions with the liquid layer could result in an increased flux
from the airway but reduce (relative to no reactions) the delivery of the gas to the tissue .
If the gas is the only toxic molecule, then this reaction would protect the tissue . Conversely,
if the reaction products are toxic, then reactions with the tissue layer would increase the
delivery of toxic molecules to the tissue (Overton, 1984) . Chemical reactivity with the
biological constituents of the tissue is similarly important to the gas's toxic potential to the
respiratory tract tissue-and to the amount of gas and reaction products that enter the blood for
potential extrarespiratory toxicity . Theoretically, knowledge of all the chemical species
involved and the reaction rates of the reactants and products is necessary to characterize a
system for dosimetry. Sometimes the complexities may be reduced into relative
classifications (e .g., slow, fast, instantaneous) using approximation techniques for time and
spatial dependence (Overton and Miller, 1988) .
Gases that are not soluble or reactive are relatively inert to the airways and penetrate to
the alveoli . Examples are nitrogen and volatile hydrophobic chemicals . The major factor
driving the uptake of these gases is the removal of the gas from alveolar air by capillary
blood . The concentration in alveolar air and capillary blood is generally considered to reach
equilibrium . Therefore, uptake of alveolar gases depends on blood :air partitioning,
ventilation/perfusion ratio, and air and blood concentrations .
For gases that are soluble, uptake is linearly related to solubility (Overton and Miller,
1988) . There are many different expressions for the solubility of gases, differing in terms of
units as well as in terms of what chemical form of the gaseous species in the liquid phase is
related to the gas-phase quantities . As long as the concentration of dissolved gas is small,
and the pressure and temperature are not close to the critical Aemperature and pressure, then
Henry's Law is obeyed (Overton and Miller, 1988) . It should be noted that the Henry's Law
constant is independent of chemical reactions so that it refers to the parent molecular form of
the gas in water and air, and not the total quantity absorbed in water to air quantities .
Considering the importance of chemical reactions as described above, solubilities as indicated
by Henry's Law constants may not be appropriate to fully describe uptake . Further,
3-31

p. 28
ex trapolation of Henry 's Law constants from water data to biological fluids and tissues is not
always appropriate, particularly for organic compounds .
Because uptake and disposition of inhaled vapors and gases are driven by the
equilibration of their partial pressures in tissues with their pa rtial pressures in ambient air,
solubility may be aptly described by Ostwald solubility coefficients at body temperature .
Ostwald solubility coefficients and partition coefficients (concen tration ratios of the volatile
chemical in two phases with equilibrated partial pressures) have the same values (Fiserova-
Bergerova et al ., 1984). Partition coefficients are essentially a measure of the affinity of a
chemical for one medium compared to another at equilib rium. The blood:air (or blood :gas)
partition coefficient is a critical determinant in the uptake and achieved blood concentration of
volatile org an ic chemicals (Dahl et al ., 1991a) . Absorption generalizations based on
molecular weight are not recommended. As an example, the difference in solubility between
methanol and ethane, which have similar molecular weights, is a result of the presence of the
hydroxyl group on methanol. Interspecies comparisons necessitate consideration of th e
effects of the differences in anatomy and physiology desc ribed previously, but it can
generally be stated that the less water soluble and less reactive the gas, the more similar the
deposition will be between humans and laboratory animals . The tissue :gas partition
coefficient of a chemical has been shown to correlate with its fat : gas and blood : gas partition
coefficients so that linear correlation equations may provide a useful means of estimating
tissue:gas and blood:gas partition coefficients (Fiserova-Bergerova and Diaz, 1986) .
Similarly, the fat :air partition coefficient can serve as an index of whether high
concentrations of the chemical will occur in the fat . The fat compartment plays an important
role in accumulating and sto ring lipophilic chemicals both du ring and after exposure. The
chemical stored in fat becomes available for redistribution by the systemic circulation after
the end of exposure when the arterial blood concentration decreases relative to the fat . This
"postexposure" phenomenon due to fat solubility can be an important factor influencing the
amount of chemical metabolized, because that chemical that leaches from the fat compartment
after exposure is available for metabolism, which can continue for a signifiant period of time
after removal from the exposure atmosphere . Therefore, interspecies differences in body fat
can induce interspecies differences in uptake, distribution, accumulation, and toxicity of
lipophilic chemicals .
3-32

p. 29
Metabolism of the parent compound can modulate uptake of inhaled gases from th e
respiratory tract and is also probably the most important determinant of tissue dosimetry when
metabolites are the toxic moiety . The cells and tissues at risk from toxic metabolites depend
not only on the source of the metabolites but also on their kinetic properties . The toxic
effects of metabolites that react at fast rates are confined to the activating enzyme or cell .
If metabolite reaction rates are moderate, effects will largely be restricted to the activating
tissue and to nearby tissues. Slow-reacting metabolites may themselves be potential substrates
for further metabolism .
The effect of concentration and exposure time on the above parameters of reactivity and
metabolism should be addressed . Uncatalyzed reactions follow pseudo-first-order kinetics if
the gas is inhaled at "low" concentrations (Overton and Miller, 1988) . "High" vapor
concentrations can qualitatively change the chemical fate and toxicity . Depletion of
biological coreactants, or just an increase in the concentration of the chemical to the point at
which reactions can no longer be treated as pseudo-first-order, may qualitatively change the
fate and potentially the toxicity of an inhaled gas . For chemicals metabolized according to
Michealis-Menten kinetics, metabolism may be saturated at high concentrations and become
described by zero-order kinetics . Further, saturation of metabolic pathways can alter the
metabolites formed and the resultant toxicity of the metabolized compound .
Such effects of inhaled vapor concentration on metabolism are not limited to systemic
enzymes, but also occur in localized areas within the respiratory tract . In general, the
concentrations of inhalants in the respiratory tract mucus will be higher than anywhere else in
the body, barring selective tissue uptake . Therefore, the xenobiotic metabolizing enzymes of
the respiratory tract will reach maximum reaction velocities at inhaled concentrations far
lower than those needed to bring extrarespiratory (systemic) enzymes to maximum velocities .
Therefore, it is likely (except at extremely low inhaled gas concentrations) that local
metabolizing areas within the respiratory tract, particularly the nasal tissues, will not follow
linear enzyme kinetics (Dahl, 1990) .
The physicochemical gas characteristics of reactivity and solubility will interact with
physiologic parameters such as pulmonary ventilation, cardiac output (perfusion), metabolic
pathways, tissue volumes, and excretory capacities . The relative contribution or interaction of
these is, in turn, affected by the exposure conditions (concentration and duration), so that a s
3-33
p. 30
emphasized previously, integration of these various factors is necessary to estimate the
deposited (on airway surfaces) and absorbed doses in order to assess toxicity .
3.2 MODELING COMPARATIVE DOSIMETRY OF INHALEDTOXICANTS
The preceding discussion provides an overview of the various factors that affect the
disposition (deposition, uptake, distribution, metabolism, and elimination) of inhaled
toxicants . Major determinants include (1) the respiratory tract anatomy and physiology and
(2) the physicochemical characteristics of the inhaled toxicant . The relative contribution of
each of these factors is a dynamic relationship . Further, the relative contribution of these
determinants is also influenced by exposure conditions such as concentration and duration .
As discussed in Chapter 1, a comprehensive description of the exposure-dose-response
continuum is desired for accurate extrapolation from experimental conditions and dose-
response assessment. Therefore, an extrapolation model should incorporate all of the various
deterministic factors described in the previous section into a computational structure .
Clearly, many advances in the understanding and quantification of the mechanistic
determinants of chemical disposition, toxicant-target interactions, and tissue responses are
required before an overall model of pathogenesis can be developed for a specific chemical .
Such data do exist to varying degrees, however, and may be incorporated into les s
comprehensive models that nevertheless are useful in describing delivered doses or in some
cases, target tissue interactions .
Because much information on the mechanistic determinants of target tissue dose,
toxicant-target interactions, and tissue responses is likely lacking for any given chemical to
which this RfC methodology will be applied, the default dosimetry adjustments are derived
from models that incorporate only the major determinants of chemical disposition . The
defaults are determined categorically for particles versus gases, and within gases, for those
more reactive (defined as including local metabolism) and soluble than nonreactive and
insoluble. It is recognized, however, that these are default dosimetry models, so that use of
models that incorporate a more comprehensive description of the exposure-dose-response
continuum may take precedence when such a model is judged to provide a more accurate
3-34

p.31
description . The next sections describe the rationale for the default models and dosimetry
adjustments provided in detail in Chapter 4 and the Appendices G, I, and J . Examples of
more robust models are provided to illustrate considerations of the appropriateness of the
default versus alternative model structures . The summary for this section then provides
considerations for judgement of the relative value of different modeling structures . This
judgment may be based on whether the structure of the alternative model is superior to that of
the default, (e.g., incorporates additional known mechanistic determinants) or if it empirically
results in a better correlation between "dose" and "effect" .
3 .2.1 Particle Deposition Model Based on Available Data
The preceding discussion in this chapter described the various mechanisms and
anatomical dependencies of deposition in the respiratory tract . A theoretical model to
describe deposition would require detailed information on all of these parameters (e .g ., exact
airflow patterns, complete measurements of the branching structure of the respiratory tract,
pulmonary region mechanics) across the various species used in toxicity studies .
As described in Appendix G, an empirical model was instead developed due to the limited
availability of these types of data . An empirical model is a system of equations fit to
experimental data . Measurement techniques for deposition are such that deposition can be
defined only for the major respiratory tract regions (i .e., ET, TB and PU) and not for
localized areas such as the respiratory versus olfactory epithelium . The choice of the
experimental data and description of the model are provided in Appendix G .
The default model used in the RfC methodology estimates regional deposition . "Dose"
may be accurately described by deposition alone if the particles exert their primary action on
the surface contacted (Dahl et al ., 1991a), but since the RfC is defined as a dose-response
estimate for chronic exposures, a more appropriate dose metric for particle exposures may be
to take into account clearance of the deposited dose and thereby calculate the retained dose
and the dose rate to extrarespiratory tissues . Incorporation of clearance kinetics into the
dosimetric adjustments awaits development of data enabling comparable modeling of
clearance across species. Often the physicochemical properties or mechanisms of action of
the inhaled toxicant (particle or gas) can be used to gauge the relative importance of the
various factors controlling inhaled dose . For example, the model of Yu and Yoon (1990) for
3-35

p. 32
diesel exhaust incorporates clearance components such as transport of deposited particles to
the lymphatic system . A model that described the retained dose for diesel particles was
necessary because the toxicity is related to particle overload .
3 .2.2 Gas Categorization Scheme Directs Default Gas Modelin g
Numerous model structures have been used to describe toxicant uptake in the respiratory
tract. The type of model often reflects the physicochemical characteristics of the gases to
which they are applied . For example, the model of Miller et al . (1985) for the respiratory
tract uptake of ozone (highly reactive and moderately water soluble) is a detailed, distributed
parameter model . Key elements incorporated into this convective-diffusion-chemical reaction
model include (1) anatomic dimensions of the airspace and tissue thickness (2) dispersion in
the airspace, (3) reactivity in the liquid lining (mucus or surfactant) covering the cells of the
lower respiratory tract, and (4) lateral mass transport resistance from the airspace to the blood
(Overton et al ., 1987). Models for highly reactive and highly soluble gases (e .g.,
formaldehyde, hydrogen fluoride) have emphasized the requirement to account for scrubbing
of the gas from the airstream by the upper respiratory. tract (Aharonson et al ., 1974; Morgan
and Frank, 1977; Morris and Smith, 1982 ; Hanna et al ., 1989 ; Cassanova et al ., 1991) .
Such models are not applicable to a nonreactive gas such as styrene, however .
The chemical-specific or class-specific nature of these models has been dictated by the
physicochemical characteristics of the subject gases, and therefore, any single model is not
applicable to the broad range of gases that the RfC methodology must address . Dahl (1990)
categorized gases as stable, reactive, or metabolizable based on their thermodynamic and
kinetic properties . Various concepts of "dose" can be related to these properties and the
mechanism of action (e .g ., macromolecular bound fraction as dose for reactive gases versus
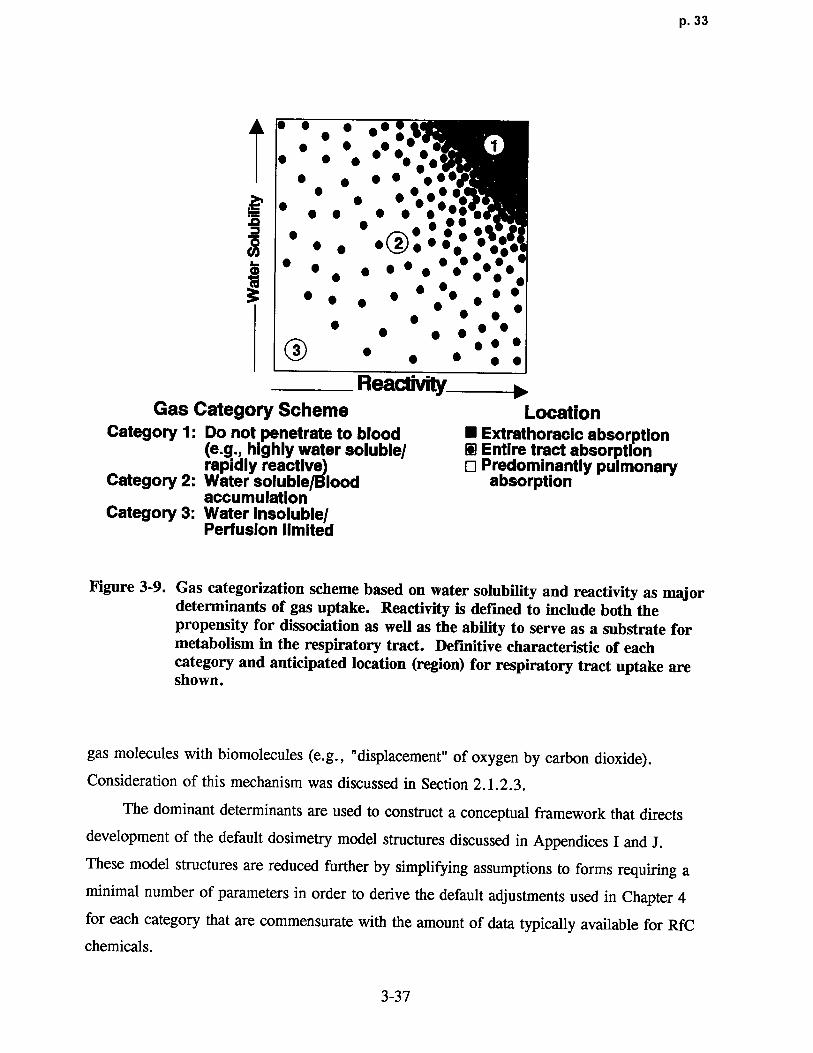
inhaled dose for stable asphyxiants) . A gas categorization scheme was constructed based on
physicochemical characteristics as determinants of gas uptake as shown in Figure 3-9 .
A similar scheme has been developed by the International Commission on Radiological
Protection (1993) . The definition of reactivity includes both the propensity for dissociation as
well as the ability to serve as a substrate for metabolism in the respiratory tract . The scheme
does not apply to inert gases that exert their effect by reversible "physical" interactions o f
3-36
p. 33
• • • • •• • ~• • • •• •• •: •: • 1
• • • • j••r• • • • • • ••
'.-~~' • • • • • ••••~ •• •
~ • • • •O•••• • ••••16.0 • • • • • • • • • ••• ••3 • • • • • •• • • •
• ~ • •
• • • • • • •O • • • •
• • • •
ReaclivityGas Category Scheme Location
Category 1 : Do not penetrate to blood ■ Extrathoracic absorption(e.g ., highly water soluble/ D Entire tract absorptionrapidly reactive) ❑ Predominantly pulmonary
Catego ry 2: Water soluble/Blood absorptionaccumulation
Category 3 : Water insoluble/Perfusion limited
Figure 3-9 . Gas categorization scheme based on water solubility and reactivity as majordeterminants of gas uptake. Reactivity is defined to include both thepropensity for dissociation as we ll as the ability to serve as a substrate formetabolism in the respiratory tract. Definitive characteristic of eachcategory and anticipated location (region) for respiratory tract uptake areshown .
gas molecules with biomolecules (e .g ., "displacement" of oxygen by carbon dioxide) .
Consideration of this mechanism was discussed in Section 2 .1 .2 .3 .
The dominant determinants are used to construct a conceptual framework that directs
development of the default dosimetry model structures discussed in Appendices I and J .
These model structures are reduced further by simplifying assumptions to forms requiring a
minimal number of parameters in order to derive the default adjustments used in Chapter 4
for each category that are commensurate with the amount of data typically available for RfC
chemicals .
3-37

p. 34
The two categories of gases with the greatest potential for respiratory effects ar e
(1) gases that are highly water soluble and/or rapidly irreversibly reactive and (2) water
soluble gases which may also be rapidly reversibly reactive or moderately to slowly
irreversibly metabolized in respiratory tract tissue . The objective of the default modeling
approach is to describe the effective dose to the three major regions of the respiratory tract
(ET, TB, PU) by addressing the absorption or "scrubbing" of a relatively water soluble
and/or reactive gas from the inspired airstream as it travels from the ET to PU region . That
is, the dose to the peripheral regions (TB and PU) is affected by the dose to the region
immediately proximal . The appropriateness of assessing proximal to distal dose
representative of the scrubbing (uptake) pattern is supported by the proximal to distal
progression pattern of respiratory tract toxicity with increasing concentration that is observed
with many chemicals (Jarabek, 1994) . At low concentrations of highly water soluble and/or
irreversibly reactive gases, observed effects are largely isolated to the ET region . At higher
concentrations, more severe effects occur in the ET region and toxicity is also observed to
progress to the peripheral regions . The severity of toxicity also progresses distally with
increased exposure concentrations . As for the default particle deposition model described in
Appendix G, the default gas models do not describe respiratory tract uptake in detail to the
level of local airflow distribution (e .g ., respiratory versus olfactory epithelium), but they do
adequately describe the scrubbing of the chemical from the inhaled airstream on a regional
scale .
The defining characteristic for Category 1 gases is that they are so highly water soluble
and/or rapidly irreversibly reactive in the surface-liquid/tissue of the respiratory tract that
they do not develop a significant backpressure (i .e., reversal in the concentration gradient at
the gas-liquid interface) from the surface-liquid tissue phase during exhalation . Category 1
gases are also distinguished by the property that the gas does not significantly accumulate in
the blood which would reduce the concentration driving force and, hence, reduce the
absorption rate . The default model structure is based on these characteristics . Examples of
gases classified as Category 1 are hydrogen fluoride, chlorine, formaldehyde, and the volatile
organic acids and esters .
Gases in Category 2 are moderately water soluble and rapidly reversibly reactive or
moderately to slowly irreversibly metabolized in respiratory tract tissue . Ozone, sulfur
3-38
p. 35
dioxide, xylene, propanol, and isoamyl alcohol are examples of Category 2 gases . The
boundaries between categories are not definitive . Some compounds may appear to be defined
by either Category 1 or Category 2 because water solubility and reactivity are a continum .
Thus, although sulfur dioxide is reversibly reactive, which would categorize it as a
Category 2 gas, it is also highly soluble such as to be a Category 1 gas . Similarly, ozone is
highly reactive yet only moderately water soluble . More explicit delineation of categories
will be made upon review of the empirical data and the predictability of the model gases that
may appear to fit more than one category.
Because they are not as reactive in the respiratory tract tissue as Category 1 gases, gases
in Category 2 have the potential for significant accumulation in the blood and thus have a
higher potential for both respiratory and remote toxicity . Thus, the model structure used to
describe uptake of these gases is a hybrid of that for Category 1 and Category 3 . The PBPK
model component of the structure is necessary to evaluate the steady-state blood concentration
which allows calculation of both absorption flux on inhalation and the desorption flux during
exhalation . The derivation of the model structures and their reduction to forms with a
minimal number of parameters are described in detail in Appendix I .
Gases in Category 3 are relatively water insoluble and unreactive in the ET and TB
surface liquid and tissue and thus result in relatively small dose to these regions . The uptake
of Category 3 gases is predominantly in the pulmonary region and is perfusion limited .Styrene is an example of a Category 3 gas . The site of toxicity of these gases is generally at
sites remote to the respiratory tract and a compartmental approach can be used to describe
distribution to various systemic tissues . Thus, the default model for Category 3 gases is
similar in structure to the PBPK model used by Ramsey and Andersen (1984) to describe
styrene distribution . The model structure and the derivation of the default dosimetric
adjustment based on this model are described in detail in Appendix J .
3.2 .3 Summary Considerations for Judging Model Structures
Although a comprehensive description of the exposure-dose-response continuum is
desired for accurate extrapolation from experimental conditions and dose-response assessment,
often the data base is inadequate . The preceding chapter discussion illustrates that data on the
mechanistic determinants of chemical disposition, toxicant-target interactions, and tissu e
3-39

p. 36
responses vary in degree of availability for chemicals and species . Depending on the relative
importance of these various determinants, models with less detail may be used as a default to
adequately describe differences in dosimetry for the purposes of interspecies extrapolation
often required for the chemicals at which the RfC methodology is directed . The default
dosimetry models incorporated in the methodology represent structures that are commensurate
with the available data for both chemical-specific (e.g., reactivity and solubility) and
species-specific (e .g ., respiratory tract airway dimensions, surface areas, ventilation rates,
deposition data, distribution of cell types, metabolic capacities) parameters .
An understanding of the basis for model structures also allow development of a
framework for the evaluation of whether an alternative model structure is considered optimal
relative to the default. For example, an alternate model structure might be considered more
optimal than the default for extrapolation when default assumptions or parameters are
replaced by more detailed, biologically-motivated descriptions or actual data, respectively .
For example, a model could be considered more optimal if it incorporates more chemical or
species-specific information or if it accounts for more mechanistic determinants . These
considerations are summarized in Table 3-6 .
TABLE 3-6. HIERARCHY OF MODEL STRUCTURES FOR DOSIMETRY ANDINTERSPECIES EXTRAPOLATION
Optimal model structure
Structure describes all significant mechanistic determinants of chemical disposition,toxicant-target interaction, and tissue response
Uses chemical-specific and species-specific parameter s
Dose metric described at level of detail commensurate to toxicity data
Default model structure
Limited or default description of mechanistic determinants of chemical disposition,toxicant-target interaction, and tissue respons e
Uses categorical or default values for chemical and species parameters
Dose metric at generic level of detail
3-40

p. 37
The sensitivity of the model to these differences in structure may be gauged by their
relative importance in describing the response function for a given chemical . A model which
incorporates many parameters may not be any better at describing ("fitting") limited response
data than a simpler model . In these instances, the principle of parsimony might dictate the
use of the simpler model .
Woodruff et al. (1992) used Monte Carlo analyses to assess the impact that structure
and parameterization of PBPK models has on output predictions and variability .
Nonphysiologically based (NPB) models of three or two compartments were compared with
PBPK models that either used five compartments (PBPK5) to describe the body (well-
perfused, pborly-perfused, fat, bone marrow, and liver tissue compartments) or that "lumped"
the body into three (fat, bone marrow, and central) compartments (PBPK3) . Comparisons
were run for different data sets from inhalation to benzene . The two main influences on
variability of model output predictions were (1) the quantity and type of data used to calibrate
the model and (2) the number of parameters in the model . While some differences existed
between the models' average predictions when calibrated to the same experimental data, these
differences were smaller than the differences between the predictions made by the same
model fitted to different data sets . An excessive number of parameters was shown to lead to
overparameterization and cause large variability in the output. The similarities in the average
predictions of the NPB and PBPK models supported the use of NPB models in some cases .
The NPB models have fewer parameters and are potentially easier to fit . The PBPK models
did show greater reliability for extrapolation but NPB models provided reliable results with
less effort needed in fitting data when the objective was to interpolate from the current data .
Issues addressed in the review by Woodruff et al . (1992) and others (Hattis et al ., 1989;Farrar et al ., 1989 ; Portier and Kaplan, 1989 ; Bois et al ., 1990) regarding evaluation of the
uncertainty in input parameters and the variability of predictions due to alternate structures
and data sets, should be considered when evaluating different available model structures for
replacing the default adjustments .
3-41

p. 38
4 . QUANTITATIVE PROCEDURES
This chapter presents the quantitative procedures for dose-responsel assessment for
noncancer toxicity . Once key studies have been identified in the available data base for a
chemical and evaluated for adequacy and limitations in terms of experimental design and
analysis, dose-response assessment for noncancer toxicity involves the designation of the
critical effects for each individual study, dosimetric adjustment of the associated exposure
concentrations to human equivalent concentrations (HECs), and an analysis of the overall dat a
array of these effects for that which is most representative of the threshold region . It is this
no-observed-adverse-effect level (NOAEL) for the critical effect, together with uncertainty
factors (UFs), that is used for the derivation of the inhalation reference concentration (RfC) .
An RfC has a numerical value, and hence, a quantitative nature. As discussed throughout
this document, numerous theories, assumptions, and empirical data provide the quantitative
framework for these RfC calculations. To account for inherent uncertainties in the chemical-
specific data base and essential qualitative judgments, levels of confidence are assigned,
enhancing the interpretation of a numerical RfC .
This chapter begins in Section 4 .1 with a discussion of the minimum data base criteria
to develop an RfC and of how to evaluate the available data to determine that a sufficient
number of appropriate endpoints were addressed to ascertain the potential for noncancer
toxicity. Guidance on how to designate effect levels (i .e., assign exposure levels as NOAEL s
or lowest-observed-adverse-effect levels [LOAELs]) is provided in Section 4 .2 . The
remainder of the chapter is dedicated to the dosimetric adjustments used to extrapolate the
experimental data to an HEC, according to whether the observed toxicity is in the respiratory
tract or is extrarespiratory (sites remote to the portal of entry) and according to the type of
inhaled toxicant. Conversion of experimental units to the units of the RfC (mg/m3) and
'Although the strict definitions of "dose", "response", and "effect" are recognized and discussed explicitly inSection 1 .2 ., the conventions of the NAS paradigm will be used in this document, with the RfC beingsynonymous with a "dose-response" assessment . Thus, in the broader sense, the term "dose" may encompassadministered dose (i .e ., exposure concentration), delivered dose, or target tissue dose . Likewise, "response" inthe qualitative sense, is an indication of an adverse influence regardless of whether the data were measured asquantal, count, continuous, or ordered categorical . The reader is referred to Section 1 .2 for a detaileddiscussion of the general principles of dose-response and assessment for noncancer toxicity .
4-1
p. 39
adjustment for discontinuous experimental exposure duration are described in Sections 4 .3.2
and 4.3 .3, respectively . The dosimetric adjustments for particles are discussed in Section
4 .3 .5 and for gases in Section 4 .3 .6. Duration and dosimetric adjustment of human data is
discussed in Section 4 .3.7. Once the effect levels are converted to HECs, the choice of the
critical effect and principal study is made according to the guidance in Section 4 .3 .8. The
operational derivation of an RfC is provided and the choice of UFs and assignment of
confidence levels discussed in Sections 4 .3 .8 .1 and 4.3 .8.2, respectively .
4.1 MINIMUM DATA BASE CRITERI A
Noncancer toxicity is defined as health effects other than cancer and gene mutations that
are due to the effects of environmental agents on the structure or function of various organ
systems . Therefore, by definition, a data base for derivation of a dose-response estimate for
noncancer toxicity should ensure that both appropriate and adequate numbers of endpoints
have been evaluated .
As shown in Table 4-1, the minimum laboratory animal toxicologic data base
requirement for derivation of an RfC with low confidence is a well-conducted subchronic
inhalation bioassay that evaluated a comprehensive array of endpoints, including an adequate
evaluation of portal-of-entry (respiratory tract) effects, and established an unequivocal
NOAEL and LOAEL. For a higher confidence RfC, chronic inhalation bioassay data, two-
generation reproductive studies, and developmental studies in two different mammalian
species are usually required. Considerations related to evaluating the comprehensiveness of
the available data according to these criteria follow in Section 4 .1 .1 . Oral data may be used,
according to the criteria and guidance provided in Section 4 .1 .2, when inhalation data are not
available . Typically, the level of confidence in a given RfC will be higher if it is derived
from human data and supported by laboratory animal data . A more detailed discussion of
how to assign confidence levels is provided in Section 4 .3 .9.2 .
4.1 .1 Evaluation of Comprehensiveness
Data bases vary considerably in their completeness . The rationale supporting the
minimum data base requirements for derivation of an RfC, as outlined above, is that
4-2

p. 40
TABLE 4-1 . NI[NIMUM DATA BASE FOR BOTH HIGH AND LO W
CONFIDENCE IN THE INHALATION REFERENCE CONCENTRATION (RfC)
Mammalian Data Basea Confidence Comments
1 . A. Two inhalation bioassaysb in different High Minimum data base forspecies high confidence
B. One two-generation reproductive study
C . Two developmental toxicity studies indifferent species
2. 1A and 1B, as above Medium to high
3. Two of three studies, as above in 1A and Medium to high1B; one or two developmental toxicitystudies
4 . Two of three studies, as above in 1A and Medium1 B
5 . One of three studies, as above in IA and Medium to low1B ; one or two developmental toxicitystudies
6. One inhalation bioassay° Low Minimum data base forestimation of an RfC
'Composed of studies published in refereed journals, reports that adhered to good laboratory practice and haveundergone final QA/QC, or studies rated by the Office of Pesticide Programs as "core-minimum" . It isunderstood that adequate toxicity data in humans can form the basis of an RfC and yield hig h
confidence in the RfC without this data base . Pharmacokinetic data that indicate insignificant distributionoccurs remote to the respiratory tract may decrease requirements for reproductive and developmental data .
'Chronic data .`Chronic data preferred but subchronic acceptable .
well-defined and well-conducted subchronic toxicity studies are generally considered to be
reliable predictors of many forms of chronic toxicity, with the notable exceptions of
carcinogenic, teratogenic, and reproductive effects . Testing is required in two different
species, in the absence of a relevant laboratory animal model, in order to address potential
species sensitivity . The additional specific requirement for adequate respiratory tract
evaluation arises from the increased potential for the portal-of-entry tissue to interact
intimately with chemicals . The observation that approximately 70% of the RfCs derived to
date (October, 1994) have been based on respiratory tract endpoints is consistent with this
increased potential .
4-3

p. 4 1
It should be recognized, however, that for some substances, results of other studies may
suggest the possibility of effects not detected in the subchronic studies . Current toxicity
testing strategies are hierarchical sequences of tests designed to develop a profile of a
chemical's toxicity (Environ Corporation, 1985) . Initial testing tiers consist of relatively
rapid, inexpensive tests designed to identify acute toxicity . This information is not directly
useful in predicting chronic adverse effects in humans, but can be used to guide decisions as
to type and extent of other testing required, such as subchronic, chronic, or reproductive
bioassays . The toxicity "profiles" or information required as a minimum data base also are
somewhat structured according to this hierarchy . The magnitude of data insufficiency varies
on a case-by-case basis and should be defined by the nature of the plausible or possible
pathogenesis processes (i.e., defined according to the possible mechanism[s] of action for the
observed effect[s]) . For example, the U .S. Food and Drug Administration (1982) suggests
that if a chemical tested in a subchronic study is found to cause focal hyperplasia, metaplasia,
proliferative lesions or necrosis, then a carcinogenicity study in two rodent species is
warranted. Likewise, if reproductive effects are found, then teratology testing also should be
conducted . If acute or subchronic data demonstrate reproductive organ toxicity or neurotoxic
effects, standard 2-generation reproductive assays, developmental testing, and a neurotoxicity
battery may be required for appropriate characterization . Pharmacokinetic data that indicate
insignificant distribution to sites remote from the respiratory tract at exposure concentrations
under consideration for derivation of an RfC can mitigate the requirements for reproductive
and developmental data, except when these endpoints are suggested as potential targets by
other inhalation data . Route-to-route extrapolation of oral data, according to the criteria
provided in the next section, may provide a qualitative gauge by which to judge the relative
sensitivity of these endpoints to those under consideration for the respiratory tract or other
target tissues .
The quantitative relationships between these various endpoints and how to evaluate the
entire data array for determination of the principal studies on which to base the derivation of
the RfC are discussed in Section 4 .3 .8.
4-4

p. 42
4.1 .2 Route-to-Route Extrapolation
When the data base for a given chemical is not adequate via inhalation, route-to-route
extrapolation is often practiced by some risk assessors using empirically derived factors that
are not necessarily applicable to the case at hand . For most route-to-route extrapolations, the
lack of data, lack of ability to interpret data, and underutilization of existing data due to
insufficient models and statistics reduce or eliminate the validity of these extrapolations
(Gerrity and Henry, 1990) .
Data from other routes of exposure may be useful to derivation of an RfC only when
respiratory tract effects and/or "first-pass" effects (a pharmacologic phenomenon) can be
ruled out . First-pass effects refer to the metabolism that can take place in the portal-of-entry
tissue, prior to entry into the systemic circulation . For example, after oral administration,
many chemicals are delivered to the liver via the portal vein from the gastrointestinal (GI)
tract before they enter into the systemic circulation .
The respiratory tract can also exhibit a first-pass effect after inhalation due to its various
cell types and metabolic enzyme systems . This first-pass action can alter the disposition of
the parent and metabolites, thereby modulating the dose to remote or systemic target tissues
in a route-dependent fashion . Therefore, unless this first-pass effect and dosimetry are
adequately understood, there can be substantial error introduced in route-to-route
extrapolation that does not account for these parameters . In the absence of data to determine
dosimetry via inhalation, when a chemical is thought to be susceptible to first-pass effects
(e.g ., metabolized), or where a potential for portal-of-entry effects is indicated but not well
characterized (e.g., respiratory toxicity after acute exposures or skin irritation after dermal
administration), then route-to-route extrapolation for derivation of an RfC is not appropriate .
For a more detailed discussion of important parameters to consider, refer to Gerrity and
Henry (1990), the National Research Council (1986, 1987), and Pepelko and Withey (1985) .
Oral toxicity data are the most common data available as alternatives to inhalation data .
Oral data should not be used for route-to-route extrapolation in the following instances :
(1) when groups of chemicals are expected to have different toxicity by the tworoutes ; for example, metals, irritants, and sensitizers ;
(2) when a first-pass effect by the respiratory tract is expected ;
4-5
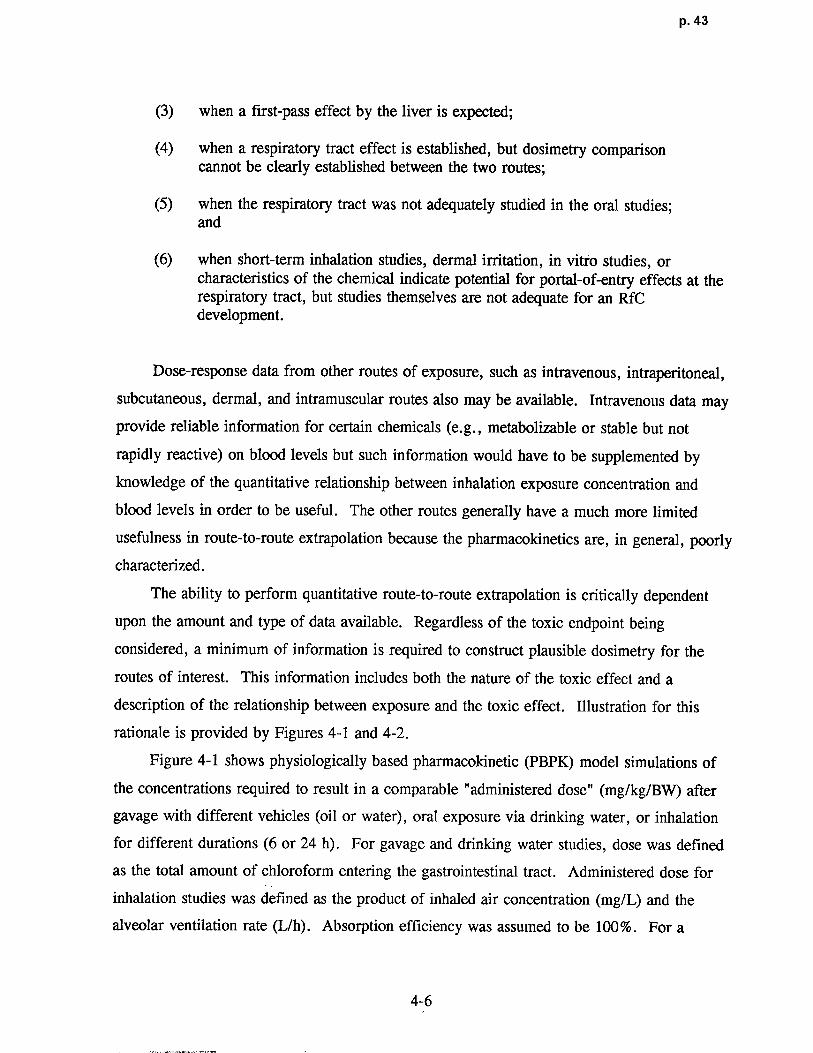
p. 43
(3) when a first-pass effect by the liver is expected ;
(4) when a respiratory tract effect is established, but dosimetry comparisoncannot be clearly established between the two routes ;
(5) when the respiratory tract was not adequately studied in the oral studies ;and
(6) when short-term inhalation studies, dermal irritation, in vitro studies, orcharacteristics of the chemical indicate potential for portal-of-entry effects at therespiratory tract, but studies themselves are not adequate for an RfCdevelopment.
Dose-response data from other routes of exposure, such as intravenous, intraperitoneal,
subcutaneous, dermal, and intramuscular routes also may be available . Intravenous data may
provide reliable information for certain chemicals (e .g., metabolizable or stable but not
rapidly reactive) on blood levels but such information would have to be supplemented by
knowledge of the quantitative relationship between inhalation exposure concentration and
blood levels in order to be useful . The other routes generally have a much more limited
usefulness in route-to-route extrapolation because the pharmacokinetics are, in general, poorl y
characterized .
The ability to perform quantitative route-to-route extrapolation is critically dependent
upon the amount and type of data available . Regardless of the toxic endpoint being
considered, a minimum of information is required to construct plausible dosimetry for the
routes of interest . This information includes both the nature of the toxic effect and a
description of the relationship between exposure and the toxic effect . Illustration for this
rationale is provided by Figures 4-1 and 4-2 .
Figure 4-1 shows physiologically based pharmacokinetic (PBPK) model simulations of
the concentrations required to result in a comparable "administered dose" (mg/kg/BW) after
gavage with different vehicles (oil or water), oral exposure via drinking water, or inhalation
for different durations (6 or 24 h) . For gavage and drinking water studies, dose was defined
as the total amount of chloroform entering the gastrointestinal tract . Administered dose for
inhalation studies was defined as the product of inhaled air concentration (mg/L) and the
alveolar ventilation rate (L/h) . Absorption efficiency was assumed to be 100% . For a
4-6

p. 44
1,000(a)
Gavage (water, 100 mg/kg) ; PTDEAD -14 .3°/
750
500knhalation
avage (oil ; 100 mg/kg) ; PTDEAD - 5 .6%
E (48.3 ppm for 6h) ; PTDEAD - 0 .3%J Drinking water (337 mg/L) ;
250PTDEAD-0.1%
0
Inhalation (12.1 ppm for 24h); PTDEAD - 0.08%-250
0 5 10 15 20 25
200 (b)Gavage (oil ; 100 mg/kg) ; PTDEAD - 0.05%
160 Gavage (water, 100 mg/kg) ;PTDEAD = 0.03%
inhalation (697 ppm for 6h) ;120 '- PTDEAD - 0.05%
E,J Drinking water (3507 mg/L) ;
80- PTDEAD = 0.11 %
40 Inhalation (172 ppm for 24 h) ;PTDEAD = 0 .06%
0-0 5 10 15 20 25
Time (h)
F igure 4-1. Multiple route comparisons for (a) mice and (b) humans administeredchloroform at a dose of 100 mg/kg body weight . Actual concentrations ofchloroform in air or in drinking water used to deliver a total body burdencomparable to a gavage dose of 100 kg/mg and the percentage of liver cellskilled (PTDEAD) as a result of the exposures are labeled for eachsimulation . Model simulations are of the rates of metabolism in the liver(RAML, mg/L of liver/h) for 24 h .
Source: Corley and Reitz (1990) .
4-7
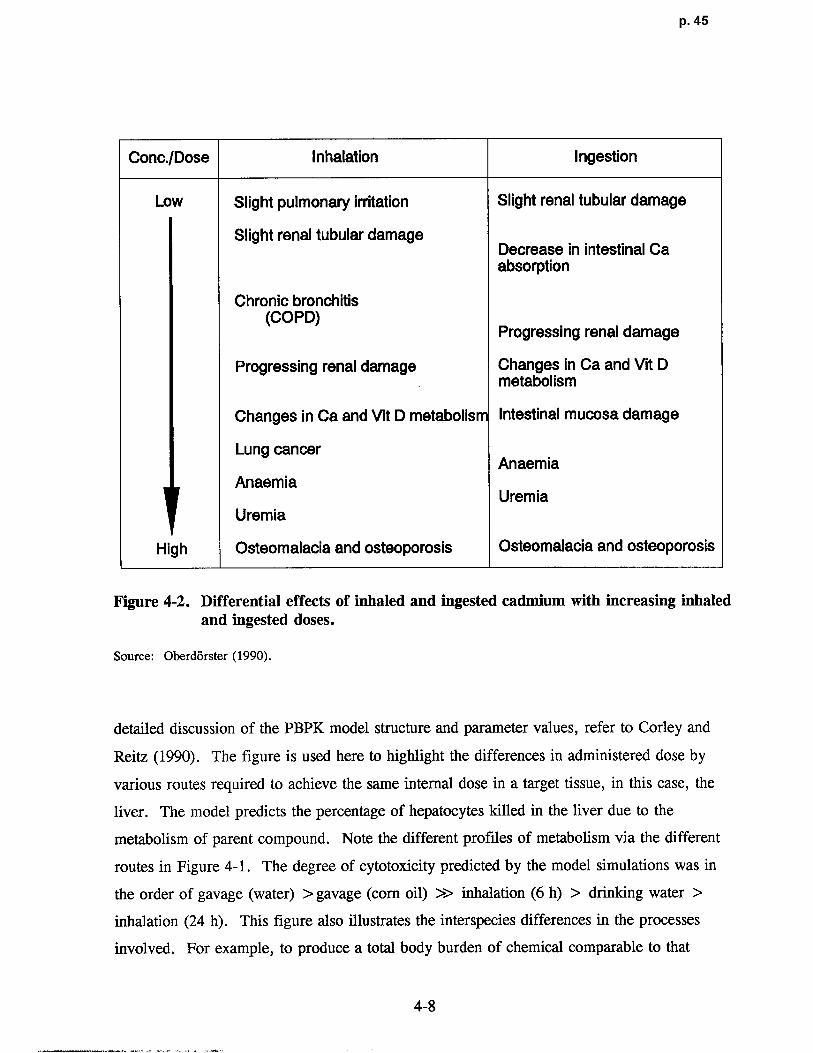
p. 45
Conc./Dose Inhalation Ingestion
Low Slight pulmonary irritation Slight renal tubular damage
Slight renal tubular damageDecrease in intestinal Caabsorption
Chronic bronchitis(COPD)
Progressing renal damage
Progressing renal damage Changes in Ca and Vit Dmetabolis m
Changes in Ca and Vit D metabolism Intestinal mucosa damage
Lung cancerAnaemia
AnaemiaUremia
Uremia
High Osteomalacia and osteoporosis Osteomalacia and osteoporosis
Figure 4-2 . Differential effects of inhaled and ingested cadmium with increasing inhaledand ingested doses.
Source: Oberdorster (1990) .
detailed discussion of the PBPK model structure and parameter values, refer to Corley and
Reitz (1990) . The figure is used here to highlight the differences in administered dose by
various routes required to achieve the same internal dose in a target tissue, in this case, the
liver. The model predicts the percentage of hepatocytes killed in the liver due to th e
metabolism of parent compound . Note the different profiles of metabolism via the different
routes in Figure 4-1 . The degree of cytotoxicity predicted by the model simulations was in
the order of gavage (water) > gavage (corn oil) >> inhalation (6 h) > drinking water >
inhalation (24 h) . This figure also illustrates the interspecies differences in the processes
involved . For example, to produce a total body burden of chemical comparable to that
4-8
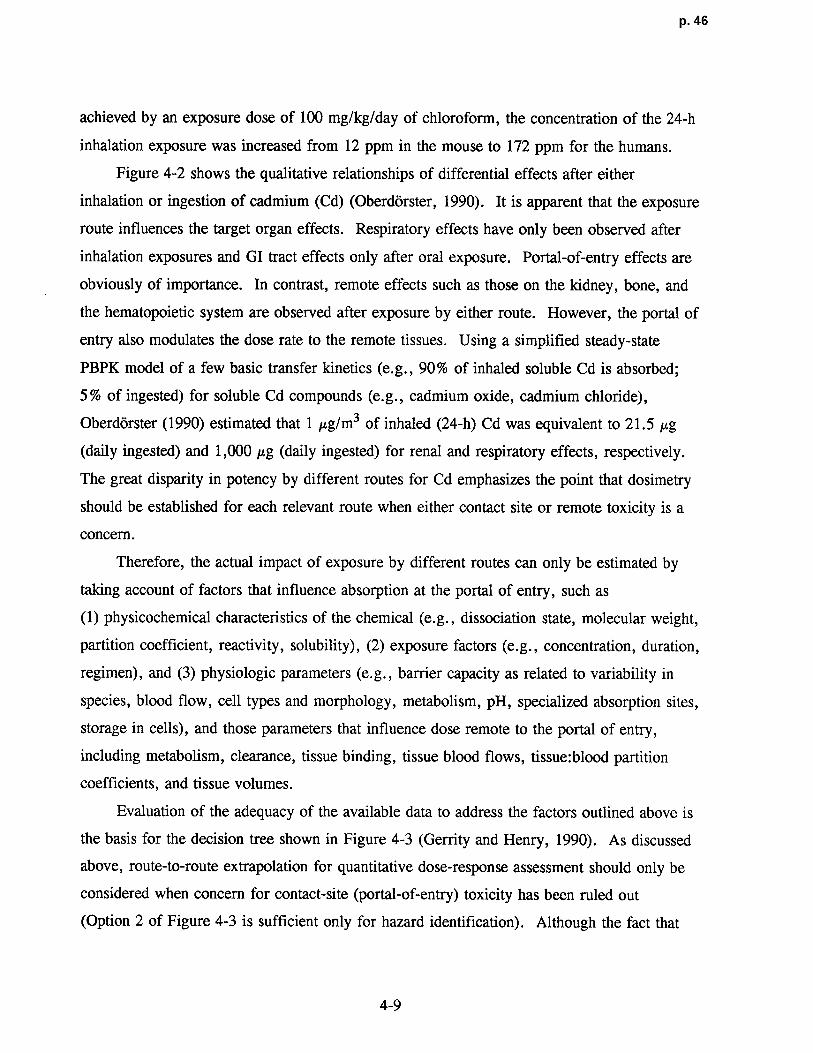
p. 46
achieved by an exposure dose of 100 mg/kg/day of chloroform, the concentration of the 24-h
inhalation exposure was increased from 12 ppm in the mouse to 172 ppm for the humans .
Figure 4-2 shows the qualitative relationships of differential effects after either
inhalation or ingestion of cadmium (Cd) (Oberdorster, 1990) . It is apparent that the exposure
route influences the target organ effects . Respiratory effects have only been observed after
inhalation exposures and GI tract effects only after oral exposure . Portal-of-entry effects are
obviously of importance . In contrast, remote effects such as those on the kidney, bone, and
the hematopoietic system are observed after exposure by either route . However, the portal of
entry also modulates the dose rate to the remote tissues . Using a simplified steady-state
PBPK model of a few basic transfer kinetics (e .g ., 90% of inhaled soluble Cd is absorbed ;
5% of ingested) for soluble Cd compounds (e .g., cadmium oxide, cadmium chloride),
Oberdorster (1990) estimated that 1 µg/m3 of inhaled (24-h) Cd was equivalent to 21 .5 Ag
(daily ingested) and 1,000 µg (daily ingested) for renal and respiratory effects, respectively.
The great disparity in potency by different routes for Cd emphasizes the point that dosimetry
should be established for each relevant route when either contact site or remote toxicity is a
concern .
Therefore, the actual impact of exposure by different routes can only be estimated by
taking account of factors that influence absorption at the portal of entry, such as
(1) physicochemical characteristics of the chemical (e .g., dissociation state, molecular weight,
partition coefficient, reactivity, solubility), (2) exposure factors (e .g., concentration, duration,
regimen), and (3) physiologic parameters (e .g ., barrier capacity as related to variability in
species, blood flow, cell types and morphology, metabolism, pH, specialized absorption sites,
storage in cells), and those parameters that influence dose remote to the portal of entry,
including metabolism, clearance, tissue binding, tissue blood flows, tissue:blood partition
coefficients, and tissue volumes .
Evaluation of the adequacy of the available data to address the factors outlined above is
the basis for the decision tree shown in Figure 4-3 (Gerrity and Henry, 1990) . As discussed
above, route-to-route extrapolation for quantitative dose-response assessment should only be
considered when concern for contact-site (portal-of-entry) toxicity has been ruled out
(Option 2 of Figure 4-3 is sufficient only for hazard identification) . Although the fact that
4-9
p. 47
Chemical Identity
Do adequate toxicology dataexist for at least one route?
No Yes Is toxicityremote from
Can SAR or contact siteanalogy be used? likely?
No Yes No Yes(Contact siteconcern)
Collect data Use data for Collect data Candidate for(Option 1) analogous on all relevant route-to-route
compound routes extrapolation(Option 2) (Option 3) (Option 4)
Figure 4-3 . Decision tree for route-to-route extrapolation (see text below for adiscussion of the options listed) . SAR = structure activity relationship .
Source: Gerrity and Henry (1990) .
the effect of a chemical is observed in the portal of entry does not necessarily preclude route-
to-route extrapolation, the requirements for quantitative data via each route (Option 3 of
Figure 4-3) in order to perform such an extrapolation usually obviate the reason (i .e., lack of
data) for which it was being considered in the first place .
If respiratory tract toxicity can be ruled out and remote site toxicity is of interest, then
route-to-route extrapolation becomes a possibility (Option 4 of Figure 4-3) . Methods for
route-to-route extrapolation range in accuracy and therefore, inherent uncertainty . The
simplest approach is to use default absorption values for each exposure route appropriate to
the chemical class in question . Such values have only been developed for a limited class of
volatile organic chemicals . Because this approach entails an increased uncertainty compared
to those that use pharmacokinetic data and PBPK modeling, use of default absorption values
is considered inadequate for quantitative dose-response assessment .
4-10

p. 48
Direct measurement of absorption efficiency for the routes of interest is an improvement
on the use of default values, but the approach still ignores many of the potentially important
factors mentioned above, invoking additional uncertainty that would have to be accounted for
when calculating a dose-response estimate . Measurement of bioavailability by the use of a
validated internal marker provides greater certainty . Comparative excretion data when the
associated metabolic pathways are equivalent by each route and regimen of interest or
comparative systemic toxicity data when such data indicate equivalent effects by each route
and regimen of interest may also provide useful information . However, the associated
uncertainty would have to be accounted for in the estimate derived using an extrapolation
based on such data .
The preferred method for performing route-to-route extrapolation involves the
development of a PBPK model that describes the disposition (deposition, absorption,
distribution, metabolism, and elimination) of the chemical for the routes of interest (Gerrit y
and Henry, 1990) . Such models account for fundamental physiologic and biochemical
parameters and processes such as blood flows, ventilatory parameters, metabolic capacities,
and renal clearance, tailored by the physicochemical (e .g ., blood:air and tissue:blood
partitions) and biochemical properties (e.g ., binding, depletion of co-factors) of the chemical
in question .
The use of a PBPK model is predicated on the assumption that an effective (target-
tissue) dose achieved by one route in a particular species is expected to be equally effective
when achieved by another exposure route or in some other species . A key determination is
the choice of the dose surrogate for the toxic effect . The more accurately the exposure-dose-
response continuum is characterized, and therefore the correlation of the chosen dose
surrogate with toxic effect, the more accurate this approach will be with respect to use in
quantitative extrapolation. For example, a measure of target-tissue dose for a chemical with
pharmacologic activity could be the tissue concentration divided by some measure of the
receptor-binding constant for that chemical . The behavior of a substance administered by a
different exposure route can be determined by adding equations that describe the nature of the
new input function . Similarly, because known physiologic parameters are used, different
species (e.g., humans versus laboratory animal species) can be modeled by replacing the
appropriate constants. It should be emphasized that PBPK models must be used in
4-11

p. 49
conjunction with toxicity and mechanistic studies in order to relate the effective dose
associated with an effect for the test species and conditions to other scenarios . The use of an
existing model structure, essentially a template, can greatly reduce the effort required for
model development of analogous chemicals .
4.1 .3 Not-Verifiable Statu s
When the available data do not meet the minimum data base requirements as discussed
above or when the existing data can not be synthesized into a compelling toxicity profile
without great uncertainty (see Section 4 .3.8), the data base on a given chemical is designated
as "not-verifiable" and no RfC estimate is calculated . This status would require reanalysis
when new data become available .
4 .2 DESIGNATION OF EFFECT LEVELS
The designation of effect levels, or the association of adversity2 with exposure
concentrations, is one of the most difficult procedures of any dose-response analysis for
noncancer toxicity . The critical effect for an individual study is often described as either the
adverse effect that first appears in the dose scale as dose is increased, or as a known
precursor to the first adverse effect . The premise of this designation is the underlying
threshold phenomenon and it assumes that if this critical effect is prevented then all observed
adverse effects at subsequent concentrations are prevented . In the simplest terms, a NOAEL
and a LOAEL are determined for the specified adverse effect from the exposure levels of a
given individual study for each of the various species tested . The NOAEL is the highest
level tested at which the specified adverse effect (i .e., a biologically and statistically defined
adverse effect) is not produced and is, thus, by definition, a subthreshold level (Klaassen,
1986) . The NOAEL/LOAEL is a function of the exposure levels used in the experimental
2Here adverse effects are considered to be functional impairments or pathological lesions that may affect theperformance of the whole organism or that reduce an organism's ability to cope with an additional challenge(Federal Register, 1980) . One of the major problems encountered with this concept is the reporting of"observed effect levels" as contrasted to "observed adverse effect levels ." The terms "adverse" and "notadverse" are at times satisfactorily defined, but because more subtle responses continue to be identified dueto increasingly sophisticated testing protocols, scientific judgment is needed regarding the exact definition ofadversity.
4-12
p. 50
design, or is a function of designating a specified health effect measure (e .g., 10% incidence
of a lesion) as the outcome of interest in the case of some alternative approaches presented in
Appendix A3, and therefore, does not necessarily reflect the "true" biological threshold .
Table 4-2 presents the four types of effect levels that may be applicable when evaluating
an individual study. Historically, the distinction between adverse effects and nonadverse
effects has been and remains problematic . For example, although disease is a dynamic
process (injury, adaptation, or healing), a pathologist records a morphologic change at a
single point in time and these "freeze-frame" data are used to determine the probable cause
and pathogenesis (past) and probable progression or outcome (future) . Designation of an
effect level (i .e., the designation of adversity) requires interpretation of the data based on an
ability to deduce the preceding events that have led to the observed change and to predict the
outcome or progression . The relationship between structural alterations to altered function is
not always simple, however .
Determining whether altered morphology is an adaptive response or truly an expression
of toxicity (functional impairment) can be extremely difficult and even controversial (Burger
et al., 1989 ; Ruben and Rousseaux, 1991) . In some cases, structural alteration can occur,
but normal function can continue in target tissues with functional reserve such as the lung,
liver, and kidney . Not all tissues demonstrate this high reserve . The central nervous system
can compensate to only a limited degree and where the damage occurs is vitally important for
the function of the system . Therefore, "focal" damage may be adverse in some but not all
target tissues . Also, the lack of observed functional change may be due to failure to detect
subtle or unknown functional changes rather than to their absence .
A similar morphologic alteration may have both functional and physiologic significance,
but often it is difficult to differentiate toxicity from physiologic response by morphologic
means alone. Not all functional abnormalities manifest themselves morphologically .
Temporal-spatial patterns are particularly challenging when evaluating toxicologic pathology .
Problems concerning time include reversibility, adaptation versus toxicity, progression versus
3There are alternative approaches under development (presented and discussed in Appendix A) aimed at derivingestimates of exposures that are analogous in intent to the establishment of a NOAEL . The NOAEL/LOAELapproach outlined is not intended to discourage alternative or more sophisticated dose-response procedures whensufficient data are available, but rather to present key issues necessarily involved (e .g ., dosimetric adjustmentand data array analysis) in any approach for the assessment of noncancer toxicity .
4-13
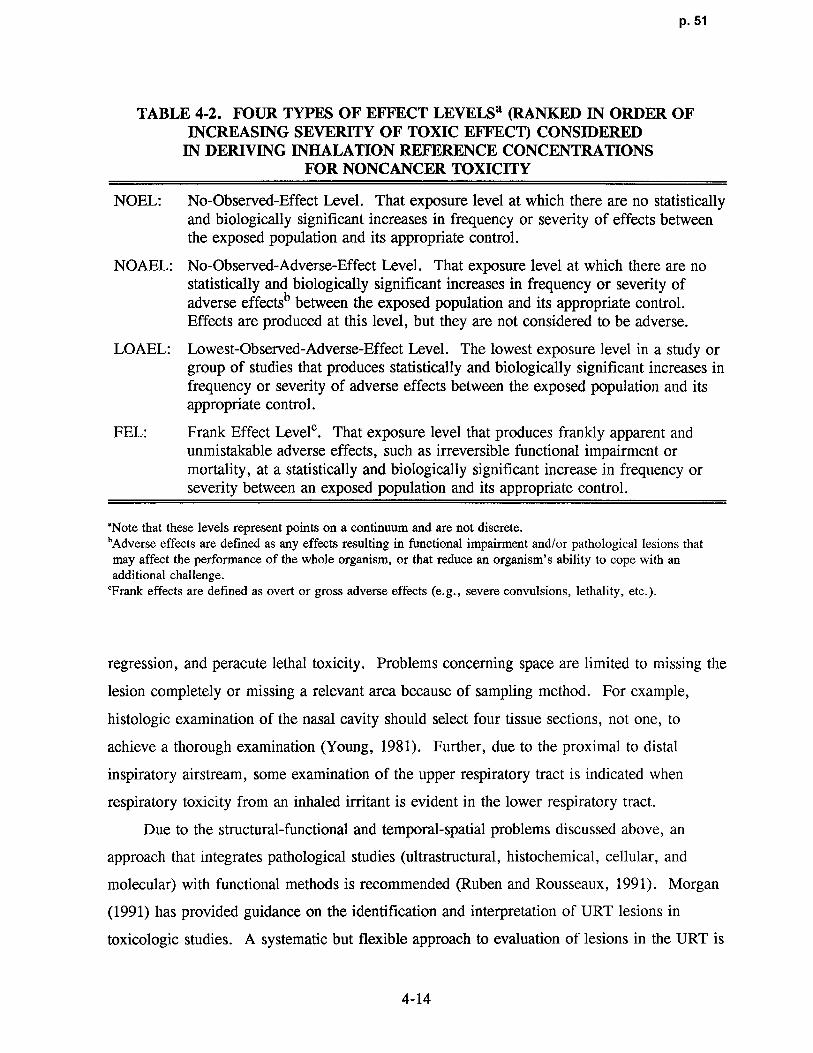
p. 51
TABLE 4-2 . FOUR TYPES OF EFFECT LEVELSa (RANKED IN ORDER OF
INCREASING SEVERITY OF TOXIC EFFECT) CONS IDEREDIN DERIVING INHALATION REFERENCE CONCENTRATIONS
FOR NONCANCER TOXICITY
NOEL: No-Observed-Effect Level . That exposure level at which there are no statisticallyand biologically significant increases in frequency or severity of effects betweenthe exposed population and its appropriate control .
NOAEL: No-Observed-Adverse-Effect Level . That exposure level at which there are nostatistically and biologically significant increases in frequency or severity ofadverse effectsb between the exposed population and its appropriate control .Effects are produced at this level, but they are not considered to be adverse .
LOAEL: Lowest-Observed-Adverse-Effect Level . The lowest exposure level in a study orgroup of studies that produces statistically and biologically significant increases infrequency or severity of adverse effects between the exposed population and itsappropriate control .
FEL: Frank Effect Level°. That exposure level that produces frankly apparent andunmistakable adverse effects, such as irreversible functional impairment ormortality, at a statistically and biologically significant increase in frequency orseverity between an exposed population and its appropriate control .
`Note that these levels represent points on a continuum and are not discrete .'Adverse effects are defined as any effects resulting in functional impairment and/or pathological lesions thatmay affect the performance of the whole organism, or that reduce an organism's ability to cope with anadditional challenge.
'Frank effects are defined as overt or gross adverse effects (e .g ., severe convulsions, lethality, etc .) .
regression, and peracute lethal toxicity . Problems concerning space are limited to missing the
lesion completely or missing a relevant area because of sampling method . For example,
histologic examination of the nasal cavity should select four tissue sections, not one, to
achieve a thorough examination (Young, 1981) . Further, due to the proximal to distal
inspiratory airstream, some examination of the upper respiratory tract is indicated when
respiratory toxicity from an inhaled irritant is evident in the lower respiratory tract .
Due to the structural-functional and temporal-spatial problems discussed above, an
approach that integrates pathological studies (ultrastructural, histochemical, cellular, and
molecular) with functional methods is recommended (Ruben and Rousseaux, 1991) . Morgan
(1991) has provided guidance on the identification and interpretation of URT lesions in
toxicologic studies . A systematic but flexible approach to evaluation of lesions in the URT i s
4-14

p. 52
recommended, one that considers selection of section level in context with th e
physicochemical characteristics of the inhaled gas (e .g., water solubility and reactivity), the
role of factors that may account for lesion dist ribution (e.g., dosimetry and tissue
susceptibility), and development of a pathogenesis profile or a chronological order of events
(e.g., degenerative, adaptive, and adaptive/regenerative changes versus time) . The nasal
diagrams proposed by Mery et al . (in press) offer an approach to recording data and mapping
lesions that aids this type of interpretation s trategy. This approach is also likely the best to
compile the data and precludes the restraint to interpretation and mathematical modeling
presented by data scored catego rically for seve rity (e.g ., + = mild, + + = moderate ; and
+ + + = severe) and/or without sufficient section detail with respect to lesion location
(Jarabek, 1994) .
In the early stages of respirato ry disease, there is considerable uncertainty conce rning
how to differentiate between acute reversible effects, which are the immediate consequence of
an exposure episode, and potential progression to chronic, nonreversible respiratory
pathology. The boundary between adaptive and toxic responses also remains controversial for
some respiratory tract lesions (Burger et al ., 1989) . These are important issues both in terms
of evaluation of respiratory tract effects per se, as well as for decisions concerning the c ritical
effect in inhalation studies . Inhalation-specific issues such as evaluation of pulmonary
function, sensory irritation, and allergic sensitization data are discussed in Section 2 .2.
Designation of effect levels usually contains an element of scientific judgment in
addition to objective criteria . Considerable experience and precedent for such decisions have
accrued over the last several years in the process of developing oral reference doses, RfCs,
and other health-related benchmark estimates . Table 4-3 presents guidance as to how general
effects would usually be designated as different (adverse) effect levels . In general, effects
that may be considered marginal are designated as adverse only to the extent that they are
consistent with other structural and functional data suggesting the same toxicity. For
example, altered liver enzymes (statistically out of normal range) would only be considered
adverse in context with altered structure (pathology) and liver weight changes .
4-15

p. 53
TABLE 4-3 . EFFECT LEVELS CONSIDERED IN
DERIVING INHALATION REFERENCE CONCENTRATIONSIN RELATIONSHIP TO EMPIRICAL SEVERITY RATING VALUES
(Ranks are from lowest to highest severity .)a
Effect or No-Effect Level Rank General Effect
NOEL 0 No observed effects.
NOAEL 1 Enzyme induction or other biochemicalchange, consistent with possible mechanismof action, with no pathologic changes andno change in organ weights .
NOAEL 2 Enzyme induction and subcellularproliferation or other changes in organelles,consistent with possible mechanism ofaction, but no other apparent effects .
NOAEL 3 Hyperplasia, hypertrophy, or atrophy, butno change in organ weights .
NOAEL/LOAEL 4 Hyperplasia, hypertrophy, or atrophy, withchanges in organ weights .
LOAEL 5 Reversible cellular changes includingcloudy swelling, hydropic change, or fattychanges .
(LO)AELb 6 Degenerative or necrotic tissue changeswith no apparent decrement in organfunction .
(LO)AEL/FEL 7 Reversible slight changes in organ function.
FEL 8 Pathological changes with definite organdysfunction that are unlikely to be fullyreversible .
FEL 9 Pronounced pathologic changes with severeorgan dysfunction with long-term sequelae .
FEL 10 Death or pronounced life shortening .
'Adapted from DeRosa et al . (1985) and Hartung (1986) .eThe parentheses around the "LO" in the acronym "LOAEL" refer to the fact that any study may have a series
of doses that evoke toxic effects of rank 5 through 7 . All such doses are referred to as adverse effect levels
(AELS) . The lowest AEL is the (LO)AEL .
4-16

p. 54
4.3 CALCULATION OF HUMAN EQUIVALENT CONCENTRATIONS
A key element of extrapolation of laboratory animal inhalation data to humans is
estimation of the "dose" (i .e., agent mass deposited per unit surface area or tissue volume)
delivered to specific target sites in the respiratory tract or made available to uptake and
metabolic processes for systemic distribution considered with mechanistic determinants of
toxicant-target interactions and tissue responses (Martonen and Miller, 1986; Andersen et al .,
1991) . To this end, PBPK and other mathematical dosimetry models have evolved into
particularly useful tools for predicting disposition differences for risk assessment (Miller
et al ., 1987b). Their use is predicated on the assumption that an effective (target-tissue) dose
in a particular species is expected to be equally toxic when achieved in some other species .
However, it is likely that species differences in sensitivity occur due to such species-specific
factors as host defense, repair processes, and genetics, so that the use of a 10-fold UF to
account for intraspecies variability, despite application of dosimetric adjustments, requires
additional research .
This section outlines the methods for calculating HEC estimates by using adjustment
factors that have resulted from similar modeling efforts of species-specific dosimetry
differences. The factors are used to adjust the observed exposure effect levels (i .e.,
NOAELs, LOAELs, etc .) in laboratory animals to estimate a concentration that would be an
equivalent exposure to humans (i .e., NOAEL[HECI s, LOAEL[HBC]s, etc) . These HECs then
are the basis for comparison and choice of the critical effect and study .
As discussed in Section 3 .2, the equations presented in this chapter are default
adjustments based on dosimetry models that incorporate only the major determinants of
particle or gas disposition . The use of models that may incorporate a more comprehensive
description of the exposure-dose-response continuum is considered the optimal approach in
each case . It should also be noted that because PBPK models allow for explicit handling of
intermittent exposure regimens (e .g., model can simulate 6 h/day, 5 days/7 days exposure
and predict resultant internal dose), the duration adjustment discussed in Section 4 .3.2 is
obviated by the use of these models .
Figure 4-4 is a flowchart for the default calculation of HECs and provides an outline for
the contents of this section . Conversion of units from ppm to mg/m3 is required before
dosimetric adjustments can be applied . This calculation is discussed in Section 4 .3 .1 . The
4-17

p. 55
Convertppm to mg/m3(Section 4.3.1)
/Secflon 4.3 .5.1 Adjust forExposure Re g imen
Respiratory(section 4.3 .2)
1 . EvaluateIdentify Identify
the Target 2.
System Characterize articies Type orEffect(s)
by MMAD, aa, or Agent
Remote Default Values Gases
(Extrarespiratory)1 . Evaluate
/Section 4.3.5.2 Generationetermine System
Gas 2 . Characterize byCategory Concentration,
Temperature ,Category I Category 3 Pressure, or
Default Values
Catego ry 2
Identify IdentifyRemote
Respiratory Y ~the Target the Target (Extrarespirato ry)
Effect(s) Effect(s)
/Section4.3.6.1/ Section 4 .3 .6 . 2
Remote Respirato ry(Extrarespirato ry)
Identifythe Target
Remote Effect(s) Respiratory(Extrarespiratory)
Section 4.3.6.2 Section 4.3.6.1
Figure 4-4 . Flowchart for calculation of human equivalent concentrations.
4-18

p. 56
next step in calculating a HEC is to convert the exposure regimen of the experiment i n
question to that of the human exposure scenario ; that is, a continuous (24-h/day) lifetime
(70-year) exposure . The third step of the approach is to apply the dosimetric adjustments
appropriate for the type of toxicant to be assessed (particle or gas, and if a gas, what
category) and the effect to be assessed (respiratory tract or extrarespiratory toxicity) resulting
from an inhalation exposure. The default dosimetric adjustments to derive HECs for
respiratory tract effects and extrarespiratory effects of particles are provided in Section 4 .3 .5 .
For gases, the determination of the appropriate gas category according to the scheme
provided in Section 3 .2 .2 is required to determine which dosimetric adjustment to apply to
calculate an HEC . Because the boundaries between the categories are not definitive (see
discussion in Section 3 .2 .2 and Appendix I), but instead were made to allow derivation of
default model structures, identification of the target effect(s) is used to further define the gas
category. Thus, remote (extrarespiratory) effects of Category 1 gases and respiratory effects
of Category 3 gases are treated according to the default dosimetric adjustments for each of
these respective effects of Category 2 gases (Section 4 .3 .5 and 4 .3 .6) . The default
dosimetric adjustments to derive HEC values for respiratory effects of Category 1 gases are
provided in Section 4 .3 .5 . The default dosimetric adjustment to derive HEC values for
extrarespiratory effects of Category 3 gases is provided in Section 4 .3.6 .
Although the presentation in this section divides the dosimetry calculations into those
applied to extrapolate respiratory tract effects versus extrarespiratory effects, it should be
recognized that there is no strict compartmentalization of effects for a chemical . A given
inhaled chemical could cause both respiratory tract and extrarespiratory effects . Therefore,
the decision on which of the equations to use in this chapter is governed by the endpoint of
interest in concert with the properties of the chemical to be assessed .
4 .3.1 Conversion to Standard Units
In the rare event that investigations using particulate exposures would report the
concentration in ppm, a mass-density relationship should be used to convert the exposure
concentration to mg/m3 . Inhalation toxicity studies on gases typically employ exposure levels
expressed as mg/m3 or ppm. Exposure levels for gases, including the NOAEL selected for
RfC derivation, should be expressed in standard units of mg/m3 . For exposure level s
4-19
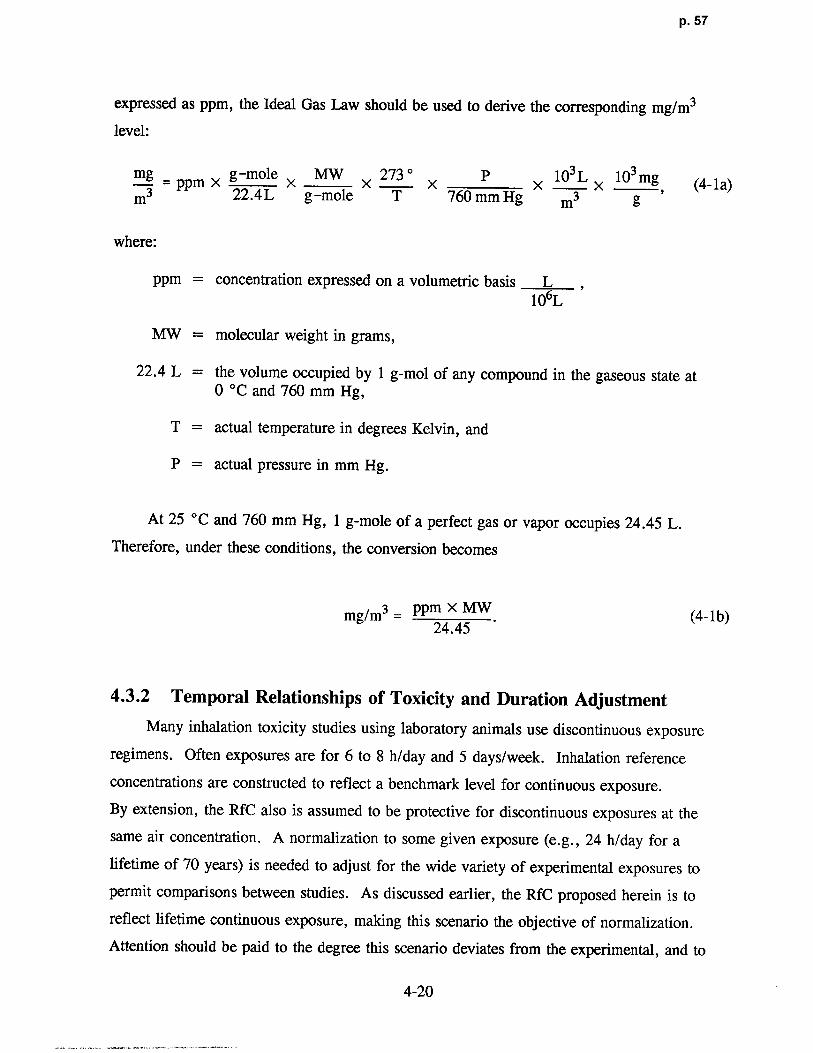
p. 57
expressed as ppm, the Ideal Gas Law should be used to derive the corresponding mg/m3
level :
mg = ppm X g-mole X MW X 273 ° x P X 103 L x 103 mg (4- la)m3 22.4L g-mole T 760 mm Hg m3 g
where:
ppm = concentration expressed on a volumetric basis L106L
MW = molecular weight in grams ,
22.4 L = the volume occupied by 1 g-mol of any compound in the gaseous state at0°C and 760 mm Hg ,
T = actual temperature in degrees Kelvin, and
P = actual pressure in mm Hg .
At 25 °C and 760 mm Hg, 1 g-mole of a perfect gas or vapor occupies 24 .45 L.
Therefore, under these conditions, the conversion becomes
mg/m3 = ppm X MW (4-lb)24.45
4.3 .2 Temporal Relationships of Toxicity and Duration Adjustment
Many inhalation toxicity studies using laboratory animals use discontinuous exposure
regimens. Often exposures are for 6 to 8 h/day and 5 days/week . Inhalation reference
concentrations are constructed to reflect a benchmark level for continuous exposure .
By extension, the RfC also is assumed to be protective for discontinuous exposures at the
same air concentration . A normalization to some given exposure (e .g ., 24 h/day for a
lifetime of 70 years) is needed to adjust for the wide variety of experimental exposures to
permit comparisons between studies . As discussed earlier, the RfC proposed herein is to
reflect lifetime continuous exposure, making this scenario the objective of normalization .
Attention should be paid to the degree this scenario deviates from the experimental, and t o
4-20
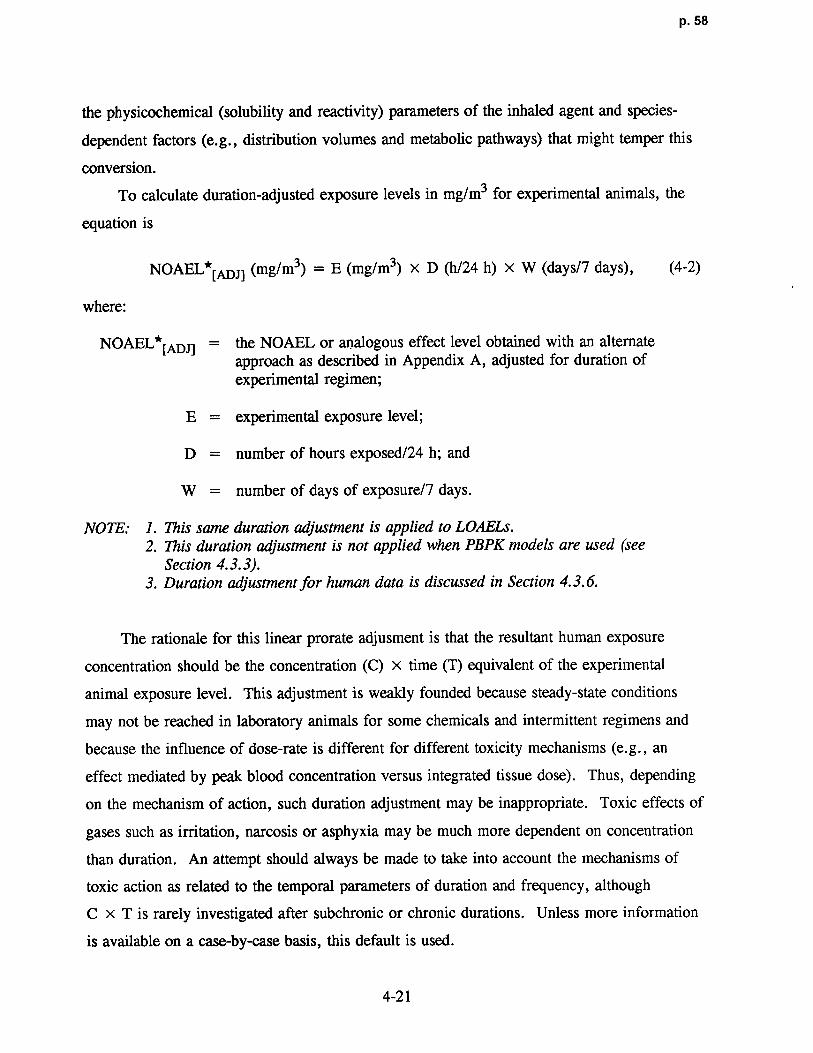
p. 58
the physicochemical (solubility and reactivity) parameters of the inhaled agent and species-
dependent factors (e .g., distribution volumes and metabolic pathways) that might temper this
conversion .
To calculate duration-adjusted exposure levels in mg/m3 for experimental animals, the
equation is
NOAEL*[,e,DJ] (mg/m3) = E(mg/m3) X D (h/24 h) X W (days/7 days), (4-2)
where:
NOAEL*[ADJi = the NOAEL or analogous effect level obtained with an alternateapproach as described in Appendix A, adjusted for duration ofexperimental regimen ;
E = experimental exposure level ;
D = number of hours exposed/24 h; and
W = number of days of exposure/7 days .
NOTE: 1. This same duration adjustment is applied to LOAELs .2. This duration adjustment is not applied when PBPK models are used (see
Section 4.3.3) .3. Duration adjustment for human data is discussed in Section 4 .3.6.
The rationale for this linear prorate adjusment is that the resultant human exposure
concentration should be the concentration (C) x time (T) equivalent of the experimental
animal exposure level . This adjustment is weakly founded because steady-state conditions
may not be reached in laboratory animals for some chemicals and intermittent regimens and
because the influence of dose-rate is different for different toxicity mechanisms (e.g ., an
effect mediated by peak blood concentration versus integrated tissue dose) . Thus, depending
on the mechanism of action, such duration adjustment may be inappropriate . Toxic effects of
gases such as irritation, narcosis or asphyxia may be much more dependent on concentration
than duration. An attempt should always be made to take into account the mechanisms of
toxic action as related to the temporal parameters of duration and frequency, althoug h
C X T is rarely investigated after subchronic or chronic durations . Unless more information
is available on a case-by-case basis, this default is used .
4-21

p. 59
As the effect in question increases in its severity, the validity of this equation becomes
more tenuous . The toxicity of an exposure is dependent upon the character of th e
"concentration-time" (C X T) curve, which may be described by a hyperbola whose arms
converge asymptotically toward the axes of the coordinates (Bliss, 1940). Bliss and James
(1966) have shown that such curves can be extrapolated with minimal error when the time
points in the experiment are located on the segment of the curve asymptotically approaching
the axes of the coordinates (i.e., high concentration acute exposures or low concentration
chronic exposures) . The exposure duration should ideally embrace the time span in which the
rate of onset of specific toxic effects sharply change, reflecting the degree of arc in the curve
of the (C X T) relationship .
Fiserova-Bergerova et al . (1980), using a compartmentalized model based on first-order
kinetics, demonstrated that duration of exposure to a gas can have profound effects on the
fractions of uptake exhaled or metabolized . Concentrations in tissues reflected the
concentration fluctuations in exposure, but the fluctuation in tissues was greater during
exposure to low solubility gases than to lipid soluble vapors (blood : air partition coefficients
of 0.5 and 10.0, respectively), due to the faster equilibration of partial pressures of the low
solubility gases . Fluctuations between tissue and exposure concentrations were diminished if
the substances were metabolized . Because a toxic effect is usually related to tissue
concentration, consideration should be given to these duration and solubility effects .
Extrapolation on the basis of C X T should be attempted only if a steady-state was attained .
Likewise, linear extrapolation from one concentration exposure to another is scientifically
supportable only if all processes involved in the uptake and elimination of the inhaled agent
are first order . Differences are caused primarily by concentration-dependent metabolic
clearance .
4 .3.3 Use of Pharmacokinetic and Pharmacodynamic Data
Pharmacokinetic and pharmacodynamic data (described in Section 1 .2) can be used in a
range of applications, from providing adjustments to external exposures based on correlations
of exposure to effect, through gathering insight on various important mechanistic insights and
calculation of kinetic parameters, to developing a comprehensive exposure-dose-response
description that incorporates major determinants of toxicant disposition, toxicant-targe t
4-22

p. 60
interaction and tissue response . These data can also be used to ascertain what laborator y
animal species is most appropriate, based on similarity of major mechanistic determinants, for
extrapolation to humans .
Empirical equations such as correlation equations (e .g., that relate the extent of external
exposure with the amount of internal biologic markers) can be used to describe kinetic
processes by a simple mathematical expression . These data, as described in Section 4.1 .2,
may be useful as a qualitative index of uptake for a given route, but they provide no insight
into the other parameters controlling disposition of a toxicant (distribution, metabolism,
excretion) over time and therefore their use is rather restricted .
Experimental data that track the concentrations of various kinetic parameters during and
following exposures can be used to determine various measures of the intensity of tissue
exposure. The parameters that are proportional to the relevant measure of tissue exposure are
referred to as tissue dose metrics (Andersen, 1987) . These metrics include estimates of time
integrals of tissue exposure to a parent toxicant or its metabolite(s) (e .g., area under the
blood [AUBC] or tissue curve [AUTC]), concentrations of these materials in tissues, or
receptor occupancy caused by the presence in tissues . This information provides little insight
into the mechanistic determinants or the biological effect of the parent or its metabolite(s) .
The choice of which metric to use as an appropriate measure should be based on some
knowledge of the mechanism by which the toxic effects are induced .
This mechanistic knowledge does not necessarily have to be exhaustive, but can rather
be related to certain general aspects of the nature and causes of a particular toxic interaction .
For example, is the effect related to chemical reactivity or to occupancy of cellular receptor
molecules? Is the effect associated with the parent or with a metabolite? If it is a metabolite,
does the metabolite have a sufficiently long half-time in the body to circulate freely
throughout the body or is it so reactive that it likely produces its damage locally? Are the
effects themselves reversible cytotoxic phenomena or irreversible changes? Is there sufficient
time for the target tissue to recover from the damage within the exposure frequency interval ?
If the critical damaging toxicant-target interaction is caused by direct chemical reaction
in which the toxicant reacts with and consumes cellular constituents, the degree of damage
should be related to the time integral of tissue exposure to the reactive chemical (e .g .,
AUTC). This definition would likely need to incorporate quantitative information on the
4-23

p. 61
synthesis and normal catabolism of the macromolecules involved to describe chroni c
exposures accurately . If the toxicant interacts with tissue by noncovalent binding to cellular
receptor molecules, the response of the cell is dependent on the occupancy of the receptor
and occupancy is determined by the binding constant for the chemical and the free
concentration of the toxicant in the cell .
The use of categorization schemes based on the physicochemical properties or
mechanisms of action of the inhaled toxicant have been proposed and different concepts of
"dose" related to these (National Research Council, 1986 ; Andersen, 1987 ; O'Flaherty, 1989 ;
Dahl, 1990) . Considerations such as these are described in Section 3 .2. and went into the
development of the default dosimetry adjustments provided in the following Sections 4 .3 .5
through 4.3.7. Details on the development of the dosimetry models are provided in
Appendices G, I and J . The default adjustments are determined categorically for particles
versus gases, and within gases, for those more reactive and soluble than nonreactive and
insoluble . Reactivity is defined to include both the propensity for dissociation as well as the
ability to serve as a substrate for metabolism in the respiratory tract . Because these are
default dosimetry adjustments, the use of models that may incorporate a more comprehensive
description of the exposure-dose-response continuum is considered the optimal approach for
extrapolation to HECs when such a model is judged to provide a more accurate description .
This judgment may be based on whether the structure of the alternative model is superior to
that of the default, (e.g., incorporates known mechanistic determinants) or if it empirically
results in a better correlation between "dose" and "effect" . The reader is referred to
Section 3 .2 for a discussion of modeling comparative dosimetry and to Section 3 .2.3 for
summary considerations regarding judging model structures .
Use of more comprehensive models obviate the need for the duration adjustment
described above in Section 4.3.2 because such models employ parameters that describe time-
dependent determinants of toxicant disposition such as metabolic clearance, distribution
volumes and elimination constants . These models can therefore be used to simulate both the
experimental exposure regimen as well as the exposure scenario for the human . PBPK and
linear pharmacokinetic models have both been used to evaluate and to adjust for different
work place exposure durations (Droz, 1985 ; Andersen et al ., 1987b; Saltzman, 1988). For
example, in order to extrapolate laboratory animal data using a PBPK model, the laboratory
4-24

p. 62
animal regimen (e .g., 6 h/day, 5 days/week) is simulated and the resultant appropriate dose
metric (e .g., AUTC) calculated . This is done assuming steady-state conditions for chronic
studies if it is likely that these conditions were met for 90% of the time (see Section 4 .3.5),
or the entire exposure can be simulated with the model . The model is then used with the
human parameters to ascertain the exposure concentration that results in an equivalent dose
metric under the human exposure scenario (e .g., 24 h/day) . This exposure concentration
back-extrapolated from the equivalent dose metric is the HEC .
4.3 .4 Default Dosimetric Adjustment and Physiological Parameters
As described in Sections 3 .2 and 4.3.3., the dosimetric adjustment factors described in
in the following sections are default approaches to be used when more sophisticated or
chemical-specific models are not available . The HEC is calculated with the default
dosimetric adjustment factor as :
NOAEL*[HECI (mg/m3) = NOAEL*[ADJl (mg/m3) X DAFr (4-3)
where:
NOAEL*[xEC) is the NOAEL or analogous effect level obtained with an alternate
approach as described in Appendix A, dosimetrically adjusted to an HEC,
NOAEL*[ADJ] is defined in Equation 4-2, and
DAFr is a dosimetric adjustment factor for respiratory tract region, r (ET, TB, PU, TH,
or TOTAL), either the regional deposited dose ratio (RDDR) for particles or the regional gas
dose ratio (RGDRr) for gases .
The DAF represents a multiplicative factor used to adjust an observed exposure
concentration in a particular laboratory species to an exposure concentration for humans that
would be associated with the same delivered dose. The calculation of the RDDRr for
particles and the RGDRr for gases is described in section 4 .3.5 and 4.3 .6, respectively .
Depending on whether the observed toxicity is in the respiratory tract or at remote
(extrarespiratory) sites, the DAFr is used in conjunction with default normalizing factors for
the physiological parameter of interest . Because insoluble particles deposit and clear along
the surface of the respiratory tract, dose per unit surface area is a commonly use d
4-25

p. 63
normalizing factor for respiratory effects due to particulate deposition ; body weight is often
used to normalize dose to remote target tissues . In some cases, it may be appropriate to
normalize by regional volumes or target organ weights . For gases, use of mass flux (mass
per surface area-time) is considered a reasonably accurate predictor of the peak localized
concentration driving the absorption gradient for respiratory tract effects . For example, if the
observed toxicity is in the TB region, the dose deposited in that region for each species is
normalized to the TB surface area for each species .
Default values of surface area (SA) for the various respiratory tract regions of five
commonly tested animal species are provided in Table 4-4 . Selection of the values was based
on a meeting of experts in laboratory animal and human morphometric measurements
convened in August 1991 (Jarabek, 1991) . At that time, a thorough review of the literature
had been conducted and the group was presented with summary tables of surface area
measurements; animal information (as available) including strain, body weight, sex and age ;
tissue preparation, and morphometric measurement technique . Based on discussion among
the expert group members, values were identified as most representative of a species and
designated as the default . These values do not always correspond exactly to the published
value that is cited in Table 4-4, most generally due to rounding.
TABLE 4-4. DEFAULT SURFACE AREA VALUES FORRESPIRATORY EFFECTSa
ET TB PU
(cm2) Source (cm2) Source (m2) Source
Human 200.0 Guilmette et at . (1989) 3,200.0 Mercer et at . (1994a) 54 .0 Mercer et al . (1994b)
Mouse 3 .0 Gross et al . (1982) 3 .5 Mercer et al . (1994a) 0.05 Geelhaar and Weibel (1971) ,
Mercer et at . (1994b)
Hamster 14.0b 20.0 Yu and Xu (1987) 0 .3 Lechner (1978 )
Rat 15.0° Gross et at . (1982) 22.5 Mercer et at . (1994a) 0.34 Mercer et al . (1994b)
Guinea Pig 30 .0 Schreider and Hutchens 200 .0 Schreider and Hutchens 0 .9 Tenney and Remmers (1963)
(1980) (1980)
Rabbit 30.0 Kliment (1973) 300.0 Kliment (1973) 5 .9 Gehr et at . (1981)
aET = Extrathoracic .
TB = Tracheobronchial .
PU = Pulmonary .bNo measurements of hamster ET surface area were found in the literature . This value is estimated based on similarity of the other
regional surface areas to the rat .
cAdditional unpublished measurements of the surface area beyond the ethmoid turbinates are included .
4-26
p. 64
Body weight is the recommended normalizing factor for remote (extrarespiratory)
effects . The default body weight values for the same five animal species are provided in
Table 4-5. The body weight for the human is the weight used by the International
Commission on Radiological Protection (Snyder et al., 1975) for the Reference Man . The
values in Table 4-5 are taken from U .S . Environmental Protection Agency (1988a) and
provide recommended values for body weights when evaluating subchronic or chronic studies
in a variety of strains for each species . Often information on the strain used in a particular
study can be obtained from the principal investigator in the rare event that it is not provided
in the journal articles. If different strains are used than those in Table 4-5 and the body
weight is reported, choose the strain with the most comparable body weight . Documents on
recommended values for use in risk assessment (U .S. Environmental Protection Agency,
1988a) and for use in physiologically based models (U .S. Environmental Protection Agency,
1988b) are useful sources of default values for parameters such as ventilation rates and body
weights for use in these equations when these values are not supplied in individual
investigations . Available allometric equations (Adolph, 1949 ; Weibel, 1972 ; U.S .
Environmental Protection Agency, 1988a), relating body size to the parameters of interest
such as ventilatory rates and lung surface areas also may be appropriate . It must be
emphasized that the use of default or derived values must be consistent with the dosimetric
modeling parameters and approaches used in adjusting concentrations to human equivalent
values, such as the parameters used to calculate the RDDRr and RGDRr .
The default ventilation values for minute volume [VE = tidal volume (VT) x breathing
frequency (f)] are calculated using the allometric scaling equations provided in U .S .
Environmental Protection Agency (1988a). The general form for the equation is :
log (VE)=bo+b1 log(BW) (4-4)
where log refers to the natural logarithm, VE is in L/min and body weight (BW) is in kg .
The species specific parameters (bo and bl) are listed in Table 4-6 . At the present time, the
default body weight for the human is defined to be 70 kg, and the VE is defined to b e
(13.8 L/min) 20 m3/day .
4-27

p. 65
TABLE 4-5. BODY WEIGHT (kg) DEFAULT VALUES-RATS
Strain Sex Subchronic Chronic
Fisher 344 F 0.124 0.229
Fisher 344 M 0.180 0.380
Sprague-Dawley F 0.204 0.338
Sprague-Dawley M 0.267 0.523
Long-Evans F 0.179 0.344
Long-Evans M 0.248 0.472
Osborne-Mendel F 0.201 0.389
Osborne-Mendel M 0.263 0.514
Wistar F 0.156 0.297
Wistar M 0.217 0.462
BODY WEIGHT (kg) DEFAULT VALUES-MICE
Strain Sex Subchronic Chronic
B6C3F 1 F 0.0246 0.0353
B6C3F1 M 0.0316 0.0373
BAF1 F 0.0204 0.0222
BAF1 M 0.0223 0.0261
BODY WEIGHT (kg) DEFAULT VALUES-HAMSTE R
Strain Sex Subchronic Chronic
Syrian F 0.095 0.145
Syrian M 0.097 0.134
Chinese and Djungarian F 0.025 0.038
Chinese and Djung arian M 0.03 0.041
BODY WEIGHT (kg) DEFAULT VALUES-GUINEA PIG S
Strain Sex Subchronic Chronic
Not specified F 0.39 0.86
Not specified M 0.48 0.89
BODY WEIGHT (kg) DEFAULT VALUES- RABBITS
Strain Sex Subchronic Chronic
New Zealand F 3.10 3.93
New Zeal an d M 2.86 3.76
Source: U.S . Environmental Protection Agency (1988a) .
4-28

p. 66
TABLE 46. INTERCEPT (bo) AND COEFFICIENT (bi) VALUES USE DIN ALGORITHM (Equation 4-4) TO CALCULATE DEFAULT MINUTE VOLUMES
BASED ON BODY WEIGHT
bo bl
Rat -0.578 0 .821Mouse 0.326 1.050Hamster -1.054 0.902Guinea pig -1.191 0.516Rabbit -0.783 0 .831
Source: U.S. Environmental Protection Agency (1988a) .
4.3 .5 Dosimetric Adjustments for Particle Exposures
Inhalation toxicologists have advanced their ability to measure the deposition of particles
in the various regions of the respiratory tract across species. Initially the data were primarily
total deposition values for polydisperse and sometimes unstable aerosols, but data now exist
for insoluble monodisperse aerosols of different sizes under different breathing conditions
(U.S. Environmental Protection Agency, 1982b) . Data are available for many experimental
species of interest on the regional deposition of aerodynamic particle size ranges and on the
necessary physiologic parameters (e .g., ventilation parameters and regional surface areas)
incorporated in dose adjustments (Overton et al ., 1987 ; Miller et al ., 1987b; Miller et al .,
1988 ; Raabe et al ., 1988 ; Patra et al., 1986; Patra, 1986) . Deposition data are usually
reported as the deposition fraction for each respiratory tract region of the species of interest .
Deposition fraction is the ratio of the number or mass of particles deposited in the respiratory
tract to the number or mass of particles inhaled . Deposition data also may be expressed as
efficiencies, that is the amount deposited in a particular region normalized for the amount
entering that region .
Knowledge also has been gained in the technology and methods for generating and
characterizing aerosols . State-of-the-art inhalation toxicology studies characterize the
particulate exposure by the particle diameter (e .g ., aerodynamic equivalent diameter [dae],
aerodynamic resistance diameter [dar], mass median aerodynamic diameter [MMAD]), and
the geometric standard deviation (Qo) . Appendix H provides information on convertin ga
4-29

p. 67
reported particle units to those used in the calculation of the dosimetric adjustment factor and
guidance on default values.
These advances in quantitation of species-specific regional respiratory tract deposition
and characterization of physiologic parameters have been used in the development of an
empirical model that accounts for dosimetry differences using deposition data typical for
aerodynamic particles . This application is an adaptation (Miller et al ., 1983b; Graham et al .,
1985) and an extension (Miller et al ., 1988 ; Jarabek et al ., 1989, 1990) of previous work .
A series of empirical equations were fit to experimental measurements of regional particle
deposition in various laboratory species and humans as described in Appendix G. These
equations are used to estimate fractional deposition and, in conjunction with normalizing
factors such as body weight or surface area, are used to adjust for dosimetric differences
between species in the calculation of an HEC. The approach is limited at this time to
relatively insoluble and nonhygroscopic particles .
The derivation of the NOAEL[HECI for insoluble, approximately spherical particles is
described as
NOAEL*[HEC] (mg/m3) = NOAEL*[ADJI (mg/m3) X RDDRr, (4-5)
where:
NOAEL*[HECI = the NOAEL or analogous effect level obtained with an alternateapproach as described in Appendix A, dosimetrically adjusted to anHEC;
NOAEL*[ADJ] = is defined in Equation 4-2 ; and
RDDRr = a multiplicative factor used to adjust an observed inhalationparticulate exposure concentration of an animal (A) to the predictedinhalation particulate exposure concentration for a human (H) thatwould be associated with the same dose delivered to the rth region ortarget tissue :
(RDDr./Normalizing Factor)ARDDRr =
(RDDr/Normalizing Factor) H
The r regions and potential target tissues identified by this calculation are the three
respiratory tract regions (extrathoracic [ET], tracheobronchial [TB], or pulmonary [PU]) .
4-30

p. 68
Definitions of the three regions are provided in Chapter 3 of this document . The RDDRr can
also be calculated for the thoracic (TH) region (TB plus PU regions) or the total (TOT )
respiratory tract (all three respiratory tract regions) . Total deposition (deposition summed for
all three regions) is assumed to be available for transport to other organs and is used to
calculate the RDDR for extrarespiratory (ER) effects .
It is frequently desirable to use a normalizing factor when comparing doses across
species. Because insoluble particles deposit and clear along the surface of the respiratory
tract, dose per unit surface area is a commonly used normalizing factor for particulate
deposition in the respiratory tract . In some cases, it might be desirable to normalize by
regional volumes, organ weight, or body weight . It might also be appropriate to examine the
dose ratio with no normalizing factor. The appropriate normalizing factor to use may also be
judged according to the guidance provided in Section 4 .3 .3 on the use of pharmacokinetic and
pharmacodynamic data, with heed to the cautionary notes provided in the following sections .
Regional deposited dose (RDD) is estimated a s
RDDr = 10-6 X Ci X VE X Fr, (4-6)
where :
RDDr = dose deposited in region r, mg/min,
Ci = concentration, mg/m3 ,
VE = minute volume, mL/min ,
Fr = fractional deposition in region r .
The RDDRr may be expressed as a series of four ratios :
RDDR = (10~ x Cl)A x(Normalizing Factor)H x(V E)A X (Fr)A 4-7)r (10-6 X Cl)H (Normalizing Factor)A (VE)H (Fr)H (
For the purposes of calculating the RDDRr, the exposure concentration for the
laboratory animal (A) and human (H) are assumed to be the same because it is assumed that
the observed effect in the laboratory animal is relevant to human health risk. Therefore, the
RDDRr provides a factor to adjust for the difference in dose delivered to the target tissue
4-31

p. 69
under the same exposure scenario . The first term in Equation 4-7, therefore, equals one and
will not be discussed further .
The second term in Equation 4-7 is the ratio of the normalizing factors for the human
and laboratory animal of interest . For effects in any or all of the three regions of the
respiratory tract, surface area (see Table 4-4) is the recommended normalizing factor .
To evaluate extrarespiratory effects, body weight (see Table 4-5) is the recommended
normalizing factor . The third term of Equation 4-7 is the ratio of minute volumes (see
Equation 4-4) .
The final term in the RDDRr equation is the ratio of regional fractional deposition in
laboratory animals and humans . By means of nonlinear regression, empirical equations have
been fit using experimentally measured regional deposition in both laboratory animals and
humans . Details on the estimation procedures are provided in Appendix G . These equations
provide predictions for approximately spherical, nonhygroscopic, insoluble particles in the
aerodynamic size range (particle diameter > 0 .5 j.cm) . Deposition fractions should not be
calculated using these equations if the particles deviate enough from spherical that they are
not reasonably described by an aerodynamic diameter (e .g., fibers) or if the particles are
smaller than 0 .5 µm (see Appendix H for a discussion of particle-related issues) . Predicted
deposition of hygroscopic particles may be approximated by these equations using the
equilibrium particle size, if known . Other techniques to estimate fractional deposition are
required for particles falling outside the assumptions of this empirical model .
The RDDRr is most easily calculated using the software available as a supplement to
this document. For near monodisperse particles (ag < 1 .3), deposition fractions may be
calculated as described in Appendix G and the RDDRr calculated by hand . For polydisperse
particles (vg > 1 .3), however, deposition fractions are calculated by integrating the product
of the monodisperse deposition probabilities and the log-normal distribution . This calculation
must be done by computer . The software to perform the RDDRr calculation is written i n
C and will run on any DOS-based personal computer . A math coprocessor chip is not
required . Figures 4-5 to 4-8 illustrate the four screens of the program. The first three
figures show how the program display screens will look during data entry, while Figure 4-8
reproduces the RDDRs that would be calculated using these input data .
4-32

p. 70
This program calculates the regional deposited dose ratiofor rodent/human for a particle characterized by a given mass median
aerodynamic diameter (MMAD) and geometri c variance (sigma g).v.2 . 2
Enter the MMAD in microns (.5 - 30) : 2 .3
Enter the sigma g(>=1 .0): 1 . 8Computationally sigma g < 1 .3 will be considered monodisperse
Press Esc key to quit, Enter to continue, any other key to repeat .
Figure 4-5. Display Screen 1 of the computer program that calculates regional depositeddose ratios .
Human information :
default Body weight = ?8 .88 (Kg)default Minute Volume (VE) = 13 .88 (Liters)default ET surface area = 288 .88 (cmL)default iB surface area = 3288 .88 (creL)default PU surface area = 54 .88 (nt )
Press Esc key to quit, Enter to continue, any other key to repeat .
Figure 4-6. Display Screen 2 of the program that calculates regional deposited doseratios .
4-33

p. 71
Select one of the following :
1 . use2 . hamster3 . rat4 . guinea pigS . rabbit
Select one (1 - 5) : 3
Body weight from table 4-4 = 188 .88 (g)default Minute Volume (VE) = 137 .38 (ml )default ET surface area = 15 .88 (cmz) new value : 12 .88(cmz)default TB surface area = 22 .58 (cmz )default PU surface area = 0 .34 (mL )
Press Esc key to quit, Enter to continue, any other key to repeat .
Figure 4-7. Display Screen 3 of the computer program that calculates regionaldeposited dose ratios .
Regional deposited dose ratios
NflAD = 2.30Sigma g = 1.8 0
Body Extrathoracic Tracheobronchial Pulmonary
SPECIES weight(g) VE(wl) SA(cw"2) dep SA(cw"2) dep SA(w"2) dep
-------------------------------------------------------------------------------rat 180 137 .3 12 .000 0 .473 22 .500 0 .058 0.340 0 .089human
70000 13800 .0 200 .000 0 .3% 3200 .000 0 .095 54.000 0 .231
--------------------------------------------------------------------------------RATI[1 0 .003 0 .010 0.060 1 .1% 0 .007 0 .610 0.006 0 .387
RDDR 0.198 0.863 0 .611
Thoracic Total RT ExtrarespiratorySA
(w°2) dep SA(m-2) dep BY(g) dep
--------------------------------------------------------------------------------rat 0.342 0 .147 0 .343 0 .620 180 0 .620
human 54 .320 0 .125 54 .340 0 .721 70000 0 .72 1
--------------------------------------------------------------------------------RATIQ 0.006 1 .174 0 .006 0 .860 0.003 0 .860
RDDR 0.713 1.353 3.326
Enter : save screen • new session . Esc : save screen • quit . V . 2 . 3
Figure 4-8 . Display Screen 4 of the computer program that calculates regionaldeposited dose ratios.
4-34

p. 72
To begin the program, type RDDR in upper or lower case letters . The program will
then prompt you to enter the MMAD and og for which you want to calculate an RDDRr
(Figure 4-5) . Although most studies do report particle sizes as aerodynamic diameter, some
studies do not . Using incorrect units in the program will result in incorrect estimates of
the deposition fraction. Particle size definitions, a discussion on conversion among units,
and guidance on default values when there is inadequate information in a study to determine
the MMAD and aba are provided in Appendix H .
The second screen (Figure 4-6) will print the default values for the minute volume, the
three respiratory tract surface areas, and the body weight for the human . As each one is
listed, the user has the option of changing the default value for the calculations . Although
the software is written so that default values may be changed, it should be noted that body
weight, surface areas, and minute volumes are all inter-related and should be changed so that
all values are consistent with each other . It is also not recommended to make changes
without being able to provide detailed documentation to support alternative values .
The third screen (Figure 4-7) provides a list of 5 animal species from which one must
be selected. The body weight (selected from Table 4-5) must be entered . The program then
calculates and lists the default minute volume and the default surface areas . Similar to the
humans, any of these values may be changed if desired . The same cautions and caveats for
changing human default values apply to the laboratory animals .
In the fourth screen (Figure 4-8), the input parameters are listed ; the ratios described in
Equation 4-7 are printed ; and the calculated RDDRs are listed for the three respiratory tract
regions, the thoracic region, the total respiratory tract and for extrarespiratory effects . This
screen may be output to an ASCII file and printed using DOS commands . The "PRINT
SCREEN" key will work for a stand-alone PC with its own local printer . Use of the
"PRINT SCREEN" key with networks depends on how files are treated in the buffer .
The program may be run sequentially and calculations made by hand to determine an
RDDRr based on a human activity pattern . First, the minute volumes to be included in the
activity pattern and the fractional time spent at each minute volume must be determined .
Then, the program must be run for each minute volume (keeping all other data the same-
4-35
p. 73
MMAD, Qg, and surface area for the human, and species, minute volume, and surface area
for the animal) . Then,
aRDDRr
["
CT ] = t[1] X VEH
P ]x FrH
[1] +t[2] X VE X Fr + . . . +t~n] X VE X Fr (4-8
)
H[2] H[2] H[n] H [n]
where t[il is the fractional time spent breathing minute volume [i],
t[l] + t[21 + . . . + t[n] = 1, and(4-9)
a- (SAr)H x VE x Fr (4-10)(SAr)A A "
All of the needed values can be read from Screen 4. The calculated value, a, should have the
same input values (i .e., surface areas, all animal input information) on each Screen 4
generated for the activity pattern, but the human values for deposition (FrH[I]) and minute
volume (VEH[i] ) will be different .
Although the default normalizing factor used in the program for the respiratory tract
RDDRs is surface area and the default normalizing factor for the extrarespiratory RDDR is
body weight, there are situations in which an alternative normalizing factor might be
appropriate . In this case, the deposition ratio and the VE ratio from the 4th screen of the
computer program (Figure 4-8) may be multiplied by hand calculations of the normalizing
factor in humans divided by the normalizing factor in animals to determine the RDDRr .
Alternatively, when the default surface area values are listed in Screens 2 and ?
(Figures 4-6 and 4-7), they may be changed to the values of the new normalizing factor .
A caveat when "tricking" the program this way is to pay attention to the units of the
normalizing factor . In the program, ET and TB surface areas are entered in cm2 while the
PU surface area is entered in m2 . The program converts units internally when calculating the
TH and total RDDRs. Unless the units of the proposed normalizing factor bear the same
relationship to one another as the surface areas, the program calculated TH and total RDDRs
with the alternative normalizing factor will be incorrect . At the present time, because
VE calculations depend on entering correct body weight data, if the program is "tricked" by
4-36
p. 74
entering information other than body weight to estimate an extrarespiratory RDDR, then th e
correct VE must be used to replace the program calculated "default" VE .
The next two sections provide a summary of the default values used for respiratory tract
effects and extrarespiratory tract effects . As discussed above, details on estimation of the
deposition fractions are described in Appendix G .
4.3.5.1 Respiratory Effects
The general dosimetric approach for insoluble particles outlined above provides the basis
for estimating HECs . When the toxic effect of interest is in the respiratory tract, the
equivalent dose across species is assumed to be the particle mass (mg) per minute per unit
surface area (cm2 or m2) of the respiratory tract region of concern .
When the toxic effect of interest is in the respiratory tract, the normalizing factor
described in Equation 4-7 should be replaced specifically by the surface area (SA) of the
respiratory tract region of interest .
RDDRr = ( 10~ X C;)A X(SAr)H X(VE)A X(Fr)A (4-11)
(10-6X G)H (SAr)A (VE)g (F)H
The default surface area values are provided in Table 4-4 .
It is preferable, when possible, to estimate the RDDRr for one of the three defined
respiratory tract regions (ET, TB, or PU). Sometimes the nature of the effect or the detail of
reporting precludes distinguishing between a TB and a PU effect so that an RDDRr for the
TH region would be preferred, or it might be possible only to identify the region of interest
as the entire respiratory tract . Either some aggregation must be used in calculating the
RDDRr, or the RDDRr for the region that results in the most conservative HEC could be
selected . There are several techniques to aggregate the deposition information for calculation
of TH or total respiratory tract RDDRs . The resulting RDDR can vary substantially, and in
some cases the determination of which species is more sensitive (human or laboratory animal)
may change. This is due to differences in fractional deposition (reflecting the complexities
of the mechanisms governing deposition) in the different regions (see Chapter 3) and to the
differences in regional surface areas, which may span several orders of magnitude. The
4-37

p. 75
formula used to calculate the total respiratory tract RDDR (RDDRTOT) is given below .
Calculation of the thoracic RDDR (RDDRTH) differs only in the exclusion of terms related to
the ET region .
First, for each species, regional fractional deposition (Fr) per unit surface area (SAT) is
calculated and weighted by the percent of the respirato ry tract (TH region) accounted for by
that region .
)X SAET + SATB + SAPU (4-1
2SAET
Then, simplifying this expression and summing over the three (or two in the case of the
calculation for the TH region) regions gives
FTOT FET + FTB + FPU (4-13)SATOT SAET + SATB + SAPU '
yielding
(10 --6 X Ci)A (SATOT)H (VE)A (FTOT)ARDDRTOT = x x x (4-14)
(10~ X C)H (SATOT)A (VE)H (FTOT) H
4.3.5.2 Remote (Extrarespiratory) Effects
The respirato ry tract might not be the target organ for an inhaled compound. The dose
actually delivered to other regions of the body will be affected by metabolism, clearance, and
distribution patterns . Part icles depositing in the respiratory tract will clear rapidly (ET can be
within seconds of inhalation) or slowly (PU clearance may take weeks or months) to the GI
tract or be absorbed into the interstitium, lymphatics, or into the blood from the respiratory
tract . Once deposited, however, very few particles will clear by exhalation (sneezing or
coughing). Therefore, it is not unreasonable to estimate extrarespiratory deposition by total
4-38
p. 76
deposition in the respiratory tract when information on dose delivered to nonrespiratory tract
organs is unavailable .
The current default normalizing factor for extrarespiratory effects is body weight .
In the case of extrarespiratory effects of particles, the equivalent dose across species is
assumed to be the mass of particles (mg) deposited per unit body weight (kg) . Until
clearance and distribution parameters can be incorporated, it is assumed that 100% of the
deposited dose to the entire respiratory system is available for uptake to the systemic
circulation . Although this assumption will most likely result in an overestimate of the dose
delivered to the extrarespiratory target tissue, it is not possible to predict a priori the impact
on the dose ratio and resulting HEC (e .g., if the overestimate is of similar magnitude in both
the laboratory species and human, the HEC will be relatively unaffected) . Use of deposited
dose is more accurate than using exposure concentration, however . Therefore, Equation 4-7
may be rewritten as :
RDDRER = (10~ x Ci)A
XBWH x(VE)A x (FTOT)A (4-15)
(10-6 X C)H BWA (VE)H (FTOT)H
The default values for body weight are shown in Table 4-5 . The body weight for the
human is the weight used by the International Commission on Radiological Protection
(Snyder et al ., 1975) for the Reference Man .
4.3.5.3 Additional Issues for Particle Dosimetry
The RDDRr for particle exposures consists of components to account for differences
between species due to ventilation (VE), the dose metric (surface area, body weight, or other
appropriate factor) and predicted regional deposition fractions . Although the use of this
dosimetric adjustment provides a step towards more quantitative risk assessment, there are
some limitations in the available data which, at present, preclude extension of the model to
certain scenarios of interest for risk assessment . As additional information become s
available, the particle dosimetry equations will be refined and updated . This section discusses
current recommendations for addressing particle dosimetry when the exposure information is
outside the defined conditions for the model .
4-39

p. 77
Hygroscopicity, Solubility, and Nonspherical Panicles
The empirical equations used to estimate the predicted regional deposition fractions are
derived from exposures using monodisperse, approximately spherical, nonsoluble, and
nonhygroscopic particles. The cases outside the defined conditions for the equations include
polydisperse particle size distributions, nonspherical particles, and soluble and/or hygroscopic
particles. Also, Gerde et al . (1991) have shown that highly lipophilic chemicals and
chemicals either absorbed or precipitated onto particles behave fundamentally differently and
may require other modeling approaches .
As described in Appendix G, deposition fractions may be estimated for polydisperse
spherical particles by integrating the monodisperse deposition fraction over the size
distribution of polydisperse particle . The calculations made for this document assume a
lognormal particle size distribution (Raabe, 1971) . When particle size distribution for an
exposure is reported as MMAD and Qg, it may be assumed that the particle size distribution
is described by the lognormal distribution (because MMAD and ag are the first two moments
for a lognormal distribution). If exact size distribution information is given or the particles
are described as coming from a different, well-parameterized distribution, then an exact
calculation must be performed .
Nonspherical particles may be described in terms of their equivalent aerodynamic
diameter and, if this information is provided, deposition fractions may be calculated as
described in this chapter and Appendix G . Deposition fractions may not be calculated usin g
these equations if an aerodynamic diameter is not provided .
Many particles are hygroscopic and/or soluble . Hygroscopic particles may change size,
shape, and density as they traverse the warm, humid airways of the respiratory tract . Soluble
particles might or might not undergo hygroscopic changes as they travel along the airways .
Solubility will change the physicochemical interactions of the particle with the surface upon
which it deposits. Hygroscopicity is a phenomenon related to deposition whereas solubility is
related to clearance. This discussion, therefore, will focus on hygroscopicity and its potential
effects on predicted fractional deposition .
The RDD of a hygroscopic aerosol will often be different from that of nonhygroscopic
particles, although both had similar size distributions upon inhalation (Martonen et al ., 1985) .
The factors influencing changes in inhaled hygroscopic particle characteristics are bein g
4-40

p. 78
studied experimentally and through development and analysis with complex theoretical models
(Martonen and Patel, 1981 ; Martonen, 1982; Ferron and Hornik, 1984 ; Martonen et al . ,
1985 ; Eisner et al., 1990), but application in risk assessment awaits definition of the primary
factors influencing hygroscopic growth on species- and agent-specific bases . The factors
include initial particle geometry and density, material hygroscopic growth characteristics,
respiratory parameters, and temperature and relative humidity profiles . Observations on the
data from modeling efforts to date indicate that hygroscopic particles in the diffusion-
dominated regime have reduced TH deposition relative to nonhygroscopic particles of
identical preinspired size, whereas those hygroscopic particles affected by inertial and
gravitational forces have an increase in TH deposition relative to nonhygroscopic particles
(Martonen et al ., 1985) . These observations may be explained by changes in the particle size
after inspiration . Accordingly, the calculated deposition efficiency for nonhygroscopic
particles would underestimate the TH deposited dose for the larger (affected by inertial and
gravitational forces) hygroscopic particles, and overestimate the deposited dose for the
smaller diffusion-dependent hygroscopic particles . The TH deposited dose of inhaled
nonhygroscopic particles, however, is always less than the initial total dose (exposure dose) .
Also, the relative changes in deposition will be in a similar direction in experimental animal
species and humans . Dosimetric adjustment by the default insoluble (nonhygroscopic)
empirical deposition equations is recommended as a conservative default for the hydroscopic
particles, pending modification by the elucidation of the hygroscopic models .
Ventilation
It is recognized that this approach is based on deposition efficiency data obtained or
derived under a particular set of ventilatory parameters (i .e ., the experimental parameters for
the laboratory animals and human subjects), coupled with default ventilation parameters ( VE) .
The assumption in this application is that it is valid to linearly extrapolate from these
experimental values to the default sets of ventilation parameters. The validity of this
assumption is being investigated . The effect of activity pattern on ventilation and the
allometric relationships between lung weight, lung surface area, and body weight have been
investigated (Adolph, 1949 ; Weibel, 1972 ; U.S . Environmental Protection Agency, 1988a ;
4-41

p. 79
1993b; Federal Register, 1992b) . A discussion of the impact that breathing pattern has on
the human deposition estimates can be found elsewhere (Miller et al ., 1988) .
Differences Between Experimental and Ambient Exposure s
The human ambient exposure scenario, when known, may be characterized by a
different MMAD and vg than that used to derive the health risk assessment . Comparisons
between ratios calculated with a MMAD and a9 the same as the animal exposure and
calculated with the human estimate using the anticipated ambient MMAD and ag may provide
some insight on the uncertainty of this extrapolation .
Clearance and Retention
In addition to inspired air concentration, VE, surface area, and deposition efficiency,
the effective dose of inhaled particulate matter will vary with bioavailability . The fraction of
particulate matter dissolved and assumed to be bioavailable can be expected to increase with
greater particle solubility, as well as with longer residence time in the lungs . Until clearance
and distribution parameters can be systematically incorporated, 100% of the deposited dose to
the entire respiratory tract is assumed to be available for uptake to the systemic circulation .
As discussed, this assumption will most likely result in an overestimate of the dose delivered
to the extrarespiratory target tissue, although it is not possible to predict a priori the impact
on the dose ratio and resultant HEC . Use of deposited dose is more accurate than using
exposure concentration, however . Models have recently been used to simulate clearance and
estimate retention in various species (Snipes, 1989a,b ; Yu and Yoon, 1990) . The EPA has
recognized the importance of incorporating clearance components to its dosimetric
adjustments in order to calculate regional retained dose ratios (RRDRs) for estimates of long-
term lung burdens, but such models for classes of particles and different species used in
testing are not fully developed . In those cases where clearance and distribution have been
experimentally determined and a validated model exists, the more comprehensive model
should be used . For example, the model of Yu and Yoon (1990) was used to calculate the
HEC for diesel engine emissions (IRIS, 1992) .
4-42

p. 80
Population Variability
The calculation of an RDDRr currently uses point estimates for all the terms in
Equation 4-7 and its variants ; that is, a default VE for each species, a default regional surface
area, and an estimate of fractional deposition . These single values are assumed to be
representative of the average value of that term for a member of the laboratory animal species
or human population. In fact, as discussed in Chapter 3, there are many sources of
intraspecies variability that contribute to the range of responses observed to a given external
exposure to an inhaled toxicant . Host factors affect both the delivered dose of the toxicant to
the target tissue and the sensitivity of that tissue to interaction with the toxicant . The
procedures described in the preceding sections of this chapter on particle dosimetry provide
some limited capabilities to examine the effects of population variability on the RDDRr by
simply changing the default VE and surface areas in an iterative fashion . As indicated in
these sections and in Appendix G, however, because of the correlations between VE, surface
area, and body weight, such changes should be made with extreme caution . Although the
point estimates of the parameters used to predict deposition efficiencies (details in
Appendix G) are used to calculate fractional regional deposition, the empirical model also
provides estimates of variability that can be used to generate confidence intervals reflective of
population variability. Using iterative computational procedures, it is possible to generate
envelopes of regional fractional deposition that can be used with distributions of VE, surface
areas, and body weights to provide ranges of RDDRrs . Actual implementation of this
procedure is not straightforward due to the complex nature of the correlation structures .
In future versions of the dosimetric model used to calculate RDDRr, it should be possible to
estimate a distribution for the RDDRr reflective of population variability in both laboratory
animals and humans .
Susceptible Subpopulations
The data used to estimate regional fractional deposition are based on experimental
measurements made in healthy laboratory animals and humans breathing under normal or
approximately normal conditions . It is recognized that deposition patterns might vary in
potentially susceptible subpopulations such as children, the elderly, or people with respiratory
diseases (see Chapter 2) . Limited data are available at present for fitting deposition
4-43

p. 81
efficiency equations for any of these subpopulations . If it is assumed that the same efficiency
relationships may be used, then the model may be used to examine predicted RDDRs
(in healthy children, for example) by scaling surface area and ventilation for size . This
approach is consistent with deterministic models of deposition in which airway geometry and
ventilation are scaled to children's dimensions, but the mechanisms of deposition are
unchanged. Although the approaches are consistent, the predicted deposition patterns might
vary with measured data .
4 .3.6 Dosimetric Adjustments for Gas Exposure s
The approach described in Section 4 .3 .5 for the insoluble particles illustrates the
feasibility of interspecies dosimetry calculations to extrapolate the toxicological results of
inhaled toxicants to human exposure conditions for dose-response evaluation . Dosimetry data
facilitate evaluation of concentration-response data with respect to dose-response relationships .
As described in Section 3 .2, predictive physiologically-based modeling for relatively insoluble
and reactive gases has been demonstrated (Overton and Miller, 1988) . Predictive
physiologically based modeling has also been demonstrated for gases and vapors of organic
solvents that may be metabolically activated (Fiserova-Bergerova, 1983 ; Andersen et al .,
1987a; Overton, 1989), and for reactive and soluble gases (Aharonson et al ., 1974 ; Morgan
and Frank, 1977 ; Hanna et al ., 1989; Casanova et al ., 1991 ; Morris and Blanchard, 1992) .
As discussed in Section 3 .2.2, the chemical-specific or class-specific nature of these models
has been dictated by the physicochemical characteristics of the subject gases and no single
model structure is applicable to the broad range of gases that the RfC methodology must
address. A gas categorization scheme was thus developed as a way to create separation
between types of gases so that model structures for each type could be developed . The
scheme developed in Section 3 .2 .2 should be used to categorize the type of gas for dosimetric
adjustment. The derivation of the model structure and its reduction to a form with a minimal
number of parameters as the basis of the default dosimetry adjustments for gases i n
Category 1 and 2 are presented in Appendix I . The model structure and basis for the default
adjustment for gases in Category 3 are presented in Appendix J . The reader is referred to
these sections for proper understanding of the framework of default dosimetric equations
presented herein .
4-44
p. 82
Consideration also should be given to the discussion by the National Research Counci l
(1986) and Dahl (1990) on interspecies extrapolation based on mechanism of action . Three
classes of mechanism were distinguished based on whether the parent compound, stable
metabolite, or reactive metabolite produces the toxic effect ; measures of dose for each of
these classes were suggested . These factors are often species-specific and dose-dependent, as
well as being chemical-specific and, therefore, require a substantial data base (beyond that
which exists in most circumstances) in order to model comparative species dosimetry of gases
based on mechanism of action . O'Flaherty (1989) presented a framework within which to
consider measures of delivered dose and discusses procedures for interspecies conversion of
kinetically equivalent doses . Identification of the limiting anatomic and physiologic
parameters, physicochemical characteristics, and exposure concentration and duration
conditions will facilitate the application of these factors to improve the interspecies default
dose adjustments . This understanding can also be used to gauge the appropriation of the
default adjustments on a case-by-case basis .
Basically, the RGDRr is used as the DAFr in Equation 4-3 to dosimetrically adjust the
experimental NOAEL to an HEC as
NOAEL*[HECI (mg/m3) = NOAEL*[ADJ] (mg/m3) X RGDRr, (4-16)
where :
NOAEL*[xECI = the NOAEL or analogous effect level obtained with an alternativeapproach as described in Appendix A, dosimetrically adjusted to anHEC ;
NOAEL*[ADJI = is defined in Equation 4-2 ; and
RGDRr = (RGD)A/(RGD)H, the ratio of regional gas dose in laboratory animalspecies to that of humans for region (r) of interest for the toxiceffect .
The default equations to derive the RGDRr for the different gas categories according to
toxicity in the respiratory tract versus remote sites follow in Section 4 .3 .6.1 and 4 .3 .6.2,
respectively . Because the boundaries between the categories are not definitive (see discussion
in Section 3 .2 .2 and Appendix I), but instead were made to allow derivation of default mode l
4-45

p. 83
structures, identification of the target effect(s) is used to further define the gas category .
Thus, remote (extrarespiratory) effects of Category 1 gases and respiratory effects of
Category 3 gases are treated according to the default dosimetric adjustments for each of these
respective effects of Category 2 gases (Section 4 .3.5 and 4 .3 .6) . The default dosimetric
adjustments to derive HEC values for respiratory effects of Category 1 gases are provided in
Section 4 .3 .5 . The default dosimetric adjustment to derive HEC values for extrarespiratory
effects of Category 3 gases is provided in Section 4.3 .6. Note that the gas categorization
scheme dose not apply to inert gases that exert their effects by reversible "physical"
interactions of gas molecules with biomolecules (e .g ., "displacement" of oxygen by carbon
dioxide or narcosis by some parent compounds) . Consideration of the inert gases is discussed
in Section 2 .1 .2 .3 .
4.3.6.1 Respiratory Effects
The two categories of gases with the greatest potential for respiratory tract effects are
gases in Category 1 and 2 . Category 1 gases are defined as gases that are highly water-
soluble and/or rapidly irreversibly reactive in the respiratory tract . Reactivity is defined to
include both the propensity for dissociation as well as the ability to serve as substrate for
metabolism in the respiratory tract . Gases in Category 2 are defined as gases that are
moderately water-soluble that may be rapidly reversibly reactive or moderately to slowly
irreversibly reactive in respiratory tract tissue . Examples of gases in Category 1 are
hydrogen fluoride, chlorine, formaldehyde, and the organic acids and esters . Examples of
gases in Category 2 are ozone, sulfur dioxide, xylene, propanol, and isoamyl alcohol .
Respiratory Effects-Category 1 Gases
Category 1 gases are distinguished by the property that the gas does not significantly
accumulate in the blood which would reduce the concentration driving force into the
respiratory tract tissue and hence reduce the absorption rate . This characteristic allowed the
default approach to be developed based on the integration of attributes of two empirical
models as discussed in Appendix I . The approach takes into account the loss of chemical in
the airstream to the upper respiratory tract as it progresses to the lower respiratory tract an d
4-46

p. 84
separate equations are provided to calculate dose in each region . The rationale and full
derivation of the equations is provided in Appendix I .
Extrathoracic Effects . For Category 1 gases that have an effect in the upper respiratory
tract, the following equation is used to calculate the ET regional gas dose ratio (RGDRET) .
-KB ErSA Er
VE) (A 1- e VE
)A
RGDRET =(DoseET)A (SAET (4-17)(Dose ) ~ET H -KgErSA ET
(SAE )H(1 - e VE )HET
where :
VE = minute volume (mL/min = cm3/min) ,
SET = surface area of the extrathoracic region (cm2), and
KgET = overall mass transport coefficient in the extrathoracic region (cm/min) .
A, H = subscripts denoting laboratory animal and human, respectively .
When the overall mass transport coefficient in the ET region (K~ET) is not known or can not
be reasonably approximated with experimental data for either species, the following equation
is used to calculate the default RGDRET (see Section 1 .2 .4 .1) :
VE)A
RGDR (DoseET)A SAET (4-18)ET (DoseET)H V
E )H
SAET
Tracheobronchial Effects. For Category 1 gases that affect the lower respiratory tract,
the scrubbing in the upper airways of the chemical is taken into account, and the
concentration of the air exiting the ET region is used in the derivation of dose to th e
TB region .
4-47

p. 85
The following equation is used to calculate the TB regional gas dose ratio (RGDRTB) :
VE -K9T
BSAM
RGDRTB =(DoseTB)A SATB A (fpET) A (1 - e VE )A (4-19)(DOSe~TB)H VE (fpET) H -Kg.~,B SA.ra ~
SA TB H (1 - e VE )H
where:
SATB = surface area of the tracheobronchial region (cm2) ,
KgTB = overall mass transport coefficient in the tracheobronchial region (cm/min),and
fpET = the fraction of inhaled chemical concentration penetrating the ET region andthereby available for uptake in the TB region, calculated as
KBuSAEr- V (4-20)
fpET = e E
If the penetration fraction is unknown due to the lack of data on KgTB, it is reasonable to
assume that Kg is large, which is consistent with the definition of Category 1 gases, such that
the exponential term of Equation 4-19 reduces to zero . The same result may be achieved by
determining the conditions in which the third ratio of the right hand side of Equation 4-19
reduces to 1 . These conditions will be a function of the default values for respiratory tract
surface area and minute volume as well as the absolute value of the overall mass transport
coefficient . Using the definition of fpET results in the following dose ratio :
4-48

p. 86
V E -K SAET
SA B~ V
RGDRTB = (RGDTB)A = TB `e' (eE
)A (4-21)(RGDTB)H
V
SA~.
E -KgEr VSATB H (e )H
When the overall mass transport coefficient in the extrathoracic region (KgE,I,) is not known
or can not be reasonably approximated with experimental data for either species, KgET is
further assumed to be one, and Equation 4-21 reduces further such that only minute volume
and surface areas are needed to evaluate the dose ratio :
`/E _ SAET
SA V E
RGDRTB = (RGDTB)A = TB A A(RGD ) (4-22)TB H VE 1 _ SAFr
rSXLT--IH VE H
If KgET is available for each species, Equation 4-21 would be the preferred default equation .
Pulmonary Effects . The gas concentration that reaches the PU region was affected by
the amount of uptake in both the ET and TB regions so that the derivation for the PU gas
dose ratio (RGDRpu) incorporates the penetration fraction both for the ET and TB regions,
respectively. The following equation is used to calculate RGDRpU :
( KgPQSAPU , )A ( Qalv )
RGDR
(Dosepu)A KgPUSAPU + Qaiv SApU A(fPTB)A (fPET)A (4-23)
PU (DosepU)HKgruSApU ) ( Qalv ) (fPTB)H (fPBT)H ~
KgvoSA + Qa1v H SApUH
where:
Qalv = alveolar ventilation rate (mL/min = cm3/min),
4-49
p. 87
SApU = surface area of the pulmonary region (cm2) ,
Kgpu = overall mass transport coefficient in the pulmonary region (cm/min) ,
fpET = the fraction of inhaled chemical concentration penetrating the extrathoracicregion and thereby available for uptake in the tracheobronchial region,calculated as in Equation 4-20, and
fpTB = the fraction of inhaled chemical concentration penetrating thetracheobronchial region and thereby available for uptake in the pulmonaryregion, calculated as
-K9TB
SA,,
fpTB CXTB = eVE (4-24)
=CXET
where :
CXET = the concentration exiting the extrathoracic region, and
CXTB = the concentration exiting the tracheobronchial region .
At large KgpU values, Equation 4-23 reduces to
Qalv
(RGDpU)A=
PUJ
A (fPTB)A (fPET)ARGDRpU = - (4-25)
(RGDpU)HkQalv (fpTB)H (fPET)H
pUH
If the penetration fractions to each of the preceding regions are unknown due to lack of
data on KgET and KgTB, the approach to deriving a default equation for the PU region is
described below.
Using the definition of fpET and fpTB results in the following PU region gas dose ratio :
4-50

p. 88
SATB SAEr
(-)AQalv -Kg1.B
V-Kg~.
V
RGDR = (RGDpU)A _ SApU (e E )A (e E )A (4-26)PU - ~
(R DpU H ( Qaly ) -KS
BTB VB -K
-Er
ysr
SApU H (e E )H (e E )H
which can be rearranged to
Qalv -SATBJ( KsTBIn -SA~. (KsE'~A
RGDpU) [sApu e ~E e vERGDRpU = A -_ A A A (4-27)
(RGDPU)H Qaly SArB
(KJAI -SA ET ( Ke 11)H
SApU H e ~E H e N~ E H
If (KbET) A and (KgTB) A are assumed to be equal to (K'.ET)H and (K(TB)H, respectively,
then Equation 4-27 can be further simplified to
KJB Kg~
Qalv_ SA.~.B SA~.
(RGDpU)A SApUA e yL A e yE A (4-28)
RGDRpU(RGDPU)H Qalv - SA'
.B - SAET
[sAPU H e v ► JH e Vc H
If it is further assumed that the value of K9 is equal to 1 for each region, the resulting default
equation (Equation 4-28) reduces to an equation requiring only surface area and VE
parameters . It should be noted that as comparative transport studies become available,
Equation 4-27 would be preferable because it includes the differences in mass transport in
each region for each species .
4-51
p. 89
Respiratory E,,~`'ects-Category 2 Gases
Category 2 or "transitional" gases have the potential for significant accumulation in the
blood and thus have the potential for both respiratory and remote (extrarespiratory) toxicity .
The accumulation in the blood will reduce the concentration driving force during inspiration
and thereby reduce the absorption rate or dose upon inhalation . They also have the potential
for significant desorption during exhalation . The model structure used as the basis for the
default dosimetric adjustment for Category 1 gases was insufficient for addressing this
property and a hybrid structure between that for Category 1 and Category 3 gases was
constructed . The rationale and full derivation of the equations is provided in Appendix I .
The default dosimetric adjustments for respiratory tract effects of Category 2 gases is
presented below and those for dosimetric adjustment of remote toxicity are provided in
Section 4 .3.6.2.
Extrathoracic Effects. For Category 2 gases, the ET regional gas dose ratio (RGDRET)
is given by
(C'S AE ) (1C
/ g -K SAE(RGD e~r
RGDRET = ET)A - ET A A(1 - e )A (4-29)(RGDET)H `/
E Cb/B -K SAFr(Ci ) (1- ) g~SAET H Ci H(1 - e E
)H
where :
Ci = inhaled concentration (mg/cm3 = 10-6 mg/m3), an d
Cb/g = gas concentration in equilibrium with blood concentration (mg/m3) .
However, K,,ET
for Category 2 gases is by definition less than 1 . Assuming K(,ET
is equal to
or less than 0 .5, a power series expansion of the exponential term results in the following
relationship :
4-52
P. 90
yET(Cl )VE (1 - CC/g) SAET
(RGDET)A S ET A ' A E A
RGDRET =(RGDET)H = VECb/g -Kg SAET
(4-30)
(Ci C, ) ( ~. )
SAET H 1 H VE H
Assuming the same inspired concentration, simplifies the RGDRET to
RGD ) K (1-C g)
( ET A geCA 1 ARGDRET = (RGD ) K C (4-31)
ET H ge~.H (1 _ b/g)
C' H
If the overall mass transport coefficients (K 9d are assumed equal as in the case of Category
1 gases, the RGDRET is reduced to the ratio of the blood term (1 - Cb/g/Ci) .
Two cases were developed for the derivation of the blood term (see Appendix I) . The
first case assumes systemic elimination is much greater than respiratory tract metabolism such
that
(RGDET)A - Kg~A (0 .25 QTHb/b)A RGDRET (4-32 )
(RGDET)H KgErH (0 .25 QTHb/g)H
and the second case where the respiratory tract metabolism is of equal significance to
systemic elimination such that
(RGDET)A - KgET
A (0.5 QTHb/g)ARGDRET (4-33)
(RGDET)H Kg~,H (0 .5 QTHb/g)I
I 4-53

P. 91
where EMAx, the maximum extraction efficiency, is equal to 0.25 Qr and Hb/g is the
blood :gas (air) partition coefficient of the chemical . Because the constants are equal in the
numerator and denominator, Equations 4-32 and 4-33 reduce to the same equation . Thus, the
default regional gas dose ratio for ET effects of Category 2 gases is :
(RGDET)A KgEr
A (QTHb/g)A
RGDRET = (4-34)(RGDET)H Kg
FrH (QTHb/g)H
Equation 4-34 can be further reduced by the assumption that the overall mass transport
coefficients (KgET) are equal when these values are not available . The value of 1 .0 is used
for the ratio of (Hb/g)A / (Hb/g)H if (Hb/g)A ~> (Hb/g)H or if these partition coefficient values
are unknown . Gargas et al . (1989) and Jepson et al . (1994) provide discussion of techniques
to derive partition coefficients and report values for volatile and nonvolatile chemicals,
respectively .
Tracheobronchial Effect.s . The TB regional gas dose ratio (RGDRTB) for Category 2
gases is given by
(C `IE ) -K SA E7 Cb/a -K SA,.
(RGDTB)A 1SATBA(e VE )A C' A(1 - e yE )A
RGDRTB - - ~B(RGDTB)H VE -K SA~ Cb/a -K S
g~ (1 - ) ~B(C'SATB)H (e )H Ci H (1 - e E )H
(4-35)
As in the ET region, KgTB for Category 2 gases is by definition less than 1 and a powe r
series expansion of the exponential term for the TB region similarly reduces the last term on
the right hand side to the animal-to-human ratio of KgTB (SATB/ VE) . The exponential term
for the ET term in Equation 4-35 is reduced by assuming KgET is the same for each species
as was assumed for Category 1 gases . At values of KgET less than or equal 0 .5, the
4-54

p. 92
ET exponential term approaches one. Thus, assuming the same inspired concentrations ,
Equation 4-35 becomes
Cb/a(1 - )
(RGDTB
)p
Kg
C'RGDRTB = = TBA A . (4-36)
(RGDTB)H KgTBH (1 _ Cb/a)
C' H
As above for the ET region, the case in which systemic elimination predominates is given by :
(RGDTB) Kg•i•B (0 .25 QTHb/a)RGDRTB =
A = A A , (4-37)(RGDTB)H KgTBH (0.25 QTHb/a)H
and the case in which respiratory tract metabolism and systemic elimination are of equal
significance is given by:
(RGDTB)A (0.5 QTHb/a)A = A A (4-38)RGDR =TB (RGDTB)H KgTBH (0.5 QTHb/a)H ~
where EMAX is equal to 0 .25 Q . Because the constants are equal in the numerator and
denominator, Equations 4-37 and 4-38 reduce to the same equation . Thus, the default
regional gas dose ratio for TB effects of Category 2 gases i s
RGDR = (RGDTB)A - KgTBA (QTHb/a) ,~ (4-39)TB (RGDTB)H KgTBH (QTHb/a)
H
Equation 4-39 can be further reduced by the assumption that the overall mass transport
coefficients (KgTB) are equal when these values are not available . The value of 1 .0 is used
for the ratio of (Hb/g)A / (Hb/g)H if (Hb/g)A > (Hb/g)H or if these partition coefficient values
are unknown . Gargas et al . (1989) and Jepson et al . (1994) provide discussion of techniques
4-55

p. 93
to derive partition coefficients and report values for volatile and nonvolatile chemicals ,
respectively .
Pulmonary Effects. The PU regional gas dose ratio (RGDRpu) for Category 2 gases is
given by
Qalv-K SA~' -K SAre _ C
b/a
(RGDpU)A (C'SApU)A (e R~ VE )A (e ~B VE )A Ci )A
RGDRpU = _ .(RGDpU)H (C Q
a1v ) -Ks~ SV~ -K~ B SV B (1 _ Cb/a )
1 SApU H (e E)g (e E)g C' H
(4-40)
The default ratio is obtained by assuming the mass transport coefficients for the ET and the
TB region are the same in each species . At values of KgTB < 0.5, as per the definition for
Category 2 gases, the exponential term for both the ET and TB term in Equation 4-40
reduces to 1 .0 . Thus, assuming the same inspired concentrations, Equation 4-40 becomes
( Qalv ) (1 _ Cb/a
(RGDpU) SAPU CiRGDRpU =
A = A A (4-41)(RGDpU)H Q
a1v ) (1 _ Cb/a)
SApv H -CT H
The RGDRpU must be evaluated for both cases described above for the ET and TB regions .
In the case where systemic elimination determines the blood term, the ratio is given b y
Qa1v
(RGDpU)A - ( SApUA (0 .25 QTHb/g)ARGDRpU = - . (4-42)
(RGDPU)H Q iv (0.25 QTHb/g)H
( SApUH
4-56
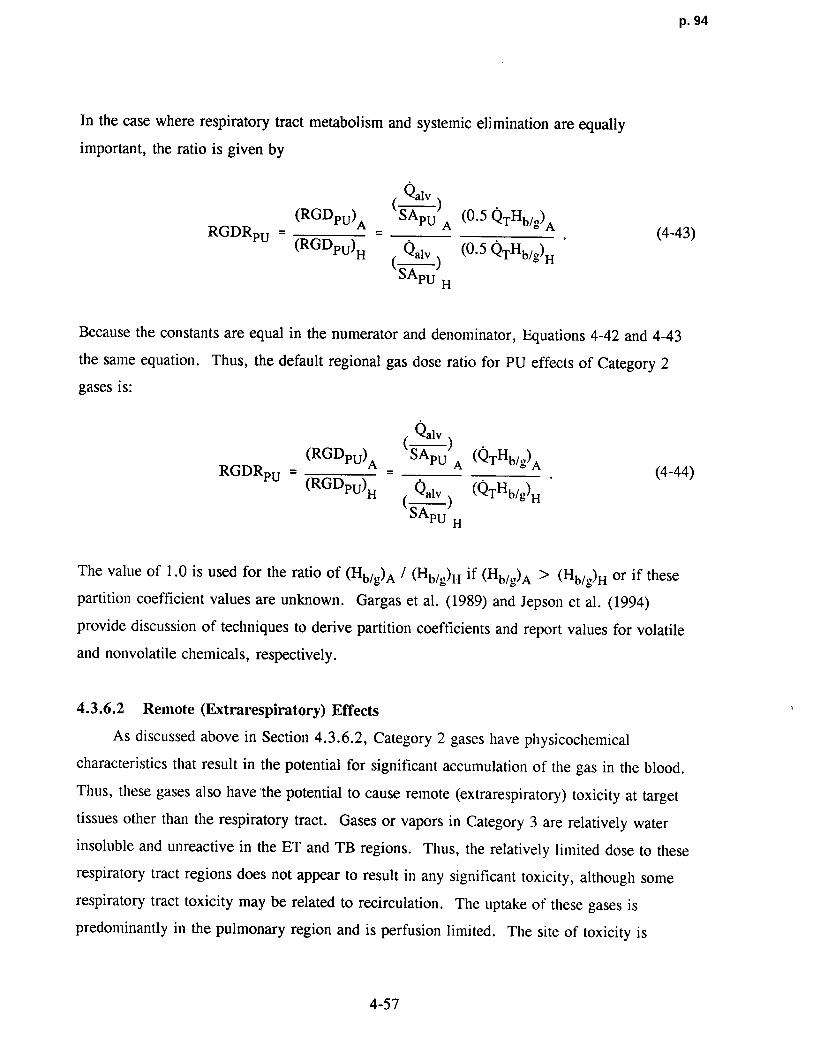
p. 94
In the case where respiratory tract metabolism and systemic elimination are equall y
important, the ratio is given by
Qalv
(4-43)RGDR (RGDpU)A - SApU A(0.5 QTHb/b)
A PU (RGDPU)H ( Qalv ) (0.5 QTHb/g)H
SApUH
Because the constants are equal in the numerator and denominator, Equations 4-42 and 4-43
the saine equation . Thus, the default regional gas dose ratio for PU effects of Category 2
gases is :
Qalv
(RGD ) SA (QTHb/„)RGDRpU = PU A_ PU A b p
(4-44)(RGDPU)H Qalv ) (QTHb/g)H
SApUH
The value of 1 .0 is used for the ratio of (Hb/g)A /(Hb/a)H if (Hb/?)A >(Hb/3)H or if these
partition coefficient values are unknown. Gargas et al . (1989) and Jepson et al . (1994)
provide discussion of techniques to derive partition coefficients and report values for volatile
and nonvolatile chemicals, respectively .
4 .3.6.2 Remote (Extrarespiratory) Effects
As discussed above in Section 4 .3.6.2, Category 2 gases have physicochemical
characteristics that result in the potential for significant accumulation of the gas in the blood .
Thus, these gases also have the potential to cause remote (extrarespiratory) toxicity at target
tissues other than the respiratory tract . Gases or vapors in Category 3 are relatively water
insoluble and unreactive in the ET and TB regions . Thus, the relatively limited dose to these
respiratory tract regions does not appear to result in any significant toxicity, although some
respiratory tract toxicity may be related to recirculation . The uptake of these gases is
predominantly in the pulmonary region and is perfusion limited . The site of toxicity i s
4-57

p. 95
generally remote to the principal site of absorption in the PU region . An example of a
Category 3 gases is styrene .
Remote (Extrarespiratory) Effects-Category 2 Gase s
In the event that remote toxicity is associated with a gas in Category 2, the dose to the
respiratory tract, and therefore to the blood, is necessary to establish the dose ratio .
However, in this case, the surface area of the respiratory tract is irrelevant, only the
absorption rate in mass/time (RGDRT) is important such that the dose ratio become s
_ Cb/a
)(RGDRT)A (VE)A (1 CiA (4-45)
(RGDRT)H (Vg)H (1 - Cb/a )
C' H
As in Section 4 .3 .6 .1, this ratio must be evaluated for each of two cases . In the case where
systemic elimination determines the blood term, the regional gas dose ratio for remote
(extrarespiratory) effects of Category 2 gases is given b y
(RGDRT) (VE) (0 .25 QTHb/,~)
RGDRER = (RGD )A -A ~ A (4-46)
RT H (VE)H (0 .25 QTHb/g)H
In the case where respiratory tract metabolism and systemic elimination are equally
important, the ratio is given by
(RGDRT)A _ (VE)A (0 .5 QTHb/ ,,)ARGDRER = (4-47)
(RGDRT)H (VE)H (0 .5 QTHb/(Y)H
4-58
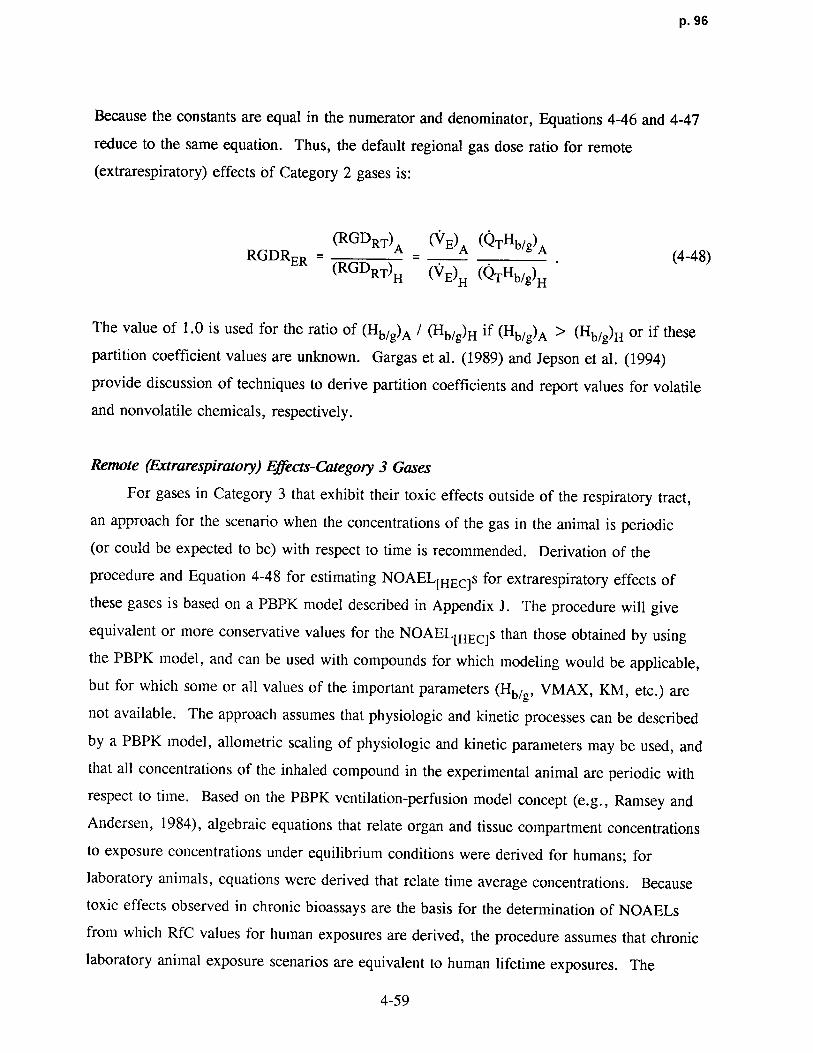
p. 96
Because the constants are equal in the numerator and denominator, Equations 4-46 and 4-47
reduce to the same equation . Thus, the default regional gas dose ratio for remot e
(extrarespiratory) effects of Category 2 gases is :
RGDR _ (RGDRT)A - (VE)A (QTHb/b)A (4-48)
ER (RGDRT)H (VE)H (QTHb/g)H
The value of 1 .0 is used for the ratio of (Hb/g)A / (Hb/g)H if (Hb/b)A >(Hb/g)H or if these
partition coefficient values are unknown . Gargas et al . (1989) and Jepson et al . (1994)
provide discussion of techniques to derive partition coefficients and report values for volatile
and nonvolatile chemicals, respectively .
Remote (Extrarespiratory) Effects-Category 3 Gases
For gases in Category 3 that exhibit their toxic effects outside of the respiratory tract,
an approach for the scenario when the concentrations of the gas in the animal is periodic
(or could be expected to be) with respect to time is recommended . Derivation of the
procedure and Equation 4-48 for estimating NOAEL[HEC]s for extrarespiratory effects of
these gases is based on a PBPK model described in Appendix J . The procedure will give
equivalent or more conservative values for the NOAEL[xECIs than those obtained by using
the PBPK model, and can be used with compounds for which modeling would be applicable,
but for which some or all values of the important parameters (Hb/g, VMAX, KM, etc .) are
not available . The approach assumes that physiologic and kinetic processes can be described
by a PBPK model, allometric scaling of physiologic and kinetic parameters may be used, and
that all concentrations of the inhaled compound in the experimental animal are periodic with
respect to time . Based on the PBPK ventilation-perfusion model concept (e .g., Ramsey and
Andersen, 1984), algebraic equations that relate organ and tissue compartment concentrations
to exposure concentrations under equilibrium conditions were derived for humans ; for
laboratory animals, equations were derived that relate time average concentrations . Because
toxic effects observed in chronic bioassays are the basis for the determination of NOAELs
from which RfC values for human exposures are derived, the procedure assumes that chronic
laboratory animal exposure scenarios are equivalent to human lifetime exposures . The
4-59

p. 97
procedure also assumes that the toxic effects observed are related to the arterial bloo d
concentration (concentration leaving lung compartment in the model) of the inhaled
compound and that NOAEL [xEC]s should be such that the human time-integrated arterial
blood concentration is less than or equal to that of the exposed laboratory animal . This latter
assumption is equivalent to assuming that the laboratory animal time-averaged arterial blood
concentration is equal to the human equilibrium arterial blood concentration . Note that the
time average concentrations are the area under the curve over a period divided by the length
(time) of a period (e.g., average concentration over 1 week) . A mathematical derivation was
used to obtain the proposed method of simple alebraic equations to compute NOAEL [ HEC]s•
A more detailed description of the development of the procedure is given in Appendix J .
Another assumption is that the concentrations of the inhaled compound within the
animal achieved periodicity with respect to time (i .e., periodic steady state-the concentration
versus time profile is the same for every week) . An illustration of periodicity is provided in
Figure 4-9 . Periodicity of the arterial concentration of the agent was not achieved until the
sixth week for the plotted theoretical exposure simulation . Practically, the conditions of
periodicity should be met during "most" of the exposure duration . For example, if this
condition is met for 90% of the time (e .g ., periodic during the last 90 weeks of a 100 week
experiment), then estimates of average concentrations will be in error by less than 10% .
The following equation is used to calculate an HEC for extrarespiratory effects of gases
in Category 3 :
,,NOAEL*[HECI (mg/m3) = NOAEL*[ADJ] (mg/m3) x
(Hb/ A (4-48)
(Hb/g)H
where:
NOAEL* [HEC] = the NOAEL or analogous effect level obtained with an alternativeapproach as described in Appendix A, dosimetrically adjusted to anHEC;
NOAEL*[ADJI = is defined in Equation 4-2 ; and
4-60

p. 98
75
J
60E...
045 Periodicity~
C Blood:Air Part ition Coefficient = 1,000U 30 Fat: Blood Partition Coefficient - 100
15
00.0 0.5 1.0 1.5 2.0 2.5
Time (h x 10 3 )
Figure 4-9 . Time course of periodicity for F344 rat exposed 6 h/day, 5 days/week totheoretical gas with partition coefficients as shown (Jarabek et al ., 1990) .
(Hb/g)A/(Hb/g)H = the ratio of the blood :gas (air) partition coefficient of the chemica lfor the laboratory animal species to the human value. The value of1 .0 is used for the ratio if (Hb/g)A > (Hb/g)H •
In the case where Hb/g values are unknown, the default value of (Hb/g)A/(Hb/g)H = 1 is
recommended. An analysis of the available data on rats for blood :air partition coefficients
shows that the (Hb/g)A is greater than (Hb/g)H in most cases . Gargas et al . (1989) and Jepson
et al . (1994) provide discussion of techniques to derive partition coefficients and report values
for volatile and nonvolative chemicals, respectively .
Figure 4-10 provides guidance on the relationship of the blood :air and fat:blood
partition coefficients with respect to achieving periodicity of an inhaled agent in the arterial
blood of a 380-g F344 rat. (It should be noted that often tissue:air partition coefficients are
4-61

P. 99
X = Fat: Blood Partition Coefficien t
YX 1 10 100 1,000
10,000U_
o 1,0000
° 100~~ _ .. . . :._ _czCL 10co
czC~
00
co 0 . 1u~
0 .01
Chronic Only Chronic or Subchronic
Figure 4-10 . Relationship of blood :gas (Hb/g) and fat:blood partition coefficients to theattainment of periodic blood concentrations in the F344 rat . For a givencombination of partition coefficients, the figure indicates (by shading) ifsimulated blood concentrations reached periodicity within 10% of theexposure time. The exposure regimen was 6 h/day, 5 days/week t o10 ppm. Subchronic = 90 days; chronic = 104 weeks.
reported (e .g ., fat :air) . The fat :blood partition coefficient can be calculated by dividing the
fat:air partition coefficient by the blood :air partition coefficient .) The PBPK model as
described in Appendix J was run to simulate a 6 h/day, 5 days/week exposure regimen o f
4-62

p. 100
10 ppm . Physiologic parameters, such as ventilation rate, were scaled as described i n
Appendix J . No metabolic parameters were incorporated in the model for the simulations,
because the arterial blood concentration takes longer to reach periodicity without metabolism .
Therefore, this figure represents the most conservative values for the partition coefficients for
that exposure regimen . The blood:air and fat:blood partition coefficients were chosen based
on sensitivity analyses that indicated these two parameters were important to describing the
time course of the concentration of an agent in the arterial blood, and upon data availability .
The importance of the relationship between the partition coefficients and the attainment
of periodicity is particularly significant when extrapolating from studies of different
durations . For example, for an agent with a blood:air partition coefficient of 1,000 an d
a fat :blood partition coefficient of 100, it would be inappropriate to extrapolate from a
subchronic exposure regimen because the criterion of attaining periodicity for 90% of the
exposure duration is not met . Periodicity is attained with these same parameters when the
study is carried out for a longer duration, however, so that the approach based on the ratio of
animal :human partition coefficients can be used on a chronic study without violation of
critical assumptions.
Similar matrices to Figure 4-10 can be developed for the relationship between partition
coefficients and the attainment of periodicity of the agent in the arterial blood of each
experimental species of interest . Use of physiologic parameters for other species and
different exposure regimens at various concentrations will influence this relationship and
should be considered when determining the extrapolation approach to use for derivation of an
HEC.
Since the requirement for achieving periodicity over 90% of the exposure duration is
based on the objective of limiting error in the estimate to less than 10%, a modifying factor
to account for a greater amount of error should be applied (see Section 4 .3 .8 .1) when the
nature of the inhaled agent (e .g., high fat :blood partition coefficient) suggests this condition
was not met .
4.3.6.3 Additional Assumptions and Default Value s
As with aerosols, after evaluation of the adequacy of the generation system, the initial
step in the calculation of HECs is characterization of the exposure .
4-63