
- Brawijaya Knowledge Garden
74
VOLUME NO. 4 (2014), ISSUE NO. 04 (APRIL) ISSN 2231-1009 A Monthly Double-Blind Peer Reviewed (Refereed/Juried) Open Access International e-Journal - Included in the International Serial Directories Indexed & Listed at: Ulrich's Periodicals Directory ©, ProQuest, U.S.A., EBSCO Publishing, U.S.A., Cabell’s Directories of Publishing Opportunities, U.S.A., Open J-Gage, India [link of the same is duly available at Inflibnet of University Grants Commission (U.G.C.)], Index Copernicus Publishers Panel, Poland with IC Value of 5.09 & number of libraries all around the world. Circulated all over the world & Google has verified that scholars of more than 3130 Cities in 166 countries/territories are visiting our journal on regular basis. Ground Floor, Building No. 1041-C-1, Devi Bhawan Bazar, JAGADHRI – 135 003, Yamunanagar, Haryana, INDIA http://ijrcm.org.in/
-
Upload
khangminh22 -
Category
Documents
-
view
0 -
download
0
Transcript of - Brawijaya Knowledge Garden

VOLUME NO. 4 (2014), ISSUE NO. 04 (APRIL) ISSN 2231-1009
A Monthly Double-Blind Peer Reviewed (Refereed/Juried) Open Access International e-Journal - Included in the International Serial Directories
Indexed & Listed at: Ulrich's Periodicals Directory ©, ProQuest, U.S.A., EBSCO Publishing, U.S.A., Cabell’s Directories of Publishing Opportunities, U.S.A.,
Open J-Gage, India [link of the same is duly available at Inflibnet of University Grants Commission (U.G.C.)], Index Copernicus Publishers Panel, Poland with IC Value of 5.09 & number of libraries all around the world.
Circulated all over the world & Google has verified that scholars of more than 3130 Cities in 166 countries/territories are visiting our journal on regular basis.
Ground Floor, Building No. 1041-C-1, Devi Bhawan Bazar, JAGADHRI – 135 003, Yamunanagar, Haryana, INDIA
http://ijrcm.org.in/

VOLUME NO. 4 (2014), ISSUE NO. 04 (APRIL) ISSN 2231-1009
INTERNATIONAL JOURNAL OF RESEARCH IN COMPUTER APPLICATION & MANAGEMENT A Monthly Double-Blind Peer Reviewed (Refereed/Juried) Open Access International e-Journal - Included in the International Serial Directories
http://ijrcm.org.in/
ii
CONTENTS
Sr. No.
TITLE & NAME OF THE AUTHOR (S) Page No.
1. AN INVESTIGATION ON EMPLOYEES' JOB SATISFACTION IN NUCLEAR POWER PLANT
AT KUDANKULAM, INDIA
DR. T. VIJAYAKUMAR & SANKARI PRIYA
1
2. CRITICAL FACTORS FOR SUSTAINABLE CHANGE MANAGEMENT PROCESS: A REVIEW
DR. MITA MEHTA, LALITA DEVI & VEENA RAI
4
3. MANAGEMENT STRATEGIES TO CAPITALIZE AND ENHANCE HUMAN POTENTIAL IN
INDIAN MANUFACTURING SECTOR
PRABHJOTKAUR, SAMRIDHI GOYAL & KAWALPREET SINGH
10
4. IMPACT OF E-TRUST ON E-LOYALTY
DR. ANDAL AMMISETTI
15
5. KNOWLEDGE ECONOMY AS AN EXTENSION OF INFORMATION SOCIETY WITH
REFERENCE TO INDIA
GEETU SHARMA
19
6. DYNAMIC RELATIONSHIP TECHNIQUE FOR COMPLICATION REDUCTION IN BIG DATA
SELVARATHI C
22
7. CONSUMER ATTITUDE TOWARDS THE BRANDED APPARELS IN MEN IN THANJAVUR
DISTRICT
K. NALINI
28
8. FINANCIAL HEALTH THROUGH Z SCORE ANALYSIS: A CASE STUDY ON SELECTED
PHARMACEUTICAL COMPANIES
NIRMAL CHAKRABORTY
30
9. AN APPROACH TO EVALUATE SOFTWARE QUALITY MODEL
DEEPSHIKHA
36
10. TRACKING THE INDEX FUNDS WITH FAMA FRENCH THREE FACTOR MODEL
DR. SHIKHA VOHRA & SHIVANI INDER
39
11. SOCIAL AUDIT REPORT CARD OF SOCIAL PERFORMANCE
DR. S. K. JHA
43
12. STRATEGIC POSITIONING AS A GROWTH STRATEGY IN COMMERCIAL BANKS IN
KENYA
ESTHER WANJIRU MAINA
46
13. RURAL EMPLOYMENT DIVERSIFICATION IN INDIA: PROGRESS TOWARDS THE
MILLENNIUM DEVELOPMENT GOALS IN INDIA
SANGHARSHA BALIRAM SAWALE & NEHA RAKESH NAMDEO
52
14. RELEVANCE OF TALENT MANAGEMENT IN BUSINESS STRATEGY OF AN
ORGANISATION
POOJA SHARMA
56
15. THE COLLECTIVE ACTION OF ‘GOTONG ROYONG’ SOCIETY IN ELECTRICITY
INFRASTRUCTURE DEVELOPMENT IN REMOTE ISLANDS
ENI SRI RAHAYUNINGSIH
59
REQUEST FOR FEEDBACK & DISCLAIMER 67

VOLUME NO. 4 (2014), ISSUE NO. 04 (APRIL) ISSN 2231-1009
INTERNATIONAL JOURNAL OF RESEARCH IN COMPUTER APPLICATION & MANAGEMENT A Monthly Double-Blind Peer Reviewed (Refereed/Juried) Open Access International e-Journal - Included in the International Serial Directories
http://ijrcm.org.in/
iii
CHIEF PATRON PROF. K. K. AGGARWAL
Chairman, Malaviya National Institute of Technology, Jaipur (An institute of National Importance & fully funded by Ministry of Human Resource Development, Government of India)
Chancellor, K. R. Mangalam University, Gurgaon
Chancellor, Lingaya’s University, Faridabad
Founder Vice-Chancellor (1998-2008), Guru Gobind Singh Indraprastha University, Delhi
Ex. Pro Vice-Chancellor, Guru Jambheshwar University, Hisar
FOUNDER PATRON
LATE SH. RAM BHAJAN AGGARWAL Former State Minister for Home & Tourism, Government of Haryana
Former Vice-President, Dadri Education Society, Charkhi Dadri
Former President, Chinar Syntex Ltd. (Textile Mills), Bhiwani
CO-ORDINATOR
DR. SAMBHAV GARG Faculty, Shree Ram Institute of Business & Management, Urjani
ADVISORS
DR. PRIYA RANJAN TRIVEDI Chancellor, The Global Open University, Nagaland
PROF. M. S. SENAM RAJU Director A. C. D., School of Management Studies, I.G.N.O.U., New Delhi
PROF. S. L. MAHANDRU Principal (Retd.), MaharajaAgrasenCollege, Jagadhri
EDITOR
PROF. R. K. SHARMA
Professor, Bharti Vidyapeeth University Institute of Management & Research, New Delhi
EDITORIAL ADVISORY BOARD
DR. RAJESH MODI Faculty, YanbuIndustrialCollege, Kingdom of Saudi Arabia
PROF. PARVEEN KUMAR Director, M.C.A., Meerut Institute of Engineering & Technology, Meerut, U. P.
PROF. H. R. SHARMA Director, Chhatarpati Shivaji Institute of Technology, Durg, C.G.
PROF. MANOHAR LAL Director & Chairman, School of Information & Computer Sciences, I.G.N.O.U., New Delhi
PROF. ANIL K. SAINI Chairperson (CRC), GuruGobindSinghI. P. University, Delhi
PROF. R. K. CHOUDHARY Director, Asia Pacific Institute of Information Technology, Panipat

VOLUME NO. 4 (2014), ISSUE NO. 04 (APRIL) ISSN 2231-1009
INTERNATIONAL JOURNAL OF RESEARCH IN COMPUTER APPLICATION & MANAGEMENT A Monthly Double-Blind Peer Reviewed (Refereed/Juried) Open Access International e-Journal - Included in the International Serial Directories
http://ijrcm.org.in/
iv
DR. ASHWANI KUSH Head, Computer Science, UniversityCollege, KurukshetraUniversity, Kurukshetra
DR. BHARAT BHUSHAN Head, Department of Computer Science & Applications, GuruNanakKhalsaCollege, Yamunanagar
DR. VIJAYPAL SINGH DHAKA Dean (Academics), Rajasthan Institute of Engineering & Technology, Jaipur
DR. SAMBHAVNA Faculty, I.I.T.M., Delhi
DR. MOHINDER CHAND Associate Professor, KurukshetraUniversity, Kurukshetra
DR. MOHENDER KUMAR GUPTA Associate Professor, P.J.L.N.GovernmentCollege, Faridabad
DR. SAMBHAV GARG Faculty, Shree Ram Institute of Business & Management, Urjani
DR. SHIVAKUMAR DEENE Asst. Professor, Dept. of Commerce, School of Business Studies, Central University of Karnataka, Gulbarga
DR. BHAVET Faculty, Shree Ram Institute of Business & Management, Urjani
ASSOCIATE EDITORS
PROF. ABHAY BANSAL Head, Department of Information Technology, Amity School of Engineering & Technology, Amity University, Noida
PROF. NAWAB ALI KHAN Department of Commerce, AligarhMuslimUniversity, Aligarh, U.P.
ASHISH CHOPRA Sr. Lecturer, Doon Valley Institute of Engineering & Technology, Karnal
TECHNICAL ADVISOR
AMITA Faculty, Government M. S., Mohali
FINANCIAL ADVISORS
DICKIN GOYAL Advocate & Tax Adviser, Panchkula
NEENA Investment Consultant, Chambaghat, Solan, Himachal Pradesh
LEGAL ADVISORS
JITENDER S. CHAHAL Advocate, Punjab & Haryana High Court, Chandigarh U.T.
CHANDER BHUSHAN SHARMA Advocate & Consultant, District Courts, Yamunanagar at Jagadhri
SUPERINTENDENT
SURENDER KUMAR POONIA
VOLUME NO. 4 (2014), ISSUE NO. 04 (APRIL) ISSN 2231-1009
INTERNATIONAL JOURNAL OF RESEARCH IN COMPUTER APPLICATION & MANAGEMENT A Monthly Double-Blind Peer Reviewed (Refereed/Juried) Open Access International e-Journal - Included in the International Serial Directories
http://ijrcm.org.in/
v
CALL FOR MANUSCRIPTS We invite unpublished novel, original, empirical and high quality research work pertaining to recent developments & practices in the areas of
Computer Science & Applications; Commerce; Business; Finance; Marketing; Human Resource Management; General Management; Banking;
Economics; Tourism Administration & Management; Education; Law; Library & Information Science; Defence & Strategic Studies; Electronic Science;
Corporate Governance; Industrial Relations; and emerging paradigms in allied subjects like Accounting; Accounting Information Systems; Accounting
Theory & Practice; Auditing; Behavioral Accounting; Behavioral Economics; Corporate Finance; Cost Accounting; Econometrics; Economic
Development; Economic History; Financial Institutions & Markets; Financial Services; Fiscal Policy; Government & Non Profit Accounting; Industrial
Organization; International Economics & Trade; International Finance; Macro Economics; Micro Economics; Rural Economics; Co-operation;
Demography: Development Planning; Development Studies; Applied Economics; Development Economics; Business Economics; Monetary Policy; Public
Policy Economics; Real Estate; Regional Economics; Political Science; Continuing Education; Labour Welfare; Philosophy; Psychology; Sociology; Tax
Accounting; Advertising & Promotion Management; Management Information Systems (MIS); Business Law; Public Responsibility & Ethics;
Communication; Direct Marketing; E-Commerce; Global Business; Health Care Administration; Labour Relations & Human Resource Management;
Marketing Research; Marketing Theory & Applications; Non-Profit Organizations; Office Administration/Management; Operations Research/Statistics;
Organizational Behavior & Theory; Organizational Development; Production/Operations; International Relations; Human Rights & Duties; Public
Administration; Population Studies; Purchasing/Materials Management; Retailing; Sales/Selling; Services; Small Business Entrepreneurship; Strategic
Management Policy; Technology/Innovation; Tourism & Hospitality; Transportation Distribution; Algorithms; Artificial Intelligence; Compilers &
Translation; Computer Aided Design (CAD); Computer Aided Manufacturing; Computer Graphics; Computer Organization & Architecture; Database
Structures & Systems; Discrete Structures; Internet; Management Information Systems; Modeling & Simulation; Neural Systems/Neural Networks;
Numerical Analysis/Scientific Computing; Object Oriented Programming; Operating Systems; Programming Languages; Robotics; Symbolic & Formal
Logic; Web Design and emerging paradigms in allied subjects.
Anybody can submit the soft copy of unpublished novel; original; empirical and high quality research work/manuscript anytime in M.S. Word format
after preparing the same as per our GUIDELINES FOR SUBMISSION; at our email address i.e. [email protected] or online by clicking the link online
submission as given on our website (FOR ONLINE SUBMISSION, CLICK HERE).
GUIDELINES FOR SUBMISSION OF MANUSCRIPT
1. COVERING LETTER FOR SUBMISSION:
DATED: _____________
THE EDITOR
IJRCM
Subject: SUBMISSION OF MANUSCRIPT IN THE AREA OF .
(e.g. Finance/Marketing/HRM/General Management/Economics/Psychology/Law/Computer/IT/Engineering/Mathematics/other, please specify)
DEAR SIR/MADAM
Please find my submission of manuscript entitled ‘___________________________________________’ for possible publication in your journals.
I hereby affirm that the contents of this manuscript are original. Furthermore, it has neither been published elsewhere in any language fully or partly, nor is it
under review for publication elsewhere.
I affirm that all the author (s) have seen and agreed to the submitted version of the manuscript and their inclusion of name (s) as co-author (s).
Also, if my/our manuscript is accepted, I/We agree to comply with the formalities as given on the website of the journal & you are free to publish our
contribution in any of your journals.
NAME OF CORRESPONDING AUTHOR:
Designation:
Affiliation with full address, contact numbers & Pin Code:
Residential address with Pin Code:
Mobile Number (s):
Landline Number (s):
E-mail Address:
Alternate E-mail Address:
NOTES:
a) The whole manuscript is required to be in ONE MS WORD FILE only (pdf. version is liable to be rejected without any consideration), which will start from
the covering letter, inside the manuscript.
b) The sender is required to mentionthe following in the SUBJECT COLUMN of the mail:
New Manuscript for Review in the area of (Finance/Marketing/HRM/General Management/Economics/Psychology/Law/Computer/IT/
Engineering/Mathematics/other, please specify)
c) There is no need to give any text in the body of mail, except the cases where the author wishes to give any specific message w.r.t. to the manuscript.
d) The total size of the file containing the manuscript is required to be below 500 KB.
e) Abstract alone will not be considered for review, and the author is required to submit the complete manuscript in the first instance.
f) The journal gives acknowledgement w.r.t. the receipt of every email and in case of non-receipt of acknowledgment from the journal, w.r.t. the submission
of manuscript, within two days of submission, the corresponding author is required to demand for the same by sending separate mail to the journal.
2. MANUSCRIPT TITLE: The title of the paper should be in a 12 point Calibri Font. It should be bold typed, centered and fully capitalised.
3. AUTHOR NAME (S) & AFFILIATIONS: The author (s) full name, designation, affiliation (s), address, mobile/landline numbers, and email/alternate email
address should be in italic & 11-point Calibri Font. It must be centered underneath the title.
4. ABSTRACT: Abstract should be in fully italicized text, not exceeding 250 words. The abstract must be informative and explain the background, aims, methods,
results & conclusion in a single para. Abbreviations must be mentioned in full.

VOLUME NO. 4 (2014), ISSUE NO. 04 (APRIL) ISSN 2231-1009
INTERNATIONAL JOURNAL OF RESEARCH IN COMPUTER APPLICATION & MANAGEMENT A Monthly Double-Blind Peer Reviewed (Refereed/Juried) Open Access International e-Journal - Included in the International Serial Directories
http://ijrcm.org.in/
vi
5. KEYWORDS: Abstract must be followed by a list of keywords, subject to the maximum of five. These should be arranged in alphabetic order separated by
commas and full stops at the end.
6. MANUSCRIPT: Manuscript must be in BRITISH ENGLISH prepared on a standard A4 size PORTRAIT SETTING PAPER. It must be prepared on a single space and
single column with 1” margin set for top, bottom, left and right. It should be typed in 8 point Calibri Font with page numbers at the bottom and centre of every
page. It should be free from grammatical, spelling and punctuation errors and must be thoroughly edited.
7. HEADINGS: All the headings should be in a 10 point Calibri Font. These must be bold-faced, aligned left and fully capitalised. Leave a blank line before each
heading.
8. SUB-HEADINGS: All the sub-headings should be in a 8 point Calibri Font. These must be bold-faced, aligned left and fully capitalised.
9. MAIN TEXT: The main text should follow the following sequence:
INTRODUCTION
REVIEW OF LITERATURE
NEED/IMPORTANCE OF THE STUDY
STATEMENT OF THE PROBLEM
OBJECTIVES
HYPOTHESES
RESEARCH METHODOLOGY
RESULTS & DISCUSSION
FINDINGS
RECOMMENDATIONS/SUGGESTIONS
CONCLUSIONS
SCOPE FOR FURTHER RESEARCH
ACKNOWLEDGMENTS
REFERENCES
APPENDIX/ANNEXURE
It should be in a 8 point Calibri Font, single spaced and justified. The manuscript should preferably not exceed 5000 WORDS.
10. FIGURES &TABLES: These should be simple, crystal clear, centered, separately numbered &self explained, and titles must be above the table/figure. Sources of
data should be mentioned below the table/figure. It should be ensured that the tables/figures are referred to from the main text.
11. EQUATIONS:These should be consecutively numbered in parentheses, horizontally centered with equation number placed at the right.
12. REFERENCES: The list of all references should be alphabetically arranged. The author (s) should mention only the actually utilised references in the preparation
of manuscript and they are supposed to follow Harvard Style of Referencing. The author (s) are supposed to follow the references as per the following:
• All works cited in the text (including sources for tables and figures) should be listed alphabetically.
• Use (ed.) for one editor, and (ed.s) for multiple editors.
• When listing two or more works by one author, use --- (20xx), such as after Kohl (1997), use --- (2001), etc, in chronologically ascending order.
• Indicate (opening and closing) page numbers for articles in journals and for chapters in books.
• The title of books and journals should be in italics. Double quotation marks are used for titles of journal articles, book chapters, dissertations, reports, working
papers, unpublished material, etc.
• For titles in a language other than English, provide an English translation in parentheses.
• The location of endnotes within the text should be indicated by superscript numbers.
PLEASE USE THE FOLLOWING FOR STYLE AND PUNCTUATION IN REFERENCES:
BOOKS
• Bowersox, Donald J., Closs, David J., (1996), "Logistical Management." Tata McGraw, Hill, New Delhi.
• Hunker, H.L. and A.J. Wright (1963), "Factors of Industrial Location in Ohio" Ohio State University, Nigeria.
CONTRIBUTIONS TO BOOKS
• Sharma T., Kwatra, G. (2008) Effectiveness of Social Advertising: A Study of Selected Campaigns, Corporate Social Responsibility, Edited by David Crowther &
Nicholas Capaldi, Ashgate Research Companion to Corporate Social Responsibility, Chapter 15, pp 287-303.
JOURNAL AND OTHER ARTICLES
• Schemenner, R.W., Huber, J.C. and Cook, R.L. (1987), "Geographic Differences and the Location of New Manufacturing Facilities," Journal of Urban Economics,
Vol. 21, No. 1, pp. 83-104.
CONFERENCE PAPERS
• Garg, Sambhav (2011): "Business Ethics" Paper presented at the Annual International Conference for the All India Management Association, New Delhi, India,
19–22 June.
UNPUBLISHED DISSERTATIONS AND THESES
• Kumar S. (2011): "Customer Value: A Comparative Study of Rural and Urban Customers," Thesis, Kurukshetra University, Kurukshetra.
ONLINE RESOURCES
• Always indicate the date that the source was accessed, as online resources are frequently updated or removed.
WEBSITES
• Garg, Bhavet (2011): Towards a New Natural Gas Policy, Political Weekly, Viewed on January 01, 2012 http://epw.in/user/viewabstract.jsp
VOLUME NO. 4 (2014), ISSUE NO. 04 (APRIL) ISSN 2231-1009
INTERNATIONAL JOURNAL OF RESEARCH IN COMPUTER APPLICATION & MANAGEMENT A Monthly Double-Blind Peer Reviewed (Refereed/Juried) Open Access International e-Journal - Included in the International Serial Directories
http://ijrcm.org.in/
1
AN INVESTIGATION ON EMPLOYEES' JOB SATISFACTION IN NUCLEAR POWER PLANT AT KUDANKULAM,
INDIA
DR. T. VIJAYAKUMAR
PROFESSOR & HEAD
DEPARTMENT OF MANAGEMENT STUDIES
ST. XAVIER’S CATHOLIC COLLEGE OF ENGINEERING
NAGERCOIL
SANKARI PRIYA
PLACEMENT OFFICER
CAPE INSTITUTE OF TECHNOLOGY
LEVENGIPURAM
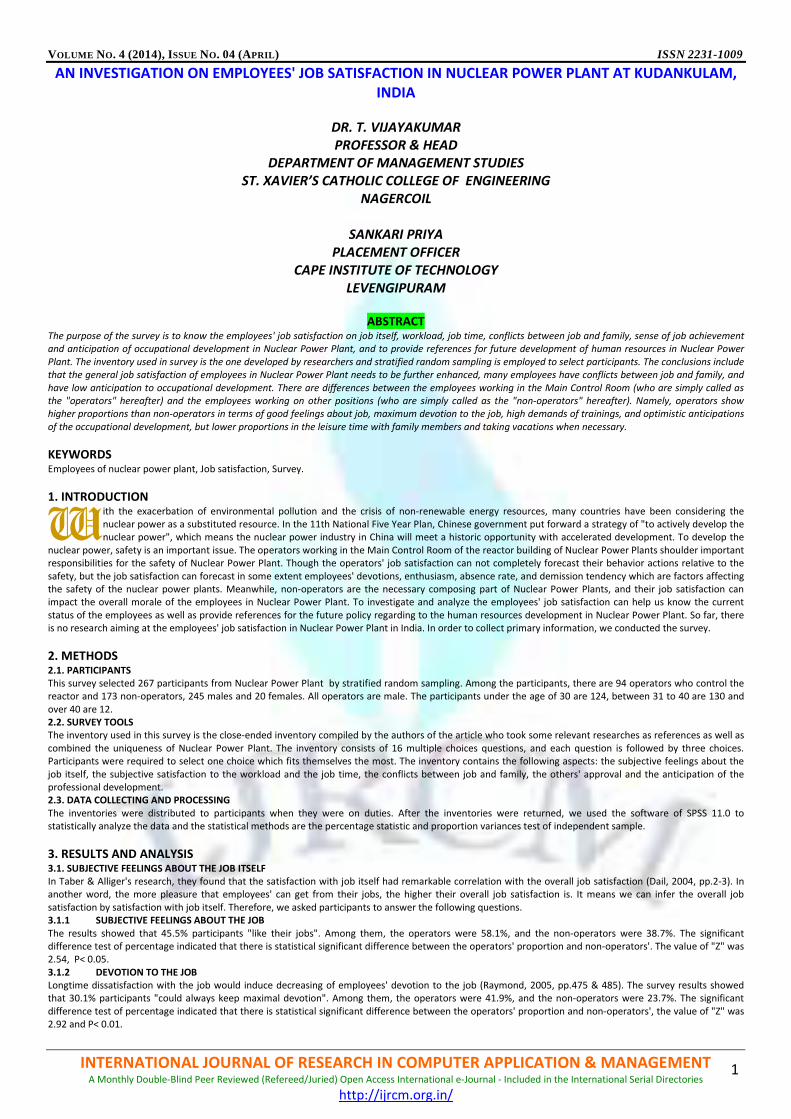
ABSTRACT The purpose of the survey is to know the employees' job satisfaction on job itself, workload, job time, conflicts between job and family, sense of job achievement
and anticipation of occupational development in Nuclear Power Plant, and to provide references for future development of human resources in Nuclear Power
Plant. The inventory used in survey is the one developed by researchers and stratified random sampling is employed to select participants. The conclusions include
that the general job satisfaction of employees in Nuclear Power Plant needs to be further enhanced, many employees have conflicts between job and family, and
have low anticipation to occupational development. There are differences between the employees working in the Main Control Room (who are simply called as
the "operators" hereafter) and the employees working on other positions (who are simply called as the "non-operators" hereafter). Namely, operators show
higher proportions than non-operators in terms of good feelings about job, maximum devotion to the job, high demands of trainings, and optimistic anticipations
of the occupational development, but lower proportions in the leisure time with family members and taking vacations when necessary.
KEYWORDS
Employees of nuclear power plant, Job satisfaction, Survey.
1. INTRODUCTION ith the exacerbation of environmental pollution and the crisis of non-renewable energy resources, many countries have been considering the
nuclear power as a substituted resource. In the 11th National Five Year Plan, Chinese government put forward a strategy of "to actively develop the
nuclear power", which means the nuclear power industry in China will meet a historic opportunity with accelerated development. To develop the
nuclear power, safety is an important issue. The operators working in the Main Control Room of the reactor building of Nuclear Power Plants shoulder important
responsibilities for the safety of Nuclear Power Plant. Though the operators' job satisfaction can not completely forecast their behavior actions relative to the
safety, but the job satisfaction can forecast in some extent employees' devotions, enthusiasm, absence rate, and demission tendency which are factors affecting
the safety of the nuclear power plants. Meanwhile, non-operators are the necessary composing part of Nuclear Power Plants, and their job satisfaction can
impact the overall morale of the employees in Nuclear Power Plant. To investigate and analyze the employees' job satisfaction can help us know the current
status of the employees as well as provide references for the future policy regarding to the human resources development in Nuclear Power Plant. So far, there
is no research aiming at the employees' job satisfaction in Nuclear Power Plant in India. In order to collect primary information, we conducted the survey.
2. METHODS 2.1. PARTICIPANTS
This survey selected 267 participants from Nuclear Power Plant by stratified random sampling. Among the participants, there are 94 operators who control the
reactor and 173 non-operators, 245 males and 20 females. All operators are male. The participants under the age of 30 are 124, between 31 to 40 are 130 and
over 40 are 12.
2.2. SURVEY TOOLS
The inventory used in this survey is the close-ended inventory compiled by the authors of the article who took some relevant researches as references as well as
combined the uniqueness of Nuclear Power Plant. The inventory consists of 16 multiple choices questions, and each question is followed by three choices.
Participants were required to select one choice which fits themselves the most. The inventory contains the following aspects: the subjective feelings about the
job itself, the subjective satisfaction to the workload and the job time, the conflicts between job and family, the others' approval and the anticipation of the
professional development.
2.3. DATA COLLECTING AND PROCESSING
The inventories were distributed to participants when they were on duties. After the inventories were returned, we used the software of SPSS 11.0 to
statistically analyze the data and the statistical methods are the percentage statistic and proportion variances test of independent sample.
3. RESULTS AND ANALYSIS 3.1. SUBJECTIVE FEELINGS ABOUT THE JOB ITSELF
In Taber & Alliger's research, they found that the satisfaction with job itself had remarkable correlation with the overall job satisfaction (Dail, 2004, pp.2-3). In
another word, the more pleasure that employees' can get from their jobs, the higher their overall job satisfaction is. It means we can infer the overall job
satisfaction by satisfaction with job itself. Therefore, we asked participants to answer the following questions.
3.1.1 SUBJECTIVE FEELINGS ABOUT THE JOB
The results showed that 45.5% participants "like their jobs". Among them, the operators were 58.1%, and the non-operators were 38.7%. The significant
difference test of percentage indicated that there is statistical significant difference between the operators' proportion and non-operators'. The value of "Z" was
2.54, P< 0.05.
3.1.2 DEVOTION TO THE JOB
Longtime dissatisfaction with the job would induce decreasing of employees' devotion to the job (Raymond, 2005, pp.475 & 485). The survey results showed
that 30.1% participants "could always keep maximal devotion". Among them, the operators were 41.9%, and the non-operators were 23.7%. The significant
difference test of percentage indicated that there is statistical significant difference between the operators' proportion and non-operators', the value of "Z" was
2.92 and P< 0.01.
W

VOLUME NO. 4 (2014), ISSUE NO. 04 (APRIL) ISSN 2231-1009
INTERNATIONAL JOURNAL OF RESEARCH IN COMPUTER APPLICATION & MANAGEMENT A Monthly Double-Blind Peer Reviewed (Refereed/Juried) Open Access International e-Journal - Included in the International Serial Directories
http://ijrcm.org.in/
2
3.1.3 REQUIREMENTS FOR THE PROFESSIONAL TRAINING
The research of US MCI Corporation indicated that training was the second important influencing factor in the factors of affecting employees' job satisfaction,
Training is a way for employees to learn interpersonal skills and professional techniques, and can facilitate employees to work more effectively. Due to its
uniqueness, Nuclear Power Plant relies on the high-tech heavily which means employees may need trainings to support their work. The survey results showed
that 68.8% participants thought they "need to take frequent trainings to be competent for their jobs'". Among them, the operators were 82.3%. and the non-
operators were 61.3%. The significant difference test of percentage indicated that the percentage of operators was higher that the percentage of the non-
operators, the value of "Z" was 3.357 and P< 0.01.
3.1.4 TENDENCY OF CHANGING POSITIONS
Employees may demission themselves from their positions if they feel dissatisfactory with their current positions and it is hard to change the work conditions
(Raymond, 2005, pp.475 & 485). The results indicated that 53.4% participants answered that "often think about of changing their positions". Among them, the
operators were 49.5%, and the non-operators were 55.5%. The significant difference test of percentage indicated that there was no statistical significant
difference between the operators' proportion and non-operators'.
According to the above results, we can get two points as follows:
Firstly, almost 1/2 participants "like their current jobs", short 1/3 participants "can always keep maximal devotion to their jobs", over 1/2 participants "often
think about changing their positions" and over 2/3 participants thought "they need frequent trainings to be competent for their positions".
Secondly, there are differences between the operators and the non-operators. Operators have higher proportions than non-operators on items of "liking their
present jobs", "maximal devotion to their jobs" and "training requirements", (the value of "Z" respectively was 2.54, 2.92, 3.35 and P< 0.05, or P< 0.01). One
reason to explain the differences may be the characteristics of operators' job. In Nuclear Power Plant, it is operators' job to insure the safe operation of the
nuclear reactor and its relative systems in every second because the safety of the reactor affects not only the successful electricity generating, but also the
development of the nuclear power in India. The importance of the operators' job cannot but arouse the managers' more attention. The significance of the job
and the attention of the managers will endow values to operators which consequently will produce more satisfactory sense. When employees feel satisfactory,
they will keep maximal devotion to their jobs. Furthermore, since operators realized the potential risks underlain in their jobs, they need more training to be
competent.
3.2 SUBJECTIVE SATISFACTION SENSE WITH THE WORKLOAD AND THE WORK TIME
In Rice, Gentile & Mefarlin's research, they found that "the work time and the employees' control sense to the work time are the two important factors
composing job satisfaction (Dail, 2004, pp.2-3, 183-184)". And some other researches indicate that one of various stressors in the organization is the overload of
the work responsibility. How do these factors impact the employees' satisfaction in nuclear power plants?
3.2.1 WORK TIME
Due to the particularity of the nuclear power, Nuclear Power Plants usually locate on the sites with less population. Though the daily work time in Nuclear Power
Plants is 8 hours, since the worksite is away from town site, usually, employees' choose to take lunch break at worksite which means the total duration at work
site is longer than 8 hours. Therefore, will the employees' satisfactory senses with the work time be impacted? The survey results indicated that 52.5%
participants thought "the job time is too long". Among them, the operators were 41.9%), and the non-operators were 58.2%. The significant difference test of
percentage indicated that the percentage of non-operators was obviously higher than the percentage of the operators, and the value of "Z" was 2.54, P< 0.05.
3.2.2 WORKLOAD
The survey results indicated that 36.6% participants thought "the workload was too heavy", among them, the operators were 37.6%, the non-operators were
36%. And 58.8% participants thought the present workload was moderate, among them the operators were 57%, the non-operators were 59.3%. The significant
test of percentage indicated that there is no significant difference between the proportions of the operators and the non-operators. The value of "Z" was 0.16,
P>0.05.
3.2.3 VACATION
Generally speaking, taking vacations when necessary represents one's control sense in work and it is also one of factors of influencing the employees' job
satisfaction. The survey results showed that 82.8% participants answered that "they could not take vacations when necessary". Among them, the operators were
94%, the non-operators were 78%. The significant difference test of percentage indicated that the percentage of the operators was obviously higher than the
percentage of the non-operators, and the value of "Z" was 3.22. P- 0.01.
According to the above survey results, we get the following two points.
Firstly, over 1/2 participants thought "the work time was too long", over 1/3 participants thought "the workload was too heavy" and over 2/3 participants could
not take vacations when necessary..
Secondly, there are differences between the operators and the non-operators in terms of work time and vacation control. Namely, more non-operators think
work time is too long and more operators feel less control of their vacations. One possible reason to explain the difference may be different job characteristics.
Most non-operators work in daytime and have to spend the whole day including lunch break at the worksite which may impose them the feeling of working
longer than 8 hours. On the contrary, operators work on shifts and shift duration and transmission usually are fixed. As a result, fewer operators think work time
is too long. On the other hand, due to the fixed shift system, it is not easy for operators to take vacations freely which makes operators feel less control of the
time.
3.3 CONFLICTS BETWEEN JOB AND FAMILY
Ayree and his colleagues indicated that the conflicts between job and family could affect not only the employees' psychological happiness, but also their job
attitudes, and further result in some relevant actions such as absence, retardation or demission (Dail, 2004, pp. 183-184). The negative emotion induced by the
family conflicts could be very easily transferred to the job and affect job efficiency. Working on shifts makes operators" work and rest schedule not match that of
their family members. Will this cause some conflicts?
3.3.1 LEISURE TIME WITH OTHER FAMILY MEMBERS
The survey results indicated that 33.8% participants answered that "they could seldom eat with their families". Among them, the operators were 46.2%, and the
non-operators were 27.2%. The significant difference test of percentage indicated that there is statistical significant difference between the proportion of
operators and non-operators, and the value of "Z" was 2.79, P< 0.01.
3.3.2 FAMILY MEMBERS' COMPLAINTS
The results indicated that 52.1% participants answered that "their families often complain the family life is affected". Among them, the operators were 62.4%o,
and the non-operators were 46.5%. The significant difference test of percentage indicated that the percentage of the operators was obviously higher than the
non-operators, and the value of ''Z" was 2.23, P< 0.05.
From the above survey results we could see that, 1/3 participants could spend little leisure time with their families, over 1/2 participants' families complained
the family life was affected. That means both operators and non-operators had conflicts between job and family. However, operators' proportion is higher than
non-operators.
3.4 OTHERS 'APPROVAL AND ANTICIPATION OF THE PROFESSIONAL DEVELOPMENT
In an organization, supervisors and colleagues are the two most important colonies impacting the employee's job satisfaction (Raymond, 2005, pp.475 & 485).
Some other researches indicate that the promotion anticipation is one of professional stressors for employees. Employees who are optimistic with their
professional development will enjoy better mental health, body health and job satisfaction than those who aren't (Zhang, 2006, p.90).
3.4.1 SUBJECTIVE PERCEPTION ABOUT THE SUPERVISORS' APPROVAL
The results showed that 46.6%> participants thought "their supervisors comparatively affirm their work performance". Among them, operators were 41.9%, and
the non-operators were 49.1%. In addition, 51.5% participants were not sure whether their performance was approved by their supervisors. Among them, the

VOLUME NO. 4 (2014), ISSUE NO. 04 (APRIL) ISSN 2231-1009
INTERNATIONAL JOURNAL OF RESEARCH IN COMPUTER APPLICATION & MANAGEMENT A Monthly Double-Blind Peer Reviewed (Refereed/Juried) Open Access International e-Journal - Included in the International Serial Directories
http://ijrcm.org.in/
3
operators were 57% and the non-operators were 48.6%.The significant difference test of percentage indicated no statistical proportion differences and the
values of'Z" respectively were 0.75 and 0.99, P> 0.05.
3.4.2 SUBJECTIVE PERCEPTION ABOUT THE COLLEAGUES' APPROVAL
The survey results indicated that 62%o participants thought "their colleagues comparatively affirm their work performance". Among them, the operators were
68.8%, and the non-operators were 58.4%. The significant difference test of percentage indicated no statistical proportion differences. The value of "Z" was 1.54,
P> 0.05.
3.4.3 ANTICIPATION OF THE PROFESSIONAL DEVELOPMENT
The results indicated that 27.2% participants answered "hard working can bring opportunities for promotion". Among them, the operators were 41.3%, and the
non-operators were 19.7%. The significant difference test of percentage indicated that the percentage of the operators was obviously higher than the
percentage of the non-operators, and the value of "Z" was 3.95, P< 0.001.
From the above survey results, we can get the following three points.
Firstly, over 1/2 participants were not sure whether their supervisors affirm their performance. Maybe there were communication problems between the
supervisors and the underlings. Some researchers showed that in an organization, the approval of significant others' was an important source of employees'
satisfaction and could influence the tendency of the individual demission.
Secondly, less than 1/3 participants thought "hard working can bring the opportunities for promotion". It seemed that many participants didn't agree the hard
working was an important factor for professional development. It is very easy for an employee to feel unsatisfied with his/her work and decrease the devotion
to job if he/she doesn't believe that endeavor is related with professional development.
Thirdly, more operators, compared with non-operators believed the hard working could bring opportunities for promotion. Such difference between operators
and non-operators could be attributed to the important roles of operators in Nuclear Power Plant. Since managers paid more attention to the operators, it is
easier to notice their work performance and hard work which may result in more opportunities for promotions than other positions.
4. CONCLUSIONS To sum up, we obtain the following conclusions:
Firstly, the overall job satisfaction of employees' in Nuclear Power Plantneeds to be further improved. This point is manifested by the following aspects: only
about 1/2 participants liked their own job, 1/3 participants could keep maximal devotion to their jobs, and about 1/2 participants had the tendency to change
their positions.
Secondly, the conflicts between job and family experienced by employees shall not be neglected. The survey results showed that about 1/2 participants' families
complained the normal family life was affected by work. This should be noticed by the managers. It is easy for employees to experience negative emotions when
they have conflicts with their spouses or family members. As a result, employees would attribute this negative result to their jobs or the organization and
produce unsatisfied feelings about the jobs which may affect work efficiency. A serious family conflict may disperse employees' attentions, and increase the
accident probability. If it is not possible to change the current working systems such as working on shifts, managers could consider some other methods to
alleviate such conflicts. For example, to establish a reasonable vacation system, to organize family parties on a regular basis etc.. These compensatory measures
can facilitate mutual understanding of family members and to decrease negative emotions.
Thirdly, the differences between operators and non-operators demonstrated through the survey should be taken into account when policies related to human
resources development to be made. Due to the importance of their positions, operators have higher proportions in positive feelings about their work, maximum
devotions to their job, high demand of training, approved work performance and optimistic anticipations of occupational development. On the contrary, non-
operators have lower proportions on those items. Non-operators are a necessary part of Nuclear Power Plant. The negative emotions and lower satisfactions
surly will impact the overall morale as "group emotions" when these feelings are perceived by others. Therefore, the managers of Nuclear Power Plants should
constitute more scientific, effective and human-centered managing policies according to the job characters and different psychological experiences of operators
and the non-operators to fully enhance the employee's job satisfaction. One of managers' responsibilities is to create a harmonious workplace in which all
employees can actualize their values. When employees feel satisfied with their work, their will devote themselves delightedly to their jobs. As a result, invisible
power underlain in humans will be transferred into visible profits. That is very thing that human resources development tries to work on.
REFERENCES 1. Dail L. Fields. (2004). Taking the Measure of Job: A Guide to Validated Scales for Organizational Research and Diagnosis. China Light Industry Press, pp.2-3,
183-184.
2. Raymond A. Noe. John R. Hollenbeck, Barry Gerhart & Patrick M. Wright. Interpreted by Liuxin (2005). Human Resource Management: Winning the
competitive advantages (the 5th edition). China Renmin University Press. pp.475 & 485.
3. Zhang, Xichao. (2006). Employee Assistance Programs: Theory and Practice of China EAP. China Social Science Press, p. 90.

VOLUME NO. 4 (2014), ISSUE NO. 04 (APRIL) ISSN 2231-1009
INTERNATIONAL JOURNAL OF RESEARCH IN COMPUTER APPLICATION & MANAGEMENT A Monthly Double-Blind Peer Reviewed (Refereed/Juried) Open Access International e-Journal - Included in the International Serial Directories
http://ijrcm.org.in/
4
CRITICAL FACTORS FOR SUSTAINABLE CHANGE MANAGEMENT PROCESS: A REVIEW
DR. MITA MEHTA
ASSOCIATE PROFESSOR
SYMBIOSIS INSTITUTE OF MANAGEMENT STUDIES
SYMBIOSIS INTERNATIONAL UNIVERSITY
PUNE
LALITA DEVI
STUDENT
SYMBIOSIS INSTITUTE OF MANAGEMENT STUDIES
SYMBIOSIS INTERNATIONAL UNIVERSITY
PUNE
VEENA RAI
STUDENT
SYMBIOSIS INSTITUTE OF MANAGEMENT STUDIES
SYMBIOSIS INTERNATIONAL UNIVERSITY
PUNE
ABSTRACT In present era of Human Resource Management, Change is a must for companies to survive and compete in today’s economic environment. As understood,
change is a complex process and requires involvement from top management to increase the readiness for change among the individuals in an organization. The
greatest fear an employee faces is of unknown change and in some cases outright resistance. It has been observed that organizations like ICICI, Infosys etc. are
undergoing a major structural change for their sustainable business growth. Effective communication plays an important role in successful implementation of a
change process. This research paper aims at reviewing various literatures in the area of change management at national as well as international level.
KEYWORDS Change management, Communication, leadership, resistance, sustainable change process, top management.
JEL CODE
D23
INTRODUCTION uthors have reviewed thirty articles all on change management over a period of sixteen years from 1997 to 2013. Because of the changes in the economy,
organizations are moving towards change to sustain the changes in the environment. Majority of the organizations fail to implement the desired change
as it is not an easy process. The authors have reviewed the articles for industries in different countries including Europe, Dutch land, Pakistan, India and
US covering both public and private Industries. Change resistance during acquisition or merger of organization has also been studied. The papers on reasons of
resistance by employees for change have been covered. Papers on various change models including Kurt Lewin’s Model, Nadler’s Model, ADKAR Model, TOC,
KAIZEN etc. have been reviewed by the authors.Role of CEO and other executives in change management and the competencies required by managers to
execute change successfully have been reviewed by the authors in addition to the papers on the methods of increasing readiness among individuals for the
change in an organization. Correlation of Total Quality Management and organizational change has been reviewed by the authors.
LITERATURE REVIEW Crawford John, Fisher Tom and Abraham Morris and (1997) discussed Management of organization and Quality culture and change of the award winning
organizations. These organizations followed Nadler’s principles. A questionnaire covering details of organization, Vision, Management practices, Motivation and
rewards systems was prepared. 14 organizations were studied using 25 questionnaires. Five questionnaires to each of the following categories were distributed-
senior and middle line management, operations employees, support and technical staff, and administrative support staff. It was assumed that these
organizations undergo time bound changes. Because of its focus on the dynamics of the change process Nadler’s model was selected. Importance of Vision was
indicated by the low mean scores. Involvement from CEO is necessary for unfreezing the existing system. A leadership behavior is required by leaders and
managers for successful change management. The author understands that Nadler Model principles were used by organizations to make a successful change
transition for a fruitful culture. Information management systems, rewards and recognition, standards of performance, learning and development were all used
simultaneously to ensure realization of the change. The author understands that development of a strategic vision, participation from top executives, inviting
participation from the employees, a detailed planning and feedback mechanism are the variables needed to change in a balancing way for an organization to
move to a new steadiness state.
Marie McHugh University of Ulster, Newtonabbey (1999) studied the Front line staff which led to the Organizational transformation. Various methods of public
management in countries like UK etc.suggestedlowering down the bureaucratic systems in private and non-governmental sectors would be playing an important
role in future. The research was done on in Dublin area’s two local offices. A questionnaire that consisted of seven parts including workand relationships,
services offered to customers,change management, work culture, career and development, technology provided and welfare was filled by the staff. Managers
emphasize their energy on changing the work itself by synchronizing employee roles and duties, and interactions to address the organization's most important
competitive task. Welfare service for society has been scrutinized regularly due to involvement of finances from public and its quality of services in current
years.When it comes to external environment, in response to top management becomes more aware regarding the need for change. In addition to the above
mentioned facts, Managers are required to be in the role of a good facilitator rather than a controller.The author understands that organizational change starts
at the edge and is headed by the frontline staff at a junior level while top management just acts as a facilitator in the transformation process.
Andrew Crane, Lloyd C. and Harris (2002) conducted a research titled views of management (regarding diffusion, degree and depth of change) in the
greenification of organizational culture. The research was conducted keeping in view that there is a need to hold responsibilities regarding beliefs, values and
behaviors related to environment in addition to think beyond technological fixes. The methodology was adopted to collect data related to past and
A

VOLUME NO. 4 (2014), ISSUE NO. 04 (APRIL) ISSN 2231-1009
INTERNATIONAL JOURNAL OF RESEARCH IN COMPUTER APPLICATION & MANAGEMENT A Monthly Double-Blind Peer Reviewed (Refereed/Juried) Open Access International e-Journal - Included in the International Serial Directories
http://ijrcm.org.in/
5
presentorganizational changes. Forty four semi structured interviews were conducted with top and middle managers of different organizations. As per the
analysis of the data and various narratives, it was found that diffusion, degree and depth were three most important cultural labels of greening. When the
analysis of greening is done with respect to the cultural depth it was appreciated by members of the organization that greening plays an important role. Various
factors like receptivity and green values were considered important for organization creation by the management and this was known as “Degree of cultural
greening”. It was considered that behavior, feelings and attitude of employees across the organization defined the diffusion of the cultural greening by the
management.
Jon Mikaelsson, Volvo Car Corporation and The FEN X Program, (2002) published a study titled Change management in the development of product
development in an organization a learning experience from Volvo Car Corporation to study the Collapse between Renault and Volvo Group which concluded to
the acquiring of “Volvo Car Corporation” by “Ford Motor Company”. During this period, the process of development of product was changed drastically
fromapoint of view of the organization. The change was divided into three phases’ initial phase, development phase and system wide diffusion phase. There is a
need of focus with respect to development of product in day today’sbusiness reality in the automotive industry.
While doing analysis of assets, it was found that knowledge; Time and Money are reserved assets. As per the rating, the people who are associated with the
development of the product, analysis done by them and decision taken by them based on those analysis are extremely important. A research of several years by
a large number of employees (thousands) is required for the development of a product in an automotive industry. The result of this research leads to design and
manufacturing of various parts to form a complete car. Researcher scrutinized the need of change management in an organization associated with development
of product. The author concluded that when the change initiative is considered, it is important to pay attention to two types of communication i.e. lateral and
vertical. It is important to bring out the real time experiments and non-routine works rather than theoretical considerations to have a strong foundation for
change. There are various methods by which non routine works can be analyzed, but the two most important used methods- One of them concentrates on the
traditional value system of the organization designed to routinely learn the change process. The other path provides various possibilities by which anxiety levels
can be dealt easily by continuously focusing on changes which are non-routine.
Ve´ronique Zardet and Olivier Voyant (2003) conducted a study on transformationof Organization based on socio-economic approach in the context of
industries. The purpose of the research paper was to find out if the essential principles of classical organization theory school are found in present scenario and
whether they are still an important part of industries in today’s world. And in case they are, to find out their impact. The study takes into account four cases a)
European industrial bakery established in 1975 with 300 employees, b) European group in consumer goods distribution with 1,500 employees, c) High tech
company with 4,000 workers and d) Service Company with 350 employees. Socio economic methodology was implemented in all the industries in the entire
company. Cost, performance are hidden factors which leads to dysfunctions in the work culture of an organization The study concluded that the various
principles regarding the structure of the organization are extremely important for the organization as per the classical school theory. The leaders whose thinking
were matching with that of classical schools were awaken for the evaluationof the hidden costs reducing from depth of specialization due to new technologies
like certification and reengineering. Concepts which were considered very important for a long time like experience curve, fundamental separation, managerial
decision making and economies of scale are actually inaccurate and this finding is the most important contribution of this research. Consecutive dysfunctions
(which is as per the bureaucratic and classical organization concept) often cancels out the expected profit and this is proven by the hidden costs.
Melanie Bryant (2004) conducted a study titled “Conversion stories as shifting narratives of organizational change” which was concerned with the experience of
employees which they talked out regarding their experiences of change in the organizational. Participants were identified and recruited through snowball
sampling. Out of 22 participants, 11 were cited in d paper. It was suggested by majority of the participants that a limited career opportunity is because of poor
employee-employer relationship at work. New managers were called by the participants as fantastic leaders. The researchers concluded that the shift from one
view point that is old organization prior to change to another view point that is new after change workplace is the main feature of the change communication.
Anuradha Chawla & E. Kevin Kelloway (2004) published a research on the topic predicting openness and commitment to change on large scale organization for
developing and testing a tool to predict it. The data was collected through survey on 164 employees to find out the variables that impacts employees
commitment towards a change process and how it is affecting their behaviour. The study concluded job security and communication as an important tool in
bringing out the commitment of employees and they act as a direct and indirect predictors and variables to openness. Their results showed the impact of
procedural justice during restructuring on understanding commitment. Participation of employees in the process was found to be a direct as well as indirect
variable to trust but was an indirect variable to openness. Finally, trust and openness does not affect an employee’s decision to exit the company. They studied
and found out that employee engagement and commitment are highly linked and so it resulted as communication and reliable (trust) are most important factors
to employee engagement .They found a similarity of these two factors as important functions in the previous studies done by other researchers. They
highlighted the participation of employees as most important factor to a successful change process.
Donald B. Fedor and David M. Herold (2004) studied through on research titled effects of change and change Management on employee responses: An Overview
of Results from Multiple Studies. The purpose of this paper is to provide detailed findings on managing change process in an organization. The research divided
the study into three parts in which study 1 focused on the change in behavior of employees towards their job and organization during the process. Study 2
researched on degree of resistance of employees towards change and how it is leading to stress. Study 3analyzed the degree of commitment of an employee to
change and how the process of change has impacted their commitment to the company. The methodology included data collection from 21 different sectors of
industries mainly services, manufacturing, healthcare and engineering which took close to 92 change initiatives 34 for Study 1, 27 initiatives for Study 2 and 31
different change initiatives in US. Method of sampling were common for the three studies where manager of each company were asked about the initiatives
they took for bringing out change at work place and how the step has impacted certain employees at the workplace . Study 1 suggested that good practices of
change management has a positive impact on the working of younger employees but raises a problem on how to deal with older for a successful implementation
of change. Study 2 analyzed the reasons and level of strain employees faced in their jobs during change process depends on the high level of personal demands
and the degree of change. Final conclusion suggested the change process management should also consider the work unit as well as individual job level.
Dr.Nidhi Pandey, Asst Professor conducted a research on the title Strategic Human Resource Management, TQM and organizational change and development
(2005). The paper is aimed to bring out the relation between the TQM and organisational development. The study revealed the basic assess preconditions and
the present state of organisation to ensure that there is clear need for change and thus TQM is the apt strategy. Culture of the organisation and the styles of
leadership should be in congruence with the TQM. It is also mentioned that if this is not found then TQM should not be implemented or at least avoided or
delayed till the conditions are favourable. There is need on the part of the leaders for commitment maintenance, visible process delivery, providing the required
support and making people accountable for their results. Maximise the usage of inputs from various stakeholders like clients, funding sources, referring agencies
etc.
Don Chrusciel, Ames, Iowa (2006) carried out a search study titled Importance of emotional intelligence (EI) while dealing with adaptation in decision
management. The purpose of this paper was to show that how staff performance and productivity can be improved and assessed by the use of Emotional
Intelligence. It can also be used for the development of effective human resource strategy which helps to deal with changes in the organization. Necessary
training is important for improvement of one’s emotional intelligence after identification of importance of emotional intelligence. It is not necessary to be
satisfied with present level of emotional intelligence and to accept all the levels if they are inadequate. Identification and use of emotional intelligence requires
suitabletraining which would not only benefit the individual but also the organization.
James Thomas Kunnanatt (2007) conducted a study titled “Influence of ISO 9000 on climate of organizational Strategic change management in an Indian
organization, aimed to find out how the procedure of ISO 9000 applicationalters the machineries of organizational climate. The study was carried out in an
electrical engineering organizationwhich was operating in the state of Kerala, India since last forty year. In this organization the change was implemented using
“participatory approach”. Measurement of climate both pre and postthe implementation of ISO 9000 was done using Pareek’s (Motivational Analysis of
Organizations-Climate) MAO-C instrument. It was concluded thatdependency, affiliation and control take a U-turn transformation and give a way to helpful
climate conditions including extension, achievement and expert advice on implementation of ISO 9000.

VOLUME NO. 4 (2014), ISSUE NO. 04 (APRIL) ISSN 2231-1009
INTERNATIONAL JOURNAL OF RESEARCH IN COMPUTER APPLICATION & MANAGEMENT A Monthly Double-Blind Peer Reviewed (Refereed/Juried) Open Access International e-Journal - Included in the International Serial Directories
http://ijrcm.org.in/
6
The study is conducted by Asta Pundziene, Raimonda Alonderiene and Solveiga Buoziute (2007) tilted Managers’ change communication competence links with
the success of the organisational change. The study explores ways to increased communication competence amongst the managers which is required for
successfully implementing change management in the enterprises. The aim of the survey is to come up with links and relation between the success of the
change management and the competence of change management. Also the paper throws light on the communication competencies which are needed for
organisational change and the effective ways to get hold of them. The literature of the change management shows the importance of the communication while
implementing the organisational change. The study finds out the competence in communication required by the mangers during the change and also the ways of
learning. An empirical research conducted in more than 40 Lithuanian enterprises shows that Lithuanian managers had developed competencies in
communication and they could understand which form of the learning was most common. Insights in the literature conclude that internal communication is the
most important factor responsible for organisation change. The survey indicates the process which leads to manager’s learning and content. Also it reveals that
learning through doing or informal learning is very common among Lithuanian managers.
A research was conducted by David M. Herold, Donald B. Fedor and Yi Liu (2008) titled the effects of transformational and change leadership on employees’
Commitment to a Change: A Multilevel Study. The study aimed at analysing the role of transformational leader as change agent and its role for a successful
implementation of change in an organization. They also tried to find out its relation with and impact on employees commitment and attitudes towards
restructuring. For the collection of data they selected a sample size of 343 employees for 30 different organizations of sizes more than 1000 employees of
different sectors in US. The industries surveyed were telecom, information technology, consulting, manufacturing, and BFSI. The sample size selected was from
14 to 300,000. It was concluded that transformational leadership has a positive impact on the followers’ behaviour towards commitment to change. Also good
management practices are closely related to change and are responsible for a smooth change process to occur. Concluding statement was made as
transformational leader plays an important role as a change agent for an organization.
Katja Pook Perspectives, Goettingen, (2011) conducted a study titled Getting the involvement of people for the benefit of intellectual capital management that
addressesthe HR challenges. The main purpose of the article was to understand the benefits and exposits the intellectual capital assessment to face theexisting
challenges related to development in the organization and work issues of human resources. The research concludes that there is a substantialintersection of
benefits of IC assessments (in some areas of human resources work) and challenges in which are substantially interlinked with development of organization. The
contributions of IC management to HR work and organizational development are manifold, especially by providing a method to align individual perspectives and
actions to enhance organizational success. Establishing IC assessment and the entire process of cultural change towards more participation in strategically
relevant issues, intense knowledge sharing and empowerment of employees in strategy implementation, might show effects in the individual regarding
satisfaction at the workplace, organizational commitment, work-related activity, etc. IC management is well worth investigating these kinds of effects.
Soparnot, Tours (2011) published a study titled “the concept of organizational change capacity” aimed to design a structure for identification of dimensions of
change capacity and its components.A single case study was conducted by the author to observe an organization that had acquired the status of a company
because of its capacity to change. The study was conducted by observations in one department of Renault with 160 employees. Three dimensions were
identified important for change capacity as per the study which was related to learning dimensions, context and its process. If the deep analysis of these factors
was done, it was found that various resources that facilitate the process change are the factor of context dimension. Similarly various principals involves in the
implementation of change is the sub factor for process dimension and at the end the capacity related to introspection of an organization is a sub factor of
learning dimension.
Deborah Blackman and Monica Kennedy (2011) titled “Sometimes, to change the people, you’ve got to change the people: when learning is not enough”. This
paper discusses organisational learning and change management in an Australian university undergoing a major change. The aim is to find out the major factors
acting as resistance to change and how it is affecting the work. The research was done through survey of the staff and the leader performing different roles and
occupations, through interviews. The secondary data was collected from the documents and reports at workplace. Analysis suggested the differences in the
approaches of the leader and the members towards changes. The main head of the organization has a very formal approach towards change ignoring the people
participation for a successful implementation of change which can lead to a change failure. The ambiguous information presented to the members lead to a
greater resistance towards change disregarding the organizational information presented to them leading to change failure because of non-participation.
Marinel-Adi Mutate and Razvan Grigoras (2011) conducted a study titled change in knowledge based organizations-a procession – organic approach. The paper
studied the change processes explained within the organic framework of investigation. The study defined a contrast difference between transformation and
change process. They explained how the knowledge based companies are the one going to sustain in the future. The study concluded that for a company to
survive change and undergo a smooth transition a proper research of the current stage and the future requirement of the change is to be done in order to
survive the change process and save it from the failure of the change.
Kari Kerttula and Tuomo Takala (2012) conducted a study titled “Power and strategic change in a multinational industrial corporation” aimed to analyze the
power usage in a strategic change method within a large industry related to forest. The organization had a total of seven thousand seven hundred employees, six
to eight levels of organization and more than thirty units for production, a global sales network. For a period of more than two years and by using change
narrative, observation by participants, the author collected the empirical.The management perspective was used to find out the usage of power. The researcher
played two roles,in addition to being a researcher he was a part of the management as well.The study revealed many conclusions. As per the first conclusion
revealed that the transformative change in a multinational organization involves a learning process that is very challenging and is of multistage. The second
conclusion states that change which was taking place out of the well-established and well managed functioning of the organization does not represent a
separate process. Change cannot take place by shortcuts was the third conclusion. It involves actions, thinking process of the people beginning from the
understanding of the steps required for the change
J. Jenny Gregor, Mueller Frithjof, and F. Bauer Georg (2012) conducted a research titled “Readiness of Organisation and Individual for change”, aimed for the
proper management of occupational health and organizational interventions. This paper was designed to grow a survey based and health specific dimension for
valuation of organizational and individual health focused level of willingness for change. A complete intervention study of management of stress was carried out
across 9 large and medium enterprises in Switzerland with a sample size of 3,703 for a period lasting 10 years. A survey tool which was online known as S-Tool
consisting of a simple section with 35 authenticated measures on stressors, health and wellbeing, resources and also an in depth unit with 12 scales on relations
with customer, fairness, domain balance of life, burnout and coping the stress was filled by the respondents. Descriptive statistics (tables of mean and
correlation) and reliability analyses were used for analyzing the total sample. From the conclusion of the study the authors understand that readiness which is
health oriented for change is an effective tool for both organizations and individual to assess the present behavior and commitment for change.
P.J. DriessenPeter, M. Cramer Jacqueline andHeijden Angela (2012) conducted a study titled “Change mediator sense making for sustainability in a subsidiary
which is multinational”. They discussed the considerate of processes implementation for corporate sustainability accomplishment by provision of knowledge
about the role of agents causing change. The paper inspected the sustainability in a subsidiary which was Dutch of the US based company which used to
manufacturer carpet tile over a period of 10 years. It was detected that the sustainability visualization was realized from the top executives. Initially, CEO was
considered to be the most important agent leading to change who is also known as the sustainability pundit”. After a continuous hard work for 4 years on
relocating the sustainability vision of the company, creation of awareness and building of concrete projects, the change mediators mirrored on their growth and
recognized that their sustainability activities had not yet formed all the desired results. The dissimilarity in culture between the Europe and United States played
a very significant role. In the year 2004 a descending trend was felt by the change representatives in their hard work and a control above sustainability. The
results show that inserting sustainability by change negotiators is usually a growing process of change that comprises of minute random steps. Gradually change
mediators became involved with the sustainability issues as the subject and the presentations of the company became attractive to them. The authors
understand that the inference is that change mediators should include different ways to network and exchange information between people from different
departments for engagement of all the employees in the organization.

VOLUME NO. 4 (2014), ISSUE NO. 04 (APRIL) ISSN 2231-1009
INTERNATIONAL JOURNAL OF RESEARCH IN COMPUTER APPLICATION & MANAGEMENT A Monthly Double-Blind Peer Reviewed (Refereed/Juried) Open Access International e-Journal - Included in the International Serial Directories
http://ijrcm.org.in/
7
Elizabeth Briody, Tracy Meerwarth Pester (2012) conducted a study titled “The impact of a story on organization’s cultural change” aimed to explain the fruitful
implementation of applications in the organization to ensue change in the organization as per the facts from manufacturing plan of General Motors. For the
identification of important attributes of perfect plant culture, it is important to analyze and collect the Hoist story which was a part an ethnographic multi-year
research project. With respect to various issues related to cultural change in the organization, the researcher worked in coordination with the members of the
organization. The emphasis of the findings was first on the Hoist story which provided the ignition to the change process which involves a high degree of buy in
throughout the organization and is in contrast with the literature of management “planned change”. The findings emphasize both the Hoist Story’s process
impact and outcome impact. Several “packaged products” (e.g. a story script, video, collaboration tools) were developed as a result and it got its manufacturing
process and a culture closer to that of GM. The second emphasis was on outcome impact. Further research can be conducted citing the importance of stories
for the process of change.
Jana Deprez, Herman Van Den Broeck, Eva Cools and Dave Bouckenooghe conducted a study titled “Gender differences in commitment to change: impacted by
gender or by being part of a minority group” (2012), aimed to research on the impact of gender towards change process and how differently change affects
employees behavior towards their commitment to change initiative. The research methodology included a survey on a Belgian automotive company which was
undergoing a total restructuring process. Data were collected through survey on a sample of 77 employees. The sample consisted of women as a minority group
to check the impacts of change on gender. Independent t-tests were done to unleash main reasons for gender differences towards change and how they
perceive it, context and variables of change process, and degree of commitment towards change. The study concludes that women do not behave differently
and were found to show more positive attitude change process than men. But men scored significantly more on the scale for continuance commitment to
change than women. The researchers contradicted the previous finding which showed women as more averse to risk than men and therefore negative attitude
towards change. The findings of the survey can be of significance importance to policy makers and researchers to find approaches to change focusing on gender
balanced approach leaving the old school approach of ‘one-size-fits-all’.
The study conducted by Ajayi Samson Adeniyi titled by an analysis of employee resistance towards organisational changes (2012). The study reveals that the
employees are completely against the process change, change dynamics, causes for the caused change and the procedure adopted by the employees to bring in
change in the organisation. The study focuses on the various reasons responsible for resistance amongst the employees towards the changes being introduced in
the organisation. The data collection is through secondary and primary methods. This data is later represented in form of simple percentages table and then
they are analysed and conclusions are interpreted. The important findings from this study reveal that the main cause for resistance amongst the employees is
required change being poorly communicated, lack of motivation and lack of encouragement to make these changes functional and lastly the changes being
introduced in a very inhuman way. In the end the study concludes that the Airtel Networks ltd underwent a failed change management process. There was no
proper communication amongst the employees when the changes were introduced and the management failed to put forward the hazardous nature of the task
before implementing such changes. Thus it is recommended that employees need to be well communicated about the nature of the changes being introduced in
the organisation. This should be followed by proper process as well as relevant inventive packages and motivation.
Ralf & frank (2013) conducted a study titled mind the gap the relevance of post-change-periods for organizational sense making. This paper talked about
exploring the gap by using qualitative in-depth analysis at the national branch of a major MNC in communication sector, they have been analysed by means of
sense making theory which is combined with neo-institutionalism and sociological systems theory. The case portraits how corridors of future success are defined
by retrospection and throws light on the change in the moment which was ignored earlier. The conclusion was drawn that the on individual space of sense
making is driven by the requirement to recreate the past of the particular company and company’s own story. The emerging contradictions which were apparent
in sense making stories on organisational levels are the expressions for the major structural contradictions, where the organisational system is mainly
confronted with.
The study which is titled eighteen shades of grey has been conducted by Ralf Wetzel and Lore Van Gore in the year of 2013. It is an explorative and extensive
literature review based on the theoretical flavours of an organisation and its change research published in the Journal of Organisational Change Management.
The motive of this research is to understand the grounding nature of the theoretical research because broadly these theoretical foundations are very mostly
diffuse or continuously boring. In order to get more insights about the selection, 85 articles on organisational change were chosen and then published in
renowned journals of 2010. A reference analysis was conducted based on 18 prominent theories of organisations and their prime contributing authors. The
results initially show a very in depth theoretical selectivity in OCR mainly focusing on learning, cognitive, neo-institutional and discursive theories. Rests of the
theories were almost neglected. Later our analysis reveal that this particular practice is a sign that in present scenario OCR is struggling hard with changing the
cognitive frames mainly of topical OT into fruitful accesses to its own object. Application of the theory finally appears as a dissatisfying escape technique
performed in order to cover theoretical antagonisms and to escape even deeper confrontation with respect to the underlying assumptions of identity and OCR
conditions.
ZenabKazmi,SyedaAsiya,and MarjaNaarananoja (2013) conducted a study titled “Relative approaches of key models of change management - a fine variety to
pick from as per needs of the situation”, to get an awareness over the selection conditions of the leaders of change to choose the most appropriate from a
diversity of models for change management for smooth makeover of the organization. Relative analysis was carried out to inspect the existing work condition
and find out the gaps between the preferred levels of selected dimensions (i.e., Creativity, Care, Confidence and Commitment). Results were attained through
the interview feedbacks, questionnaire and discussion sessions which were open with the aimed sample. The authors certain well known models for
management of change and complemented those alongside the feedback obtained from the samples. It was establish that Kurt Lewin's model cannot be used as
it is over simplified for fairly modem work situations where the multifaceted ego subjects were evidently present in the behaviors of team members. Elizabeth
Kubler-Ross’s model is relatively more appropriate in stages when an individual is met with the misfortune such as the loss of the family member or the friend
leading to too much misery, there is a choice to leave the environment of the organization remains an alternative for the employee. Kotter's Model of Change
Management is very alike to Lewin’s model is not appropriate to contemporary circumstances as it totally evaded any conversation stressing that how this great
level method ties into Management of Project. Understandings on the change management explanation choices done in the worldwide situation persuaded the
authors to select one from the 3 i.e., TOC, ADKAR and KAIZEN Models. Author understands that ADKAR is the comparatively feasible model as it has strong
capability to evaluate the level of "readiness" amongst the employees and also it gives the choice of "barrier point," that delivers the chance to evidently
classifying the difficulty confronted by the team member. Author understands that ADKAR delivers the motives to comprehend that when the employees lack
acknowledgement, reward and support for change, then deterioration in their passion and level of energy about the change is predictable. In few cases
workforces tend to just return back to ancient ways of doing work finally leading to the failure of the change process.
Dr. C. Swarnalatha, T.S. Prasanna (2013) conducted a detailed study on the topic titled Employee Engagement and Change Management. The paper aimed to
study the common link between employee engagement and its relation to change. It was a detailed study on the two concepts and to find out to what extent
are they related and what functions are common between two of them. The methodology included review of different papers published by recognized authors
and study their finding to conclude and summaries all the results in one. By studying different papers they came to a conclusion that a successful
implementation of change process and restructuring requires a proper employee engagement activities including clear communication with the employees and
gaining trust for a process. They also found out many common functions are being shared between the two processes.
Saquib Yusaf Janjua, Majid Khan, Majid Khan and Farrukh Nawaz Kayani (2013), conducted a research study titled change factors driving management
development needs: empirical evidence from Pakistan. The paper analysed the impact of different environment external and internal on organizational changes
and competencies required in managers to handle change process. The study analysed the external and internal developments impacting change process in the
business in Pakistan. The research methodology included a survey on 500 working managers in the respective companies in major cities of Islamabad and
Rawalpindi. Respondents were asked open ended as well as close ended questions related to what factors are main drivers to bring out change and to rank them
in order of priority. A multivariate analysis was then done on these responses to bring out the empirical evidence. It provided a detailed analysis on how change
drivers affect business organizations. Technological changes are the main variable affecting the working of business along with policies of government and the

VOLUME NO. 4 (2014), ISSUE NO. 04 (APRIL) ISSN 2231-1009
INTERNATIONAL JOURNAL OF RESEARCH IN COMPUTER APPLICATION & MANAGEMENT A Monthly Double-Blind Peer Reviewed (Refereed/Juried) Open Access International e-Journal - Included in the International Serial Directories
http://ijrcm.org.in/
8
economic scenario and the stability of political system in the country. The internal environment included the changes in the polices at workplace, job redesigning
and innovative practices related to technology up gradation as the main driver to affect the competencies needed for the managers at workplace.
Srinivasan Tata Chari (2013) conducted a research titled changes in organizational and professional identifications during socialization of newcomers. This
methodology of the research study was done through a survey of fresh graduates joining the top IT companies. The sample size was 365 newcomers including
both male and female. The batch of the sample was selected from the phase when economy started to recover after recession including major changes and
restructuring at organizational level. A hierarchical regression was done on the responses.The study showed a positive relation in the perceived organization
identification and the expectation of the newcomers leading to a positive impact of newcomer oneness towards organization. The study has suggested the
importance of mentoring and proper induction of the newcomers to understand the business leading to increase in oneness an employee feels towards their
companies.
CONCLUSION Researchers would like to conclude that this paper has covered a brief review of organization change. Conclusions that can be drawn from the research are
discussed here. Development of a strategic vision, participation from top executives, inviting participation from the employees, a detailed planning and feedback
mechanism are the variables needed to change in a complementary way by which a new equilibrium state can be reached by an organization.There is a need of
information exchange and various ways of interaction between and within different departments by change agents for engagement of all the employees in the
organization as effective communication plays an important role. Lack of recognition, reward and reinforcement for change, may decline the level of energy and
passion across the people otherwise employees tend follow back the old ways of doing work which finally leads to the downfall of the change process.Successful
employee engagements are considered as an antecedent to successful change implementation. Intense knowledge sharing and empowerment of employees
leads to smother change management process. Finally, there are no shortcuts to change. It is a slow and steady process that starts from thinking and then
implementing the measures required over a period of time.
FINDINGS Major findings are:
1. Majority of papers were about the involvement of top management in change process.
2. Most of the papers reviewed focused mainly on the resistance among employees and how to overcome it.
3. Organizations change processes mainly followed conventional change models like Kurt Lewin’s Model.
4. Most of the researches were conducted by collecting primary data from employees as well as managers.
5. Change processes were mostly initiated when an organization acquired a subsidiary in another country, merger and acquisition and transformation of a
public subsidiary to private or vice versa.
SCOPE FOR FUTURE RESEARCH Further research can be done on:
1. The study can be done to define different kinds of change and the critical factors required for success.
2. An extensive research can be done on the relation between engagement and change management.
3. In order to evaluate the value of new frameworks, different methods of measuring the success of organizational change management should be designed.
4. In addition to individual, efforts should be made to study the actual behavior reactions, attitudes and emotions influenced by transformational or other
leadership dimensions.
5. Instead of “one-fits-all” approach, the policy makers can work further on gender balanced change approach as studies conclude that women are more
apprehensive towards change.
REFERENCES 1. Ajayi Samson Adeniyi, “An Analysis Of Employee Resistance Towards Organisational Changes”, SSRN, 2012
2. Angela van der Heijden, Jacqueline M. Cramer and Peter P.J. Driessen, “Change agent sense making for sustainability in a multinational subsidiary”, Journal
of Organizational Change Management Vol. 25 No. 4, 2012 pp. 535-559
3. Anuradha Chawla & E. Kevin Kelloway, “Predicting openness and commitment to change”, The Leadership & Organization Development Journal, Vol. 25
No. 6, 2004, pp. 485-498
4. Asta Pundzienė, Raimonda Alonderienė and Solveiga Buožiūtė, “Managers’ change communication competence links with the success of the organisational
change”, ISSN 1392-2785 Engineering Economics, 2007, No 4 (54)
5. Deborah Blackman and Monica Kennedy, “Sometimes, to change the people, you’ve got to change the people”: when learning is not enough, International
Journal Learning and Change , Vol. 5, Nos. 3/4, 2011
6. Don Chrusciel, “Considerations of emotional intelligence (EI) in dealing with change decision management”, Management Decision Vol. 44 No. 5, 2006 pp.
644-657
7. Donald B. Fedor and David M. Herold, “Effects of Change and Change Management on Employee Responses: An Overview of Results from Multiple
Studies”, Tappi Fall Technical journal, 2004, Paper 3-1
8. Dr. C. Swarnalatha and T.S. Prasanna, “Employee Engagement and Change Management”, International Journal of Business and Management Invention,
Volume 2, Issue 6, 2013, PP.01-06
9. Dr.Nidhi Pandey, “Strategic Human Resource Management TQM and Organizational Change And Development”, ISBN
10. Elizabeth Briody, Tracy Meerwarth Pester, Robert Trotter, “A story’s impact on organizational-culture change”, Journal of Organizational Change
Management Vol. 25 No. 1, 2012 pp. 67-87
11. Frithjof Mueller, Gregor J. Jenny and Georg F. Bauer, “Individual and organizational health-oriented readiness for change”, International Journal of
Workplace Health Management Vol. 5 No. 3, 2012 pp. 220-236
12. James Thomas Kunnanatt, “Strategic change management experience of an Indian organization”, International Journal of Manpower Vol. 28 No. 2, 2007
pp. 175-192
13. Jana Deprez , Herman Van Den Broeck, Eva Cools and Dave Bouckenooghe, “Gender differences in commitment to change: impacted by gender or by being
part of a minority group”, Journal of Vlerick Leuven Gent Working Paper Series, vol. 07, 2012, pp. 213-243
14. Jon Mikaelsson “Managing change in product development organization: learning from Volvo Car Corporation” , Leadership & Organization Development
Journal 23/6 [2002] 301-313
15. Kari Kerttula and Tuomo Takala, “Power and strategic change in a multinational industrial corporation”, Leadership & Organization Development Journal
Vol. 33 No. 3, 2012 pp. 233-254
16. Katja Pook, “Getting people involved The benefit of intellectual capital management for addressing HR challenges”, Journal of European Industrial Training
Vol. 35 No. 6, 2011 pp. 558-572
17. Liu,”When Change Leadership Impacts Commitment To Change And When It Doesn’t - A Multi-Level Multi-Dimensional Investigation”, SSRN, 2009
18. Lloyd C. Harris and Andrew Crane, “The greening of organizational culture Management views on the depth, degree and diffusion of change”, Journal of
Organizational Change Management, Vol. 15 No. 3, 2002, pp. 214-234

VOLUME NO. 4 (2014), ISSUE NO. 04 (APRIL) ISSN 2231-1009
INTERNATIONAL JOURNAL OF RESEARCH IN COMPUTER APPLICATION & MANAGEMENT A Monthly Double-Blind Peer Reviewed (Refereed/Juried) Open Access International e-Journal - Included in the International Serial Directories
http://ijrcm.org.in/
9
19. Marie McHugh, Geraldine O'Brien and Joop Ramondt, “Organizational metamorphosis led by front line staff”, Employee Relations, Vol. 21 No. 6, 1999, pp.
556-576
20. Marinel-Adi Mustafa and Răzvan Grigoraș, “Change in Knowledge Based Organizations. A Processual – Organic Approach”, Romanian National Authority for
Scientific Research, CNCS – UEFISCDI, 2011, pp.0849
21. Melanie Bryant, Julie Wolfram Cox, “Conversion stories as shifting narratives of organizational change”, Journal of Organizational Change Management Vol.
17 No. 6, 2004 pp. 578-592
22. Morris Abraham, Tom Fisher and John Crawford, “Quality culture and the management of organization change”, International Journal of Quality &
Reliability Management, Vol. 14 No. 6, 1997, pp. 616-636
23. Ralf Wetzel & Frank E.P. Dievernich,” Mind The Gap. The Relevance Of Post-Change-Periods For Organizational Sense making” , Systems Research &
Behavioural Science 2013, sres.2198
24. Ralf Wetzel & Lore Van Gorp, “Eighteen shades of grey? An explorative literature review into the theoretical flavours of organizational change research”,
Journal of Organizational Change Management, 2013, pp.316- 343
25. Richard Soparnot, “The concept of organizational change capacity”, Journal of Organizational Change Management Vol. 24 No. 5, 2011 pp. 640-661
26. Srinivasan Tatachari, “Changes in Organizational and Professional Identifications during Socialization of Newcomers”
27. Steven Caldwel, David M. Herold and Donald B. Fedor,” The Effects of Transformational and Change Leadership on Employees’ Commitment to a Change: A
Multilevel Study”, Journal of Applied Psychology , 2008, Vol. 93, No. 2, 346–357
28. Syeda Asiya Zenab Kazmi and Marja Naarananoja “Comparative approaches of key change management models - a fine assortment to pick from as per
situational needs”, 3rd Annual International Conference on Business Strategy and Organizational Behaviour (BizStrategy 2013)
29. Vasja Roblek , Maja Meško and Andrej Bertoncelj, “Social Media, Organizational Changes and Added Value in Knowledge-Based Industries”, AARESOC-
ICBM 2013, pp.212-234
30. Ve´ronique Zardet and Olivier Voyant, “Organizational transformation through the socio-economic approach in an industrial context”, Journal of
Organizational Change Management Vol. 16 No. 1, 2003 pp. 56-71

VOLUME NO. 4 (2014), ISSUE NO. 04 (APRIL) ISSN 2231-1009
INTERNATIONAL JOURNAL OF RESEARCH IN COMPUTER APPLICATION & MANAGEMENT A Monthly Double-Blind Peer Reviewed (Refereed/Juried) Open Access International e-Journal - Included in the International Serial Directories
http://ijrcm.org.in/
10
MANAGEMENT STRATEGIES TO CAPITALIZE AND ENHANCE HUMAN POTENTIAL IN INDIAN
MANUFACTURING SECTOR
PRABHJOTKAUR
ASST. PROFESSOR
S.G.G.S. KHALSA COLLEGE
MAHILPUR
SAMRIDHI GOYAL
ASST. PROFESSOR
DESH BHAGAT COLLEGE OF EDUCATION
DHURI
KAWALPREET SINGH
MANAGER (HR & ADMIN)
SARLI TECHNOLOGIES
AMRITSAR
ABSTRACT In today’s competitive scenario, most manufacturing units are facing immense skill shortage and high attrition rates. Human resource being the most vital organ
of a business demands careful capitalization and continuous innovation. An effectively motivated and competitive human resource produces the best quality
products. So, for a manufacturing unit its human resource is equally important as customers outside waiting to buy its product. Human resource is one of the
most crucial driver and dormant variable for development and change in the business. It is most abundant and readily leveraged resource which demands careful
handling in order to minimize the problems relating to job dissatisfaction, absenteeism, and employee turnover. To develop human potential in Indian
Manufacturing sector current HR practices are constantly striving towards enhancing the quality of work life and personal life of its employees. The view point of
management towards its employees has begun to change and shifting of focus of vision and mission statements towards the people working for them is a perfect
example. As Chris Collins, director of the Center for Advanced Human Resource Studies at Cornell University’s ILR School states “It’s important to create an
environment in which people think in a new way, with a workforce that is constantly learning, adjusting and adapting to new technology,” a revolution has begun
with a mission of developing the hidden skills and perfection in the workforce by providing everything.The main aim behind this paper is to find various strategies
used by Indian manufacturing industries and suggest new innovative ways to capitalize and enhance human potential.
KEYWORDS
Human Potential, Indian Manufacturing sector.
INTRODUCTION f all the resources, the ‘human resource’ is the most significant and the only active factor of production. All the other factors like capital, materials,
buildings, plant and machinery, etc; remain inactive unless there are competent people to utilize them for producing goods and services as desired by
the society. The goal of achieving greater quality and higher productivity depends on the skills of people. Developing human resources, upgrading their
skills and extending their knowledge and competencies would lead to organizational development. Therefore management and effective utilization of the
potential of its human resource by a manufacturing unit is the key to its success in today’s competitive scenario. The organization which does not understands
the value and potential of its most important asset i.e. its human resource; can never sustain in the long run. If the human resources are not properly motivated,
the management will not be able to accomplish the desired results. Therefore, human resources should be managed with utmost care to inspire, encourage and
impel them to contribute their maximum for the achievement of business objectives. In words of Walt Disney, “You can create, design and build the most
wonderful place in the world but it requires people to make that dream a reality.” Over time, it is human capital that creates financial capital, not the reverse. It
is increasingly recognized that it is the people, or human resource of the organization that are most likely to supply the core competencies which will be the
primary source of sustained competitive advantage and successful long term financial performance. While most of the Indian manufacturing companies
understand the importance of developing and managing their human resource, they do not have the right system and practices in place to manage their
potential effectively. But at the same time the companies that have already realized the importance of their human resource are constantly striving towards
enhancing the quality of work life and also the personal life of its employees and it does not stops with the employee but it gets extended to his/her family as
well. The way the companies think about their people and what they choose to do or not to do in unlocking their human potential determine their future
sustainability. Modern times and future scenario are the proofs that the human resource has to be treated as a valuable asset to be used for the benefits of
organizations and society. Now a days human resource policies are aiming at promotion of mutuality – mutual goals, mutual respect, mutual rewards and
mutual responsibilities. The belief is that policies of mutuality will elicit commitment which, in turn, will yield both better economic performance and capitalize
greater human resource potential by greater human resource development. To provide the employees a safe and healthy working environment is not regarded
as a necessity in fact it has become a habit. Now Indian Manufacturing Firms are focusing on the future, they are busy developing plans that offer each employee
opportunities to develop future abilities, matching expectations with opportunities. Indian Manufacturing Firms are investing resources to shape employees for
the future and not the past by carrying out employee development plans, by practicing career and performance management, by proving the employees with
everything that is needed to reach the top score of employee satisfaction. Because a satisfied and happy employee is gradually going to result in the best quality
product and achieve the much needed organizational objective.
RATIONALE OF THE STUDY The contribution of Indian Manufacturing industry to its GDP is merely 16%. The structural reforms since 1990 have made some progress. However the long
term competitive ability of Indian Manufacturing firms would depends upon how efficiently the Indian Manufacturing units tap the potential of their most vital
organ i.e. its human resource. This study is being carried out to highlight the importance of capitalizing and enhancing the human potential in revitalizing the
Indian Manufacturing sector both economically and globally.
O

VOLUME NO. 4 (2014), ISSUE NO. 04 (APRIL) ISSN 2231-1009
INTERNATIONAL JOURNAL OF RESEARCH IN COMPUTER APPLICATION & MANAGEMENT A Monthly Double-Blind Peer Reviewed (Refereed/Juried) Open Access International e-Journal - Included in the International Serial Directories
http://ijrcm.org.in/
11
OBJECTIVES OF THE STUDY 1. To indentify the current HR practices being followed by Indian Manufacturing firms.
2. To understand the importance of enhancing and capitalizing human potential in Indian Manufacturing Sector.
3. To put forward the new ways to foster excellent personnel and have these personnel display their potential to the utmost degree.
RESEARCH METHODOLOGY RESEARCH TYPE
Descriptive Research
TYPE OF DATA/DATA SOURCE USED
Secondary Data/Data source. The present study is based on secondary data. Basically, the required information has been derived from Various books, Articles
from Newspapers, Magazines & Journals and From the various related web-sites which deal directly or indirectly with the topics related to Human Resource in
the Indian Manufacturing Industry. After searching the important web-sites, relevant information was down loaded and analyzed to address the objectives of
present study.
LIMITATIONS OF THE STUDY 1. The study is based on published data and information. No primary data is being collected.
2. Every care has been taken to entice qualitative and correct data; still secondary data have collected for the purposes other than problem at hand.
3. The objectives, nature and methods used to collect secondary data may not be appropriate to the present situation.
4. Secondary data may be lacking in accuracy, or they may not be completely current or dependable.
5. Time constraint remained the major limitation in the study
6. The biasness can always be there.
7. Before using secondary data, it is important to evaluate them on above mentioned factors. So, it consumes the same time as the primary data.
CURRENT HR PRACTICES PREVALENT IN INDIAN MANUFACTURING SECTOR Modern time demands that the industrial sector specially the manufacturing sector should strongly believe in the philosophy of continuous learning, for all
employees. The spirit of learn ability among their people and an organizational commitment to continuous personal and professional development should be
the bottom line streamlining the Indian Manufacturing sector. Not all of the Manufacturing Industries realize the importance of development of their human
resource but those who does are the fore runners. The successful frame work for continuous learning demand to be built around a number of focused programs
for their employees. These range from major initiatives such as various ongoing management development and personnel improvement programs. The modern
times and the fore sight in the future ask for complementary host of technology advancement and unending approach towards training options from the
Manufacturing sector of India.
Some of the best practices that are prevalent in Indian Manufacturing Sector that we have come across during this study are:
• EMPLOYEE ENGAGEMENT: Employee engagement, also called worker engagement, is a business management concept. An "engaged employee" is one
who is fully involved in, and enthusiastic about their work, and thus will act in a way that furthers their organization's interests. According to Scarlett
Surveys, "Employee Engagement is a measurable degree of an employee's positive or negative emotional attachment to their job, colleagues and
organization that profoundly influences their willingness to learn and perform is at work". Thus engagement is distinctively different from employee
satisfaction, motivation and organizational culture. The highly productive and the most reputed companies across the world have understood the fact that
it was employee engagement that made them stand apart from all other companies. In India different Manufacturing companies had taken different
initiatives to enhance the level of engagement among employees towards their jobs and the organization. Some offer custom-made incentives while some
stick to provide extra facilities like crèche for kids, schools for children of employees, pick and drop, provision of food, movie tickets and many other things.
Each company has its own reasons to establish a specific type of reward-motivation programme depending upon their financial status, region in which they
are operating and level which they function at and the backgrounds of the employees. In the year 2005, an annual study conducted by the research arm of
Kenexa, a leading global HR solution provider, revealed that most of the Indian Manufacturing companies have miles to cover in order to achieve what
global companies have done already when it comes to employee engagement and effective leadership. However at the same time there are manufacturing
giants like Mahindra and Mahindra, Tata, etc which are surprisingly stand apart from rest of the Indian Manufacturing Organizations and International
players too when it comes to employee recognition, emphasis of improvement of quality, show of genuine responsibility of organization towards
employees and opportunities to grow.
• EMPLOYEE DEVELOPMENT: Employee development is a joint, on-going effort on the part of an employee and the organization for which he or she works
to upgrade the employee's knowledge, skills, and abilities. Successful employee development requires a balance between an individual's career needs and
goals and the organization's need to get work done. Several Indian Manufacturing organizations are engaged in many employee development programs
thorough which they cater the potential of their human resource in making positive contributions to organizational performance. A more highly-skilled
workforce can accomplish more and a supervisor's group can accomplish more as employees gain in experience and knowledge. Many Indian
manufacturing organizations are missing out on a continuous effort of staying in touch with employees to ensure that there is the right culture to engage
them in consistent performance improvement. However the big manufacturing giants like Tata Steel have well-established and effective arrangements at
each business location for transparent communication and consultation with Works Councils and Trade Union representatives. Further, the Big
Manufacturing Companies have always registered steady quality improvement and productivity enhancement through dedicated efforts of their
Company’s Performance Improvement teams, focused on technical best practice transfer and the value of knowledge networks.
Giants like Apollo tyres and Jindal sons have taken huge steps towards the well-being of their employees. They have put into practice many initiatives, events
and programmes that have helped to create not only an enduring loyalty amongst employees but also enabled them to have a more fulfilled life. As per the
survey conducted by students of Amity University’s Management programme in 2009 in Tata Steel distribution and processing plan, the Tata Steel's Performance
Management System has the following aims:
� Align the activities and behavior of the workforce with company values and objectives
� Assess the performance of individuals comprehensively and fairly
� Develop the capabilities of employees to enhance performance
� Develop corporate culture
� Enhance line management relationships
Which clearly shows that when most of the Indian Manufacturing organizations are ignoring the importance of Employee Development, they major Indian
players in Indian Manufacturing Industry know the importance of continuous development of the human potential and they are cashing in every effort to
enhance and capitalize the potential of their work force.
• PERFORMANCE MANAGEMENT: Human beings have immense potential, skills and strength which should not go waste. Proper and effective tapping of the
Human potential is immensely necessary to achieve the effective utilization of human resource. Recognizing the importance of the most valuable asset of
an organization i.e. their employees, the Indian Manufacturing firms have devised various management strategies to capitalize and further enhance the
human potential. The Performance Management System ensures that performance and achievement do not go unnoticed. It provides an opportunity to
the employees to monitor their progress and develop into complete professionals. The cornerstone of their Performance Management System is the
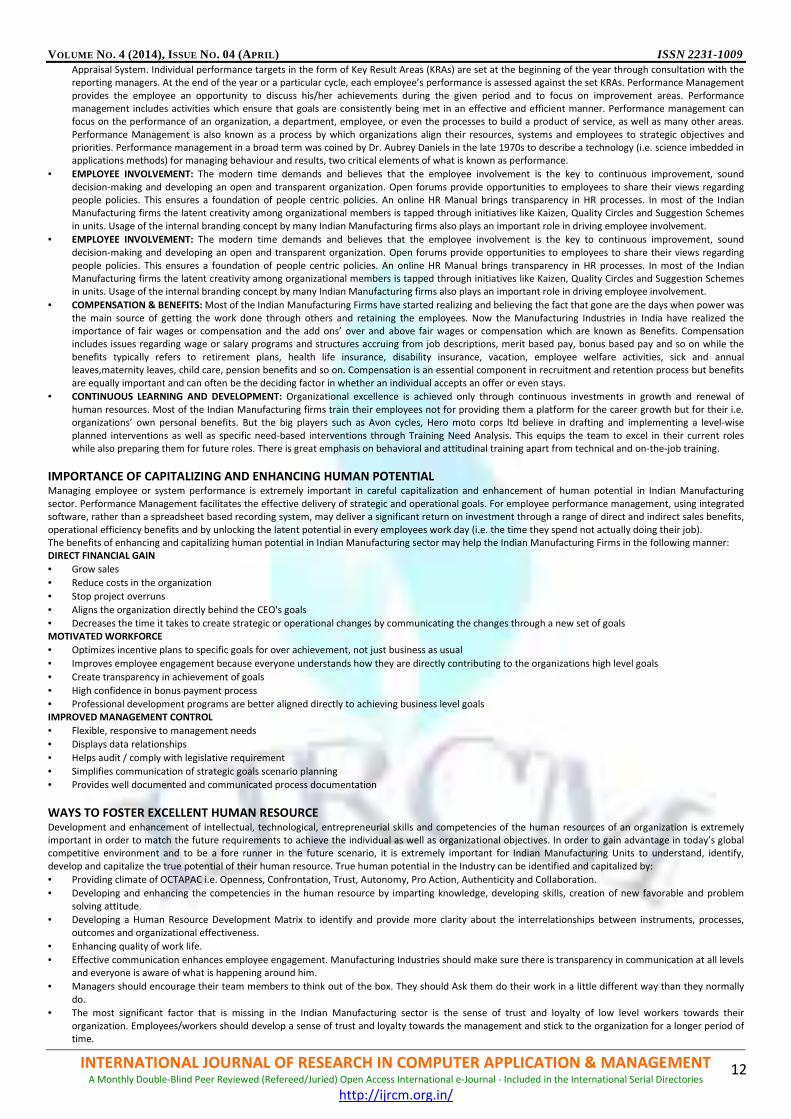
VOLUME NO. 4 (2014), ISSUE NO. 04 (APRIL) ISSN 2231-1009
INTERNATIONAL JOURNAL OF RESEARCH IN COMPUTER APPLICATION & MANAGEMENT A Monthly Double-Blind Peer Reviewed (Refereed/Juried) Open Access International e-Journal - Included in the International Serial Directories
http://ijrcm.org.in/
12
Appraisal System. Individual performance targets in the form of Key Result Areas (KRAs) are set at the beginning of the year through consultation with the
reporting managers. At the end of the year or a particular cycle, each employee’s performance is assessed against the set KRAs. Performance Management
provides the employee an opportunity to discuss his/her achievements during the given period and to focus on improvement areas. Performance
management includes activities which ensure that goals are consistently being met in an effective and efficient manner. Performance management can
focus on the performance of an organization, a department, employee, or even the processes to build a product of service, as well as many other areas.
Performance Management is also known as a process by which organizations align their resources, systems and employees to strategic objectives and
priorities. Performance management in a broad term was coined by Dr. Aubrey Daniels in the late 1970s to describe a technology (i.e. science imbedded in
applications methods) for managing behaviour and results, two critical elements of what is known as performance.
• EMPLOYEE INVOLVEMENT: The modern time demands and believes that the employee involvement is the key to continuous improvement, sound
decision-making and developing an open and transparent organization. Open forums provide opportunities to employees to share their views regarding
people policies. This ensures a foundation of people centric policies. An online HR Manual brings transparency in HR processes. In most of the Indian
Manufacturing firms the latent creativity among organizational members is tapped through initiatives like Kaizen, Quality Circles and Suggestion Schemes
in units. Usage of the internal branding concept by many Indian Manufacturing firms also plays an important role in driving employee involvement.
• COMPENSATION & BENEFITS: Most of the Indian Manufacturing Firms have started realizing and believing the fact that gone are the days when power was
the main source of getting the work done through others and retaining the employees. Now the Manufacturing Industries in India have realized the
importance of fair wages or compensation and the add ons’ over and above fair wages or compensation which are known as Benefits. Compensation
includes issues regarding wage or salary programs and structures accruing from job descriptions, merit based pay, bonus based pay and so on while the
benefits typically refers to retirement plans, health life insurance, disability insurance, vacation, employee welfare activities, sick and annual
leaves,maternity leaves, child care, pension benefits and so on. Compensation is an essential component in recruitment and retention process but benefits
are equally important and can often be the deciding factor in whether an individual accepts an offer or even stays.
• CONTINUOUS LEARNING AND DEVELOPMENT: Organizational excellence is achieved only through continuous investments in growth and renewal of
human resources. Most of the Indian Manufacturing firms train their employees not for providing them a platform for the career growth but for their i.e.
organizations’ own personal benefits. But the big players such as Avon cycles, Hero moto corps ltd believe in drafting and implementing a level-wise
planned interventions as well as specific need-based interventions through Training Need Analysis. This equips the team to excel in their current roles
while also preparing them for future roles. There is great emphasis on behavioral and attitudinal training apart from technical and on-the-job training.
IMPORTANCE OF CAPITALIZING AND ENHANCING HUMAN POTENTIAL Managing employee or system performance is extremely important in careful capitalization and enhancement of human potential in Indian Manufacturing
sector. Performance Management facilitates the effective delivery of strategic and operational goals. For employee performance management, using integrated
software, rather than a spreadsheet based recording system, may deliver a significant return on investment through a range of direct and indirect sales benefits,
operational efficiency benefits and by unlocking the latent potential in every employees work day (i.e. the time they spend not actually doing their job).
The benefits of enhancing and capitalizing human potential in Indian Manufacturing sector may help the Indian Manufacturing Firms in the following manner:
DIRECT FINANCIAL GAIN
• Grow sales
• Reduce costs in the organization
• Stop project overruns
• Aligns the organization directly behind the CEO's goals
• Decreases the time it takes to create strategic or operational changes by communicating the changes through a new set of goals
MOTIVATED WORKFORCE
• Optimizes incentive plans to specific goals for over achievement, not just business as usual
• Improves employee engagement because everyone understands how they are directly contributing to the organizations high level goals
• Create transparency in achievement of goals
• High confidence in bonus payment process
• Professional development programs are better aligned directly to achieving business level goals
IMPROVED MANAGEMENT CONTROL
• Flexible, responsive to management needs
• Displays data relationships
• Helps audit / comply with legislative requirement
• Simplifies communication of strategic goals scenario planning
• Provides well documented and communicated process documentation
WAYS TO FOSTER EXCELLENT HUMAN RESOURCE Development and enhancement of intellectual, technological, entrepreneurial skills and competencies of the human resources of an organization is extremely
important in order to match the future requirements to achieve the individual as well as organizational objectives. In order to gain advantage in today’s global
competitive environment and to be a fore runner in the future scenario, it is extremely important for Indian Manufacturing Units to understand, identify,
develop and capitalize the true potential of their human resource. True human potential in the Industry can be identified and capitalized by:
• Providing climate of OCTAPAC i.e. Openness, Confrontation, Trust, Autonomy, Pro Action, Authenticity and Collaboration.
• Developing and enhancing the competencies in the human resource by imparting knowledge, developing skills, creation of new favorable and problem
solving attitude.
• Developing a Human Resource Development Matrix to identify and provide more clarity about the interrelationships between instruments, processes,
outcomes and organizational effectiveness.
• Enhancing quality of work life.
• Effective communication enhances employee engagement. Manufacturing Industries should make sure there is transparency in communication at all levels
and everyone is aware of what is happening around him.
• Managers should encourage their team members to think out of the box. They should Ask them do their work in a little different way than they normally
do.
• The most significant factor that is missing in the Indian Manufacturing sector is the sense of trust and loyalty of low level workers towards their
organization. Employees/workers should develop a sense of trust and loyalty towards the management and stick to the organization for a longer period of
time.

VOLUME NO. 4 (2014), ISSUE NO. 04 (APRIL) ISSN 2231-1009
INTERNATIONAL JOURNAL OF RESEARCH IN COMPUTER APPLICATION & MANAGEMENT A Monthly Double-Blind Peer Reviewed (Refereed/Juried) Open Access International e-Journal - Included in the International Serial Directories
http://ijrcm.org.in/
13
• A nine driver approach of employee effectiveness should be taken by the Indian Manufacturing Sector to engage and enable employees. The nine drivers
are clarity and direction, confidence in leaders, quality and customer focus, respect and recognition, compensation and benefits, performance
management, authority and empowerment, cooperation, and structure, work and processes.
• A 360 Degree Feedback System of performance appraisal should be used in the manufacturing organizations as it provides senior managers with valuable
inputs through assessment from their colleagues, subordinates and internal as well as external customers. This enables the management to prepare their
employee's individual development plans by understanding their potential, interests and goals.
• Assessment and development centres should be brought into reality: Assessment and Development Centres provide organizations with a huge amount of
useful and validated data about the potential of new recruits or the performance and development needs of existing employees. Setting up of these
centres involves the identification and designing of multiple assessment processes for a group of participants. Assessment and Development Centres are
considered the most effective tool for identifying future managers. They help an organisation to promote and hire the best resources by evaluating their
knowledge, behavioural traits, skills and competencies. An assessment centre is basically a series of assessments carried out using several techniques like
simulation, psychometric test and exercises to take critical decisions like selective or rejecting a candidate for recruitment, for promotions and appraisals
etc. There are some basic considerations for running an assessment centres which is the corporate adaptation of an army process. Assessment centres
need to have clearly defined competencies with behavioural indicators and scales for evaluation and the techniques used for assessment should assess
these very competencies and behaviours. No other competency or behaviour apart from the one identified earlier, however profound, is evaluated. There
are several techniques used and multiple assessors are involved to assess candidates in different simulation and exercises.Simulations exercises are an
integral part of both assessment and development centres. They basically are situations, exercises and conditions which imitate the real life working
scenario of the assessee. They find a special place in assessments because they allow opportunities to observe and assess the assessee’s behaviour
pertaining to each job related competency. Examples of simulations include group exercises, in-basket exercises, structured interviews, presentations, and
fact-finding exercises. Development Centres and assessment centres are often confused as being the same as they use the same techniques to evaluate
employees. But there are certain clear differences between them. A development centre like an assessment centre uses assessment techniques like
simulation, psychometrics etc, but the purpose of it is totally different. A development centre as the name suggests is conducted only for the
developmental purposes of the employees. It is conducted to assess potential, to identify strengths and development needs and the end result is a well
documented individual development plan for each participant. The Development Centre can be as long as 3 days where each day the participants undergo
simulation exercises. It also, has a pre defined competencies and behaviours as reference point which are assessed during assessments but unlike
assessment centres feedback is an important component of development centres. During assessment centres it is only the decision that is shared with the
candidates but in the development centre, the candidate is provided feedback after every exercise and towards the closing of the development centre an
elaborate feedback session may be conducted which lays the foundation for the development of an individual development plan for the participant. As the
spirit of a development centre is to create an open and transparent atmosphere for learning, mistakes are not treated negatively but are looked upon as
learning opportunities by both assessors and assessee. The role of the assessors in the development centre also becomes larger as they now have to also
play the part of learning partner with the assessee. They are more open to hear the assessee and help them realize and explore their areas of strengths and
development. A development centre when used in the organization has a greater acceptability amongst the employees as it is seen as a non-threatening
and objective assessment of development areas. Involvement and buy in of line managers can be beautifully integrated in the development centre process
by sharing information with them regarding the performance of their subordinates or team members and seeking their feedback about the participants on
their on the job performance. This creates a partnership which is crucial for the individual development plan created after development centre to be acted
out and the goals outlined, achieved.
• Indian Manufacturing Firms needs to be proficient in developing the Continuous learning and development of their human resource. The employees in
Manufacturing Units should keep current with new work methods, skills and technologies to complete work activities take ownership for own-self
development.
• Indian Manufacturing Organizations should apply learning from past experiences to current and future work activities in order to tap capitalize and
enhance the potential of their most valuable asset i.e. THE HUMAN RESOURCE.
CONCLUSION On the basis of the study it is concluded that People, if managed properly can be the organization’s greatest competitive edge. Unlocking human talent is vital
for the success and sustainability of any organization. The productivity, quality and financial performance of Indian Manufacturing Firms depends upon how well
the firms manage and tap the immense potential of their human resources. Employees possessing high value and unique human capital significantly contribute
to generate intellectual products which support the Manufacturing firms to achieve competitive advantage in this age of global competition. This study
empirically explained the patterns through which Indian manufacturing employees perceived human capital development from firms’ investment on HR
practices . These investment methods were reward strategy to reinforce employees’ consistent innovative behaviors, career-oriented training to advance
employees’ career within the firm, performance appraisal to improve required skills of employees, recruitment strategy to increase the stock of the human
capital, career management to improve developmental behaviors of employees, and performance-oriented training to develop skills and knowledge of
employees.
ACKNOWLEDGEMENT Our endeavor shall be incomplete without the acknowledgement to all those personalities who have extended full co-operation and valuable assistance to us in
making this research paper a reality. We would thus, like to take this opportunity to convey our deepest feelings of gratitude to all for giving this research paper
the final and desired shape. Our families, some untold friends and our teachers have always been a support and source of great inspiration.
REFERENCES 1. http://74.125.153.132/search?q=cache:21XhIeAbNc0J:www1.ximb.ac.in/users/fac/Snigdha/snigdha.nsf/dd5cab6801f1723585256474005327c8/35f3a2297
bb5359e65256c3a0031f3e0/%24FILE/Assignment%2520%2520EICHER.ppt+HR+Practices+in+indian+manufacturing+Industry&cd=2&hl=en&ct=clnk&gl=in&
client=firefox-a, Viewed on January, 2013.
2. http://articles.economictimes.indiatimes.com/keyword/employee-engagement, Viewed on February, 2013.
3. http://web.mit.edu/reeng/www/hrpd/design/elements.html, Viewed on January, 2013.
4. Management Today Magazine February 2005, Viewed on January, 2013.
5. www . raymond india.com/jnus_ hr .asp, Viewed on January, 2013.
6. www.chillibreeze.com/articles_various/hurdles-faced-by-hr-1211.asp, Viewed on February, 2013.
7. www.citehr.com, Viewed on January, 2013.
8. www.delhibusinessreview.org/V_13n1/v13n1e.pdf, Viewed on February, 2013.
9. www.isb.edu/isb/File/ISBInsight_Volume9Issue3.pdf, Viewed on January, 2013.
10. www.jklakshmi.com/ hr practices .html, Viewed on January, 2013.
11. www.kellyservices.co.in/WorkArea/DownloadAsset.aspx?id... Viewed on February, 2013.
12. www.managementparadise.com/forums/publish-uploadproject-download-reference-project/126017-hr-practice-autocomponent-manufacturing-industry.
html, Viewed on January, 2013.
13. www.managementstudyguide.com, Viewed on February, 2013.

VOLUME NO. 4 (2014), ISSUE NO. 04 (APRIL) ISSN 2231-1009
INTERNATIONAL JOURNAL OF RESEARCH IN COMPUTER APPLICATION & MANAGEMENT A Monthly Double-Blind Peer Reviewed (Refereed/Juried) Open Access International e-Journal - Included in the International Serial Directories
http://ijrcm.org.in/
14
14. www.managementstudyguide.com/employee-engagement.htm, Viewed on February, 2013.
15. www.shrm.org › SHRM › Publications › HR Magazine, Viewed on February, 2013.
16. www.siu.edu.in/Research/pdf/Soumi_Rai_2011FM.pdf, Viewed on February, 2013.
17. www.slideshare.net/JCSI/measuring-hr-developing-yourrecruitment-metrics, Viewed on January, 2013.

VOLUME NO. 4 (2014), ISSUE NO. 04 (APRIL) ISSN 2231-1009
INTERNATIONAL JOURNAL OF RESEARCH IN COMPUTER APPLICATION & MANAGEMENT A Monthly Double-Blind Peer Reviewed (Refereed/Juried) Open Access International e-Journal - Included in the International Serial Directories
http://ijrcm.org.in/
15
IMPACT OF E-TRUST ON E-LOYALTY
DR. ANDAL AMMISETTI
ASST. PROFESSOR
KING SAUD UNIVERSITY
RIYADH
ABSTRACT Though online retailing is evolving at an unprecedented rate, participants at all levels still exhibit a fundamental lack of trust. It is noted by many academicians
that “difficulty of use and lack of trust with respect to online payment, privacy and customer service have been found to constitute a real psychological barrier to
e-commerce”. It is widely felt, therefore, that the importance of trust in the e-business exchange deserves special attention. Retailers can build mutually valuable
relationships with customers through a trust-based collaboration process (Dayal et al., 2001). However, the way in which trust may be gained and the impact it
has on e-business outcomes are not yet well understood (Jones et al., 2000). Factors relating to trust in online retailing have been seen from many different
perspectives by researchers from different disciplines, and often expressed in different terms. There is a need for a common framework that will support a shared
understanding of the concept of trust and its relations with itsantecedents and consequences.The present study aims at understanding factors that influence
electronic trust(e-trust) and impact of those variables on electronic loyalty(e-loyalty).
KEYWORDS E-Loyalty, E-Retailing, E-Trust, Online Customers, Online shopping.
1. INTRODUCTION onsumer trust of Internet vendors is a major factor influencing the success of e-commerce. To enhance consumer trust, many e-retailers are
experimenting with various trust-building strategies, including participation in third-party assurance programs. Many researchers proved that there is a
positive relationship between third-party assurance seals, trust, and online purchasing intentions.
Various researchers have suggested that online customers’ trust will positively influence their adoption of internet to search for information and subsequently,
their intention to purchase online. With a greater degree of trust in the online retailer, customers are more willing to make online purchases (Jarvenpaa et al.,
1999; Novaket al., 1999; Stratford, 1999; Sultan et al., 1999; Gefen and Straub, 2001). Hoffman et al.(1996) argued that the likelihood of customers’ preferential
usage of the internet to buy products over traditional physical stores is influenced by the amount of customer trust concerning the delivery of goods and use of
personal information. Theory suggests that these outcomes of trust and commitment promote relationship marketing success (Morgan and Hunt, 1994). Thus, it
proves that there is a positive relationship between electronic trust and e-store loyalty.
2. REVIEW OF LITERATURE Avinandan Mukherjee, Montclair, and Prithwiraj Nath (2007),in their article entitled Role of electronic trust in online retailing: A re-examination of the
commitment-trust aim to re-examine the commitment-trust theory (CTT) of relationship marketing in the online retailing context. They found both privacy and
security to have significant impacts on trust and commitment. Their study confirms that trust significantly affects customers’ intention to engage in online retail
transaction. The research also throws new light on the impact of relationship benefits and termination costs on commitment. Finally, they demonstrate the
superiority of their proposed model when compared to an alternative base model.
The study concludes that the commitment-trust theory of relationship marketing can be applied successfully in the online retailing context, with few
enhancements specific to the context like online privacy and security. They demonstrate how trust can be developed through creating perceptions of shared
values, privacy, security, and communication in online retailing. The behavioural intentions of online retail customers depend on perceived trust and
commitment. The issue of trust is therefore increasingly recognized as a critical success factor in the emerging retail “marketspace”.
Kimery, Kathryn M,McCord, Mary (2002),in their article entitledThird-party assurances: Mapping the road to trust in e-retailing advocate that consumer trust of
Internet vendors is a major factor influencing the success of e-commerce. To enhance consumer trust, many e-retailers are experimenting with various trust-
building strategies, including participation in third-party assurance programs. Their study presents a model describing the relationship between third-party
assurance seals, trust, and online purchasing intentions. Contrary to early studies, post hoc results reveal that one seal type, the privacy assurance seal, did have
a small, but significant, positive impact on consumer trust of an unfamiliar e-retailer.
Damon Aiken and David M. Boush (2006), in their atyicle entitledTrust marks, Objective-Source Ratings, and Implied Investments in Advertising: Investigating
OnlineTrust and the Context-Specific Nature of Internet Signals tried to provide a preliminary investigation of the effectiveness of Internet marketers’ various
attempts to develop consumer trust through Web signals. The work is an exploration of the context-specific nature of trust in e-commerce. An online
experiment compares three potential signals of trust in an Internet retail firm: (1) a third-party certification (i.e., a “trust mark”), (2) an objective-source rating
(i.e., a review from Consumer Re-ports magazine), and (3) an implication of investment in advertising (i.e., a television advertisement to air during the Super
Bowl). The trust mark had the greatest effect on perceived trustworthiness, influencing respondents’ beliefs about security and privacy, general beliefs about
firm trustworthiness, and willingness to provide personal in-formation. The relationship between Internet experience and trust was. in the form of an inverted
U.
For the present study the questionnaire used by Avinandan Mukherjee, Montclair, and Prithwiraj Nath (2007),in their article entitled ‘Role of electronic trust in
online retailing: A re-examination of the commitment-trust’ is taken as a basis for understanding the impact of e-trust factors on e-loyalty.
3. IMPORTANCE OF THE STUDY Gommans et al. (2001) offered a conceptual framework for e-loyalty (which remains untested), in which the authors suggest five elements that contribute to an
online consumer’s choice to revisit or repeat purchase at the site of an online vendor. Attitudes, behaviors, and behavioral intentions are proposed to underpin
e-loyalty. More specifically, the e-loyalty framework includes: the value proposition (i.e. product customization, product quality and choice, pricing, and brand
recognition); brand building (i.e. brand building and community building); trust and security (i.e. evidence of third party approval, privacy, company reputation,
and reliability); customer service (i.e. quick response to customer enquiries, ease of making contacts, easy payment options, or fast delivery); and finally website
and technology (i.e. ease of navigation, personalized features, design for targeted customers segments, language options, effective search functions).Present
study attempts to understand the role of trust factors in building e-loyalty.
4. OBJECTIVES OF THE STUDY The study primarily aims at determining the factors that influence trust of online shoppers and understand how each trust factor influences Internet store
loyalty.
1. Understand the factors that influence Electronic Trust in online shopping.
2. And study the impact of E-trust factors on E-Loyalty.
C

VOLUME NO. 4 (2014), ISSUE NO. 04 (APRIL) ISSN 2231-1009
INTERNATIONAL JOURNAL OF RESEARCH IN COMPUTER APPLICATION & MANAGEMENT A Monthly Double-Blind Peer Reviewed (Refereed/Juried) Open Access International e-Journal - Included in the International Serial Directories
http://ijrcm.org.in/
16
5. RESEARCH METHODOLOGY OF THE STUDY The data has been collected from various sources. The primary data was collected through structured questionnaire and it was filled by 754 randomly selected
respondents. Secondary data was collected from various published and unpublished research papers, articles, papers and books.
6. RESULTS AND FINDINGS Though online retailing is evolving at an unprecedented rate, participants at all levels still exhibit a fundamental lack of trust. Many researchers noted that
“difficulty of use and lack of trust with respect to online payment privacy and customer service have been found to constitute a real psychological barrier to e-
commerce”. It is widely felt, therefore, that the importance of trust in the e-business exchange deserves special attention. Retailers can build mutually valuable
relationships with customers through a trust-based collaboration process.
The overall environment of perceived insecurity on the internet provide unique challenges to online retailers to find ways in which to initiate and develop e-
business relationships (Warrington et al., 2000). The popular press is replete with news on high-profile lapses in online security, increased incidence of
spamming, hacking, and “phishing”, and figures suggesting that a large proportion of online “business” is fraudulent. Consumer concerns include a range of
possibilities from fraud through the hacking of credit card numbers to leaking of personal information, resulting in excessive spam to identity theft (Newholm et
al., 2004). In spite of these challenges, the retailer must develop a trustworthy relationship in order to increase sales on the internet and foster customer loyalty.
TABLE 1: IMPACT OF TRUST FACTORS ON INTERNET STORE LOYALTY (Based on Mean Scores)
Sl. No. Electronic Trust Factors Mean Scores
1. Reputation of the brand, company or e-retailer 4.4443
2. Size of the e-retailer 4.4284
3. Offline presence 4.4350
4. Third party assurance seals 4.4390
5. Professionalism in web design 4.4708
6. Protection of identifiable information 4.4271
7. Safety of credit card or financial information 4.4085
It is clear from the Table 1 that all the seven dimensions of Customer Trust do have a great impact on e-Loyalty. The results are expected, as trust is an essential
component of all successful buyer-seller relationships. Physical separation of the buyer and seller, and that of the buyers and the merchandise contributes to the
significance of electronic trust.
REPUTATION OF THE BRAND, COMPANY OR E-RETAILER ON E-LOYALTY
Customer confidence arises from the online retailer’s reputation, which is defined as faith in overall quality or character as seen or judged by people ingeneral
(Malaga, 2001). Confidence also arises from the strength of the brand name, endorsement from trusted third parties, and previous interactions on- and/or
offline(Egger, 2000). Ba (2001) concluded that when customers feel low on confidence about an online retailer, they would be discouraged from purchasing from
that website. For gaining confidence, customers also assess the abilities of the retailer, which are based on the skills and competencies that the retailer
possesses in electronic transactions (Leeand Turban, 2001)
Table 2 and 3 reveal that majority of e-shoppers give great importance to the reputation and perceived size of e-retailer. They opined that brand name,
company image and the size of the company do play a vital role in their trust and commitment towards an e-site.
TABLE 2: REPUTATION OF THE BRAND, COMPANY OR E-RETAILER ONE-LOYALTY
Particulars Number of Respondents Percentage of respondents
Moderate 115 15.3
Considerable impact 189 25.1
Great Impact on loyalty 450 59.7
Total 754 100.0
TABLE 3: IMPACT OF SIZE OF THE E-RETAILER ON E-LOYALTY
Particulars Number of Respondents Percentage of respondents
Moderate 122 16.2
Considerable impact 187 24.8
Great Impact on loyalty 445 59.0
Total 754 100.0
IMPACT OF OFFLINE PRESENCE OF E-RETAILER ON E-LOYALTY
Some retail companies use virtual stores as a complementary service to their ‘bricks-and-mortar’ stores. For example, using personal client databases, new
technologies enable merchants to direct their clients to certain items that are likely to be of interest to a particular shopper. In addition, with a single click a
shopper can be put in contact with a human agent who, via voice and image, can attend to the precise needs of a particular client. In effect, new technology
enables an online store to undertake ‘micro-merchandising’. In this way, the web pages that constitute the Internet site of a company can become,
simultaneously, a point of sale and a source of information. Used in a complementary fashion, an online shop and a physical shop can thus enhance each other
through cross-promotions, logistical services, supply services, and other forms of value-added service (Steinfield and Whitten, 1999). Table 4 reveals that more
than 50% of the respondents opined that Offline presence of a e-retailer has impact on their e-loyalty.
TABLE 4: IMPACT OF OFFLINE PRESENCE OF E-RETAILER ON E-LOYALTY
Particulars Number of Respondents Percentage of respondents
Moderate 112 14.9
Considerable impact 202 26.8
Great Impact on loyalty 440 58.4
Total 754 100.0
IMPACT OF THIRD PARTY ASSURANCE SEALS ON E-LOYALTY
Kimery, Kathryn M, McCord, Mary (2002),in their article entitledThird-party assurances: Mapping the road to trust in e-retailing advocate that consumer trust of
Internet vendors is a major factor influencing the success of e-commerce. To enhance consumer trust, many e-retailers are experimenting with various trust-
building strategies, including participation in third-party assurance programs. Their hypotheses addressing a positive relationship between the viewing of
assurance seals and consumer trust of a specific e-retailer are not supported. Contrary to early studies, post hoc results reveal that one seal type, the privacy
assurance seal, did have a small, but significant, positive impact on consumer trust of an unfamiliar e-retailer. Contrary to the results of the above study, Table 5
reveals that around 60 per cent of the respondents accept that third party assurance seals have an impact on their internet store loyalty. This can be attributed
to the fact that still many Indians have lot of apprehensions towards e-shopping. In the years to come, when e-retailing gets accepted by many the phenomenon
may change.

VOLUME NO. 4 (2014), ISSUE NO. 04 (APRIL) ISSN 2231-1009
INTERNATIONAL JOURNAL OF RESEARCH IN COMPUTER APPLICATION & MANAGEMENT A Monthly Double-Blind Peer Reviewed (Refereed/Juried) Open Access International e-Journal - Included in the International Serial Directories
http://ijrcm.org.in/
17
TABLE 5: IMPACT OF THIRD PARTY ASSURANCE SEALS ON E-LOYALTY
Particulars Number of Respondents Percentage of respondents
Moderate 118 15.6
Considerable impact 187 24.8
Great Impact on loyalty 449 59.5
Total 754 100.0
IMPACT OF PROFESSIONALISM IN WEB DESIGN ON E-LOYALTY
Customers’ trust in the technology of electronic communication and the internet is frequently a proxy for their trust in an online retailer. Their trust in
technology is likely to correlate with their overall trust when engaging in online activities (Lee and Turban,2001). Customers with different levels of trust in
technology use various performance measures such as speed, reliability, availability, navigability, order fulfillment, and customization to determine their trust in
electronic transactions (Lee and Turban,2001). Technology-based trust influences the perceived reliability of the system. Table 6 reveals that a site which is
professionally designed has a great impact on e-loyalty. Respondents opined that an aesthetically pleasing web site design attracts them and it generates
pleasurable feelings that are associated with the online experience.
TABLE 6: IMPACT OF PROFESSIONALISM IN WEB DESIGN ON E-LOYALTY
Particulars Number of Respondents Percentage of respondents
Moderate 106 14.1
Considerable impact 187 24.8
Great Impact on loyalty 461 61.1
Total 754 100.0
IMPACT OF PROTECTION OF IDENTIFIABLE INFORMATION ON E-LOYALTY
Privacy of personal information is a major concern for online consumers. Supplying contact information to an online merchant could result in spam and
telemarketing. Many merchants promise not to use consumer information for these purposes, or adopt a mechanism to opt-out of such contacts. If the retailer
does not it will be an issue of concern. Figures in Table 7advocate that E-retailers need to assure their customers that they have an acceptable privacy policy and
they will not share private information with others without consent.
TABLE 7: IMPACT OF PROTECTION OF IDENTIFIABLE INFORMATION ON E-LOYALTY
Particulars Number of Respondents Percentage of respondents
Moderate 122 16.2
Considerable impact 188 24.9
Great Impact on loyalty 444 58.9
Total 754 100.0
IMPACT OF SAFETY OF CREDIT CARD OR FINANCIAL INFORMATION
Though online retailing is evolving at an unprecedented rate, participants at all levels still exhibit a fundamental lack of trust. Many researchers noted that
“difficulty of use and lack of trust with respect to online payment privacy and customer service have been found to constitute a real psychological barrier to e-
commerce”. It is widely felt, therefore, that the importance of trust in the e-business exchange deserves special attention. Table 8 reveals that majority of e-
shoppers prefer being committed to those e-shopper who assure them of safety of credit card or financial information.
TABLE 8: IMPACT OF SAFETY OF CREDIT CARD OR FINANCIAL INFORMATION ON E-LOYALTY
Particulars Number of Respondents Percentage of respondents
Moderate 126 16.7
Considerable impact 194 25.7
Great Impact on loyalty 434 57.6
Total 754 100.0
7. CONCLUSIONS AND RECOMMENDATIONS Based on the results it can be concluded that both trust and commitment have a significant influence on customers’ behavioural intentions. A customer who
trusts an online retailer shall give positive recommendations to others. Hence, positive relationship is found to exist between trust, commitment and word of
mouth. A trusting customer will always consider to buy from the website. Hence, trust and commitment have significant positive influence on the purchase
intentions of the customer. Higher trust and commitment also promote continued interaction between the online retailer and the buyer.
Consumer concerns include a range of possibilities from fraud through the hacking of credit card numbers to leaking of personal information, resulting in
excessive spam to identity theft (Newholm et al., 2004). In spite of these challenges, the retailer must develop a trustworthy relationship in order to increase
sales on the internet and foster customer loyalty.
TABLE 9: CHI-SQUARE TEST STATISTICS ON IMPACT OF TRUST ON INTERNET STORE LOYALTY
1.RepER 2.SizeER 3.Offline 4.Ass.se 5.Prof 6.Prot.Inf 7.Cr.card
Chi-Square(a) .008 .511 1.389 .092 .931 .535 1.884
df 2 2 2 2 2 2 2
Asymp. Sig. .996 .774 .499 .955 .628 .765 .390
Note: Small significance values (<.05) indicate that the observed distribution does not conform to the hypothesized distribution
Test statistics reveal that significance values for the seven items are >.05, which indicate that the observed distribution does conform to the hypothesized
distribution. Hence it can be inferred that null hypotheses ‘H0 Customer Trust has a positive impact on Internet Store Loyalty’ sustains.
RECOMMENDATIONS TO BUILD E-TRUST
Present study revealed that all the seven constructs included as antecedents to customer trust have great impact on e-loyalty. Here are some suggestions for
building e-trust based on the study results and noted contributions of academicians and researchers.
First, generating confidence in websites through endorsement by celebrities and trust in technological features has significant impact in building consumer trust
towards a website (Avinandan Mukherjee. 2007). Developing reputation of the online retail brand acts as assurance to the customers (Jarvenpaa et al., 1999;
Stratford, 1999). The best way to create customer confidence is through third party endorsement. This is more significant if the third party is a peer consumer (Li
et al., 2001). This has immense implications for commercial retail website design and long-term internet retailing strategies.
Second, privacy is found to be the most important determinant of trust. Co-operative interaction between the customer and the online retailer (Li et al., 2001;
Novak et al.,1999), and use of privacy programmes (Li et al., 2001) can improve the trustworthiness of the website. A consumer visiting a website will expect
clear guidelines on consumer privacy on non-disclosure of private information and receiving unsolicited e-mails.

VOLUME NO. 4 (2014), ISSUE NO. 04 (APRIL) ISSN 2231-1009
INTERNATIONAL JOURNAL OF RESEARCH IN COMPUTER APPLICATION & MANAGEMENT A Monthly Double-Blind Peer Reviewed (Refereed/Juried) Open Access International e-Journal - Included in the International Serial Directories
http://ijrcm.org.in/
18
Third, perceived security is found to be the crucial factor in building trust. Customers are more willing to provide information and make purchases online with
higher perceived security (Ackerman et al., 1999). While credit card brands and web-based seals of approval provide security, it has been found that web-based
security seals such as the Better Business Bureau, Verisign, and TRUSTe, which are recognised by customers, are more effective than credit card logos (Jarvenpaa
et al.,1999; Stratford, 1999). Security perceptions can be enhanced through explicitly mentioning the use of encryption (Stratford, 1999). Guarantee of online
transactions by major financial institutions or vendors increases customers’ trust (Rutter, 2000), which encourages them to engage in online information search
and purchase.
Fourth, Communication or online contact has greater significance in building online customer trust. Avinandan Mukherjee (2007) study showed communication
between the online retailer and its users is a significant determinant of consumer trust. A greater number of links with other established websites and the
presence of a virtual advisor (Sultan et al., 1999; Jarvenpaa et al., 1999) can improve communication and reinforce consumer trust. In addition, integrating
human assistants into web systems is a way to provide efficient user support and increase online customers’ trust in a retailer (Aberg and Shahmehri, 2001).
Lastly, Offline Presence makes the customers assured that the online retailers are not only available online but offline as well. This gives them the psychological
comfort that these companies can be relied upon.
8. LIMITATIONS OF THE STUDY The study is based on a sample of Indian Internet shoppers mostly comprised of software professionals. To increase generalisability, the study should be
replicated with samples drawn from other populations. Such replications will allow firmer conclusions to be drawn concerning the relationships examined in this
study. Future research should address this issue. Secondly, additional variable measuring individual differences (e.g., variety seeking behaviour and expectations)
need to be identified and included in future research designs. Lastly, using a 5-point Likert-type scale with a neutral or fence-sitting position option can distort
preferences when ambivalent feelings exist about the question or item.
9. SCOPE FOR THE FUTURE RESEARCH To improve the sample and the chances of surveying more consumers in the Internet population, future researchers might consider obtaining a national random
sample. Majority of the respondents for the chosen study are aged around 20-35 years. Expanding the sample to other generations would allow
intergenerational comparisons to be made. Future research could explore the impact of variables such as personality traits on the customer’s decision to stay
with his or her current service provider. On the other hand, understanding the interplay between benefits sought from a site and the site’s service quality is a
potentially fruitful avenue for research.
REFERENCES 1. Avinandan Mukherjee, and Prithwiraj Nath, “ Role of electronic trust in online retailing - A reexamination of the commitment-trust theory”, in European
Journal of Marketing Vol. 41 No. 9/10, 2007 pp. 1173-1202.
2. Eduard Cristóbal Fransi, Frederic Marimon Viadiu, E-Retailing Management: Analysing The Spanish E-Consumers Behaviour, in IADIS International Journal
on WWW/Internet Vol. 5, No. 1, pp. 98-112
3. Gommans, M., K. S. Krishnan, and K. B. Scheffold (2001). “From Brand Loyalty to E-Loyalty: A Conceptual Framework.” Journal of Economic and Social
Research, 3 (1): 43–58.
4. Hsu, Li-Chang,Wang, Chao-Hung, “A Study Of E-Trust In Online Auctions” in Journal of Electronic Commerce Research. Date: Saturday, November 1 2008
http//www.allbusiness.com/company-activities-management/operations/11706951-html
5. Jyh-Shen Chiou, Cornelia Droge and Sangphet Hanvanich,“Does Customer Knowledge Affect How Loyalty is Formed?”’in Journal of Service Research 2002;
5; 113
6. K. Damon Aiken and David M. Boush, “Trustmarks, Objective-Source Ratings, and Implied Investments in Advertising: Investigating OnlineTrust and the
Context-Specific Nature of Internet Signals”, in Journal of the Academy of Marketing Science 2006; 34; 308
7. Kimery, Kathryn M,McCord, Mary “Third-party assurances: Mapping the road to trust in e-retailing”, in JITTA : Journal of Information Technology Theory
and Applicationhttp://www.allbusiness.com/jitta-journal-information-technology-theory-application/11427105-1.html

VOLUME NO. 4 (2014), ISSUE NO. 04 (APRIL) ISSN 2231-1009
INTERNATIONAL JOURNAL OF RESEARCH IN COMPUTER APPLICATION & MANAGEMENT A Monthly Double-Blind Peer Reviewed (Refereed/Juried) Open Access International e-Journal - Included in the International Serial Directories
http://ijrcm.org.in/
19
KNOWLEDGE ECONOMY AS AN EXTENSION OF INFORMATION SOCIETY WITH REFERENCE TO INDIA
GEETU SHARMA
ASST. PROFESSOR
SHREE ATAM VALLABH JAIN COLLEGE
HUSSAINPURA
ABSTRACT For the last two hundred years, neo-classical economics has recognised two factors of production: labour and capital. This is now changing. Information and
knowledge are replacing capital and energy as the primary wealth-creating assets, just as the latter two replaced land and labour 200 years ago. In addition,
technological developments in the 21st century have transformed the majority of wealth-creating work from physically-based to “knowledge-based.” Technology
and knowledge are now the key factors of production. With increased mobility of information and the global work force, knowledge and expertise can be
transported instantaneously around the world, and any advantage gained by one company can be eliminated by competitive improvements overnight. The only
comparative advantage a company will enjoy will be its process of innovation–combining market and technology know-how with the creative talents of
knowledge workers to solve a constant stream of competitive problems–and its ability to derive value from information. We are now an information society in a
knowledge economy.
KEYWORDS
Knowledge, Economy, Information, Society, Transformation.
INTRODUCTION e are living through a period of profound change and transformation of the shape of society and its underlying economic base … The nature of
production, trade, employment and work in the coming decades will be very different from what it is today.” In an agricultural economy land is the
key resource. In an industrial economy natural resources, such as coal and iron ore, and labour are the main resources. A knowledge economy is
one in which knowledge is the key resource. It is not a new idea that knowledge plays an important role in the economy, nor is it a new fact. All economies,
however simple, are based on knowledge about how, for example, to farm, to mine and to build; and this use of knowledge has been increasing since the
Industrial Revolution. But the degree of incorporation of knowledge and information into economic activity is now so great that it is inducing quite profound
structural and qualitative changes in the operation of the economy and transforming the basis of competitive advantage. The rising knowledge intensity of the
world economy and our increasing ability to distribute that knowledge have increased its value to all participants in the economic system. The implications of
this are profound, not only for the strategies of firms and for the policies of government but also for the institutions and systems used to regulate economic
behaviour.
WHAT IS KNOWLEDGE ECONOMY? “Capitalism is undergoing an epochal transformation from a mass production system where the principal source of value was human labour to a new era of
‘innovation mediated production’ where the principal component of value creation, productivity and economic growth is knowledge.” Defining the knowledge
economy is challenging precisely because the commodity it rests on “knowledge” is itself hard to pin down with any precision. Perhaps for this reason there are
few definitions that go much beyond the general and hardly any that describe the knowledge economy in ways that might allow it to be measured and
quantified. The Knowledge Economy is emerging from two defining forces: the rise in knowledge intensity of economic activities, and the increasing globalisation
of economic affairs. The rise in knowledge intensity is being driven by the combined forces of the information technology revolution and the increasing pace of
technological change. Globalisation is being driven by national and international deregulation, and by the IT related communications revolution. However, it is
important to note that the term ‘Knowledge Economy’ refers to the overall economic structure that is emerging, not to any one, or combination of these
phenomena. Various observers describe today’s global economy as one in transition to a “knowledge economy”, as an extension of “information society”. The
transition requires that the rules and practices that determined success in the industrial economy need rewriting in an interconnected, globalised economy
where knowledge resources such as know-how, expertise, and intellectual property are more critical than other economic resources such as land, natural
resources, or even manpower.
WHAT’S NEW ABOUT THE NEW ECONOMY? “In the 21st century, comparative advantage will become much less a function of natural resource endowments and capital-labour ratios and much more a
function of technology and skills. Mother nature and history will play a much smaller role, while human ingenuity will play a much bigger role.” What makes the
emergence of the knowledge economy important is that it is, in some significant respects, different from the industrial economy we have known for most of the
last 200 years. Those differences include the following:
INFORMATION REVOLUTION
The IT revolution has intensified the move towards knowledge codification, and increased the share of codified knowledge in the knowledge stock of advanced
economies. All knowledge that can be codified and reduced to information can now be transmitted around the world at relatively little cost. Hence, knowledge is
acquiring more of the properties of a commodity. Market transactions are facilitated by codification, and the diffusion of knowledge is accelerated. Codification
is also reducing the importance of additional, duplicative investments in acquiring knowledge. It is creating bridges between fields and areas of competence and
reducing the ‘dispersion’ of knowledge. These developments promise an acceleration of the rate of growth of stocks of accessible knowledge, with positive
implications for economic growth.
KNOWLEDGE, SKILLS AND LEARNING
Information and communication technologies have greatly reduced the cost and increased the capacity of organisations to codify knowledge, process and
communicate information. In doing so they have radically altered the ‘balance’ between codified and tacit knowledge in the overall stock of knowledge. In
essence, creating a shortage of tacit knowledge. As access to information becomes easier and less expensive, the skills and competencies relating to the
selection and efficient use of information become more crucial, and tacit knowledge in the form of the skills needed to handle codified knowledge becomes
more important than ever. Information and communication technology investments are complementary with investment in human resources and skills. The
skills required of humans will increasingly be those that are complementary with information and communication technology; not those that are substitutes.
Whereas machines replaced labour in the industrial era, information technology will be the locus of codified knowledge in the knowledge economy, and work in
the knowledge economy will increasingly demand uniquely human (tacit) skills – such as conceptual and inter-personal management and communication skills.
INNOVATION AND KNOWLEDGE NETWORKS
The knowledge economy increasingly relies on the diffusion and use of knowledge, as well as its creation. Hence the success of enterprises, and of national
economies as a whole, will become more reliant upon their effectiveness in gathering, absorbing and utilising knowledge, as well as in its creation. A knowledge
economy is, in effect, a hierarchy of networks, driven by the acceleration of the rate of change and the rate of learning, where the opportunity and capability to
get access to and join knowledge-intensive and learning-intensive relations determines the socio-economic position of individuals and firms.13 Firms must
W

VOLUME NO. 4 (2014), ISSUE NO. 04 (APRIL) ISSN 2231-1009
INTERNATIONAL JOURNAL OF RESEARCH IN COMPUTER APPLICATION & MANAGEMENT A Monthly Double-Blind Peer Reviewed (Refereed/Juried) Open Access International e-Journal - Included in the International Serial Directories
http://ijrcm.org.in/
20
become learning organisations, continuously adapting management, organisation and skills to accommodate new technologies and grasp new opportunities.
They will be increasingly joined in networks, where interactive learning involving creators, producers and users in experimentation and exchange of information
drives innovation.
LEARNING ORGANIZATIONS AND INNOVATION SYSTEMS
In a knowledge economy, firms search for linkages to promote inter-firm interactive learning, and for outside partners and networks to provide complementary
assets. These relationships help firms spread the costs and risks associated with innovation, gain access to new research results, acquire key technological
components, and share assets in manufacturing, marketing and distribution. As they develop new products and processes, firms determine which activities they
will undertake individually, which in collaboration with other firms, which in collaboration with universities or research institutions, and which with the support
of government. Innovation is thus the result of numerous interactions between actors and institutions, which together form an innovation system. Those
innovation systems consist of the flows and relationships, which exist among industry, government and academia in the development of science and technology.
And the interactions within these systems influence the innovative performance of firms and ultimately of the economy. The ‘knowledge distribution power’ of
the system, or its capability to ensure timely access by innovators to relevant stocks of knowledge, is therefore a major determinant of prosperity. Global
competition and production. Strategy and location.
INDIA ASA KNOWLEDGE ECONOMY: ASPIRATIONS VERSUS REALITY
The Indian vision of a knowledge-based economy will be realised only when it is based on the foundation of a robust industrial economy. To be truly beneficial,
the rain of IT must fall at the right place, in the right quantity, at the right time and for the right purpose. THE Indian software industry has compiled an
impressive track record over the past decade. Entrepreneurs, bureaucrats and politicians are now advancing views about how India can transform itself into a
knowledge-based economy by riding the information technology (IT) bandwagon. Isolated instances of villagers using e-mail are cited as examples of such
transformation. Likewise, e-governance is being projected as the way of the future. There is no dearth of fascinating stories about IT-enabled changes. But, there
is little discussion about whether such changes are sustainable and effective when other areas of the economy continue to lag. For example, 79 per cent of
India’s population lives in villages with limited basic infrastructure. Over 60 per cent of the population is considered literate, but with literacy being defined as
the ability to read and write simple words in any language, acquired with or without formal schooling. This criterion is so basic, that it is almost irrelevant in the
context of a knowledge economy. Yet, Central and State governments have projected IT as a vehicle for social and economic transformation. Are we putting the
cart before the horse here? Even if the focus on IT is justifiable, how must IT policy be designed so that the nation is benefited in a balanced way? In this
commentary, we discuss the implications of India’s intensive focus on the IT sector. We argue that India should aggressively pursue manufacturing- and
agriculture-based industries to build a robust industrial economy that can be made more efficient with IT. IT projects can certainly be pursued within the private
sector. However, government policy should not be heavily skewed in favour of the IT industry when its benefits to society are unclear and when its role within
the broader framework of national development has not been adequately articulated. Further, policy-makers should moderate their obsession with IT as a
panacea for India’s socio-economic problems.
INDIA AS A KNOWLEDGE ECONOMY
The value of IT depends greatly on the existing level of economic development. IT can make existing assets and processes more effective and efficient, but
cannot compensate for the lack of a basic infrastructure. What is appropriate for a developed economy is not necessarily appropriate for India, where basic
elements of infrastructure including quality education, healthcare, electricity and drinking water remain in short supply. The impact of IT is best understood
when the differences between industrial and knowledge-intensive ventures are recognised. Industrial growth derives from investments in large-scale
infrastructure (such as railways, roadways, power grids and dams). Such infrastructure supports the growth of physical-asset intensive industries (such as the
steel and transportation industries) that create and move physical entities (such as goods, water and people). These ventures employ numerous workers with
limited education and skills, and can uplift large sections of society. In contrast, ventures in the knowledge economy usually involve the production of
knowledge-intensive goods (like software), and the large-scale capture, movement and utilization of information using sophisticated network infrastructure
(such as computers, cable, fibre and routers). Beyond the physical labour required for initial construction, building and maintaining such infrastructure requires
specialized knowledge. Despite the hype of the “new economy”, the fact is that economic development is cumulative. The industrial economy made agriculture
more productive. The productivity of agricultural labour skyrocketed with the use of industrial and biological innovations including tractors, irrigation systems,
fertilizers, pesticides and genetically engineered seeds. Historically, industrial innovation in developed economies has created great wealth and improved living
standards across societal divides. This progress has set them up in an ideal position to create and exploit knowledge as they transform into knowledge-based
economies. Crucially, the greatest source of productivity and growth attributed to the knowledge economy derives not from the knowledge economy itself, but
from its effects on the industrial economy. For example, IT can enable supply chains and factories to work more efficiently. The “leapfrogging” argument,
whereby India skips heavy infrastructure building and transforms directly into a knowledge economy, is therefore suspect. Proponents of leapfrogging describe
how isolated villages without conventional telephones have directly adopted cellular phones. The example provides excellent symbolism. However, the
underlying principle is not scalable to the level of the national economy where many complex sub-systems work together. Consider the transportation sub-
system. The laws of physics do not allow IT to substitute the physical movement of goods by a “virtual” movement. A lightning-fast information network will not
in itself help achieve faster and cheaper transport. Better roadways and railways will.
IT, JOB GROWTH AND GOVERNMENT POLICY
Indian IT firms have focussed on developing and delivering IT services to advanced economies. Even if India became the world’s software factory and the most
optimistic projections of IT-related jobs (including jobs in call centres and design centres) were upheld, this industry will employ at most a few million people. In
a nation with over a billion people, this constitutes but a dent in the employment statistics. Further, a social planner should be concerned not just with the
creation of wealth, but also with its distribution across social divides. The IT industry holds limited potential for wealth to trickle down to the poorer sections of
society. Unlike a steel plant, IT engenders few opportunities for the uneducated. Any transfer of wealth from the IT sector (for example, by taxing the IT sector to
fund social spending) would be achieved through the heavy hand of government.. In fact, the rapid growth of IT will likely lead to a digital divide in the short
term, where the rich and educated are empowered and enriched by IT and the poor are oblivious to its impact.
Before embracing IT, Indian policy planners must carefully evaluate whether investments in other areas would yield higher, and more equitable, returns. For
example, consider the jute industry. The country needs to be particularly careful not to give short shrift to the manufacturing sector. China is not known for its
strengths in IT, although it now has some presence in the area. But, what China has accomplished in terms of its core industrial base is striking. Foreign direct
investment (FDI) in China was of the order of billion in 2000 despite all the noise about alleged labour and human rights abuses. Chinese exports exceeded 0
billion in 2000, with the United States alone accounting for 0 billion of these exports. In fact, the value of “footwear” exported annually by China to the U.S.
(worth about .2 billion) itself compares with or even exceeds the total value of India’s annual IT exports. Why are these numbers relevant? Exporting footwear
creates millions of jobs for citizens who lack sophisticated skills. According to some reports, a total of 34 million export-related jobs have been created in China,
with exports to the U.S. alone accounting for over 20 million jobs in the last decade. These jobs have improved living standards for a substantial fraction of
Chinese society. There is much we need to learn from China about how the manufacturing sector can deliver robust and equitable economic growth. Taiwan,
Malaysia and South Korea have also flourished using similar approaches. In contrast with manufacturing, the direct benefits to IT (such as employment in IT jobs)
are likely to flow to the few who already have the benefits of education. The trickle-down effects of IT (such as cleaning and maintenance staff for IT firms) are
likely to be modest or non-existent outside the large cities. It is also time to discard the notion that the manufacturing sector is inherently less appealing because
it may involve some physical labour. In the more advanced economies, a skilled factory floor worker is frequently paid more than a call-centre employee.
Empowered with technology, the factory worker can add value at a remarkable rate. In India, the reverse often holds. Mundane call-centre jobs, often
outsourced from more developed economies, absorb well-educated, English-speaking workers whose abilities could be employed much more productively
elsewhere. The actions of governments in India tend to be biased in favour of the IT sector.. The government needs a more balanced policy, one that ensures
that the core industrial sector is not ignored in the rush toward IT.

VOLUME NO. 4 (2014), ISSUE NO. 04 (APRIL) ISSN 2231-1009
INTERNATIONAL JOURNAL OF RESEARCH IN COMPUTER APPLICATION & MANAGEMENT A Monthly Double-Blind Peer Reviewed (Refereed/Juried) Open Access International e-Journal - Included in the International Serial Directories
http://ijrcm.org.in/
21
IT AND EDUCATION
IT is fashionable to say that India’s population constitutes its greatest asset. This viewpoint is misleading. People are assets only when they participate
meaningfully in the cycle of value creation and consumption by exercising buying power, or creating products and services of value, or by creating and
harnessing knowledge. A large fraction of India’s population does not meet, or even come close to, this asset standard. To transform such a situation, a renewed
focus is required on the two pillars that have supported the growth of every successful economy – a strong infrastructure core and widespread access to
education. Now to discuss the IT-education interface.
IT AND CULTURE
A Knowledge Economy is characterised by a culture of innovation. For such a culture to take root, innovation must be rewarded and intellectual property must
be protected. A culture that truly enhances innovation supports the view that to try hard and fail is perfectly fine. Yet, the Indian psyche has historically been
averse to blessing the risky venture. This attitude transcends into the corporate arena. Consider how static the Indian automobile industry was for three decades
before the refreshing winds of competition brought about rapid change. Competition breeds innovation. While one side of the cultural coin pertains to the
incentives for innovation, the flip side pertains to its protection. Ideas, unlike property, cannot be protected by building a fence around them. Intellectual
property protection is not a purely economic issue; it also has important cultural dimensions. The economic angle can be addressed with stronger patent laws
and punitive procedures. However, the cultural angle will decide whether such protection can be enforced meaningfully. Addressing the cultural angle is a
challenge.
THE ROAD TO TECHNOLOGY
A society that is deeply divided by social and economic fissures must think carefully about how it achieves economic and technological advance. The path, in
some ways, is more important than the outcome itself. In the Indian context, particular attention needs to be paid to when, where, and in what form IT and
other technological advances are encouraged. There are, indeed, many low-hanging fruits to be harvested. For example, a recent article in The New York Times
described how a fisherman working off the coasts of Kerala used a cell phone on the seas to obtain information about spot market prices for fish at Kochi and
Koll am. The fisherman netted the equivalent of an additional, 000 in annual income merely by deciding to deliver his catch to the more remunerative market
each time his boat came in. This striking example of how simple information flows can enhance market efficiency can be replicated in many ways, and in many
markets. However, the stakes are quite different when it comes to the formulation of a national IT policy. Any national policy requires some trade-offs between
the benefits to industrial sectors, regions and classes of people. In formulating a national IT policy, the quest for superior technology must be moderated by an
understanding of its implications at the social level – what might be good for a private company or an entrepreneur may not always be good for society and vice-
versa Successful technology adoption will move in measured steps, at a pace and in a direction that are in harmony with changes in the socio-economic fabric.
The role of the government in ensuring such harmony should not be underestimated. This is especially true in India where the government remains responsible
for a significant fraction of the economic output, and where it is actively reshaping rules and regulations as the country integrates into the global economy.
Information technology can change the way a society communicates, collaborates, lives, works and plays. The growth of the IT sector in India symbolises the
potential of Indian industry to perform at world-class standards. This success demonstrates much of what can go right when the spirit of human enterprise is
given free rein. However, the success of IT at the corporate level in India cannot solve its economic and social challenges. Just as copious rainfall can lead to
dramatic floods, an obsession with IT and the knowledge economy is not useful. To be truly beneficial, the rain of IT must fall at the right place in the right
quantity, at the right time and for the right purpose. Neither does the aggressive pursuit of IT represent the sole, or even an obvious, pathway to a first class
economy despite the glowing success of high-profile IT companies.
CONCLUSION Technological developments in the 21
st century have transformed the majority of wealth-creating work from physically-based to “knowledge-based.” Technology
and knowledge are now the key factors of production. With increased mobility of information and the global work force, knowledge and expertise can be
transported instantaneously around the world, and any advantage gained by one company can be eliminated by competitive improvements overnight. The only
comparative advantage a company will enjoy will be its process of innovation–combining market and technology know-how with the creative talents of
knowledge workers to solve a constant stream of competitive problems–and its ability to derive value from information. We are now an information society in a
knowledge economy where knowledge management is essential. This page lists and rates Internet resources related to the field of knowledge based economy
and knowledge management in the new information society.
REFERENCES 1. Anand, Kumar Shiv, “Fundamentals of Information Technology”
2. Norton, Peter, “Introduction to Computer”
3. Srivastva, Chetan, “Fundamentals of Information TiwanaAmrit, Technology”
4. VedPuriswar A V, “Knowledge Management”

VOLUME NO. 4 (2014), ISSUE NO. 04 (APRIL) ISSN 2231-1009
INTERNATIONAL JOURNAL OF RESEARCH IN COMPUTER APPLICATION & MANAGEMENT A Monthly Double-Blind Peer Reviewed (Refereed/Juried) Open Access International e-Journal - Included in the International Serial Directories
http://ijrcm.org.in/
22
Mining Complex and Dynamic Data Mining from Sparse, Uncertain, and Incomplete Data Local Learning and Model Fusion for Multiple Information Sources
DYNAMIC RELATIONSHIP TECHNIQUE FOR COMPLICATION REDUCTION IN BIG DATA
SELVARATHI C
ASST.PROFESSOR
COMPUTER SCIENCE & ENGINEERING
M.KUMARASAMY COLLEGE OF ENGINEERING
KARUR
ABSTRACT Big Data usually includes data sets with sizes beyond the ability of commonly used software tools to capture, curate, manage, and process the data within a
tolerable elapsed time. This paper presents a DYNAMIC CORRELATION TECHNIQUE which reduces complexity and characterizes the features of the Big Data
revolution, and proposes a Big Data processing model, from the data mining perspective. This DCT model involves demand-driven aggregation of information
sources, mining and analysis, user interest modeling, and security and privacy considerations. We analyze the challenging issues in the data-driven model and
also in the Big Data revolution.
KEYWORDS Big Data, data mining, heterogeneity, autonomous sources, complex and evolving associations.
1 INTRODUCTION he era of Big Data has arrived astonishingly in the past few years. Numerous data are produced in the form of documents, chatting messages, audio,
video, and applications and they are spread in the web. It will be more difficult to analyze these enormous data and we need more complicated
algorithms and applications for mining these heterogeneous data. Also Big data has property of autonomous sources with complex and evolving
relationships.
In the internet every day quintillion bytes of data are created and Our capability for data generation has never been so powerful and enormous ever since
last few centuries.
The data collection has grown massively and is beyond the ability of commonly used software tools to capture, manage, and process within a
“reasonable elapsed time.” The most fundamental challenge for Big Data applications is to explore the large volumes of data and extract useful
information or knowledge for future actions [40]. In many situations, the knowledge extraction process has to be very efficient and close to real time
because storing all observed data is nearly infeasible. As a result, the extraordinary data volumes require an effective data analysis and prediction platform
to achieve fast response and real-time classification for such Big Data.
The remainder of the paper is structured as follows: In Section 2, we summarize the key challenges for Big Data mining.. in Section 3 we propose a DCT
(DYNAMIC CORRELATION TECHNIQUE) to process mining with Big Data, Related work is discussed in Section 4, and we conclude the paper in Section 5.
2 DATA MINING CHALLENGES WITH BIG DATA For an intelligent learning database system [52] to handle Big Data, the essential key is to scale up to the exceptionally large volume of data and provide
treatments for the characteristics featured by the aforementioned HACE theorem. Fig. 2 shows a conceptual view of the Big Data processing framework,
which includes three tiers from inside out with considerations on data accessing and computing (Tier I), data privacy and domain knowledge (Tier II), and
Big Data mining algorithms (Tier III).
FIG. 1
TIER III: BIG DATA MINING ALGORITHMS
TIER II: BIG DATA SEMANTICS AND APPLICATION KNOWLEDGE
TIER I: BIG DATA MINING PLATFORM
A Big Data processing framework: The research challenges form a three tier structure and center around the “Big Data mining platform” (Tier I), which focuses on
low-level data accessing and computing. Challenges on information sharing and privacy, and Big Data application domains and knowledge form Tier II, which
concentrates on high-level semantics, application domain knowledge, and user privacy issues. The outmost circle shows Tier III challenges on actual mining
algorithms.
The challenges at Tier I focus on data accessing and Arithmetic computing procedures. Because Big Data are often stored at different locations and data
volumes may continuously grow, an effective computing platform will have to take distributed large-scale data storage into consideration for computing. For
example, typical data mining algorithms require all data to be loaded into the main memory, this, however, is becoming a clear technical barrier for Big Data
because moving data across different locations is expensive (e.g., subject to intensive network communication and other IO costs), even if we do have a
super large main memory to hold all data for computing.
The challenges at Tier II center around semantics and domain knowledge for different Big Data applications. Such information can provide additional benefits
to the mining process, as well as add technical barriers to the Big Data access (Tier I) and mining algorithms (Tier III). For example, depending on different
domain applications, the data privacy and information sharing mechanisms between data producers and data consumers can be significantly differ- ent.
Sharing sensor network data for applications like water quality monitoring may not be discouraged, whereas releasing and sharing mobile users’ location
information is clearly not acceptable for majority, if not all, applications. In addition to the above privacy issues, the application domains can also provide
additional information to benefit or guide Big Data mining algorithm designs. For example, in market basket transactions data, each transaction is considered
T
Information Sharing and Data Privacy Domain and Application KNOWLEDGE
Clustered nodes Parallel computing

VOLUME NO. 4 (2014), ISSUE NO. 04 (APRIL) ISSN 2231-1009
INTERNATIONAL JOURNAL OF RESEARCH IN COMPUTER APPLICATION & MANAGEMENT A Monthly Double-Blind Peer Reviewed (Refereed/Juried) Open Access International e-Journal - Included in the International Serial Directories
http://ijrcm.org.in/
23
independent and the discovered knowledge is typically represented by finding highly correlated items, possibly with respect to different temporal and/or
spatial restrictions. In a social network, on the other hand, users are linked and share dependency structures. The knowledge is then represented by user
communities, leaders in each group, and social influence modeling, and so on. Therefore, understanding semantics and application knowledge is important for
both low-level data access and for high-level mining algorithm designs.
At Tier III, the data mining challenges concentrate on algorithm designs in tackling the difficulties raised by the Big Data volumes, distributed data
distributions, and by complex and dynamic data characteristics. The circle at Tier III contains three stages. First, sparse, heterogeneous, uncertain,
incomplete, and multisource data are prepro- cessed by data fusion techniques. Second, complex and dynamic data are mined after preprocessing.
Third, the global knowledge obtained by local learning and model fusion is tested and relevant information is fed back to the preprocessing stage. Then,
the model and parameters are adjusted according to the feedback. In the whole process, information sharing is not only a promise of smooth development of
each stage, but also a purpose of Big Data processing.
In the following, we elaborate challenges with respect to the three tier framework in Fig. 1.
2.1 TIER I: BIG DATA MINING PLATFORM
In typical data mining systems, the mining procedures require computational intensive computing units for data analysis and comparisons. A computing
platform is, therefore, needed to have efficient access to, at least, two types of resources: data and computing processors. For small scale data mining
tasks, a single desktop computer, which contains hard disk and CPU processors, is sufficient to fulfill the data mining goals. Indeed, many data mining
algorithm are designed for this type of problem settings. For medium scale data mining tasks, data are typically large (and possibly distributed) and cannot
be fit into the main memory. Common solutions are to rely on parallel computing [43], [33] or collective mining [12] to sample and aggregate data from
different sources and then use parallel computing programming (such as the Message Passing Interface) to carry out the mining process.
For Big Data mining, because data scale is far beyond the capacity that a single personal computer (PC) can handle, a typical Big Data processing framework
will rely on cluster computers with a high-performance computing platform, with a data mining task being deployed by running some parallel programming
tools, such as MapReduce or Enterprise Control Language (ECL), on a large number of computing nodes (i.e., clusters). The role of the software component is
to make sure that a single data mining task, such as finding the best match of a query from a database with billions of records, is split into many small tasks
each of which is running on one or multiple computing nodes. For example, as of this writing, the world most powerful super computer Titan, which is
deployed at Oak Ridge National Laboratory in Tennessee, contains 18,688 nodes each with a 16-core CPU.
Such a Big Data system, which blends both hardware and software components, is hardly available without key industrial stockholders’ support. In fact, for
decades, companies have been making business decisions based on transactional data stored in relational databases. Big Data mining offers opportunities to go
beyond traditional relational databases to rely on less structured data: weblogs, social media, e-mail, sensors, and photographs that can be mined for useful
information. Major business intelligence companies, such IBM, Oracle, Teradata, and so on, have all featured their own products to help customers acquire
and organize these diverse data sources and coordinate with customers’ existing data to find new insights and capitalize on hidden relationships.
2.2 TIER II: BIG DATA SEMANTICS AND APPLICATION KNOWLEDGE
Semantics and application knowledge in Big Data refer to numerous aspects related to the regulations, policies, user knowledge, and domain information.
The two most important issues at this tier include 1) data sharing and privacy; and 2) domain and application knowledge. The former provides answers to
resolve concerns on how data are maintained, accessed, and shared; whereas the latter focuses on answering questions like “what are the under- lying
applications ?” and “what are the knowledge or patterns users intend to discover from the data ?”
2.2.1 INFORMATION SHARING AND DATA PRIVACY
Information sharing is an ultimate goal for all systems involving multiple parties [24]. While the motivation for sharing is clear, a real-world concern is that Big
Data applications are related to sensitive information, such as banking transactions and medical records. Simple data exchanges or transmissions do not
resolve privacy con- cerns [19], [25], [42]. For example, knowing people’s locations and their preferences, one can enable a variety of useful location-
based services, but public disclosure of an individual’s locations/movements over time can have serious consequences for privacy. To protect privacy, two
common approaches are to 1) restrict access to the data, such as adding certification or access control to the data entries, so sensitive information is
accessible by a limited group of users only, and 2) anonymize data fields such that sensitive information cannot be pinpointed to an indivi- dual record
[15]. For the first approach, common chal- lenges are to design secured certification or access control mechanisms, such that no sensitive information can
be misconducted by unauthorized individuals. For data anonymization, the main objective is to inject randomness into the data to ensure a number of
privacy goals. For example, the most common k-anonymity privacy measure is to ensure that each individual in the database must be indistinguishable from
k — 1 others. Common anonymiza- tion approaches are to use suppression, generalization, perturbation, and permutation to generate an altered version
of the data, which is, in fact, some uncertain data.
One of the major benefits of the data annomization-based information sharing approaches is that, once anonymized, data can be freely shared across
different parties without involving restrictive access controls. This naturally leads to another research area namely privacy preserving data mining [30],
where multiple parties, each holding some sensitive data, are trying to achieve a common data mining goal without sharing any sensitive information inside
the data. This privacy preserving mining goal, in practice, can be solved through two types of approaches including 1) using special communication
protocols, such as Yao’s protocol [54], to request the distributions of the whole data set, rather than requesting the actual values of each record, or 2)
designing special data mining methods to derive knowledge from anonymized data (this is inherently similar to the uncertain data mining methods).
2.2.2 DOMAIN AND APPLICATION KNOWLEDGE
Domain and application knowledge [28] provides essential information for designing Big Data mining algorithms and systems. In a simple case, domain
knowledge can help identify right features for modeling the underlying data (e.g., blood glucose level is clearly a better feature than body mass in diagnosing
Type II diabetes). The domain and application knowledge can also help design achievable business objectives by using Big Data analytical techniques. For
example, stock market data are a typical domain that constantly generates a large quantity of information, such as bids, buys, and puts, in every single second.
The market continuously evolves and is impacted by different factors, such as domestic and international news, government reports, and natural disasters,
and so on. An appealing Big Data mining task is to design a Big Data mining system to predict the movement of the market in the next one or two minutes.
Such systems, even if the prediction accuracy is just slightly better than random guess, will bring significant business values to the developers [9]. Without
correct domain knowledge, it is a clear challenge to find effective matrices/measures to characterize the market movement, and such knowledge is often
beyond the mind of the data miners, although some recent research has shown that using social networks, such as Twitter, it is possible to predict
the stock market upward/downward trends [7] with good accuracies.
2.3 TIER III: BIG DATA MINING ALGORITHMS
2.3.1 LOCAL LEARNING AND MODEL FUSION FOR MULTIPLE INFORMATION SOURCES
As Big Data applications are featured with autonomous sources and decentralized controls, aggregating distributed data sources to a centralized site for
mining is system- atically prohibitive due to the potential transmission cost and privacy concerns. On the other hand, although we can always carry out
mining activities at each distributed site, the biased view of the data collected at each site often leads to biased decisions or models, just like the elephant
and blind men case. Under such a circumstance, a Big Data mining system has to enable an information exchange and fusion mechanism to ensure that
all distributed sites (or information sources) can work together to achieve a global optimization goal. Model mining and correlations are the key steps to
ensure that models or patterns discovered from multiple information sources can be consolidated to meet the global mining objective. More specifically,
the global mining can be featured with a two-step (local mining and global correlation) process, at data, model, and at knowledge levels. At the data
level, each local site can calculate the data statistics based on the local data sources and exchange the statistics between sites to achieve a global
data distribution view. At the model or pattern level, each site can carry out local mining activities, with respect to the localized data, to discover
local patterns. By exchanging patterns between multiple sources, new global patterns can be synthetized by aggregating patterns across all sites [50]. At the

VOLUME NO. 4 (2014), ISSUE NO. 04 (APRIL) ISSN 2231-1009
INTERNATIONAL JOURNAL OF RESEARCH IN COMPUTER APPLICATION & MANAGEMENT A Monthly Double-Blind Peer Reviewed (Refereed/Juried) Open Access International e-Journal - Included in the International Serial Directories
http://ijrcm.org.in/
24
knowledge level, model correlation analysis investigates the relevance between models gener- ated from different data sources to determine how relevant
the data sources are correlated with each other, and how to form accurate decisions based on models built from autonomous sources.
2.3.2 MINING FROM SPARSE, UNCERTAIN, AND INCOMPLETE DATA
Spare, uncertain, and incomplete data are defining features for Big Data applications. Being sparse, the number of data points is too few for drawing reliable
conclusions. This is normally a complication of the data dimensionality issues, where data in a high-dimensional space (such as more than 1,000 dimensions)
do not show clear trends or distribu- tions. For most machine learning and data mining algorithms, high-dimensional spare data significantly de- teriorate
the reliability of the models derived from the data. Common approaches are to employ dimension reduction or feature selection [48] to reduce the data
dimensions or to carefully include additional samples to alleviate the data scarcity, such as generic unsupervised learning methods in data mining. Uncertain
data are a special type of data reality where each data field is no longer deterministic but is subject to some random/error distributions. This is mainly
linked to domain specific applications with inaccurate data readings and collections. For example, data produced from GPS equipment are inherently
uncertain, mainly because the technology barrier of the device limits the precision of the data to certain levels (such as 1 meter). As a result, each
recording location is represented by a mean value plus a variance to indicate expected errors. For data privacy- related applications [36], users may
intentionally inject randomness/errors into the data to remain anonymous. This is similar to the situation that an individual may not feel comfortable to let
you know his/her exact income, but will be fine to provide a rough range like [120k, 160k]. For uncertain data, the major challenge is that each data item is
represented as sample distributions but not as a single value, so most existing data mining algorithms cannot be directly applied. Common solutions
are to take the data distributions into consideration to estimate model parameters. For example, error aware data mining [49] utilizes the mean and
the variance values with respect to each single data item to build a Na¨ıve Bayes model for classification. Similar approaches have also been applied for
decision trees or database queries. Incomplete data refer to the missing of data field values for some samples. The missing values can be caused by
different realities, such as the malfunction of a sensor node, or some systematic policies to intentionally skip some values (e.g., dropping some sensor
node readings to save power for transmission). While most modern data mining algorithms have in-built solutions to handle missing values (such as ignoring
data fields with missing values), data imputation is an estab- lished research field that seeks to impute missing values to produce improved models
(compared to the ones built from the original data). Many imputation methods [20] exist for this purpose, and the major approaches are to fill most frequently
observed values or to build learning models to predict possible values for each data field, based on the observed values of a given instance.
2.3.3 MINING COMPLEX AND DYNAMIC DATA
The rise of Big Data is driven by the rapid increasing of complex data and their changes in volumes and in nature [6]. Documents posted on WWW servers,
Internet back- bones, social networks, communication networks, and transportation networks, and so on are all featured with complex data. While complex
dependency structures underneath the data raise the difficulty for our learning systems, they also offer exciting opportunities that simple data
representations are incapable of achieving. For example, researchers have successfully used Twitter, a well-known social networking site, to detect events
such as earthquakes and major social activities, with nearly real- time speed and very high accuracy. In addition, by summarizing the queries users
submitted to the search engines, which are all over the world, it is now possible to build an early warning system for detecting fast spreading flu outbreaks
[23]. Making use of complex data is a major challenge for Big Data applications, because any two parties in a complex network are potentially interested
to each other with a social connection. Such a connection is quadratic with respect to the number of nodes in the network, so a million node network
may be subject to one trillion connections. For a large social network site, like Facebook, the number of active users has already reached 1 billion, and
analyzing such an enormous network is a big challenge for Big Data mining. If we take daily user actions/interactions into consideration, the scale of diffi-
culty will be even more astonishing.
Inspired by the above challenges, many data mining methods have been developed to find interesting knowl- edge from Big Data with complex relationships
and dynamically changing volumes. For example, finding communities and tracing their dynamically evolving rela- tionships are essential for understanding and
managing complex systems [3], [10]. Discovering outliers in a social network [8] is the first step to identify spammers and provide safe networking
environments to our society.
If only facing with huge amounts of structured data, users can solve the problem simply by purchasing more storage or improving storage efficiency.
However, Big Data complexity is represented in many aspects, including complex heterogeneous data types, complex intrinsic semantic associations in data,
and complex relationship networks among data. That is to say, the value of Big Data is in its complexity.
Complex heterogeneous data types. In Big Data, data types include structured data, unstructured data, and semistruc- tured data, and so on. Specifically,
there are tabular data (relational databases), text, hyper-text, image, audio and video data, and so on. The existing data models include key-value stores,
bigtable clones, document databases, and graph databases, which are listed in an ascending order of the complexity of these data models. Traditional
data models are incapable of handling complex data in the context of Big Data. Currently, there is no acknowledged effective and efficient data model
to handle Big Data.
Complex intrinsic semantic associations in data. News on the web, comments on Twitter, pictures on Flicker, and clips of video on YouTube may discuss about an
academic award- winning event at the same time. There is no doubt that there are strong semantic associations in these data. Mining complex semantic
associations from “text-image-video” data will significantly help improve application system performance such as search engines or recommendation
systems. However, in the context of Big Data, it is a great challenge to efficiently describe semantic features and to build semantic association models to
bridge the semantic Complex relationship networks in data. In the context of Big Data, there exist relationships between individuals. On the Internet,
individuals are web pages and the pages linking to each other via hyperlinks form a complex network. There also exist social relationships
between individuals forming complex social networks, such as big relationship data from Face book, Twitter, LinkedIn, and other social media [5], [13],
[56], including call detail records (CDR), devices and sensors information [1], [44], GPS and geocoded map data, massive image files transferred by
the Manage File Transfer protocol, web text and click-stream data [2], scientific information, e-mail [31], and so on. To deal with complex
relationship networks, emerging research efforts have begun to address the issues of structure-and-evolution, crowds-and-interaction, and information-and-
communication. The emergence of Big Data has also spawned new computer architectures for real-time data-intensive process- sing, such as the open
source Apache Hadoop project that runs on high-performance clusters. The size or complexity of the Big Data, including transaction and interaction data sets,
exceeds a regular technical capability in capturing, managing, and processing these data within reasonable cost and time limits. In the context of Big Data, real-
time processing for complex data is a very challenging task.
3 RELATED WORK 3.1 BIG DATA MINING PLATFORMS (TIER I)
Due to the multisource, massive, heterogeneous, and dynamic characteristics of application data involved in a distributed environment, one of the most
important characteristics of Big Data is to carry out computing on the petabyte (PB), even the exabyte (EB)-level data with a complex computing process.
Therefore, utilizing a parallel computing infrastructure, its corresponding programming language support, and software models to efficiently analyze and mine
the distributed data are the critical goals for Big Data processing to change from “quantity” to “quality.”
Currently, Big Data processing mainly depends on parallel programming models like MapReduce, as well as providing a cloud computing platform of Big
Data services for the public. MapReduce is a batch-oriented parallel computing model. There is still a certain gap in perfor- mance with relational
databases. Improving the perfor- mance of MapReduce and enhancing the real-time nature of large-scale data processing have received a significant amount
of attention, with MapReduce parallel program- ming being applied to many machine learning and data mining algorithms. Data mining algorithms usually
need to scan through the training data for obtaining the statistics to solve or optimize model parameters. It calls for intensive computing to access the large-
scale data frequently. To improve the efficiency of algorithms, Chu et al. proposed a general-purpose parallel programming method, which is applicable to a
large number of machine learning algo- rithms based on the simple MapReduce programming model on multicore processors. Ten classical data mining

VOLUME NO. 4 (2014), ISSUE NO. 04 (APRIL) ISSN 2231-1009
INTERNATIONAL JOURNAL OF RESEARCH IN COMPUTER APPLICATION & MANAGEMENT A Monthly Double-Blind Peer Reviewed (Refereed/Juried) Open Access International e-Journal - Included in the International Serial Directories
http://ijrcm.org.in/
25
algorithms are realized in the framework, including locally weighted linear regression, k-Means, logistic regression, naive Bayes, linear support vector
machines, the indepen- dent variable analysis, Gaussian discriminant analysis, expectation maximization, and back-propagation neural networks [14]. With the
analysis of these classical machine learning algorithms, we argue that the computational operations in the algorithm learning process could be transformed
into a summation operation on a number of training data sets. Summation operations could be per- formed on different subsets independently and
achieve penalization executed easily on the MapReduce program- ming platform. Therefore, a large-scale data set could be divided into several subsets
and assigned to multiple Mapper nodes. Then, various summation operations could be performed on the Mapper nodes to collect intermediate results.
Finally, learning algorithms are executed in parallel through merging summation on Reduce nodes. Ranger et al. [39] proposed a MapReduce-based
application programming interface Phoenix, which supports parallel programming in the environment of multi core and multi- processor systems, and
realized three data mining algo- rithms including k-Means, principal component analysis, and linear regression. Gillick et al. [22] improved the MapReduce’s
implementation mechanism in Hadoop, evaluated the algorithms’ performance of single-pass learning, iterative learning, and query-based learning in the
MapReduce framework, studied data sharing between computing nodes involved in parallel learning algorithms, distributed data storage, and then showed
that the MapReduce mechanisms suitable for large-scale data mining by testing series of standard data mining tasks on medium-size clusters.
Papadimitriou and Sun [38] pro- posed a distributed collaborative aggregation (DisCo) framework using practical distributed data preprocessing and
collaborative aggregation techniques. The implementa- tion on Hadoop in an open source MapReduce project showed that DisCo has perfect scalability
and can process and analyze massive data sets (with hundreds of GB).
To improve the weak scalability of traditional analysis software and poor analysis capabilities of Hadoop systems, Das et al. [16] conducted a study of the
integration of R (open source statistical analysis software) and Hadoop. The in-depth integration pushes data computation to parallel processing, which
enables powerful deep analysis capabil- ities for Hadoop. Wegener et al. [47] achieved the integration of Weka (an open-source machine learning and data
mining software tool) and MapReduce. Standard Weka tools can only run on a single machine, with a limitation of 1-GB memory. After algorithm
parallelization, Weka breaks through the limitations and improves performance by taking the advantage of parallel computing to handle more than 100-GB
data on MapReduce clusters. Ghoting et al. [21] proposed Hadoop-ML, on which developers can easily build task-parallel or data-parallel machine learning and
data mining algorithms on program blocks under the language runtime environment.
3.2 BIG DATA SEMANTICS AND APPLICATION KNOWLEDGE (TIER II)
In privacy protection of massive data, Ye et al. [55] proposed a multilayer rough set model, which can accurately describe the granularity change
produced by different levels of generalization and provide a theoretical foundation for measuring the data effectiveness criteria in the anonymization process,
and designed a dynamic mechanism for balancing privacy and data utility, to solve the optimal generalization/refinement order for classifica- tion. A recent
paper on confidentiality protection in Big Data [4] summarizes a number of methods for protecting public release data, including aggregation (such as k-
anonymity, I-diversity, etc.), suppression (i.e., deleting sensitive values), data swapping (i.e., switching values of sensitive data records to prevent users
from matching), adding random noise, or simply replacing the whole original data values at a high risk of disclosure with values synthetically generated
from simulated distributions.
For applications involving Big Data and tremendous data volumes, it is often the case that data are physically distributed at different locations, which
means that users no longer physically possess the storage of their data. To carry out Big Data mining, having an efficient and effective data access
mechanism is vital, especially for users who intend to hire a third party (such as data miners or data auditors) to process their data. Under such a
circumstance, users’ privacy restrictions may include 1) no local data copies or downloading, 2) all analysis must be deployed based on the existing data
storage systems without violating existing privacy settings, and many others. In Wang et al. [48], a privacy-preserving public auditing mechanism for
large scale data storage (such as cloud computing systems) has been proposed. The public key-based mechanism is used to enable third-party auditing
(TPA), so users can safely allow a third party to analyze their data without breaching the security settings or compromising the data privacy.
For most Big Data applications, privacy concerns focus on excluding the third party (such as data miners) from directly accessing the original data. Common
solutions are to rely on some privacy-preserving approaches or encryp- tion mechanisms to protect the data. A recent effort by Lorch et al. [32] indicates
that users’ “data access patterns” can also have severe data privacy issues and lead to disclosures of geographically co-located users or users with common
interests (e.g., two users searching for the same map locations are likely to be geographically colocated). In their system, namely Shround, users’ data
access patterns from the servers are hidden by using virtual disks. As a result, it can support a variety of Big Data applications, such as microblog search
and social network queries, without compromising the user privacy.
3.3 BIG DATA MINING ALGORITHMS (TIER III)
To adapt to the multisource, massive, dynamic Big Data, researchers have expanded existing data mining methods in many ways, including the efficiency
improvement of single-source knowledge discovery methods [11], designing a data mining mechanism from a multisource perspective [50], [51], as well as
the study of dynamic data mining methods and the analysis of stream data [18], [12]. The main motivation for discovering knowledge from massive data
is improving the efficiency of single-source mining methods. On the basis of gradual improvement of computer hardware functions, researchers continue to
explore ways to improve the efficiency of knowledge discovery algo- rithms to make them better for massive data. Because massive data are
typically collected from different data sources, the knowledge discovery of the massive data must be performed using a multisource mining mechanism. As
real-world data often come as a data stream or a characteristic flow, a well-established mechanism is needed to discover knowledge and master the evolution
of knowl- edge in the dynamic data source. Therefore, the massive, heterogeneous and real-time characteristics of multisource data provide essential
differences between single-source knowledge discovery and multisource data mining.
Wu et al. [50], [51], [45] proposed and established the theory of local pattern analysis, which has laid a foundation for global knowledge discovery in
multisource data mining. This theory provides a solution not only for the problem of full search, but also for finding global models that traditional mining
methods cannot find. Local pattern analysis of data processing can avoid putting different data sources together to carry out centralized computing.
Data streams are widely used in financial analysis, online trading, medical testing, and so on. Static knowledge discovery methods cannot adapt to the
characteristics of dynamic data streams, such as continuity, variability, rapidity, and infinity, and can easily lead to the loss of useful information.
Therefore, effective theoretical and technical frameworks are needed to support data stream mining [18], [57].
Knowledge evolution is a common phenomenon in real- world systems. For example, the clinician’s treatment programs will constantly adjust with the
conditions of the patient, such as family economic status, health insurance, the course of treatment, treatment effects, and distribution of cardiovascular
and other chronic epidemiological changes with the passage of time. In the knowledge discovery process, concept drifting aims to analyze the
phenomenon of implicit target concept changes or even fundamental changes triggered by dynamics and context in data streams. According to different
types of concept drifts, knowledge evolution can take forms of mutation drift, progressive drift, and data distribution drift, based on single features, multiple
features, and streaming features [53].
4 CONCLUSIONS Driven by real-world applications and key industrial stakeholders and initialized by national funding agencies, managing and mining Big Data have shown to be
a challenging yet very compelling task. While the term Big Data literally concerns about data volumes, our HACE theorem suggests that the key
characteristics of the Big Data are 1) huge with heterogeneous and diverse data sources, 2) Autonomous with distributed and decentralized control, and 3)
complex nd evolving in data and knowledge association Such combined characteristics suggest that Big Data require a “big mind” to consolidate data for
maximum values [27]. To explore Big Data, we have analyzed several challenges at the data, model, and system levels. To support Big Data mining,
high-performance computing platforms are required, which impose systematic designs to unleash the full power of the Big Data. At the data level, the
autonomous information sources and the variety of the data collection environments, often result in data with complicated conditions, such as
missing/uncertain values. In other situations, privacy concerns, noise, and errors can be introduced into the data, to produce altered data copies. Developing

VOLUME NO. 4 (2014), ISSUE NO. 04 (APRIL) ISSN 2231-1009
INTERNATIONAL JOURNAL OF RESEARCH IN COMPUTER APPLICATION & MANAGEMENT A Monthly Double-Blind Peer Reviewed (Refereed/Juried) Open Access International e-Journal - Included in the International Serial Directories
http://ijrcm.org.in/
26
a safe and sound information sharing protocol is a major challenge. At the model level, the key challenge is to generate global models by combining locally
discovered patterns to form a unifying view. This requires carefully designed algorithms to analyze model correlations between distributed sites, and fuse
decisions from multiple sources to gain a best model out of the Big Data. At the system level, the essential challenge is that a Big Data mining framework needs
to consider complex relationships between samples, models, and data sources, along with their evolving changes with time and other possible factors. A system
needs to be carefully designed so that unstructured data can be linked through their complex relationships to form useful patterns, and the growth of data
volumes and item relationships should help form legitimate patterns to predict the trend and future.
We regard Big Data as an emerging trend and the need for Big Data mining is arising in all science and engineering domains. With Big Data technologies, we
will hopefully be able to provide most relevant and most accurate social sensing feedback to better understand our society at real- time. We can
further stimulate the participation of the public audiences in the data production circle for societal and economical events. The era of Big Data has arrived.
REFERENCES 1. R. Ahmed and G. Karypis, “Algorithms for Mining the Evolution of Conserved Relational States in Dynamic Networks,” Knowledge and Information
Systems, vol. 33, no. 3, pp. 603-630, Dec. 2012.
2. M.H. Alam, J.W. Ha, and S.K. Lee, “Novel Approaches to Crawling Important Pages Early,” Knowledge and Information Systems, vol. 33, no. 3, pp
707-734, Dec. 2012.
3. S. Aral and D. Walker, “Identifying Influential and Susceptible Members of Social Networks,” Science, vol. 337, pp. 337-341, 2012.
4. A. Machanavajjhala and J.P. Reiter, “Big Privacy: Protecting Confidentiality in Big Data,” ACM Crossroads, vol. 19, no. 1, pp. 20-23, 2012.
5. S. Banerjee and N. Agarwal, “Analyzing Collective Behavior from Blogs Using Swarm Intelligence,” Knowledge and Information Systems, vol. 33, no. 3,
pp. 523-547, Dec. 2012.
6. E. Birney, “The Making of ENCODE: Lessons for Big-Data Projects,” Nature, vol. 489, pp. 49-51, 2012.
7. J. Bollen, H. Mao, and X. Zeng, “Twitter Mood Predicts the Stock Market,” J. Computational Science, vol. 2, no. 1, pp. 1-8, 2011.
8. S. Borgatti, A. Mehra, D. Brass, and G. Labianca, “Network Analysis in the Social Sciences,” Science, vol. 323, pp. 892-895, 2009.
9. J. Bughin, M. Chui, and J. Manyika, Clouds, Big Data, and Smart Assets: Ten Tech-Enabled Business Trends to Watch. McKinSey Quarterly, 2010.
10. D. Centola, “The Spread of Behavior in an Online Social Network Experiment,” Science, vol. 329, pp. 1194-1197, 2010.
11. E.Y. Chang, H. Bai, and K. Zhu, “Parallel Algorithms for Mining Large-Scale Rich-Media Data,” Proc. 17th ACM Int’l Conf. Multi- media, (MM ’09,) pp.
917-918, 2009.
12. R. Chen, K. Sivakumar, and H. Kargupta, “Collective Mining of Bayesian Networks from Distributed Heterogeneous Data,” Knowledge and Information
Systems, vol. 6, no. 2, pp. 164-187, 2004.
13. Y.-C. Chen, W.-C. Peng, and S.-Y. Lee, “Efficient Algorithms for Influence Maximization in Social Networks,” Knowledge and Information Systems, vol. 33,
no. 3, pp. 577-601, Dec. 2012.
14. C.T. Chu, S.K. Kim, Y.A. Lin, Y. Yu, G.R. Bradski, A.Y. Ng, and K. Olukotun, “Map-Reduce for Machine Learning on Multicore,” Proc. 20th Ann. Conf. Neural
Information Processing Systems (NIPS’ 06), pp. 281-288, 2006.
15. G. Cormode and D. Srivastava, “Anonymized Data: Generation, Models, Usage,” Proc. ACM SIGMOD Int’l Conf. Management Data, pp. 1015-1018, 2009.
16. S. Das, Y. Sismanis, K.S. Beyer, R. Gemulla, P.J. Haas, and J. McPherson, “Ricardo: Integrating R and Hadoop,” Proc. ACM SIGMOD Int’l Conf.
Management Data (SIGMOD ’10), pp. 987-998. 2010.
17. P. Dewdney, P. Hall, R. Schilizzi, and J. Lazio, “The Square Kilometre Array,” Proc. IEEE, vol. 97, no. 8, pp. 1482-1496, Aug. 2009.
18. P. Domingos and G. Hulten, “Mining High-Speed Data Streams,” Proc. Sixth ACM SIGKDD Int’l Conf. Knowledge Discovery and Data Mining (KDD ’00), pp.
71-80, 2000.
19. G. Duncan, “Privacy by Design,” Science, vol. 317, pp. 1178-1179, 2007.
20. B. Efron, “Missing Data, Imputation, and the Bootstrap,” J. Am. Statistical Assoc., vol. 89, no. 426, pp. 463-475, 1994.
21. A. Ghoting and E. Pednault, “Hadoop-ML: An Infrastructure for the Rapid Implementation of Parallel Reusable Analytics,” Proc. Large-Scale Machine
Learning: Parallelism and Massive Data Sets Workshop (NIPS ’09), 2009.
22. D. Gillick, A. Faria, and J. DeNero, MapReduce: Distributed Computing for Machine Learning, Berkley, Dec. 2006.
23. M. Helft, “Google Uses Searches to Track Flu’s Spread,” The New York Times, http://www.nytimes.com/2008/11/12/technology/ internet/12flu.html.
2008.
24. D. Howe et al., “Big Data: The Future of Biocuration,” Nature, vol. 455, pp. 47-50, Sept. 2008.
25. B. Huberman, “Sociology of Science: Big Data Deserve a Bigger Audience,” Nature, vol. 482, p. 308, 2012.
26. “IBM What Is Big Data: Bring Big Data to the Enterprise,” http://www-01.ibm.com/software/data/bigdata/, IBM, 2012.
27. A. Jacobs, “The Pathologies of Big Data,” Comm. ACM, vol. 52, no. 8, pp. 36-44, 2009.
28. I. Kopanas, N. Avouris, and S. Daskalaki, “The Role of Domain Knowledge in a Large Scale Data Mining Project,” Proc. Second Hellenic Conf. AI:
Methods and Applications of Artificial Intelligence, I.P. Vlahavas, C.D. Spyropoulos, eds., pp. 288-299, 2002.
29. A. Labrinidis and H. Jagadish, “Challenges and Opportunities with Big Data,” Proc. VLDB Endowment, vol. 5, no. 12, 2032-2033, 2012
30. ] Y. Lindell and B. Pinkas, “Privacy Preserving Data Mining,” J. Cryptology, vol. 15, no. 3, pp. 177-206, 2002.
31. W. Liu and T. Wang, “Online Active Multi-Field Learning for Efficient Email Spam Filtering,” Knowledge and Information Systems, vol. 33, no. 1, pp. 117-
136, Oct. 2012.
32. J. Lorch, B. Parno, J. Mickens, M. Raykova, and J. Schiffman, “Shoroud: Ensuring Private Access to Large-Scale Data in the Data Center,” Proc. 11th
USENIX Conf. File and Storage Technologies (FAST ’13), 2013.
33. D. Luo, C. Ding, and H. Huang, “Parallelization with Multi- plicative Algorithms for Big Data Mining,” Proc. IEEE 12th Int’l Conf. Data Mining, pp. 489-
498, 2012.
34. J. Mervis, “U.S. Science Policy: Agencies Rally to Tackle Big Data,” Science, vol. 336, no. 6077, p. 22, 2012.
35. Xindong Wu, Xingquan Zhu, Gong-Qing Wu, and Wei Ding “Data Mining with Big Data”, IEEE Trans. Knowledge And Data Engineering, vol. 26, no. 1, pp 97-
107, JAN 2014
36. T. Mitchell, “Mining our Reality,” Science, vol. 326, pp. 1644-1645, 2009
37. Nature Editorial, “Community Cleverness Required,” Nature, vol. 455, no. 7209, p. 1, Sept. 2008.
38. S. Papadimitriou and J. Sun, “Disco: Distributed Co-Clustering with Map-Reduce: A Case Study Towards Petabyte-Scale End-to- End Mining,” Proc. IEEE
Eighth Int’l Conf. Data Mining (ICDM ’08), pp. 512-521, 2008.
39. C. Ranger, R. Raghuraman, A. Penmetsa, G. Bradski, and C.Kozyrakis, “Evaluating MapReduce for Multi-Core and Multi- processor Systems,” Proc.
IEEE 13th Int’l Symp. High Perfor- mance Computer Architecture (HPCA ’07), pp. 13-24, 2007.
40. A. Rajaraman and J. Ullman, Mining of Massive Data Sets. Cambridge Univ. Press, 2011.
41. C. Reed, D. Thompson, W. Majid, and K. Wagstaff, “Real Time Machine Learning to Find Fast Transient Radio Anomalies: A Semi-Supervised Approach
Combining Detection and RFI Exci- sion,” Proc. Int’l Astronomical Union Symp. Time Domain Astronomy, Sept. 2011.
42. E. Schadt, “The Changing Privacy Landscape in the Era of Big Data,” Molecular Systems, vol. 8, article 612, 2012.
43. J. Shafer, R. Agrawal, and M. Mehta, “SPRINT: A Scalable Parallel Classifier for Data Mining,” Proc. 22nd VLDB Conf., 1996.
44. A. da Silva, R. Chiky, and G. He´ brail, “A Clustering Approach for Sampling Data Streams in Sensor Networks,” Knowledge and Information Systems, vol.
32, no. 1, pp. 1-23, July 2012.

VOLUME NO. 4 (2014), ISSUE NO. 04 (APRIL) ISSN 2231-1009
INTERNATIONAL JOURNAL OF RESEARCH IN COMPUTER APPLICATION & MANAGEMENT A Monthly Double-Blind Peer Reviewed (Refereed/Juried) Open Access International e-Journal - Included in the International Serial Directories
http://ijrcm.org.in/
27
45. K. Su, H. Huang, X. Wu, and S. Zhang, “A Logical Framework for Identifying Quality Knowledge from Different Data Sources,” Decision Support Systems,
vol. 42, no. 3, pp. 1673-1683, 2006.
46. “Twitter Blog, Dispatch from the Denver Debate,” http:// blog.twitter.com/2012/10/dispatch-from-denver-debate.html, Oct. 2012.
47. D. Wegener, M. Mock, D. Adranale, and S. Wrobel, “Toolkit-Based High-Performance Data Mining of Large Data on MapReduce Clusters,” Proc. Int’l Conf.
Data Mining Workshops (ICDMW ’09), pp. 296-301, 2009.
48. C. Wang, S.S.M. Chow, Q. Wang, K. Ren, and W. Lou, “Privacy- Preserving Public Auditing for Secure Cloud Storage” IEEE Trans. Computers, vol. 62, no.
2, pp. 362-375, Feb. 2013.
49. X. Wu and X. Zhu, “Mining with Noise Knowledge: Error-Aware Data Mining,” IEEE Trans. Systems, Man and Cybernetics, Part A, vol. 38, no. 4, pp. 917-
932, July 2008.
50. X. Wu and S. Zhang, “Synthesizing High-Frequency Rules from Different Data Sources,” IEEE Trans. Knowledge and Data Eng., vol. 15, no. 2, pp. 353-
367, Mar./Apr. 2003.
51. X. Wu, C. Zhang, and S. Zhang, “Database Classification for Multi-Database Mining,” Information Systems, vol. 30, no. 1, pp. 71-88, 2005.
52. X. Wu, “Building Intelligent Learning Database Systems,” AI Magazine, vol. 21, no. 3, pp. 61-67, 2000.
53. X. Wu, K. Yu, W. Ding, H. Wang, and X. Zhu, “Online Feature Selection with Streaming Features,” IEEE Trans. Pattern Analysis and Machine Intelligence,
vol. 35, no. 5, pp. 1178-1192, May 2013.
54. A. Yao, “How to Generate and Exchange Secretes,” Proc. 27th Ann. Symp. Foundations Computer Science (FOCS) Conf., pp. 162-167, 1986.
55. M. Ye, X. Wu, X. Hu, and D. Hu, “Anonymizing Classification Data Using Rough Set Theory,” Knowledge-Based Systems, vol. 43, pp. 82-94, 2013.

VOLUME NO. 4 (2014), ISSUE NO. 04 (APRIL) ISSN 2231-1009
INTERNATIONAL JOURNAL OF RESEARCH IN COMPUTER APPLICATION & MANAGEMENT A Monthly Double-Blind Peer Reviewed (Refereed/Juried) Open Access International e-Journal - Included in the International Serial Directories
http://ijrcm.org.in/
28
CONSUMER ATTITUDE TOWARDS THE BRANDED APPARELS IN MEN IN THANJAVUR DISTRICT
K. NALINI
ASST. PROFESSOR
MASS COLLEGE OF ARTS & SCIENCE
KUMBAKONAM
ABSTRACT In the present world, consumer’s purchase behavior is differentiated among consumers and is based on their personal cultural, social and environmental factors.
Branding plays an important role in the creation of demand and its retention consumer behavior attitude is a field of study which focuses consumer activities.
Nowadays researches and practitioners have focused on consumption analysis why and how people consume in addition to why and how they buy consumer
behavior is an emerging field which attempts to understand and predict human actions with regard to purchase decisions. It mainly describes how individuals
decide to spend their resources (time, money, effort) on consumption related items, consumer behavior is equivalent to marketing, items marketing involves
sizing up consumer behavior and responding to it appropriately through strategy. In this context consumer behavior and brand preference of apparels is
undertaken as a study for research keywords consumer behavior, brand preference, apparels, consumption pattern, influencing factor.
1. INTRODUCTION onsumers vary in one form or other on the basics of their likes, dislikes, attitude income levels etc. The behavior of consumers is complex, dynamic, multi-
dimensional process and all marketing decisions are based on assumptions about consumer behavior the cultural and social factors influence the
consumer while they purchase the apparels the area where the consumers belongs to also plays a vital role in deciding the behavior of consumers in
choosing the apparels the Indian consumers are subject to various changes on the basis of their spending habits.
2. RESEARCH OBJECTIVE 1. To study overall profile of the consumers
2. To analysis factors influencing the purchase decision
3. To assess the store selection process of the consumer
4. To evaluate brand preference, brand loyalty among the consumer.
5. To identity the major promotional tools attracting the consumer on purchasing to identify the overall individual’s attitudes of the consumers towards
purchase decisions.
3. IMPORTANCE OF BRANDS 1. It acts as an implement for sales promotion in the market
2. It creates the brand publicity
3. It facilities consumer preference our products.
4. STATEMENT OF THE PROBLEM The present study deals with the study of consumer preferences toward branded apparels the consumer behavior differs from brand to brand on the basis of
quality, quantity, price, taste, advertisement etc. The complication had undergone to identify consumer’s perception.
5. RESEARCH METHODOLOGY 1. DATA COLLECTION PRIMARY DATA COLLECTION
The data collected for the initial study and they have their originality. The data are collected by means of structured questionnaire. The questions was prepared
and given to consumers of thanjavur district the result of the information obtained from various customers are analyzed.
2. SECONDARY DATA SECTION
Secondary data are these which are already collected by someone for some purposes and are available for the present study. Secondary data were collected
from the websites, company profiles, newspapers, magazines and through general discussion with company persons.
3. QUESTIONNAIRE DESIGN
The relevant information was obtained from 100 college students of the district thanjavur. A questionnaire was prepared and distributed to the consumers.
6. REVIEW OF LITERATURE Lalitha et al., (2008) made a study entitled "Brand Preference of Men’s wear". Scope of the study focuses on the brand preference regarding shirts and pants of
select consumers living in twin cities of Hyderabad and Secunderabad. It is confined to the customers visiting the select showrooms in Hyderabad and
Secunderabad. The objectives of this study were to know the reason why customers prefer branded shirts and pants to unbranded ones, to find out the
influence of advertisement for branded clothing for the purchase behavior of the respondent and to know the factors influencing customers while choosing
branded shirts or pants. It is concluded that educational qualifications, employment status, age group, convenience of shops, and advertisement are influencing
factors for purchasing the branded shirts and pants by the respondents. 94percent of the respondents are highly educated and purchased branded ready wears.
Age group of 20-50 years is income earning people and spending on the branded wears. The study reveals that the advertisements play a limited role to choose
the brand among ready-made dresses available in the market. 54percent of the customers are buying branded ready wear because of quality and status symbol.
Ritu Narang (2006) in a study entitled “A Study on Branded Men’s wear”, was taken up in the city of Lucknow with an intention to explore the purchase behavior
of the buyers of branded men’s wear. The objectives of this research are to study the purchase behavior of the buyers of branded men’s garments, to study the
impact of advertising on the purchase decision of buyers, to study the impact of promotional activities on purchase behavior of buyers (Kazmi, 2001; Mathur,
2002). The research type was exploratory as it was conducted to develop a concept about the purchasing behavior of buyers of branded men’s garments and the
impact of advertising on their purchase decision. This study concluded that most of the times buyers visit the showrooms of branded garments with the purpose
of shopping (Jaishri and Jethwaney, 1999). The purchasing of branded garments is not impulsive. However, compared to women, male buyers visit the
showroom for passing the time; the number of people visiting the showroom with a brand in mind is same as the number of people visiting the showroom with
no brand in mind; Advertising has maximum impact in creating brand awareness (Kamalaveni, 2008).
Pathak and Tripathi (2009) made a study entitled “Customer Shopping Behavior among Modem Retail Formats: A Study of Delhi & NCR”. The Study is an
exploratory research conducted in Delhi & NCR. It specifically focuses on customer shopping behavior in Indian scenario among the modern retail formats
(Sumathi, 2003). Objectives of the study are to find out the factors that affect the buyer's decisions among the modern retail formats and to evaluate the
comparative strength of these factors in buying decision of the buyers.
C

VOLUME NO. 4 (2014), ISSUE NO. 04 (APRIL) ISSN 2231-1009
INTERNATIONAL JOURNAL OF RESEARCH IN COMPUTER APPLICATION & MANAGEMENT A Monthly Double-Blind Peer Reviewed (Refereed/Juried) Open Access International e-Journal - Included in the International Serial Directories
http://ijrcm.org.in/
29
On the basis of primary as well as secondary research the authors note that retailers often over look the schemes and offerings expected by the customers and
tried to impose their own offerings upon customers which ultimately cause the dissatisfaction (Fornell, et al., 2006; 2009). It is also observed that in the changing
retailing environment, understanding the psyche of a customer is critical for success in retailing. Aggregate level picture may be misleading, as it averages the
beats and the valleys. Hence, Individual understanding is desirable (Mishra, 2009). It is further stated that the Indian customers have become more sensitive to
quality, customer service and status. She/he is ready to pay, sometimes, astronomical sums, provided their needs are satisfied. They are basically looking for an
experience which is more of cognitive than physical (Biplab (1998)).
7. FACTORS INFLUENCING THE CONSUMER BEHAVIOR QUALITY: Consumers often judge the quality of a product on the basis of a variety of informational cues that they associate with the product. Some of these
cues are specific product characteristics (for example, color) and are therefore, intrinsic cues. Some cues are extrinsic to the product, for example, price, store
image, and brand image. Extrinsic cues are attributes which are ‘product related’ but are not a part of the physical product (Wheatley, Chiu and Goldman, 1981).
Either individually or integrated, these intrinsic and extrinsic cues form the foundation for perceptions of product quality.
PRICE: Many researchers found out that once a consumer identifies the price difference between one brand to another, price variations begin to affect their
preferences. Thus price is an important factor that affects a consumer behavior while evaluating the brand/ product.
FRIENDS AND FAMILY: Individuals members of families play major role in deciding me model of apparel they seek information about product of relevant the
decision makers of the power to determine issues such as whether to buy which product to buy, which brand to buy where to buy, and when to buy.
CONSUMER CHARACTERISTICS: The consumers attribute like involvement fashion and brand consciousness, loyalty, emotion, differs from consumer to
consumers and it have as it impact in choosing the apparel. The preference of readymade garments, brand consciousness receiving or giving apparel as a gift
loyalty towards store and product brand.
REFERENCE GROUP: The factors like television ads, magazine consumer’s favorite celebrities of stars, friends, family members and other persons. The dimension
of their influence is indicated by TV shows, magazines, favorite celebrities, influence of friends, friends favor toward apparel buyer behavior of the consumer,
parent’s preference and other people perception.
STORE ATTRIBUTES: These are the store atmosphiciecs and characteristics like facilities in the stone services, provided by the store storage etc.
PROMOTION: The retail stores adopt various promotional techniques there is a significant positive influence of promotional techniques on consumer buying
behavior.
PRODUCT ATTRIBUTES: Features of the product like quality, price, brand, fit etc mentions that researches have identified many product attribute and criteria
that are critical for fashion consumer in clothing purchases.
8. RESULT & DISCUSSIONS The study reveals at the above factors influence the buying behavior of consumers. It also contributes to the academic by providing a conceptual framework to
understand the apparel buying behavior of Indian consumers. It will provide a clear insight of buying behavior in apparel buying this may even get improved by
improving the strategies applied for testing.
LIMITATIONS
Every research has its own limitations. This study was conducted in only one city and with limited number of respondents. Data collections were primary and so
it suffers from the limitations of the primary data. May factors like economy, technology and not included in this study.
9. CONCLUSION Consumers often judge the quality of a product on the basis of a variety of informational cues that they associate with the product. Some of these cues are
specific product characteristics (for example, color) and are therefore, intrinsic cues. Some cues are extrinsic to the product, for example, price, store image, and
brand image. Extrinsic cues are attributes which are ‘product related’ but are not a part of the physical product (Wheatley, Chiu and Goldman, 1981). Either
individually or integrated, these intrinsic and extrinsic cues form the foundation for perceptions of product quality.
REFERENCES 1. Bakewell, C. and Mitchell, V. W. (2006). Male versus female consumer decision making. Journal of Business Research, 59, 12971300.
2. Biplab, S. B. (1998). Hand Book of Marketing Management, Himalaya Publishing House, Bombay, 1st Edition.
3. Canabal, M. E. (2001). Decision making styles of young South Indian consumers: An exploratory study. College Student Journal, 36(1), 1219.
4. Fornell, C., S. Mithas, and F.V. Morgeson III (2009). "The Economic and Statistical Significance of Stock Returns on Customer Satisfaction," Marketing
Science, 28(5), 820825.
5. Fornell, C., S. Mithas, F.V. Morgeson III, and M.S. Krishnan (2006). “Customer Satisfaction and Stock Prices: High Returns, Low Risk,” Journal of Marketing,
70(1), 3−14
6. Jaishri, N. Jethwaney, (1999). Advertising, Phoenix Publishing House, New Delhi, 1st Edition. Jaishri, Y. (1998).Consumer behavior and fashion. Textile
trends. 40:3343.
7. Kamalaveni. D., Kalaiselvi, S. and Rajalakshmi, S. (2008). Brand Loyalty of Women consumers with respect to FMCGs. Indian Journal of Marketing, 38(9), PP.
4450.
8. Kazmi. S.H.H. (2001). Advertising and Sale Promotion, Excel Books, New Delhi, 1st Edition.
9. Lalitha. A., Ravikumar, J.and Padmavali, K. (2008). Brand preference of Men Wear. Indian Journal of Marketing, 38(10), pp.3336.
10. Mathur. V.C.(2002). Advertising Management, New Age International Publishers, New Delhi, 1st edition.
11. Mishra, Sita (2009).“New Retail Models in India: Strategic Perspective Analysis”, Journal of Marketing and Communication, Dec. 2008, Vol 4, No.2,pp. 3947.
TEXT BOOKS
12. Marketing by S.A.Sherlekhar.
13. Roger D.Blackwell, Paul W.Minard, James F.Engel, “Consumer Behavior” Harcourtollege Publishers.

VOLUME NO. 4 (2014), ISSUE NO. 04 (APRIL) ISSN 2231-1009
INTERNATIONAL JOURNAL OF RESEARCH IN COMPUTER APPLICATION & MANAGEMENT A Monthly Double-Blind Peer Reviewed (Refereed/Juried) Open Access International e-Journal - Included in the International Serial Directories
http://ijrcm.org.in/
30
FINANCIAL HEALTH THROUGH Z SCORE ANALYSIS: A CASE STUDY ON SELECTED PHARMACEUTICAL
COMPANIES
NIRMAL CHAKRABORTY
ASST. PROFESSOR
MAHISHADAL RAJ COLLEGE
VIDYASAGAR UNIVERSITY
MEDINIPUR
ABSTRACT Survival of the business in the modem world is possible, only when, apart from other things, it has optimum level of finance which is required to meet its both
short term and long term commitment. The objective of the study is to examine the financial health of the selected four companies (namely, Dr. Reddy’s
laboratories, Ranbaxy laboratories, CIPLA and Aurobindo pharma) during the period 1999-2000 to 2011-2012. Z Score model, developed by Edward I Altman, has
been applied to examine the financial health of the selected companies under the study period. The research findings are that overall financial health of all the
selected companies was good.
KEYWORDS Business commitment, Financial health, optimum finance, Z score.
INTRODUCTION n the changing scenario, every business strives hard for survival in the present day’s era of cut throat competition. Survival of the business is possible, only
when, apart from other things, it has a sound financial position. The finance is required to meet its long term as well as short term liabilities. To meet long
term liability, it requires permanent capital and for short term liability, it requires working capital. Therefore, finance is important for every type of
business. However, both excessive as well as inadequate finance position are harmful for the business. Therefore, analysis of financial position on regular basis is
very much urgent2.
Company’s performance is judged by its financial statement in the light of operational efficiency of the company. Due to cut throat competition among the
business community, everyone is doing something better than the others to capture the market. Therefore, monitoring the financial health of a company by
checking its sales volume and the growth of profit is not sufficient for present situation. It is necessary to check the utilization of capital, assets, and return to
shareholders as well as predicting financial distress. Several indicators and information sources can help to predict and to prevent from the financial distress.
Financial statement analysis is one of the methods by which analysis of financial distress can be predicted.
To analyze the financial position and performance of the company different tools are employed. Among of the different tools, ratio analysis is a widely used tool,
which is relevant in assessing the performance of the firm in respect of the liquidity position, managerial efficiency position, operational performance
measurement and long term as well as short term solvency position. In addition to the above, it also supports to predict the financial distress of the business. No
single ratio can provide a meaningful complete picture of a company’s financial health position.
Under the circumstances, an attempt has been made in the present study to have an insight into the examination of financial health of the selected
pharmaceutical companies.
COMPANIES PROFILE Dr. Reddy’s Laboratories is one of the popular pharmaceutical companies with base in more than 100 countries. The company is very much customer friendly.
Though the company is located in various parts of the world, it has its headquarters in India. The subsidiaries of this company are found at various countries like
US, Germany, UK, Russia and Brazil. It takes care of the fact that maximum people get benefited by the products of this pharmaceutical company. It
commercialized various treatments so as to provide high tech treatment to the masses. It tries to meet the medical needs to the people.
Ranbaxy is among the predominant pharmaceutical companies in India and was founded in 1961. It is a research based pharma giant and became a public
limited company in 1973.Ranbaxy was recently ranked the top 10 international pharmaceutical companies in the world have presence across 49 countries.
CIPLA was founded by Khwaja Abdul Hamied in 1935and was known as The Chemical, Industrial and Pharmaceutical Laboratories, though it is better known by
the acronym CIPLA today. It was registered in August, 1935 as a public limited enterprise. Today, the company has its facilities spread across several location s
across India. It has an extensive export market and regularly exports more than 150 countries.
Aurobindo Pharma , an India based private pharmaceutical company having presence around the world. It was set up in the year 1986 and started its operation
in 1988-89 in Pondicherry, India. Now, the company is headquartered at Hyderabad, India. It is one of the most respected generic pharmaceuticals and active
pharmaceutical ingredients manufacturing company of the world. The company operates in over 100 countries across the world. Aurobindo pharma products
cover segments like- Antibiotics, Anti-Retro Virals, CVS, and CNS, gastroenterological, Anti-Allergic.
LITERATURE REVIEW Mulla
4 (2002) in his article entitled “Use of Z-score Analysis for Evaluation of Financial Health of Textile Mills - A Case Study.”made a study in Textile mill with the
help of Z-score model for evaluating the financial health with five weighted financial ratios .
Selvam M6., Vanitha, S., & Babu. (2004 July),in their article entitled “ A Study on Financial Health of Cement Industry - Z-score Analysis” which revealed about
Cement industry’s financial heath with special reference to India Cements Limited.
Bagchi, S5. (2004, July)in his article entitled “ Accounting Ratios for Risk Evaluation” analyzed about practical implication of accounting ratios in risk evaluation
and concluded that accounting ratios are still dominant factors in the matter of credit risk evaluation.
Chaitanya, V. K7. (2005, August) in his article entitled “Measuring Financial Distress of IDBI using Altman Z-score Model” used Z-score model to measure the
financial fitness of IDBI and concluded that IDBI is likely to become insolvent in the years to come.
Chowdhury, A., & Barua, S1. (2009) in their article entitled “Rationalities of Z-category Shares in Dhaka Stock Exchange: Are They in Financial Distress Risk?”,
investigate the financial attributes of Z- category companies’ shares using Z-score analysis and found that ninety percent of those companies are suffering with
financial problem.
RESEARCH GAP All the above reviews show the significance of measurement of financial distress in several companies other than pharmaceutical companies. Rather a few
studies have been made on pharmaceutical companies in India. The present study made an attempt to measure the financial distress along with liquidity,
solvency and leverage position of select pharmaceutical companies in India. The Indian pharmaceutical companies are also competing with some of the best
companies in the global market. The industry is capital intensive and intellectual in nature and in the front rank of India’s science based industries. Indian
I
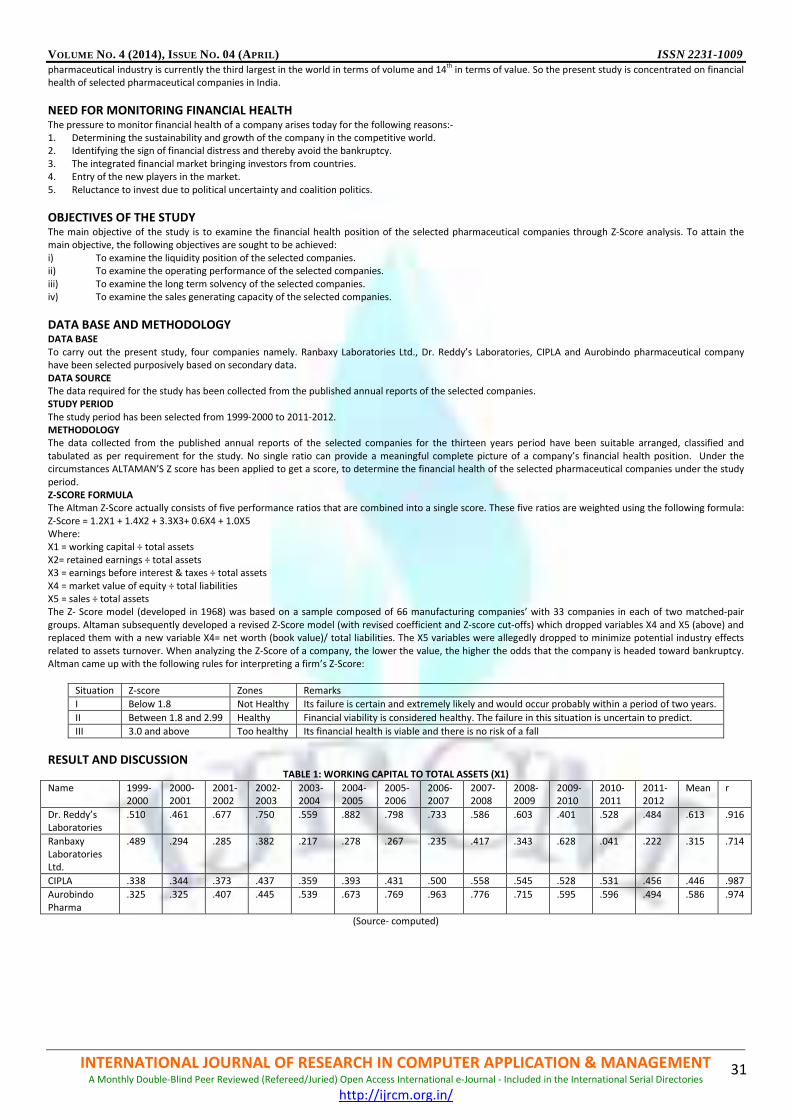
VOLUME NO. 4 (2014), ISSUE NO. 04 (APRIL) ISSN 2231-1009
INTERNATIONAL JOURNAL OF RESEARCH IN COMPUTER APPLICATION & MANAGEMENT A Monthly Double-Blind Peer Reviewed (Refereed/Juried) Open Access International e-Journal - Included in the International Serial Directories
http://ijrcm.org.in/
31
pharmaceutical industry is currently the third largest in the world in terms of volume and 14th
in terms of value. So the present study is concentrated on financial
health of selected pharmaceutical companies in India.
NEED FOR MONITORING FINANCIAL HEALTH The pressure to monitor financial health of a company arises today for the following reasons:-
1. Determining the sustainability and growth of the company in the competitive world.
2. Identifying the sign of financial distress and thereby avoid the bankruptcy.
3. The integrated financial market bringing investors from countries.
4. Entry of the new players in the market.
5. Reluctance to invest due to political uncertainty and coalition politics.
OBJECTIVES OF THE STUDY The main objective of the study is to examine the financial health position of the selected pharmaceutical companies through Z-Score analysis. To attain the
main objective, the following objectives are sought to be achieved:
i) To examine the liquidity position of the selected companies.
ii) To examine the operating performance of the selected companies.
iii) To examine the long term solvency of the selected companies.
iv) To examine the sales generating capacity of the selected companies.
DATA BASE AND METHODOLOGY DATA BASE
To carry out the present study, four companies namely. Ranbaxy Laboratories Ltd., Dr. Reddy’s Laboratories, CIPLA and Aurobindo pharmaceutical company
have been selected purposively based on secondary data.
DATA SOURCE
The data required for the study has been collected from the published annual reports of the selected companies.
STUDY PERIOD
The study period has been selected from 1999-2000 to 2011-2012.
METHODOLOGY
The data collected from the published annual reports of the selected companies for the thirteen years period have been suitable arranged, classified and
tabulated as per requirement for the study. No single ratio can provide a meaningful complete picture of a company’s financial health position. Under the
circumstances ALTAMAN’S Z score has been applied to get a score, to determine the financial health of the selected pharmaceutical companies under the study
period.
Z-SCORE FORMULA
The Altman Z-Score actually consists of five performance ratios that are combined into a single score. These five ratios are weighted using the following formula:
Z-Score = 1.2X1 + 1.4X2 + 3.3X3+ 0.6X4 + 1.0X5
Where:
X1 = working capital ÷ total assets
X2= retained earnings ÷ total assets
X3 = earnings before interest & taxes ÷ total assets
X4 = market value of equity ÷ total liabilities
X5 = sales ÷ total assets
The Z- Score model (developed in 1968) was based on a sample composed of 66 manufacturing companies’ with 33 companies in each of two matched-pair
groups. Altaman subsequently developed a revised Z-Score model (with revised coefficient and Z-score cut-offs) which dropped variables X4 and X5 (above) and
replaced them with a new variable X4= net worth (book value)/ total liabilities. The X5 variables were allegedly dropped to minimize potential industry effects
related to assets turnover. When analyzing the Z-Score of a company, the lower the value, the higher the odds that the company is headed toward bankruptcy.
Altman came up with the following rules for interpreting a firm’s Z-Score:
Situation Z-score Zones Remarks
I Below 1.8 Not Healthy Its failure is certain and extremely likely and would occur probably within a period of two years.
II Between 1.8 and 2.99 Healthy Financial viability is considered healthy. The failure in this situation is uncertain to predict.
III 3.0 and above Too healthy Its financial health is viable and there is no risk of a fall
RESULT AND DISCUSSION TABLE 1: WORKING CAPITAL TO TOTAL ASSETS (X1)
Name 1999-
2000
2000-
2001
2001-
2002
2002-
2003
2003-
2004
2004-
2005
2005-
2006
2006-
2007
2007-
2008
2008-
2009
2009-
2010
2010-
2011
2011-
2012
Mean r
Dr. Reddy’s
Laboratories
.510 .461 .677 .750 .559 .882 .798 .733 .586 .603 .401 .528 .484 .613 .916
Ranbaxy
Laboratories
Ltd.
.489 .294 .285 .382 .217 .278 .267 .235 .417 .343 .628 .041 .222 .315 .714
CIPLA .338 .344 .373 .437 .359 .393 .431 .500 .558 .545 .528 .531 .456 .446 .987
Aurobindo
Pharma
.325 .325 .407 .445 .539 .673 .769 .963 .776 .715 .595 .596 .494 .586 .974
(Source- computed)
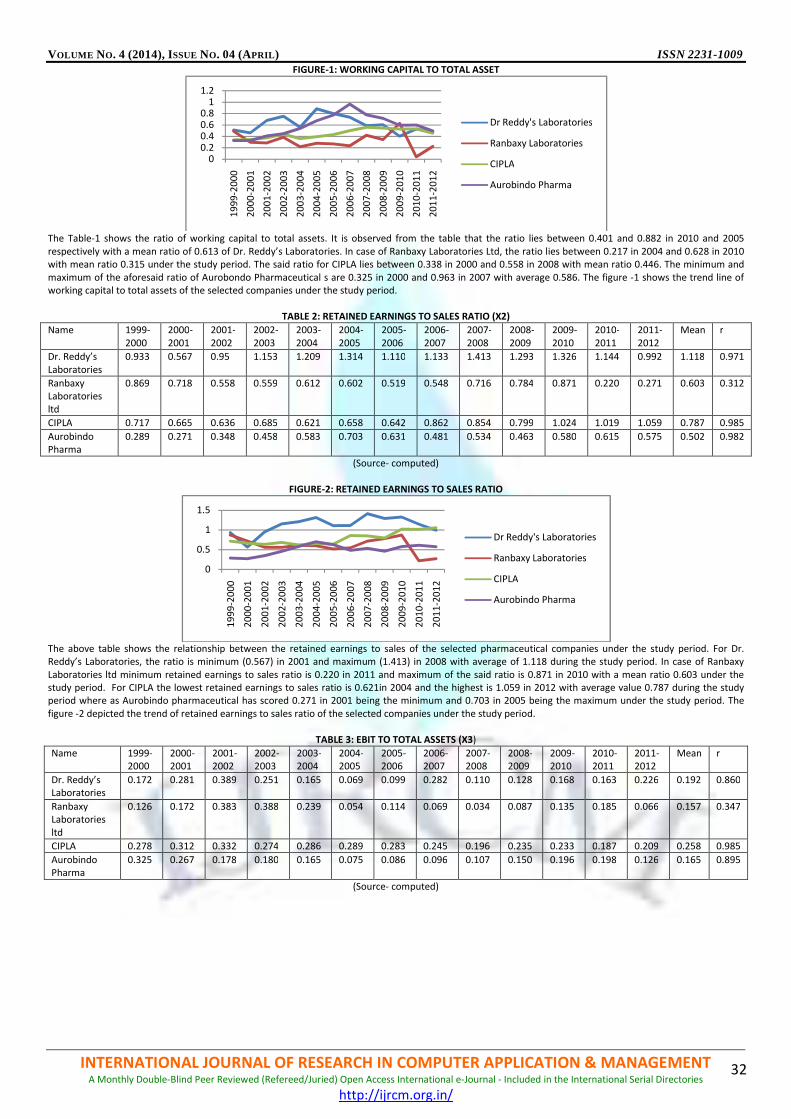
VOLUME NO. 4 (2014), ISSUE NO. 04 (APRIL) ISSN 2231-1009
INTERNATIONAL JOURNAL OF RESEARCH IN COMPUTER APPLICATION & MANAGEMENT A Monthly Double-Blind Peer Reviewed (Refereed/Juried) Open Access International e-Journal - Included in the International Serial Directories
http://ijrcm.org.in/
32
FIGURE-1: WORKING CAPITAL TO TOTAL ASSET
The Table-1 shows the ratio of working capital to total assets. It is observed from the table that the ratio lies between 0.401 and 0.882 in 2010 and 2005
respectively with a mean ratio of 0.613 of Dr. Reddy’s Laboratories. In case of Ranbaxy Laboratories Ltd, the ratio lies between 0.217 in 2004 and 0.628 in 2010
with mean ratio 0.315 under the study period. The said ratio for CIPLA lies between 0.338 in 2000 and 0.558 in 2008 with mean ratio 0.446. The minimum and
maximum of the aforesaid ratio of Aurobondo Pharmaceutical s are 0.325 in 2000 and 0.963 in 2007 with average 0.586. The figure -1 shows the trend line of
working capital to total assets of the selected companies under the study period.
TABLE 2: RETAINED EARNINGS TO SALES RATIO (X2)
Name 1999-
2000
2000-
2001
2001-
2002
2002-
2003
2003-
2004
2004-
2005
2005-
2006
2006-
2007
2007-
2008
2008-
2009
2009-
2010
2010-
2011
2011-
2012
Mean r
Dr. Reddy’s
Laboratories
0.933 0.567 0.95 1.153 1.209 1.314 1.110 1.133 1.413 1.293 1.326 1.144 0.992 1.118 0.971
Ranbaxy
Laboratories
ltd
0.869 0.718 0.558 0.559 0.612 0.602 0.519 0.548 0.716 0.784 0.871 0.220 0.271 0.603 0.312
CIPLA 0.717 0.665 0.636 0.685 0.621 0.658 0.642 0.862 0.854 0.799 1.024 1.019 1.059 0.787 0.985
Aurobindo
Pharma
0.289 0.271 0.348 0.458 0.583 0.703 0.631 0.481 0.534 0.463 0.580 0.615 0.575 0.502 0.982
(Source- computed)
FIGURE-2: RETAINED EARNINGS TO SALES RATIO
The above table shows the relationship between the retained earnings to sales of the selected pharmaceutical companies under the study period. For Dr.
Reddy’s Laboratories, the ratio is minimum (0.567) in 2001 and maximum (1.413) in 2008 with average of 1.118 during the study period. In case of Ranbaxy
Laboratories ltd minimum retained earnings to sales ratio is 0.220 in 2011 and maximum of the said ratio is 0.871 in 2010 with a mean ratio 0.603 under the
study period. For CIPLA the lowest retained earnings to sales ratio is 0.621in 2004 and the highest is 1.059 in 2012 with average value 0.787 during the study
period where as Aurobindo pharmaceutical has scored 0.271 in 2001 being the minimum and 0.703 in 2005 being the maximum under the study period. The
figure -2 depicted the trend of retained earnings to sales ratio of the selected companies under the study period.
TABLE 3: EBIT TO TOTAL ASSETS (X3)
Name 1999-
2000
2000-
2001
2001-
2002
2002-
2003
2003-
2004
2004-
2005
2005-
2006
2006-
2007
2007-
2008
2008-
2009
2009-
2010
2010-
2011
2011-
2012
Mean r
Dr. Reddy’s
Laboratories
0.172 0.281 0.389 0.251 0.165 0.069 0.099 0.282 0.110 0.128 0.168 0.163 0.226 0.192 0.860
Ranbaxy
Laboratories
ltd
0.126 0.172 0.383 0.388 0.239 0.054 0.114 0.069 0.034 0.087 0.135 0.185 0.066 0.157 0.347
CIPLA 0.278 0.312 0.332 0.274 0.286 0.289 0.283 0.245 0.196 0.235 0.233 0.187 0.209 0.258 0.985
Aurobindo
Pharma
0.325 0.267 0.178 0.180 0.165 0.075 0.086 0.096 0.107 0.150 0.196 0.198 0.126 0.165 0.895
(Source- computed)
00.20.40.60.8
11.2
19
99
-20
00
20
00
-20
01
20
01
-20
02
20
02
-20
03
20
03
-20
04
20
04
-20
05
20
05
-20
06
20
06
-20
07
20
07
-20
08
20
08
-20
09
20
09
-20
10
20
10
-20
11
20
11
-20
12
Dr Reddy's Laboratories
Ranbaxy Laboratories
CIPLA
Aurobindo Pharma
0
0.5
1
1.5
19
99
-20
00
20
00
-20
01
20
01
-20
02
20
02
-20
03
20
03
-20
04
20
04
-20
05
20
05
-20
06
20
06
-20
07
20
07
-20
08
20
08
-20
09
20
09
-20
10
20
10
-20
11
20
11
-20
12
Dr Reddy's Laboratories
Ranbaxy Laboratories
CIPLA
Aurobindo Pharma
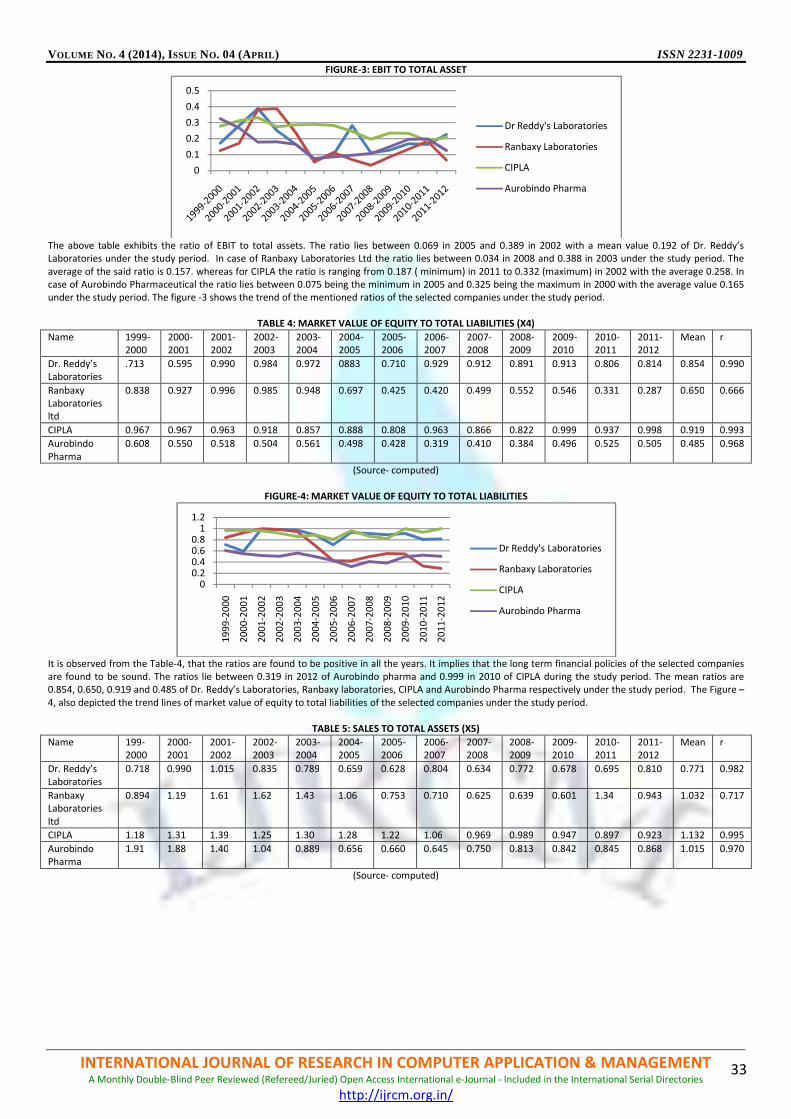
VOLUME NO. 4 (2014), ISSUE NO. 04 (APRIL) ISSN 2231-1009
INTERNATIONAL JOURNAL OF RESEARCH IN COMPUTER APPLICATION & MANAGEMENT A Monthly Double-Blind Peer Reviewed (Refereed/Juried) Open Access International e-Journal - Included in the International Serial Directories
http://ijrcm.org.in/
33
FIGURE-3: EBIT TO TOTAL ASSET
The above table exhibits the ratio of EBIT to total assets. The ratio lies between 0.069 in 2005 and 0.389 in 2002 with a mean value 0.192 of Dr. Reddy’s
Laboratories under the study period. In case of Ranbaxy Laboratories Ltd the ratio lies between 0.034 in 2008 and 0.388 in 2003 under the study period. The
average of the said ratio is 0.157. whereas for CIPLA the ratio is ranging from 0.187 ( minimum) in 2011 to 0.332 (maximum) in 2002 with the average 0.258. In
case of Aurobindo Pharmaceutical the ratio lies between 0.075 being the minimum in 2005 and 0.325 being the maximum in 2000 with the average value 0.165
under the study period. The figure -3 shows the trend of the mentioned ratios of the selected companies under the study period.
TABLE 4: MARKET VALUE OF EQUITY TO TOTAL LIABILITIES (X4)
Name 1999-
2000
2000-
2001
2001-
2002
2002-
2003
2003-
2004
2004-
2005
2005-
2006
2006-
2007
2007-
2008
2008-
2009
2009-
2010
2010-
2011
2011-
2012
Mean r
Dr. Reddy’s
Laboratories
.713 0.595 0.990 0.984 0.972 0883 0.710 0.929 0.912 0.891 0.913 0.806 0.814 0.854 0.990
Ranbaxy
Laboratories
ltd
0.838 0.927 0.996 0.985 0.948 0.697 0.425 0.420 0.499 0.552 0.546 0.331 0.287 0.650 0.666
CIPLA 0.967 0.967 0.963 0.918 0.857 0.888 0.808 0.963 0.866 0.822 0.999 0.937 0.998 0.919 0.993
Aurobindo
Pharma
0.608 0.550 0.518 0.504 0.561 0.498 0.428 0.319 0.410 0.384 0.496 0.525 0.505 0.485 0.968
(Source- computed)
FIGURE-4: MARKET VALUE OF EQUITY TO TOTAL LIABILITIES
It is observed from the Table-4, that the ratios are found to be positive in all the years. It implies that the long term financial policies of the selected companies
are found to be sound. The ratios lie between 0.319 in 2012 of Aurobindo pharma and 0.999 in 2010 of CIPLA during the study period. The mean ratios are
0.854, 0.650, 0.919 and 0.485 of Dr. Reddy’s Laboratories, Ranbaxy laboratories, CIPLA and Aurobindo Pharma respectively under the study period. The Figure –
4, also depicted the trend lines of market value of equity to total liabilities of the selected companies under the study period.
TABLE 5: SALES TO TOTAL ASSETS (X5)
Name 199-
2000
2000-
2001
2001-
2002
2002-
2003
2003-
2004
2004-
2005
2005-
2006
2006-
2007
2007-
2008
2008-
2009
2009-
2010
2010-
2011
2011-
2012
Mean r
Dr. Reddy’s
Laboratories
0.718 0.990 1.015 0.835 0.789 0.659 0.628 0.804 0.634 0.772 0.678 0.695 0.810 0.771 0.982
Ranbaxy
Laboratories
ltd
0.894 1.19 1.61 1.62 1.43 1.06 0.753 0.710 0.625 0.639 0.601 1.34 0.943 1.032 0.717
CIPLA 1.18 1.31 1.39 1.25 1.30 1.28 1.22 1.06 0.969 0.989 0.947 0.897 0.923 1.132 0.995
Aurobindo
Pharma
1.91 1.88 1.40 1.04 0.889 0.656 0.660 0.645 0.750 0.813 0.842 0.845 0.868 1.015 0.970
(Source- computed)
0
0.1
0.2
0.3
0.4
0.5
Dr Reddy's Laboratories
Ranbaxy Laboratories
CIPLA
Aurobindo Pharma
00.20.40.60.8
11.2
19
99
-20
00
20
00
-20
01
20
01
-20
02
20
02
-20
03
20
03
-20
04
20
04
-20
05
20
05
-20
06
20
06
-20
07
20
07
-20
08
20
08
-20
09
20
09
-20
10
20
10
-20
11
20
11
-20
12
Dr Reddy's Laboratories
Ranbaxy Laboratories
CIPLA
Aurobindo Pharma

VOLUME NO. 4 (2014), ISSUE NO. 04 (APRIL) ISSN 2231-1009
INTERNATIONAL JOURNAL OF RESEARCH IN COMPUTER APPLICATION & MANAGEMENT A Monthly Double-Blind Peer Reviewed (Refereed/Juried) Open Access International e-Journal - Included in the International Serial Directories
http://ijrcm.org.in/
34
FIGURE-5: SALES TO TOTAL ASSET
The table shows the overall performance of the companies. Sales to total assets ratio measure the power of the asset in generating the sales. Greater the ratio
better the performance and the vise a- vise. It is observed from the study that the average ratio ranges from 0.771 to 1.132. The ratio of Dr.Reddy’s Laboratories
lies between 0.634 and 1.015. The ratio for Ranbaxy Laboratories lies between 0.601 and 1.62 while it was 0.897 and 1.39 for CIPLA, 0.645 and 1.91 for
Aurobindo pharma during the study period. It is observed that the CIPLA got the first position in terms of sales to total assets followed by Aurobindo pharma,
Ranbaxy Laboratories and Dr. Reddy’s Laboratories respectively under the study period.
TABLE – 6: ALTMAN’S Z SCORE
Year DR.Reddy’s Laboratories Ranbaxy Laboratories CIPLA Aurobindo Pharma
1999-2000 3.631 3.616 4.087 4.142
2000-2001 3.621 3.670 4.263 3.860
2001-2002 5.035 5.940 4.401 3.273
2002-2003 4.767 4.732 4.188 3.112
2003-2004 4.280 3.919 4.058 3.233
2004-2005 4.314 2.832 4.159 2.990
2005-2006 3.892 2.431 4.054 3.006
2006-2007 4.757 2.238 4.253 2.982
2007-2008 4.225 2.539 4.000 3.027
2008-2009 4.263 2.127 4.030 3.044
2009-2010 4.117 3.347 4.382 2.975
2010-2011 3.952 2.506 4.140 3.389
2011-2012 4.014 1.978 4.241 2.984
(Source- computed)
FIGURE-6: ALTMAN’S Z SCORE
The table shows that Z score of Dr. Reddy’s Laboratories and CIPLA are more or less stable and the score is greater than 3 in all the years under the study period.
It is observed that the financial health of the said two companies is too healthy during the study period. Z score of Aurobindo Pharma is more than 3 in all the
study period except in 2005, 2007, 2010 and 2012. However the score is much greater than 1.80. It is observed from the study that the company is financially
healthy during the study period. The Z score of Ranbaxy Laboratories is declining from 3.616 to 1.978. it implies that the company is financially healthy at
present but a declining trend is observed which is not good for the company’s health. It is observed that the financial health of the company is moving from
safety zone to dangerous zone. The Figure – 6 shows the Z- Score trend of the selected pharmaceutical companies under the study period.
FINDINGS AND CONCLUSIONS 1. The financial health of CIPLA is the best among all other selected companies as its Z score are more consistent and greater than 3 followed by Dr. Reddy’s
Laboratories, Aurobindo pharma and Ranbaxy laboratories respectively in all the years under the study period.
2. The working capital to total assets of all the selected companies is found to be positive under the study period. The ratio is much healthy in case of Dr.
Reddy’s Laboratories followed by Aurobindo Pharmaceutical, CIPLA, and Ranbaxy Laboratories Ltd. Respectively during the study period.
3. The highest working capital to total assets ratio found to 0.963 in 2007 of Aurobindo Pharmaceutical and the lowest ratio 0.217 in 2004 of Ranbaxy
Laboratories Ltd of all the selected pharmaceutical companies under the study period. It is observed from the study that liquidity position of Ranbaxy
Laboratories Ltd is not satisfactory.
4. Retained earnings to sales ratio of all the selected companies are found to be positive under the study period. The ratio is maximum (1.413) in 2008 of Dr.
Reddy’s Laboratories and the minimum (0.271) in 2001 of Aurobindo Pharmaceutical.
5. It is observed from the study that Dr. Reddy’s Laboratories occupy the better position in comparison to the other selected companies in respect of
operational efficiency as the retained earnings to sales ratio is 1.118 (being the maximum) followed by CIPLA (0.787), Ranbaxy Laboratories Ltd (0.603), and
Aurobindo Pharmaceutical among all the selected companioes.
6. EBIT to total assets ratio are observed to be positive in all the year s of the selected pharmaceutical companies under the study period. It reveals that
earning capacity of the selected companies is satisfactory.
0
0.5
1
1.5
2
2.5
Dr Reddy's Laboratories
Ranbaxy Laboratories
CIPLA
Aurobindo Pharma
0
1
2
3
4
5
6
7
Dr Reddy's Laboratories
Ranbaxy Laboratories
CIPLA
Aurobindo Pharma

VOLUME NO. 4 (2014), ISSUE NO. 04 (APRIL) ISSN 2231-1009
INTERNATIONAL JOURNAL OF RESEARCH IN COMPUTER APPLICATION & MANAGEMENT A Monthly Double-Blind Peer Reviewed (Refereed/Juried) Open Access International e-Journal - Included in the International Serial Directories
http://ijrcm.org.in/
35
7. It is observed that CIPLA has the highest earning capacity on an average being average ratio 0.258 ( maximum) followed by Dr. Reddy’s Laboratories,
Aurobindo Pharmaceutical and Ranbaxy Laboratories Ltd. Respectively under the study period.
8. It is observed that the ratio of EBIT to Total Assets was the highest (0.389) of Dr. Reddy’s Laboratories in 2001 and the lowest 0.75 in 2005 for Aurobindo.
LIMITATION OF THE STUDY 1) The study is mainly based on secondary data.
2) The study is limited to four companies only.
3) The study is based on consolidated financial statement, which may lead to some errors and assumptions.
4) Examining the financial health, only few ratios, have been considered in Z score model which is one of the major limitation of the study
5) The study has been conducted over a limited period of 13 years only.
6) The company has been selected purposively which is it’s another limitation.
REFERENCES 1. Chowdhury, A., & Barua, S. (2009). Rationalities of Z-category Shares in Dhaka Stock Exchange: Are They in Financial Distress Risk? BRAC University Journal,
6(1), 45-58.
2. Pandey, I.M.,(2005), “Financial Management”, 9th
Edition. Delhi, Vikash Publishing House Ltd.,
3. Annual reports of the companies
4. Mulla, M. A. (2002, Jan-Mar). Use of Z-score Analysis for Evaluation of Financial Health of Textile Mills - A Case Study. Abhigyan, 19(4), 37-41.
5. Bagchi, S. (2004, July). Accounting Ratios for Risk Evaluation. The Management Accountant, 39(7), 571-573. 9
6. Selvam , M., Vanitha, S., & Babu. (2004, July). A Study on Financial Health of Cement Industry - Z-score Analysis. The Management Accountant, 39(7), 591-
593.
7. Chaitanya, V. K. (2005, August). Measuring Financial Distress of IDBI using Altman Z-score Model. ICFAI Journal of Bank Management, 0(3), 7-17.

VOLUME NO. 4 (2014), ISSUE NO. 04 (APRIL) ISSN 2231-1009
INTERNATIONAL JOURNAL OF RESEARCH IN COMPUTER APPLICATION & MANAGEMENT A Monthly Double-Blind Peer Reviewed (Refereed/Juried) Open Access International e-Journal - Included in the International Serial Directories
http://ijrcm.org.in/
36
AN APPROACH TO EVALUATE SOFTWARE QUALITY MODEL
DEEPSHIKHA
ASST. PROFESSOR
DEPARTMENT OF COMPUTER SCIENCE AND ENGINEERING
VAISH COLLEGE OF ENGINEERING
ROHTAK
ABSTRACT Everyone has an idea about the meaning of quality. Software metrics and quality models play a pivotal role in measurement of software quality. There are many
quality models and attributes used in both industries as well as in academia. However, we faced many issues related to existing software metrics and quality
models during our research on measuring software quality using design patterns,. The goals of this work are to propose a systematic way of specifying the
relevant quality attributes and their sub characteristics. In this paper, we present an approach of quality model for CBSE. Our model adopts the weight of quality
characteristics which are obtained by carefully selected questionnaires for the stakeholders and Analytic Hierarchy Process (AHP) technique. AHP process is useful
because we can know the importance of the sub characteristics that have been added in characteristics. We also present the evaluation process using checklists
and result of a trial evaluation for validation of our model. As, a result, we believe that the proposed model helps to acquire high quality software.
KEYWORDS Software quality model,, software matrics.
INTRODUCTION
s it is known that Component-Based Software Engineering (CBSE) is an emerging paradigm of software development, its goal is composing applications
with plug & play software components on the frameworks. CBSE is aiming at realizing long-waited software reuse by changing both software architecture
and software process. In CBD, an important role is laid by the Quality of the Software which is made by using different components.
COMPONENT BASED SYSTEM AND OBJECT ORIENTED APPROACH
OBJECT ORIENTED APPROACH
The OO paradigm emphasizes the creation of classes and that classes encapsulate both data and the algorithms that used to manipulate the data.
OO development is a conceptual process. It is not a programming technique. It can serve as a medium for specification, analysis, documentation, and interfacing,
as well as for programming.
An object-oriented system programmed with an OOPL reduces the complexity in the system design and implementation, which in turn increase the
maintainability. The Object Oriented approach had various advantages like Portability, code sharing etc.
DISADVANTAGES OF OO APPROACH
Inefficiency: One drawback to using object-oriented paging schemes is the fact that they can't really handle huge data structures efficiently.
Another major drawback to an object-based system is the overhead involved in handling replacement and defragmentation.
COMPONENT
Components can be defined as binary unit of independent production, acquisition and deployment that on interaction forms a functioning system. Components
are run time entities, as they exist while the system is running, it is important to mention that the component is just not a design entity like classes in object
orientation.
Some developers think that developing components is easy as they are same as objects. But the fact is, components and objects are not same but have a lot in
common, so developing them is similar as that of making object in object oriented. A developer should consider few important aspects while developing
components such that:
1. The challenge is to build a component which is safe, robust with maintaining its ease and lightweight.
2. To design generic components which can be reusable in all different kind of environment.
According to Clements, CBSE embodies the “the ‘buy, don’t build’ philosophy" and also that “in the same way that early subroutines liberated the programmer
from thinking about details, CBSE shifts the emphasis from programming to composing software systems”.
DEVELOPING SOFTWARE SYSTEMS USING CBSE OFFERS MANY ADVANTAGES • Development costs are reduced since existing components are used to develop the systems.
• Reliability is increased since the components has previously been tested in various contexts.
• Time to market is reduced since the components used already exist.
• Maintenance costs are reduced.
• Efficiency and flexibility is improved due to the fact that components can easier be added or replaced.
Nowadays many researchers have interest in evaluating software products using the standards. However, these standards for software quality do not provide
the guidelines to apply the quality model and Quality is multidimensional construct reflected in the quality model, where each parameter in the model defines a
quality dimension. A metrics measurement-based framework, linked to a quality model, is a requirement for effective software production and quality. There
are a number of requirements that need to be met by a quality model, in order for confidence to be gained that the model correctly captures quality
requirements, and correctly reflects how well those requirements have been met. A quality model links together and defines the various software metrics and
measurement techniques that an organization uses. The aim of this study is to present a new approach to quality modeling which seeks to combine the previous
hierarchical modeling approaches, whilst resolving conflicts of opinions of quality, so that quality measurement can be both tailored to a local environment and
potentially can be compared across projects. By concentrating on removing conflicts of opinion between the Essential Views a consensus can be reached as to
what properties constitute quality and how quality should be measured. It will also discuss what quality is by presenting a number of high-profile quality gurus
together with their thoughts on quality (which in some cases actually results in a more or less formal quality model).
METHODOLOGY Steps to be followed to carry out this research are:
STEP 1:- The research on the quality model of component based system starts with the study of what the components are, CBSE, its development life cycle.
However quality is said to be composition of different attributes of a software product or component. Software quality attributes attempt to explain all aspects
of a software system, and it is therefore a very wide concept.
STEP 2:- various attributes are calculated and studied based on the study of various existing quality models for general systems and CBS. When describing the
quality of a software component one will have to choose a suitable set of quality attributes for the description of the system (or components). The aspects
studied and difficulties encountered in this step are: Which quality characteristics and quality attributes should be considered?
A
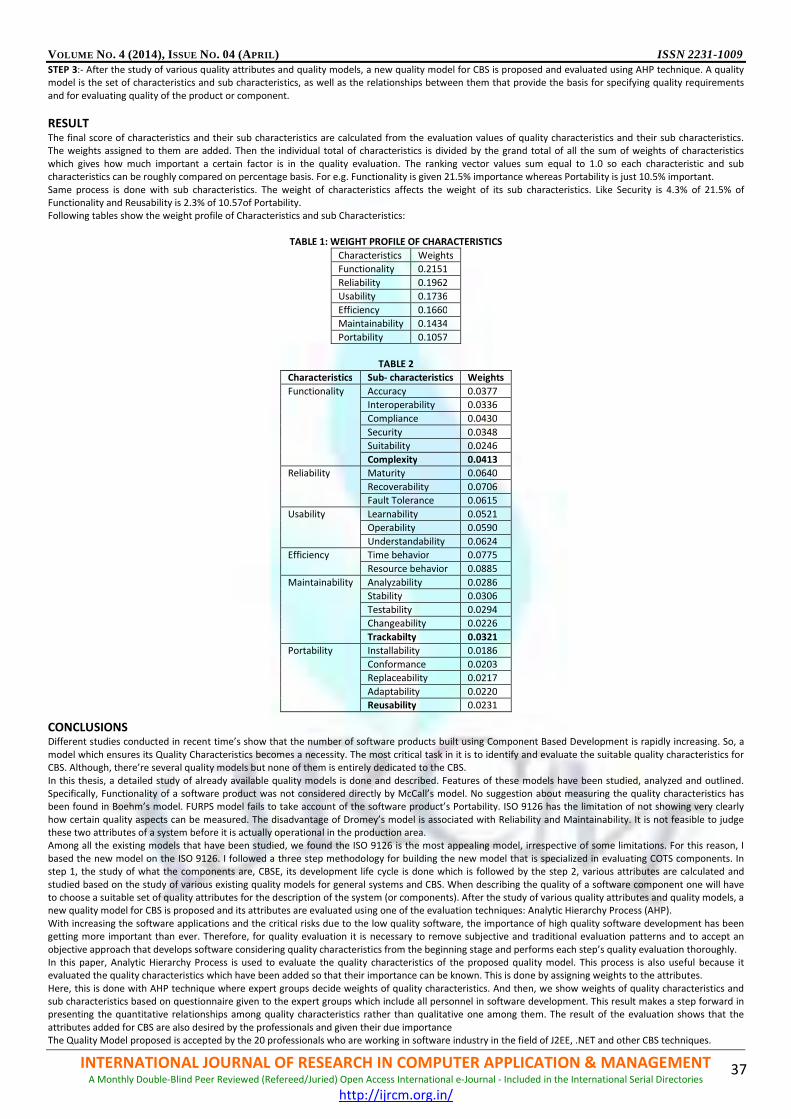
VOLUME NO. 4 (2014), ISSUE NO. 04 (APRIL) ISSN 2231-1009
INTERNATIONAL JOURNAL OF RESEARCH IN COMPUTER APPLICATION & MANAGEMENT A Monthly Double-Blind Peer Reviewed (Refereed/Juried) Open Access International e-Journal - Included in the International Serial Directories
http://ijrcm.org.in/
37
STEP 3:- After the study of various quality attributes and quality models, a new quality model for CBS is proposed and evaluated using AHP technique. A quality
model is the set of characteristics and sub characteristics, as well as the relationships between them that provide the basis for specifying quality requirements
and for evaluating quality of the product or component.
RESULT The final score of characteristics and their sub characteristics are calculated from the evaluation values of quality characteristics and their sub characteristics.
The weights assigned to them are added. Then the individual total of characteristics is divided by the grand total of all the sum of weights of characteristics
which gives how much important a certain factor is in the quality evaluation. The ranking vector values sum equal to 1.0 so each characteristic and sub
characteristics can be roughly compared on percentage basis. For e.g. Functionality is given 21.5% importance whereas Portability is just 10.5% important.
Same process is done with sub characteristics. The weight of characteristics affects the weight of its sub characteristics. Like Security is 4.3% of 21.5% of
Functionality and Reusability is 2.3% of 10.57of Portability.
Following tables show the weight profile of Characteristics and sub Characteristics:
TABLE 1: WEIGHT PROFILE OF CHARACTERISTICS
Characteristics Weights
Functionality 0.2151
Reliability 0.1962
Usability 0.1736
Efficiency 0.1660
Maintainability 0.1434
Portability 0.1057
TABLE 2
Characteristics Sub- characteristics Weights
Functionality Accuracy 0.0377
Interoperability 0.0336
Compliance 0.0430
Security 0.0348
Suitability 0.0246
Complexity 0.0413
Reliability Maturity 0.0640
Recoverability 0.0706
Fault Tolerance 0.0615
Usability Learnability 0.0521
Operability 0.0590
Understandability 0.0624
Efficiency Time behavior 0.0775
Resource behavior 0.0885
Maintainability Analyzability 0.0286
Stability 0.0306
Testability 0.0294
Changeability 0.0226
Trackabilty 0.0321
Portability Installability 0.0186
Conformance 0.0203
Replaceability 0.0217
Adaptability 0.0220
Reusability 0.0231
CONCLUSIONS Different studies conducted in recent time’s show that the number of software products built using Component Based Development is rapidly increasing. So, a
model which ensures its Quality Characteristics becomes a necessity. The most critical task in it is to identify and evaluate the suitable quality characteristics for
CBS. Although, there’re several quality models but none of them is entirely dedicated to the CBS.
In this thesis, a detailed study of already available quality models is done and described. Features of these models have been studied, analyzed and outlined.
Specifically, Functionality of a software product was not considered directly by McCall’s model. No suggestion about measuring the quality characteristics has
been found in Boehm’s model. FURPS model fails to take account of the software product’s Portability. ISO 9126 has the limitation of not showing very clearly
how certain quality aspects can be measured. The disadvantage of Dromey’s model is associated with Reliability and Maintainability. It is not feasible to judge
these two attributes of a system before it is actually operational in the production area.
Among all the existing models that have been studied, we found the ISO 9126 is the most appealing model, irrespective of some limitations. For this reason, I
based the new model on the ISO 9126. I followed a three step methodology for building the new model that is specialized in evaluating COTS components. In
step 1, the study of what the components are, CBSE, its development life cycle is done which is followed by the step 2, various attributes are calculated and
studied based on the study of various existing quality models for general systems and CBS. When describing the quality of a software component one will have
to choose a suitable set of quality attributes for the description of the system (or components). After the study of various quality attributes and quality models, a
new quality model for CBS is proposed and its attributes are evaluated using one of the evaluation techniques: Analytic Hierarchy Process (AHP).
With increasing the software applications and the critical risks due to the low quality software, the importance of high quality software development has been
getting more important than ever. Therefore, for quality evaluation it is necessary to remove subjective and traditional evaluation patterns and to accept an
objective approach that develops software considering quality characteristics from the beginning stage and performs each step’s quality evaluation thoroughly.
In this paper, Analytic Hierarchy Process is used to evaluate the quality characteristics of the proposed quality model. This process is also useful because it
evaluated the quality characteristics which have been added so that their importance can be known. This is done by assigning weights to the attributes.
Here, this is done with AHP technique where expert groups decide weights of quality characteristics. And then, we show weights of quality characteristics and
sub characteristics based on questionnaire given to the expert groups which include all personnel in software development. This result makes a step forward in
presenting the quantitative relationships among quality characteristics rather than qualitative one among them. The result of the evaluation shows that the
attributes added for CBS are also desired by the professionals and given their due importance
The Quality Model proposed is accepted by the 20 professionals who are working in software industry in the field of J2EE, .NET and other CBS techniques.
VOLUME NO. 4 (2014), ISSUE NO. 04 (APRIL) ISSN 2231-1009
INTERNATIONAL JOURNAL OF RESEARCH IN COMPUTER APPLICATION & MANAGEMENT A Monthly Double-Blind Peer Reviewed (Refereed/Juried) Open Access International e-Journal - Included in the International Serial Directories
http://ijrcm.org.in/
38
REFERENCES 1. C. Szyperski, Component Software, Addison-Wesley, 1998.
2. Component Based Development by M. Huizing
3. Paul C. Clements, “From subroutines to subsystems, component Bases Software Development”. The American programmer.
4. C.Atkinson, “Component Based Product Line Engineering with UML” the component software series, 2001: Addison Wesley Professional.
5. Axel anders Kvale, “Empirical study of CBSE with Aspect oriented programming”
6. T.Obendorf, “COTS and open systems- An overview.1997” http://www.sei.cmu.edu/str/descripters/cots.html#ndi
7. Component-based Software Engineering – New Challenges in Software Development by Ivica Crnkovic, [email protected], http://www.idt.mdh.se
/personal/icc
8. Maiden N. and Ncube C. Acquiring Requirements for Commercial off-The Shelf Package Selection, IEEE Software, Vol. 15, No. 2, Mar., 1998
9. Software Quality:Definitions and Strategic Issues by Ronan Fitzpatrick, MSc Computing Science (ITSM), Advanced Research Module
10. ISO/IEC standard 9126 – 1 Software Engineering – product quality- Part 1: Quality Model, June 2001
11. McCall, J. A., Richards, P. K., and Walters, G. F., "Factors in Software Quality", Nat'l Tech.Information Service, no. Vol. 1, 2 and 3, 1977.
12. Boehm, B. W., Brown, J. R., Kaspar, H., Lipow, M., McLeod, G., and Merritt, M., Characteristics of Software Quality, North Holland, 1978.
13. Boehm, Barry W., Brown, J. R, and Lipow, M.: Quantitative evaluation of software quality, International Conference on Software Engineering, Proceedings
of the 2nd international conference on Software engineering, 1976.
14. Grady, R. B., Practical software metrics for project management and process improvement, Prentice Hall, 1992.
15. Dromey, R. G., "A model for software product quality", IEEE Transactions on Software Engineering, no. 2, pp. 146-163, 1995.
16. “ISO 9126 Software Quality Characteristics”, http://www.sqa.net/iso9126.html
17. Quality Attributes for a Component Quality Model by Alexandre Alvaro, Eduardo Santana de Almeida, Silvio Romero de Lemos Meira, Federal University of
Pernambuco and C.E.S.A.R – Recife Center for Advanced Studies and Systems, Brazil
18. A Critical Survey of Reusability Aspects for Component-Based Systems by Arun Sharma, Rajesh Kumar, and P. S. Grover, Proceedings of world Academy of
Science, Engineering and Technology Volume 21 January 2007 ISSN 1307-6884
19. Palmer, B. (1999). Click Here for Decisions. Fortune, 139(9), 53-16. Journal on-line. Available from ABI/Inform, accession no. 01807687.
20. Partovi, F.Y. (1994). Determining What to Benchmark: An Analytic Hierarchy Process Approach. International Journal of Operations & Project Management,
14(Jun), 25-39. Journal on-line. Available from ABI/Inform, accession no. 00915975.
21. Saaty, T. L. (1990). Decision Making for Leaders. Pittsburgh: RWS Publications.
22. The Analytic Hierarchy Process by James McCaffrey.
23. J.K. Cho, K.S. Lee, and S.J. Lee, “A Software Quality model with Weight in Software Development lifecycle” in Proc. of KISS Workshop on Software
engineering, Pyunchang, Korea, 2004.
24. K.S. Lee and S.J. Lee, “A Weight Decision technique of Software Quality characteristics in Software development Life Cycle”, in Proc. of ACIS ICIS ’04, LA,USA
2004, pp.338-343.

VOLUME NO. 4 (2014), ISSUE NO. 04 (APRIL) ISSN 2231-1009
INTERNATIONAL JOURNAL OF RESEARCH IN COMPUTER APPLICATION & MANAGEMENT A Monthly Double-Blind Peer Reviewed (Refereed/Juried) Open Access International e-Journal - Included in the International Serial Directories
http://ijrcm.org.in/
39
TRACKING THE INDEX FUNDS WITH FAMA FRENCH THREE FACTOR MODEL
DR. SHIKHA VOHRA
ASST. PROFESSOR
DEPARTMENT OF BBA
DEV SAMAJ COLLEGE FOR WOMEN
CHANDIGARH
SHIVANI INDER
RESEARCH SCHOLAR
DEPARTMENT OF COMMERCE
PUNJABI UNIVERSITY
PATIALA
ABSTRACT The objective of this paper is to assess the tracking error and performance of Index Funds which are based on Nifty for the time period 2005-2012. The
performance measures used are standard deviation, Beta, Alpha, R-Squared, Sharpe measure, Jensen measure, Treynor measure and Sharpe differential return
measure. The results indicate that ICICI prudential index fund has outperformed the rest of the fund in passively managing its portfolio and tracking the
benchmark and the analysis also gives a hint that at times of low performance of benchmark index the fund manager tries to balance the returns by superior
selection of scrips.
KEYWORDS
Alpha, Beta, Fama French model, Passive funds, Sharpe.
1. INTRODUCTION n the underdeveloped regions savers of moderate means are generally reluctant to invest in corporate securities because of lack of knowledge about
complicated investment affairs. Their resources being small, they can at best hold securities of one or two or of few industrial concerns. Investment in
securities of mutual funds takes care of both these problems by providing diversification in security units and expert knowledge to provide steady and
regular earnings to investors and a share in the general prosperity. Indian mutual fund industry began with establishment of Unit Trust of India in the year 1964,
but the major growth of this industry started in the early 1990s when the sector was opened to private and foreign players due to econmic reforms.
2. LITERATURE REVIEW Subha and Bharathi (2007) in their paper examined the investment performance of Indian Mutual funds using Sharpe Ratio, Treynor Ratio and Jensen differential
return measure. The study was based on daily NAV for 51 mutual fund schemes for a period of one year from 1st October 2004 to 30thSeptember 2005. On the
basis of study Sharpe Ratio indicates good performance by majority of the scheme, while in terms of Treynor ratio only few schemes showed good performance.
The study in general revealed that the performance of the Mutual funds during study period were satisfactory. Dhanda, Batra and Anjum (2012) conducted a
study to evaluate the performance of selected open ended schemes in terms of risk and return relationship for the period 1st April 2009 to 31
st March 2011. For
the purpose of study rate of return method, Beta, Standard Deviation, Sharpe ratio and Treynor ratio had been used. BSE-30 has been used as a benchmark to
study the performance of mutual funds in India. The findings of the study reveal that only three schemes have performed better than benchmark. Prajapati and
Patel (2012) conducted a study to evaluate the performance of Indian mutual funds through relative performance index, risk-return analysis, Treynor's ratio,
Sharp's ratio, Sharp's measure, Jensen's measure, and Fama's measure. They used daily closing NAVs, made available from the website of Association of Mutual
Funds in India (AMFI). The study period was from 1st January 2007 to 31st December, 2011. The results of performance measures suggested that most of the
mutual fund had given positive return during 2007 to 2011. Narayanasamy and Rathnamani (2013) in their study evaluated the performance of selected mutual
fund schemes in terms of risk return relationship. The study considered 5 mutual fund scheme launched by private sector for the period Jan 1 2010 to Dec
2012.The findings of study revealed that all the funds have well during study period except in 2011 due to fall in CNX Nifty index.Sharma (2013) conducted a
study to analyse the performance of equity mutual funds industry against risk free rate and benchmarks return for the period of five years. The study was based
on 10 growth oriented- open ended- equity mutual fund schemes. Risk- return analysis, coefficient of variation, Treynor's ratio, Sharpe’s ratio, Jensen's measure,
Fama's measure and regression analysis was used for study. The findings of study revealed that market factor effect behaviour of mutual funds returns. The
results showed that performance of the majority mutual fund schemes had outperformed the market benchmark indexes in term of Treynor and Sharpe ratio
based on historical monthly returns.
3. OBJECTIVES OF STUDY The study is conducted to assess the tracking error and performance of Index Funds which are based on Nifty for the time period 2005-2012. The list of the funds
considered for study is given in Table 1.
TABLE 1: LIST OF FUNDS CONSIDERED FOR STUDY
Sr.No. Name of the Fund Benchmark Launched On Asset Management Company.
1 Principal Index Fund S&P CNX Nifty Jul-99 Principal PNB AMC Pvt. Ltd
2 UTI Nifty Index Fund S&P CNX Nifty Mar-00 UTI AMC Pvt. Ltd.
3 Franklin India Index Fund S&P CNX Nifty Jun-00 Franklin Templeton AMC (India) Pvt. Ltd.
4 SBI Magnum Index Fund S&P CNX Nifty Dec-01 SBI Funds Management Ltd.
5 ICICI Prudential Index Fund S&P CNX Nifty Feb-02 ICICI Prudential AMC Ltd.
6 HDFC Index Fund – Nifty Plan S&P CNX Nifty Jul-02 HDFC AMC Ltd.
7 Birla Sun Life Index Fund S&P CNX Nifty Sep-02 Birla Sun Life AMC Ltd.
8 LICMF Index Fund – Nifty Plan S&P CNX Nifty Nov-02 LIC Mutual Fund AMC Ltd
9 Tata Index Fund-Nifty Plan S&P CNX Nifty Feb-03 Tata AMC Pvt. Ltd
10 ING Large Cap Equity Fund S&P CNX Nifty Jan-04 ING Investment Management (I) Ltd.
11 Canara Robeco Nifty Index Fund S&P CNX Nifty Sep-04 Canara Robeco AMC Ltd.
I

VOLUME NO. 4 (2014), ISSUE NO. 04 (APRIL) ISSN 2231-1009
INTERNATIONAL JOURNAL OF RESEARCH IN COMPUTER APPLICATION & MANAGEMENT A Monthly Double-Blind Peer Reviewed (Refereed/Juried) Open Access International e-Journal - Included in the International Serial Directories
http://ijrcm.org.in/
40
4. RESEARCH METHODOLOGY The closing NAV on quarterly basis are considered for calculation of buy and hold returns. Only the schemes with ‘growth’ option are considered for the study.
The study is based on the secondary data. The data have been collected from various websites like mutualfundsindia.com, www.amfiindia.com and
moneycontrol.com.
TOOLS
The Buy and Hold Returns are calculated by taking natural logarithms of current NAV to previous NAV. Return for the portfolio is Rp= ln(NAVt/NAVt-1) and
market’s return Rm=ln(Pt/Pt-1)
where Rp – return of the fund(portfolio) , NAVt is Net Asset Value at time t, NAVt-1 is Net Asset Value at previous period t-1 , Pt is the closing price of the index at
period t and Pt-1 is the closing price of the index at period t-1 or previous period.
For estimation of risk, total risk and beta coefficients are estimated. Total risk is assessed by calculating standard deviation of the returns. Beta coefficient is
estimated out of the regression line which is also known as security characteristic line (SCL). Portfolio returns are regressed on the market returns in order to
estimate β.
The SCL plays an important role in Modern Portfolio Theory and is exppained as follows:
Rp= α + β * Rm + ε
4.1Sharpe’s Measure was developed as a composite measurement of portfolio performance. It employs standard deviation instead of beta as in Treynor’s
measure. It uses the capital market line as a benchmark.(i.e. Sp= (Rp-Rf)/σp) The higher the Sharpe’s measure the better the performance as each unit of total risk
is rewarded with greater excess return.
4.2 Jensen Measure was first used for evaluation of mutual fund managers in 1970. This measure is used to adjust the level of beta risk, so that riskier securities
are expected to have higher returns. It allows the investor to statistically test whether portfolio produces an abnormal return relative to the overall capital
market. It is calculated as follows:
(Rp-Rf)=α+β(Rm-Rf) + ep
4.3 Treynor’s Measure computed a measure of the portfolio performance, measures excess portfolio return per unit of risk equal to the portfolio rate of return
minus the risk free rate of return, dividing by portfolio beta. This is useful for assessing the excess return, helping investors to evaluate how the structure of the
portfolio to different levels of systematic risk will affect the return.(i.e. Tp=Rp-Rf/βp) The measure uses the Security market line as a benchmark. It is also known
as ‘return to volatility ratio’.
4.4 Fama Decomposition Measure: Eugene F Fama (1972) developed a portofio performance evaluation measurement technique which decomposes the total
return of a portfolio into risk free return, return due to market risk and return due to stock selection of the the fund manager at the specified level of risk.
Rp=Rf + β(Rm-Rf) + (Rm-Rf)/(σp/ σm –β)+( Rm-Rf )-( σp/ σm )( Rm-Rf )
4.5 Tracking Error Estimates: Tracking error is an estimate of difference between the performance of a fund and the underlying benchmark index(Roll,1992).
Pope and Yadav(1994) provided different estimates of measuring the tracking error.
Estimate 1: the average of the absolute difference in returns between the fund and the index
(i.e. Errorestimate1= (∑n=1to n | ep |)/n
Where ep = difference between fund return and index return)
Estimate 2: the standard deviation of return differences between the fund and the index
(i.e. Errorestimate2= √(1/n-1)*(∑t=1to n (ep-e‾))
Estimate 3: the standard error of a regression of fund returns on benchmark returns
It makes use of the market model to estimate the tracking error in returns. It regresses Index fund portfolio returns on the benchmark index returns and
considers the standard error( volatility around the regression line) as an estimate of the tracking error)
5. ANALYSIS AND DISCUSSION As shown in the Table 2and 3, that the Buy and Hold returns of most of the returns hover around the 4%. The Buy and Hold Return of the ICICI Prudential is the
highest and that of HDFC Index Fund is lowest. The total risk of the Birla Sunlife Index Scheme is highest and it also has a high beta while the lowest total risk is
shown by LIC Index Mutual fund and the beta value is lowest for the UTI Nifty Index Fund. ICICI Prudential Index fund has shown the preferred excess returns.
TABLE 2 : DESCRIPTIVE STATISTICS OF THE SCHEMES CONSIDERED
Z Principal
Index
Fund
UTI Nifty
Index
Fund
Franklin
India
Index
Fund
SBI
Magnu
m Index
Fund
ICICI
Prudenti
al Index
Fund
HDFC
Index
Fund
Nifty
Plan
Birla Sun
Life
Index
Fund
LICMF
Index
Fund
Nifty
Plan
Tata
Index
Fund
Nifty
Plan
ING
Large
Cap
Equity
Fund
Canara
Robeco
Nifty
Index
Fund
Mean 3.864 4.232 4.257 3.976 4.539 3.756 4.076 3.575 4.351 4.044 4.071
Standard Error 2.545 2.514 2.573 2.551 2.578 2.529 2.582 2.434 2.573 2.488 2.521
Standard Deviation 14.170 13.995 14.327 14.204 14.353 14.081 14.374 13.553 14.328 13.852 14.036
Variance 200.780 195.854 205.256 201.763 206.012 198.281 206.614 183.686 205.298 191.872 196.997
Kurtosis 0.343 0.615 0.419 0.597 0.357 0.374 0.145 0.706 0.290 0.594 0.431
Skewness 0.146 0.148 0.133 0.177 0.182 0.024 0.244 0.163 0.196 0.192 0.178
Range 63.896 64.213 65.131 64.997 64.565 65.027 64.980 63.935 64.402 63.616 64.436
Minimum -23.503 -23.260 -23.617 -23.216 -22.609 -26.051 -23.774 -24.015 -23.386 -22.707 -23.357
Maximum 40.393 40.953 41.514 41.781 41.955 38.976 41.207 39.920 41.016 40.909 41.079
Count 31.000 31.000 31.000 31.000 31.000 31.000 31.000 31.000 31.000 31.000 31.000
Confidence Level
(95%)
5.197 5.133 5.255 5.210 5.265 5.165 5.272 4.971 5.256 5.081 5.148
Risk Free
Rate of
Return
Compensation for
Systematic Risk
Compensation for Inadequate Diversification
Net Selectivity or Net Superior Return
Selectivity

VOLUME NO. 4 (2014), ISSUE NO. 04 (APRIL) ISSN 2231-1009
INTERNATIONAL JOURNAL OF RESEARCH IN COMPUTER APPLICATION & MANAGEMENT A Monthly Double-Blind Peer Reviewed (Refereed/Juried) Open Access International e-Journal - Included in the International Serial Directories
http://ijrcm.org.in/
41
TABLE 3: RISK RETURN ANALYSIS OF THE INDEX FUNDS
Principal
Index
Fund
UTI Nifty
Index
Fund
Franklin
India
Index
Fund
SBI
Magnum
Index
Fund
ICICI
Prudentia
l Index
Fund
HDFC
Index
Fund –
Nifty
Plan
Birla Sun
Life
Index
Fund
LICMF
Index
Fund –
Nifty
Plan
Tata
Index
Fund-
Nifty
Plan
ING
Large
Cap
Equity
Fund
Canara
Robeco
Nifty
Index
Fund
Schemes Return 3.8636 4.2323 4.2575 3.9757 4.5390 3.7561 4.0760 3.5748 4.3509 4.0443 4.0711
Risk free return 6.4647 6.4647 6.4647 6.4647 6.4647 6.4647 6.4647 6.4647 6.4647 6.4647 6.4647
Market return 4.2416 4.2416 4.2416 4.2416 4.2416 4.2416 4.2416 4.2416 4.2416 4.2416 4.2416
Excess return -2.6010 -2.2324 -2.2072 -2.4890 -1.9256 -2.7085 -2.3886 -2.8899 -2.1138 -2.4204 -2.3935
Schemes risk 14.1697 13.9948 14.3267 14.2043 14.3531 14.0812 14.3741 13.5531 14.3282 13.8518 14.0355
Beta of scheme 0.9456 0.9120 0.9561 0.9469 0.9567 0.9377 0.9506 0.8845 0.9497 0.9234 0.9235
Table 4 portrays the risk adjusted measures for the index fund schemes considered. Sharpe's Measure compensates the excess return for every unit of total risk
taken. And it is evident from the results shown in Table 4 that the ICICI prudential gives the best performance on the basis of this measure and the Principal
Index fund provides the least excess compensation over the total risk taken.
Jensens's measure tries to estimate the returns relatively on the basis of the risk taken by them i.e. risker portfolios should generate higher returns. On the basis
of this estimate the UTI Nifty Index fund has outperformed the rest of the funds. But if we consider the total risk and beta in account as well then ICICI Prudential
Fund should have given abnormal excess returns above the market returns. Treynor's measure estimates the compensation to the volatility of the portfolio. As
per this measure ICICI Prudential has adjusted its well to the relative volatility of the Benchmark and the LIC MF Index fund has underperformed. Fama and
French Decomposition measure provides a decomposition of the return into the various components stressing upon the performance of the fund manager for
the diversification and selection of funds for generation of superior returns. As shown in the table the compensation for the systematic risk is the better for the
LIC MF index fund and lowest for the Franklin India Index MF. Compensation for inadequate diversification should be in negative in order to underline the idea
that the portfolio is well diversified. It is negative for all the funds and it shows that funds are adequately diversified. The third component of Fama French
decomposition model is the 'net selectivity ' of the fund i.e. how much returns the fund manager has been able to generate because of superior selection of the
stocks. As we know that the index funds are passive funds so the scope for the net selectivity reduces to a greater extent , so a passive fund should have
comparatively low scores. as it is evident from the calculated values that only ICICI prudential and tata index fund has shown some selection of stock while
principal index fund has shown the lowest net selectivity.
TABLE 4: RISK ADJUSTED MEASURES AND RISK DECOMPOSITION OF THE SCHEMES CONSIDERED
Princip
al
Index
Fund
UTI
Nifty
Index
Fund
Franklin
India
Index
Fund
SBI
Magnu
m Index
Fund
ICICI
Prudentia
l Index
Fund
HDFC
Index
Fund –
Nifty Plan
Birla Sun
Life
Index
Fund
LICMF
Index
Fund –
Nifty Plan
Tata
Index
Fund-
Nifty Plan
ING Large
Cap
Equity
Fund
Canara
Robeco
Nifty Index
Fund
Sharpe’s
measure
-0.1836 -0.1595 -0.1541 -0.1752 -0.1342 -0.1924 -0.1662 -0.2132 -0.1475 -0.1747 -0.1705
Jensen’s
measure
4.0720 4.1465 4.0487 4.0691 4.0472 4.0896 4.0609 4.2077 4.0628 4.1212 4.1210
Treynor’s
measure
-2.7507 -2.4477 -2.3086 -2.6285 -2.0127 -2.8886 -2.5128 -3.2672 -2.2257 -2.6211 -2.5917
Sharpe’s
differential
return
3.9981 4.0249 3.9739 3.9927 3.9699 4.0116 3.9667 4.0928 3.9737 4.0469 4.0187
Fama French
Decomposition
Model Return
3.5062 4.2237 4.2727 3.7239 4.8236 3.3009 3.9186 2.9849 4.4547 3.8620 3.9137
Compensation
for systematic
risk
-2.1021 -2.0275 -2.1254 -2.1050 -2.1269 -2.0845 -2.1132 -1.9663 -2.1113 -2.0528 -2.0530
Compensation
for Inadequate
diversification
-0.0739 -0.1216 -0.0747 -0.0763 -0.0773 -0.0779 -0.0942 -0.1150 -0.0891 -0.0744 -0.1024
Net selectivity
or net superior
return
-0.4250 -0.0832 -0.0071 -0.3076 0.2785 -0.5461 -0.1812 -0.8086 0.0866 -0.2932 -0.2381
TABLE 5: ESTIMATES OF TRACKING ERROR
Tracking
Error
Princip
al
Index
Fund
UTI
Nifty
Index
Fund
Franklin
India
Index
Fund
SBI
Magnu
m Index
Fund
ICICI
Prudentia
l Index
Fund
HDFC
Index
Fund –
Nifty Plan
Birla Sun
Life
Index
Fund
LICMF
Index Fund
– Nifty Plan
Tata
Index
Fund-
Nifty Plan
ING Large
Cap
Equity
Fund
Canara
Robeco
Nifty Index
Fund
Estimate 1 0.3780 0.0093 -0.0159 0.2659 -0.2974 0.4855 0.1656 0.6668 -0.1093 0.1973 0.1705
Estimate 2 0.8926 3.1755 0.8562 1.0924 1.0862 1.3017 2.0838 3.1371 1.8532 1.2079 2.5259
Estimate 3 0.8591 3.1720 0.8672 1.0840 1.1105 1.2657 2.1386 2.9862 1.8963 1.0512 2.5234
Table 5 provides the tracking error estimates. As per the simplest estimate of the tracking error i.e. Tracking error estimate 1 the ICICI prudential fund has the
lowest error and HDFC index fund has the highest fund. According to the estimate 2 which considers the deviation of returns from its benchmark the icici
prudential fund has outperformed the rest and the uti mf index fund has underperformed. Considering the estimate 3 for the tracking error which is based on
the errors of regressing the portfolio returns on the benchmark returns the ing large cap is the best performing fund while the uti mf index fund is the least
performing fund. the estimate 3 is provides a better assessment of the tracking error and it can to some extent assurance in the forecasting of the returns as
well.

VOLUME NO. 4 (2014), ISSUE NO. 04 (APRIL) ISSN 2231-1009
INTERNATIONAL JOURNAL OF RESEARCH IN COMPUTER APPLICATION & MANAGEMENT A Monthly Double-Blind Peer Reviewed (Refereed/Juried) Open Access International e-Journal - Included in the International Serial Directories
http://ijrcm.org.in/
42
6. CONCLUSION Considering all the estimates and measures it can be assessed that the ICICI prudential index fund has outperformed the rest of the fund in passively managing
its portfolio and tracking the benchmark and the analysis also gives a hint that at times of low performance of benchmark index the fund manager tries to
balance the returns by superior selection of scrips.
REFERENCES 1. Dhanda S.K., Batra G.S. and Anjum B.(2012), “Performance Evaluation of Selected Open Ended Mutual Funds in India”, International Journal of Marketing,
Financial Services & Management Research, Vol. 1, No. 1, Jan (2012), Available at: www.indianresearchjournal.com.
2. Frino A. , Gallagher D. R.(2001) , “Tracking S&P 500 Index Funds”, Journal of Portfolio Management, Vol. 28 (1), pp. 44-55.
3. Narayanasamy R., and Rathnamani N. (2013), “Performance Evaluation of Equity Mutual Funds (On Selected Equity Large Cap Funds)”, International
Journal of Business and Management Invention, Vo. 2, Issue 4, April 2013, Page- 18-24, www.ijbmi.org
4. Prajapati K.P.,Patel M. K. (2012),”Comparative Study on Performance Evaluation Of Mutual Fund Schemes of Indian Companies”, International Refereed
Research Journal, Vol-III,Issue 3,July, pp 47.Available at: http://www.researchersworld.com/vol3/issue3/vol3_issue3_3/Paper_07.pdf
5. R. M. Srivastava and Divya Nigam (2010), " Management of Indian financial institutions", Himalaya Publishing House , pp.566-67,
6. Rao M.,Rani H.R. (2013), “Risk Adjusted Performance Evaluation of Selected Balanced Mutual Fund Schemes in India”, Scholars World-International
Refereed Multidisciplinary Journal of Contemporary Research, Volume.1, Issue.2, pp.133.
7. Sharma, Dhanraj (2013), "Performance Evaluation of Indian Equity Mutual Funds", The Indian Journal of Commerce, Vol. 66, No. 2, April- June 2013.
8. Shubha, M.V and Bharathi, S. Jaya, "An Empirical Study on the Performance of Select Mutual Fund Schemes in India", Journal of Contemporary Research in
Management, Volume-1, 2 Jan- June 2007.
9. Stein,D., “Introducing Tracking Error”, Research Brief, Parametric Leaders in Structured Portfolio Management, Available at: http://www.parametri
cportfolio.com/wp- content/uploads/2012/02/Research-Brief-Introducing-Tracking-Error.web_.pdf
10. Zaheeruddin M.,Sivakumar P.,Reddy K.,2013, “Performance Evaluation of Mutual Funds in India with Special Reference to Selected Financial
Intermediaries”, IOSR Journal of Business and Management , Volume 7, Issue 2 (Jan. - Feb. 2013), pp. 34-40.
VOLUME NO. 4 (2014), ISSUE NO. 04 (APRIL) ISSN 2231-1009
INTERNATIONAL JOURNAL OF RESEARCH IN COMPUTER APPLICATION & MANAGEMENT A Monthly Double-Blind Peer Reviewed (Refereed/Juried) Open Access International e-Journal - Included in the International Serial Directories
http://ijrcm.org.in/
43
SOCIAL AUDIT REPORT CARD OF SOCIAL PERFORMANCE
DR. S. K. JHA
FACULTY
L. N. MITHILA UNIVERSITY
DARBHANGA
ABSTRACT A Social Audit is a systematic study and evaluation of an organization’s social performance as distinguished from its economic performance. In social audit, a
systematic attempt is made to identify and evaluate those activities of a business which have social impact. Social Audit has huge prospects in future for the
betterment of the Social Community. This paper is an effort to explore the conceptual foundations, need and coverage of social audit. The paper also outlines
different steps which must be accomplished in the process of social audit. Finally the paper presents an overview of present status as well as legal framework of
social audit in India.
KEYWORDS Accountability, Business, Social Cost and Benefit Analysis, Social Institutions, Transparency.
INTRODUCTION umanity has always strived for an ideal society. The relationship between business and society has always been a subject of intense debate. Society has
always refused to allow permanent concentration of power in the hands of any one without commensurate responsibility. Business must lend itself to
public scrutiny about what is happening behind the opaque walls of corporate business entities. As social institutions, companies are required to align
their functions to the social dictates. The position of the companies in the society has got to be seen in the light of social institutions existing for a social purpose.
All this is not philanthropy, but a bounded duty of companies towards those who comprise the work force, including managers, and who also constitute the
consuming public who keep the companies going.
GENESIS AND CONCEPTUALISATION The overwhelming demand in context of business organizations having social obligation gave birth to social audit. The concept of social audit was pioneered by
Charles Medawar long bank in 1972. It has a long history in the United States, and the United Kingdom in the 1970s; and to some extent in our country in the
late 1980s. The term ‘Social Audit’ broadly refers to that area of corporate social performance that involves developing and using information about corporate
activities of significance to the society and how these responsibilities have been carried out.
In social audit, a systematic attempt is made to identify and evaluate those activities of a business which have social impact. A social audit is a systematic study
and evaluation of an organization’s social performance as distinguished from its economic performance. Social audit tries to evaluate positive impact of an
organization’s activities on the social wellbeing of people. It is assessed by way of social cost and Benefit analysis of its activities. Social cost may be
• Usage of scarce natural resources,
• Environmental pollution,
• Deforestation,
• Spread of occupational diseases,
• Injuries/deaths at work place due to poor maintenance policies,
• Health hazards to the nearby population, etc.
Social Audit refers to accounting for the real benefits realized by the stakeholders to whom the government as a part of the development initiatives and the
organizations as a part of their social responsibilities are extending social infrastructures – either through financial aid or by setting up the required
infrastructure that could bring in a holistic development of the society at large. In other words, it refers to the process of checking the extent to which the
benefits extended by the government, its agencies and its participants or organizations operating in its economic setup have been realized by their stakeholders,
by setting up necessary control system and monitoring system in place.
Social audit forces organization more socially accountable for the objectives they declare. Social Audit may be defined as an examination of the social
performance of a business enterprise towards the society. Social audit is conducted to assess how much is the contribution of business enterprise to the society.
So, Social Audit is one which is done by an independent person in order to examine the expenditure incurred by the business enterprise towards social activities
as well as the monetary value of the social benefits emerged out of such activities and also how entities are discharging their social obligations for the protection
of the environment pollution – free environment (Basu, 2004).
The earliest use of the term ‘Social Audit’ in the context of business can be attributed to Theodore J Kreps, whose monograph on Measurement of Social
Performance of Business (1940) had defined and described the idea of social audit, albeit in somewhat different sense than those used by the other writers in
the 1970s. He suggested that, “The acid test of business is not the Profit and Loss Statement but social audit”. Social audit is concerned with the possible
influence on the social quality of life instead of the economic quality of life. Social audit leads to a report on the social performance of a business unit.
Bowen’s work had set the standard for social audit, which he conceived to be “an appraisal of individual corporations … by persons outside the company who
would have a more disinterested and detached view of its activities than company employees” (Bowen, 1953). Bowen’s work had drawn wider attention from
the Management discipline and provided it with a mother lode of materials for research in an emerging field that came to be known as SIM or Social Issues in
Management, and also for an interdisciplinary field of study that found its place in the curriculum of many business schools (Wood, 1991).
Batra (1996) in his study argues that social auditing is playing a key role due to increased awareness among corporate sectors that every enterprise should
contribute towards social goals. Thomas (2005) highlights social audit as a principle for creating universal value, identifying the pillars for Social Audit, as socio
cultural, administrative, legal and democratic system which acts as the foundation for operationalising Social Audit.
Social Audit ensures the involvement of potential beneficiaries and other stakeholders of an activity or project from the planning stage to the monitoring and
evaluation of that activity or project. Social Audit is supplement to the conventional audit. It is relevant both in Private Sector as well as Government Sector,
although it is more urgent in Government Sector where funds are drawn from the state exchequer i.e., public money.
Social responsibility disclosure model (Abt, 1977) proposed by Abt Associates (a consultant firm with clerk Abt as its president) included a Social Income
Statement showing the benefits to the company, to the staff, to the general public and the community. Social audit consists of examining and verifying the
financial resource mobilizations into the channels of social objectives, it is necessarily based on some basic principles like
• Principle of Transparency,
• Principle of Participation,
• Principle of Accountability,
• Principle of Responsibility,
• Principle of Comparison etc.,
H

VOLUME NO. 4 (2014), ISSUE NO. 04 (APRIL) ISSN 2231-1009
INTERNATIONAL JOURNAL OF RESEARCH IN COMPUTER APPLICATION & MANAGEMENT A Monthly Double-Blind Peer Reviewed (Refereed/Juried) Open Access International e-Journal - Included in the International Serial Directories
http://ijrcm.org.in/
44
which makes it more stringent and effective.
Social audit is a process audit rather than an audit for results. It can determine only what an organisation is doing in social areas, not the amount of social good
that results from these activities. Social audits use both qualitative and quantitative data. Normally a firm uses as much quantitative data as possible, and then
supplements it with qualitative data. On March 30, 1995, the first conference on social audit was held at Edinburgh, organized by the New Economic Foundation
(NEF). The conference was followed by a workshop where Social Audit was defined “as the process whereby an enterprise measures and reports on its
performance in meeting its declared social, community or environmental objectives”. In India, Tata Iron and Steel Company (TISCO) introduced the social audit
element in the report in July 1980. They presented a report on Social Audit to show their accomplishment of social obligations.
BENEFITS OF SOCIAL AUDIT The benefits of Social Audit are as follows:
• Social audit enables the company to take close look at itself and understand how far the company had lived up to its social objectives.
• Social audit brings about an encouragement for social concern in the organization.
• Social audit provides data for comparative effectiveness of different types of programmes.
• It helps to earn an organization a good reputation in the society.
• It trains the community on participatory local planning.
• It encourages local democracy.
• It encourages community participation.
• It promotes collective decision-making and sharing responsibilities.
• It develops human resources and social capital.
TYPOLOGY OF SOCIAL AUDIT
Social audit may be of the following types:
• Social Income Statement and Balance Sheet Audit,
• Social Performance Audit,
• Government Mandated Audit and
• Social Programme Audits.
COVERAGE OF SOCIAL AUDIT
The list of activities that would be the Subject of social audit, according to Bowen are:
(i) Prices,
(ii) Wages,
(iii) Research and Development,
(iv) Advertising,
(v) Public Relations,
(vi) Human Relations,
(vii) Community Relations and
(viii) Employment Stabilization.
The points where Social Audit must concentrate are:
� Community participation,
� Ethical Practice,
� Discriminatory Event,
� Environmental Factors,
� Compliance of Rules or Legal obligations,
� Identification of Hindrance and Suggestion of Measures,
� Financial Comparison etc.
METHODOLOGY OF SOCIAL AUDIT The social audit is a new concept. As a result there are very few guidelines for making it, and there is no standard procedure to follow. Most companies are at
the beginning of the learning curve with social audits. However, in order to conduct social audit task successfully, there are six steps which must be
accomplished in the process of social audit:
Step 1: Preparation of Groundwork or Gathering Information,
Step 2: Determining the Audit Parameter and Identifying the Stakeholders,
Step 3: Preparation of Books of Social Accounts,
Step 4: Use of Social Accounts for The Purpose of Verification,
Step 5: Interpretation and Comment and
Step 6: Feedback and Review.
The decision to conduct social audit must be internal and voluntarily taken up. This would help in improving the image of an enterprise as a socially responsible
one. Bowen (1953) envisaged social audit as a team work. Bowen also suggested about the desirable qualification of the auditor-who should be:
(i) Oriented towards the social point of view,
(ii) Conversant with business practices and problems and
(iii) Technically trained in such fields as law, economics, sociology, psychology, personnel, government, engineering, philosophy, and theology.
Understandably, the requirement of such extensive qualifications generally not being endowed in one person. Spreckley (2008) in the book “Social Audit
Toolkit” had stated the cyclical format structure of social audit consisting of
• Governance Statement
(Constitutional Alums Organisational Rules, Operational Objectives, Policies, Value Base set objectives)
• Social Accounting and verification
(Social Accounting framework, Social Audit Report, Social Accounting Monitoring)
• Internal view and organisation and
(Internal SWOT Analysis, Roles, Tasks, Responsibilities, Internal Position Analysis, Set objectives)
• External view and Stakeholders
(External SWOT Analysis, Stakeholder Record, Stakeholder Dialogue, Position Analysis, Set objectives)
An effective social audit should ensure that there is efficient governance practices in place and the stakeholders are provided with access to the required
outcomes of social audit which could help them to evaluate the extent of value created by such programmes in the society.
SOCIAL AUDIT IN INDIA: PRESENT SCENARIO • Social audit in private sector is still at nascent sage as there is no legal binding for organizations to go for social audit reports.

VOLUME NO. 4 (2014), ISSUE NO. 04 (APRIL) ISSN 2231-1009
INTERNATIONAL JOURNAL OF RESEARCH IN COMPUTER APPLICATION & MANAGEMENT A Monthly Double-Blind Peer Reviewed (Refereed/Juried) Open Access International e-Journal - Included in the International Serial Directories
http://ijrcm.org.in/
45
• Social audit in Government Sector currently is mainly focused on exposing corrupt practices of Government functionaries.
• Of late, social audit has been used to enforce rights of citizens, thanks to Right to Information Act and introduction of Citizen Charters in the Government
Offices.
• As there is no punitive action prescribed in the legislation, social audits have not become order of the day and almost all States in India are deficient in
carrying out these audits as prescribed in the relevant legislations.
• Recently, the Centre has given the Comptroller and Auditor General a place in social audit of rural job scheme and direct the States to set up directorates
to train auditors from civil society. A nominee of CAG would be present in social audits that gram sabhas would conduct twice a year. CAG would also do an
annual audit as part of its mandate. Coupled with rigour of CAG’s accounting, the exercise would also bring in the new concept of social audit in
mainstream.
• The National Advisor Council (NAC) has decided to engage NGOs for conducting social audits as various minority organizations alleged that the
development schemes for the community are misused.
• The Ministry of Housing and Urban Poverty Alleviation has laid down Social Audit Methodology and guidelines for various schemes sponsored by it.
• Some states have engaged even voluntary organizations/NGOs for conducting social audits of schemes like midday meals, issue of child labour, female
foeticide, children’s right to education, etc.
SOCIAL AUDIT IN GOVERNMENT SECTOR Social audit as a term was used way back in 1950s. There has been series of activities since then as more and more organizations have become actively involved
in the topic. Evolution of team Anna as crusaders against Corruption, Creation of Central Vigilance Commissioner, Right to Information Act, Citizen Charters, and
now proposed Jan Lok Pal Bill are all representatives of underlying sense of social audit among common masses and the Government has to bow before the
wishes of the people and in the process there is a ray of hope that corruption, red-tapeism, nepotism and favouritism shall give way to a transparent
Government. Government on its part is also on the path of streamlining systems and procedures.
LEGAL FRAMEWORK OF SOCIAL AUDIT IN INDIA The Social Audit in India got a legal status after incorporation of the 73
rd Amendment to the Indian Constitution regarding Panchayati Raj Institutions. This
Amendment gave powers to Gram Sabhas to conduct Social Audits and it was with this historic Amendment that the concept of Social Audit gained importance
in our country. Section 17 of Mahatma Gandhi National Rural Employment Guarantee Act, 2005 mandates Social Audit as, “The Gram Sabha shall conduct
regular social audits of all the projects under the scheme taken up within the Gram Panchayat. The Gram Panchayat shall make available all relevant documents
including the muster rolls, bills, vouchers, measurement book, copies of sanction orders and other connected books of account and papers to the Gram Sabha
for the purpose of conducting the social audit.”
Right to Information Act, 2005 applies to all the states and Union Territories of India except the states of Jammu & Kashmir. However, J & K has also passed
Right to Information Act, 2010, on similar lines. The Act has been a milestone in empowering citizens with the right to seek information from the Government on
the issues of their interest and welfare. Central Government/State Government officers have been now displaying Citizen Charters in their websites as well as in
their office premises specifying the ceiling on the time within which a particular work is to be performed by their functionaries. This has enabled citizens to lodge
complaints in case the charter is not adhered practically. In fact, the Right to Information Act has been promulgated to provide every citizen of India a right to
audit Government performance by way of asking questions in this regard.
FUTURE EXPECTATIONS Social audit in private sector is more of a choice than compulsion. As a result, private sector has not shown so much interest in going for social audit. It is
expected that private sector will be made accountable to society by making Social Cost and Benefit Analysis mandatory for any profitable venture. In Govt.
Sector, social audit will have to be strengthened by provision of punitive clause in the already running social schemes like MNREGA, JNNURM, Sarva Shiksha
Abhiyan, Rajiv Gandhi Gramin Vidutikaran Yojana, Pradhan Mantri Gram Sadak Yojana, Swarn Jayanti Shahari Rozgar Yojana and Bharat Nirman as well as inbuilt
clause of social audit and punitive action in case of default in the schemes to be launched in future.
TO BE EFFECTIVE, THE SOCIAL AUDITOR MUST HAVE THE RIGHT TO: � Seek clarifications from the implementing agency about any decision-making, activity, scheme, income and expenditure incurred by the agency;
� Consider and scrutinize existing schemes and local activities of the agency; and
� Access registers and documents relating to all development activities undertaken by the implementing agency or by any other government
department.
CONCLUSION Social audit, which had started its journey as a discursive practice, is now subsumed under the larger field of corporate social responsibility. The notion of social
responsibility, from which social audit emanates, is essentially a dynamic concept. Its philosophy remain unchanged, but the content which is accorded to its
meaning may change in response to the social demands placed upon business.
For serving a useful purpose, social audit should be on a regular and systematic basis and the findings should be made public with an indication of the actions
taken thereon. Since all the industries, that may be under the purview of social audit do not have the same features, industry – specific social audit programmes
should be developed with an eye to the seasonal factors capable of raising typical issues. Social audit plays a vital role in transparency and accountability but it
has still miles to go. Its present form of documentation is not considered to be consistent documentary evidence. Professionals like Cost Accountants can play a
pivotal role in prescribing as well as conducting social audits. Even Social Auditing and Reporting Standards may also be framed. This will develop a Social
Transparency Regime!
REFERENCES 1. Abt, C. C. (1977), The Social Audit for Management, Amason, New York.
2. Batra, G. S. (1996), Dynamics of Social Auditing in Corporate Enterprises: A Study of the Indian Corporate sector, Management Auditing Journal, Vol. II, No.
2, Pp. 36-45.
3. Bauer, Raymond A. and Dan H. Fenn (1972), What is Corporate Social Audit? Harvard Business Review, 51 (1), Pp. 37-48.
4. Bowen, Howard R. (1953), Social Responsibilities of The Businessman, Harper, New York.
5. Davis, K. (1967), Understanding the Social Responsibility Puzzle, Business Horizon, 10(4), Pp. 45-51.
6. Kerps, Theodore J. (1940), Measurement of the Social Performance of Business (Monograph # 7), United States Government Printing office, Washington, D.
C.
7. Sethi, S. P. (1975), Dimensions of Corporate Social Performance: An Analytical Framework, California Management Review, 17(3), Pp. 58-65.
8. Thomas, Kurian, Social Audit: A Tool Kit-A Guide for Performance Improvement and Outcome Measurement, Published by Director General & Executive
Director, Centre For Good Governance.
9. Utting, P (2000), Business Responsibility for Sustainable Development, United National Research Institute For Social Development, Geneva.

VOLUME NO. 4 (2014), ISSUE NO. 04 (APRIL) ISSN 2231-1009
INTERNATIONAL JOURNAL OF RESEARCH IN COMPUTER APPLICATION & MANAGEMENT A Monthly Double-Blind Peer Reviewed (Refereed/Juried) Open Access International e-Journal - Included in the International Serial Directories
http://ijrcm.org.in/
46
STRATEGIC POSITIONING AS A GROWTH STRATEGY IN COMMERCIAL BANKS IN KENYA
ESTHER WANJIRU MAINA
LECTURER
KARATINA UNIVERSITY
KENYA
ABSTRACT Strategic positioning is about defining how an organization differentiates its offering and creates value for its market. It’s about carving out a spot in the
competitive landscape and focusing the organization to deliver on that strategy. A good strategy includes: Market profile; Customer segments; Competitive
analysis; Value proposition and positioning strategy,(Porter,2000). Competition within the banking sector is not a new phenomenon. Parallel to the emergence of
new banks, the incumbent large banks have expanded operations in neighboring countries. Sometimes new banks adopt strategies of constituting a complement
to the customers’ regular bank, for instance by offering competitive fund management to certain customer categories. The banking sector is, however,
particularly prone to the risk of restrictions on competition (Carter, 1981). This paper analyzes how positioning can enhance business growth as a strategy to
remain competitive. The mainstream banks being key players in the financial sector have adopted product and market differentiation, cost leadership ,service
diversification and market focus strategies to acquire strategic positioning in the financial industry hence growth. The conclusion is that, through strategic
positioning many banks have managed to acquire a national identity, hence increasing their market share, capital and customer base, raise the liquidity levels as
well as upgrading the personnel skills to remain competitive and increase their business volume. The major recommendation is that the banks need to provide
more competitive and affordable financial products and services, concentrate more on creating awareness of the service and widen their market scope through
research and innovation to avoid customer desertion and to remain competitive.
KEYWORDS Strategic positioning, commercial banks.
1.1 INTRODUCTION trategic positioning is the positioning of an organization (unit) in the future, while taking into account the changing environment, plus the systematic
realization of that positioning. It includes the devising of the desired future position of the organization on the basis of present and foreseeable
developments, and the making of plans to realize that positioning. The strategic positioning method is derived from the business world. The method is
aimed at ensuring the continuity of the organization. The strategy determines the contents and the character of the organization's activities. It is a marketing
strategy that aims to make a brand or an organization occupy a distinct position, relative to competing brands or organizations in the mind of the customer.
Companies apply this strategy either by emphasizing the distinguishing features of their brand (what it is, what it does and how, etc.) or they may try to create a
suitable image (Ansoff, 2001).
1.2 GLOBAL TRENDS IN BANKING
Trends affecting banks comprise privatization, regulation and supervision, demographic factors, technological innovations in the global market, Keasey (2003).
The privatization of banks is high on the agenda in France, Germany and Italy. As the influence of government continues, competitive relationship in the financial
sector and in the banking industry particularly has undergone considerable change. Development in regulation and supervision influence the banking industry
via various channels. White (1998) argues that technological developments fundamentally alter the cost structure, output mix and distribution channels of
banks, he goes further to say that the developments in information technology are the most fundamental forces for change in the financial sector. There is
increased competition among banks and other new financial intermediaries in the world. In order to stay competitive and achieve their goals and objectives,
banks are periodically re-evaluating their positioning strategies. Most banks strive towards achieving an integrated banking business which is operationally
efficient (Pearce, 2004). Generally, banks aim to achieve strong organic revenue growth, improve customer loyalty, improve productivity and realize growth in
retail market share and corporate banking market share (Pearce, 2004).
1.3 COMMERCIAL BANKS IN KENYA
The banking system in Kenya is regulated by the Central Bank of Kenya (CBK) Act Cap 491 and the Banking Act Cap 488. These Acts are intended primarily to
facilitate the development and maintenance of a sound monetary policy (GoK, 1989). The industry comprises of financial institutions, among them commercial
banks. Others are either non-bank financial institutions (NBFIs) or Mortgage finance companies. According to the Commercial Banks Directory (2007), Kenya has
a well developed financial sector, particularly for the region, but it is vulnerable to government influence and inadequate supervision. The central issue of
interest by the central bank to the commercial banks is how best to promote access to the financial system by a wider segment of the Kenyan populace.
Commercial banks’ expansionary strategy targets Small and Medium enterprises (SME’s). The future of the industry looks promising with financial and legal
sector restructuring (CBK, 2005). According to the Commercial Banks Directory of 2007 provided by the Central Bank of Kenya, the peer grouping of this sector
has been categorized into small, medium and large banks. The various banks compete for customers and as service providers direct selling forms an integral part
of their day to day marketing activities geared towards attainment of superior financial performance, market share growth and customer retention.
1.4 STATEMENT OF THE PROBLEM
Competition within the financial sector can be viewed as the extent to which financial markets are contestable and the extent to which consumers can choose a
wide range of financial services from a variety of providers. Competition is a desirable feature because it normally leads to increased institutional efficiency,
lowers costs for clients, and ensures improvement in the quality and range of financial services provided. Some measures of competition include total number of
financial institutions, changes in market share, ease of entry and price of services according to (World Bank and International Monetary Fund, 2010). In Kenya
there are forty four commercial banks licensed by Central Bank to carry out banking activities. Out of these fourteen are foreign owned, six have government
participation and twenty are privately owned.
Competition between banks is problematic when it includes communicating on practices which may directly or indirectly affect the competitive conduct of a
bank. Financial institutions have different shapes and sizes (Ansoff, 1999). On one side of the spectrum are diversified banking conglomerates with global
presence; on the other side are local niche players. This means that all banks have to deal with competition. Due to this, it is imperative for commercial banks to
adopt the survival strategies through strategic positioning in the financial sector. This entails a need for common views – in so far as law, regulation and local
circumstances permit. Where the views of competition diverge significantly the promotion of competition amongst banking institutions is impeded. This would
be a harmful and unnecessary obstacle in view of the integration of financial markets (Barth, Caprio, and Levine, 2004).
Zineldin (2009), attests that in the global scene the banking industry did well before the global financial crunch which saw collapse of banks in developed world
like USA and Japan. The aftershocks of the melt down continued to be experienced with slow recovery in the world economy a phenomenon which slightly
affected banks in Africa. This scenario brought challenges due to slowness of credit flow to Africa as the developed economies tried to fix the problem by billing
out their ailing financial institutions.
1.5 COMPETITIVENESS
Competitiveness pertains to the ability and performance of a firm, sub-sector or country to sell and supply goods and services in a given market, in relation to
the ability and performance of other firms, sub-sectors or countries in the same market. Company’s competitiveness depends on the nature of the industry that
S
VOLUME NO. 4 (2014), ISSUE NO. 04 (APRIL) ISSN 2231-1009
INTERNATIONAL JOURNAL OF RESEARCH IN COMPUTER APPLICATION & MANAGEMENT A Monthly Double-Blind Peer Reviewed (Refereed/Juried) Open Access International e-Journal - Included in the International Serial Directories
http://ijrcm.org.in/
47
the company is doing their businesses. Porter (2004) sees the competition as the core to firm’s success or failure and highlights the importance of having a
competitive strategy to successfully position against the forces that determine industry competition.
2. LITERATURE REVIEW 2.1 STRATEGIC POSITIONING STRATEGY
Strategic positioning from a global perspective looks at more than just a particular product. It entails positioning the business or brand in the global marketplace
to the company’s best advantage. It is more comprehensive than product positioning. Procter & Gamble is one of the best examples of a company famous for
their product positioning in the global market. For example Sony has positioned the company as a provider of innovative and higher quality (higher priced)
entertainment electronics.
Apple has strategically repositioned the company as a provider of leading edge technology that is easy to use and redefines the market. Hence they transformed
from selling "a computer for artistic people" to developers of iTunes, iPod, iPhone and the iPad.
Strategic positioning also involves entrenching that position clearly in the minds of the leaders and staff of the business. That motivates them and guides their
decision making.
Strategic positioning is not just about marketing although it determines marketing. Strategic positioning will drive every aspect of the business from operations
to financial decisions.
When you know what you want to do, you will recognize the opportunities as they present themselves.
Porter (2004) argues that superior performance can be achieved in a competitive industry through the pursuit of a generic strategy, which he defines as the
development of an overall cost leadership, differentiation, or focus approach to industry competition. If a firm does not pursue one of these strategy types, it
will be stuck-in-the-middle and will experience lower performance when compared to firms that pursue a generic strategy (Porter, 2004).
2.1.1 PORTER’S FIVE FORCES MODEL OF INDUSTRY
Porter’s Five Forces model is a very popular way of looking at the industry in which a firm operates. An understanding of the theoretical heritage of the Five
Forces model makes it more meaningful to researcher. The S-C-P (Structure, Conduct and Performance) framework from industrial organization economics is
the economic tradition from which Porter developed the Five Forces. The S-C-P framework was originally developed with the intent of helping economists and
policy makers understand when an industry was likely not to be competitive.
2.2 COMPETITIVE STRATEGIC POSITIONING FORCES
The strongest competitive forces determine the profitability of an industry and so are of great importance in business operations. Different forces take on
prominence in shaping competition in each industry. Every industry has an underlying structure, or a set of fundamental economic and technical characteristics,
that gives rise to these competitive forces.Michael porters’ “Five competitive forces” can be used to gain insight into competitive positioning in an industry. It
offers a richer view of competition by capitalizing on the interrelationships of the five powerful and dynamic forces. The five forces are: potential entry, the
power of buyers, the power of suppliers, substitute products and rivalry among existing competitors. (Porter, 1980; Pearce and Robinson, 1994; Thompson and
Strickland, 1987)
2.2.1 APPLICABILITY OF THE MODEL
A high threat of entry makes an industry unattractive because any above normal profits will be quickly dissipated. Barriers to entry help create the cost
disadvantages necessary to minimize the threat of new firms entering the industry. The threat of rivalry depends on firms’ willingness to engage in competitive
practices like price wars, adding product features, offering credit terms, etc. Substitutes meet the same consumer need but do it in a different way whereas
rivals meet the need in the same way. They create a ceiling on prices and profits. If the substitute is close (in terms of filling the customer need) to the focal
firms product, then customers may switch because of relatively small price differences. Suppliers pose a threat to firm and industry profits to the extent that the
market in which the focal firm buys from suppliers is not competitive. Market imperfections may allow suppliers to extract above normal profits from the focal
firm.
Just as powerful suppliers may be able to limit firm and industry economic returns, powerful buyers may also extract above normal returns by exploiting market
imperfections. Michael Porters’ competitive forces can be used to gain insight into competitive dynamics in an industry. It offers a richer view of competition by
capitalizing on the interrelationships of five powerful and dynamic forces.
2.3 PORTER’S GENERIC AND POSITIONING STRATEGIES
According to Porter (2004), Industrial attractiveness alone ensures no survival of the organization. For this reason porter developed three positioning strategies
that create sustainable competitive advantage. Organizations can use their resources to create and sustain a competitive advantage that is to provide greater
value for customers than competitors can. A competitive advantage becomes sustainable when other companies cannot duplicate the benefits it provides and
have. To compete effectively and achieve the sustainable competitive advantage, the Commercial Banks need to employ the porter’s generic strategies namely;
the cost leadership strategy, differentiation strategy and focus strategy.
2.3.1 COST LEADERSHIP STRATEGY
This strategy emphasizes on organizational efficiency so that the overall cost of providing products and services are lower than those of competitors. This low-
cost approach entails careful attention to minimizing cost in every aspect of the business. For effectiveness of this strategy, a business must be a cost leader. The
management should as well consider making at least those products or services that are very important to customers depending on their desired needs. The cost
advantage may help to neutralize threats in the external environment. A cost advantage presents a barrier to entry because would-be entrants face the
investment cost of matching an incumbent’s cost position.
2.3.2 DIFFERENTIATION STRATEGY
This Strategy attempts to develop products and services that are viewed as unique in the industry. Differentiation allows the business to charge premiums or
prices above average profits. Differentiation takes many forms such as design or brand image, technology, and customer care. Due to changes in customer tastes
and needs, businesses following differentiation strategy must carefully assess the customers’ shifting requirements. This strategy is more relevant to the current
study since the commercial banks regularly repackage the existing products; adopt new technology as well as segmenting their customers to the respective
needs.
2.3.3 MARKET FOCUS STRATEGY
This Strategy entails specializing by establishing a position of overall cost leadership, differentiation or both; but only within a particular portion or segment of an
entire market. The rationale is that by specialization, the organization can serve the market segment more effectively than can competitors who cover the entire
market. The business segment may be a particular group of customers, a specific geographic area, or a certain part of the product or service line.
2.4 SUMMARY OF THE STRATEGIC POSITIONING MODEL
Financial service firms employ competitive methods to support Porter's (2004) generic strategy types and how this influences firm performance. A study on
competitive advantage Robinson,(1988) revealed critical competitive methods to be those emphasized at an above average level by more than half of the
banks pursuing a particular generic strategy. The results indicate that firms operating in the banking segment of the financial service industry pursue cost
leadership, product differentiation, customer service differentiation, and focus strategies using competitive methods.
3.0 COMPETITIVE STRATEGIES AND PERFORMANCE OF COMMERCIAL BANKS IN KENYA The choice of a competitive strategy is critical for the survival and success of any company. Therefore, successful survival of any bank depends on production,
packaging and delivery of products to those of competitors. Consequently, Commercial banks in Kenya have adopted strategies aimed at assisting them to
maintain their competitive position in the market and improve their corporate performance. Commercial banks in Kenya have moderate usage of low-cost
leadership strategy with significant variations in its adoption. The use of cost cutting measures, improved business efficiencies and maximization of economies

VOLUME NO. 4 (2014), ISSUE NO. 04 (APRIL) ISSN 2231-1009
INTERNATIONAL JOURNAL OF RESEARCH IN COMPUTER APPLICATION & MANAGEMENT A Monthly Double-Blind Peer Reviewed (Refereed/Juried) Open Access International e-Journal - Included in the International Serial Directories
http://ijrcm.org.in/
48
are the most popular positioning strategies amongst the banks. Due to the competitive nature of the industry, most banks aim at being the low-cost leadership
in the market to gain a competitive edge. For example Equity Bank of Kenya operate accounts with no service charge and they almost offer free service to some
category of customers. It is also evident that most of them also use the differentiation strategy especially introduction of unique features to a product or service
and unique products and services. The greatest impact was on internal business processes and customer perspective which had marked impact on strengthening
internal control and higher levels of customer satisfaction as well as improving profit levels of the banks.
3.0.1 DIRECT SALES STRATEGY
Besides adoption of the Porter’s generic strategies, the banks also use the marketing strategies to position themselves such as the direct sales strategy which is
geared towards customer focus.
Direct sales involve the direct personal presentation, demonstration, and sale of products and services to consumers, usually in their homes or at their jobs
(Michael et al, 2006) and (Xardel, 1993). Glenn (2009), argues that direct selling provides important benefits to individuals who desire an opportunity to earn an
income and build a business of their own; to consumers who enjoy an alternative to shopping centers, department stores or the like; and to the consumer
products market. It offers an alternative to traditional employment for those who desire a flexible income earning opportunity to supplement their household
income, or whose responsibilities or circumstances do not allow for regular part-time or full time employment. Almost all Commercial Banks in Kenya use this
strategy to tap new customers. The banks have established customer care desks to have a physical interaction with the customer. They have also engaged sales
representatives who use the personal selling approach. For example Barclays Banks, Kenya Commercial Bank and National Bank of Kenya have sales people
engaged on contract basis whose main concern is to market the banks products and services to the existing and potential markets.
3.0 PORTER’S GENERIC STRATEGIES AND COMMERCIAL BANKS
In the recent past, Commercial Banks have witnessed stiff competition leading to innovativeness and invent ness in their services and products. As a result the
banks have adopted some strategic positioning strategies as stipulated here below;
3.1 PRODUCT DIFFERENTIATION
Product differentiation is a business level strategy in which firms attempt to create and exploit differences between their products and those offered by
competitors. These differences may lead to competitive advantage if customers perceive the difference and have a preference for the difference. A product
differentiation strategy requires that a firm be able to effectively communicate with customers through advertising, public relations, sponsoring of events, etc.
Due to increasing competition in the financial sector the commercial banks are aggressively and continuously advertising their products where they have
engaged the sales force who embarks on personal selling of the products. The banks have differentiated their products making them attractive to the
consumers. The products are tailor made to suit the various categories of the customers based mostly on the income levels. The banks continuously repackage
the already existing products and services to make them more appealing to cope with the customers changing needs. This assists the banks shift from the
traditional to modern products resulting to customer retention. Through product differentiation strategy, the banks have also demonstrated a lot of creativity
and innovativeness hence development of new products and markets. The banks capabilities lie primarily in design and marketing.
3.2 MARKET FOCUS
Commercial Banks in Kenya focus their efforts and resources to serving few market segments well rather than capturing the whole market. Customized services
to cater for disabled, women, youth, athletes and students in higher institutions of learning, salaried employees and farmers to mention just a few ensures that
the banks have continuous supply of customers. In market focusing, involvement in MSEs through product suitable for a particular group of people ensures a
niche approach to competition. Business club participation, unsecured personal loans for salaried customers are also used as other strategic positioning
strategies by some commercial banks.
3.3 LOW COST LEADERSHIP
A cost leadership strategy is intended to generate competitive advantage by achieving costs that are lower than all competitors. A firm with lower costs than
competitors creates more value because of the greater difference between the firm’s costs and the price the firm is able to charge (i.e., higher profit
margins).The commercial banks apply this strategy in the sense that they price their products differently from the competitors to the extent that they render
some of the services free. On the other hand, as a result of market segmentation and product differentiation, the transaction costs are also minimal while some
accounts are serviced free of charge. The banks use this strategy to attract more customers but they charge more on the credit facilities extended to the
borrowers since the borrowers have no choice since the difference in interest rates margins charged by the competitors seems negligible. As a result the
customers are not in a position to migrate to the competitors .The low cost strategy encourages more investments inform of deposits and savings which the
banks pay a return on and this enables the banks to position themselves better than the competitor. Commercial Banks are able to offer low prices and still
make profits because of its low costs achieved though automation of the service delivery modes hence reducing drastically the operational costs. The banks have
wide branch networks operated online hence reducing the number of employees required to physically serve the customers. The banks thus appear to have
achieved strategic positioning hence competitive advantage with its low cost leadership strategy. For example, Equity Bank started out with a sharp focus on
cost leadership. This strategy allowed it to gain market share and become very profitable. In time, the bank could afford to advertise heavily to convince
customers that they had the low price. This heavy advertising is indicative of a product differentiation strategy.
3.4 SERVICE DIVERSIFICATION
Diversification is Strategic action aimed at creating value for the organization. Commercial banks have created value through service diversification by spreading
core competencies that are generating competitive advantage in one business to other businesses. The banks have engaged themselves into Mortgage services
as well as the Insurance agency and the Stock markets brokerage services. The financial advantages of diversification include; capital allocation efficiency, risk
reduction and tax advantages. Instead of leveraging scope economies across businesses, some commercial Banks like Kenya Commercial Bank have decided to
grow and develop its Savings and Loan Service separately. Other banks consequently have opted for mergers and strategic alliances being another substitute for
growth through diversification.
4.0 CHALLENGES OF STRATEGIC POSITIONING Strategic positioning challenges refer to those pressures that exert a decisive influence on an organization’s likelihood of future success. These challenges
frequently are driven by an organization’s future competitive position relative to other providers of similar products. These challenges generally are externally
driven. However, in responding to externally driven strategic challenges, an organization may face external and internal strategic challenges. External strategic
challenges relates to customer or market needs or expectations; product or technological changes; or financial, societal, and other risks or needs while Internal
strategic challenges relates to an organization’s capabilities or its human and other resources, (Baldrige, 2002)
Competition forces Commercial Banks to constantly engage in offensive and defensive marketing strategies. The competitive moves by some commercial bank
have noticeable effects on its competitors and, thus, invite retaliation or efforts to counter the move (Porter 1980).For example, Equity Bank of Kenya adopted
strategic positioning strategies such as free accounts and all category banking services which made its competitors respond by counterattacking with increasing
advertising expenditures, cutting prices, increasing innovation, and introducing new products, and repacking as well rebranding the existing ones. The bank grew
by taking market share from rivals and creating new markets. The incumbents prepared for attacks by defending their market share and strengthening their
position through repositioning themselves in other segments within the industry. The commercial banks improved their position, by engaging in competitive
battles and adopting offensive strategies. According to Porter (2000), successful use of offensive strategies can help a firm improve its competitive position, gain
market share, and increase profits.
The banks also adopted the defensive marketing strategies such as the pre-entry and post-entry marketing strategies by setting the entry and exit barriers. Pre-
entry defensive strategies are actions taken by firms intended to persuade potential entrants to believe that market entry would be difficult or unprofitable.
Such actions include signalling, fortify and defend, covering all bases, continuous improvement, and capacity expansion. Post-entry defensive strategies are

VOLUME NO. 4 (2014), ISSUE NO. 04 (APRIL) ISSN 2231-1009
INTERNATIONAL JOURNAL OF RESEARCH IN COMPUTER APPLICATION & MANAGEMENT A Monthly Double-Blind Peer Reviewed (Refereed/Juried) Open Access International e-Journal - Included in the International Serial Directories
http://ijrcm.org.in/
49
actions taken by firms intended to protect their market position from companies that have already entered the market or incumbents that are threatening to
take away market share. Such actions include defending position before competitors become established, introducing fighting brands among others.
4.1 BENEFITS OF STRATEGIC POSITIONING
4.1.1 CONTINUOUS PROCESS IMPROVEMENT
This means that commercial banks should be constantly analyzing how they communicate, perform and add value to their organizations. This further implies the
banks need to have an intimate knowledge of their core competencies, and should have an understanding of how their work contributes to the core
competencies, and the environmental factors that are related to those core competencies.
4.1.2 EMPLOYEES' LEVEL OF UNDERSTANDING ABOUT THE ORGANIZATION'S CORE COMPETENCIES IS INITIATED AND REINFORCED BY LEADERSHIP MESSAGES
When leaders communicate how the organization's core competencies are linked to the activities of different organizational subunits, then employees will
understand how their daily efforts are translated into organizational capability. Moreover, when bank managers communicate the organization's vision, and the
values and ideology that support the organizational culture, they enhance employees' understanding of the organization's strategic objectives.
4.1.3 INSTITUTIONALIZING THE PROCESSES OF KNOWLEDGE ACQUISITION.
Knowledge acquisition includes activities such as customer surveys, research and development programs, demonstration projects, performance reviews, and the
analysis of competitors' products. Informal sources for knowledge acquisition activities include trade publications, televised news and print media.
4.1.4 ESTABLISHMENT OF INTERDEPARTMENTAL WORKING GROUPS
Commercial Bank managers establishes interdepartmental working groups that have the assigned purpose of sharing acquired information to solve problems or
develop strategies related to core competencies. Through this the bank managers have made investments in human capital via training and development
programs to standardize and improve information-distribution skills. The banks have as well invested in physical capital and have created company-wide
information systems that increase the ease and rate of information sharing among branches and customers.
4.2 RELEVANT CASE STUDIES ON STRATEGIC POSITIONING
4.2.1 NOKIA AND SAMSUNG
In the Communication Industry market surveys of 2012 have indicated that Samsung surpassed Nokia for the top position in the global handset market in the
first quarter of 2012. The Korean company ( Samsung) shipped 93.5 million handsets in the first quarter for a 25 percent share of the market, even as global
handset shipments grew a little over 3 percent annually. In contrast, Nokia's handset shipments were down 24 percent year-on-year to 82.7 million units, giving
it a 22.5 percent share. According to market research firm Strategy Analytics, only 14% of Nokia’s shipments were Smartphone’s, in contrast to 34% for
Samsung. This marks the first time since 1998 that Nokia has not been number one in the cell phone market (Market Survey Report,2012)
4.2.2 CASE STUDY OF DELL
Business activities of Dell are organized in each region incorporating different customer segments. Which includes the following; Large corporate (Relationship)
customers, Home and small business (Transaction) customers and Public sector (government and educational) customers. Dell segments its customers into
Relationship, Transaction, and Public/International customers. Dell’s segmentation of customers helps it respond to changes in demand among different
customers, to develop new customer segments. Relationship customers are Fortune 1000 companies such as; Microsoft, Mobil, Procter &Gamble, Shell Oil,
Toyota, and Wal-Mart. Transaction customers, which represent 30% of U.S. sales, are small and medium-sized enterprises (about 20%) and Individual Customers
and consumers (about 10%). Transaction customers are served by several thousand inside sales representatives who can call up historical sales records to assist
the customers in choosing systems that match their prior purchase pattern.
4.2.2.1 BASIC STRATEGIES IN DELL’S MARKETING COMMUNICATIONS
SIMPLIFY TECHNOLOGY FOR CUSTOMERS
Making quality personal computers, servers, storage, and services affordable is Dell’s legacy. They are focused on making information technology affordable for
millions of customers around the world. As a result of direct relationships with customers they are best positioned to simplify how customers implement and
maintain information technology and deliver hardware, services, and software solutions tailored for their businesses and homes.
CUSTOMER’S CHOICE AND CUSTOM-TAILORED SERVICES
Dell’s systems & services can be accessed easily by customer via telephone and purchase from website www.dell.com, where they may review, configure, and
price systems within entire product line. Although the focus of Dell’s business strategy has been selling directly to its customers, it also uses some indirect sales
channels when there is a business need. Dell began offering Dimension desktop computers and Inspiron notebook computers in retail stores in the Americas and
announced partnerships with retailers in the U.K., Japan, and China. Dell first steps in retail strategy, which will allow extending business model and reaching
customers that have not been able to reach directly.
Dell’s business base has been built on direct sales, build-to-order strategy for producing and selling PCs. Dell offered competitive prices, high levels of support,
and a focus on selling and supporting PCs without the distraction of offering a number of hardware and services. Dell has made the most of the inherent
advantages of its business model to grow rapidly and profitably. A key advantage of direct sales and build-to-order production is that expensive inventory does
not build up in the channel and lose value before it can be sold.
ENVIRONMENT FRIENDLY
They built environmental consideration into every stage of the Dell product life cycle - from developing and designing energy-efficient products, to reducing the
footprint of manufacturing and operations, to customer use and product recovery.(Source: Scribd.com)
5.0 CONCLUSION Positioning strategies is a vital tool to confront competitive pressures in a market environment and also improve the performance of the commercial banks.
Commercial banks needs to develop a distinctive image by which consumers will be able to identify them with, and provide a combination of features perceived
to be desirable by the target market.
Competition within the banking sector is not a new phenomenon. Parallel to the emergence of new banks, the incumbent large banks have expanded operations
in neighboring countries. Sometimes new banks adopt strategies of constituting a complement to the customers’ regular bank, for instance by offering
competitive fund management to certain customer categories. The banking sector is, however, particularly prone to the risk of restrictions on competition
(Carter, 1981). This increased risk relates partly to the economic characteristics of the sector, like the generally high degree of concentration and the existence of
network effects and entry barriers. Customers often do not possess sufficient countervailing power to balance the economic weight of financial institutions.
Switching costs and a general lack of transparency are two major reasons for this imbalance. Also, specific regulation exists for the banking sector which affects
the behavior of market players (Child, 1990).
Commercial banks are critical for increased investment, economic growth, employment and poverty alleviation. The recent globalization of competition has
caused many Commercial Banks to re-look into competitive strategies of positioning themselves in the financial sector. The Stiff competition in banking industry
has forced banks to move into mortgage finance and back to core business of lending to customers due to low interest rates accruing from government
securities. Banks commenced giving personal loans and credit cards ,hence they have adopted strategic positioning strategies which may take the form of overall
cost leadership, product differentiation, market focusing and diversification of services to suit the diverse needs of the customers. According Porter, (2004),
organizations need to protect themselves against the negative effects of industry- wide competition and to create a sustainable competitive advantage. This
would only happen if organizations strategically position themselves in the competitive sectors as well as adopting the positioning strategies.
6.0 RECOMMENDATIONS Commercial banks need to enhance the performance by increasing the level of significance of positioning strategies adopted in order to distinguish themselves
from its competitors, create an image relative to competitors and be identified in the minds of targeted customers for their product and services. Position

VOLUME NO. 4 (2014), ISSUE NO. 04 (APRIL) ISSN 2231-1009
INTERNATIONAL JOURNAL OF RESEARCH IN COMPUTER APPLICATION & MANAGEMENT A Monthly Double-Blind Peer Reviewed (Refereed/Juried) Open Access International e-Journal - Included in the International Serial Directories
http://ijrcm.org.in/
50
management, market strategies, internal and external infrastructure, use of information technology, ability to innovate and differentiate would be necessary for
the banks as it would enable them to increasingly respond to market considerations therefore enhance competition , profitability and business growth.
6.1 OTHER RECOMMENDATIONS
1. PROFITABLE MARKETS
The banks should identify the most profitable markets now and in future, assessing the present and future needs of customers, setting business development
goals, making plans to meet them and managing the various services and promoting them to achieve the plans - all in the context of changing environment in
the market.
2. RESPONSIVE MARKETING STRATEGIES
The commercial banks should adopt responsive marketing strategies which suggest an attuning or responding to the changing needs of customers, society and
environment. Marketing leads to the creation of new products and services and promotes new ideas to the society which is being served and since marketing
involves an important persuasive role in the formation of public opinion it is unavoidable.
3. MARKET SEGMENTATION
The customer of a bank today is most discerning. With banks operating in a buyer's market, the customer looks for a bank which can meet all his present and
future requirements at an affordable competitive cost. The customer is also increasingly quality-conscious. Almost everyone would appreciate that no two
classes of customers are alike. Therefore in any environment relating to a banks branch or region, the potential clientele can always be classified into different
homogeneous segments. Market segmentation differentiates customers with similar banking needs from those with dissimilar needs. It also provides a solid
basis upon which the marketing strategy of a bank can be designed. Segmenting the market also helps to evolve a distinctive marketing package for each
segment based on the needs of different customer segment. This in turn helps the marketer to cultivate in the customer's mind a perception of psychological
membership of banks offerings. This will result in greater satisfaction of customer needs which will in turn result in to higher returns.
4. BENEFIT SEGMENTATION
The banks should also adopt the strategy of benefit segmentation where segmentation is on the basis of the benefit that a customer seeks from purchasing a
given bank product. For instance, going for a 'credit card' is seeking the benefit of status. Another going for a loan to a particular bank is seeking the benefit of
economy. Similarly, a third customer is seeking the benefit of convenience and prepared to pay a price for prompt, efficient and courteous service. Thus benefits
like status, economy and convenience could be the basis for segmenting the market.
5. PRODUCT DIFFERENTIATION
In the highly regulated banking industry all offer the same type of products. The bank products can be categorised into three groups namely Core products,
Formal products, and augmented products. Some of the core products of commercial banks are Savings Bank Account, Current Account, Term deposit, Recurring
deposit, Cash credit, Term loan, overdraft and the like. The products define the business of commercial bank as well as designing the product in view of the
needs of customers in well defined homogeneous market segment. This may increase the product and customer loyalty.
6. PROMOTION CAMPAIGNS
Due to the inherent intangible nature of services, the customer of banking service relies more on subjective impression rather than concrete evidence. When a
bank comes out with a new product, it makes its target customer segment aware of it only through marketing promotion. The fundamental objective of a
promotion campaign is to persuade the customer to buy the product in preference to other similar products available in the market.
7. PHYSICAL IMAGE
Physical image is the strategic tool for the banks. Banking products are intangible. The intangible nature of the products and services offered by the banks is a
major challenge to the banks in the competitive industry. One among the important strategies that banks need to adopt is the upkeep of branch premises and
interior decor. Packaging in banking products should also be emphasized for instance an attractively designed product brochure or a catchy brand name which a
customer can easily understand or a pictorial design which can represent a particular product.
8. MODERN TECHNOLOGY
Total Branch Automation would enable customers to transact all their banking needs through a single counter instead of going to different counters in the
premises. This would help significantly in improving the efficiency of operations. Automated Teller Machines are capable of performing the function of a bank-
teller or a cashier that is dispensing cash, answering account related enquiries, ordering a new cheque book and providing statements of account among others.
The ATM facilities enable customers to transact with the bank anytime of the day all through the 24 hours. This would reduce the turnaround time of customer
service and as well can be used as a strategy for queue management. Banks through the technique of net-working are able to transmit messages at the push of a
button. Now the mail transfers and telegraphic transfers are effected within a matter of seconds. Technology has also the networking and computerisation of
branches by some banks. This makes it possible for customers to operate their accounts through any branch of the bank once they become the account holder
of a branch. This would increase efficiency and effectiveness of the banks and as well increase customer satisfaction.
REFERENCES 1. Barney, J.B :(1986), "Strategic factor markets: expectations, luck, and business strategy", Management Science, Vol. 32 pp.1231-41
2. Barney, J.B: (1991), "Firm resources and sustained competitive advantage", Journal of Management, pp.99-120.
3. Ennew, C. (1997), "Understanding competitive advantage in retail financial services", International Journal of Bank Marketing. Vol. 15 No.3, pp.73-82.
4. Furst, K., Lang, W, Nolle, D(2000a), "Internet banking: developments and prospects", Office of the Comptroller of the Currency, E&PA Working Paper 2000-
9, September.
5. Hall, R (1992),"The strategic analysis of intangible resources", Strategic Management Journal, Vol. 13 No.2, pp.135-44.
6. Ho, S. (1999), "TQM and strategic change", Strategic Change, Vol. 8 No.2, pp.73.
7. Jourdan, J., Katz, J. (1999), "Banking in the age of information technology", Regional Review, Vol. 9 No.2.
8. Kirui S. (2001) Competitive advantage through outsourcing of Non Core Logistics Activities within the supply chain of British American Tobacco Kenya.
9. Kumar, K. (1997), "Pure versus hybrid: performance implications of Porter's generic strategies", Health Care Management Review, Vol. 22 No.4, pp.47-60.
10. Lamming, R. (1993), Beyond Partnership. Strategies for Lean Supply, Prentice Hall, New York, NY.
11. Lieberman, M., Montgomery, D (1988), "First mover advantages", Strategic Management Journal, pp.41-58.
12. Microsoft (2005), Encarta premium suite Microsoft Corporation, CD Rom encyclopedia.
13. Miller, D. (1992), "The generic strategy trap", Journal of Management Studies, No. January/February, pp.37-41.
14. Mulusa, T. (1988). Evaluation, Education and Community Development Programs, Nairobi: University of Nairobi Press.
15. Njoroge, P. M. (2004) Enforcement of competition policy and law in Kenya: Including case studies in the areas of mergers and takeovers, prevention of
possible future abuse of dominance and collusion/price fixing. Nairobi, the Monopolies and Prices Commission.
16. Nonaka, I. (1991), "The knowledge-creating company", Harvard Business Review, pp.2-9
17. Orodho, H.O. (2005). Elements of Education and Social Science Research methods. Nairobi: Masola Publishers.
18. Owour T.O. (2004) Relationship between Strategic Planning & Competitive Advantage in the Export Processing Zones in Kenya
19. Porter, M. E. (2004) Competitive strategy: Techniques for analyzing industries and competitors. New York, Free Press.
20. Porter's (2004) Generic strategies as determinants of strategicgroup membership and organizational performance", Academy of Management Journal, Vol.
27 No.3, pp.467
21. Robinson, R. (2001) Strategic Management Formulation & Implementation, Richard D. Irwin Inc, USA, 3rd Edition
22. Sako, M. (1992), Prices, Quality and Trust: Inter-firm Relations in Britain and Japan, Cambridge University Press, Cambridge.
23. Schumpeter, J.A. (1950), Capitalism, Socialism, and Democracy, Harper and Row, New York,

VOLUME NO. 4 (2014), ISSUE NO. 04 (APRIL) ISSN 2231-1009
INTERNATIONAL JOURNAL OF RESEARCH IN COMPUTER APPLICATION & MANAGEMENT A Monthly Double-Blind Peer Reviewed (Refereed/Juried) Open Access International e-Journal - Included in the International Serial Directories
http://ijrcm.org.in/
51
24. Senge, P.M (1990), The Fifth Discipline: The Art and Practice of the Learning Organization, Double Day/Currency, New York, NY.
25. Teece, D.J, Pisano, G, Shuen, A (1997), "Dynamic capabilities and strategic management", Strategic Management Journal, Vol. 18 pp.509-33.
26. Van Horne, J.C. (1992), Financial Management and Policy, 9th ed., Prentice-Hall, Englewood Cliffs, NJ.
27. Williamson, O.E (1991), "Strategizing, economizing, and economic organization", Strategic Management Journal, Special Issue, Vol. 12 pp.75-94.
28. Zineldin, M. (1996), "Bank strategic positioning and some determinants of bank selection", International Journal of Bank Marketing. Vol. 14 No.6, pp.12-22.

VOLUME NO. 4 (2014), ISSUE NO. 04 (APRIL) ISSN 2231-1009
INTERNATIONAL JOURNAL OF RESEARCH IN COMPUTER APPLICATION & MANAGEMENT A Monthly Double-Blind Peer Reviewed (Refereed/Juried) Open Access International e-Journal - Included in the International Serial Directories
http://ijrcm.org.in/
52
RURAL EMPLOYMENT DIVERSIFICATION IN INDIA: PROGRESS TOWARDS THE MILLENNIUM
DEVELOPMENT GOALS IN INDIA
SANGHARSHA BALIRAM SAWALE
PGT ECONOMICS
KENDRIYA VIDYALAYA
BHUSAWAL
NEHA RAKESH NAMDEO
COMPUTER INSTRUCTOR
KENDRIYA VIDYALAYA
BHUSAWAL
ABSTRACT The Millennium Declaration adopted by the General Assembly of the United Nations in September 2000 reaffirmed its commitment to the right to development,
peace, security and gender equality, to the eradication of many dimensions of poverty and to overall sustainable development. These are intended for the
Member Countries to take efforts in the fight against poverty, illiteracy, hunger, lack of education, gender inequality, infant and maternal mortality, disease and
environmental degradation. The Millennium Declaration adopted 8 development goals, 18 time-bound targets and 48 indicators. This paper will focus primarily
on the progress in the India’s achievement of Millennium Development goals and their targets relating to poverty, hunger, education and health. While India is on
track to meet the goal of reducing extreme poverty by one half, over half of its population suffers from another type of poverty—hunger. India is on track to meet
the goal of primary school completion rates and gender equality in education. Rates of child malnutrition are extremely high, leading to infection and disease. The
country is severely off course in reducing its very high rates of infant, under five and maternal mortality. These shortfalls not only affect the lives of those
presently living under harsh circumstances, but trap future generations in the cycle of poverty as well.
KEYWORDS Maternal Mortality Rate, Millennium Development Goals, United Nations, Sustainable Development.
INTRODUCTION ndia is increasingly recognized as a global power in key economic sectors. There have also been positive trends on certain social indicators, particularly
those that respond to vertical, campaign-like approaches: the near eradication of polio; a significant increase in literacy rates and the enrolment of both
boys and girls in primary school.
However, progress has been slow in areas requiring systemic changes, such as in the provision of good quality services (i.e. primary health care and community-
based nutrition services). There has also been limited change in the practice of key behaviors related to child well-being, such as hand washing and exclusive
breastfeeding. The HIV/AIDS epidemic continues to spread and poses a significant threat. Issues related to child protection, including trafficking and child labor,
are becoming more pronounced. Repeated and extensive emergencies such as the tsunami, flooding and earthquakes have also adversely affected the lives of
children in India.
The Millennium Development Goals (MDGs) bring to the forefront the importance of human development in the context of sustainable economic and social
development. They join together the international community by creating a framework for advancement that can be measured by the progress on a number of
targets and indicators and by creating an area for global partnerships in development. The goal aims for specific levels of achievement on a number of
development indicators, such as ensuring that all children are in school and reducing infant mortality and improving maternal health.
The Millennium Declaration adopted by the General Assembly of the United Nations at the Millennium Summit held in New York on 8 September 2000. These
are intended for the Member Countries to take efforts in the fight against poverty, illiteracy, hunger, lack of education, gender inequality, infant and maternal
mortality, disease and environmental degradation. All progress is measured using 1990 as the benchmark year and 2015 as the year by which the goals should
be achieved.
The Millennium Declaration adopted 8 development goals, 18 time-bound targets and 48 indicators. In the Indian context, 12 of the 18 targets are relevant. The
UN framework had 53 statistical indicators to measure the progress towards the 18 targets. India adopted 35 of the 53 indicators for the 12 targets concerning
India.
OBJECTIVES OF THE STUDY To explain the progress in the respect of India’s achievement of Millennium Development goals and their targets relating to poverty, hunger, education and
health.
DATA COLLECTION CSO is the nodal agency for statistical tracking of the Millennium Development Goals (MDGs) in India. It has published annually India country report on the
MDGs. For the year 2009it has published India country report in the form of Mid Term Statistical Appraisal Report towards achieving the targets. It is a major
resource of data which is used for this research study. United Nation’s various reports on millennium development goals and World Bank’s study report on MDG
these are also major data sources has been used in this study.
Below is a summary of the goals, their related targets and some selected indicators that India, along with much of the international community, is striving to
achieve by 2015.
MILLENNIUM DEVELOPMENT GOALS
The Millennium Development Goals are:
MDG 1: Eradicate extreme poverty and hunger;
MDG 2: Achieve universal primary education;
MDG 3: Promote gender equality and empower women;
MDG 4: Reduce child mortality;
MDG 5: Improve maternal health;
MDG 6: Combat HIV/ AIDS, malaria and other diseases;
MDG 7: Ensure environmental sustainability; and
MDG 8: Develop a global partnership for development.
I

VOLUME NO. 4 (2014), ISSUE NO. 04 (APRIL) ISSN 2231-1009
INTERNATIONAL JOURNAL OF RESEARCH IN COMPUTER APPLICATION & MANAGEMENT A Monthly Double-Blind Peer Reviewed (Refereed/Juried) Open Access International e-Journal - Included in the International Serial Directories
http://ijrcm.org.in/
53
This paper will focus primarily on the goals and their targets relating to poverty, hunger, education and health and India’s progress in achievement them. The
high percentage of Below Poverty Line people and hunger are become major hurdles in achieving the MDGs. Rates of child malnutrition are extremely high,
leading to infection and disease. The country is trying to reduce its high rates of infant, under five and maternal mortality and is also behind target on primary
school completion rates and gender equality in education.
PROGRESS TOWARDS THE GOALS
India’s position with reference to the various Goals is given below:
GOAL 1: ERADICATE EXTREME POVERTY AND HUNGER
To achieve the Goal of eradicating extreme poverty and hunger, India must reduce by 2015 the proportion of people below poverty line (the proportion of
people whose income is less than $1 a day) from nearly 37.5 percent in 1990 to about 23.9 percent. The poverty ratio for India has declined from 37.5 percent in
1990-91 to 27.5 percent in 2004-05. As per the poverty estimates of 2011-12, the Poverty Head Count Ratio (PHCR) is 21.9% thus India has already achieved the
target against the target of 23.9%. With the historical rate of decline in Poverty HCR, the Country is likely to achieve Poverty HCR level of 20.74% by 2015.
Poverty Gap Ratio which reflects the degree to which mean consumption of the poor falls short of the established poverty line, indicating the depth of poverty
was 5.05 for Rural and 2.70 for Urban India in 2011-12.
Share of Poorest Quintile in National Consumption (MRP-Mixed Recall Period) is 9.75 in Rural India and 7.11 in Urban India in 2009-10.
HUNGER
The MD goal is to reduce the headcount ratio of calorie deficiency from 62.2 percent in 1990 to 31.1 percent in 2015. The proportion of the undernourished
decreased to about 53 percent (World Bank, 2004). It is projected that 39.2 percent of the population will consume fewer calories than required in 2015, as
opposed to the MDG target value of 31.1 percent, which still leaves almost one third of the population suffering from hunger.
All-India trend of the proportion of underweight (severe and moderate) children below 3 years of age shows India is going slow in eliminating the effect of
malnourishment. According to the National Family Health Survey estimates, the proportion of underweight children was 53% in 1990-91. It has declined by 3
percentage points during 1998-99 to 2005-06, from about 43% to about 40%. At the historical rate of decline, it is expected to come down to about 33% only by
2015 vis –a vis the target value of 26%.
Rates of child underweight in India are twice higher than the average figure in sub-Saharan Africa (22 per cent). Recently Prime Minister Manmohan Singh
expressed his serious concern about India’s child malnutrition problem, calling it a matter of “national shame.”
GOAL 2: ACHIEVE UNIVERSAL PRIMARY EDUCATION
To achieve universal primary education under Goal-2, India should increase the primary school enrolment rate to 100 percent and wipe out the drop-outs by
2015 against 41.96 percent in 1991-92.
A trend based on DISE (District Information System on education) data shows that the country is now well set to achieve cent percent primary education for
children in the primary schooling age of 6-10 years ahead of 2015. DISE 2010-11 reports Net Enrolment Ratio (NER) at Primary level as 99.89.
Apparent Survival Rate:Grade V (Ratio of enrolment in grade V to grade 1) is the proportion of pupils starting Grade I who reach the last grade of primary. The
DISE shows apparent survival rate at Primary level of 82 for 2010-11.
According to the trend exhibited during 1991 -2001 (1991: 61.9% and 2001: 76.4 %), India is likely to attain 100% Youth literacy (Literacy rate of 15-24 year olds)
by 2015. The literacy rate (7 years and above) has also increased from 52.2 percent in 1992-93 to 74.04 percent in 2011. But he drop-out rate for primary
education during 2002-03 is 34.89 percent. It is clearly still very high.
India is on-track in terms of improving the proportion of girls to boys in primary education. The trend of national estimates suggests that the country is likely to
achieve universal primary enrolment by the measure of NER well before 2015. The National Program of Universal Education, known as Sarva Shiksha Abhiyan
(SSA) was played the prominent role in this matter.
GOAL 3: PROMOTE GENDER EQUALITY AND EMPOWERMENT OF WOMEN
Under the MDG 4th
number target is that to eliminate gender disparity in primary and secondary education, preferably by 2005, and in all levels of education no
later than 2015. To ensure gender parity in education levels in Goal-3, India will have to promote female participation at all levels to reach a female male
proportion of equal level by 2015. It is important to eliminate gender disparity in primary and secondary education and in all levels of education.
India has achieved gender parity in primary education and the disparity in secondary education is set to disappear shortly. The gender parity in Primary
education reached the target value of 1 in 2008-09 itself. The female: male literacy rate in the age group 15-24 years tends to reach 1 by 2015, implying
attainment of gender parity by 2015.
The percentage share of females in wage employment in the non- agricultural sector, stood at 18.6% in 2009-10 (NSS) and 19.6% and 17.6% were the respective
figures in Rural and Urban areas respectively. It is projected that with the historical rate of progression, the share of women in wage employment can reach a
level of about 23.1% by 2015 which is much below target of 50%.
The Proportion of seats held by women in National Parliament (%) is 11.21% in 2013 vis –a-vis the target of 50% in 2015.
GOAL 4: REDUCE CHILD MORTALITY
One of the MDG goals is to reduce under five mortality rate (U5MR) from 125 deaths per thousand live births in 1988-92 to 42 in 2015. India tends to reach 50
by 2015 as per the historical trend, missing the target by 8 percentage points. However, considering the sharper decline in the recent years, the target is likely to
be met.
The infant mortality rate (IMR) has also come down from 80 per thousand live births in 1990 to 44 per thousand at present against the MDG target of 27 in 2015.
So India is likely to miss the target relating to IMR by 2015. However, the faster decline in recent years indicates to narrowing the gap between the target and
the likely achievement in 2015.
The proportion of one-year old (12-23 months) children immunised against measles has registered an increase from 42.2% (1992-93) to 74.1% (2009) (UNICEF
&GOI- Coverage Evaluation Survey 2009). However, expected to cover about 89% children in the age group 12-23 months for immunization against measles by
2015 and thus likely to fall short of universal immunisation by about 11 percentage points.So India is on-track in terms of improving the level of immunized child.
GOAL 5: IMPROVE MATERNAL HEALTH
To achieve Goal-5, India should reduce maternal mortality (MMR) from 437 deaths per 100,000 live births in 1991 to 109 by 2015. At the historical pace of
decrease, India tends to reach MMR of 139 per 100,000 live births by 2015, against the target of 109. However, the bright line in the trend is the sharper decline
i.e. 17% during 2006-09 and 16% during 2003-06 compared to 8% decline during 2001-2003.
Increase in the proportion of births attended by skilled health personnel is also necessary to achieve the MDG. So India needs to hasten the pace under the
National Rural Health Mission to achieve the related MDG. With the existing rate of increase in deliveries by skilled personnel, the achievement for 2015 is likely
to be 62% only, which is far short of the targeted universal coverage.
GOAL 6: COMBAT HIV/AIDS, MALARIA AND OTHER DISEASES
In so far as Goal-6 is concerned, though India has a low prevalence of HIV among pregnant women as compared to other developing countries. The prevalence
rate has decline from 0.86 per thousand pregnant women in 2004 to 0.39 in 2010-11. This increasing trend needs to be reversed to achieve MDG 6.
In 2001, it was estimated that 0.79 percent of the adult population (age 15-49) was living with HIV/AIDS and that 170,000 children (age 0-14) were living with the
disease as well.
The prevalence and death rates associated with malaria are consistently coming down. At present the death rate associated with malaria is 0.06 percent. The
death rate associated with TB has come down from 67 deaths per 100,000 populations in 1990 to 26 per 100,000 populations in 2010 (WHO report 2011). The
proportion of TB patients successfully treated has also risen from 81% in 1996 to 87% in 2010 with the help of National Tuberculosis Control Programme -RNTCP.

VOLUME NO. 4 (2014), ISSUE NO. 04 (APRIL) ISSN 2231-1009
INTERNATIONAL JOURNAL OF RESEARCH IN COMPUTER APPLICATION & MANAGEMENT A Monthly Double-Blind Peer Reviewed (Refereed/Juried) Open Access International e-Journal - Included in the International Serial Directories
http://ijrcm.org.in/
54
India accounts for almost a quarter of Tuberculosis (TB) cases in the world, with 2 million cases of this completely curable disease occurring on average per year
in the country. TB causes more deaths annually in India – 421,000 deaths per year—than malaria, hepatitis, meningitis, nutritional deficiencies, sexually
transmitted diseases, leprosy, and tropical diseases combined (WHO, 1999).
India’s public spending (federal, state and local governments) in the health sector is a mere 0.9 percent of its GDP. India spends less than other Asian countries.
India also spends significantly less than the three-percent average that developing countries spend on health as a percentage of GDP.
Sustaining the reversing trends in Prevalence of HIV/AIDS, Malaria and TB is continues needed. India’s progress on the MDG of combating HIV/AIDS, malaria and
TB is also satisfactory.
GOAL 7: ENSURE ENVIRONMENTAL SUSTAINABILITY
Under the MDG 7 the target of 9th
number is to integrate the principles of sustainable development into country policies and programmes and reverse the loss
of environmental resources. Goal-7 aims at ensuring environmental sustainability. As per assessment made in 2003, total land area covered under different
forests has been 20.64% due to Government’s persistent efforts to preserve the natural resources. There is an increase in forest cover by about 1128 sq. km
between 2007 and 2011. The reserved and protected forests together account for 19% of the total land area to maintain biological diversity.
As per Census 2011, 67.4%households are using solid fuels for cooking. The Energy Intensity (Amount of energy consumed for producing one unit of GDP) (KWH)
per rupee is decreasing from 0.1594 in 1990-91 to 0.1355 in 2008-09.
The proportion of population without sustainable access to safe drinking water and sanitation is to be halved by 2015 and India is on track to achieve this target.
WATER AND SANITATION
Millions of people in India suffer from waterborne diseases as a result of lack of access to safe drinking water. The Government’s Plan aims to ensure that all
villages have sustained access to potable drinking water by 2007. The target of halving the proportion of households without access to safe drinking water
sources from its 1990 level of about 34% to the order of 17%, to be reached by 2015, has already been attained by 2007-08, much before the target timeline.
The MDG target is 80.5 percent of rural population with access to improved water by 2015. The proportion of people with improved access to drinking water has
raised from 76 per cent in 1990 to 89 per cent in 2010.
It is likely that India as a whole will meet the goal of halving the proportion of people without sustainable access to safe drinking water by 2015 including both
rural and urban sectors (MDG 7, target 10).
Given the 1990 level for households without any sanitation facility at 76%, India is required to reduce the proportion of households having no access to
improved sanitation to 38% by 2015. The NSS 2008-09 reports that, 49.2% households are not having sanitation facility. As per census 2011, 46.9% households
have latrine facility within the premises, whereas the position at rural and urban are 30.7% and 81.4% respectively.It is expected that at the historical rate of
decline, India may achieve to reduce the proportion of households without any sanitation to about 43% by 2015 missing the target by about 5 percentage points
As per Census 2001, 640 towns spread over 26 States/ UTs reported existence of Slums, with 42.6 million people consisting of 8.2 million households resided in
slums of these towns. The share of slum population as percentage of urban population in respect of towns/ cities reporting slums stands at 23.1% in 2001.
GOAL 8: DEVELOP A GLOBAL PARTNERSHIP FOR DEVELOPMENT
Goal-8 is regarding the developing global partnership for development. It is basically meant for the Developed Countries to provide development assistance to
developing countries. The Government of India holds the following views regarding the role of the developed countries in achieving this goal:
The financial support needed to achieve the targets under this Goal However, a huge gap still exists for those countries between the development assistance
required to meet the MDGs and what has been pledged by the developed countries so far.
With regard to one of the targets of the Goal 8, i.e. in cooperation with the private sector, make available the benefits of new technologies, especially
information and communications, India has made substantial progress in recent years.
Under MDG eighteen number target is to increase In co-operation with the Private Sector, make available the benefits of new technologies, especially
Information and Communication.
Overall teledensity (Number of Telephones per 100 population) shows a slight dip recently, after the substantial progress made in the past. The overall tele-
density has remarkably increased from 0.67 percent in 1991 to 73 percent in 2013. Use of Personal Computers has also increased from 5.4 million PCs in 2001 to
14.5 million in 2005 and there are 5.3 million internet subscribers as on March 2005 (2.3 internet users per 100 population and 0.5 per 100 internet subscribers).
In the following table indicate that India’s progress in achieving MDGs.
TABLE 1: PROGRESS TOWARDS ACHIEVING THE MDGS IN INDIA
S.N. Indicator Year 1990
(est. value)
MDG
targetvalue
Year Value Year Value Status
1 Proportion of population below poverty line (%)2 47.8 23.9 1993-94 45.3 2011-12 21.92 Achieved
2 Proportion of under-weight children below 3 years (%) 52 26 1998-99 43 2005-06 40 Off-track
3 Net Enrolment Ratio in primary grade (%) 77 100.0 2004 87.4 2010-11 99.89 Achieved
4 Literacy rate of 15-24 year olds 61 100.0 1991 61.9 2007-08 86 Off-track
5 Ratio of girls to boys in primary education
(Gender Parity Index of GER)
0.73 1.00 1991 0.76 2010-11 1.01 Achieved
6 Ratio of girls to boys in secondary education
(Gender Parity Index of GER)
1.00 1991 0.60 2010-11 0.88 On-track
7 Ratio of girls to boys in tertiary education
(Gender Parity Index of GER)
1.00 1991 0.54 2010-11 0.79 Off-track
8 Share of women in wage employment in the non-agricultural
sector (%)
12.7 50 1995 15 2009-10 18.6 Off-track
9 Under five mortality rate (per 1000 live births) 126 42 1992-93 109 2011 55 Off-track
10 Infant Mortality rate (per 1000 live births) 80 27 1990 80 2012 42 Off-track
11 Maternal mortality ratio (per 100,000 live births) 437 109 1992-93 424 2007-09 212 Off-track
12 Households with sustainable access to an improved water
source, (%)
66.4 83 1993 68 2008-09 91.4 Achieved
13 Households without access to sanitation (%) 76 38 1993 70 2008 49.2 Off-track
Source: Towards Achieving Millennium Development Goals India 2013, Ministry of Statistics and Programme Implementation , Government of India.
The above table shows that India has reached some goals such as proportion of population below poverty line, net enrolment ratio in primary education, ratio of
girls to boys in primary education, supply of drinking water etc. and is on track to achieve others, but is lagging behind in many others.
CONCLUSION India makes up only 2.4 percent of the world surface area of 135.79 million square kilometers, but accounts for almost 17 percent of the world’s population and
is home to over one third of the world’s poor people. So India’s progress towards meeting the goals will not only have a significant impact on its own people, but
on the status of development in South Asia and the world at large.
But it is observed that India is fail to achieve some of the most important Millennium Development Goal (MDG) targets like reduction in maternal and child
deaths and increase in child immunization rates by 2015. The MDG targets will expire in 2015 and not all goals will be achieved by India.

VOLUME NO. 4 (2014), ISSUE NO. 04 (APRIL) ISSN 2231-1009
INTERNATIONAL JOURNAL OF RESEARCH IN COMPUTER APPLICATION & MANAGEMENT A Monthly Double-Blind Peer Reviewed (Refereed/Juried) Open Access International e-Journal - Included in the International Serial Directories
http://ijrcm.org.in/
55
WHO mentioned in its report that India has been effectively reducing its infant and maternal mortality figures, with the help of National Rural Health Mission
(NRHM). But the pace hasn't been satisfactory enough, especially when it comes to infant and maternal deaths.
India has already achieved the targets in boosting primary education, reducing the prevalence of H.I.V., improving forest cover and providing safe drinking water.
But India’s performance is continues to be poor in reducing poverty and improving the nutritional status of children. Even Bangladesh, with lower per capita
income, is showing better results than India in poverty reduction and health improvements. The United Nation’s Millennium Development Goals Report of the
U.N. Secretary-General, 2012, which assesses the regional progress on eight MDGs the world promised to meet, suggests that although progress has been made
on improvements in maternal health, actual targets remain far from achieving the desired rate.
The report found that India is lagging in its effort to reach Millennium goals to reduce poverty and improve health and sanitation, but has shown significant
progress boosting education, treating AIDS and addressing environmental concerns.
The rapid growth of the economy since the early 1990s, and the Government of India increased commitment to accelerating social and economic development,
presents a unique opportunity for all people. But current rates of progress on many indicators are not sufficient to meet many of the Millennium Development
Goals (MDGs) by 2015. Some reports show many of these goals can still be reached with a redoubling of efforts.
Greater effort and focus must be directed to enrolling all children in the development process through improved management and provision of quality basic
social services, promoting child-related behavior change within households, and mobilizing the community to become more involved in the management of
services for children.
Centrally-sponsored schemes have increased public resources to key sectors. The challenge remains to convert these commitments and resources into
measurable results for all, especially those belonging to socially disadvantaged and marginalized communities.
The National Employment Guarantee programme, the Sarva Shiksha Abhiyan in education, Total Literacy Campaign of the National Literacy Mission, 73rd and
74th constitutional amendments providing reservation for women, National Rural Health Mission, Total Sanitation Campaign and Bharat Nirman are some of the
important steps taken by the Government which will help in achieving the Millennium Development Goals.
REFERENCES 1. Millennium Development Goals (Mdgs) - India Country Report-2005 released bythe Ministry of Statistics and Programme Implementation, 2005.
2. Millennium Development Goals States of India Report 2010, Central Statistics Office,Ministry of Statistics and Programme Implementation, Government of
India, New Delhi.
3. Nirupam Bajpai, Jeffrey D. Sachs, and Nicole Volavka, India’s Challenge to Meet the Millennium Development Goals, CGSD Working Paper No. 24, April
2005
4. Planning Commission, Government of India, National Human Development Report, March 2002.
5. The HUNGAMA Survey Report – 2011
6. The United Nation’s Millennium Development Goals Report, 2012.
7. The World Bank, Report on Attaining the Millennium Development Goals in India: Role of Public Policy & Service Delivery, June 2004.
8. Towards Achieving Millennium Development Goals India 2013, Ministry of Statistics and Programme Implementation , Government of India, New Delhi.
WEBSITES
9. Child Development: http://wcd.nic.in/childdet.htm
10. Developmentgoals.org http://www.developmentgoals.org/South_Asia.htm
11. India Budget: http://www.indiabudget.nic.in
12. Planning Commission: http://www.delhiplanning.nic.in
13. World Health Organization: www.who.int/vaccines/en/neotetanus.shtml

VOLUME NO. 4 (2014), ISSUE NO. 04 (APRIL) ISSN 2231-1009
INTERNATIONAL JOURNAL OF RESEARCH IN COMPUTER APPLICATION & MANAGEMENT A Monthly Double-Blind Peer Reviewed (Refereed/Juried) Open Access International e-Journal - Included in the International Serial Directories
http://ijrcm.org.in/
56
RELEVANCE OF TALENT MANAGEMENT IN BUSINESS STRATEGY OF AN ORGANISATION
POOJA SHARMA
RESEARCH SCHOLAR
DEPARTMENT OF COMMERCE
DELHI SCHOOL OF ECONOMICS
UNIVERSITY OF DELHI
DELHI
ABSTRACT Human resources are the most important ingredient in the recipe of a successful business organisation. Hence nurturing and recognising talented employees is
extremely important. However, high attrition rate due to several reasons including compensation issues, poor performance appraisals and poaching prevent
companies to achieve its potential. Retention has become a major concern for business organisation. This paper attempts to highlight Talent Management as a
tool in Human Resource Management making an organisation an attractive destination for skilled employees and retaining them by developing a conducive
environment for their personal and professional development ultimately leading to better productivity.
JEL CLASSIFICATION
M10, M12
KEYWORDS
Human Resource, Talent management, Training and Development.
INTRODUCTION uman Resource Management has come far from the times when it was treated as only a staff function. Now, it is more embedded into the Organisational
Strategy and plays a major role helping a firm achieve its short as well as long term goals. This is because it is now recognised that people working in the
organisation are equally important as the organisation itself.
Talent Management is primarily involves recruitment and identification of talent by spotting high performing individuals in an organisation and formulation and
adoption of strategies for nurturing their talent. This is done by positioning them appropriately in the organisational hierarchy so that they can deliver their best.
It also comprises of providing such employees with avenues for development within the organisation. Hence it is a comprehensive HR tool to recruit and retain
talent in the organisation.
IMPORTANCE OF THE STUDY Talent Management is being increasing recognised as an important tool which helps achieve an organisation its objectives efficiently and effectively. Following
are some reasons a firm should adopt a well defined talent management policy:
1. EFFICIENT UTILISATION OF CURRENT WORKFORCE
It is necessary to recognise the abilities of the people currently employed in the workforce and utilize their talent to the fullest enabling them to meet their
potential. It is also helpful in placing them in the right job at the right time so that best results can be achieved.
2. BENEFICIAL IN DEFINING RECRUITMENT STRATEGY
While formulating the recruitment policy, if HR manager is aware of the required talents where the organisations are facing a skill gap, it is much easier to hire
suitable employees. The skill gap can easily be identified with a help of a definite talent management system in place.
3. IDENTIFYING FUTURE CAPABILITIES
Along with the current job, talent management also helps in gauging a employees future potential to handle greater responsibilities enabling to chart his career
development path within the organisation.
4. LEADERSHIP DEVELOPMENT
If the individual is high performer, with requisite training and development, he/she can be groomed into an effective leader, which in turn can help organisation
achieve its objectives effectively.
5. COMPETITION
The pool of talented employee tends to be limited. Therefore, it is very necessary that a company is able to identify and attract apt talent to gain a competitive
advantage over its rivals.
6. DYNAMIC BUSINESS ENVIRONMENT
With the ever changing global environment where with increased mobility of workforce, technology advancements, talent retention is a key issue.
7. BUSINESS SUSTAINABILITY
Sustainability also connotes efficiency. Efficiency in an organisation is function of cost effectiveness, higher profits, improved productivity and long term viability.
However, all this is not possible if a company lacks competent workforce. Human capital is the most important asset in an organisation.
STATEMENT OF THE PROBLEM The research paper explores the relevance of talent management in business strategy of the organisation.
OBJECTIVE OF THE STUDY The study has the following objectives:
1. To understand the meaning of the term ‘Talent Management’
2. To understand the role of Talent management in Human resource management strategy of an organisation
3. To highlight the challenges faced by corporations to implement an effective talent management strategy
ASPECTS OF TALENT MANAGEMENT According to DeCenzo and Robbins (2005), HRM is a comprehensive function which primarily consists of four activities namely Staffing, Training and
Development, Motivation and Maintenance. Talent Management is a continuous activity and must be incorporated at each of the activities of HRM. Following is
the suggested approach on how talent management can play a role in HRM strategy in the organisation.
H

VOLUME NO. 4 (2014), ISSUE NO. 04 (APRIL) ISSN 2231-1009
INTERNATIONAL JOURNAL OF RESEARCH IN COMPUTER APPLICATION & MANAGEMENT A Monthly Double-Blind Peer Reviewed (Refereed/Juried) Open Access International e-Journal - Included in the International Serial Directories
http://ijrcm.org.in/
57
TALENT MANAGEMENT AND WORKFORCE PLANNING
Workforce planning involves determining an organisation’s human resource needs. These days’ companies are focusing on building a competency framework
and matching the available with that required for their organisation. On the basis of the deficit, hiring plans are formulated. This also involves identifying niche
talent required by the organisation and according choosing the jobs for which recruitment will be necessary. A big challenge the companies face is the dynamic
global environment where skill obsolescence takes place at a fast pace and hence a futuristic hiring process needs to be developed keeping in mind the
technology changes and newer processes being introduced almost every day. Another important issue with workforce planning is choice between developing in-
house talent vs. external recruitment of talent. Costs are involved in both. Therefore, maintaining a talent inventory and then identifying gaps becomes crucial.
TALENT MANAGEMENT AND STAFFING
Staffing principally involves recruitment and selection of employees. At this stage, Talent Identification becomes important task. At the recruitment stage, a
comprehensive recruitment policy must be formulated which describes the source of recruitment as well as the specific job description to attract the right
talent. It is necessary for the HR manager to involve the superiors as well the subordinates to well describe the necessary qualifications, experience and skills
required which fits in well with the organisational setup.
Recruiting the right talent is as important as retaining it. Hence, if right people are identified in the beginning the risk of attrition can be reduced to a great
extent. The way the job is advertised also matters. Therefore, the right medium so that suitable prospective employees are reached out must be ensured. These
days’ innovative techniques are being adopted by companies to attract appropriate candidates. Social media provides a great advantage over traditional
medium as they are considered more reliable for verification of background of a candidate. Moreover, it is cost effective and has a wider reach. The recruitment
process can be made more effortless for the candidates by providing them with the options submitting resumes online.
Selection involves eliminating the least suitable candidates and zeroing on the also right candidate. It requires proper match of the skill set of the candidate with
that of the job specifications. Clearer the job requirements, easier would be for HR manager to choose the correct candidate. Choice of candidates also depends
on future potential which can be identified by putting the candidate through appropriate tests at various stages of the selection process. This again must be in
line with the job in question capable of gauging the latent talent. Work sampling is one of the preferred techniques where a various tasks similar to the nature of
the job are assigned to judge the suitability of the candidate. Various Psychometric tests are also conducted to understand the candidate’s nature and attitude
towards job situations. Nowadays greater emphasis is put on ability of the candidate to embrace the organisation’s work culture. Issues as Equal Opportunity
Cell, diverse manpower and inclusion of women in the workforce are also considered important before selecting employees.
TALENT MANAGEMENT AND TRAINING AND DEVELOPMENT
This is the most important stage in the HR strategy where talent management can play a role. Training and development however have different connotation.
Training is more related to the current job the employee has been recruited. Development is more concerned with future assignments which the employee
might be engaged in.
Once the suitable candidates are selected, it is necessary to make them job ready. Here the superior plays an important role by guiding the new recruit with task
and responsibilities and making the reporting hierarchy clear. While recruitment it is nearly impossible to select a candidate matching exactly the requirements
of the job. Hence, deficiencies or the skill gaps need to be identified and met with appropriate training. This is also termed as Workforce readiness training. It
also involves providing the candidate with training to familiarise with job at hand. While choosing the training program the potential of the employee must also
be kept in mind as to whether he/she will be able benefit from the training program depending on their abilities to adapt. One example is that of simulation
training which are extensively used where similar conditions are created to that of actual workplace at an artificial setting involving experiential exercises.
Training must also involve updating the knowledge at regular intervals incorporating new trends in the market which will ultimately improve employee’s
productivity. Type of training also depends upon the work performance of the employee which needs to be regularly monitored by the superior. This is done by
measuring it against a benchmark and then identifying the gaps. Performance management system plays an important role in this exercise. 360 degree
performance appraisals, Management by objectives, balanced scorecards are popular performance appraisal techniques. A new addition to the list is Just in Time
a feedback mechanism allowing instant evaluation for the job at hand. This is in line with new age technology enabling the managers to take timely corrective
actions. Suitable training programs can then be identified which fill effectively fill those gaps and improve work performance.
Performance appraisal is a continuous exercise which is performed every year and therefore HR managers must formulate system to motivate employees to
constantly improve their performance on job by providing them with adequate rewards and advancement opportunities. Also those not performing up to the
mark should not be shunned. Instead a supportive organisational environment should be developed wherein the reasons for non performance should be
identified and are met with adequate training. Appraisal can also help identify areas where the employee is performing better. The job roles can accordingly be
redefined according to their capabilities. This helps promotes specialisation so that talent in each employee is best utilised. Hence performance management
also helps in efficient delegation of work.
Development of employees is a long term exercise and consists of activities including career management and career development where the future potential of
the employees needs to be kept in mind. High performing individuals can be selected and chosen for higher positions and by providing them with requisite
coaching and mentoring. This is called succession planning. Various organisations follow this technique to nurture superior talent in the organisation. It develops
a feeling of belongingness among employees which in turn helps reduce attrition rates. Aguinis,Gottfredson & Joo (2012) recommends Individualised
development plans for each employee identifying each employees needs and expectations from work.
TALENT MANAGEMENT AND MOTIVATION
A motivated workforce produces superior results. Therefore it is necessary that employees are adequately rewarded. However, different employees have
different motivational needs. Some desire extrinsic rewards such as increase in salary or addition in perquisites. But some prefer intrinsic rewards such as
flexible working hours or promotions. Yet others like more challenging work assignments and participation in the decision making process of the company. The
managers need to identify what works best for their employees to motivate and keep their workforce inspired to work hard.
Remuneration in particular are important motivational factor .Therefore, equity within the organisation as well as with the industry standards must be taken
into account. In addition to that top performing employee’s values superior pay for superior performance as noted by Aguinis,Gottfredson & Joo (2012). Authors
observe that inadequate salary affects performance levels to a great extent hence compensation packages are indeed important drivers for high calibre
employees.
TALENT MANAGEMENT AND MAINTENANCE
The maintenance function comprises of a healthy and competitive work environment which promotes safe and equitable conditions for employees to perform
efficiently and effectively. Here the concept of learning organisation works well. Learning organisation is the one which is always striving to achieve competitive
advantage in its operations by engaging in the best practices and continually improving its business processes identifying new opportunities in the dynamic
business environment and making their workforce adapt to change by providing adequate training. It also includes providing employees opportunities for
growth by charting career development paths. Maintenance also involves integrating employee’s personal and professional goals so that employees are
intrinsically motivated towards achieving better results.
Better employee relations are also a critical element in maintenance function of HR. It includes independence to voice their opinion along with equal
opportunities for promotions and fair assessment of work performance. A well established grievance redressal system for employees must be in place to prevent
unfair treatment to employees.

VOLUME NO. 4 (2014), ISSUE NO. 04 (APRIL) ISSN 2231-1009
INTERNATIONAL JOURNAL OF RESEARCH IN COMPUTER APPLICATION & MANAGEMENT A Monthly Double-Blind Peer Reviewed (Refereed/Juried) Open Access International e-Journal - Included in the International Serial Directories
http://ijrcm.org.in/
58
CHALLENGES FOR TALENT MANAGEMENT 1. DIVERSE WORKFORCE
In this era of globalisation, one of the most pertinent challenges which the organisation faces is that of diverse workforce. Organisation needs to cultivate a
cooperative culture which helps the individuals grow in the organisation without any bias or discrimination. Workforce diversity is a reality which is now faced by
every organisation irrespective of what business they are in. Hence HR department must make sure that mangers are sensitised towards the issue.
2. RETENTION OF TOP PERFORMERS
Talented employees expect good performance compensated appropriately. It is necessary to provide some leverage to high performing employees by rewarding
them at regular intervals. However, needs of each is different. Flexible working hours, customised compensation packages, promotion opportunities are some of
the ways to retain top talent into the organisation.
3. TECHNOLOGY AND TALENT MANAGEMENT
Talent management strategies have specific significance in technology driven industries. Rapid change in technology requires continuous up gradation of
knowledge and suitable changes in training processes to keep the workforce up to date and competitive.
4. INCREASED MOBILITY OF WORKERS
Globalisation has also contributed towards enhanced mobility of workers. People are willing to move from one country to another provided better job
opportunities are available. This adds to the challenge for organisation to retain talent by provide adequate growth opportunities.
5. MANAGERIAL INVOLVEMENT
Talent management requires participation of every manager in identifying and nurturing talent of their employees and not just HR managers. Manager must be
actively involved in job profiling, performance appraisal, training, decision on compensation packages and charting career development paths of employees.
CONCLUSION Human resource department now-a-days is much more than a staff function and more integrated into business strategy of an organisation which is instrumental
in managing employees and bringing the best out of them for achievement of organisational goals. A crucial component of human resource management is
talent management. Talented workforce is an asset to an organisation. It helps build a competitive advantage and makes a business more profitable entity.
Additionally it enhances the reputation of a firm and adds goodwill to an organisation. Therefore, every organisation must have a talent management system in
place so that high potential employees can be identified ad retained in the organisation.
REFERENCES 1. Aguinis, H., Gottfredson, R. K., & Joo, H. (2012). Using performance management to win the talent war. Business Horizons, 55(6), 609-616.
2. Crous, Samantha (30 October 2013)“New trends in talent management for 2014”, viewed on 17th
February 2014, http://www.top-employers.com/
nl/nieuws-en-inzichten/blog/2013/10/new-trends-in-talent-management-for-2014/
3. DeCenZo, D. A., & Robbins, S. P. (2005). “Fundamentals of Human Resource Management” John Wiley and Sons, U.S.A.
4. Skidmore, Krista F. “Where Talent Management Is Headed: Five Trends for 2013 and Beyond” viewed on 15th
February, 2014 http://www.flashpoin
thr.com/five_trends_for_2013.html,
5. ‘Top 9 Talent Management Trends”( August 26, 2013) viewed on 15th
February 2014, https://www.paycor.com/resource-center/top-9-talent-managem
ent-trends
6. “Top 5 Talent Trends in 2014: Futurestep’s predictions for a year of economic recovery”, (7th
Jan, 2014) ,viewed on 16th
February 2014 http://www.f
uturestep.com/press/top-5-talent-trends-2014-futuresteps-predictions-year-economic-recovery/
VOLUME NO. 4 (2014), ISSUE NO. 04 (APRIL) ISSN 2231-1009
INTERNATIONAL JOURNAL OF RESEARCH IN COMPUTER APPLICATION & MANAGEMENT A Monthly Double-Blind Peer Reviewed (Refereed/Juried) Open Access International e-Journal - Included in the International Serial Directories
http://ijrcm.org.in/
59
THE COLLECTIVE ACTION OF ‘GOTONG ROYONG’ SOCIETY IN ELECTRICITY INFRASTRUCTURE
DEVELOPMENT IN REMOTE ISLANDS
ENI SRI RAHAYUNINGSIH
RESEARCH SCHOLAR
FACULTY OF ECONOMICS & BUSINESS
BRAWIJAYA UNIVERSITY
EAST JAVA
ABSTRACT The research aims to reveal the electricity infrastructure development in remote islands, specifically in Sumenep Islands, Madura Indonesia. The research uses
qualitative approach because the development phenomenon is holistic in nature. Initial informant is chosen based on purposive sampling and continued with
snowball sampling. Research findings show that: (1) electricity infrastructure limitation has caused negative effects on society’s welfare; (2) government and
private sector has failed to cooperate in electricity infrastructure development; (3) lack of society’s resources; and (4) strong social capital within the society.
Those conditions drove the society in the research location to provide electricity infrastructure on their own through “gotong royong” activity. The success and
sustainability of “gotong royong” activity is facilitated by strong social capitals, including: (1) actors’ rationality tends to altruistic or sympathy; (2) the institution
(rules of the game) is made in a simple and informal way and mutually agreed; and (3) actors have strong social interdependence. Recommendation for
government to facilitate collective action of “gotong royong” in electricity infrastructure development is by providing supporting infrastructure.
KEYWORDS
collective action, social capital, gotong royong.
I. INTRODUCTION conomic development is a development process aimed to achieve long-term economic growth along with institutional system improvement. The
economic development is indicated by the increase of population welfare. Institutional system improvement, in the other hand, is indicated by
improvement on such aspects as rule of the games and players implementing the rules (Arsyad, 2010).
Infrastructure has strategic role in the development process as social overhead capital stimulating all developmental sectors. Every infrastructure is interrelated
as substitution or complementary. The availability of one infrastructure will influence either directly or indirectly the functionality of other infrastructure in
sequence (OECD, 2006). Therefore, infrastructure development should be conducted in integrated and sustainable way.
NKRI (Unitary State of the Republic of Indonesia) is an archipelago nation with 13.478 islands, 1.340 tribes, 546 languages and various and abundant natural
resources (Google, February 28, 2013). Instead of improving society’s welfare, local autonomy has increased poverty among the society due to social gap,
isolation and infrastructure facilities limitation. At remote islands, the government and private sector has failed to cooperate in infrastructure development. It is
related to the limited governmental budget, non-conducive investment and actors’ moral hazard (Agu, 2009 and Rohima, 2013).
However, the solution is there for the failure of cooperation between government and private sector. Currently, many infrastructures developments are funded
through donation from certain parties as individual or through association; although the free riders are still exist (Miller, 1997). Social interdependency and
natural resources scarcity are incentive for a community or group to have a Mutually Beneficial Collective Action/MBCA in order to solve such issues as public
good supply and shared resources management. Collective action by a community facilitated by strong social capital will decrease the transaction cost in
monitoring and rules implementation due to the interdependence among community’s members. In making a decision, an individual will not only consider the
cost of resources utilization for him/herself but also the expectation of other individuals in his/her community on how someone should behave. It is related to
social character within village and coastal communities. The social characters include interdependence, expectation of individual behavior and norms of
reciprocity. The existence of social sanction or customary sanction can suppress the incentive to break the rule or to be a free-rider. Kimbal’s research (2012)
showed the role of social capital on the success and sustainability of economic activities in Pasar Blante Kawangkoan North Sulawesi.
Based on the background, the research is focused on the phenomenon of society’s collective activity of “gotong royong” in electricity infrastructure
development in Sumenep Islands Madura, which is a remote location.
II. LITERATURE REVIEW 1. RATIONALITY OF COLLECTIVE ACTION OF “GOTONG ROYONG”
Gotong royong or ghutong rojhung or majjama’ manenkki or sitatabangan is one of forms of Mutually Beneficial Collective Action (MBCA), which is the cultural
heredity of Indonesian society and is manifested in all aspects of life including electricity infrastructure development in Sumenep Islands Madura.
A collective action of gotong royong is a rational action since every individual has different strengths and weaknesses; therefore, they will need to cooperate for
mutual benefit and to complement each other (Miller, 1997; Ritzer, 2009). Actors with gotong royong rationality and supported by good moral (altruistic and
sympathy) of productive and efficient behavior will create social capital with positive implication to the success and sustainability of the collective action. On the
other hand, a rationality supported with moral hazard (egoistic and opportunistic) of un-productive and inefficient behavior that lead to tragedy of the commons
will create social capital with negative impact on the success and sustainability of the collective action (Hausman, 1993). A group of heterogenic collective action
has potential to have bigger moral hazard because there are tendency that everyone will feel more comfortable with people who have similarity and wanted to
cooperate with them. For example, one free rider will trigger the emergence of another free rider.
2. SOCIAL CAPITAL AND COLLECTIVE ACTION OF GOTONG ROYONG
The success and sustainability of collective action of gotong royong is influenced by the cognitive and structural aspects of social capital. The cognitive aspect is
the mental process (consciousness internalization) toward norms, values, attitudes, beliefs, etc. The internalization will influence the moral of MBCA’s actors in
terms of trust quality, solidarity, cohesiveness, cooperation, generosity and else. Those morals are called the dynamic factors. The final output of internalization
process is ideas or expectations toward collective behavior to achieve collective benefit. Cognitive social capital is manifested in form of civic culture and has
influencing characteristic. Therefore, social capital within this category is called predispose social capital since it influences people to do MBCA. Another
characteristic of this social capital is intrinsic or hardly observed. The structural aspect of capital social is a building block on how the social capital is constructed.
Therefore, social capital according to structural aspects, reverse to cognitive social capital, has extrinsic or observable characteristic. However, both aspects of
social capital have similar output, which is ideas or expectations leading to MBCA. Structural social capital is in form of network, group or other interpersonal
relationships. The dynamic factors are horizontal and vertical relationships. Structural social capital is manifested in form of social organization to facilitate
MBCA. Therefore, social capital within this category is called assets. Both aspects of social capital will bring ideas or expectations leading to MBCA behavior.
Cognitive social capital influences the community to do MBCA and structural social capital facilitates the MBCA. Cognitive and structural social capitals will be
effective if it is supported by complementary interaction between formal and informal institutional (Dhesi, 2000 and Uphoff, 1999 in Yustika, 2008).
E

VOLUME NO. 4 (2014), ISSUE NO. 04 (APRIL) ISSN 2231-1009
INTERNATIONAL JOURNAL OF RESEARCH IN COMPUTER APPLICATION & MANAGEMENT A Monthly Double-Blind Peer Reviewed (Refereed/Juried) Open Access International e-Journal - Included in the International Serial Directories
http://ijrcm.org.in/
60
3. AGENCY THEORY
Agency theory is a relevance theory in analyzing infrastructure development in Sumenep Islands Madura. According to Lupia & McCubbins (2000) in Zainuri
(2010), agency theory is a theory rooted from the synergy of economic, sociology and organizational theories. Agency theory consists of two actors, principal and
agent. Principal is individual or group who carries the final risk of an activity. Agent is individual or group who has been given the authority or assigned to do the
job from the principal. Principal makes implicit or explicit contract with agent in hoping that agent will act or do the job as stated by the principal. Principal
delegates the authority to agent. The delegation is happened when principal choose the agent to act based on principal’s interest.
The main principle of agency theory is cooperation between a party who give the authority (principal) and the one who receive it (agent) in form of contract. The
implication of the theory tends to cause opportunistic behavior by the agent and harm the principal. To minimize the damage on principal, a simple agency
model assumes two options on contract, which are: (1) behavior-based contract is when principal monitors agent’s behavior, and (2) outcome-based contract is
when principle provides incentive to motivate agent to achieve principal’s interest. Theorists stand on the proposition that when there is cooperation between
principal and agent, the damage on principal occurs because agent most likely will give priority on his/her own interest (egoistic/self-interest).
II. RESEARCH METHOD The research used qualitative approach. This approach is more appropriate in order to find out the meaning of social phenomenon, emotional and one’s
experience in economic context. A qualitative research is based on unique and complex problems. It does not look for generalization but a specific truth in
certain location or context and is holistic in nature (it views research object, in this case gotong royong, as a whole unit inseparable from other aspects). The
research focused on the meaning behind an empirical non-sensual (noumena) and non-nomothetic (measurable and statistical) fact/phenomenon.
The research is limited to find out the institutional of collective action of gotong royong on the supply and utilization of electricity infrastructure in Sumenep
Islands Madura Indonesia. Research location was chosen by considering the appropriateness o the location to the research theme. For islanders who live in
isolated and remote islands, gotong royong is the most effective and efficient option in infrastructure supply and utilization because support from external
parties cannot be expected.
Data in this research was the social reality on gotong royong institutional in the supply and utilization of electricity infrastructure. Source of data was key
informants or people who are considered to have information on the researched phenomenon (Miles, 1992). Initial informant was chosen based on purposive
sampling and continued with snowball sampling. Other source of data were observation on an event and study on relevant documents. Analysis and data
collection was conducted all together to get conclusion.
III. RESULT AND ANALYSIS 1. EFFECT OF LIMITED INFRASTRUCTURE
Sumenep Regency is located in the easternmost of Madura Island. It consists of land and islands. The location of the islands is isolated from the capital city of
Sumenep Regency and is bordered with Borneo, Sulawesi and Bali Islands. This condition has implication on the characteristic of the islanders who are
heterogeneous (multi-ethnic) dominated by Madura and Bugis ethnics. There are relatively no issues caused by the heterogeneity since both ethnics, Madura
and Bugis, share some characteristics. Both Bugis and Madura people are (1) Muslim, (2) uphold the self-esteem; (3) hard work ethics; (4) having wander culture;
(5) strong kinship; (6) strong ethnicity bound; and (5) strong cooperation culture (Rifai, 2007 and Alimudin, 2006).
The islands area consist of nine sub-districts, 84 villages and 126 islands with area of 946,53 km2 or 45% of Sumenep Regency area. The sub-districts in the
islands area are Masalembu, Sapeken, Kangayan, Arjasa, Raas, Nonggunong, Gayam, Talango and Giligenting. Of the 126 islands, 48 are populated and the
remaining 78 islands are not populated. Total population of Sumenep Regency is 297.505 and 103.530 households with average member of family is 2 – 3
people/household. Population density in all sub-districts is relatively low (less than 1000 people/km2) because most islands are not populated. Sex ratio in all
sub-district is less than 100, means that there are more women than men (BAPPEDA, 2009; BPS, 2010).
The large number of unpopulated islands indicates that most of natural resources potential in Sumenep Island are not optimally utilized, especially marine and
fishery resources. Field finding also indicated that infrastructure limitation has caused less people outside the islands who visit or live in the islands. At the same
time, local society who is Madurese and Bugis ethnic has wander culture and high work ethics. It is rare to find an adult male in productive age live in the island
since most of them has been wandered to other regions or even abroad. Population in this area is dominated by elders, women and children.
Infrastructure has a role as social overhead capital stimulating development in all sectors. Every infrastructure is interrelated either as substitution or
complementary. Infrastructure limitation in Sumenep Islands Madura influences, directly or indirectly, other infrastructures malfunction. Generally, this
limitation has implication on the low level of society’s welfare indicated by low quality of life and high living cost.
The low quality of life is indicated by the low number of households having infrastructure facilities. The number of households having electricity facility from the
state power firm (PLN) is 15% and 2% having clean water facilities from PDAM (state-owned water company). Premium, oil and diesel agent from Pertamina is
only available in two sub-districts and Telecommunication from Telkom is only 2%. Those facilities extend only to capital city of the regencies and their
surrounding villages and not for other isolated villages. The condition is exacerbated by the limited ground transportations, bad roads, no public transportation
and street lighting, and limited sea transportation to small and isolated islands.
High living cost is indicated by household’s average expense for basic infrastructure up to Rp. 2.000.000 per month, which includes: (1) electrical bill of Rp.
75.000 – Rp. 350.000 per month; (2) clean water of Rp. 450.000 – Rp.750.000 per month, average clean water per day is 10 gallon costing Rp.1500 per gallon in
rain season and Rp.2500 in dry season; (3) ground transportation ranging from Rp. 300.000 – Rp. 900.000, average gas requirement per day is 1 liter with price
ranging from Rp. 10.000 – Rp.30.000 per liter; (4) sea transportation between nearest islands is around Rp. 25.000 per day or Rp.750.000 per month; and (5) cost
of telecommunication. Those expenses is not included the expenses for consumptions and other expenses.
This high living cost and low quality of live is negatively impacted the Human Development Index (HDI) in the islands. HDI, in general, is lower in the islands than
in Sumenep Regency. The average HDI of Sumenep Regency is 68.90, educational index (EI) is 72.67, life expectancy index (LEI) is 65.08 and purchasing power
index (PPI) of 68.94. Whereas, the average of HDI in Sumenep Islands is 67, 28, EI of 69.21, LEI of 63.55 and PPI 61.73. The low PPI is mainly related to the low
efficiency and productivity of household and company’s economic activities. The low EI and LEI is related to the less optimum educational and health facilities
function.
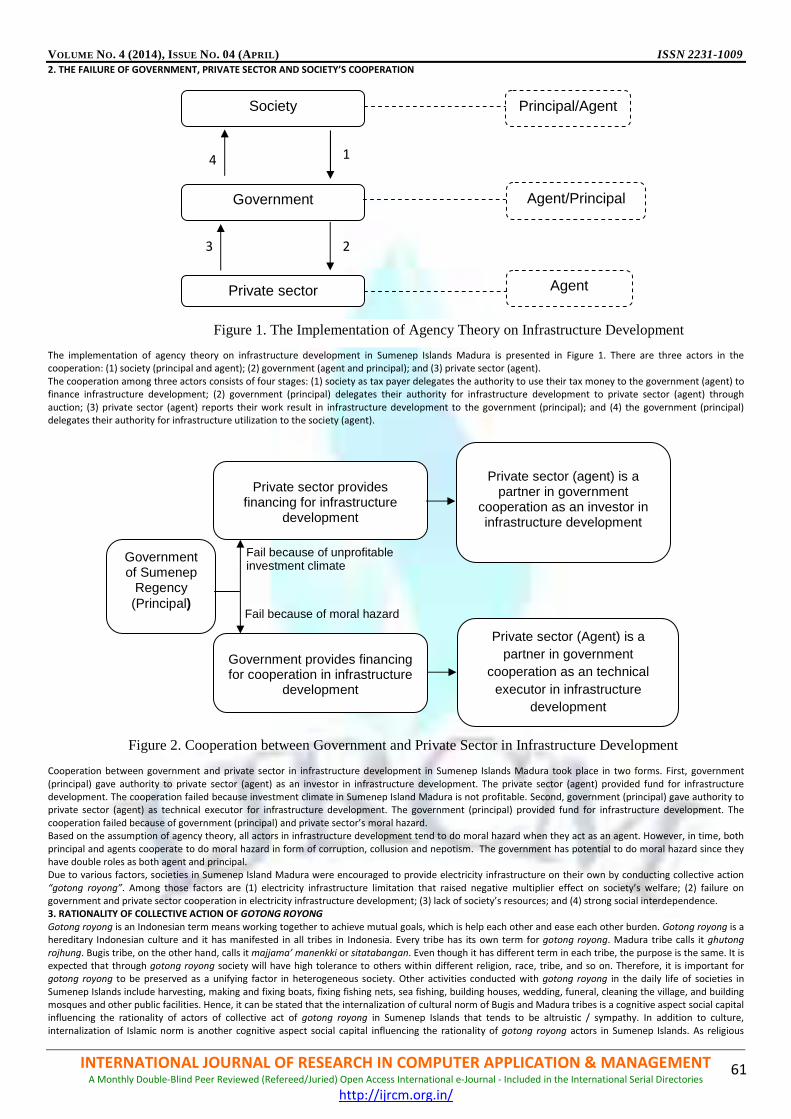
VOLUME NO. 4 (2014), ISSUE NO. 04 (APRIL) ISSN 2231-1009
INTERNATIONAL JOURNAL OF RESEARCH IN COMPUTER APPLICATION & MANAGEMENT A Monthly Double-Blind Peer Reviewed (Refereed/Juried) Open Access International e-Journal - Included in the International Serial Directories
http://ijrcm.org.in/
61
2. THE FAILURE OF GOVERNMENT, PRIVATE SECTOR AND SOCIETY’S COOPERATION
The implementation of agency theory on infrastructure development in Sumenep Islands Madura is presented in Figure 1. There are three actors in the
cooperation: (1) society (principal and agent); (2) government (agent and principal); and (3) private sector (agent).
The cooperation among three actors consists of four stages: (1) society as tax payer delegates the authority to use their tax money to the government (agent) to
finance infrastructure development; (2) government (principal) delegates their authority for infrastructure development to private sector (agent) through
auction; (3) private sector (agent) reports their work result in infrastructure development to the government (principal); and (4) the government (principal)
delegates their authority for infrastructure utilization to the society (agent).
Cooperation between government and private sector in infrastructure development in Sumenep Islands Madura took place in two forms. First, government
(principal) gave authority to private sector (agent) as an investor in infrastructure development. The private sector (agent) provided fund for infrastructure
development. The cooperation failed because investment climate in Sumenep Island Madura is not profitable. Second, government (principal) gave authority to
private sector (agent) as technical executor for infrastructure development. The government (principal) provided fund for infrastructure development. The
cooperation failed because of government (principal) and private sector’s moral hazard.
Based on the assumption of agency theory, all actors in infrastructure development tend to do moral hazard when they act as an agent. However, in time, both
principal and agents cooperate to do moral hazard in form of corruption, collusion and nepotism. The government has potential to do moral hazard since they
have double roles as both agent and principal.
Due to various factors, societies in Sumenep Island Madura were encouraged to provide electricity infrastructure on their own by conducting collective action
“gotong royong”. Among those factors are (1) electricity infrastructure limitation that raised negative multiplier effect on society’s welfare; (2) failure on
government and private sector cooperation in electricity infrastructure development; (3) lack of society’s resources; and (4) strong social interdependence.
3. RATIONALITY OF COLLECTIVE ACTION OF GOTONG ROYONG
Gotong royong is an Indonesian term means working together to achieve mutual goals, which is help each other and ease each other burden. Gotong royong is a
hereditary Indonesian culture and it has manifested in all tribes in Indonesia. Every tribe has its own term for gotong royong. Madura tribe calls it ghutong
rojhung. Bugis tribe, on the other hand, calls it majjama’ manenkki or sitatabangan. Even though it has different term in each tribe, the purpose is the same. It is
expected that through gotong royong society will have high tolerance to others within different religion, race, tribe, and so on. Therefore, it is important for
gotong royong to be preserved as a unifying factor in heterogeneous society. Other activities conducted with gotong royong in the daily life of societies in
Sumenep Islands include harvesting, making and fixing boats, fixing fishing nets, sea fishing, building houses, wedding, funeral, cleaning the village, and building
mosques and other public facilities. Hence, it can be stated that the internalization of cultural norm of Bugis and Madura tribes is a cognitive aspect social capital
influencing the rationality of actors of collective act of gotong royong in Sumenep Islands that tends to be altruistic / sympathy. In addition to culture,
internalization of Islamic norm is another cognitive aspect social capital influencing the rationality of gotong royong actors in Sumenep Islands. As religious
1
2 3
4
Figure 1. The Implementation of Agency Theory on Infrastructure Development
Principal/Agent
Agent/Principal
Agent
Government
Private sector
Society
Government of Sumenep
Regency (Principal)
Private sector (agent) is a
partner in government cooperation as an investor in infrastructure development
Private sector (Agent) is a partner in government
cooperation as an technical executor in infrastructure
development
Private sector provides financing for infrastructure
development
Government provides financing for cooperation in infrastructure
development
Fail because of unprofitable investment climate
Fail because of moral hazard
Figure 2. Cooperation between Government and Private Sector in Infrastructure Development
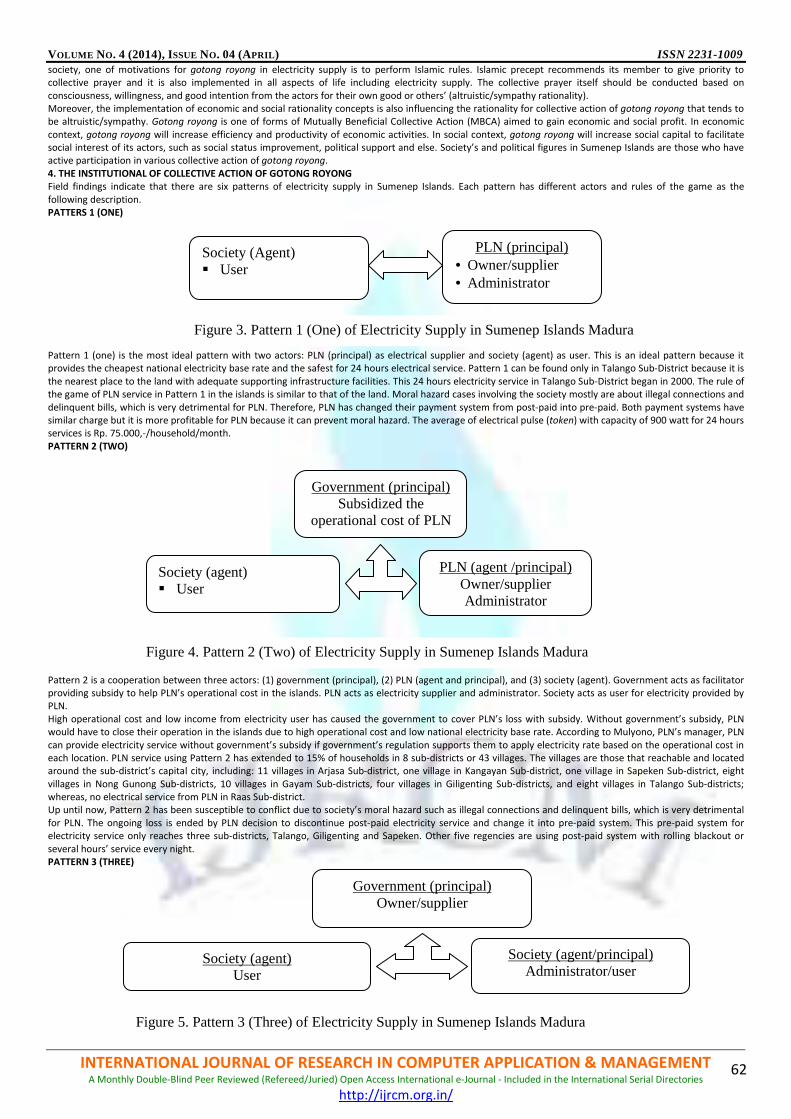
VOLUME NO. 4 (2014), ISSUE NO. 04 (APRIL) ISSN 2231-1009
INTERNATIONAL JOURNAL OF RESEARCH IN COMPUTER APPLICATION & MANAGEMENT A Monthly Double-Blind Peer Reviewed (Refereed/Juried) Open Access International e-Journal - Included in the International Serial Directories
http://ijrcm.org.in/
62
society, one of motivations for gotong royong in electricity supply is to perform Islamic rules. Islamic precept recommends its member to give priority to
collective prayer and it is also implemented in all aspects of life including electricity supply. The collective prayer itself should be conducted based on
consciousness, willingness, and good intention from the actors for their own good or others’ (altruistic/sympathy rationality).
Moreover, the implementation of economic and social rationality concepts is also influencing the rationality for collective action of gotong royong that tends to
be altruistic/sympathy. Gotong royong is one of forms of Mutually Beneficial Collective Action (MBCA) aimed to gain economic and social profit. In economic
context, gotong royong will increase efficiency and productivity of economic activities. In social context, gotong royong will increase social capital to facilitate
social interest of its actors, such as social status improvement, political support and else. Society’s and political figures in Sumenep Islands are those who have
active participation in various collective action of gotong royong.
4. THE INSTITUTIONAL OF COLLECTIVE ACTION OF GOTONG ROYONG
Field findings indicate that there are six patterns of electricity supply in Sumenep Islands. Each pattern has different actors and rules of the game as the
following description.
PATTERS 1 (ONE)
Pattern 1 (one) is the most ideal pattern with two actors: PLN (principal) as electrical supplier and society (agent) as user. This is an ideal pattern because it
provides the cheapest national electricity base rate and the safest for 24 hours electrical service. Pattern 1 can be found only in Talango Sub-District because it is
the nearest place to the land with adequate supporting infrastructure facilities. This 24 hours electricity service in Talango Sub-District began in 2000. The rule of
the game of PLN service in Pattern 1 in the islands is similar to that of the land. Moral hazard cases involving the society mostly are about illegal connections and
delinquent bills, which is very detrimental for PLN. Therefore, PLN has changed their payment system from post-paid into pre-paid. Both payment systems have
similar charge but it is more profitable for PLN because it can prevent moral hazard. The average of electrical pulse (token) with capacity of 900 watt for 24 hours
services is Rp. 75.000,-/household/month.
PATTERN 2 (TWO)
Pattern 2 is a cooperation between three actors: (1) government (principal), (2) PLN (agent and principal), and (3) society (agent). Government acts as facilitator
providing subsidy to help PLN’s operational cost in the islands. PLN acts as electricity supplier and administrator. Society acts as user for electricity provided by
PLN.
High operational cost and low income from electricity user has caused the government to cover PLN’s loss with subsidy. Without government’s subsidy, PLN
would have to close their operation in the islands due to high operational cost and low national electricity base rate. According to Mulyono, PLN’s manager, PLN
can provide electricity service without government’s subsidy if government’s regulation supports them to apply electricity rate based on the operational cost in
each location. PLN service using Pattern 2 has extended to 15% of households in 8 sub-districts or 43 villages. The villages are those that reachable and located
around the sub-district’s capital city, including: 11 villages in Arjasa Sub-district, one village in Kangayan Sub-district, one village in Sapeken Sub-district, eight
villages in Nong Gunong Sub-districts, 10 villages in Gayam Sub-districts, four villages in Giligenting Sub-districts, and eight villages in Talango Sub-districts;
whereas, no electrical service from PLN in Raas Sub-district.
Up until now, Pattern 2 has been susceptible to conflict due to society’s moral hazard such as illegal connections and delinquent bills, which is very detrimental
for PLN. The ongoing loss is ended by PLN decision to discontinue post-paid electricity service and change it into pre-paid system. This pre-paid system for
electricity service only reaches three sub-districts, Talango, Giligenting and Sapeken. Other five regencies are using post-paid system with rolling blackout or
several hours’ service every night.
PATTERN 3 (THREE)
Society (Agent) � User
PLN (principal) • Owner/supplier • Administrator
Figure 3. Pattern 1 (One) of Electricity Supply in Sumenep Islands Madura
Society (agent) � User
Government (principal) Subsidized the
operational cost of PLN
PLN (agent /principal) Owner/supplier Administrator
Figure 4. Pattern 2 (Two) of Electricity Supply in Sumenep Islands Madura
Society (agent) User
Government (principal) Owner/supplier
Society (agent/principal) Administrator/user
Figure 5. Pattern 3 (Three) of Electricity Supply in Sumenep Islands Madura

VOLUME NO. 4 (2014), ISSUE NO. 04 (APRIL) ISSN 2231-1009
INTERNATIONAL JOURNAL OF RESEARCH IN COMPUTER APPLICATION & MANAGEMENT A Monthly Double-Blind Peer Reviewed (Refereed/Juried) Open Access International e-Journal - Included in the International Serial Directories
http://ijrcm.org.in/
63
Pattern 3 is a cooperation between government and islanders with three actors: (1) government (principal); (2) administrator society (agent and principal); and
(3) user society (agent). The government has shown its commitment on electricity infrastructure development in Sumenep Islands by giving assistance in form of
PLTD (Diesel Power Station) to the society through sub-district government. Since the assistance is limited, only few people are able to have benefit from the
program, especially those who live in sub-districts’ capital city. The uneven distribution for PLTD assistance has created conflict in the society.
The sub-district government, then, gives the authority to manage PLTD to the society. In each sub-district, the society will from groups of 30-50 people based on
PLTD capacity. Some people, then, selected by the members of group to be PLTD administrators. In this case, the administrators are also the users. The
administrators act as coordinators in running the organization related to the agreement on the rule of the game, service hours, service rate, bill payment, PLTD
maintenance, PLTD operational, electrical connection supervision to avoid moral hazard conducted by member or free rider.
The use of PLTD in-group is more efficient since the cost is shared. However, it has some disadvantages, among other: (1) the utilization is limited since it should
be share with other users; (2) less safety since the administrator is not professional people; (3) higher labor cost for operational, maintenance, supervision and
collecting payment from users; and (4) high potential for conflict and fraud by administrators and users.
Pattern 3 is susceptible to conflict because moral hazard of the administrators and users. Without good supervision, the administrators were less discipline in
performing their duties to operate and maintain PLTD in accordance with the rule. Therefore, the PLTD is often damage and malfunction, and it has shorter
economic life. The same goes for user, without supervision they use the opportunity to make illegal connections and delay the bill payment, which is detrimental
and put other users in danger. Administrators and users’ moral hazard lead to loss caused by high operational cost and low income. The ongoing moral hazard
has caused malfunction on PLTD and electricity blackout.
The failure in PLTD management by society was found in Masalembu Sub-district. In 2001, Masalembu Sub-district received PLTD aid from the Sumenep Regency
Government and East Java Province Government. In 2001, PLTD management was handed over to the society in a group. PLTD management by the society has
failed because it is not supported by professional human resources to operate and maintain the PLTD and moral hazard from user who made illegal connection
and delay the bill payment. Users and administrators were blaming each other whenever PLTD broke. In turn, the PLTD cannot function because of the damage
and the operational has experienced loss. Due to the failure, PLDT management was returned to the local government in 2009.
PATTERN 4 (FOUR)
Pattern 4 (Four) is the result of pattern 3 (three) failure. The actors on Pattern 4 are: (1) government as the owner/supplier of PLTD (principal); (2) private sector
as the administrator (agent and principal); and (3) society as the user (agent).
The government followed up the failure of PLTD management by society by auctioning PLTD management to private sector. The private sector who won the
auction will be determined as PLTD management in the islands. In Masalembu Sub-district, CV Angkasa Surabaya won the auction. During 2009 – 2012, there
was no problem in the management. However, in 2012, the PLTD began to broke and has caused high operational and maintenance costs. The damage has
forced the management to do rolling blackout and provide electricity service for 2 – 3 hours/night. The bill for users, however, was remained the same as
previously before the PLTD broke, which is around Rp. 200.000 – Rp. 350.000/month/household. The condition lasted for months. It created conflict between
the user society and CV Angkasa as the management. The user are forced to pay the bill to get electricity connection.
The condition continued until in November 3, 2012, the regent of Sumenep Regency came to Masalembu. During the visit, the society and member of provincial
council (DPRD) from Masalembu demanded the government to draw the authority for PLTD management from CV Angkasa and give the management to PLN
that is considered more professional. PLN, however, is not willing to provide the electricity because of the loss. Following are dialogue between KH. Busyro Karim
(Regent of Sumenep), Darul Hasyim (member of DPRD Sumenep from Masalembu Island), Mulyono (PLN Manager in Sumenep Regency) and Hairul (society’s
representative from Masalembu).
Society “People in Masalembu have been experienced blackout for months because one of PLTD managed by CV Angkasa has malfunctioned. We are
also object for the high electricity bill charged by the management to us because we have to pay the same bill whilst we did not get the
electricity. We ask the government to give the management to PLN.”
DPRD “I want to ask to Regent to fulfill the demand. People in Masalembu do not receive electricity service; however, they are still willing to pay the bill
because they do not want their electrical connection being cut.
Regent “The government has given maximum effort by giving PLTD to be managed by the society; however, it was failed. Then, the PLTD management
was handed over to the private, and it failed too. Now, the society wants to have electricity service provided by PLN. I think I will turn to Mr.
Mulyono as PLN Manager in Sumenep Regency to answer the question.”
PLN “Thank you Sir. Basically, PLN is ready to provide electricity in the islands, with some condition: (1) everyone in the islands willing to be pre-paid
electricity customers; (2) facility for pre-paid electricity pulse (token) refill should be available; (3) there are no illegal connection; and (4) there
will be special rate or special subsidy for isolated and unreachable islands area. All of those requirements should be fulfilled because PLN has
been experienced huge loss due to high operational cost and low income from the customer. The high cost is related to highe fuel cost and other
equipments; whereas, low income is related to the many illegal connections, users who in debts and PLN obligation to apply national electrical
base rate (TDL) that unsuitable with operational cost in the islands.
The requirements mentioned by PLN indicate the rationality of PLN when giving electricity service in Sumenep Islands. Any electricity service demand that is not
economically feasible will be rejected.
Government (principal) Owner/supplier
Society (agent) User
Private sector (agent/principal) Administrator
Figure 6. Pattern 4 (Four) of Electricity Supply in Sumenep Islands Madura

VOLUME NO. 4 (2014), ISSUE NO. 04 (APRIL) ISSN 2231-1009
INTERNATIONAL JOURNAL OF RESEARCH IN COMPUTER APPLICATION & MANAGEMENT A Monthly Double-Blind Peer Reviewed (Refereed/Juried) Open Access International e-Journal - Included in the International Serial Directories
http://ijrcm.org.in/
64
PATTERN 5 (FIVE)
Pattern 5 (five) consists of two actors, owner society (principal) and user society (agent). The failure of government and private sector in providing electricity in
the islands has forced the society in the islands to provide their own electricity by conducting collective action of gotong royong. Electricity service through the
collective action of gotong royong has fulfilled ±85% of households’ requirement in Sumenep Islands that spread in nine sub-districts and 84 isolated villages.
Table 1 shows six stages conducted to provide electricity using Pattern 5 which is through gotong royong.
TABLE 1: STAGES IN COLLECTIVE ACTION OF GOTONG ROYONG TO PROVIDE ELECTRICITY IN SUMENEP ISLANDS MADURA
Stages Activities
1 Societies in the islands make sure that they are no longer able to count on electricity facilities from external parties (government and private sector)
2 Societies in the island who live in a group in close neighborhood have initiative and agree to provide electricity on their own by conducting collective
action of gotong royong
3 The group of collective action of gotong royong consists of two actors, the generator’s owner (principal) and the lessee (agent). The generator’s owner
is people who are wealthy and have high social status. The lessee, in the other hand, is people who live near the generator’s owner. Therefore, the
generator bought should be based on the owner’s ability or the lessee’s requirement.
4 Before buying the generator, all actors create the rule of the game (institutional) that should be mutually agreed. The rules including (1) actors’ right
and obligation; (2) sanction for actors who break the rule; and (3) service technique, consists of: installation network installment, service duration
(hour), rate, time to pay, and electricity voltage allocation. The rate can be changed based on operational cost fluctuation, especially the fuel price.
5 Principal will buy the generator, equipments and install the electricity installation network for all users.
6 Service technique will include service operational, generator maintenance, network supervision, and payment collection. Service security is not
guaranteed because it has not supported by professional and certified workers as regulated on Minimum Service Standard. Networking supervision
and payment collection are conducted regularly to prevent moral hazard of illegal connection and delayed payment.
Source: Primary data processed, 2012
Pattern 5 (five) has some advantages, among other: (1) relatively better maintenance and supervision for it managed by generator’s owner and assisted by some
workers; (2) more efficient in cost since it is shared; and (3) relatively small potential of conflict and moral hazard because actors’ rationality tend to be
altruistic/sympathy, principal and agent have strong social interdependency, and all rules of the game are mutually agreed. However, it also has some
disadvantage: (1) security is less guaranteed because it is not supported by professional human resources; (2) the electricity utilization is limited because it
should be shared with other lessees; (3) high cost on labor for operational, maintenance, supervision on illegal connection and payment collection from users;
and (4) it still has potential of conflict and moral hazard.
Based on the field findings, the capacity of generator mostly used by the society is 900 watt and 2200 watt. The average price of the generator is Rp. 3.000.000
for 900 watt and Rp 8.000.000 for 2200 watt. On average, each household receives electricity service between 50-100 watt. Many households only use one or
two lamps with 5 or 10 watt capacity without any television. Therefore, generator with capacity of 900 watt can be used for 10-20 households and the 2200 watt
can be used by 30 – 50 households. Different rates and service hours are found in several locations, especially in Sapeken Sub-district. Based on service hour
duration, there are four groups of collective action of gotong royong, as the following description:
Group 1. Electricity service for 3 hours per night from 18.00 – 21.00 WIB (Western Indonesian Time) is found in Sapangkur Kecil Island in Sapeken Sub-district.
PLTD with capacity of 900 watt, on average, can provide service for 13 households with various rates: (1) three lamps is Rp. 35.000/month; (2) two lamps and TV
is Rp. 55.000/month.
Group 2. Electricity service with 5 hours duration per night is found in Salarangan and Paliat Islands in Sapeken Sub-district. In Salarangan Island, the duration is
from 18.00 – 23.00 WIB with various rate: (1) 10 watt lamp is Rp. 15.000/lamp/month; and (2) one 10-watt lamp and TV is Rp. 60.000/month. There are six Solar
Power Stations (PLTS) in Salarangan Island provided by Sumenep Regency Government. The uneven distribution for PLTS is the source of conflict among the
societies. In Paliat Island, 1 unit of PLTD from government’s aid and 30 PLTD from individual who rented them are available. The service duration is between
17.00 – 22.00 WIB with various rates: (1) 10 watt lamp is Rp. 1.500/lamp/day; and (2) one 10-watt lamp and TV is Rp. 2.500/day. The electricity bill is paid
directly to the owner every five or ten days.
Group 3. Electricity service with duration of 6 hours per night is found in Pagerungan Kecil, Sadulang Besar, Sadulang Kecil, Saular, Sitabok, Sabuntan and
Saredeng Islands Sapeken Sub-district. The duration is from 18.00 – 24.00. The rate varies for every island: Pageringan Kecil Island is Rp. 240.000/month;
Sadulang Besar and Sadulang Kecil Islands is Rp. 15.000/lamp/month for 5-watt lamp and Rp. 17.500/lamp/month for 10-watt lamp; Saular Island is Rp.
100.000/month for lamp and TV and Rp. 50.000/month for lamp only; Sitabok Island is Rp. 130.000/month for lamp and TV; Sabutan Island is Rp.
15.000/lamp/month for 8-watt lamp; and Saredeng Island is Rp. 100.000/month for three lamps and TV.
Group 4. Electricity service with duration of 10 hours per night is found in five sub-districts, (1) Giligenting, (2) Raas, (3) Sapeken in Sapangkur Besar, Saur, Saseel,
Sepanjang Islands; (4) Arjasa in Sagubing and Mamburit Islands; (5) Kangayan in Bungin Nyarat, Saobi and Sapapan Islands; (6) Gayam; (7) Nong Gunong, and (8)
Masalembu in Karamian and Masakambing Islands. The duration for the service is from 17.00 – 05.00 am WIB. At midnight, from 00.00 – 02.00 am, the
electricity is off because the generator should rest. The rate in Sapeken Sub-district Sapangkur Besar Island for two lamps and TV is Rp. 95.000/month; in Saur
Island is Rp. 35.000/lamp/month for 10-watt lamp, Rp. 45.000/month for two 10-watt lamps, and Rp. 85.000/month for three lamps and TV; in Saseel Island is
Rp. 30.000/lamp/month; and Sapanjang Island is Rp. 30.000/lamp/month for lamp only. In Raas Sub-district the rate for 10-watt lamp is Rp. 25.000/lamp/month
and for TV is Rp. 50.000/TV/month; whereas, in Arjasa Sub-district in Sagubing and Mamburit Islands is Rp. 25.000/lamp/month for 6-watt lamp and in Kangayan
Sub-district in Bangun Nyarat and Saobi Islands is Rp. 15.000/month for 5-watt lamp. In Sapapan Island, the rate is Rp. 20.000/lamp/month for 5-watt lamp and
Rp. 48.000/month for TV. In Arjasa, rolling blackout is conducted every 10 days.
Society (principal) � Owner/supplier � Administrator � USer
Society (agent) User
Figure 7. Pattern 5 (Five) of Electricity Supply in Sumenep Islands Madura

VOLUME NO. 4 (2014), ISSUE NO. 04 (APRIL) ISSN 2231-1009
INTERNATIONAL JOURNAL OF RESEARCH IN COMPUTER APPLICATION & MANAGEMENT A Monthly Double-Blind Peer Reviewed (Refereed/Juried) Open Access International e-Journal - Included in the International Serial Directories
http://ijrcm.org.in/
65
TABLE 2: CALCULATION FOR GENERATOR COST
Duration of Service Cost for Generator owned and used by Individual
(Rp/household/month)
Cost for Generator Owned and Used by Individual and Rented to Others
(Rp/household/month)
Assumption: 100 watt/household
Cost Calculation Rate Calculation Rate applied in Pattern 5
900 watt 2200 watt 900 watt 2200 watt
5 Hour 3,692,000 6,927,667 410,222 337,621 75.000 -150.000
6 Hour 4,430,400 8,413,200 492,267 405,145 150.000 – 200.000
10 Hour 7,384,000 14,355,333 820,444 675,242 300.000 – 450.000
24 Hour 14,768,000 29,210,667 1,640,889 1,350,485
• PLN bill using national electricity base rate (TDL) with capacity of 900 watt and 24 hours service is Rp. 75.000/month/household in average
• Assumption: All cost is calculated in detail based on maintenance regulation with fuel price of Rp. 20.000/l
Source: Primary Data (processed), 2012
Table 2 shows that the cost for electricity for 2200 watt generator is more efficient than that of 900 watt. PLN electricity rate is the cheapest compare to all
other patterns because: (1) PLN uses national electricity base rate, which is very cheap; (2) PLN uses PLTD (big scale generator), which is more efficient; and (3)
PLN is supported by professional human resources. The rate for pattern 5 (five) implemented in the islands, however, is cheaper compare to other electricity
rates calculated. This cheaper rate is related to several factors: (1) the generator’s owners have double motivation – economic and non-economic - influencing
their rationality that tend to be altruistic/sympathy and less care about detail cost calculation; (2) strong social interdependency between the owners and
lessees; (3) the owners are unable to calculate all operational and maintenance cost in detail, including the fluctuated fuel price; and (4) the owners do not
follow the regulation on generator operational and maintenance. Owners and lessees are bounded by simple and semi-formal cooperation contract based on
mutual agreement. Social capital between owners and users is the main factor determining the success and sustainability of the cooperation.
PATTERN 6 (SIX)
Pattern 6 (Six) is the simplest pattern because it has one actor. The owner is also the administrator and user because one household has one private generator
and it is not rented to others. Pattern 6 (Six) has disadvantage as the owner has to bear the high operational cost. The advantages, however, are many: (1) it
improves social status; (2) bigger using capacity in accordance with the generator’s capacity; (3) longer economic life since the maintenance is guaranteed; and
(3) no conflict potential with others. Many households who have the private generator and do not rented them do not use the generator due to huge
operational cost (see Table 1).
5. CONCLUSION Infrastructure limitation in Sumenep Islands Madura has caused negative multiplier effects on society’s welfare. The failure of government and private sector
cooperation in infrastructure development has encouraged the society to do collective action of gotong royong to provide electricity as shown in Pattern 5. The
success and sustainability of collective action of gotong royong has been facilitated by strong social capitals, which are: (1) actors’ rationality who is
altruistic/sympathy with mutual beneficial motivation; (2) semi-formal, simple and mutually agreed rules of the game, (3) lack of society’s resources; and (3)
social interdependency among the actors. With the success of collective action of gotong royong in electricity supply in Sumenep Island, there are two
recommendations for government’s policy: (1) the government will facilitate society’s collective action of gotong royong to provide other infrastructures unable
to be provided by the government and private sector; and (2) the government should be more focused on limited budget for infrastructure supply unable to be
provided by private sector or society using collective action. In turn, it can create a complementing and mutually beneficial cooperation between private sector,
government and society.
GLOSSARY Term Description
Holistic A school of thought stated that social reality (fact) has dual characteristics and cannot be separated.
Tragedy of
Commons
A group of individual who are competing to use shared resources for personal gain without regard to interest of others.
Principal An individual or a group of people or organization who has the biggest interest and authority in an activity. The principal gives the
authority to the agent.
Agent An individual or a group of people or organization who receives the trust or the authority from the principal to achieve principal’s
interest.
Altruistic/
Sympathy
One of human characteristics that put weight on others’ interest or the good of his/her fellow men than his/her own interest; a
personal interest that beneficial to others’ interest.
Egoistic/
Opportunistic
One of human characteristics that put weight on personal interest than others’ interest; a personal interest that detrimental to
other’s interest.
Rationality One of human characters that always choose the best and most beneficial option for one’s personal interests among other options.
Moral Hazard Behavior that deviates from the prevailing norms that benefit themselves and harm others.
Gotong royong Mutually Beneficial Collective Action (MBCA)
REFERENCES 1. Agu, Chukwuma dan Vincent A. Onodugo. (2009). Capacity, Proximity and the Limitations of Infrastructure Services Decentralisation for Poverty Reduction :
Evidence from Benchmarking of Nigerian States. Journal of Infrastructure Development, 1, 153-178. Published by: SAGE http://www.sagepublications.com.
2. Alimuddin, Muhammad Ridwan. 2006. Bugis People, Rantau and their culture. http://www.google.com. 29 Juli 2010
3. Arsyad, Lincoln. (2010). Developmental economic; forth edition. Yogyakarta: BP STIE YKPN.
4. BAPPEDA Sumenep Regency. (2009). Islands Area Profile of Sumenep Regency; Regional Development Plan Agency, Sumenep Regency.
5. BPS Sumenep Regency. (2010). Sumenep Regency in Numbers 2010). Bureau of Statistic Sumenep Regency.
Society/Individual(Principal/agent) � Owner/supplier � Administrator � User
Figure 8. Pattern 6 (Six) of Electricity Supply in Sumenep Islands Madura

VOLUME NO. 4 (2014), ISSUE NO. 04 (APRIL) ISSN 2231-1009
INTERNATIONAL JOURNAL OF RESEARCH IN COMPUTER APPLICATION & MANAGEMENT A Monthly Double-Blind Peer Reviewed (Refereed/Juried) Open Access International e-Journal - Included in the International Serial Directories
http://ijrcm.org.in/
66
6. Dhesi, Autar S. (2000). Social Capital and Community Development. Oxford University Press and Community Development Journal, Vol 35, No 3:199-214
7. Hausman, Daniel M and Michael S.McPherson.(1993). Taking Ethics Seriously: Economics and Contemporary Moral Philosophy. Journal Economic
Literature, 31, 671-731. Published by American Economic Association
8. Kimbal, Rahel Widiawati. (2012). Social Capital In Non-Barter Transaction Chain In Pasar Blante Ka W Angkoan, North Sulawesi Province. Journal Of
Indonesian Economy & Business. Fakultas Ekonomi Universitas Gajahmada. Yogyakarta.
9. Magnani, Natalia dan Lauro Struffi. (2009). Translation sociology and social capital in rural development initiatives. A case study from the Italian Alps.
Journal of Rural Studies, 25, 231–238. Journal homepage: www.elsevier.com/locate/jrurstud
10. Miles, Mattew B. et al. (1992). Qualitative Data Analysis. Source Book on New Methods. Penerbit Universitas Indonesia (UI-Press). Jakarta
11. Miller, Roger le Roy. et al. (1997). Intermediate Micro-Economic Theory. PT. RajaGrafindo Persada. Jakarta.
12. OECD. (2006). Infrastructure To 2030: Telecom, Land Transport,Water And Electricity. Published by Organisation For Economic Co-Operation And
Development (OECD). Paris
13. Rifai, Mien Achmad. (2007). Madurese, the Character, Behavior, Work Ethic, Appearance, and Way of Life as Imaged by their Proverbs. Pilar Media. Bogor.
14. Ritzer, George dan Douglas J Goodman. (2009). Sociology Theory. From Classical Sociology Theory to the Very Latest Development of Post-modern Social
Theory. Kreasi Wacana. Yogyakarta.
15. Rohima, Siti (2013). Vicious Circle Analysis of Poverty and Entrepreneurship. IOSR Journal of Business and Management (IOSR-JBM). ISSN: 2278-487X.
Volume 7, Issue 1 (Jan. - Feb. 2013), PP 33-46. www.iosrjournals.org
16. Yustika, Ahmad Erani. (2008). Institutional Economic, Definition, Theory & Strategy. Bayumedia Publising. Malang.
17. Zainuri. (2010). The meaning and governance of Zakat in Institutional Economic Perspective; Dissertation. Doctorate Program of Economic Science. Post-
Graduate Program, School of Economic, Brawijaya University, Malang.

VOLUME NO. 4 (2014), ISSUE NO. 04 (APRIL) ISSN 2231-1009
INTERNATIONAL JOURNAL OF RESEARCH IN COMPUTER APPLICATION & MANAGEMENT A Monthly Double-Blind Peer Reviewed (Refereed/Juried) Open Access International e-Journal - Included in the International Serial Directories
http://ijrcm.org.in/
67
REQUEST FOR FEEDBACK
Dear Readers
At the very outset, International Journal of Research in Computer Application & Management (IJRCM)
acknowledges & appreciates your efforts in showing interest in our present issue under your kind perusal.
I would like to request you tosupply your critical comments and suggestions about the material published
in this issue as well as on the journal as a whole, on our [email protected] for further
improvements in the interest of research.
If youhave any queries please feel free to contact us on our E-mail [email protected].
I am sure that your feedback and deliberations would make future issues better – a result of our joint
effort.
Looking forward an appropriate consideration.
With sincere regards
Thanking you profoundly
Academically yours
Sd/-
Co-ordinator
DISCLAIMER The information and opinions presented in the Journal reflect the views of the authors and not of the
Journal or its Editorial Board or the Publishers/Editors. Publication does not constitute endorsement by the
journal. Neither the Journal nor its publishers/Editors/Editorial Board nor anyone else involved in creating,
producing or delivering the journal or the materials contained therein, assumes any liability or
responsibility for the accuracy, completeness, or usefulness of any information provided in the journal, nor
shall they be liable for any direct, indirect, incidental, special, consequential or punitive damages arising
out of the use of information/material contained in the journal. The journal, nor its publishers/Editors/
Editorial Board, nor any other party involved in the preparation of material contained in the journal
represents or warrants that the information contained herein is in every respect accurate or complete, and
they are not responsible for any errors or omissions or for the results obtained from the use of such
material. Readers are encouraged to confirm the information contained herein with other sources. The
responsibility of the contents and the opinions expressed in this journal is exclusively of the author (s)
concerned.
VOLUME NO. 4 (2014), ISSUE NO. 04 (APRIL) ISSN 2231-1009
INTERNATIONAL JOURNAL OF RESEARCH IN COMPUTER APPLICATION & MANAGEMENT A Monthly Double-Blind Peer Reviewed (Refereed/Juried) Open Access International e-Journal - Included in the International Serial Directories
http://ijrcm.org.in/
II