Pesisir & Lautan--Indonesian Journal of Coastal and Marine ...
59
Transcript of Pesisir & Lautan--Indonesian Journal of Coastal and Marine ...
PENGANTAR REDAKSI
Puji dan Syukur dipanjatkan ke hadapan Tuhan Yang Maha Kuasa atas perkenan-Nya sehingga JurnalPengelolaan Sumberdaya Pesisir dan Lautan Indonesia dapat diterbitkan sesuai dengan rencana. Jurnal inidiharapkan dapat menjadi media informasi dan komunikasi antar disiplin ilmu yang mengulas masalah-masalah yangberkaitan dengan pengelolaan sumberdaya pesisir dan lautan, khususnya di Indonesia.
Penerbitan Jurnal Pengelolaan Sumberdaya Pesisir dan Lautan Indonesia merupakan hasil kerjasama antaraPusat Kajian Sumberdaya Pesisir dan Lautan Institut Pertanian Bogor (PKSPL – IPB) dengan The Coastal ResourcesCenter, University of Rhode Island U.S.A (CRC-URI). Jurnal ini bertujuan untuk meningkatkan kesadaran dankepedulian masyarakat luas akan pentingnya sumberdaya pesisir dan lautan, merangsang dialog diantara para praktisidan pakar dalam pengelolaan sumberdaya pesisir dan lautan, dan membagi pengalaman dan pengetahuan diantaraseluruh pemerhati masalah-masalah pengelolaan sumberdaya pesisir dan lautan.
Jurnal Pengelolaan Sumberdaya Pesisir dan Lautan Indonesia diterbitkan 2 (dua) kali dalam setahun dandiedarkan kepada para peminatnya yang berasal dari pejabat pemerintah dari seluruh tingkatan, kalangan akademik,para peneliti dan praktisi serta berbagai kalangan yang menjadi pemerhati masalah-masalah pengelolaan sumberdayapesisir dan lautan.
Kami mengharapkan penerbitan perdana Jurnal ini dapat bermanfaat bagi semua kalangan yang terkait denganpengelolaan sumberdaya pesisir dan lautan. Selamat membaca dan kontribusi anda kami tunggu.
Pemimpin Redaksi
Dr. Ir. Dietriech G. Bengen, DEA
REPUBLIK INDONESIABADAN PERENCANAAN PEMBANGUNAN NASIONAL
JALAN TAMAN SUROPATI 2, JAKARTA 10310TELEPON : 336207 - 3905650
KATA PENGANTAR
Pertama-tama saya mengucapkan selamat atas penerbitan perdana dari Jurnal Pengelolaan Sumberdaya Pesisirdan Lautan Indonesia, yang merupakan kerjasama antara Pusat Kajian Sumberdaya Pesisir dan Lautan Institut PertanianBogor (PKSPL-IPB) dengan Coastal Resources Center University of Rhode Island USA (CRC-URI). Saya sangatberharap jurnal yang pertama kali diterbitkan di Indonesia tentang pengelolaaan sumberdaya pesisir dan lautan ini dapatmenjadi forum informasi dan komunikasi yang berdaya guna dan berhasil guna, tidak hanya bagi kalangan akademisnamun juga bagi pihak-pihak terkait lainnya di kalangan praktisi, birokrasi dan dunia usaha.
Keberadaan jurnal pengelolaan pesisir dan lautan ini juga sangat dibutuhkan tidak hanya secara lokal diIndonesia, namun juga bagi kalangan pemerhati dan praktisi pengelola sumberdaya pesisir dan lautan di luar negeri,termasuk dari kalangan investor swastanya. Hal ini sangat beralasan mengingat bahwa dengan mempertimbangkanpotensi wilayah pesisir sebagai salah satu sumber keanekaragaman hayati pada ekosistem pantai dan pesisir diIndonesia, telah banyak upaya yang dilakukan dalam rangka menyusun suatu strategi dalam pengelolaan, konservasidan rehabilitasi wilayah pesisir tersebut.
Lebih jauh lagi, dengan mempertimbangkan bahwa potensi wilayah pesisir yang dimiliki Indonesia merupakanyang terbesar di dunia maka pemanfaatan nilai ekonomisnya juga perlu dioptimalkan dan dikendalikan denganmemperhatikan upaya pelestariannya.
Pentingnya suatu jurnal informasi dan komunikasi tentang pengelolaan sumberdaya pesisir dan lautan yangberskala nasional, terutama dengan mempertimbangkan beberapa peranan pokok dari sumberdaya pesisir pada skalanasional sebagai berikut:1. Peranan pentingnya dari ekosistem wilayah pesisir dalam upaya konservasi keanekaragaman hayati yang ada di
kawasan pantai dan pesisir, terutama yang memiliki potensi pengembangan ekonomis berjangka panjang baik padaskala lokal masyarakat pesisir maupun dalam skala nasional.
2. Peranan penting wilayah pesisir di dalam mendukung upaya pelestarian lingkungan dan nilai-nilai ekologis, yangsekaligus diarahkan untuk dapat meningkatkan derajat kesejahteraan masyarakat pesisir serta mendukung upayapembangunan yang berkelanjutan di tingkat nasional.
3. Peranan wilayah pesisir sebagai sumberdaya alam yang potensial pada skala nasional di dalam menunjang ekspornon migas yang bersumber dari industri pesisir dan maritim.
4. Peranan wilayah pesisir di dalam meningkatkan kesejahteraan masyarakat pesisir dan pantai, tanpa mengabaikanupaya pelestarian dan rehabilitasinya secara optimal dan berkelanjutan.
Dengan demikian, peranan dari ekosistem wilayah pesisir pada skala nasional maupun skala lokal adalahsangat potensial, baik ditinjau peranannya sebagai sumberdaya biologis maupun sumberdaya ekonomis.
Untuk itu, jurnal pengelolaan sumberdaya pesisir dan lautan ini diharapkan dapat memberikan informasi yangpaling mutakhir tentang teori, pola dan praktek pengelolaan wilayah pesisir dan pantai yang berdaya guna dan berhasilguna, termasuk dalam rangka upaya pelestarian dan rehabilitasnya secara optimal dan berkelanjutan.
Selain peranan di atas, jurnal ini sekaligus diharapkan dapat pula menjadi suatu forum informasi dankomunikasi praktek pengelolaan sumberdaya pesisir dan lautan yang telah atau sedang dilaksanakan oleh pemerintah,baik yang dibiayai oleh anggaran pembangunan maupun bantuan luar negeri.
Seperti kita ketahui bersama, program pengelolaan wilayah pesisir dan pantai selama satu dasawarsa terakhirdan khususnya dalam Repelita VI ini telah memperoleh dukungan dari berbagai sumber pendanaan, termasuk yangberasal dari pinjaman/hibah luar negeri (PHLN) seperti melalui Proyek Marine Resources Evaluation and Planning(MREP) yang sejak tahun 1992 yang lalu dibiayai melalui pinjaman ADB. Selain itu, terdapat beberapa proyek lainnyayang tengah dipersiapkan saat ini yang diarahkan untuk meningkatkan dayaguna dan hasilguna pengelolaan ekosistempesisir dan pantai, seperti yang akan dimulai pada tahun 1998 ini melalui Proyek COREMAP (Coral ReefRehabilitation and Management Project) yang akan dilaksanakan dalam jangka panjang selama 15 tahun melaluipinjaman dari ADB, IBRD, dan hibah dari Pemerintah Australia.
Dengan memperhatikan keberadaan dari berbagai proyek yang telah dilaksanakan dengan investasi yangcukup mahal tersebut, maka jurnal ini menjadi sangat diperlukan dengan suatu forum informasi kepada kalangan terkaitterhadap hasil dan rekomendasi yang dihasilkan dari pelaksanaan proyek-proyek tersebut. Berbagai temuan danrekomendasi proyek yang dikemukakan melalui jurnal ini diharapkan selain dapat dijadikan bahan diskusi ilmiah dikalangan akademisi untuk pengembangan lebih lanjut, juga sebagai masukan bagi pengambilan keputusan dankebijaksanaan dalam bidang pengelolaan sumberdaya pesisir dan lautan di Indonesia di masa yang akan datang.
Selain itu, di sisi perguruan tinggi seperti yang dilaksanakan IPB dengan PKSPL-nya, jurnal ini diharapkandapat menjadi suatu forum komunikasi yang efektif di dalam tukar menukar informasi mutakhir mengenai teknologidan pola pengelolaan sumberdaya pesisir dan pantai, baik diantara kalangan pengajar dan mahasiswa maupun antarapengajar dan mahasiswa. Terlebih lagi dengan mempertimbangkan keberadaan dari para mahasiswa S-2 dalam bidangManajemen Sumberdaya Pesisir dan Lautan di IPB, yang baru saja dibentuk Program Pasca Sarjana sejak tahun terakhirini.
Akhirnya, saya sangat mengharapkan penerbitan perdana dari jurnal pengelolaan sumberdaya pesisir danlautan Indonesia ini dapat diteruskan dengan terbitan-terbitan selanjutnya secara berkala dan berkesinambungan. Halini saya kemukakan, mengingat kesinambungan dari suatu jurnal ilmiah dengan bidang kajian khusus seperti ini padaumumnya sangat tergantung dari materi dan substansi yang dikemukakan dalam setiap penerbitannya. Oleh sebab itu,perumusan materi dan substansi terbitan sangat perlu untuk direncanakan sejak dini untuk jangka waktu tertentu,dengan sekaligus memperhitungkan kemungkinan kesediaan calon kontributor/penyumbang tulisan bagi jurnal yangbersangkutan.
Sekali lagi, selamat atas penerbitan jurnal pengelolaan sumberdaya pesisir dan lautan Indonesia. Semogajurnal ini dapat dimanfaatkan secara maksimal dalam rangka meningkatkan daya guna pemanfatan, pengendalian danpelestarian sumberdaya pesisir dan lautan di Indonesia dalam masa yang akan datang.
Jakarta, 9 Maret 1998
Deputi Ketua BappenasBidang Regional dan Daerah
Prof. Dr. Herman Haeruman Js.
DEPARTEMEN DALAM NEGERIREPUBLIK INDONESIA
KATA PENGANTAR
Puji dan syukur kita persembahkan kehadirat Tuhan Yang Maha Kuasa karena atas berkat danrahmatNya, “Jurnal Pengelolaan Sumberdaya Pesisir dan Lautan Indonesia”, dapat diterbitkan untukpertama kalinya. Jurnal ini memuat tulisan-tulisan ilmiah dari berbagai pakar dan praktisi yangberkiprah dalam bidang kelautan.
Sebagaimana diketahui Pengelolaan Sumberdaya Pesisir dan Lautan merupakan kebijaksanaan yangbaru dimulai pada PJP II, Repelita VI. Sehingga gagasan, pemikiran, dan kajian dalam bentuk tulisanilmiah sangat diperlukan untuk memberikan masukan-masukan yang berharga bagi para pelaku-pelakupembangunan kelautan, peneliti, dan pengambil kebijaksanaan, khususnya pengelolaan wilayah pesisirterpadu.
Kita menyadari bahwa pembangunan baik di Indonesia maupun di negara-negara pantai lainnya akanlebih berkonsentrasi ke wilayah pesisir. Hal ini didorong oleh meningkatnya pembangunan kota-kotabesar pantai, kawasan industri, pelabuhan, pengembangan wisata bahari, dan pembangunan perikananyang menempati wilayah pesisir, mendorong urbanisasi yang semakin pesat ke wilayah pesisir. Hal inimeningkatkan kebutuhan akan sumberdaya pesisir dan lautan. Untuk itu diperlukan jurnal sebagaimedia informasi ilmiah dalam menyampaikan hasil kajian-kajian yang bermanfaat bagi pengelolaansumberdaya pesisir dan lautan secara lestari.
Kepada para pembaca, kami harapkan masukan-masukan dan saran yang positif agar jurnal volumeberikutnya dapat ditingkatkan secara lebih baik dan memenuhi harapan pembaca. Kepada parapengasuh dan pengelola jurnal saya menyampaikan penghargaan dan “selamat” atas penerbitan jurnalyang penting ini.
Jakarta, 9 Mei 1998
DIREKTUR JENDRAL PEMBANGUNAN DAERAH
H. FAISAL TAMIN
WELCOME FROMPROYEK PESISIR AND
THE COASTAL RESOURCES CENTER, URI
On behalf of the Coastal Resources Center of the University of Rhode Island, it is our pleasure to offer ourcongratulations on publication of this first edition of the Indonesian Journal of Coastal and Marine ResourcesManagement. The ever widening network of integrated coastal management (ICM) practitioners and researchers inIndonesia has identified the need to have a ‘vehicle’ for information exchange and a peer-reviewed journal thatpromotes professional advancement.
We hope this journal will help strengthen the Indonesian ICM profession by developing a body of skills,knowledge and experience which shall better equip Indonesia to meet national development aspirations whilstconserving the diverse coastal and marine resource base on which much of that development depends. We havewitnessed a similar encouraging trend in the global ICM community as a result of our global Newsletter, Intercoast. Bysharing the knowledge and experience of scientists, managers and other stakeholders this new journal will help tostrengthen connections between ICM practitioners in Indonesia and further links between Indonesia and the global ICMnetwork.
Obviously the success and sustainability of any new venture depends greatly on the commitment of thoseinvolved and its relevance to you, the users. While the commitment of everyone involved in the design anddevelopment of this journal is obvious in this edition (a big thank you to all the members of the editorial panel andauthors), this new journal begins life entering relatively ‘uncharted waters’. Interest in, and support for, ICM hasreached an unprecedented level in Indonesia, however, we have yet to see the coalescing of interests, lessons andinstitutional capacity which is typical of maturing ICM programs elsewhere. In other words, there is much coastalmanagement activity, but as yet, little integration.
We have high hopes that this journal, and other initiatives supported by Proyek Pesisir under the USAID-BAPPENAS Natural Resources Management Program, will contribute to improved integration of coastal managementeffort, particularly by helping to improve dialogue between research, management and non-governmental organisations.Ultimately, the success of the journal in this regard will, however, depend on you - the reader and contributor.
We encourage you to maximise the potential of this journal as a voice for improving the practice of coastalmanagement in Indonesia and look forward to supporting you in realising our common agenda.
Ian DuttonChief of Party - Proyek PesisirCRC/URIJakarta, Indonesia
Lynne Hale,Associate Director - Field Programs
CRC/URINaragansett, RI, USA
COASTAL RESOURCES CENTER
TYPICAL GEOGRAPHIC INFORMATIONSYSTEM (GIS) APPLICATIONSFOR COASTAL RESOURCES
MANAGEMENT IN INDONESIAIWAN GUNAWAN
Directorate of Technology for Natural Resources Inventory,Deputy for Natural Resources Development
Agency for the Assessment and Application of Technology (BPPT)
ABSTRACT
oastal zone is a very complex, dynamic anddelicate environment because of the influenceof both terrestrial and marine ecosystems.As it is a delicate environment, sustainable
utilization of its resources can only be achieved basedon multiple, best and reasonable use with integratedapproach. The approach requires a thoroughunderstanding of the characteristics of the structures,functions, and dynamics of the coastal physical andhuman environment. Because an integratedmanagement approach in coastal and marine resourcesis a must, the main planning objective is typicallydirected toward achieving the balance between threemain goals: 1) exploiting natural prospect orendowment, 2) meeting the societal wish, and 3)accommodating the existing livelihood or conditions.This approach leads to a decision whether to enhance,to conserve, or to change the existing resource usestrategy. As Indonesia is a very large maritimecontinent, planning and management of coastal andmarine resources can best be conducted using thisintegrated approach supported by GeographicInformation Systems (GIS) to characterize theresources, and to identify potential matches and orconflicts between the three goals. Understanding thistypical GIS applications for coastal and marineresource management will be helpful in theidentification of information and analysis needs for theGIS.
INTRODUCTION
Coastal zone is one of the mostcomplex environment because of itstransitional nature, mixing the land or the
terrestrial and the marine ecosystems. Thecomplexity of coastal environment can beseen, for example, from the riversedimentation regime which is influenced bymany processes occurring deep in land at theupstream part of the river watershed.Similarly, erosional processes along the coastare influenced by many oceanographiccharacteristics which extends far offshore tothe deep ocean.
Because of the influence of variousforces in both terrestrial and marineecosystems, coastal environment is always ina delicate balance. Any changes occurring inthe land or at the sea, be that natural orhuman induced, may disturb the equilibriumof the system. It is therefore very importantfor resource managers working in coastalzones to always consider the impact ofchanges caused by resource utilization orexploitation to this delicate balance.
In its simplistic and traditional form,resource decision is a choice betweenexploitation and conservation. But morerecently, the term sustainable use, that is theutilization of the resources as such that futuregeneration has the opportunity to utilize theresources at the same level as the present, ismore and more being pursued. Sustainableresource utilization, including that in thecoastal zone, requires a comprehensive
C
understanding on how resources arestructured, functions, and are changing suchthat reasonable and continued utilization canbe achieved.
This paper presents examples of howinformation solution to answer some coastalresource management questions can bedeveloped using sophisticated spatialinformation management tool known as theGeographic Information Systems (GIS).More attentions are given to the systematicapproach to formulate information themesrelevant to specific resource management(e.g., planning) needs as opposed to moretechnical discussion on the GIS as a tool.Readers wishing to learn more about the GIStool should refer to the relevant literature.
RESOURCES UTILIZATION CYCLEAND ITS APPLICATION TO COASTALENVIRONMENT
The earth and its subsystems are acomplex system with many physicalcomponents linked to one another (Orians,1990). As a complex system, the earth ischaracterized by strong interactions betweenthe parts, complex feedback loops, time andspace lags, discontinuities, thresholds, andlimits (Costanza et al., 1993). Naturalresource utilization is a process of subtraction
and/or addition of materials to and from thesystem. This process causes changes to thecomponents of the system by using some ofthe physical resources and/or introducingnew resources to the system. Physicalresources cannot be used sustainably becauseof their finite numbers. However, manyphysical processes have regenerativeproperties which make the resourcesrenewable.
Degradation of resources occurs whena system's processing capacity is exceeded byresource use (Orians, 1990). Sustainableresource development, as defined by theWorld Commission on Environment andDevelopment, is a development that meetsthe needs of present generation withoutcompromising the ability of future generationto meet their own needs (Pezzey, 1992;Orians, 1990; Soemarwoto, 1991; Turner etal., 1993).
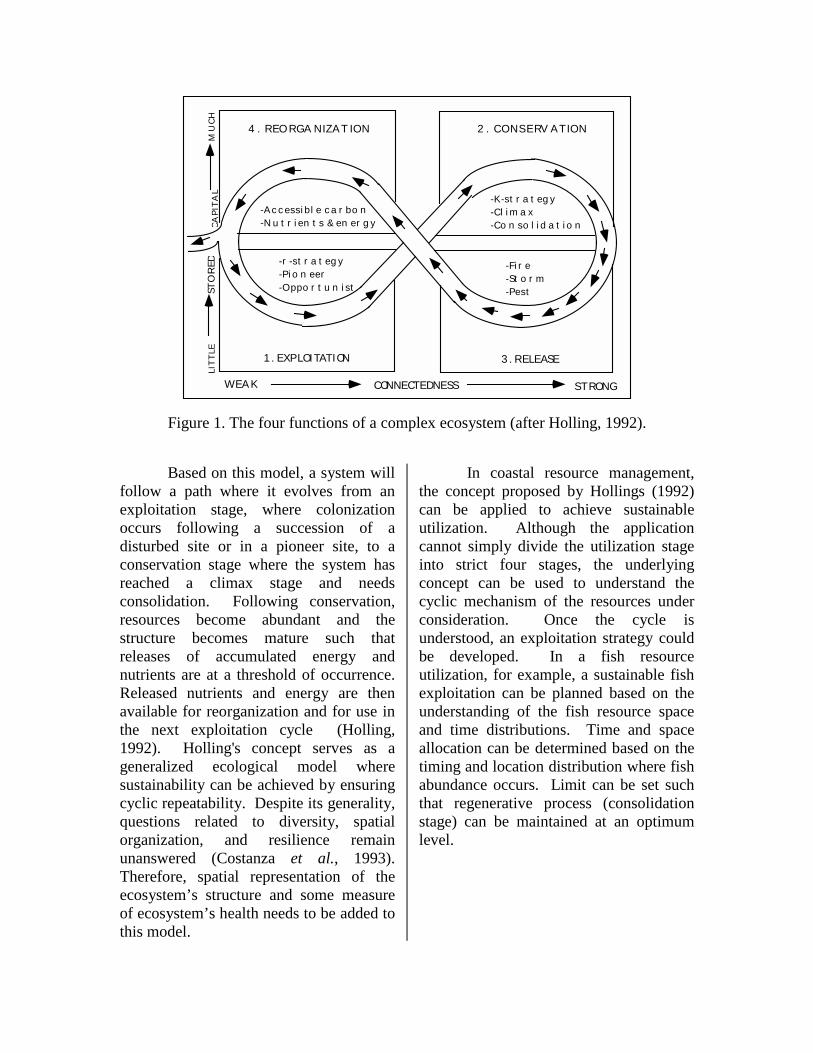
Because natural resource utilizationinvolves the use of biological resources aspart of the earth's complex ecosystem, theconcept of ecological sustainability mustconsider the availability of these resources.A general model for an ecological-economicsystem has been proposed by Holling (1992).In this model, a complex system is describedas having four basic functions including:1)exploitation, 2)conservation, 3)release, and4)reorganization (Figure 1).
1 . EXPLOITATION
2 . CONS ERV ATION
3 . RELEASE
4 . REORGANIZATION
WEAK CONNECTEDNESS STRONG
LIT
TLE
STO
RED
MU
CH
-Accessible carbon-Nutrients & energy
-r-strategy-Pioneer-Opportunist
-K-strategy-Climax-Consolidation
-Fire-Storm-Pest
CA
PIT
AL
Figure 1. The four functions of a complex ecosystem (after Holling, 1992).
Based on this model, a system willfollow a path where it evolves from anexploitation stage, where colonizationoccurs following a succession of adisturbed site or in a pioneer site, to aconservation stage where the system hasreached a climax stage and needsconsolidation. Following conservation,resources become abundant and thestructure becomes mature such thatreleases of accumulated energy andnutrients are at a threshold of occurrence.Released nutrients and energy are thenavailable for reorganization and for use inthe next exploitation cycle (Holling,1992). Holling's concept serves as ageneralized ecological model wheresustainability can be achieved by ensuringcyclic repeatability. Despite its generality,questions related to diversity, spatialorganization, and resilience remainunanswered (Costanza et al., 1993).Therefore, spatial representation of theecosystem’s structure and some measureof ecosystem’s health needs to be added tothis model.
In coastal resource management,the concept proposed by Hollings (1992)can be applied to achieve sustainableutilization. Although the applicationcannot simply divide the utilization stageinto strict four stages, the underlyingconcept can be used to understand thecyclic mechanism of the resources underconsideration. Once the cycle isunderstood, an exploitation strategy couldbe developed. In a fish resourceutilization, for example, a sustainable fishexploitation can be planned based on theunderstanding of the fish resource spaceand time distributions. Time and spaceallocation can be determined based on thetiming and location distribution where fishabundance occurs. Limit can be set suchthat regenerative process (consolidationstage) can be maintained at an optimumlevel.
CHARACTERIZATION OFCOASTAL RESOURCES USING GIS
Ideally, any coastal resourceutilization effort is planned considering theresource cycle as presented by the aboveHollings’ concept. However, asknowledge concerning resourcecharacteristics is often incomplete vis-a-vis urgent and immediate resourceutilization needs, only limited aspectsdirectly relevant to the planning objectiveof the resource utilization are usuallyconsidered. In the development of coastaltourism, for example, the aspectsconsidered in planning can be simplifiedto those directly relevant to tourism suchas tourist attraction objects, touristfacilities, and transportation accessibility.
As indicated in the introduction ofthis paper, coastal environment is verycomplex, involves many processes acrossterrestrial and marine spaces, verydynamics and is always in delicatebalance. Understanding the structure andthe dynamics of coastal environment as asystem is substantial in planning asustainable coastal resource management
(Dahuri, et al., 1996). There are threemain aspects: structure, functions, andchange or dynamics that are typically usedto characterize a landscape ecosystem(Forman and Godron, 1986) or a largergeo-ecosystem (Hugget, 1995). Thescience of geography has the main purposeof characterizing the structure, thefunctions and the dynamics of theecosystem under consideration bypresenting the facts about the ecosystem inthree different dimensions : spatial,temporal and thematic (Gunawan, 1997).
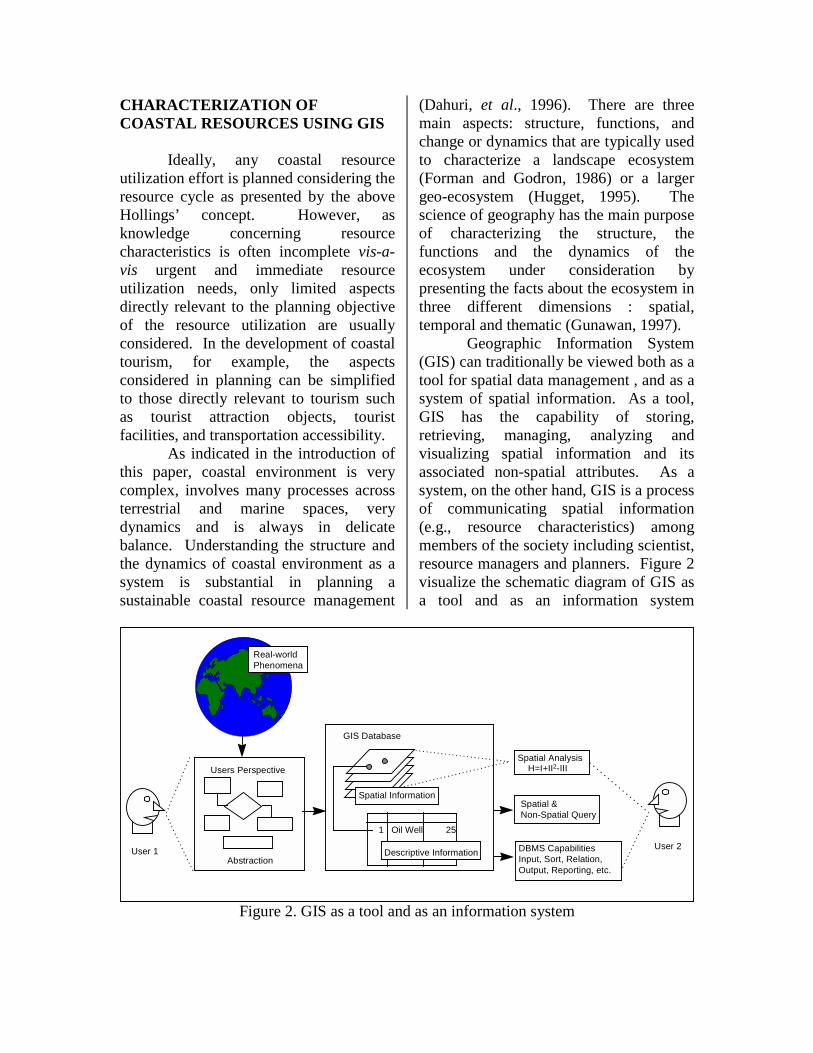
Geographic Information System(GIS) can traditionally be viewed both as atool for spatial data management , and as asystem of spatial information. As a tool,GIS has the capability of storing,retrieving, managing, analyzing andvisualizing spatial information and itsassociated non-spatial attributes. As asystem, on the other hand, GIS is a processof communicating spatial information(e.g., resource characteristics) amongmembers of the society including scientist,resource managers and planners. Figure 2visualize the schematic diagram of GIS asa tool and as an information system
1 Oil Well 25
H=I+II2-IIISpatial Analysis
Descriptive Information
Spatial &Non-Spatial Query
DBMS CapabilitiesInput, Sort, Relation,Output, Reporting, etc.
Spatial Information
GIS Database
Abstraction
Users Perspective
User 1 User 2
Real-worldPhenomena
Figure 2. GIS as a tool and as an information system
In coastal resource management,GIS can be used to present basic spatialfacts concerning the coastal physical andhuman environment in terms of itsstructures, functions and dynamics. Forcoastal physical environment, for example,the basic spatial facts include coastaltopography/bathymetry, morphology,vegetation cover, sediment flow, erosionand deposition, climate, habitat boundary,
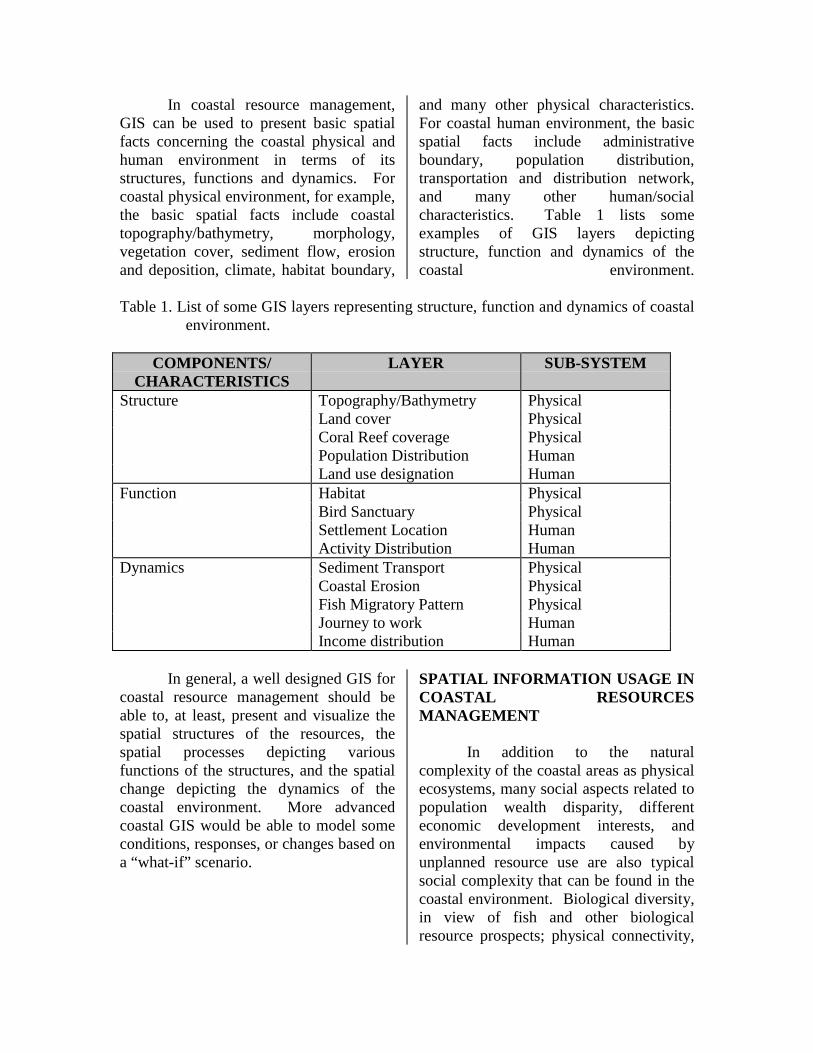
and many other physical characteristics.For coastal human environment, the basicspatial facts include administrativeboundary, population distribution,transportation and distribution network,and many other human/socialcharacteristics. Table 1 lists someexamples of GIS layers depictingstructure, function and dynamics of thecoastal environment.
Table 1. List of some GIS layers representing structure, function and dynamics of coastalenvironment.
COMPONENTS/CHARACTERISTICS
LAYER SUB-SYSTEM
Structure Topography/Bathymetry PhysicalLand cover PhysicalCoral Reef coverage PhysicalPopulation Distribution HumanLand use designation Human
Function Habitat PhysicalBird Sanctuary PhysicalSettlement Location HumanActivity Distribution Human
Dynamics Sediment Transport PhysicalCoastal Erosion PhysicalFish Migratory Pattern PhysicalJourney to work HumanIncome distribution Human
In general, a well designed GIS forcoastal resource management should beable to, at least, present and visualize thespatial structures of the resources, thespatial processes depicting variousfunctions of the structures, and the spatialchange depicting the dynamics of thecoastal environment. More advancedcoastal GIS would be able to model someconditions, responses, or changes based ona “what-if” scenario.
SPATIAL INFORMATION USAGE INCOASTAL RESOURCESMANAGEMENT
In addition to the naturalcomplexity of the coastal areas as physicalecosystems, many social aspects related topopulation wealth disparity, differenteconomic development interests, andenvironmental impacts caused byunplanned resource use are also typicalsocial complexity that can be found in thecoastal environment. Biological diversity,in view of fish and other biologicalresource prospects; physical connectivity,
in view of sea transportation and industriallocation prospects; and aesthetic values, inview of tourism prospects are at least thethree main factors that make coastal zonevery attractive for development andsettlement. Combination of all of theabove factors consequently gives only onebest solution to the sustainable utilizationof coastal resources, that is the integratedmanagement based on reasonable,multiple and best use policies(Kenchington, 1995; Dahuri, et al., 1996).The objective of a sound coastal zoneresource management is, therefore,meeting the needs of members of thesociety, also known as the stakeholders,who are very dependent on the coastalenvironment at the same time maintainingthe natural functioning of the coastalenvironment as a natural system.
In a simplistic form, coastal zoneplanning can be seen as a process ofbalancing three main objectives: 1)exploiting the ideal prospects orendowment; 2) meeting the wish of thesociety (that may vary from the localfisherman’s to the international chain ofresort hotels’); and 3) accommodatingexisting livelihood currently in place inthe area under consideration. Translatingthese goals into a coastal spatialinformation system, consequently there areat least three major information themes.The natural prospects theme may consistof many information sub-themes varyingfrom soil fertility map, fish distributions ormigratory patterns, to coral reef and whitesandy beach locations. The society-wishtheme may consist of sub-themes varyingfrom land use and zoning plan, fisherman
traditional settlement and fishing route, tohotel and restaurant expansion plans. Andlastly, the existing livelihood theme mayconsist of sub-themes varying from currentland use and land cover to existing landownership.
In a GIS implementation, the threemain themes as listed above representthematic layers of basic informationnecessary in the GIS for integrated coastalresource management application. As thespatial reality depicted by the thematiclayers may suggest either a matching or aconflicting conditions between prospects,wishes and existing, the related GISanalyses will also be typically targetedtoward assessing existing and potentialmatches or existing and potential conflictsbetween the three main themes.
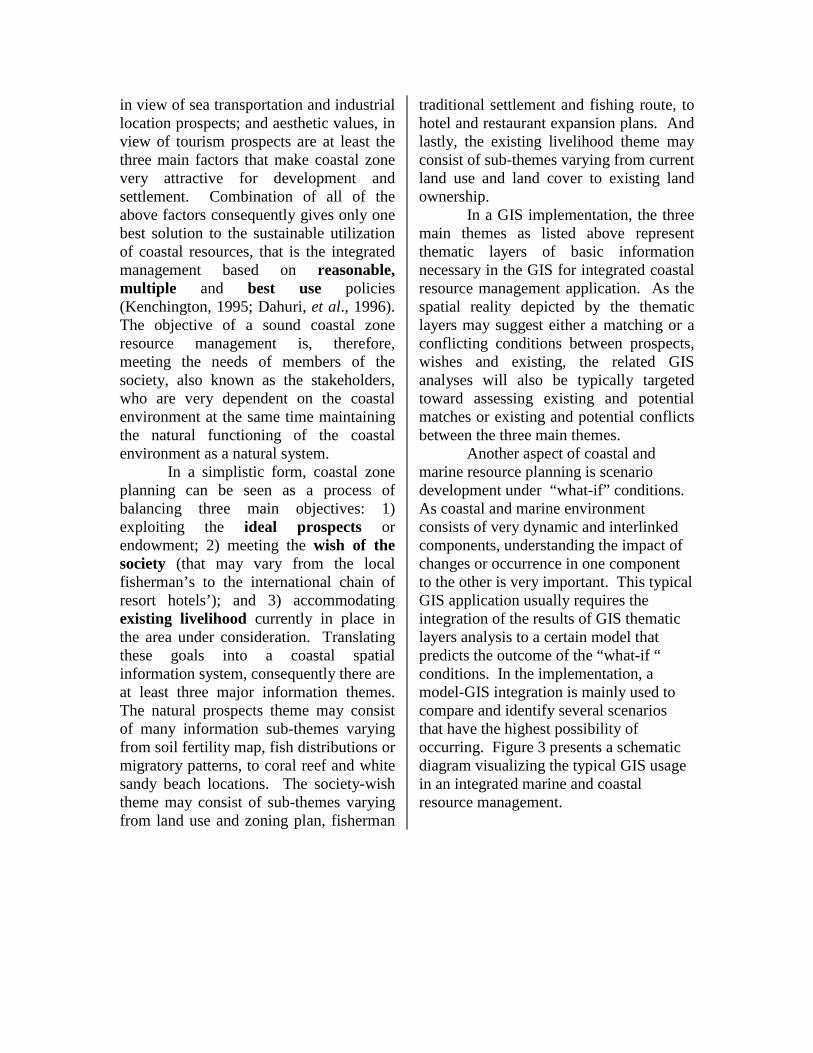
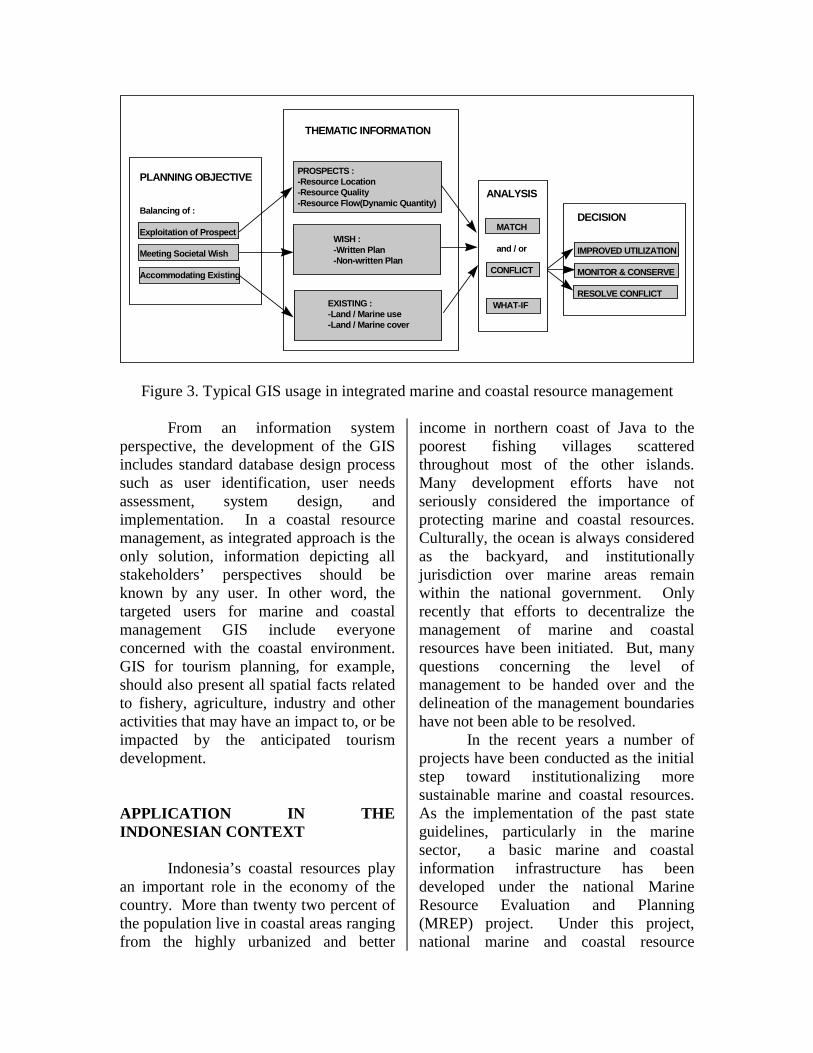
Another aspect of coastal andmarine resource planning is scenariodevelopment under “what-if” conditions.As coastal and marine environmentconsists of very dynamic and interlinkedcomponents, understanding the impact ofchanges or occurrence in one componentto the other is very important. This typicalGIS application usually requires theintegration of the results of GIS thematiclayers analysis to a certain model thatpredicts the outcome of the “what-if “conditions. In the implementation, amodel-GIS integration is mainly used tocompare and identify several scenariosthat have the highest possibility ofoccurring. Figure 3 presents a schematicdiagram visualizing the typical GIS usagein an integrated marine and coastalresource management.
THEMATIC INFORMATION
PROSPECTS :-Resource Location-Resource Quality-Resource Flow(Dynamic Quantity)
WISH :-Written Plan-Non-written Plan
EXISTING :-Land / Marine use-Land / Marine cover
PLANNING OBJECTIVE
Balancing of :
Exploitation of Prospect
Meeting Societal Wish
Accommodating Existing
ANALYSIS
MATCH
and / or
CONFLICT
DECISION
IMPROVED UTILIZATION
MONITOR & CONSERVE
RESOLVE CONFLICTWHAT-IF
Figure 3. Typical GIS usage in integrated marine and coastal resource management
From an information systemperspective, the development of the GISincludes standard database design processsuch as user identification, user needsassessment, system design, andimplementation. In a coastal resourcemanagement, as integrated approach is theonly solution, information depicting allstakeholders’ perspectives should beknown by any user. In other word, thetargeted users for marine and coastalmanagement GIS include everyoneconcerned with the coastal environment.GIS for tourism planning, for example,should also present all spatial facts relatedto fishery, agriculture, industry and otheractivities that may have an impact to, or beimpacted by the anticipated tourismdevelopment.
APPLICATION IN THEINDONESIAN CONTEXT
Indonesia’s coastal resources playan important role in the economy of thecountry. More than twenty two percent ofthe population live in coastal areas rangingfrom the highly urbanized and better
income in northern coast of Java to thepoorest fishing villages scatteredthroughout most of the other islands.Many development efforts have notseriously considered the importance ofprotecting marine and coastal resources.Culturally, the ocean is always consideredas the backyard, and institutionallyjurisdiction over marine areas remainwithin the national government. Onlyrecently that efforts to decentralize themanagement of marine and coastalresources have been initiated. But, manyquestions concerning the level ofmanagement to be handed over and thedelineation of the management boundarieshave not been able to be resolved.
In the recent years a number ofprojects have been conducted as the initialstep toward institutionalizing moresustainable marine and coastal resources.As the implementation of the past stateguidelines, particularly in the marinesector, a basic marine and coastalinformation infrastructure has beendeveloped under the national MarineResource Evaluation and Planning(MREP) project. Under this project,national marine and coastal resource
databases have been developed using GIStechnology. Empowerment of coastalcommunities in view of practicingsustainable utilization of coral reefresources has also been initiated throughthe Coral Reef Rehabilitation andManagement Program (COREMAP).Other projects addressing more specificlocal, regional and sectoral issues havealso been conducted at smaller extent.
As sustainable and integratedmarine and coastal development isbecoming a necessity, efforts to betterinstitutionalize such a development arecontinued. A special national council tocoordinate national maritime affairs hasbeen established under Presidential DecreeNo. 71/1996. The continuation of theMREP project is being focused onproviding information solution to prioritymarine and coastal spatial planning needsof the provinces involved in the project.As providing information solution is themain objective, a GIS applicationdevelopment approach should be utilized.Two examples of GIS applicationdevelopment beginning with Entity-Relationship database design approach andcontinued to database implementation andspatial analysis are presented in thefollowing paragraphs. The presentation ofthese examples is intended to provide anoverview of how GIS can be developed asan information solution to answer somecoastal resource management questions,versus a data management toolboxapproach that most data providinginstitutions would typically use. As worksand utilization on these examples are stillin progress, results presented are not attheir final forms.
GIS for coastal and marine regionaldevelopment planning : Manado-Bitung
A GIS application prototype forsustainable regional development planning
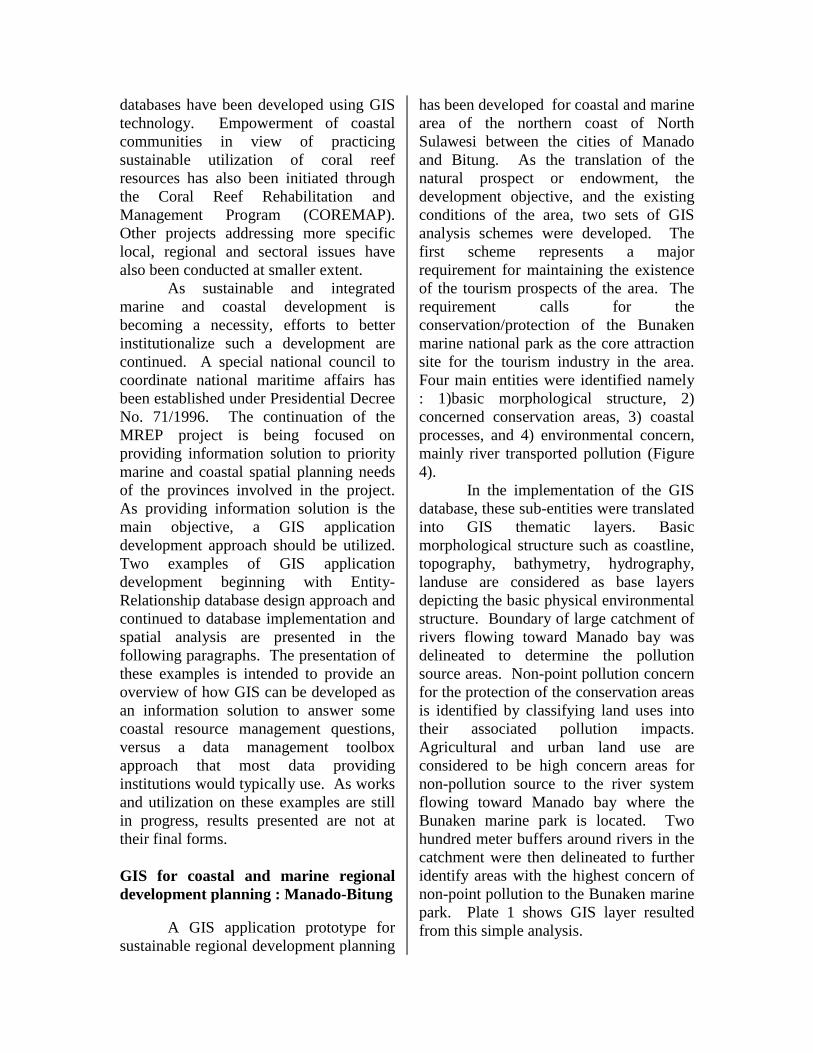
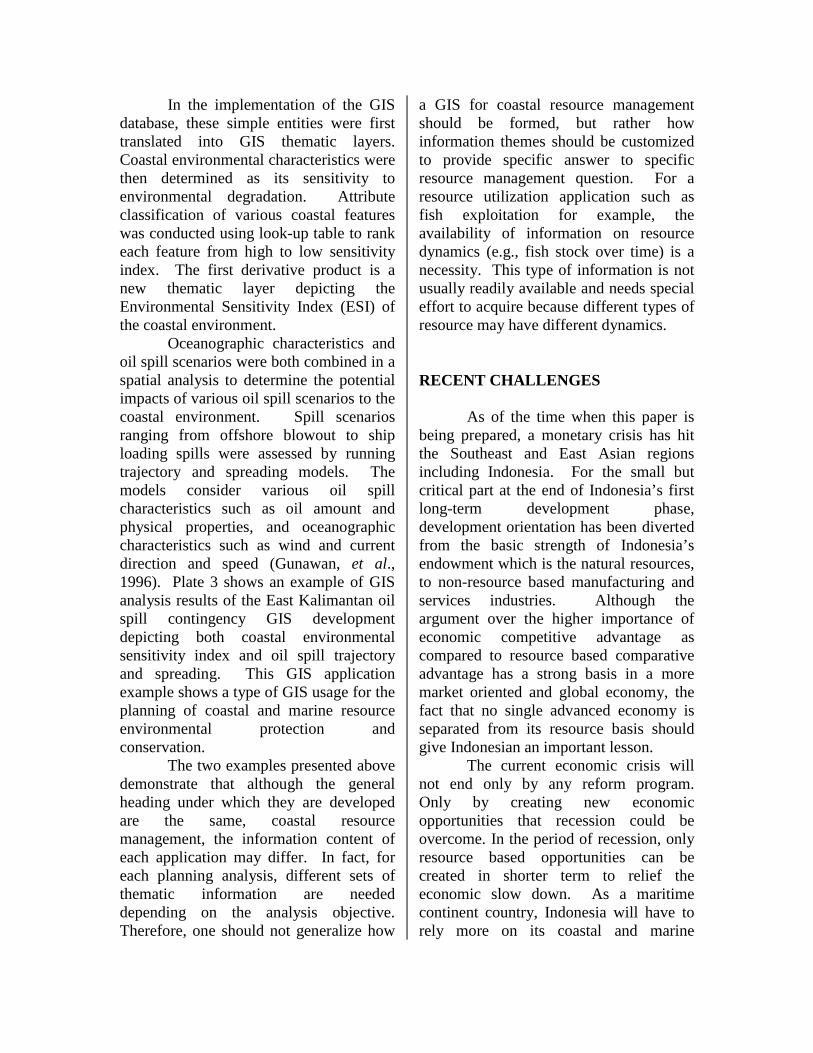
has been developed for coastal and marinearea of the northern coast of NorthSulawesi between the cities of Manadoand Bitung. As the translation of thenatural prospect or endowment, thedevelopment objective, and the existingconditions of the area, two sets of GISanalysis schemes were developed. Thefirst scheme represents a majorrequirement for maintaining the existenceof the tourism prospects of the area. Therequirement calls for theconservation/protection of the Bunakenmarine national park as the core attractionsite for the tourism industry in the area.Four main entities were identified namely: 1)basic morphological structure, 2)concerned conservation areas, 3) coastalprocesses, and 4) environmental concern,mainly river transported pollution (Figure4).
In the implementation of the GISdatabase, these sub-entities were translatedinto GIS thematic layers. Basicmorphological structure such as coastline,topography, bathymetry, hydrography,landuse are considered as base layersdepicting the basic physical environmentalstructure. Boundary of large catchment ofrivers flowing toward Manado bay wasdelineated to determine the pollutionsource areas. Non-point pollution concernfor the protection of the conservation areasis identified by classifying land uses intotheir associated pollution impacts.Agricultural and urban land use areconsidered to be high concern areas fornon-pollution source to the river systemflowing toward Manado bay where theBunaken marine park is located. Twohundred meter buffers around rivers in thecatchment were then delineated to furtheridentify areas with the highest concern ofnon-point pollution to the Bunaken marinepark. Plate 1 shows GIS layer resultedfrom this simple analysis.
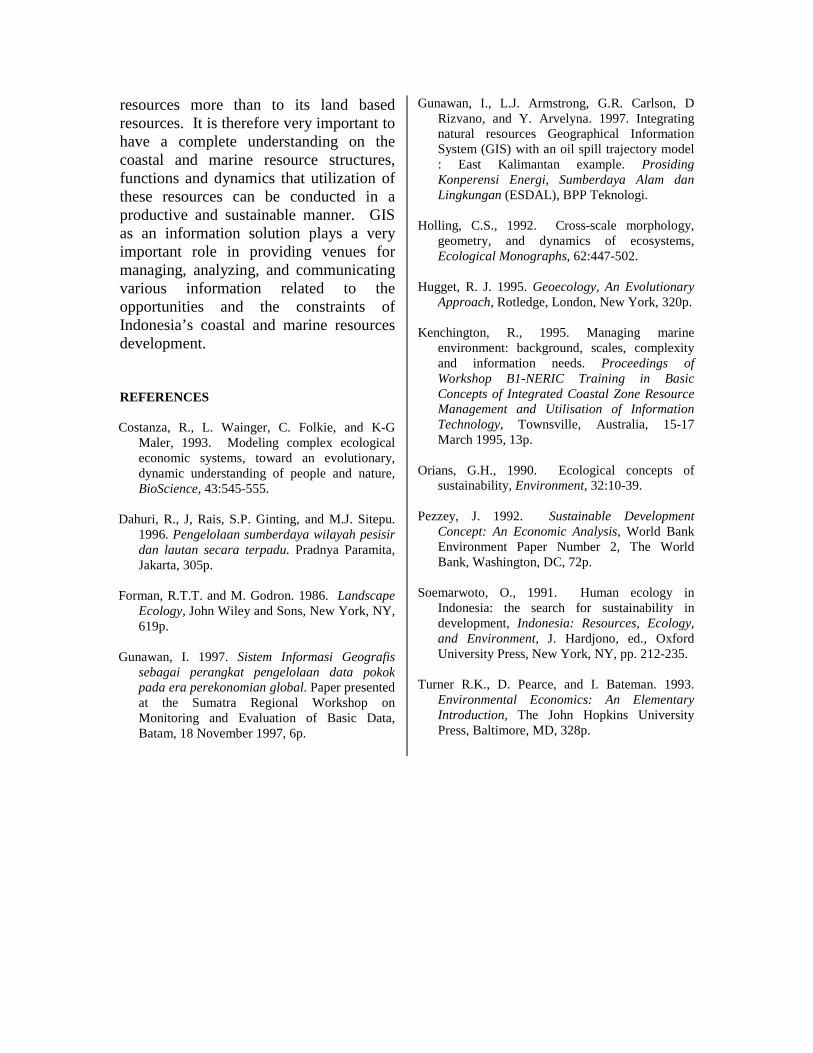
The second analysis scheme forManado-Bitung GIS application representsthe tourism development objective of thearea to extent the length of stay of touristby providing more tourist attraction inaddition to the marine park only. Thisobjective is translated into theidentification of new tourism prospects in
the area. Five entities were identified assuitable to represent factors significant totourism development namely : 1) tourismattraction, 2) tourism facility, 3)accessibility, and 4) human resources.Each major entity is further divided intosub-entities as presented in Figure 5.
PHYSICAL FEATURES POINT AND NON-POINTPOLLUTION SOURCES
CONSERVATION AREAS NATURAL PROCESSES
POLLUTIONRISKS
CoastlineTopographyBathymetryRiverLanduse
Population CenterHotelRestaurantMiningFactoryAgriculture
Sediment TransportCurrentWindRainfall
Coral ReefMangroveCritical Habitat
Figure 4. Entity diagram for marine park pollution prevention GIS application
PHYSICAL FEATURES
CoastlineTopographyBathymetryRiverLanduse
HUMAN RESOURCES
ACCESSIBILITY TOURIST FACILITY TOURIST ATTRACTION
RoadsPorts/HarborsSealanes
INFRASTRUCTURE
HotelResortElectricityTelephoneWaterMedical Facility
SUPPORT
Craft CenterCar RentalRestaurantTravel Agency
NATURAL CULTURAL ACTIVITIES
Land ParkMarine ParkMangroveHabitatCamping Ground
Historic SiteFestivitiesMuseum
DivingSailingFishingHikingSight Seeing
Population DistributionEducation/SkillsIncome
TOURISM DEVELOPMENTNEEDS & PROSPECTS
Figure 5. Entity diagram for tourism development prospects
In the implementation of the GISdatabase, these simple entities were alsotranslated into GIS thematic layers. Nospatial analysis was currently performedfor this scheme as the data availability isvery limited. A simple cartographicenhancement was conducted to highlightexisting tourist attraction and someindications of accessibility (Plate 2).Further analysis can be performed usingnetwork and spatial interaction analyses iftourist movement (transportation) andstays information are available. GISapplication as described in this firstexample is typical application that can beextended and applied in the managementof coastal and marine resources in manyparts of Indonesia where tourism is ofsignificant development prospect.
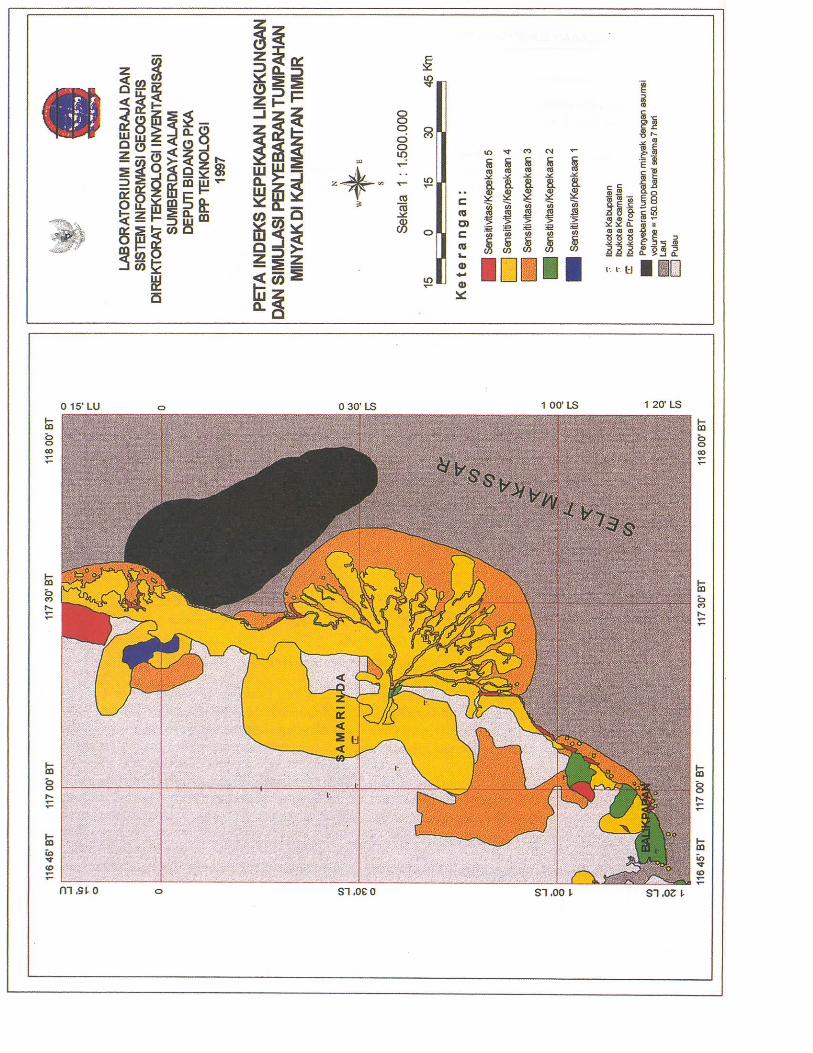
GIS for oil spill contingency plnningapplication : East Kalimantan
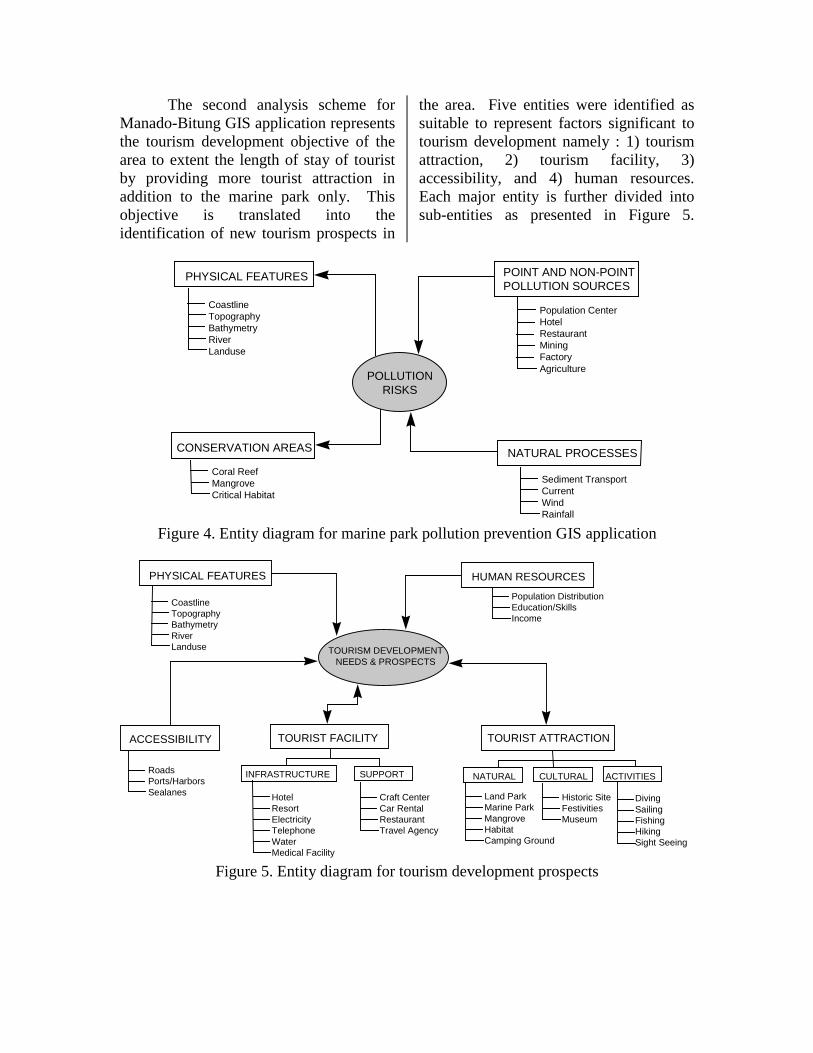
A GIS application prototype fordeveloping oil spill contingency plan hasbeen constructed for a study area of theEast Kalimantan Province off the coast ofthe Mahakam river delta. As a translationof the actual oill spill event, real worldphenomena have been represented by threemajor entities namely : 1) coastalenvironmental characteristics, 2)oceanographic characteristics, and 3) oilspill scenarios. Each major entity isfurther divided into normalized/simplersub-entities (figure 6).
COASTAL & MARINEPROCESSES
OCEANOGRAPHY
SPILL SCENARIO
POTENTIALLYEFFECTED COASTLINE(MODEL OUTPUT)
POTENTIALLY EFFECTED RESOURCES
RESPONSE PRIORITIES
BASE FEATURES
ENVIRONMENTAL SENSITIVITYINDEX MAP
SPILL TRAJECTORYMODEL
ProductionTransport
PhysicalChemicalBiological
DynamicsWaveTemperatureSalinityMeteorology
BiotaPortsAquacultureRecreation Area
Spill TypeRelease TypeDurationVolumeProbability
OIL PRODUCTION
Figure 6. Entitiy diagram for oil spill GIS application.
In the implementation of the GISdatabase, these simple entities were firsttranslated into GIS thematic layers.Coastal environmental characteristics werethen determined as its sensitivity toenvironmental degradation. Attributeclassification of various coastal featureswas conducted using look-up table to rankeach feature from high to low sensitivityindex. The first derivative product is anew thematic layer depicting theEnvironmental Sensitivity Index (ESI) ofthe coastal environment.
Oceanographic characteristics andoil spill scenarios were both combined in aspatial analysis to determine the potentialimpacts of various oil spill scenarios to thecoastal environment. Spill scenariosranging from offshore blowout to shiploading spills were assessed by runningtrajectory and spreading models. Themodels consider various oil spillcharacteristics such as oil amount andphysical properties, and oceanographiccharacteristics such as wind and currentdirection and speed (Gunawan, et al.,1996). Plate 3 shows an example of GISanalysis results of the East Kalimantan oilspill contingency GIS developmentdepicting both coastal environmentalsensitivity index and oil spill trajectoryand spreading. This GIS applicationexample shows a type of GIS usage for theplanning of coastal and marine resourceenvironmental protection andconservation.
The two examples presented abovedemonstrate that although the generalheading under which they are developedare the same, coastal resourcemanagement, the information content ofeach application may differ. In fact, foreach planning analysis, different sets ofthematic information are neededdepending on the analysis objective.Therefore, one should not generalize how
a GIS for coastal resource managementshould be formed, but rather howinformation themes should be customizedto provide specific answer to specificresource management question. For aresource utilization application such asfish exploitation for example, theavailability of information on resourcedynamics (e.g., fish stock over time) is anecessity. This type of information is notusually readily available and needs specialeffort to acquire because different types ofresource may have different dynamics.
RECENT CHALLENGES
As of the time when this paper isbeing prepared, a monetary crisis has hitthe Southeast and East Asian regionsincluding Indonesia. For the small butcritical part at the end of Indonesia’s firstlong-term development phase,development orientation has been divertedfrom the basic strength of Indonesia’sendowment which is the natural resources,to non-resource based manufacturing andservices industries. Although theargument over the higher importance ofeconomic competitive advantage ascompared to resource based comparativeadvantage has a strong basis in a moremarket oriented and global economy, thefact that no single advanced economy isseparated from its resource basis shouldgive Indonesian an important lesson.
The current economic crisis willnot end only by any reform program.Only by creating new economicopportunities that recession could beovercome. In the period of recession, onlyresource based opportunities can becreated in shorter term to relief theeconomic slow down. As a maritimecontinent country, Indonesia will have torely more on its coastal and marine
resources more than to its land basedresources. It is therefore very important tohave a complete understanding on thecoastal and marine resource structures,functions and dynamics that utilization ofthese resources can be conducted in aproductive and sustainable manner. GISas an information solution plays a veryimportant role in providing venues formanaging, analyzing, and communicatingvarious information related to theopportunities and the constraints ofIndonesia’s coastal and marine resourcesdevelopment.
REFERENCES
Costanza, R., L. Wainger, C. Folkie, and K-GMaler, 1993. Modeling complex ecologicaleconomic systems, toward an evolutionary,dynamic understanding of people and nature,BioScience, 43:545-555.
Dahuri, R., J, Rais, S.P. Ginting, and M.J. Sitepu.1996. Pengelolaan sumberdaya wilayah pesisirdan lautan secara terpadu. Pradnya Paramita,Jakarta, 305p.
Forman, R.T.T. and M. Godron. 1986. LandscapeEcology, John Wiley and Sons, New York, NY,619p.
Gunawan, I. 1997. Sistem Informasi Geografissebagai perangkat pengelolaan data pokokpada era perekonomian global. Paper presentedat the Sumatra Regional Workshop onMonitoring and Evaluation of Basic Data,Batam, 18 November 1997, 6p.
Gunawan, I., L.J. Armstrong, G.R. Carlson, DRizvano, and Y. Arvelyna. 1997. Integratingnatural resources Geographical InformationSystem (GIS) with an oil spill trajectory model: East Kalimantan example. ProsidingKonperensi Energi, Sumberdaya Alam danLingkungan (ESDAL), BPP Teknologi.
Holling, C.S., 1992. Cross-scale morphology,geometry, and dynamics of ecosystems,Ecological Monographs, 62:447-502.
Hugget, R. J. 1995. Geoecology, An EvolutionaryApproach, Rotledge, London, New York, 320p.
Kenchington, R., 1995. Managing marineenvironment: background, scales, complexityand information needs. Proceedings ofWorkshop B1-NERIC Training in BasicConcepts of Integrated Coastal Zone ResourceManagement and Utilisation of InformationTechnology, Townsville, Australia, 15-17March 1995, 13p.
Orians, G.H., 1990. Ecological concepts ofsustainability, Environment, 32:10-39.
Pezzey, J. 1992. Sustainable DevelopmentConcept: An Economic Analysis, World BankEnvironment Paper Number 2, The WorldBank, Washington, DC, 72p.
Soemarwoto, O., 1991. Human ecology inIndonesia: the search for sustainability indevelopment, Indonesia: Resources, Ecology,and Environment, J. Hardjono, ed., OxfordUniversity Press, New York, NY, pp. 212-235.
Turner R.K., D. Pearce, and I. Bateman. 1993.Environmental Economics: An ElementaryIntroduction, The John Hopkins UniversityPress, Baltimore, MD, 328p.
THE APPLICATION OF CARRYINGCAPACITY CONCEPT
FOR SUSTAINABLE COASTALRESOURCES DEVELOPMENT IN
INDONESIA
ROKHMIN DAHURICenter for Coastal and Marine Resources Studies (CCMRS)
Bogor Agricultural University (IPB)
ABSTRACT
he focus of economic development in Indonesiashift from terrestrial to marine and coastalresources in the second long-term Development(1993-2018). The shift is due to the fact that 1)63% (3.1 million km2) of Indonesian territorial
area is covered by marine waters which is rich innatural resources, and 2) terrestrial resources arebecoming less and less and difficult to develop.
Experience in developing coastal and marineresource during the First long-term Development(1967-1992) result not only in economic growth butalso environmental degradation. In some coastal areas,the degradation has come to a level that threatens thesustainability of coastal and marine ecosystems tosupport further Indonesia’s economic development.Despite the environmental degradation, Indonesia cannot stop the development of coastal and marineresources because this country still needs the economicgrowth to achieve a prosperous society.
The Challenge for coastal planners andmanagers in Indonesia right now is to develop coastaland marine resources for the maximum benefit and, atthe same time, to maintain the sustainable capacity ofecosystems (meaning does not exceed the carryingcapacity of the ecosystems). This paper discuss thedefinition of coastal zone carrying capacity andguiding principles for sustainable development ofcoastal resources in Indonesia
INTRODUCTION
As Indonesia embarks on its Second Long-term Development Plan (1993-2018), the focus ofeconomic development is turned to marine and coastalresources. This is reflected in the 1993 State PolicyGuidelines (GBHN) which consider marine and
coastal-related development aspects as a sector in it.Before the 1993 GBHN, marine and coastal resourceswere only part of other development sectors.
The shift of development focus fromterrestrial resource-based activities to marine resource-based activities is because of two main reasons. First,Indonesia is the largest archipelagic state in the worldwith 17,508 islands, 81.000 km coastline, and 63%(3.1 million km2) of its territorial area is covered bymarine waters which are endowed with diverse andrich natural resources. Second, although the pace ofdevelopment in Indonesia is amongst the fastest in theworld it is still heavily dependent on its naturalresources. As the number of population increases(expected to reach 276 million by the year of 2020)and terrestrial (upland) resources are becoming scarceor difficult to develop, the role of coastal and marineresources will be more prominent in the Second Long-term Development Period.
Despite a bright prospect as indicated above,experiences in developing coastal and marineresources during the First Long-term DevelopmentPeriod (1967-1992) have resulted in not only positivebenefits (economic growth) but also environmentaldegradation. The degree of environmental degradationin some coastal areas, especially those which aredensely populated and industrialized areas, has cometo a level that threatens the sustainability of coastal andmarine ecosystems to support further Indonesia'seconomic development. Cases like increasingpollution levels in the Strait of Malacca and along theNorth Coast of Java; overfishing of some fish andshrimp stocks in the Strait of Malacca, the North Coastof Java, Bali Strait, and South Sulawesi; and excessivecoral reef and mangrove damages indicate such athreatened condition.
T
2
The problem is that we as a developing nationcan not stop development of coastal and marineresources, simply because Indonesia still needseconomic growth to increase quality of life of thosepoor people and to achieve a just and prosperoussociety. Thus, the challenge for coastal planners andmanagers in this country is how to develop coastal andmarine resources for the maximum benefit of the entirenation and, at the same time, maintaining thesustainable capacity of coastal and marine ecosystems.In other words, how do we develop and utilize coastaland marine resources which does not exceed thecarrying capacity of coastal and marine ecosystems tosupport human existence and development.
DEFINING CARRYING CAPACITY OF THECOASTAL ZONE
Carrying capacity of an ecosystem such ascoastal zone, is defined as the maximum population ofa given species which can be supported on asustainable basis (indefinitely), allowing for seasonaland random changes, without any degradation of thenatural resource base that would diminish thismaximum population in the future (Kirchner et al.,1985; Munn, 1989).
Based upon such a definition, carryingcapacity of an ecosystem is then determined by theability of the ecosystem to provide natural resourcesand environmental services (e.g. living space,recreational areas, clean air, and the ability of anecosystem to dispose of wastes) required by populationof a given species. For an animal population, factorsthat determine carrying capacity of an ecosystem maybe only the availability of food and living space. Foodavailability is also a major factor which determinecarrying capacity of a region inhabited by traditional(primitive) human population, since it can be aconstraint to population growth. However, in modernsocieties (e.g. in highly concentrated urban areas)where food is readily available through trade withoutlying areas, the carrying capacity is oftendetermined by other factors, such as the availability ofliving space, potable water and clean air or the abilityof urban areas to absorb wastes. A region's carryingcapacity is, therefore, ultimately determined by itsscarcest vital natural resources and environmentalservices needed by animal or human population wholive in such a region.
Thus, if the carrying capacity of the coastalzone could be accurately assessed, then it would bepossible to set the number of human population andthe level (intensity) of economic development thatcould live and occur in the coastal zone on asustainable basis. So far there has been very limited orno effort to define and measure carrying capacity ofthe coastal zone for human population and its
development activities. As a result, our endeavor torealize sustainable development of the coastal zone hasbeen approach mostly on an adhoc (piecemeal)approach, not on a comprehensive and holisticapproach which is required for sustainabledevelopment.
Indeed applying the carrying capacityconcept to human population and sustainabledevelopment is complicated by two major factors(Dahuri, 1991). First, natural resource consumptionpercapita and environmental services needed byhumans are extremely vary, whether within the samesociety or among different societies competing for thesame natural resources and environmental services.Second, human's ability to control or manage, to someextent, the natural resources and environmentalservices upon which they depend. Unlike other animalspecies, human beings can increase the carryingcapacity of a region (including coastal zone) by usingtechnological interventions and trade. However,people can also diminish the carrying capacity of aregion through various forms of environmental miss-management leading to long-term natural resourcesdegradation. Such human-induced degradation is duefrequently to various short-term human's objectives,which occur largely in response to rapid populationgrowth and excessive development activities to fulfillhuman's greed.
Through technological interventions, peoplecan improve the productivity of natural resources and,thereby, expanding the region's carrying capacity.Technology can increase a region's carrying capacity intwo ways (Kirchner et al., 1985). First, it can allowpeople to substitute, to some limited extent, a naturalresource that is abundant for one that is scarce.Fertilizers, for example, allow farmers to compensatefor a shortage of arable land by applying chemicalsthat are not in short supply at least until thepetrochemical or coal feedstocks used to synthesizemany of them become too expensive. Second,technology can increase the efficiency of conversion ofnatural resources into economic goods, therebyallowing people to "squeeze" more economic valuefrom a given natural resources base.
While technological advances can expand thecarrying capacity of a region to a considerable extent,they ultimately reach diminishing returns and do notmake unlimited population growth possible. Forexample, at high application levels, fertilizers exhibitsharply declining marginal returns and cause seriousenvironmental complications (such as eutrophicationof lakes and coastal waters, and health-endangeringnitrate levels in drinking water). At some point,increase in a fertilizer use will result in nutrient"poisoning" of crops and an actual drop in yields. Bycontrast, some production functions used in economic
3
analysis (such as the Cobb-Douglas function) assumethat factors of production are infinitely substitutable forone another, and that using any resources moreintensively guarantees an increase in output.
Moreover, technology cannot increase thetotal quantity of natural resources ultimately availableon this planet. It can not create more raw materials outof nothing-nor can it increase the efficiency ofconversion of these materials into economic goodsbeyond the constraints imposed by the physical laws ofthermodynamics. For example, intercropping orrotation cropping of compatible species can result ingreater food "outputs" from the same farm "inputs",but no conceivable combination of technologies couldproduce more food energy "output" than was availableas (solar and other) energy "input" to the farm.Therefore, no technological advances can eliminatenatural resource constraints entirely. Furthermore,technology cannot increase the Earth's natural wasteassimilation capacity, although it can be used to reducethe volume of pollutants or other wastes that aregenerated. Thus, while technological advances canexpand a region's carrying capacity to some extent,they cannot replace the need for eventual populationstabilization. In the shorter term, the rate of populationgrowth cannot exceed the rate at which technologicaladvances increase carrying capacity without reducingpeople's standard of living and risking an overshoot ofthe carrying capacity.
Another means of pushing back naturalresources constraints is trade. Trade can expand localcarrying capacity by exchanging resources that arelocally plentiful for those that are locally scarce. Forexample, countries in the Persian Gulf can supportpopulations far in excess of their local agriculturalcarrying capacities by trading oil for food. Similarly,city-states such as Singapore and Hong Kong supportpopulation densities roughly 100 times higher than thelocal carrying capacity by paying for food with thevalue added to labor-intensive goods. In other words,trade allows one region to make use of the excesscarrying capacity of another.
However, trade can expand local carryingcapacities only in certain circumstances. The resourcethat is scarce in one region (for example, food) must beavailable in surplus elsewhere, and the region'splentiful resource for (example oil, phosphate rock, orcheap labor) must be scarce elsewhere. Trade cannotalleviate global scarcity, as there is no other "globe"nearby with which to trade. The difference in valuebetween the exported and imported goods must beenough to pay the costs of transportation both ways,which for small, remote, or landlocked countries (orthose lacking good internal transportation) can beenormous. Transportation costs are a particularly greatobstacle to commerce in high-bulk, low-value
commodities such as food staples or many rawmaterials. As fossil fuels become more scarce andtheir cost rise, many opportunities for trade are likelyto become uneconomical because of highertransportation costs.
GUIDING PRINCIPLES FOR SUSTAINABLEDEVELOPMENT OF COASTAL RESOURCESIN INDONESIA
It is obvious by now that to achievesustainable development of the coastal zone, it shouldbe ensured that the number of human population andits associated development activities should not exceedthe carrying capacity of the coastal zone. This is ofhighly relevant because carrying capacity of the coastalzone is generally difficult to be expanded by existing(available) technologies. This is particularly true interms of the limited ability of the coastal zone toprovide natural resources (fish and other marine livingresources) and to absorb wastes.
Thus, sustainable coastal resourcesdevelopment can only be attained by bringing thepopulation number (including its associateddevelopment activities) and the carrying capacity ofthe coastal zone into balance. In other words,economic development of a certain coastal zone can besustainable only if the total human demand for naturalresources and environmental services does not surpassthe carrying capacity (functional ability) of such acoastal zone to provide them.
Any natural ecosystem, such as a coastalzone, provides four major functions to the existence ofhuman beings and its economic development: (1) life-support services, (2) amenity services, (3) materialinputs (the supplier of natural resources), and (4) wastereceptor services (Ortolano, 1984). Life-supportservices include such things that are necessary forhuman existence as the provision of clean water andfresh air, hydrological cycle, tidal patterns, nutrientcycle, spawning and nursery grounds for marine biota,and space for living and development activities.Amenity services from the natural ecosystem can befound in the form of surroundings that people findpleasant, attractive and renewing, such as beautifulbeaches and coral reefs. The coastal ecosystem canalso supply natural resources that are required byhuman beings for their consumption and productionprocesses, such as fish, mangrove timber, oil and gas,and other minerals. Waste receptor services offered bycoastal ecosystems reflect their ability to transformwastes into harmless substances and dilute them.
Accordingly, from ecological perspectives,sustainable coastal resources development requires that
4
four main guidelines should be implemented whenconducting the development of a coastal zone: (1)spatial harmony, (2) optimal utilization of naturalresources, (3) pollution control, and (4) minimizationof adverse environmental impacts.
Spatial Harmony
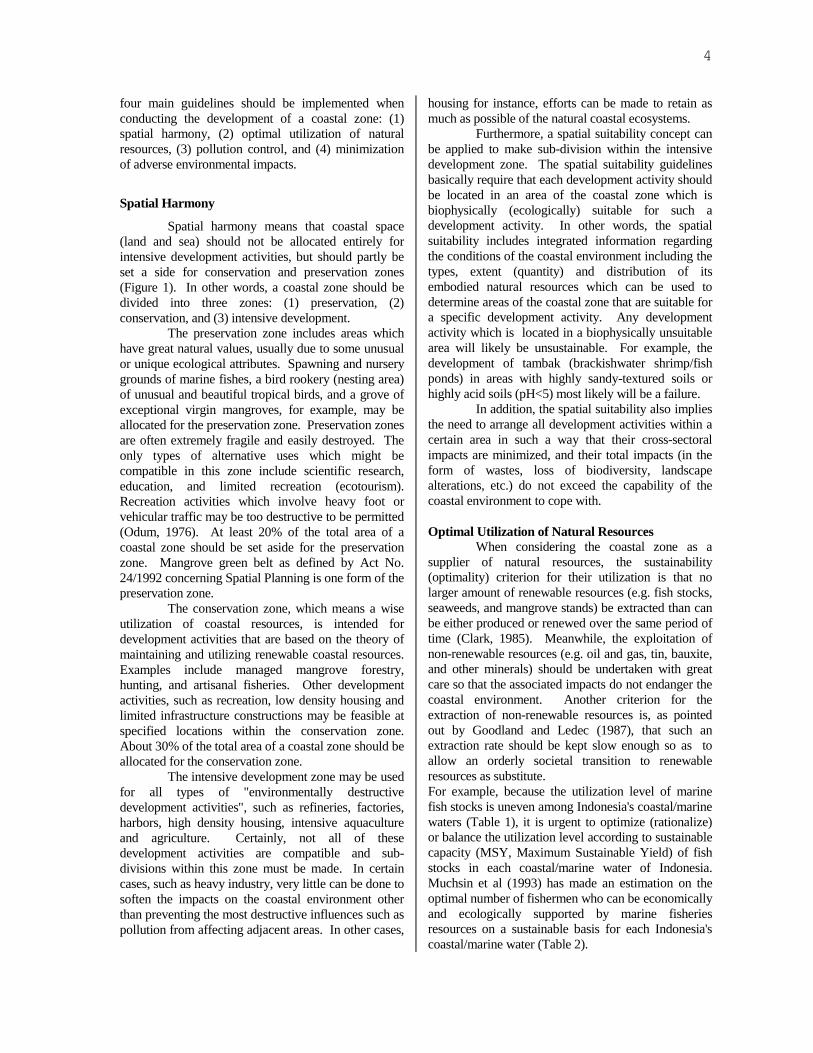
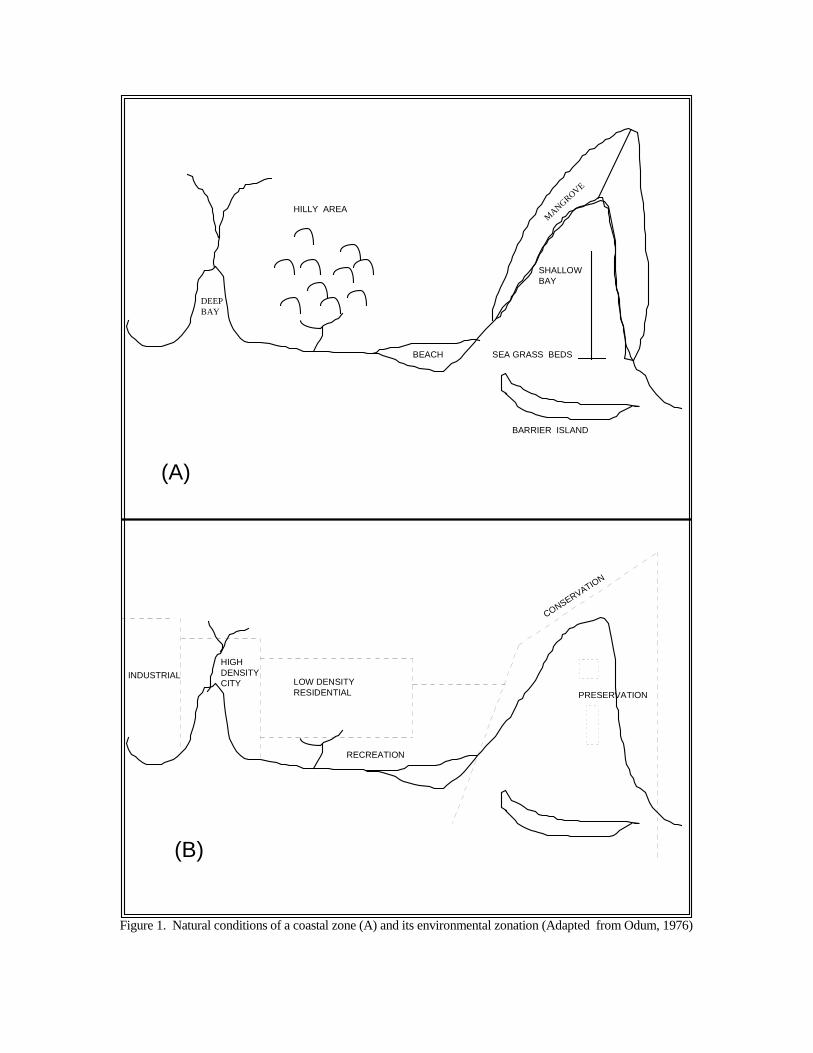
Spatial harmony means that coastal space(land and sea) should not be allocated entirely forintensive development activities, but should partly beset a side for conservation and preservation zones(Figure 1). In other words, a coastal zone should bedivided into three zones: (1) preservation, (2)conservation, and (3) intensive development.
The preservation zone includes areas whichhave great natural values, usually due to some unusualor unique ecological attributes. Spawning and nurserygrounds of marine fishes, a bird rookery (nesting area)of unusual and beautiful tropical birds, and a grove ofexceptional virgin mangroves, for example, may beallocated for the preservation zone. Preservation zonesare often extremely fragile and easily destroyed. Theonly types of alternative uses which might becompatible in this zone include scientific research,education, and limited recreation (ecotourism).Recreation activities which involve heavy foot orvehicular traffic may be too destructive to be permitted(Odum, 1976). At least 20% of the total area of acoastal zone should be set aside for the preservationzone. Mangrove green belt as defined by Act No.24/1992 concerning Spatial Planning is one form of thepreservation zone.
The conservation zone, which means a wiseutilization of coastal resources, is intended fordevelopment activities that are based on the theory ofmaintaining and utilizing renewable coastal resources.Examples include managed mangrove forestry,hunting, and artisanal fisheries. Other developmentactivities, such as recreation, low density housing andlimited infrastructure constructions may be feasible atspecified locations within the conservation zone.About 30% of the total area of a coastal zone should beallocated for the conservation zone.
The intensive development zone may be usedfor all types of "environmentally destructivedevelopment activities", such as refineries, factories,harbors, high density housing, intensive aquacultureand agriculture. Certainly, not all of thesedevelopment activities are compatible and sub-divisions within this zone must be made. In certaincases, such as heavy industry, very little can be done tosoften the impacts on the coastal environment otherthan preventing the most destructive influences such aspollution from affecting adjacent areas. In other cases,
housing for instance, efforts can be made to retain asmuch as possible of the natural coastal ecosystems.
Furthermore, a spatial suitability concept canbe applied to make sub-division within the intensivedevelopment zone. The spatial suitability guidelinesbasically require that each development activity shouldbe located in an area of the coastal zone which isbiophysically (ecologically) suitable for such adevelopment activity. In other words, the spatialsuitability includes integrated information regardingthe conditions of the coastal environment including thetypes, extent (quantity) and distribution of itsembodied natural resources which can be used todetermine areas of the coastal zone that are suitable fora specific development activity. Any developmentactivity which is located in a biophysically unsuitablearea will likely be unsustainable. For example, thedevelopment of tambak (brackishwater shrimp/fishponds) in areas with highly sandy-textured soils orhighly acid soils (pH<5) most likely will be a failure.
In addition, the spatial suitability also impliesthe need to arrange all development activities within acertain area in such a way that their cross-sectoralimpacts are minimized, and their total impacts (in theform of wastes, loss of biodiversity, landscapealterations, etc.) do not exceed the capability of thecoastal environment to cope with.
Optimal Utilization of Natural ResourcesWhen considering the coastal zone as a
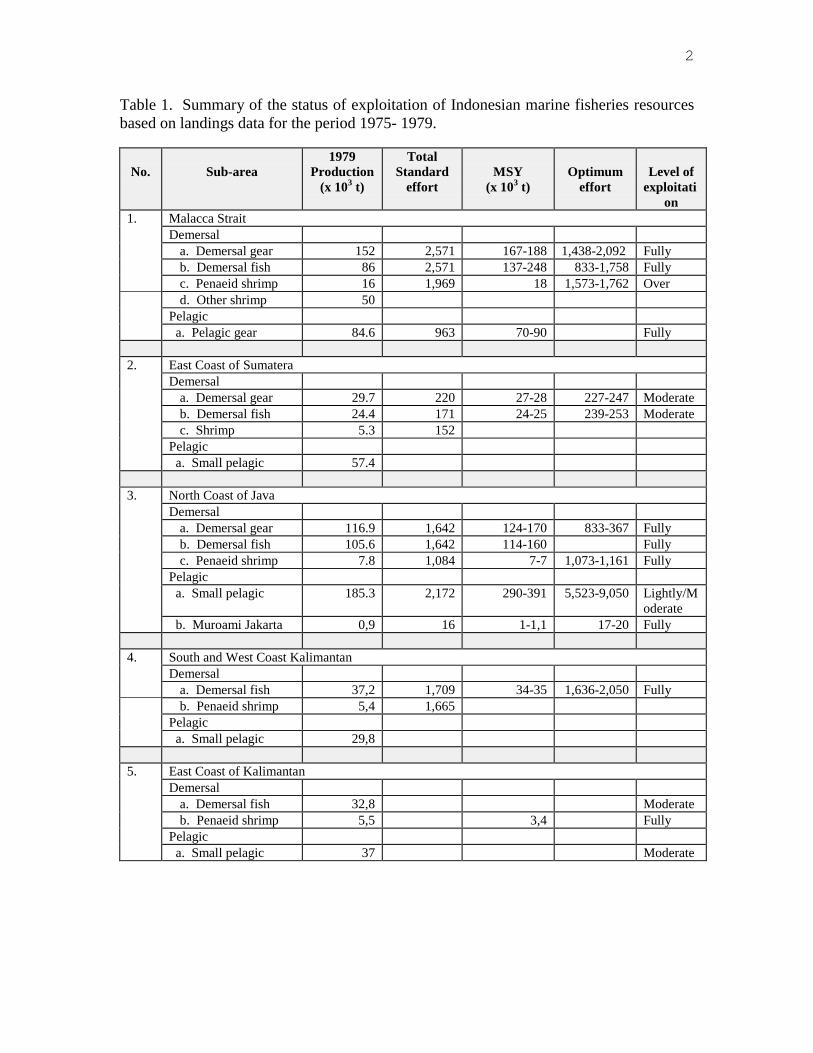
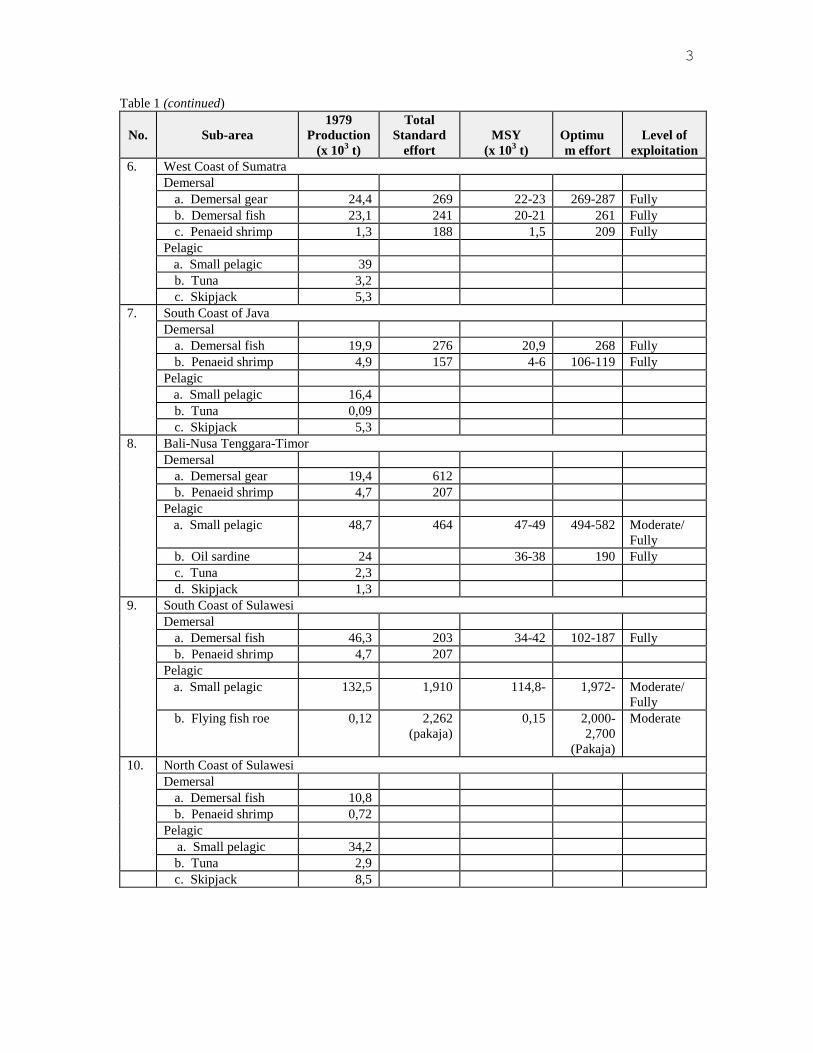
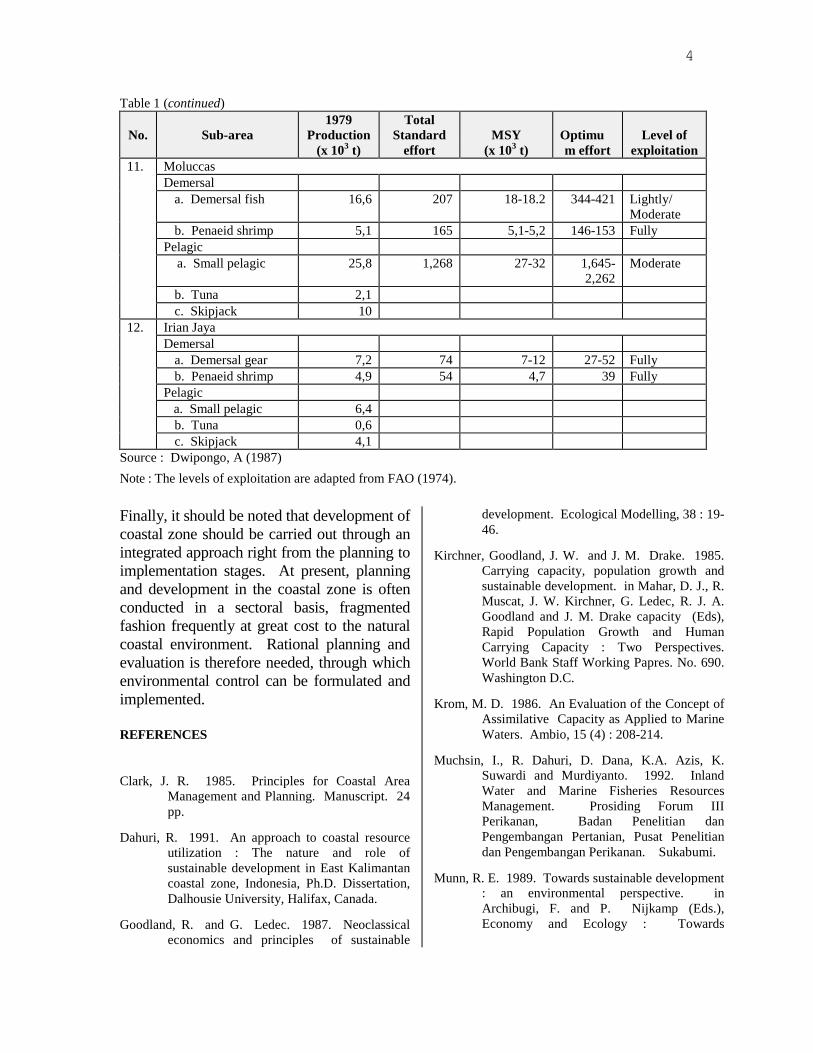
supplier of natural resources, the sustainability(optimality) criterion for their utilization is that nolarger amount of renewable resources (e.g. fish stocks,seaweeds, and mangrove stands) be extracted than canbe either produced or renewed over the same period oftime (Clark, 1985). Meanwhile, the exploitation ofnon-renewable resources (e.g. oil and gas, tin, bauxite,and other minerals) should be undertaken with greatcare so that the associated impacts do not endanger thecoastal environment. Another criterion for theextraction of non-renewable resources is, as pointedout by Goodland and Ledec (1987), that such anextraction rate should be kept slow enough so as toallow an orderly societal transition to renewableresources as substitute.For example, because the utilization level of marinefish stocks is uneven among Indonesia's coastal/marinewaters (Table 1), it is urgent to optimize (rationalize)or balance the utilization level according to sustainablecapacity (MSY, Maximum Sustainable Yield) of fishstocks in each coastal/marine water of Indonesia.Muchsin et al (1993) has made an estimation on theoptimal number of fishermen who can be economicallyand ecologically supported by marine fisheriesresources on a sustainable basis for each Indonesia'scoastal/marine water (Table 2).
5
Pollution Control
When treating a coastal zone as the receptacleof wastes, it must be ensured that all wastes fromdevelopment activities both within the coastal zone andbeyond its boundaries should not exceed itsassimilative capacity. In this case, assimilativecapacity means the ability of the coastal zone to absorba certain amount of wastes before there is anunacceptable environmental or health hazards (Krom,1986). However, for hazardous toxic wastes (B3)should not be discharged into the coastal environment.
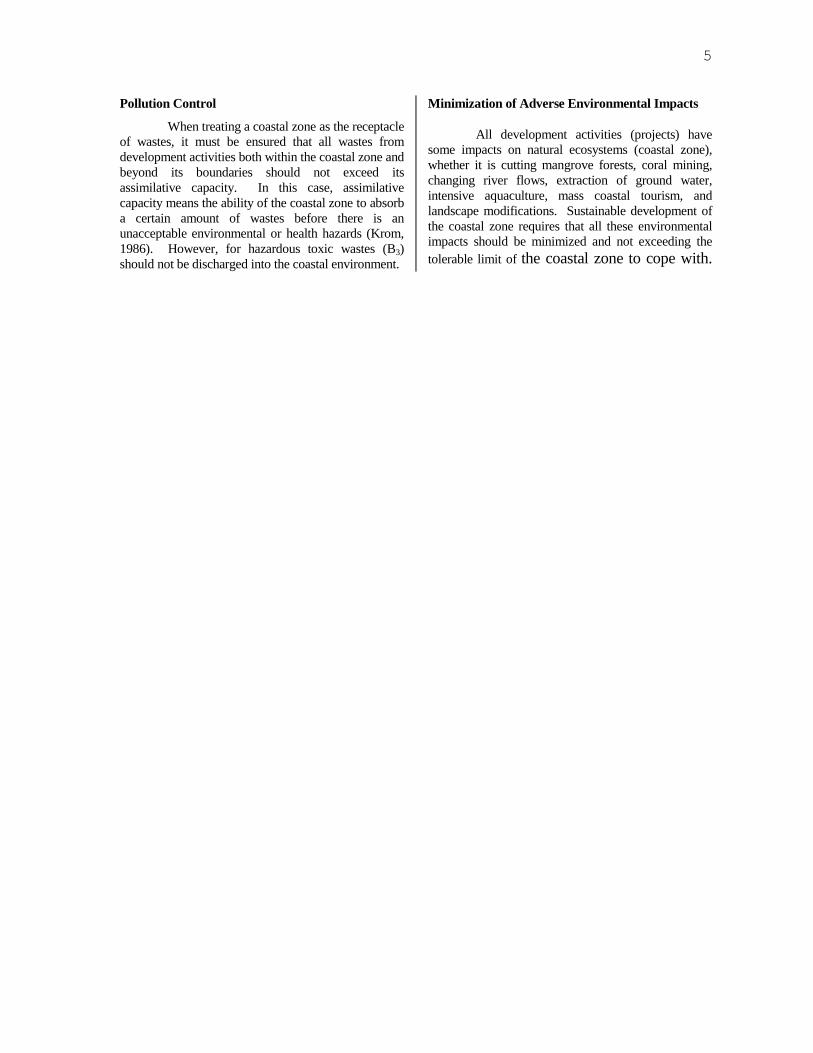
Minimization of Adverse Environmental Impacts
All development activities (projects) havesome impacts on natural ecosystems (coastal zone),whether it is cutting mangrove forests, coral mining,changing river flows, extraction of ground water,intensive aquaculture, mass coastal tourism, andlandscape modifications. Sustainable development ofthe coastal zone requires that all these environmentalimpacts should be minimized and not exceeding thetolerable limit of the coastal zone to cope with.
DEEPBAY
MANGROVE
HILLY AREA
SHALLOW BAY
SEA GRASS BEDSBEACH
BARRIER ISLAND
INDUSTRIALHIGHDENSITYCITY
PRESERVATIONLOW DENSITYRESIDENTIAL
RECREATION
CONSERVATION
(A)
(B)
Figure 1. Natural conditions of a coastal zone (A) and its environmental zonation (Adapted from Odum, 1976)
2
Table 1. Summary of the status of exploitation of Indonesian marine fisheries resourcesbased on landings data for the period 1975- 1979.
No. Sub-area1979
Production(x 103 t)
TotalStandard
effortMSY
(x 103 t)Optimum
effortLevel of
exploitation
1. Malacca StraitDemersal
a. Demersal gear 152 2,571 167-188 1,438-2,092 Fullyb. Demersal fish 86 2,571 137-248 833-1,758 Fullyc. Penaeid shrimp 16 1,969 18 1,573-1,762 Overd. Other shrimp 50
Pelagic a. Pelagic gear 84.6 963 70-90 Fully
2. East Coast of SumateraDemersal
a. Demersal gear 29.7 220 27-28 227-247 Moderateb. Demersal fish 24.4 171 24-25 239-253 Moderatec. Shrimp 5.3 152
Pelagic a. Small pelagic 57.4
3. North Coast of JavaDemersal
a. Demersal gear 116.9 1,642 124-170 833-367 Fullyb. Demersal fish 105.6 1,642 114-160 Fullyc. Penaeid shrimp 7.8 1,084 7-7 1,073-1,161 Fully
Pelagic a. Small pelagic 185.3 2,172 290-391 5,523-9,050 Lightly/M
oderate b. Muroami Jakarta 0,9 16 1-1,1 17-20 Fully
4. South and West Coast KalimantanDemersal
a. Demersal fish 37,2 1,709 34-35 1,636-2,050 Fullyb. Penaeid shrimp 5,4 1,665
Pelagic a. Small pelagic 29,8
5. East Coast of KalimantanDemersal
a. Demersal fish 32,8 Moderateb. Penaeid shrimp 5,5 3,4 Fully
Pelagic a. Small pelagic 37 Moderate
3
Table 1 (continued)
No. Sub-area1979
Production(x 103 t)
TotalStandard
effortMSY
(x 103 t)Optimum effort
Level ofexploitation
6. West Coast of SumatraDemersal
a. Demersal gear 24,4 269 22-23 269-287 Fullyb. Demersal fish 23,1 241 20-21 261 Fullyc. Penaeid shrimp 1,3 188 1,5 209 Fully
Pelagic a. Small pelagic 39
b. Tuna 3,2c. Skipjack 5,3
7. South Coast of JavaDemersal
a. Demersal fish 19,9 276 20,9 268 Fullyb. Penaeid shrimp 4,9 157 4-6 106-119 Fully
Pelagic a. Small pelagic 16,4
b. Tuna 0,09c. Skipjack 5,3
8. Bali-Nusa Tenggara-TimorDemersal
a. Demersal gear 19,4 612b. Penaeid shrimp 4,7 207
Pelagic a. Small pelagic 48,7 464 47-49 494-582 Moderate/
Fullyb. Oil sardine 24 36-38 190 Fullyc. Tuna 2,3d. Skipjack 1,3
9. South Coast of SulawesiDemersal
a. Demersal fish 46,3 203 34-42 102-187 Fullyb. Penaeid shrimp 4,7 207
Pelagic a. Small pelagic 132,5 1,910 114,8- 1,972- Moderate/
Fullyb. Flying fish roe 0,12 2,262
(pakaja)0,15 2,000-
2,700(Pakaja)
Moderate
10. North Coast of SulawesiDemersal
a. Demersal fish 10,8b. Penaeid shrimp 0,72
Pelagic a. Small pelagic 34,2
b. Tuna 2,9c. Skipjack 8,5
4
Table 1 (continued)
No. Sub-area1979
Production(x 103 t)
TotalStandard
effortMSY
(x 103 t)Optimum effort
Level ofexploitation
11. MoluccasDemersal
a. Demersal fish 16,6 207 18-18.2 344-421 Lightly/Moderate
b. Penaeid shrimp 5,1 165 5,1-5,2 146-153 FullyPelagic a. Small pelagic 25,8 1,268 27-32 1,645-
2,262Moderate
b. Tuna 2,1c. Skipjack 10
12. Irian JayaDemersal
a. Demersal gear 7,2 74 7-12 27-52 Fullyb. Penaeid shrimp 4,9 54 4,7 39 Fully
Pelagic a. Small pelagic 6,4
b. Tuna 0,6c. Skipjack 4,1
Source : Dwipongo, A (1987)Note : The levels of exploitation are adapted from FAO (1974).
Finally, it should be noted that development ofcoastal zone should be carried out through anintegrated approach right from the planning toimplementation stages. At present, planningand development in the coastal zone is oftenconducted in a sectoral basis, fragmentedfashion frequently at great cost to the naturalcoastal environment. Rational planning andevaluation is therefore needed, through whichenvironmental control can be formulated andimplemented.
REFERENCES
Clark, J. R. 1985. Principles for Coastal AreaManagement and Planning. Manuscript. 24pp.
Dahuri, R. 1991. An approach to coastal resourceutilization : The nature and role ofsustainable development in East Kalimantancoastal zone, Indonesia, Ph.D. Dissertation,Dalhousie University, Halifax, Canada.
Goodland, R. and G. Ledec. 1987. Neoclassicaleconomics and principles of sustainable
development. Ecological Modelling, 38 : 19-46.
Kirchner, Goodland, J. W. and J. M. Drake. 1985.Carrying capacity, population growth andsustainable development. in Mahar, D. J., R.Muscat, J. W. Kirchner, G. Ledec, R. J. A.Goodland and J. M. Drake capacity (Eds),Rapid Population Growth and HumanCarrying Capacity : Two Perspectives.World Bank Staff Working Papres. No. 690.Washington D.C.
Krom, M. D. 1986. An Evaluation of the Concept ofAssimilative Capacity as Applied to MarineWaters. Ambio, 15 (4) : 208-214.
Muchsin, I., R. Dahuri, D. Dana, K.A. Azis, K.Suwardi and Murdiyanto. 1992. InlandWater and Marine Fisheries ResourcesManagement. Prosiding Forum IIIPerikanan, Badan Penelitian danPengembangan Pertanian, Pusat Penelitiandan Pengembangan Perikanan. Sukabumi.
Munn, R. E. 1989. Towards sustainable development: an environmental perspective. inArchibugi, F. and P. Nijkamp (Eds.),Economy and Ecology : Towards

2
Sustainable Development. KluwerAcademic Publisher, Boston. p. 49-72.
Odum, E. P. 1976. Ecological Guidelines forTropical Coastal Development. IUCNPublication New Series No. 42, IUCN,Switzerland.
Ortolano, A. 1984. Environmental Planning andDecision Making. John Wiley and Sons,Toronto.
1
1
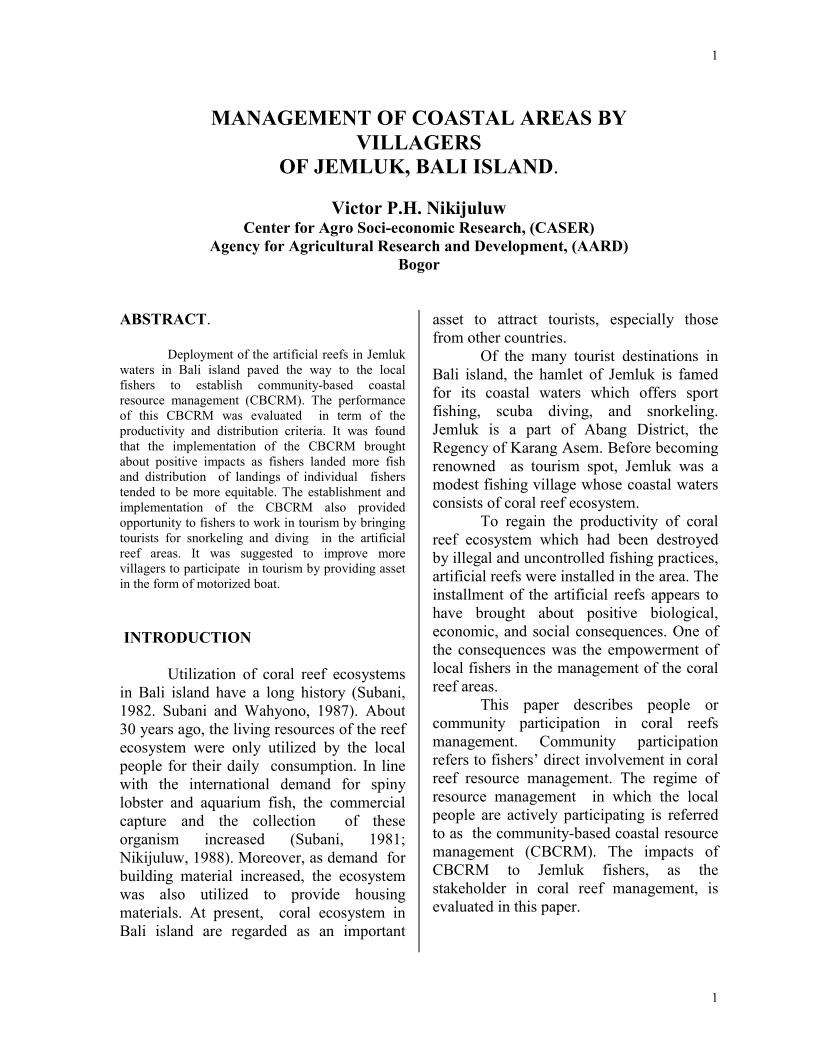
MANAGEMENT OF COASTAL AREAS BYVILLAGERS
OF JEMLUK, BALI ISLAND.
Victor P.H. NikijuluwCenter for Agro Soci-economic Research, (CASER)
Agency for Agricultural Research and Development, (AARD)Bogor
ABSTRACT.
Deployment of the artificial reefs in Jemlukwaters in Bali island paved the way to the localfishers to establish community-based coastalresource management (CBCRM). The performanceof this CBCRM was evaluated in term of theproductivity and distribution criteria. It was foundthat the implementation of the CBCRM broughtabout positive impacts as fishers landed more fishand distribution of landings of individual fisherstended to be more equitable. The establishment andimplementation of the CBCRM also providedopportunity to fishers to work in tourism by bringingtourists for snorkeling and diving in the artificialreef areas. It was suggested to improve morevillagers to participate in tourism by providing assetin the form of motorized boat.
INTRODUCTION
Utilization of coral reef ecosystemsin Bali island have a long history (Subani,1982. Subani and Wahyono, 1987). About30 years ago, the living resources of the reefecosystem were only utilized by the localpeople for their daily consumption. In linewith the international demand for spinylobster and aquarium fish, the commercialcapture and the collection of theseorganism increased (Subani, 1981;Nikijuluw, 1988). Moreover, as demand forbuilding material increased, the ecosystemwas also utilized to provide housingmaterials. At present, coral ecosystem inBali island are regarded as an important
asset to attract tourists, especially thosefrom other countries.
Of the many tourist destinations inBali island, the hamlet of Jemluk is famedfor its coastal waters which offers sportfishing, scuba diving, and snorkeling.Jemluk is a part of Abang District, theRegency of Karang Asem. Before becomingrenowned as tourism spot, Jemluk was amodest fishing village whose coastal watersconsists of coral reef ecosystem.
To regain the productivity of coralreef ecosystem which had been destroyedby illegal and uncontrolled fishing practices,artificial reefs were installed in the area. Theinstallment of the artificial reefs appears tohave brought about positive biological,economic, and social consequences. One ofthe consequences was the empowerment oflocal fishers in the management of the coralreef areas.
This paper describes people orcommunity participation in coral reefsmanagement. Community participationrefers to fishers’ direct involvement in coralreef resource management. The regime ofresource management in which the localpeople are actively participating is referredto as the community-based coastal resourcemanagement (CBCRM). The impacts ofCBCRM to Jemluk fishers, as thestakeholder in coral reef management, isevaluated in this paper.
2
2
METHODOLOGY
This study focuses on the CBCRMon the area of Jemluk where artificial reefswere installed. Identification anddocumentation of the CBCRM wasundertaken by considering key variables assuggested by fishers (1993). Accordingly, inorder that a community-based resourcemanagement system may exist, it shouldhave essential and optional elements. Theessential elements are the institutional baseconsisting of shared norms and behaviors.The optional elements is organizationalstructure. The type of resource managementinstitutional arrangements can be examinedin terms of contextual variables. Sixcontextual variables considered in this studyare (1) biophysical attributes, (2) marketattributes, (3) stakeholder attributes, (4)community context, (5) externalinstitutional arrangement, and (6) externalfactors (Pomorey, 1993).
The performance of the CBCRM is afunction of its ability to mobilize availableresources and to use them productively,equitably, and sustainably in meeting theneeds of community members (Korten,1986). While it is true that productivity,equity, and sustainability criteria of theCBCRM should be evaluated altogether, inthis study, however, only productivity andequity criteria were examined. This wasdone because of the lack of data for testingof sustainability criteria.
The field data collection was performedin May and June 1995 and March 1996.Respondents were 30 fishers who alsoengaged in tourism activities. In addition,information were also collected from villageleaders and fisheries officers. A literaturesurvey was conducted to gather data on thecontextual variables of the CBCRM.Productivity (efficiency) and equity impactswere analyzed by estimating the mean,coefficient of variation and Pearson
Skewness Coefficient (Walpole, 1982) offish landing, fish price, operational costs offishing, and day spent fishing.
RESULTS AND DISCUSSIONS
Fisheries and Marine Resources inJemluk.
Jemluk is situated in the northeast ofBali island. The length of coast line underthe Jemluk territory is about 2 km. Thewaters within 400 meters from the beach aredesignated for the activities of the villagers.The water bottom consists of living coral,sandy coral, muddy coral, and black sand.Wasilun et al (1993) estimated that blacksand is about 180,000 m2. Oceanographiccondition of the Jemluk inshore waterscannot be separated from that of openwaters. Wasilun et al (1994) stated thatduring the month of August, relativelycooler and higher salinity water from BandaSea passes by the Jemluk area to the JavaSea. In the month of February, mud fromJemluk river floods the sea waters. This isthe reason for the existence of muddy coraland black sand on the bottom of the Jemlukwaters. Nevertheless, the waters are stillclear because of the circulation process bythe tidal waves (Wasilun, et al. 1994).
The type of human activities in theJemluk coastal area are presented in Table1. The coastal area in fact is used by thepeople for various purposes. Flat land ismore intensively used than coastal waters,tidal areas, and upland areas. The coastalwaters are mainly used for fishing andtourism activities. Artificial reefs wereinstalled in the coastal waters as a part ofthe environmental, fisheries and tourismdevelopment programs. Garbage is dumpedin a special place on the land. This helpreduce problems from domestic waste-caused pollution.
The total population of Jemluk in1996 was 567 consisting of 279 male and
3
3
287 female. The total number of householdwas 120. Therefore, on the average, therewere five persons in each household. Thishousehold size was relatively higher thanthe national figure of approximately fourperson per household. The exact figures onage distribution of the population were notavailable. However, it could be observedthat the number of young people in the laborforce was relatively higher than othergroups.
Almost all parents send theirchildren to school. An elementary school(grade six) is available in the village.Children who want to go to high school maygo to the district school. Unlike the situationthat might be seen in other fishingcommunities, children in Jemluk were notso involved in helping their parents infisheries-related activities. Beside studying,children’s spare time is used for playing orlearning dancing.
By origin, the residents of Jemlukcame from Culik Village who moved towork as fishers. As tourism developed,people from surrounding villages, such asTista and Bunutan, also came to live inJemluk.
About 93% of the households areengaged in fishing, 3.4% in agriculture, andthe rest in trades and services. Based on thelivelihood pattern, Jemluk might becategorized as a fishing village. There arefour families who rely on agriculture. Onpart time basis, they also engage in fishingas boat crew. Other families depend onsmall-scale trading, home industry, andtourism services.
Fishing activities in the village,however, are confined to the near-shorewaters. In other words, fishers just exploitthe fisheries resources in the waterstraditionally considered as their territory.Going farther for fishing is almostimpossible as the boats owned by fishers arewithout engine or with small engine.
The types of fishing gears employedby Jemluk fishers are troll line (261 units),hand line (261 units), bottom gill net (3units) and drift gill net (12 units). Onehousehold can have more than one gear.Almost all families possessed a troll andhand line. Troll line was operated in the daywhile hand line was used both in the dayand night. Drift gill net is relatively newgear, being used for only three year. Thehand line is employed to catch demersalfish, the gill net is directed to catch pelagicfish.
Most of the fishers who use handline and drift gill net fish for theirsubsistence needs. Commercial fishing andmarketing is not the main orientation forthese fishers. On the other hand, fishers whoemploy troll line and bottom gill net alwayssell their catch. The types of fish caught aremackerel, little tuna, pomfret, snapper, andgrouper. All these fish are highly valued inthe village market. There is no special fishauction market in the village, meaning thatfishers are free to sell their marketable catchanywhere. The surplus of landings arebrought to the village market which isvisited by local consumers and middlemenfrom other places. The villagers can buygoods for daily needs from the villagemarket. To buy belongings such as clothes,television, radio, or other luxury items,villagers go to larger markets in the district,regency, or province.
Of about 100 current fishers inJemluk, 40% are engaged in the tourismsector by providing their fishing boats asexcursion boats. The number boat andfrequency of trips in tourism has steadilyincreased. In 1992, there were 324excursion boat trips, increased about tentimes to about 2400 trips in 1995. Not allfishing boats can serve as tourist boats. Thisis due to the fact that only motorized boatare demanded by tourist.
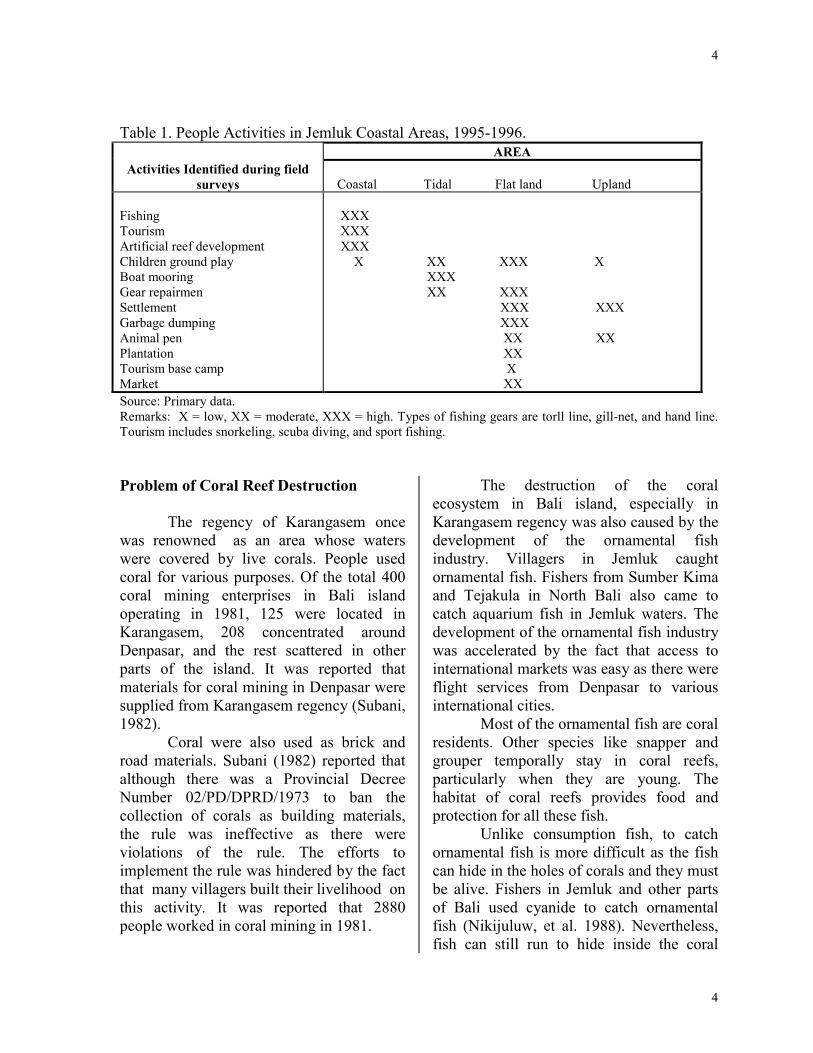
4
4
Table 1. People Activities in Jemluk Coastal Areas, 1995-1996.AREA
Activities Identified during fieldsurveys Coastal Tidal Flat land Upland
FishingTourismArtificial reef developmentChildren ground playBoat mooringGear repairmenSettlementGarbage dumpingAnimal penPlantationTourism base campMarket
XXX XXX XXX X XX XXX X XXX XX XXX XXX XXX XXX XX XX XX X XX
Source: Primary data.Remarks: X = low, XX = moderate, XXX = high. Types of fishing gears are torll line, gill-net, and hand line.Tourism includes snorkeling, scuba diving, and sport fishing.
Problem of Coral Reef Destruction
The regency of Karangasem oncewas renowned as an area whose waterswere covered by live corals. People usedcoral for various purposes. Of the total 400coral mining enterprises in Bali islandoperating in 1981, 125 were located inKarangasem, 208 concentrated aroundDenpasar, and the rest scattered in otherparts of the island. It was reported thatmaterials for coral mining in Denpasar weresupplied from Karangasem regency (Subani,1982).
Coral were also used as brick androad materials. Subani (1982) reported thatalthough there was a Provincial DecreeNumber 02/PD/DPRD/1973 to ban thecollection of corals as building materials,the rule was ineffective as there wereviolations of the rule. The efforts toimplement the rule was hindered by the factthat many villagers built their livelihood onthis activity. It was reported that 2880people worked in coral mining in 1981.
The destruction of the coralecosystem in Bali island, especially inKarangasem regency was also caused by thedevelopment of the ornamental fishindustry. Villagers in Jemluk caughtornamental fish. Fishers from Sumber Kimaand Tejakula in North Bali also came tocatch aquarium fish in Jemluk waters. Thedevelopment of the ornamental fish industrywas accelerated by the fact that access tointernational markets was easy as there wereflight services from Denpasar to variousinternational cities.
Most of the ornamental fish are coralresidents. Other species like snapper andgrouper temporally stay in coral reefs,particularly when they are young. Thehabitat of coral reefs provides food andprotection for all these fish.
Unlike consumption fish, to catchornamental fish is more difficult as the fishcan hide in the holes of corals and they mustbe alive. Fishers in Jemluk and other partsof Bali used cyanide to catch ornamentalfish (Nikijuluw, et al. 1988). Nevertheless,fish can still run to hide inside the coral
5
5
reefs even though they have been sprayedwith cyanide. To get the fish, the coral isbroken.
As a consequence of such coral reefexploitation, coral fish resources weredegraded. Subani (1982) asserted that bothproduction and number of species of seaweed, mollusk, and crustacean, especiallyspiny lobster, decreased. The poor state offish resources was exacerbated by the factthat fishers fish primarily in near shorewaters and do not go farther offshore.
Deployment of Artificial Reefs.
To regain the previous state of fishresources in the area, artificial reefs wereintroduced and installed by the provincialgovernment through the Local FisheriesService, the Directorate General of Fisheries(DGF), and collaboration with the ResearchInstitute for Marine Fisheries (RIMF). In1991, 3 units of pyramid modules made ofopen concrete cubes were installed by theRIMF. After being evaluated and found thatthe installment of the reefs brought aboutpositive impact to fish availability(Wasilun, et al. 1993), another 4 units ofartificial reefs were placed in 1992. Inaddition, the Local Fisheries Serviceassembled 11 units of pyramid modulesmade of old tires and concrete. Hence intotal there were 18 modules of artificialreefs installed in Jemluk waters covering anarea of about 217 cubic meters.
Deployment of artificial reefs inJemluk waters was a part of the CoastalWaters Development Project of theProvincial Fisheries Service. It was statedthat the main objective of the artificial reefdeployment in Jemluk was to providesubstitute for destroyed coral reefs. Thesecondary objective was to have habitat orshelter for fish and other marine organism(Diskan, 1994). The objectives, however,
do not cover the whole ranges of theecological and socioeconomic features ofartificial reefs. The ranges of objectives ofan artificial reefs deployment as revealed byMunro and Balgos ( 1995), taking from thecases of the Philippines, are as:
• habitat or shelter for fish and othermarine organism
• substrate for regeneration of coralsand other marine organism
• feeding, breeding and nursery area• reference point• deterrent to trawling• eco-tourism and other recreational
purposes• waste disposal• mariculture• fishing ground• sanctuary• substitute for destroyed coral reefs• entry point for coastal management
initiatives• focus for propaganda purposes of
vested interest groups• replenishment area• provide a known and easily located
fishing area.
There was no biological base line studypurposely conducted before the deploymentof the artificial reefs. However, monitoringon the kind of abundance of fish wasconducted after reefs had been deployed.Two months after the first installation, 28families consisting of 114 species of fishwere found in the artificial reefs (Wasilun,et al. 1993). The abundance of fish in theartificial reefs also increased. In October1991, it was found that the abundance of offish was 5 pieces per meter cubic, Itincreased to 61 pieces in August 1992.Based on the abundance of fish, it can besaid that the artificial reefs have functionedas fish habitat.
6
6
Establishment of CBCRM
Villagers of Jemluk were involved inconstruction and placement of the artificialreefs. The monitoring of the biologicalimpact of the artificial reefs also involvedsome fishers. Extension services to thevillagers on the function of the artificialreefs before and right after their deploymentwere carried out by the Provincial FisheriesService. The impact of the extensionservices is that community awareness tomanage coral reef resources improved.
Management of the coral reefs andtheir fish resources essentially is undergovernment responsibility. In chapter 18 ofthe National Law (UU) No. 4/1987 aboutthe Principal Guidelines of EnvironmentalManagement, it is stated that themanagement of the environment andnatural resources are undertaken in acoordinated manner by a ministry at thenational level, by sectoral departments inaccordance with their respective tasks, andby local government at the provincial level.In chapter 5 of the Law No. 4/1987, it isstated that every person is responsible tocare for his (her) environment, and toprotect and cope with damage and pollution.The role of non-governmental organization(NGO) as a partner of the government isalso appreciated in environmentalmanagement.
The provincial government of Baliissued the Local Code (Perda) No. 3/1985about Fishery Resource Conservation.Accordingly, every person is responsible tomaintain and conserve fish habitat. Fishersare disallowed to catch fish by usingexplosive, poison, electric current, and otherequipment which can damage fish resource.
Without realizing the legal basis forindividuals and society to manage theirenvironment, the villagers of Jemlukdeveloped their own mechanism to manage
the deployed artificial reefs and theirsurrounding waters. The villager-initiatedresource management system was started bythe establishment of the Tunas Mekar FisherAssociation (TMFA) whose membersconsist of fishers who also work in tourism.The TMFA has an executive boardconsisting of one coordinator, one secretary,and one treasurer.
After the installment of the artificialreefs, tourist were attracted to visit the areafor snorkeling and scuba diving. WhileJemluk had been visited by tourists since1982, the visitation rate rose after theconstruction of the artificial reefs.
The coming of tourists to the villagemeant that other economic opportunity wascreated . Fishers who formerly relied ononly fishing could diversify their livelihoodsby offering their boats to bring tourists forsnorkeling and diving. In order to providebetter services to tourists, fishers formed theTMFA. The formation of this organizationcame about because many tourists came tothe area and the fishers compete against oneanother to offer their services. Thecompetition among fishers to serve touristsmade for uncomfortable conditions for thetourists. With the formation of the TMFA,conflict was avoided because fishers couldserve the tourists according to their agreedschedule.
The membership of the TMFA isrestricted to those having motorized boatsand commitment to provide better service.Furthermore, each member pays Rp 150,000as a membership fee. Due to the motorizedboat requirement, only about 40% of fishinghousehold have the ability to join theTMFA.
Although only around 40% offishing households joined the TMFA, theother fishers and residents of Jemluk paidrespect to managing the area as a touristdestination in Bali. In this regard, villagers,under the supervision of the Local Fisheries
7
7
Service, the Tourism Department, and theLocal Police Station, establish their ownrules and regulations concerning utilizationand management of the Jemluk waters,especially coral reef areas.
For those who did not join theTMFA, benefit could still be derived fromfishing in the artificial reef areas especiallywhen they could not go farther offshore forfishing due to bad weather. In addition,since members of the TMFA were notfishing because of being scheduled fortourism, the remaining fishers has a greaterchance to catch fish. In technical words, itimplied that the establishment of the TMFAand the installment of the artificial reefshave brought about a positive impact tofishers in the form of less fishing effort.
Under those coastal watersmanagement measures, pressure on theresources seemed to be reduced. In fact,construction of the artificial reefs made theresource more productive. The pristinecondition of beaches was graduallyregained. In sum, it might be said that thenew approach to resource management,based on villagers participation (CBCRM),has been effective. The artificial reefs whichwere developed to replace destroyed coralreefs and provide alternative fish habitathave also functioned as fishing ground forsmall-scale fishers, eco-tourism andrecreational areas, and an entry point forcommunity-based management initiatives.
Implementation of the CBCRM Rules.
Table 2 provides basic rules orregulations initiated by the villagers for thepurpose of the management of Jemlukwaters. The rules are applied to bothmembers and non-members of the TMFA.The rules dealing only with the activities ofthe TMFA members are written in theTMFA constitution and presented in Table3.
Every villagers is strictly prohibitedfrom dumping garbage in the sea and litteron the beach. Cleanliness, neatness, andtidiness of the environment are intensivelypromoted by the provincial government in abid to attract more tourists to visit Bali. Tomaintain the cleanliness of the beach,members of the TMFA are obliged to cleanthe beach once a month. If that is notpossible, the member should inform theassociation beforehand and pay Rp 250 as apenalty. The penalty of Rp 250 per violationis so low that every member may be able topay it. Nevertheless, this penalty is not areason to make members of the TMFAabandon their obligation. In other words,members of the TMFA do not have theintention to break the rule although theycan undoubtedly afford the penaltypayment.
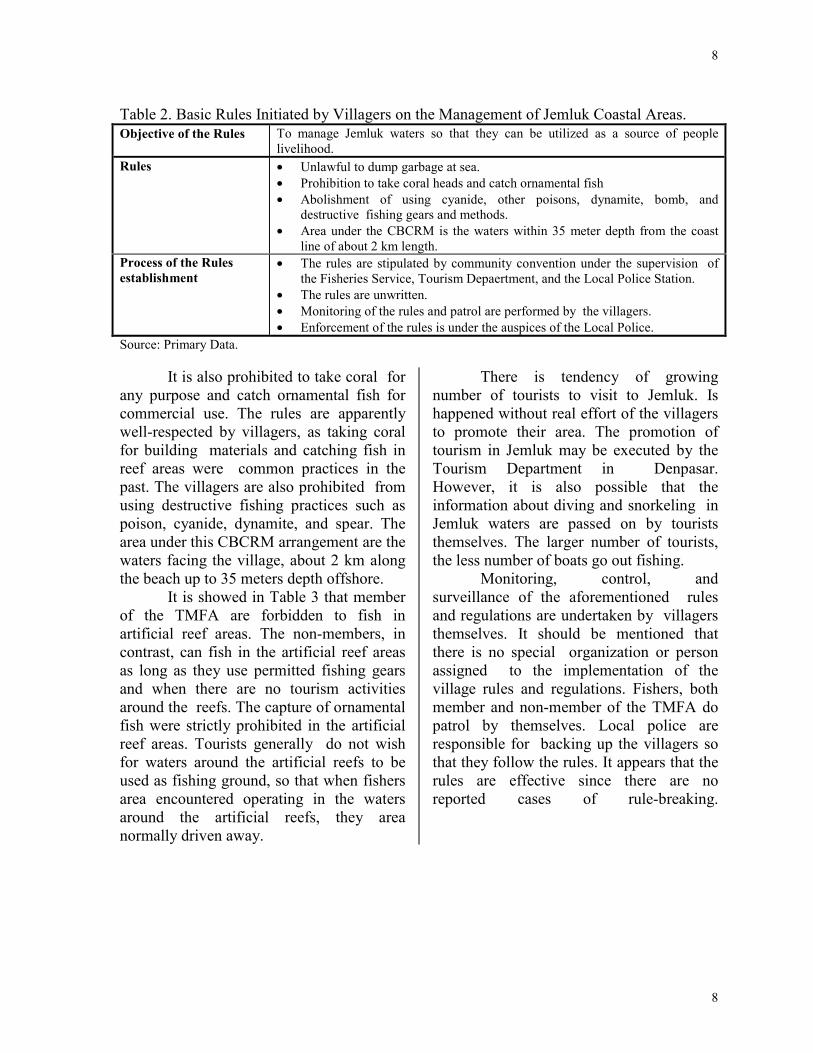
8
8
Table 2. Basic Rules Initiated by Villagers on the Management of Jemluk Coastal Areas.Objective of the Rules To manage Jemluk waters so that they can be utilized as a source of people
livelihood.Rules • Unlawful to dump garbage at sea.
• Prohibition to take coral heads and catch ornamental fish• Abolishment of using cyanide, other poisons, dynamite, bomb, and
destructive fishing gears and methods.• Area under the CBCRM is the waters within 35 meter depth from the coast
line of about 2 km length.Process of the Rulesestablishment
• The rules are stipulated by community convention under the supervision ofthe Fisheries Service, Tourism Depaertment, and the Local Police Station.
• The rules are unwritten.• Monitoring of the rules and patrol are performed by the villagers.• Enforcement of the rules is under the auspices of the Local Police.
Source: Primary Data.
It is also prohibited to take coral forany purpose and catch ornamental fish forcommercial use. The rules are apparentlywell-respected by villagers, as taking coralfor building materials and catching fish inreef areas were common practices in thepast. The villagers are also prohibited fromusing destructive fishing practices such aspoison, cyanide, dynamite, and spear. Thearea under this CBCRM arrangement are thewaters facing the village, about 2 km alongthe beach up to 35 meters depth offshore.
It is showed in Table 3 that memberof the TMFA are forbidden to fish inartificial reef areas. The non-members, incontrast, can fish in the artificial reef areasas long as they use permitted fishing gearsand when there are no tourism activitiesaround the reefs. The capture of ornamentalfish were strictly prohibited in the artificialreef areas. Tourists generally do not wishfor waters around the artificial reefs to beused as fishing ground, so that when fishersarea encountered operating in the watersaround the artificial reefs, they areanormally driven away.
There is tendency of growingnumber of tourists to visit to Jemluk. Ishappened without real effort of the villagersto promote their area. The promotion oftourism in Jemluk may be executed by theTourism Department in Denpasar.However, it is also possible that theinformation about diving and snorkeling inJemluk waters are passed on by touriststhemselves. The larger number of tourists,the less number of boats go out fishing.
Monitoring, control, andsurveillance of the aforementioned rulesand regulations are undertaken by villagersthemselves. It should be mentioned thatthere is no special organization or personassigned to the implementation of thevillage rules and regulations. Fishers, bothmember and non-member of the TMFA dopatrol by themselves. Local police areresponsible for backing up the villagers sothat they follow the rules. It appears that therules are effective since there are noreported cases of rule-breaking.
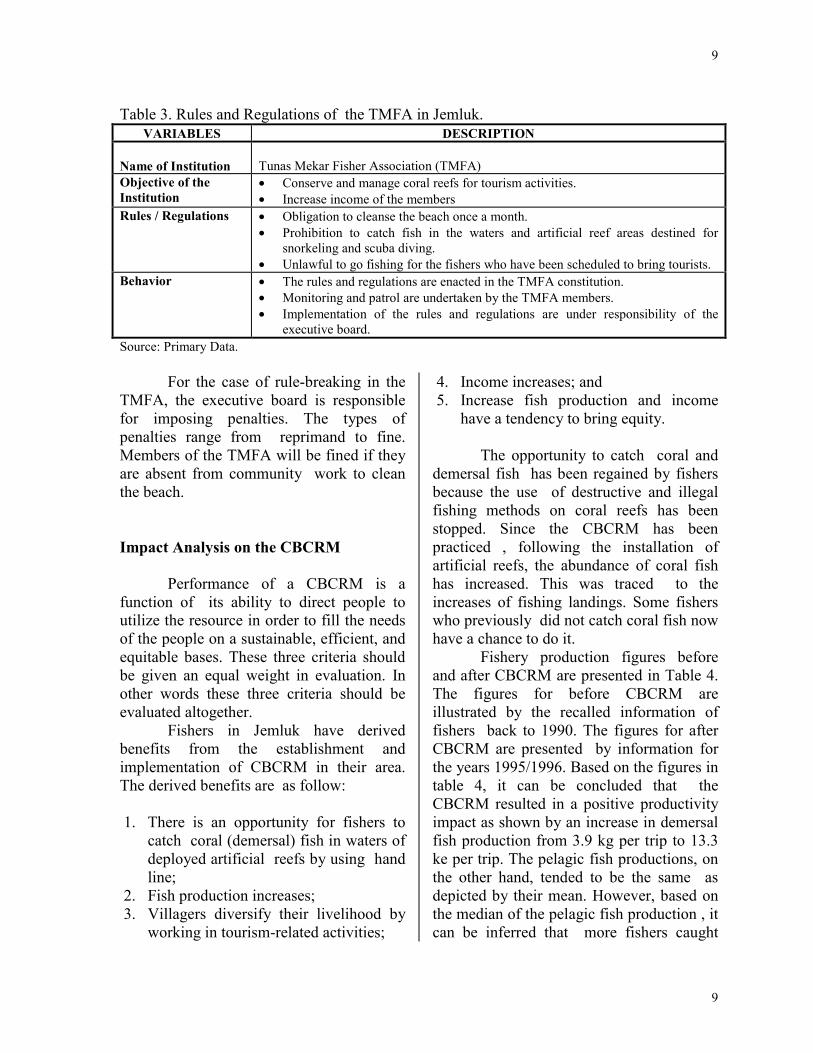
9
9
Table 3. Rules and Regulations of the TMFA in Jemluk.VARIABLES DESCRIPTION
Name of Institution Tunas Mekar Fisher Association (TMFA)Objective of theInstitution
• Conserve and manage coral reefs for tourism activities.• Increase income of the members
Rules / Regulations • Obligation to cleanse the beach once a month.• Prohibition to catch fish in the waters and artificial reef areas destined for
snorkeling and scuba diving.• Unlawful to go fishing for the fishers who have been scheduled to bring tourists.
Behavior • The rules and regulations are enacted in the TMFA constitution.• Monitoring and patrol are undertaken by the TMFA members.• Implementation of the rules and regulations are under responsibility of the
executive board.Source: Primary Data.
For the case of rule-breaking in theTMFA, the executive board is responsiblefor imposing penalties. The types ofpenalties range from reprimand to fine.Members of the TMFA will be fined if theyare absent from community work to cleanthe beach.
Impact Analysis on the CBCRM
Performance of a CBCRM is afunction of its ability to direct people toutilize the resource in order to fill the needsof the people on a sustainable, efficient, andequitable bases. These three criteria shouldbe given an equal weight in evaluation. Inother words these three criteria should beevaluated altogether.
Fishers in Jemluk have derivedbenefits from the establishment andimplementation of CBCRM in their area.The derived benefits are as follow:
1. There is an opportunity for fishers tocatch coral (demersal) fish in waters ofdeployed artificial reefs by using handline;
2. Fish production increases;3. Villagers diversify their livelihood by
working in tourism-related activities;
4. Income increases; and5. Increase fish production and income
have a tendency to bring equity.
The opportunity to catch coral anddemersal fish has been regained by fishersbecause the use of destructive and illegalfishing methods on coral reefs has beenstopped. Since the CBCRM has beenpracticed , following the installation ofartificial reefs, the abundance of coral fishhas increased. This was traced to theincreases of fishing landings. Some fisherswho previously did not catch coral fish nowhave a chance to do it.
Fishery production figures beforeand after CBCRM are presented in Table 4.The figures for before CBCRM areillustrated by the recalled information offishers back to 1990. The figures for afterCBCRM are presented by information forthe years 1995/1996. Based on the figures intable 4, it can be concluded that theCBCRM resulted in a positive productivityimpact as shown by an increase in demersalfish production from 3.9 kg per trip to 13.3ke per trip. The pelagic fish productions, onthe other hand, tended to be the same asdepicted by their mean. However, based onthe median of the pelagic fish production , itcan be inferred that more fishers caught
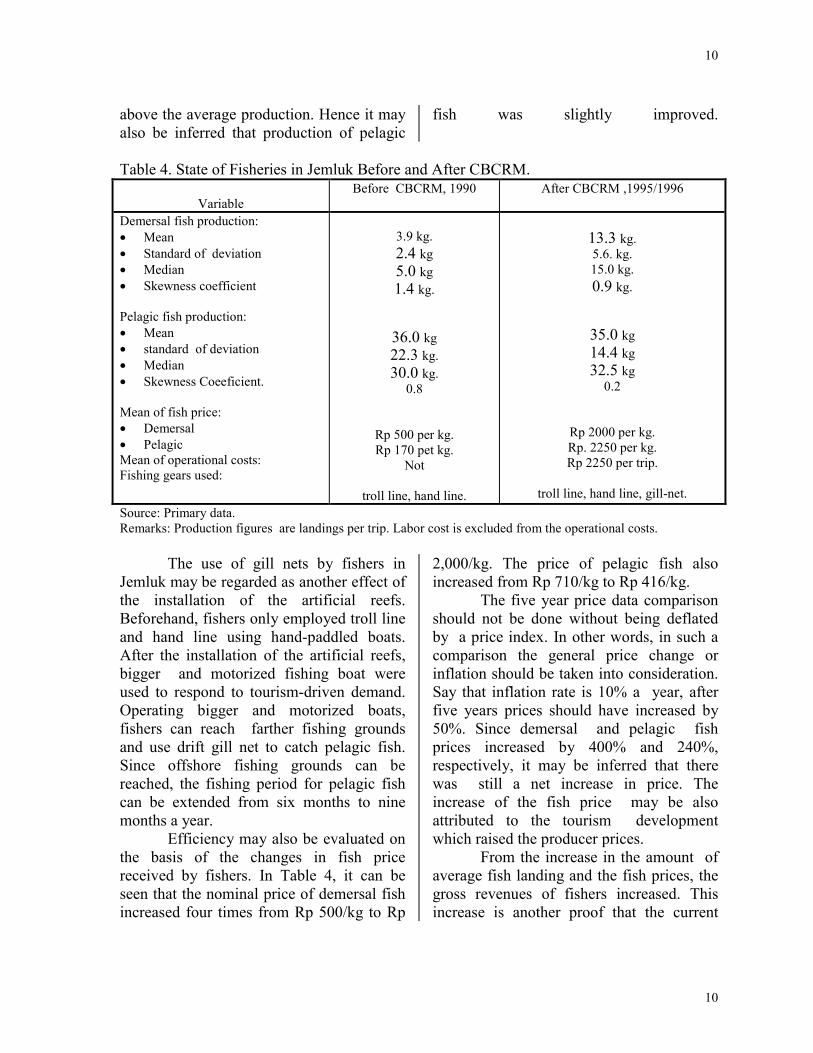
10
10
above the average production. Hence it mayalso be inferred that production of pelagic
fish was slightly improved.
Table 4. State of Fisheries in Jemluk Before and After CBCRM.
VariableBefore CBCRM, 1990 After CBCRM ,1995/1996
Demersal fish production:• Mean• Standard of deviation• Median• Skewness coefficient
Pelagic fish production:• Mean• standard of deviation• Median• Skewness Coeeficient.
Mean of fish price:• Demersal• PelagicMean of operational costs:Fishing gears used:
3.9 kg.2.4 kg5.0 kg1.4 kg.
36.0 kg22.3 kg.30.0 kg.
0.8
Rp 500 per kg.Rp 170 pet kg.
Not
troll line, hand line.
13.3 kg.5.6. kg.15.0 kg.0.9 kg.
35.0 kg14.4 kg32.5 kg
0.2
Rp 2000 per kg.Rp. 2250 per kg.Rp 2250 per trip.
troll line, hand line, gill-net.Source: Primary data.Remarks: Production figures are landings per trip. Labor cost is excluded from the operational costs.
The use of gill nets by fishers inJemluk may be regarded as another effect ofthe installation of the artificial reefs.Beforehand, fishers only employed troll lineand hand line using hand-paddled boats.After the installation of the artificial reefs,bigger and motorized fishing boat wereused to respond to tourism-driven demand.Operating bigger and motorized boats,fishers can reach farther fishing groundsand use drift gill net to catch pelagic fish.Since offshore fishing grounds can bereached, the fishing period for pelagic fishcan be extended from six months to ninemonths a year.
Efficiency may also be evaluated onthe basis of the changes in fish pricereceived by fishers. In Table 4, it can beseen that the nominal price of demersal fishincreased four times from Rp 500/kg to Rp
2,000/kg. The price of pelagic fish alsoincreased from Rp 710/kg to Rp 416/kg.
The five year price data comparisonshould not be done without being deflatedby a price index. In other words, in such acomparison the general price change orinflation should be taken into consideration.Say that inflation rate is 10% a year, afterfive years prices should have increased by50%. Since demersal and pelagic fishprices increased by 400% and 240%,respectively, it may be inferred that therewas still a net increase in price. Theincrease of the fish price may be alsoattributed to the tourism developmentwhich raised the producer prices.
From the increase in the amount ofaverage fish landing and the fish prices, thegross revenues of fishers increased. Thisincrease is another proof that the current
11
11
system of coastal waters managementbrought about positive impact to the fishers.
Under the CBCRM, fishers spendabout Rp 2,250 per boat every time they gofishing for gasoline. Before the CBCRM,fishers did not use an engine and thereforethere was no expenditure for oil and gas.Therefore, implementation of the CBCRMdid not only change the technology used butalso the pattern of inputs used and fishingexpense.
The equity impact of the CBCRMmight be judged by virtue of the coefficientof variation. In Table 4, it can be seen thatafter or with the CBCRM, the production ofdemersal and pelagic fish bore smallercoefficients of variation, meaning that fishproduction become more equal amongindividual fishers. The Pearson skewnesscoefficient tended to be closer to zero,implying that production per individualfishers did not vary so much with theimplementation of the CBCRM. Hence, itcould be said that implementation of theCBCRM in Jemluk brought about improvedequity to the members of the TMFA.
The variation of landings may beexplained as follow. Before the deploymentof the artificial reefs, fishers only caughtfish in the waters around destroyed coralreefs. Operating hand line and troll line,they competed with one another for limitedfish resources available in inshore waters.Under such circumstance, catch dependedvery much on the skill of fishers. It was alsoa situation that who came first to the fishingground had better chances to fish than thosecoming later. Therefore, landings ofindividual fishers would vary. After thedeployment of the artificial reefs, fishersoperated bigger and motorized boats andused gill net as a fishing gear. They had theability to enter offshore fishing groundwhich offer more fish. Competition was notso tight and as a consequence landings ofindividual fishers was not so different.
CONCLUSION AND POLICYIMPLICATION
Conclusion.
The villagers of Jemluk can becategorized into those who area onlyfishers and those working in fisheries andtourism. The first group are the fishersemploying non-motorized boats and usinghand line and troll line as fishing gears. Thesecond group consists of the fishersowning motorized boats and operating trollline or gill net as fishing gears. The secondgroup of fishers area organized into TMFA.
CBCRM has been established andimplemented in Jemluk coastal waters. Theestablishment of the CBCRM was initiatedby villagers in a bid to enhance the qualityof the waters which years before had beendegraded due to destructive practices.Another objective of the CBCRM is toimprove well-being of the villagers. Theestablishment of the CBCRM can beregarded as a follow-up to the installationof artificial reefs in the area. The coming oftourists for snorkeling and diving in thewaters of Jemluk can be considered as animpulse or another reason for theestablishment of the CBCRM.
The CBCRM is a set of local rulesand regulations on the management andutilization of the coastal waters. The rulesand regulations include the type ofallowable fishing gears and methods, timeof fishing, area of fishing, and obligation ofthe villagers to utilize the coastal area.Moreover, the CBCRM also deals withtourism activities in the waters around theartificial and living reefs. The CBCRMrules and regulations which relates to themembers of the TMFA are written in theTMFA constitution. The rules dealing withall villagers of Jemluk are unwritten. Thereis no penalty system for the rules and
12
12
regulation applied to all villagers. However,there are penalties for violations performedby member of the TMFA. The rules andregulations are effectively implementedsince there are no reported violations.
Villagers area involved inmonitoring , control, and surveillance of theimplementation of the rules and regulations.The enforcement of the rules andregulations are undertaken with the localpolice. The executive board of the TMFA isresponsible for enforcing the organizationrules and regulations.
The impact of the CBCRM to thevillagers was evaluated based on efficiencyand equity criteria. It can be inferred that theCBCRM brought about a positive efficiencyimpact shown by bigger catches landed byfishers. The efficiency impact of theCBCRM could also be judged on the factthat non-members of the TMFA could havea chance to catch demersal fish in theinshore waters.
The establishment andimplementation of the CBCRM improvedthe quality of marine resources andenvironment, indicating an achievement ofsustainability criteria of the CBCRM. Thebaseline data on biological aspects indeedwere not available. However, basing on themonitoring survey starting right after theartificial reefs deployment and thecomparison of catch before and after theestablishment of the CBCRM, it may beconcluded that there was a positivebiological impact. Nevertheless, one shouldkeep in mind that the long term biologicalimpact might be negative, if there is nocontrol of fishing effort in the artificial reefareas. Providing that eco-tourism is furtherdeveloped, the existing fisher may keep onmoving to tourism sector. Under suchcircumstance, fishing activity will have lesspressure and therefore it will sustain orimprove ecological condition of the coastalareas,
Equity impact of the CBCRM wasassessed on the basis of the coefficient ofvariation and Person’ Skewness Coefficienttaken for the amount of fish landings. Thetwo coefficients asserted that the CBCRMresulted in less disparity of catchdistribution.
Policy Implication
Major beneficiaries of the CBCRMin Jemluk seem to be members of theTMFA. Other villagers received benefitsfrom fishing as they now catch demersalfish by employing hand line. However theycould not generate income from tourismbecause of limited assets. It can beconcluded that the establishment of theCBCRM in Jemluk resulted in a biggerproportion of economic activities to themembers of the TMFA . While non-members still had improved income, it waslimited to that received from fishing. Theimplication of this is that if motorized boatscould be provided to the non-members ofthe TMFA, they could join the organizationand consequently enjoy the benefit oftourism.
To anticipate more fishers joiningthe TMFA, tourism should be promoted. Inaddition to the snorkeling and divingoffered in Jemluk, there should be alsoefforts to make tourists stay longer andspent money in the village. Thus far, touristsonly came from Denpasar for snorkelingand diving then go right back to Denpasar.If accommodation facilities were madeavailable in the village, an increased influxof tourists into the village might occur.
The local government, through theProvincial Fisheries Service and/or theProvinvial Tourist Promotion Office shouldconsider the possibility of developingadditional artificial reefs. Learning fromexperience, deployment of additional
13
13
artificial reefs should have clear objectivesand a management plan. Since Jemluk hastourism potential, one of the objectives ofthe artificial reefs deployment is to promotetourism. By specifying this objective,commercial fishing activities in the artificialreefs should be totally closed and displacedfishers can become involved in tourism. Asubsidized credit scheme should beprovided so that bigger and motorized boatscan be afforded.
The installment of the artificial reefsis under the responsibility of thegovernment. However, management ofdeployed artificial reefs can be handed overto villagers. In the case of Jemluk , TMFAcan be an embryo to develop a biggerCBCRM organization which embraces allthe fishers in the village.
In order to develop additionalartificial reefs, biophysical characteristics ofthe waters should be examined to determineproper location and number. The artificialreefs should provide long term benefits.
Compared to other fishingcommunities on Bali island, Jemluk issmall. Therefore, practices of the CBCRMin this hamlet will have limited impact onthe management of coastal areas andinshore waters on Bali island. It is possiblethat other coastal village have their ownsystems of coastal management.Identification of such systems, therefore, isrequired so that an overall system ofCBCRM for the whole island may bederived.
AKNOWLEDGEMENT
This study was supported by the FisheriesCo-management Research Project jointly organizedby the ICLARM, Manila Philippines and the IFM,North Sea Center, Hirtshals Denmark. The paper hasbenefited from the helpful comments given by Dr.Bob Pomeroy of ICLARM.
REFERENCES
Clark, J.R. 1992. Integrated Management of CoastalZones. FAO Fish. Tech. Pap. No. 327.Rome. FAO. 167 p.
Diskan, 1994. Laporan Tahunan 1993. PemerintahPropinsi Daerah Tingkat I bali, Denpasar.
Fishers, B. 1993. Creating space: developmentagencies and local institutions in naturalresource management. Forest, Trees, andPeople, 22:4-11.
Korten, D.C. (Ed). 1986. Community Management.Asian Experiences and Perspective. WestHarford, Kumarin Press.
Munro, J.L. and M.C. Balgos. (Eds). 1995. Artificialreefs in the Philippines. ICLARM Con.Proc. 49, 56p.
Nikijuluw, V.P.H.; MM. Wahyono; S.R. Suharti.1988. Perikanan Ikan Hias Laut di PulauBali. Manajemen dan RentabilitasSumberdaya, Jurnal Penelitian PerikananLaut, 45:59-67
Nikijuluw, V.P.H. 1995. Community-based fisherymanagement (sasi) in Central Maluku .Indonesian Agricultural Research andDevelopment Journal, 16(2):19-23.
Pomeroy, R.S. 1993. A Research Framework forCoastal Fisheries Co-managementInstitutions. ICLARM, Manila 15 p.
Pomeroy, R.S. and M.J. Williams. 1994. FisheriesCo-management and Small-scale Fisheries:A Policy Brief. ICLARM, Manila 15 p.
Subani, W. 1981. Penelitian Lingkungan hidupUdang Barong (Spiny Losbter), Perikanandan Pelestarian Sumbernya di PantaiSelatan Bali. Bulletin Penelitin Perikanan,1(3):361-386.
Subani, W. 1982. Penambangan Karang SertaDampaknya terhadap SumberdayaPerikanan di Perairan Pantai Selatan Bali.Laporan Penelitian Perikanan Laut,23:17-32.
Subani, W. dan M.M. Wahyono. 1987. KerusakanEkosistem Perairan Pantai dan Dampaknyaterhadap Sumberdaya Perikanan di pantai
14
14
Selatan Bali, Barat dan Timor Lombok danTeluk Jakarta. Jurnal PenelitianPerikanan Laut, 42:53-70.
Walpole, R.E. 1982. Introduction to Statistics.MacMillan Publishing Co. Inc. New York.
Wasilun, Suprapto, Murniyati. 1993. PengaruhTerumbu Buatan Terhadap PerbaikanKomunitas Ikan di Perairan Jemluk , Bali.Bulletin Penelitian Perikanan, 4:131-138.
Wasilun, Suprapto, Murniyati. 1994. KemungkinanPengembangan Terumbu Karang BuatanUntuk Tujuan Peningkatan Produksiperikanan dan Wisata Bahari. JurnalPenelitian Perikanan Laut, 85:69-84.
White, A.T. 1988. Marine parks and reserves:management for coastal environments inSoutheast Asia. ICLARM Education Series,2. 36 p.
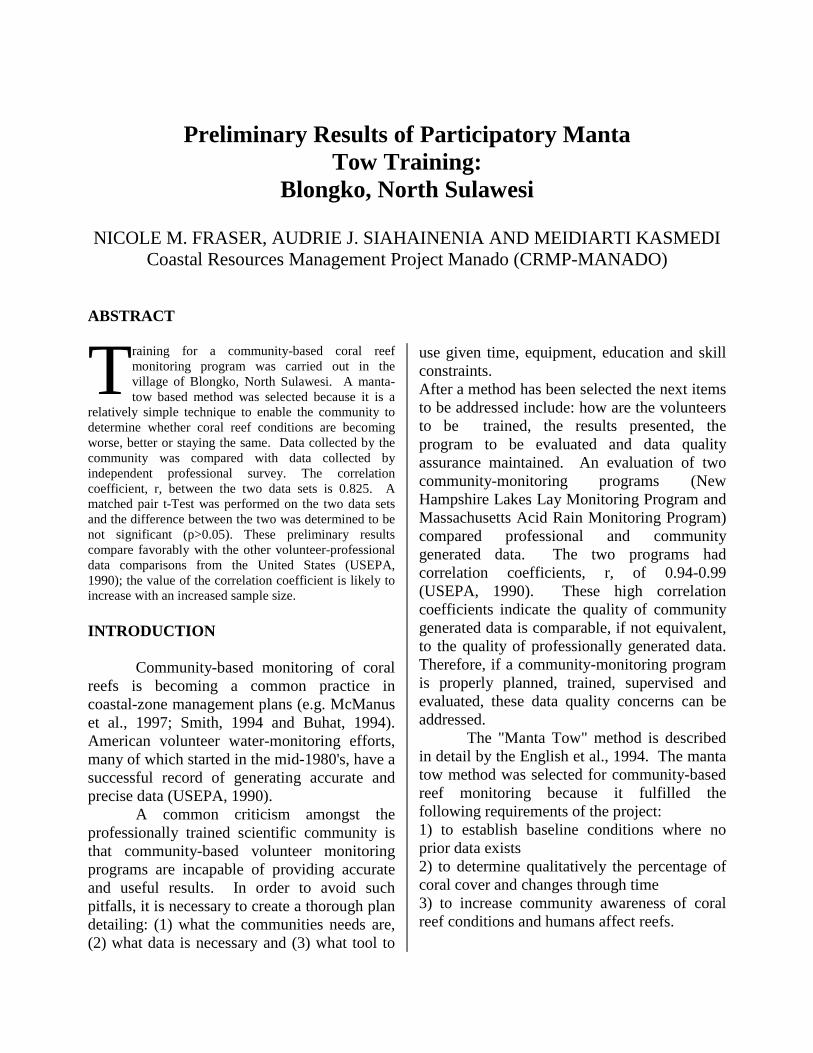
Preliminary Results of Participatory MantaTow Training:
Blongko, North Sulawesi
NICOLE M. FRASER, AUDRIE J. SIAHAINENIA AND MEIDIARTI KASMEDICoastal Resources Management Project Manado (CRMP-MANADO)
ABSTRACT
raining for a community-based coral reefmonitoring program was carried out in thevillage of Blongko, North Sulawesi. A manta-tow based method was selected because it is a
relatively simple technique to enable the community todetermine whether coral reef conditions are becomingworse, better or staying the same. Data collected by thecommunity was compared with data collected byindependent professional survey. The correlationcoefficient, r, between the two data sets is 0.825. Amatched pair t-Test was performed on the two data setsand the difference between the two was determined to benot significant (p>0.05). These preliminary resultscompare favorably with the other volunteer-professionaldata comparisons from the United States (USEPA,1990); the value of the correlation coefficient is likely toincrease with an increased sample size.
INTRODUCTION
Community-based monitoring of coralreefs is becoming a common practice incoastal-zone management plans (e.g. McManuset al., 1997; Smith, 1994 and Buhat, 1994).American volunteer water-monitoring efforts,many of which started in the mid-1980's, have asuccessful record of generating accurate andprecise data (USEPA, 1990).
A common criticism amongst theprofessionally trained scientific community isthat community-based volunteer monitoringprograms are incapable of providing accurateand useful results. In order to avoid suchpitfalls, it is necessary to create a thorough plandetailing: (1) what the communities needs are,(2) what data is necessary and (3) what tool to
use given time, equipment, education and skillconstraints.After a method has been selected the next itemsto be addressed include: how are the volunteersto be trained, the results presented, theprogram to be evaluated and data qualityassurance maintained. An evaluation of twocommunity-monitoring programs (NewHampshire Lakes Lay Monitoring Program andMassachusetts Acid Rain Monitoring Program)compared professional and communitygenerated data. The two programs hadcorrelation coefficients, r, of 0.94-0.99(USEPA, 1990). These high correlationcoefficients indicate the quality of communitygenerated data is comparable, if not equivalent,to the quality of professionally generated data.Therefore, if a community-monitoring programis properly planned, trained, supervised andevaluated, these data quality concerns can beaddressed.
The "Manta Tow" method is describedin detail by the English et al., 1994. The mantatow method was selected for community-basedreef monitoring because it fulfilled thefollowing requirements of the project:1) to establish baseline conditions where noprior data exists2) to determine qualitatively the percentage ofcoral cover and changes through time3) to increase community awareness of coralreef conditions and humans affect reefs.
T
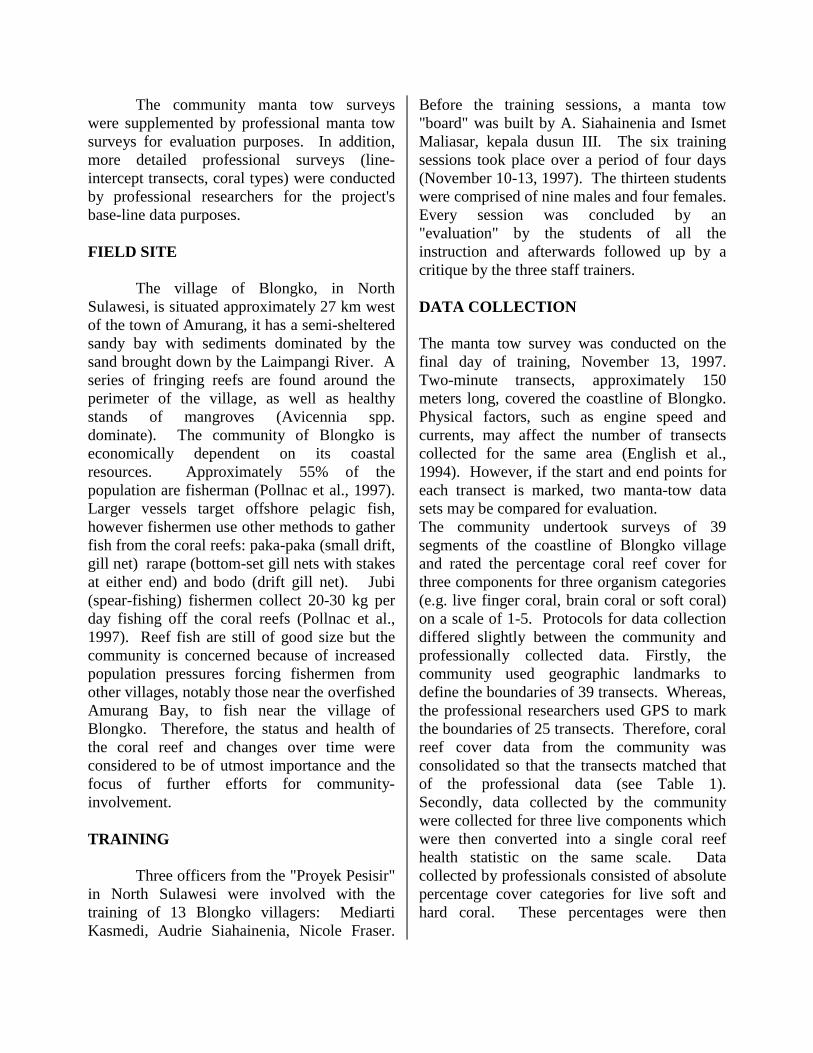
The community manta tow surveyswere supplemented by professional manta towsurveys for evaluation purposes. In addition,more detailed professional surveys (line-intercept transects, coral types) were conductedby professional researchers for the project'sbase-line data purposes.
FIELD SITE
The village of Blongko, in NorthSulawesi, is situated approximately 27 km westof the town of Amurang, it has a semi-shelteredsandy bay with sediments dominated by thesand brought down by the Laimpangi River. Aseries of fringing reefs are found around theperimeter of the village, as well as healthystands of mangroves (Avicennia spp.dominate). The community of Blongko iseconomically dependent on its coastalresources. Approximately 55% of thepopulation are fisherman (Pollnac et al., 1997).Larger vessels target offshore pelagic fish,however fishermen use other methods to gatherfish from the coral reefs: paka-paka (small drift,gill net) rarape (bottom-set gill nets with stakesat either end) and bodo (drift gill net). Jubi(spear-fishing) fishermen collect 20-30 kg perday fishing off the coral reefs (Pollnac et al.,1997). Reef fish are still of good size but thecommunity is concerned because of increasedpopulation pressures forcing fishermen fromother villages, notably those near the overfishedAmurang Bay, to fish near the village ofBlongko. Therefore, the status and health ofthe coral reef and changes over time wereconsidered to be of utmost importance and thefocus of further efforts for community-involvement.
TRAINING
Three officers from the "Proyek Pesisir"in North Sulawesi were involved with thetraining of 13 Blongko villagers: MediartiKasmedi, Audrie Siahainenia, Nicole Fraser.
Before the training sessions, a manta tow"board" was built by A. Siahainenia and IsmetMaliasar, kepala dusun III. The six trainingsessions took place over a period of four days(November 10-13, 1997). The thirteen studentswere comprised of nine males and four females.Every session was concluded by an"evaluation" by the students of all theinstruction and afterwards followed up by acritique by the three staff trainers.
DATA COLLECTION
The manta tow survey was conducted on thefinal day of training, November 13, 1997.Two-minute transects, approximately 150meters long, covered the coastline of Blongko.Physical factors, such as engine speed andcurrents, may affect the number of transectscollected for the same area (English et al.,1994). However, if the start and end points foreach transect is marked, two manta-tow datasets may be compared for evaluation.The community undertook surveys of 39segments of the coastline of Blongko villageand rated the percentage coral reef cover forthree components for three organism categories(e.g. live finger coral, brain coral or soft coral)on a scale of 1-5. Protocols for data collectiondiffered slightly between the community andprofessionally collected data. Firstly, thecommunity used geographic landmarks todefine the boundaries of 39 transects. Whereas,the professional researchers used GPS to markthe boundaries of 25 transects. Therefore, coralreef cover data from the community wasconsolidated so that the transects matched thatof the professional data (see Table 1).Secondly, data collected by the communitywere collected for three live components whichwere then converted into a single coral reefhealth statistic on the same scale. Datacollected by professionals consisted of absolutepercentage cover categories for live soft andhard coral. These percentages were then
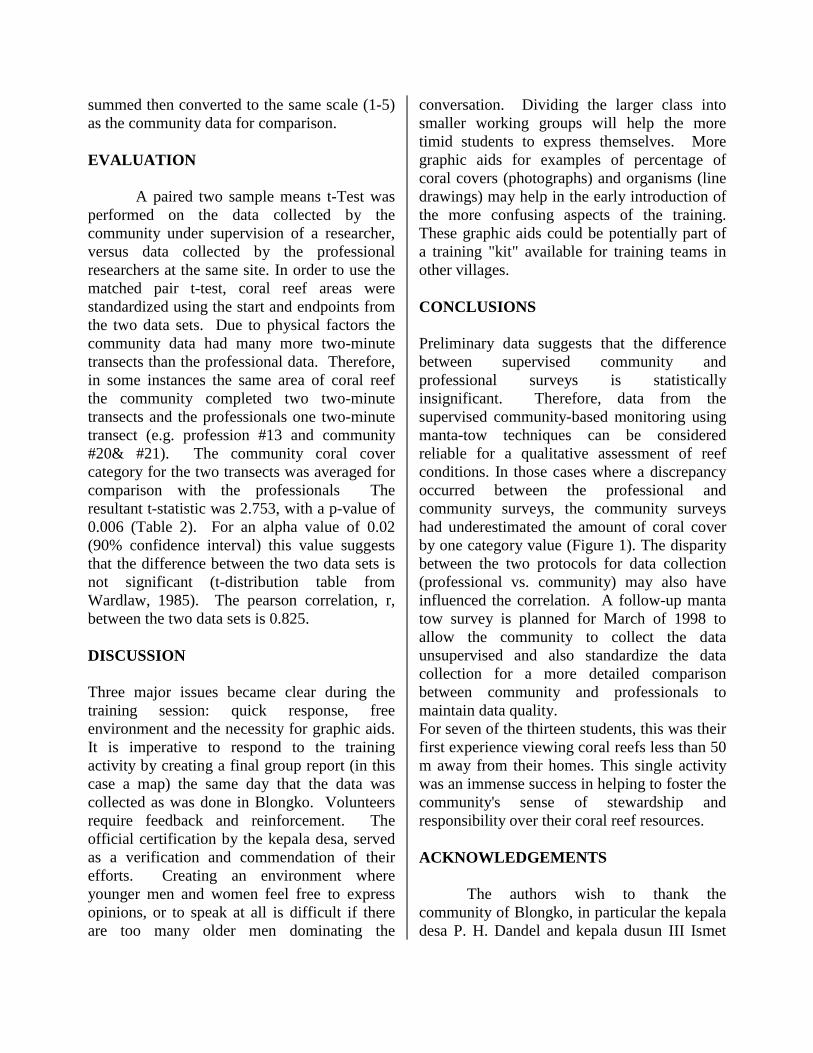
summed then converted to the same scale (1-5)as the community data for comparison.
EVALUATION
A paired two sample means t-Test wasperformed on the data collected by thecommunity under supervision of a researcher,versus data collected by the professionalresearchers at the same site. In order to use thematched pair t-test, coral reef areas werestandardized using the start and endpoints fromthe two data sets. Due to physical factors thecommunity data had many more two-minutetransects than the professional data. Therefore,in some instances the same area of coral reefthe community completed two two-minutetransects and the professionals one two-minutetransect (e.g. profession #13 and community#20& #21). The community coral covercategory for the two transects was averaged forcomparison with the professionals Theresultant t-statistic was 2.753, with a p-value of0.006 (Table 2). For an alpha value of 0.02(90% confidence interval) this value suggeststhat the difference between the two data sets isnot significant (t-distribution table fromWardlaw, 1985). The pearson correlation, r,between the two data sets is 0.825.
DISCUSSION
Three major issues became clear during thetraining session: quick response, freeenvironment and the necessity for graphic aids.It is imperative to respond to the trainingactivity by creating a final group report (in thiscase a map) the same day that the data wascollected as was done in Blongko. Volunteersrequire feedback and reinforcement. Theofficial certification by the kepala desa, servedas a verification and commendation of theirefforts. Creating an environment whereyounger men and women feel free to expressopinions, or to speak at all is difficult if thereare too many older men dominating the
conversation. Dividing the larger class intosmaller working groups will help the moretimid students to express themselves. Moregraphic aids for examples of percentage ofcoral covers (photographs) and organisms (linedrawings) may help in the early introduction ofthe more confusing aspects of the training.These graphic aids could be potentially part ofa training "kit" available for training teams inother villages.
CONCLUSIONS
Preliminary data suggests that the differencebetween supervised community andprofessional surveys is statisticallyinsignificant. Therefore, data from thesupervised community-based monitoring usingmanta-tow techniques can be consideredreliable for a qualitative assessment of reefconditions. In those cases where a discrepancyoccurred between the professional andcommunity surveys, the community surveyshad underestimated the amount of coral coverby one category value (Figure 1). The disparitybetween the two protocols for data collection(professional vs. community) may also haveinfluenced the correlation. A follow-up mantatow survey is planned for March of 1998 toallow the community to collect the dataunsupervised and also standardize the datacollection for a more detailed comparisonbetween community and professionals tomaintain data quality.For seven of the thirteen students, this was theirfirst experience viewing coral reefs less than 50m away from their homes. This single activitywas an immense success in helping to foster thecommunity's sense of stewardship andresponsibility over their coral reef resources.
ACKNOWLEDGEMENTS
The authors wish to thank thecommunity of Blongko, in particular the kepaladesa P. H. Dandel and kepala dusun III Ismet
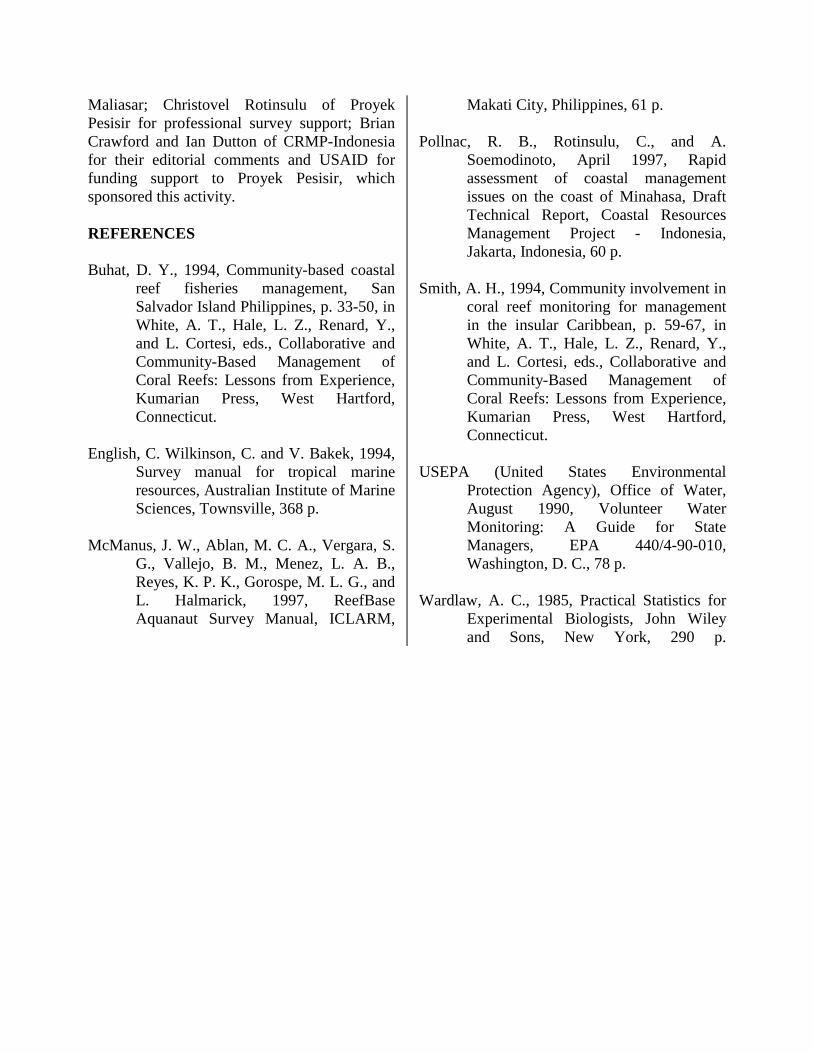
Maliasar; Christovel Rotinsulu of ProyekPesisir for professional survey support; BrianCrawford and Ian Dutton of CRMP-Indonesiafor their editorial comments and USAID forfunding support to Proyek Pesisir, whichsponsored this activity.
REFERENCES
Buhat, D. Y., 1994, Community-based coastalreef fisheries management, SanSalvador Island Philippines, p. 33-50, inWhite, A. T., Hale, L. Z., Renard, Y.,and L. Cortesi, eds., Collaborative andCommunity-Based Management ofCoral Reefs: Lessons from Experience,Kumarian Press, West Hartford,Connecticut.
English, C. Wilkinson, C. and V. Bakek, 1994,Survey manual for tropical marineresources, Australian Institute of MarineSciences, Townsville, 368 p.
McManus, J. W., Ablan, M. C. A., Vergara, S.G., Vallejo, B. M., Menez, L. A. B.,Reyes, K. P. K., Gorospe, M. L. G., andL. Halmarick, 1997, ReefBaseAquanaut Survey Manual, ICLARM,
Makati City, Philippines, 61 p.
Pollnac, R. B., Rotinsulu, C., and A.Soemodinoto, April 1997, Rapidassessment of coastal managementissues on the coast of Minahasa, DraftTechnical Report, Coastal ResourcesManagement Project - Indonesia,Jakarta, Indonesia, 60 p.
Smith, A. H., 1994, Community involvement incoral reef monitoring for managementin the insular Caribbean, p. 59-67, inWhite, A. T., Hale, L. Z., Renard, Y.,and L. Cortesi, eds., Collaborative andCommunity-Based Management ofCoral Reefs: Lessons from Experience,Kumarian Press, West Hartford,Connecticut.
USEPA (United States EnvironmentalProtection Agency), Office of Water,August 1990, Volunteer WaterMonitoring: A Guide for StateManagers, EPA 440/4-90-010,Washington, D. C., 78 p.
Wardlaw, A. C., 1985, Practical Statistics forExperimental Biologists, John Wileyand Sons, New York, 290 p.
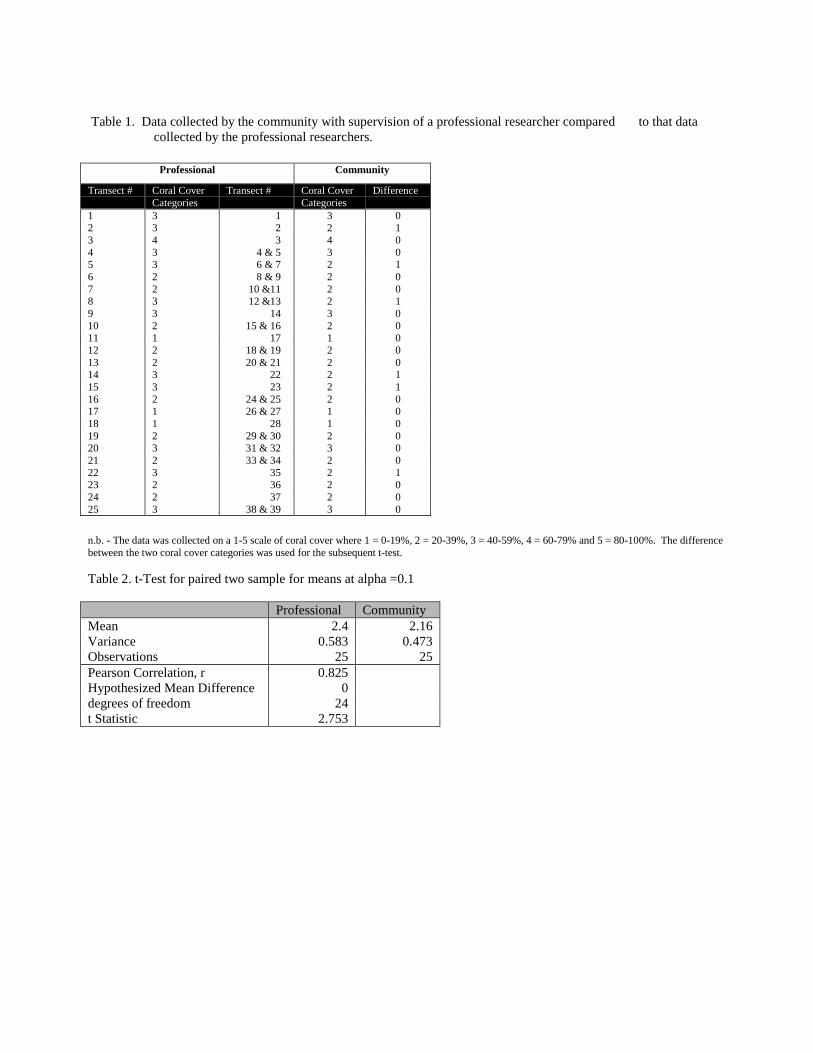
Table 1. Data collected by the community with supervision of a professional researcher compared to that datacollected by the professional researchers.
Professional Community
Transect # Coral CoverCategories
Transect # Coral CoverCategories
Difference
1 3 1 3 02 3 2 2 13 4 3 4 04 3 4 & 5 3 05 3 6 & 7 2 16 2 8 & 9 2 07 2 10 &11 2 08 3 12 &13 2 19 3 14 3 010 2 15 & 16 2 011 1 17 1 012 2 18 & 19 2 013 2 20 & 21 2 014 3 22 2 115 3 23 2 116 2 24 & 25 2 017 1 26 & 27 1 018 1 28 1 019 2 29 & 30 2 020 3 31 & 32 3 021 2 33 & 34 2 022 3 35 2 123 2 36 2 024 2 37 2 025 3 38 & 39 3 0
n.b. - The data was collected on a 1-5 scale of coral cover where 1 = 0-19%, 2 = 20-39%, 3 = 40-59%, 4 = 60-79% and 5 = 80-100%. The differencebetween the two coral cover categories was used for the subsequent t-test.
Table 2. t-Test for paired two sample for means at alpha =0.1
Professional CommunityMean 2.4 2.16Variance 0.583 0.473Observations 25 25Pearson Correlation, r 0.825Hypothesized Mean Difference 0degrees of freedom 24t Statistic 2.753
BOOK REVIEWJohn R. Clark (1996) Coastal Zone Management Handbook, Lewis/CRC Press,Boca Raton, Florida, 694pp. ISBN: 1-56670-092-2, RRP US$89.95
ohn Clark is a legendary figure in the field of coastal management. His career incoastal zone management (CZM) spans nearly five decades during which he haspioneered many of the CZM concepts and practices which are now gainingincreasing attention globally and in Indonesia. He is especially familiar with the
Indonesian context for coastal management through his work (since 1992) on the BaliBeach Conservation project; work which is continuing at the present time.
He has authored some 26 books, and been a major contributor to numerous otherpublications including the recently published “Ecology of the Indonesian Seas” alsoreviewed in this journal. His works have become seminal reference sources forgenerations of coastal zone managers, particularly because his writings have areputation for clarity, organisation and comprehensiveness.
This most recent publication is no exception. Clearly defined as a reference book in theclassic sense, it is organised into four main parts: (1) concepts, problems and approaches tocoastal zone management which form a ‘blueprint’ for integrated coastal managementprograms, (2) some 46 specific management approaches to deal with a very wide range ofcoastal management issues, (3) a general compilation of information about coastal planningand management presented as 110 individual sections, and (4) some 47 case studies of globalcoastal management programs (including a case studies of projects in Bali, Java andSulawesi) which feature contributions from various global experts in CZM.
The encyclopaedic nature of the work may daunt Indonesian readers (and manynative English readers also), but has two ‘saving graces’. Firstly, the work is a ‘one-stop shop’; novice coastal managers need look no further for a single introductoryreference text which will have at least something of relevance to their topic of interest.Secondly, the text is made more readable by both numerous figures and photographsand by the careful division of text into easy-to-find ‘mini-bites’.
While one could quibble about the relevance of some sections of the work andthere is some inevitable repetition of concepts, clearly this is a landmark book and onewhich shall long stand as a benchmark reference in the field of coastal management.Every university teaching CZM-related courses, every government agency beginningCZM programs and every research organisation supplying information to decision-makers on CZM issues in Indonesia should have a copy. For other potential audiences(such as students), you may care to wait for the summary version which John iscurrently preparing - it will be printed.
Ian DuttonCRC/URIProyek PesisirJakartaIn 1998
J
RESENSI BUKUJohn R. Clark (1996) Coastal Zone Management Handbook, Lewis/CRC Press,Boca Raton, Florida, 694pp. ISBN: 1-56670-092-2, RRP US$89.95
ohn Clark adalah seorang tokoh legendaris dalam bidang pengelolaan kawasanpesisir. Dalam pengalamannya selama hampir lima dasawarsa, ia memeloporibanyak konsep dan praktek CZM yang semakin mendapat pengakuan secaraglobal dan di Indonesia. Ia mengenal baik bidang pengelolaan pesisir dalam
konteks Indonesia. Hal ini terutama dimungkinkan karena tugasnya dengan BaliBeach Conservation project sejak 1992 hingga saat ini. John Clark telah menulis 26buku serta menjadi kontributor utama sejumlah penerbitan lainnya, termasuk Ecologyof the Indonesian Seas yang baru saja muncul (dan dianalisa juga dalam jurnal ini).Karyanya merupakan sumber referensi penting bagi pengelola wilayah pesisir, karenatulisan-tulisannya itu mempunyai reputasi baik, karena jelas, teratur dan lengkap.
Karyanya yang terakhir ini juga termasuk kategori yang demikian. Digolongkansecara tepat sebagai buku referensi klasik, isinya terbagi dalam empat bagian utamayang mengandung: (1) konsep, masalah dan pendekatan terhadap manajemen zonapesisir yang menjadi satu pola dasar bagi program pengelolaan daerah pesisir yangterpadu, (2) daftar dari 46 pendekatan manajemen yang spesifik untuk menggarapserangkaian masalah-masalah pengelolaan daerah pesisir, (3) informasi umummengenai perencanaan dan pengelolaan wilayah pesisir pantai yang dirangkumsebagai 110 bagian tersendiri, dan (4) sekitar 47 kasus studi mengenai program-program manajemen pesisir di seluruh dunia (termasuk studi sejumlah proyek-proyekdi Bali, Jawa dan Sulawesi) yang menampilkan sumbangan karya tulis berbagai pakarglobal mengenai CZM.
Karena buku ini berbentuk ensiklopedia, hal itu mungkin agak menyulitkansebagian pembaca, namun buku ini memiliki dua kekuatan utama. Pertama, karya inibagaikan sebuah toko serba ada; pengelola pesisir yang masih awampun cukupmemakai satu buku ini saja untuk menemukan referensi awal yang penting, lagipulabuku ini mengandung bahan-bahan yang relevan dalam bidangnya. Kedua, naskahnyadibuat sangat efisien untuk dibaca dengan adanya cukup banyak grafik dan foto, sertanaskahnya disusun secara teliti kedalam bab-bab kecil yang mudah ditemukan.
Meskipun beberapa pakar tertentu mungkin mempersoalkan relevansi sebagiandari buku ini, serta pengulangan kembali beberapa konsep (yang tak dapatdihindarkan), secara jelas buku penting ini akan berfungsi sebagai referensi dasarutama dibidang manajemen daerah pesisir, antara lain universitas yang hendakmengajarkan mata kuliah CZM dan seluk-beluknya, setiap instansi pemerintah yangmengawali program CZM-nya, dan setiap organisasi riset yang memasok informasibagi para pembuat keputusan mengenal hal-hal CZM di Indonesia sebaiknya memilikibuku tersebut. Pembaca potensial lainnya (misalnya mahasiswa), dapat menungguditerbitkannya edisi ringkas yang sedang disusun oleh John. Buku tersebut akan keluartahun 1998.
Ian DuttonCRC/URIProyek PesisirJakartaIn 1998
J
BOOK REVIEWTomas Tomascik, Annmarie Janice Mah, Anugerah Nontji and Mohammad Kasim Moosa (1997) TheEcology of the Indonesian Seas, Periplus Editions, Singapore, Part One: ISBN 962-593-078-7, 1-642 + xivand Part Two: ISBN 962-593-163-5, 643-1388 + vi, RRP Rp170,000.
The long awaited ‘wet’ additions to the Ecology of Indonesia series, published under the EMDI(Environmental Management in Indonesia) program of CIDA (Canadian International Development Agency) inpartnership with the Ministry of Environment of the Government of Indonesia, arrived in the bookstores ofJakarta in late 1997. That they have been well worth waiting for is clearly evidenced by the difficulty whichmany of us have experienced when we returned to those stores to obtain second or third copies as gifts during therecent festive season - “I’m sorry sir, but you will have to wait until new stocks arrive” is a frequent response ofbookstore employees who are intrigued why anyone could possibly want to buy two books which look more likedoor stops than a good read !
As anyone who has endured the experience of trying to locate, compile or otherwise utilise information onthe marine and coastal resources of Indonesia will appreciate, these books are much, much more than a goodread. They are indispensable guides to the treasure house of Indonesia’s marine estate. They are also one of thefinest compilations of the state of knowledge of any subject I have ever had the privilege to read. The fact thatboth volumes are of direct and immediate relevance to the rapidly emerging national interest in coastal andmarine resources management thus makes them an essential addition to the shelves of anyone in Indonesia whoshares that interest.
The four distinguished authors and other expert contributors, under the leadership of Dr Tomascik haveproduced a book which, by virtue of the range of subject matter addressed and the detail provided on eachsubject, had to be divided into two parts, but are in reality, an indivisible whole. Part One begins with anintroduction to the geology and oceanography of Indonesia’s seas before moving on to a series of chapters oncoral reefs and the environmental factors which sustain them. The emphasis of much of the book on coral reefsis appropriate in view of Indonesia’s pre-eminent position as a global centre for marine biodiversity and theircurrent parlous state due to ignorance, over-exploitation and lack of management attention. It is especiallyappropriate that such a comprehensive analysis of the world’s most diverse and extensive reefs first appeared inthe International Year of the Coral Reef (1997).
The second part of the book begins with further reviews of specific reef types (fringing, patch, barrier andcays) and then diversifies into reviews of seagrass, mangrove and pelagic systems. The book concludes with acogent and timely analysis of threats to marine and coastal resources, integrated coastal zone management needsand possible approaches.
Throughout the book, numerous case studies (in short highlight boxes), beautifully drawn maps anddiagrams and numerous photographs (including colour plates) help to break up the voluminous text. Findingmaterial on specific subjects and locations is aided by a comprehensive index and the comprehensivebibliography (some 88 pages of references) provides a well-organised guide to additional information sources.
Despite the obvious efforts of the writers to express many of the more complex concepts as simply andclearly as possible, non native english speaking readers, and especially non scientists will find much of the textof this book ‘hard going’. It is to be hoped that academicians, researchers and managers will collaborate to buildon this work and to make its vast store of knowledge more readily available to decision-makers, resource users(including developers) and the Indonesian coastal communities whose lives depend on maintaining healthy seas.This work will then have achieved its truly remarkable potential.
Ian DuttonCRC/URIProyek PesisirJakarta
RESENSI BUKUTomas Tomascik, Annmarie Janice Mah, Anugerah Nontji dan Muhammad Kasim Moosa (1997). TheEcology of the Indonesia Seas, Periplus Editions, Singapore, Part One: ISBN 962-593-078-7, 1-642 + xivand Part Two: ISBN 962-593-163-5, 643-1388 + vi, RRP Rp. 170.000.
"Bagian basah" yang telah lama ditunggu dari seri Ecology of Indonesia, diterbitkan oleh programManajemen Lingkungan di Indonesia (EMDI) dibawah pengelolaan Canadian International DevelopmentAgency (CIDA) yang bekerjasama dengan kantor Menteri Negara Lingkungan Hidup dari Pemerintah R.I. Bukuini mulai muncul di toko-toko buku di Jakarta pada akhir 1997. Bahwa jilid-jilid tersebut cukup laris dan baikmutunya telah dibuktikan oleh pengalaman saya ketika kembali mengunjungi toko-toko yang sama untukmendapatkan beberapa buah buku tambahan sebagai kado Hari Raya Natal baru-baru ini. Persediaan bukutersebut sering habis di toko buku.
Sebagaimana sering dialami oleh orang yang berusaha mencari, menyusun ataupun menggunakan informasitentang sumber daya alam kelautan dan daerah pesisir di Indonesia, buku-buku tersebut jauh lebih berhargadaripada tampak luarnya yang seakan-akan hanya hiasan rak buku saja. Jilid-jilid ini merupakan panduan pentingyang tak dapat diabaikan mengenai khazanah alam kelautan Indonesia. Buku-buku tersebut juga adalah salahsatu rangkuman terbaik mengenai sains yang telah terkumpul dari topik manapun yang sempat saya baca selamaini. Fakta bahwa kedua penerbitan itu secara langsung relevan terhadap perhatian nasional yang tertuang dalambidang sumber daya kelautan dan pesisir akhir-akhir ini, menjadikannya esensial bagi kepustakaan orangsiapapun di Indonesia yang mempunyai minat dibidang tersebut.
Keempat pengarang serta berbagai penyumbang lainnya, dibawah pimpinan langsung Dr. Tomascik, telahmenghasilkan sebuah karya yang oleh karena luasnya bidang yang dicakup serta rincian mendetail setiaptopiknya, terpaksa disusun menjadi dua buku terpisah, namun yang sebenarnya merupakan suatu kesatuan.
Bagian Pertama diawali oleh sebuah pendahuluan mengenai geografi dan oseanografi dari peranan laut diIndonesia, sebelum pembahasan tentang terumbu-terumbu karang serta faktor lingkungan. Perhatian terhadapterumbu karang di bagian buku ini sangat tepat mengingat kedudukan Indonesia sangat khusus yaitu sebagaipusat biodiversitas global kelautan dan keadaannya yang sekarang cukup kritis akibat kurang pengetahuan,eksploitasi berlebihan dan langkanya keterampilan manajemen. Sangat tidak tepat jika analisis lengkap mengenaiterumbu-terumbu karang yang paling beraneka ragam dan luas ini muncul pada saat Tahun InternasionalTerumbu Karang (1997) sedang berlangsung.
Bagian Kedua dari buku ini dimulai dengan analisis lanjutan dari tipe-tipe terumbu karang (fringing, patch,barrier serta cays) dan kemudian terbagi dalam beberapa tinjauan mengenai rumput laut, tumbuhan bakau dansistim pelagis. Buku ini diakhiri dengan sebuah analisis yang cukup meyakinkan serta tepat waktu akanancaman-ancaman terhadap sumber daya alam laut dan pesisir, kebutuhan-kebutuhan manajemen zona pesisiryang terpadu, dan tindakan-tindakan yang mungkin dapat dilaksanakan manusia.
Secara keseluruhan, banyaknya kasus studi (dalam kotak-kotak skema yang diarsir), peta dan diagram yangindah serta foto-foto dalam jumlah yang banyak (termasuk foto berwarna) membantu meringankan sifat monotonteks tebal itu. Jika kita hendak mencari bahan mengenai topik dan lokasi tertentu, tersedia indeks yangkomprehensif serta sebuah bibliografinya yang lengkap (kira-kira 88 halaman referensi) sebagai panduan.
Kendati para penulis dengan lugas berusaha mengutarakan konsep-konsep yang kompleks secara jelas danringkas, pembaca yang tidak berbahasa Inggris, khususnya mereka di bidang non-akademis akan mendapatkanbuku ini sukar untuk dimengerti. Para sarjana, ahli riset dan manajer akan bekerjasama sangat diharapkan dapatmengembangkan isi dari buku ini dan menjadikan buku ini sebagai gudang informasi bagi para pembuatkeputusan, pemakai sumber alam (termasuk pengembang) dan masyarakat pantai Indonesia yangpenghidupannya tergantung dari adanya lingkungan laut yang sehat. Selamat membaca. Saya kira buku-bukutersebut sangat mengesankan isinya.
Ian DuttonCRC/URIProyek PesisirJakarta
Publication
Assessment and monitoring of climaticchange impacts on mangrove ecosystem.1994. UNEP Regional Seas Reports andStudies no. 154.
Mangrove Ecology Workshop Manual.C. Feller (ed.). Smithsonian EnvironmantalResearch Center.
Mangrove Forest ManagementGuidelines. 1993. FAO, Rome.
The Mangrove of Zanzibar. 1996. J.P.Shanula and A. Whittick. Institute ofMarine Sciences, USDM. 65 pages.Describe flora, ecosystem, uses for the non-specialist. ISBN 0-88901-308.
Tropical Mangrove Ecosystems. 1992. D.Alongi and Robertson (eds.). 336 pages.Avalaible from the American GeophysicalUnion, the book is founded on the workdone on Hinchinbrook Island and elsewherein the tropics of Notheastern Australia.Contact: AGU-Orders, 2000 Florida AvenueNW, USA. Tel: 1-800-966-2481 (NorthAmerica) or 1-202-462-6900 (elsewhere).FAX: 1-202-328-0566. E-mail:[email protected]. WebSite:http://earth.agu.org/pubs/.List-$37.00;AGUmember-$25.90.
Available from ISME:
Conservation and Sustanaible Utilisationof Mangrove Forests in the Latin Americaand Africa Regions. Part 1. LatinAmerica. 1993. L.C. Lacerda. (ed.).Mangrove Ecosystems Technical Reports,Vol. 2, ISME/ITTO. 272 pages. Out of print.
For ISME titles contact: ISME, c/o Collegeof Agriculture, University of the Ryukyus,
Nishihara, Okinawa 903-01, Japan. FAX:(81) 98-895-6602
Available from the IUCN:
Ecology and Management of Mangroves.1993. Aksornkoae, IUCN, Bangkok,Thailand. 176 pages.
Mangroves of the Sundarbans. 1994. Vol.1 India. A>B> Chaudhuri and A.Choudhury, IUCN, Bangkok, Thailand.
Manuel de Formation a la Gestion desZones Humides Tropicales. 1994. J.Skinner, N. Beaumond and J.Y. Pirot. 272pages. This book is a training manual forwetlands managers, based on West AfricanExperiences. IUCN Publications. Uk pounds13.50;US$20.00
For IUCN titles contact: IUCN PublicationServices Unit, 219c Huntingdon Road,Cambridge CB3 ODL, United Kingdom.Tel. 44 1223 277894. FAX. 44 1223277175. E-Mail: [email protected].
Periodicals
Indonesian Journal of Fishery andAquatic Sciences. Contact: Dr. Dietriech G.Bengen, Department of Living AquaticResources Management, Faculty ofFisheries, Bogor Agricultural University.Tel: 62-251-622938. Email:[email protected]
Indonesian Journal of Coastal andMarine Resources Management. Contact:Dr. Dietriech G. Bengen, Marine CenterBuilding 4th Floor, Center for Coastal andMarine Resources Studies, Faculty ofFisheries, Kampus IPB Darmaga, BogorAgricultural University. PO BOX 258 Tel:62-251-626380. Fax: 62-251-621086 Email:[email protected]
Mangroves and Salt Marshes. A newinternational journal concerned with theinterdisciplinary science and management oftidal wetlands; it will cover pure and appliedsciences and include studies on siltation,fisheries, forestry, aquaculture and thesustanaible use of mangroves and salt-marshes. Contact: Daniel Childers,Associate Editor, Southeast EnvironmentalReseach Program, OE 148 University Park,Miami, Florida 33199. Tel. (1) 305-348-3095; FAX (1) 305-348-4096
Conference
April 6-9. International Conference onthe Biology of Coastal Environments.Bahrain. Contact: Dr. Jameel Abbas, Dept.of Biology, College of Science, Universityof Bahrain. E-mail:[email protected]. One of the mainthemes is mangroves.
May 5-7. Annual Meeting, PasificNorthwest Chapter Society of WelandScientists. Corvallis, Oregon. Contact:Emily Roth, NRCS, Portland, Oregon. Tel:503-235-6272.
May 15-16. 24th Annual Conference onEcosystems Restoration and Creation.Tampa, Florida. Contact: Frederick J.Webb, Dean of Environmental Programs,Hillsborough Community College, PlantCity Campus, 1206 N. Park Rd., Plant City,FL 33566 USA. Tel: 813-757-2104. E-mail:[email protected].
May 21-23. 1st International Conferenceon Sustanaible Tourism in Vietnam. Hue,Vietnam. Russell Arthur Smith,Coordinator, Vietnam TourismDevelopment Program, Hanns SeidelFoundation & Nanyang TechnologicalUniversity. Tel: +65 799 4836. FAX: +65791 3697. E-mail:[email protected]:http://edge.tamu.edu/waves97/.
June 2-6. Coastline ’97: ConnectingEuropean and Mediterranean Coasts. 6th
EUCC International Conference. Naples,Italy. Contact: Dr Giovanni Randazzo,Instituto di Scienze della Terra, Université diMessina, Salita Sperone, 31-C.P.24, 98166– S. Agata di Messina, Italy. Tel. +39 906765095. FAX: +39 90 392333. E-mail:[email protected].
July 7-9. Air-Sea-Land InteractionProcesses in Estuaries. Melbourne,Australia. Contact: M. Cintia Piccolo andGerardo M. E. Perillo, Instituto Argentinode Oceanografia, Av. Alem 53, 8000 BahiaBalanca, Argentina. Tel. (54-91)23555/20254/558431. FAX (54-91) 88-3933/20254.
August 5-8. U.S.-China Conference on theEnvironment. Beijing. Contact: GlobalInteractions Inc., 14 West Cheryl Drive,Phoenix, AZ 85021-2481. Tel:602-943-3922. FAX: 602-943-4458. E-mail:[email protected]. Web Site:http://www.goodnet.com/ global
Guidelines to Authors
anuscripts format. Manuscripts should contain a cover page that includes the title, the name(s) of theauthor(s) and their addres(es). Each research paper, note and review article should have an abstract of notmore than 300 words. For manuscripts written in Bahasa Indonesia, it must have an abstract in both
Bahasa Indonesia and English. The abstract should state concisely the purpose of the paper, procedures followed,significant findings and major conclusions. Research papers must submitted according to the following format:Introduction, Material and Methods, Results, Discussion, References and Appendix (if required). Research notesshould combine Results and Discussion sections, whilst all other forms of manuscript should list references at theend of the text.Manuscript should be typed in Word Perfect (ver. 5.1 or later version) or Microsoft Word (ver. 5.0 or later version),used Times New Roman font type size 12, double-spaced, with margins 2.5 cm on A4 size paper. The right marginshould not be justified and words to be printed in Italics should be underlined. Metric measurements should alwaysbe given, or where in appropriates the metric equivalents given in parentheses. All pages including tables should benumbered. Footnotes should be avoided and bound manuscripts will not be accepted.
Citations and References. Within the text, citation should be cited by author(s) and date in parenthesis asfollows: (Bengen and Widinugraheni, 1995; Dartnall and Jones, 1986; Kenchington, 1978). For references citedwith three or more authors “et al.” should always be used.
Unpublished studies may be referred to as personal communications giving the name and short address e.g.(Darmawan, PKSPL- PB, and personal communication). It is the author’s responsibility to obtain permission fromthe colleague whose work is cited in this way.
References should be listed in alphabetical order. The names of all authors and the full title of the paper mustbe supplied together with the years, volume and first and last pages.
If publication is in press, the reference should be cited as completely as possible and then by including (inpress).
Examples of acceptable referencing format to the journal are provided below:
Bengen, D. G. and P. Widinugraheni, 1995. Sebaran Spasial Karang dan Asosiasinya dengan Karakteristik Habitatdi Pantai Blebu dan Pulau Sekepal, Lampung Selatan. Prosiding Seminar Nasional Pengelolaan TerumbuKarang Jakarta, 10 - 12 Oktober 1995 : 81 - 95.
Dartnall, A.J. and M. Jones (eds) 1986. A Manual Survey Methods, Living Resources in Coastal Areas.Australia Institute Marine Science, Townsville.
Kenchington, R. A. 1978. Visual Survey of Large Areas of Coral Reefs. In D. R. Stoddart and R. E. Johannes(eds). Coral Reefs: Research Methods. UNESCO, Paris.
Tables. Tables are to be compiled on separate sheets. Tables are numbered consecutively. A title should beprovided for each table and they should be referred to in the text.
Illustrations. Graphs, photographs, maps, etc will be designed as figures. All illustrations should similarly benumbered consecutively and referred to in the text. Each should be identified by the fig number, author, andabriviated title on the back. Poor contrast graphics will not be accepted Photographs should be in glossy print. Thesize of the lettering being appropriate to that of the illustration size, but taking into account the possible need for re-duction in size (up to 50 %).
Proofs. Only one set of proofs will be sent to the main authors, showing the final layout of the paper, as it willappear in the journal. Proof corrections must be limited to typographical errors. Corrected proofs should be returnedto the Editor within (7) days of being received by author.
Offprints. Ten offprints of each paper will be provided free of charge. Additional copies may be purchased onan “offprint order form” which will accompany the proofs.
M
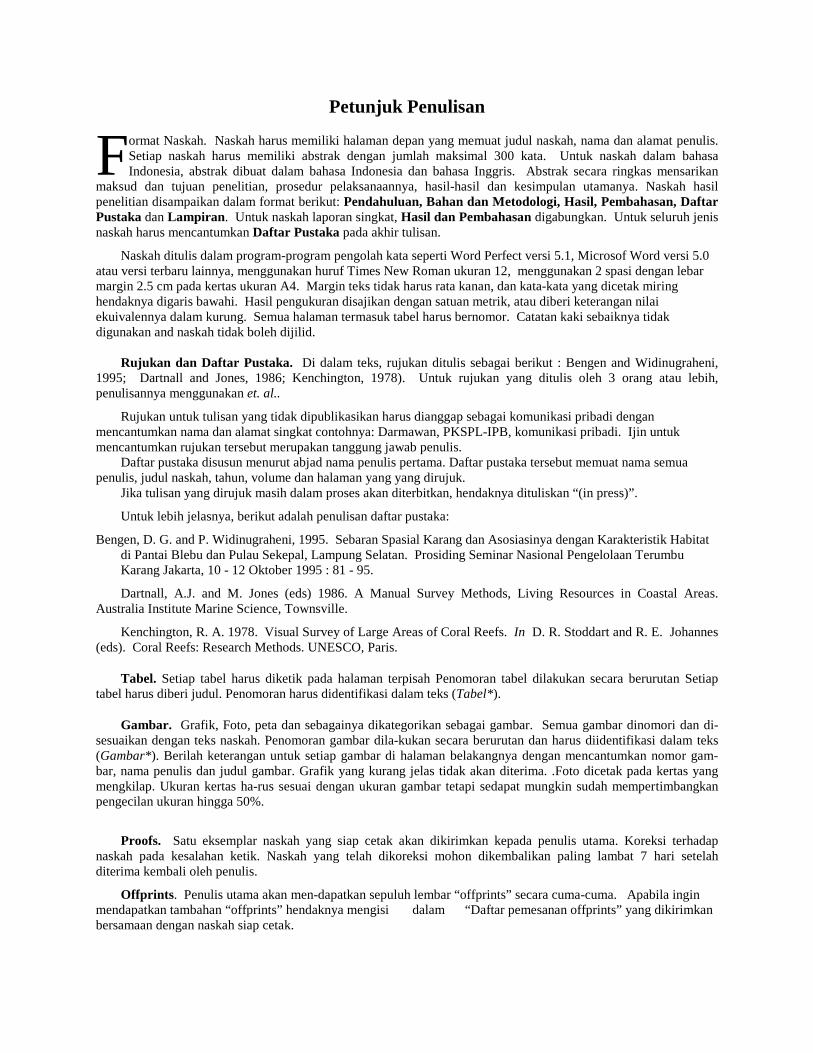
Petunjuk Penulisan
ormat Naskah. Naskah harus memiliki halaman depan yang memuat judul naskah, nama dan alamat penulis.Setiap naskah harus memiliki abstrak dengan jumlah maksimal 300 kata. Untuk naskah dalam bahasaIndonesia, abstrak dibuat dalam bahasa Indonesia dan bahasa Inggris. Abstrak secara ringkas mensarikan
maksud dan tujuan penelitian, prosedur pelaksanaannya, hasil-hasil dan kesimpulan utamanya. Naskah hasilpenelitian disampaikan dalam format berikut: Pendahuluan, Bahan dan Metodologi, Hasil, Pembahasan, DaftarPustaka dan Lampiran. Untuk naskah laporan singkat, Hasil dan Pembahasan digabungkan. Untuk seluruh jenisnaskah harus mencantumkan Daftar Pustaka pada akhir tulisan.
Naskah ditulis dalam program-program pengolah kata seperti Word Perfect versi 5.1, Microsof Word versi 5.0atau versi terbaru lainnya, menggunakan huruf Times New Roman ukuran 12, menggunakan 2 spasi dengan lebarmargin 2.5 cm pada kertas ukuran A4. Margin teks tidak harus rata kanan, dan kata-kata yang dicetak miringhendaknya digaris bawahi. Hasil pengukuran disajikan dengan satuan metrik, atau diberi keterangan nilaiekuivalennya dalam kurung. Semua halaman termasuk tabel harus bernomor. Catatan kaki sebaiknya tidakdigunakan and naskah tidak boleh dijilid.
Rujukan dan Daftar Pustaka. Di dalam teks, rujukan ditulis sebagai berikut : Bengen and Widinugraheni,1995; Dartnall and Jones, 1986; Kenchington, 1978). Untuk rujukan yang ditulis oleh 3 orang atau lebih,penulisannya menggunakan et. al..
Rujukan untuk tulisan yang tidak dipublikasikan harus dianggap sebagai komunikasi pribadi denganmencantumkan nama dan alamat singkat contohnya: Darmawan, PKSPL-IPB, komunikasi pribadi. Ijin untukmencantumkan rujukan tersebut merupakan tanggung jawab penulis.
Daftar pustaka disusun menurut abjad nama penulis pertama. Daftar pustaka tersebut memuat nama semuapenulis, judul naskah, tahun, volume dan halaman yang yang dirujuk.
Jika tulisan yang dirujuk masih dalam proses akan diterbitkan, hendaknya dituliskan “(in press)”.
Untuk lebih jelasnya, berikut adalah penulisan daftar pustaka:
Bengen, D. G. and P. Widinugraheni, 1995. Sebaran Spasial Karang dan Asosiasinya dengan Karakteristik Habitatdi Pantai Blebu dan Pulau Sekepal, Lampung Selatan. Prosiding Seminar Nasional Pengelolaan TerumbuKarang Jakarta, 10 - 12 Oktober 1995 : 81 - 95.
Dartnall, A.J. and M. Jones (eds) 1986. A Manual Survey Methods, Living Resources in Coastal Areas.Australia Institute Marine Science, Townsville.
Kenchington, R. A. 1978. Visual Survey of Large Areas of Coral Reefs. In D. R. Stoddart and R. E. Johannes(eds). Coral Reefs: Research Methods. UNESCO, Paris.
Tabel. Setiap tabel harus diketik pada halaman terpisah Penomoran tabel dilakukan secara berurutan Setiaptabel harus diberi judul. Penomoran harus didentifikasi dalam teks (Tabel*).
Gambar. Grafik, Foto, peta dan sebagainya dikategorikan sebagai gambar. Semua gambar dinomori dan di-sesuaikan dengan teks naskah. Penomoran gambar dila-kukan secara berurutan dan harus diidentifikasi dalam teks(Gambar*). Berilah keterangan untuk setiap gambar di halaman belakangnya dengan mencantumkan nomor gam-bar, nama penulis dan judul gambar. Grafik yang kurang jelas tidak akan diterima. .Foto dicetak pada kertas yangmengkilap. Ukuran kertas ha-rus sesuai dengan ukuran gambar tetapi sedapat mungkin sudah mempertimbangkanpengecilan ukuran hingga 50%.
Proofs. Satu eksemplar naskah yang siap cetak akan dikirimkan kepada penulis utama. Koreksi terhadapnaskah pada kesalahan ketik. Naskah yang telah dikoreksi mohon dikembalikan paling lambat 7 hari setelahditerima kembali oleh penulis.
Offprints. Penulis utama akan men-dapatkan sepuluh lembar “offprints” secara cuma-cuma. Apabila inginmendapatkan tambahan “offprints” hendaknya mengisi dalam “Daftar pemesanan offprints” yang dikirimkanbersamaan dengan naskah siap cetak.
F