Middle School Student Statistical Literacy Based on ...
13
E-ISSN : 2579-9258 Jurnal Cendekia: Jurnal Pendidikan Matematika P-ISSN: 2614-3038 Volume 05, No. 02, Juli 2021, pp. 2040-2052 2040 Middle School Student Statistical Literacy Based on Adversity Quotient Vicky Firdausi Nuzula 1 , Ismail 2 1, 2 Program Studi Pendidikan Matematika, Fakultas Matematika dan Ilmu Pengetahuan Alam Universitas Negeri Surabaya, Jl. Ketintang, Gayungan, Surabaya, Jawa Timur, 60231 [email protected] Abstract Statistical literacy was needed to read, interpret, conclude, and communicate data. One of the external factors was Adversity Quotient (AQ) in determining attitudes when faced difficulties related to statistical literacy. This type of research was descriptive research with a qualitative approach, with the aim was describing the statistical literacy of middle school students in terms of Adversity Quotient. Subjects consisted of 3 students who were selected from 31 students based on the results of the Adversity Response Profile with categories 1 subject of climber type, 1 subject of camper type, and 1 subject of quitter type, who were given statistical literacy tests and interviews. The results showed that: climber, camper, and quitter type subjects have not been able to present data in the appropriate diagrams and make criticisms of the data. Climber type subject was able to give reasons with mathematical calculations and apply appropriate statistical concepts, so that categorized in the critical level; Camper type subject was able to identify statistical terminology, but have not applied it, so that categorized in the inconsistent level; Quitter type subject only used imagination and provided non-statistical reasons, so that categorized in the informal level. Keywords: Statistical literacy, Adversity Quotient Abstrak Literasi statistik dibutuhkan dalam membaca, menginterpretasi, menyimpulkan serta mengomunikasikan data. Salah satu faktor yang mempengaruhi literasi statistik yaitu Adversity Quotient (AQ) dalam penentuan sikap ketika dihadapkan kesulitan terkait soal literasi statistik. Jenis penelitian ini yaitu penelitian deskriptif dengan pendekatan kualitatif, dengan tujuan mendeskripsikan literasi statistik siswa SMP ditinjau dari Adversity Quotient. Subjek terdiri dari 3 siswa yang diambil berdasarkan hasil Adversity Response Profile dengan kategori 1 subjek tipe climber, camper, dan quitter. Kemudian subjek diberi tes soal literasi statistik dan wawancara. Hasil penelitian menunjukkan bahwa: subjek tipe climber, camper, dan quitter belum mampu menyajikan data dalam bentuk diagram yang sesuai dan membuat kritik dari data. Subjek tipe climber mampu memberikan alasan dengan perhitungan matematis dan menerapkan konsep statistika yang sesuai, sehingga berada di level critical; Subjek tipe camper mampu mengidentifikasi terminologi statistika, namun belum menerapkannya, sehingga berada di level inconsistent; subjek tipe quitter hanya menggunakan imajinasi dan memberikan alasan non-statistik, sehingga berada di level informal. Kata kunci: Literasi statistik, Adversity Quotient Copyright (c) 2021 Vicky Firdausi Nuzula, Ismail Corresponding author: Vicky Firdausi Nuzula Email Address: [email protected] (Jl. Ketintang, Gayungan, Surabaya, Jawa Timur, 60231) Received 19 June 2021, Accepted 15 July 2021, Published 21 July 2021 INTRODUCTION In the 21st century, statistical literacy was needed to read, interpret, conclude, and communicate data. According to (Gal & Weldon, 2002)statistical literacy was described as the ability to interpret, evaluate critically, and communicate information presented in the data. This understanding means that not only the ability to read, analyze, interpret data, but also students are required to be able to communicate data. This was also expressed by (Hariyanti, 2019; Yolcu, 2014) that communicating data was one aspect of statistical literacy that must be achieved by students. So, it can be concluded that statistical literacy is the ability to read, interpret, conclude, and communicate data. According to (Aoyama & Stephens, 2003) the meaning of reading includes: basic reading of the table or graph presented, understanding keywords or things that stand out from a graph, and connecting the
Transcript of Middle School Student Statistical Literacy Based on ...
E-ISSN : 2579-9258 Jurnal Cendekia: Jurnal Pendidikan Matematika
P-ISSN: 2614-3038 Volume 05, No. 02, Juli 2021, pp. 2040-2052
2040
Middle School Student Statistical Literacy Based on Adversity Quotient
Vicky Firdausi Nuzula1, Ismail 2
1, 2 Program Studi Pendidikan Matematika, Fakultas Matematika dan Ilmu Pengetahuan Alam Universitas Negeri Surabaya,
Jl. Ketintang, Gayungan, Surabaya, Jawa Timur, 60231
Abstract
Statistical literacy was needed to read, interpret, conclude, and communicate data. One of the external factors was
Adversity Quotient (AQ) in determining attitudes when faced difficulties related to statistical literacy. This type of
research was descriptive research with a qualitative approach, with the aim was describing the statistical literacy of
middle school students in terms of Adversity Quotient. Subjects consisted of 3 students who were selected from 31
students based on the results of the Adversity Response Profile with categories 1 subject of climber type, 1 subject
of camper type, and 1 subject of quitter type, who were given statistical literacy tests and interviews. The results
showed that: climber, camper, and quitter type subjects have not been able to present data in the appropriate diagrams
and make criticisms of the data. Climber type subject was able to give reasons with mathematical calculations and
apply appropriate statistical concepts, so that categorized in the critical level; Camper type subject was able to identify
statistical terminology, but have not applied it, so that categorized in the inconsistent level; Quitter type subject only
used imagination and provided non-statistical reasons, so that categorized in the informal level.
Keywords: Statistical literacy, Adversity Quotient
Abstrak
Literasi statistik dibutuhkan dalam membaca, menginterpretasi, menyimpulkan serta mengomunikasikan data. Salah
satu faktor yang mempengaruhi literasi statistik yaitu Adversity Quotient (AQ) dalam penentuan sikap ketika
dihadapkan kesulitan terkait soal literasi statistik. Jenis penelitian ini yaitu penelitian deskriptif dengan pendekatan
kualitatif, dengan tujuan mendeskripsikan literasi statistik siswa SMP ditinjau dari Adversity Quotient. Subjek terdiri
dari 3 siswa yang diambil berdasarkan hasil Adversity Response Profile dengan kategori 1 subjek tipe climber,
camper, dan quitter. Kemudian subjek diberi tes soal literasi statistik dan wawancara. Hasil penelitian menunjukkan
bahwa: subjek tipe climber, camper, dan quitter belum mampu menyajikan data dalam bentuk diagram yang sesuai
dan membuat kritik dari data. Subjek tipe climber mampu memberikan alasan dengan perhitungan matematis dan
menerapkan konsep statistika yang sesuai, sehingga berada di level critical; Subjek tipe camper mampu
mengidentifikasi terminologi statistika, namun belum menerapkannya, sehingga berada di level inconsistent; subjek
tipe quitter hanya menggunakan imajinasi dan memberikan alasan non-statistik, sehingga berada di level informal.
Kata kunci: Literasi statistik, Adversity Quotient
Copyright (c) 2021 Vicky Firdausi Nuzula, Ismail
🖂 Corresponding author: Vicky Firdausi Nuzula
Email Address: [email protected] (Jl. Ketintang, Gayungan, Surabaya, Jawa Timur, 60231)
Received 19 June 2021, Accepted 15 July 2021, Published 21 July 2021
INTRODUCTION
In the 21st century, statistical literacy was needed to read, interpret, conclude, and communicate data.
According to (Gal & Weldon, 2002)statistical literacy was described as the ability to interpret, evaluate
critically, and communicate information presented in the data. This understanding means that not only the
ability to read, analyze, interpret data, but also students are required to be able to communicate data. This
was also expressed by (Hariyanti, 2019; Yolcu, 2014) that communicating data was one aspect of statistical
literacy that must be achieved by students. So, it can be concluded that statistical literacy is the ability to
read, interpret, conclude, and communicate data.
According to (Aoyama & Stephens, 2003) the meaning of reading includes: basic reading of the table
or graph presented, understanding keywords or things that stand out from a graph, and connecting the

Middle School Student Statistical Literacy Based on Adversity Quotient, Vicky Firdausi Nuzula, Ismail 2041
information presented in the two graphs. The meaning of interpret according to (Hafiyusholeh et al., 2017)
includes: being able to make appropriate graphs, determine the value of measure of tendency; concluding
data means making inferences from data; (Gould, 2017) argues that communicating data means being able
to make evaluations or criticisms and make predictions about the data presented. Based on (Khadijah et al.,
2018; Setiawan, 2020) the aspect of presenting data in the tables and diagrams was the most developed
subject at all levels, in middle school, students are taught to understand data from a table, how to present
data in diagrams, determine the measure of tendency, and make predictions. Therefore, statistical literacy
is needed in the middle school level, so that students are able to read, interpret, conclude, and communicate
data.
(Watson & Callingham, 2003)classified statistical literacy levels into 6: idiosyncratic, informal,
inconsistent, consistent non-critical, critical, and critical mathematical. There were several studies that have
tested the statistical literacy of middle school students such as (Hariyanti, 2019; Maryati & Priatna, 2018;
Wildani et al., 2019; Yolcu, 2014), the study said that middle school students were rarely able to make
predictions and evaluations from data, when made conclusions from data, middle school students rarely use
mathematical calculations or involve statistical terminology and apply them. Therefore, skills in statistical
literacy are very important for middle school students (Priyambodo & Maryati, 2019)
According to (Gal & Weldon, 2002), it was difficult to describe statistical literacy if it did not show
5 basic knowledge, such as: literacy skills, statistical knowledge, mathematical knowledge, context
knowledge, and critical questions. In addition, there were several external factors that affect statistical
literacy such as belief, attitude, and critical attitudes, and so on. (Carmichael & Hay, 2010) argued that a
relationship can be made between statistical literacy and Adversity Quotient (AQ), because there are several
things that can affect Adversity Quotient (AQ), such as belief and attitude (Stoltz, 2003), the external factors
of statistical literacy.
Adversity Quotient (AQ) according to (Stoltz, 2003) is the ability to survive in difficulties. Adversity
Quotient (AQ) can help students strengthen their ability and persistence in dealing with problems.
(Muhtarom, 2019)argued that Adversity Quotient (AQ) is a measurement of a person's ability to see, face,
and solve difficulties. (Hastuti et al., 2017) said that Adversity Quotient (AQ) is a person's ability to survive
in difficulties and effort in solving difficulties. From these opinions, it can be concluded that Adversity
Quotient (AQ) is the ability to survive in seeing, facing, and solving difficulties.
(Stoltz, 2003) classified Adversity Quotient (AQ) into 3 types: climbers, who have a strong belief
and understanding that something urgent must be resolved immediately, so that everything can be done.
Camper is a group of people who have tried to overcome the difficulties experienced but have not reached
the peak of completion. When faced with difficulties, they consider the risks involved and the rewards.
Quitter, who stop when facing difficulties before trying, show less ambition, minimal enthusiasm,
substandard quality, and take as few risks as possible and not creative. This is also in line with (Hastuti et
al., 2017; MZ et al., 2017; Purnamasari et al., 2018) which examined Adversity Quotient in middle school
students.
2042 Jurnal Cendekia: Jurnal Pendidikan Matematika, Volume 05, No. 02, July 2021, hal. 2040-2052
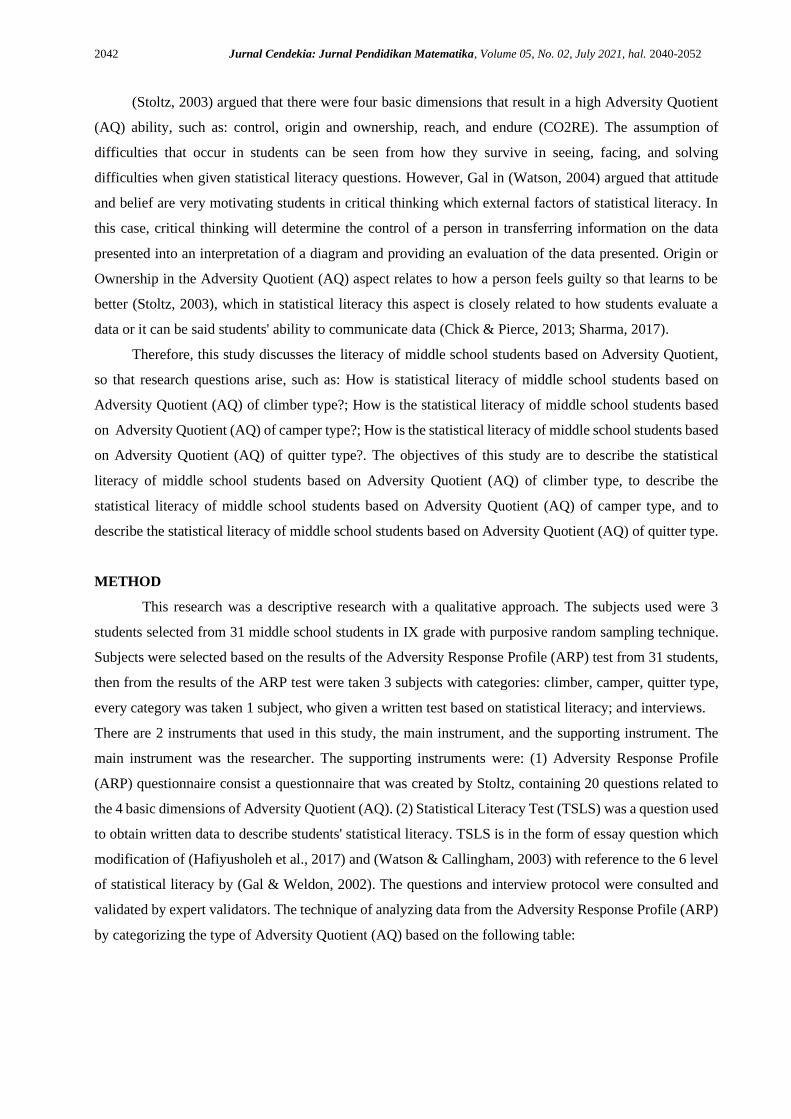
(Stoltz, 2003) argued that there were four basic dimensions that result in a high Adversity Quotient
(AQ) ability, such as: control, origin and ownership, reach, and endure (CO2RE). The assumption of
difficulties that occur in students can be seen from how they survive in seeing, facing, and solving
difficulties when given statistical literacy questions. However, Gal in (Watson, 2004) argued that attitude
and belief are very motivating students in critical thinking which external factors of statistical literacy. In
this case, critical thinking will determine the control of a person in transferring information on the data
presented into an interpretation of a diagram and providing an evaluation of the data presented. Origin or
Ownership in the Adversity Quotient (AQ) aspect relates to how a person feels guilty so that learns to be
better (Stoltz, 2003), which in statistical literacy this aspect is closely related to how students evaluate a
data or it can be said students' ability to communicate data (Chick & Pierce, 2013; Sharma, 2017).
Therefore, this study discusses the literacy of middle school students based on Adversity Quotient,
so that research questions arise, such as: How is statistical literacy of middle school students based on
Adversity Quotient (AQ) of climber type?; How is the statistical literacy of middle school students based
on Adversity Quotient (AQ) of camper type?; How is the statistical literacy of middle school students based
on Adversity Quotient (AQ) of quitter type?. The objectives of this study are to describe the statistical
literacy of middle school students based on Adversity Quotient (AQ) of climber type, to describe the
statistical literacy of middle school students based on Adversity Quotient (AQ) of camper type, and to
describe the statistical literacy of middle school students based on Adversity Quotient (AQ) of quitter type.
METHOD
This research was a descriptive research with a qualitative approach. The subjects used were 3
students selected from 31 middle school students in IX grade with purposive random sampling technique.
Subjects were selected based on the results of the Adversity Response Profile (ARP) test from 31 students,
then from the results of the ARP test were taken 3 subjects with categories: climber, camper, quitter type,
every category was taken 1 subject, who given a written test based on statistical literacy; and interviews.
There are 2 instruments that used in this study, the main instrument, and the supporting instrument. The
main instrument was the researcher. The supporting instruments were: (1) Adversity Response Profile
(ARP) questionnaire consist a questionnaire that was created by Stoltz, containing 20 questions related to
the 4 basic dimensions of Adversity Quotient (AQ). (2) Statistical Literacy Test (TSLS) was a question used
to obtain written data to describe students' statistical literacy. TSLS is in the form of essay question which
modification of (Hafiyusholeh et al., 2017) and (Watson & Callingham, 2003) with reference to the 6 level
of statistical literacy by (Gal & Weldon, 2002). The questions and interview protocol were consulted and
validated by expert validators. The technique of analyzing data from the Adversity Response Profile (ARP)
by categorizing the type of Adversity Quotient (AQ) based on the following table:
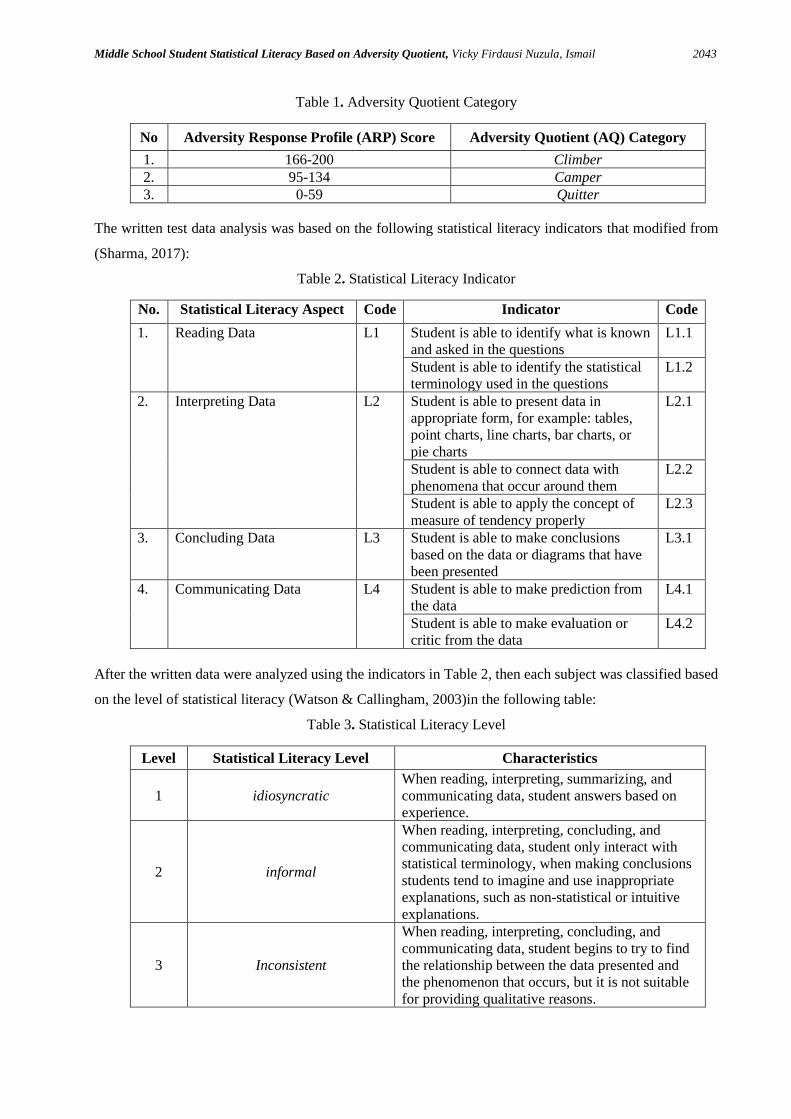
Middle School Student Statistical Literacy Based on Adversity Quotient, Vicky Firdausi Nuzula, Ismail 2043
Table 1. Adversity Quotient Category
No Adversity Response Profile (ARP) Score Adversity Quotient (AQ) Category
1. 166-200 Climber
2. 95-134 Camper
3. 0-59 Quitter
The written test data analysis was based on the following statistical literacy indicators that modified from
(Sharma, 2017):
Table 2. Statistical Literacy Indicator
No. Statistical Literacy Aspect Code Indicator Code
1.
Reading Data L1 Student is able to identify what is known
and asked in the questions
L1.1
Student is able to identify the statistical
terminology used in the questions
L1.2
2. Interpreting Data L2 Student is able to present data in
appropriate form, for example: tables,
point charts, line charts, bar charts, or
pie charts
L2.1
Student is able to connect data with
phenomena that occur around them
L2.2
Student is able to apply the concept of
measure of tendency properly
L2.3
3. Concluding Data L3 Student is able to make conclusions
based on the data or diagrams that have
been presented
L3.1
4. Communicating Data L4 Student is able to make prediction from
the data
L4.1
Student is able to make evaluation or
critic from the data
L4.2
After the written data were analyzed using the indicators in Table 2, then each subject was classified based
on the level of statistical literacy (Watson & Callingham, 2003)in the following table:
Table 3. Statistical Literacy Level
Level Statistical Literacy Level Characteristics
1 idiosyncratic
When reading, interpreting, summarizing, and
communicating data, student answers based on
experience.
2 informal
When reading, interpreting, concluding, and
communicating data, student only interact with
statistical terminology, when making conclusions
students tend to imagine and use inappropriate
explanations, such as non-statistical or intuitive
explanations.
3 Inconsistent
When reading, interpreting, concluding, and
communicating data, student begins to try to find
the relationship between the data presented and
the phenomenon that occurs, but it is not suitable
for providing qualitative reasons.

2044 Jurnal Cendekia: Jurnal Pendidikan Matematika, Volume 05, No. 02, July 2021, hal. 2040-2052
4 Consistent non-critical
Student is able to find the relationship between
the data presented and the phenomena that occur
by using statistical terminology such as using the
average, mean, or mode but inappropriate.
5 Critical Student is able to apply statistical terminology
such as mean, median, and mode appropriately.
6 Critical Mathematical
Students is able to make accurate evaluations and
predictions using statistical terminology based on
the data.
The analysis of interview results included: data reduction, data presentation, making conclusions
(Sugiyono, 2019).
RESULT AND DISCUSSION
The Analysis of Adversity Response Profile (ARP)
The following table shows the selected subjects based on the results of the Adversity Response Profile
(ARP):
Table 4 The Result of Adversity Response Profile
No Subject ARP Score AQ Category Code
1. ARW 173 Climber S-Cl
2. YWM 116 Camper S-Ch
3. GPH 59 Quitter S-Qu
Analysis and Discussion of Middle School Students Statistical Literacy on The Subject of Climber AQ
Type (S-Cl)
In this solution, S-Cl converts the information presented into a bar chart by adding the positive
numbers for Covid-19, recover, death, and treatment/isolation with additional numbers from each data.
When presenting data on Covid-19 patients who were treated/isolated based on the results of interviews, S-
Cl was confused in presenting the data, because the information presented did not state how much the
decline was. The consideration used by S-Cl in presenting data in the form of a bar chart because easier to
understand. Thus, it can be concluded that S-Cl has not succeeded in presenting data into the appropriate
diagram, namely a pie chart. This was in line with (Maryati & Priatna, 2018; Wildani et al., 2019) which
L2.1
Picture 1. The Solution of S-Cl of Question 1a
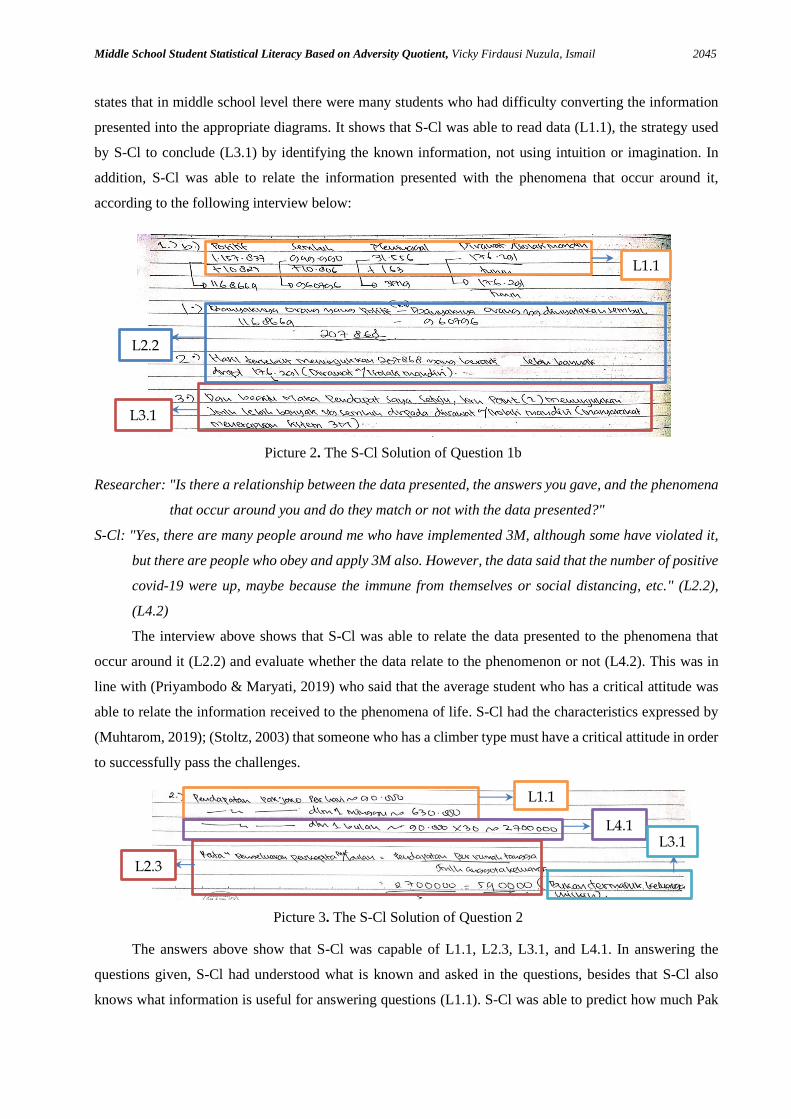
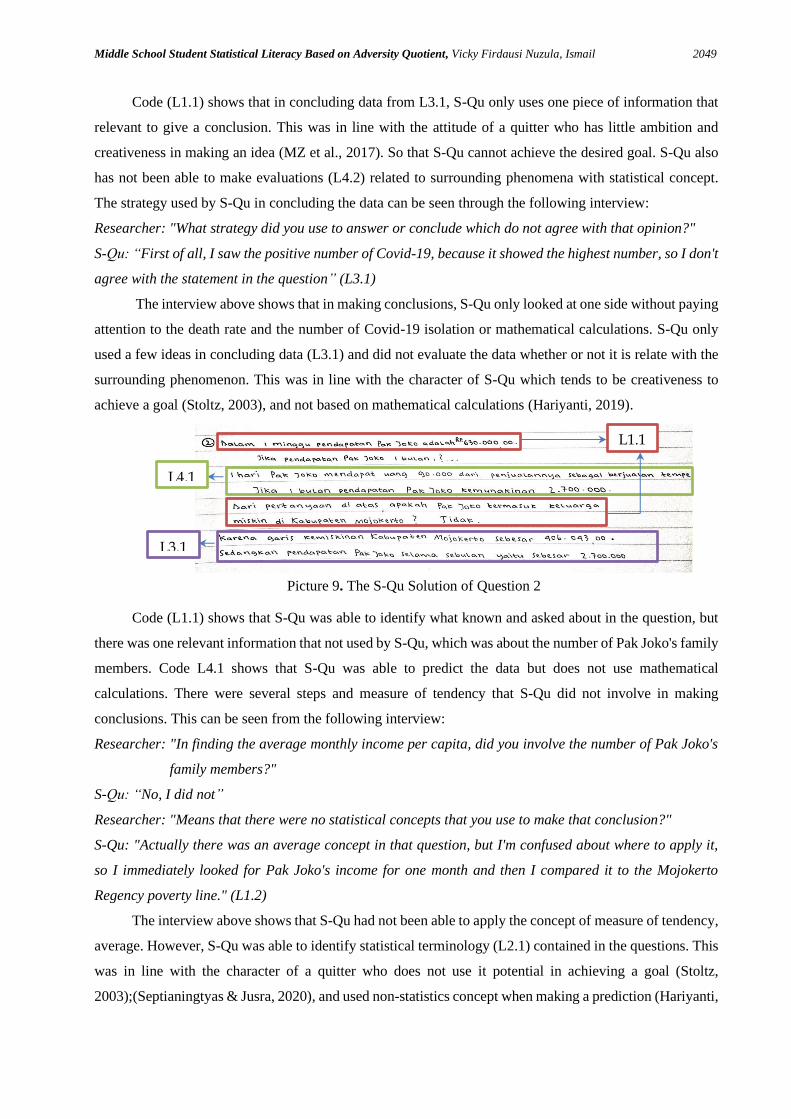
Middle School Student Statistical Literacy Based on Adversity Quotient, Vicky Firdausi Nuzula, Ismail 2045
states that in middle school level there were many students who had difficulty converting the information
presented into the appropriate diagrams. It shows that S-Cl was able to read data (L1.1), the strategy used
by S-Cl to conclude (L3.1) by identifying the known information, not using intuition or imagination. In
addition, S-Cl was able to relate the information presented with the phenomena that occur around it,
according to the following interview below:
Researcher: "Is there a relationship between the data presented, the answers you gave, and the phenomena
that occur around you and do they match or not with the data presented?"
S-Cl: "Yes, there are many people around me who have implemented 3M, although some have violated it,
but there are people who obey and apply 3M also. However, the data said that the number of positive
covid-19 were up, maybe because the immune from themselves or social distancing, etc." (L2.2),
(L4.2)
The interview above shows that S-Cl was able to relate the data presented to the phenomena that
occur around it (L2.2) and evaluate whether the data relate to the phenomenon or not (L4.2). This was in
line with (Priyambodo & Maryati, 2019) who said that the average student who has a critical attitude was
able to relate the information received to the phenomena of life. S-Cl had the characteristics expressed by
(Muhtarom, 2019); (Stoltz, 2003) that someone who has a climber type must have a critical attitude in order
to successfully pass the challenges.
The answers above show that S-Cl was capable of L1.1, L2.3, L3.1, and L4.1. In answering the
questions given, S-Cl had understood what is known and asked in the questions, besides that S-Cl also
knows what information is useful for answering questions (L1.1). S-Cl was able to predict how much Pak
L1.1
L3.1
L2.2
Picture 2. The S-Cl Solution of Question 1b
L1.1
L4.1
L2.3
L3.1
Picture 3. The S-Cl Solution of Question 2

2046 Jurnal Cendekia: Jurnal Pendidikan Matematika, Volume 05, No. 02, July 2021, hal. 2040-2052
Joko's income in 1 month (L4.1) with mathematical calculations. S-Cl was also able to identify the statistical
terminology used in problem L1.2. This was expressed in the following interview:
Researcher: "Is there any statistical terminology in the questions?"
S-Cl: “Yes, there is, average. The average referred to the average per capita income per month that had
already been defined.” (L1.2, L2.3)
From the interview above, it can be concluded that S-Cl was able to identify statistical terminology
contained in the questions (L1.2). This ability in line with (Hariyanti, 2019). In addition, S-Cl was also able
to apply the concept of measure of tendency to answer the questions. In providing conclusions, S-Cl
compared Pak Joko's income and the poverty line of Mojokerto Regency. This can be seen from the
following interview below:
Researcher: “How did you make a conclusion that Pak Joko was not a poor citizen?”
S-Cl: "After I calculated the average income per capita per month of Pak Joko's family, I compared the
results with the poverty line of Mojokerto Regency, because the results were greater then poverty
line, so the conclusion: Pak Joko's family was not a poor family, because the story said that if a
resident who has an average monthly per capita income below the poverty line is classified as poor,
and it turns out that the average monthly per capita income of Mr. Joko's family was above the
poverty line of Mojokerto, it can be concluded that Mr. Joko's family was not included poor families
in Mojokerto Regency.” (L2.3, L3.1)
The interview above shows that in concluding data, S-Cl involved the information that known on the
question and applying the concept of average in finding the desired answer. This ability was rarely owned
by middle school students according to (Hariyanti, 2019). This ability in line with the characteristics of a
climber who had creative ideas in achieving a goal (Stoltz, 2003). Therefore, S-Cl's ability to read, interpret,
conclude, and communicate data was classified at a critical level, because S-Cl was able to identify and
apply statistical concepts correctly.
Analysis and Discussion of Middle School Students Statistical Literacy on The Subject of Camper AQ
Type (S-Ch)
In code L2.1, S-Ch drawn a bar chart, although it is not appropriate, S-Ch compared positive numbers,
recovers, dies, and isolation with the numbers of increasing or decreasing. However, the graph does not
sum the numbers before the increasing or decreasing. From this, it can be seen that the combination is not
L2.1
Picture 4. The S-Ch Solution of Question 1a

Middle School Student Statistical Literacy Based on Adversity Quotient, Vicky Firdausi Nuzula, Ismail 2047
used by S-Ch. In this case, S-Ch means had not been able to drawn the appropriate diagram. The reason
used by S-Ch in making graphs can be seen in the following interview:
Researcher: "Why did you choose a bar chart, was it appropriate?"
S-Ch: “The reason, because bar charts were easier to understand and draw. In my opinion, it was suitable
because it was easy.”
From the interview above, it can be seen that the considerations used by S-Ch in presenting data by
diagrams were only used the element of convenience without paying attention to the element of suitability.
This was in line with (Amalia, 2020; Khadijah et al., 2018) which says that junior high school students had
difficulty in presenting data by an appropriate diagram. In this case, it was appropriate with the
characteristics of an AQ camper type, such as taking shortcuts but not suitable for achieving goals and
cannot reach that goal (Stoltz, 2003); (Hastuti et al., 2017).
From the answers given, S-Ch in concluding a data only looked at the phenomena and impacts that occurred
around life. This was known from the following interview:
Researcher: "From the answers you have given, what were the considerations that made you agree with the
statement that many Indonesians had implemented 3M?"
S-Ch: “I saw a phenomenon that happening around me, that most of the people around me had implemented
3M even though some did not apply, but most of people applied it. Then, if many people implement
3M, then this will reduce the Covid-19 outbreak and prevent additional Covid-19 cases."
The interview shows that S-Ch in concluding a data used a strategy by connecting with the
phenomena that occur around it, without involving the data presented or statistical concepts. S-Cl also has
not been able to make evaluations (L4.2) related to surrounding phenomena. This was in line with the
attitude of a camper who have limited abilities in dealing with a problem (Stoltz, 2003). This opinion is also
reinforced (Hariyanti, 2019) that in connecting data with phenomena that occur around middle school
students, it is not based on mathematical calculations.
Code (L2.3) shows that S-Ch was able to apply the concept of measure of tendency, average. This
indicated that S-Ch was able to interpret a data by applying the concept of measure of tendency, average.
Code (L3.1) indicated that S-Ch was able to conclude a data. However, S-Ch has not shown a mathematical
calculation of Pak Joko's income in 1 month. This can be said that S-Ch did not use mathematical
L.3.1
L3.1
L2.3
Picture 5. The S-Ch Solution of Question 1b
Picture 6. The S-Ch Solution of Question 2

2048 Jurnal Cendekia: Jurnal Pendidikan Matematika, Volume 05, No. 02, July 2021, hal. 2040-2052
calculations when making predictions from data (L4.1). Then S-Ch made a conclusion that had found. This
was in line with (Hariyanti, 2019; Wildani et al., 2019) that middle school students in making prediction
were not based on mathematical calculations. Therefore, S-Ch's ability to read, interpret, conclude, and
communicate data was classified at an inconsistent level, because S-Ch seldom used mathematical
calculation to predict data and did not applied statistical concept to evaluate data, just connected with the
phenomena around.
Analysis and Discussion of Middle School Students Statistical Literacy on The Subject of Quitter AQ
Type (S-Qu)
S-Qu presented the data in a line chart. From these answers, it can be seen that S-Qu had not been
able to interpret data in an appropriate diagram, a pie chart. S-Qu paid less attention that each point on the
line chart will have a value. The analysis in line with the character of a quitter, namely not understanding
the situation in solving a problem (Stoltz, 2003); (Septianingtyas & Jusra, 2020). The following interview
shows that S-Qu does not know what type of diagram was being drawn.
Researcher: “What diagrams did you use to present the data?”
S-Qu: “Emmm… Dot chart.”
The interview above shows misconception between what was presented, and the type of diagram mentioned
at the time of the interview. Then the strategy used by S-Qu in making the diagram can be seen from the
following interview:
Researcher: "What strategy did you use in presenting the data in the diagram you drew?"
S-Qu: “First I saw that there were positive numbers, recovered, died, and isolation, after that I tried to put
them in a diagram by making dots according to the values stated in the information presented. Then I
connect the dots with a line.”
Researcher: "So the type of diagram you present was called a dot chart or a line chart?"
S-Qu: “Oh... I means line chart.”
The interview above shows that the strategy used by S-Qu in presenting the diagram was how to
make a line chart. This was in line with (Stoltz, 2003) which said that a quitter tends to ignore the potential
they have. This was shown by the way they do not realize that the diagram presented was a line chart.\
L3.1
L1.1
Picture 7. The S-Qu Solution of Question 1a
Picture 8. The S-Qu Solution of Question 1b
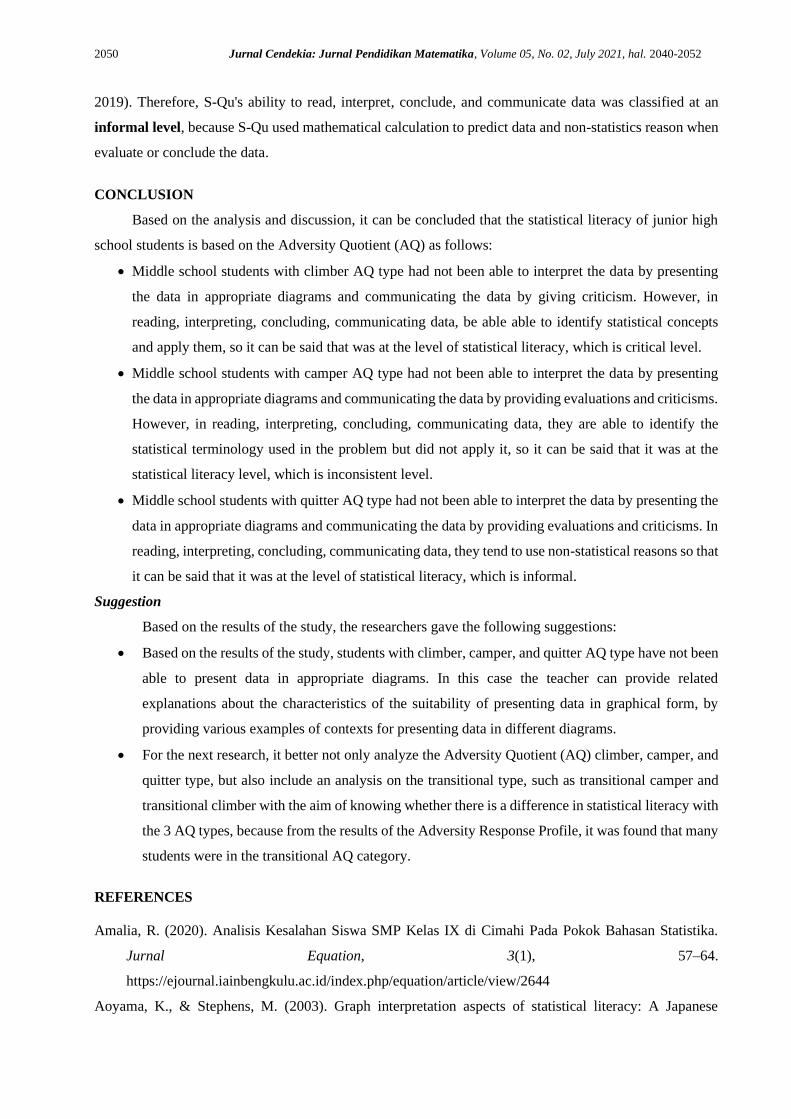
Middle School Student Statistical Literacy Based on Adversity Quotient, Vicky Firdausi Nuzula, Ismail 2049
Code (L1.1) shows that in concluding data from L3.1, S-Qu only uses one piece of information that
relevant to give a conclusion. This was in line with the attitude of a quitter who has little ambition and
creativeness in making an idea (MZ et al., 2017). So that S-Qu cannot achieve the desired goal. S-Qu also
has not been able to make evaluations (L4.2) related to surrounding phenomena with statistical concept.
The strategy used by S-Qu in concluding the data can be seen through the following interview:
Researcher: "What strategy did you use to answer or conclude which do not agree with that opinion?"
S-Qu: “First of all, I saw the positive number of Covid-19, because it showed the highest number, so I don't
agree with the statement in the question” (L3.1)
The interview above shows that in making conclusions, S-Qu only looked at one side without paying
attention to the death rate and the number of Covid-19 isolation or mathematical calculations. S-Qu only
used a few ideas in concluding data (L3.1) and did not evaluate the data whether or not it is relate with the
surrounding phenomenon. This was in line with the character of S-Qu which tends to be creativeness to
achieve a goal (Stoltz, 2003), and not based on mathematical calculations (Hariyanti, 2019).
Code (L1.1) shows that S-Qu was able to identify what known and asked about in the question, but
there was one relevant information that not used by S-Qu, which was about the number of Pak Joko's family
members. Code L4.1 shows that S-Qu was able to predict the data but does not use mathematical
calculations. There were several steps and measure of tendency that S-Qu did not involve in making
conclusions. This can be seen from the following interview:
Researcher: "In finding the average monthly income per capita, did you involve the number of Pak Joko's
family members?"
S-Qu: “No, I did not”
Researcher: "Means that there were no statistical concepts that you use to make that conclusion?"
S-Qu: "Actually there was an average concept in that question, but I'm confused about where to apply it,
so I immediately looked for Pak Joko's income for one month and then I compared it to the Mojokerto
Regency poverty line." (L1.2)
The interview above shows that S-Qu had not been able to apply the concept of measure of tendency,
average. However, S-Qu was able to identify statistical terminology (L2.1) contained in the questions. This
was in line with the character of a quitter who does not use it potential in achieving a goal (Stoltz,
2003);(Septianingtyas & Jusra, 2020), and used non-statistics concept when making a prediction (Hariyanti,
L1.1
L4.1
L3.1
Picture 9. The S-Qu Solution of Question 2
2050 Jurnal Cendekia: Jurnal Pendidikan Matematika, Volume 05, No. 02, July 2021, hal. 2040-2052
2019). Therefore, S-Qu's ability to read, interpret, conclude, and communicate data was classified at an
informal level, because S-Qu used mathematical calculation to predict data and non-statistics reason when
evaluate or conclude the data.
CONCLUSION
Based on the analysis and discussion, it can be concluded that the statistical literacy of junior high
school students is based on the Adversity Quotient (AQ) as follows:
• Middle school students with climber AQ type had not been able to interpret the data by presenting
the data in appropriate diagrams and communicating the data by giving criticism. However, in
reading, interpreting, concluding, communicating data, be able able to identify statistical concepts
and apply them, so it can be said that was at the level of statistical literacy, which is critical level.
• Middle school students with camper AQ type had not been able to interpret the data by presenting
the data in appropriate diagrams and communicating the data by providing evaluations and criticisms.
However, in reading, interpreting, concluding, communicating data, they are able to identify the
statistical terminology used in the problem but did not apply it, so it can be said that it was at the
statistical literacy level, which is inconsistent level.
• Middle school students with quitter AQ type had not been able to interpret the data by presenting the
data in appropriate diagrams and communicating the data by providing evaluations and criticisms. In
reading, interpreting, concluding, communicating data, they tend to use non-statistical reasons so that
it can be said that it was at the level of statistical literacy, which is informal.
Suggestion
Based on the results of the study, the researchers gave the following suggestions:
• Based on the results of the study, students with climber, camper, and quitter AQ type have not been
able to present data in appropriate diagrams. In this case the teacher can provide related
explanations about the characteristics of the suitability of presenting data in graphical form, by
providing various examples of contexts for presenting data in different diagrams.
• For the next research, it better not only analyze the Adversity Quotient (AQ) climber, camper, and
quitter type, but also include an analysis on the transitional type, such as transitional camper and
transitional climber with the aim of knowing whether there is a difference in statistical literacy with
the 3 AQ types, because from the results of the Adversity Response Profile, it was found that many
students were in the transitional AQ category.
REFERENCES
Amalia, R. (2020). Analisis Kesalahan Siswa SMP Kelas IX di Cimahi Pada Pokok Bahasan Statistika.
Jurnal Equation, 3(1), 57–64.
https://ejournal.iainbengkulu.ac.id/index.php/equation/article/view/2644
Aoyama, K., & Stephens, M. (2003). Graph interpretation aspects of statistical literacy: A Japanese
Middle School Student Statistical Literacy Based on Adversity Quotient, Vicky Firdausi Nuzula, Ismail 2051
perspective. Mathematics Education Research Journal, 15(3), 207–225.
https://doi.org/10.1007/BF03217380
Carmichael, C., & Hay, I. (2010). Statistical literacy in the middle school : The relationship between interest
, self-efficacy and prior mathematics achievement 1. Journal of Educational and Developmental
Psychology, 10, 83–93. www.newcastle.edu.au/journal/ajedp/
Chick, H., & Pierce, R. (2013). The Statistical Literacy Needed to Interpret School Assessment Data.
Mathematics Teacher Education & Development, 15(2), 1–19.
http://search.ebscohost.com/login.aspx?direct=true&db=eric&AN=EJ1018712&site=ehost-
live%5Cnhttp://search.ebscohost.com/login.aspx?direct=true&db=ehh&AN=94988608&site=ehost-
live
Gal, I., & Weldon, K. L. (2002). [Adults’ Statistical Literacy: Meanings, Components, Responsibilities]:
Discussion. International Statistical Review / Revue Internationale de Statistique, 70(1), 43.
https://doi.org/10.2307/1403719
Gould, R. (2017). Data literacy is statistical literacy. Statistics Education Research Journal, 16(1), 22–25.
https://iase-web.org/Publication.php?p=SERJ
Hafiyusholeh, M., Budayasa, K., & Siswono, T. Y. E. (2017). Literasi Statistik: Siswa SMA dalam
Membaca, Menafsirkan, dan Menyimpulkan Data. Prosiding SI MaNIs (Seminar Nasional Integrasi
Matematika Dan Nilai Islami), 1(1), 79–85.
Hariyanti, F. (2019). Statistical Literacy Siswa SMP dalam Pembelajaran Matematika Student ’ s Statistical
Literacy of Junior high school in Learning Mathematics. EKSPOSE: Jurnal Penelitian Hukum Dan
Pendidikan, 18(2), 911–920. https://doi.org/http://dx.doi.org/10.30863/ekspose.v18i2.564
Hastuti, T. D., Sari, D. R., & Riyadi. (2017). Student profile with high adversity quotient in math learning.
International Conference on Mathematics, Science, and Education. https://doi.org/10.1088/1742-
6596/983/1/012131
Khadijah, I. N. A., Maya, R., & Setiawan, W. (2018). Analisis Kemampuan Komunikasi Matematis Siswa
Smp Pada Materi Statistika. JPMI Jurnal Pembelajaran Matematika Inovatif, 1(6), 1095–1104.
https://doi.org/http://dx.doi.org/10.22460/jpmi.v1i6.p1095-1104
Maryati, I., & Priatna, N. (2018). Analisis Kemampuan Literasi Statistis Siswa Madrasah Tsanawiyah
dalam Materi Statistika. Journal of Medives : Journal of Mathematics Education IKIP Veteran
Semarang, 2(2), 205. https://doi.org/10.31331/medives.v2i2.640
Muhtarom. (2019). Profil Keyakinan Pendagogical Content Knowledge Mahasiswa Calon Guru
Matematika Ditinjau dari Adversity Quotient. Surabaya: Unesa (Disertasi Tidak Dipublikasikan).
MZ, Z. A., Risnawati, R., Kurniati, A., & Prahmana, R. C. I. (2017). Adversity Quotient in Mathematics
Learning (Quantitative Study on Students Boarding School in Pekanbaru). International Journal on
Emerging Mathematics Education, 1(2), 169. https://doi.org/10.12928/ijeme.v1i2.5780
Priyambodo, S., & Maryati, I. (2019). Peningkatan Kemampuan Literasi Statistis melalui Model
Pembelajaran Berbasis Proyek yang Dimodifikasi. Mosharafa: Jurnal Pendidikan Matematika, 8(2),
2052 Jurnal Cendekia: Jurnal Pendidikan Matematika, Volume 05, No. 02, July 2021, hal. 2040-2052
273–284. https://doi.org/10.31980/mosharafa.v8i2.496
Purnamasari, F. E., Sujadi, I., & Slamet, I. (2018). Effect of adversity quotient of junior high school students
on reflective thinking process in mathematical problem solving Effect of adversity quotient of junior
high school students on reflective thinking process in mathematical problem solving. International
Conference on Mathematics, Science, and Education. https://doi.org/10.1088/1742-
6596/1321/2/022128
Septianingtyas, N., & Jusra, H. (2020). Kemampuan Pemecahan Masalah Matematis Peserta Didik
Berdasarkan Adversity Quotient. Jurnal Cendekia : Jurnal Pendidikan Matematika, 4(2), 657–672.
https://doi.org/10.31004/cendekia.v4i2.263
Setiawan, E. P. (2020). PYTHAGORAS : Jurnal Pendidikan Matematika , 14 ( 2 ), 2019 , 163-177 Analisis
muatan literasi statistika dalam buku teks matematika Kurikulum 2013. PYTHAGORAS: Jurnal
Pendidikan Matematika, d(2), 163–177. https://doi.org/https://doi.org/10.21831/pg.v14i2.28558
Sharma, S. (2017). Definitions and models of statistical literacy : a literature review. Open Review of
Educational Research, 4(1), 118–133. https://doi.org/10.1080/23265507.2017.1354313
Stoltz, P. G. (2003). Adversity Quotient (Mengubah Hambatan Menjadi Peluang) terjemahan. Jakarta:
Gramedia.
Watson, J. M. (2004). Is statistical literacy relevant for middle school students ? Towards Excellence in
Mathematics, 1989, 3–10. https://doi.org/10.1.1.144.7227&rep=rep1&type=pdf
Watson, J. M., & Callingham, R. a. (2003). Statistical Literacy: From Idiosyncratic to Critical Thinking
Continued on Next Page. Curricular Development in Statistics Education, 2002, 116–162.
Wildani, J., Triyana, I. W., & Mahmudah, W. (2019). LITERASI STATISTIS SISWA KELAS VIII THE
STATISTICAL LITERACY OF 8 TH GRADE STUDENTS OF SMP. Vygotstky:Jurnal Pendidikan
Matematika Dan Matematika, 1(2), 99–110. https://doi.org/https://doi.org/10.30736/vj.v1i2.137
Yolcu, A. (2014). Middle school students’ statistical literacy: Role of grade level and gender. Statistics
Education Research Journal, 13(2), 118–131. https://doi.org/https://eric.ed.gov/?id=EJ1047563