First Half 2020 Financial Result - PermataBank
32
Company Presentation First Half 2020 Financial Result #MakingADifference
Transcript of First Half 2020 Financial Result - PermataBank

Company Presentation
First Half 2020
Financial Result
#MakingADifference

Disclaimer Laporan ini disusun oleh PT Bank Permata Tbk secara independen dan diedarkan hanya untuk tujuan informasi
umum. Hal ini tidak dimaksudkan untuk orang tertentu yang mungkin menerima laporan ini. Informasi dalam laporan
ini telah diperoleh dari sumber-sumber yang kami anggap dapat dipercaya. Tidak ada jaminan (tersurat maupun
tersirat) yang dibuat untuk keakuratan atau kelengkapan informasi. Semua pendapat dan perkiraan yang termasuk
dalam laporan ini merupakan penilaian kami pada tanggal ini dan dapat berubah tanpa pemberitahuan sebelumnya.
Kami tidak bertanggung jawab atau memiliki kewajiban apa pun tanpa pemberitahuan sebelumnya dari PT Bank
Permata Tbk dan / atau karyawan dan / atau agen mereka masing-masing yang timbul yang dapat dibawa atau
diderita oleh orang lain sebagai akibat bertindak atas dasar seluruh atau sebagian dari isi laporan ini. Baik PT Bank
Permata Tbk dan / atau perusahaan afiliasinya dan / atau karyawan dan / atau agennya masing-masing tidak
bertanggung jawab atas kesalahan, kelalaian dalam laporan ini dan setiap ketidakakuratan atau kelalaian yang
mungkin timbul.
This report has been prepared by PT Bank Permata Tbk independently and is circulated for the purpose of general
information only. It is not intended to the specific person who may receive this report. The information in this report
has been obtained from sources which we deem reliable. No warranty (expressed or implied) is made to the
accuracy or completeness of the information. All opinions and estimations included in this report constitute our
judgment as of this date and are subject to change without prior notice.
We disclaim any responsibility or liability without prior notice of PT Bank Permata Tbk and/or their respective
employees and/or agents whatsoever arising which may be brought against or suffered by any person as a result of
acting in reliance upon the whole or any part of the contents of this report and neither PT Bank Permata Tbk and/or
its affiliated companies and/or their respective employees and/or agents accepts liability for any errors, omissions,
negligent or otherwise, in this report and any inaccuracy herein or omission here from which might otherwise arise.

Presentation Content
3
PERMATA BANK IN BRIEF 2
MACRO ECONOMY UPDATES 1
BUSINESS UPDATE 4
FINANCIAL PERFORMANCE HIGHLIGHTS 3
OTHER INFORMATION 5
3.28%
3.49%3.00%
2.67%
1.96%2.0%
2.0%
4.0%
Jun
-19
Jul-
19
Au
g-1
9
Sep
-19
Oct
-19
No
v-19
Dec
-19
Jan
-20
Feb
-20
Mar
-20
Ap
r-2
0
May
-20
Jun
-20
Series1
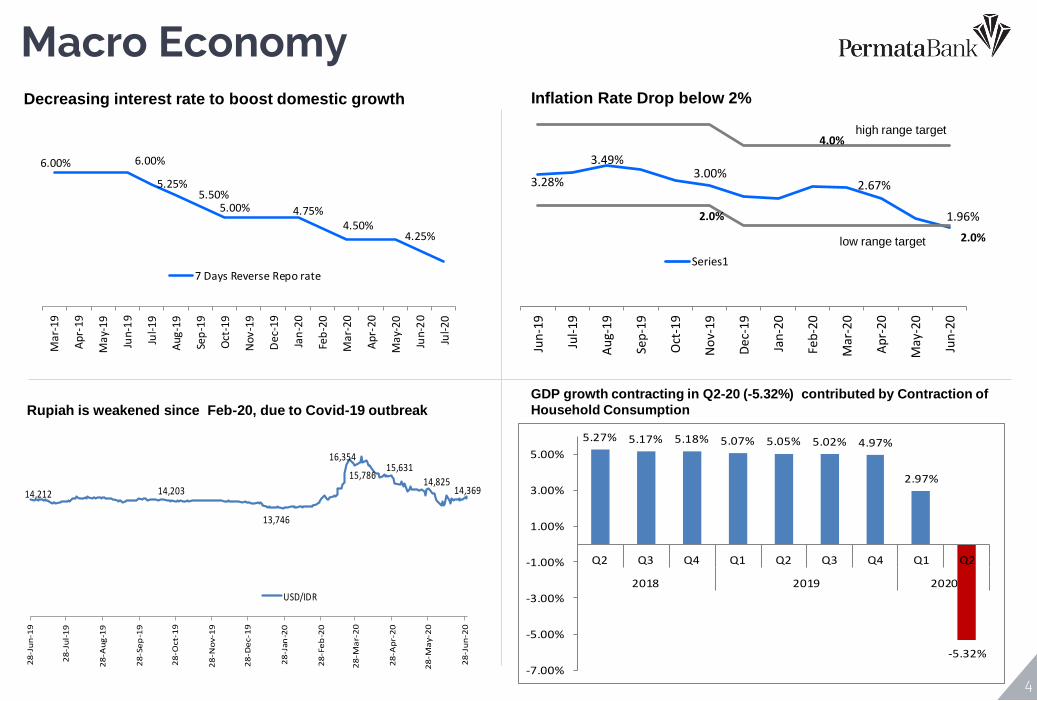
Macro Economy
4
Decreasing interest rate to boost domestic growth
Rupiah is weakened since Feb-20, due to Covid-19 outbreak
Inflation Rate Drop below 2%
GDP growth contracting in Q2-20 (-5.32%) contributed by Contraction of
Household Consumption
low range target
high range target
6.00% 6.00%
5.50%5.25%
5.00% 4.75%4.50%
4.25%
Mar
-19
Ap
r-1
9
May
-19
Jun
-19
Jul-1
9
Au
g-1
9
Sep
-19
Oct
-19
Nov
-19
Dec
-19
Jan
-20
Feb
-20
Mar
-20
Ap
r-2
0
May
-20
Jun
-20
Jul-2
0
7 Days Reverse Repo rate
14,212 14,203
13,746
16,354
15,786 15,631
14,825 14,369
28
-Ju
n-1
9
28
-Ju
l-1
9
28
-Au
g-1
9
28
-Se
p-1
9
28
-Oct
-19
28
-No
v-1
9
28
-De
c-1
9
28
-Jan
-20
28
-Fe
b-2
0
28
-Ma
r-2
0
28
-Ap
r-2
0
28
-Ma
y-2
0
28
-Ju
n-2
0
USD/IDR
5.27% 5.17% 5.18% 5.07% 5.05% 5.02% 4.97%
2.97%
-5.32%
-7.00%
-5.00%
-3.00%
-1.00%
1.00%
3.00%
5.00%
Q2 Q3 Q4 Q1 Q2 Q3 Q4 Q1 Q2
2018 2019 2020

PermataBank in Brief
5
Year Established
Listing at the Bourse
Asset **)
Market Capitalization **)
Network & Branches **)
ATMs **)
Shareholders
Corporate Rating
Sub Debt Rating
Basel-III Sub Debt Rating
1955
Since 1990 at the Jakarta Stock Exchange and
Surabaya Stock Exchange (both merged and
now known as the Indonesian Stock Exchange
(BEI)
Rp 157,8 tn (consolidated)
Rp 35.6 tn
Total 309 Branches consist of :
• 69 Branch Offices (incl.14 Sharia Branches & 1 HO)
• 221 Sub Branch (incl. 4 Sharia Sub Branches)
• 19 Cash Offices (incl. 1 Sharia Services)
965 (incl. 19 sharia ATMs) and additional
access to >100,000 ATMs*
• Bangkok Bank Public Company Ltd
(89.12%)
• Public 10.88%
id AAA (Pefindo)
AA+(idn) (Fitch)
Baa2 (Moody;s)
id AA+ (Pefindo)
Id AA (Pefindo)
Bangkok Bank is the largest corporate bank in
Thailand, with Total Assets of ± US$ 123 Billion
and has more than 17 million customer
accounts with 1,200 branches nationwide
Bangkok Bank has the largest overseas branch
network of any Thai bank, with 31 overseas
locations in 15 nation, including China,
Cambodia, Hong Kong, Indonesia, Japan,
Laos, Malaysia, Myanmar, the Philippines,
Singapore, Taiwan, Vietnam, the United
Kingdom, and the United States.
Bangkok Bank has core presence in key
ASEAN market, leveraging on cross border
trade, capital, wealth and investment flow.
Bangkok Bank is aiming to become a leading
and well-diversified ASEAN regional bank.
Bangkok Bank has been in presence in
Indonesia since 1968 with deep understanding
of the Indonesian banking sector.
*) connected through Alto, Visa Plus, ATM Bersama, Master Card, Cirrus and Prima networks
**) as of June-20
Controlling Shareholders

6
PermataBank Growth Strategies
6
REVENUE: Grow customer (incl.
partnership), deepen relationship
(fee, cross-sell, value chain to
customer’s ecosystem), increase NIM
(e.g. pricing, unsecured lending,
CASA), drive BETTER
product/offerings
COST: Improve efficiency and
productivity: process, review
network/branch model, commercial
excellence
QUALITY: Manage risk appetite, risk
limits and underwriting criteria in
regards of Covid-19 impact.
A
Leverage capabilities and
increase collaboration with
Bangkok Bank: leveraging
international customers, product
skills and joint deals across
lending, transaction banking, FM
sales and ALM
Build new strategic partnership
& deepen relationship with
existing strategic partners with
innovative business models
Continue to deepen relationship
with Astra Group, and its
ecosystem across 7 industry
verticals and segment offering
(retail, commercial, corporate and
Syariah)
B
CREDIT: Create credit culture to
drive responsible growth, clear
governance and compliance
adherence
DIGITAL: Create and execute Digital
Roadmap (Customer experience,
Digitize sales, Tech/Ops, Agile
Operating model)
NETWORK: Revamp network and
review branch model (Lean branch
service, Lean branch model)
ORGANIZATION: Manage changes
across organization (people, culture)
EXPERIENCE: Improve Stakeholder
Experience (addressed complaints,
better process – lower TAT & service
delivery)
C
STRENGTHENING
FINANCIAL PERFORMANCE
STRENGTHENING
SYNERGY WITH
SHAREHOLDERS
STRENGTHENING
BUSINESS ENABLER

Financial Performance PermataBank focus on the penetration of high yield assets, while at the same time able to manage risk and risk-return reward.

Performance Highlights
8
• LOAN GROWTH – loan decrease by 3.1% (yoy) to Rp.103.7 trillion in June-20 in line with lower loan
demand due to the weakening global and domestic economies affected by COVID-19 outbreak. Bank
focuses on helping the affected debtors by conducting a loan restructuring and relaxation program in
accordance with OJK's direction.
• RESTRUCTURED LOAN – by the end of June 2020, the total application request for loan restructuring
and relaxation programs related to COVID-19 was approx. Rp 15.5 trillion (15% of the total loans in June
2020) of which 62% is already approved, 13% is still in process and 25% rejected by committee.
• THIRD PARTY FUND - Total third party fund grew by 11.4% to Rp. 124.5 trillion, which majorly was
supported by CA and SA growth of 14.7% and 6.7%, resp., led to an increase in CASA by 10.7%. CASA ratio
at 52% which showing that PemataBank continues to play an important role in supporting customers to
manage their business in difficult economic conditions.
• MANAGEABLE ASSET QUALITY WITH PRUDENT COVERAGE RATIO - The gross NPL ratio increased
slightly to 3.7% compared to June-19 at 3.6%, with the NPL-net maintained at 1.8% compared to 1.3% at
June-19. This was affected by COVID-19 outbreak to debtors' financial capability in almost segment
industries.
THE NPL COVERAGE RATIO WAS MAINTAINED AT 112% in the June-20 position in line with efforts to
improve credit quality that have been carried out and indicating the Bank's efforts to continuously mitigate
potential credit losses prudently.

Performance Highlights
9
• STRONG LIQUIDTY - Common Equity Tier 1 (CET-1) and Capital Adequacy Ratio (CAR) were strongly
maintained at 20.2% and 21.3%, resp., in Jun-20 increased compared to 18.4% and 19.8% in the same
period last year - far higher than the regulator’s minimum capital requirement. The capital ratio even
remained strong after incorporating the impact of the first implementation of PSAK 71 regarding the
provision for losses of financial instruments effective from Jan 1, 2020.
• REVENUE GROWTH – Pre Provision Operating Profit (PPOP) was recorded at Rp 1.7 trillion or grew by
24.2% (YoY) compared to the same period last year, which mainly was contributed by an increase in net
interest income of 12.1% (YoY) to Rp 3.2 trillion at the end of H1-20 and also Non-Interest Income increased
by 7.8% to Rp.990 billion. This improved NIM ratio to 4.5% or an increase by 38bps compared to the June-19
position of 4.2%. While the Fee Income to Income (FIR) ratio was maintained stable at 24.0%, a slight
decrease compared to the position in June-19 of 24.7%
Operational Costs is at manageable level with the Cost to Income Ratio (CIR) recorded at 58.7%, improved
significantly compared to last year's position of 62.8% and Dec-19 position of 61.6%.
Net profit was booked at Rp 366 billion or reduced by 48.5% compared to previous year. However,
Normalized profit after tax (excluding LI impact of COVID-19 and changing of income tax rates from 25% to
22%) was recorded at Rp.742 billion or increased by 4.4% compared to the same period last year.

Key Financial Highlights
10
Jun 2019 Jun 2020 ∆ (%)
Loans (Rp Tn) 107.0 → 103.7 -3.1
Gross NPL Ratio
Net NPL Ratio
NPL Coverage Ratio
3.6%
1.3 %
157%
→
→
→
3.7%
1.8%
112%
0.1
0.5
-45
CASA Ratio
[CASA (Rp Tn)]*
51.9%
58.5
→
→
52.1%
64.8
+0.02
+10.7
LDR 93% → 81% -12
NIM 4.2% → 4.5 +0.3
BOPO 88% → 91% +3
CIR 63% → 59% -4
Profit Before Tax (Rp Bn) 953 → 750 -21.3
Profit After Tax (Rp Bn)
Profit After Tax (Rp Bn) normalized**
711
711
→
→
366
742
-48.5
+4
Notes : * Including Sharia deposits
** Excluding the COVID-19 impact on the increasing allowance for impairment asset and the effect of decreasing CIT – PPh from 25% to 22%
Source : Published Report (Consolidated)

Income Statement
11
Source : Published Report (Consolidated).
• The significant increase in loan impairment was due to higher expected credit losses and market volatility in anticipation to
COVID-19 pandemic. The deterioration in some Macro Economic Variables (MEV) have been applied in calculating the
Probability of Default (PD) of loan portfolio
• The implementation of the new corporate income tax rate cause the Bank have to recalculate the deferred tax assets (DTA)
(which was originally calculated at a rate of 25% to be lowered to 22%), resulting an overstatement in recognition of DTA
assets).
Net Interest Income 3,162 2,821 12% 3,162 2,821 12%
Non Interest Income 990 918 8% 990 918 8%
Revenue 4,152 3,739 11% 4,152 3,739 11%
Operating Expense 2,438 2,359 3% 2,438 2,359 3%
Staff costs 1,304 1,173 11% 1,304 1,173 11%
Promotion costs 49 68 -29% 49 68 -29%
Other costs 1,085 1,117 -3% 1,085 1,117 -3%
Pre Provision Operating Profit 1,714 1,381 24% 1,714 1,381 24%
Provision Expense 1,068 466 129% 863 466 85%
Operating Profit 647 915 -29% 852 915 -7%
Non Operating Income 104 39 169% 104 39 169%
Profit Before Tax 750 953 -21% 955 953 0%
Tax (384) (242) 59% (213) (242) -12%
Profit After Tax 366 711 -48.5% 742 711 4%
Jun-20YoY
Growth
Published Report Normalized Profit *
YOYJun-20 Jun-19 Jun-19(in IDR bn)

Balance Sheet
12 Source : Published Report (Consolidated)
Notes : * Including Reverse repo
** Including Sharia deposits
Cash 1.8 1.9 -5% 2.3 -20%
Placement with Bank Indonesia 16.2 13.5 19% 16.3 -1%
Placement with Other Banks 5.5 3.3 69% 9.6 -42%
Marketable Securities * 22.6 14.8 53% 11.9 91%
Loans (gross) 103.7 107.0 -3% 108.2 -4%
Allowance for Loan Impairment Losses (4.2) (5.9) -29% (3.9) 8%
Other Assets 12.4 13.2 -6% 17.2 -28%
Total Assets 158.0 147.8 7% 161.5 -2%
Deposits ** 124.5 112.8 10% 122.9 1%
- Current Accounts 33.5 29.2 15% 32.4 3%
- Saving Accounts 31.3 29.3 7% 29.8 5%
- Time Deposits 59.7 54.3 10% 60.7 -2%
Subordinated Debt 1.6 4.1 -62% 2.3 -31%
Others Liabilities 8.1 7.6 6% 12.3 -34%
Total Liabilities 134.1 124.5 8% 137.5 -2%
Shareholders' Equity 23.9 23.3 2% 24.0 -1%
Total Liabilities & Shareholders' Equity 158.0 147.8 7% 161.5 -2%
Actual Actual
(in IDR tn) Jun-20 Jun-19 YoY Dec-19 YTD
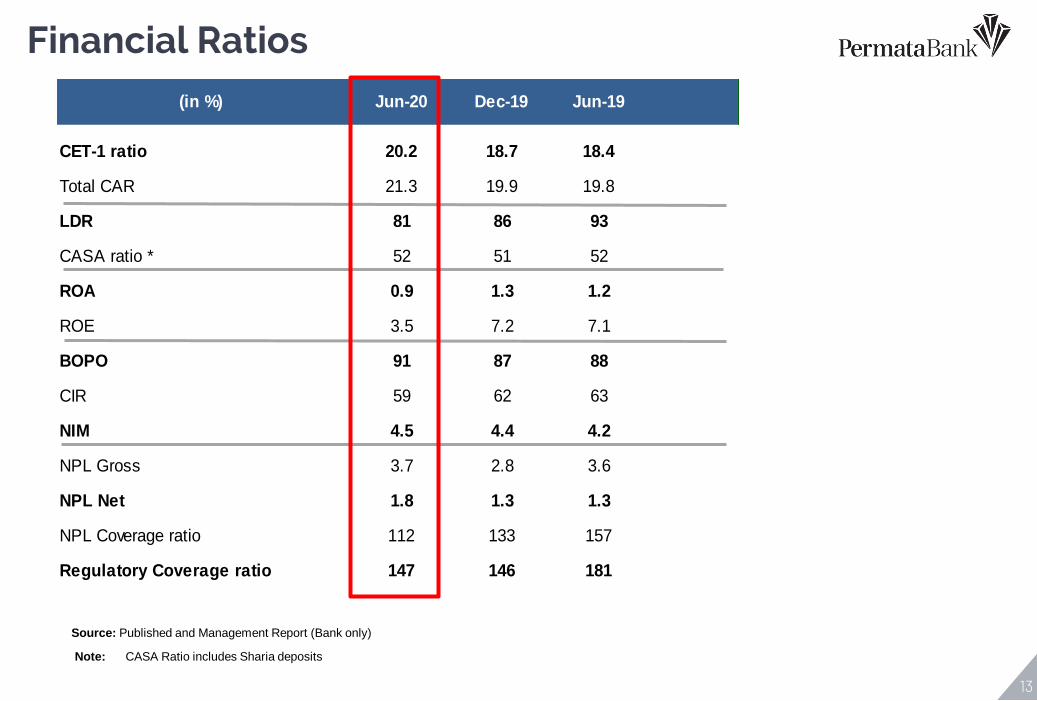
CET-1 ratio 20.2 18.7 18.4
Total CAR 21.3 19.9 19.8
LDR 81 86 93
CASA ratio * 52 51 52
ROA 0.9 1.3 1.2
ROE 3.5 7.2 7.1
BOPO 91 87 88
CIR 59 62 63
NIM 4.5 4.4 4.2
NPL Gross 3.7 2.8 3.6
NPL Net 1.8 1.3 1.3
NPL Coverage ratio 112 133 157
Regulatory Coverage ratio 147 146 181
(in %) Jun-20 Dec-19 Jun-19
13
Source: Published and Management Report (Bank only)
Note: CASA Ratio includes Sharia deposits
Financial Ratios
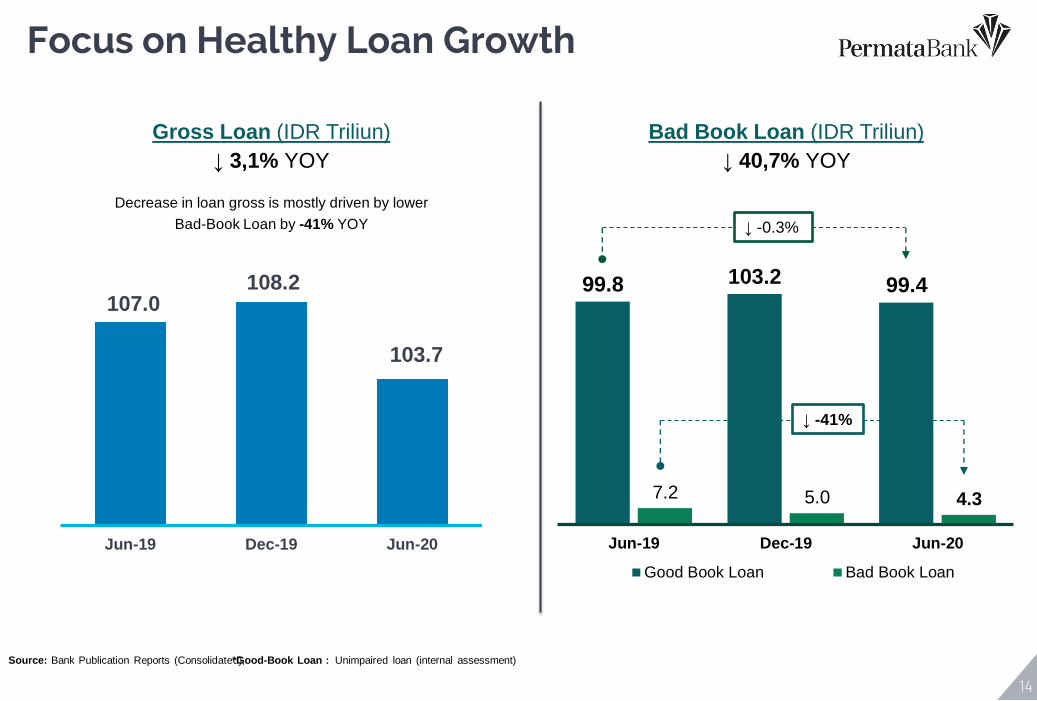
14
Gross Loan (IDR Triliun)
↓ 3,1% YOY
Bad Book Loan (IDR Triliun)
↓ 40,7% YOY
107.0 108.2
103.7
Jun-19 Dec-19 Jun-20
Decrease in loan gross is mostly driven by lower
Bad-Book Loan by -41% YOY
99.8 103.2 99.4
7.2 5.0 4.3
Jun-19 Dec-19 Jun-20
Good Book Loan Bad Book Loan
↓ -41%
↓ -0.3%
Source: Bank Publication Reports (Consolidated), *Good-Book Loan : Unimpaired loan (internal assessment)
Focus on Healthy Loan Growth
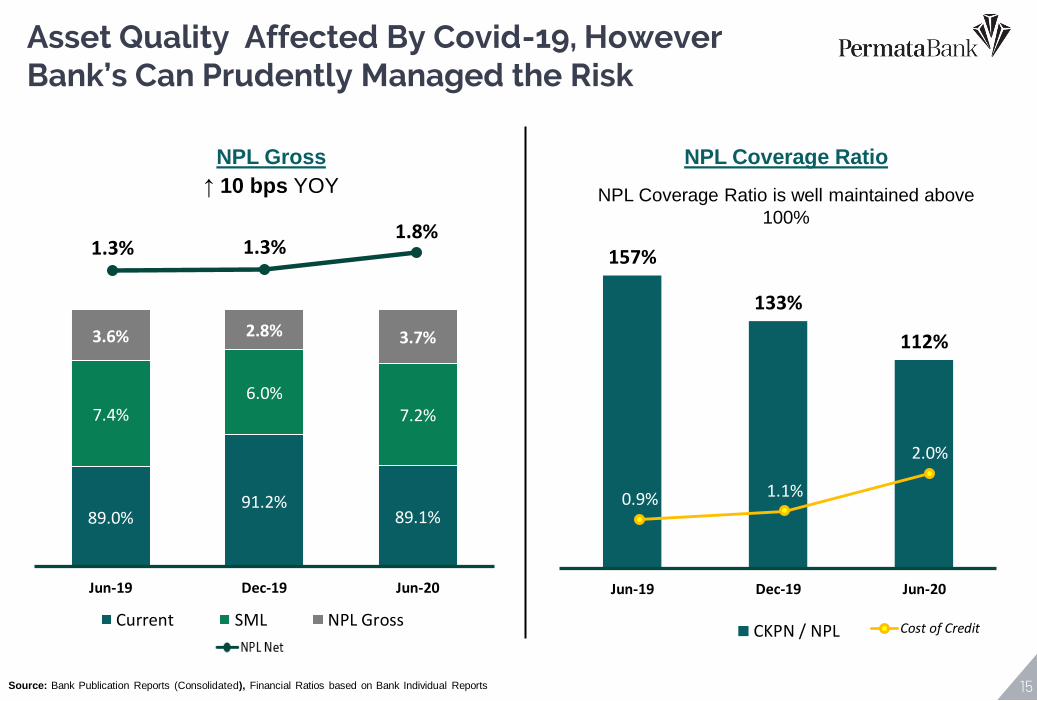
15
Asset Quality Affected By Covid-19, However Bank’s Can Prudently Managed the Risk
89.0% 91.2%
89.1%
7.4% 6.0%
7.2%
3.6% 2.8% 3.7%
Jun-19 Dec-19 Jun-20
Current SML NPL Gross
NPL Gross
↑ 10 bps YOY
NPL Coverage Ratio
NPL Coverage Ratio is well maintained above
100%
1.3% 1.3% 1.8%
157%
133%
112%
Jun-19 Dec-19 Jun-20
CKPN / NPL
0.9% 1.1%
2.0%
Cost of Credit
Source: Bank Publication Reports (Consolidated), Financial Ratios based on Bank Individual Reports

Program For Developing Restructuring & Relaxation of Loan Impacted by Covid-19
16
11.2%
89%
Loan Restructured & Relaxation
Non-Restructured & Non-Relaxed Loan
29%
40%
28%
2%
Loan Tenor Extension
Granting Grace Period
Postponement of Installments / Interest
Payment Holiday
63%
37%
Loan Restructured Loan Relaxation
Loan Affected by Covid-19
IDR 15.5 Trillion Request for Restructuring & Relaxation
11% of Total Credits - June 2020
Restructuring & Relaxation
Program
63% Restructuring, 37% Relaxation
Restructuring Scheme
40% Deferred Installments / Interest

52
51
52
Jun-19 Dec-19 Jun-20
58.5 62.3 64.8
54.3 60.7 59.7
112.8 122.9 124.5
Jun-19 Dec-19 Jun-20
CASA Time Deposits
Growth Deposit, focus on CASA
17
Deposit Composition (IDR Trillion)
By Currencies CASA Ratio (%)
1.3 % (YTD)
10.4% YOY
Source : Published and Management Report
0.16 bps (YOY)
• The third party funds balances increased by 10.4.% from Jun-19 to Jun-20, mainly driven by the increase in CASA by 11% YoY.
• PB’s deposit strategy is continuously focusing on low cost and sustainable funds (CASA).
• The CASA percentage is maintained stable
at 52% in Jun-20 in line with PB’s deposit strategy and in order to contribute a stable NIM%.
+11%
YOY Growth %
+10%
84% 85% 84%
16% 15% 16%
Jun-19 Dec-19 Jun-20
IDR Non IDR

7.9% 7.9% 8.0% 8.3% 8.4% 8.4% 8.4%8.1% 7.8%
4.2% 4.3% 4.3%4.8% 4.7% 4.6% 4.6%
4.0%
3.9%4.0% 4.0% 4.1% 4.0% 4.2% 4.2% 4.4% 4.6%
4.5%
0.0%
1.0%
2.0%
3.0%
4.0%
5.0%
6.0%
7.0%
8.0%
9.0%
10.0%
Jun-18 Sep-18 Dec-18 Mar-19 Jun-19 Sep-19 Dec-19 Mar-20 Jun-20
Yield of Interest Earning Assets Cost of Interest Bearing Liabilities NIM
Increasing NIM and Overall Yield
18
• NIM ratio is 4.5% or increased by 38bps compared to the position of Jun-19 which is at 4.2%. Despite the uncertain economy condition due to COVID-19, the Bank still continuously improving its NIM.
• The increase in NIM was mostly due contributed by decrease in the interest expense due to Bank’s subordinated bond (Tier-2 Capital) and increase in CASA composition during the year. Both caused the cost of funds decrease faster while the loan interest yield is slower to adjust following by its repricing period due to the decrease of BI 7D RR.
Source : Published and Management Report (Bank Only)

298 190
65 113 57 100 95
918
407
191 60 99 46 72 115
990
-
200
400
600
800
1,000
1,200
Gains Fx Sale &Incr. in Value of
Sec. & Gov.Bonds
Loan RelatedFees
Trade Finance Bancassurance Security AgencyServices &
InvestmentServices
Credit Card & E-Channel
Others Total NonInterest Income
Jun-19 Jun-20
Strong Growth of Non Interest Income
19
NFI Composition* (IDR Billion)
Fee to Income Ratio*
+36% +0.4%
-8% -13% +21% -29%
+8%
-19%
• Bank recorded Strong NFI growth of 8%
YoY, contributed from treasury
transaction (FX) which increased by 36%
year-on-year.
• Due to strong growth of NFI, Fee Income
to Income (FIR) ratio was able to be
maintained at 24%.
Source : Published and Management Report (*Bank Only)
23%
22%22%
23%
25%25% 25%
23%
24%
21%
22%
22%
23%
23%
24%
24%
25%
25%
26%
Jun-18 Sep-18 Dec-18 Mar-19 Jun-19 Sep-19 Dec-19 Mar-20 Jun-20

581
32 86 57
421
1,178
622
32 89 103
378
1,223
Staff Cost Marketing &Promotion
InformationTechnology
Depreciation andamortization
Others Total OperatingExpenses
Mar-19 Mar-20
Managable Operating Expenses
20
Expenses Composition* (IDR Billion)
Operation Efficiency Ratios* (BOPO)
+14%
+0.2%
-10%
+80% +3%
+7%
Cost to Income Ratio*
Source : Published and Management Report (*Bank Only)
66% 66%65% 65%
63% 62%62%
58% 59%
54%
56%
58%
60%
62%
64%
66%
68%
Jun
-18
Sep
-18
De
c-1
8
Mar
-19
Jun
-19
Sep
-19
De
c-1
9
Mar
-20
Jun
-20
98%96%
93%
88% 88% 87% 87%
94%
91%
80%
90%
100%
Jun
-18
Sep
-18
Dec
-18
Mar
-19
Jun
-19
Sep
-19
Dec
-19
Mar
-20
Jun
-20

20.1818.37
20.2
0.0
0.9 0.3
1.81
Jun-19 RWA Profit DTA MTM AFS Fixed AssetReval
Others Jun-20
(3,249)(1,561) (341)
113,432 108,282
-
- -
Jun-19 Credit Risk Market Risk OperationalRisk
Jun-20
19.8 19.8 19.9 19.6
21.3
18.4 18.6 18.7 18.4
20.2
Jun-19 Sep-19 Dec-19 Mar-20 Jun-20
Total CAR CET1
Capital Position Remain Strong
21
Risk Weighted Asset (IDR Billion)
-4,7 % YOY +1.81 % YOY
CET-1 Ratio (%)
Min Requirement (incl buffers) : 12.5

Business Updates
Positioning for Quality and Sustainable Growth with Simple, Fast, and Reliable Business Process.
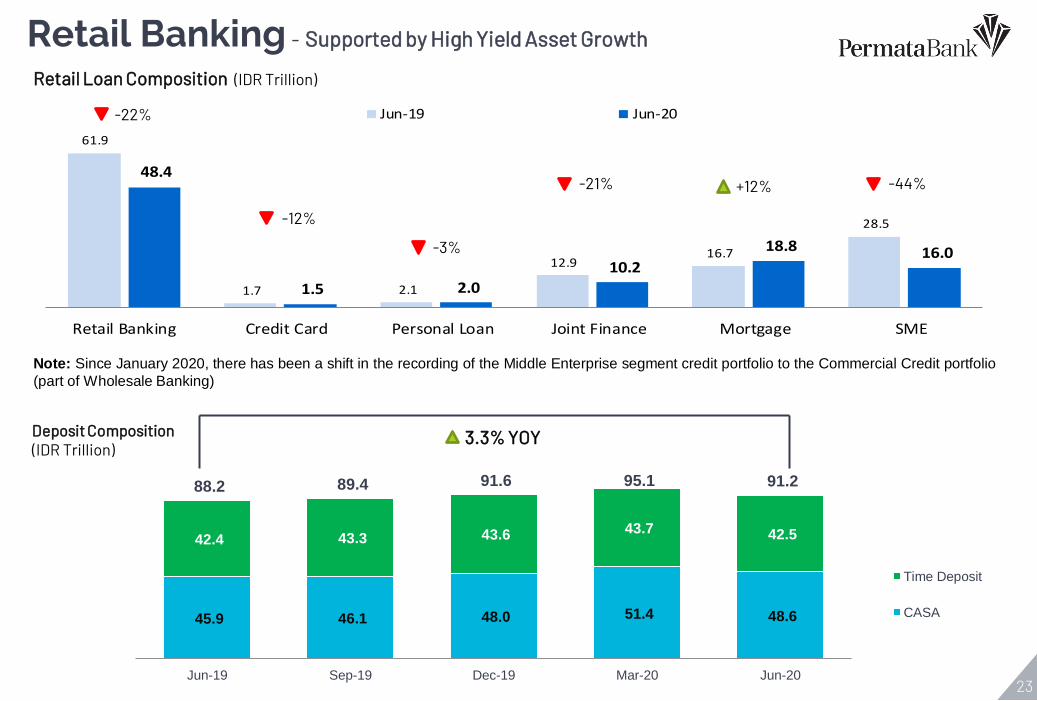
61.9
1.7 2.1
12.9 16.7
28.5
48.4
1.5 2.0
10.2
18.8 16.0
Retail Banking Credit Card Personal Loan Joint Finance Mortgage SME
Jun-19 Jun-20
Retail Banking - Supported by High Yield Asset Growth
23
-22%
-12%
+12% -44% -21%
Retail Loan Composition (IDR Trillion)
-3%
3.3% YOY Deposit Composition (IDR Trillion)
45.9 46.1 48.0 51.4 48.6
42.4 43.3 43.6 43.7 42.5
88.2 89.4 91.6 95.1 91.2
Jun-19 Sep-19 Dec-19 Mar-20 Jun-20
Time Deposit
CASA
Note: Since January 2020, there has been a shift in the recording of the Middle Enterprise segment credit portfolio to the Commercial Credit portfolio
(part of Wholesale Banking)
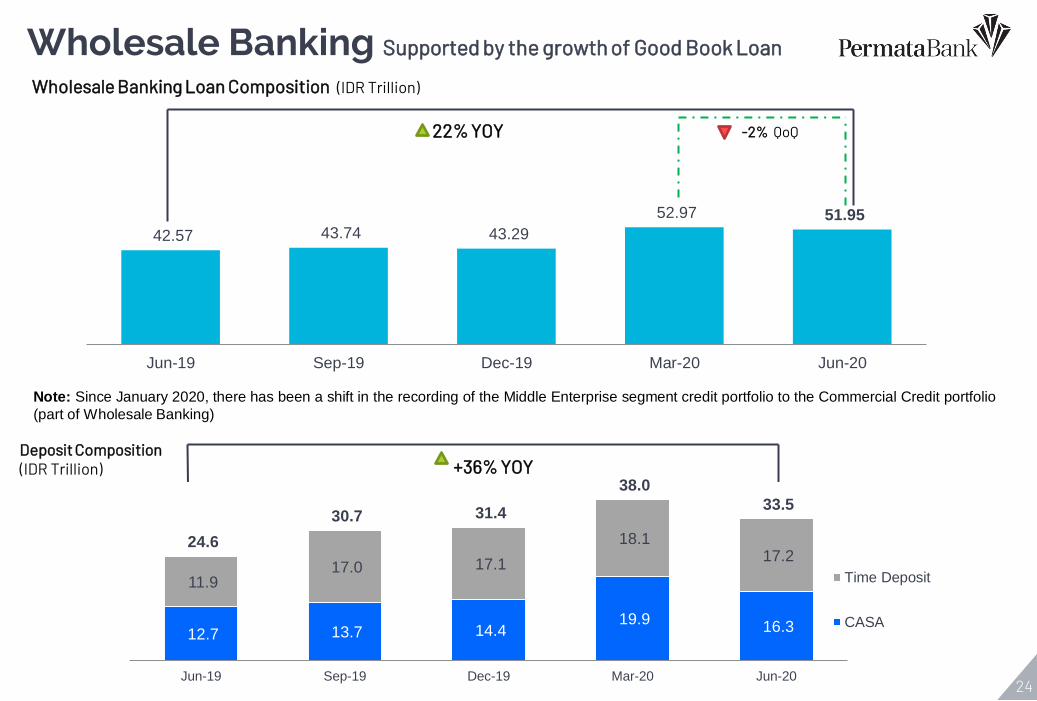
42.57 43.74 43.29
52.97 51.95
Jun-19 Sep-19 Dec-19 Mar-20 Jun-20
Wholesale Banking Supported by the growth of Good Book Loan
24
22% YOY -2% QoQ
Note: Since January 2020, there has been a shift in the recording of the Middle Enterprise segment credit portfolio to the Commercial Credit portfolio
(part of Wholesale Banking)
+36% YOY
12.7 13.7 14.4 19.9
16.3
11.9 17.0 17.1
18.1 17.2
24.6
30.7 31.4
38.0
33.5
Jun-19 Sep-19 Dec-19 Mar-20 Jun-20
Time Deposit
CASA
Wholesale Banking Loan Composition (IDR Trillion)
Deposit Composition (IDR Trillion)
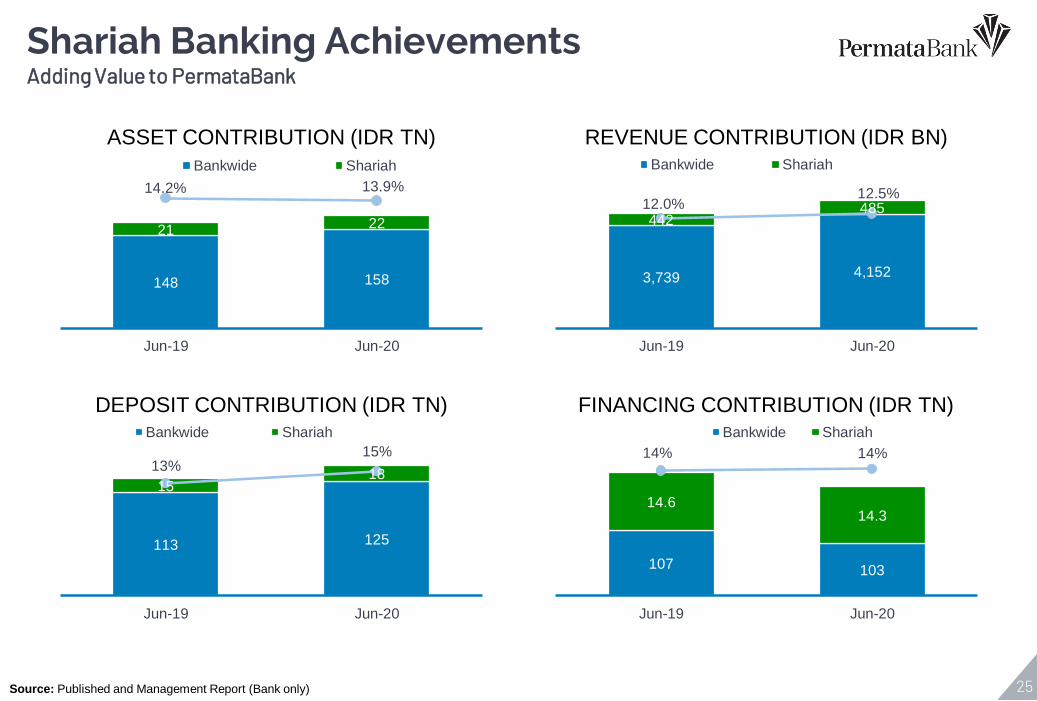
25
Shariah Banking Achievements Adding Value to PermataBank
3,739 4,152
442 485 12.0% 12.5%
Jun-19 Jun-20
Bankwide Shariah
148 158
21 22
14.2% 13.9%
Jun-19 Jun-20
Bankwide Shariah
113 125
15 18
13% 15%
Jun-19 Jun-20
Bankwide Shariah
REVENUE CONTRIBUTION (IDR BN) ASSET CONTRIBUTION (IDR TN)
FINANCING CONTRIBUTION (IDR TN) DEPOSIT CONTRIBUTION (IDR TN)
Source: Published and Management Report (Bank only)
107 103
14.6 14.3
14% 14%
Jun-19 Jun-20
Bankwide Shariah
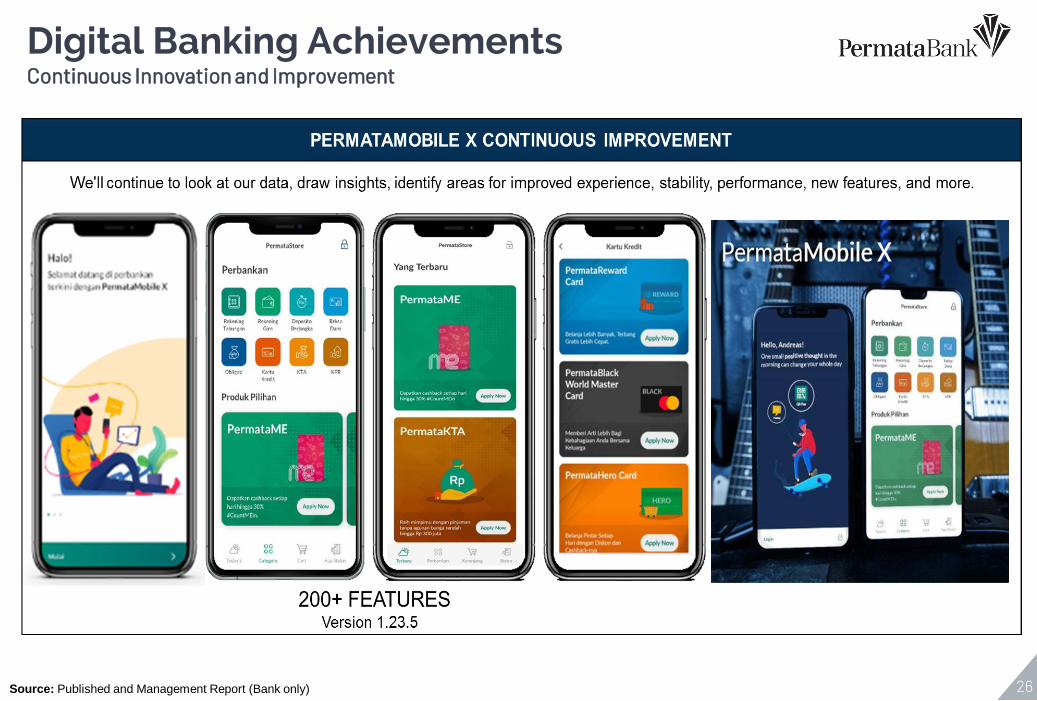
26
Digital Banking Achievements Continuous Innovation and Improvement
Source: Published and Management Report (Bank only)

27
PERMATAMOBILE X Mobile Banking Super App
Source: Published and Management Report (Bank only)

Other Information
Contain Shares Information, Asset Quality’s Debtor, Ratings and others appendices

Board of Commissioner
29
Chartsiri Sophonpanich
President Commissioner
Chalit Tayjasanant
Commissioner
Chong Toh
Commissioner
Niramarn Laisathit
Commissioner
Haryanto Sahari
Independent Commissioner
Rahmat Waluyanto
Independent Commissioner
Goei Siauw Hong
Independent Commissioner
Yap Tjay Soen
Independent Commissioner

Board of Director
30
Ridha DM Wirakusumah
President Director
Dhien Tjahajani
Director
Lea Kusumawijaya
Director
Abdy Salimin
Director
Djumariah Tenteram
Director
Darwin Wibowo
Director
Herwin Bustaman
Director
Dayan sadikin
Director

Shares Perfromance
31
630
665
1045
1260
915
780900
1,080 1,110
1385
985
127012601205 1,215
1,315
995
1,045
1,290 1,265 1280
-
100
200
300
400
500
600
700
0
200
400
600
800
1000
1200
1400
1600
Thou
sand
s
Trading volume Share price
BNLI Dec-18 Mar-19 Jun-19 Sep-19 Dec-19 Mar-20 Jun-20 Price (IDR) 625 960 780 1,110 1,265 1,035 1,270
PBV (x) 0.8 1.2 0.9 1.3 1.5 1.2 1.5
P/E Ratio 26 18 15 21 24 N/M 49
Market Cap (IDR Tn) 17.5 26.9 21.9 31.1 35.5 29.0 35.6
Book Value 22,452 22,955 23,313 23,729 24,037 23,247 23,855
O/S Share (in Bn ) (average) 28.043 28.043 28.043 28.043 28.043 28.043 28.043
PAT 901 377 711 1,093 1,500 0.002 366
EPS 32 54 51 52 54 0.00 26.14
BVS 801 819 831 846 857 829 851

Thank You!
PT Bank Permata Tbk Investor Relations Unit World Trade Center II Jl. Jend. Sudirman Kav. 29-31 Jakarta 12920 - Indonesia Phone : (62-21) 523 - 7899 / 7999 Website : www.permatabank.com Email : [email protected]
Disclaimer: This report has been prepared by PT Bank Permata Tbk independently and is circulated for the purpose of general information only. It is not intended to the specific person who may
receive this report. The information in this report has been obtained from sources which we deem reliable. No warranty (expressed or implied) is made to the accuracy or completeness of the
information. All opinions and estimations included in this report constitute our judgment as of this date and are subject to change without prior notice.
We disclaim any responsibility or liability without prior notice of PT Bank Permata Tbk and/or their respective employees and/or agents whatsoever arising which may be brought against or suffered
by any person as a result of acting in reliance upon the whole or any part of the contents of this report and neither PT Bank Permata Tbk and/or its affiliated companies and/or their respective
employees and/or agents accepts liability for any errors, omissions, negligent or otherwise, in this report and any inaccuracy herein or omission here from which might otherwise arise.
32