DAFTAR PUSTAKA - core.ac.uk · 78 Lampiran 4 no nama usi a se x Lama Men deri ta Stat Per kaw nan...
52
69 DAFTAR PUSTAKA 1. Sudikno BS, 2 Siswanto2 Pengetahuan Hiv Dan Aids Pada Remaja Di Indonesia (Analisis Data Riskesdas 2010). Jurnal Kesehatan Reproduksi. 2011;1(3):145-54. 2. Price SA WL. Patofisiologi Konsep Klinis Proses Proses Penyakit (Pathophysiolgy:Clinical Concepts of Disease Processes). 6 ed. JAKARTA: Penerbit Buku Kedokteran EGC; 2006. 3. WHO. HIV AIDS.[cited 2014]; Available from: www.who.int/hiv. 4. Hawari D. Global Effect HIV AIDS Dimensi PsikologI. JAKARTA: Balai Penerbit FK UI2006. 5. Uvikacansera S. Setiap Menit Lima Orang Terinfeksi HIV AIDS. 2010 15 November 2015 [cited; Available from: www.bataviase.co.id 6. UNAIDS. FACT SHEET. 2014 15 november 2015 [cited; Available from: UNAIDS.org 7. RI DPPK. Statistik Status HIV/AIDS di Indonesia. 2014 12 november 2015 [cited; Available from: http://spiritia.or.id , 8. KPA J. Semarang Penyumbang Angka HIV/AIDS Terbesar di Jawa Tengah 2015 [cited; Available from: http://aidsjateng.or.id/ 9. Dinkes J. Profil kesehatan kota semarang. 2014 [cited 2015 1 november]; Available from: www.dinkes-kotasemarang.go.id 10. Bare BG, & Smeltzer, S. C. Brunner & Suddarth's : Textbook of Medical Surgical Nursing. . Philadelphia: Lippincolt; 2005. 11. Ignatavicius D, & Bayne, M. V. Medical Surgical Nursing: A Nursing ProcessApproach. Philadelphia: W. B. Saunders Company.; 1998. 12. Purnama A, & Haryanti, E. Stigma & Diskriminasi terhadap ODHA. 2006 [cited 2015 10 November]; Available from: http://www.rahima.or.id . 13. Douaihy A. Factors Affecting Quality of Life in Patient with HIV Infection. . 2001 [cited 2015 10 November]; Available from: http://www.nedscape.com/view_articles.html . 14. Nasution A. Kewaspadaan terhadap AIDS (AIDS Awareness). Medan: Fakultas Kesehatan Masyarakat, Universitas Sumatera Utara.; 2004. 15. David FR, & Brian, S. HIV & Psychiatry. 2000 [cited 2015 10 November]; Available from: http://spiritia.or.id . 16. Cichocki M. Dealing with HIV & Depression when Sadness Takes Over. 2009 [cited 2015 10 November]; Available from: http://aids.about.com/es/condition/a/depression.htm 17. Rubin RR, & Peyrot, M. Psychological Issue & Treatments for People with Diabetes. Journal of Clinical Psychology. 2001;57(4):457-78. 18. Atkins JH RS, Sota TL, Rueda S, Fenta H, Bacon J, Rourke SB. Impact of social support on cognitive symptom burden in HIV/AIDS. AIDS Care. 2010;22(7):793–802 19. who. 1994.[cited 2014]; Available from: www.who.int/hiv.
Transcript of DAFTAR PUSTAKA - core.ac.uk · 78 Lampiran 4 no nama usi a se x Lama Men deri ta Stat Per kaw nan...

69
DAFTAR PUSTAKA
1. Sudikno BS, 2 Siswanto2 Pengetahuan Hiv Dan Aids Pada Remaja Di
Indonesia (Analisis Data Riskesdas 2010). Jurnal Kesehatan Reproduksi.
2011;1(3):145-54.
2. Price SA WL. Patofisiologi Konsep Klinis Proses Proses Penyakit
(Pathophysiolgy:Clinical Concepts of Disease Processes). 6 ed. JAKARTA:
Penerbit Buku Kedokteran EGC; 2006.
3. WHO. HIV AIDS.[cited 2014]; Available from: www.who.int/hiv.
4. Hawari D. Global Effect HIV AIDS Dimensi PsikologI. JAKARTA: Balai
Penerbit FK UI2006.
5. Uvikacansera S. Setiap Menit Lima Orang Terinfeksi HIV AIDS. 2010 15
November 2015 [cited; Available from: www.bataviase.co.id
6. UNAIDS. FACT SHEET. 2014 15 november 2015 [cited; Available from:
UNAIDS.org
7. RI DPPK. Statistik Status HIV/AIDS di Indonesia. 2014 12 november 2015
[cited; Available from: http://spiritia.or.id,
8. KPA J. Semarang Penyumbang Angka HIV/AIDS Terbesar di Jawa Tengah
2015 [cited; Available from: http://aidsjateng.or.id/
9. Dinkes J. Profil kesehatan kota semarang. 2014 [cited 2015 1 november];
Available from: www.dinkes-kotasemarang.go.id
10. Bare BG, & Smeltzer, S. C. Brunner & Suddarth's : Textbook of Medical
Surgical Nursing. . Philadelphia: Lippincolt; 2005.
11. Ignatavicius D, & Bayne, M. V. Medical Surgical Nursing: A Nursing
ProcessApproach. Philadelphia: W. B. Saunders Company.; 1998.
12. Purnama A, & Haryanti, E. Stigma & Diskriminasi terhadap ODHA. 2006
[cited 2015 10 November]; Available from: http://www.rahima.or.id.
13. Douaihy A. Factors Affecting Quality of Life in Patient with HIV Infection. .
2001 [cited 2015 10 November]; Available from:
http://www.nedscape.com/view_articles.html.
14. Nasution A. Kewaspadaan terhadap AIDS (AIDS Awareness). Medan:
Fakultas Kesehatan Masyarakat, Universitas Sumatera Utara.; 2004.
15. David FR, & Brian, S. HIV & Psychiatry. 2000 [cited 2015 10 November];
Available from: http://spiritia.or.id.
16. Cichocki M. Dealing with HIV & Depression when Sadness Takes Over.
2009 [cited 2015 10 November]; Available from:
http://aids.about.com/es/condition/a/depression.htm
17. Rubin RR, & Peyrot, M. Psychological Issue & Treatments for People with
Diabetes. Journal of Clinical Psychology. 2001;57(4):457-78.
18. Atkins JH RS, Sota TL, Rueda S, Fenta H, Bacon J, Rourke SB. Impact of
social support on cognitive symptom burden in HIV/AIDS. AIDS Care.
2010;22(7):793–802
19. who. 1994.[cited 2014]; Available from: www.who.int/hiv.

70
20. Kusuma H. Hubungan antara Depresi dan Dukungan Keluarga dengan
KualitasHidup PasienHIV/AIDS yang Menjalani Perawatan di RSUPN Cipto
Mangunkusumo Jakarta. Jakarta: UI; 2011.
21. Sudoyo AW, Setiyohadi, B., Alwi, I., & Setiati, S. Buku Ajar Ilmu Penyakit
Dalam. 4 ed. Jakarta: Pusat Penerbitan Departemen Ilmu Penyakit Dalam FK
UI.; 2007.
22. Zein U, dkk. 100 Pertanyaan Seputar HIV/AIDS Yang Perlu AndaKetahui.
Medan: USU press2006.
23. Yatim DI. Dialog Seputar AIDS. Jakarta: PT Gramedia Widiasarana
Indonesia; 2006. p. 5.
24. S. U. Setiap Menit Lima Orang Terinfeksi HIV AIDS. 2010 [cited 2015 10
November]; Available from: www.bataviase.co.id
25. RI DPPK. Statistik Status HIV/AIDS di Indonesia. 2014 [cited 2015 11
November]; Available from: http://spiritia.or.id,
26. Hoffmann R, & Kamps. HIV Medicine. 2006 [cited; Available from:
www.HIVMedicine.com
27. Meranti PT, & Djauzi S. Respon imun infeksi HIV, Division of Allergy &
Clinical Immunology. 2009 [cited 2015 11 November]; Available from:
www. jacinetwork.org
28. Bare BG, & Smeltzer, S. C. Brunner & Suddarth‟s: Textbook of Medical
Surgical Nursing. Philadelphia: Lippincolt; 2005.
29. Djoerban Z, & Djauzi,S. . HIV/AIDS di Indonesia. Buku AjarIlmu Penyakit
Dalam. 4 ed. Jakarta: Pusat Penerbitan Departemen Penyakit Dalam
FKUI2009. p. 1825-9.
30. Nursalam & Kurniawati ND. Asuhan Keperawatan pada Pasien Terinfeksi
HIV/AIDS. Jakarta: Salemba Medika.; 2009.
31. Kaplan H.I SBJ, Grebb J.A. Sinopsis Psikiatri Terjemahan Widjaja Kusuma.
Jakarta: Binarupa Aksara2010.
32. Davison GC, Neale, John M, Kring, Ann M. . Psikologi Abnormal. Jakarta:
PT. RajaGrafindoPersada2010.
33. Doenges ME, Townsend, M. C., & Moorhouse, M. F. Rencana Asuhan
keperawatan Psikiatri. Jakarta: EGC; 2006.
34. Maslim R. Diagnosa Gangguan Jiwa Rujukan Ringkas Dari PPDGJ-III.
Jakarta: Bagian Ilmu Kedokteran Jiwa FK-Unika Atmajaya; 2002.
35. N. A. Luaran terapi pada gangguan depresi mayor. Cermin dunia kedokteran.
2012;39(2): 92-6
36. Landefeld. Current Geriatric Diagnosis and Treatment. USA: McGrow-Hill;
2004.
37. Radloff L. The CES-D Scale. A self-report depression scale for research in
the general population. Appl Psychol Measures. 1977;1:385-401.
38. Beck AT, Steer, R. A., Ball, R., & Ranieri, W. Comparison of Beck
Depression Inventories-IA and –II in psychiatric outpatients. Journal of
Personality Assessment. 1996;67(3):588-97.
39. Hersen M TS, Beidel DC. Adult Psychopathology and Diagnosis. 5 ed: John
Wiley & Sons; 2007. p. 301-2.
71
40. Laserman J JE, et al. Progression to AIDS : The Effects of Stress,Depressive
Symptoms, and Social Support. Psychosomatic Medicine 1999. p. 397-406.
41. Vitriawan W, Sitorus, R. & Afiyanti, Y. Pengalaman Pasien Pertama Kali
Terdiagnosis HIV/AIDS: Studi Fenomenologi Dalam Perspektif
Keperawatan. Jurnal Keperawatan Indonesia. 2007;11(1):6-12.
42. Astuti AB, K. Hubungan Antara Dukungan Sosial Yang Diterima Dengan
Kebermaknaan Hidup Pada Odha (Orang Dengan HIV/AIDS). Jurnal Insight
2010 [cited 2016 16 januari]; Available from: (http://fpsi.mercubuana-
yogya.ac.id/wpcontent/uploads/2012/06/Agustus_2010_Kondang-
Budiyani.pdf)
43. Fell M NS, Herns M,et al. Mood and Psychiatric Disturbance in HIVand
AIDS : Changes Over Time. British Journal of Psychiatry. 1993;162:604-10.
44. Kaplan HI, Sadock, Benjamin J. & Grebb, Jack A. Sinopsis Psikiatri,.
Tangerang: Binarupa Aksara Publisher2010.
45. Chandra PS DG, Ranjan S. HIV & Psychiatric Disorders. Indian J MedRes.
2005;121:451-6.
46. Schulte R. Depression among Patient with HIV/AIDS in US. 2000 [cited
2015 12 November]; Available from: http://web.ebscohocst.com.
47. MM R. Major depression disorders and aids, in depression and physical
illness. handbook of HIV and social work. New york: Principles Practice;
2008. p. 185-205.
48. J R. HIV and Mood Disorders. ACRIA. 2006;15:1-5.
49. Ironson Gail ea. Dispositional Optimism and the Mechanisms by Which It
Predicts Slower Disease Progression in HIV: Proactive Behavior, Avoidant
Coping, and Depression. International Journal of Behavioral Medicine.
2005;12:86-97.
50. Burack BaS. Depressive Symptoms and CD4 Lymphocyte decline among
HIV infected men. New York: National Library of Medicine National
Institutes of Health.; 1993.
51. Penzak SR RY. Depression Patients with HIV Infection. American Journal of
Health System. 2000;57:376-86
52. Li L, Wu, S., Wu, Z., Sun, S., Cui, H., & Jia, M. Understanding Family
Support for People Living with HIV/AIDS in Yunnan, China. 2004 [cited
2016 13 Januari]; Available from: http://www.ncbi.nlm.nih.gov.
53. WHO. WHOQOL measuring quality of life.. 1997 [cited; Available from:
who.org
54. Cella D. Quality of Life. Psycho-Oncology. New York: Oxford University
Press.; 1998. p. 1135-46.
55. Polonsky A. Understanding & Assesing Diabetes Spesific Quality of Life.
2007 [cited 2015 12 November]; Available from:
http://www.journal.diabetes.org.
56. Nazir KA. Penilaian Kualitas Hidup Pasien Pasca Bedah Pintas Koroner yang
Menjalani Rehabilitasi Fase III dengan Menggunakan SF-36. Jakarta: UI;
2006.

72
57. Afiyah RK. Kualitas Hidup Perempuan yang mengalami Histerektomi serta
Faktor-Faktor yang Mempengaruhinya di Wilayah DKI Jakarta: Study
Grounded Theory. Jakarta: UI; 2010.
58. Khoiruddin A. Faktor-faktor yang mempengaruhi perilaku perawat dalam
enerapkan prosedur tindakan pencegahan universal di instalasi bedah sentral
RSUP Dr.Kariadi. Semarang 2010.
59. Fatiregun A.A KCM. Quality Of Life of People Living With HIV/AIDS in
Kogi State. Benin Journal of Postgraduate Medicine. 2012;11(1):21-7.
60. Nojomi M, Anbary, K., Ranjbar, M Health-Related Quality of Life in Patients
with HIV/AIDS. Archives of Iranian Medicine. 2008;11(6).
61. Worthington C, & Krentz, H. B. Socioeconomic Factors and Health-Related
Quality of Life in Adult Living with HIV. International Journal STD AIDS.
2005;16:608-14.
62. Ichikawa M, & Natpartan, C. Perceived SocialEnvaironment Quality of Life
among People Living with HIV/AIDS in Northern Thailand. AIDS Care.
2006;18:128-32.
63. Pohan. Opportunistic Infection of HIV-Infected/AIDS Patients in Indonesia :
Problems and Challenge. HIV/AIDS Research Inventory 1995-20092009. p.
249-53
64. Odili VU. Determinants of quality of life in hiv/aids patients. West African
Journal of Pharmacy. 2011;22(1):42-8.
65. Carter. Low quality of life associated with poorer survival for patients taking
HIV treatment. 2010 [cited 2016 16 Januari]; Available from:
www.aidsmap.com Departemen Sosial RI
66. David T ea. The Impact of Apathy and Depression on Quality of Life in
Patients Infected with HIV AIDS Patient Care and STDs. 2004;17(3):115-20.
67. Abiodun OA, Bola, A. O., Olorunfemi, A. O., Adeola, O. A., Bamidele F. O.,
& Ibiyemi,F. Relationship between Depression and Quality of Life in Persons
with HIV Infection in Nigeria. 2010 [cited 2016 16 Januari]; Available
from: http://baywood.metapress.com.
68. Sugiyono. Statistik Non Parametrik Untuk Penelitian. Bandung: Alfabeta;
2004.
69. Ginting H NG, Veld WMvd, Srisayekti W. Validating The Beck Depression
Inventory-II in Indonesia‟s General Population and Coronary Heart Disease
Patients. International Journal of Clinical and Health Psychology.
2013;13:235-42
70. Anonim. “The World Health Organization Quality of Life (WHOQOL)-
BREF”. 2004 [cited 2016 1 Januari]; Available from:
http://www.who.int/substance_abuse/research_tools/en/english_whoqol.pdf.
71. Salim OC SN, Kusumaratna RK, Hidayat A. Validitas dan reliabilitas World
Health Organization Quality of Life -BREF untuk mengukur kualitas hidup
lanjut usia. Universa Med. 2007;26(1):27-38.
72. Nursalam. Konsep Dan Penerapan Metodologi Penelitian Ilmu Keperawatan.
2 ed. Jakarta: Salemba Medika.; 2011.
73. Khair BBEM. People Living with HIV/AIDS in the City of Bangkok: Quality
of Life and Related Factors. J Med Assoc Thai 2012;95(6).
73
74. Cotton S. Spiritually and Religion in Patients with HIV AIDS. J Gern Intern
Med. 2006:5-13.
75. Rüütel K. Factors influencing quality of life of people living with HIV in
Estonia: a cross-sectional survey. Journal of the International AIDS Society.
2009;12(13).
76. Nirmal B, Divya, K. R., Dorairaj, V.S., & Venkateswaran, K. . Quality of
Life in HIV/AIDS Patients: A Cross-Sectional Study in South India. 2008 20
mei 2016.
77. Doris. Relationship between CD4 count and quality of life over time among
HIV patients in Uganda: a cohort studyHealth Qual Life Outcomes.
2015;13(144).
78. WHO. Programme On Mental Health WHOQOL Measuring Quality Of Life.
Division of Mental Helath and Prevnetion of Substance Abuse World Health
Organization. 1997.
79. Oluwagbemiga. A Situation Analysis of People Living with HIV/AIDS in
Lagos State. Journal of Social Aspects of HIV/AIDS. HIV/AIDS and Family
Support Systems. 3 ed. Oxford: Community; 2007. p. 668-77.
80. Mukund B. Impact of Mental wellbeing and Quality of Life on Depression,
Anxiety and Stress among people living with HIV/AIDS (PLWHA). The
International Journal of Indian Psychology. 2015;3(1):9.
81. Yaunin Y. Kejadian Gangguan Depresi pada Penderita HIV/AIDS yang
Mengunjungi Poli VCT RSUP Dr. M. Djamil Padang Periode Januari -
September 2013. Jurnal Kesehatan Andalas. 2014;3(2).
82. Kanniappana. Desire for Motherhood: Exploring HIV-positive Women‟s
Desires, Intentions and Decision-Making in Attaining Mother-hood. AIDS
Care. 2007;20(6):625-30.
83. Adewuya Ao. Relationship Between Depression And Quality Of Life In
Persons With Hiv Infection In Nigeria. Int‟l J Psychiatry In Medicine.
2008;38(1):43-51.
74
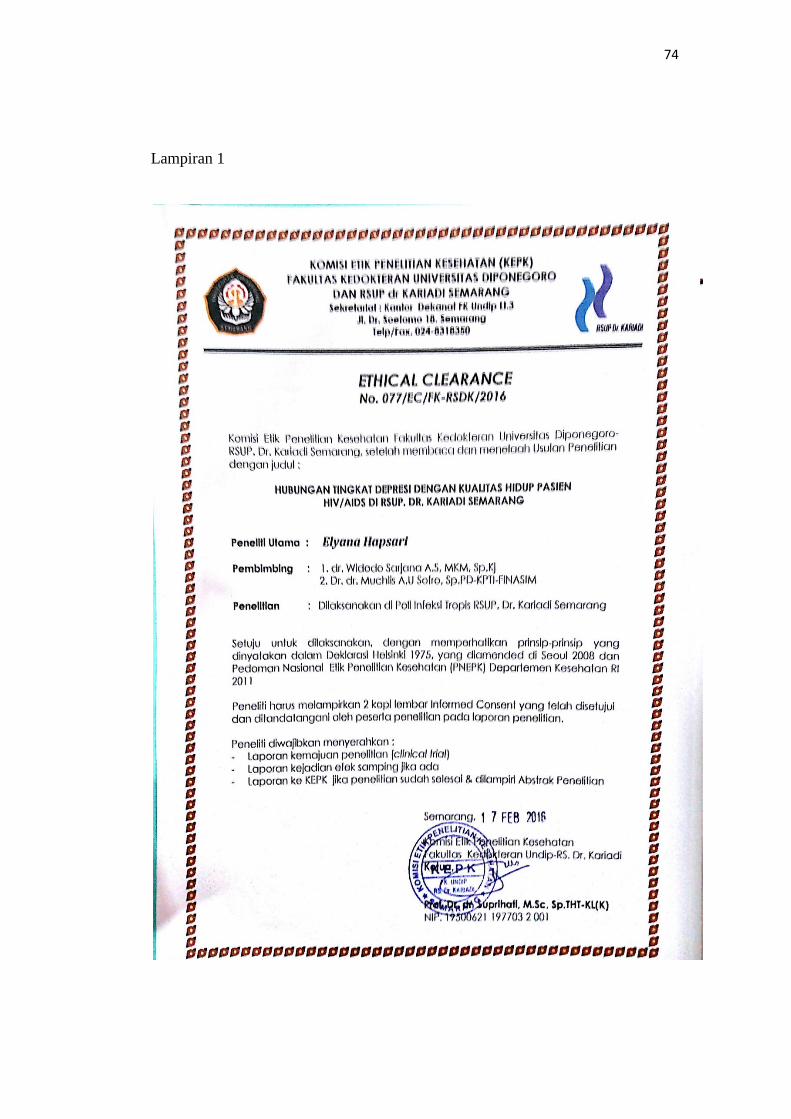
Lampiran 1

75
Lampiran 2

76
Lampiran 3

77

78
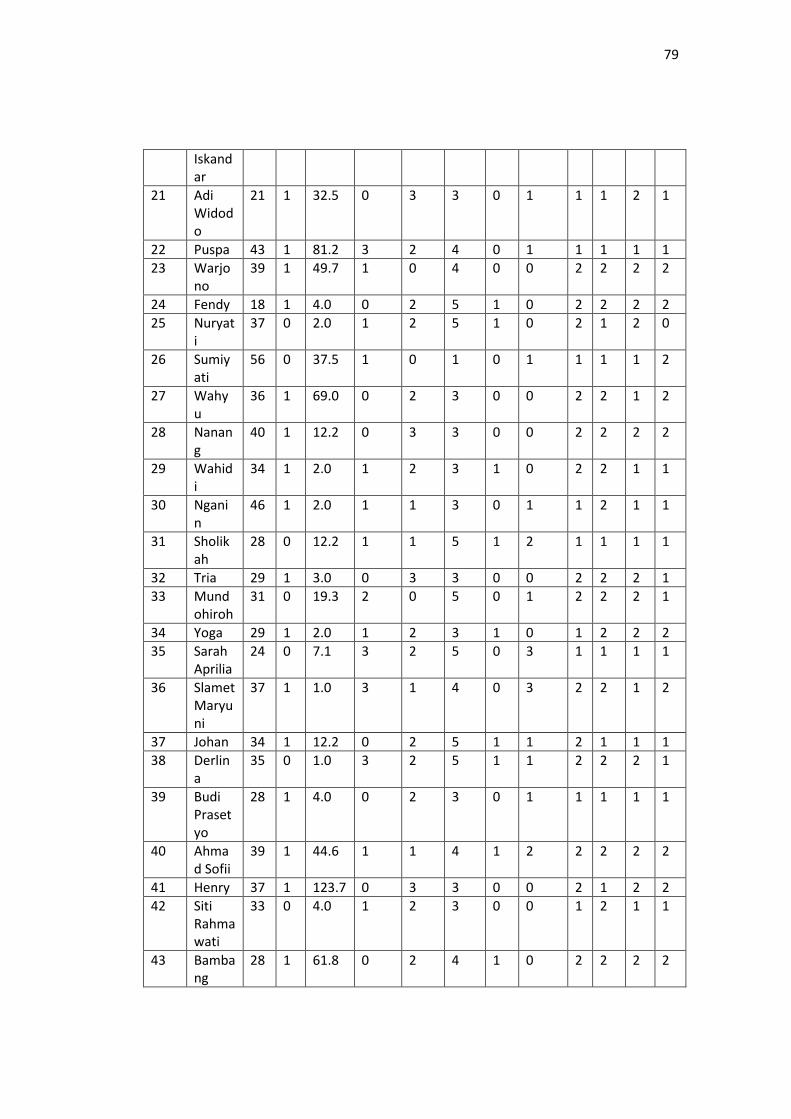
Lampiran 4
no nama usia
sex
Lama Men deri ta
Stat Per kaw nan
Pendi dikan trakhr
Peker jaan
CD4
depresi
fis
psik
sos
Ling
1 Triana 28 0 11.2 3 3 3 0 0 2 2 2 1
2 Haryono
43 1 49.7 1 2 4 0 0 2 2 2 1
3 Alexander
36 1 38.5 1 2 3 0 0 2 2 1 1
4 Erna S 37 0 17.2 3 1 5 0 0 2 2 2 1
5 Maruli 35 1 85.2 0 2 3 0 0 1 0 1 1
6 Tri Isniati
34 0 108.6 2 2 1 0 2 2 1 2 1
7 Ali Purnomo
26 1 39.5 0 2 3 0 1 2 2 2 1
8 Dwi Rahayu
23 0 39.5 0 3 4 1 2 1 1 1 0
9 Supadmi
35 0 19.3 1 2 3 0 0 1 1 2 1
10 Purjiyem
29 0 51.7 2 0 5 0 0 1 2 2 2
11 Slamet Putra
23 1 12.2 0 2 3 0 0 2 2 2 2
12 Devi Anita
26 0 77.1 1 1 5 0 1 1 1 1 1
13 Susilowati
27 0 43.6 0 0 1 1 0 1 1 1 1
14 Rochrriyati
31 0 115.6 1 0 3 0 0 2 1 1 1
15 Imam Effendi
24 1 123.7 0 2 3 0 0 2 1 2 1
16 Dian Riyanti
26 0 76.1 1 1 5 0 0 2 1 2 1
17 Puryanti
38 0 87.2 1 0 5 0 1 2 1 2 2
18 Gatot T H
38 1 16.2 0 3 3 1 0 2 2 2 2
19 Rubyanto
29 1 3.0 0 2 4 1 3 2 1 2 1
20 Sigit 24 1 4.0 0 1 1 1 1 2 1 2 0
79
Iskandar
21 Adi Widodo
21 1 32.5 0 3 3 0 1 1 1 2 1
22 Puspa 43 1 81.2 3 2 4 0 1 1 1 1 1
23 Warjono
39 1 49.7 1 0 4 0 0 2 2 2 2
24 Fendy 18 1 4.0 0 2 5 1 0 2 2 2 2
25 Nuryati
37 0 2.0 1 2 5 1 0 2 1 2 0
26 Sumiyati
56 0 37.5 1 0 1 0 1 1 1 1 2
27 Wahyu
36 1 69.0 0 2 3 0 0 2 2 1 2
28 Nanang
40 1 12.2 0 3 3 0 0 2 2 2 2
29 Wahidi
34 1 2.0 1 2 3 1 0 2 2 1 1
30 Nganin
46 1 2.0 1 1 3 0 1 1 2 1 1
31 Sholikah
28 0 12.2 1 1 5 1 2 1 1 1 1
32 Tria 29 1 3.0 0 3 3 0 0 2 2 2 1
33 Mundohiroh
31 0 19.3 2 0 5 0 1 2 2 2 1
34 Yoga 29 1 2.0 1 2 3 1 0 1 2 2 2
35 Sarah Aprilia
24 0 7.1 3 2 5 0 3 1 1 1 1
36 Slamet Maryuni
37 1 1.0 3 1 4 0 3 2 2 1 2
37 Johan 34 1 12.2 0 2 5 1 1 2 1 1 1
38 Derlina
35 0 1.0 3 2 5 1 1 2 2 2 1
39 Budi Prasetyo
28 1 4.0 0 2 3 0 1 1 1 1 1
40 Ahmad Sofii
39 1 44.6 1 1 4 1 2 2 2 2 2
41 Henry 37 1 123.7 0 3 3 0 0 2 1 2 2
42 Siti Rahmawati
33 0 4.0 1 2 3 0 0 1 2 1 1
43 Bambang
28 1 61.8 0 2 4 1 0 2 2 2 2
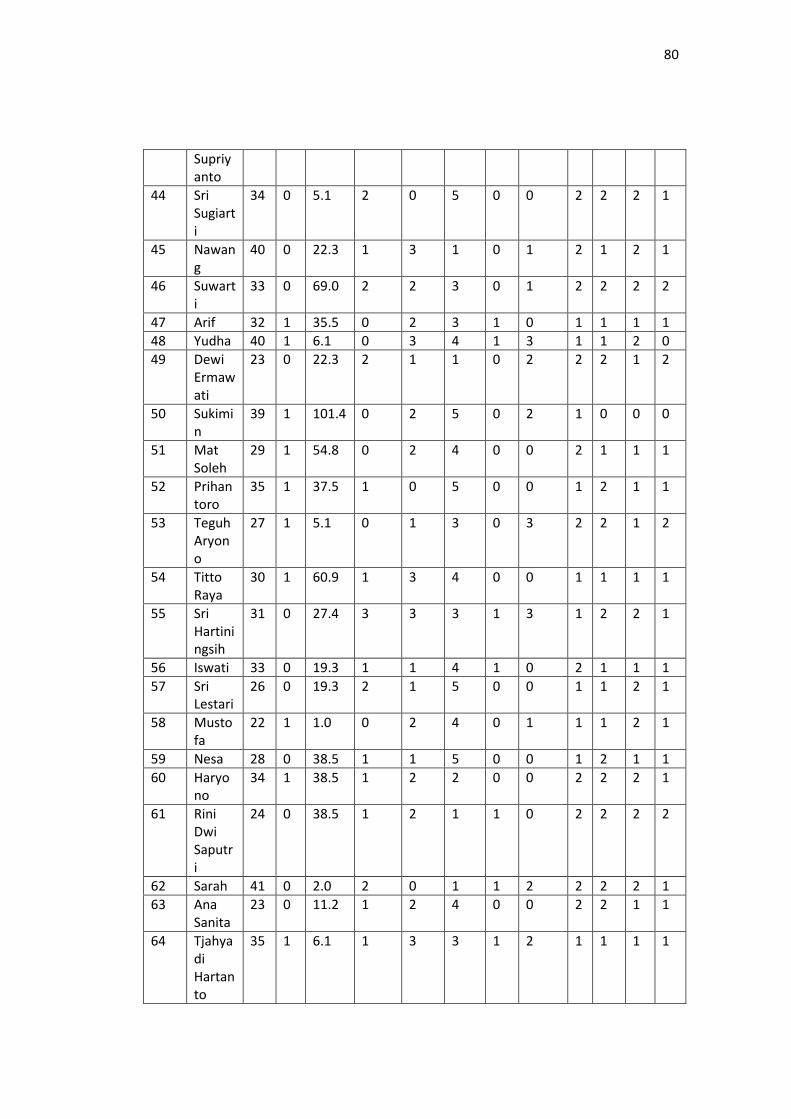
80
Supriyanto
44 Sri Sugiarti
34 0 5.1 2 0 5 0 0 2 2 2 1
45 Nawang
40 0 22.3 1 3 1 0 1 2 1 2 1
46 Suwarti
33 0 69.0 2 2 3 0 1 2 2 2 2
47 Arif 32 1 35.5 0 2 3 1 0 1 1 1 1
48 Yudha 40 1 6.1 0 3 4 1 3 1 1 2 0
49 Dewi Ermawati
23 0 22.3 2 1 1 0 2 2 2 1 2
50 Sukimin
39 1 101.4 0 2 5 0 2 1 0 0 0
51 Mat Soleh
29 1 54.8 0 2 4 0 0 2 1 1 1
52 Prihantoro
35 1 37.5 1 0 5 0 0 1 2 1 1
53 Teguh Aryono
27 1 5.1 0 1 3 0 3 2 2 1 2
54 Titto Raya
30 1 60.9 1 3 4 0 0 1 1 1 1
55 Sri Hartiningsih
31 0 27.4 3 3 3 1 3 1 2 2 1
56 Iswati 33 0 19.3 1 1 4 1 0 2 1 1 1
57 Sri Lestari
26 0 19.3 2 1 5 0 0 1 1 2 1
58 Mustofa
22 1 1.0 0 2 4 0 1 1 1 2 1
59 Nesa 28 0 38.5 1 1 5 0 0 1 2 1 1
60 Haryono
34 1 38.5 1 2 2 0 0 2 2 2 1
61 Rini Dwi Saputri
24 0 38.5 1 2 1 1 0 2 2 2 2
62 Sarah 41 0 2.0 2 0 1 1 2 2 2 2 1
63 Ana Sanita
23 0 11.2 1 2 4 0 0 2 2 1 1
64 Tjahyadi Hartanto
35 1 6.1 1 3 3 1 2 1 1 1 1

81
Wijaya
65 Dian Rosila
33 0 4.0 2 2 5 0 3 1 2 1 0
66 Dewi Setianingsih
36 0 23.3 3 1 5 0 3 2 2 2 1
67 Kuncoro
39 1 39.5 1 3 2 0 3 2 2 1 2
68 Mujiyono
48 1 62.9 1 2 3 0 0 2 1 2 1
69 Suciati 29 0 84.2 1 1 1 0 0 2 2 1 0
70 Kostinah
38 0 37.5 2 2 1 0 0 1 2 2 2
71 Agung Nugroho
33 1 104.5 0 3 4 0 1 2 2 1 1
72 Chris T G
45 1 140.0 1 3 3 1 0 1 1 1 1
73 Nanik Widiyanti
36 0 70.0 3 2 5 0 1 2 2 2 2
74 Orry Lesmana
31 1 79.1 0 2 1 1 3 0 0 1 0
75 Untung Rahardjo
24 1 26.3 0 2 3 0 2 2 2 0 2
76 Kristiyan
35 1 75.0 1 2 5 0 0 2 2 2 2
77 Agus Rahmawan
33 1 40.5 1 3 4 0 0 1 1 1 1
78 Agus 34 1 11.2 1 2 3 1 0 2 2 1 1
79 Iwan Pamuji
25 1 17.2 0 3 4 0 0 1 1 0 1
80 Agus Atiyanto
30 1 4.0 0 3 3 1 0 2 2 2 2
81 Okky Kurniawan
32 1 4.0 0 3 5 1 3 1 2 1 0
82 Yohanes
43 1 31.4 0 2 5 1 0 1 1 1 1
83 Giyati 38 0 10.2 1 2 1 0 1 2 1 2 1
84 Lia 42 0 24.4 3 0 5 1 2 2 2 2 2
85 Sri 31 0 82.2 1 2 4 0 0 1 2 2 2

82
Yuliana
86 Kosiyah
33 0 23.3 3 1 5 0 2 2 1 1 2
87 Rani 36 0 81.2 1 3 5 0 2 2 2 2 1
88 Ali Mas'at
29 1 38.5 0 1 3 1 2 2 2 2 2
89 Bagus Febriantyah
25 1 13.1 0 1 1 1 3 2 2 2 2
90 Supartiyah
48 0 12.2 2 2 1 1 3 2 2 2 2
91 Rica T 33 1 25.3 0 2 3 0 0 1 2 2 2
92 Rodiyatun
35 0 7.1 1 1 5 1 0 2 2 1 1
93 Yoga 29 1 2.0 1 2 3 1 0 2 1 1 1
94 Mustafa
22 1 1.0 0 3 3 0 0 2 2 2 1

83
Lampiran 5 DATA KATEGORIK
Jenis Kelamin
Frequency Percent Valid Percent Cumulative
Percent
Valid
Perempuan 41 43.2 43.6 43.6
Laki-laki 53 55.8 56.4 100.0
Total 94 98.9 100.0
Missing System 1 1.1
Total 95 100.0
Status Perkawinan
Frequency Percent Valid Percent Cumulative
Percent
Valid
Belum menikah 35 36.8 37.2 37.2
Menikah 37 38.9 39.4 76.6
Cerai mati 11 11.6 11.7 88.3
Cerai Hidup 11 11.6 11.7 100.0
Total 94 98.9 100.0
Missing System 1 1.1
Total 95 100.0
Pendidikan Terakhir
Frequency Percent Valid Percent Cumulative
Percent
Valid
SD 11 11.6 11.7 11.7
SMP 19 20.0 20.2 31.9
SMA 43 45.3 45.7 77.7
PT 21 22.1 22.3 100.0
Total 94 98.9 100.0
Missing System 1 1.1
Total 95 100.0

84
Pekerjaan
Frequency Percent Valid Percent Cumulative
Percent
Valid
Tidak Bekerja 14 14.7 14.9 14.9
PNS 2 2.1 2.1 17.0
Swasta 33 34.7 35.1 52.1
Wiraswasta 18 18.9 19.1 71.3
5 27 28.4 28.7 100.0
Total 94 98.9 100.0
Missing System 1 1.1
Total 95 100.0
Jumlah CD4
Frequency Percent Valid Percent Cumulative
Percent
Valid
Tinggi 61 64.2 64.9 64.9
Rendah 33 34.7 35.1 100.0
Total 94 98.9 100.0
Missing System 1 1.1
Total 95 100.0
Depresi
Frequency Percent Valid Percent Cumulative
Percent
Valid
Tidak depresi 50 52.6 53.2 53.2
Depresi ringan 18 18.9 19.1 72.3
Depresi sedang 13 13.7 13.8 86.2
Depresi berat 13 13.7 13.8 100.0
Total 94 98.9 100.0
Missing System 1 1.1
Total 95 100.0
Domain Fisik
Frequency Percent Valid Percent Cumulative
Percent
Valid
Baik 1 1.1 1.1 1.1
Cukup 34 35.8 36.2 37.2
Kurang 59 62.1 62.8 100.0

85
Total 94 98.9 100.0
Missing System 1 1.1
Total 95 100.0
Domain Psikologis
Frequency Percent Valid Percent Cumulative
Percent
Valid
Baik 3 3.2 3.2 3.2
Cukup 37 38.9 39.4 42.6
Kurang 54 56.8 57.4 100.0
Total 94 98.9 100.0
Missing System 1 1.1
Total 95 100.0
Domain Sosial
Frequency Percent Valid Percent Cumulative
Percent
Valid
Baik 3 3.2 3.2 3.2
Cukup 40 42.1 42.6 45.7
Kurang 51 53.7 54.3 100.0
Total 94 98.9 100.0
Missing System 1 1.1
Total 95 100.0
Domain Lingkungan
Frequency Percent Valid Percent Cumulative
Percent
Valid
Baik 9 9.5 9.6 9.6
Cukup 54 56.8 57.4 67.0
Kurang 31 32.6 33.0 100.0
Total 94 98.9 100.0
Missing System 1 1.1
Total 95 100.0

86
DATA NUMERIK
Usia Descriptives
Statistic Std. Error
Umur
Mean 32.74 .707
95% Confidence Interval for Mean Lower Bound 31.34
Upper Bound 34.15
5% Trimmed Mean 32.50
Median 33.00
Variance 46.988
Std. Deviation 6.855
Minimum 18
Maximum 56
Range 38
Interquartile Range 9
Skewness .471 .249
Kurtosis .533 .493
Lama Menderita Descriptives
Statistic Std. Error
Lama Menderita
Mean 36.212 3.5369
95% Confidence Interval for
Mean
Lower Bound 29.188
Upper Bound 43.236
5% Trimmed Mean 33.329
Median 24.833
Variance 1175.922
Std. Deviation 34.2917
Minimum 1.0
Maximum 140.0
Range 139.0
Interquartile Range 49.5
Skewness 1.071 .249
Kurtosis .390 .493

87
UJI NORMALITAS
Tests of Normality
Kolmogorov-Smirnova Shapiro-Wilk
Statistic df Sig. Statistic df Sig.
Umur .069 94 .200* .980 94 .172
Jenis Kelamin .373 94 .000 .630 94 .000
Jumlah CD4 .073 94 .200* .944 94 .001
Pekerjaan .199 94 .000 .853 94 .000
Status Perkawinan .257 94 .000 .812 94 .000
Kecemasan .503 94 .000 .454 94 .000
Depresi .320 94 .000 .751 94 .000
Domain Fisik .401 94 .000 .643 94 .000
Domain Psikologis .367 94 .000 .690 94 .000
Domain Lingkungan .319 94 .000 .764 94 .000
Domain Sosial .350 94 .000 .700 94 .000
*. This is a lower bound of the true significance.
a. Lilliefors Significance Correction
UJI HUBUNGAN
UMUR-DOM FIS
Test of Homogeneity of Variances
Umur
Levene Statistic df1 df2 Sig.
.289 1 91 .592
ANOVA
Umur
Sum of Squares df Mean Square F Sig.
Between Groups 3.077 2 1.538 .032 .968
Within Groups 4366.796 91 47.987
Total 4369.872 93
UMUR-DOM PSIK
Test of Homogeneity of Variances

88
Umur
Levene Statistic df1 df2 Sig.
1.707 2 91 .187
ANOVA
Umur
Sum of Squares df Mean Square F Sig.
Between Groups 16.120 2 8.060 .168 .845
Within Groups 4353.752 91 47.843
Total 4369.872 93
UMUR-SOSIAL
Test of Homogeneity of Variances
Umur
Levene Statistic df1 df2 Sig.
.821 2 91 .443
ANOVA
Umur
Sum of Squares df Mean Square F Sig.
Multiple Comparisons
Dependent Variable: Umur
Tamhane
(I) Domain
Psikologis
(J) Domain Psikologis Mean
Difference (I-J)
Std. Error Sig. 95% Confidence Interval
Lower Bound Upper Bound
Baik Cukup 2.405 2.650 .808 -9.08 13.89
Kurang 2.278 2.461 .818 -11.41 15.96
Cukup Baik -2.405 2.650 .808 -13.89 9.08
Kurang -.128 1.553 1.000 -3.93 3.68
Kurang Baik -2.278 2.461 .818 -15.96 11.41
Cukup .128 1.553 1.000 -3.68 3.93

89
Between Groups 38.074 2 19.037 .400 .672
Within Groups 4331.799 91 47.602
Total 4369.872 93
Multiple Comparisons
Dependent Variable: Umur
Tamhane
(I) Domain Sosial (J) Domain Sosial Mean
Difference (I-J)
Std. Error Sig. 95% Confidence Interval
Lower Bound Upper Bound
Baik Cukup -3.692 4.958 .895 -36.77 29.39
Kurang -3.392 4.939 .914 -37.01 30.22
Cukup Baik 3.692 4.958 .895 -29.39 36.77
Kurang .300 1.444 .996 -3.22 3.82
Kurang Baik 3.392 4.939 .914 -30.22 37.01
Cukup -.300 1.444 .996 -3.82 3.22
UMUR-LINGKUNGAN
Test of Homogeneity of Variances
Umur
Levene Statistic df1 df2 Sig.
.908 2 91 .407
ANOVA
Umur
Sum of Squares df Mean Square F Sig.
Between Groups 24.769 2 12.384 .259 .772
Within Groups 4345.103 91 47.748
Total 4369.872 93
Multiple Comparisons
Dependent Variable: Umur
Tamhane

90
(I) Domain
Lingkungan
(J) Domain
Lingkungan
Mean
Difference (I-
J)
Std.
Error
Sig. 95% Confidence Interval
Lower
Bound
Upper
Bound
Baik Cukup -.463 2.200 .996 -6.63 5.70
Kurang -1.452 2.472 .918 -8.00 5.10
Cukup Baik .463 2.200 .996 -5.70 6.63
Kurang -.989 1.669 .913 -5.11 3.13
Kurang Baik 1.452 2.472 .918 -5.10 8.00
Cukup .989 1.669 .913 -3.13 5.11
LAMA MENDERITA -DOMFIS
Test of Homogeneity of Variances
Lama Menderita
Levene Statistic df1 df2 Sig.
.917 1 91 .341
ANOVA
Lama Menderita
Sum of Squares df Mean Square F Sig.
Between Groups 1859.194 2 929.597 .787 .458
Within Groups 107501.577 91 1181.336
Total 109360.771 93
LAMA-DOMPSIK
Test of Homogeneity of Variances
Lama Menderita
Levene Statistic df1 df2 Sig.
5.058 2 91 .008
ANOVA
Lama Menderita

91
Sum of Squares df Mean Square F Sig.
Between Groups 12247.860 2 6123.930 5.738 .004
Within Groups 97112.911 91 1067.175
Total 109360.771 93
Multiple Comparisons
Dependent Variable: Lama Menderita
Tamhane
(I) Domain
Psikologis
(J) Domain
Psikologis
Mean
Difference (I-
J)
Std.
Error
Sig. 95% Confidence Interval
Lower
Bound
Upper
Bound
Baik Cukup 46.3520
* 9.4080 .004 17.648 75.056
Kurang 59.4148* 7.5947 .009 25.930 92.900
Cukup Baik -46.3520
* 9.4080 .004 -75.056 -17.648
Kurang 13.0629 7.5783 .247 -5.575 31.701
Kurang Baik -59.4148
* 7.5947 .009 -92.900 -25.930
Cukup -13.0629 7.5783 .247 -31.701 5.575
*. The mean difference is significant at the 0.05 level.
LAMA-DOMSOS
Test of Homogeneity of Variances
Lama Menderita
Levene Statistic df1 df2 Sig.
.267 2 91 .766
ANOVA
Lama Menderita
Sum of
Squares
Df Mean Square F Sig.
Between Groups 622.393 2 311.197 .260 .771
Within Groups 108738.378 91 1194.927
Total 109360.771 93
Multiple Comparisons
Dependent Variable: Lama Menderita

92
Tamhane
(I) Domain Sosial (J) Domain Sosial Mean
Difference (I-J)
Std. Error Sig. 95% Confidence Interval
Lower Bound Upper Bound
Baik Cukup
10.9908 27.2690 .979 -172.669 194.651
Kurang 13.7209 27.0799 .961 -175.398 202.840
Cukup Baik
-10.9908 27.2690 .979 -194.651 172.669
Kurang 2.7301 7.3015 .975 -15.073 20.533
Kurang Baik -13.7209 27.0799 .961 -202.840 175.398
Cukup -2.7301 7.3015 .975 -20.533 15.073
LAMA-DOM LING
Test of Homogeneity of Variances
Lama Menderita
Levene Statistic df1 df2 Sig.
1.262 2 91 .288
ANOVA
Lama Menderita
Sum of Squares df Mean Square F Sig.
Between Groups 159.815 2 79.908 .067 .936
Within Groups 109200.956 91 1200.011
Total 109360.771 93
Multiple Comparisons
Dependent Variable: Lama Menderita
Tamhane

93
(I) Domain
Lingkungan
(J) Domain
Lingkungan
Mean
Difference
(I-J)
Std.
Error
Sig. 95% Confidence
Interval
Lower
Bound
Upper
Bound
Baik
Cukup .8568 14.585
3
1.000 -40.753 42.467
Kurang -1.9895 14.761
3
.999 -43.757 39.778
Cukup Baik
-.8568 14.585
3
1.000 -42.467 40.753
Kurang -2.8463 7.2841 .972 -20.652 14.960
Kurang Baik
1.9895 14.761
3
.999 -39.778 43.757
Cukup 2.8463 7.2841 .972 -14.960 20.652
JENIS KELAMIN-DOM FIS
Crosstab
Domain Fisik Total
Baik Cukup Kurang
Jenis Kelamin
Perempuan Count 0 15 26 41
% within Jenis Kelamin 0.0% 36.6% 63.4% 100.0%
Laki-laki Count 1 19 33 53
% within Jenis Kelamin 1.9% 35.8% 62.3% 100.0%
Total Count 1 34 59 94
% within Jenis Kelamin 1.1% 36.2% 62.8% 100.0%
Chi-Square Tests
Value df Asymp. Sig. (2-
sided)
Pearson Chi-Square .782a 2 .676
Likelihood Ratio 1.154 2 .561
Linear-by-Linear Association .082 1 .775
N of Valid Cases 94

94
a. 2 cells (33.3%) have expected count less than 5. The minimum
expected count is .44.
JENIS KELAMIN-DOM PSIK
Crosstab
Domain Psikologis Total
Baik Cukup Kurang
Jenis Kelamin
Perempuan Count 0 17 24 41
% within Jenis Kelamin 0.0% 41.5% 58.5% 100.0%
Laki-laki Count 3 20 30 53
% within Jenis Kelamin 5.7% 37.7% 56.6% 100.0%
Total Count 3 37 54 94
% within Jenis Kelamin 3.2% 39.4% 57.4% 100.0%
Chi-Square Tests
Value df Asymp. Sig. (2-
sided)
Pearson Chi-Square 2.417a 2 .299
Likelihood Ratio 3.534 2 .171
Linear-by-Linear Association .423 1 .516
N of Valid Cases 94
a. 2 cells (33.3%) have expected count less than 5. The minimum
expected count is 1.31.
JENIS KELAMIN-DOM SOS
Crosstab
Domain Sosial Total
Baik Cukup Kurang
Jenis Kelamin
Perempuan Count 0 16 25 41
% within Jenis Kelamin 0.0% 39.0% 61.0% 100.0%
Laki-laki Count 3 24 26 53
% within Jenis Kelamin 5.7% 45.3% 49.1% 100.0%
Total Count 3 40 51 94
% within Jenis Kelamin 3.2% 42.6% 54.3% 100.0%

95
Chi-Square Tests
Value df Asymp. Sig. (2-
sided)
Pearson Chi-Square 3.139a 2 .208
Likelihood Ratio 4.253 2 .119
Linear-by-Linear Association 2.253 1 .133
N of Valid Cases 94
a. 2 cells (33.3%) have expected count less than 5. The minimum
expected count is 1.31.
JENIS KELAMIN-DOM LING
Crosstab
Domain Lingkungan Total
Baik Cukup Kurang
Jenis Kelamin
Perempuan Count 4 25 12 41
% within Jenis Kelamin 9.8% 61.0% 29.3% 100.0%
Laki-laki Count 5 29 19 53
% within Jenis Kelamin 9.4% 54.7% 35.8% 100.0%
Total Count 9 54 31 94
% within Jenis Kelamin 9.6% 57.4% 33.0% 100.0%
Chi-Square Tests
Value df Asymp. Sig. (2-
sided)
Pearson Chi-Square .464a 2 .793
Likelihood Ratio .466 2 .792
Linear-by-Linear Association .294 1 .588
N of Valid Cases 94
a. 1 cells (16.7%) have expected count less than 5. The minimum
expected count is 3.93.

96
JUMLAH CD4 – DOM FIS
Crosstab
Domain Fisik Total
Baik Cukup Kurang
Jumlah CD4
Tinggi Count 0 23 38 61
% within Jumlah CD4 0.0% 37.7% 62.3% 100.0%
Rendah Count 1 11 21 33
% within Jumlah CD4 3.0% 33.3% 63.6% 100.0%
Total Count 1 34 59 94
% within Jumlah CD4 1.1% 36.2% 62.8% 100.0%
Chi-Square Tests
Value df Asymp. Sig. (2-
sided)
Pearson Chi-Square 1.968a 2 .374
Likelihood Ratio 2.214 2 .331
Linear-by-Linear Association .023 1 .878
N of Valid Cases 94
a. 2 cells (33.3%) have expected count less than 5. The minimum
expected count is .35.
JUMLAH CD4 – DOM PSIK
Crosstab
Domain Psikologis Total
Baik Cukup Kurang
Jumlah CD4
Tinggi Count 2 23 36 61
% within Jumlah CD4 3.3% 37.7% 59.0% 100.0%
Rendah Count 1 14 18 33
% within Jumlah CD4 3.0% 42.4% 54.5% 100.0%
Total Count 3 37 54 94
% within Jumlah CD4 3.2% 39.4% 57.4% 100.0%

97
Chi-Square Tests
Value df Asymp. Sig. (2-
sided)
Pearson Chi-Square .200a 2 .905
Likelihood Ratio .199 2 .905
Linear-by-Linear Association .121 1 .728
N of Valid Cases 94
a. 2 cells (33.3%) have expected count less than 5. The minimum
expected count is 1.05.
JUMLAH CD4 – DOM SOS
Crosstab
Domain Sosial Total
Baik Cukup Kurang
Jumlah CD4
Tinggi Count 3 25 33 61
% within Jumlah CD4 4.9% 41.0% 54.1% 100.0%
Rendah Count 0 15 18 33
% within Jumlah CD4 0.0% 45.5% 54.5% 100.0%
Total Count 3 40 51 94
% within Jumlah CD4 3.2% 42.6% 54.3% 100.0%
Chi-Square Tests
Value df Asymp. Sig. (2-
sided)
Pearson Chi-Square 1.724a 2 .422
Likelihood Ratio 2.695 2 .260
Linear-by-Linear Association .194 1 .659
N of Valid Cases 94
a. 2 cells (33.3%) have expected count less than 5. The minimum
expected count is 1.05.

98
JUMLAH CD4 – DOM LING
Crosstab
Domain Lingkungan Total
Baik Cukup Kurang
Jumlah CD4
Tinggi Count 3 38 20 61
% within Jumlah CD4 4.9% 62.3% 32.8% 100.0%
Rendah Count 6 16 11 33
% within Jumlah CD4 18.2% 48.5% 33.3% 100.0%
Total Count 9 54 31 94
% within Jumlah CD4 9.6% 57.4% 33.0% 100.0%
Chi-Square Tests
Value df Asymp. Sig. (2-
sided)
Pearson Chi-Square 4.648a 2 .098
Likelihood Ratio 4.431 2 .109
Linear-by-Linear Association .924 1 .336
N of Valid Cases 94
STATUS PERKAWINAN – DOM FIS
Crosstab
Domain Fisik Total
Baik Cukup Kurang
Status
Perkawinan
Belum
menikah
Count 1 13 21 35
% within Status
Perkawinan
2.9% 37.1% 60.0% 100.0%
Menikah
Count 0 14 23 37
% within Status
Perkawinan
0.0% 37.8% 62.2% 100.0%
Cerai mati
Count 0 4 7 11
% within Status
Perkawinan
0.0% 36.4% 63.6% 100.0%
Cerai Hidup
Count 0 3 8 11
% within Status
Perkawinan
0.0% 27.3% 72.7% 100.0%
Total
Count 1 34 59 94
% within Status
Perkawinan
1.1% 36.2% 62.8% 100.0%
a. 1 cells (16.7%) have
expected count less
than 5. The minimum
expected count is 3.16.
99
Chi-Square Tests
Value df Asymp. Sig. (2-
sided)
Pearson Chi-Square 2.184a 6 .902
Likelihood Ratio 2.489 6 .870
Linear-by-Linear Association .765 1 .382
N of Valid Cases 94
a. 6 cells (50.0%) have expected count less than 5. The minimum expected
count is .12.
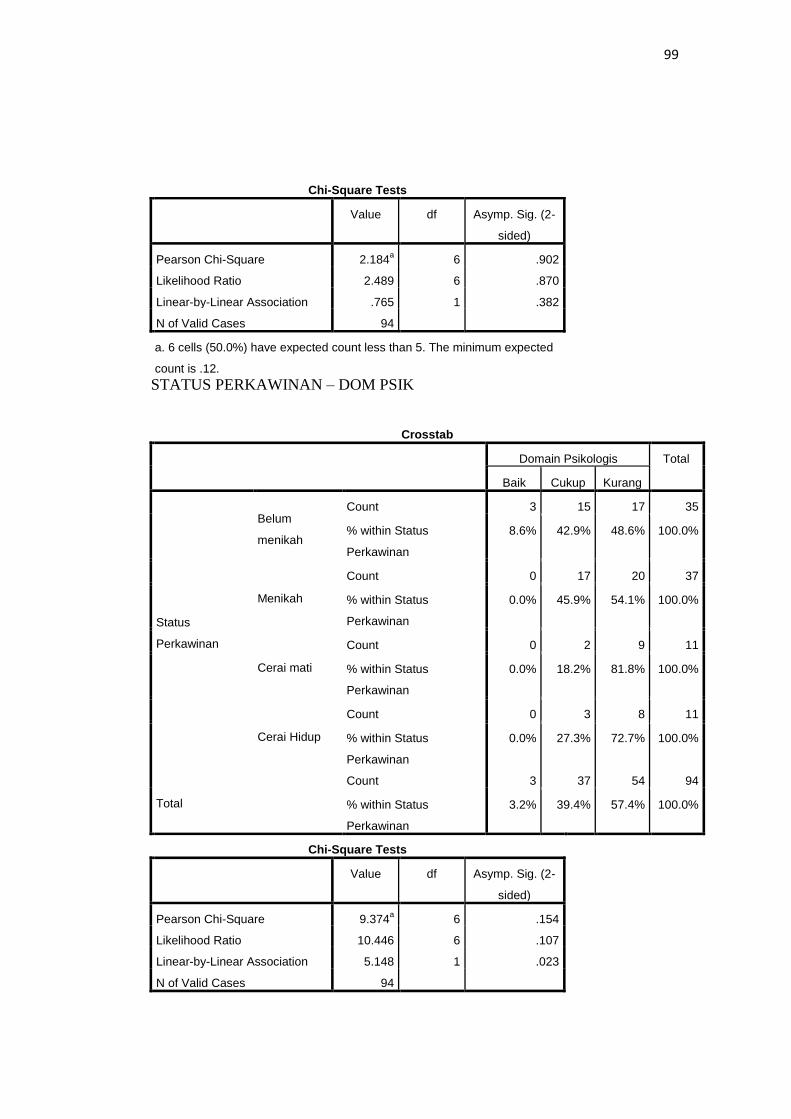
STATUS PERKAWINAN – DOM PSIK
Crosstab
Domain Psikologis Total
Baik Cukup Kurang
Status
Perkawinan
Belum
menikah
Count 3 15 17 35
% within Status
Perkawinan
8.6% 42.9% 48.6% 100.0%
Menikah
Count 0 17 20 37
% within Status
Perkawinan
0.0% 45.9% 54.1% 100.0%
Cerai mati
Count 0 2 9 11
% within Status
Perkawinan
0.0% 18.2% 81.8% 100.0%
Cerai Hidup
Count 0 3 8 11
% within Status
Perkawinan
0.0% 27.3% 72.7% 100.0%
Total
Count 3 37 54 94
% within Status
Perkawinan
3.2% 39.4% 57.4% 100.0%
Chi-Square Tests
Value df Asymp. Sig. (2-
sided)
Pearson Chi-Square 9.374a 6 .154
Likelihood Ratio 10.446 6 .107
Linear-by-Linear Association 5.148 1 .023
N of Valid Cases 94
100
a. 6 cells (50.0%) have expected count less than 5. The minimum expected
count is .35.
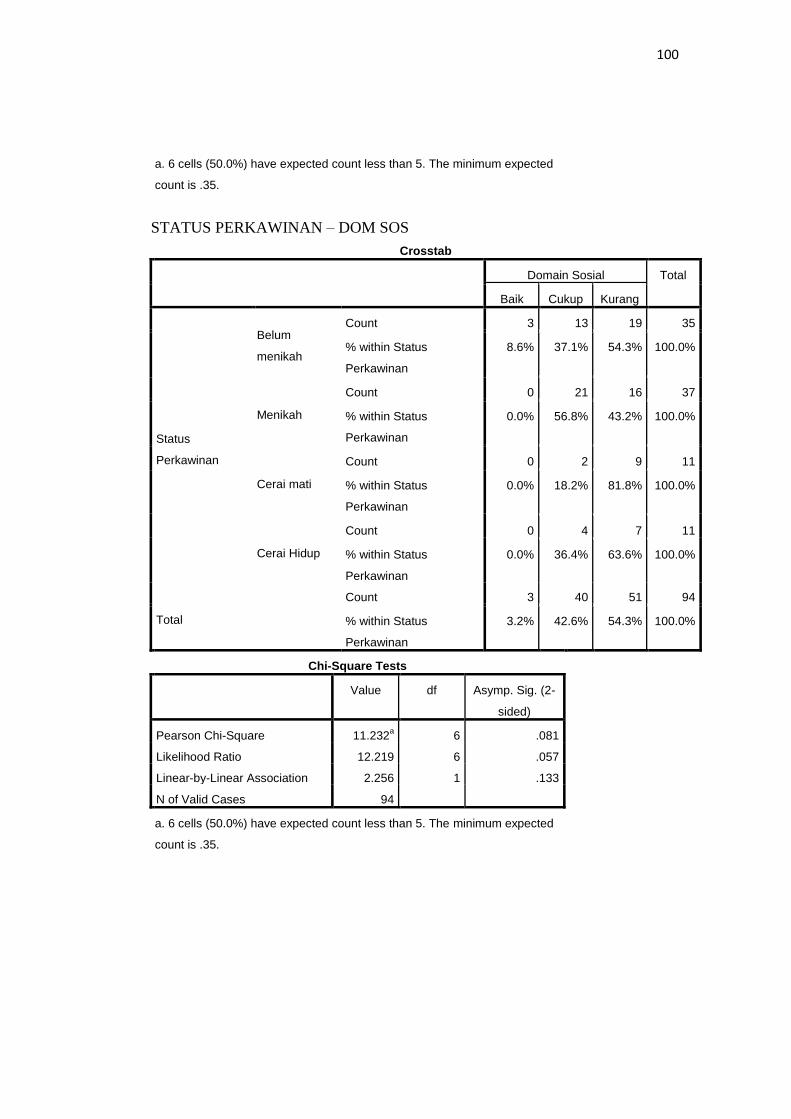
STATUS PERKAWINAN – DOM SOS
Crosstab
Domain Sosial Total
Baik Cukup Kurang
Status
Perkawinan
Belum
menikah
Count 3 13 19 35
% within Status
Perkawinan
8.6% 37.1% 54.3% 100.0%
Menikah
Count 0 21 16 37
% within Status
Perkawinan
0.0% 56.8% 43.2% 100.0%
Cerai mati
Count 0 2 9 11
% within Status
Perkawinan
0.0% 18.2% 81.8% 100.0%
Cerai Hidup
Count 0 4 7 11
% within Status
Perkawinan
0.0% 36.4% 63.6% 100.0%
Total
Count 3 40 51 94
% within Status
Perkawinan
3.2% 42.6% 54.3% 100.0%
Chi-Square Tests
Value df Asymp. Sig. (2-
sided)
Pearson Chi-Square 11.232a 6 .081
Likelihood Ratio 12.219 6 .057
Linear-by-Linear Association 2.256 1 .133
N of Valid Cases 94
a. 6 cells (50.0%) have expected count less than 5. The minimum expected
count is .35.

101
STATUS PERKAWINAN – DOM LING
Crosstab
Domain Lingkungan Total
Baik Cukup Kurang
Status
Perkawinan
Belum
menikah
Count 6 16 13 35
% within Status
Perkawinan
17.1% 45.7% 37.1% 100.0
%
Menikah
Count 2 26 9 37
% within Status
Perkawinan
5.4% 70.3% 24.3% 100.0
%
Cerai mati
Count 1 5 5 11
% within Status
Perkawinan
9.1% 45.5% 45.5% 100.0
%
Cerai Hidup
Count 0 7 4 11
% within Status
Perkawinan
0.0% 63.6% 36.4% 100.0
%
Total
Count 9 54 31 94
% within Status
Perkawinan
9.6% 57.4% 33.0% 100.0
%
Chi-Square Tests
Value df Asymp. Sig. (2-
sided)
Pearson Chi-Square 7.650a 6 .265
Likelihood Ratio 8.460 6 .206
Linear-by-Linear Association .887 1 .346
N of Valid Cases 94
a. 6 cells (50.0%) have expected count less than 5. The minimum expected
count is 1.05.

102
PENDIDIKAN TERAKHIR – DOM FIS
Crosstab
Domain Fisik Total
Baik Cukup Kurang
Pendidikan Terakhir
SD Count 0 4 7 11
% within Pendidikan Terakhir 0.0% 36.4% 63.6% 100.0%
SMP Count 0 5 14 19
% within Pendidikan Terakhir 0.0% 26.3% 73.7% 100.0%
SMA Count 1 15 27 43
% within Pendidikan Terakhir 2.3% 34.9% 62.8% 100.0%
PT Count 0 10 11 21
% within Pendidikan Terakhir 0.0% 47.6% 52.4% 100.0%
Total Count 1 34 59 94
% within Pendidikan Terakhir 1.1% 36.2% 62.8% 100.0%
Chi-Square Tests
Value Df Asymp. Sig. (2-
sided)
Pearson Chi-Square 3.200a 6 .783
Likelihood Ratio 3.565 6 .735
Linear-by-Linear Association 1.046 1 .306
N of Valid Cases 94
PENDIDIKAN TERAKHIR – DOM PSIK
Crosstab
Domain Psikologis Total
Baik Cukup Kurang
Pendidikan Terakhir
SD Count 0 4 7 11
% within Pendidikan Terakhir 0.0% 36.4% 63.6% 100.0%
SMP Count 0 7 12 19
% within Pendidikan Terakhir 0.0% 36.8% 63.2% 100.0%
SMA Count 3 16 24 43
% within Pendidikan Terakhir 7.0% 37.2% 55.8% 100.0%
PT Count 0 10 11 21
% within Pendidikan Terakhir 0.0% 47.6% 52.4% 100.0%
Total Count 3 37 54 94
% within Pendidikan Terakhir 3.2% 39.4% 57.4% 100.0%
a. 5 cells (41.7%) have expected
count less than 5. The minimum
expected count is .12.

103
Chi-Square Tests
Value Df Asymp. Sig. (2-
sided)
Pearson Chi-Square 4.323a 6 .633
Likelihood Ratio 5.434 6 .489
Linear-by-Linear Association .684 1 .408
N of Valid Cases 94
a. 5 cells (41.7%) have expected count less than 5. The minimum
expected count is .35.
PENDIDIKAN TERAKHIR – DOM SOS
Crosstab
Domain Sosial Total
Baik Cukup Kurang
Pendidikan Terakhir
SD Count 0 4 7 11
% within Pendidikan Terakhir 0.0% 36.4% 63.6% 100.0%
SMP Count 0 11 8 19
% within Pendidikan Terakhir 0.0% 57.9% 42.1% 100.0%
SMA Count 2 17 24 43
% within Pendidikan Terakhir 4.7% 39.5% 55.8% 100.0%
PT Count 1 8 12 21
% within Pendidikan Terakhir 4.8% 38.1% 57.1% 100.0%
Total Count 3 40 51 94
% within Pendidikan Terakhir 3.2% 42.6% 54.3% 100.0%
Chi-Square Tests
Value df Asymp. Sig. (2-
sided)
Pearson Chi-Square 3.494a 6 .745
Likelihood Ratio 4.331 6 .632
Linear-by-Linear Association .025 1 .876
N of Valid Cases 94
a. 5 cells (41.7%) have expected count less than 5. The minimum
expected count is .35.

104
PENDIDIKAN TERAKHIR – DOM LING
Crosstab
Domain Lingkungan Total
Baik Cukup Kurang
Pendidikan Terakhir
SD Count 0 6 5 11
% within Pendidikan Terakhir 0.0% 54.5% 45.5% 100.0%
SMP Count 2 10 7 19
% within Pendidikan Terakhir 10.5% 52.6% 36.8% 100.0%
SMA Count 4 25 14 43
% within Pendidikan Terakhir 9.3% 58.1% 32.6% 100.0%
PT Count 3 13 5 21
% within Pendidikan Terakhir 14.3% 61.9% 23.8% 100.0%
Total Count 9 54 31 94
% within Pendidikan Terakhir 9.6% 57.4% 33.0% 100.0%
Chi-Square Tests
Value Df Asymp. Sig. (2-
sided)
Pearson Chi-Square 2.873a 6 .825
Likelihood Ratio 3.861 6 .695
Linear-by-Linear Association 2.316 1 .128
N of Valid Cases 94
a. 5 cells (41.7%) have expected count less than 5. The minimum
expected count is 1.05.

105
PEKERJAAN-DOM FIS
Crosstab
Domain Fisik Total
Baik Cukup Kurang
Pekerjaan
Tidak Bekerja Count 1 3 10 14
% within Pekerjaan 7.1% 21.4% 71.4% 100.0%
PNS Count 0 0 2 2
% within Pekerjaan 0.0% 0.0% 100.0% 100.0%
Swasta Count 0 12 21 33
% within Pekerjaan 0.0% 36.4% 63.6% 100.0%
Wiraswasta Count 0 8 10 18
% within Pekerjaan 0.0% 44.4% 55.6% 100.0%
5 Count 0 11 16 27
% within Pekerjaan 0.0% 40.7% 59.3% 100.0%
Total Count 1 34 59 94
% within Pekerjaan 1.1% 36.2% 62.8% 100.0%
Chi-Square Tests
Value df Asymp. Sig. (2-
sided)
Pearson Chi-Square 8.591a 8 .378
Likelihood Ratio 7.456 8 .488
Linear-by-Linear Association .356 1 .551
N of Valid Cases 94
a. 7 cells (46.7%) have expected count less than 5. The minimum
expected count is .02.

106
PEKERJAAN-DOM PSIK
Crosstab
Domain Psikologis Total
Baik Cukup Kurang
Pekerjaan
Tidak Bekerja Count 1 6 7 14
% within Pekerjaan 7.1% 42.9% 50.0% 100.0%
PNS Count 0 0 2 2
% within Pekerjaan 0.0% 0.0% 100.0% 100.0%
Swasta Count 1 11 21 33
% within Pekerjaan 3.0% 33.3% 63.6% 100.0%
Wiraswasta Count 0 10 8 18
% within Pekerjaan 0.0% 55.6% 44.4% 100.0%
5 Count 1 10 16 27
% within Pekerjaan 3.7% 37.0% 59.3% 100.0%
Total Count 3 37 54 94
% within Pekerjaan 3.2% 39.4% 57.4% 100.0%
Chi-Square Tests
Value df Asymp. Sig. (2-
sided)
Pearson Chi-Square 5.251a 8 .730
Likelihood Ratio 6.303 8 .613
Linear-by-Linear Association .028 1 .867
N of Valid Cases 94
a. 7 cells (46.7%) have expected count less than 5. The minimum
expected count is .06.

107
PEKERJAAN-DOM SOS
Crosstab
Domain Sosial Total
Baik Cukup Kurang
Pekerjaan
Tidak Bekerja Count 0 5 9 14
% within Pekerjaan 0.0% 35.7% 64.3% 100.0%
PNS Count 0 1 1 2
% within Pekerjaan 0.0% 50.0% 50.0% 100.0%
Swasta Count 1 14 18 33
% within Pekerjaan 3.0% 42.4% 54.5% 100.0%
Wiraswasta Count 1 9 8 18
% within Pekerjaan 5.6% 50.0% 44.4% 100.0%
5 Count 1 11 15 27
% within Pekerjaan 3.7% 40.7% 55.6% 100.0%
Total Count 3 40 51 94
% within Pekerjaan 3.2% 42.6% 54.3% 100.0%
Chi-Square Tests
Value df Asymp. Sig. (2-
sided)
Pearson Chi-Square 1.881a 8 .984
Likelihood Ratio 2.335 8 .969
Linear-by-Linear Association .566 1 .452
N of Valid Cases 94
a. 7 cells (46.7%) have expected count less than 5. The minimum
expected count is .06.
108
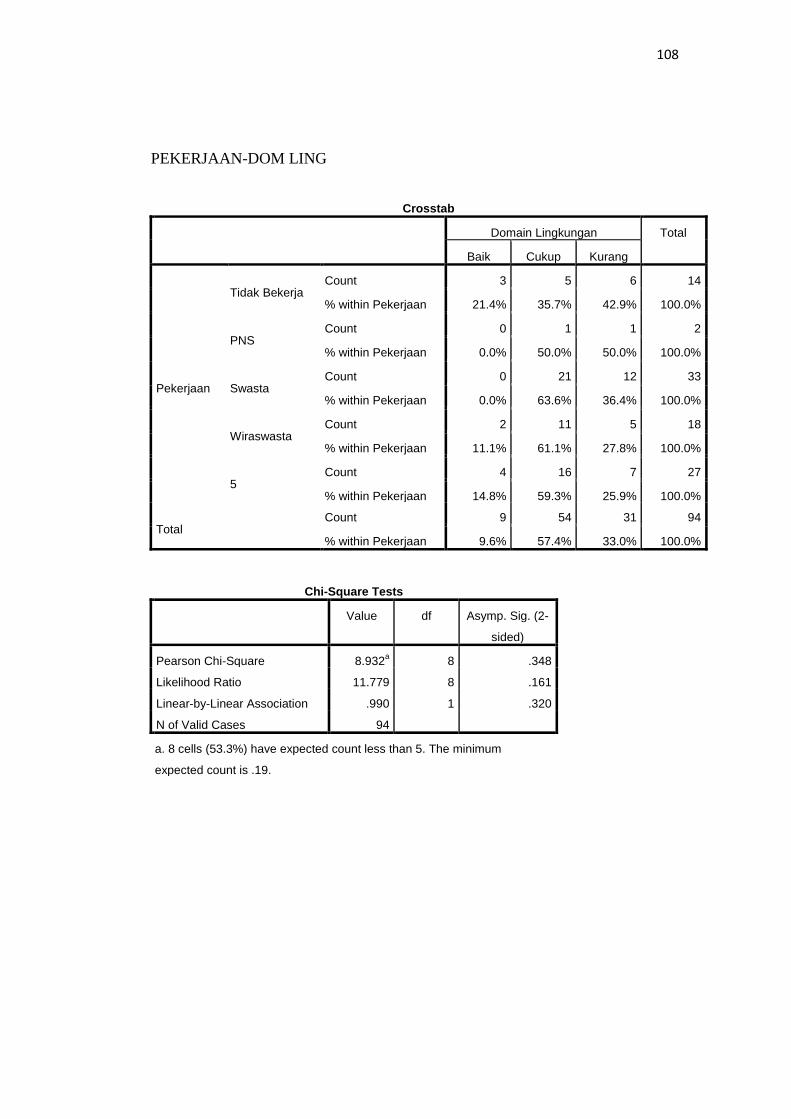
PEKERJAAN-DOM LING
Crosstab
Domain Lingkungan Total
Baik Cukup Kurang
Pekerjaan
Tidak Bekerja Count 3 5 6 14
% within Pekerjaan 21.4% 35.7% 42.9% 100.0%
PNS Count 0 1 1 2
% within Pekerjaan 0.0% 50.0% 50.0% 100.0%
Swasta Count 0 21 12 33
% within Pekerjaan 0.0% 63.6% 36.4% 100.0%
Wiraswasta Count 2 11 5 18
% within Pekerjaan 11.1% 61.1% 27.8% 100.0%
5 Count 4 16 7 27
% within Pekerjaan 14.8% 59.3% 25.9% 100.0%
Total Count 9 54 31 94
% within Pekerjaan 9.6% 57.4% 33.0% 100.0%
Chi-Square Tests
Value df Asymp. Sig. (2-
sided)
Pearson Chi-Square 8.932a 8 .348
Likelihood Ratio 11.779 8 .161
Linear-by-Linear Association .990 1 .320
N of Valid Cases 94
a. 8 cells (53.3%) have expected count less than 5. The minimum
expected count is .19.

109
DEPRESI – DOM FISIK Crosstab
Domain Fisik Total
Baik Cukup Kurang
Depresi
Tidak depresi Count 0 18 32 50
% within Depresi 0.0% 36.0% 64.0% 100.0%
Depresi ringan Count 0 7 11 18
% within Depresi 0.0% 38.9% 61.1% 100.0%
Depresi sedang Count 0 4 9 13
% within Depresi 0.0% 30.8% 69.2% 100.0%
Depresi berat Count 1 5 7 13
% within Depresi 7.7% 38.5% 53.8% 100.0%
Total Count 1 34 59 94
% within Depresi 1.1% 36.2% 62.8% 100.0%
Chi-Square Tests
Value df Asymp. Sig. (2-
sided)
Pearson Chi-Square 6.663a 6 .353
Likelihood Ratio 4.399 6 .623
Linear-by-Linear Association .599 1 .439
N of Valid Cases 94
DEPRESI – DOM PSIKOLOGIS Crosstab
Domain Psikologis Total
Baik Cukup Kurang
Depresi
Tidak depresi Count 1 18 31 50
% within Depresi 2.0% 36.0% 62.0% 100.0%
Depresi ringan Count 0 11 7 18
% within Depresi 0.0% 61.1% 38.9% 100.0%
Depresi sedang Count 1 5 7 13
% within Depresi 7.7% 38.5% 53.8% 100.0%
Depresi berat Count 1 3 9 13
% within Depresi 7.7% 23.1% 69.2% 100.0%
Total Count 3 37 54 94
% within Depresi 3.2% 39.4% 57.4% 100.0%
a. 6 cells (50.0%)
have expected count
less than 5. The
minimum expected
count is .14.

110
Chi-Square Tests
Value df Asymp. Sig. (2-
sided)
Pearson Chi-Square 7.236a 6 .300
Likelihood Ratio 7.332 6 .291
Linear-by-Linear Association .115 1 .734
N of Valid Cases 94
a. 4 cells (33.3%) have expected count less than 5. The minimum
expected count is .41.
DEPRESI – DOM SOSIAL
Crosstab
Domain Sosial Total
Baik Cukup Kurang
Depresi
Tidak depresi Count 1 21 28 50
% within Depresi 2.0% 42.0% 56.0% 100.0%
Depresi ringan Count 0 7 11 18
% within Depresi 0.0% 38.9% 61.1% 100.0%
Depresi sedang Count 2 5 6 13
% within Depresi 15.4% 38.5% 46.2% 100.0%
Depresi berat Count 0 7 6 13
% within Depresi 0.0% 53.8% 46.2% 100.0%
Total Count 3 40 51 94
% within Depresi 3.2% 42.6% 54.3% 100.0%
Chi-Square Tests
Value df Asymp. Sig. (2-
sided)
Pearson Chi-Square 8.267a 6 .219
Likelihood Ratio 6.340 6 .386
Linear-by-Linear Association .804 1 .370
N of Valid Cases 94
a. 4 cells (33.3%) have expected count less than 5. The minimum
expected count is .41.

111
DEPRESI – DOM LINGKUNGAN
Crosstab
Domain Lingkungan Total
Baik Cukup Kurang
Depresi
Tidak depresi Count 2 32 16 50
% within Depresi 4.0% 64.0% 32.0% 100.0%
Depresi ringan Count 1 13 4 18
% within Depresi 5.6% 72.2% 22.2% 100.0%
Depresi sedang Count 2 5 6 13
% within Depresi 15.4% 38.5% 46.2% 100.0%
Depresi berat Count 4 4 5 13
% within Depresi 30.8% 30.8% 38.5% 100.0%
Total Count 9 54 31 94
% within Depresi 9.6% 57.4% 33.0% 100.0%
Chi-Square Tests
Value df Asymp. Sig. (2-
sided)
Pearson Chi-Square 13.417a 6 .037
Likelihood Ratio 11.964 6 .063
Linear-by-Linear Association .691 1 .406
N of Valid Cases 94
a. 6 cells (50.0%) have expected count less than 5. The minimum
expected count is 1.24.

112
Lampiran 6
KUESIONER PENELITIAN
Data Pribadi
Tanggal pemeriksaan :
Nama :
Umur :
Jenis kelamin :
Terdiagnosis HIV sejak :
Alamat :
Status pernikahan* : Belum menikah Cerai mati
Menikah Cerai hidup
Tidak menikah
Pendidikan terakhir* : Tamat SD Perguruan Tinggi
Tamat SMP lain-lain
Tamat SMA
Pekerjaan* : Mahasiswa Swasta
Tidak bekerja Wiraswasta
PNS Lain-lain
Catatan : * Lingkari yang merupakan pilihan anda

113
Lampiran 7 :
KUESIONER PENELITIAN
Beck Depression Inventory
Instruksi : Kuesioner ini terdiri dari 21 kelompok pertanyaan. Silahkan
membaca masing-masing kelompok pertanyaan dengan seksama dan pilihlah
salah satu penyataan yang anda anggap sesuai dengan diri anda saat ini, dengan
memberi tanda silang (x) pada huruf di depan penyataan yang anda pilih.
1. 0. Saya tidak merasa sedih
1. Saya merasa sedih
2. Saya merasa sedih sepanjang waktu dan saya tidak dapat
menghilangkannya
3. Saya begitu sedih sehingga saya merasa tidak tahan lagi
2. 0. Saya tidak merasa berkecil hati terhadap masa depan
1. Saya merasa berkecil hati terhadap masa depan
2. Saya merasa tidak ada satupun yang dapat saya harapkan
3. Saya merasa bahwa masa depan saya tidak ada harapan dan segala
sesuatunya tidak dapat diperbaiki
3. 0. Saya tidak merasa gagal
1. Saya merasa bahwa saya telah gagal dari kebanyakan orang
2. Saat saya mengingat masa lalu, maka yang teringat oleh saya
hanyalah kegagalan
3. Saya merasa sebagai seorang pribadi yang gagal total
4. 0. Saya memperoleh kepuasan atas segala sesuatu seperti biasanya

114
1. Saya tidak lagi mendapat kepuasan dari hal-hal yang biasa saya
lakukan
2. Saya tidak lagi memperoleh kepuasan yang nyata dari apapun lagi
3. Saya merasa tidak puas atau bosan dengan segalanya
5. 0. Saya tidak merasa bersalah
1. Saya cukup sering merasa bersalah
2. Saya sering merasa sangat bersalah
3. Saya merasa bersalah sepanjang waktu
6. 0. Saya tidak merasa bahwa saya sedang dihukum
1. Saya merasa bahwa saya mungkin sedang dihukum
2. Saya pikir saya akan dihukum
3. Saya merasa bahwa saya sedang dihukum
7. 0. Saya tidak merasa kecewa terhadap diri saya sendiri
1. Saya merasa kecewa terhadap diri saya sendiri
2. Saya merasa jijik terhadap diri saya sendiri
3. Saya membenci diri saya sendiri
8. 0. Saya tidak merasa bahwa saya lebih buruk daripada orang lain
1. Saya selalu mencela diri saya sendiri karena kelemahan atau
kesalahan saya
2. Saya menyalahkan diri saya sendiri sepanjang waktu atas
kesalahan – kesalahan saya
3. Saya menyalahkan diri saya sendiri atas semua hal buruk yang
terjadi
9. 0. Saya tidak mempunyai pikiran untuk bunuh diri
1. Saya mempunyai pikiran – pikiran untuk bunuh diri, tetapi saya
tidak akan melaksanakannya

115
2. Saya ingin bunuh diri
3. Saya akan bunuh diri kalau ada kesempatan
10. 0. Saya tidak lebih banyak dibandingkan biasanya
1. Sekarang saya lebih banyak menangis daripada sebelumnya
2. Sekarang saya menangis sepanjang waktu
3. Saya biasanya dapat menangis, tetapi sekarang saya tidak dapat
menangis meskipun saya ingin menangis
11. 0. Sekarang saya tidak merasa lebih jengkel daripada sebelumnya
1. Saya lebih mudah jengkel atau marah daripada biasanya
2. Saya agak jengkel atau terganggu di sebagian besar waktu saya
3. Saya merasa jengkel sepanjang waktu sekarang
12. 0. Saya tidak kehilangan minat saya terhadap orang lain
1. Saya kurang berminat pada orang lain dibandingkan dengan
biasanya
2. Saya kehilangan sebagian besar minat saya terhadap orang lain
3. Saya telah kehilangan seluruh minat saya terhadap orang lain
13. 0. Saya mengambil keputusan – keputusan sama baiknya dengan
sebelumnya
1. Saya lebih banyak menunda keputusan daripada biasanya
2. Saya mempunyai kesulitan yang lebih besar dalam mengambil
keputusan daripada sebelumnya
3. Saya sama sekali tidak dapat mengambil keputusan apa pun lagi
14. 0. Saya tidak merasa bahwa keadaan saya tampak lebih buruk
dari biasanya
1. Saya merasa khawatir saya tampak tua atau tidak menarik

116
2. Saya merasa bahwa ada perubahan – perubahan menetap pada
penampilan saya yang membuat saya kelihatan tidak menarik
3. Saya yakin bahwa saya terlihat jelek
15. 0. Saya dapat bekerja dengan baik seperti sebelumnya
1. Saya membutuhkan usaha ekstra untuk mulai mengerjakan sesuatu
2. Saya harus memaksa diri saya untuk mengerjakan sesuatu
3. Saya sama sekali tidak dapat mengerjakan apa – apa
16. 0. Saya dapat tidur nyenyak seperti biasanya
1. Tidur saya tidak sebanyak biasanya
2. Saya bangun 1-2 jam lebih awal dari biasanya dan sukar tidur
kembali
3. Saya bangun beberapa jam lebih awal daripada biasanya dan tidak
dapat tidur kembali
17. 0. Saya tidak merasa lebih lelah dari biasanya
1. Saya merasa lebih mudah lelah dari biasanya
2. Saya selalu merasa lelah dalam mengerjakan segala sesuatu
3. Saya merasa terlalu lelah untuk mengerjakan apa saja
18. 0. Nafsu makan saya masih seperti biasanya
1. Nafsu makan saya tidak sebesar biasanya
2. Sekarang nafsu makan saya jauh lebih berkurang
3. Saya tidak mempunyai nafsu makan sama sekali
19. 0. Berat badan saya tidak turun banyak atau tetap akhir-akhir ini
1. Berat badan saya turun lebih dari 2,5 kg
2. Berat badan saya turun lebih dari 5 kg
3. Berat badan saya turun lebih dari 7,5 kg

117
20. 0. Saya tidak lebih khawatir mengenai kesehatan saya daripada
biasanya
1. Saya khawatir akan masalah kesehatan fisik saya, seperti sakit dan
rasa nyeri; sakit perut; ataupun sembelit
2. Saya sangat cemas akan masalah kesehatan fisik saya dan sulit
memikirkan hal – hal lainnya
3. Saya begitu cemas akan kesehatan fisik saya sehingga saya tidak
dapat berpikir mengenai hal – hal lainnya
21. 0. Saya tidak merasa ada perubahan dalam minat saya terhadap seks
1. Saya kurang berminat terhadap seks kalau dibandingkan dengan
biasanya
2. Sekarang saya sangat kurang berminat terhadap seks
3. Saya sama sekali kehilangan minat terhadap seks
118
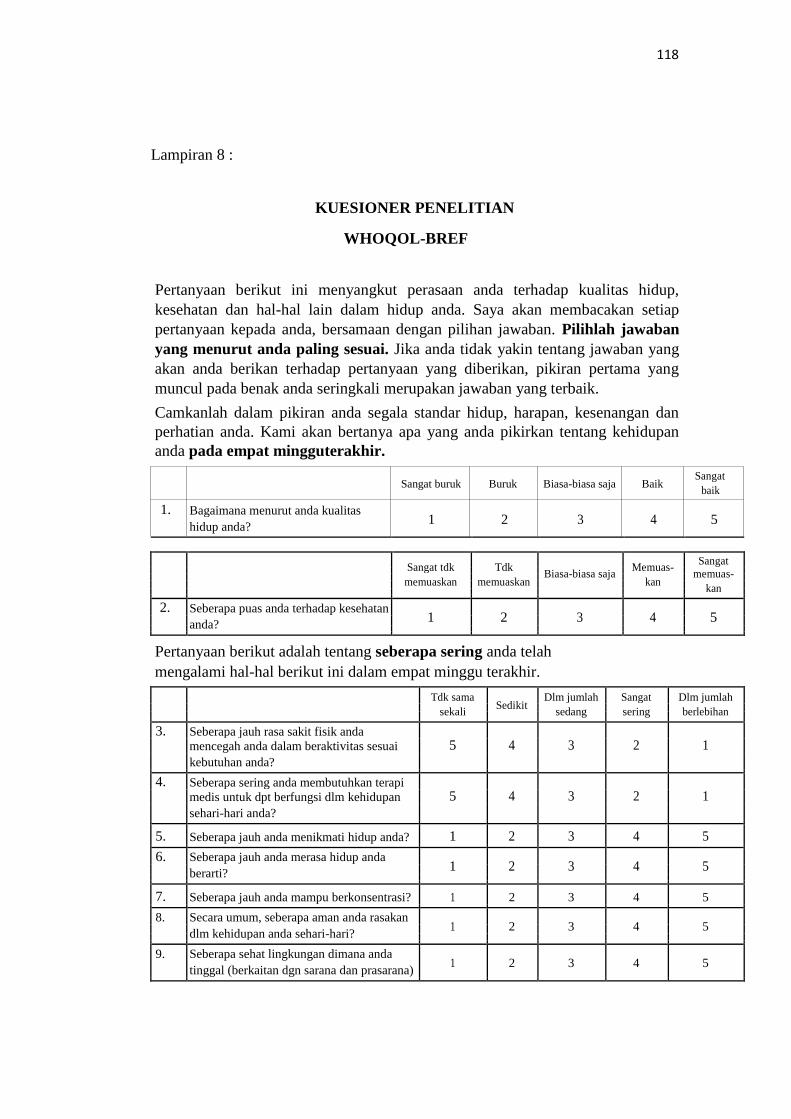
Lampiran 8 :
KUESIONER PENELITIAN
WHOQOL-BREF
Pertanyaan berikut ini menyangkut perasaan anda terhadap kualitas hidup,
kesehatan dan hal-hal lain dalam hidup anda. Saya akan membacakan setiap
pertanyaan kepada anda, bersamaan dengan pilihan jawaban. Pilihlah jawaban
yang menurut anda paling sesuai. Jika anda tidak yakin tentang jawaban yang
akan anda berikan terhadap pertanyaan yang diberikan, pikiran pertama yang
muncul pada benak anda seringkali merupakan jawaban yang terbaik. Camkanlah dalam pikiran anda segala standar hidup, harapan, kesenangan dan
perhatian anda. Kami akan bertanya apa yang anda pikirkan tentang kehidupan
anda pada empat mingguterakhir.
Sangat buruk Buruk Biasa-biasa saja Baik Sangat
baik
1. Bagaimana menurut anda kualitas 1 2 3 4 5
hidup anda?
Sangat tdk Tdk
Memuas- Sangat
Biasa-biasa saja memuas-
memuaskan memuaskan kan
kan
2. Seberapa puas anda terhadap kesehatan 1 2 3 4 5
anda?
Pertanyaan berikut adalah tentang seberapa sering anda telah
mengalami hal-hal berikut ini dalam empat minggu terakhir. Tdk sama
Sedikit Dlm jumlah Sangat Dlm jumlah
sekali sedang sering berlebihan
3. Seberapa jauh rasa sakit fisik anda 5 4 3 2 1
mencegah anda dalam beraktivitas sesuai
kebutuhan anda?
4. Seberapa sering anda membutuhkan terapi 5 4 3 2 1
medis untuk dpt berfungsi dlm kehidupan
sehari-hari anda?
5. Seberapa jauh anda menikmati hidup anda? 1 2 3 4 5
6. Seberapa jauh anda merasa hidup anda 1 2 3 4 5
berarti?
7. Seberapa jauh anda mampu berkonsentrasi? 1 2 3 4 5
8. Secara umum, seberapa aman anda rasakan 1 2 3 4 5
dlm kehidupan anda sehari-hari?
9. Seberapa sehat lingkungan dimana anda 1 2 3 4 5
tinggal (berkaitan dgn sarana dan prasarana)

119
Pertanyaan berikut ini adalah tentang seberapa penuh anda alami hal-hal berikut ini dalam 4 minggu terakhir?
Tdk sama Sedikit Sedang Seringkali
Sepenuhnya
sekali dialami
10. Apakah anda memiliki vitalitas yg
1 2 3 4 5
cukup untuk beraktivitas sehari2?
11. Apakah anda dapat menerima 1 2 3 4 5
penampilan tubuh anda?
12. Apakah anda memiliki cukup uang 1 2 3 4 5
utk memenuhi kebutuhan anda?
13. Seberapa jauh ketersediaan
informasi bagi kehidupan anda dari 1 2 3 4 5
hari ke hari?
14. Seberapa sering anda memiliki
kesempatan untuk bersenang- 1 2 3 4 5
senang /rekreasi?
Sangat buruk Buruk
Biasa-biasa Baik Sangat baik
saja
15. Seberapa baik kemampuan anda 1 2 3 4 5
dalam bergaul?
Sangat tdk Tdk Biasa-biasa Memuaskan
Sangat
memuaskan memuaskan saja memuaskan
16. Seberapa puaskah anda dg tidur 1 2 3 4 5
anda?
17. Seberapa puaskah anda dg
kemampuan anda untuk 1 2 3 4 5
menampilkan aktivitas kehidupan
anda sehari-hari?
18. Seberapa puaskah anda dengan 1 2 3 4 5
kemampuan anda untuk bekerja?
19. Seberapa puaskah anda terhadap 1 2 3 4 5
diri anda?
20. Seberapa puaskah anda dengan 1 2 3 4 5
hubungan personal / sosial anda?
21. Seberapa puaskah anda dengan 1 2 3 4 5
kehidupan seksual anda?
22. Seberapa puaskah anda dengan
dukungan yg anda peroleh dr 1 2 3 4 5
teman anda?
23. Seberapa puaskah anda dengan
kondisi tempat anda tinggal saat 1 2 3 4 5
ini?
24. Seberapa puaskah anda dgn akses 1 2 3 4 5
anda pd layanan kesehatan?
25. Seberapa puaskah anda dengan 1 2 3 4 5
transportasi yg hrs anda jalani?

120
Pertanyaan berikut merujuk pada seberapa sering anda merasakan atau mengalami hal-hal
berikut dalam empat minggu terakhir.
Tdk pernah Jarang Cukup sering Sangat sering Selalu
26. Seberapa sering anda memiliki
perasaan negatif seperti „feeling 5 4 3 2 1
blue‟ (kesepian), putus asa, cemas
dan depresi?
Komentar pewawancara tentang penilaian ini?


![ERINTAH PROVI]USI TENGAH DII{AS TENAGA DAN …disnakertrans.kalteng.go.id/files/info/14052019020222_1_DAFTARINFORMAS... · secara berkala, informasi yang wajib diumumkan secara serta](https://static.fdokumen.com/doc/165x107/5d5742c688c993d66f8bb421/erintah-proviusi-tengah-diias-tenaga-dan-secara-berkala-informasi-yang-wajib.jpg)