


Bahasa
Halaman
Hukum


FUNCTIONS & OPERATIONSS&S
SPICK & SPAN
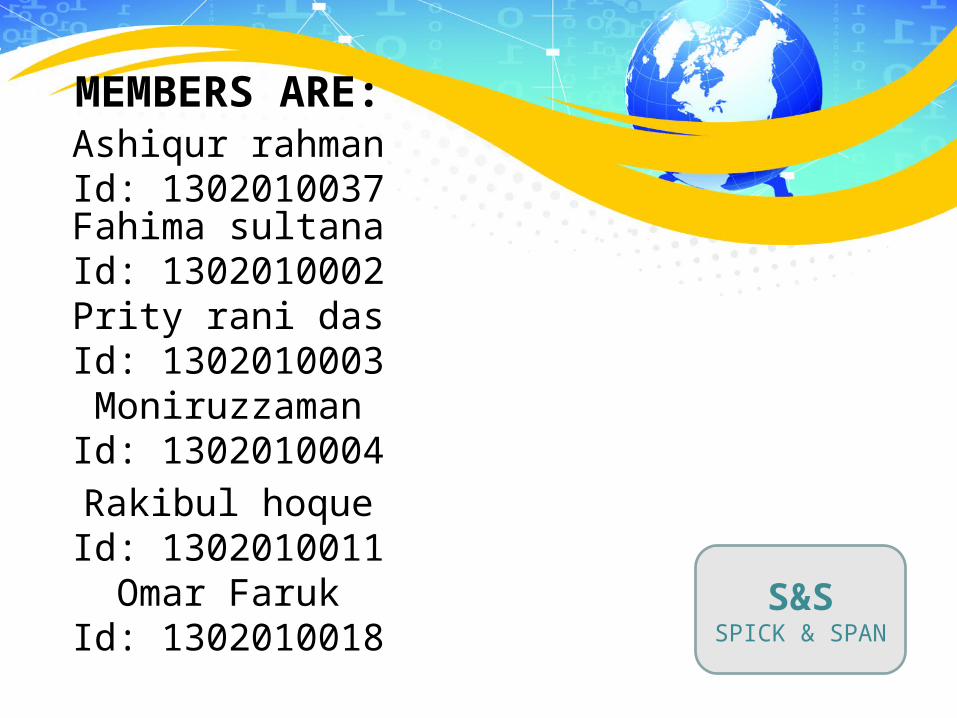
MEMBERS ARE:
S&SSPICK & SPAN
Ashiqur rahmanId: 1302010037Fahima sultanaId: 1302010002Prity rani dasId: 1302010003Moniruzzaman
Id: 1302010004Rakibul hoqueId: 1302010011Omar Faruk
Id: 1302010018

Types of company: PrivateTypes of business: Bakery ShopProduct: Cup CakesName of company: SPICK & SPANVision:
TO BE AMONG THE CREATIVE AND INNOVATIVE LEADER IN THE CUPCAKE MARKET
Mission: WE ARE COMMITTED TO INTRODUCING NEW DESIGN AND VARIETY
FLAVOUR IN OUR CUPCAKES
S&SSPICK & SPAN

Objective:1. To establish and operate cupcakes cafe for the people
who are living at Bangkok, Thailand.2. To provide with the friendliest services with
affordable prices of cupcakes and other services.Business Address: 159 Rajadamri Road, Lumpinee, Bangkok, กกกกกกกกกกกกก 10330, Thailand
Telephone Number:+880-01744151536
S&SSPICK & SPAN
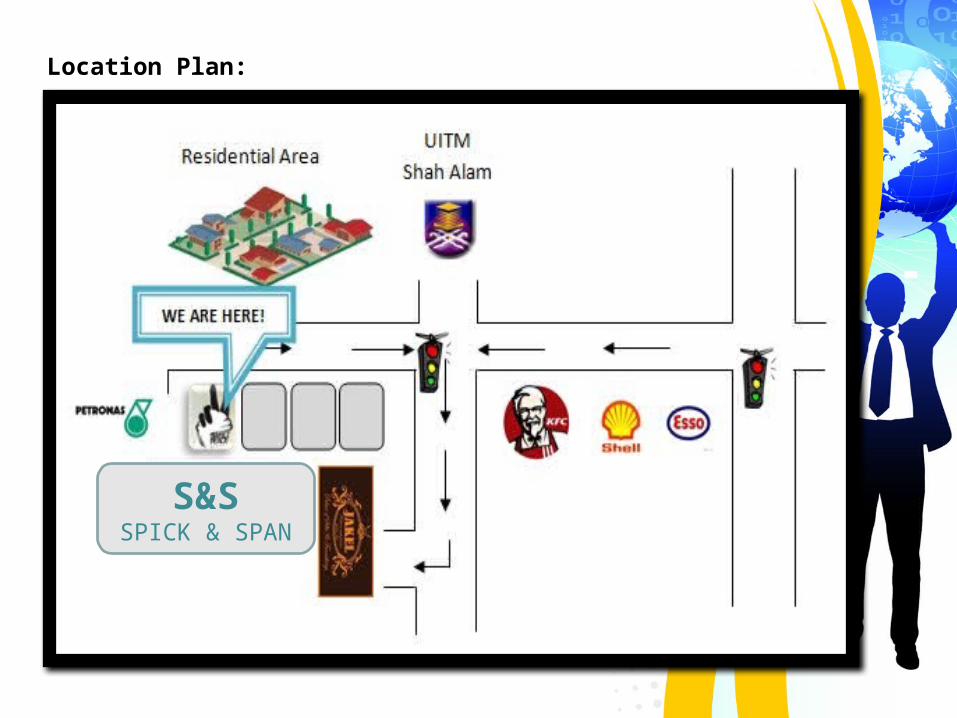
Location Plan:
S&SSPICK & SPAN
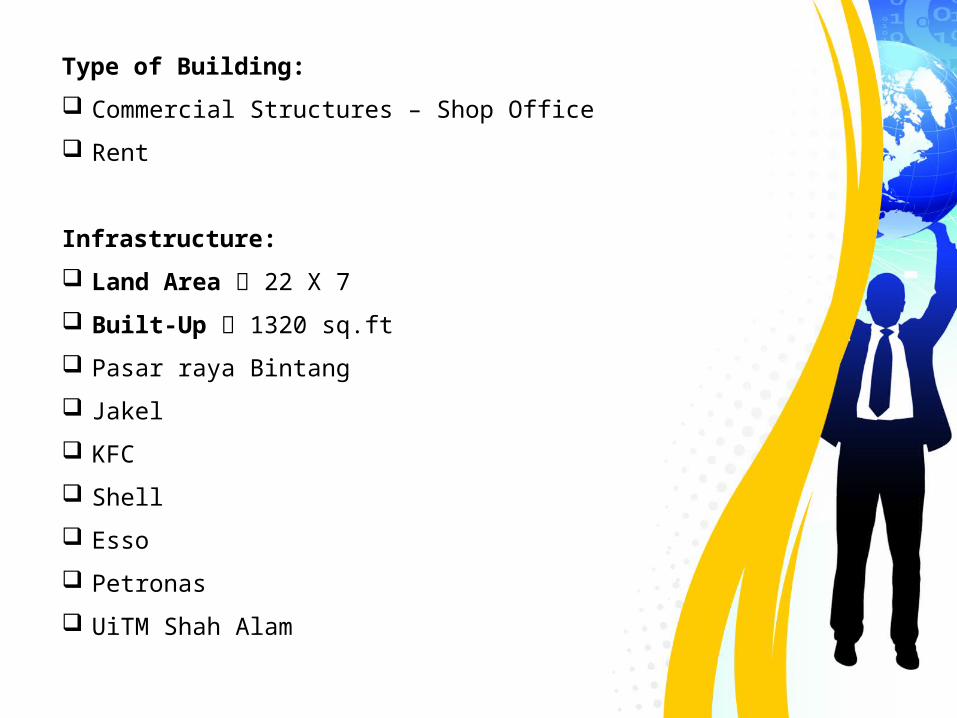
Type of Building: Commercial Structures – Shop Office Rent
Infrastructure: Land Area 22 X 7 Built-Up 1320 sq.ft Pasar raya Bintang Jakel KFC Shell Esso Petronas UiTM Shah Alam

ORGANIZATIONAL STRUCTURE FUNCTION
General Manager
Administration Manager
MarketingManager Financial
Manager
OperationManager
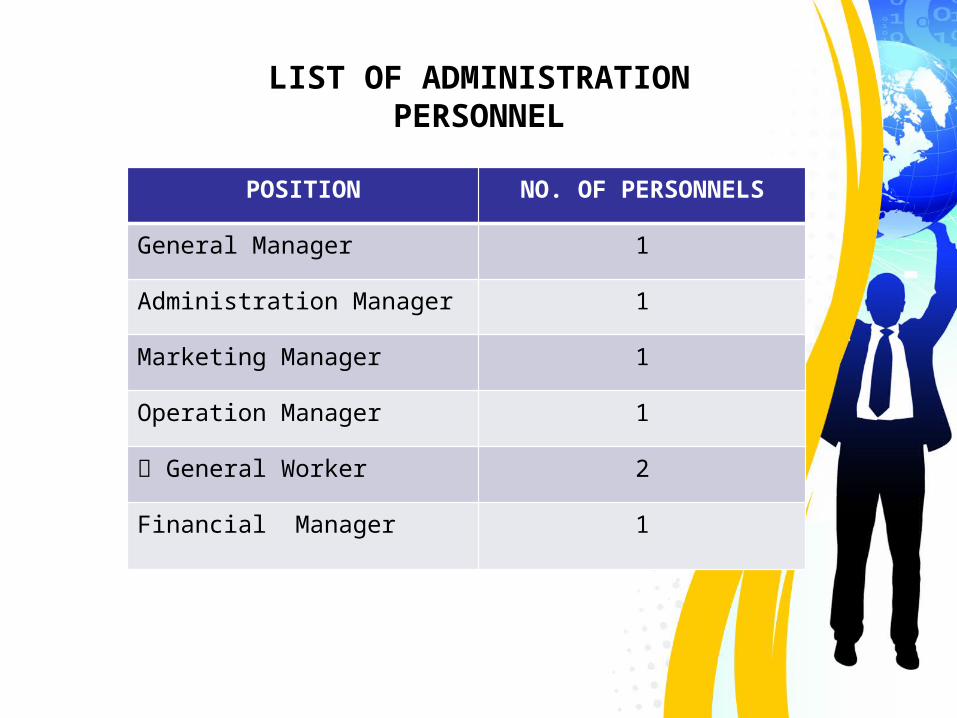
LIST OF ADMINISTRATION PERSONNEL
POSITION NO. OF PERSONNELS
General Manager 1
Administration Manager 1
Marketing Manager 1
Operation Manager 1
ก General Worker 2
Financial Manager 1

SCHEDULE OF TASK AND RESPOSIBILITIES
POSITION TASK AND RESPONSIBILITIESGeneral Manager
1. Complete management responsibilities in ensuring the company objective and mission can be achieved according to plan.
2. Supports motivation of employees in organization products or programs and operations.
3. Looks to the future for change opportunities.
4. Oversees the overall operations of organization.
5. Analyse monthly report of every department.Administra
tion Manager
1. Update and maintain database with accurate client information.
2. Controlling the financial expenses for administration department.
3. Identify and inform the duties every department.
4. Management of staff’s salary payment, bonuses and incentive, EPF.

POSITION TASK AND RESPONSIBILITIESMarketing Manager
1. To set a strategic marketing plan for the company and identify new marketing opportunities.
2. Promoting the products and services of the business to the customers.
3. Analyze SWOT (Strength, Weakness, Opportunity and Threat) of the company and strengths and weaknesses of our competitors.
4. Prepared the department report and submit to the top manager.
Operation Manager
1. Manage the quality of products and ensure problems are handled efficiently.
2. To set a rules and procedures for staff to follow in order for department run smoothly.
3. Manage and determine the operation cost adequate with the company budget.
POSITION TASK AND RESPONSIBILITIES
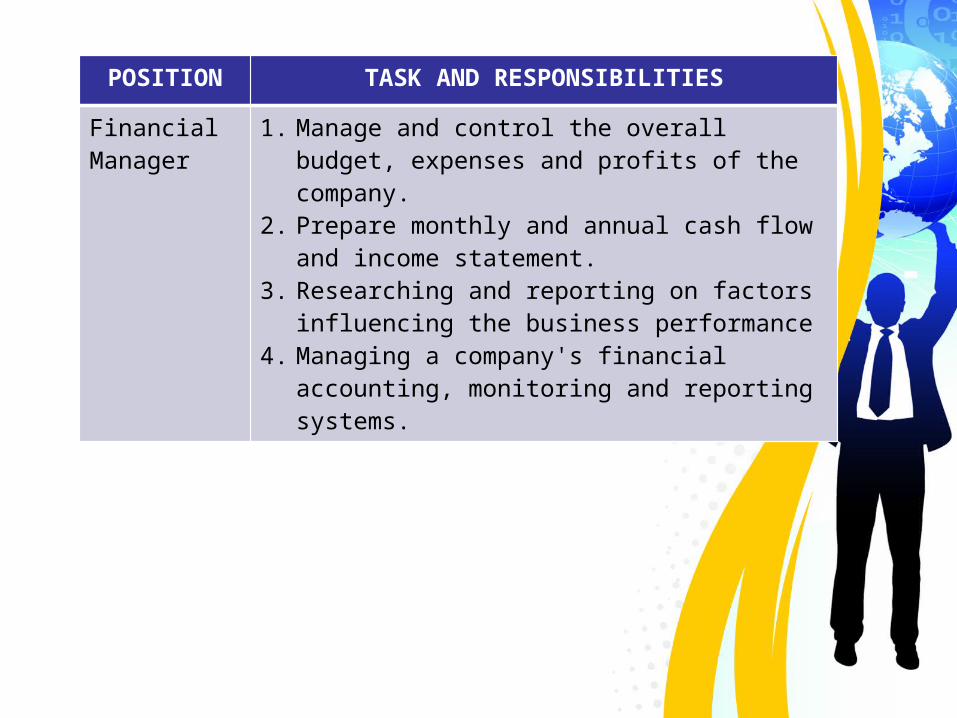
Financial Manager
1. Manage and control the overall budget, expenses and profits of the company.
2. Prepare monthly and annual cash flow and income statement.
3. Researching and reporting on factors influencing the business performance
4. Managing a company's financial accounting, monitoring and reporting systems.
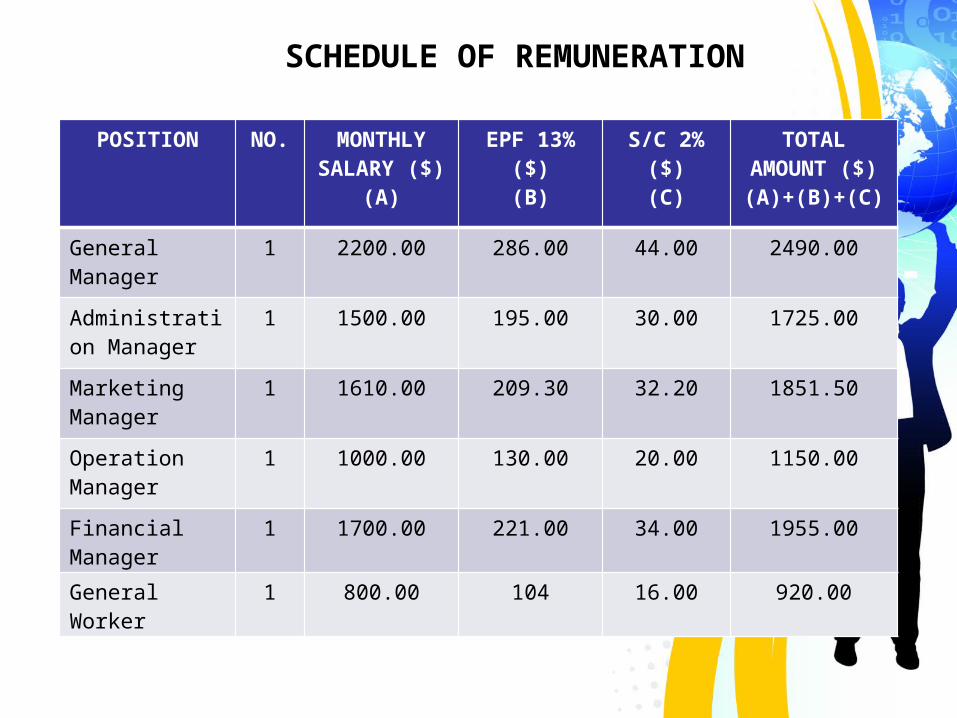
SCHEDULE OF REMUNERATION
POSITION NO. MONTHLY SALARY ($)
(A)
EPF 13%($)(B)
S/C 2%($)(C)
TOTAL AMOUNT ($)(A)+(B)+(C)
General Manager
1 2200.00 286.00 44.00 2490.00
Administration Manager
1 1500.00 195.00 30.00 1725.00
Marketing Manager
1 1610.00 209.30 32.20 1851.50
Operation Manager
1 1000.00 130.00 20.00 1150.00
Financial Manager
1 1700.00 221.00 34.00 1955.00
General Worker
1 800.00 104 16.00 920.00
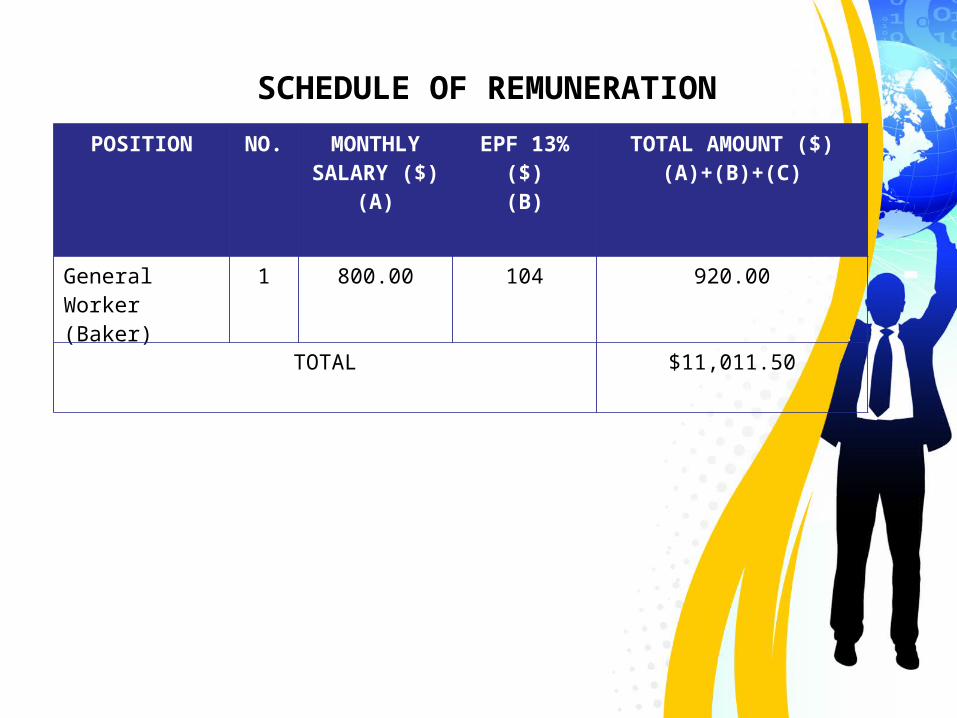
SCHEDULE OF REMUNERATIONPOSITION NO. MONTHLY
SALARY ($)(A)
EPF 13%($)(B)
TOTAL AMOUNT ($)(A)+(B)+(C)
General Worker(Baker)
1 800.00 104 920.00
TOTAL $11,011.50
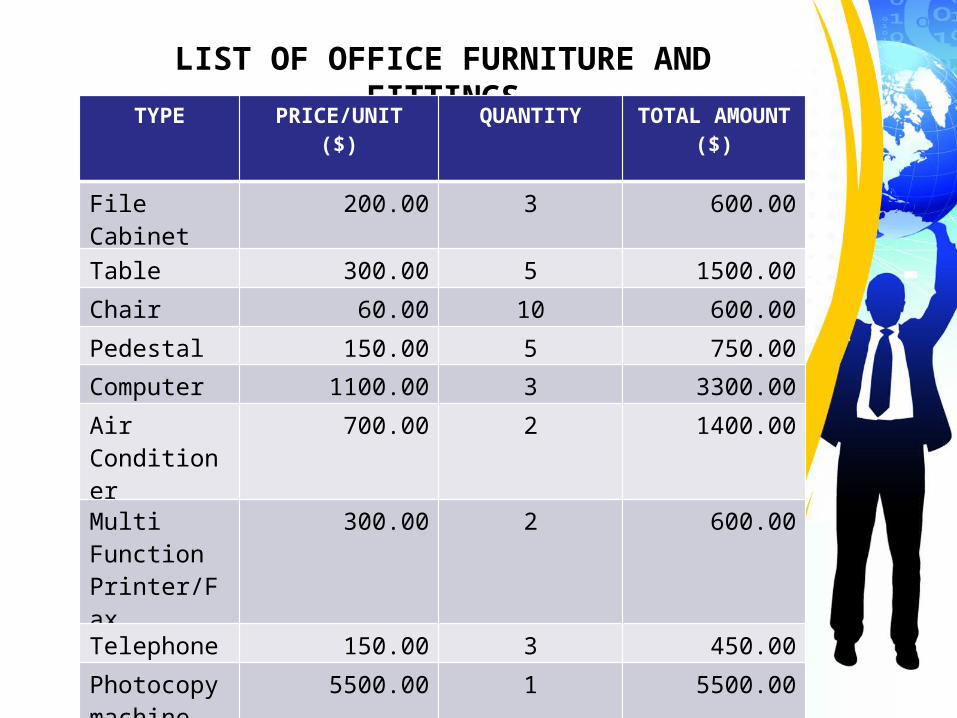
LIST OF OFFICE FURNITURE AND FITTINGSTYPE PRICE/UNIT
($)QUANTITY TOTAL AMOUNT
($)
File Cabinet
200.00 3 600.00
Table 300.00 5 1500.00Chair 60.00 10 600.00Pedestal 150.00 5 750.00Computer 1100.00 3 3300.00Air Conditioner
700.00 2 1400.00
Multi Function Printer/Fax
300.00 2 600.00
Telephone 150.00 3 450.00Photocopy machine
5500.00 1 5500.00
TOTAL $ 14,700.00
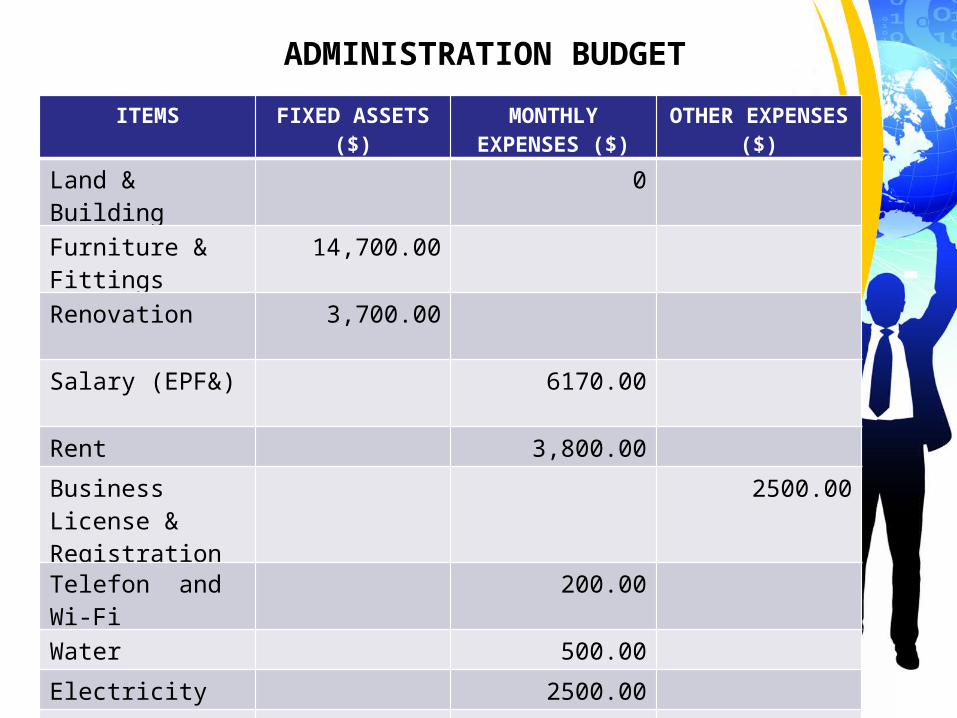
ADMINISTRATION BUDGETITEMS FIXED ASSETS
($)MONTHLY
EXPENSES ($)OTHER EXPENSES
($)Land & Building
0
Furniture & Fittings
14,700.00
Renovation 3,700.00
Salary (EPF&) 6170.00
Rent 3,800.00Business License & Registration
2500.00
Telefon and Wi-Fi
200.00
Water 500.00Electricity 2500.00
TOTAL 18400.00 13170.00 2500.00

MARKETING PLAN

Marketing plan can be defined as outlines the specific actions entrepreneur intend to carry out to interest potential customers and clients in our product and persuade them to buy the product offered.
MARKETING PLAN

Flavour Price per cup ($)Medium Cup
2 inch
Price per cup ($)Large Cup2.5 inch
Vanilla Cupcakes 2.50 3.50
Almond Cupcakes 2.50 3.50
Lemon Cupcakes 2.50 3.50
Orange Cupcakes 2.50 3.50
Mocha Cupcakes 2.50 3.50
Cappuccinos Cupcakes 2.50 3.50
Strawberry Cupcakes 2.50 3.50
Pandan Cupcakes 2.50 3.50
LIST OF PRODUCT OFFERED

LIST OF PRODUCT OFFERED

TARGET MARKET
Weekend getaway
customers
Students
Residents of urban area.

MARKET SIZETARGET MARKET NUMBER OF TARGET
MARKET(MONTHLY)
MARKET SIZE($)
Weekend getaway
customers27% 158 000.00
Students 43% 250 000.00
Residents of
urban area. 30% 180 000.00
Total 100% 588 000.00

Name of the company Strength Weakness
White Daisy’s Cupcakes Has been well known by the customer
Has operates the business for more than 4 years
Have more experience
Lack of staff
Lack of equipments
Diya’s Cupacakes Well-known by most of the customer
Location business in the middle of resident
Homemade cupcakes
Lack of staff
Cuppy Cuppy Affordable price
Good promotion
Hidden location
Basic Stories Cupcakes & Cafe
Friendly service
Newly establish with new furniture
CCTV
Small premises
Unattractive environment
Narrow building
Sweet Peace Bakerys & Cafe Product quality
Beautiful design and used natural material for the ingredients of cupcakes
Hired qualified and skill staff
New equipments and technologies
New in the market
COMPETITORS

SALES FORECAST
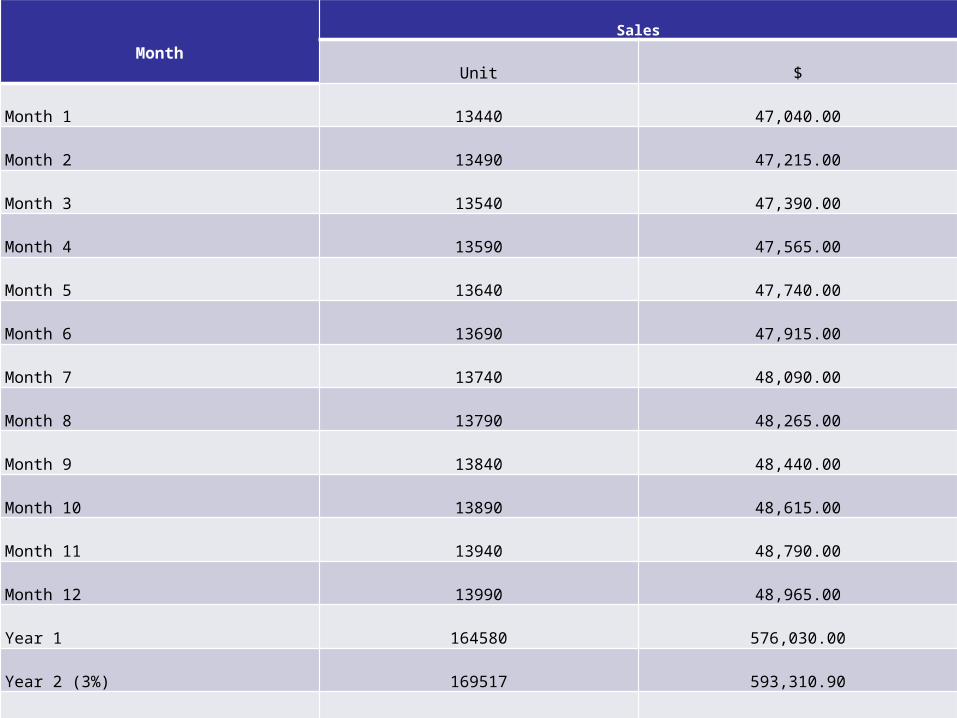
MonthSales
Unit $
Month 1 13440 47,040.00
Month 2 13490 47,215.00
Month 3 13540 47,390.00
Month 4 13590 47,565.00
Month 5 13640 47,740.00
Month 6 13690 47,915.00
Month 7 13740 48,090.00
Month 8 13790 48,265.00
Month 9 13840 48,440.00
Month 10 13890 48,615.00
Month 11 13940 48,790.00
Month 12 13990 48,965.00
Year 1 164580 576,030.00
Year 2 (3%) 169517 593,310.90
Year 3 (5%) 172809 604,831.50

MARKETING STRATEGY
PRICE PRODUCT PLACE PROMOTIONS

PROMOTION STRATEGY
SOCIAL NETWORKING
SIGNBOARD
BUSINESS CARD
SALES PROMOTION
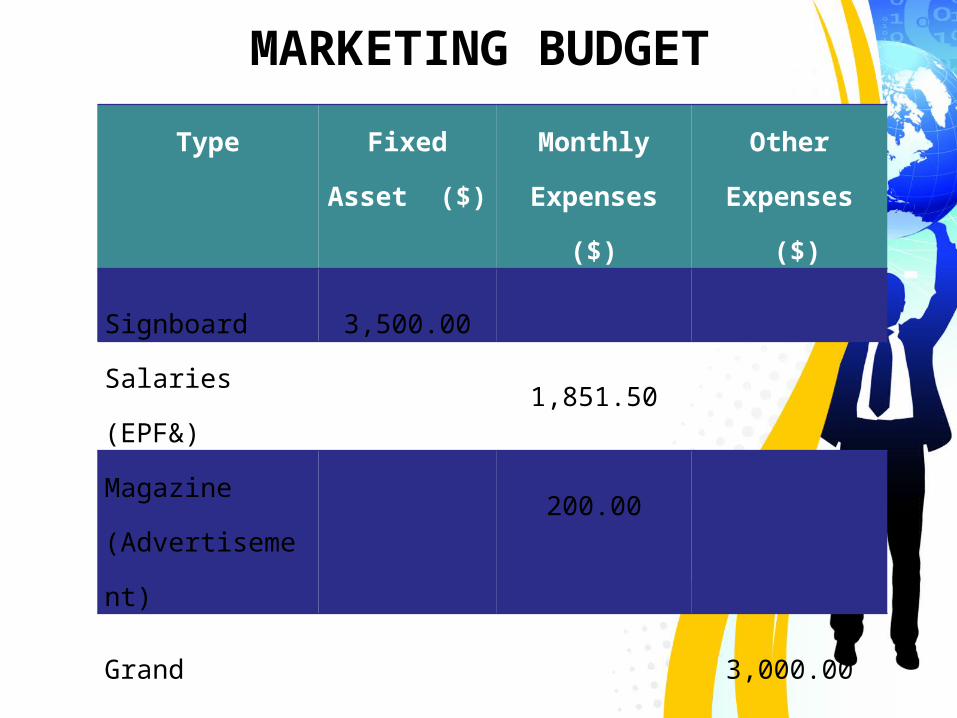
MARKETING BUDGETType Fixed
Asset ($)
Monthly
Expenses
($)
Other
Expenses
($)
Signboard 3,500.00
Salaries
(EPF&)1,851.50
Magazine
(Advertiseme
nt)
200.00
Grand
Opening
3,000.00
TOTAL 3,500.00 2,051.5 3,000.00

OPERATION PLAN

OPERATION OBJECTIVE• To optimized our customer’s satisfaction
• To create a variable cupcakes business
• To accomplish consistency in the services offered
• To resolve any of operation problem and make all the operation process run efficiently
• To ensure that all of the operation process in our business is functioning well to meet the demand of our customers
• To hiring more workers in bakery field
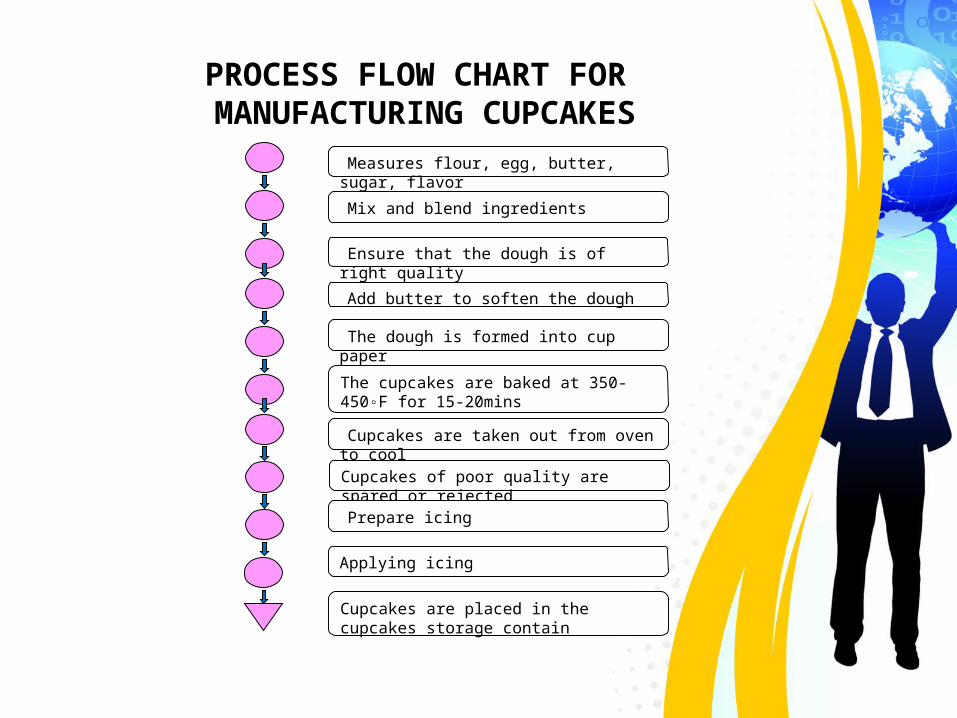
Measures flour, egg, butter, sugar, flavor Mix and blend ingredients
Ensure that the dough is of right quality Add butter to soften the dough
The dough is formed into cup paperThe cupcakes are baked at 350-450◦F for 15-20mins
Cupcakes are taken out from oven to coolCupcakes of poor quality are spared or rejected Prepare icing
Applying icing
Cupcakes are placed in the cupcakes storage contain
PROCESS FLOW CHART FOR MANUFACTURING CUPCAKES

500/5 = 100 units of cupcakes per hour
100/5 = 2 workers
Capacity planning refers to the amount of output that can be produced within a specified time. For daily production, we are required to produce 500 units of cupcakes. To produce 500 units of cupcakes it takes 5 hours.
PRODUCTION PLANNING
We estimate that one worker can produced 50 units of cupcakes in 1 hour
Therefore, we need 2 workers to produced 50 units of cupcakes in 1 hour. Sweet Peace Bakery was open on Monday until Sunday and will be closed during public holiday. Our business will start the operation on 9.00 am until 11.00 pm because we want to take much reservation and attract more customers comes to our cupcakes cafe.
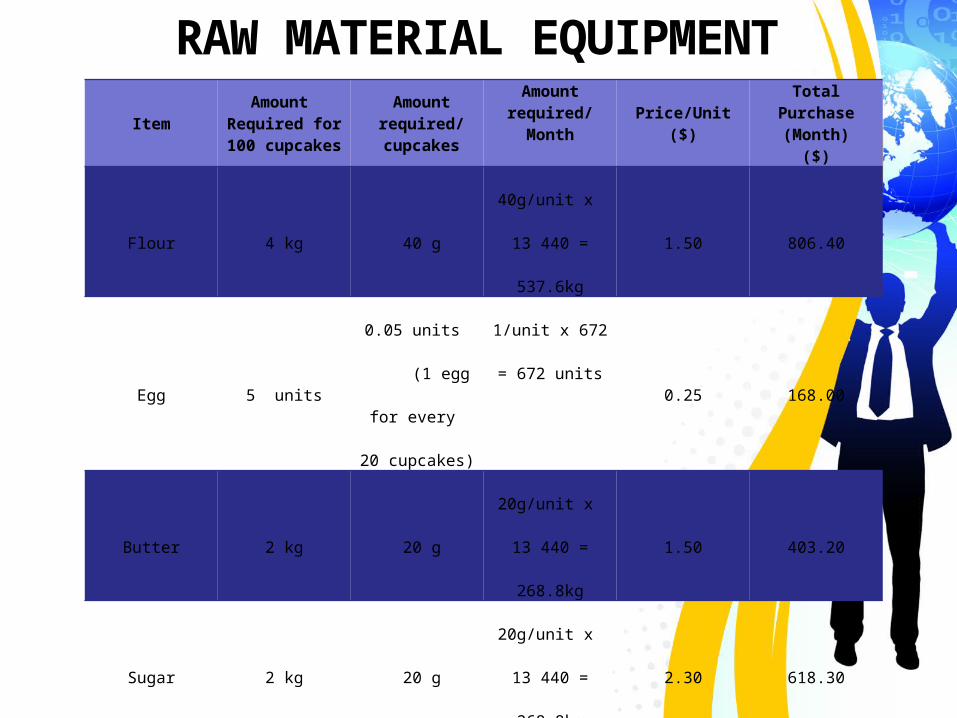
RAW MATERIAL EQUIPMENTItem
Amount Required for 100 cupcakes
Amount required/ cupcakes
Amount required/
MonthPrice/Unit
($)
Total Purchase (Month)
($)
Flour 4 kg 40 g
40g/unit x
13 440 =
537.6kg
1.50 806.40
Egg 5 units
0.05 units
(1 egg
for every
20 cupcakes)
1/unit x 672
= 672 units0.25 168.00
Butter 2 kg 20 g
20g/unit x
13 440 =
268.8kg
1.50 403.20
Sugar 2 kg 20 g
20g/unit x
13 440 =
268.8kg
2.30 618.30
Icing 2 kg 20g
20g/unit x
13 440 =
268.8kg
2.00 537.60
Total 2 533.50
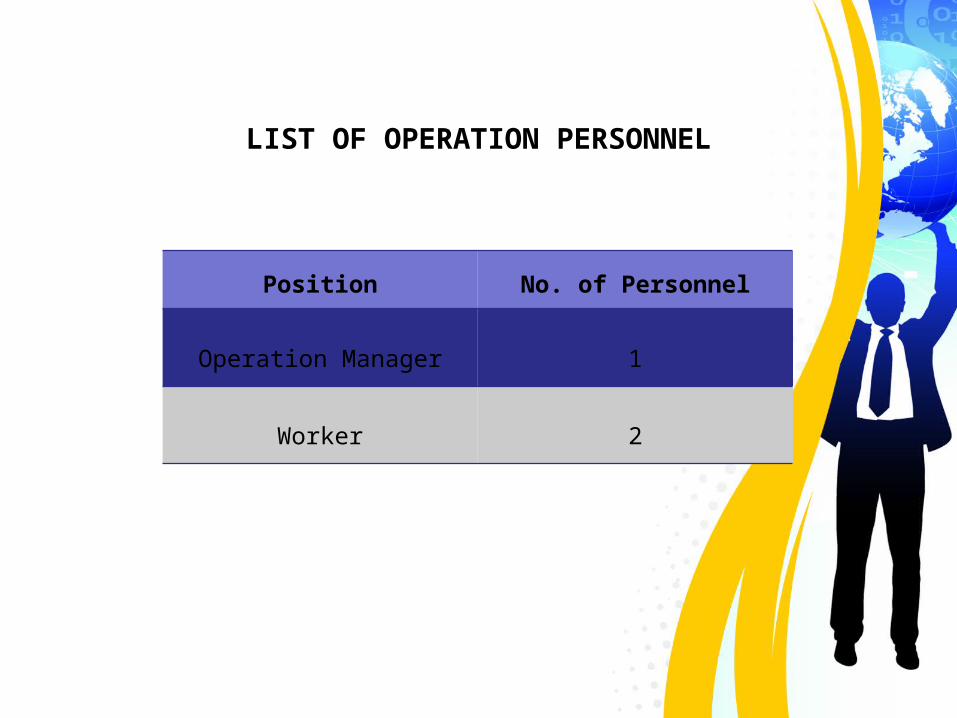
LIST OF OPERATION PERSONNEL
Position No. of Personnel
Operation Manager 1
Worker 2

SCHEDULE OF REMUNERATION
Position No. Monthly Salary
($)
EPF (13%) ($)
(2%) ($)
Total ($)
Operatio
n
Manager
1 1 000.00 130.00 20.00 1 150.00
Worker 2 800.00 104.00 16.00 1 840.00
Total 2 990.00
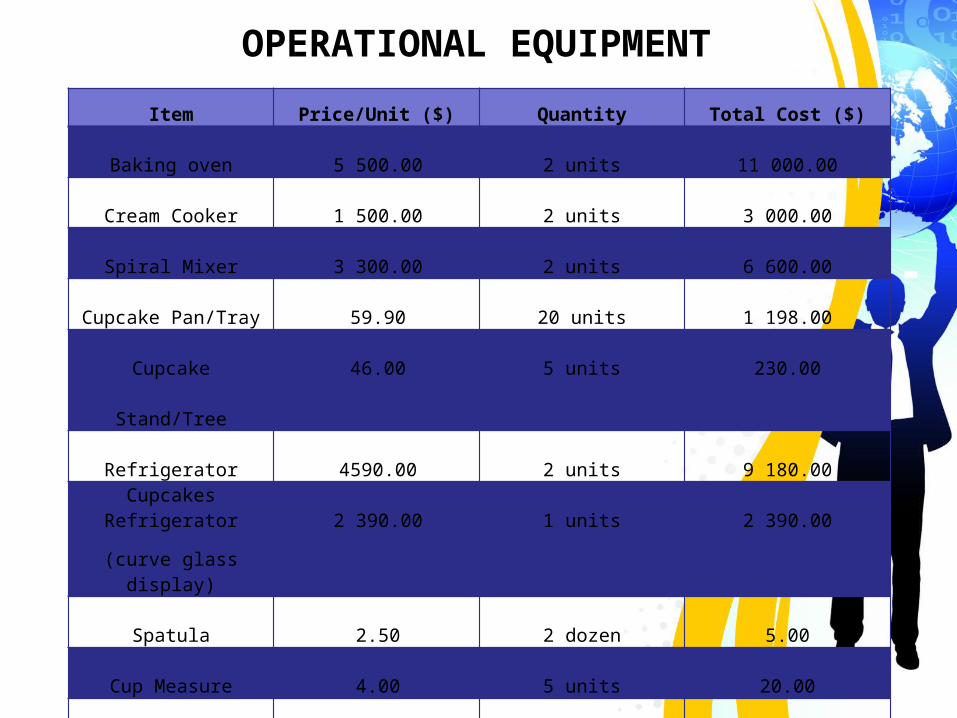
OPERATIONAL EQUIPMENTItem Price/Unit ($) Quantity Total Cost ($)
Baking oven 5 500.00 2 units 11 000.00
Cream Cooker 1 500.00 2 units 3 000.00
Spiral Mixer 3 300.00 2 units 6 600.00
Cupcake Pan/Tray 59.90 20 units 1 198.00
Cupcake
Stand/Tree
46.00 5 units 230.00
Refrigerator 4590.00 2 units 9 180.00Cupcakes
Refrigerator
(curve glass display)
2 390.00 1 units 2 390.00
Spatula 2.50 2 dozen 5.00
Cup Measure 4.00 5 units 20.00
Bowls 5.00 20 units 100.00
Icing Bag 10.00 3 packet 30.00
Cupcakes Boxes 3.00 1000 boxes 3 000.00
Total 36 753.00
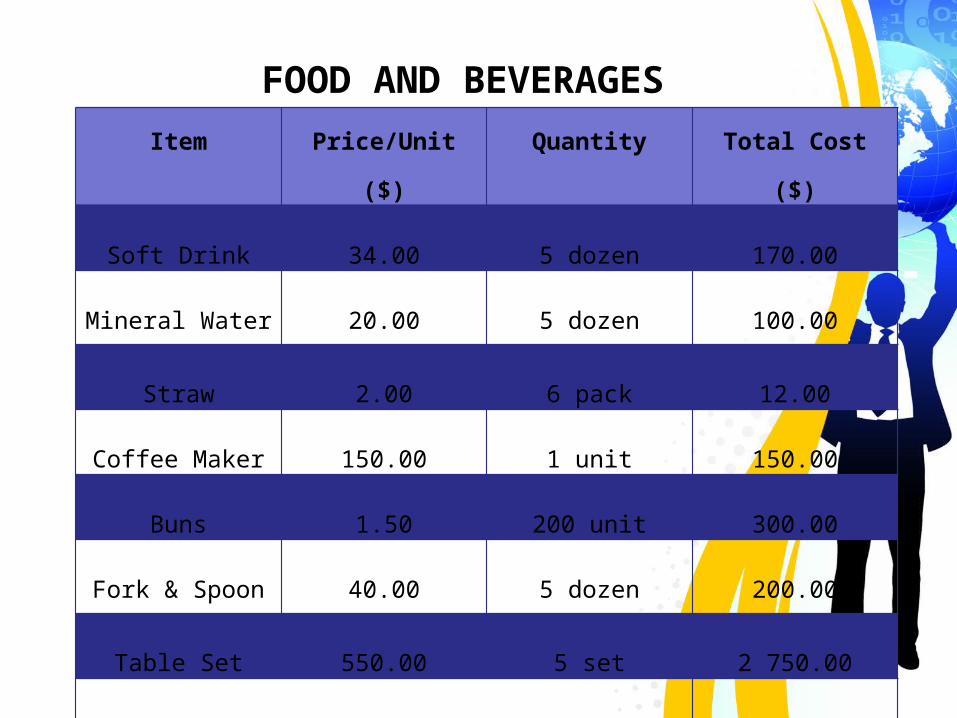
FOOD AND BEVERAGESItem Price/Unit
($)
Quantity Total Cost
($)
Soft Drink 34.00 5 dozen 170.00
Mineral Water 20.00 5 dozen 100.00
Straw 2.00 6 pack 12.00
Coffee Maker 150.00 1 unit 150.00
Buns 1.50 200 unit 300.00
Fork & Spoon 40.00 5 dozen 200.00
Table Set 550.00 5 set 2 750.00
Total 3 682.00

OTHER EQUIPMENTS BUDGET
Item Price/Unit
($)
Quantity Total Cost
($)
Cash
Machine350.00 1 350.00
Air
Conditione
r
1 000.00 2 2 000.00
Total 2 350.00

OPERATION BUDGETType Fixed Asset
Cost ($)
Monthly
Expenses ($)
Other Expenses
($)
Operational
Equipment36753.00
Raw Material2 533.50
Salary (EPF&) 2990.00
Food Beverage 3 682.00
Other
Equipment's
2 350.00
TOTAL 36753.00 9205.50 2350.00

SPACE LAYOUTFood and Beverage
Table Set
Cupcakes DisplayCashier
Kitchen Area
Washroom & Toilet
S&SSPICK & SPAN

SUPPLIERS INFO$ATIONItem Supplier
Food and
Beverages
Raw Materials
Bagus Sdn. Bhd.No. 8, Jalan Sungai Udang 2A,Klang Business Centre,4200 Klang, Selangor Darul Ehsan.
Tel : 03-33713580
Fax: 03-33721588
Kitchen
Equipment
Pretty Event Sdn. Bhd.
17,
Jalan 5/36, Bukit Harimau,
Kepong
52100 Wilayah Persekutuan Kuala
Lumpur
Supplier Info.

FINANCIAL PLAN

Sw eet Peace Bakery
Cost Sources of FinancingCash
14,700 Cash3,700 Cash
CashCash
3,500 CashCashCashCash
36,753 CashCashCashCash
W orking Capital 1 m onths 2,052 Cash13,170 Cash9,206 Cash13,100 Cash
- CashProvision for Contingencies 10% 9,618 Cash
105,799
Project Im plem entation Cost
TOTAL
Pre-Operating & Incorporation Costs (one-off)
Sales & M arketing Costs (m onthly)General & Adm inistrative Costs (m onthly)Operations & Technical Costs (m onthly)
Other Expenditure (annually)
Capital Expenditure
Operations Equipm ent
Land & Building
Renovation
Signboard
Furniture and Fitting

Cash Existing F. Assets-
14,700 14,700 3,700 3,700
- -
3,500 3,500 - - -
36,753 36,753 - - -
2,052 2,052 13,170 13,170 9,206 9,206 13,100 13,100
- 9,618 9,618
105,799 105,799
Interest rate 5% Interest rate 5%Loan tenure (years) 10 Tenure (years) 5
Sources of Project FinancingSw eet Peace Bakery
Proposed Term s of Loan (if required) Proposed Term s of Hire-Purchase (if required)
Pre-Operating & Incorporation Costs (one-off)
TOTAL
W orking Capital
Provision for Contingencies
Loan
Sales & M arketing Costs (m onthly)General & Adm inistrative Costs (m onthly)Operations & Technical Costs (m onthly)
Other Expenditure (annually)
Hire-Purchase
Signboard
Operations Equipm ent
Ow n Contributions
Land & BuildingFurniture and FittingRenovation
Capital Expenditure Cost
PRO FO$A CASH FLOW STATEMENT

2013
M O NTH Pre-Operations January February M arch April M ay June July August Septem ber October Novem ber Decem ber
CASH INFLOW
Capital (Cash) 105,799 105,799
Loan 0 0Cash Sales 47,040 47,215 47,390 47,565 47,740 47,915 48,090 48,265 48,440 48,615 48,790 48,965 576,030Collection of Accounts Receivable 0 0 0 0 0 0 0 0 0 0 0 0 0
TOTAL CASH RECEIPT 105,799 47,040 47,215 47,390 47,565 47,740 47,915 48,090 48,265 48,440 48,615 48,790 48,965 681,829
Pre-operating & Incorporation Expenditure 13,100 13,100Sales & M arketing Expenditure 2,052 2,052 2,052 2,052 2,052 2,052 2,052 2,052 2,052 2,052 2,052 2,052 24,618General & Adm inistrative Expenditure 13,170 13,170 13,170 13,170 13,170 13,170 13,170 13,170 13,170 13,170 13,170 13,170 158,040Operations & Technical Expenditure 9,206 9,206 9,206 9,206 9,206 9,206 9,206 9,206 9,206 9,206 9,206 9,206 110,472Other Expenditure 0 0Purchase of Fixed Assets 58,653 58,653Hire-Purchase Repaym ent: Principal 0 0 0 0 0 0 0 0 0 0 0 0 0Interest 0 0 0 0 0 0 0 0 0 0 0 0 0Loan Repaym ent: Principal 0 0 0 0 0 0 0 0 0 0 0 0 0Interest 0 0 0 0 0 0 0 0 0 0 0 0 0Tax Payable 0 0 0 0 0 0 0 0 0 0 0 69,074 69,074TOTAL CASH OUTFLOW 71,753 24,428 24,428 24,428 24,428 24,428 24,428 24,428 24,428 24,428 24,428 24,428 93,502 433,957CASH SURPLUS (DEFICIT) 34,046 22,613 22,788 22,963 23,138 23,313 23,488 23,663 23,838 24,013 24,188 24,363 (44,537) 247,872BEGINNING CASH BALANCE 34,046 56,658 79,446 102,408 125,546 148,858 172,346 196,008 219,846 243,858 268,046 292,408 0ENDING CASH BALANCE 34,046 56,658 79,446 102,408 125,546 148,858 172,346 196,008 219,846 243,858 268,046 292,408 247,872 247,872
M O NTHLY CASH FLO W2013
CASH OUTFLOW

PRO FO$A CASH FLOW STATEMENT (contd.)

105,799 0 0
0 0 0576,030 593,311 604,832
0 0 0
681,829 593,311 604,832
13,10024,618 25,849 27,141158,040 165,942 174,239110,472 115,367 120,571
0 - - 58,653
0 - - 0 - - 0 - - 0 - -
69,074 71,350 70,499 433,957 378,508 392,450247,872 214,803 212,382
0 247,872 462,675247,872 462,675 675,057
2013 2014 2015M O NTH
CASH INFLOW
Capital (Cash)LoanCash SalesCollection of Accounts Receivable
TOTAL CASH RECEIPT
Pre-operating & Incorporation ExpenditureSales & M arketing ExpenditureGeneral & Adm inistrative ExpenditureOperations & Technical ExpenditureOther ExpenditurePurchase of Fixed AssetsHire-Purchase Repaym ent:PrincipalInterestLoan Repaym ent:PrincipalInterestTax PayableTOTAL CASH OUTFLOWCASH SURPLUS (DEFICIT)BEGINNING CASH BALANCEENDING CASH BALANCE
CASH OUTFLOW

PRO FO$A INCOME STATEMENT

2013 2014 2015 576,030 593,311 604,832 30,408 31,300 32,300 #VALUE! #VALUE!545,622 562,011 572,532 #VALUE! #VALUE!
5,500158,040 165,942 174,23924,618 25,849 27,14180,064 84,067 88,271 #VALUE! #VALUE!
11,731 11,731 11,731 #VALUE! #VALUE!279,953 287,589 301,382 265,669 274,422 271,150 #VALUE! #VALUE!69,074 71,350 70,499 #VALUE! #VALUE!196,595 203,073 200,651 #VALUE! #VALUE!196,595 399,668 600,319 #VALUE! #VALUE!
0 30,408 31,300 32,300
30,408 31,300 32,300 #VALUE! #VALUE!
#VALUE! #VALUE! #VALUE! #VALUE! #VALUE!
Less: Cost of Sales (Notes 1 & 2)
Operations & Technical Expenditure
Gross Profit
Opening inventoryAdd: Total Purchases
Note 1
Tax
General & Adm inistrative Expenditure
Accum ulated Net Incom e
Pre-Operating & Incorporation ExpenditureLess: Expenditure
Net Incom e Before Tax
Interest on Loan
Sales & Marketing Expenditure
Net Incom e After Tax
Depreciation of Fixed AssetsTotal Expenditure
Interest on Hire-PurchaseOther Expenditure
YearsSales
Sw eet Peace BakeryPro-form a Incom e Statem ent
Carriage Inwards & DutyLess: Ending Inventory
Cost of Sales

FINANCIAL ANALYSIS

M ain M enuPro-form a Cash Flow Statem ent
Current Ratio NA NA NA #VALUE! #VALUE! Pro-form a Incom e Statem entQuick Ratio (Acid Test) NA NA NA #VALUE! #VALUE! Pro-form a Balance Sheet Financial Perform ance
Receivable Turnover NA NA NA #VALUE! #VALUE!Inventory Turnover #VALUE! #VALUE! #VALUE! #VALUE! #VALUE!
PAYBACK PERIOD FORGross Profit M argin 94.72% 94.72% 94.66% #VALUE! #VALUE! START-UP FUNDNet Profit M argin 34.13% 34.23% 33.17% #VALUE! #VALUE!Return on Assets 65.01% 40.18% 28.42% #VALUE! #VALUE!Return on Equity 65.01% 40.18% 28.42% #VALUE! #VALUE!
Debt to Equity #VALUE! #VALUE!Debt to Assets #VALUE! #VALUE!Tim e Interest Earned #DIV/0! #DIV/0! #DIV/0! #VALUE! #VALUE! INTERNAL RATE OF
2013 2014 2015 576,030 593,311 604,832 30,408 31,300 32,300 #VALUE! #VALUE!545,622 562,011 572,532 #VALUE! #VALUE!95% 95% 95% #VALUE! #VALUE!279,953 287,589 301,382 310,361 318,889 333,682 #VALUE! #VALUE!265,669 274,422 271,150 #VALUE! #VALUE!295,555 303,605 318,384 #VALUE! #VALUE!51% 51% 53% #VALUE! #VALUE!
Fixed costsTotal costsNet Profit
Break-even sales
Break-even AnalysisTotal projected sales(RM )
Total variable costs (cost of sales)Contribution m argin
Sw eet Peace Bakery
2016 201720152013 2014
LIQUIDITY
EFFICIENCY
PROFITABILITY
SOLVENCY
Percentage of break-even to sales
Financial Ratio Analysis
Contribution m argin ratio
Less than 1 year
#VALUE!
RETURN (IRR)
Less than 1 year
TIM E TO BREAK-EVEN

0
0
0
1
1
1
2013 2014 2015 2016 2017
Current Ratio
00000111111
2013 2014 2015 2016 2017
Quick Ratio (Acid Test)
0
0
0
1
1
1
2013 2014 2015 2016 2017
Receivable Turnover
00000111111
2013 2014 2015 2016 2017
Inventory Turnover
0%
20%
40%
60%
80%
100%
2013 2014 2015 2016 2017
Gross Profit M argin
0%5%10%15%20%25%30%35%
2013 2014 2015 2016 2017
Net Profit M argin
0%10%20%30%40%50%60%70%
2013 2014 2015 2016 2017
Return on Assets
0%10%20%30%40%50%60%70%
2013 2014 2015 2016 2017
Return on Equity
0%
20%
40%
60%
80%
100%
2013 2014 2015 2016 2017
Debt to Equity
0%10%20%30%40%50%60%70%80%90%100%
2013 2014 2015 2016 2017
Debt to Assets
00000111111
2013 2014 2015 2016 2017
Tim e Interest Earned


S&SSPICK & SPAN

THANK YOU…
S&SSPICK & SPAN
Copyright © 2022 FDOKUMEN

