


Bahasa
Halaman
Hukum


www.elsevier.com/locate/cogbrainres
Cognitive Brain Research 21 (2004) 250–268
Research report
What is common to brain activity evoked by the perception of visual and
auditory filled durations? A study with MEG and EEG co-recordings
Karim N’Diaye*, Richard Ragot, Line Garnero, Viviane Pouthas
Laboratoire de Neurosciences Cognitives et Imagerie Cerebrale, CNRS UPR640-LENA, Hopital Salpetriere, 47 Boulevard de l’Hopital,
75651 Paris, Cedex 13, France
Accepted 15 April 2004
Available online 9 June 2004
Abstract
EEG and MEG scalp data were simultaneously recorded while human participants were performing a duration discrimination task in
visual and auditory modality, separately. Short durations were used ranging from 500 to 900 ms, among which participants had to
discriminate a previously memorized 700-ms ‘‘standard’’ duration. Behavioral results show accurate but variable performance within and
between participants with expected modality effects: the percentage of responses was greater and the mean response time was shorter for
auditory than for visual signals. Sustained electric and magnetic activities were obtained correlatively to duration estimation, but with distinct
spatiotemporal properties. Electric CNV-like potentials showed fronto-central negativity in both modalities, whereas magnetic sustained
fields were distributed with respect to the modality of the interval to be timed. Time courses of these slow brain activities were found to be
dependent on stimulus duration but not on its modality nor on the recording signal (EEG or MEG). Source reconstruction demonstrated that
these sustained potentials/fields were generated by superimposed contributions from visual and auditory cortices (sustained sensory
responses, SSR) and from prefrontal and parietal regions. By using these two complementary techniques, we thus demonstrated the
involvement of frontal and parietal cerebral cortex in human timing.
D 2004 Elsevier B.V. All rights reserved.
Theme: Motor systems and sensorimotor integration: cortex
Topic: Neural basis of behavior: cognition
Keywords: MEG; EEG; Time perception; Auditory; Visual; Distributed source analysis
1. Introduction ‘‘time perception’’ refers to the ability of human beings to
Although numerous behavioral studies have explored
functional properties of the human timing abilities, insights
into the neural bases of them are still scarce. Despite the
ubiquity of time, experimental psychology has come up to
isolate one range of durations from this continuum: the so-
called ‘‘short’’ or circa second durations, which span from
some hundredths of a seconds to few seconds. The ability
to handle temporal events in that range of durations is what
Fraisse [20] named ‘‘time perception’’, as opposed to ‘‘time
estimation’’ which concerns longer durations. The words
0926-6410/$ - see front matter D 2004 Elsevier B.V. All rights reserved.
doi:10.1016/j.cogbrainres.2004.04.006
* Corresponding author. Tel.: +33-1-42-16-14-02; fax: +33-1-45-86-
25-37.
E-mail address: [email protected] (K. N’Diaye).
apprehend such short intervals as unitary objects whether
they are composed of either simple events (as a ‘‘beep’’ in
a Morse code) or more complex sensory signals (as a piece
of bird song). Yet, their subjective duration might differ
according to many non-temporal factors among which, our
own inner state or physical characteristics of the stimuli
(such as sound intensity). Among them, the sensory mo-
dality involved in the timed interval has been widely
demonstrated to play a major role in the perceived duration
of any time interval as well as in the accuracy of this
perception [26]. Contrasting with our unitary feeling of the
passage of time, these discrepancies in the subjective
timing of sensory events raise challenging questions: First,
since any signal is primarily processed by the appropriate
sensory channel, how much does sensory processing con-
tribute to the perception of duration? And more fundamen-
K. N’Diaye et al. / Cognitive Brain Research 21 (2004) 250–268 251
tally, to what extent can we isolate a supra-modal process-
ing of duration—a hypothetical central single timing pro-
cess, which might be involved independently of the
sensory modality of the signal to be timed?
1.1. Behavioral aspects and EEG correlates of duration
discrimination
To assess human performance in interval timing, many
experimental procedures have been adapted from animal
timing paradigms [1]. One of them is the ‘‘temporal gener-
alization’’ first applied to human beings by Wearden [81].
This paradigm has proved to be highly sensitive to slight
differences in behavioral results, such as those induced by
modality effects [38,83]. Using temporal generalization, and
other methods, psychophysical studies have quantitatively
assessed the influence of modality on perceived duration.
Auditory signals are thus judged longer than objectively
equal visual ones [4,23,64,75,83], and with a greater accu-
racy and precision [25,27].
Functional investigations of the neural bases of time
judgment may be traced back to the early 1960s. Although
not dedicated to the study of human timing as such, a fixed-
interval reaction time task provided the first insights into
electrophysiological correlates of human temporal process-
ing. In that task, participants had to respond as fast as
possible to an ‘‘imperative stimulus’’ systematically preced-
ed by a ‘‘warning stimulus’’ with a constant fore period.
While recording scalp electroencephalography (EEG), Wal-
ter et al. [80] observed a widespread fronto-central negative
potential developing during the interval separating the two
stimuli, named ‘‘contingent negative variation’’ (CNV),
which they associated with ‘‘expectancy’’. CNV has been
extensively studied within a timing framework and various
relationships between its properties and temporal judgment
have since been established [15,53,58,73].
Amplitude and time course of the CNV are correlated to
behavioral performance in the following way: CNV am-
plitude [53,66] and resolution (indexed by the zero cross-
ing of the slow wave) [52,69,73] both correlate with
subjective duration, and participants showing rapid CNV
resolutions also manifest temporal accuracy [42]. Two
recent studies by Pfeuty et al. [66] and Macar and Vidal
[51] have also demonstrated that the peak of the CNV was
dependent on the encoded duration in a duration discrim-
ination protocol.
1.2. Addressing the role of modality in human timing with
electromagnetic recordings
Contrasting with behavioral investigations, functional
studies have hardly ever focused on modality effects in
timing (but see Refs. [6,21]): On the ground of the behav-
ioral results, two alternative explanations have been pro-
posed to account for the fact that auditory signals are judged
longer. First, the auditory clock might run faster than the
visual clock. Second, auditory signals would be more
readily processed. Consequently in both cases, the accumu-
lated value for the same physical duration will be higher
when signals are auditory. Following what has been said of
CNV properties and time judgment, one could investigate
sensory modality effects using the CNV as a window on
physiological processes: Assuming that auditory signals
lead to longer subjective duration, tone-elicited CNV am-
plitude would be larger and would resolve later in time than
light-elicited CNV.
However, two possible confounds might impede such
straightforward comparisons. Firstly, scalp EEG records
electric potential due largely to whole brain activity with
only remote contributions of the actual active regions,
depending on their locations, orientation and on electrical
diffusion across the tissues. As auditory and visual cortices
are located in different regions of the brain, their contribu-
tions to the scalp EEG differ. Plain comparisons of scalp-
recorded signal in visual and auditory conditions might thus
be ill-grounded. Secondly, the time-course of sensory
evoked responses also depends on the modality. Roughly
speaking, auditory EEG responses are earlier than visual
ones. Whether sensory components might contribute to the
CNV has thus to be answered before anything is inferred
from the CNV time-course. Each of the issues raised here
will be discussed separately.
1.3. In search of the CNV generators
EEG responses to visual and auditory stimuli originate
from different regions of the brain, mainly due to the
occipital and temporal location of the visual and auditory
cortices. This needs caution when scalp distributions and
amplitudes of light- versus tone-evoked responses are to be
compared. To circumvent this difficulty, one may attempt to
isolate sources of the CNV from sensory processing activ-
ity, whose generators are located within the sensory corti-
ces. In recent years, various attempts to identify the neural
generators of CNV activity have been undertaken. Initially,
based on the analysis of scalp topography, these studies
inferred from the fronto-central distribution of CNV that it
mainly originated from frontal regions [12,49]. These
results were confirmed by epidural [80] and subdural
recordings [29,37,43], the latter also showing implications
of supplementary motor area and dorsolateral prefrontal
cortex.
The study by Pouthas et al. [69] contrasted a duration
discrimination task based on temporal generalization with
an intensity discrimination task. Timing visual signals
evoked a CNV whereas discriminating other aspects of the
same stimulus did not. Using the results of a preceding
positron emission tomography study, these authors could
constrain positions of the dipoles within the regions show-
ing increased regional cerebral blood flow. This dipole
analysis demonstrated that even if the same regions were
engaged in both tasks, time course of their activity differed.

K. N’Diaye et al. / Cognitive Brain Research 21 (2004) 250–268252
In particular, right prefrontal dipole exhibited a CNV-like
activity, reproducing the timing of its resolution as well,
while left prefrontal source showed sustained activity what-
ever the task. These results are in line with those obtained
by Pfeuty et al. [66] on a similar but auditory duration
discrimination task, as well as with those by Monfort et al.
[60] showing an enhanced negativity over right frontal areas
when encoding and comparing duration information.
Magnetoencephalography (MEG) can be of precious
help in analyzing neural bases of timing behavior owing
to its high spatial resolution. Using dipolar or distributed
source analyses, a few studies have tried to probe the
‘‘contingent magnetic variation’’ (CMV), the magnetic
counterpart of the CNV [3,13,16,35]. Multiple generators
located in frontal, premotor, sensory and associative areas
form a complex picture, which may be partly due to the
diversity of the tasks used (filled/empty intervals, auditory/
visual modalities) and to a ‘‘considerable intersubject vari-
ability’’ [16] observed by all authors.
Furthermore, magnetic correlates of duration discrimina-
tion in the circa-second range have never been addressed
directly. To our knowledge, only two studies have previ-
ously used MEG to deal with duration discrimination in the
circa-second range. In the first study, by Hari et al. [31],
duration discrimination of tones was used as a case of
selective listening. They reported enhanced sustained activ-
ity correlative to attention to duration over temporal sensors
were the auditory sustained response was recorded from.
Sieroka et al. [76] have used an auditory oddball paradigm
where longer targets had to be detected among 1-s tones.
Augmented activity for the auditory sustained response was
explained with a dipolar modeling by an additional parietal
source whose moment’s amplitude was correlated with
duration discrimination performance by subjects.
1.4. Time-course of brain activity in duration estimation
The key feature of MEG-EEG is thus the millisecond
resolution which allows one to follow the evolution of brain
activity from the stimulus onset to the evaluation of its
duration by the human observer leading ultimately to a
motor response. Within the framework of time perception,
this is of much value since timing the duration of any
particular event is essentially a dynamic process. As men-
tioned above, a growing number of studies have focused on
the waveform of event-related potentials/fields in a timing
context. It has been demonstrated that timing performance
was tightly related to the resolution of slow waves (e.g. the
CNV), whose generators might comprise a distributed
network of cortical regions. Much information can be gained
from studying the time course of these particular slow
potentials in relation to the anatomy of their generators.
However when the participants have to time a visual or
an auditory signal, one shall also be concerned with the
concurrent cortical activity which is elicited within sensory
cortices, as both kinds of signals evoke transient and
sustained responses. In EEG, transient activity is described
as a succession of positive–negative potentials labeled after
their electrical sign and their latency [22,63]: the main
visually evoked potentials recorded from the occipital or
parieto-occipital sites are the P1 (positive, 80–130 ms after
stimulus onset), the N1 (negative, 130–200 ms) and the P2
(positive, 200–300 ms). The main auditory electric compo-
nents are recorded from fronto-central sites (because of the
dispersion of the electric field by the head tissues); they
consist of a small positive component, the P50 (50–60 ms),
followed by a larger negative shift, the N1 (100–120 ms)
and then a positive deflexion, i.e. the P2 (150–200 ms). The
magnetic counterparts of these electric potentials are labeled
likewise: P50m, N1m and P2m.
The functional significance of these early components is
still a matter of debate as it is now acknowledged that each
of them might be divided into multiple overlapping sub-
components differentially affected by behavioral context or
stimulus properties [55,61]. However, the main sources of
the transient responses are mainly located within the
corresponding sensory cortices (supratemporal cortex for
auditory signals and inferior occipital cortex but also in
dorsal occipital and medial occipito-parietal cortices for
visual stimuli [14]).
Besides these transient responses, continuous sensory
stimulation (i.e. signals longer than few tens of millisec-
onds) additionally evoke sustained responses whose distri-
butions are very similar to those of the primary sensory
responses (as their cortical generators largely overlap
[28,63]) and which persist until stimulus offset. On scalp
recordings, these sustained responses may overlap with
other slow waves, such as those elicited by cognitive
processes. However, contrary to task-related components,
these sustained responses ordinarily show a plateau-shaped
waveform, i.e. constant amplitude throughout the duration
of the stimulation [67,76].
Since timing procedures commonly use visual or audi-
tory stimuli to define the interval to be timed, valid
inferences on electrophysiological correlates of human tim-
ing thus require to distinguish between sensory evoked
potentials/fields (especially sustained ones) and timing-re-
lated activity. Two lines of evidence can be drawn upon: (1)
as stated above, the main correlate of human timing is the
CNV which develops in relation to the interval to be timed.
Its time course allows one to distinguish it from the
sustained potentials that it could be mistaken for: whereas
the CNV peaks at a point in time corresponding to the
target-duration (or its subjective representation), the sus-
tained response shows a steady plateau waveform with
constant amplitude. (2) According to the location of the
generators of the sustained sensory responses (SSR), their
electric and magnetic signatures might differ from scalp
recordings of the CNV, whose generators lie in distinct
(although unclear) cortical regions. Source reconstruction is
here of great profit as it enables to identify distinct subsets
of generators for these two types of evoked responses that

K. N’Diaye et al. / Cognitive Brain Research 21 (2004) 250–268 253
might otherwise appear very similar providing their electric/
magnetic scalp distributions.
1.5. Objectives of the present study
The present experiment was thus aimed at investigating
the neural bases of timing in a duration discrimination task.
Besides fMRI, which has been extensively used with timing
tasks (see reviews by Lewis and Miall [48] and Macar et al.
[54]) but lacks temporal accuracy, MEG supplies informa-
tion on the anatomy of the cortical substrates involved in a
particular cognitive task, while at the same time providing
the same high temporal accuracy as EEG. Whereas most
BOLD-based studies provide little information on the
evolution of brain activity (event-related fMRI allows
promising insights on that question [70]), we looked at
the precise time course of the electrophysiological corre-
lates of the processes involved in timing duration whilst
source analyses were conducted to identify their anatomical
substrates.
To extend the results of previous EEG studies carried out
in our laboratory [66,69], EEG recordings were simulta-
neously acquired throughout the experiment. Direct com-
parison of EEG and MEG signals is not straightforward
since MEG—contrary to EEG—is known to be ‘‘blind’’ to
radially oriented or deep cerebral currents [32]. As a
consequence, some electric components may not show an
obvious magnetic counterpart in the simultaneously ac-
quired MEG data. Hence, measuring MEG and EEG simul-
taneously provides a full picture of brain activity (for
comparison of auditory MEG and EEG responses, see
Ref. [36]).
Works by Pouthas and her coworkers [66,69] have
used, respectively, visual and auditory signals, but none
have used both modalities with the same participants.
Because of the questions raised concerning the role of
modality in timing, we were interested in having the same
participants perform identical task in visual and auditory
modalities, in order to compare auditory and visual blocks
within the same study. We assumed that common mech-
anisms to visual and auditory timing should therefore be
activated in both conditions, while modality specific
processes should differ in-between. According to the
results of the work cited above, we hypothesized that
sensory processing-related and timing-related activities
might display distinct time-courses. The former (being
stimulus-driven) would be reflected by early and middle
latency transient components followed by plateau-like
sustained potentials/fields over the scalp surface. On the
contrary, time course of components related to the timing
task should reflect temporal processing of events with
little or no dependency on the stimulus actually presented.
From what is known about electrophysiological correlates
of time perception, we expected to observe fronto-central
activity whose resolution should occur at the end of the
target duration used in our task. However, analyses solely
based on electromagnetic scalp signals may be impeded
by the diffusion of electric potentials due to head tissue
and also by the concurrent activation of a scattered set of
cortical generators. We used distributed source reconstruc-
tion in order to separate those contributions on the basis
of their neuroanatomical locations. In sum, the spatiotem-
poral analysis of electromagnetic correlates of timing
processes should provide helpful insights on their func-
tional properties in comparison to those of stimulus driven
activities.
2. Materials and methods
2.1. Participants
Thirteen right-handed healthy young male volunteers
(ranging in age from 21 to 29 years, mean 24.6) participated
in the study. All had normal hearing and vision. It was
controlled that participants were not under medication and
did not suffer from any central nervous system abnormality
or injury. Informed consent was obtained from each partic-
ipant. Participants were paid for their participation. The
study was approved by the French Ethical Committee on
Human Research (CCPPRB, Hopital Pitie-Salpetriere).
2.2. Design and procedure
Our study used a temporal generalization task. The
session was divided in two parts: one in the visual modality,
the other in the auditory modality. Order of presentation was
counter-balanced across participants. Each part was com-
posed of three blocks. Each block started with six succes-
sive presentations of the 700-ms ‘‘standard stimulus’’.
Participants had to memorize its duration in order to
compare it to each of the following ‘‘test stimuli’’ which
could be: 490, 595, 700, 805 or 910 ms, designated as
‘‘short’’, ‘‘intermediate short’’, ‘‘standard’’, ‘‘intermediate
long’’ and ‘‘long’’. Every block was thus made of 6 standard
presentations and 100 test stimuli randomly presented.
Participants had to respond by pressing a button for each
test stimulus, with the right thumb if its duration was
identical to that of the standard or with the left thumb if it
was different. Since there were 20 presentations of the 5
test-durations in every block, participants should have
pressed the left button in 80% of trials, and the right button
for the 20% remaining. Inter-trial interval was random
between 1500 and 2300 ms (mean: 1900 ms).
2.3. Stimuli
Auditory stimuli were 500 Hz pure tones, 490, 595, 700,
805 or 910 ms long, including a 3-ms rise/fall time. Sounds
were produced by piezoelectric transducers and conducted
through plastic tubing and molded earplugs to both ears of
the participant. Intensity was initially set around 70 dB,
K. N’Diaye et al. / Cognitive Brain Research 21 (2004) 250–268254
adjusted according to the comfort of each participant, and
then kept constant during the whole session. Visual stimuli
were produced by a green light emitting diode (LED) placed
outside the shielded room to prevent magnetic artifacts. The
beam light was guided through an optical fiber to a
translucent aperture in the middle of a black panel placed
65 cm from the participant’s face. The light was piloted by a
computer with a millisecond precision. Light duration was
identical to tone duration, i.e. 490, 595, 700, 805 or 910 ms.
Sixty trials by participant were recorded for each duration,
in each modality.
2.4. Simultaneous EEG and MEG
In a dimly lit electromagnetically shielded room, each
participant was seated in a chair with eyes open gazing at a
white circle in the middle of the black panel holding the
optical fiber used for visual stimulation.
Magnetic fields were measured with a 151-DC-SQUID
whole-head type MEG system (Omega 151, CTF Systems,
Port Coquitlam, B.C., Canada [79]). Three small coils were
attached to reference landmarks on the participant: at the
left and right pre-auricular points and at the nasion. At the
beginning of each block, the head position relative to the
coordinate system of the MEG helmet was calculated from
the position of those coils in order to register possible head
movements during the experimental session.
Electrical activity was recorded simultaneously with a 64
Ag/AgCl unipolar electrode cap and processed by the MEG
system. Electrode placement followed the Extended Inter-
national 10–20 system and position of each electrode in the
participant’s coordinate system was digitized with a Polhe-
mus Fast Track system (Polhemus, Colchester, VT, USA).
EEG signal was referenced on-line against the linked
earlobe potential.
All operations were controlled by a computer (PC) with
< 1 ms precision running in MS-DOS mode. This PC also
recorded participant’s responses and triggered MEG/EEG
acquisition on every trial. Electromagnetic activity was
recorded with a digitization sampling-rate of 625 Hz after
passing through a DC to 100 Hz on-line filter.
Each trial was 2 s long including 100 ms pre-trigger and
1900 ms post-trigger periods. The 100-ms pre-stimulus
epoch served as a baseline for MEG or EEG amplitude.
Participants were instructed to maintain their gaze fixed
on the optic fiber at the center of the panel and to avoid
blinking in the interval from stimulus onset to their
response. Eye-blinks or movements and cardiac artifacts
were monitored for later off-line correction with three pairs
of disposable electrodes placed laterally on the temples, at
the outer canthus of each side for horizontal electrooculo-
gram (EOG), above and below the right eye for vertical
EOG, and on the shoulder and stomach for the electrocar-
diogram (ECG). One extra-channel served as a control
track, recording the signal derivated from the stimulation
system.
2.5. Data analysis
Three behavioral indexes were computed from responses.
Generalization gradient was computed as the rate of ‘‘Yes, it
is the Standard’’ responses (%Yes) according to the duration
of the stimulus actually presented. Percentage of correct
responses (%Correct) was the mean of the rate of true
positive, i.e. ‘‘Standard’’ responses to standard durations
(S) and the rates of true negative, i.e. ‘‘Not the standard’’
responses to the longer or shorter than standard durations (C,
IC, IL and L). Response time (RT) was computed from
stimulus’s offset. Analyses of variance (ANOVA) were
carried out using a two within-subject factors: modality
(visual/auditory) and duration (five levels: C, IC, S, IL, L)
corrected for multiple comparisons. T-tests comparing con-
ditions were corrected with the Bonferroni method.
Two participants were discarded from the following
analysis because of a large amount of movement and
blinking artifacts. Trials during which responses occurred
less than 125 ms after the offset of any stimulus were also
rejected. Trials showing deflections of EOG were corrected
using an automatic off-line method [24]. Likewise, cardiac
artifacts were removed from the signal by subtracting the
average activity time-locked to the QRS complex. Trials
with EEG changes exceeding 50 AV or MEG changes
exceeding 0.5 pT were discarded. For further analysis, data
were then low-pass filtered under 20 Hz.
To even out differences in head position across partic-
ipants, co-registration was applied on inter-individual MEG
data: MEG signal was first modeled in a high-dimension
space (151 virtual dipoles) and then re-projected on a single
array of sensors, which was the same for all participants.
This allowed a more precise inter-individual averaging of
scalp MEG data.
Event-related potentials (ERP) and event-related fields
(ERF) were obtained by computing separate averages of the
data for each stimulus duration, from each modality inde-
pendently of the subject’s response (i.e. whether it was
correct or not). To increase signal to noise ratio, all durations
were pooled together to investigate early components, that is
before 490 ms. Indeed, until that point, all stimuli were
physically identical.
To analyze transient components, data were filtered with
a 20-Hz low-pass zero-phase digital filter. Electric N1
latency was measured as the latency of the maximum
negative deflexion in EEG trace occurring around 180 ms
at parieto-occipital sites (PO7 and PO8) in the visual
condition, and around 100 ms at fronto-central sites (FC5
and FC6) in the auditory condition. Its magnetic counterpart
(N1m) was measured on temporo-parieto-occipital sensors
(MLT26 and MRT26) in the visual condition and on tem-
poral sensors (MLT22 and MRT22) in the auditory condition
at the first maximum deviation after stimulus onset.
Slow potentials were analyzed from 8-Hz low-pass
filtered data. Maximum amplitude and latency of this
maximum was collected from the same EEG and MEG

K. N’Diaye et al. / Cognitive Brain Research 21 (2004) 250–268 255
sites as those used for the transient responses. Slow wave
resolution was defined as the latency of the half-height
amplitude between the maximum and the peak following
stimulus offset. Finally, the latency of this latter peak was
recorded as an index of the transient off response.
These data were statistically analyzed with an analysis of
variance (ANOVA) separately for EEG and MEG signals
using the following within-subject factors: modality (visual/
auditory)� duration (5 levels)� side (left/right)� position
(fronto-temporal/parieto-occipital) corrected for multiple
comparisons: The Huynh-Feldt correction (eHF) was appliedon EEG/MEG measurements instead of the Greenhouse–
Geisser (eGG), provided that e was above 0.75 (and degrees
of freedom larger than 1).
All statistics were calculated using Statistica software
[77].
2.6. Source analysis
Distributed source analyses used The BrainStorm
Toolbox [2] to perform a minimum-norm analysis. For
this purpose, anatomical magnetic resonance images
(MRI) were obtained for each participant on a separate
session with a 1.5-T Sigma MRI scanner (General
Electrics, Milwaukee, WI) at the Service de Neuroradio-
logie de l’Hopital de la Pitie-Salpetriere (Paris, France).
Sequence used a high resolution volume inversion-recu-
peration fast spoiled gradient recalled echo structural
imaging (IR-FSPGR) along an axial scan plane, time of
repetition = 14.3 ms, time of echo = 6.3 ms, time of
inversion = 400 ms, field of view = 24 � 24 cm,
matrix = 256� 192, number of excitations = 1, number of
slices = 124, contiguous 1.3 mm thick. Scan time was
9V43U. Grey matter and grey matter/white matter interface
segmentations were performed using Anatomist software
[56]. The scalp data used for source reconstruction was
an average of co-registered individual datasets: trials of
700, 805 and 910 ms duration were pooled together to
increase signal to noise ratio. On these grand-mean
datasets, distributed source analyses were performed using
a template brain segmentation co-registered with the
template sensor array (a similar source reconstruction
using grand-mean data has been used by Hopf et al.
[34]). Because 700, 805 and 910 ms stimuli were
physically indiscernible up to 700 ms (the shortest of
the three durations), distribution of sources was computed
from this average until 700 ms.
Fig. 1. Generalization gradient in both modalities. Percentage of ‘‘equal to
standard’’ responses (ordinate) according to stimulus duration.
3. Results
3.1. Behavioral data
3.1.1. Generalization gradient
Average behavioral results show that the maximum rate
of ‘‘standard’’ responses was obtained for the standard
(700 ms) duration (68% in the visual condition and 68.8%
in the auditory condition) in comparison to other longer or
shorter stimuli, leading to the classical centered gradient
shape (Fig. 1).
3.1.2. Percentage of correct responses
Behavioral performance was assessed by computing
the rate of correct responses (true positive plus true
negative). Participants performed with 63.2% of correct
responses in visual blocks and 70.2% in auditory blocks.
A two within-subject factor ANOVA was conducted using
modality and duration as independent variables: 2 modal-
ities� 5 durations, corrected for multiple comparisons.
The effect of modality on correct responses was signif-
icant (F = 14.1, p < 0.01) indicating that stimuli were
better recognized in the auditory modality than in the
visual modality. The effect of duration was also signifi-
cant (F = 6.1, p < 0.05, eGG = 0.46). There was no inter-
action between modality and duration (F = 1.4, p = 0.27,
eGG = 0.47). Interestingly, post-hoc comparisons revealed
that the percentage of correct responses was significantly
higher for the extreme (490 and 910 ms) durations than
for the intermediate short duration (595 ms), and also for
the long duration (910 ms) than for the intermediate long
(805 ms) duration ( p < 0.05 in every case). There were
no differences for any other comparison. This shows that
the intermediate durations (595 and 805 ms) tend to be
more easily confounded with the standard than the
extreme durations (490 and 910 ms).
3.1.3. Response times
Response times, computed from signal offset, varied
monotonically with stimulus durations: the longer the dura-

K. N’Diaye et al. / Cognitive Brain Research 21 (2004) 250–268256
tion, the shorter the response time (548.5 ms for ‘‘long’’
vs. 748.5 ms for ‘‘short’’ stimuli). Auditory signals were
answered earlier than visual signals (667.6 and 723.0 ms,
respectively) (Fig. 2). These observations were assessed
by statistical analyses: significant effects of duration
(F = 30.8, p < 0.01, eGG = 0.48) and modality (F = 8.0,
p < 0.05) on response times were obtained. Interaction
between these two factors did not lead to any significant
effect (F = 1.7, p = 0.21, eGG = 0.39). Post-hoc compari-
sons showed significant differences between the response
times to the shortest durations (either 490-, 595- or 700-
ms stimuli) and the responses times to the longest ones
(805- or 910-ms durations) ( p < 0.05 in every pair wise
comparison). Participants were faster at identifying the
longest durations.
3.2. EEG and MEG data in the visual condition
EEG recordings were made up of a transient response
followed by a sustained response. Firstly, three-component
early and middle latency responses occurred with a posi-
tive–negative–positive sign over occipital regions (Figs. 3,
top, and 5). These transient responses were then followed by
a sustained potential showing occipital positivity and fronto-
central negativity. MEG recordings showed a transient
middle latency response maximal over temporo-parietal
sensors followed by a sustained activity over the same
regions (Figs. 3, bottom, and 5).
3.2.1. Visual early and middle latency responses
Visual stimulation led to a typical pattern of P1, N1, P2
components recorded on left (PO7) and right (PO8) parieto-
Fig. 2. Mean response times for each stimulus du
occipital electrodes, respectively 123, 192 and 230 ms after
light onset. (Fig. 3, second row) At fronto-central sites, a
large positive deflection, peaking 200 ms after light onset,
was recorded (Fig. 3, first row). Magnetic counterparts of
the N1 and the P2 components, namely N1m and P2m,
peaking respectively 160 and 210 ms after stimulus onset,
were recorded with maxima on left (MLT26) and right
(MRT26) temporo-parieto-occipital sensors (Fig. 3, third
row). ANOVA analyses show no effect of stimulus duration
on N1 and N1m latencies or amplitudes (F < 1, p>0.5 for all
main effects).
3.2.2. EEG visual sustained response
After those early and middle latency components, a
negative fronto-central slow potential developed. This
slow wave can be labeled as a CNV firstly described
by Walter et al. [80] and observed in a similar condition
to ours (e.g. Pouthas et al. [69]). Its location was distinct
from that of the transient sensory response, being max-
imal on the fronto-central electrodes (Fig. 5). This broad
slow component was also prominent at lateral fronto-
central sites (FC5 and FC6) as shown on Fig. 3 (first
row). The mean latency of the maximum was 655 ms
(S.D. = 118 ms). No significant effect of duration was
obtained (F = 2.5, p = 0.11, eGG = 0.60). CNV resolution
showed a slow decrease in amplitude from the maximum
followed by a steeper slope. This deflexion marked the
end of the sustained potential following LED extinction.
Two separate components seemed thus to occur concur-
rently at the resolution of the CNV: first, a slow
resolution of the negativity starting around 650–700 ms
independently of the duration of the stimulation (except
ration in the visual and auditory modality.
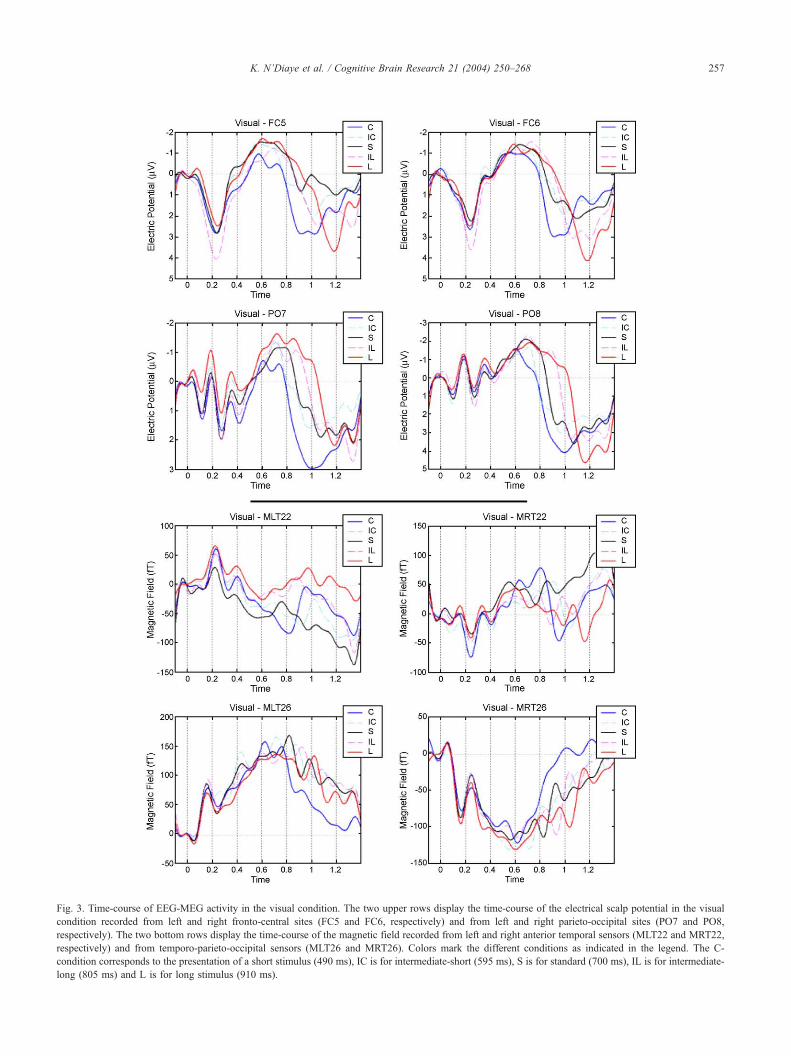
Fig. 3. Time-course of EEG-MEG activity in the visual condition. The two upper rows display the time-course of the electrical scalp potential in the visual
condition recorded from left and right fronto-central sites (FC5 and FC6, respectively) and from left and right parieto-occipital sites (PO7 and PO8,
respectively). The two bottom rows display the time-course of the magnetic field recorded from left and right anterior temporal sensors (MLT22 and MRT22,
respectively) and from temporo-parieto-occipital sensors (MLT26 and MRT26). Colors mark the different conditions as indicated in the legend. The C-
condition corresponds to the presentation of a short stimulus (490 ms), IC is for intermediate-short (595 ms), S is for standard (700 ms), IL is for intermediate-
long (805 ms) and L is for long stimulus (910 ms).
K. N’Diaye et al. / Cognitive Brain Research 21 (2004) 250–268 257
K. N’Diaye et al. / Cognitive Brain258
the shortest one, 490 ms), then a fast positivity time-
locked to the light offset. Sustained activity was also
present on parieto-occipital and occipital electrodes, i.e.
on the putative projection area of visual cortex, but with
smaller amplitude. However, contrary to what has been
described concerning fronto-central regions, the sustained
negativity resolution was modified by the actual duration.
On these posterior sites, resolution occurred in time with
the offset of the stimulation, which contrasts from what
was observed on fronto-central sites. On Fig. 3, one can
see a clear separation of the waveforms according to
stimulus duration on posterior sites (second row) but not
on frontal sites (first row).
3.2.3. MEG visual sustained response
Magnetic data also showed a sustained response over
temporo-parietal and parieto-occipital sensors (Fig. 5, top
right). This field was maximal on left (MLT26) and right
(MRT26) temporo-parietal sensors and its waveform dis-
played a CNV-like pattern with a steep increase after the
P2m component of the transient response, followed by a
plateau with constant amplitude around 120 fT (Fig. 3,
fourth row). Resolution of this sustained field was time-
locked to stimulus offset. However, a decrease in this
field could be observed for the longest duration, where
an analogue of the slow positive electric component
described above started at 700 ms, and then was over-
ridden by a N1m–P2m complex corresponding to the
offset response. The same pattern was observed over both
hemispheres. On the temporo-parietal recording sites,
where maximal field was recorded, the latency of the
maximal amplitude was not significantly dependent on
stimulus duration (F = 2.6, p = 0.098, eGG = 0.54) nor was
its amplitude (F = 1.22, p>0.1).
3.2.4. EEG and MEG scalp distributions
Topography of the electric signal due to early sensory
activity was mainly posterior with negativity peaking on
parietal and occipital sensors. On the contrary, the sustained
potential was a negative fronto-central slow wave paired
with a centro-parietal positivity. The magnetic signal
showed a very different pattern: there was a great similarity
in the distributions of the evoked fields due to the early
response and the distributions of the fields due to the
sustained activity. At both latencies, peak activity was
bilaterally localized on temporo-parieto-occipital sensors
reflecting posterior activity.
3.3. EEG and MEG data in the auditory condition
EEG recordings showed negative transient responses
followed by a sustained negativity, centered on fronto-
central electrodes. MEG recordings also showed a tran-
sient response, which was maximal over fronto-temporal
and temporo-parietal sensors and followed by a sustained
activity over the same regions (Fig. 4).
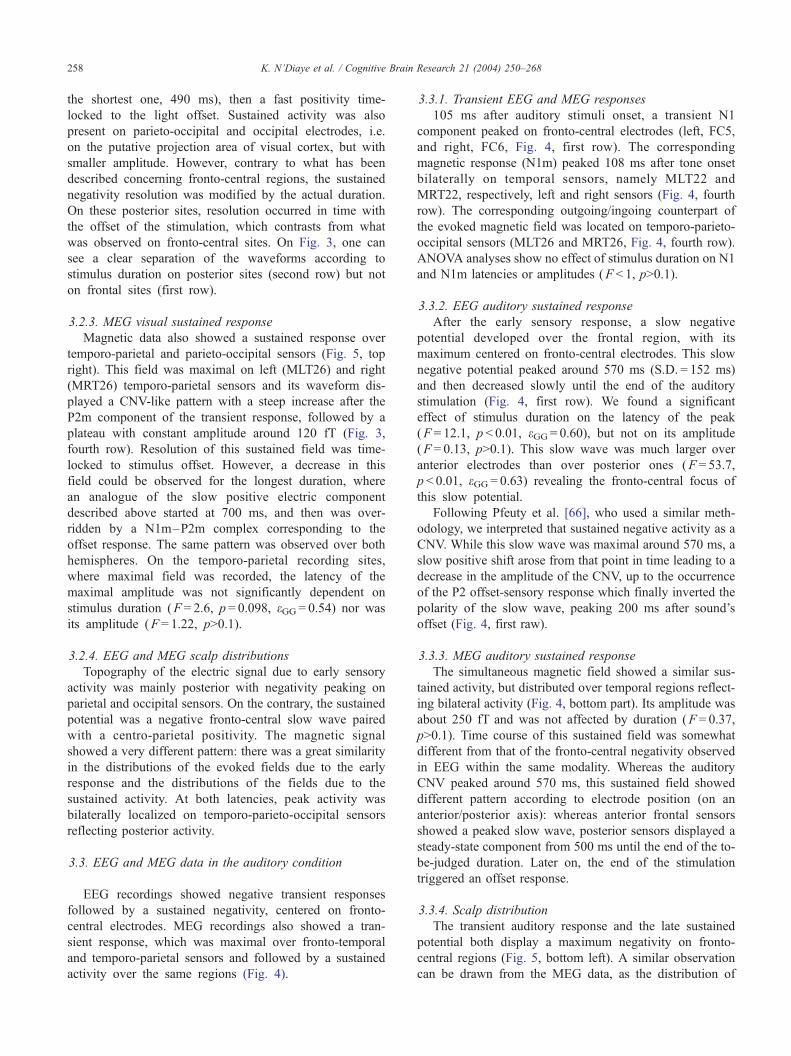
3.3.1. Transient EEG and MEG responses
105 ms after auditory stimuli onset, a transient N1
component peaked on fronto-central electrodes (left, FC5,
and right, FC6, Fig. 4, first row). The corresponding
magnetic response (N1m) peaked 108 ms after tone onset
bilaterally on temporal sensors, namely MLT22 and
MRT22, respectively, left and right sensors (Fig. 4, fourth
row). The corresponding outgoing/ingoing counterpart of
the evoked magnetic field was located on temporo-parieto-
occipital sensors (MLT26 and MRT26, Fig. 4, fourth row).
ANOVA analyses show no effect of stimulus duration on N1
and N1m latencies or amplitudes (F < 1, p>0.1).
3.3.2. EEG auditory sustained response
After the early sensory response, a slow negative
potential developed over the frontal region, with its
maximum centered on fronto-central electrodes. This slow
negative potential peaked around 570 ms (S.D. = 152 ms)
and then decreased slowly until the end of the auditory
stimulation (Fig. 4, first row). We found a significant
effect of stimulus duration on the latency of the peak
(F = 12.1, p < 0.01, eGG = 0.60), but not on its amplitude
(F = 0.13, p>0.1). This slow wave was much larger over
anterior electrodes than over posterior ones (F = 53.7,
p < 0.01, eGG = 0.63) revealing the fronto-central focus of
this slow potential.
Following Pfeuty et al. [66], who used a similar meth-
odology, we interpreted that sustained negative activity as a
CNV. While this slow wave was maximal around 570 ms, a
slow positive shift arose from that point in time leading to a
decrease in the amplitude of the CNV, up to the occurrence
of the P2 offset-sensory response which finally inverted the
polarity of the slow wave, peaking 200 ms after sound’s
offset (Fig. 4, first raw).
3.3.3. MEG auditory sustained response
The simultaneous magnetic field showed a similar sus-
tained activity, but distributed over temporal regions reflect-
ing bilateral activity (Fig. 4, bottom part). Its amplitude was
about 250 fT and was not affected by duration (F = 0.37,
p>0.1). Time course of this sustained field was somewhat
different from that of the fronto-central negativity observed
in EEG within the same modality. Whereas the auditory
CNV peaked around 570 ms, this sustained field showed
different pattern according to electrode position (on an
anterior/posterior axis): whereas anterior frontal sensors
showed a peaked slow wave, posterior sensors displayed a
steady-state component from 500 ms until the end of the to-
be-judged duration. Later on, the end of the stimulation
triggered an offset response.
3.3.4. Scalp distribution
The transient auditory response and the late sustained
potential both display a maximum negativity on fronto-
central regions (Fig. 5, bottom left). A similar observation
can be drawn from the MEG data, as the distribution of
Research 21 (2004) 250–268

Fig. 4. Time-course of EEG-MEG activity in the auditory condition. The two upper rows display the time-course of the electric scalp potential in the auditory
condition recorded from fronto-central sites (FC5 and FC6, respectively, left and right) and from parieto-occipital sites (PO7 and PO8, respectively, left and
right). The two bottom rows display the time-course of the magnetic field recorded from left and right anterior temporal sensors (MLT22 and MRT22,
respectively) and from temporo-parieto-occipital sensors (MLT26 and MRT26). Colors mark the different conditions as indicated in the legend. The C-
condition corresponds to the presentation of a short stimulus (490 ms), IC is for intermediate-short (595 ms), S is for standard (700 ms), IL is for intermediate-
long (805 ms) and L is for long stimulus (910 ms).
K. N’Diaye et al. / Cognitive Brain Research 21 (2004) 250–268 259
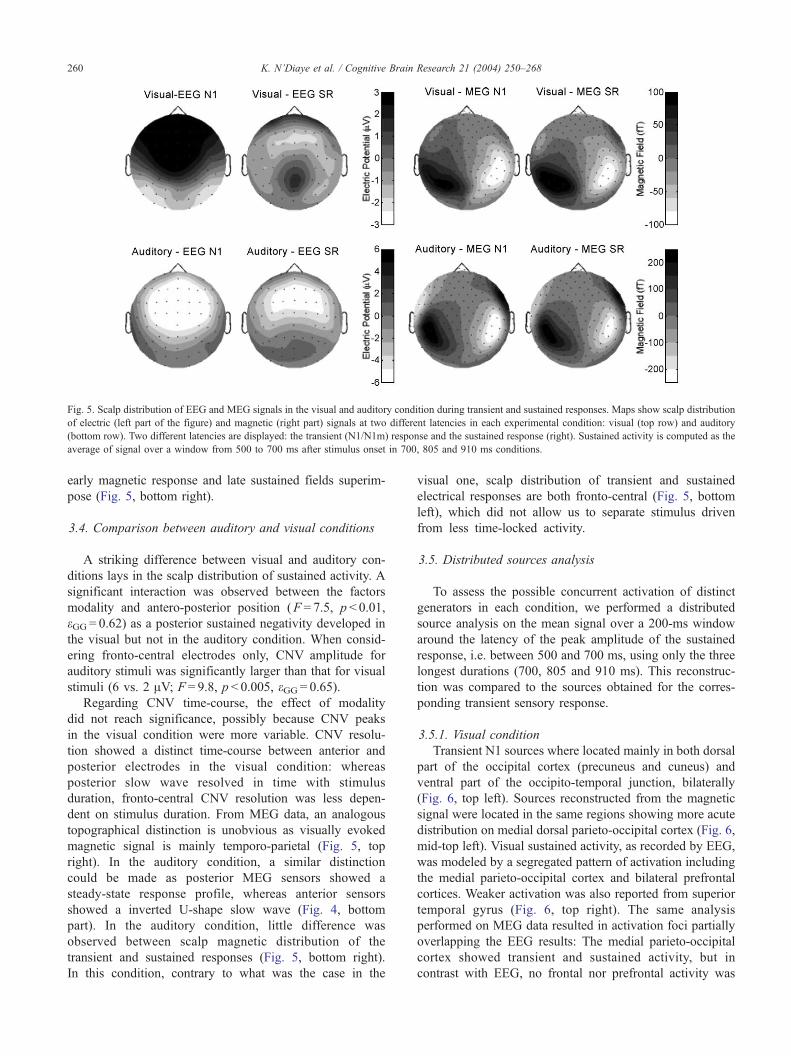
Fig. 5. Scalp distribution of EEG and MEG signals in the visual and auditory condition during transient and sustained responses. Maps show scalp distribution
of electric (left part of the figure) and magnetic (right part) signals at two different latencies in each experimental condition: visual (top row) and auditory
(bottom row). Two different latencies are displayed: the transient (N1/N1m) response and the sustained response (right). Sustained activity is computed as the
average of signal over a window from 500 to 700 ms after stimulus onset in 700, 805 and 910 ms conditions.
K. N’Diaye et al. / Cognitive Brain Research 21 (2004) 250–268260
early magnetic response and late sustained fields superim-
pose (Fig. 5, bottom right).
3.4. Comparison between auditory and visual conditions
A striking difference between visual and auditory con-
ditions lays in the scalp distribution of sustained activity. A
significant interaction was observed between the factors
modality and antero-posterior position (F = 7.5, p < 0.01,
eGG = 0.62) as a posterior sustained negativity developed in
the visual but not in the auditory condition. When consid-
ering fronto-central electrodes only, CNV amplitude for
auditory stimuli was significantly larger than that for visual
stimuli (6 vs. 2 AV; F = 9.8, p < 0.005, eGG = 0.65).Regarding CNV time-course, the effect of modality
did not reach significance, possibly because CNV peaks
in the visual condition were more variable. CNV resolu-
tion showed a distinct time-course between anterior and
posterior electrodes in the visual condition: whereas
posterior slow wave resolved in time with stimulus
duration, fronto-central CNV resolution was less depen-
dent on stimulus duration. From MEG data, an analogous
topographical distinction is unobvious as visually evoked
magnetic signal is mainly temporo-parietal (Fig. 5, top
right). In the auditory condition, a similar distinction
could be made as posterior MEG sensors showed a
steady-state response profile, whereas anterior sensors
showed a inverted U-shape slow wave (Fig. 4, bottom
part). In the auditory condition, little difference was
observed between scalp magnetic distribution of the
transient and sustained responses (Fig. 5, bottom right).
In this condition, contrary to what was the case in the
visual one, scalp distribution of transient and sustained
electrical responses are both fronto-central (Fig. 5, bottom
left), which did not allow us to separate stimulus driven
from less time-locked activity.
3.5. Distributed sources analysis
To assess the possible concurrent activation of distinct
generators in each condition, we performed a distributed
source analysis on the mean signal over a 200-ms window
around the latency of the peak amplitude of the sustained
response, i.e. between 500 and 700 ms, using only the three
longest durations (700, 805 and 910 ms). This reconstruc-
tion was compared to the sources obtained for the corres-
ponding transient sensory response.
3.5.1. Visual condition
Transient N1 sources where located mainly in both dorsal
part of the occipital cortex (precuneus and cuneus) and
ventral part of the occipito-temporal junction, bilaterally
(Fig. 6, top left). Sources reconstructed from the magnetic
signal were located in the same regions showing more acute
distribution on medial dorsal parieto-occipital cortex (Fig. 6,
mid-top left). Visual sustained activity, as recorded by EEG,
was modeled by a segregated pattern of activation including
the medial parieto-occipital cortex and bilateral prefrontal
cortices. Weaker activation was also reported from superior
temporal gyrus (Fig. 6, top right). The same analysis
performed on MEG data resulted in activation foci partially
overlapping the EEG results: The medial parieto-occipital
cortex showed transient and sustained activity, but in
contrast with EEG, no frontal nor prefrontal activity was
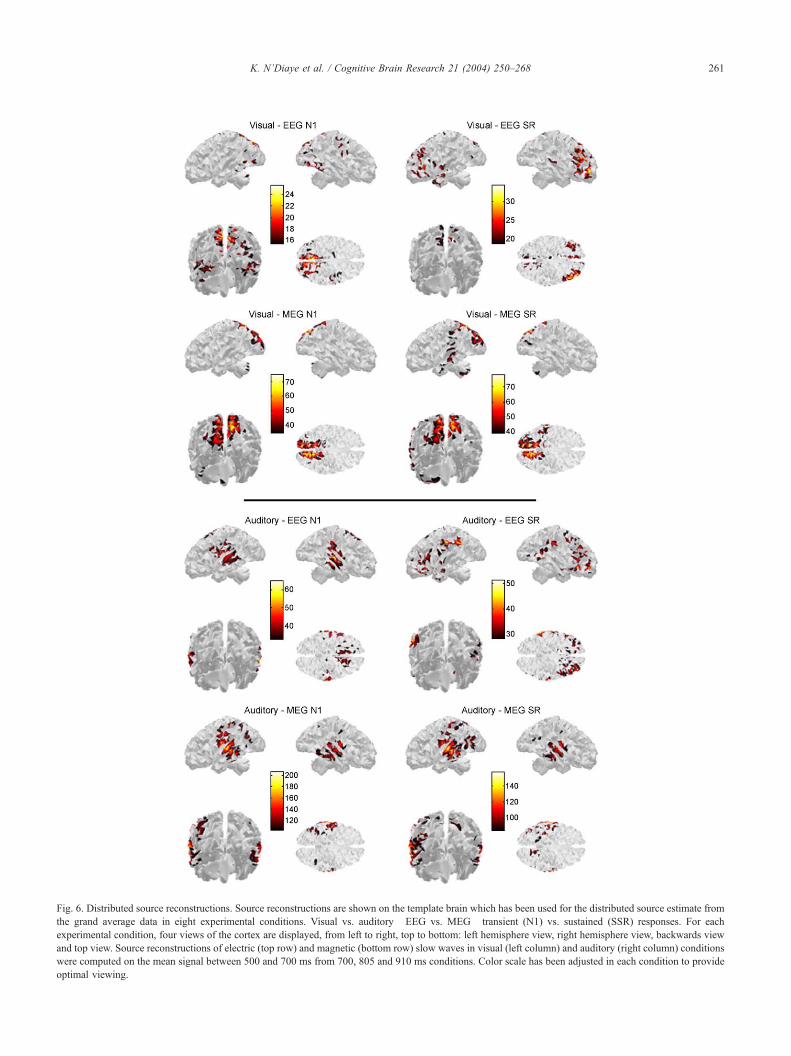
Fig. 6. Distributed source reconstructions. Source reconstructions are shown on the template brain which has been used for the distributed source estimate from
the grand average data in eight experimental conditions. Visual vs. auditory�EEG vs. MEG� transient (N1) vs. sustained (SSR) responses. For each
experimental condition, four views of the cortex are displayed, from left to right, top to bottom: left hemisphere view, right hemisphere view, backwards view
and top view. Source reconstructions of electric (top row) and magnetic (bottom row) slow waves in visual (left column) and auditory (right column) conditions
were computed on the mean signal between 500 and 700 ms from 700, 805 and 910 ms conditions. Color scale has been adjusted in each condition to provide
optimal viewing.
K. N’Diaye et al. / Cognitive Brain Research 21 (2004) 250–268 261

K. N’Diaye et al. / Cognitive Brain Research 21 (2004) 250–268262
obtained. Simultaneous activity was also reported in tem-
poral regions on the banks of the superior temporal and
middle temporal sulci but also within superior parietal lobe.
(Fig. 6, mid-top right).
3.5.2. Auditory condition
Three active regions were observed during the audito-
ry N1 potential: Both left and right temporal cortices
(especially superior and middle temporal gyrus) and
medial fronto-central regions (Fig. 6, mid-bottom left).
Auditory CNV was modeled by strongly active sources
stemming from bilateral inferior parietal lobe and a
widespread activation over bilateral prefrontal cortices
(Fig. 6, mid-bottom right). MEG data in the auditory
condition resulted in a very different distribution pattern
of activity: Whereas bilateral temporal cortex was also
intensely active during both transient and sustained re-
sponse, no prefrontal activity was generated. However,
distributed activity was observed within superior parietal
regions (especially left ones) and at temporo-occipital
junction (posterior inferior temporal gyrus and inferior
occipital gyrus) (Fig. 6, bottom).
4. Discussion
4.1. Behavioral data
As reported in previous studies, proficient temporal
generalization performance was characterized by a central
tendency to respond positively (i.e. ‘‘identical to the stan-
dard’’ by a right button-press) to the test duration
corresponding to the initially-presented ‘‘standard’’. Better
discrimination was achieved for extreme short (490 ms) or
long (910 ms) durations in comparison to the intermediate
(595 or 805 ms) even if some participants showed variable
performance (which is often observed when no feed-back is
given, see Ref. [82]). Concerning modality influence, audi-
tory signals are generally reported as being perceived longer
and with a greater accuracy [27,64,83]. Here, a significant
effect of modality was observed on duration discrimination
in line with those previous studies since auditory stimuli led
to better discrimination than visual ones.
In addition to discrimination performance, response
times (RT) show here two remarkable features:
(1) The longer the test-duration, the faster the response. One
possible interpretation of this result might be that
participants made their decision while the test duration
was elapsing and, as soon as the timed duration
exceeded the memorized standard, they could categorize
the on-going signal as a non-standard duration, since
they were in a two-alternative choice procedure. As
noticed by Leon and Shadlen [45], the conditional
probability of categorizing a signal according to its
duration is a monotonic function of time. Although this
hypothesis may explain behavioral results for a short/
long categorization, it fails within the context of
generalization were uncertainty would be a bimodal
function of time for a perfect observer. Instead of this
bimodal pattern, RT in our study were monotonically
decreasing with the duration to be timed. In a different
timing task, Lacouture et al. [41] also noticed a decrease
in RTs with the duration to be timed, independently of
the bow-effect, which describes shorter RTs when
discrimination is easier. A possible explanation of this
could be that the shorter-than-standard and the longer-
than-standard stimuli are differently processed. Catego-
rizations of the longest (805 and 910 ms) durations
would occur as soon as standard duration has elapsed.
On the contrary, this categorization could not happen
earlier than the standard duration and would even
require a constant time to be performed.
(2) Auditory stimuli are more rapidly discriminated than
visual stimuli. The 60-ms difference between auditory
and visual RT is in accordance with results showing
better performances in auditory than visual timing
task and similar modality effects on RT are reported
in other timing tasks by Ford and Hillyard [19] and
Rousseau and Rousseau [72]. This can be interpreted
as a better efficiency of the auditory channel to
process time, but alternative hypotheses such as speed
differences in sensory processing cannot be discarded
(see Ref. [25]).
4.2. Electromagnetic data
This present study was aimed at comparing cortical
activity simultaneously monitored with MEG and EEG
within a single group of participants while they were
performing the same timing task in both modalities.
Fronto-central sustained event-related potentials (CNV) oc-
curred in both auditory and visual modalities while partic-
ipants were performing a duration discrimination task. Time-
course of this slow EEG potential was shown to be depen-
dent on the duration to be timed, while its topography was
shown to be modality independent. However, classifying the
duration-dependent sustained magnetic activity as a magnet-
ic equivalent of the electric CNV (a CMV) is uncertain
because the magnetic fields topography did not reproduce
the frontal distribution of the CNV. On the contrary, its
distribution was similar to that of modality specific early
sensory responses. The EEG–MEG recordings showed that
during duration perception of filled intervals timing-depen-
dent activity and sustained sensory response (SSR) occurred
concurrently. However, separating these slow waves was
uneasy especially in the auditory modality.
These results were supported by modeling the distributed
sources of the sustained electric and magnetic responses in
each modality. Beside sensory cortices, prefrontal cortices in
EEG and temporo-parietal or parietal cortices in MEG
showed activity as the stimulus duration was being judged.
Brain Research 21 (2004) 250–268 263
4.2.1. EEG data in the visual condition
In line with previous studies, whilst participants were
performing duration discrimination of visual signals, we
observed a fronto-central CNV that peaked on fronto-central
sites. The latency of this maximum was around 600 ms after
stimulus onset. As sensory activity within the visual cortex
projects onto the parieto-occipital regions of the scalp, SSR
and CNV were easily distinguishable. Moreover, CNV time-
course differed from that of the SSR. Whereas sustained
negativity at parietal or parieto-occipital electrodes showed
a steady-state profile, which resolved after light offset,
fronto-central negativity peaked around 650 ms for all but
the shortest stimulus, and then resolved independently of the
duration to be judged (see the superimposed traces on Fig. 3
for 595, 700, 805 and 910 ms conditions). The marked
differences in the time course of activity between fronto-
central and parietal/parieto-occipital regions indicate that
these two slow waves are due to concurrently active but
distinct generators. From this condition, we can conclude
that timing visual filled intervals leads to a sustained activity
within the corresponding sensory regions and to a simulta-
neous fronto-central scalp negativity which cannot be
accounted for by the sensory processing of the visual
stimulation to be timed. It should be noted at that point that
although the actual duration of the stimulation to be timed
does not seem critical for the peak latency of the CNV
negative deflexion, it determines the latency of the positive
shift which marks the end of the CNV resolution. The CNV
seems thus here to be composed of two different compo-
nents: a slow negative wave peaking at 655 ms and a fast
resolution crossing baseline towards a positive peak. These
two components are differentially modulated by the duration
discrimination task: the slow negative wave might reflect a
true timing process (as its peak latency does not correlate
with the duration of the on-going stimulation but is rather
modulated by the encoded ‘‘standard’’ duration); the fast
positive resolution, on the contrary, is dependent on the real
stimulus duration and it may thus reflect the processing of
the stimulus offset.
4.2.2. EEG data in the auditory condition
By recording electric scalp activity while participants
were performing duration discrimination of continuous
tones, we observed a fronto-central negativity whose time
course was duration dependent. Contrary to what could
be inferred from EEG data in the visual condition, pos-
sible superimposition of timing-dependent activity and
sensory sustained activity cannot be readily assessed from
scalp distributions. It has indeed been repeatedly shown
[30,67,68] that, outside any explicit timing context, long-
lasting tones also generate a fronto-central negative poten-
tial, the auditory sustained potential (ASP), the resolution of
which being time-locked to the offset of the sound. None-
theless, attention to time has also been reported to modulate
ASP: In a thorough study of ASPs, Picton et al. [67]
demonstrated that enhanced ASPs were recorded when
K. N’Diaye et al. / Cognitive
participants were requested to detect durations deviants
among continuous tones (but not when they were attending
frequency deviants). The temporal component of the task
seemed critical for this effect and these authors concluded on
the possible superimposed contributions of frontal and
temporal generators to the ASP. Our data suggest that such
a sustained sensory activity would be superimposed on task
specific cortical slow components. Whereas ASP show a
steady-state profile, the present slow potentials peaked at a
specific point in time independent of the duration to be
timed. Afterwards, the fronto-central negativity amplitude
decreased (compare our Fig. 5 with Fig. 1 from Picton et al.
[67]). The present results therefore support the concurrent
activity of generators whose electric signature lies on frontal
regions of the scalp during the timing of auditory filled
intervals.
4.2.3. MEG data in both conditions
The most striking observation concerning MEG data in
the present experiment is the similarity between the distri-
bution of this slow potential and the transient sensory
response (N1m). Moreover, time course of the sustained
potential followed the duration of the sound to be timed: the
shorter the duration, the earlier the resolution of the sus-
tained field. The present slow cortical field might thus
reflect the contribution of a common set of generators
responsible for both the N1m and a sustained sensory
response. As a result, no magnetic counterpart of the CNV
could be identified from the scalp data at late (>300 ms)
latencies.
Generators of the sustained responses have been reported
to lie in the same cortical regions of those of the transient
sensory responses. This hypothesis is supported, at least in
the auditory modality, by many studies that showed that
auditory sustained fields (ASF) could be repeatedly recorded
with MEG. Source modeling of these ASF demonstrated
that their generators were also located in the auditory supra-
temporal cortex, which is the reason why they are so easily
detectable with MEG [28,30,36,63,76]. However, in keeping
with observations made on their electric counterpart (ASP),
Hari et al. [31] also reported enhancement of ASF with
selective listening, in particular while participants performed
a duration discrimination task while the N1m, which shares
anatomically common generators with the ASF, was not
modulated by selective attention to duration. However, in
the present task, there was no control condition to compare
our timing condition with.
4.2.4. Sustained response generators
To separate activity stemming from sensory regions from
signal due to other sources, we performed a minimum-norm
constrained distributed source imaging. As a result, we were
able to reconstruct the main generators that contributed to
the slow potentials/fields within each condition (auditory
and visual) as recorded either by EEG or MEG. Interest-
ingly, EEG data not only showed weak activations of

K. N’Diaye et al. / Cognitive Brain Research 21 (2004) 250–268264
sensory cortices but also strongly activated bilateral parietal
and prefrontal regions. Frontal activations reported for each
of the two conditions (visual or auditory) largely over-
lapped. Surprisingly MEG data also led to much greater
activation foci within respective visual occipital or auditory
supratemporal cortices, while no frontal generators were
observed. However, extended temporo-parieto-occipital and
parietal regions showed sustained activity while participants
were timing the intervals in both modalities.
As clearly seen from scalp data, EEG and MEG signals
showed undoubtedly different aspects of the brain activity.
Source analyses confirmed this view since different subsets
of sources were reconstructed from each recorded signal. An
explanation for the absence of a magnetic counterpart to the
fronto-central electric slow wave can be given by the
physical characteristics of the MEG signal: While electric
potentials are produced by both radial and tangential sources
(with respect to the surface of the scalp), magnetic signal
reflects only the contributions of the latter. As a conse-
quence, tangential sources (like those in the calcharine
sulcus) might generate a stronger magnetic than electric
response, which would therefore hide contributions from
other sources, especially if they are radially oriented as it
may be the case on frontal gyri [11,71].
Moreover, as EEG captures signal from deeper gener-
ators than MEG, these sources might be reflected in wide-
spread distribution on the cortical surface. Apparent frontal
activity in the present data might thus be explained by
activation from deep neural structures. One candidate for
this may be the basal ganglia whose contribution in interval
timing [59] but also at shorter duration ranges [17,70] has
been widely documented.
Auditory and visual EEG data also showed medial
activations. Contribution from the supplementary motor
area (SMA) is possible since other timing studies have
demonstrated the involvement of this area in temporal tasks
[17,50]. Activity from this structure has appeared to be
difficult to record with MEG possibly because of its
anatomical configuration: bilateral activity on the medial
wall of both hemispheres would result in two opposite
dipoles facing each other, whose activity might partially
cancel out, producing a very small magnetic field on the
scalp surface [44].
4.2.5. Comparisons between visual and auditory conditions
Using filled intervals in both conditions, we observed
sustained activity on the scalp projection areas of sensory
cortices with both recording techniques. One could thus
question the specificity of the slow cortical responses as
regards timing processes. To our knowledge, only one MEG
study [16] has used filled (auditory) interval to investigate
CMV. Like us, the authors were unable to clearly separate
CMV from sustained auditory activity, although some argu-
ments allowed them not to confound them: intersubject
variance was greater for the CMV, and single dipoles failed
to explain this sustained activity. On balance, it is worth
noticing that Dammers and Ioannides [13], even when using
empty intervals, found consistent CMV generators within
auditory and sensorimotor cortices. CNV-dedicated studies
generally use empty intervals, but filled intervals have also
been used [66,69,73] and authors rarely comment on the
possible superimposition of sensory sustained activity over
other ERP. However, some arguments strengthen our con-
clusion drawn from our analyses of EEG and MEG scalp
recordings. On the one hand, even if concurrent sustained
activity in sensory regions was recorded, it may not be
crucial to duration discrimination itself as demonstrated by
its time course. On the other hand, common cortical net-
works were shown to be active during the timing task,
independently of the modality. We can therefore conclude
that these particular networks were specifically engaged by
the timing task and provide substrate for cognitive processes
such as time perception.
Firstly, timing of visual and auditory signals evoked
strong sustained activity in respective visual and auditory
sensory regions. These activities may correspond to an
enhancement of sensory processing (as signal offset
detection is crucial to the task) rather than time process-
ing per se. Indeed, preservation of auditory duration
discrimination has been evidenced with patients suffering
from bilateral auditory cortex lesions [78]. However, the
involvement of sensory regions in duration processing
can not be totally excluded, especially regarding auditory
regions where increased metabolic activity has been
shown to occur when participants were timing duration
of short (f 300 ms) auditory signals [5]. In the present
experiment, possible rehearsal of the memorized signal
may have been used as a strategy by the participants to
perform the task in the visual condition as well, since
superior temporal regions were also active while partic-
ipants were timing visual signals.
Moreover, temporal information provided by the wave-
form of the EEG recordings, especially in the visual
condition, showed distinct time courses between the
fronto-central negativity and the electric negative potential
recorded on parietal and occipital sites. These latter sites
correspond to the projecting areas of the visual cortex which
the visual sustained potential is generated from. The time
course of the fronto-central negativity can thus not be fully
attributed to the sustained activity reflecting visual process-
ing. Even if no strict correlation could be established
between electrophysiological activity and behavioral perfor-
mance, CNV amplitude (measured at fronto-central sites, in
both conditions, increased continuously until the standard
duration had elapsed, after what it started to decrease. These
results are in line with those of Pfeuty et al. [66] showing
positive correlation between this CNV activity and the
memorized standard duration. Fronto-central slow cortical
responses recorded in timing tasks using filled intervals thus
reflect contribution of sustained responses from sensory
regions but also from additional sources specifically in-
volved in duration discrimination.

K. N’Diaye et al. / Cognitive Brain Research 21 (2004) 250–268 265
Finally, the similar scalp distribution of these task-spe-
cific fronto-central responses to visual and auditory dura-
tions (though less ample in the visual modality) and the
common networks activated independently of the sensory
modality involved strengthen the conclusion that the slow
fronto-central negative component which develops in both
conditions, may reflect supra-modal timing processes.
4.3. Synthesis
The critical observations we made in the present study
were (1) that slow electric potentials or magnetic fields were
simultaneously recorded by EEG and MEG when partic-
ipants were performing duration discrimination of filled
visual or auditory intervals; (2) that sustained modality-
dependent activity occurred within the associated sensory
areas; (3) that from the scalp-recorded slow potentials/fields,
one could partially isolate modality independent activations
within prefrontal and temporo-parieto-occipital or parietal
cortices, differently recorded by EEG or MEG. Contribu-
tions of these generators superimpose to produce the scalp
distributions of these slow cortical potentials/fields.
From our source reconstruction, common cortical net-
works located in bilateral prefrontal cortex might be the
generators of this modality-independent frontal activity.
Prefrontal cortex has been repeatedly reported to play a
major role in interval timing [9,17,33,47,57,62,69,70]. But
its role in working memory [46] has also been assessed for
long. The temporal generalization task is heavily demanding
on working memory, since the standard has to be memo-
rized for the whole block, which generally led the partic-
ipants to update it according to the durations they were
presented. Furthermore, decisional processes might also
involve the prefrontal cortex [39]: the critical point in time
from which the visual and auditory CNV started to resolve
nearly corresponds to the standard duration. One can there-
fore hypothesize that the outcome of memorized vs. stim-
ulus duration comparison is processed in line and the
decision is made from then on.
According to distributed source reconstructions, gener-
ators of these modality-independent activities may be mod-
eled as widespread parietal and temporo-parietal activations.
These results are in line with those recently obtained by
Sieroka et al. [76] in an auditory duration discrimination
task. Sustained magnetic components were indeed explained
by the joint contribution of bilateral dipoles located within
supratemporal cortices and an additional parietal dipole.
Interestingly, they report large inter-individual variability
in the locations obtained for this dipole.
Possibly as part of a fronto-parietal network, the parietal
lobe has been reported to be involved in human timing
[8,54,57,69,70,74] and a recent study using intra-cortical
recordings confirmed these results at the neuron level in
rhesus monkeys [45]. Midline precuneus/cuneus regions
were active in a temporal order task reported by Cabeza et
al. [7]. This region is known to be anatomically connected to
the dorsal frontal cortex [65] and was shown to be activated
during auditory [84] or visual [18] imagery task. Possible
processing of the duration to be timed might thus be
reflected in this parietal activation, but other concurrent
cognitive processes could also be the cause of it. Whether
parietal activity is linked to attentional, memory, response
preparation or specifically temporal processes cannot be
discussed under the sole light of the present data.
Sensory activations may reflect processing of the stimu-
lation but their role in timing is harder to assess. Although
auditory cortex has been repeatedly proven able to detect
temporal deviance, its integration windows within which it
can perform temporal processing, seems limited to 200 ms
[10] or slightly longer [40]. Moreover, left temporal cortex
was active during the visual condition. It is possible that this
focus corresponds to auditory imagery process. Post-test
interview revealed that most subjects used this strategy to
perform the visual task. fMRI studies also reported temporal
activation in visual duration discrimination tasks [17,47].
These sources were either superimposed (or at least very
close to) the most active sources in the auditory condition.
This is coherent with Zatorre et al. [85] suggesting that
auditory imagery share common neural bases with actual
auditory perception.
5. Conclusion
Taken together, these results suggest that timing-depen-
dent cortical activity might be reflected in an electric
negative sustained CNV-like potential on fronto-central
regions of the scalp present in both modalities. This CNV
was concurrently observed with sustained activity from
sensory regions evoked by the on-going stimulation. Simul-
taneous sustained evoked related magnetic fields showed
markedly different distributions with regard to the modality
of the signal to be timed. Complementary electric and
magnetic images of sustainedly active brain regions proved
to require the simultaneous use of EEG and MEG record-
ings to be fully captured: As opposed to EEG data, MEG
recordings seemed to be more sensitive to the sources from
sensory regions since the distribution of the sustained
activity was very similar to that of the primary sensory
response in the corresponding modality. Source reconstruc-
tion demonstrated that these sustained potentials/fields were
generated by superimposed contributions from visual and
auditory cortices and from prefrontal and parietal regions.
These results suggest the involvement of both sensory and
supra-modal associative regions in the duration discrimina-
tion of filled time intervals.
Acknowledgements
The authors thank Antoine Ducorps and Denis Schwartz
(MEG Center, Paris) for their watchful assistance on MEG
K. N’Diaye et al. / Cognitive Brain Research 21 (2004) 250–268266
recordings and numerous interactions in data analysis, and
Florence Bouchet for her technical advice on EEG record-
ings. Laurent Hugueville provided valuable help on protocol
design and Sylvain Baillet shall be acknowledged for his
unfailingly responsive support. The authors are also grateful
to Pr Didier Dormont (Service de Neuroradiologie, Hopital
de la Pitie-Salpetriere) for the medical supervision and the
MRI acquisitions. The authors are supported by the Centre
National de la Recherche Scientifique and this research was
funded by the Action Concertee Incitative Cognitique,
Ministere Franc�ais de la Recherche (Cog. 113).
References
[1] L.G. Allan, The perception of time, Percept. Psychophys. 26 (1979)
340–354.
[2] S. Baillet, J.C. Mosher, D. Schwartz, R.M. Leahy, The BarinStorm
Toolbox, (2000), http://neuroimage.usc.edu/brainstorm/.
[3] L.F. Basile, R.L. Rogers, W.T. Bourbon, A.C. Papanicolaou, Slow
magnetic flux from human frontal cortex, Electroencephalogr. Clin.
Neurophysiol. 90 (1994) 157–165.
[4] I. Behar, W. Bevan, The perceived duration of auditory and visual
intervals: cross-modal comparison and interaction, Am. J. Psychol. 74
(1961) 17–26.
[5] P. Belin, S. McAdams, L. Thivard, B. Smith, S. Savel, M. Zilbovicius,
S. Samson, Y. Samson, The neuroanatomical substrate of sound dura-
tion discrimination, Neuropsychologia 40 (2002) 1956–1964.
[6] M. Besson, F. Faita, C. Czternasty, M. Kutas, What’s in a pause:
event-related potential analysis of temporal disruptions in written
and spoken sentences, Biol. Psychol. 46 (1997) 3–23.
[7] R. Cabeza, J. Mangels, L. Nyberg, R. Habib, S. Houle, A.R. McIn-
tosh, E. Tulving, Brain regions differentially involved in remembering
what and when: a PET study, Neuron 19 (1997) 863–870.
[8] J.T. Coull, A.C. Nobre, Where and when to pay attention: the neural
systems for directing attention to spatial locations and to time inter-
vals as revealed by both PET and fMRI, J. Neurosci. 18 (1998)
7426–7435.
[9] J.T. Coull, C.D. Frith, C. Buchel, A.C. Nobre, Orienting attention
in time: behavioural and neuroanatomical distinction between ex-
ogenous and endogenous shifts, Neuropsychologia 38 (2000)
808–819.
[10] N. Cowan, On short and long auditory stores, Psychol. Bull. 96
(1984) 341–370.
[11] A.C. Croize, R. Ragot, L. Garnero, A. Ducorps, M. Pelegrini-Issac, K.
Dauchot, H. Benali, Y. Burnod, Dynamics of parieto-frontal networks
underlying visuospatial short-term memory encoding, NeuroImage (in
press).
[12] R.Q. Cui, A. Egkher, D. Huter, W. Lang, G. Lindinger, L. Deecke,
High resolution spatiotemporal analysis of the contingent negative
variation in simple or complex motor tasks and a non-motor task,
Clin. Neurophysiol. 111 (2000) 1847–1859.
[13] J. Dammers, A.A. Ioannides, Neuromagnetic localization of CMV
generators using incomplete and full-head biomagnetometer, Neuro-
Image 11 (2000) 167–178.
[14] F. Di Russo, A. Martinez, M.I. Sereno, S. Pitzalis, S.A. Hillyard,
Cortical sources of the early components of the visual evoked poten-
tial, Hum. Brain Mapp. 15 (2002) 95–111.
[15] T. Elbert, R. Ulrich, B. Rockstroh, W. Lutzenberger, The processing
of temporal intervals reflected by CNV-like brain potentials, Psycho-
physiology 28 (1991) 648–655.
[16] T. Elbert, B. Rockstroh, S. Hampson, C. Pantev, M. Hoke, The mag-
netic counterpart of the contingent negative variation, Electroencepha-
logr. Clin. Neurophysiol. 92 (1994) 262–272.
[17] A.M. Ferrandez, L. Hugueville, S. Lehericy, J.B. Poline, C. Marsault,
V. Pouthas, Basal ganglia and supplementary motor area subtend du-
ration perception: an fMRI study, NeuroImage 19 (2003) 1532–1544.
[18] P.C. Fletcher, C.D. Frith, S.C. Baker, T. Shallice, R.S. Frackowiak,
R.J. Dolan, The mind’s eye-precuneus activation in memory-related
imagery, NeuroImage 2 (1995) 195–200.
[19] J.M. Ford, S.A. Hillyard, Event-related potentials (ERPs) to interrup-
tions of a steady rhythm, Psychophysiology 18 (1981) 322–330.
[20] P. Fraisse, Perception and estimation of time, Annu. Rev. Psychol. 35
(1984) 1–36.
[21] A.W. Gaillard, Effects of warning-signal modality on the contingent
negative variation (CNV), Biol. Psychol. 4 (1976) 139–154.
[22] A.S. Gevins, B.A. Cutillo, Signals of Cognition, in: F.A. Lopes da
Silva, W. Strom van Leeuwen, A. Remond (Eds.), Handbook of Elec-
troencephalography and Clinical Neurophysiology, Revised Series,
vol. 2, Elsevier, New-York, 1986, pp. 335–381.
[23] S. Goldstone, J. Goldfarb, Direct comparison of auditory and visual
duration, J. Exp. Psychol. 5 (1964) 483–485.
[24] G. Gratton, M.G. Coles, E. Donchin, A new method for off-line
removal of ocular artifact, Electroencephalogr. Clin. Neurophysiol.
55 (1983) 468–484.
[25] S. Grondin, Duration discrimination of empty and filled intervals
marked by auditory and visual signals, Percept. Psychophys. 54
(1993) 383–394.
[26] S. Grondin, Sensory modalities and temporal processing, in: H. Hel-
frich (Ed.), Time and Mind: Information Processing Perspectives,
Hogrefe and Huber, Seattle, 2003, pp. 75–92.
[27] S. Grondin, G. Meilleur-Wells, C. Ouellette, F. Macar, Sensory
effects on judgments of short time-intervals, Psychol. Res. 61
(1998) 261–268.
[28] A. Gunji, S. Koyama, R. Ishii, D. Levy, H. Okamoto, R. Kakigi, C.
Pantev, Magnetoencephalographic study of the cortical activity eli-
cited by human voice, Neurosci. Lett. 348 (2003) 13–16.
[29] T. Hamano, H.O. Luders, A. Ikeda, T.F. Collura, Y.G. Comair, H.
Shibasaki, The cortical generators of the contingent negative variation
in humans: a study with subdural electrodes, Electroencephalogr.
Clin. Neurophysiol. 104 (1997) 257–268.
[30] R. Hari, K. Aittoniemi, M.L. Jarvinen, T. Katila, T. Varpula, Auditory
evoked transient and sustained magnetic fields of the human brain,
Localization of neural generators, Exp. Brain Res. 40 (1980) 237–240.
[31] R. Hari, M. Hamalainen, E. Kaukoranta, J. Makela, S.L. Joutsiniemi,
J. Tiihonen, Selective listening modifies activity of the human audi-
tory cortex, Exp. Brain Res. 74 (1989) 463–470.
[32] R. Hari, S. Levanen, T. Raij, Timing of human cortical functions
during cognition: role of MEG, Trends Cogn. Sci. 4 (2000) 455–462.
[33] D.L. Harrington, K.Y. Haaland, R.T. Knight, Cortical networks un-
derlying mechanisms of time perception, J. Neurosci. 18 (1998)
1085–1095.
[34] J.M. Hopf, E. Vogel, G. Woodman, H.J. Heinze, S.J. Luck, Localizing
visual discrimination processes in time and space, J. Neurophysiol. 88
(2002) 2088–2095.
[35] L. Hultin, P. Rossini, G.L. Romani, P. Hogstedt, F. Tecchio, V. Piz-
zella, Neuromagnetic localization of the late component of the con-
tingent negative variation, Electroencephalogr. Clin. Neurophysiol. 98
(1996) 435–448.
[36] M. Huotilainen, I. Winkler, K. Alho, C. Escera, J. Virtanen, R.J.
Ilmoniemi, I.P. Jaaskelainen, E. Pekkonen, R. Naatanen, Combined
mapping of human auditory EEG and MEG responses, Electroence-
phalogr. Clin. Neurophysiol. 108 (1998) 370–379.
[37] A. Ikeda, S. Yazawa, T. Kunieda, S. Ohara, K. Terada, N. Mikuni, T.
Nagamine, W. Taki, J. Kimura, H. Shibasaki, Cognitive motor control
in human pre-supplementary motor area studied by subdural record-
ing of discrimination/selection-related potentials, Brain 122 (Pt 5)
(1999) 915–931.
[38] F. Klapproth, The effect of study-test modalities on the remembrance
of subjective duration from long-term memory, Behav. Processes 59
(2002) 37–46.

K. N’Diaye et al. / Cognitive Brain Research 21 (2004) 250–268 267
[39] D.C. Krawczyk, Contributions of the prefrontal cortex to the neural
basis of human decision making, Neurosci. Biobehav. Rev. 26 (2002)
631–664.
[40] E. Kushnerenko, R. Ceponiene, V. Fellman, M. Huotilainen, I.
Winkler, Event-related potential correlates of sound duration: sim-
ilar pattern from birth to adulthood, NeuroReport 12 (2001)
3777–3781.
[41] Y. Lacouture, S. Grondin, S. Mori, Absolute identification of tempo-
ral intervals: preliminary data, in: E. Sommerfeld, R. Kompass, T.
Lachmann (Eds.), Proceedings of the 17th Annual Meeting of the
International Society for Psychophysics, Pabst Science, Berlin,
2001, pp. 493–498.
[42] M. Ladanyi, B. Dubrovsky, CNV and time estimation, Int. J. Neuro-
sci. 26 (1985) 253–257.
[43] M. Lamarche, J. Louvel, P. Buser, I. Rektor, Intracerebral recordings
of slow potentials in a contingent negative variation paradigm: an
exploration in epileptic patients, Electroencephalogr. Clin. Neurophy-
siol. 95 (1995) 268–276.
[44] W. Lang, D. Cheyne, R. Kristeva, R. Beisteiner, G. Lindinger, L.
Deecke, Three-dimensional localization of SMA activity preceding
voluntary movement. A study of electric and magnetic fields in a
patient with infarction of the right supplementary motor area, Exp.
Brain Res. 87 (1991) 688–695.
[45] M.I. Leon, M.N. Shadlen, Representation of time by neurons in
the posterior parietal cortex of the macaque, Neuron 38 (2003)
317–327.
[46] R. Levy, P.S. Goldman-Rakic, Segregation of working memory func-
tions within the dorsolateral prefrontal cortex, Exp. Brain Res. 133
(2000) 23–32.
[47] P.A. Lewis, R.C. Miall, Brain activation patterns during measurement
of sub- and supra-second intervals, Neuropsychologia 41 (2003)
1583–1592.
[48] P.A. Lewis, R.C. Miall, Distinct systems for automatic and cognitive-
ly controlled time measurement: evidence from neuroimaging, Curr.
Opin. Neurobiol. 13 (2003) 250–255.
[49] P.A. Leynes, J.D. Allen, R.L. Marsh, Topographic differences in CNV
amplitude reflect different preparatory processes, Int. J. Psychophy-
siol. 31 (1998) 33–44.
[50] F. Macar, F. Vidal, Time processing reflected by EEG surface lap-
lacians, Exp. Brain Res. 145 (2002) 403–406.
[51] F. Macar, F. Vidal, The CNV peak: an index of decision making and
temporal memory, Psychophysiology 40 (2003) 950–954.
[52] F. Macar, N. Vitton, An early resolution of contingent negative var-
iation (CNV) in the discrimination, Electroencephalogr. Clin. Neuro-
physiol. 54 (1982) 426–435.
[53] F. Macar, F. Vidal, L. Casini, The supplementary motor area in motor
and sensory timing: evidence from slow brain potential changes, Exp.
Brain Res. 3 (1999) 271–280.
[54] F. Macar, H. Lejeune, M. Bonnet, A. Ferrara, V. Pouthas, F. Vidal, P.
Maquet, Activation of the supplementary motor area and of attention-
al networks during temporal processing, Exp. Brain Res. 142 (2002)
475–485.
[55] S. Makeig, M. Westerfield, J. Townsend, T.P. Jung, E. Courchesne,
T.J. Sejnowski, Functionally independent components of early event-
related potentials in a visual spatial attention task, Philos. Trans. R.
Soc. Lond., B Biol. Sci. 354 (1999) 1135–1144.
[56] D. Riviere, D. Papadopoulos, C. Poupon, F. Poupon, O. Coulon, J.-B.
Poline, V. Frouin, J. Regis, J.-F. Mangin, A structural browser of brain
anatomy, Neuro Image 11 (2000) S912.
[57] P. Maquet, H. Lejeune, V. Pouthas, M. Bonnet, L. Casini, F. Macar,
M. Timsit-Berthier, F. Vidal, A. Ferrara, C. Degueldre, L. Quaglia, G.
Delfiore, A. Luxen, R. Woods, J.C. Mazziotta, D. Comar, Brain ac-
tivation induced by estimation of duration: a PET study, NeuroImage
3 (1996) 119–126.
[58] D.W. McAdam, D.A. Irwin, C.S. Rebert, J.R. Knott, Conative control
of the contingent negative variation, Electroencephalogr. Clin. Neuro-
physiol. 21 (1966) 194–195.
[59] W.H. Meck, Neuropharmacology of timing and time perception,
Cogn. Brain Res. 3 (1996) 227–242.
[60] V. Monfort, V. Pouthas, R. Ragot, Role of frontal cortex in memory
for duration: an event-related potential study in humans, Neurosci.
Lett. 286 (2000) 91–94.
[61] R. Naatanen, T. Picton, The N1 wave of the human electric and
magnetic response to sound: a review and an analysis of the compo-
nent structure, Psychophysiology 24 (1987) 375–425.
[62] H. Onoe, M. Komori, K. Onoe, H. Takechi, H. Tsukada, Y. Wata-
nabe, Cortical networks recruited for time perception: a monkey
positron emission tomography (PET) study, NeuroImage 13 (2001)
37–45.
[63] C. Pantev, C. Eulitz, T. Elbert, M. Hoke, The auditory evoked sus-
tained field: origin and frequency dependence, Electroencephalogr.
Clin. Neurophysiol. 90 (1994) 82–90.
[64] T.B. Penney, J. Gibbon, W.H. Meck, Differential effects of auditory
and visual signals on clock speed and temporal memory, J. Exp.
Psychol. Hum. Percept. Perform. 26 (2000) 1770–1787.
[65] M. Petrides, D.N. Pandya, Projections to the frontal cortex from the
posterior parietal region in the rhesus monkey, J. Comp. Neurol. 228
(1984) 105–116.
[66] M. Pfeuty, R. Ragot, V. Pouthas, When time is up: CNV time course
differentiates the roles of the hemispheres in the discrimination of
short tone durations, Exp. Brain Res. 151 (2003) 372–379.
[67] T.W. Picton, D.L. Woods, G.B. Proulx, Human auditory sustained
potentials: I. The nature of the response, Electroencephalogr. Clin.
Neurophysiol. 45 (1978) 186–197.
[68] T.W. Picton, C. Alain, D.L. Woods, M.S. John, M. Scherg, P. Valdes-
ayard, J. Bosch-Bayard, N.J. Trujillo, Intracerebral sources of human
auditory-evoked potentials, Audiol. Neuro-otol. 4 (1999) 64–79.
[69] V. Pouthas, L. Garnero, A.M. Ferrandez, B. Renault, ERPs and PET
analysis of time perception: spatial and temporal brain mapping dur-
ing visual discrimination tasks, Hum. Brain Mapp. 10 (2000) 49–60.
[70] S.M. Rao, A.R. Mayer, D.L. Harrington, The evolution of brain
activation during temporal processing, Nat. Neurosci. 4 (2001)
317–323.
[71] T. Rinne, K. Alho, R.J. Ilmoniemi, J. Virtanen, R. Naatanen, Separate
time behaviors of the temporal and frontal mismatch negativity sour-
ces, NeuroImage 12 (2000) 14–19.
[72] L. Rousseau, R. Rousseau, Stop-reaction time and the internal clock,
Percept. Psychophys. 58 (1996) 434–448.
[73] D.S. Ruchkin, M.G. McCalley, E.M. Glaser, Event related potentials
and time estimation, Psychophysiology 14 (1977) 451–455.
[74] R.I. Schubotz, A.D. Friederici, D.Y. von Cramon, Time perception
and motor timing: a common cortical and subcortical basis revealed
by fMRI, NeuroImage 11 (2000) 1–12.
[75] A.J. Sebel, W.E. Wilsoncroft, Auditory and visual differences in time
perception, Percept. Mot. Skills 57 (1983) 295–300.
[76] N. Sieroka, H.G. Dosch, H.J. Specht, A. Rupp, Additional neuro-
magnetic source activity outside the auditory cortex in duration dis-
crimination correlates with behavioural ability, NeuroImage 20 (2003)
1697–1703.
[77] I. StatSoft, STATISTICA for Windows, StatSoft, Tulsa, OK, 1994.
[78] M.J. Tramo, G.D. Shah, L.D. Braida, Functional role of auditory
cortex in frequency processing and pitch perception, J. Neurophysiol.
87 (2002) 122–139.
[79] J. Vrba, G. Anderson, K. Betts, M. Burbank, T. Cheung, D. Cheyne,
A. Fife, S. Govorkov, F. Habib, G. Haid, V. Haid, T. Hoang, C.
Hunter, P. Kubik, S. Lee, J. McCubbin, M.J. McKenzie, D. Nonis,
J. Paz, E. Reichl, D. Ressl, S.E. Robinson, C.1. Schroyen, I.
Sekatchev, Spe, 151-Channel Whole-Cortex MEG System for Seated
or Supine Positions. Biomag98, 11th Int. Conf. on Biomagnetism,
Sendai, Japan, 1998.
[80] W.G. Walter, R. Cooper, V.J. Aldridge, W.C. McCallum, A.L. Winter,
Contingent negative variation: an electrical sign of sensorimotor as-
sociation and expectancy in the human brain, Nature 203 (1964)
380–384.

K. N’Diaye et al. / Cognitive Brain Research 21 (2004) 250–268268
[81] J.H. Wearden, Do humans possess an internal clock with scalar timing
properties, Learn. Motiv. 22 (1991) 59–83.
[82] J.H. Wearden, Temporal generalization in humans, J. Exp. Psychol.,
Anim. Behav. Processes 18 (1992) 134–144.
[83] J.H. Wearden, H. Edwards, M. Fakhri, A. Percival, Why ‘‘sounds are
judged longer than lights’’: application of a model of the internal
clock in humans, Q. J. Exp. Psychol., B 51 (1998) 97–120.
[84] S.S. Yoo, C.U. Lee, B.G. Choi, Human brain mapping of auditory
imagery: event-related functional MRI study, NeuroReport 12 (2001)
3045–3049.
[85] R.J. Zatorre, A.C. Evans, E. Meyer, Neural mechanisms underlying
melodic perception and memory for pitch, J. Neurosci. 14 (1994)
1908–1919.
Top Related
Copyright © 2022 FDOKUMEN

