


Bahasa
Halaman
Hukum

Introduction
The weasel Mustela nivalis Linnaeus, 1766 is
a species with distinctive morphological and
physiological features (small size, elongated
body shape, high matabolic rate). Since it is the
smallest sized member of the order Carnivora,
this mustelid is a very specialized predator of
small rodents within their burrows, but it falls
within the prey size range of many predators.
Many behavioural traits are related to its small
size, including space use and habitat selection.
As Klemola et al. (1999) suggested, small mus-
telids choose their habitats mainly according to
prey abundance, but the risk of predation may
also modify the spacing pattern of the weasel.
The relationship between spacing pattern and
prey abundance in mustelids was also compre-
hensively described by Erlinge (1974, 1977), King
(1975), Debrot and Mermod (1983), Jêdrzejewski
et al. (1995), Macdonald et al. (2004) and Brandt
[137]
Acta Theriologica 54 (2): 137–146, 2009.
PL ISSN 0001–7051
Weasel Mustela nivalis spatial ranging behaviour and habitat
selection in agricultural landscape
Caterina MAGRINI, Emiliano MANZO, Livia ZAPPONI, Francesco M. ANGELICI,
Luigi BOITANI and Michele CENTO
Magrini C., Manzo E., Zapponi L., Angelici F. M., Boitani L. and Cento M.2009. Weasel Mustela nivalis spatial ranging behaviour and habitat selectionin agricultural landscape. Acta Theriologica 54: 137–146.
This paper reports the findings of a study on the spacing pattern of a popu-lation of weasels Mustela nivalis Linnaeus, 1758 in central Italy. We describethis pattern at spatial and habitat level, meant as a set of vegetational andenvironmental features. The study area is a typical agricultural landscape,consisting of highly fragmented natural habitat modified by thousands ofyears of human presence and work. The results indicate that individual homeranges vary greatly from non breeding to breeding season: during spring andsummer, weasels increase their movements and the number of tracts theycross, which results in home range areas up to 10 times larger. Moreover thisstudy demonstrates a strong preference of weasels for habitats formed bynatural residual edges between fields and meadows. The shapes of theindividual home ranges follow these edges, producing a typical linear spatialhome range pattern.
Dipartimento di Scienze Ambientali, Universit� di Parma, Italy, e-mail: [email protected](CM); Dipartimento di Biologia Animale e dell’Uomo , Universit� La Sapienza, Roma, Italy (EM,LZ, LB, MC), Fondazione Italiana Zoologia dei Vertebrati, Roma, Italy (FMA)
Key words: Mustelid, small carnivore, home range, spacing behaviour
and Lambin (2007), Zub et al. (2008), while the
association between spacing pattern and preda-
tion risk was studied in weasel by King and
Moors (1979), Erlinge and Sandell (1988), Kor-
pimäki and Norrdahl (1989) and Brandt and
Lambin (2007), Zub et al. (2008). Trophic spe-
cialization seems to have an influence on the
choice of suitable habitat for this species: agri-
cultural landscapes yield high densities of prey
populations as well as residual high covered
habitat to escape from predators (Simms 1979,
Klemola et al. 1999).
In this paper, we use the term ‘home range’,
as defined by King (1975), which covers the en-
tire spectrum between a defended area with
clear-cut boundaries and a system with freely
overlapping movements. Although many au-
thors in the past have described mustelid spac-
ing pattern as actual territorial behaviour, with
active defence and prevention of settlement by
neighbours (Lockie 1966, Erlinge 1974, 1977),
we prefer the use of the home range concept, be-
cause it is a general concept that may or may not
include territorial behaviour. Powell (1979) also
defined intra-sexual territorialism for the genus
Mustela, but suggested that this spacing pattern
may change locally in relation to food density,
habitat availability, and sexual activity. Sandell
(1989) summarized the spacing pattern of soli-
tary carnivores, showing that the main factor in-
fluencing the shift between territorial and non
territorial behaviour was resource distribution,
specifically food supply and mating partners.
The aim of this study was to illustrate some
features of weasel ecology, particularly those
concerning the spacing pattern, analysed in a
landscape highly fragmented by human activity.
Study area
The research was conducted in the Regional Natural
Reserve of Lungo and Ripasottile Lakes, in the province of
Rieti, central Italy. The area is typical intra-montane ba-
sin, closed on the north-east by the Reatini Mountains
(highest peak Terminillo, 2216 m), and on the south-west
by the Sabini Mountains (highest peak Tancia, 1282 m).
The Reserve occupies an area of 3278 ha of agricultural
landscape.
The local plant cover was made up of strips of mixed
copse woodland, mainly represented by oaks Quercus sp.,
ashes Fraxinus sp., hornbeams Carpinus sp., and black-
-thorns Prunus sp., and riparian vegetation mainly com-
posed by willows Salix sp., poplars Populus sp. and elder
Sambucus sp., interspersed with intensive cultivations, like
oat Avena sativa, wheat Triticum sativum, corn Zea mays,
sugar beet Beta vulgaris crassa and sunflower Helianthus
annuus.
Material and methods
Trapping and radio tracking
Field data collection was carried out from February
2003 to May 2004. Weasels were trapped using Edgar
wooden box traps (King and Edgar 1977). The Edgar live
traps used in this research were 60 cm long, 12 cm wide and
15 cm high, hand made from 1 cm thick wood, treated with
mordant varnish.
Trapping sessions were conducted every month for dif-
ferent periods of time and the trapping effort was variable
by year and season, based on the number of radio tracked
animals in a sampling period. Twenty to 50 traps worked si-
multaneously during the data collection period, the number
of traps was so variable because, during the same period,
some traps were taken for maintenance, and some were sto-
len. The traps were placed throughout a study area of 900
ha. Trap sites were chosen in the most suitable habitats
(stone walls, ditches and hedgerows), at variable distance
from each other, usually from 20 to 50 m. During data col-
lection traps were moved over different locations inside
study area, in order to capture different animals. The traps
were baited with dead house mice Mus domesticus and
checked twice a day, once in the morning and subsequently
12 hours later. During the cold season, from November to
March, the traps were disarmed at night.
Captured animals were transferred from the trap to a
sealed transparent plastic box, used as a pre-anaesthetisation
chamber, in which cotton wetted with ethyl ether was intro-
duced. Each animal was weighed to evaluate the exact dose
of anaesthetic and intramuscularly injected with ketamine.
Anaesthesia lasted an average of 10 minutes per animal.
Each captured animal was marked with an individually
numbered transponder tag (Trovan, UK), inserted subcuta-
neously between the shoulder blades. Each animals was
also fitted with a radio transmitter, equipped with an exter-
nal PIP model antenna (Biotrack, UK; 7 cm, 1 g). The
weight of the radio tag represented approximately 1% of an
adult females’ body weight and 0,5% of an adult males’ body
weight. The tags were fitted to the animals by a thin satin
collar, sewn on with cotton. After handling them, the ani-
mals were kept in a cage for the following 12 hours and
were fed, in order to monitor their health and the possible
reactions to anaesthetic. All tagged animals (which did not
lose the collars) were recaptured and the collars were re-
moved from their necks, when the transmitters were broken
or the batteries ran out.
Seventeen weasels were captured (14 males and 3 fe-
males), of which 9 (53%) were recaptured several times, for
138 C. Magrini et al.
a total of 46 captures. The total number of radio locations
was 1846, from 14 animals, but only 6 adult animals were
followed over enough days for spatial analysis. From 14
tagged animals, 6 of them lost the collars few days after re-
lease.
Although the battery life of transmitters averaged about
30–40 days, many radio tags were lost or broken within an
average of 10 days after being fitted. The range of their sig-
nal varies from 20 to 200 m, depending on the vegetation
and ground features of area occupied by the animal, and its
underground movements. A radio receiver (Custom, USA)
with a directional handle antenna was used to locate the
animals.
Animal locations were taken by homing methodology, a
simple, non triangulation technique that enables the real
position of the tracked animal to be estimated by following
the signal’s increasing strength (White and Garrott 1990).
There was no error associated with this methodology be-
cause animal location was concretely taken and not simply
estimated. The only error was introduced by the quality of
the map. A 1:10 000 map of the study area was used, and
the individual positions were taken in kilometric coordi-
nates UTM, so the error introduced by this mapping system
was 10 m.
Activity state was determined by the presence of inter-
mittent signal from tags. In order to maximize the amount
of data collected during the short time the radio tags were
working, the sampling strategy consisted in taking animal
locations every 15 minutes, for 8 hours continuously, fol-
lowed by 8 hours of rest, round the clock (Naef-Daenzer
1993, Jêdrzejewski et al. 1995, Samson and Raymond 1998).
For small mammals, the constraints of short battery life
mean that continuous tracking is the only option, since lon-
ger time intervals would yield too few location fixes (Harris
et al. 1990).
Data analysis
For home range analysis we used continuous locations.
Eliminating auto correlated data by sub-sampling reduces
both the accuracy and precision of the estimates (De Solla et
al. 1999) and limits the biological significance of the analy-
sis, because animal behaviour is essentially a dependent
phenomenon, and statistical independence is often not the
same as biological independence (Lair 1987, Rooney et al.
1998). The time period over which a home range is mea-
sured is one of the most important parameters needed to
fully define the home range (Morris 1988). For the home
range analysis, the sample period was selected to obtain an
equal number of fixes over the same temporal frame for
each individual. In particular, a normalized sample of 100
fixes per animal was used, referred to 5 continuous days,
not including data from first day after the release. This pro-
cedure was possible because of the homogeneous distribu-
tion of locations throughout the 24 hours of the day for
every weasel.
In this study, radio tracking data refer to small tempo-
ral frames. We analysed them both with non statistical
methods, the minimum convex polygon (MCP) (Mohr 1947)
and the grid cells count (GCC) (Siniff and Tester 1965) and
with a statistical non parametric method, the Kernel esti-
mator (Worton 1989). For GCC, we chose a cell size of 10 �
10 m, corresponding to the error associated to animal loca-
tions in this study, and assumed that cells crossed by the
straight line joining two consecutive locations should also
be counted as part of the home range area, as suggested by
White and Garrott (1990). Among the possible non paramet-
ric methods, we chose the fixed kernel estimator with the
least square cross validation (LSCV) smoothing parameter
(Worton 1995, Seaman and Powell 1996, Seaman et al.
1999). Home range analyses were done using Animal Move-
ment, version 2.0 (Alaska Biological Science Center).
Habitat selection is defined in terms of differential use
of available habitat types (Garshelis 2000). In this study
the term selection was described as the ‘second order selec-
tion’ of a population inside an area (Johnson 1980). John-
son’s methodology was used to perform statistical analysis.
So the animals and not the locations were the sampling
units and it was possible to determine habitat selection
without an exact assessment of habitat availability. There-
fore availability was determined by the polygon approach,
in which the sum of the areas of the polygons of each habi-
tat type provided the total area of each habitat type (White
and Garrott 1990). The MCP estimates of individual home
ranges were used, because they represent a descriptive defi-
nition of home ranges, not including the use of UD (utiliza-
tion distribution) area. In fact, the UD itself produces a
probability of use of a particular resource inside the individ-
ual range (Marzluff et al. 2001), and it is not the best home
range descriptor to be used in the availability analysis.
Three habitat types were chosen, and their relative avail-
ability was determined within the individual home range
areas.
The three habitat types were:
A. cultivated fields and meadows,
B. human settlements including houses, haylofts, sta-
bles, henhouses, industrial structures, paved or unpaved
roads accessible to cars,
C. corridors of natural environment represented by
woodland and hedges, including all spaces between fields,
between fields and rivers, streams or waterways, and be-
tween fields and roads, often represented by small channels.
The pattern of use was defined as the number of loca-
tions recorded within each habitat type. The use of homing
methodology reduced the risk of biased telemetry data on
habitat use (Garshelis 2000).
Habitat analyses were performed using Prefer, version
5.1 (Northern Praire Science Center) and Arcview, version
3.3 (Environmental Systems Research Institute, Inc).
Results
Estimates of home range size varied greatly
between individuals (Table 1), because of sea-
sonal changes in spacing behaviour. Based on
100 fixes per animal, the average area estimated
by the GCC method represents only 4,6% of the
average area estimated by the MCP methodol-
Space use in weasels 139
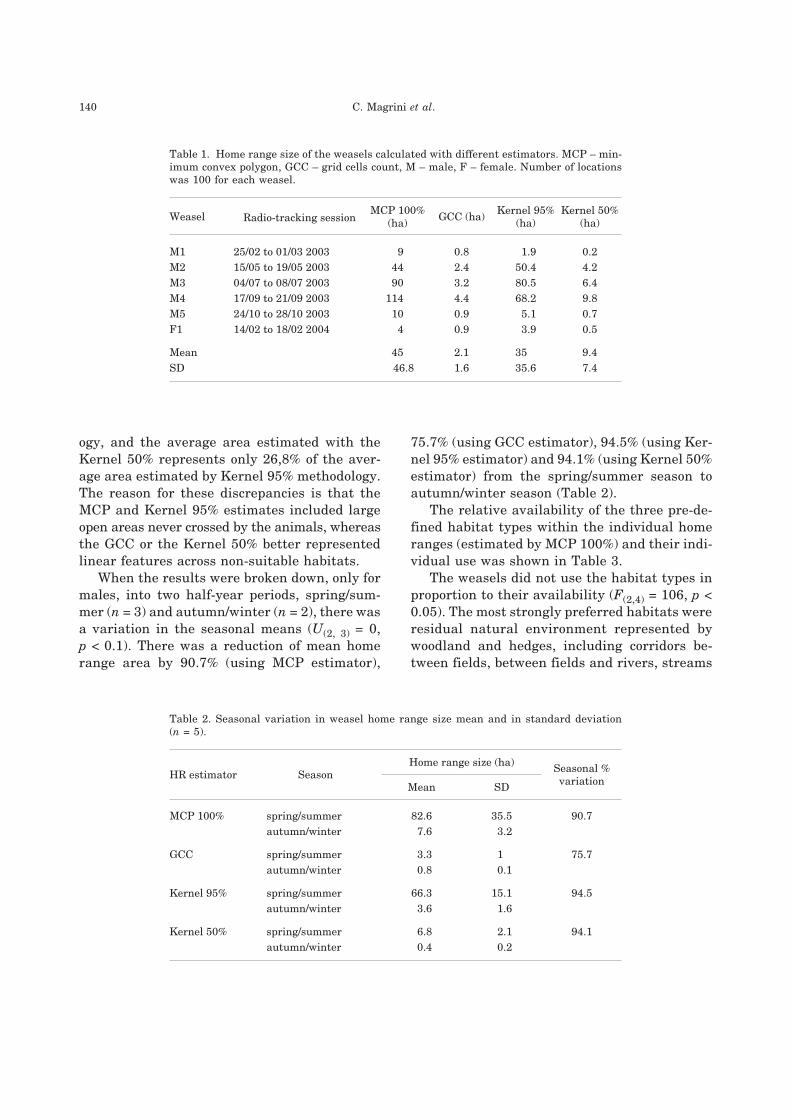
ogy, and the average area estimated with the
Kernel 50% represents only 26,8% of the aver-
age area estimated by Kernel 95% methodology.
The reason for these discrepancies is that the
MCP and Kernel 95% estimates included large
open areas never crossed by the animals, whereas
the GCC or the Kernel 50% better represented
linear features across non-suitable habitats.
When the results were broken down, only for
males, into two half-year periods, spring/sum-
mer (n = 3) and autumn/winter (n = 2), there was
a variation in the seasonal means (U(2, 3) = 0,
p < 0.1). There was a reduction of mean home
range area by 90.7% (using MCP estimator),
75.7% (using GCC estimator), 94.5% (using Ker-
nel 95% estimator) and 94.1% (using Kernel 50%
estimator) from the spring/summer season to
autumn/winter season (Table 2).
The relative availability of the three pre-de-
fined habitat types within the individual home
ranges (estimated by MCP 100%) and their indi-
vidual use was shown in Table 3.
The weasels did not use the habitat types in
proportion to their availability (F(2,4) = 106, p <
0.05). The most strongly preferred habitats were
residual natural environment represented by
woodland and hedges, including corridors be-
tween fields, between fields and rivers, streams
140 C. Magrini et al.
Table 1. Home range size of the weasels calculated with different estimators. MCP – min-
imum convex polygon, GCC – grid cells count, M – male, F – female. Number of locations
was 100 for each weasel.
Weasel Radio-tracking sessionMCP 100%
(ha)GCC (ha)
Kernel 95%
(ha)
Kernel 50%
(ha)
M1 25/02 to 01/03 2003 9 0.8 1.9 0.2
M2 15/05 to 19/05 2003 44 2.4 50.4 4.2
M3 04/07 to 08/07 2003 90 3.2 80.5 6.4
M4 17/09 to 21/09 2003 114 4.4 68.2 9.8
M5 24/10 to 28/10 2003 10 0.9 5.1 0.7
F1 14/02 to 18/02 2004 4 0.9 3.9 0.5
Mean 45 2.1 35 9.4
SD 46.8 1.6 35.6 7.4
Table 2. Seasonal variation in weasel home range size mean and in standard deviation
(n = 5).
HR estimator SeasonHome range size (ha)
Seasonal %
variationMean SD
MCP 100% spring/summer 82.6 35.5 90.7
autumn/winter 7.6 3.2
GCC spring/summer 3.3 1 75.7
autumn/winter 0.8 0.1
Kernel 95% spring/summer 66.3 15.1 94.5
autumn/winter 3.6 1.6
Kernel 50% spring/summer 6.8 2.1 94.1
autumn/winter 0.4 0.2
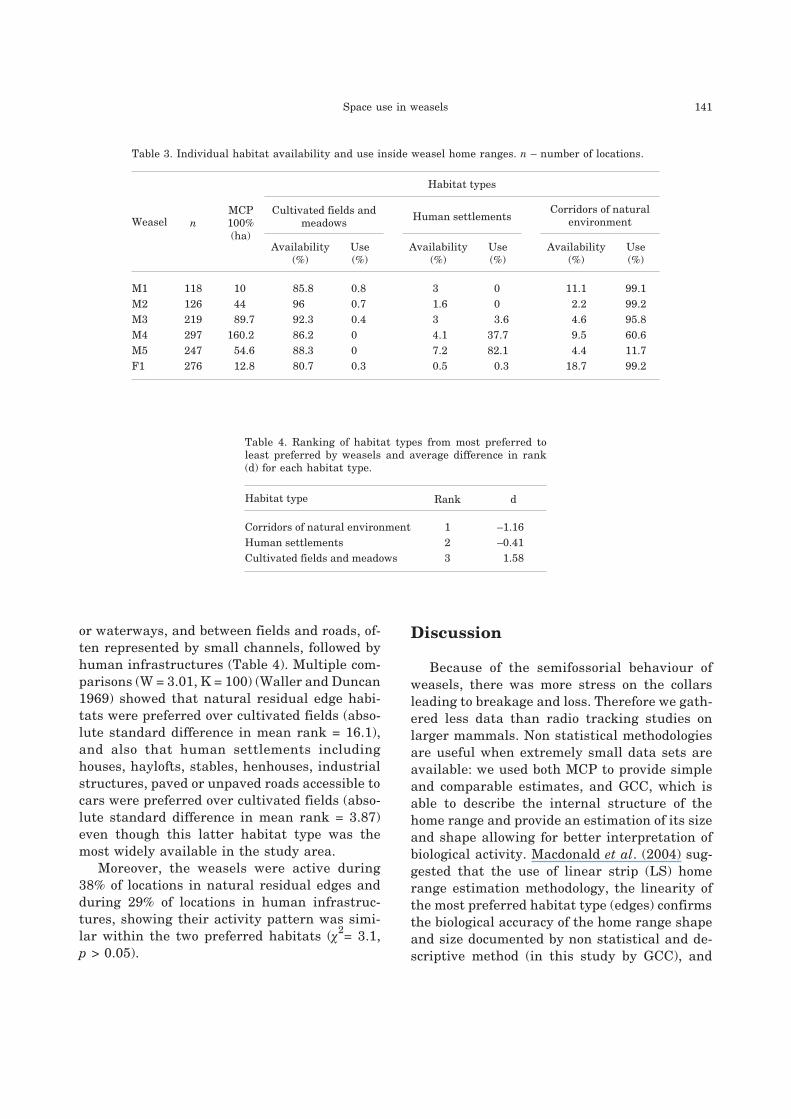
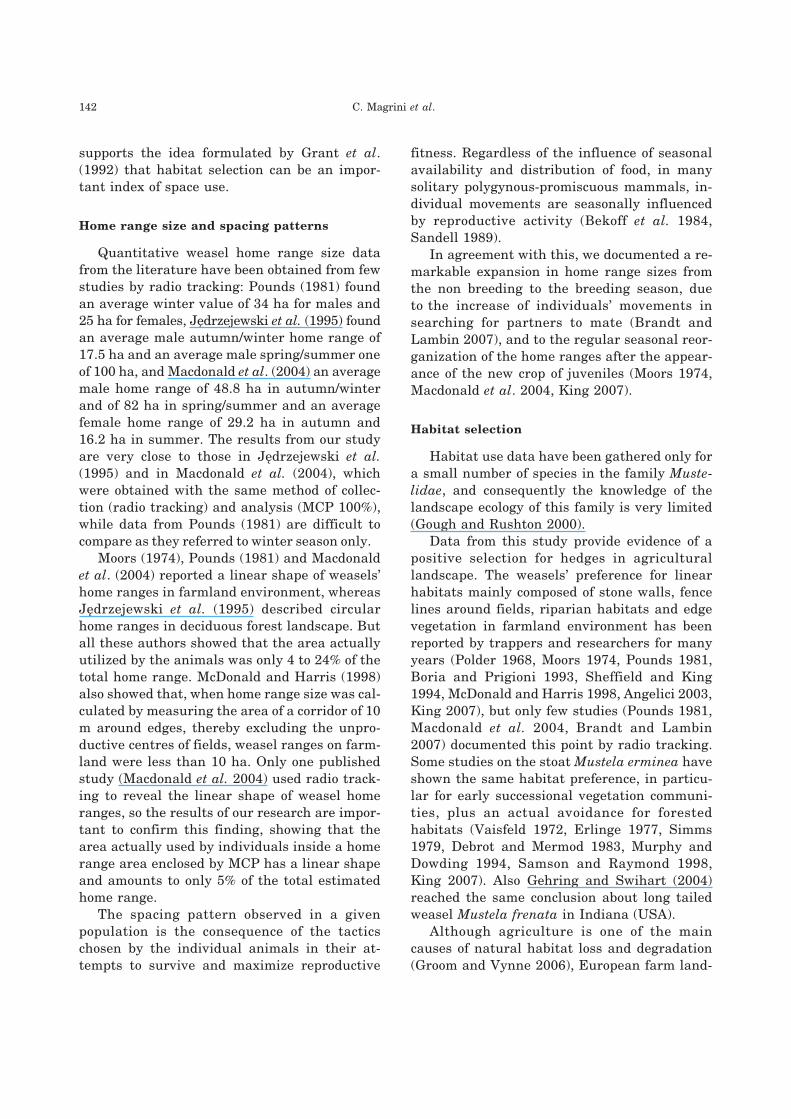
or waterways, and between fields and roads, of-
ten represented by small channels, followed by
human infrastructures (Table 4). Multiple com-
parisons (W = 3.01, K = 100) (Waller and Duncan
1969) showed that natural residual edge habi-
tats were preferred over cultivated fields (abso-
lute standard difference in mean rank = 16.1),
and also that human settlements including
houses, haylofts, stables, henhouses, industrial
structures, paved or unpaved roads accessible to
cars were preferred over cultivated fields (abso-
lute standard difference in mean rank = 3.87)
even though this latter habitat type was the
most widely available in the study area.
Moreover, the weasels were active during
38% of locations in natural residual edges and
during 29% of locations in human infrastruc-
tures, showing their activity pattern was simi-
lar within the two preferred habitats (�2= 3.1,
p > 0.05).
Discussion
Because of the semifossorial behaviour of
weasels, there was more stress on the collars
leading to breakage and loss. Therefore we gath-
ered less data than radio tracking studies on
larger mammals. Non statistical methodologies
are useful when extremely small data sets are
available: we used both MCP to provide simple
and comparable estimates, and GCC, which is
able to describe the internal structure of the
home range and provide an estimation of its size
and shape allowing for better interpretation of
biological activity. Macdonald et al. (2004) sug-
gested that the use of linear strip (LS) home
range estimation methodology, the linearity of
the most preferred habitat type (edges) confirms
the biological accuracy of the home range shape
and size documented by non statistical and de-
scriptive method (in this study by GCC), and
Space use in weasels 141
Table 3. Individual habitat availability and use inside weasel home ranges. n – number of locations.
Weasel n
MCP
100%
(ha)
Habitat types
Cultivated fields and
meadowsHuman settlements
Corridors of natural
environment
Availability
(%)
Use
(%)
Availability
(%)
Use
(%)
Availability
(%)
Use
(%)
M1 118 10 85.8 0.8 3 0 11.1 99.1
M2 126 44 96 0.7 1.6 0 2.2 99.2
M3 219 89.7 92.3 0.4 3 3.6 4.6 95.8
M4 297 160.2 86.2 0 4.1 37.7 9.5 60.6
M5 247 54.6 88.3 0 7.2 82.1 4.4 11.7
F1 276 12.8 80.7 0.3 0.5 0.3 18.7 99.2
Table 4. Ranking of habitat types from most preferred to
least preferred by weasels and average difference in rank
(d) for each habitat type.
Habitat type Rank d
Corridors of natural environment 1 –1.16
Human settlements 2 –0.41
Cultivated fields and meadows 3 1.58
supports the idea formulated by Grant et al.
(1992) that habitat selection can be an impor-
tant index of space use.
Home range size and spacing patterns
Quantitative weasel home range size data
from the literature have been obtained from few
studies by radio tracking: Pounds (1981) found
an average winter value of 34 ha for males and
25 ha for females, Jêdrzejewski et al. (1995) found
an average male autumn/winter home range of
17.5 ha and an average male spring/summer one
of 100 ha, and Macdonald et al. (2004) an average
male home range of 48.8 ha in autumn/winter
and of 82 ha in spring/summer and an average
female home range of 29.2 ha in autumn and
16.2 ha in summer. The results from our study
are very close to those in Jêdrzejewski et al.
(1995) and in Macdonald et al. (2004), which
were obtained with the same method of collec-
tion (radio tracking) and analysis (MCP 100%),
while data from Pounds (1981) are difficult to
compare as they referred to winter season only.
Moors (1974), Pounds (1981) and Macdonald
et al. (2004) reported a linear shape of weasels’
home ranges in farmland environment, whereas
Jêdrzejewski et al. (1995) described circular
home ranges in deciduous forest landscape. But
all these authors showed that the area actually
utilized by the animals was only 4 to 24% of the
total home range. McDonald and Harris (1998)
also showed that, when home range size was cal-
culated by measuring the area of a corridor of 10
m around edges, thereby excluding the unpro-
ductive centres of fields, weasel ranges on farm-
land were less than 10 ha. Only one published
study (Macdonald et al. 2004) used radio track-
ing to reveal the linear shape of weasel home
ranges, so the results of our research are impor-
tant to confirm this finding, showing that the
area actually used by individuals inside a home
range area enclosed by MCP has a linear shape
and amounts to only 5% of the total estimated
home range.
The spacing pattern observed in a given
population is the consequence of the tactics
chosen by the individual animals in their at-
tempts to survive and maximize reproductive
fitness. Regardless of the influence of seasonal
availability and distribution of food, in many
solitary polygynous-promiscuous mammals, in-
dividual movements are seasonally influenced
by reproductive activity (Bekoff et al. 1984,
Sandell 1989).
In agreement with this, we documented a re-
markable expansion in home range sizes from
the non breeding to the breeding season, due
to the increase of individuals’ movements in
searching for partners to mate (Brandt and
Lambin 2007), and to the regular seasonal reor-
ganization of the home ranges after the appear-
ance of the new crop of juveniles (Moors 1974,
Macdonald et al. 2004, King 2007).
Habitat selection
Habitat use data have been gathered only for
a small number of species in the family Muste-
lidae, and consequently the knowledge of the
landscape ecology of this family is very limited
(Gough and Rushton 2000).
Data from this study provide evidence of a
positive selection for hedges in agricultural
landscape. The weasels’ preference for linear
habitats mainly composed of stone walls, fence
lines around fields, riparian habitats and edge
vegetation in farmland environment has been
reported by trappers and researchers for many
years (Polder 1968, Moors 1974, Pounds 1981,
Boria and Prigioni 1993, Sheffield and King
1994, McDonald and Harris 1998, Angelici 2003,
King 2007), but only few studies (Pounds 1981,
Macdonald et al. 2004, Brandt and Lambin
2007) documented this point by radio tracking.
Some studies on the stoat Mustela erminea have
shown the same habitat preference, in particu-
lar for early successional vegetation communi-
ties, plus an actual avoidance for forested
habitats (Vaisfeld 1972, Erlinge 1977, Simms
1979, Debrot and Mermod 1983, Murphy and
Dowding 1994, Samson and Raymond 1998,
King 2007). Also Gehring and Swihart (2004)
reached the same conclusion about long tailed
weasel Mustela frenata in Indiana (USA).
Although agriculture is one of the main
causes of natural habitat loss and degradation
(Groom and Vynne 2006), European farm land-
142 C. Magrini et al.
scapes are systems where human activities
repeatedly create disturbances (endogenous)
through evolutionary time (Angelstam 1992, Ko-
zakiewicz et al. 1999), upon which the elements
of biological diversity depend (McIntyre and
Hobbs 1999, McNeely and Scherr 2006). The
basic condition for the use of agricultural land-
scape by the animal community is the presence
of residual natural habitats used as corridors
through the matrix (Middleton and Merriam
1983, Saunders et al. 1991).
The general view is that small mustelids
prefer farmland habitats rather than woodland
habitats (Klemola et al. 1999, Zub et al. 2008).
As a matter of fact, fragmented farm landscape
crossed by residual edge habitat favours meso-
predator release (Crooks and Soulè 1999); these
middle sized species can better exploit linear
edge habitats (Palomares and Caro 1999, Crooks
2002, Gehring and Swihart 2003).
Two main reasons account for the habitat
preference of weasels in a rural environment:
cover and food requirements. Weber (1988) de-
scribes an enclosure experiment on the micro-
habitat preference of polecats Mustela putorius,
a species which lives in environments similar to
those occupied by the weasel. Weber reported a
preference for densely structured habitats, like
edge vegetation, and proposed that the reason
has more to do with the cover providing refuge
from larger predators than with the availability
of prey. The same conclusion was inferred by a
study on drainage culverts in the agricultural
environment (Clevenger et al. 2001); culverts
were mainly used by weasels and selection for
this habitat was linked to the structural fea-
tures of the culverts (cover, depth), more than
prey abundance. Moreover, Brandt and Lambin
(2007) considered that selection of high grass
cover by weasels might reflect the avoidance for
habitat with high intraguild predation risk. Also
Zub et al. (2008) suggested that, at local scale,
availability of dense plant cover and other habi-
tat requirements, instead of the abundance of
prey, was the most important factor affecting
weasel habitat selection, in complex ecosystems
of the temperate zone.
However, the distribution of prey may be
another reason for this preference. Although
hedges are one of the most prey rich habitats for
weasels (Tattersall et al. 2001, 2002), middle and
small sized predators, like mustelids, also benefit
from the use of linear edge habitats because
these corridors cross more habitats, where ani-
mals can feed by spill over predation (Schneider
2001). Actually cultivated fields are used for
food and cover by many species of prey, in
particular Apodemus sp. (Tew et al. 1994, Ko-
zakiewicz et al. 1999), and Microtus sp. (Manson
et al. 1999). The weasel is a small predator, with
a specialized trophic niche: their predators in-
clude raptors, snakes, men, and larger carnivores
(Gerdol and Mantovani 1980, Korpimaki and
Norrdahl 1989, Bertarelli et al. 1992, Angelici
and Amori 1994, Angelici and Luiselli 1998,
Angelici 2003). Well vegetated habitats there-
fore give protection from predation and also
enable movements from outside the edge to
hunting areas composed of agricultural fields
and meadows, where the usual prey of weasel
live. In fact, the study area supports populations
of Savi’s pine vole Microtus savii, wood mouse
Apodemus sylvaticus and house mouse Mus do-
mesticus, the usual rodent prey species for
weasels, whose ecology is linked with fields in
the agricultural landscape (Capizzi and Santini
2002).
On the other hand, rural structures like
haylofts and henhouses are used both for provid-
ing cover and allowing predation on domestic
species (chickens and rabbits) and the house
mouse Mus domesticus, which live in higher
density near human settlements, regardless of
spill-over predation.
Lastly, this study assesses that the two pre-
ferred habitats, although quantitatively used in
a different way (natural edges were used more
than rural structures), were qualitatively used
in the same way. Actually there is evidence that
both habitats are used for the same activity
(resting, moving). However, natural edge habi-
tats are more frequently used because they are
the only spaces that enable the crossing of the
agricultural matrix.
Acknowledgements: We wish to thank the Regional NaturalReserve of Lungo and Ripasottile Lakes for allowing andsupporting our study. C. King, P. Ciucci and G. Orecchiaprovided invaluable advices.
Space use in weasels 143
References
Angelici F. M. 2003. Mustela nivalis (Linnaeus, 1766). [In:
Mammalia III: Carnivora-Artiodactyla. L. Boitani, S.
Lovari and A. Vigna Taglianti, eds]. Calderini, Bologna:
142–152.
Angelici F. M. and Amori G. 1994. [Mammals preyed on
by hawk species in Italy]. [In: Atti del VI Convegno
Italiano di Ornitologia]. Torino: 417– 418. [In Italian]
Angelici F. M. and Luiselli L. 1998. Patterns of mam-
mal-eating by snakes in Italian Alps and in peninsular
Italy: a review. Ecologia Mediterranea 24: 1–13.
Angelstam H. 1992. Conservation of communities: the im-
portance of edges, surroundings and landscape mosaic
structure. [In: Ecological principles of nature conserva-
tion; applications in temperate and boreal environ-
ments. L. Hansson, ed]. Elsevier Science Pub., London:
252– 325.
Bekoff M., Daniels T. J. and Gittleman J. L. 1984. Life
history patterns and the comparative social ecology of
carnivores. Annual Review Ecology Systematics 15:
191–232.
Bertarelli C., Gelati A. and Giannella C. 1992. [Preliminary
data on tawny owl (Strix aluco) and barn owl (Tyto alba)
winter diet in the low Modena district]. Picus 18: 133–140.
[In Italian]
Boria A. and Prigioni C. 1993. [Home range size and feeding
preference of weasel (Mustela nivalis) in cultivated area
of the Po Valley]. [In: Riassunti del II Simposio Italiano
sui Carnivori, Biologia e conservazione dei mustelidi. C.
Prigioni, ed]. Pavia. [In Italian]
Brandt M. J. and Lambin X. 2007. Movement patterns of
specialist predator, the weasel Mustela nivalis exploit-
ing asynchronous cyclic field vole Microtus agrestis pop-
ulations. Acta Theriologica 52: 13–25.
Capizzi D. and Santini L. 2002. [Savi pine vole, wood mouse,
house mouse]. [In: Mammiferi d’Italia. M. Spagnesi and
A. M. De Marinis, eds]. Ministero dell’Ambiente e della
Tutela del Territorio, Direzione Conservazione della Na-
tura, Istituto Nazionale di Fauna Selvatica Alessandro
Ghigi, Roma, Bologna: 188–189, 199–200, 203–204. [In
Italian]
Clevenger A. P., Chruszcz B. and Gunson K. 2001. Drainage
culverts as habitat linkages and factors affecting passage
by mammals. Journal Applied Ecology 38: 1340–1349.
Crooks K. R. 2002. Relative sensitivities of mammalian car-
nivores to habitat fragmentation. Conservation Biology
16: 488–502.
Crooks K. R. and Soulé M. E. 1999. Mesopredator release
and avifaunal extinctions in fragmented system. Nature
400: 563–566.
Debrot S. and Mermod C. 1983. The spatial and temporal
distribution pattern of the stoat (Mustela erminea L.).
Oecologia 59: 69–73.
De Solla S. R., Bonduriansky R. and Brooks R. J. 1999.
Eliminating auto-correlation reduces biological rele-
vance of home range estimates. Journal of Animal
Ecology 68: 221–234.
Erlinge S. 1974. Distribution, territoriality and numbers of
the weasel Mustela nivalis in relation to prey abun-
dance. Oikos 25: 308–314.
Erlinge S. 1977. Spacing strategy in stoat Mustela erminea
L. Oikos 28: 32–42.
Erlinge S. and Sandell M. 1988. Coexistence of stoat Mus-
tela erminea, and weasel Mustela nivalis: social domin-
ance, scent communication and reciprocal distribution.
Oikos 53: 242–246.
Garshelis D. L. 2000. Delusions in habitat evaluation: mea-
suring use, selection, and importance. [In: Research
techniques in animal ecology. L. Boitani and T. K.
Fuller, eds]. Columbia University Press, New York:
111–164.
Gehring T. M. and Swihart R. K. 2003. Body size, niche
breadth, and ecologically scaled responses to habitat
fragmentation: mammalian predators in an agricultural
landscape. Biological Conservation 109: 283–295.
Gehring T. M. and Swihart R. K. 2004. Home range and
movements of long-tailed weasels in a landscape frag-
mented by agriculture. Journal Mammalogy 85: 79–86.
Gerdol R. and Mantovani E. 1980. [Preliminary data on
barn owl (Tyto alba) predation in Ferrara district].
Avocetta 4: 83–86. [In Italian]
Gough M. C. and Rushton S. P. 2000. The application of
GIS-modelling to mustelid landscape ecology. Mammal
Review 30: 197–216.
Grant J. W. A., Chapman C. A. and Richardson K. S. 1992.
Defended versus undefended home range size of carni-
vores, ungulates and primates. Behavioural Ecology
Sociobiology 31: 149–161.
Groom M. J. and Vynne C. H. 2006. Habitat degradation
and loss. [In: Principles of conservation biology. M. J.
Groom, G. K. Meffe and C. R. Carroll, eds]. Sinauer As-
sociates, Suderland: 173–212.
Harris S., Cresswell W. J., Forde P. G., Trewhella W. J.,
Woollard T. and Wray S. 1990. Home range analysis us-
ing radio tracking data: a review of problems and tech-
niques particularly as applied to the study of mammals.
Mammal Review 20: 97–123.
Jêdrzejewski W., Jêdrzejewska B. and Szymura L. 1995.
Weasel population response, home range, and predation
on rodents in a deciduous forest in Poland. Ecology 76:
179–195.
Johnson D. H. 1980. The comparison of usage and availabil-
ity measurements for evaluating resource preference.
Ecology 61: 65–71.
King C. M. 1975. The home range of the weasel (Mustela
nivalis) in an English woodland. Journal of Animal
Ecology 44: 639–668.
King C. M. 2007. The natural history of weasels and stoats.
Christopher Helm (eds), London: 1–464.
King C. M. and Edgar R. L. 1977. Techniques for trapping
and tracking stoats (Mustela erminea); a review, and a
new system. New Zealand Journal of Zoology 4: 193–212.
144 C. Magrini et al.
King C. M. and Moors P. J. 1979. On coexistence, for-
aging strategy and biogeography of weasels and stoats.
Oecologia 39: 129–150.
Klemola T., Korpimaki E., Norrdahal K., Tanhuanpaa M.
and Koivula M. 1999. Mobility and habitat utilization of
small mustelids in relation to cyclically fluctuating prey
abundances. Annales Zoologici Fennici 36: 75–82.
Korpimäki E. and Norrdahl K. 1989. Avian predation on
mustelids in Europe: occurrence and effects on body size
variation and life traits. Oikos 55: 205–215.
Kozakiewicz M., Gortat T., Kozakiewicz A. and Barkowska
M. 1999. Effects of habitat fragmentation on four rodent
species in a Polish farm landscape. Landscape Ecology
14: 391–400.
Lair H. 1987. Estimating the location of the focal centre in
red squirrel home range. Ecology 68: 1092–1101.
Lockie J. D. 1966. Territory in small carnivores. Sympo-
sium of Zoological Society of London 18: 143–165.
Macdonald D. W., Tew T. E. and Todd I. A. 2004. The ecol-
ogy of weasels (Mustela nivalis) on mixed farmland in
southern England. Biologia (Bratislavia) 59: 235–241.
Manson R. H., Ostfeld R. S. and Canham C. D. 1999.
Responses of a small mammal community to hetero-
geneity along forest-old-field edges. Landscape Ecology
14: 355–367.
Marzluff J. M., Knick S. T. and Millspaugh J. J. 2001. High-
tech behavioural ecology: modelling the distribution of
animal activities. [In: Radio tracking and animal popu-
lations. J. J. Millspaugh and J. M. Marzluff, eds]. Aca-
demic Press, San Diego: 309–326.
McDonald R. A. and Harris S. 1998. Stoats and weasels.
The Mammal Society (eds), London: 1–32.
McIntyre S. and Hobbs R. 1999. A framework for conceptu-
alizing human effects on landscapes and its relevance to
management and research models. Conservation Biol-
ogy 13: 1282–1292.
McNeely J. A. and Scherr S. J. 2006. Promoting wildlife
conservation in agricultural landscapes. [In: Principles
of conservation biology. M. J. Groom, G. K. Meffe and
C. R. Carroll, eds]. Sinauer Associates, Sunderland:
208–211.
Middleton J. and Merriam G. 1983. Distribution of wood-
land species in farmland woods. Journal of Applied
Ecology 20: 625–644.
Mohr C. O. 1947. Table of equivalent populations of North
American small mammals. American Midland Natural-
ist 37: 223–249.
Moors P. J. 1974. The annual energy budget of a weasel
(Mustela nivalis) population in farmland. PhD thesis,
Aberdeen University, Aberdeen: 1–153.
Morris P. A. 1988. A study of home range and movements in
the hedgehog (Erinaceus europaeus). Journal of Zoology,
London 214: 433–449.
Murphy E. C. and Dowding J. E. 1994. Range and diet of
stoats (Mustela erminea) in a New Zealand beech forest.
New Zealand Journal of Ecology 8: 11–18.
Naef-Daenzer B. 1993. A new transmitter for small animals
and enhanced methods of home range analysis. The
Journal of Wildlife Management 57: 680–689.
Palomares F. and Caro T. M. 1999. Interspecific killing
among mammalian carnivores. The American Natural-
ist 153: 492–508.
Polder E. 1968. Spotted skunk and weasel populations den
and cover usage in northeast Iowa. Transactions of Iowa
Academy Science 75: 142–146.
Pounds C. J. 1981. Niche overlap in sympatric populations
of stoats (Mustela erminea) and weasels (Mustela niva-
lis) in northeast Scotland. PhD thesis, Aberdeen Uni-
versity, Aberdeen: 1–326.
Powell R. A. 1979. Mustelid spacing patterns: variations on
a theme by Mustela. Zeitschrift Tierpsychologie 50:
153–165.
Rooney S. M., Wolfe A. and Hayden T. J. 1998. Auto-
correlated data in telemetry studies: time to independ-
ence and the problem of behavioural effects. Mammal
Review 28: 89–98.
Samson C. and Raymond M. 1998. Movement and habitat
preference of radio tracked stoats, Mustela erminea,
during summer in southern Quebec. Mammalia 62:
165–174.
Sandell M. 1989. The mating tactics and spacing patterns of
solitary carnivores. [In: Carnivore behaviour, ecology
and evolution. J. L. Gittleman, ed]. Cornell University
Press, Ithaca: 164–182.
Saunders D. A., Hobbs R. J. and Margules C. R. 1991. Bio-
logical consequences of ecosystem fragmentation: a re-
view. Conservation Biology 5: 18–32.
Schneider M. F. 2001. Habitat loss, fragmentation and
predator impact: spatial implication for prey conserva-
tion. Journal of Applied Ecology 38: 720–735.
Seaman D. E., Millspaugh J. J., Kernohan B. J., Brundige
G. C., Raedeke K. J. and Gitzen R. A. 1999. Effects of
sample size on kernel home range estimates. The Jour-
nal of Wildlife Management 63: 739–747.
Seaman D. E. and Powell R. A. 1996. An evaluation of the
accuracy of kernel density estimators for home range
analysis. Ecology 77: 2075–2085.
Sheffield S. R. and King C. M. 1994. Mustela nivalis. Mam-
malian Species 454: 1–10.
Simms D. A. 1979. Studies on a ermine population in south-
ern Ontario. Canadian Journal of Zoology 57: 824–832.
Siniff D. B. and Tester J. R. 1965. Computer analysis of ani-
mal movement data obtained by telemetry. Bioscience
15: 104–108.
Tattersall F. H., Macdonald D. W., Hart B. J., Johnson P.
J., Manley W. J. and Feber R. E. 2002 Is habitat linear-
ity important for small mammal communities on farm-
land? Journal of Applied Ecology 39: 643–652.
Tattersall F. H., Macdonald D. W., Hart B. J., Manley W. J.
and Feber R. E. 2001. Habitat use by wood mice (Apo-
demus sylvaticus) in a changeable arable landscape.
Journal of Zoology, London 255: 487–494.
Space use in weasels 145

Tew T. E., Todd I. A. and Macdonald D. W. 1994. Field mar-
gins and small mammals. BCPC Monograph 58: 85–93.
Vaisfeld M. A. 1972. Ecology of stoat in the cold season
in the European North. Zoologicheskii Zhurnal 51:
1705–1714.
Waller R. A. and Duncan D. B. 1969 A Bayes rule for the
symmetric multiple comparisons problem. Journal of
American Statistic Association 64: 1484–1503.
Weber D. 1988. Experiments on microhabitat preference of
polecats. Acta Theriologica 33: 403–413.
White G. C. and Garrott R. A. 1990 Analysis of wildlife
radio-tracking data. Academic Press (eds), San Diego:
1–383.
Worton B. J. 1989. Kernel methods for estimating the utili-
zation distribution in home range studies. Ecology 70:
164–168.
Worton B. J. 1995. Using Monte Carlo simulation to evalu-
ate Kernel-based home range estimators. The Journal of
Wildlife Management 59: 794–800.
Zub K., Sonnichsen L. and Szafrañska P. A. 2008. Habitat
requirements of weasels Mustela nivalis constrain their
impact on prey populations in complex ecosystems of
the temperate zone. Oecologia 157: 571–582.
Received 22 July 2008, accepted 22 September 2008.
Associate editor was Karol Zub.
146 C. Magrini et al.
Top Related
Copyright © 2022 FDOKUMEN

