


Bahasa
Halaman
Hukum

E C O R E Ais a compound of the prefix “ECO”, which suggests an ecologically soundand comfortable environment, and the name the of the nation, “KOREA”
Environmental Review 2015, Korea
07Waste
Main Policy Framework (1) Policy Direction of Resource Circulation
(2) Waste Management and Reduction
(3) Waste Recycling
(4) Hazardous Waste Management
Current Policy Focus (1) Disposable Products and Over-packaged Products
(2) Volume-based Food Waste Fee System
(3) Waste Electrical & Electronic Product Recycling Target Management System
(4) Free Collection for Large-scale Household Appliances Waste
(5) Waste-to-Energy
Key facts and trends (1) Waste Generation
(2) Waste Treatment
30ECOREA 2015 Chapter 7. Waste
Main Policy Framework
(1) Policy Direction of Resource Circulation
The waste policy of the Ministry of Environment of Korea, based on the principle of resource
circulation, is aimed at minimizing untreated wastes in landfill and maximizing recycling by
refraining from the single use and disposal of energy and resources to create a resource circulation
society in which natural resources and energy are recirculated within the economic activity areas
for as long as possible.
Under this policy, the first fundamental plan of resource circulation (2011-2015) was established
in 2011 with the goal of realizing a zero-waste society by going beyond the quantitative level of
resource circulation and shifting towards “upcycling” that upgrades the value of waste resources.
In addition, the ministry announced measures to promote the transition to a resource
circulation society in September 2013, which include free pickup services for large-scale waste
home appliances, securement of the collection, transportation and classification of recycling
resources, expansion of waste to energy facilities, creation of a recycling market, etc. To that end, it
plans to establish the “Act on Promotion of Transition toward a Resource Circulation Society.”
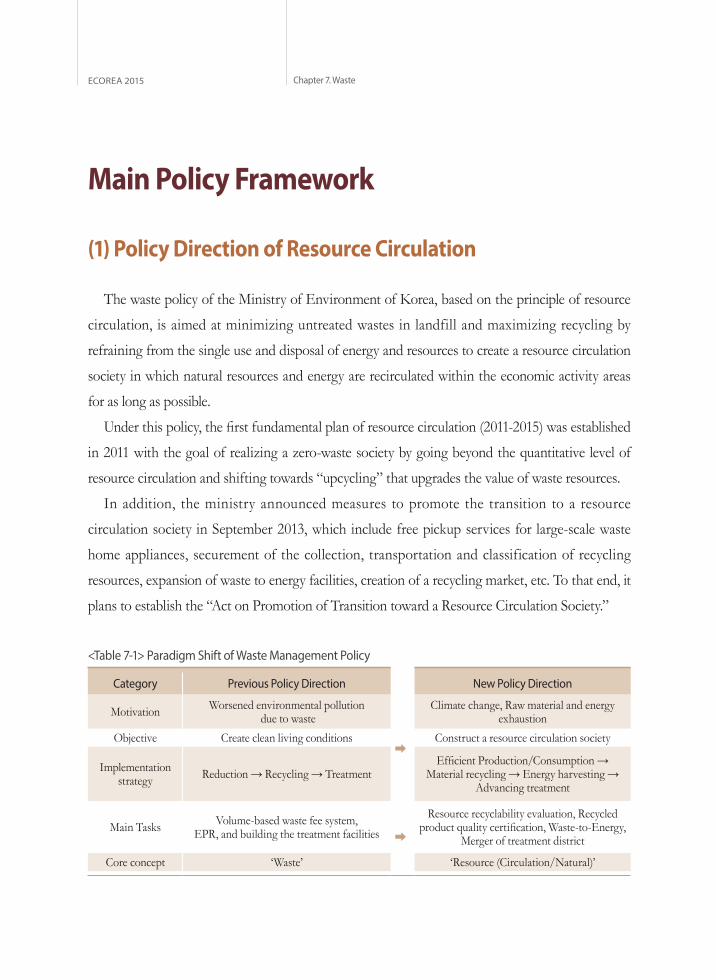
<Table 7-1> Paradigm Shift of Waste Management Policy
Category Previous Policy Direction New Policy Direction
Motivation Worsened environmental pollution due to waste
�
Climate change, Raw material and energy exhaustion
Objective Create clean living conditions Construct a resource circulation society
Implementation strategy Reduction → Recycling → Treatment
Efficient Production/Consumption → Material recycling → Energy harvesting →
Advancing treatment
Main Tasks Volume-based waste fee system,EPR, and building the treatment facilities �
Resource recyclability evaluation, Recycled product quality certification, Waste-to-Energy,
Merger of treatment district
Core concept ‘Waste’ ‘Resource (Circulation/Natural)’
30Main Policy Framework 31
(2) Waste Management and Reduction
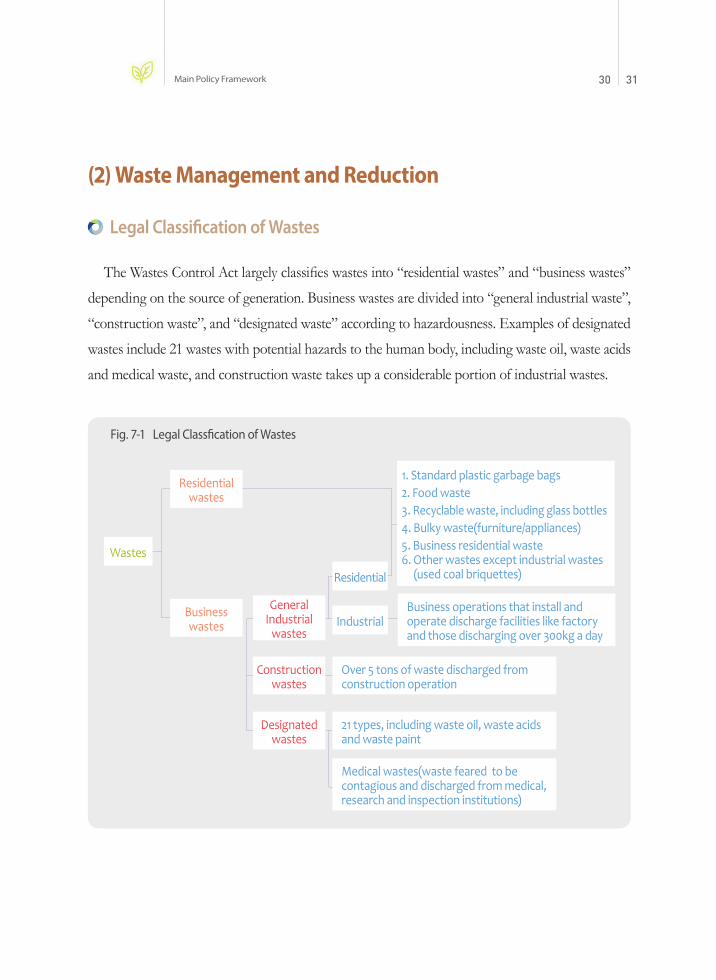
Legal Classification of Wastes
The Wastes Control Act largely classifies wastes into “residential wastes” and “business wastes”
depending on the source of generation. Business wastes are divided into “general industrial waste”,
“construction waste”, and “designated waste” according to hazardousness. Examples of designated
wastes include 21 wastes with potential hazards to the human body, including waste oil, waste acids
and medical waste, and construction waste takes up a considerable portion of industrial wastes.
Wastes
Residential
IndustrialBusiness operations that install and operate discharge facilities like factory and those discharging over 300kg a day
Residentialwastes
Business wastes
General Industrial
wastes
Designated wastes
Constructionwastes
Over 5 tons of waste discharged from construction operation
21 types, including waste oil, waste acids and waste paint
Medical wastes(waste feared to be contagious and discharged from medical, research and inspection institutions)
1. Standard plastic garbage bags2. Food waste3. Recyclable waste, including glass bottles4. Bulky waste(furniture/appliances)5. Business residential waste6. Other wastes except industrial wastes (used coal briquettes)
Fig. 7-1 Legal Classfication of Wastes
32ECOREA 2015 Chapter 7. Waste
Volume-based Waste Fee System
The Volume-based Waste Disposal System is a policy, in accordance with the polluter pays
principle, to fundamentally reduce waste generation and facilitate separation and discharge of
recyclable materials by imposing waste fees in proportion to the amount of residential wastes one
generates (except recyclable wastes). Under this program, wastes are required to be discharged by
using designated standard plastic garbage bags or putting on labels marking wastes as bulky waste,
and the charges are collected by selling volume-rate garbage bags and labels marking wastes. In the
case of discharging recyclable materials, they are collected free of charge regardless of the amount.
The Volume-based Waste Disposal System applies to residential waste discharged from
households and business operations, and was recently expanded to cover food waste.3) This
program, launched in January 1995, is considered to have significantly decreased the amount of
residential waste. With this, the daily generated amount of residential waste per person decreased
from 1.3kg in 1994 to 1.0kg since 1995 after the implementation of the program.
Waste Charging System
The Waste Charging System is designed to control the generation of wastes and prevent waste
of resources by charging the manufacturers or importers, under the polluter pays principle, the
cost for disposing of products, materials and containers that include poison or harmful substances,
or are difficult to reuse and have the potential to create problems in waste management.
The collected waste charges revert to the Environmental Improvement Special Account and
are used to fund studies on waste reduction and reuse, as well as the development of related
technology, supporting projects for installing waste disposal facilities and reusing waste, funding
local governments for retrieving and reusing waste, and purchasing and stocking up on reusable
resources.
The items charged as of 2013 are pesticide and poisonous substance containers, anti-freeze,
3) For more information, see Current Policy Focus (2) Volume-based Food Waste Fee System
32Main Policy Framework 33
chewing gum, disposable diapers, cigarettes, and plastics. As for plastics, the disposal cost will be
levied on the end product rather than the raw material itself, considering the varying reuse rates.
Business Waste Reduction Program
The Reduction of Industrial Waste program is concerned with reducing environmental hazards
by minimizing the amount of waste disposed of through the control of their generation and
expansion of recycling in order to encourage the voluntary efforts of businesses to reduce harmful
waste.
This program was introduced in December 1996, and four types of business operations
were added to target businesses subject to mandatory waste reduction in 2014. Currently, 2,312
businesses from 18 types of business operations that are considered to generate large amounts of
waste are designated for the reduction program and encouraged to voluntarily make improvements
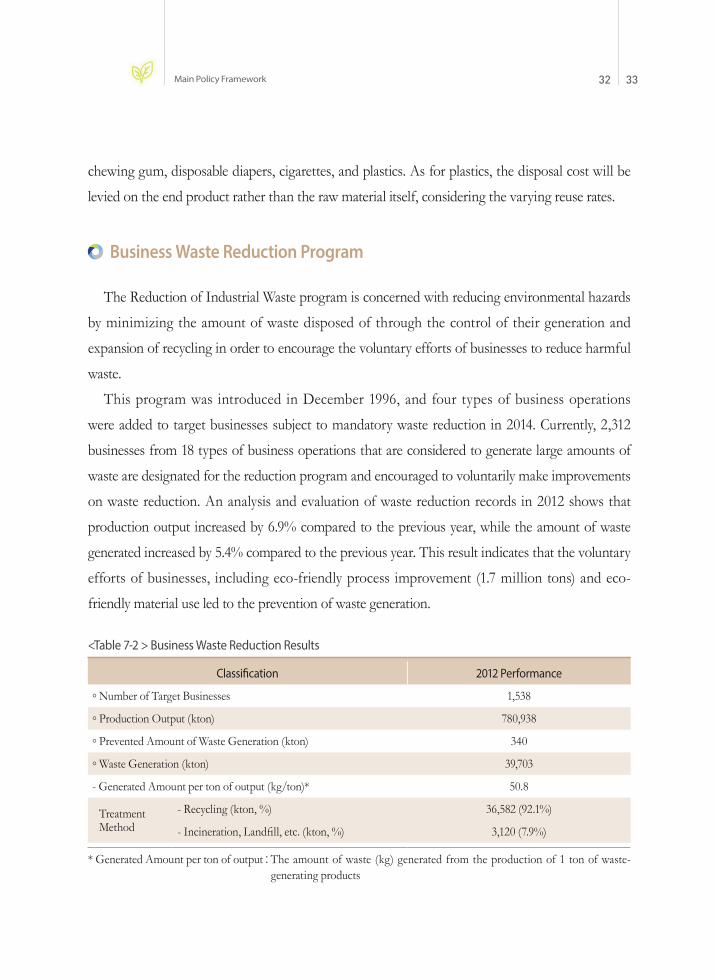
on waste reduction. An analysis and evaluation of waste reduction records in 2012 shows that
production output increased by 6.9% compared to the previous year, while the amount of waste
generated increased by 5.4% compared to the previous year. This result indicates that the voluntary
efforts of businesses, including eco-friendly process improvement (1.7 million tons) and eco-
friendly material use led to the prevention of waste generation.
<Table 7-2 > Business Waste Reduction Results
Classification 2012 Performance
◦ Number of Target Businesses 1,538
◦ Production Output (kton) 780,938
◦ Prevented Amount of Waste Generation (kton) 340
◦ Waste Generation (kton) 39,703
- Generated Amount per ton of output (kg/ton)* 50.8
TreatmentMethod
- Recycling (kton, %) 36,582 (92.1%)
- Incineration, Landfill, etc. (kton, %) 3,120 (7.9%)
* Generated Amount per ton of output:�The amount of waste (kg) generated from the production of 1 ton of waste-generating products
34ECOREA 2015 Chapter 7. Waste
In 2005, an online waste reduction information system (www.allbaro.or.kr) was created to
provide information on waste reduction policy direction, model cases and reduction methods, and
a reward program for businesses with outstanding performance in reducing waste generation, as
well as a presentation program for model businesses with outstanding performance in reducing
waste generation, have been in place.
(3) Waste Recycling
Extended Producer Responsibility (EPR)
Extended Producer Responsibility was introduced to promote the reduction, reuse and
recycling of waste by encouraging manufacturers to consider the environment through the whole
process of product design, manufacturing, distribution, consumption and disposal.
Prior to introducing the EPR, the Wastes Deposit Program had been implemented since 1992
as a way to strengthen the role of manufacturers regarding recycling. The Wastes Deposit Program
allowed manufacturers to deposit a cost in proportion to their production output and retrieve it
in the amount in proportion to their records in reuse. It was designed to encourage businesses
to make effort to recycle by offering financial incentives, but the system faced criticism because
companies simply paid the charge and did not make actual reuse efforts.
Under these circumstances, the Waste Deposit Program was abolished and EPR was
introduced to ensure the practical efforts of businesses. After a preparatory period that began with
seven items, including electronic products, between 2000 and 2002 with a voluntary agreement
between the government and industry, the full-fledged Extended Producer Responsibility system
was introduced in 2003. The total amount of recycling has grown from 938,000 tons in 2002
to 1,519,000 tons in 2012, an increase of about 62%, which implies quantitative growth in the
recycling sector.
At the time of the initial operation of EPR in 2003, the target items were limited to products
and packaging containers such as paper packs, glass bottles, metal cans, synthetic resin packaging,
34Main Policy Framework 35
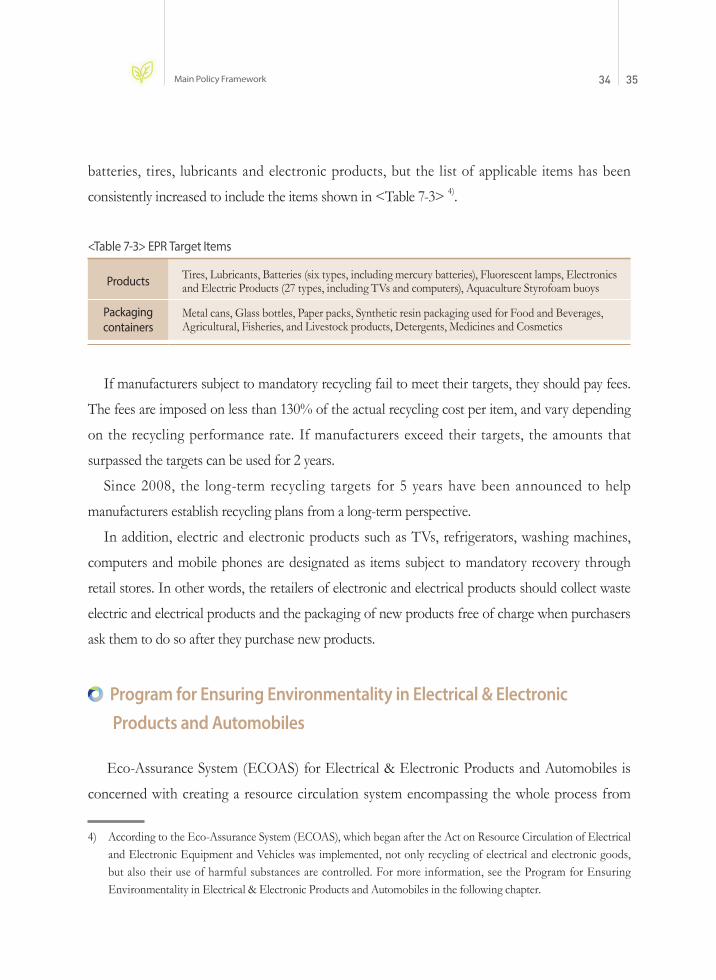
batteries, tires, lubricants and electronic products, but the list of applicable items has been
consistently increased to include the items shown in <Table 7-3> 4).
<Table 7-3> EPR Target Items
Products Tires, Lubricants, Batteries (six types, including mercury batteries), Fluorescent lamps, Electronics and Electric Products (27 types, including TVs and computers), Aquaculture Styrofoam buoys
Packaging containers
Metal cans, Glass bottles, Paper packs, Synthetic resin packaging used for Food and Beverages, Agricultural, Fisheries, and Livestock products, Detergents, Medicines and Cosmetics
If manufacturers subject to mandatory recycling fail to meet their targets, they should pay fees.
The fees are imposed on less than 130% of the actual recycling cost per item, and vary depending
on the recycling performance rate. If manufacturers exceed their targets, the amounts that
surpassed the targets can be used for 2 years.
Since 2008, the long-term recycling targets for 5 years have been announced to help
manufacturers establish recycling plans from a long-term perspective.
In addition, electric and electronic products such as TVs, refrigerators, washing machines,
computers and mobile phones are designated as items subject to mandatory recovery through
retail stores. In other words, the retailers of electronic and electrical products should collect waste
electric and electrical products and the packaging of new products free of charge when purchasers
ask them to do so after they purchase new products.
Program for Ensuring Environmentality in Electrical & Electronic Products and Automobiles
Eco-Assurance System (ECOAS) for Electrical & Electronic Products and Automobiles is
concerned with creating a resource circulation system encompassing the whole process from
4) According to the Eco-Assurance System (ECOAS), which began after the Act on Resource Circulation of Electrical and Electronic Equipment and Vehicles was implemented, not only recycling of electrical and electronic goods, but also their use of harmful substances are controlled. For more information, see the Program for Ensuring Environmentality in Electrical & Electronic Products and Automobiles in the following chapter.
36ECOREA 2015 Chapter 7. Waste
design and production to disuse in order to control the use of harmful substances and thus
facilitate recycling.
To support this program, Korea implemented the Act on the Resource Circulation of Electrical
and Electronic Products and Vehicles in April 2007. Prior to the enactment of the law, the
government implemented a guideline on examination of preliminary recycling of electrical and
electronic products and vehicles and restriction of their use of harmful substances. However, their
feasibility was not satisfactory, and the follow-up management at the disposal stage was conducted
through EPR, but was limited to electrical and electronic products.
The main contents of the Act on the Resource Circulation of Electrical and Electronic Products
and Vehicles are as follows. First, businesses are encouraged to use eco-friendly and easy-to-recycle
raw materials in the production stage and are made to assess and evaluate their compliance with
standards on the inclusion of harmful substances.
Second, every manufacturer or importer of electrical and electronic products and every
manufacturer or importer of vehicles must provide people who are engaged in the recycling
business with information about recycling, including the composition of materials, contents
of harmful substances and dismantling methods, to help those persons pursue their recycling
businesses.
Third, the law clarifies the roles of interest groups related to the recycling of end-of-life
vehicles. Manufacturers or importers of vehicles should make efforts to develop and distribute
recycling technology and provide financial and technical assistance. Persons who run a business
of dismantling vehicles and persons who run a business of recycling residual scrap should recycle
resources from end-of-life vehicles as much as possible, and recycling methods and standards for
end-of-life vehicles were established to promote proper recycling.
Fourth, every automotive dismantler should separately collect and store substances that affect
the climate and ecosystem such as freon gas. Every vehicle scrap recycler must separately discharge
residual scrap generated from end-of-life vehicles after collecting metals, and the expenses needed
for treatment and recycling is deducted from the price of end-of-life vehicles.
36Main Policy Framework 37
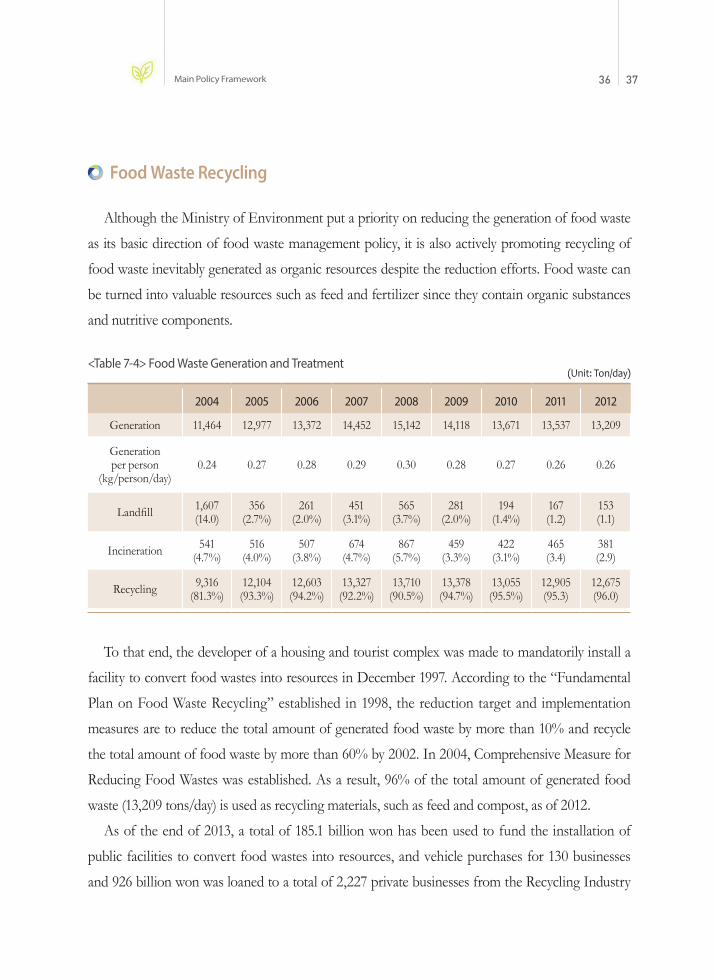
Food Waste Recycling
Although the Ministry of Environment put a priority on reducing the generation of food waste
as its basic direction of food waste management policy, it is also actively promoting recycling of
food waste inevitably generated as organic resources despite the reduction efforts. Food waste can
be turned into valuable resources such as feed and fertilizer since they contain organic substances
and nutritive components.
<Table 7-4> Food Waste Generation and Treatment (Unit: Ton/day)
2004 2005 2006 2007 2008 2009 2010 2011 2012
Generation 11,464 12,977 13,372 14,452 15,142 14,118 13,671 13,537 13,209
Generationper person
(kg/person/day)0.24 0.27 0.28 0.29 0.30 0.28 0.27 0.26 0.26
Landfill 1,607(14.0)
356(2.7%)
261(2.0%)
451(3.1%)
565(3.7%)
281(2.0%)
194(1.4%)
167(1.2)
153(1.1)
Incineration 541(4.7%)
516(4.0%)
507(3.8%)
674(4.7%)
867(5.7%)
459(3.3%)
422(3.1%)
465(3.4)
381(2.9)
Recycling 9,316(81.3%)
12,104(93.3%)
12,603(94.2%)
13,327(92.2%)
13,710(90.5%)
13,378(94.7%)
13,055(95.5%)
12,905(95.3)
12,675(96.0)
To that end, the developer of a housing and tourist complex was made to mandatorily install a
facility to convert food wastes into resources in December 1997. According to the “Fundamental
Plan on Food Waste Recycling” established in 1998, the reduction target and implementation
measures are to reduce the total amount of generated food waste by more than 10% and recycle
the total amount of food waste by more than 60% by 2002. In 2004, Comprehensive Measure for
Reducing Food Wastes was established. As a result, 96% of the total amount of generated food
waste (13,209 tons/day) is used as recycling materials, such as feed and compost, as of 2012.
As of the end of 2013, a total of 185.1 billion won has been used to fund the installation of
public facilities to convert food wastes into resources, and vehicle purchases for 130 businesses
and 926 billion won was loaned to a total of 2,227 private businesses from the Recycling Industry
38ECOREA 2015 Chapter 7. Waste
Promotion Fund to assist related technology development and facility installation in the private
sector.
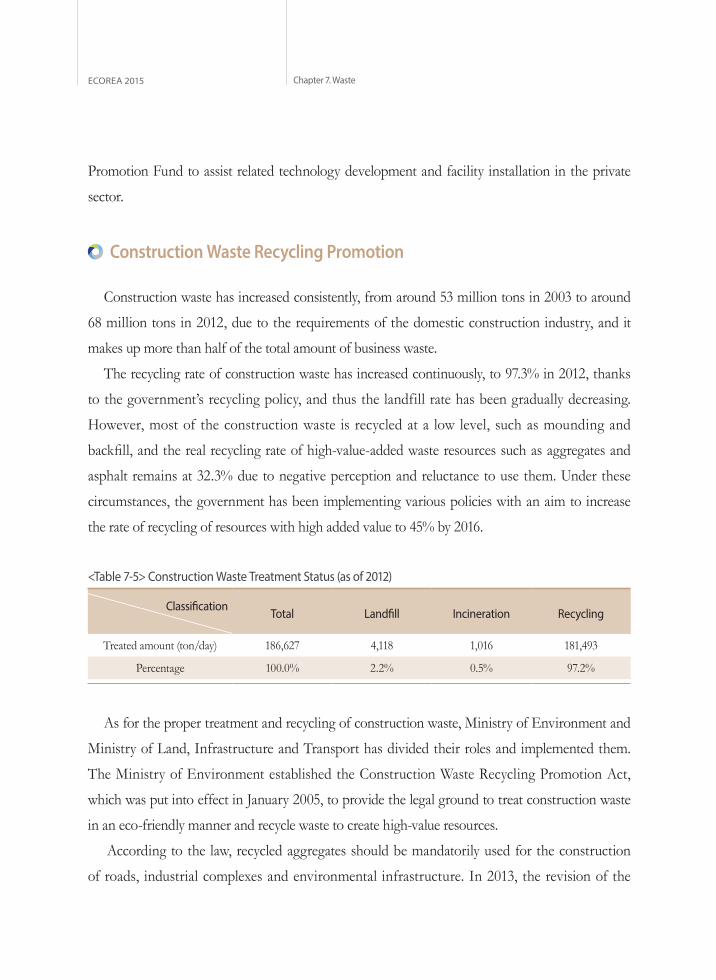
Construction Waste Recycling Promotion
Construction waste has increased consistently, from around 53 million tons in 2003 to around
68 million tons in 2012, due to the requirements of the domestic construction industry, and it
makes up more than half of the total amount of business waste.
The recycling rate of construction waste has increased continuously, to 97.3% in 2012, thanks
to the government’s recycling policy, and thus the landfill rate has been gradually decreasing.
However, most of the construction waste is recycled at a low level, such as mounding and
backfill, and the real recycling rate of high-value-added waste resources such as aggregates and
asphalt remains at 32.3% due to negative perception and reluctance to use them. Under these
circumstances, the government has been implementing various policies with an aim to increase
the rate of recycling of resources with high added value to 45% by 2016.
<Table 7-5> Construction Waste Treatment Status (as of 2012)
Classification Total Landfill Incineration Recycling
Treated amount (ton/day) 186,627 4,118 1,016 181,493
Percentage 100.0% 2.2% 0.5% 97.2%
As for the proper treatment and recycling of construction waste, Ministry of Environment and
Ministry of Land, Infrastructure and Transport has divided their roles and implemented them.
The Ministry of Environment established the Construction Waste Recycling Promotion Act,
which was put into effect in January 2005, to provide the legal ground to treat construction waste
in an eco-friendly manner and recycle waste to create high-value resources.
According to the law, recycled aggregates should be mandatorily used for the construction
of roads, industrial complexes and environmental infrastructure. In 2013, the revision of the
38Main Policy Framework 39
enforcement ordinance and regulations specified the treatment methods for construction waste.
Based on the revision, the asphalt concrete waste used for simple mounding and backfill should be
separately discharged and stored away from other construction waste, and the recycling of asphalt
concrete waste was restricted to road construction.
To guarantee the quality of recycled aggregates, the government introduced a quality
certification system for recycled aggregates in January 2007 and implemented quality standards for
recycled aggregate products by use in 2012.
Moreover, information related to the transfer of construction waste through the process of
discharge, collection and transportation, and treatment should be inserted into an electronic
information treatment program to manage construction waste in a transparent and effective
way. Also, a construction waste information management system has been in place that provides
information related to the production status, quality, demand and supply of recycled aggregates to
directly link manufacturers and consumers.
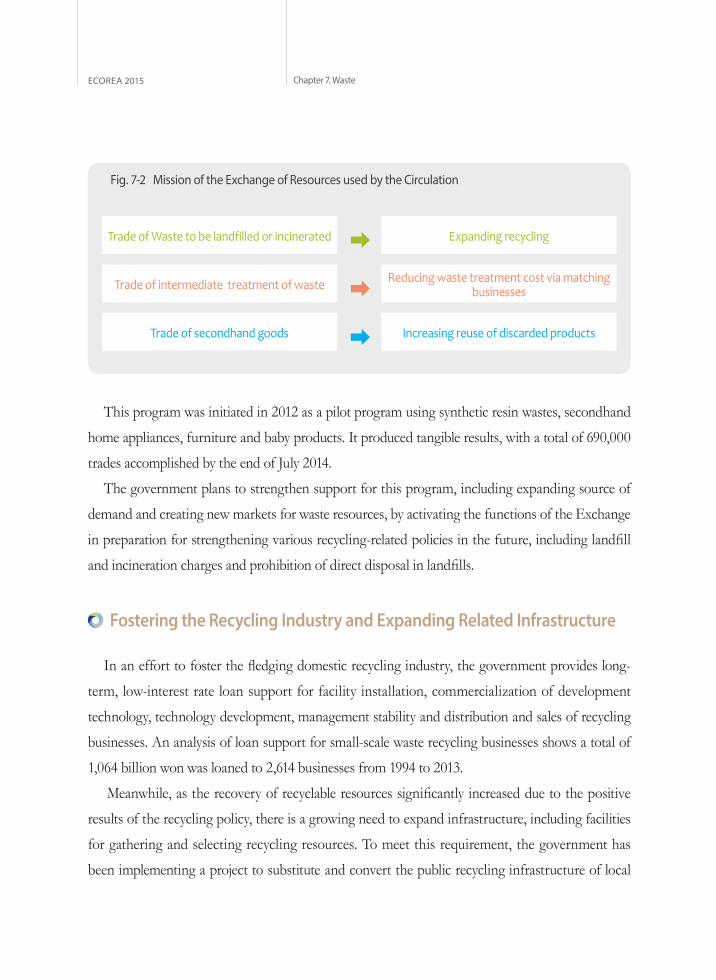
Exchange of Resources used by the Circulation
The Exchange of Resources used by the Circulation is an online marketplace between waste
suppliers and waste consumers. This system allows waste suppliers to register information
about types, properties, quantity and quality of wastes with the online exchange, and then waste
consumers can use this information on the nearest business operations, prices, regions and quality
to find and purchase optimal products. Starting from the second half of 2014, a distribution
assistance service intermediating between businesses engaging in waste discharge and waste
treatment, a GIS-based search function, and an electronic bidding system were additionally
introduced to the system to dramatically activate the trade of high-value-added waste resources.
40ECOREA 2015 Chapter 7. Waste
Fig. 7-2 Mission of the Exchange of Resources used by the Circulation
Trade of Waste to be landfilled or incinerated Expanding recycling
Reducing waste treatment cost via matching businesses
Increasing reuse of discarded products
Trade of intermediate treatment of waste
Trade of secondhand goods
�
�
�
This program was initiated in 2012 as a pilot program using synthetic resin wastes, secondhand
home appliances, furniture and baby products. It produced tangible results, with a total of 690,000
trades accomplished by the end of July 2014.
The government plans to strengthen support for this program, including expanding source of
demand and creating new markets for waste resources, by activating the functions of the Exchange
in preparation for strengthening various recycling-related policies in the future, including landfill
and incineration charges and prohibition of direct disposal in landfills.
Fostering the Recycling Industry and Expanding Related Infrastructure
In an effort to foster the fledging domestic recycling industry, the government provides long-
term, low-interest rate loan support for facility installation, commercialization of development
technology, technology development, management stability and distribution and sales of recycling
businesses. An analysis of loan support for small-scale waste recycling businesses shows a total of
1,064 billion won was loaned to 2,614 businesses from 1994 to 2013.
Meanwhile, as the recovery of recyclable resources significantly increased due to the positive
results of the recycling policy, there is a growing need to expand infrastructure, including facilities
for gathering and selecting recycling resources. To meet this requirement, the government has
been implementing a project to substitute and convert the public recycling infrastructure of local
40Main Policy Framework 41
governments to modern facilities since 2000. As of 2013, a total of 147.4 billion won was used to
fund 394 business operations for the installation and improvement of collection facilities (local
governments shared 30% of the total expenses).
(4) Hazardous Waste Management
Allbaro System (Waste Management System)
The Waste Disposal Certification System, which was introduced in 1999 to track the
transportation of hazardous wastes, was a system in which recording and transferring of document
and reporting to relevant authorities was performed manually. Thus, it was difficult to achieve
its intended goal since the program required excessive amounts of manpower, time and costs to
figure out the moving routes of wastes by checking documents.
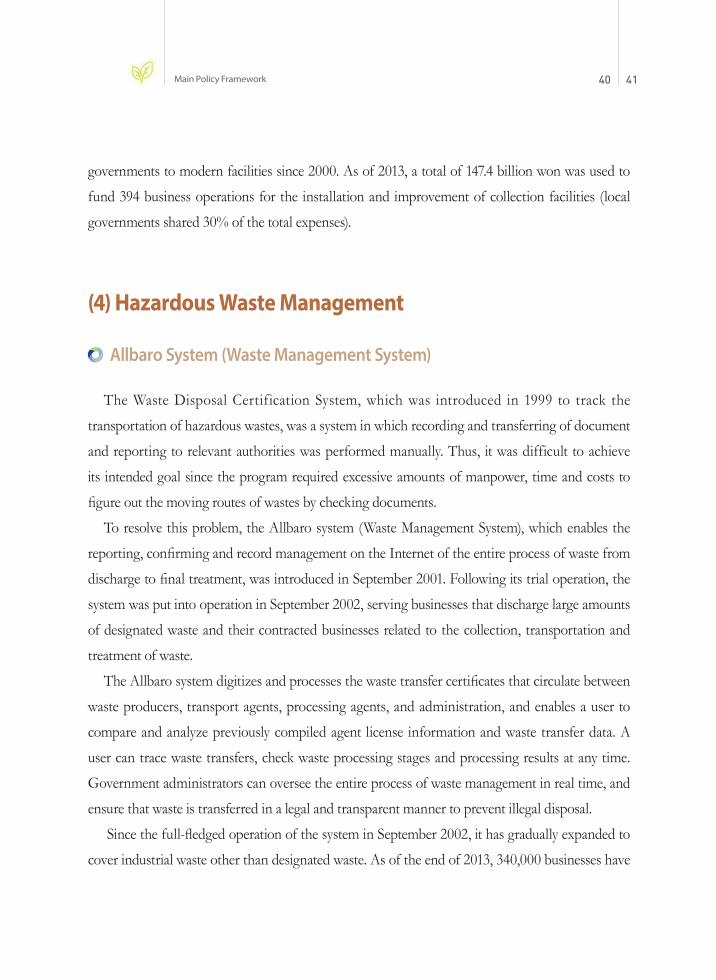
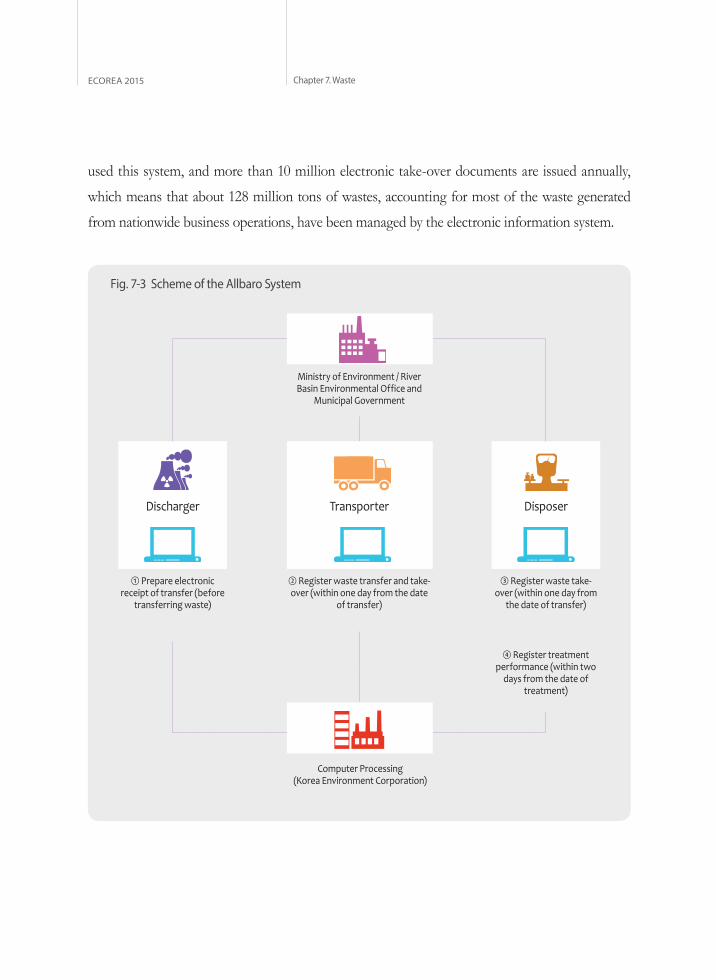
To resolve this problem, the Allbaro system (Waste Management System), which enables the
reporting, confirming and record management on the Internet of the entire process of waste from
discharge to final treatment, was introduced in September 2001. Following its trial operation, the
system was put into operation in September 2002, serving businesses that discharge large amounts
of designated waste and their contracted businesses related to the collection, transportation and
treatment of waste.
The Allbaro system digitizes and processes the waste transfer certificates that circulate between
waste producers, transport agents, processing agents, and administration, and enables a user to
compare and analyze previously compiled agent license information and waste transfer data. A
user can trace waste transfers, check waste processing stages and processing results at any time.
Government administrators can oversee the entire process of waste management in real time, and
ensure that waste is transferred in a legal and transparent manner to prevent illegal disposal.
Since the full-fledged operation of the system in September 2002, it has gradually expanded to
cover industrial waste other than designated waste. As of the end of 2013, 340,000 businesses have
42ECOREA 2015 Chapter 7. Waste
used this system, and more than 10 million electronic take-over documents are issued annually,
which means that about 128 million tons of wastes, accounting for most of the waste generated
from nationwide business operations, have been managed by the electronic information system.
Fig. 7-3 Scheme of the Allbaro System
Ministry of Environment / River Basin Environmental Office and
Municipal Government
② Register waste transfer and take-over (within one day from the date
of transfer)
① Prepare electronic receipt of transfer (before
transferring waste)
③ Register waste take-over (within one day from
the date of transfer)
④ Register treatment performance (within two
days from the date of treatment)
Discharger DisposerTransporter
Computer Processing (Korea Environment Corporation)
42Main Policy Framework 43
Abandoned Waste Treatment
A lot of waste was left abandoned after failing to be properly treated by waste-related businesses
that went bankrupt during the financial crisis in 1998. As of the end of 2011, 3,057,000 tons
of abandoned waste was generated from a total of 970 businesses. Among this, about 96%,
or 2,937,000 tons of waste, were treated through the polluter pays principle or administrative
measures as of the end of 2011, and about 90,000 tons of abandoned waste from 16 businesses
across the country remain untreated.
Against this background, on February 8, 1999, the government introduced the Abandoned
Waste Performance Bond Guarantee System, which ensures the guarantee of disposal of
abandoned waste by allowing waste treating businesses to choose either to join a mutual aide
association or to take up a performance bond insurance policy. In the case of joining a mutual
aid association, the association takes the responsibility to dispose of abandoned waste through
mutual aid projects for its members, while in the case of purchasing the insurance the supervisory
authority receives the insurance money to treat abandoned waste.
Since then, the government has made various efforts to improve the effectiveness of the
system, including expanding the scope of businesses to be subject to the performance bond
system. Recently, the costs for disposal of abandoned waste, which serve as a standard price to
calculate the performance bond deposit for abandoned waste, were raised to ensure the efficient
implementation of abandoned waste disposal, and the unit prices of for the disposal of different
types of abandoned waste, which were revised in October, 2013.
Medical Waste Management
Medical waste requires strict management and safe treatment, as it contains disease-spreading
viruses and bacteria that are highly infectious and have a high risk of secondary infections that are
difficult to treat. Currently, 148,000 tons of medical wastes are generated yearly (as of 2012), and the
amount is expected to continue to grow with the increasing elderly population, which buttresses the
need to steadily push for a policy for an efficient safety management related to medical waste.
4444ECOREA 2015 Chapter 7. Waste
While the infectious characteristics of medical waste require strict management, their efficient
management within a scope that reassures safety must not be disregarded. Thus, it has been
necessary to create an efficient management system and alleviate the burden of the discharging
party (e.g., hospitals), while reinforcing safety management from discharge to the treatment of
medical waste.
To make improvements in such problematic aspects, the government has come to work to
upgrade efficiency in the use of containers dedicated to medical waste within a scope that assures
safety management, while moving to establish Radio Frequency Identification (RFID) that would
ensure real-time computerized monitoring of the discharge, collection, transport, and disposal of
medical waste. The RFID-applied tracking of waste became mandatory for the transfer of medical
waste in August 2008.
In 2008, an improvement allowed a mixed storage reflecting the properties, source, and
charateristics of medical waste so that treatment was facilitated to meet the demand from
discharging parties and treatment businesses. In 2010, standards were liberalized to create
dedicated containers in various sizes, while legal action was ensured against any person who
produced, distributed, or used dedicated containers in an illegal manner. Furthermore, in 2013,
the safety management of medical waste was intensified when specific disinfection standards and
disinfection equipment for vehicles transferring medical waste were established.
Current Policy Focus
(1) Disposable Products and Over-packaged Products
Along with the rapid growth of the national economy and increased living standards, the use
of disposables and ostentatiously over-packaged products has become common, causing a waste of
resources, generating unnecessary waste and bringing about a negative impact on the environment.
Current Policy Focus 44 4544
Accordingly, the Ministry of Environment started to act in 1994 to control the use of disposables
and over-packaged products in accordance with the Act on the Promotion of Saving and
Recycling of Resources, and currently focuses on legal regulations and voluntary agreements as it
main policies to handle these issues.
Legal Regulations
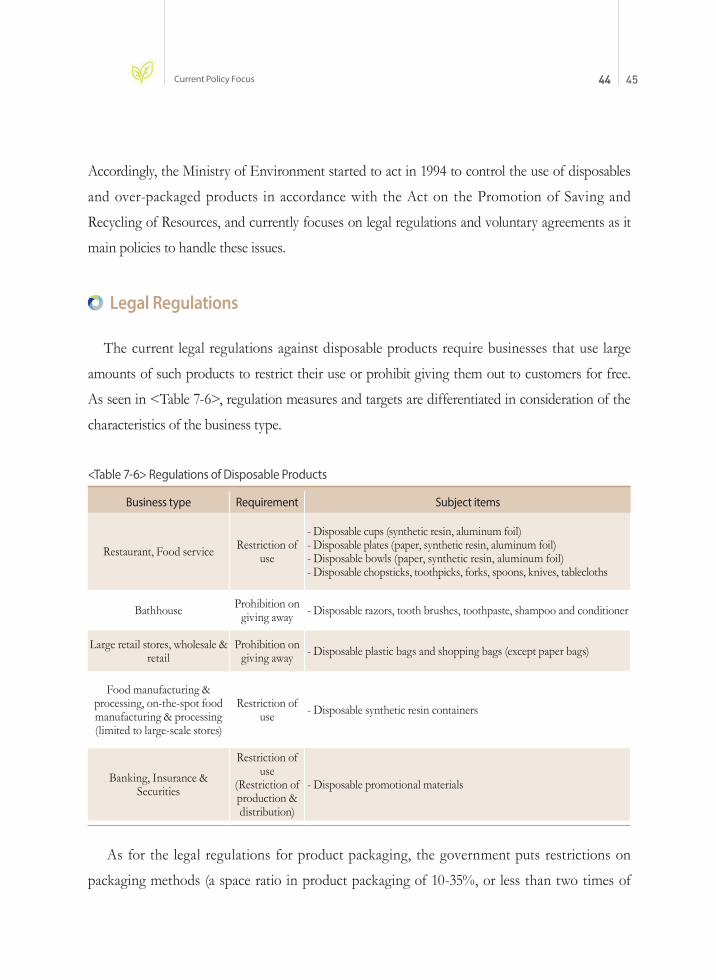
The current legal regulations against disposable products require businesses that use large
amounts of such products to restrict their use or prohibit giving them out to customers for free.
As seen in <Table 7-6>, regulation measures and targets are differentiated in consideration of the
characteristics of the business type.
<Table 7-6> Regulations of Disposable Products
Business type Requirement Subject items
Restaurant, Food service Restriction of use
- Disposable cups (synthetic resin, aluminum foil)- Disposable plates (paper, synthetic resin, aluminum foil)- Disposable bowls (paper, synthetic resin, aluminum foil)- Disposable chopsticks, toothpicks, forks, spoons, knives, tablecloths
Bathhouse Prohibition on giving away - Disposable razors, tooth brushes, toothpaste, shampoo and conditioner
Large retail stores, wholesale & retail
Prohibition on giving away - Disposable plastic bags and shopping bags (except paper bags)
Food manufacturing & processing, on-the-spot food manufacturing & processing(limited to large-scale stores)
Restriction of use - Disposable synthetic resin containers
Banking, Insurance & Securities
Restriction of use
(Restriction of production & distribution)
- Disposable promotional materials
As for the legal regulations for product packaging, the government puts restrictions on
packaging methods (a space ratio in product packaging of 10-35%, or less than two times of
46ECOREA 2015 Chapter 7. Waste
packaging) to reduce unnecessary packaging materials, as well as on packaging materials by
prohibiting the use of materials that are difficult to recycle, including PVC.
The ministry has reflected the social and cultural changes and development of technology
related to recycling and packaging to adjust regulation targets and measures. In 2008, it exempted
biodegradable resin products from the regulation on disposable products, abolished the disposable
cup deposit program and report reward system on disposable products on account of an insufficient
legal basis, and permitted the use of disposable paper cups and free paper bags for shoppers.
The ministry established the Guideline on the Restrictions of Use of Disposable Products in
order to ensure that local governments could conduct systematic checks and inspections of target
businesses, and implemented crackdowns on over-packaged products during traditional Korean
holidays like Lunar New Year’s Day and Chuseok, and school admission and graduation seasons.
Voluntary Agreement
Coffee shops and fast-food franchises are representative businesses that use large amounts
of disposable products, including disposable cups. In October 2002, Ministry of Environment
reached a voluntary agreement with 13 major coffee shops and fast-food chains in an effort to
reduce the use of disposable products. The major contents of the agreement include a reduction
of the use of disposable products, intensified collection and reuse of inevitably used disposable
cups, and offering incentives to people with reusable cups. In 2013, the agreement was renewed by
adding some clauses that included the setting up of quantitative reduction targets, press releases on
inspection results, and offering instant cash discounts to people with reusable cups.
In 2011, the Ministry concluded a voluntary agreement with five megastores to reduce the
use of disposable plastic bags and promote the use of shopping baskets, encouraging them to
use alternative materials such as shopping baskets and volume-based garbage bags and packing
containers instead of disposable plastic bags. Moreover, by entering a voluntary agreement in 2012
with two bakery franchises that were using a lot of disposable plastic bags, the ministry has been
making efforts to eliminate the practice of providing products in plastic bags unnecessarily, and to
use paper bags instead of disposable plastic bags.
Current Policy Focus 46 47
As for product packaging, the Ministry reached an agreement in 2011 with large-scale
distributors and civic groups based on the Farm Produce Green Packaging Safety Regulations to
reduce the use of accessory packaging materials such as paper bands and ribbons. In accordance
with this agreement, about 40% of the paper bands were removed from fruit gift baskets for
the Chuseok holiday in 2012. Following this move, in September 2013, the ministry expanded
the scope of the targets of the agreement to include livestock and marine products, as well
as agricultural products, increased the number of participating businesses and concluded the
“Primary Food Eco-friendly Packaging Voluntary Agreement,” which strengthened the contents
of the existing agreement, including the use of reusable packaging materials. Also, the ministry
concluded an agreement with the cosmetics industry and is implementing a pilot project to reduce
the packaging of cosmetics containers.
(2) Volume-based Food Waste Fee System
Recently, Ministry of Environment has been shifting its policy direction to restrict the
generation of food waste and has implemented a volume-based food waste fee system that imposes
fees in proportion to the amount of food waste generated. This program has been implemented
nationwide by expanding targets to include multi-unit housing starting in 2013.
A volume-based fee system has been implemented for residential waste with an aim to reduce
the amount of waste generated and promote recycling since 1994, but recycling products separately
discharged and food waste have been excluded from imposing the fees charged in the proportion
of the amount of waste generated. However, as the amount of food waste generated has been
increasing since the direct landfill of food waste was banned in 2005, people’s living standards
have improved, and the number of one- or two-person households now accounts for 48% of the
total households, there is an increasing need to reduce the amount of food waste generated. In
2012, the daily generated amount of food waste was about 13,209 tons, which makes up about
27% of the total amount of generated residential waste (48,990 tons/day).
Subsequently, the relevant ministries jointly adopted the “Comprehensive Measures for Food
48ECOREA 2015 Chapter 7. Waste
Waste Reduction” in 2010 and are promoting various measures fit for the characteristics of food
waste by the stage and source of generation. As part of the implementation measures, the volume-
based food waste fee system was implemented.
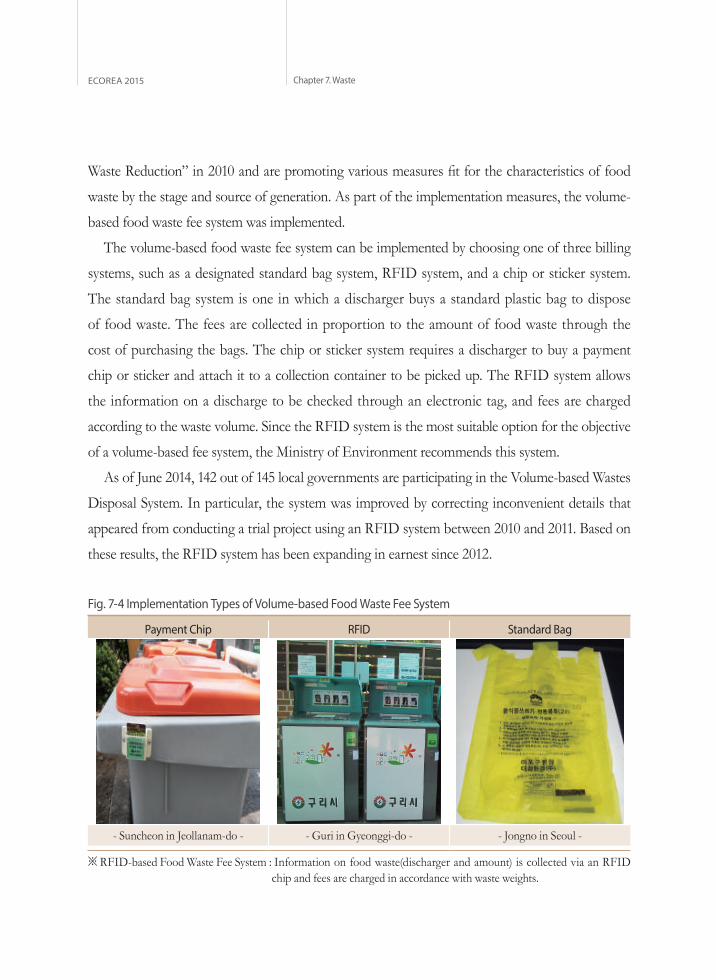
The volume-based food waste fee system can be implemented by choosing one of three billing
systems, such as a designated standard bag system, RFID system, and a chip or sticker system.
The standard bag system is one in which a discharger buys a standard plastic bag to dispose
of food waste. The fees are collected in proportion to the amount of food waste through the
cost of purchasing the bags. The chip or sticker system requires a discharger to buy a payment
chip or sticker and attach it to a collection container to be picked up. The RFID system allows
the information on a discharge to be checked through an electronic tag, and fees are charged
according to the waste volume. Since the RFID system is the most suitable option for the objective
of a volume-based fee system, the Ministry of Environment recommends this system.
As of June 2014, 142 out of 145 local governments are participating in the Volume-based Wastes
Disposal System. In particular, the system was improved by correcting inconvenient details that
appeared from conducting a trial project using an RFID system between 2010 and 2011. Based on
these results, the RFID system has been expanding in earnest since 2012.
Fig. 7-4 Implementation Types of Volume-based Food Waste Fee System
Payment Chip RFID Standard Bag
- Suncheon in Jeollanam-do - - Guri in Gyeonggi-do - - Jongno in Seoul -
※ RFID-based Food Waste Fee System : Information on food waste(discharger and amount) is collected via an RFID chip and fees are charged in accordance with waste weights.
Current Policy Focus 48 49
(3) Waste Electrical & Electronic Product Recycling Target Management System
The Waste Electrical & Electronic Product Recycling Target Management System is intended
to require manufacturers to meet certain recycling amounts by setting a per capita recycling target
rate. As it has become difficult to set clear classification standards for each item in the electrical
and electronic product markets and to make remarkable improvements in recycling through the
current item-based recycling measure, this system was introduced in January 2014.
The recycling target is a concept similar to the mandatory amount of recycling imposed on
manufacturers in the existing EPR system, but it was changed from a method to set a mandatory
recycling rate by item to a method to set a per capita target rate (kg/person) by product group.
Under the EPR system, the mandatory recycling rates of individual manufacturers are calculated
by applying market share rates to mandatory recycling rates by item, while under the Recycling
Target Management System, the per capita recycling target rate is converted to the total amount in
consideration of the population number, and the mandatory recycling target rate is set according
to the market share of each manufacturer.
The Per Capita Waste Electrical & Electronic Product Recycling Target Rate announced in
January 2014 was set at 3.9kg/capita in 2014 and 6.0kg/capita in 2018. Meanwhile, the number of
target items increased from the existing 10 to 27, and these items are classified into five groups:
large-scale equipment, telecommunication devices, medium-size equipment, small-size equipment
and cellular phones. The government plans to establish a small- and medium-sized home appliance
collection system in consideration of the discharging characteristics, weights and collection
conditions of small- and medium-sized home appliances.
50ECOREA 2015 Chapter 7. Waste
(4) Free Collection for Large-scale Household Appliances Waste
The Free Collection Service for Large-scale Household Appliances Waste is a system in which
a person can reserve to dispose of a bulky home appliance such as a TV, refrigerator, washing
machine, etc., using the Internet or via a call center, and then a task force team visits the household
to collect the item free of charge.
In the previous system, residents were required to purchase a discharge sticker (between
3,000 won and 15,000 won) from the municipal government, attach the stick to the waste home
appliance and put it outside their house to be collected. Moreover, as the collected items failed
to be delivered to recycling centers, and some core parts containing rare metals were illegally
collected to be sold or exported, such problems caused severe environmental pollution and
resource outflows. A survey showed that less than 5% of the collected waste home appliances were
transferred to recycling centers in their original state with the previous system.
Under such circumstances, the Ministry of Environment initiated a free pick-up service for
waste home appliances in Seoul as a pilot project in June 2012, and five metropolitan cities and
Gyeonggi Province participated in the program in May 2013. A total of 162,000 units of waste
home appliances were collected through the program in 2013. Compared to the collection
performance results in 2012 under the previous system, collections in 2013 increased significantly,
1.5 to 6 times by each local government. If the program succeeds, it is expected to greatly
contribute to achieving the national recycling target for electrical and electronic products. In
addition, as the recovery rate of appliances in their original forms improved remarkably, from
below 5% to over 95%, the program is expected to contribute to the circulation of rare metals.
The ministry plans to gradually expand the free pick-up service for waste electrical and electronic
products nationwide starting in 2014.
Current Policy Focus 50 51
(5) Waste-to-Energy
Korea depends on imports for 97% of its energy needs. Therefore, it is imperative that the
country comes up with methods for extending the production and distribution of new and
renewable energy. As of 2012, the ratio of total domestic primary energy to new and renewable
energy was a mere 3.18%, but the government plans to increase the portion of new and renewable
energy to 20% by 2050. The remarkable fact is that currently, over 67% of new and renewable
energy is produced from waste, and its production cost is cheaper at 10% of solar power and 66%
of wind power. Thus, energy production using waste has emerged as the method that can realize
new and renewable energy in the most effective way at an early stage.
The total production of Korea’s new and renewable energy in 2012 was 8,850,000 TOE5).
Among this, the production of renewable energy converted from waste6) was 3,220,000 TOE,
which accounts for 1.2% of primary energy and 36.4% of new and renewable energy. The largest
amount of energy was collected from residual heat from waste incineration facilities or landfill
gas. Thus, the government needs to promote a more active waste-to-energy policy to expand
its programs to include the production of Solid Refuse Fuel (SRF) using combustible waste and
establishment of SRF power plants, and electricity production and upgrading facilities using biogas
from organic waste.
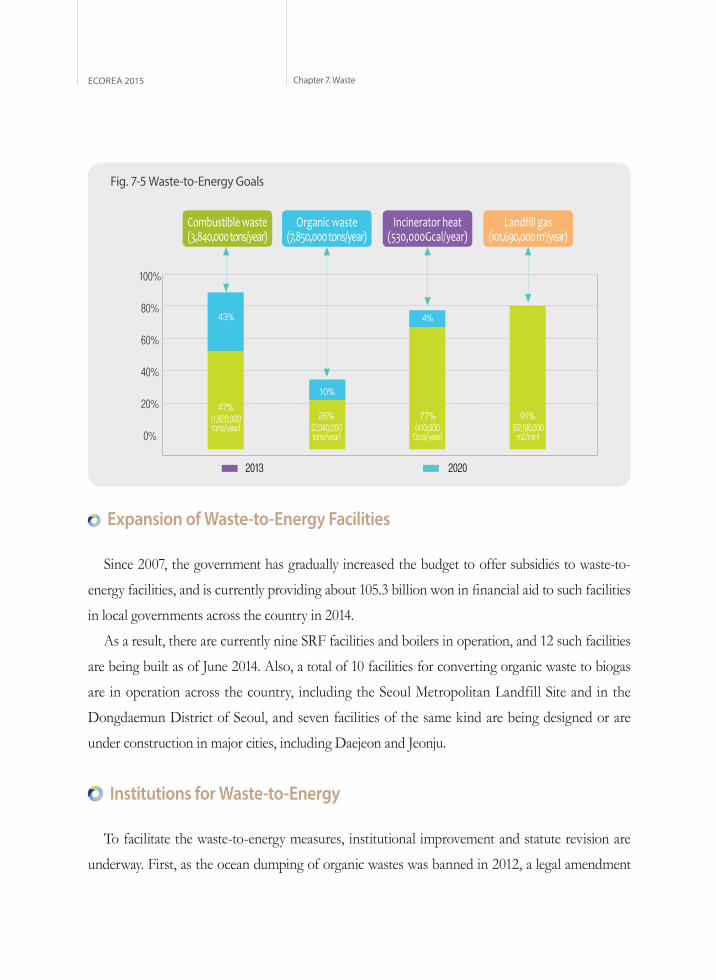
The Ministry of Environment disclosed its Measures for Waste Resource and Biomass Energy
in October 2008 and an implementation plan for the same measures in July 2009. According
to the measures, the amounts of combustible waste and organic waste are 3,840,000 tons/year
and 7,850,000 tons/year, respectively. Only 1.5% (58,000 tons/year) of combustible waste and
2% (160,000 tons/year) of organic waste are used as sources of energy. Against this background,
the ministry is pushing ahead with relevant measures to increase the percentages of recycled
inflammable and organic waste to 90% (3,450,000 tons/year) and 36% (2,830,000 tons/year),
respectively, by 2020.
5) TOE (Tonnage of Oil Equivalent)6) Waste gas excluded, biogas and landfill gas included.
5252ECOREA 2015 Chapter 7. Waste
43%
10%
4%
2013 2020
Combustible waste (3,840,000 tons/year)
Organic waste (7,850,000 tons/year)
Incinerator heat (530,000Gcal/year)
Landfill gas (101,690,000 m2/year)
100%
80%
60%
40%
20%
0%
Fig. 7-5 Waste-to-Energy Goals
(1,820,000 tons/year) (2,040,000
tons/year)
26%(410,000
Gcal/year)
77%(92,190,000 m2/min)
91%47%
Expansion of Waste-to-Energy Facilities
Since 2007, the government has gradually increased the budget to offer subsidies to waste-to-
energy facilities, and is currently providing about 105.3 billion won in financial aid to such facilities
in local governments across the country in 2014.
As a result, there are currently nine SRF facilities and boilers in operation, and 12 such facilities
are being built as of June 2014. Also, a total of 10 facilities for converting organic waste to biogas
are in operation across the country, including the Seoul Metropolitan Landfill Site and in the
Dongdaemun District of Seoul, and seven facilities of the same kind are being designed or are
under construction in major cities, including Daejeon and Jeonju.
Institutions for Waste-to-Energy
To facilitate the waste-to-energy measures, institutional improvement and statute revision are
underway. First, as the ocean dumping of organic wastes was banned in 2012, a legal amendment
Key facts and trends 52 5352
was made to ensure sewage sludge that was usually dumped into the sea could be used as fuel
at coal-fired power plant. Also, the raw materials and manufacturing methods for solid refuse
fuels became diversified through the revision of relevant laws to facilitate measures to convert
combustible waste to solid fuel. Moreover, the SRF Product Information Management System
(www.SRF-info.or.kr) has been operating since the end of 2010 to promote information exchanges
between SRF manufacturers and consumers.
Eco-friendly Energy Town
Starting in 2014, the Ministry is actively pursuing a project to create Eco-friendly Energy
Towns, which are designed to return profits to the residents by combining the production of new
and renewable energy such as waste energy and solar photovoltaic energy. The ministry developed
a project model aimed at improving the welfare and income of local residents by using waste
resources such as food waste, and livestock manure and biomass to produce energy, including heat
and electricity, or by providing or selling the gas and heat generated from landfills or incineration
facilities to the surrounding areas, and is conducting a pilot project in Hongcheon-gun, Gangwon-
do. Also, it plans to establish three Eco-friendly Energy Towns each year in the future.
Key facts and trends
(1) Waste Generation
The ministry has been conducting surveys on waste generation status by source and type,
and waste treatment status by subject and method annually, and is conducting a National Waste
Statistics Survey every 5 years.
54ECOREA 2015 Chapter 7. Waste
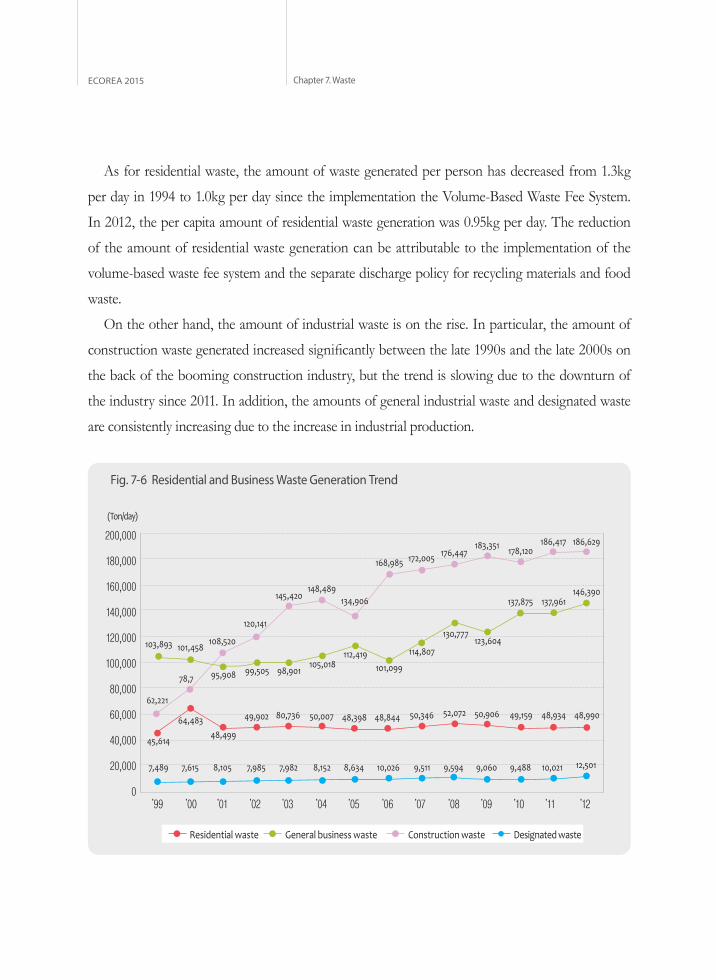
As for residential waste, the amount of waste generated per person has decreased from 1.3kg
per day in 1994 to 1.0kg per day since the implementation the Volume-Based Waste Fee System.
In 2012, the per capita amount of residential waste generation was 0.95kg per day. The reduction
of the amount of residential waste generation can be attributable to the implementation of the
volume-based waste fee system and the separate discharge policy for recycling materials and food
waste.
On the other hand, the amount of industrial waste is on the rise. In particular, the amount of
construction waste generated increased significantly between the late 1990s and the late 2000s on
the back of the booming construction industry, but the trend is slowing due to the downturn of
the industry since 2011. In addition, the amounts of general industrial waste and designated waste
are consistently increasing due to the increase in industrial production.
200,000
180,000
160,000
140,000
120,000
100,000
80,000
60,000
40,000
20,000
0’99 ’00 ’01 ’02 ’03 ’04 ’05 ’06 ’07 ’08 ’09 ’10 ’11 ’12
Residential waste General business waste Construction waste Designated waste
Fig. 7-6 Residential and Business Waste Generation Trend
(Ton/day)
7,489
45,614
62,221
78,7
108,520
120,141
145,420148,489
134,906
168,985 172,005 176,447183,351 178,120
186,417 186,629
101,458
95,908 99,505 98,901105,018
112,419101,099
114,807
130,777123,604
137,875 137,961146,390
103,893
64,48348,499
49,902 80,736 50,007 48,398 48,844 50,346 52,072 50,906 49,159 48,934 48,990
7,615 8,105 7,985 7,982 8,152 8,634 10,026 9,511 9,594 9,060 9,488 10,021 12,501
Key facts and trends 54 55
(2) Waste Treatment
With regard to treatment methods for waste, including residential and business wastes, 10.3%
of waste was buried, 6.3% incinerated, 82.4% recycled and 1.0% discharged into the sea. Although
the percentages of waste treated by incineration or recycled have been increasing annually, the rates
of waste treated by landfill and ocean dumping have been decreasing. In particular, the reduction
of waste discharged into the sea indicates that the ocean dumping of sewage sludge, food waste
leachates, and livestock wastewater was banned in 2012-2013 as the 1996 protocol to the London
Convention7) took effect, and the treatment methods for these types of waste are being changed to
incineration or recycling.
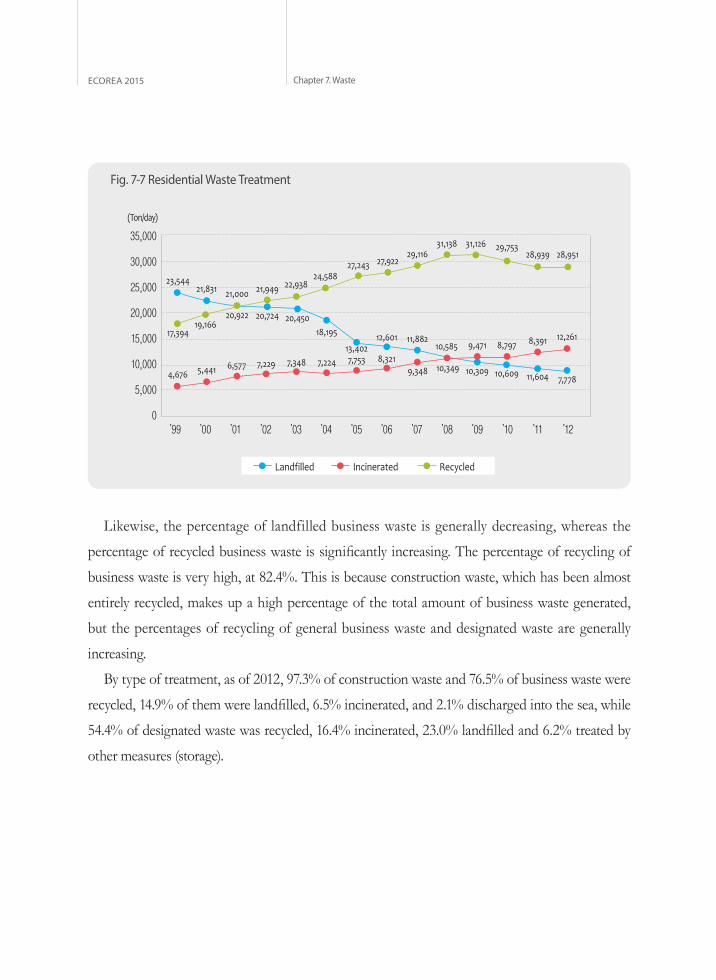
When considering the trend of residential waste treatment between 1999 and 2012, seen
in <Figure 7-7>, the percentage of waste that is landfilled has steadily decreased, whereas the
percentages of waste incinerated or recycled have increased. These results show that waste
treatment measures are shifting from a simple landfill-based treatment to a resource circulation
type, creating a virtuous circle of waste resources on the back of the volume-based waste fee
system, promoting recycling and waste-to-energy efforts, etc. Meanwhile, the percentage of
recycled waste has been decreasing since 2010, which implies waste that was simply recycled in the
past is being converted into energy in accordance with the waste-to-energy policy.
7) London Convention on the Prevention of Marine Pollution by Dumping of Wastes and Other Matter (1972)
56ECOREA 2015 Chapter 7. Waste
35,000
30,000
25,000
20,000
15,000
10,000
5,000
0
’99 ’00 ’01 ’02 ’03 ’04 ’05 ’06 ’07 ’08 ’09 ’10 ’11 ’12
Incinerated RecycledLandfilled
(Ton/day)
Fig. 7-7 Residential Waste Treatment
4,676
17,394
23,54421,831 21,000
20,724 20,45018,195
13,40212,601 11,882
10,585
10,309 10,609 11,604 7,778
19,16620,922
21,949 22,93824,588
27,243 27,92229,116
31,138 31,126 29,75328,939 28,951
5,441 6,577 7,229 7,348 7,224 7,753 8,3219,348 10,349
9,471 8,797 8,391 12,261
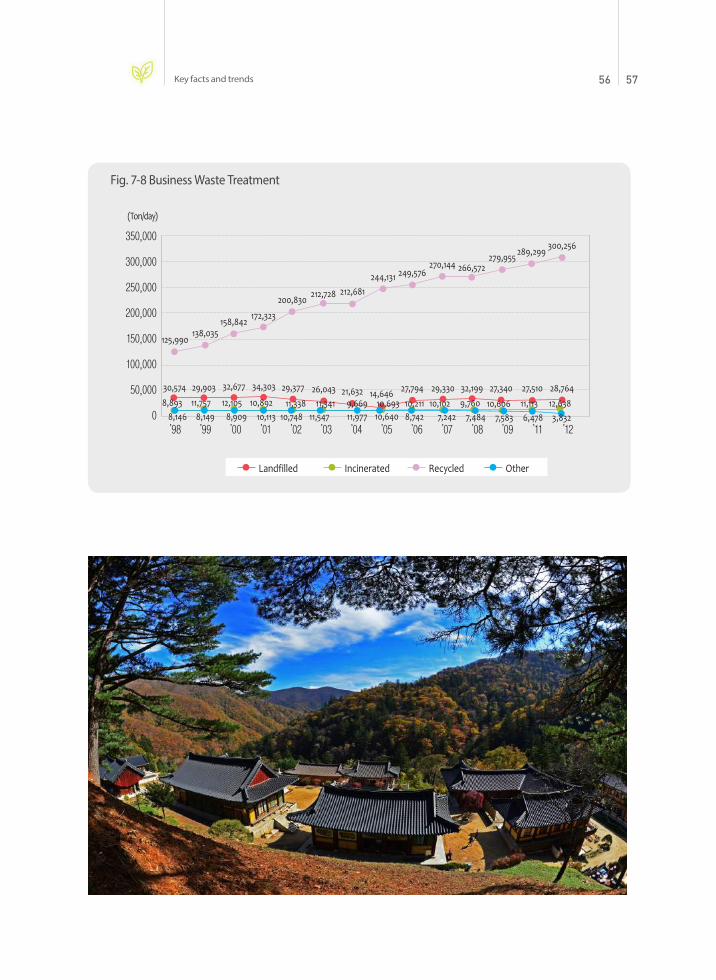
Likewise, the percentage of landfilled business waste is generally decreasing, whereas the
percentage of recycled business waste is significantly increasing. The percentage of recycling of
business waste is very high, at 82.4%. This is because construction waste, which has been almost
entirely recycled, makes up a high percentage of the total amount of business waste generated,
but the percentages of recycling of general business waste and designated waste are generally
increasing.
By type of treatment, as of 2012, 97.3% of construction waste and 76.5% of business waste were
recycled, 14.9% of them were landfilled, 6.5% incinerated, and 2.1% discharged into the sea, while
54.4% of designated waste was recycled, 16.4% incinerated, 23.0% landfilled and 6.2% treated by
other measures (storage).
Key facts and trends 56 57
350,000
300,000
250,000
200,000
150,000
100,000
50,000
0
’98 ’99 ’00 ’01 ’02 ’03 ’04 ’05 ’06 ’07 ’08 ’09 ’11 ’12
Landfilled Incinerated OtherRecycled
(Ton/day)
Fig. 7-8 Business Waste Treatment
125,990
30,574
8,8938,146 8,149 8,909
11,757 12,105 10,892 11,338 11,341 9,669 10,693 10,211 10,102 9,760 10,606 11,113 12,6387,242 7,484 7,583 6,478 3,8328,74210,64011,97711,54710,113 10,748
29,903 32,677 34,303 29,377 26,043 21,632 14,646 27,794 29,330 32,199 27,340 27,510 28,764
138,035158,842
172,323
200,830212,728 212,681
244,131 249,576270,144 266,572
279,955 289,299300,256
Copyright © 2022 FDOKUMEN

