


Bahasa
Halaman
Hukum

California Polytechnic State University
Aerospace Engineering Department
San Luis Obispo, CA
Senior Project
Thermal Analysis of the CubeSat CP3 Satellite
Jonas Friedel and Sean McKibbon
6/7/2011
Due to inconsistencies found in the on-orbit thermal data from the CubeSat CP3 satellite between 2007 and 2011, further analysis is performed on a larger number of data from August 2010 through April 2011, aiming to find an explanation for the overall increasing measured temperatures and shortening peak periods. Therefore, the satellite power data as well as orbital anomalies are analyzed leading to the conclusion that the satellite was temporarily (January – March 2011) orbiting with significantly increased sun exposure causing the higher temperatures. The shortened temperature peak periods are explained by alternating albedo values as the main influence in temperature changes. Typical thermal coefficients for anodized aluminum of the non-solar cell area of the spacecraft are found by performing basic thermal calculations using the critical temperature data.
brought to you by COREView metadata, citation and similar papers at core.ac.uk
provided by DigitalCommons@CalPoly
“Thermal Analysis of the CubeSat CP3 Satellite“ Jonas Friedel and Sean McKibbon
1
Table of Contents 1 Introduction ..................................................................................................................................... 2
2 CP3 temperature data evaluation ................................................................................................... 2
2.1 Initial comparison of 2007 and 2011 temperature data ......................................................... 2
2.2 Further investigation of 2010 and 2011 temperature data .................................................... 3
3 Power data analysis ....................................................................................................................... 11
3.1 Internal component voltage analysis .................................................................................... 11
3.2 Solar panel voltage analysis .................................................................................................. 12
4 Explaining the temperature data development ............................................................................ 14
4.1 Influence of satellite orbit ..................................................................................................... 14
4.2 Influence of albedo values .................................................................................................... 14
4.3 Influence of thermal coefficients .......................................................................................... 15
4.4 Potential explanation for data anomalies ............................................................................. 15
5 Conclusion ..................................................................................................................................... 18
Sources .................................................................................................................................................. 19
Table of Figures ..................................................................................................................................... 19
Table of Tables....................................................................................................................................... 19
Appendix ................................................................................................................................................ 20
“Thermal Analysis of the CubeSat CP3 Satellite“ Jonas Friedel and Sean McKibbon
2
1 Introduction CP3 is a 10 cm cubic satellite built at Cal Poly San Luis Obispo and was launched on April 17th, 2007. It
was launched into an orbit with an inclination of 97.9 degrees and a period of 99.14 minutes. Using
the collected temperature and power data, valuable information can be obtained about the health
status and the orbital characteristics of the satellite. Once the satellite is on orbit, this information is
the only index for explanations when it comes to anomalies of the received data.
2 CP3 temperature data evaluation
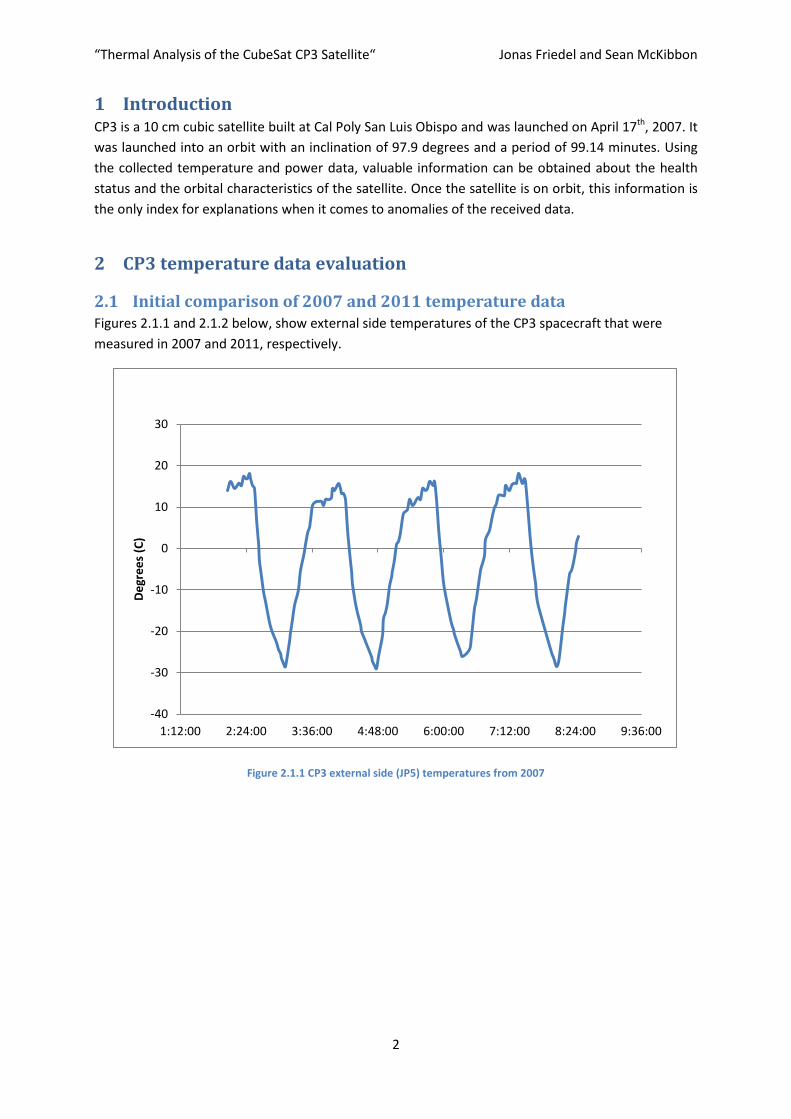
2.1 Initial comparison of 2007 and 2011 temperature data Figures 2.1.1 and 2.1.2 below, show external side temperatures of the CP3 spacecraft that were
measured in 2007 and 2011, respectively.
Figure 2.1.1 CP3 external side (JP5) temperatures from 2007
-40
-30
-20
-10
0
10
20
30
1:12:00 2:24:00 3:36:00 4:48:00 6:00:00 7:12:00 8:24:00 9:36:00
De
gre
es
(C)
“Thermal Analysis of the CubeSat CP3 Satellite“ Jonas Friedel and Sean McKibbon
3
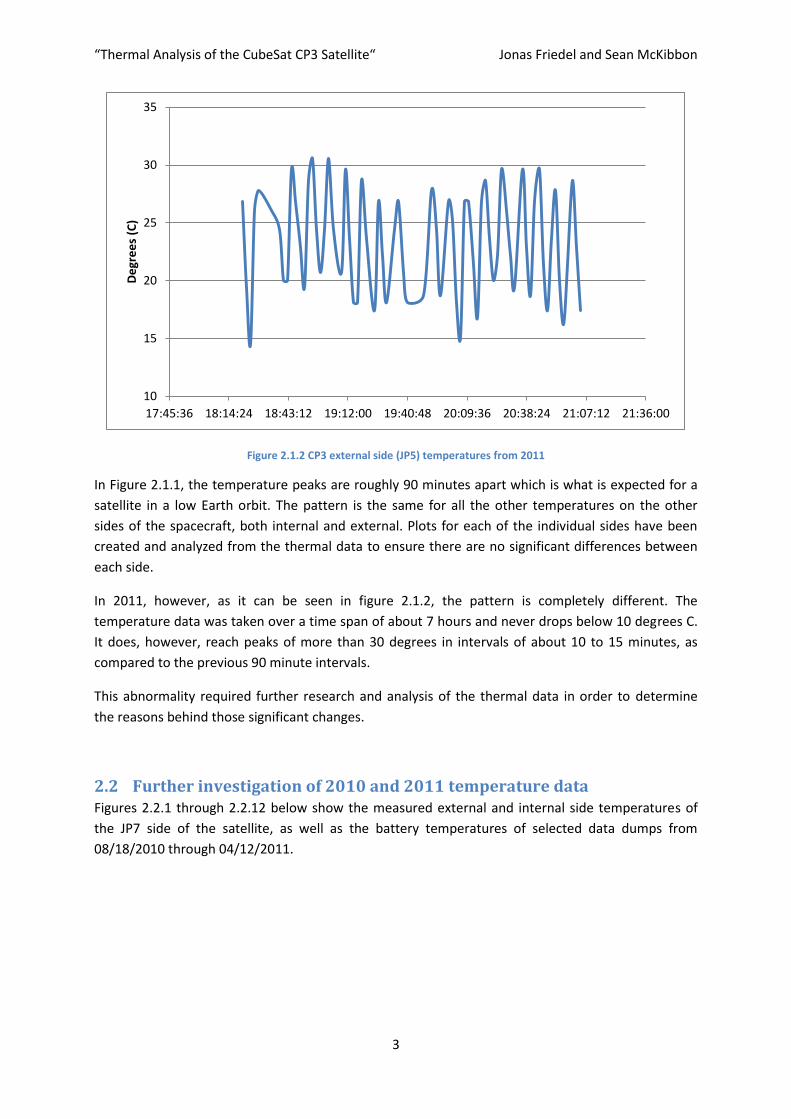
Figure 2.1.2 CP3 external side (JP5) temperatures from 2011
In Figure 2.1.1, the temperature peaks are roughly 90 minutes apart which is what is expected for a
satellite in a low Earth orbit. The pattern is the same for all the other temperatures on the other
sides of the spacecraft, both internal and external. Plots for each of the individual sides have been
created and analyzed from the thermal data to ensure there are no significant differences between
each side.
In 2011, however, as it can be seen in figure 2.1.2, the pattern is completely different. The
temperature data was taken over a time span of about 7 hours and never drops below 10 degrees C.
It does, however, reach peaks of more than 30 degrees in intervals of about 10 to 15 minutes, as
compared to the previous 90 minute intervals.
This abnormality required further research and analysis of the thermal data in order to determine
the reasons behind those significant changes.
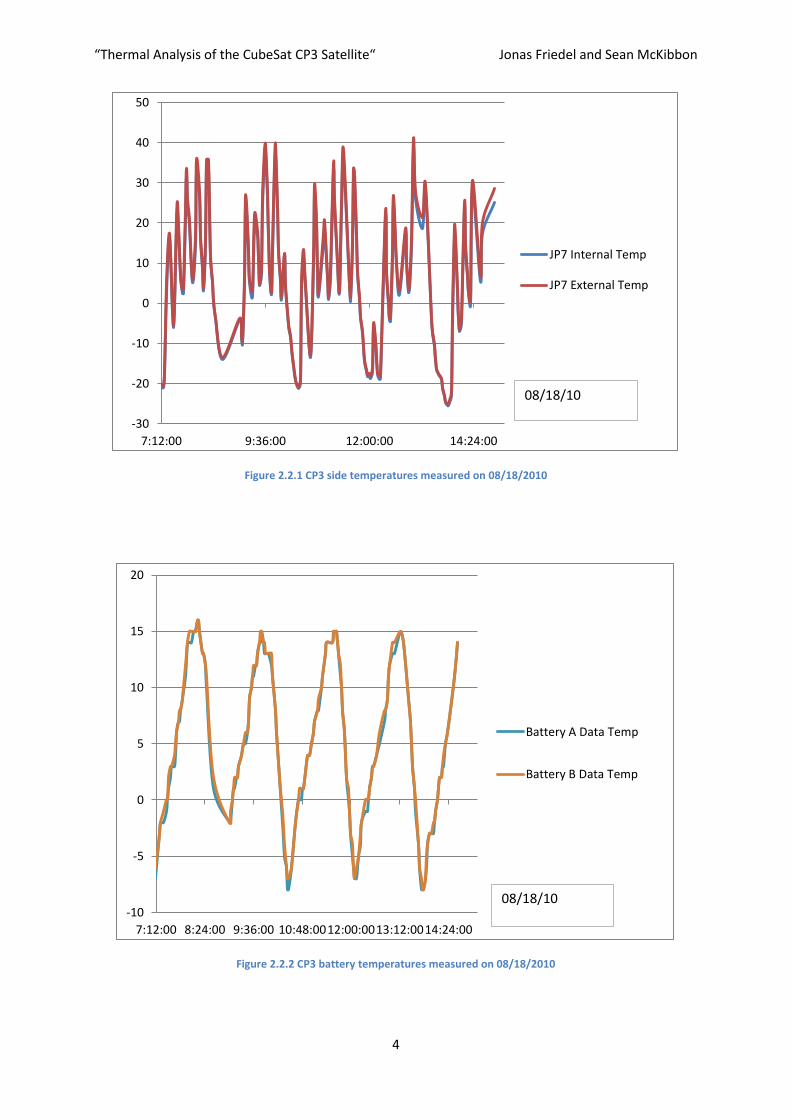
2.2 Further investigation of 2010 and 2011 temperature data Figures 2.2.1 through 2.2.12 below show the measured external and internal side temperatures of
the JP7 side of the satellite, as well as the battery temperatures of selected data dumps from
08/18/2010 through 04/12/2011.
10
15
20
25
30
35
17:45:36 18:14:24 18:43:12 19:12:00 19:40:48 20:09:36 20:38:24 21:07:12 21:36:00
De
gre
es
(C)
“Thermal Analysis of the CubeSat CP3 Satellite“ Jonas Friedel and Sean McKibbon
4
Figure 2.2.1 CP3 side temperatures measured on 08/18/2010
Figure 2.2.2 CP3 battery temperatures measured on 08/18/2010
-30
-20
-10
0
10
20
30
40
50
7:12:00 9:36:00 12:00:00 14:24:00
JP7 Internal Temp
JP7 External Temp
08/18/10
-10
-5
0
5
10
15
20
7:12:00 8:24:00 9:36:00 10:48:0012:00:0013:12:0014:24:00
Battery A Data Temp
Battery B Data Temp
08/18/10
“Thermal Analysis of the CubeSat CP3 Satellite“ Jonas Friedel and Sean McKibbon
5
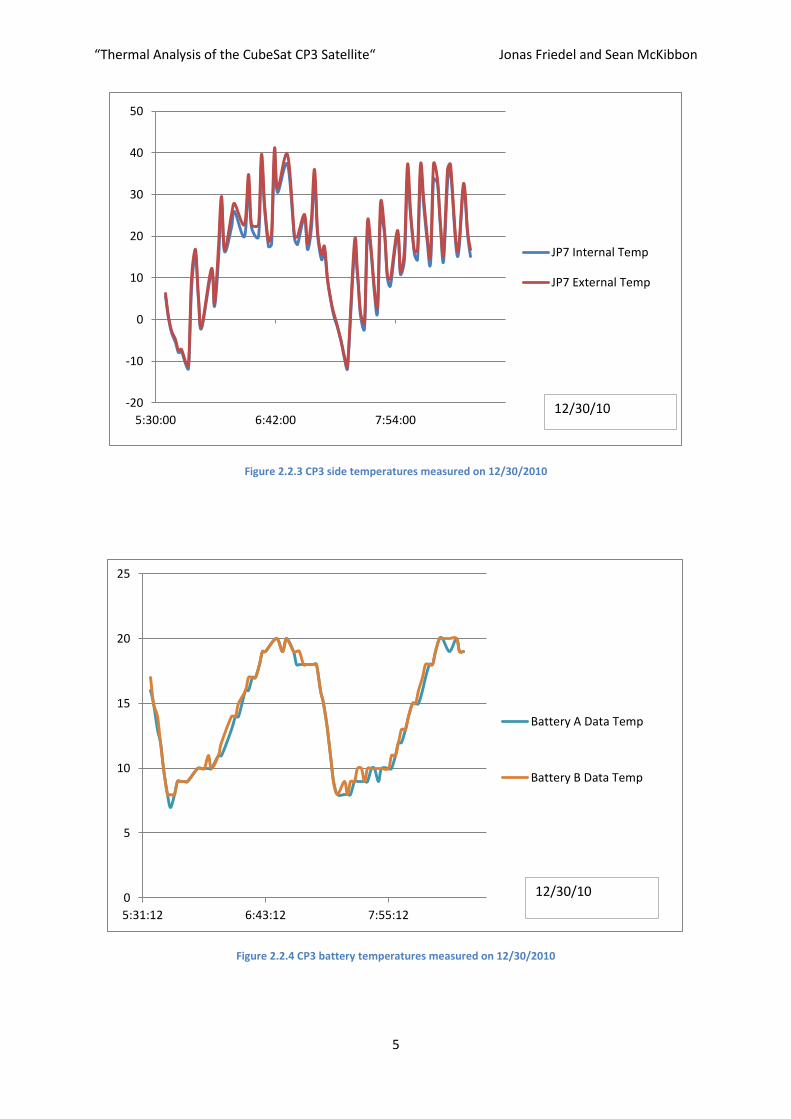
Figure 2.2.3 CP3 side temperatures measured on 12/30/2010
Figure 2.2.4 CP3 battery temperatures measured on 12/30/2010
-20
-10
0
10
20
30
40
50
5:30:00 6:42:00 7:54:00
JP7 Internal Temp
JP7 External Temp
12/30/10
0
5
10
15
20
25
5:31:12 6:43:12 7:55:12
Battery A Data Temp
Battery B Data Temp
12/30/10
“Thermal Analysis of the CubeSat CP3 Satellite“ Jonas Friedel and Sean McKibbon
6
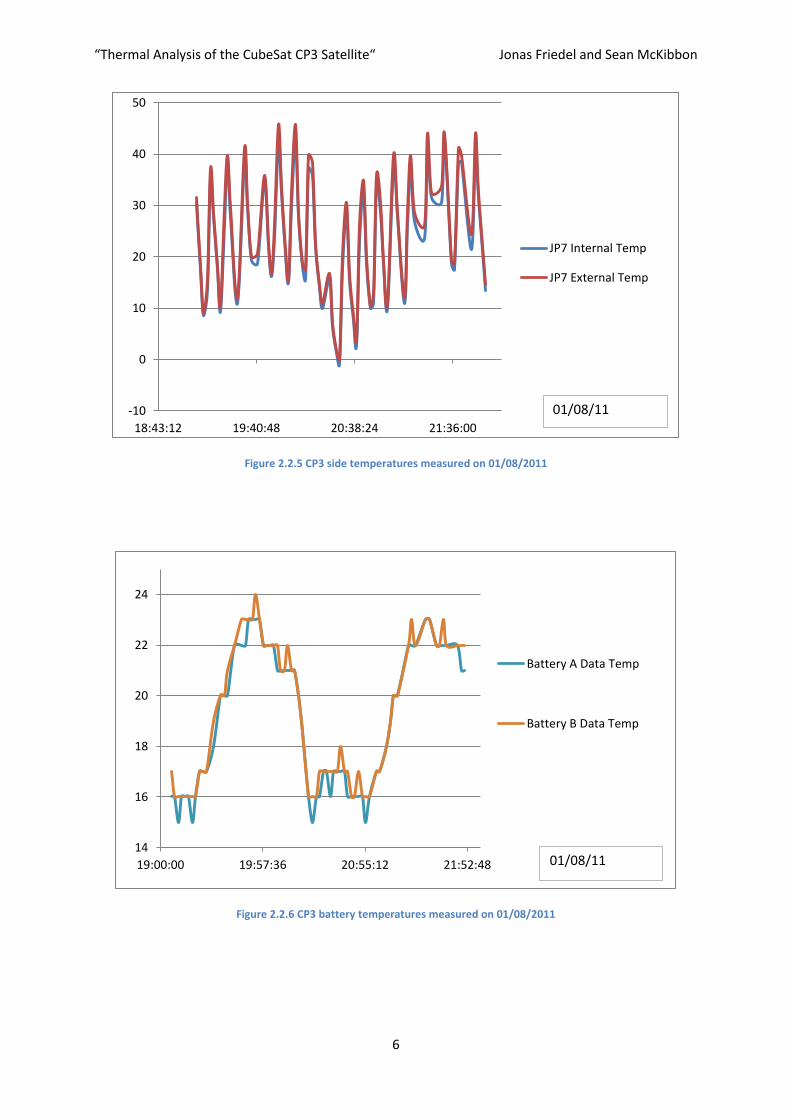
Figure 2.2.5 CP3 side temperatures measured on 01/08/2011
Figure 2.2.6 CP3 battery temperatures measured on 01/08/2011
-10
0
10
20
30
40
50
18:43:12 19:40:48 20:38:24 21:36:00
JP7 Internal Temp
JP7 External Temp
01/08/11
14
16
18
20
22
24
19:00:00 19:57:36 20:55:12 21:52:48
Battery A Data Temp
Battery B Data Temp
01/08/11
“Thermal Analysis of the CubeSat CP3 Satellite“ Jonas Friedel and Sean McKibbon
7
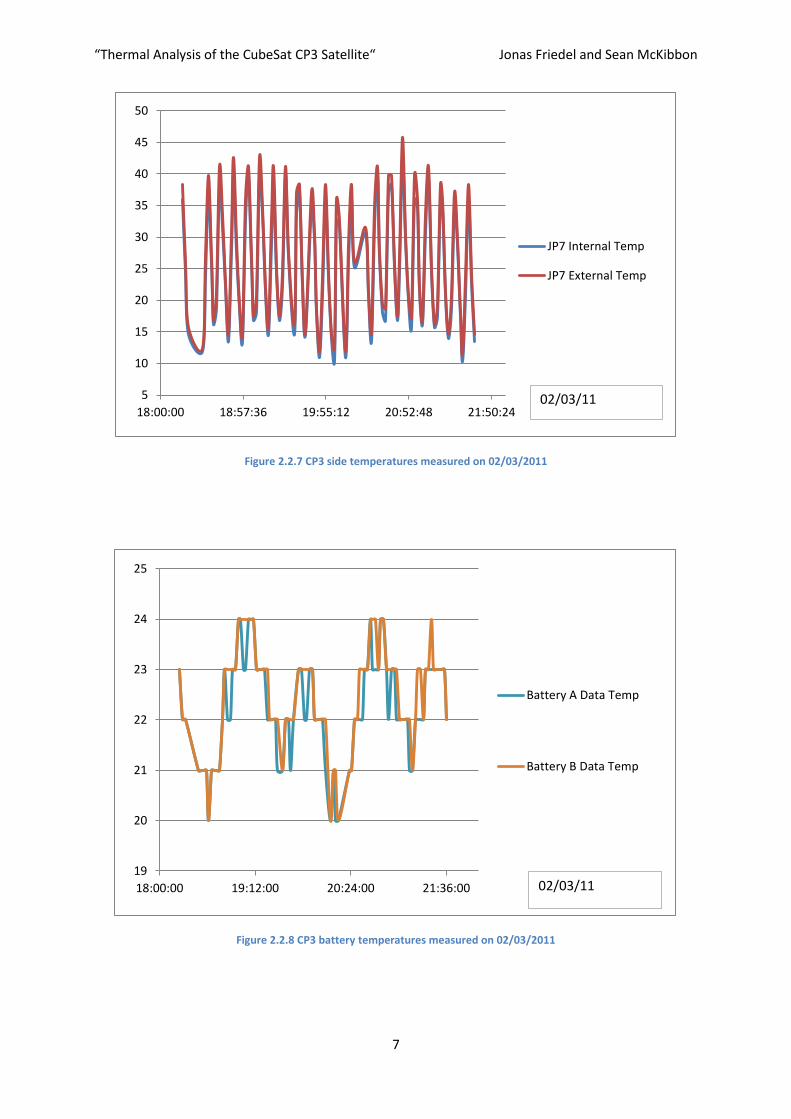
Figure 2.2.7 CP3 side temperatures measured on 02/03/2011
Figure 2.2.8 CP3 battery temperatures measured on 02/03/2011
5
10
15
20
25
30
35
40
45
50
18:00:00 18:57:36 19:55:12 20:52:48 21:50:24
JP7 Internal Temp
JP7 External Temp
02/03/11
19
20
21
22
23
24
25
18:00:00 19:12:00 20:24:00 21:36:00
Battery A Data Temp
Battery B Data Temp
02/03/11
“Thermal Analysis of the CubeSat CP3 Satellite“ Jonas Friedel and Sean McKibbon
8
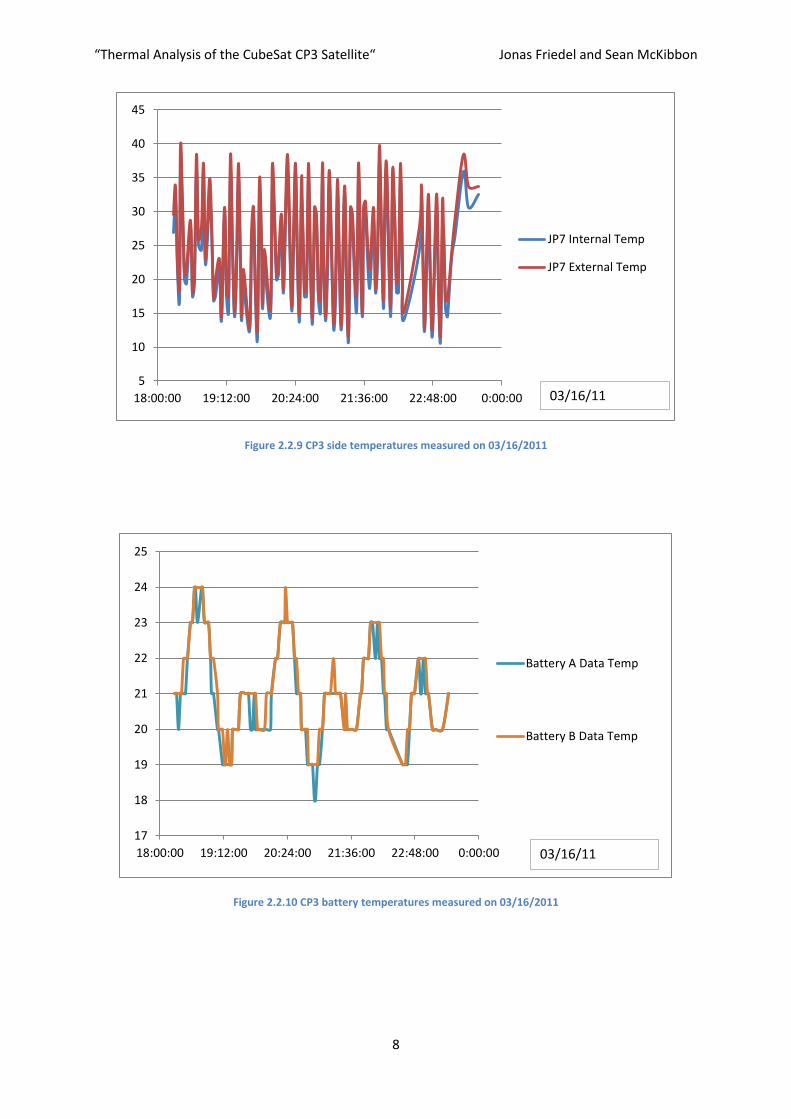
Figure 2.2.9 CP3 side temperatures measured on 03/16/2011
Figure 2.2.10 CP3 battery temperatures measured on 03/16/2011
5
10
15
20
25
30
35
40
45
18:00:00 19:12:00 20:24:00 21:36:00 22:48:00 0:00:00
JP7 Internal Temp
JP7 External Temp
03/16/11
17
18
19
20
21
22
23
24
25
18:00:00 19:12:00 20:24:00 21:36:00 22:48:00 0:00:00
Battery A Data Temp
Battery B Data Temp
03/16/11
“Thermal Analysis of the CubeSat CP3 Satellite“ Jonas Friedel and Sean McKibbon
9
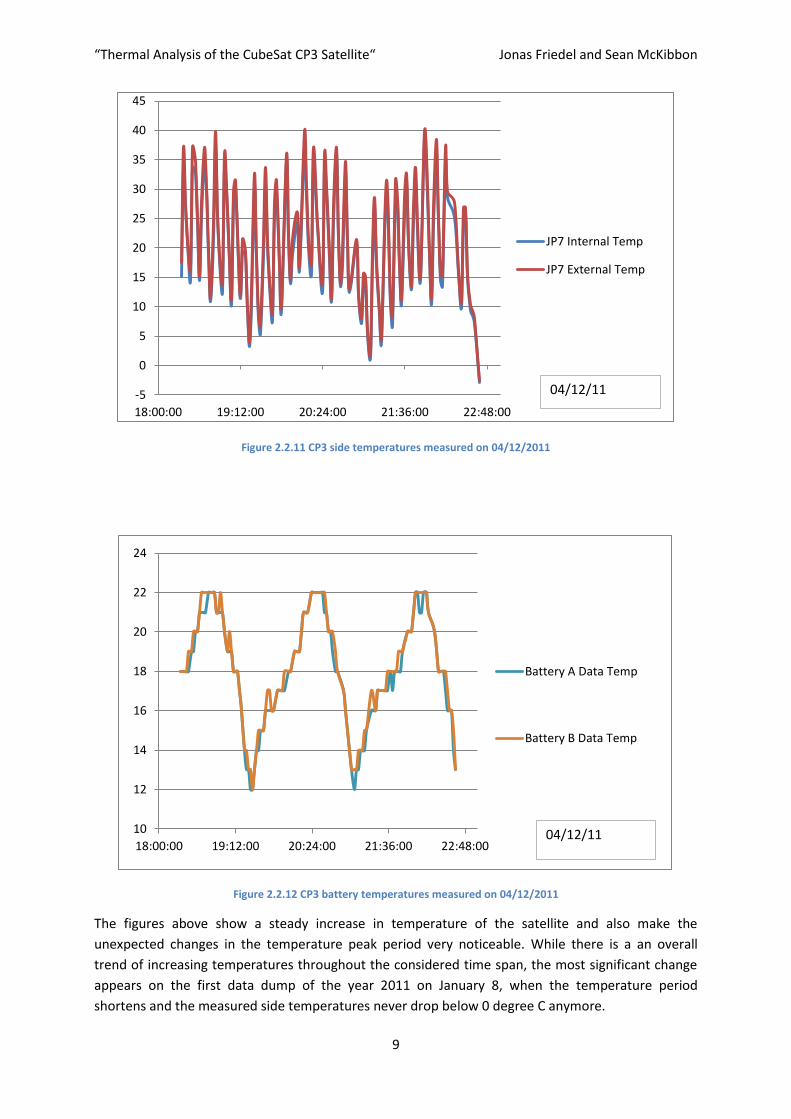
Figure 2.2.11 CP3 side temperatures measured on 04/12/2011
Figure 2.2.12 CP3 battery temperatures measured on 04/12/2011
The figures above show a steady increase in temperature of the satellite and also make the
unexpected changes in the temperature peak period very noticeable. While there is a an overall
trend of increasing temperatures throughout the considered time span, the most significant change
appears on the first data dump of the year 2011 on January 8, when the temperature period
shortens and the measured side temperatures never drop below 0 degree C anymore.
-5
0
5
10
15
20
25
30
35
40
45
18:00:00 19:12:00 20:24:00 21:36:00 22:48:00
JP7 Internal Temp
JP7 External Temp
04/12/11
10
12
14
16
18
20
22
24
18:00:00 19:12:00 20:24:00 21:36:00 22:48:00
Battery A Data Temp
Battery B Data Temp
04/12/11
“Thermal Analysis of the CubeSat CP3 Satellite“ Jonas Friedel and Sean McKibbon
10
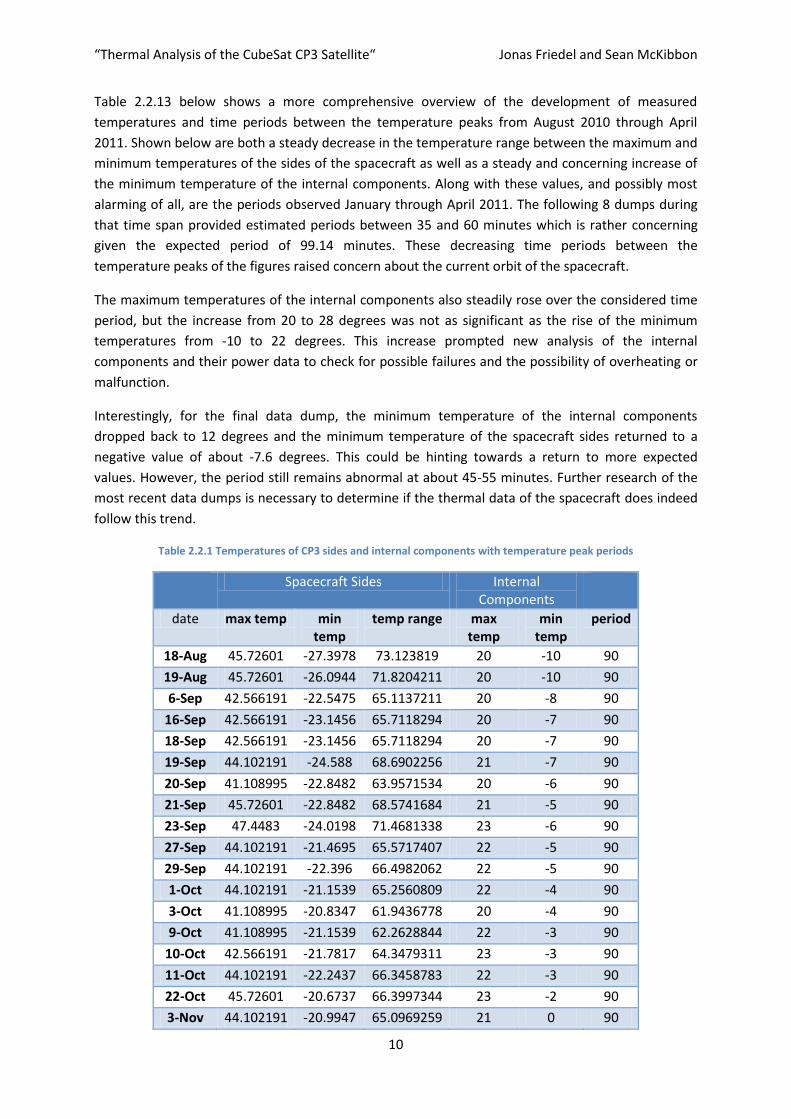
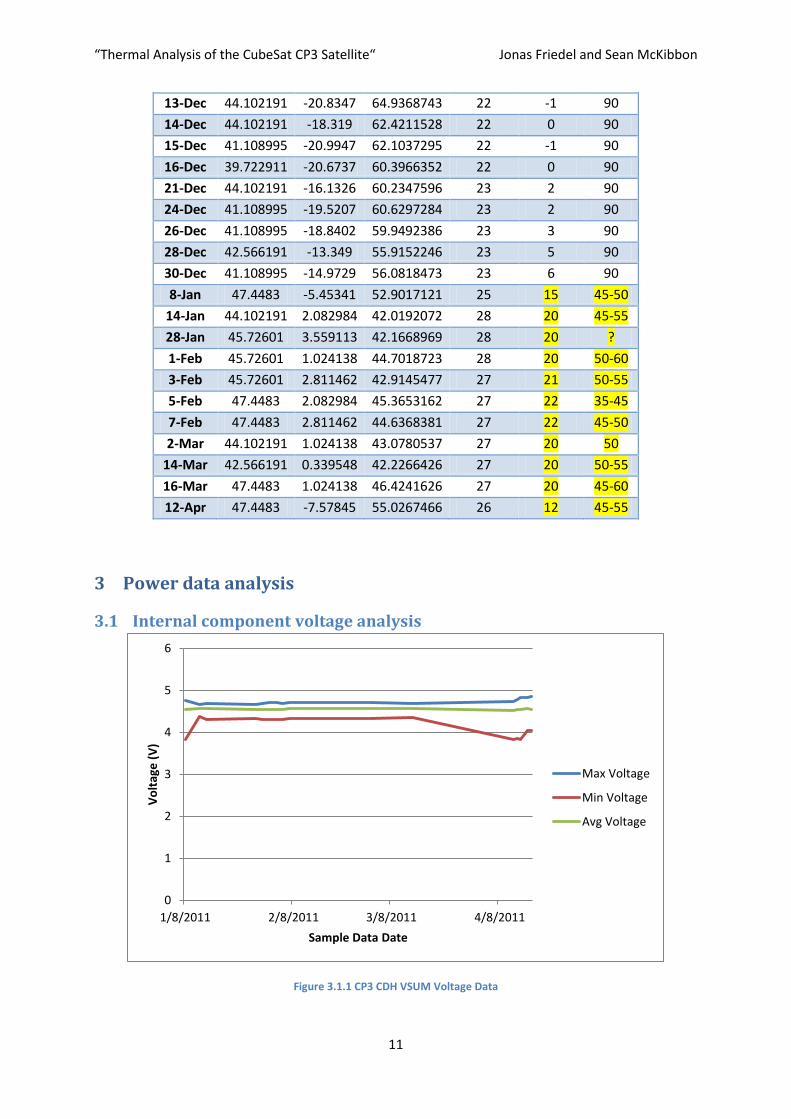
Table 2.2.13 below shows a more comprehensive overview of the development of measured
temperatures and time periods between the temperature peaks from August 2010 through April
2011. Shown below are both a steady decrease in the temperature range between the maximum and
minimum temperatures of the sides of the spacecraft as well as a steady and concerning increase of
the minimum temperature of the internal components. Along with these values, and possibly most
alarming of all, are the periods observed January through April 2011. The following 8 dumps during
that time span provided estimated periods between 35 and 60 minutes which is rather concerning
given the expected period of 99.14 minutes. These decreasing time periods between the
temperature peaks of the figures raised concern about the current orbit of the spacecraft.
The maximum temperatures of the internal components also steadily rose over the considered time
period, but the increase from 20 to 28 degrees was not as significant as the rise of the minimum
temperatures from -10 to 22 degrees. This increase prompted new analysis of the internal
components and their power data to check for possible failures and the possibility of overheating or
malfunction.
Interestingly, for the final data dump, the minimum temperature of the internal components
dropped back to 12 degrees and the minimum temperature of the spacecraft sides returned to a
negative value of about -7.6 degrees. This could be hinting towards a return to more expected
values. However, the period still remains abnormal at about 45-55 minutes. Further research of the
most recent data dumps is necessary to determine if the thermal data of the spacecraft does indeed
follow this trend.
Table 2.2.1 Temperatures of CP3 sides and internal components with temperature peak periods
Spacecraft Sides Internal Components
date max temp min temp
temp range max temp
min temp
period
18-Aug 45.72601 -27.3978 73.123819 20 -10 90
19-Aug 45.72601 -26.0944 71.8204211 20 -10 90
6-Sep 42.566191 -22.5475 65.1137211 20 -8 90
16-Sep 42.566191 -23.1456 65.7118294 20 -7 90
18-Sep 42.566191 -23.1456 65.7118294 20 -7 90
19-Sep 44.102191 -24.588 68.6902256 21 -7 90
20-Sep 41.108995 -22.8482 63.9571534 20 -6 90
21-Sep 45.72601 -22.8482 68.5741684 21 -5 90
23-Sep 47.4483 -24.0198 71.4681338 23 -6 90
27-Sep 44.102191 -21.4695 65.5717407 22 -5 90
29-Sep 44.102191 -22.396 66.4982062 22 -5 90
1-Oct 44.102191 -21.1539 65.2560809 22 -4 90
3-Oct 41.108995 -20.8347 61.9436778 20 -4 90
9-Oct 41.108995 -21.1539 62.2628844 22 -3 90
10-Oct 42.566191 -21.7817 64.3479311 23 -3 90
11-Oct 44.102191 -22.2437 66.3458783 22 -3 90
22-Oct 45.72601 -20.6737 66.3997344 23 -2 90
3-Nov 44.102191 -20.9947 65.0969259 21 0 90
“Thermal Analysis of the CubeSat CP3 Satellite“ Jonas Friedel and Sean McKibbon
11
13-Dec 44.102191 -20.8347 64.9368743 22 -1 90
14-Dec 44.102191 -18.319 62.4211528 22 0 90
15-Dec 41.108995 -20.9947 62.1037295 22 -1 90
16-Dec 39.722911 -20.6737 60.3966352 22 0 90
21-Dec 44.102191 -16.1326 60.2347596 23 2 90
24-Dec 41.108995 -19.5207 60.6297284 23 2 90
26-Dec 41.108995 -18.8402 59.9492386 23 3 90
28-Dec 42.566191 -13.349 55.9152246 23 5 90
30-Dec 41.108995 -14.9729 56.0818473 23 6 90
8-Jan 47.4483 -5.45341 52.9017121 25 15 45-50
14-Jan 44.102191 2.082984 42.0192072 28 20 45-55
28-Jan 45.72601 3.559113 42.1668969 28 20 ?
1-Feb 45.72601 1.024138 44.7018723 28 20 50-60
3-Feb 45.72601 2.811462 42.9145477 27 21 50-55
5-Feb 47.4483 2.082984 45.3653162 27 22 35-45
7-Feb 47.4483 2.811462 44.6368381 27 22 45-50
2-Mar 44.102191 1.024138 43.0780537 27 20 50
14-Mar 42.566191 0.339548 42.2266426 27 20 50-55
16-Mar 47.4483 1.024138 46.4241626 27 20 45-60
12-Apr 47.4483 -7.57845 55.0267466 26 12 45-55
3 Power data analysis
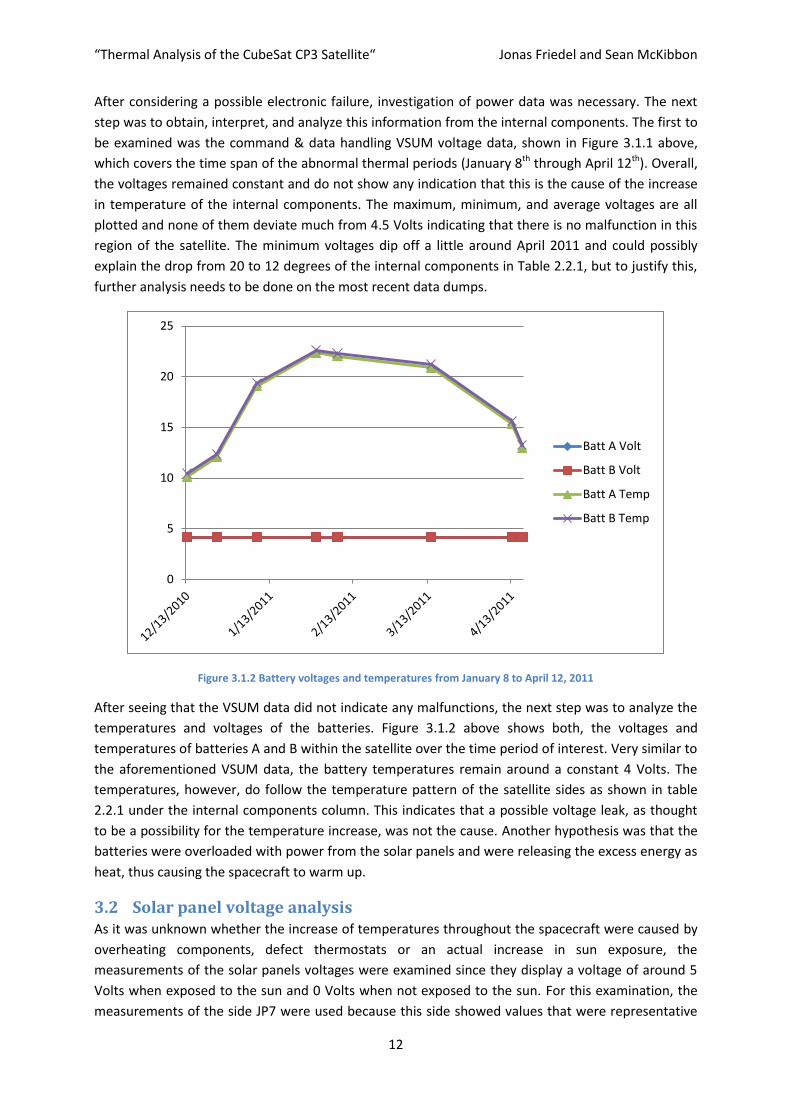
3.1 Internal component voltage analysis
Figure 3.1.1 CP3 CDH VSUM Voltage Data
0
1
2
3
4
5
6
1/8/2011 2/8/2011 3/8/2011 4/8/2011
Vo
ltag
e (
V)
Sample Data Date
Max Voltage
Min Voltage
Avg Voltage
“Thermal Analysis of the CubeSat CP3 Satellite“ Jonas Friedel and Sean McKibbon
12
After considering a possible electronic failure, investigation of power data was necessary. The next
step was to obtain, interpret, and analyze this information from the internal components. The first to
be examined was the command & data handling VSUM voltage data, shown in Figure 3.1.1 above,
which covers the time span of the abnormal thermal periods (January 8th through April 12th). Overall,
the voltages remained constant and do not show any indication that this is the cause of the increase
in temperature of the internal components. The maximum, minimum, and average voltages are all
plotted and none of them deviate much from 4.5 Volts indicating that there is no malfunction in this
region of the satellite. The minimum voltages dip off a little around April 2011 and could possibly
explain the drop from 20 to 12 degrees of the internal components in Table 2.2.1, but to justify this,
further analysis needs to be done on the most recent data dumps.
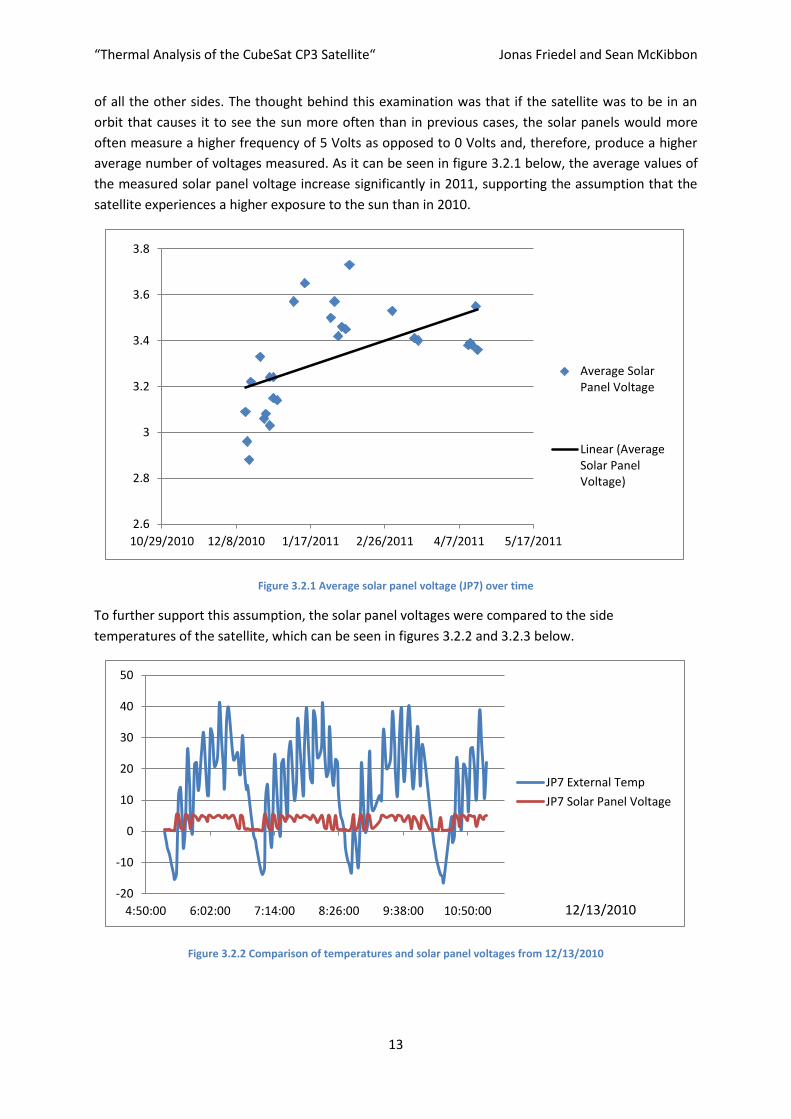
Figure 3.1.2 Battery voltages and temperatures from January 8 to April 12, 2011
After seeing that the VSUM data did not indicate any malfunctions, the next step was to analyze the
temperatures and voltages of the batteries. Figure 3.1.2 above shows both, the voltages and
temperatures of batteries A and B within the satellite over the time period of interest. Very similar to
the aforementioned VSUM data, the battery temperatures remain around a constant 4 Volts. The
temperatures, however, do follow the temperature pattern of the satellite sides as shown in table
2.2.1 under the internal components column. This indicates that a possible voltage leak, as thought
to be a possibility for the temperature increase, was not the cause. Another hypothesis was that the
batteries were overloaded with power from the solar panels and were releasing the excess energy as
heat, thus causing the spacecraft to warm up.
3.2 Solar panel voltage analysis As it was unknown whether the increase of temperatures throughout the spacecraft were caused by
overheating components, defect thermostats or an actual increase in sun exposure, the
measurements of the solar panels voltages were examined since they display a voltage of around 5
Volts when exposed to the sun and 0 Volts when not exposed to the sun. For this examination, the
measurements of the side JP7 were used because this side showed values that were representative
0
5
10
15
20
25
Batt A Volt
Batt B Volt
Batt A Temp
Batt B Temp
“Thermal Analysis of the CubeSat CP3 Satellite“ Jonas Friedel and Sean McKibbon
13
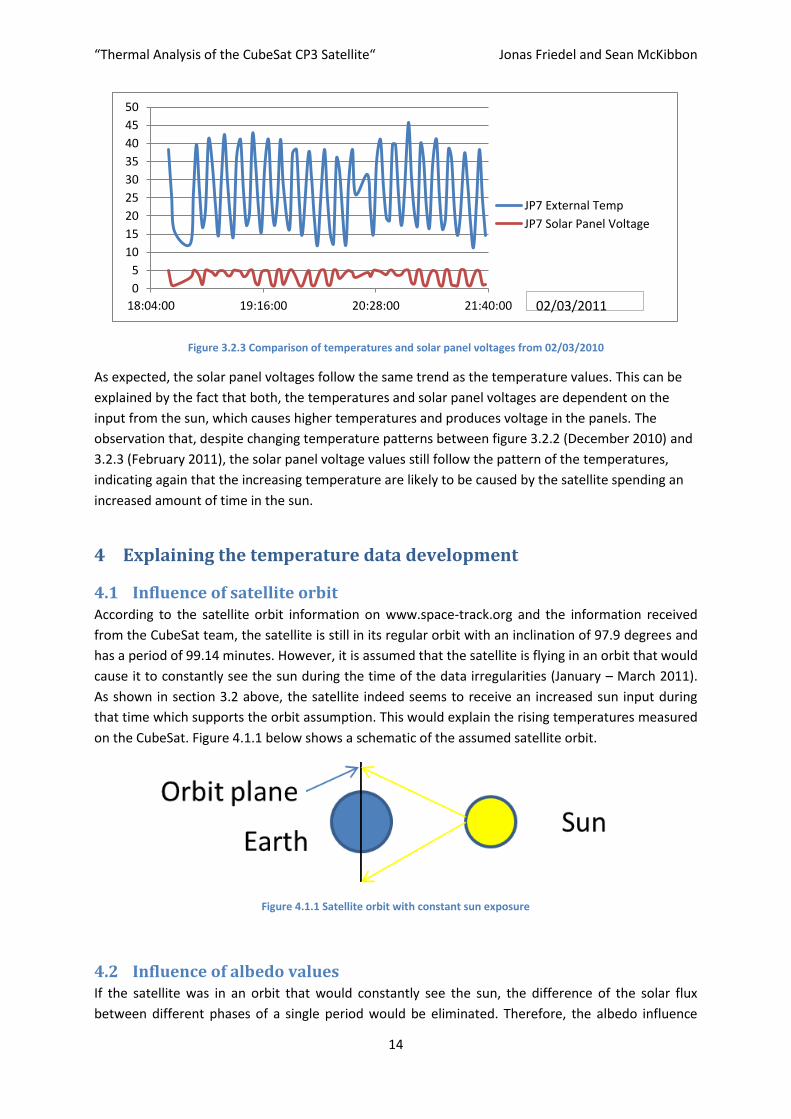
of all the other sides. The thought behind this examination was that if the satellite was to be in an
orbit that causes it to see the sun more often than in previous cases, the solar panels would more
often measure a higher frequency of 5 Volts as opposed to 0 Volts and, therefore, produce a higher
average number of voltages measured. As it can be seen in figure 3.2.1 below, the average values of
the measured solar panel voltage increase significantly in 2011, supporting the assumption that the
satellite experiences a higher exposure to the sun than in 2010.
Figure 3.2.1 Average solar panel voltage (JP7) over time
To further support this assumption, the solar panel voltages were compared to the side
temperatures of the satellite, which can be seen in figures 3.2.2 and 3.2.3 below.
Figure 3.2.2 Comparison of temperatures and solar panel voltages from 12/13/2010
2.6
2.8
3
3.2
3.4
3.6
3.8
10/29/2010 12/8/2010 1/17/2011 2/26/2011 4/7/2011 5/17/2011
Average SolarPanel Voltage
Linear (AverageSolar PanelVoltage)
-20
-10
0
10
20
30
40
50
4:50:00 6:02:00 7:14:00 8:26:00 9:38:00 10:50:00
JP7 External Temp
JP7 Solar Panel Voltage
12/13/2010
“Thermal Analysis of the CubeSat CP3 Satellite“ Jonas Friedel and Sean McKibbon
14
Figure 3.2.3 Comparison of temperatures and solar panel voltages from 02/03/2010
As expected, the solar panel voltages follow the same trend as the temperature values. This can be
explained by the fact that both, the temperatures and solar panel voltages are dependent on the
input from the sun, which causes higher temperatures and produces voltage in the panels. The
observation that, despite changing temperature patterns between figure 3.2.2 (December 2010) and
3.2.3 (February 2011), the solar panel voltage values still follow the pattern of the temperatures,
indicating again that the increasing temperature are likely to be caused by the satellite spending an
increased amount of time in the sun.
4 Explaining the temperature data development
4.1 Influence of satellite orbit According to the satellite orbit information on www.space-track.org and the information received
from the CubeSat team, the satellite is still in its regular orbit with an inclination of 97.9 degrees and
has a period of 99.14 minutes. However, it is assumed that the satellite is flying in an orbit that would
cause it to constantly see the sun during the time of the data irregularities (January – March 2011).
As shown in section 3.2 above, the satellite indeed seems to receive an increased sun input during
that time which supports the orbit assumption. This would explain the rising temperatures measured
on the CubeSat. Figure 4.1.1 below shows a schematic of the assumed satellite orbit.
Figure 4.1.1 Satellite orbit with constant sun exposure
4.2 Influence of albedo values If the satellite was in an orbit that would constantly see the sun, the difference of the solar flux
between different phases of a single period would be eliminated. Therefore, the albedo influence
0
5
10
15
20
25
30
35
40
45
50
18:04:00 19:16:00 20:28:00 21:40:00
JP7 External Temp
JP7 Solar Panel Voltage
02/03/2011
“Thermal Analysis of the CubeSat CP3 Satellite“ Jonas Friedel and Sean McKibbon
15
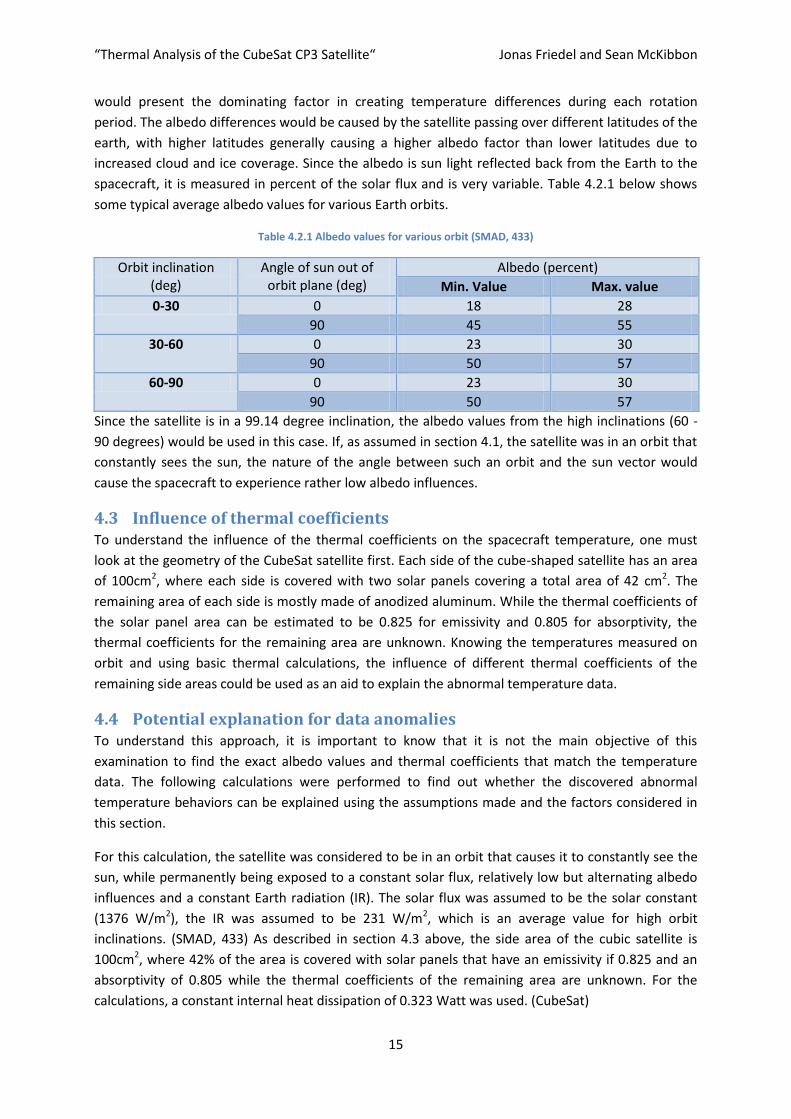
would present the dominating factor in creating temperature differences during each rotation
period. The albedo differences would be caused by the satellite passing over different latitudes of the
earth, with higher latitudes generally causing a higher albedo factor than lower latitudes due to
increased cloud and ice coverage. Since the albedo is sun light reflected back from the Earth to the
spacecraft, it is measured in percent of the solar flux and is very variable. Table 4.2.1 below shows
some typical average albedo values for various Earth orbits.
Table 4.2.1 Albedo values for various orbit (SMAD, 433)
Orbit inclination (deg)
Angle of sun out of orbit plane (deg)
Albedo (percent)
Min. Value Max. value
0-30 0 18 28
90 45 55
30-60 0 23 30
90 50 57
60-90 0 23 30
90 50 57
Since the satellite is in a 99.14 degree inclination, the albedo values from the high inclinations (60 -
90 degrees) would be used in this case. If, as assumed in section 4.1, the satellite was in an orbit that
constantly sees the sun, the nature of the angle between such an orbit and the sun vector would
cause the spacecraft to experience rather low albedo influences.
4.3 Influence of thermal coefficients To understand the influence of the thermal coefficients on the spacecraft temperature, one must
look at the geometry of the CubeSat satellite first. Each side of the cube-shaped satellite has an area
of 100cm2, where each side is covered with two solar panels covering a total area of 42 cm2. The
remaining area of each side is mostly made of anodized aluminum. While the thermal coefficients of
the solar panel area can be estimated to be 0.825 for emissivity and 0.805 for absorptivity, the
thermal coefficients for the remaining area are unknown. Knowing the temperatures measured on
orbit and using basic thermal calculations, the influence of different thermal coefficients of the
remaining side areas could be used as an aid to explain the abnormal temperature data.
4.4 Potential explanation for data anomalies To understand this approach, it is important to know that it is not the main objective of this
examination to find the exact albedo values and thermal coefficients that match the temperature
data. The following calculations were performed to find out whether the discovered abnormal
temperature behaviors can be explained using the assumptions made and the factors considered in
this section.
For this calculation, the satellite was considered to be in an orbit that causes it to constantly see the
sun, while permanently being exposed to a constant solar flux, relatively low but alternating albedo
influences and a constant Earth radiation (IR). The solar flux was assumed to be the solar constant
(1376 W/m2), the IR was assumed to be 231 W/m2, which is an average value for high orbit
inclinations. (SMAD, 433) As described in section 4.3 above, the side area of the cubic satellite is
100cm2, where 42% of the area is covered with solar panels that have an emissivity if 0.825 and an
absorptivity of 0.805 while the thermal coefficients of the remaining area are unknown. For the
calculations, a constant internal heat dissipation of 0.323 Watt was used. (CubeSat)
“Thermal Analysis of the CubeSat CP3 Satellite“ Jonas Friedel and Sean McKibbon
16
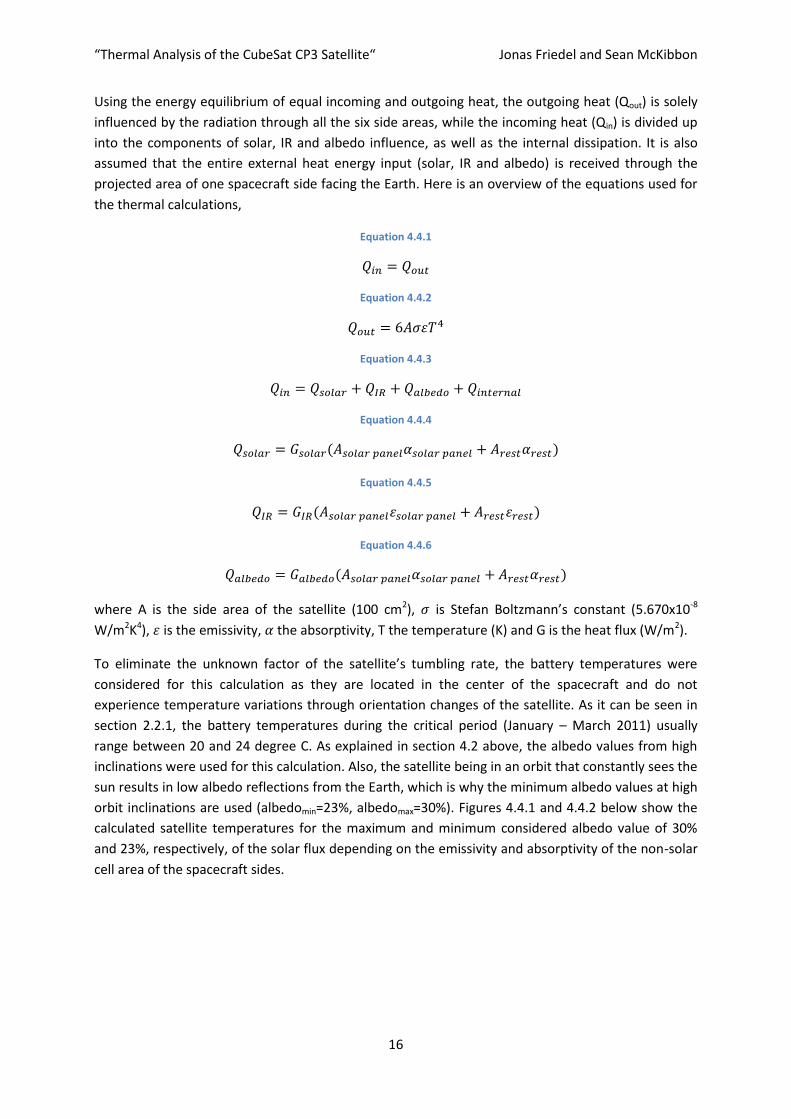
Using the energy equilibrium of equal incoming and outgoing heat, the outgoing heat (Qout) is solely
influenced by the radiation through all the six side areas, while the incoming heat (Qin) is divided up
into the components of solar, IR and albedo influence, as well as the internal dissipation. It is also
assumed that the entire external heat energy input (solar, IR and albedo) is received through the
projected area of one spacecraft side facing the Earth. Here is an overview of the equations used for
the thermal calculations,
Equation 4.4.1
Equation 4.4.2
Equation 4.4.3
Equation 4.4.4
Equation 4.4.5
Equation 4.4.6
where A is the side area of the satellite (100 cm2), is Stefan Boltzmann’s constant (5.670x10⁻⁸
W/m2K4), is the emissivity, the absorptivity, T the temperature (K) and G is the heat flux (W/m2).
To eliminate the unknown factor of the satellite’s tumbling rate, the battery temperatures were
considered for this calculation as they are located in the center of the spacecraft and do not
experience temperature variations through orientation changes of the satellite. As it can be seen in
section 2.2.1, the battery temperatures during the critical period (January – March 2011) usually
range between 20 and 24 degree C. As explained in section 4.2 above, the albedo values from high
inclinations were used for this calculation. Also, the satellite being in an orbit that constantly sees the
sun results in low albedo reflections from the Earth, which is why the minimum albedo values at high
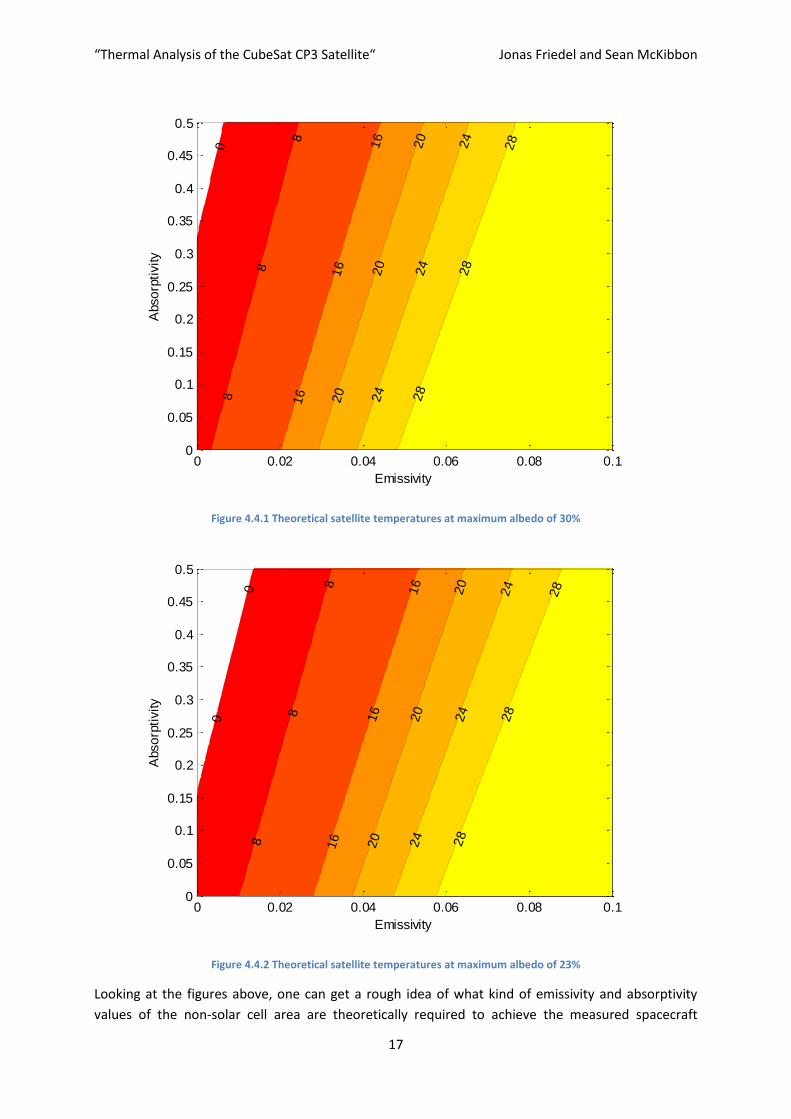
orbit inclinations are used (albedomin=23%, albedomax=30%). Figures 4.4.1 and 4.4.2 below show the
calculated satellite temperatures for the maximum and minimum considered albedo value of 30%
and 23%, respectively, of the solar flux depending on the emissivity and absorptivity of the non-solar
cell area of the spacecraft sides.
“Thermal Analysis of the CubeSat CP3 Satellite“ Jonas Friedel and Sean McKibbon
17
Figure 4.4.1 Theoretical satellite temperatures at maximum albedo of 30%
Figure 4.4.2 Theoretical satellite temperatures at maximum albedo of 23%
Looking at the figures above, one can get a rough idea of what kind of emissivity and absorptivity
values of the non-solar cell area are theoretically required to achieve the measured spacecraft
08
8
816
16
16
20
20
20
24
24
24
28
28
28
Emissivity
Abso
rpti
vity
0 0.02 0.04 0.06 0.08 0.10
0.05
0.1
0.15
0.2
0.25
0.3
0.35
0.4
0.45
0.5
0
08
8
816
16
16
20
20
20
24
24
24
28
28
28
Emissivity
Abso
rpti
vity
0 0.02 0.04 0.06 0.08 0.10
0.05
0.1
0.15
0.2
0.25
0.3
0.35
0.4
0.45
0.5
“Thermal Analysis of the CubeSat CP3 Satellite“ Jonas Friedel and Sean McKibbon
18
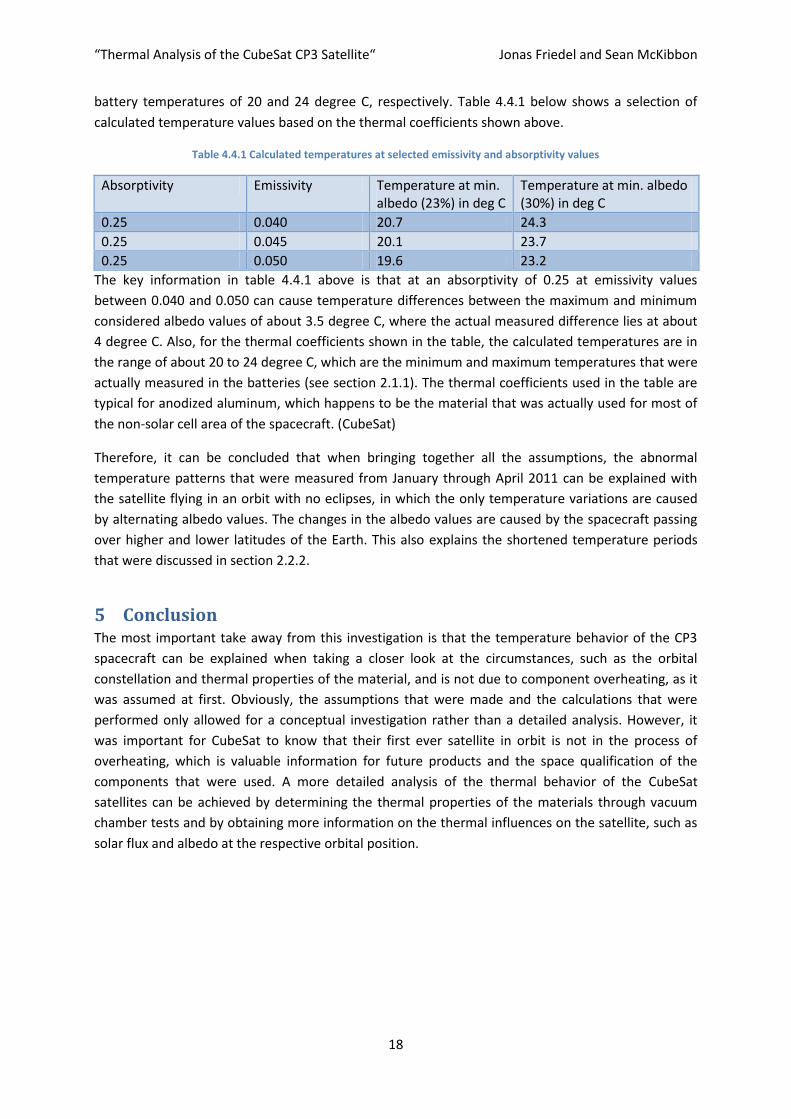
battery temperatures of 20 and 24 degree C, respectively. Table 4.4.1 below shows a selection of
calculated temperature values based on the thermal coefficients shown above.
Table 4.4.1 Calculated temperatures at selected emissivity and absorptivity values
Absorptivity Emissivity Temperature at min. albedo (23%) in deg C
Temperature at min. albedo (30%) in deg C
0.25 0.040 20.7 24.3
0.25 0.045 20.1 23.7
0.25 0.050 19.6 23.2
The key information in table 4.4.1 above is that at an absorptivity of 0.25 at emissivity values
between 0.040 and 0.050 can cause temperature differences between the maximum and minimum
considered albedo values of about 3.5 degree C, where the actual measured difference lies at about
4 degree C. Also, for the thermal coefficients shown in the table, the calculated temperatures are in
the range of about 20 to 24 degree C, which are the minimum and maximum temperatures that were
actually measured in the batteries (see section 2.1.1). The thermal coefficients used in the table are
typical for anodized aluminum, which happens to be the material that was actually used for most of
the non-solar cell area of the spacecraft. (CubeSat)
Therefore, it can be concluded that when bringing together all the assumptions, the abnormal
temperature patterns that were measured from January through April 2011 can be explained with
the satellite flying in an orbit with no eclipses, in which the only temperature variations are caused
by alternating albedo values. The changes in the albedo values are caused by the spacecraft passing
over higher and lower latitudes of the Earth. This also explains the shortened temperature periods
that were discussed in section 2.2.2.
5 Conclusion The most important take away from this investigation is that the temperature behavior of the CP3
spacecraft can be explained when taking a closer look at the circumstances, such as the orbital
constellation and thermal properties of the material, and is not due to component overheating, as it
was assumed at first. Obviously, the assumptions that were made and the calculations that were
performed only allowed for a conceptual investigation rather than a detailed analysis. However, it
was important for CubeSat to know that their first ever satellite in orbit is not in the process of
overheating, which is valuable information for future products and the space qualification of the
components that were used. A more detailed analysis of the thermal behavior of the CubeSat
satellites can be achieved by determining the thermal properties of the materials through vacuum
chamber tests and by obtaining more information on the thermal influences on the satellite, such as
solar flux and albedo at the respective orbital position.
“Thermal Analysis of the CubeSat CP3 Satellite“ Jonas Friedel and Sean McKibbon
19
Sources CubeSat
James R. Wertz, W. J. (2009). Sapce Mission Analysis and Design (SMAD). Microcosm Press.
Table of Figures Figure 2.1.1 CP3 external side (JP5) temperatures from 2007 ............................................................... 2
Figure 2.1.2 CP3 external side (JP5) temperatures from 2011 ............................................................... 3
Figure 2.2.1 CP3 side temperatures measured on 08/18/2010 .............................................................. 4
Figure 2.2.2 CP3 battery temperatures measured on 08/18/2010 ........................................................ 4
Figure 2.2.3 CP3 side temperatures measured on 12/30/2010 .............................................................. 5
Figure 2.2.4 CP3 battery temperatures measured on 12/30/2010 ........................................................ 5
Figure 2.2.5 CP3 side temperatures measured on 01/08/2011 .............................................................. 6
Figure 2.2.6 CP3 battery temperatures measured on 01/08/2011 ........................................................ 6
Figure 2.2.7 CP3 side temperatures measured on 02/03/2011 .............................................................. 7
Figure 2.2.8 CP3 battery temperatures measured on 02/03/2011 ........................................................ 7
Figure 2.2.9 CP3 side temperatures measured on 03/16/2011 .............................................................. 8
Figure 2.2.10 CP3 battery temperatures measured on 03/16/2011 ...................................................... 8
Figure 2.2.11 CP3 side temperatures measured on 04/12/2011 ............................................................ 9
Figure 2.2.12 CP3 battery temperatures measured on 04/12/2011 ...................................................... 9
Figure 3.1.1 CP3 CDH VSUM Voltage Data ............................................................................................ 11
Figure 3.1.2 Battery voltages and temperatures from January 8 to April 12, 2011 .............................. 12
Figure 3.2.1 Average solar panel voltage (JP7) over time ..................................................................... 13
Figure 4.1.1 Satellite orbit with constant sun exposure ....................................................................... 14
Figure 4.4.1 Theoretical satellite temperatures at maximum albedo of 30%....................................... 17
Figure 4.4.2 Theoretical satellite temperatures at maximum albedo of 23%....................................... 17
Table of Tables Table 2.2.1 Temperatures of CP3 sides and internal components with temperature peak periods .... 10
Table 4.2.1 Albedo values for various orbit (SMAD, 433) ..................................................................... 15
Table 4.4.1 Calculated temperatures at selected emissivity and absorptivity values .......................... 18
“Thermal Analysis of the CubeSat CP3 Satellite“ Jonas Friedel and Sean McKibbon
20
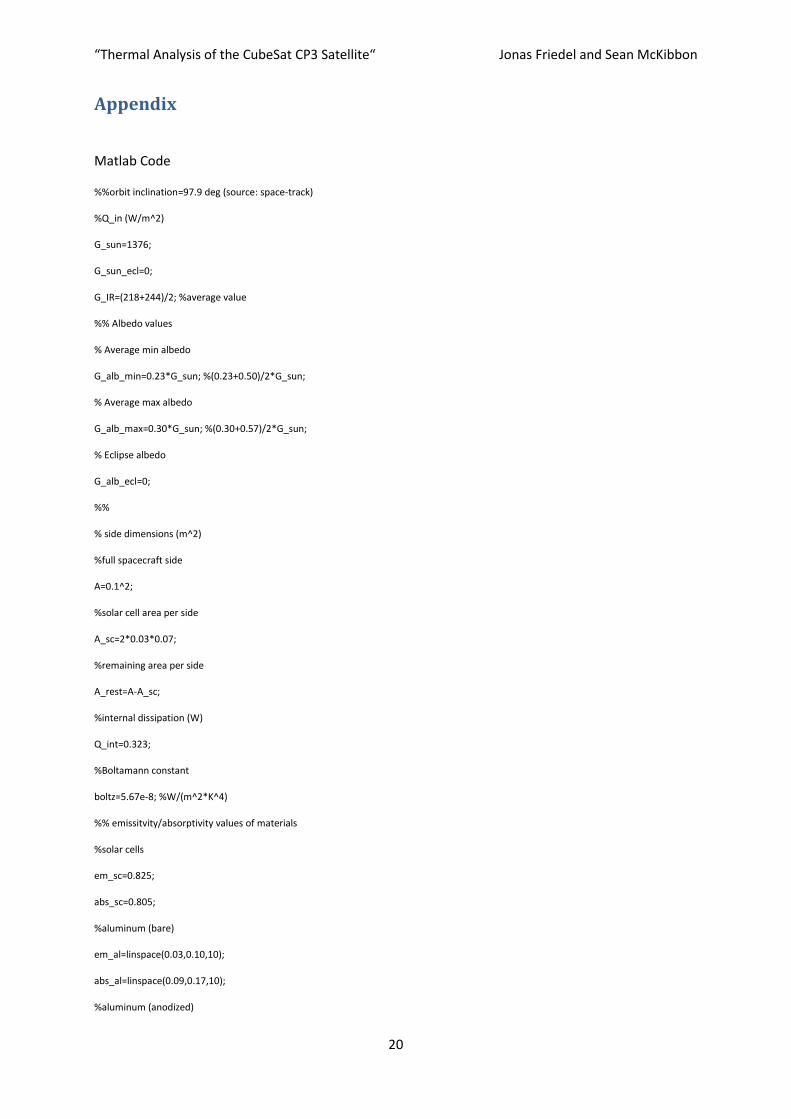
Appendix
Matlab Code
%%orbit inclination=97.9 deg (source: space-track)
%Q_in (W/m^2)
G_sun=1376;
G_sun_ecl=0;
G_IR=(218+244)/2; %average value
%% Albedo values
% Average min albedo
G_alb_min=0.23*G_sun; %(0.23+0.50)/2*G_sun;
% Average max albedo
G_alb_max=0.30*G_sun; %(0.30+0.57)/2*G_sun;
% Eclipse albedo
G_alb_ecl=0;
%%
% side dimensions (m^2)
%full spacecraft side
A=0.1^2;
%solar cell area per side
A_sc=2*0.03*0.07;
%remaining area per side
A_rest=A-A_sc;
%internal dissipation (W)
Q_int=0.323;
%Boltamann constant
boltz=5.67e-8; %W/(m^2*K^4)
%% emissitvity/absorptivity values of materials
%solar cells
em_sc=0.825;
abs_sc=0.805;
%aluminum (bare)
em_al=linspace(0.03,0.10,10);
abs_al=linspace(0.09,0.17,10);
%aluminum (anodized)
“Thermal Analysis of the CubeSat CP3 Satellite“ Jonas Friedel and Sean McKibbon
21
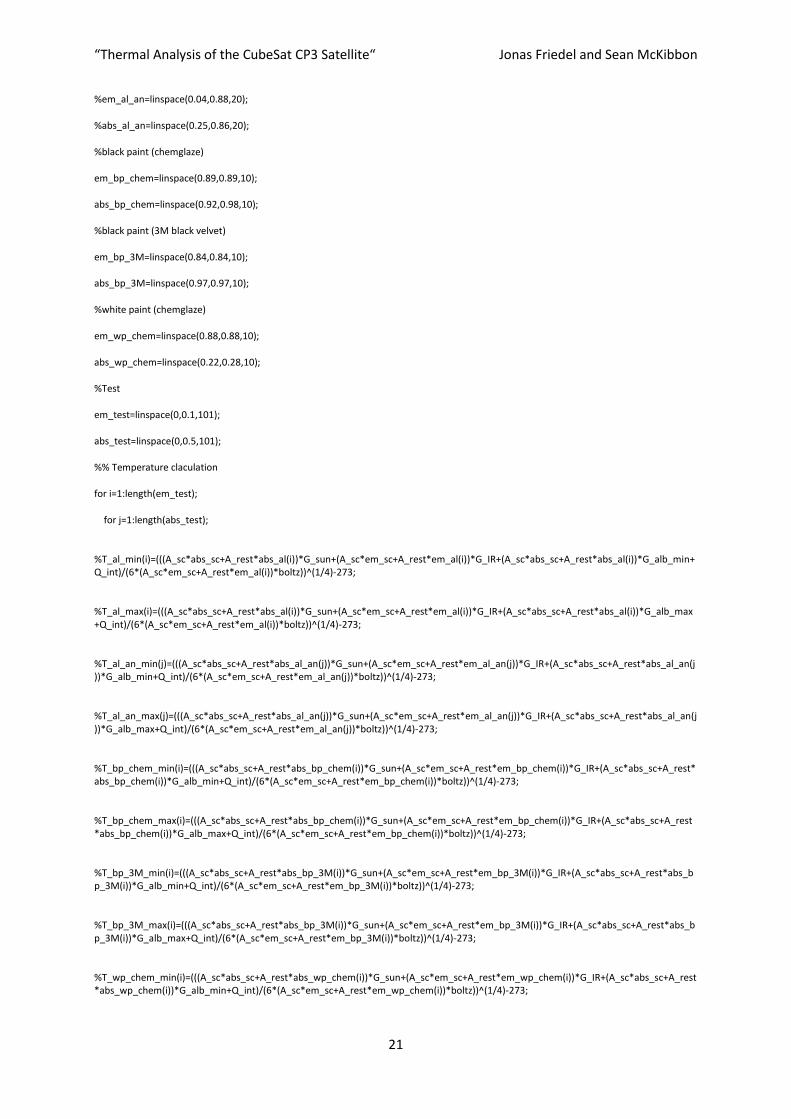
%em_al_an=linspace(0.04,0.88,20);
%abs_al_an=linspace(0.25,0.86,20);
%black paint (chemglaze)
em_bp_chem=linspace(0.89,0.89,10);
abs_bp_chem=linspace(0.92,0.98,10);
%black paint (3M black velvet)
em_bp_3M=linspace(0.84,0.84,10);
abs_bp_3M=linspace(0.97,0.97,10);
%white paint (chemglaze)
em_wp_chem=linspace(0.88,0.88,10);
abs_wp_chem=linspace(0.22,0.28,10);
%Test
em_test=linspace(0,0.1,101);
abs_test=linspace(0,0.5,101);
%% Temperature claculation
for i=1:length(em_test);
for j=1:length(abs_test);
%T_al_min(i)=(((A_sc*abs_sc+A_rest*abs_al(i))*G_sun+(A_sc*em_sc+A_rest*em_al(i))*G_IR+(A_sc*abs_sc+A_rest*abs_al(i))*G_alb_min+Q_int)/(6*(A_sc*em_sc+A_rest*em_al(i))*boltz))^(1/4)-273;
%T_al_max(i)=(((A_sc*abs_sc+A_rest*abs_al(i))*G_sun+(A_sc*em_sc+A_rest*em_al(i))*G_IR+(A_sc*abs_sc+A_rest*abs_al(i))*G_alb_max+Q_int)/(6*(A_sc*em_sc+A_rest*em_al(i))*boltz))^(1/4)-273;
%T_al_an_min(j)=(((A_sc*abs_sc+A_rest*abs_al_an(j))*G_sun+(A_sc*em_sc+A_rest*em_al_an(j))*G_IR+(A_sc*abs_sc+A_rest*abs_al_an(j))*G_alb_min+Q_int)/(6*(A_sc*em_sc+A_rest*em_al_an(j))*boltz))^(1/4)-273;
%T_al_an_max(j)=(((A_sc*abs_sc+A_rest*abs_al_an(j))*G_sun+(A_sc*em_sc+A_rest*em_al_an(j))*G_IR+(A_sc*abs_sc+A_rest*abs_al_an(j))*G_alb_max+Q_int)/(6*(A_sc*em_sc+A_rest*em_al_an(j))*boltz))^(1/4)-273;
%T_bp_chem_min(i)=(((A_sc*abs_sc+A_rest*abs_bp_chem(i))*G_sun+(A_sc*em_sc+A_rest*em_bp_chem(i))*G_IR+(A_sc*abs_sc+A_rest*abs_bp_chem(i))*G_alb_min+Q_int)/(6*(A_sc*em_sc+A_rest*em_bp_chem(i))*boltz))^(1/4)-273;
%T_bp_chem_max(i)=(((A_sc*abs_sc+A_rest*abs_bp_chem(i))*G_sun+(A_sc*em_sc+A_rest*em_bp_chem(i))*G_IR+(A_sc*abs_sc+A_rest*abs_bp_chem(i))*G_alb_max+Q_int)/(6*(A_sc*em_sc+A_rest*em_bp_chem(i))*boltz))^(1/4)-273;
%T_bp_3M_min(i)=(((A_sc*abs_sc+A_rest*abs_bp_3M(i))*G_sun+(A_sc*em_sc+A_rest*em_bp_3M(i))*G_IR+(A_sc*abs_sc+A_rest*abs_bp_3M(i))*G_alb_min+Q_int)/(6*(A_sc*em_sc+A_rest*em_bp_3M(i))*boltz))^(1/4)-273;
%T_bp_3M_max(i)=(((A_sc*abs_sc+A_rest*abs_bp_3M(i))*G_sun+(A_sc*em_sc+A_rest*em_bp_3M(i))*G_IR+(A_sc*abs_sc+A_rest*abs_bp_3M(i))*G_alb_max+Q_int)/(6*(A_sc*em_sc+A_rest*em_bp_3M(i))*boltz))^(1/4)-273;
%T_wp_chem_min(i)=(((A_sc*abs_sc+A_rest*abs_wp_chem(i))*G_sun+(A_sc*em_sc+A_rest*em_wp_chem(i))*G_IR+(A_sc*abs_sc+A_rest*abs_wp_chem(i))*G_alb_min+Q_int)/(6*(A_sc*em_sc+A_rest*em_wp_chem(i))*boltz))^(1/4)-273;
“Thermal Analysis of the CubeSat CP3 Satellite“ Jonas Friedel and Sean McKibbon
22
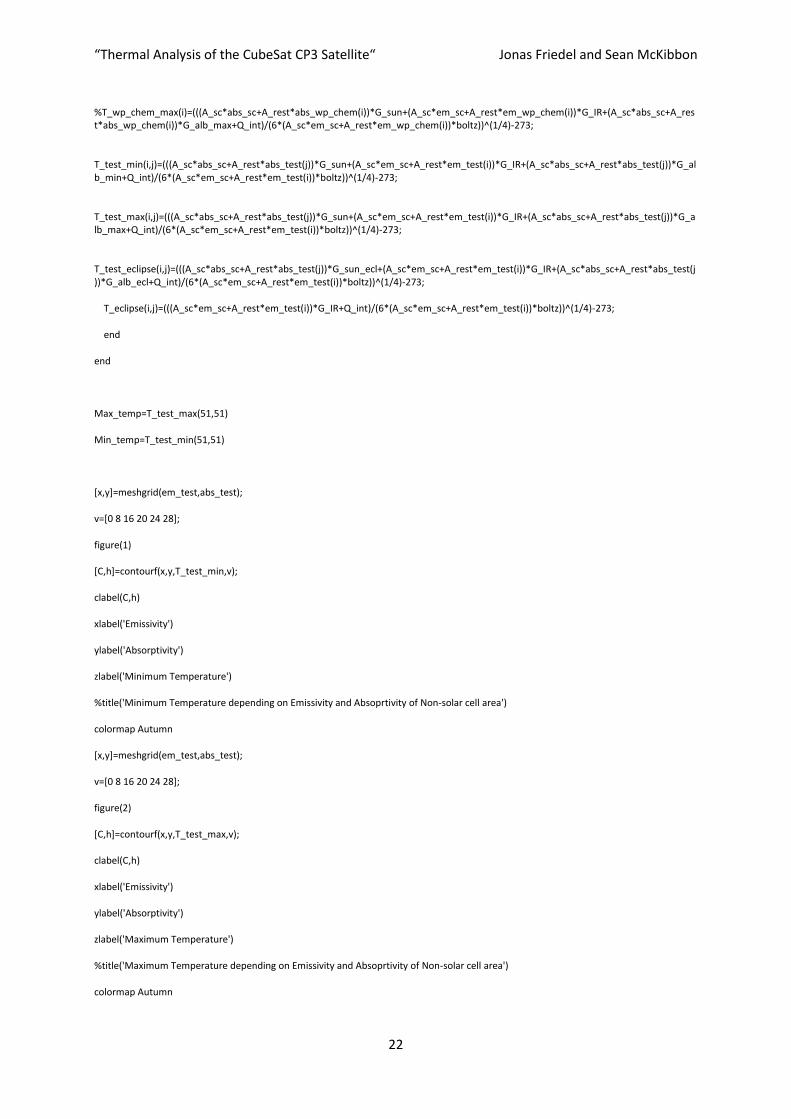
%T_wp_chem_max(i)=(((A_sc*abs_sc+A_rest*abs_wp_chem(i))*G_sun+(A_sc*em_sc+A_rest*em_wp_chem(i))*G_IR+(A_sc*abs_sc+A_rest*abs_wp_chem(i))*G_alb_max+Q_int)/(6*(A_sc*em_sc+A_rest*em_wp_chem(i))*boltz))^(1/4)-273;
T_test_min(i,j)=(((A_sc*abs_sc+A_rest*abs_test(j))*G_sun+(A_sc*em_sc+A_rest*em_test(i))*G_IR+(A_sc*abs_sc+A_rest*abs_test(j))*G_alb_min+Q_int)/(6*(A_sc*em_sc+A_rest*em_test(i))*boltz))^(1/4)-273;
T_test_max(i,j)=(((A_sc*abs_sc+A_rest*abs_test(j))*G_sun+(A_sc*em_sc+A_rest*em_test(i))*G_IR+(A_sc*abs_sc+A_rest*abs_test(j))*G_alb_max+Q_int)/(6*(A_sc*em_sc+A_rest*em_test(i))*boltz))^(1/4)-273;
T_test_eclipse(i,j)=(((A_sc*abs_sc+A_rest*abs_test(j))*G_sun_ecl+(A_sc*em_sc+A_rest*em_test(i))*G_IR+(A_sc*abs_sc+A_rest*abs_test(j))*G_alb_ecl+Q_int)/(6*(A_sc*em_sc+A_rest*em_test(i))*boltz))^(1/4)-273;
T_eclipse(i,j)=(((A_sc*em_sc+A_rest*em_test(i))*G_IR+Q_int)/(6*(A_sc*em_sc+A_rest*em_test(i))*boltz))^(1/4)-273;
end
end
Max_temp=T_test_max(51,51)
Min_temp=T_test_min(51,51)
[x,y]=meshgrid(em_test,abs_test);
v=[0 8 16 20 24 28];
figure(1)
[C,h]=contourf(x,y,T_test_min,v);
clabel(C,h)
xlabel('Emissivity')
ylabel('Absorptivity')
zlabel('Minimum Temperature')
%title('Minimum Temperature depending on Emissivity and Absoprtivity of Non-solar cell area')
colormap Autumn
[x,y]=meshgrid(em_test,abs_test);
v=[0 8 16 20 24 28];
figure(2)
[C,h]=contourf(x,y,T_test_max,v);
clabel(C,h)
xlabel('Emissivity')
ylabel('Absorptivity')
zlabel('Maximum Temperature')
%title('Maximum Temperature depending on Emissivity and Absoprtivity of Non-solar cell area')
colormap Autumn
Top Related
Copyright © 2022 FDOKUMEN

