


Bahasa
Halaman
Hukum

Experimental Gerontology 47 (2012) 608–613
Contents lists available at SciVerse ScienceDirect
Experimental Gerontology
j ourna l homepage: www.e lsev ie r .com/ locate /expgero
The specific contributions of force and velocity to muscle power in older adults
Rachele M. Pojednic a, David J. Clark b,c, Carolynn Patten b,d, Kieran Reid a,Edward M. Phillips a,e, Roger A. Fielding a,⁎a Nutrition, Exercise Physiology and Sarcopenia Laboratory, Jean Mayer USDA Human Nutrition Research Center on Aging at Tufts University, 711 Washington St., Boston,MA 02111, United Statesb Brain Rehabilitation Research Center, Malcom Randall VA Medical Center, Gainesville, FL, United Statesc Department of Aging and Geriatric Research, University of Florida, Gainesville, FL, United Statesd Department of Physical Therapy, University of Florida, Gainesville, FL, United Statese Department of Physical Medicine and Rehabilitation, Harvard Medical School and Spaulding Rehabilitation Hospital, Boston, MA, United States
Abbreviations: (MH), middle aged healthy; (OH), oldelimited; (TORa), absolute torque; (TORs), specific isompower; (PWRs), specific power; (VEL), velocity at 40% 1R⁎ Corresponding author. Tel.: +1 617 556 3016; fax:
E-mail address: [email protected] (R.A. Fieldin
0531-5565/$ – see front matter © 2012 Published by Eldoi:10.1016/j.exger.2012.05.010
a b s t r a c t
a r t i c l e i n f oArticle history:Received 9 February 2012Received in revised form 26 April 2012Accepted 14 May 2012Available online 22 May 2012
Section Editor: Christiaan Leeuwenburgh
Keywords:PowerVelocityStrengthAgingFunction
The purpose of this study is to examine the relative importance of the force-based and velocity-based mea-sures of muscle performance to explain inter-individual differences in power production capability and func-tional task performance. Participants included seventy-nine men and women: middle-aged healthy adults(MH: 40–55 years), older healthy adults (OH: 70–85 years), and older adults with mobility limitations(OML: 70–85 years). Muscle power at 180°/s, isometric maximal torque, and maximal contraction velocityat 40% 1RM were measured during unilateral leg extension. The Short Physical Performance Battery (SPPB)was used to differentiate between healthy and mobility limited older adults. Functional task performancewas assessed using multiple chair rise and stair climb tests. Leg extensor force (torque), but not maximal con-traction velocity, was significantly associated with muscle power in MH. Both torque and velocity were sig-nificantly associated with muscle power in OH. Maximal velocity, but not torque, was associated with powerin OML. Maximal velocity demonstrated an association with multiple chair rise time and stair climb time inOML, but not MH or OH. It is concluded that movement velocity is an increasingly important determinant ofmaximal power output with advancing age. Furthermore, movement velocity is also a critical componentof functional task performance with aging and may contribute to functional deficits. These findings help toexplain why the rate-dependent variable power has emerged as a critical component of both assessmentand rehabilitation of muscular performance and physical function in older adults.
© 2012 Published by Elsevier Inc.
1. Introduction
Muscle power is now acknowledged as a valuablemeasure for quan-tifying age-related physical impairment (Bean et al., 2010; Foldvariet al., 2000; Reid et al., 2008). Power is defined as work performedover a period of time, or as the product of force andmovement velocity.Because power reflects both force production and movement velocity,altered neural ormuscular capability affecting either factor will contrib-ute to declines in power and potentially to declines in physical function.In contrast, traditional strength assessments (e.g., isometric maximalvoluntary contraction (MVC) and one-repetition maximum (1RM))may be less sensitive to altered neural or muscular capability becausethey are predominantly force-dependent. Indeed, power has been
r healthy; (OML), older mobilityetric torque; (PWRa), absoluteM.+1 617 556 3083.g).
sevier Inc.
shown to decline earlier andmore rapidly than strengthwith advancingage (Foldvari et al., 2000; Metter et al., 1997).
Maximizing power production capability is considered to be animportant objective for maintaining physical function with aging(Bean et al., 2010; Foldvari et al., 2000; Reid et al., 2008). However,achieving this objective requires an improved understanding of thefactors that limit muscle power, and how these factors may differwith age and functional status. Muscle size is undoubtedly an impor-tant factor to age-related declines in power production (Nogueiraet al., 2009). Yet a growing body of evidence indicates that musclesize and strength are not as closely linked as previously assumed(Clark and Manini, 2008). Accordingly, there is now increased inter-est in understanding the determinants of muscle performance ratherthan just muscle size. A number of recent studies report considerableimpairment of movement velocity with aging. For instance, isometricforce production is less impaired than dynamic force production inthe lower extremities of healthy older adults (Clark et al., 2010;Dalton et al., 2010). Moreover, maximal contraction velocity underunloaded or isotonic resistance conditions is considerably slowedwith aging (Dalton et al., 2010; Lanza et al., 2003) and may be a key
609R.M. Pojednic et al. / Experimental Gerontology 47 (2012) 608–613
component in the onset of functional difficulties in the elderly (VanRoie et al., 2011). Further investigation into the relative importanceof force and velocity to power production is an important step towardunderstanding the mechanisms limiting power production capabilityin older adults.
The purpose of this study is to examine the relative importance offorce-based and velocity-based measures of muscle performance toexplain inter-individual differences in power production capabilityand functional task performance. Three distinct cohorts were assessed:healthy middle-aged adults, healthy older adults, and older adults withmobility limitations. We hypothesized that the velocity-based measurewould be more important to muscle power and functional task perfor-mance in the older groups than in the middle-aged group, and particu-larly in the group with mobility limitations.
2. Methods
2.1. Participants
Data were collected from 79 participants: 25 healthy middle-agedadults (mean age 47.2±4.5 years), 28 healthy older adults (meanage 73.6±3.5 years), and 26 older adults with mobility limitations(mean age 77.9±4.3 years). All procedures were approved by theTufts University Health Science Campus Institutional Review Boardand all subjects provided their written informed consent prior toparticipation.
Volunteers were recruited by local newspaper advertisements,direct mailing to volunteers from earlier studies at our center, andposting of flyers. Three specific groups were recruited: middle-agedhealthy adults (MH, age 40–55 years), older healthy adults (OH, age70–85 years), and older adults with mobility limitations (OML, age70–85 years). Volunteers were screened by telephone using thefollowing exclusion criteria: presence of unstable chronic disease,acute or terminal illness, myocardial infarction within 6 months(or other symptomatic coronary artery disease), uncontrolled hy-pertension (>150/90 mm Hg), fracture in the previous 6 months,diseases or medications affecting neuromuscular function, antico-agulation therapy (due to a muscle biopsy procedure, data not pres-ented here), hormone replacement therapy, body mass index lessthan 19 kg/m2 or greater than 33 kg/m2, weight loss or gain withinthe previous 6 months, and participation in a strength or endurancetraining program within the previous 6 months. Volunteers beingconsidered for MH and OH were also required to not be taking anyprescription medications. Individuals who passed the telephonescreening were further screened by a licensed physician or nursepractitioner, including assessment of the presence of lower extremityjoint pain and administration of the Folstein Mini-Mental StateExamination (MMSE) (Folstein et al., 1975)and Short Physical Perfor-mance Battery test (SPPB) (Guralnik et al., 1994). Persons with MMSEscore less than 23 or with joint pain were excluded. The SPPB, whichprobes the domains of strength, ambulation capacity, and balance,is predictive of future disability (Guralnik et al., 1994) and was usedto classify the older adults into the OH and OML groups. Older adultsscoring 9 or less (out of a possible 12 points) were classified asOML, whereas those scoring greater than 9 and who were not takingprescription medication were classified as OH.
2.2. Protocol
Maximal voluntary knee extensions were performed on an iso-kinetic dynamometer (Cybex II Isokinetic Dynamometer, CybexDivision of Lumex Inc, Ronkonkama, NY) and on a pneumatic resist-ance training machine (Keiser A420 Model Keiser Corp, Fresno, CA).Participants were seated upright with the hip and knee of the domi-nant leg flexed to approximately 85° and 90°, respectively. The testingapparatus was adjusted such that the lateral epicondyle of the
dominant knee was aligned with the equipment's axis of rotation.The limb was secured to the equipment's lever arm by a paddedstrap placed 1 in. above the ankle.
2.3. 1RM and velocity
Each participant's one repetition maximum (1RM), defined as thegreatest load that could be moved one time through the full range ofmotion using proper technique (Callahan et al., 2007) was measuredon the pneumatic leg press. Prior to testing, each subject was asked tohold the dominant leg in full extension against minimal resistancewhile the examiner recorded the limb position using real-time outputprovided by the manufacturer's software. 1RM attempts were consid-ered successful if the participant reached 90% of criterion limb posi-tion. Resistance was increased after each trial unless the participantfailed to achieve 90% of maximal limb position, in which case theresistance was reduced by half of the previous increment. Testingcontinued until the participant failed two consecutive trials at agiven level of resistance. Each trial was followed by 1 min of restand 1RM was typically attained within 6–8 trials.
To evaluate contraction velocity while controlling for individualdifferences in absolute strength, the resistance level of the pneumaticmachine was set to 40% of the participant's 1RM. Participants wereinstructed to perform maximal effort knee extension as quickly andexplosively as possible through the entire concentric range of motion.Five maximal effort trials were performed, with at least 30 s of restbetween each trial.
2.4. Torque and power
Torque (i.e., rotational force) and power were assessed on the iso-kinetic dynamometer. To evaluate torque in isolation, isometric MVCsof the knee extensors were performed. The leg was held in 60° of kneeflexion and the participant was instructed to push as hard as possiblefor 3–5 s while the examiner provided strong verbal encouragement.Trials were performed until successive attempts showed improve-ment of b5% (generally 3–5 trials). Following measurement of MVC,the dynamometer was set to isokinetic mode at 180°/s. Participantswere instructed to perform 5 consecutive maximal voluntary kneeextension trials.
2.5. Functional assessments
Stair climb was assessed using a standard riser of stairs. The sub-ject was asked to ascend a 10 rise set of stairs as fast as they could.Subjects could ascend holding the railing or using their assistivedevice if necessary. Repeated multiple chair rise time was determinedon a standard chair with the subject holding arms across the chest.Subjects were asked to stand and sit 10 times as fast as they could.Participants performed each functional task twice, and the averagewas used for subsequent analysis.
2.6. Instrumentation
For the isokinetic dynamometer, torque and angular velocity sig-nals were directly sampled at 1 kHz by a Powerlab/16SP A/D systemwith Chart v5.4 software (ADInstruments, Colorado Springs, CO).For the pneumatic resistance training machine, pressure and linearposition were sampled from pneumatic pistons at 400 Hz and trigo-nometrically converted to SI units of torque and angular velocity bythe manufacturer's software. All data were saved to disk for offlineanalysis.
Computed tomography (CT) scans of the thigh were obtained atthe midpoint of the femur using a Siemens Somatom Scanner(Erlangen, Germany) operating at 120 kV and 100 mA, a slice widthof 10 mm and a scanning time of 1 s. All scans were analyzed by a
Table 1Means and standard deviations for torque, velocity and power.
Variable MH mean (SD) OH mean (SD) OML mean (SD)
Torque (Nm) 154.59 (36.35) 137.53 (54.73) 114.76 (40.60)Specific torque (Nm/cm2) 2.46 (0.63) 2.55 (0.55) 2.50 (0.605)Velocity @40% RM (radians/s) 5.64 (1.27) 4.83 (1.22) 3.88 (1.19)Power @180°/s (watts) 215.04 (85.64) 173.28 (86.64) 119.39 (50.16)Specific power (watts/cm2) 3.35 (1.10) 3.15 (1.06) 2.60 (0.82)
610 R.M. Pojednic et al. / Experimental Gerontology 47 (2012) 608–613
single blinded assessor using SliceOmatic v4.2 software (Tomovision,Montreal, Canada). Images were reconstructed on a 512×512 matrixwith a 25-cm field of view, and anterior compartment muscle cross-sectional area (CSA) was measured by manual tracing using, whenapplicable, intermuscular adipose tissue as a guide. Muscle CSA wasmeasured in the range of 0–100 Hounsfield units and calculated asthe sum of low- and normal-density area.
2.7. Data analysis
All data were analyzed offline using Matlab 7.0 (The Mathworks,Natick, MA) and statistical analysis was performed using JMP statisti-cal software (v. 9.0.2, SAS Institute Inc, Cary, NC). Concentric kneeextension torque and velocity were averaged over a window of70–50° of knee flexion. Power was calculated by multiplying torqueby velocity (after converting from deg/s to radians/s). IsometricMVC torque was measured at 60° of knee flexion, and defined asthe highest value sustained over a 250 ms window. For each testingcondition the highest three values of the five trials were averagedand used for statistical analysis. Because this study is focused on mus-cle performance rather than muscle size, specific torque and specificpower were calculated by normalizing MVC and power, respectively,to cross sectional area of the quadriceps muscle for each participant.Force-based muscle performance was indicated by specific torque(TORs) and velocity-based muscle performance was indicated byvelocity at 40% 1RM (VEL).
2.8. Statistics
Within each group, multivariable least squares regression was usedto determine the ability of TORs and VEL to account for the inter-individual variability in PWRs. An a priori modeling technique was uti-lized in order to identify the role of each specific predictor (TORs andVEL) on the outcome (PWRs). Gender has been cited as a possible con-founder, and was thus included in the model (Sayers et al., 2005). Theproportion of variation in PWRs accounted for by each main variable(TORs and VEL)was calculated as partial R2 values. Colinearity betweenpredictorswas assessed by examining the variance inflation factor (VIF)of each variable.
To determine the ability of TORs and VEL and to account for theinter-individual variability of functional task performance (i.e. multi-ple chair rise and stair climb), a least squares multivariate regressionmodel was constructed for all subjects and also stratified by group.This model also included gender and body weight as potential con-founders of functional outcomes (Brown et al., 1995). Statisticalsignificance was set at p≤0.05 for all analyses.
3. Results
3.1. Participants
Data were collected for 79 participants, including 25 MH (47.2±4.51 years, 11.7±0.46 SPPB), 28 OH (73.67±3.52, 10.89±0.91 SPPB),and 25 OML (77.9±4.33, 7.88±1.24 SPPB).
3.2. Force/torque, velocity and power
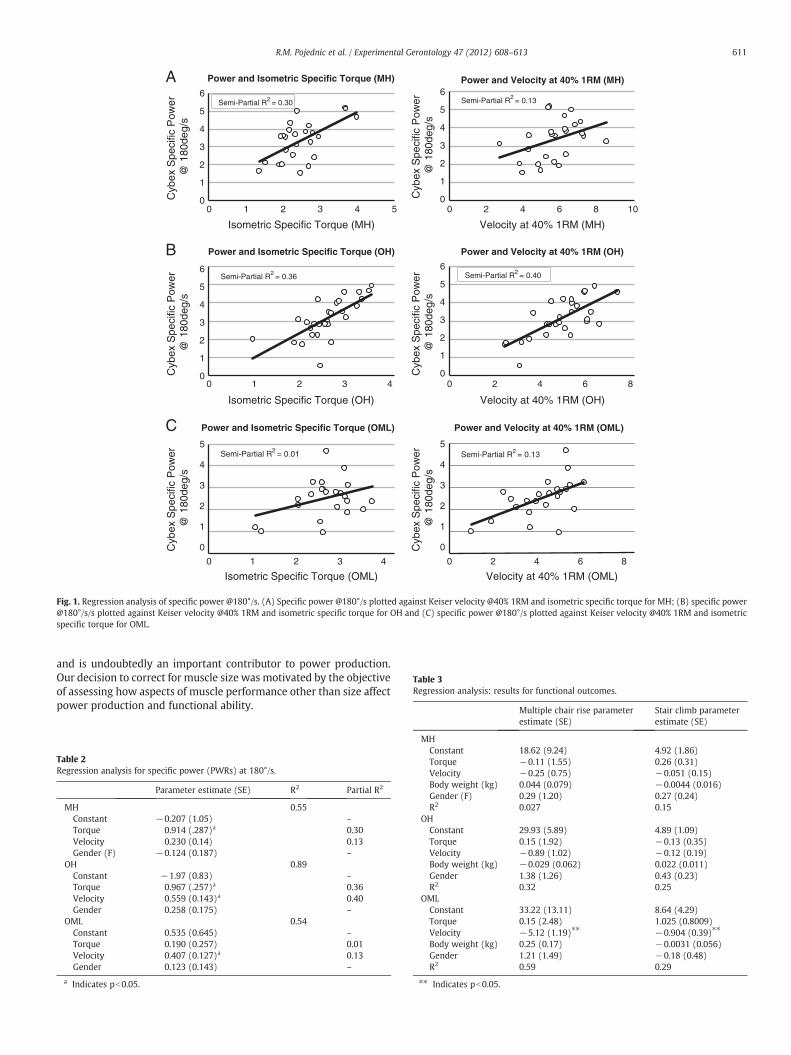
Means and standard deviations of all outcomes (TORa, TORs, VEL,PWRa, and PWRs) are presented in Table 1. Results of the multivariateregression reveal that for MH subjects, TORs was highly associatedwith PWRs (Total Model R2=0.46; TORs p=0.005, partial R2=0.30) but VEL was not (p=0.13, partial R2=0.13). In OH, bothTORs (Total Model R2=0.70; TORs p=0.001, partial R2=0.36) andVEL (pb0.001, partial R2=0.4) were highly associated with PWRs.However, in OML, VEL (Total Model R2=0.47; VEL p=0.005, partialR2=0.13) was significantly associated, but TORs was not (p=0.47,
partial R2=0.01) (Fig. 1). Gender was not associated with PWRs inany of the groups (Table 2). It should be noted that an outlier wasremoved for the regression analysis. One OML participant demon-strated an absolute power (PWRa) output of 36.3 W (compared to amean PWRa output of 119.4 W, S.D.=50.17) and was confirmed asan outlier (Studentized Residual of −2.51 and Cook's Distance of0.14).
Colinearity between TORs and VEL was also not significant.
3.3. Functional outcomes
VEL strongly accounted for the inter-individual variability on per-formance of multiple chair rise (pb0.0001) and stair climb perfor-mance (pb0.0001) when assessed across all study participants. Incontrast, TORs was not associated with multiple chair rise or stairclimb performance (p=0.86, p=0.066, respectively). Gender wasnot significantly associated with performance of either functionaltask.
Further analysis within each group revealed no association be-tween VEL and multiple chair rise for MH (Total Model R2=0.027,p=0.74,) or OH (Total Model R2=0.32; p=0.39,) but was signifi-cantly associated with multiple chair rise performance in OML(Total Model R2=0.59; p=0.0007). TORs, body weight and genderwere not associated with multiple chair rise performance in anygroup (Table 3).
Analysis of the relationship between VEL and stair climb timewithin each group demonstrated no association in MH (Total ModelR2=0.15; p=0.74) or OH (Total Model R2=0.25; p=0.52,), butdid demonstrate a significant association within OML (Total ModelR2=0.29; p=0.034) (Table 3). TORs, body weight and gender werenot associated with stair climb performance in any group (Table 3).
It should be noted that an outlier was removed for analysis of mul-tiple chair rise. One participant demonstrated a multiple chair risetime of 83 s (compared to a mean multiple chair rise of 25.44 s,S.D.=9.69) and was confirmed as an outlier (Studentized Residualof 3.77 and Cook's Distance of 0.304). Only after removal of this out-lier was there a significant association between VEL and multiplechair rise time within the OML group.
4. Discussion
This study examines the relative importance of force-based andvelocity-based measures of muscle performance to explain powerproduction capability in older adults. The results demonstrate thatvelocity is an increasingly influential determinant of power produc-tion capability with aging and with lower mobility function. Specifi-cally, VEL demonstrated a stronger association than TORs to poweroutput for OH and OML compared to MH (Table 2). This finding sug-gests that neural and muscular factors underlying movement velocitymay be more compromised than those underlying force production(after accounting for muscle size).
A previous study has reported that force, rather than velocity, con-tributes more to power reductions with aging (Yamauchi et al., 2009).However, that study reported absolute torque and power in two agegroups (young and elderly) while we analyzed specific torque andspecific power. Absolute torque is largely dependent on muscle size,
0
1
2
3
4
5
6
0 1 2 3 4 5
Cyb
ex S
peci
fic P
ower
@
180
deg/
sC
ybex
Spe
cific
Pow
er
@ 1
80de
g/s
Cyb
ex S
peci
fic P
ower
@
180
deg/
s
Cyb
ex S
peci
fic P
ower
@
180
deg/
s
Cyb
ex S
peci
fic P
ower
@
180
deg/
sC
ybex
Spe
cific
Pow
er
@ 1
80de
g/s
Isometric Specific Torque (MH)
Power and Isometric Specific Torque (MH)
0
1
2
3
4
5
6
0 1 2 3 4
Isometric Specific Torque (OH)
Power and Isometric Specific Torque (OH)
Semi-Partial R2 = 0.36
0
1
2
3
4
5
0 1 2 3 4
Isometric Specific Torque (OML)
Power and Isometric Specific Torque (OML)
Semi-Partial R2 = 0.01
0
1
2
3
4
5
6
0 2 4 6 8 10
Velocity at 40% 1RM (MH)
Power and Velocity at 40% 1RM (OH)
Power and Velocity at 40% 1RM (MH)
Semi-Partial R2 = 0.13
0
1
2
3
4
5
6
0 2 4 6 8
Velocity at 40% 1RM (OH)
0
1
2
3
4
5
0 2 4 6 8
Velocity at 40% 1RM (OML)
Power and Velocity at 40% 1RM (OML)
Semi-Partial R2 = 0.13
B
C
Semi-Partial R2 = 0.30
Semi-Partial R2 = 0.40
A
Fig. 1. Regression analysis of specific power @180°/s. (A) Specific power @180°/s plotted against Keiser velocity @40% 1RM and isometric specific torque for MH; (B) specific power@180°/s/s plotted against Keiser velocity @40% 1RM and isometric specific torque for OH and (C) specific power @180°/s plotted against Keiser velocity @40% 1RM and isometricspecific torque for OML.
Table 3Regression analysis: results for functional outcomes.
Multiple chair rise parameter Stair climb parameter
611R.M. Pojednic et al. / Experimental Gerontology 47 (2012) 608–613
and is undoubtedly an important contributor to power production.Our decision to correct for muscle size was motivated by the objectiveof assessing how aspects of muscle performance other than size affectpower production and functional ability.
Table 2Regression analysis for specific power (PWRs) at 180°/s.
Parameter estimate (SE) R2 Partial R2
MH 0.55Constant −0.207 (1.05) –
Torque 0.914 (.287)a 0.30Velocity 0.230 (0.14) 0.13Gender (F) −0.124 (0.187) –
OH 0.89Constant −1.97 (0.83) –
Torque 0.967 (.257)a 0.36Velocity 0.559 (0.143)a 0.40Gender 0.258 (0.175) –
OML 0.54Constant 0.535 (0.645) –
Torque 0.190 (0.257) 0.01Velocity 0.407 (0.127)a 0.13Gender 0.123 (0.143) –
a Indicates pb0.05.
estimate (SE) estimate (SE)
MHConstant 18.62 (9.24) 4.92 (1.86)Torque −0.11 (1.55) 0.26 (0.31)Velocity −0.25 (0.75) −0.051 (0.15)Body weight (kg) 0.044 (0.079) −0.0044 (0.016)Gender (F) 0.29 (1.20) 0.27 (0.24)R2 0.027 0.15
OHConstant 29.93 (5.89) 4.89 (1.09)Torque 0.15 (1.92) −0.13 (0.35)Velocity −0.89 (1.02) −0.12 (0.19)Body weight (kg) −0.029 (0.062) 0.022 (0.011)Gender 1.38 (1.26) 0.43 (0.23)R2 0.32 0.25
OMLConstant 33.22 (13.11) 8.64 (4.29)Torque 0.15 (2.48) 1.025 (0.8009)Velocity −5.12 (1.19)⁎⁎ −0.904 (0.39)⁎⁎
Body weight (kg) 0.25 (0.17) −0.0031 (0.056)Gender 1.21 (1.49) −0.18 (0.48)R2 0.59 0.29
⁎⁎ Indicates pb0.05.
612 R.M. Pojednic et al. / Experimental Gerontology 47 (2012) 608–613
Velocity was also shown to be an increasingly important compo-nent of functional ability with aging. VEL, rather than TORs, demon-strated a significant effect on both multiple chair rise and stairclimb when examining inter-individual variability in middle aged(MH) and older adults (OH, OML). When examining those individualsin the mobility limited group (OML), VEL was the only significant var-iable associated with multiple chair rise time and stair climb, indicat-ing that the velocity component of muscle performance is importantto functional capability (Table 3).
Although relatively few studies have examined the components ofmuscle power on function, one report has suggested that contractionvelocity is a stronger predictor of performance of lower intensityfunctional tasks than muscle strength (Sayers et al., 2005). Due toour unique approach of stratifying our older population by functionalability (SPPB score), our results may further demonstrate the impor-tance of contraction velocity to declines in mobility function withaging. An interesting contrast with this prior study, however, is thatour analysis did not demonstrate a significant effect of gender onthe velocity component of power production. This gender specificdecline in optimal shortening velocity has also been observed else-where, although it has not been associated with functional outcomes(Valour et al., 2003). Despite not replicating the association with gen-der specific deterioration of velocity, the conclusions of these earlierstudies combined with our results suggest that the dynamic aspectof muscle performance becomes increasingly more important for pre-serving function with age.
Our results add to the evidence that evaluation of muscle perfor-mance in dynamic conditions may be more sensitive than slow orisometric torque measurements for detecting weakness (Clark andFielding, 2011). It may be that isometric assessments are less sensi-tive because they allow sufficient time for motor units to be recruited,excitation–contraction coupling to occur, and for tendons to becomefully taut for optimal force transmission. In contrast, these force pro-ducing mechanisms may not have time to become fully engagedduring dynamic assessments in older adults, leading to a more dra-matic reduction in performance. Indeed, aging has previously beenshown to be accompanied by slowing of neuromuscular activation(Clark et al., 2010), declines in the integrity of the neuromuscularjunction (Deschenes et al., 2010), excitation–contraction uncoupling(Boncompagni et al., 2006), altered muscle fiber contractile proper-ties (Ng and Kent-Braun, 1999; Roos et al., 1999), and altered archi-tecture and compliance of muscle and tendon (Maganaris et al.,2004; Morse et al., 2005; Narici and Maganaris, 2007).
Lastly, as power has been noted to be a predictor of functional lim-itation with age, our results support the growing body of evidencethat power, with specific attention to the contribution of velocity,is a critical component in the design of intervention strategies foraging individuals (Henwood and Taaffe, 2005; Sayers and Gibson,2010). However, only with in depth knowledge of the individualcontributions of both force and velocity can interventions be tailoredto optimize the most influential component. Our findings have impor-tant implications for those researchers and clinicians looking to mostpositively affect functional outcomes in older adults. Based upon ourresults, strategies should be employed to maximize velocity in phys-ical activity interventions in older adults. Indeed, it has been demon-strated that high-velocity training can increase peak power (Fieldinget al., 2002) and facilitate significant improvements in functionaloutcomes (Henwood and Taaffe, 2005). Moreover, specific improve-ments in the velocity component of power production have beendemonstrated with short term training protocols in older, but notyoung, subjects (Petrella et al., 2007). Further research must be con-ducted to determine the optimal parameters for an interventionthat targets age-related changes in dynamic muscle performance.
One limitation of this study is that TORs and VEL only accountedfor about half of the variability in PWRs for the MH and OML groups.One likely explanation for this is differences in the neuromechanics
of each of the three tasks that we assessed. That is, TORs was assessedwith isometric contractions, VEL with isotonic contraction and PWRswith isokinetic contractions. This factor, plus the normal variability ofmaximal voluntary motor performance in humans, likely account forthe majority of the unexplained variability.
5. Conclusion
These findings from three distinct groups of adults – middle agedhealthy, older healthy, and older mobility limited – demonstrate differ-ential contributions of force and velocity to the measurement of powerand functional outcomes in an aging population. After accounting formuscle size, our findings identify velocity as themore significant deter-minant of power production and functional ability in older adults,especially in older adults with mobility limitations. These findings indi-cate the need for additional research to identify the specific neural andmuscular mechanisms related to impaired power and functional taskperformance aswell as to identify the optimal parameters of training in-terventions to prevent, or restore, loss of dynamic muscle performance.
Acknowledgments
This research was supported by the National Institute on Aginggrant number AG18844 and based upon work supported by theU.S. Department of Agriculture, under agreement 58-1950-7-707. Anyopinions, findings, conclusions or recommendations expressed in thispublication are those of the author(s) and do not necessarily reflect theview of the U.S. Department of Agriculture. This research was alsosupported by the BostonClaudeD. PepperOlderAmerican IndependenceCenter 1P30AG031679, the Boston Rehabilitation Outcomes Center,funded by NIH Infrastructure Grant (1R24HD065688-01A1) and theNHLBI Training Grant (T32HL69772).
References
Bean, J.F., Kiely, D.K., LaRose, S., Goldstein, R., Frontera, W.R., Leveille, S.G., 2010. Arechanges in leg power responsible for clinically meaningful improvements in mobil-ity in older adults? J. Am. Geriatr. Soc. 58, 2363–2368.
Boncompagni, S., d'Amelio, L., Fulle, S., Fano, G., Protasi, F., 2006. Progressive disorgani-zation of the excitation–contraction coupling apparatus in aging human skeletalmuscle as revealed by electron microscopy: a possible role in the decline of muscleperformance. J. Gerontol. A Biol. Sci. Med. Sci. 61, 995–1008.
Brown, M., Sinacore, D.R., Host, H.H., 1995. The relationship of strength to function inthe older adult. J. Gerontol. A Biol. Sci. Med. Sci. 50, 55–59.
Callahan, D., Phillips, E., Carabello, R., Frontera, W.R., Fielding, R.A., 2007. Assessment oflower extremity muscle power in functionally-limited elders. Aging Clin. Exp. Res.19, 194–199.
Clark, D.J., Fielding, R.A., 2011. Neuromuscular contributions to age-related weakness.J. Gerontol. A Biol. Sci. Med. Sci.
Clark, B.C., Manini, T.M., 2008. Sarcopenia=/=dynapenia. J. Gerontol. A Biol. Sci. Med.Sci. 63, 829–834.
Clark, D.J., Patten, C., Reid, K.F., Carabello, R.J., Phillips, E.M., Fielding, R.A., 2010.Impaired voluntary neuromuscular activation limits muscle power in mobility-limited older adults. J. Gerontol. A Biol. Sci. Med. Sci. 65, 495–502.
Dalton, B.H., Power, G.A., Vandervoort, A.A., Rice, C.L., 2010. Power loss is greater in oldmen than young men during fast plantar flexion contractions. J. Appl. Physiol. 109,1441–1447.
Deschenes, M.R., Roby, M.A., Eason, M.K., Harris, M.B., 2010. Remodeling of the neuro-muscular junction precedes sarcopenia related alterations in myofibers. Exp.Gerontol. 45, 389–393.
Fielding, R.A., LeBrasseur, N.K., Cuoco, A., Bean, J., Mizer, K., Fiatarone Singh, M.A., 2002.High-velocity resistance training increases skeletal muscle peak power in olderwomen. J. Am. Geriatr. Soc. 50, 655–662.
Foldvari, M., Clark, M., Laviolette, L.C., Bernstein, M.A., Kaliton, D., Castaneda, C., Pu, C.T.,Hausdorff, J.M., Fielding, R.A., Singh, M.A., 2000. Association of muscle power withfunctional status in community-dwelling elderly women. J. Gerontol. A Biol. Sci.Med. Sci. 55, M192–M199.
Folstein, M.F., Folstein, S.E., McHugh, P.R., 1975. “Mini-mental state”. A practical meth-od for grading the cognitive state of patients for the clinician. J. Psychiatr. Res. 12,189–198.
Guralnik, J.M., Simonsick, E.M., Ferrucci, L., Glynn, R.J., Berkman, L.F., Blazer, D.G.,Scherr, P.A., Wallace, R.B., 1994. A short physical performance battery assessinglower extremity function: association with self-reported disability and predictionof mortality and nursing home admission. J. Gerontol. 49, M85–M94.
613R.M. Pojednic et al. / Experimental Gerontology 47 (2012) 608–613
Henwood, T.R., Taaffe, D.R., 2005. Improved physical performance in older adultsundertaking a short-term programme of high-velocity resistance training. Geron-tology 51, 108–115.
Lanza, I.R., Towse, T.F., Caldwell, G.E., Wigmore, D.M., Kent-Braun, J.A., 2003. Effects ofage on human muscle torque, velocity, and power in two muscle groups. J. Appl.Physiol. 95, 2361–2369.
Maganaris, C.N., Narici, M.V., Reeves, N.D., 2004. In vivo human tendon mechanicalproperties: effect of resistance training in old age. J. Musculoskelet. Neuronal.Interact. 4, 204–208.
Metter, E.J., Conwit, R., Tobin, J., Fozard, J.L., 1997. Age-associated loss of power andstrength in the upper extremities in women and men. J. Gerontol. A Biol. Sci.Med. Sci. 52, B267–B276.
Morse, C.I., Thom, J.M., Birch, K.M., Narici, M.V., 2005. Tendon elongation influences theamplitude of interpolated doublets in the assessment of activation in elderly men.J. Appl. Physiol. 98, 221–226.
Narici, M.V., Maganaris, C.N., 2007. Plasticity of the muscle-tendon complex withdisuse and aging. Exerc. Sport Sci. Rev. 35, 126–134.
Ng, A.V., Kent-Braun, J.A., 1999. Slowed muscle contractile properties are not associat-ed with a decreased EMG/force relationship in older humans. J. Gerontol. A Biol.Sci. Med. Sci. 54, B452–B458.
Nogueira, W., Gentil, P., Mello, S.N., Oliveira, R.J., Bezerra, A.J., Bottaro, M., 2009. Effectsof power training on muscle thickness of older men. Int. J. Sports Med. 30,200–204.
Petrella, J.K., Kim, J.S., Tuggle, S.C., Bamman, M.M., 2007. Contributions of force andvelocity to improved power with progressive resistance training in young andolder adults. Eur. J. Appl. Physiol. 99, 343–351.
Reid, K.F., Callahan, D.M., Carabello, R.J., Phillips, E.M., Frontera, W.R., Fielding, R.A.,2008. Lower extremity power training in elderly subjects with mobility limita-tions: a randomized controlled trial. Aging Clin. Exp. Res. 20, 337–343.
Roos, M.R., Rice, C.L., Connelly, D.M., Vandervoort, A.A., 1999. Quadricepsmuscle strength,contractile properties, andmotor unitfiring rates in young and oldmen.MuscleNerve22, 1094–1103.
Sayers, S.P., Gibson, K., 2010. A comparison of high-speed power training and tradi-tional slow-speed resistance training in older men and women. J. Strength Cond.Res. 24, 3369–3380.
Sayers, S.P., Guralnik, J.M., Thombs, L.A., Fielding, R.A., 2005. Effect of leg muscle con-traction velocity on functional performance in older men and women. J. Am.Geriatr. Soc. 53, 467–471.
Valour, D., Ochala, J., Ballay, Y., Pousson, M., 2003. The influence of ageing on the force–velocity–power characteristics of human elbow flexor muscles. Exp. Gerontol. 38,387–395.
Van Roie, E., Verschueren, S.M., Boonen, S., Bogaerts, A., Kennis, E., Coudyzer, W.,Delecluse, C., 2011. Force–velocity characteristics of the knee extensors: an indica-tion of the risk for physical frailty in elderly women. Arch. Phys. Med. Rehabil. 92,1827–1832.
Yamauchi, J., Mishima, C., Nakayama, S., Ishii, N., 2009. Force–velocity, force–power rela-tionships of bilateral and unilateral leg multi-joint movements in young and elderlywomen. J. Biomech. 42, 2151–2157.
Top Related
Copyright © 2022 FDOKUMEN

