


Bahasa
Halaman
Hukum

The Returns to Hedge Fund Activism: An International Study
Marco Becht
Solvay Brussels School, Université libre de Bruxelles, CEPR and ECGI
Julian Franks
London Business School, CEPR and ECGI
Jeremy Grant
CM-CIC Securities
Hannes F. Wagner
Bocconi University
27 May 2014
Revised 2 March 2015
We are grateful to Alon Brav, Nick Gantchev, Robin Greenwood, Pedro Matos and Janis Skrastins as well as participants at the Transatlantic Corporate Governance Dialogue (TCGD) in Washington D.C. in December 2011, the EU-ASIA Corporate Governance Dialogue Inaugural Conference in Tokyo in June 2012, the European Financial Management Association in Rome in June 2014, and the European Finance Association in Lugano in August 2014, and seminar participants at Bocconi University, Koç Business School, the London Business School, Rotterdam University, University of Oxford and Tilburg University for comments. Song Zhang and Yordana Mavrodieva provided excellent research assistance. We acknowledge research support from the ESRC (Grant No. R060230004), the London Business School’s Centre for Corporate Governance, the BNP Paribas Hedge Fund Centre, the Goldschmidt Chair at the Solvay Brussels School of Economics and Management, Université libre de Bruxelles and the PEGGED (Politics, Economics and Global Governance: The European Dimensions) collaborative research project supported by the Seventh Framework Programme for Research and Technological Development (Contract no. SSH7-CT-2008-217559).
The Returns to Hedge Fund Activism: An International Study
Abstract
This paper provides evidence that returns to hedge fund activism are driven by engagement outcomes. We use a sample of 1,740 activist engagements from 23 countries to estimate performance of activism across North America, Europe and Asia. Striking differences emerge across countries in outcomes of the engagements. It is these differences that explain the variation in performance of activism. Although there is evidence that activists put companies into play, frequently those takeovers are preceded by significant and profitable governance changes. While the U.S. model of activism has been copied by foreign activists, non-U.S. activists outperform U.S. activists in their domestic markets
JEL Classification: G32
Key words: Shareholder activism, hedge funds, active ownership, institutional investors
In what can only be considered a form of extortion, activist hedge funds are preying on American corporations to create short-term increases in the market price of their stock at the expense of long-term value. Prominent
academics are serving the narrow interests of activist hedge funds by arguing that the activists perform an important service by uncovering “under-valued” or “under-managed” corporations and marshalling the voting power of institutional investors to force sale, liquidation or restructuring transactions to gain a pop in the price
of their stock. (Lipton, 2013, http://blogs.law.harvard.edu)
I. Introduction
Shareholder activism has gone global. In the U.S., where activism originated, it remains controversial,
as illustrated by Martin Lipton’s comment cited above. Internationally, there is at best limited evidence
about the incidence of activism, its track record of achieving change in target firms, and activists'
performance. Our paper is the first to try to provide this evidence; we do so in four stages. First, we
document the incidence and characteristics of public activism across 23 countries in Asia, Europe, and
North America. Second, we provide a comprehensive analysis of activist engagements’ performance
internationally, using common definitions and methodology. Third, we analyse how successful activists
have been in achieving specific outcomes during the engagements with target firms, and how those
outcomes differ across countries. Finally, we investigate how the target’s share price performance over
the period of the engagement depends on the specific outcomes achieved.
We analyse in total 1740 activist interventions, mainly initiated by hedge funds and focus funds,
during the 2000-2010 period. The three largest markets for shareholder activism are the U.S. with 1125
interventions, Japan (184), and the U.K. (165). Combined, these three represent 85% of all public
interventions. Despite this apparent concentration, activism is a widespread phenomenon that provides
an important disciplining device in the large majority of countries in our sample. While this is known
for countries such as the U.S., we find that activism is also frequent in France, Germany, Italy and
South Korea, countries not usually associated with active markets for corporate control. We also find
that while activist engagements are frequent in many stock markets, success differs significantly across
countries.
1

Our sample covers 330 different activists. There are four funds that have at least forty
interventions, Steel Partners, Carl Icahn, Value Act Capital Partners, and Ramius, all of which are U.S.-
based; those four funds account for 14 percent of the total. In most countries, we document a steady
rise in activist interventions during the sample period until 2007, and a sharp subsequent drop in 2008-
2010, the years of the post-Lehman financial crisis. Our international dataset allows us to benchmark
the performance of U.S. activists at home against their performance overseas, and against their foreign
peers, who themselves engage both domestic and foreign targets. Most funds have a clear domestic
focus, but foreign engagements account for 24 percent of the total and have significantly different
performance from domestic activism. Another important characteristic of our data is that some
engagements involve more than one hedge fund, often described as a ‘wolf pack’. We estimate that
wolf packs account for roughly one fifth of all engagements and show that they achieve some of the
highest returns for target shareholders.
How do activist engagements perform? We know a significant amount about performance from
prior studies for the U.S., with some additional evidence for the U.K., Japan and Germany. The
conventional measure of activists’ performance is abnormal returns around the public announcement of
the activist’s stake. We find abnormal announcement returns of 7% for the U.S. during a (-20, 20) day
window, which are similar to those reported by Brav, Jiang, Partnoy, and Thomas (2008), Clifford
(2008), Klein and Zur (2008) and Greenwood and Schor (2009). The European and Asian
announcement returns are significant at 6.4% and 4.8%, respectively, comparable to the U.S., but larger
than those previously reported for the U.K. (Becht et al. 2009), Germany (Bessler, Drobetz and Holler
2013) and Japan (Hamao, Kutsuna and Matos 2011).
How successful are activists in their engagements with target firms? For this analysis, we
identify the outcomes of each engagement, including changes to payout policy, governance, corporate
restructuring and takeovers. Compiling data on activist outcomes internationally is particularly
2

challenging; while activists engaging U.S. listed firms need to provide information on the stated
purpose of their investment in Schedule 13D filings, no equivalent exists elsewhere. Through extensive
news searches, we identify any outcomes of the engagements.
For the entire sample, the unconditional probability of an activist being successful in achieving
at least one engagement outcome is 53 percent. However, the incidence of outcomes varies
considerably across countries. For example, for North American targets, activists achieve outcomes in
61 percent of all engagements, while success rates are 50 percent in Europe, and 18 percent in Asia. It
is hence surprising that the disclosure returns are so similar across regions. We show that both the
incidence of outcomes as well as the type of outcome dramatically affects the abnormal returns over the
entire holding period of the activist from block disclosure to exit.
The announcement of outcomes contributes significantly to holding period returns during the
engagement. Abnormal returns around the announcement of outcomes average 6.4 percent across all
countries during a (-20, 20) window, with the highest returns of 8.8 percent in Europe, 6.0 percent in
North America and 2.7 percent in Asia. These returns are in addition to the block disclosure returns for
the subsample of engagements with outcomes. Abnormal returns vary considerably across types of
outcome, for example, takeovers provide abnormal returns averaging 9.7 percent, while other forms of
restructuring average 5.6 percent. Changes to boards have returns of 4.5 percent and payout changes
minus 0.2 percent only. To investigate the potential importance of governance changes initiated by the
activist, we test whether engagements with multiple outcomes, for example a board change or spin off
followed by a takeover, have a higher total return than a single outcome such as a takeover. If multiple
outcomes offer higher returns than single outcomes this would suggest, for example, that governance
changes prior to takeover improve the profitability of the engagement. We compare returns to
engagements where there are multiple types of outcome, with single events. The differences are
striking, in particular, engagements with multiple outcomes that involve a takeover have abnormal
3
returns of 18.1 percent, whereas those engagements with only the outcome of a takeover have abnormal
returns of roughly half that size (9 percent).
In the absence of publicly observable outcomes, we expect the stock price reaction to the
announcement of an activist engagement to reverse itself when it has become clear that the market no
longer expects the activist to achieve an outcome. To test this, we compare abnormal returns from the
first disclosure date of the engagement by the activist to its disclosed exit for two subsamples of
engagements, with and without outcomes, using portfolio abnormal returns calculated in calendar time.
On an annualized basis using a Fama-French four factor model, activism with outcomes
generates value-weighted abnormal returns over the engagement period of 8.0 percent, compared with
2.3 percent for activism without outcomes. When returns are equal-weighted, activism with outcomes
generates annualized abnormal returns of just 1.1 percent, compared with minus 9.8 percent without.
Activism therefore generates positive alpha on average in large firms, but in all engagements the
returns crucially depend on the activist achieving outcomes. The differences are economically
significant, although not always statistically significant. Our interpretation is that the achievement of
outcomes resolves the uncertainty at the block disclosure date about the activist’s chances of success.1
Results by region confirm that outcomes are crucial for generating positive abnormal returns
everywhere. For example, value-weighted annualized abnormal returns using a Fama-French four
factor model in Asia are 13.2 percent with outcomes, compared with 0.6 percent without outcomes.
The results for Europe are 8.1 percent with outcomes and 3.2 percent without, and in North America
engagements generate 6.6 percent with outcomes, and minus 1.2 percent without.
1 We find that fund size, measured by number of engagements during the sample period, does not affect performance. We classify large funds as those having at least 20 engagements in our sample. We test whether large funds exhibit different performance from other funds with respect to initial public disclosure, engagement outcomes, and long-term performance from entry to exit. We do not find any evidence of differential performance.
4
Our evidence so far indicates that shareholder activism is successful in creating shareholder
value across countries. While the probability for achieving such outcomes is highly variable across
countries, and the value of an outcome depends significantly on its exact nature, the business model of
activist shareholders appears to be remarkably similar internationally. One question therefore is
whether our international sample is effectively capturing U.S.-style activism only. We explore this
issue by distinguishing between U.S. activists and non-U.S. activists, and the way they perform
domestically versus internationally. We find that on average U.S. activists are most successful in their
home market, where they have the highest probability of achieving outcomes. This result is not limited
to U.S. hedge funds; we find that domestic activism generally is more successful than foreign activism.
Notwithstanding, activists tend to specialize, and only a small minority of U.S. activists in our sample
(24 out of 261 funds) engage both domestic and foreign target firms. For this subsample of 24 funds we
find that the probability of achieving outcomes in foreign engagements is strongly positively related to
how focused these U.S. funds are on foreign engagements. Funds that predominantly target domestic
firms exhibit significantly lower levels of outcomes in foreign engagements. Activists are not
successful in both domestic and foreign markets, rather they are only successful where they specialize
geographically.
Wolf packs are an important characteristic of engagements across countries. Our estimate of the
incidence of wolf pack engagements is conservative, since we can only observe activist stakes that are
either above the specific regulatory threshold or which are voluntarily disclosed. Wolf packs invest in
similar size target firms to engagements involving a single fund only, but control in aggregate larger
ownership stakes and have significantly greater disclosure returns, 14 percent versus 6 percent. This
reflects the much higher probabilities of generating an outcome, 78 versus 46 percent.
How do these results compare to prior research? In Asia, Hamao, Kutsuna and Matos (2011)
report abnormal long-term returns equivalent to 12 percent annualized from entry to exit for domestic
5
and foreign shareholder activism in Japan. We extend this by showing that positive abnormal
performance only obtains for deals with outcomes, which are generally rare in Asia. For Europe the
evidence is limited.2 For North America, the two most closely related papers are Brav, Jiang, Partnoy,
and Thomas (2008), and Greenwood and Schor (2009), who analyse domestic U.S. activism. Brav et al.
(2008) provide evidence that U.S. activist engagements have higher block disclosure returns when the
activist is successful in achieving its stated objectives3. We extend this by quantifying the contribution
that disclosure returns and outcome returns make to the overall long-term performance of the activist.
We also show that the performance of U.S. activists engaging domestic target firms is significantly
higher than their performance abroad. Greenwood and Schor (2009) examine outcomes in the 18
months following activist engagements and in particular the incidence of takeovers. They conclude that
for the U.S. at least, ‘hedge funds invest in small, undervalued companies with the ultimate goal of
seeing those targets bought out […] it follows that the activists are less interested in making corporate
governance changes that might improve the firm’. Our results show that a significant proportion of
activists’ exits via a takeover also involve other governance outcomes during the engagement. In these
cases, takeovers are almost always the final outcome achieved by activists, and board changes the first.
We compare the performance of activist engagements which include multiple outcomes with single-
event takeover engagements and find that the former perform significantly better, on average. Further,
we show that activists are successful in creating shareholder value even in scenarios that do not involve
a takeover, such as restructurings and changes to payout policy. These results suggest a more
2 In the U.K., Becht et al. (2009) report significant abnormal long-term returns equivalent to 10.3 percent annualized using Fama-French four factor alpha, but their analysis is based on a small sample of 41 mostly private engagements by a single activist. In Germany, Bessler, Drobetz and Holler report insignificant abnormal returns equivalent to 6.7 percent annualized using Fama-French four factor alpha for a sample of 231 engagements, but these returns are for fixed-length 36 months windows, and the sample inclusion criteria differ from ours. 3 In a recent paper, Bebchuk, Brav and Jiang (2014) analyze U.S. targets and find no support for the claim that activism has negative long-term effects on target performance.
6
significant role for shareholder activists in value-creating governance changes than previously
documented.
Our results make several contributions to the literature. To our knowledge, we are the first to
document the prevalence, performance and specific outcomes of activist engagements for a large cross-
section of countries. We base our analysis on a standardized set of engagements and engagement
outcomes that allows us to perform tests across jurisdictions.
Second, we extend prior work by Clifford (2008), Klein and Zur (2008), Gantchev (2013),
Bebchuk, Brav and Jiang (2014) and particularly Brav et al. (2008), and Greenwood and Schor (2009),
who analyse the short-term and long-term performance of U.S. target firms. We show that activism
outside the U.S. similarly depends on the activist achieving outcomes. We also find that not all types of
activism are equally beneficial. Activist engagements appear to create only modest or no shareholder
value when the activist achieves changes in the board structure or the payout policy of target firms
without other accompanying outcomes, such as a restructuring. Instead, activist engagements that focus
on restructuring, particularly via takeovers, or multiple outcomes, generate significant value for
shareholders. This result extends and modifies the evidence in Greenwood and Schor (2009), who
argue that activists’ role is largely to ‘put companies into play’.
Third, we use our international dataset to benchmark domestic against foreign activism, and
U.S. activists against their foreign peers. Our findings complement the prior literature focusing on the
role of institutional investors and specifically foreign institutional investors for shareholder value (e.g.
Gillan and Starks 2003, Ferreira and Matos 2008, Leuz, Lins, and Warnock 2009, and Aggarwal et al.
2011). Our results suggest that while foreign institutions’ investments tend to be credited with
generating relatively larger benefits for minority shareholders, this advantage does not appear to carry
over to hedge fund activism.
7
Fourth, we provide the first comprehensive evidence of hedge fund wolf packs internationally.
Wolf pack engagements are significantly more profitable than stand-alone engagements, and have
higher probabilities of achieving outcomes. Wolf pack activists’ success appears to derive not only
from larger stakes in target firms, but also from greater influence on other parties.
The remainder of the paper is structured as follows. Section 2 discusses the related literature on
shareholder activism and describes the differences in legal rules that shape activism across countries. In
Section 3, we describe our data and summary statistics, while Section 4 lays out our methodology and
hypotheses. Section 5 provides our findings and robustness tests. Section 6 concludes.
II. International Activism
A. Prior empirical literature
High profile shareholder engagements in 2004-2006 in the U.S., Europe and South Korea were widely
reported in the media and have stimulated a new empirical literature.4 Hedge funds were identified as
“the most dynamic and most prominent shareholder activists” (Kahan and Rock 2007) and being
fundamentally different from traditional activism conducted by large institutional investors such as
public pension funds and insurance companies (Gillan and Starks 2007).5
Traditional activists tend to focus on dismantling takeover defenses, introducing cumulative
voting, corporate social responsibility and special audits (Karpoff 2001, Gillan and Starks 2007 and
Agrawal 2012 for the US; Morgan and Wolf 2007 for Canada; Cziraki, Renneboog and Szilagyi 2010
for Europe and Buchanan, Netter, Poulsen and Yang 2012 for the U.S. and the U.K.). In contrast, hedge
fund activists seek direct influence over business decisions and strategy. Their demands include spin-
offs, the breakup of conglomerates, restructuring the balance sheet, cash-payouts, changes in
4 For example the Economist on 11 May 2006 ran a special report on hedge fund activism entitled “Battling Corporate America”. 5 The authors review shareholder activism in the U.S. and call hedge fund activists “the new kids on the block” (p. 68). In the U.S. individuals have filed the largest number of non-binding shareholder proposals since 1943.
8
management or the reversal of a board decision. Hedge funds also engage in “corporate control
activism” (Kahan and Rock 2007); they seek to prevent acquisitions, hold out against bidders in
takeovers or facilitate the takeover of a target company.
Hedge fund activists also have superior financial resources. Activist specialists frequently hold
relatively few positions that are often large in value and charge significant fees.6 Again this is in stark
contrast with traditional institutional investor portfolios that contain hundreds or thousands of stocks
and where the main objective is cost minimization.
Hedge funds also employ more interventionist tactics. Traditional activists largely confine
themselves to filing shareholder proposals, writing letters, speaking at general meetings and talking to
the media.7 Hedge fund activists also employ these techniques but they go much further. They often
request meetings with the company chairman or the CEO and they are willing to become involved in
board elections and to litigate. They solicit support from other activists to form “wolf-packs” (Briggs
2007, Coffee and Palia 2014)8 and try to win the support of institutional investors and proxy advisers
(Alexander et al. 2010). They employ professional help, including communications agencies, proxy
solicitors and lawyers.9 Above all, hedge fund activists are willing to engage in board election contests,
pay for the election campaign, and target companies know it.10 Hedge funds are also associated with
6 The typical management fee for activist funds for the period under review is 2% plus an incentive fee of 20% of the excess returns above a high-water mark. 7 U.S. shareholder proposals from traditional activists are typically filed under SEC Rule 14A-8. They are included on the management's proxy statement and inexpensive but purely advisory and limited in scope. The proposals may not refer to ordinary business, board elections or conflict with a company proposal. 8 The SEC’s 1999 reform of shareholder communication prior to a proxy solicitation and Form 14A-12 is thought to have opened the floodgates to hedge fund activism and “wolf-pack” formation in the U.S. The Deutsche Börse AG case helped to clarify the concept of “concert party” in Europe. 9 Law suits initiated by hedge fund activists have helped to clarify the rules of contested board elections, for example in the Netherlands and South Korea (Kim 2009). 10 Gantchev (2013) estimates that the average U.S. public activist campaign that involves a proxy fight costs $10.5 millions; Buchanan et al. (2012) estimate the mean cost at US$543,753 and the median cost at US$150,00. Fos and Tsoutsoura (2014) show that proxy contests have negative consequences for incumbent U.S. directors, making them a powerful threat.
9
activism through “exit” (Admati and Pfleiderer 2009, Edmans 2009, Bharath, Jayaraman and Nagar
2013 and Norli, Ostergaard, and Schindele 2014).
A large body of research has conducted event studies around different types of activist events,
including management proposals opposed by shareholders or proxy advisers (Cai, Garner and Walkling
2009).11 The disclosure of a hedge fund activist stake (see below) and the announcement of a U.S.
proxy contest are the only events that are associated with a significant positive abnormal return and the
latter is related to the former; hedge fund activists and private equity firms sponsored 45% of U.S.
proxy contests between 2000 and 2006, while traditional activists sponsored none (Buchanan et al.
2012). The returns to all other types of activist disclosure are relatively small, insignificant or negative
(Yermack 2010).12
The incidence and short run returns to hedge fund activism through “voice” have been
documented in a number of country studies for different time periods, samples and windows. For the
U.S. this includes Brav et al. (2008) (1649 activist events 2001-2006); Klein and Zur (2008) (151
events 2003-2005); Boyson and Mooradian (2011) (418 events 1994-2005). There are few non-US
studies: Bessler, Drobetz and Holler (2013) provide evidence for Germany (231 interventions by hedge
funds and other investors, 2000-2006); Girard (2011) for France (6 hedge fund engagements 2001-
2008) and Hamao, Kutsuna and Matos (2011) for Japan (916 stakes by activists, 1998-2009).
The returns to hedge fund activism are measured around the disclosure of the initial stake and
over some fixed period, typically up to 720 days after the announcement. Performance is measured for
short-term windows around disclosure events and for longer windows from entry of the activist
onwards. Shares in the target companies significantly outperform the market over various time frames
11 They also include non-binding shareholder proposals on remuneration policies (“say-on-pay”; Cai and Walking 2011, Ertimur, Ferri and Muslu 2011, Ferri and Maber 2013) and small (Rule 14A-8) shareholder proposals in the U.S. (Ertimur, Ferri, and Stubben 2010; Levit, and Malenko 2011); binding shareholder proposals, in particular when they relate to contested board elections (Mulherin and Poulsen 1998, Fos and Tsoutsoura 2014). 12 At best the effect of a marginal non-binding vote is 2.8% (Cuñat, Gine, Guadalupe 2012) and even this return is likely to derive from the increased probability of a hedge fund activist intervention.
10
around the block disclosure date.13 Some studies measure long-run stock price returns over several
years and/or the impact on accounting performance (Clifford 2008, Brav, Jiang and Kim 2011 and
Bebchuk, Brav and Jiang 2014).
The U.S. studies identify engagement success by comparing the activist demand in the 13D
filing with the observed outcome of the engagement. A notable exception is Greenwood and Schor
(2009) who partition their sample into engagements that resulted in a takeover and those that did not.
These studies do not report abnormal returns around the disclosure of the outcome.
The sources of hedge fund returns are controversial. At least some of these gains may be at the
expense of other investors. Klein and Zur (2011) examine the potential wealth transfers from
bondholders to shareholders, forcing higher cash-payouts or increasing the risk profile of the target
companies. They find an average abnormal loss to bondholders of -3.9% around the initial 13D filing
and a loss of -6.4% over the subsequent year. Sunder, Sunder and Wongsunwai (2014) find that the
spreads on bank loans increase when activists pursue corporate control changes or financial
restructuring, but not for other types of intervention.
Studies of public activism do not capture activism that is conducted "behind closed doors".
Such private activism has been documented for the U.K. by Becht et al. (2009) for 30 engagements of
the Hermes UK Focus Fund. The fund was successful in achieving outcomes and produced significant
abnormal returns from 2000 to 2006, but lost considerable value during the financial crisis of 2008. The
fund never filed a shareholder proposal.
B. Activism and outcomes across jurisdictions
In this section we discuss the activist investment process and how activist actions map into outcomes in
different countries. Differences in laws, rules and institutions affect the strategies hedge fund activists
13 For an extensive survey of the initial U.S. evidence see Brav, Jiang and Kim (2009).
11
employ when they intervene in a company. The factors that may promote or obstruct activist actions
are taken into account before a hedge fund will invest in a target. Hence, the disclosure of a stake
signals that the fund believes that it has a sufficient number of levers at its disposal to succeed with its
intervention. In countries like South Korea, hedge fund activists have also helped to push the frontier
by seeking clarification of legal rules in the courts.
Some jurisdictions are friendlier to activists than others. Becht et al. (2009) and Becht, Franks
and Grant (2014) provide evidence that hedge fund activists will refrain from engaging if their due
diligence process reveals insurmountable legal or practical obstacles at the country or company level.
Knowledge of the composition of the shareholder base and the willingness of other shareholders to
work with the activists is also important. Hedge fund activists employ consultants, lawyers, proxy
advisers, proxy solicitors, as well as native speakers, for a custom made engagement strategy for each
company and country.
Country differences exist with respect to the legal rights of shareholders to call an extraordinary
general meeting (EGM), the ease of proxy solicitation, and the ease with which shareholders may
submit proposals to be voted on by the shareholder assembly. For example, in the U.K. and Japan only
5% and 3%, respectively, of shareholders are required to call an EGM, whereas in the U.S. (Delaware)
only directors can call an EGM unless that right is given explicitly to shareholders in the company’s
articles of association. In most jurisdictions shareholders have a right to access the shareholder register
facilitating a proxy contest; the exception is Germany where shareholders can only access their own
information.
Board appointment and removal rights also differ. For example, in Italy, minorities can appoint
their own director using proportional voting. In Sweden, a firm’s four largest shareholders can form a
nominations committee for board members and any shareholder can nominate board candidates prior to
the AGM. In the U.S., up until 2010, the incumbent board nominated all directors (with the exception
12

of hostile proxy contests) and shareholders could only vote for the board’s candidates or withhold their
vote. In most European countries, including the U.K. and France, a simple majority of shareholders
voting can dismiss directors without cause. In the U.S. as in Germany, directors can only be dismissed
with cause, although such a proposal requires a 75% majority of those voting.
In conclusion, it seems that activists adapt country specific strategies – threatening proxy
contests in the US, engaging in behind-the-scenes negotiations in the UK, using the courts to clarify
shareholder rights in South Korea and the Netherlands, and exerting influence through board
nomination committees in Sweden. The skill with which these country specific mechanisms are
utilised, and the recognition of their limitations, significantly determine the success of the activist
engagement.
C. Case Studies
To provide greater insight we link the disclosure of activist stakes to actions and outcomes in different
countries by providing a series of case studies from our data set. The case studies illustrate three main
points: how the activist intervention can be linked directly to observable outcomes and consequent
changes in firm value, how activist engagements follow certain identifiable patterns across countries
and engagements, and the influence of local culture and institutions.
U.K.
The U.K. is among the most shareholder activist friendly countries in the world (Black and Coffee
1994). Shareholder can easily requisition an extraordinary general meeting (EGM) and put forward
binding resolutions that need majority approval to pass. As Becht et al. (2009) show, the threat of an
EGM is usually sufficient to facilitate a negotiated outcome in the U.K. and this is reflected in the low
number of shareholder proposals: 496 binding proposals at 85 firms (2000-2006) of which 98% were
related to the election/removal of specific directors (Buchanan et al. 2012). Proposals are used
13
strategically and activists call EGMs to achieve their objectives when necessary. This is illustrated by
the case of F&C Asset Management, one of the U.K.’s largest asset managers. In 2010 Sherborne, a
U.K. domestic activist fund, requisitioned an EGM to restructure the board of F&C, so as to radically
alter the strategy of the company. The vote resulted in the removal of F&C’s chairman and another
director, and the appointment of three of Sherborne’s nominees, including their chairman. Sherborne
held 18% of F&C prior to the vote and received 70% support in favour of their proposals. Ten
institutional investors held stakes in F&C in excess of 3%, accounting for about 48% of the outstanding
shares. The company was subsequently acquired at a substantial premium in 2013. The takeover was
facilitated by the board changes initiated by the activist.
Germany
The German corporate governance system relies to a large extent on delegation from the shareholders
to a supervisory board of non-executive directors. Shareholders have strong board election rights, but
do not vote on many other corporate decisions. Like the U.S., hedge fund activism uses board elections
as its main level of influence to affect change. Shareholders in German corporations can call an EGM
and precipitate board elections with 5% of the shares, providing the shares have been held for a period
of at least three months, similar to the U.K. However, the solicitation of proxies by shareholders calling
the EGM is complicated by the use of bearer shares in Germany which permit anonymity, and even
then share registers are not public documents. Like the U.K., the threat of a contested board election
can be so strong that board changes are triggered without a hostile vote.
This is illustrated by the case of Deutsche Börse AG (DB), which changed its entire supervisory
board as a result of a landmark activist intervention. In 2004-2005 DB expressed an intention to acquire
The London Stock Exchange, and accumulated a considerable amount of cash for this purpose. By
2005, German-based investors owned less than 1% of the shares in DB with the majority of shares
14
owned by U.K. and U.S. investors, and board control had become contestable. The U.K.-based activist
fund TCI expressed opposition to the acquisition. TCI wished DB to drop the bid and distribute the
cash to shareholders. The supervisory board of DB refused. TCI had by then accumulated a 5% stake
and was in a position to call an EGM to remove the directors of the supervisory board. When several
foreign institutional investors, including Fidelity and the Capital Group, declared their support for TCI
it became clear that the foreign activist coalition had a majority of the votes and the ability to replace
the board. The CEO of DB resigned and the entire board was replaced at the next ordinary shareholders
meeting. The bid was withdrawn and the cash distributed to shareholders.
Sweden
Like in the U.K., the U.S. and Germany, in Sweden board elections are the main lever of activist
power. However, this influence does not derive from the threat of a hostile proxy solicitation or
requisitioning an extraordinary meeting, but operates through a nominations committee. The Swedish
Corporate Governance Code requires that listed companies should have an external nomination
committee composed of shareholders who propose candidates for the board including the chairman.
Representatives of the four largest shareholders in the company are usually appointed to the committee.
Our sample contains seven board related interventions in Sweden. In all cases, activists joined the
nominations committee and succeeded in appointing directors sympathetic to their goals. In all these
cases the observed outcomes are the direct consequence of the activist intervention. Plurality voting is
used, where the candidate with the largest number of votes is elected, in contrast to majority voting in
the U.K.
An illustrative example is Lindex AB, a leading Swedish retail clothing chain. It was identified
as a target by Cevian Capital, a domestic Swedish activist fund. It viewed Lindex as an attractive
restructuring candidate, as it traded at a ‘depressed valuation’ due to an unsuccessful expansion in
15
Germany. In October 2003, Cevian acquired a 16% block holding, making it the largest shareholder;
other investors were mostly institutional investors with small stakes. Cevian was a member of the board
nominations committee and therefore could influence board appointments without the need to call a
shareholders meeting. Its founder Christer Gardell was appointed as Chairman of Lindex and another
manager of Cevian served as a non-executive director. The nominations committee also recruited four
new board members and a CEO.
Japan
In theory, shareholder rights are stronger in Japan than in Europe and the U.S. 3% of outstanding shares
with voting rights held for at least 6 months are required to requisition an EGM. Just 1% of outstanding
shares are sufficient to propose a shareholder resolution at the AGM. If passed, the resolution is
binding on the firm. All shareholders have the right to inspect the shareholder register upon request.
However, “poison pill” defences were introduced in 2006, and over 80% of annual shareholder
meetings in Japan are organized on the same day, creating practical barriers to shareholder voting.
However, the main obstacle to shareholder hedge fund activism in Japan appears to be the
reluctance of institutional investors to support activists. A prominent example is NEC Electronics
(NECE), an engagement documented by Foley, Greenwood and Quinn (2008). The case illustrates the
unduly optimistic market reaction around the disclosure of an activist stake in Japan. NECE was the
listed semi-conductor manufacturing subsidiary of the Japanese electronics conglomerate NEC, which
held over 70% of the subsidiary. In late 2005 Perry Capital, a foreign hedge fund accumulated a 4.7%
position in NECE. In a letter Perry proposed a restructuring plan including reducing expenditure and
eventually exiting the communications division. The letter was released to the press and triggered a
10.6% abnormal return. Perry failed to secure meetings with senior management at the parent NEC,
who blocked the restructuring and instead campaigned for their own strategic plans with Japanese
16
investors. “While many investors were privately sympathetic to Perry Capital’s plans for NECE, none
were willing to help in a meaningful way …. many investors were being careful not to offend NEC”
(Foley, Greenwood and Quinn 2008, p.4).
In July 2007, Perry made an offer to purchase 25 percent of NEC’s stake in NECE at a 65%
premium. The deal was rejected by NEC and Perry was unable to secure meetings with NEC’s senior
management. In response, the fund increased its position in NECE to 6% and acquired a position in
parent NEC of under 5%. It then undertook a wide-scale lobbying effort, arranging over 250 meetings
with Japanese financial and government institutions over the next year. However, Perry was forced to
divest both positions as the financial crisis worsened with the collapse of Lehman Brothers in
September 2008. The cumulative abnormal return to the fund on its investment in NECE calculated on
public information was minus 38%.
Another example illustrating insufficient support from institutional shareholders is Japanese
Electric Power Development Co. (J-Power). In 2007 The Children’s Investment Fund (TCI) became
the company’s largest shareholder with a 9.4% stake, later raised to 9.9%. J-Power was Japan's largest
electric-power wholesaler, and had accumulated significant cash balances driven by strong domestic
demand for electricity, low interest payments (low leverage) and a lack of competition. The firm had
yet to disclose a strategic plan as to how it planned to spend its cash. TCI tabled shareholder proposals
for the AGM in June 2007, advocating a dividend increase. These were defeated by an 80% majority at
the meeting. In a further setback to TCI’s strategy, the Japanese Ministry of Economy rejected TCI’s
application to raise the stake in J-Power on the grounds of “energy security concerns”. In a final
attempt to press its agenda, TCI tabled proposals for the 2008 AGM again and undertook a proxy
contest. However, a majority of 60% of shareholders sided with management – on the face of it, a
surprising outcome as 40% of J-Power shares were held by foreign investors. Faced with intractable
opposition to their proposals, TCI divested its stake in October 2008 at a loss.
17
III. Data Description
We compile a database of public targets of activism covering Asia, Europe and North America. It
includes all interventions initiated between January 2000 and December 2010. We also had access to
the data compiled by Brav et al. (2008) for the U.S., covering the period and 2001-2006.14 In addition
we collect data on the outcomes of the engagements, in particular on takeovers, other types of corporate
restructuring, board changes and changes in payout policy.
The data have been collected from various sources. In all jurisdictions regulation requires
shareholders to disclose a position when stakes reach a threshold of between 1% to 5% of capital
and/or voting rights, depending upon the country and the type of security. For the U.S. our primary
source is the 13D Monitor database, which itself is based on SEC filings. It records entry and exit dates
of activists based on a 5% threshold disclosure.15
In Europe and Asia we use centralized country regulatory filings where available. 16 For
countries where regulatory filings are not released by a central agency, such as in the U.K., we rely on
Factiva for press articles and regulatory filings. For all three regions, we search with a set of keywords
that produces a large number of activist interventions. The names of the target company and the funds
involved were recorded and the case list was extended by searching for the fund names. Press articles
featuring high profile cases often include references to other interventions undertaken by the same
14 There are a considerable number of cases in Brav et al. that are not in our database and vice versa. We examine the first 80 cases alphabetically from a combination of Brav et al. and our sample and find that in 27 cases there is overlap in the two data bases; 19 cases are in our sample but not in Brav et al, 34 cases are in Brav et al. but not in our sample. Reasons for non-overlapping samples appear to be differences in exclusion criteria and search techniques. 15 To address the potential concern that cross-country differences in disclosure thresholds might create some type of bias in our results, we perform all of our analyses from Tables 5-12 excluding all engagements where the initial activist stake is below 5 percent, and thus below the regulatory threshold in some jurisdictions. This excludes 273 out of 1740 engagements in our sample. All of our results obtain for this smaller sample. 16 There is no centralized database of block disclosure in Europe comparable to the U.S. SEC Edgar database. Also, prior to 2007 there was no standardized form in Europe similar to 13D. Disclosure thresholds are 2% in Italy, 3% in the United Kingdom and 5% in the other countries in our sample. Equally, there is no EU-wide fund disclosure document comparable to the U.S. SEC’s Form 13F for reporting the size of portfolio holdings of the fund. A feature of the U.S. 13D is that the purchaser must state the intention of the purchase whereas in Europe this is not the case. Similar thresholds apply in Hong Kong, Japan and South Korea.
18
fund. We also use hedge fund client reports to complete the list of targets. For outcomes we rely on
news reports from Factiva.
In the sample of 1740 engagements, the U.S. has 1125 interventions, Japan 184 and the U.K.
165 (Panels A and B of Table 1). Combined, these three countries represent 85% of all public
interventions. There are six other countries with at least twenty interventions including Canada, France,
Germany, Italy, South Korea and The Netherlands. Table 1 shows the annual number of public
engagements initiated between 1 January 2000 and 31 December 2010. There is a steady rise until 2007
and a sharp subsequent drop in 2008-2010, the years of the post-Lehman financial crisis. Panel C of
Table 1 lists funds that have ten interventions or more. No one fund dominates the sample. There are
four funds that have at least forty interventions, with Steel Partners having the largest number of
interventions at 92. Most funds have a clear geographic specialization. The most “global” fund is TCI
with engagements in all regions. Steel Partners engage in Asia, the U.S. and the U.K., but not in
Continental Europe.
Panel D separates engagements by activist clienteles, into four categories. As the table shows,
most engagements are purely domestic, but foreign engagements account for 24 percent of the total. In
non-U.S. domestic engagements, non-U.S. activists engage target firms in their respective home
countries. These engagements, which are most frequent in the U.K., Japan and South Korea, constitute
12 percent of the total. U.S. domestic engagements with 64 percent are the main type of activism in our
sample. Non-U.S. activists engaging foreign firms and U.S. activists engaging non-U.S.-firms represent
12 percent and 13 percent of the sample, respectively. When investing abroad, both non-U.S. and U.S.
activists target firms most frequently in Japan, Germany and the U.K.
As Panel E shows, another important characteristic of our data is that some engagements
involve more than one hedge fund, often referred to as a “wolf pack”. Due to such multiple
engagements our sample contains 1,534 unique target companies that are involved in 1,740
19
engagements. In 22 percent of our engagements there are at least two hedge funds engaging with the
target firm during the same engagement. Among these engagements, 77 percent involve two hedge
funds, while 23 percent involve three or more. Since we can only observe activist stakes that either are
above the specific regulatory threshold or are voluntarily disclosed, our estimate of the incidence of
wolf pack engagements is conservative. Hedge funds that join the activists leading the engagement may
control smaller stakes that do not breach regulatory thresholds and may therefore not be disclosed.
To illustrate wolf pack engagements, consider the case of Deutsche Boerse, discussed earlier in
Section B. Atticus Capital disclosed a stake of 5 percent in Deutsche Boerse in August 2004, it was
joined by TCI with an 8 percent stake in January 2005. Both activists joined forces and, among other
goals achieved, replaced the CEO of Deutsche Boerse in 2005. Both funds exited in March 2009.
Figure 1 provides a time-series of overall activist engagement activity, broken down by new
engagements, exits, and outstanding engagements (i.e. the stock). The onset of the financial crisis in the
third quarter of 2007 coincides almost perfectly with a strong decline in activist activity. This decline is
due to a reduction in new engagements rather than an increase in exits.
Table 2 reports holding periods and exits. Of the total of 1740, 1270 engagements have
concluded as of 31 December 2010, the end of our sample period; for all other engagements the activist
has not exited or has not reported an exit. The largest number of engagements is initiated between
2004-2008, with a peak in 2007. The largest number of exits is recorded in the period 2006-2009, with
the peak in 2007/2008 and a drop-off in 2009 and 2010 (see Figure 1).
The last two columns of Table 2, Panel A show the average holding period for engagements and
the number of engagements without exit. Panel B breaks down exits by holding period of the activist.
As one would expect, for younger cohorts both the holding periods are shorter and the number of
engagements without exit are lower, because a higher percentage of engagements are still ongoing. The
20
average holding period is 1.7 years, or 624 days, and out of 1740 engagements, 470 have no reported
exit by December 2010.
Table 3 reports the total number of outcomes per year. The impact of the financial crisis is
clearly visible, with the total number of outcomes dropping from 212 in 2007 to 115 in 2008 and
further to 49 in 2009. The fall also persists as a proportion of the [reduced] level of outstanding
engagements. The decline is spread unevenly across types of outcomes: the number of board outcomes
continues to be relatively high while the number of takeovers, associated with activists, drops by 53%
between 2007 and 2008 and a further 31% in the subsequent year.
The level of activism activity appears significant as a mechanism for changing corporate
governance. Table 4 shows activist activity as engagements per year, and as engagements per 1,000
listed firms, and compares this to unsolicited takeover bids. Over the period 2000-2010, there are per
year roughly 20 engagements in Asia, 35 engagements in Europe, and 100 engagements in North
America. The number of activist cases in all regions far exceeds the number of unsolicited or what
might be described as hostile bids. In Asia activist engagements exceed hostile bids by 7 times
(19.8/2.8), in North America by 2.6 times (104.1/40.1), and in Europe by 1.7 times (34.6/20.5). Similar
results obtain when we use scaling per 1,000 listed firms instead of per year. A break-down by country,
for sample countries with at least 5 activist engagements during the sample period, confirms this result.
In 13 out of 16 countries, activism is more frequent than hostile takeovers.
We also investigate the dynamics of shareholder activism during our sample period more
formally and find that shareholder activism is highly autocorrelated: the level of activity in one quarter
is a good predictor for activist engagement activity in up to the eight subsequent quarters.17 This is
most pronounced in North America, and least pronounced in Asia. We also show, using Granger
causality tests, that the level of shareholder activism is not causally dependent on the performance of
17 We do not report these results in the paper. They are available upon request.
21
prior engagements, the activity level of the M&A market or the market for hostile takeovers. This
applies in all three regions. What determines the level of activism in a market therefore is an open
question. We suspect that macro factors play an important role, such as returns on alternative
investments, the asset flows into hedge funds, the relative decline in performance of other hedge fund
strategies, and regulatory events that in a specific country improve the probability of successful
engagements.
IV. Methodology and Tests
Most of the methodology and tests in this section relate to how we measure the performance of hedge
fund activism. A key issue in our analysis is the link between activism and shareholder returns via
outcomes achieved by activists across countries.18
We investigate three issues: First, what are the abnormal returns around the disclosure of
activist stakes? Second, what are the abnormal returns around the disclosure of outcomes and how do
these abnormal returns vary across different types of outcomes, such as takeovers, other forms of
restructuring, changes to the target company’s board, and changes in payout? Third, what are the long-
term abnormal returns to activism, and do they depend on outcomes?
Figure 2 describes the timeline of a stylized activist engagement from entry (1) to exit (5). Entry
is assumed to coincide with the disclosure date of purchase (3, e.g. a press report or regulatory filing) to
a subsequent report of a stake either being sold or falling below the regulatory threshold (4). The
activist engagement will typically have started prior to the initial disclosure, as the activist accumulates
a stake prior to the disclosure date and the activist may have held discussions with target management.
18 Our methodology does not allow us to identify the potential treatment effect of shareholder activism when compared to other types of corporate governance interventions, as this would require the inclusion of countries and companies that have not experienced an activist intervention.
22
When there are outcomes reported during the holding period these are classified by type and recorded
(3).
This study and comparable U.S. studies such as Brav et al. (2008) rely on public information.
For example, the main data sources in Brav et al. (2008) are regulatory 13D filings that are triggered by
the funds crossing a 5% voting interest threshold. Because of this, U.S. activism identified from 13D
filings tends to be biased towards more confrontational engagements in which the funds hold a larger
stake. What this study and other studies cannot capture is private activism, i.e. activism that is disclosed
to the target firm but not to the wider public and because of smaller stakes is not subject to regulatory
disclosure. We know from a separate analysis of proprietary data that private activism is comparable to
public activism in its aims and success rates, although it is more profitable.19
A. Disclosure returns
To measure the disclosure returns from a public engagement we compute cumulative abnormal returns
starting twenty days before the public disclosure on the basis that the stake will have been acquired
over a period prior to the disclosure date and it is likely that there will be run-up effects (Schwert
1996). To capture the full disclosure effect we also trace returns for twenty days after disclosure.
Cumulative abnormal returns are obtained from country-specific market models.
B. Long term performance
We measure the long-term returns of activist engagements over the holding period of the activist, i.e.
from the initial filing date or the first press disclosure date until the exit date. We construct activist
portfolio returns in calendar time. The portfolio is rebalanced each month to include all firms in the
19 Becht, Franks and Grant (2014) rely on proprietary information from five European funds about all their private and public engagements during the period 1997-2008, including purchase dates, exit dates, engagement intention and outcomes. The sample contains 131 engagements, of which 53 are private engagements unreported in the press or regulatory proceedings.
23
month that are subject to an ongoing activist engagement. For each month from January 2000 to
December 2010, we form equal- and value-weighted portfolios and drop all firms where activists have
exited and add all firms that have newly been engaged by activists. The excess returns of this portfolio
are regressed on the excess return of the market and the four Fama and French (1993) and Carhart
(1997) mimicking portfolios. To illustrate, for the four factor model we regress
, , , , , , , , ,( ) ,p t f t P P RMRF m t f t P SMB t P HML t P MOM t P tR R R R SMB HML MOMα β β β β ε− = + − + + + +
where RMRF, SMB, HML, and MOM, are the excess return of the market, the difference between a
portfolio of small stocks and big stocks, the difference between a portfolio of high book-to-market and
low book-to-market stocks, and the difference between a portfolio of high and low momentum stocks,
respectively, and all based on U.S. stocks. We also estimate specifications where the excess returns of
the activist portfolio are regressed on excess returns of a region’s market, where the regional market
excess returns are weighted averages of the sample countries in that region, net of the U.S. risk-free
rate. αP, or Alpha, is the estimate of monthly abnormal performance of the target portfolio.
C. Outcomes and performance
We analyse in two ways whether successful engagement outcomes matter for the overall performance
of activist engagements. First, we measure announcement returns in response to observable activist
outcomes, such as a board change in the target firm. For all such outcome events we perform event
studies using (-20, 20) day event windows around the outcome announcement dates. In the case of
multiple outcomes for a single engagement we sum up the returns over all outcomes. Second, we
separate engagements by whether the activist achieves at least one outcome, or not, and analyse long-
term performance of both subsamples separately. We might expect that where there are no observable
outcomes from the engagement, the long-term performance during the entire holding period should be
24

very close to zero or even negative. Successful outcomes however should lead to positive long-term
performance, if the outcomes achieved by the activist meaningfully affect the value of the firm.
D. Wolf pack engagements
An important characteristic of our data is that some engagements involve more than one hedge fund,
referred to as a wolf pack. We identify wolf packs by considering the time series of activist
engagements in each firm in our sample and define an activist as being part of a wolf pack if the
holding period from entry to exit overlaps with another activist’s holding period. In 22 percent of our
engagements there are at least two hedge funds engaging with the target firm during the same
engagement. We observe wolf packs that include up to four activists. In a wolf pack engagement,
hedge funds’ investments in the target firm overlap in time. We address this overlap in two ways. First,
where we analyse data at the level of the individual hedge fund, we attribute any outcome achieved by
a wolf pack to all activists that are engaged at that time. By doing so we capture the potential share
price reaction of the target firm in response to an outcome for all wolf pack members, even if press
statements attribute that outcome to one hedge fund only. Second, where we analyse data at the level of
an activist engagement, we treat the entire wolf pack as one engagement and consider any achieved
outcome only once, avoiding the double counting of outcomes.
V. Results
In this section we describe our results. We report abnormal returns around the block disclosure date,
around the outcomes of engagements, and around the exits of activists. We examine how these returns
differ depending on whether the activist is a domestic or foreign investor, and we investigate the
performance of activist wolf packs. We then analyse the long-term abnormal returns for the entire
25

holding period from entry of the activist to exit, comparing different samples, with and without
outcomes. Finally, we examine the cross-country determinants of activism outcomes.
A. Returns from activist engagement announcements
We begin by analysing the performance of activist engagements at the disclosure date across all
jurisdictions. Table 5 reports the abnormal returns around the disclosure date for two event windows,
21 days and 41 days (1617 out of 1740 engagement disclosures have sufficient data available). Panel A
reports the abnormal returns around block disclosures. For the (-20, 20) window, average abnormal
returns are 6.4% for the aggregate sample, significantly different from zero at the 1% level.
There is some variation across the three regions. For the same window, North America has the
highest disclosure returns at 7.0 percent, followed by Asia at 6.4 percent and Europe at 4.8 percent.
North American abnormal returns are lower than in Brav et al. (2008), who report abnormal returns of
8.4% for the same 41-day window in the U.S., but their results are based upon a shorter sample period
from 2001 to 2006, and do not include the period of the financial crisis. As Figure 3 shows, there is
some post-disclosure drift in abnormal returns in all three regions. The figure also shows the large
abnormal share turnover (calculated relative to average turnover prior to the event window) around the
activist engagement disclosure event. Share turnover increases by more than 80 percent over normal
turnover during the event period.
Focusing on the time series of disclosure returns for the full sample and by region in Panel B
shows that disclosure returns are on average higher during the early 2000s than during the late 2000s,
but variation between years is significant. The decline in disclosure returns is most pronounced in
North America, where, block disclosure returns over the period 2000-2005 average 10.5 percent, but
over the period 2006-2010 they are much lower at 5.8 percent. The year with the overall lowest
26
disclosure returns is 2007, the onset of the financial crisis, which coincided with lower probabilities of
successful outcomes, as we show below.
These abnormal returns around the disclosure of activist engagements should reflect the
probability and potential profitability of outcomes from the engagement. We would expect
engagements with realized outcomes to be associated with additional post-disclosure abnormal returns,
and those engagements without outcomes to be associated with losses post-disclosure.
B. Disclosure returns around outcomes
We next analyse the cumulative abnormal returns around the disclosure of observable outcomes of
engagements. We include an outcome only if it is included in the stated objectives of the activist as
described in the regulatory filing or news flow. Outcomes are categorized as “Board” (replacement of
the CEO, CFO, Chairman or Non-Executive Directors), “Payout” (share buybacks or increased/special
dividends) and corporate restructuring. We separate restructurings into “Takeover” (the target firm is
acquired by a strategic buyer or private equity fund), and “Restructuring” (divestitures and spin-offs of
non-core assets, and the blocking of diversifying acquisitions).
Table 6 reports the abnormal returns for all outcomes, again for (-10,10) and (-20,20) event
windows. Out of 1740 engagements 850 have at least one subsequent outcome and sufficient data to
calculate abnormal returns. A significant number of engagements, 139 in total, achieve outcomes of
more than one type. We split those further into those that, among other outcomes, include a takeover of
the target (“Multiple+Takeover”, 58 engagements), and those which do not (“Multiple+NoTakeover”,
81 engagements).
The average abnormal return for all announced outcomes for the 41-day window is 6.4%, and is
statistically significant at the 1% level (Panel A). The largest abnormal returns are generated by
takeover transactions that also involve other outcomes, at 18.1 percent. The second largest abnormal
27
returns are generated by pure-play takeover outcomes, at 9.7 percent. Engagements with multiple
outcomes that do not include a takeover are also large at 9 percent. All other types of outcomes have
smaller abnormal returns. Non-takeover restructuring, including divestitures and spin-offs, averages 5.6
percent. Payout is not distinguishable from zero at -0.2 percent. Board changes generate abnormal
returns at 4.5 percent. These results show that successful engagements have much higher levels of
returns than those shown at the disclosure date.
There are also interesting differences in outcomes returns across region, in Panel B. In Asia,
there are very few engagements with outcomes and the outcome returns, except for two engagements
with multiple outcomes, are small and for the (-20,20) window all returns are insignificant. In Europe
outcomes are much more frequent and they have the highest average abnormal returns across the three
regions with 8.8% for the (-20,20) window. Pure-play takeovers and takeovers involving other
outcomes stand out with 10.8 percent and 25.1 percent, respectively. Restructuring outcomes have
returns of 5.3 percent and engagements with multiple outcomes (but no takeover) have 10.3 percent.
Returns to payout and board changes are not significant. In North America engagements have the
highest probability of achieving outcomes. The average abnormal return is 6.0 percent and, like in
Europe, pure-play takeovers and takeovers involving other outcomes stand out with positive returns of
9.5 and 16.2 percent. Restructuring outcomes, engagements with multiple outcomes (but no takeover),
and board outcomes are also positive and significant, while payout outcomes are roughly zero. Finally,
Panel C considers only those 58 engagements from above with multiple outcomes that involve also a
takeover (Multiple+Takeover). If governance changes facilitate eventual takeovers, one would expect
takeovers to be the last outcome in the sequence of events during an engagement, and the results
confirm this to be the case. Engagements with multiple outcomes last 806 days on average, and
takeover outcomes are announced significantly later than all other types of outcomes. Board change
announcements instead precede them. To illustrate, among these 58 engagements, board changes are
28
announced about one third into the average length of such engagements; payout changes and
restructurings are announced roughly at half-time, and takeover outcomes are announced about three
quarters into the engagement period.
Figure 4 shows the time-series of outcomes achieved for activist engagements during the
sample period, aggregated over each quarter. Consistent with the increase in ongoing engagements, the
number of achieved outcomes increases strongly over time, from about 10 outcomes per quarter in
2000 and 2001, to around 80 outcomes per quarter in early 2007. As with total activist engagement
activity, the number of outcomes achieved collapses with the onset of the financial crisis, particularly
for takeover outcomes.
C. Disclosure returns around exits
Next, we consider the abnormal performance of target firms around hedge funds’ exit announcement.
Figure 5 and Table 7 show the average cumulative abnormal target return around the exit
announcement of activists. The event window is centered on the announcement of an exit. Average exit
returns are positive at 0.6 percent, but are not significantly different from zero. Abnormal trading
activity shows a spike around the exit announcement date. Further splitting exits into those where the
activist achieved an outcome and those where there was no outcome (not shown) does not yield
additional variation in exit returns. Overall, the exit by activists does not seem to convey significant
information to the market.
D. Performance by type of activism
Our evidence so far indicates that shareholder activism is successful in creating shareholder value
across countries. Similarities include: Activists generate positive abnormal returns if and only if they
manage to achieve outcomes, and the value of achieving an outcome depends significantly on the exact
29
nature of the change implemented by the activist. The business model of activist shareholders appears
remarkably similar internationally. One question therefore is whether we are effectively capturing U.S.-
style activism only, across countries.
To address this issue, we explore four different pairs for activist engagement: U.S. activists
engaging with target firms at home (U.S. domestic), non-U.S. activists engaging with targets in their
respective home market (non-U.S. domestic), U.S. activists engaging targets outside the U.S. (U.S.
foreign) and non-U.S. activists targeting firms outside their home market (non-U.S. foreign). This
allows us to benchmark the performance of U.S. activists at home against their performance overseas,
and against their foreign peers, who themselves engage both domestic and foreign targets. Domestic
engagements approximate three quarters of total engagements, with the other quarter being
engagements by foreign activists.
Table 8 reports engagement characteristics and performance partitioned by these four categories
of activist-target pairings. Comparing domestic activist engagements with foreign engagements, we
find that target firm size is smaller in domestic engagements, and they tend to have significantly higher
activist stakes, 7.9 and 9.4 percent for non-U.S. and U.S. domestic engagements, compared with 6.0
and 6.1 percent for non-U.S. and U.S. foreign engagements, respectively. There are no significant
differences in engagement characteristics between U.S. and non-U.S. domestic targets however.
Disclosure returns for domestic engagements are also significantly higher than for foreign deals,
with roughly 7 percent abnormal performance during the (-20, 20) event window for domestic
engagements compared with 3.7 percent for foreign engagements. Again, domestic engagements are
similar for U.S. and non-U.S. activists. This suggests that, assuming engagement costs are similar,
domestic activism is more profitable than foreign activism.
Among activists across all countries, U.S. activists targeting domestic firms have significantly
higher probabilities of achieving an outcome, which is not surprising given our earlier results on
30
outcomes in the US. However, this advantage is not one of U.S.-style activism per se, as it does not
carry over to U.S. activists targeting firms abroad. Instead, U.S. activists targeting foreign firms are no
different in their success rates from other non-domestic activists. More importantly, the higher success
rates of U.S. domestic activists does not translate into higher performance, apparently because the
higher incidence in achieving outcomes relates only to board and payout policy changes, which we
have shown are the least profitable types of outcomes. Controlling for type of outcome, domestic
engagements do not earn higher returns than foreign engagements. This suggests that the performance
of engagements within a country depends more on the governance and culture of that country, rather
than the import of a foreign model of activism.
We now turn to the engagement performance of those U.S. hedge funds which invest in targets
both domestically and overseas. This provides evidence about the extent to which the success of a
domestic engagement model can translate into successful foreign engagements.
There are 24 hedge funds in our sample which engage with both domestic and foreign targets,
out of a sample of 261 U.S. hedge funds. These include some of the largest funds in the sample by
number of engagements, Steel Partners, ValueAct Capital Partners, Carl Icahn, and Third Point. In
Figure 6 we plot, for each fund, the percentage of engagements that are foreign and the probability of
achieving at least one outcome in its foreign engagements. The left panel of the figure shows that the
probability of achieving outcomes in foreign engagements is strongly positively related to the foreign
focus of a fund, i.e. the proportion of its foreign engagements. For example, Wyser Pratte achieves
almost a 60 percent success rate in terms of outcomes in foreign engagements, when foreign
engagements constitute 90 percent of the fund’s total activity. Thus, a focus by the fund on foreign
engagements translates into a high success rate in terms of outcomes. In contrast, Highfields Capital
Management achieves less than a 20 percent foreign success rate and foreign engagements constitute
less than 25 percent of the fund’s activity. The implication here is that the low success rate in foreign
31
engagements is related to the lack of focus on foreign engagements. The right panel of the figure relates
the probability of achieving outcomes in foreign engagements to the probability of achieving outcomes
in domestic engagements. The graph is strikingly downward sloping for the sample of 24 hedge funds,
suggesting that success domestically does not translate into success overseas, and similarly success
overseas does not translate into domestic success. The evidence shows that activists are not successful
in both domestic and foreign markets; instead they are only successful where they specialize
geographically.
E. Performance of wolf pack activist engagements
Table 9 reports deal characteristics and deal performance for engagements that involve more than one
activist at the same time, i.e. wolf packs. The activists involved most frequently in wolf pack
engagements are Ramius (25 engagements), Steel Partners (23), Barington Capital Group (20), Third
Point (13) and Carl Icahn (10). Comparing stand-alone activist engagements with wolf pack
engagements, we find that target firm size is similar but wolf pack engagements tend to have
significantly higher activist stakes, 13.4 compared with 8.3 percent. Disclosure returns for wolf pack
engagements are also higher than for stand-alone deals, with roughly 14 percent abnormal performance
during the (-20, 20) event window around the engagement disclosure for wolf packs, and 6 percent for
stand-alone engagements. The higher announcement returns of wolf pack engagements coincide with a
much higher incidence of outcomes achieved for these deals: The probability of achieving at least one
outcome is 46% for stand-alone engagements, while it is 78% for wolf-pack deals. The higher
probability of achieving outcomes is mostly reflected in board change outcomes, but all categories of
possible outcomes are higher for wolf packs than for stand-alone activists. The higher success rate
plausibly reflects not only the larger share stakes but also the greater influence on the target from a
32
multiple of parties who share a common view about the need to restructure and how it should be done.
Wolf packs do not earn higher returns upon disclosure of outcomes. Therefore, it appears that the much
higher initial announcement returns of wolf packs versus stand-alone activists are driven by
expectations of wolf packs having higher probabilities of achieving the outcomes they seek, instead of
implementing more profitable outcomes.
The evidence presented on wolf pack engagements so far could be interpreted as the
endogenous response to information released by disclosure of the “lead wolf pack” stake. Engagements
with high probability of outcomes and high profitability might simply attract additional activists to join
the pack. Alternatively, as has been suggested, wolf packs increase the probability of a successful
outcome and thereby improve expected profitability. We test this by ordering the entry of activists by
time within a wolf pack, and calculating the abnormal returns to successive activists block disclosure
announcements. If the entry of activists following the first block announcement is opportunistic and
does not contribute to the probability and profitability of an outcome, we would expect abnormal
disclosure returns only in response to the first activist’s engagement. The evidence suggests otherwise:
For a (-20,20) event window, the cumulative abnormal return around the date of the disclosure of the
first member of the wolf pack is 7.8 percent (t-statistic 5.82). The abnormal return for the second
member’s disclosure date is 4.9 percent (t-statistic 3.10), and where there is a third member the
disclosure announcement is 7.1 per cent (t-statistic 1.50). While the first member of the wolf pack thus
triggers the largest announcement return, subsequent disclosures still generate large abnormal returns.
While this evidence is consistent with sequential learning through activist entry, it may also be that
wolf packs increase the probability of outcomes and thereby increase the profitability of the
engagement.
F. Long-term abnormal returns and outcomes
33
To obtain measures of overall performance of an engagement one could simply add disclosure
abnormal returns to outcome abnormal returns, but not all engagements have outcomes. To overcome
this problem, we calculate abnormal returns over the entire engagement period, from entry to exit of the
activist. This enables us to compare the profitability of engagements with and without observable
outcomes. In addition, we can determine if, in aggregate, post block disclosure returns are non-zero.
In Table 10 we report raw annualized returns from the time of disclosure of an activist stake to
exit, equal- and value-weighted. We require complete stock price series for each target firm from entry
to exit. 1187 out of 1740 deals have sufficient data available. 20
We separate engagements with at least one outcome from those without any outcomes. As
expected, returns are higher for engagements with outcomes compared with those with no outcomes.
The differences are economically significant, although not always statistically significant. This applies
to the full sample, and to the subsamples of Asia, Europe and North America, and to both equal- and
value-weighted returns. On an annualized basis, activism with outcomes generates value-weighted
returns of 11.1 percent, compared with 4 percent for activism without outcomes, although the
annualized difference of 7.1 percent is not significant. With equal-weighting, returns are 8.3 percent
with outcomes and -5.5 percent without, significant at the 1 percent level. We find results that are
roughly constant across regions. Value-weighted, annualized returns of firms successfully targeted by
activists versus unsuccessful ones are 15.4 versus 5.4 percent in Asia, 8.3 versus 4.6 percent in Europe,
and 11 versus 1.4 percent in North America. The long/short portfolio that holds the portfolio of
engagements with outcomes and sells short the portfolio of engagements without outcomes has a
positive return in all the regions, but it is not significant. With equal-weighting, returns overall
20 A potential concern is whether engagement outcomes may determine data availability and observed returns may thus be biased. For U.S. firms a comparison of our sample with the population of listed firms on CRSP suggests that activist engagements do not change the overall probability of a firm to delist: During our sample period, January 2000-December 2010, the percentage of firms that delist at any point is 34.1 percent in our sample and 34.2 percent outside our sample.
34

decrease, but more so for engagements without outcomes. As a result, the long/short portfolio earns an
annualized return of 12.7 percent in Asia, 14.5 percent in Europe, and 13.1 percent in North America,
always significant at the 5 percent level or better.21
In Table 11 we report estimates of abnormal long-term performance of firms targeted by
activists, using event portfolio returns calculated in calendar time. As previously described, the event
portfolio is rebalanced each month to include all firms in that month that are subject to an ongoing
activist engagement. The excess returns of this portfolio are regressed on the excess return of the
market (MktModel) and the four Fama and French (1993) and Carhart (1997) mimicking portfolios
(Carhart); the regression intercepts are annualized and provide our estimate of abnormal performance
of the target portfolio.22
Panels A and B report equal-weighted and value-weighted results for the regression intercepts,
Alpha. The table shows Alpha for deals with at least one outcome, for deals without any outcome, and
for the long/short portfolio that holds the portfolio of engagements with outcomes and sells short the
portfolio of engagement with no outcomes. In Panel A with equal-weighting, activist engagements with
outcomes produce annualized positive abnormal returns of 8.4 percent (MktModel) and 1.1 percent
(Carhart) for the entire sample, while engagements with no outcomes have abnormal returns of -5.5
percent (MktModel) and -9.8 percent (Carhart) and thus underperform similarly risky stocks. The
long/short portfolio’s return is 13.9 percent and 10.9 percent, respectively, significant at the 1 percent
level. We find similar results when we split portfolios by region. Significance levels remain high, as
deals with outcomes continue to generate positive abnormal returns in all regions, while deals without
21 The high buy-and-hold returns in North America for the no outcome sample are consistent with research on the impact of proxy contests (see DeAngelo and DeAngelo (1989), Bebchuk (2007) and Listokin (2008)), who find that failed contests generate outperformance in the target firm. 22 Factor portfolios in all regressions are based on U.S. stocks. We also estimate MktModel specifications where excess returns of the activist portfolio are regressed on region-specific excess returns of the market (based on weighted averages of country stock market indices of all sample countries in each region). Results are very similar, omitted for brevity, and available upon request.
35
outcomes generate zero or negative abnormal returns. In Panel B with value-weighting, abnormal
returns increase overall, to 11.3 and 8.0 percent with outcomes, and 4.0 and 2.3 percent with no
outcomes. Interestingly, larger deals even with no outcomes on average exhibit positive performance,
which leads to the long/short portfolio return being insignificant in all specifications of Panel B.
Overall, the results confirm that activist engagements without outcomes do not generate
significant shareholder value anywhere. Engagements with outcomes however generate value for
shareholders, particularly in large firms. It is unlikely that this consistent pattern across regions is a
coincidence. Positive returns to shareholder activism appear to come from engagements associated with
observable outcomes.
F. Determinants of activist engagement outcomes
Our analysis shows that outcomes are crucial for value creation by activists. But as we previously have
shown descriptively, outcomes are not evenly distributed across engagements. What determines
whether an activist achieves an engagement outcome? We analyse this in a multivariate setup in Table
12. It reports the results of probit regressions, where the dependent variable is whether the activist
achieves at least one outcome in columns 1 and 2, and whether the activist achieved at least one
specific type of outcome (board change, payout change, restructuring or takeover) in columns 3 to 10.
The independent variables include the region of the target firm, the holding period, whether the firm
was previously a target of activism, whether the activist is part of a wolf pack, the activist’s initial
stake, the size of the target’s market capitalization, the percent of the target’s shares that are closely
held, as well as fixed effects for all entry years, exit years, and one-digit SIC industries.
The results show that, relative to Asia as the base case, the probability of achieving an outcome
is roughly a third higher in Europe and almost 50 percent higher in North America. Outcomes become
significantly more likely if the engagement has been ongoing for longer, if it involves a wolf pack, if
36
the activist has a higher initial stake, and if the target firm is larger. The probability of achieving any
outcome is marginally lower if the target firm has been previously subject to investor activism. These
results confirm our previous univariate results that, controlling for the market cycle of activism and
both the characteristics of the target firm and the characteristics of the activist, engagements are
significantly less likely to achieve outcomes in Asia, relative to Europe and North America.
To provide a sense of country-specific outcome probabilities, Panel B repeats the probit
regressions from above, but uses country fixed effects instead of region fixed effects.23 The country
coefficients show that within regions, there is heterogeneity among countries with respect to the
likelihood with which activists achieve their goals. If all outcomes are considered, the countries where
activists have significantly lower success rates than in the U.S. are Japan (with the lowest success rate),
South Korea, the U.K., Italy, and Germany. Spain and Hong Kong have negative coefficients but they
are not statistically significant. Canada and the Netherlands are the only countries where outcomes are
significantly more likely than in the U.S.
When we consider the specific outcomes of board changes, payout changes, restructurings and
takeovers, country rankings differ considerably. Activists are most successful in Sweden with board
changes, in the Netherlands with restructurings, and in Norway, Luxembourg, Belgium and Canada
with takeovers. Interestingly, Belgium and Luxembourg are among the least successful countries
regarding other outcomes (board changes for Belgium and non-takeover restructurings for
Luxembourg). Of course, activist engagements and their specific goals are not randomly initiated
across countries. Still, ex post these country rankings to some degree reflect a record of activists’
success rates, conditional on institutional characteristics of countries. This would suggest, for example,
that activism in Japan and Spain is generally unlikely to be unsuccessful, no matter what the activist’s
23 The U.S. is now the base case, and countries with less than five engagements are grouped into a fixed effect for “Rest of world” (not reported).
37
objective might be, while activism in cases of restructuring may be very successful in the Netherlands,
and takeovers especially successful in Norway.
VI. Conclusion
Our paper, to our knowledge, is the first to provide large-sample evidence on the performance of
shareholder activism around the world. During the period 2000 to 2010, we analyze 1740 public
engagements by activist hedge funds across 23 countries and identify the outcomes of each
engagement, including changes to payout policy, governance, corporate restructuring and takeovers.
We show that activist engagements with outcomes exhibit positive and significant abnormal
performance for the entire engagement period, while activist engagements without outcomes do not.
Success of the activist business model as such appears to crucially depend on the activist achieving
outcomes. We also show that, where activists are successful in achieving their objectives, not all types
of activism are equally beneficial. Activist engagements appear to create little or no shareholder value
when the activist achieves changes in board structure and payout policy without corresponding
restructuring. Instead, activist engagements that are successful in achieving a corporate restructuring,
particularly a takeover, or multiple objectives, generate significant value for shareholders. The
evidence confirms that the expectation of outcomes, particularly with respect to takeovers, is a key
parameter for the activist business model. We provide evidence that shareholder activism has become a
global phenomenon. The U.S. model of activism has been successfully copied and suitably adapted by
foreign activists, who outperform U.S. activists in their domestic markets. Finally, we show that hedge
fund wolf packs, who we conservatively estimate to account for roughly a fifth of overall activism, are
among the most successful types of activism. We identify a positive relationship between the build-up
of a wolf pack and the market’s expectation of an activist outcome.
38

As illustrated by Martin Lipton’s comment cited in our introduction, shareholder activism
remains controversial. Our analysis however provides evidence that increases in shareholder value of
firms targeted by activists are not simply short-term. Increases in shareholder value due to activism are
also tightly linked to activists achieving their goals. In Europe and North America, where activists are
more successful in achieving outcomes, gains for shareholders are larger than in Asia, where activists
have seen limited success.
Of course, there are substantial caveats to our findings, most importantly related to how we
measure performance. The returns to activism that we measure may not be sufficiently adjusted for risk
taking, and the positive returns to hedge fund activism might reflect risks we do not account for. But
our best estimate is that activism produces improvements in shareholder value, which in turn is due to
achieving outcomes. If activism is short term that is because the market is short term. Activists appear
to deliver what the market wants, and if this creates problems these lie more with the capital markets,
and less with activism.
39
References
Admati, A. R., and P. Pfleiderer. 2009. The "Wall Street Walk" and Shareholder Activism: Exit as a
Form of Voice. Review of Financial Studies, 22, 2645-2685.
Agrawal, A. K. 2012. Corporate Governance Objectives of Labor Union Shareholders: Evidence from
Proxy Voting. Review of Financial Studies, 25, 187-226.
Alexander, C., M. Chen, D. Seppi, C. Spatt. 2010. Interim news and the role of proxy voting advice,
Review of Financial Studies, 23, pp. 4419–4454.
Bebchuk, L. A., A. Brav, and W. Jiang. 2014. The Long-Term Effects of Hedge Fund Activism.
Forthcoming, Columbia Law Review, 114, 13-66.
Becht, M., J. Franks and J. Grant. 2014. Hedge Fund Activism in Europe: Does Privacy Matter?
Forthcoming in the Handbook in Shareholder Power, (eds.) Jennifer Hill and Randall Thomas,
Edward Elgar
Becht, M., J. Franks, Mayer, C., and S. Rossi. 2009. Returns to Shareholder Activism: Evidence from a
Clinical Study of the Hermes UK Focus Fund. Review of Financial Studies 22, 3093-3129
Bessler, W, W. Drobetz, and J. Holler. 2013. The Returns to Hedge Fund Investments in Germany.
European Financial Management.
Bharath, S. T., S. Jayaraman, and V. Nagar. 2013. Exit as Governance: An Empirical Analysis. The
Journal of Finance, 68, 2515-2547.
Black, B. S. and J. C. Coffee. 1994. Hail Britannia?: Institutional Investor Behavior under Limited
Regulation. Michigan Law Review 92, 1997-2087.
Boyson, N. M., and R. M. Mooradian. 2011. Corporate governance and hedge fund activism. Review of
Derivatives Research, 14, 169-204.
Brav, A., W. Jiang, and H. Kim. 2011. The real effects of hedge fund activism: Productivity, risk, and
product market competition. NBER Working Paper No. 17517. National Bureau of Economic
Research.
40
Brav, A., W. Jiang, and H. Kim. 2009. Hedge fund activism: a Review, Foundations and Trends in
Finance 4, 185-246.
Brav, A., W. Jiang, F. Partnoy, and R. Thomas. 2008. Hedge Fund Activism, Corporate Governance,
and Firm Performance. Journal of Finance 63, 1729-1775.
Briggs, T. W. 2007. Corporate governance and the new hedge fund activism: An empirical
analysis. Journal of Corporation Law, 32.
Buchanan, B. G., J. M. Netter, A. B. Poulsen, and T. Yang. 2012. Shareholder Proposal Rules and
Practice: Evidence from a Comparison of the United States and United Kingdom. American
Business Law Journal 49, 739-803.
Cai, J., and R.A. Walkling. 2011. Shareholders’ say on pay: Does it create value?. Journal of Financial
and Quantitative Analysis, 46, 299-339.
Cai, Jie, J. L. Garner, and R. A. Walkling. 2009. Electing Directors. Journal of Finance 64, 2389-421.
Clifford, C. P. 2008. Value Creation or Destruction? Hedge Funds as Shareholder Activists. Journal of
Corporate Finance 14, 323-36.
Coffee, J. C. and D. Palia. 2014. The Impact of Hedge Fund Activism: Evidence and Implications.
European Corporate Governance Institute (ECGI) - Law Working Paper No. 266/2014
Cuñat, V., M. Gine, and M. Guadalupe. 2012. The vote is cast: the effect of corporate governance on
shareholder value. Journal of Finance, 67, 1943-1977.
Cziraki, P., L. Renneboog, and P. Szilagyi 2010. Shareholder Activism Through Proposals: the
European Perspective, European Financial Management 16, 738-777.
Edmans, A. 2009. Blockholder Trading, Market Efficiency, and Managerial Myopia. Journal of
Finance, 64, 2481-2513.
Ertimur, Y., F. Ferri and V. Muslu. 2011. Shareholder Activism and CEO Pay, Review of Financial
Studies, 24, 535-592.
Ertimur, Y., F. Ferri, and S. R. Stubben. 2010. Board of Directors' Responsiveness to Shareholders:
Evidence from Shareholder Proposals, Journal of Corporate Finance, 16, 53-72.
Ferreira, M. A., and P. Matos. 2008. The colors of investors’ money: The role of institutional investors
around the world. Journal of Financial Economics, 88, 499-533.
41
Ferri, F. and D. A. Maber. 2013. Say on Pay Votes and CEO Compensation: Evidence from the UK,
Review of Finance, 17, 527-563.
Foley, F. C., R. Greenwood, and J. Quinn 2008. NEC Electronics. Harvard Business School Case 209-
001.
Fos, V., and M. Tsoutsoura, 2014. Shareholder democracy in play: Career consequences of proxy
contests. Journal of Financial Economics, 114, 316-340.
Gantchev, N. 2013. The Costs of Shareholder Activism: Evidence from a Sequential Decision Model.
Journal of Financial Economics 107, 610-631.
Gillan, S. L. and L. T. Starks. 2003. Corporate Governance, Corporate Ownership, and the Role of
Institutional Investors: A Global Perspective. Journal of Applied Finance 13, 4-22.
Gillan, S. and L. T. Starks. 2007. The Evolution of Shareholder Activism in the United States. Journal
of Applied Corporate Finance 19, 55 - 73.
Greenwood, R. and M. Schor. 2009. Investor Activism and Takeovers. Journal of Financial Economics
92, 362 - 375.
Hamao, Y., K. Kutsuna, and P. Matos, 2011. Investor Activism in Japan: The First 10 Years. Working
Paper University of Southern California.
Kahan, M., & E. B. Rock. 2007. Hedge funds in corporate governance and corporate
control. University of Pennsylvania Law Review, 1021-1093.
Karpoff, J. 2001. The impact of shareholder activism on target companies: A survey of empirical
findings. Working Paper University of Washington.
Klein, A. and E. Zur. 2008. Entrepreneurial Shareholder Activism: Hedge Funds and Other Private
Investors. Journal of Finance 64, 187-229.
Klein, A., and E. Zur. 2011. The Impact of Hedge Fund Activism on the Target Firm's Existing
Bondholders. Review of Financial Studies, 24, 1735-1771.
Levit, D. and N. Malenko 2011. Nonbinding voting for shareholder proposals. Journal of Finance, 66,
1579-1614.
Morgan, A., and J. Wolf. 2007. Approval of shareholder-sponsored proposals: Evidence from
Canada. International Review of Financial Analysis, 16, 136-151.
42
Mulherin, J. H., and A. B. Poulsen. 1998. Proxy contests and corporate change: implications for
shareholder wealth. Journal of Financial Economics, 47, 279-313.
Norli, O., C. Ostergaard, and I. Schindele. 2014. Liquidity and Shareholder Activism. Forthcoming
Review of Financial Studies.
Sunder, J., S. Sunder, and W. Wongsunwai. 2014, Debtholder responses to shareholder activism:
evidence from hedge fund interventions. Review of Financial Studies, forthcoming
Yermack, D. 2010. Shareholder Voting and Corporate Governance. Annual Review of Financial
Economics, 2, 103-125.
43
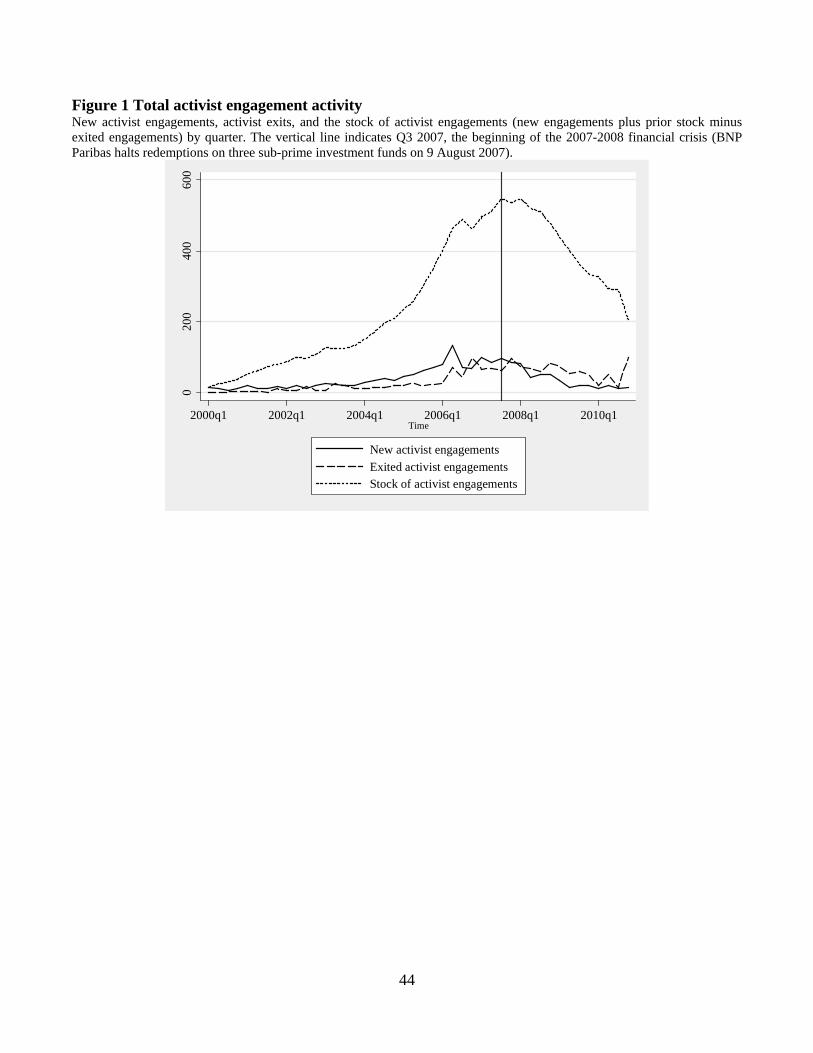
Figure 1 Total activist engagement activity New activist engagements, activist exits, and the stock of activist engagements (new engagements plus prior stock minus exited engagements) by quarter. The vertical line indicates Q3 2007, the beginning of the 2007-2008 financial crisis (BNP Paribas halts redemptions on three sub-prime investment funds on 9 August 2007).
020
040
060
0
2000q1 2002q1 2004q1 2006q1 2008q1 2010q1Time
New activist engagementsExited activist engagementsStock of activist engagements
44
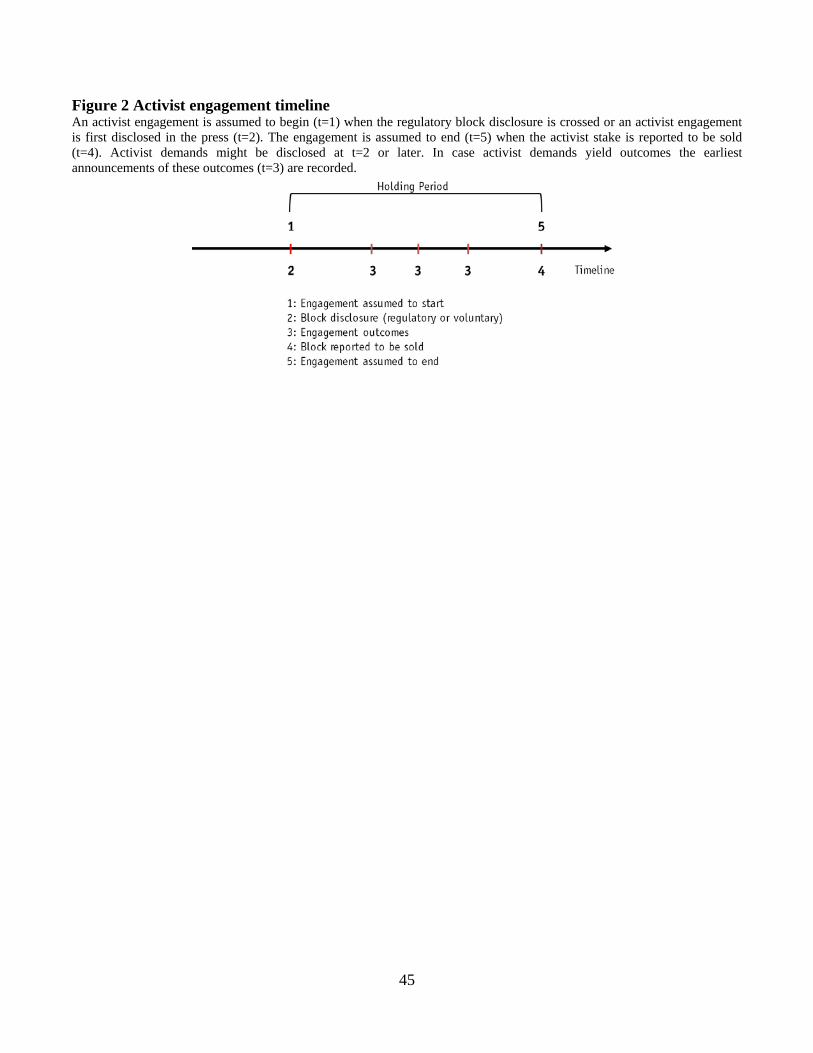
Figure 2 Activist engagement timeline An activist engagement is assumed to begin (t=1) when the regulatory block disclosure is crossed or an activist engagement is first disclosed in the press (t=2). The engagement is assumed to end (t=5) when the activist stake is reported to be sold (t=4). Activist demands might be disclosed at t=2 or later. In case activist demands yield outcomes the earliest announcements of these outcomes (t=3) are recorded.
45
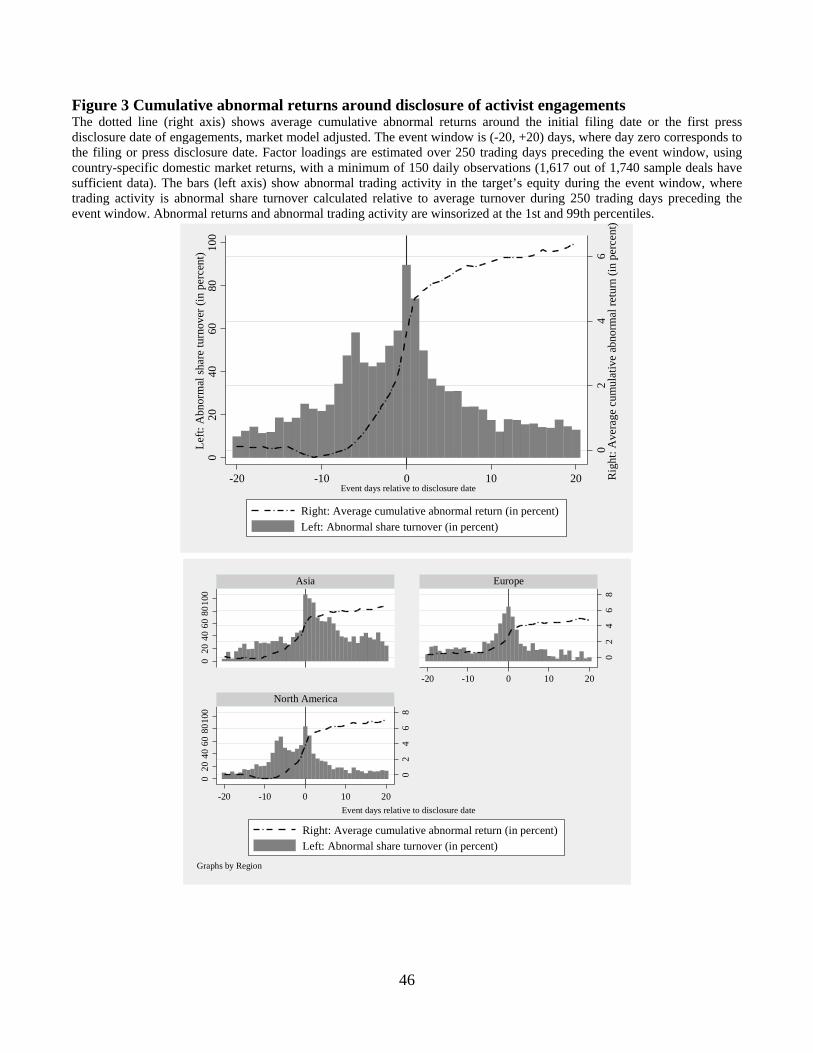
Figure 3 Cumulative abnormal returns around disclosure of activist engagements The dotted line (right axis) shows average cumulative abnormal returns around the initial filing date or the first press disclosure date of engagements, market model adjusted. The event window is (-20, +20) days, where day zero corresponds to the filing or press disclosure date. Factor loadings are estimated over 250 trading days preceding the event window, using country-specific domestic market returns, with a minimum of 150 daily observations (1,617 out of 1,740 sample deals have sufficient data). The bars (left axis) show abnormal trading activity in the target’s equity during the event window, where trading activity is abnormal share turnover calculated relative to average turnover during 250 trading days preceding the event window. Abnormal returns and abnormal trading activity are winsorized at the 1st and 99th percentiles.
02
46
Rig
ht: A
vera
ge c
umul
ativ
e ab
norm
al re
turn
(in
perc
ent)
020
4060
8010
0Le
ft: A
bnor
mal
shar
e tu
rnov
er (i
n pe
rcen
t)
-20 -10 0 10 20Event days relative to disclosure date
Right: Average cumulative abnormal return (in percent)Left: Abnormal share turnover (in percent)
02
46
8
02
46
8
020
4060
8010
00
2040
6080
100
-20 -10 0 10 20
-20 -10 0 10 20
Asia Europe
North America
Right: Average cumulative abnormal return (in percent)Left: Abnormal share turnover (in percent)
Event days relative to disclosure date
Graphs by Region
46

Figure 4 Activist engagement outcomes and takeovers Number of outcomes by quarter, with the total number of outcomes on the left axis (solid line), and the number of takeover outcomes on the right axis (dotted line). The vertical line indicates Q3 2007, the beginning of the 2007-2008 financial crisis.
05
1015
2025
Rig
ht: T
akeo
ver o
utco
mes
020
4060
80Le
ft: A
ll ou
tcom
es
2000q1 2002q1 2004q1 2006q1 2008q1 2010q1Time
Left: All outcomesRight: Takeover outcomes
47
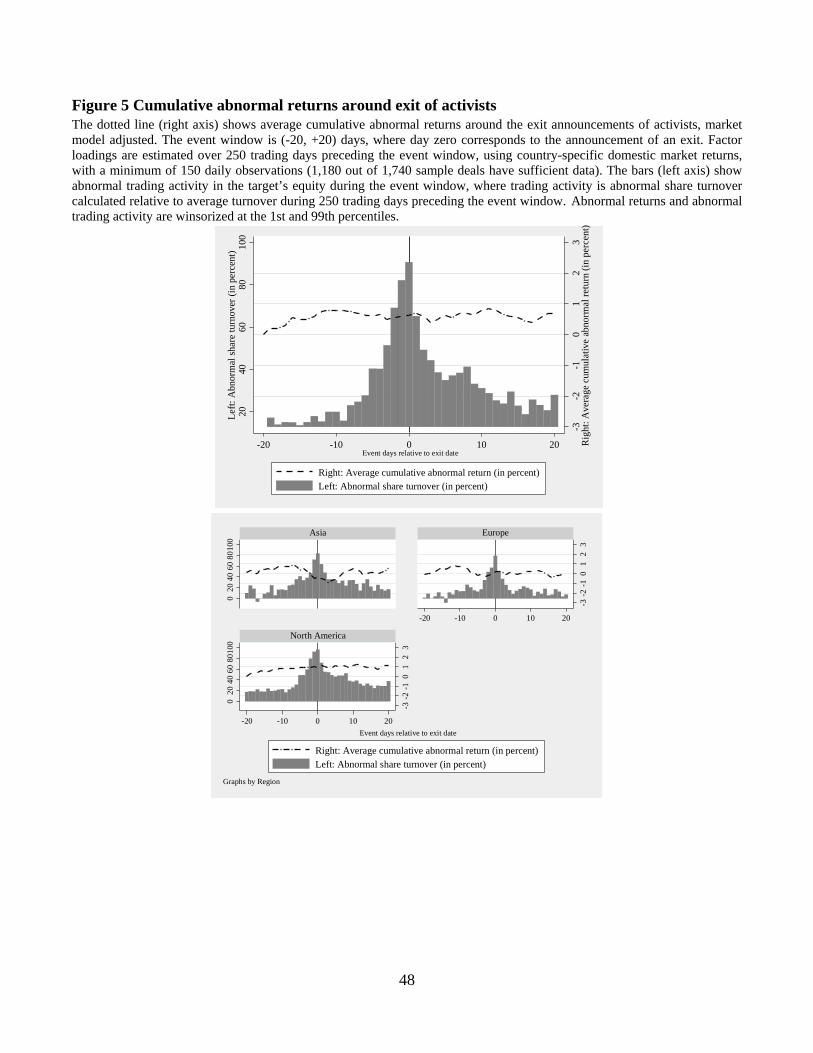
Figure 5 Cumulative abnormal returns around exit of activists The dotted line (right axis) shows average cumulative abnormal returns around the exit announcements of activists, market model adjusted. The event window is (-20, +20) days, where day zero corresponds to the announcement of an exit. Factor loadings are estimated over 250 trading days preceding the event window, using country-specific domestic market returns, with a minimum of 150 daily observations (1,180 out of 1,740 sample deals have sufficient data). The bars (left axis) show abnormal trading activity in the target’s equity during the event window, where trading activity is abnormal share turnover calculated relative to average turnover during 250 trading days preceding the event window. Abnormal returns and abnormal trading activity are winsorized at the 1st and 99th percentiles.
-3-2
-10
12
3R
ight
: Ave
rage
cum
ulat
ive
abno
rmal
retu
rn (i
n pe
rcen
t)
2040
6080
100
Left:
Abn
orm
al sh
are
turn
over
(in
perc
ent)
-20 -10 0 10 20Event days relative to exit date
Right: Average cumulative abnormal return (in percent)Left: Abnormal share turnover (in percent)
-3-2
-10
12
3
-3-2
-10
12
3
020
4060
8010
00
2040
6080
100
-20 -10 0 10 20
-20 -10 0 10 20
Asia Europe
North America
Right: Average cumulative abnormal return (in percent)Left: Abnormal share turnover (in percent)
Event days relative to exit date
Graphs by Region
48
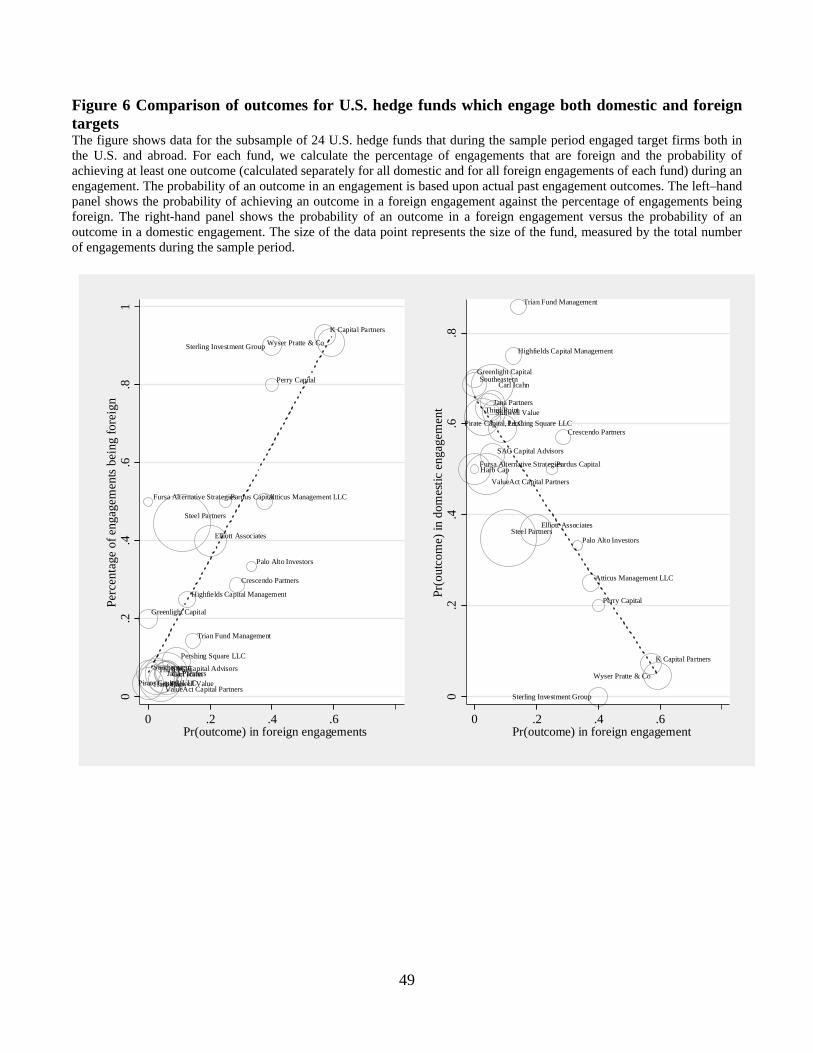
Figure 6 Comparison of outcomes for U.S. hedge funds which engage both domestic and foreign targets The figure shows data for the subsample of 24 U.S. hedge funds that during the sample period engaged target firms both in the U.S. and abroad. For each fund, we calculate the percentage of engagements that are foreign and the probability of achieving at least one outcome (calculated separately for all domestic and for all foreign engagements of each fund) during an engagement. The probability of an outcome in an engagement is based upon actual past engagement outcomes. The left–hand panel shows the probability of achieving an outcome in a foreign engagement against the percentage of engagements being foreign. The right-hand panel shows the probability of an outcome in a foreign engagement versus the probability of an outcome in a domestic engagement. The size of the data point represents the size of the fund, measured by the total number of engagements during the sample period.
Atticus Management LLC
Carl Icahn
Crescendo Partners
Elliott Associates
Fursa Alternative Strategies
Greenlight Capital
Harb Cap
Highfields Capital Management
Jana Partners
K Capital Partners
Palo Alto Investors
Pardus Capital
Perry Capital
Pershing Square LLC
Pirate Capital, LLC
SAC Capital AdvisorsSoutheastern
Steel Partners
Sterling Investment Group
Stillwell Value
Third Point
Trian Fund Management
ValueAct Capital Partners
Wyser Pratte & Co
0.2
.4.6
.81
Perc
enta
ge o
f eng
agem
ents
bein
g fo
reig
n
0 .2 .4 .6Pr(outcome) in foreign engagements
Atticus Management LLC
Carl Icahn
Crescendo Partners
Elliott Associates
Fursa Alternative Strategies
Greenlight Capital
Harb Cap
Highfields Capital Management
Jana Partners
K Capital Partners
Palo Alto Investors
Pardus Capital
Perry Capital
Pershing Square LLCPirate Capital, LLC
SAC Capital Advisors
Southeastern
Steel Partners
Sterling Investment Group
Stillwell ValueThird Point
Trian Fund Management
ValueAct Capital Partners
Wyser Pratte & Co
0.2
.4.6
.8Pr
(out
com
e) in
dom
estic
eng
agem
ent
0 .2 .4 .6Pr(outcome) in foreign engagement
49

Table 1 Activist engagements by year, country and fund group Public engagements between 1 January 2000 and 31 December 2010. In Panel B, countries are listed with a minimum of seven engagements. In Panel C, fund names are listed for funds with a minimum of ten engagements worldwide. In Panel E, wolf packs indicate engagements of multiple activists with the same target
Panel A: Engagements by year Year of initial filing or
press disclosure Number of
engagements Percent Year of initial filing or
press disclosure Number of
engagements Percent
2000 48 2.8
2006 354 20.3 2001 63 3.6
2007 369 21.2
2002 66 3.8
2008 228 13.1 2003 91 5.2
2009 93 5.3
2004 138 7.9
2010 59 3.4 2005 231 13.3 Total 1,740 100
Panel B: Engagements by country Country Number of
engagements Percent Country Number of
engagements Percent
Belgium 9 0.5
Sweden 15 0.9 Canada 20 1.2
Switzerland 19 1.1
France 27 1.6
U.K. 165 9.5 Germany 53 3.1
U.S. 1,125 64.7
Hong Kong 7 0.4
Other countries 22 1.3 Italy 42 2.4
Japan 184 10.6 Netherlands 22 1.3
Region: Asia 214 12.3 Norway 7 0.4
Region: Europe 381 21.9
South Korea 23 1.3 Region: North America 1145 65.8
Panel C: Engagements by fund group
Fund N Fund N Fund N Steel Partners 92
Financial Edge Fund 21
MMI Investments LP 14
Carl Icahn 51
SCFS Equities 20
Effissimo Capital Management 13 ValueAct Capital Partners 51
Cannell Capital 20
Atlantic Investment Management 13
Ramius 50
Discovery Group 19
Ichigo Asset Management 13 Third Point 39
Shamrock Activist Value Fund 19
DE Shaw Group 13
Murakami Fund 35
Amber Capital 18
Sandell Asset Management 13 Farrallon Capital Management 30
Centaurus Capital 17
Principle Capital Inv. Trust 13
Harbinger Capital 30
SAC Capital Advisors 17
Highland Capital Management 13 Elliott Associates 30
The Children's Investment Fund 17
Nierenberg Investment Partners 12
Wynnefield Capital 29
Stillwell Value 17
Audley Capital 12 Hermes Focus Funds 28
Southeastern Asset Management 16
Leonardo Capital 11
Blum Capital Partners 26
Pirate Capital, LLC 16
Breeden Capital Management 11 Riley Investment Management 26
Relational Investors 16
Liberty Square 11
Laxey Partners 25
Dalton Fund 15
Yucaipa Companies LLC 10 Barington Capital Group 24
Newcastle Partners 15
Governance for Owners 10
Cycladic Capital Management 23
Third Avenue Asset Management 15
Deminor 10 Symphony Financial Partners 23
Clinton Group 14
Greenlight Capital 10
Jana Partners 22
GAMCO Investors, Inc 14
David M Knott 10 Taiyo Pacific Partners 22
Cevian Capital 14
Sterling Investment Group 10
Wyser Pratte & Co 22
Lazard Korea Corp. Gov. Fund 14 Pershing Square LLC 22
K Capital Partners 14
50
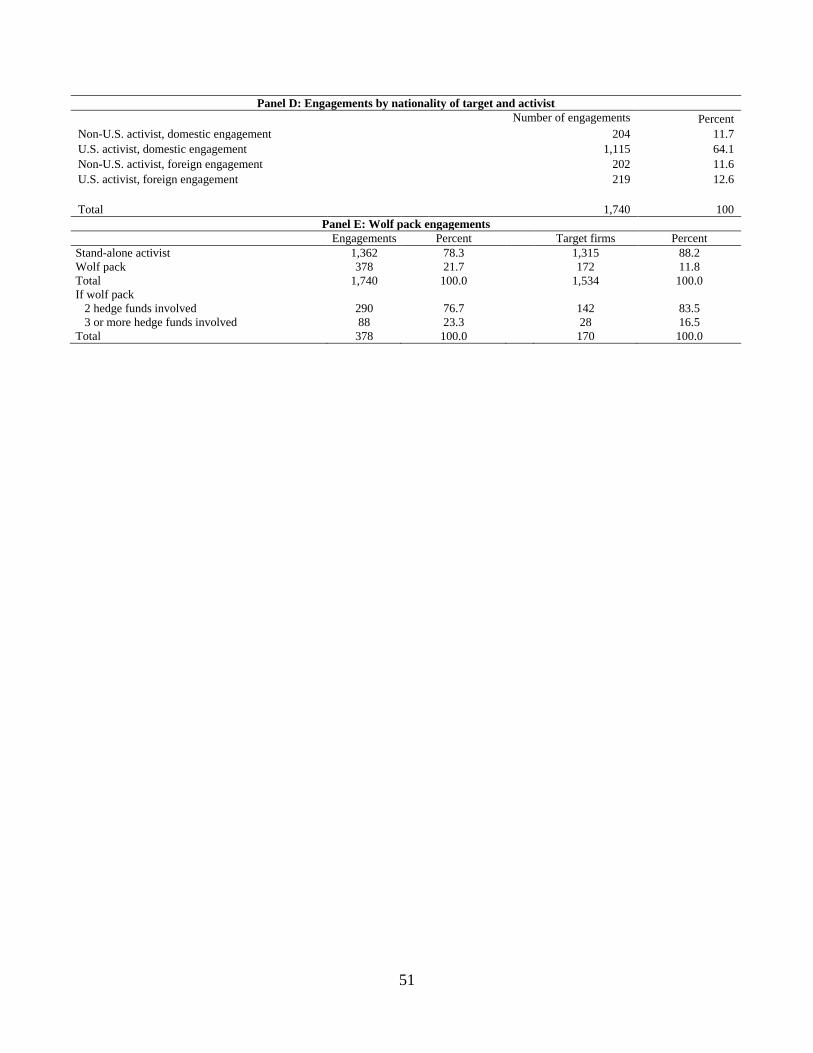
Panel D: Engagements by nationality of target and activist Number of engagements Percent Non-U.S. activist, domestic engagement
204 11.7
U.S. activist, domestic engagement
1,115 64.1 Non-U.S. activist, foreign engagement
202 11.6
U.S. activist, foreign engagement
219 12.6
Total 1,740 100 Panel E: Wolf pack engagements
Engagements Percent Target firms Percent Stand-alone activist 1,362 78.3
1,315 88.2
Wolf pack 378 21.7
172 11.8 Total 1,740 100.0
1,534 100.0
If wolf pack 2 hedge funds involved 290 76.7
142 83.5
3 or more hedge funds involved 88 23.3
28 16.5 Total 378 100.0
170 100.0
51
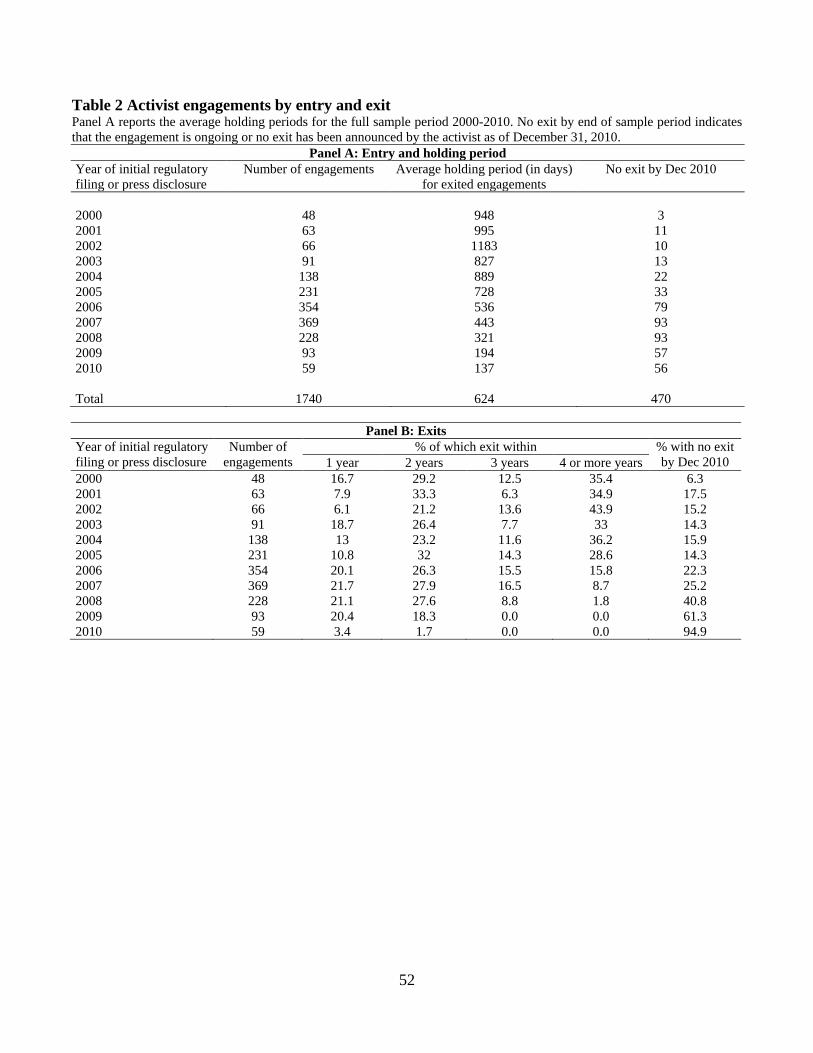
Table 2 Activist engagements by entry and exit Panel A reports the average holding periods for the full sample period 2000-2010. No exit by end of sample period indicates that the engagement is ongoing or no exit has been announced by the activist as of December 31, 2010.
Panel A: Entry and holding period Year of initial regulatory filing or press disclosure
Number of engagements Average holding period (in days) for exited engagements
No exit by Dec 2010
2000 48 948 3 2001 63 995 11 2002 66 1183 10 2003 91 827 13 2004 138 889 22 2005 231 728 33 2006 354 536 79 2007 369 443 93 2008 228 321 93 2009 93 194 57 2010 59 137 56 Total 1740 624 470
Panel B: Exits
Year of initial regulatory filing or press disclosure
Number of engagements
% of which exit within % with no exit by Dec 2010 1 year 2 years 3 years 4 or more years
2000 48 16.7 29.2 12.5 35.4 6.3 2001 63 7.9 33.3 6.3 34.9 17.5 2002 66 6.1 21.2 13.6 43.9 15.2 2003 91 18.7 26.4 7.7 33 14.3 2004 138 13 23.2 11.6 36.2 15.9 2005 231 10.8 32 14.3 28.6 14.3 2006 354 20.1 26.3 15.5 15.8 22.3 2007 369 21.7 27.9 16.5 8.7 25.2 2008 228 21.1 27.6 8.8 1.8 40.8 2009 93 20.4 18.3 0.0 0.0 61.3 2010 59 3.4 1.7 0.0 0.0 94.9
52
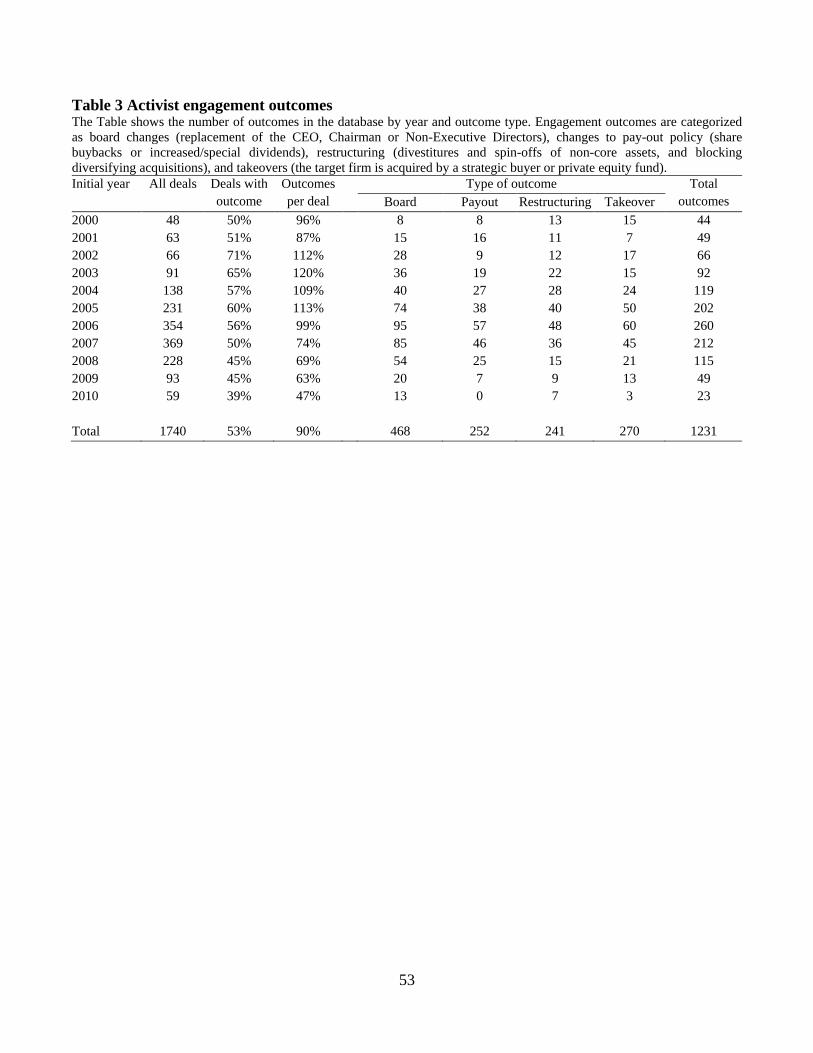
Table 3 Activist engagement outcomes The Table shows the number of outcomes in the database by year and outcome type. Engagement outcomes are categorized as board changes (replacement of the CEO, Chairman or Non-Executive Directors), changes to pay-out policy (share buybacks or increased/special dividends), restructuring (divestitures and spin-offs of non-core assets, and blocking diversifying acquisitions), and takeovers (the target firm is acquired by a strategic buyer or private equity fund). Initial year All deals Deals with
outcome Outcomes per deal
Type of outcome Total outcomes
Board Payout Restructuring Takeover
2000 48 50% 96%
8 8 13 15 44 2001 63 51% 87%
15 16 11 7 49
2002 66 71% 112%
28 9 12 17 66 2003 91 65% 120%
36 19 22 15 92
2004 138 57% 109%
40 27 28 24 119 2005 231 60% 113%
74 38 40 50 202
2006 354 56% 99%
95 57 48 60 260 2007 369 50% 74%
85 46 36 45 212
2008 228 45% 69%
54 25 15 21 115 2009 93 45% 63%
20 7 9 13 49
2010 59 39% 47%
13 0 7 3 23
Total 1740 53% 90%
468 252 241 270 1231
53
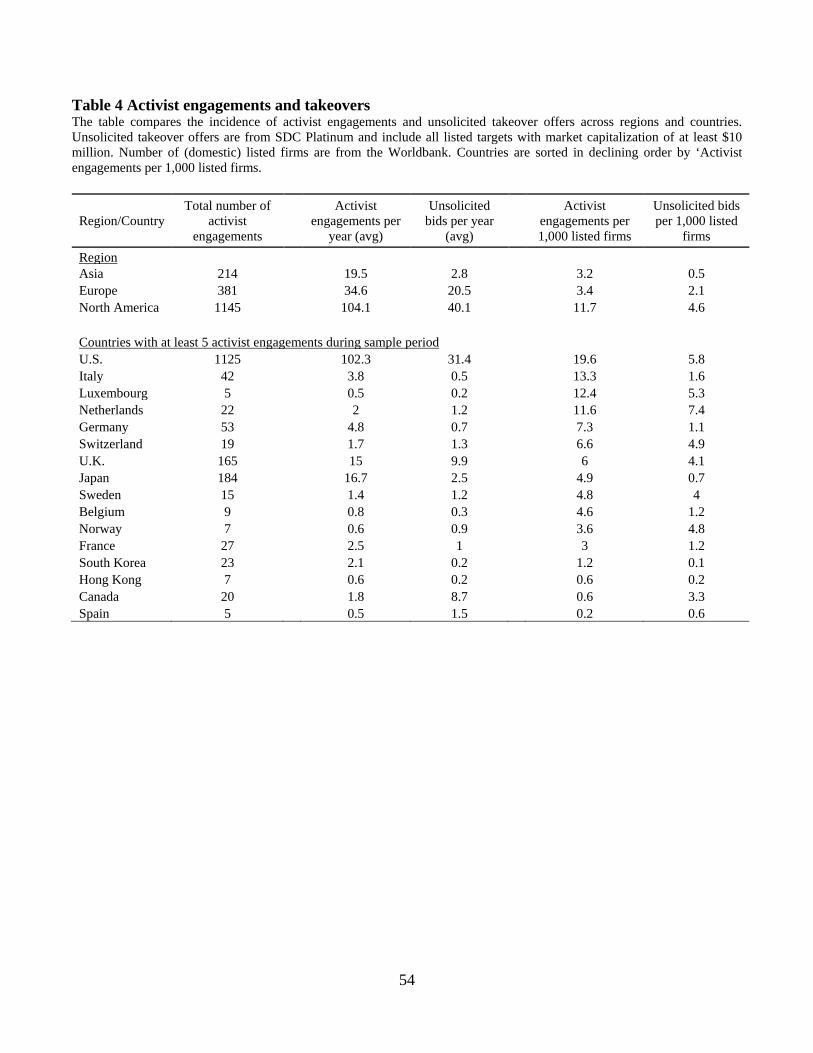
Table 4 Activist engagements and takeovers The table compares the incidence of activist engagements and unsolicited takeover offers across regions and countries. Unsolicited takeover offers are from SDC Platinum and include all listed targets with market capitalization of at least $10 million. Number of (domestic) listed firms are from the Worldbank. Countries are sorted in declining order by ‘Activist engagements per 1,000 listed firms.
Region/Country Total number of
activist engagements
Activist engagements per
year (avg)
Unsolicited bids per year
(avg)
Activist engagements per 1,000 listed firms
Unsolicited bids per 1,000 listed
firms Region
Asia 214
19.5 2.8
3.2 0.5 Europe 381
34.6 20.5
3.4 2.1
North America 1145
104.1 40.1
11.7 4.6
Countries with at least 5 activist engagements during sample period U.S. 1125
102.3 31.4
19.6 5.8
Italy 42
3.8 0.5
13.3 1.6 Luxembourg 5
0.5 0.2
12.4 5.3
Netherlands 22
2 1.2
11.6 7.4 Germany 53
4.8 0.7
7.3 1.1
Switzerland 19
1.7 1.3
6.6 4.9 U.K. 165
15 9.9
6 4.1
Japan 184
16.7 2.5
4.9 0.7 Sweden 15
1.4 1.2
4.8 4
Belgium 9
0.8 0.3
4.6 1.2 Norway 7
0.6 0.9
3.6 4.8
France 27
2.5 1
3 1.2 South Korea 23
2.1 0.2
1.2 0.1
Hong Kong 7
0.6 0.2
0.6 0.2 Canada 20
1.8 8.7
0.6 3.3
Spain 5 0.5 1.5 0.2 0.6
54
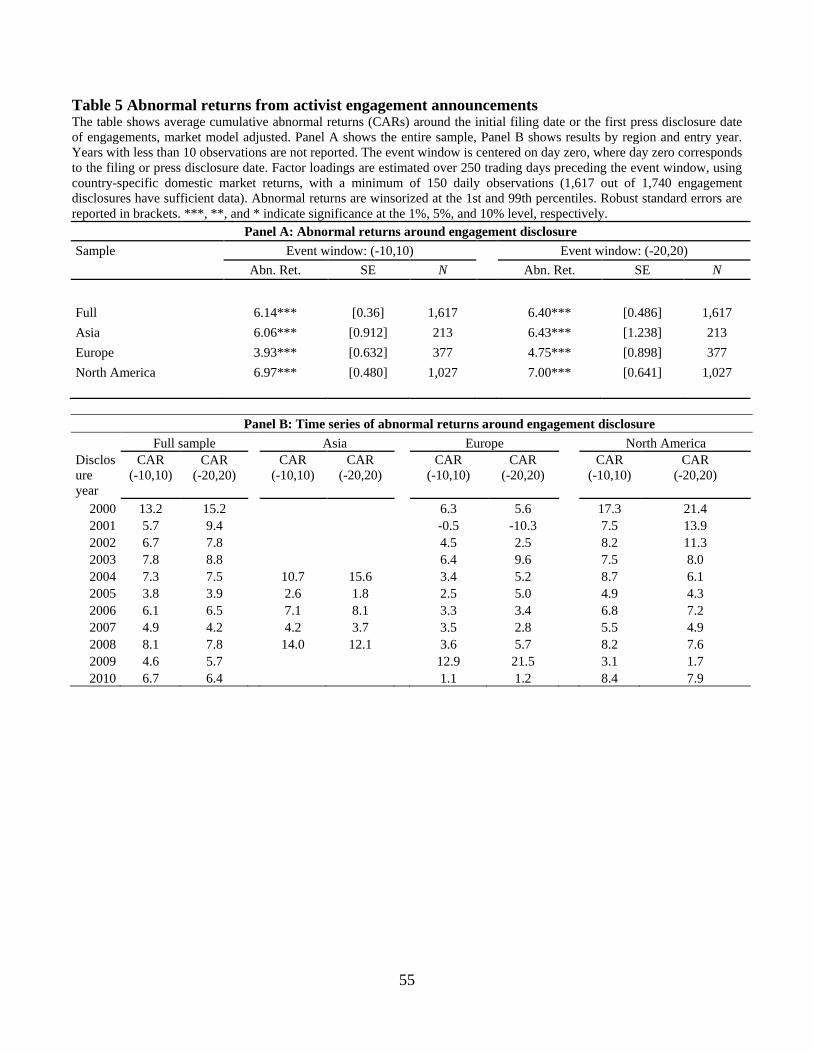
Table 5 Abnormal returns from activist engagement announcements The table shows average cumulative abnormal returns (CARs) around the initial filing date or the first press disclosure date of engagements, market model adjusted. Panel A shows the entire sample, Panel B shows results by region and entry year. Years with less than 10 observations are not reported. The event window is centered on day zero, where day zero corresponds to the filing or press disclosure date. Factor loadings are estimated over 250 trading days preceding the event window, using country-specific domestic market returns, with a minimum of 150 daily observations (1,617 out of 1,740 engagement disclosures have sufficient data). Abnormal returns are winsorized at the 1st and 99th percentiles. Robust standard errors are reported in brackets. ***, **, and * indicate significance at the 1%, 5%, and 10% level, respectively.
Panel A: Abnormal returns around engagement disclosure Sample Event window: (-10,10) Event window: (-20,20) Abn. Ret. SE N Abn. Ret. SE N
Full 6.14*** [0.36] 1,617
6.40*** [0.486] 1,617 Asia 6.06*** [0.912] 213
6.43*** [1.238] 213
Europe 3.93*** [0.632] 377
4.75*** [0.898] 377 North America 6.97*** [0.480] 1,027
7.00*** [0.641] 1,027
Panel B: Time series of abnormal returns around engagement disclosure Full sample Asia Europe North America Disclosure year
CAR (-10,10)
CAR (-20,20)
CAR (-10,10)
CAR (-20,20)
CAR (-10,10)
CAR (-20,20)
CAR (-10,10)
CAR (-20,20)
2000 13.2 15.2
6.3 5.6
17.3 21.4 2001 5.7 9.4
-0.5 -10.3
7.5 13.9
2002 6.7 7.8
4.5 2.5
8.2 11.3 2003 7.8 8.8
6.4 9.6
7.5 8.0
2004 7.3 7.5
10.7 15.6
3.4 5.2
8.7 6.1 2005 3.8 3.9
2.6 1.8
2.5 5.0
4.9 4.3
2006 6.1 6.5
7.1 8.1
3.3 3.4
6.8 7.2 2007 4.9 4.2
4.2 3.7
3.5 2.8
5.5 4.9
2008 8.1 7.8
14.0 12.1
3.6 5.7
8.2 7.6 2009 4.6 5.7
12.9 21.5
3.1 1.7
2010 6.7 6.4
1.1 1.2
8.4 7.9
55
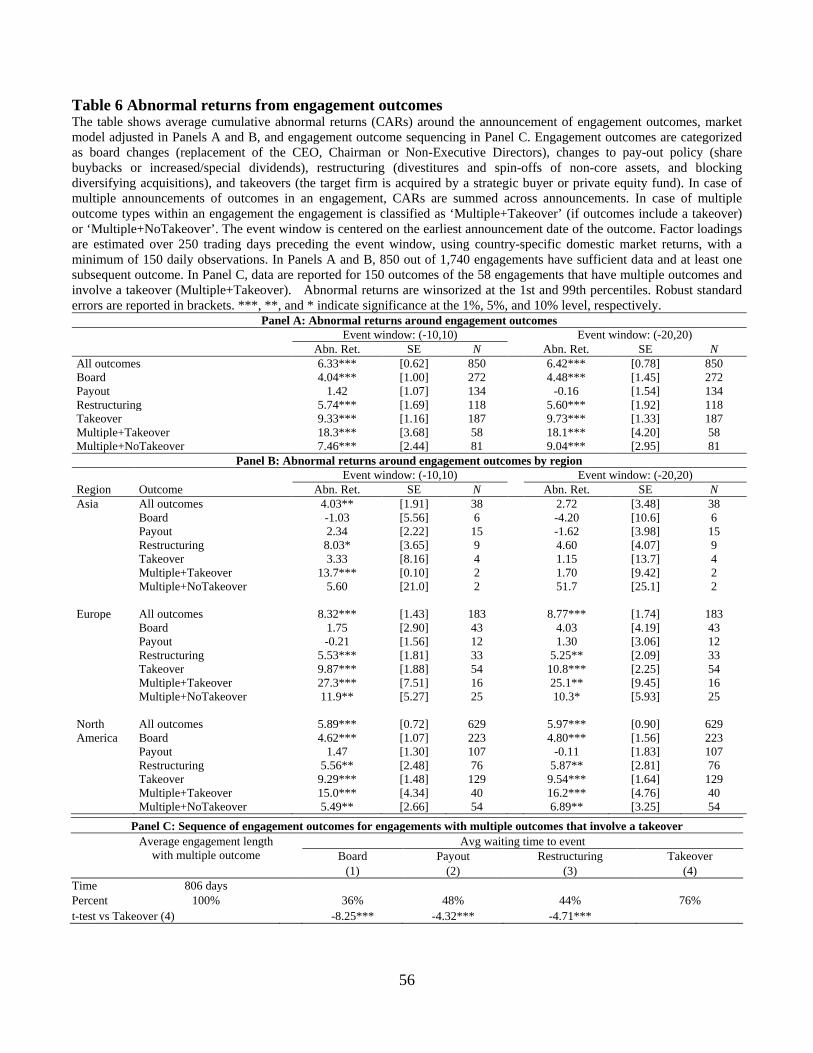
Table 6 Abnormal returns from engagement outcomes The table shows average cumulative abnormal returns (CARs) around the announcement of engagement outcomes, market model adjusted in Panels A and B, and engagement outcome sequencing in Panel C. Engagement outcomes are categorized as board changes (replacement of the CEO, Chairman or Non-Executive Directors), changes to pay-out policy (share buybacks or increased/special dividends), restructuring (divestitures and spin-offs of non-core assets, and blocking diversifying acquisitions), and takeovers (the target firm is acquired by a strategic buyer or private equity fund). In case of multiple announcements of outcomes in an engagement, CARs are summed across announcements. In case of multiple outcome types within an engagement the engagement is classified as ‘Multiple+Takeover’ (if outcomes include a takeover) or ‘Multiple+NoTakeover’. The event window is centered on the earliest announcement date of the outcome. Factor loadings are estimated over 250 trading days preceding the event window, using country-specific domestic market returns, with a minimum of 150 daily observations. In Panels A and B, 850 out of 1,740 engagements have sufficient data and at least one subsequent outcome. In Panel C, data are reported for 150 outcomes of the 58 engagements that have multiple outcomes and involve a takeover (Multiple+Takeover). Abnormal returns are winsorized at the 1st and 99th percentiles. Robust standard errors are reported in brackets. ***, **, and * indicate significance at the 1%, 5%, and 10% level, respectively.
Panel A: Abnormal returns around engagement outcomes Event window: (-10,10) Event window: (-20,20) Abn. Ret. SE N Abn. Ret. SE N All outcomes 6.33*** [0.62] 850 6.42*** [0.78] 850 Board 4.04*** [1.00] 272 4.48*** [1.45] 272 Payout 1.42 [1.07] 134 -0.16 [1.54] 134 Restructuring 5.74*** [1.69] 118 5.60*** [1.92] 118 Takeover 9.33*** [1.16] 187 9.73*** [1.33] 187 Multiple+Takeover 18.3*** [3.68] 58 18.1*** [4.20] 58 Multiple+NoTakeover 7.46*** [2.44] 81 9.04*** [2.95] 81
Panel B: Abnormal returns around engagement outcomes by region
Event window: (-10,10) Event window: (-20,20) Region Outcome Abn. Ret. SE N Abn. Ret. SE N Asia All outcomes 4.03** [1.91] 38 2.72 [3.48] 38
Board -1.03 [5.56] 6 -4.20 [10.6] 6
Payout 2.34 [2.22] 15 -1.62 [3.98] 15
Restructuring 8.03* [3.65] 9 4.60 [4.07] 9
Takeover 3.33 [8.16] 4 1.15 [13.7] 4
Multiple+Takeover 13.7*** [0.10] 2 1.70 [9.42] 2 Multiple+NoTakeover 5.60 [21.0] 2 51.7 [25.1] 2
Europe All outcomes 8.32*** [1.43] 183 8.77*** [1.74] 183
Board 1.75 [2.90] 43 4.03 [4.19] 43
Payout -0.21 [1.56] 12 1.30 [3.06] 12
Restructuring 5.53*** [1.81] 33 5.25** [2.09] 33
Takeover 9.87*** [1.88] 54 10.8*** [2.25] 54
Multiple+Takeover 27.3*** [7.51] 16 25.1** [9.45] 16 Multiple+NoTakeover 11.9** [5.27] 25 10.3* [5.93] 25
North America
All outcomes 5.89*** [0.72] 629 5.97*** [0.90] 629 Board 4.62*** [1.07] 223 4.80*** [1.56] 223 Payout 1.47 [1.30] 107 -0.11 [1.83] 107 Restructuring 5.56** [2.48] 76 5.87** [2.81] 76
Takeover 9.29*** [1.48] 129 9.54*** [1.64] 129 Multiple+Takeover 15.0*** [4.34] 40 16.2*** [4.76] 40 Multiple+NoTakeover 5.49** [2.66] 54 6.89** [3.25] 54
Panel C: Sequence of engagement outcomes for engagements with multiple outcomes that involve a takeover Average engagement length
with multiple outcome Avg waiting time to event
Board Payout Restructuring Takeover (1) (2) (3) (4) Time 806 days Percent 100% 36% 48% 44% 76%
t-test vs Takeover (4) -8.25*** -4.32*** -4.71***
56
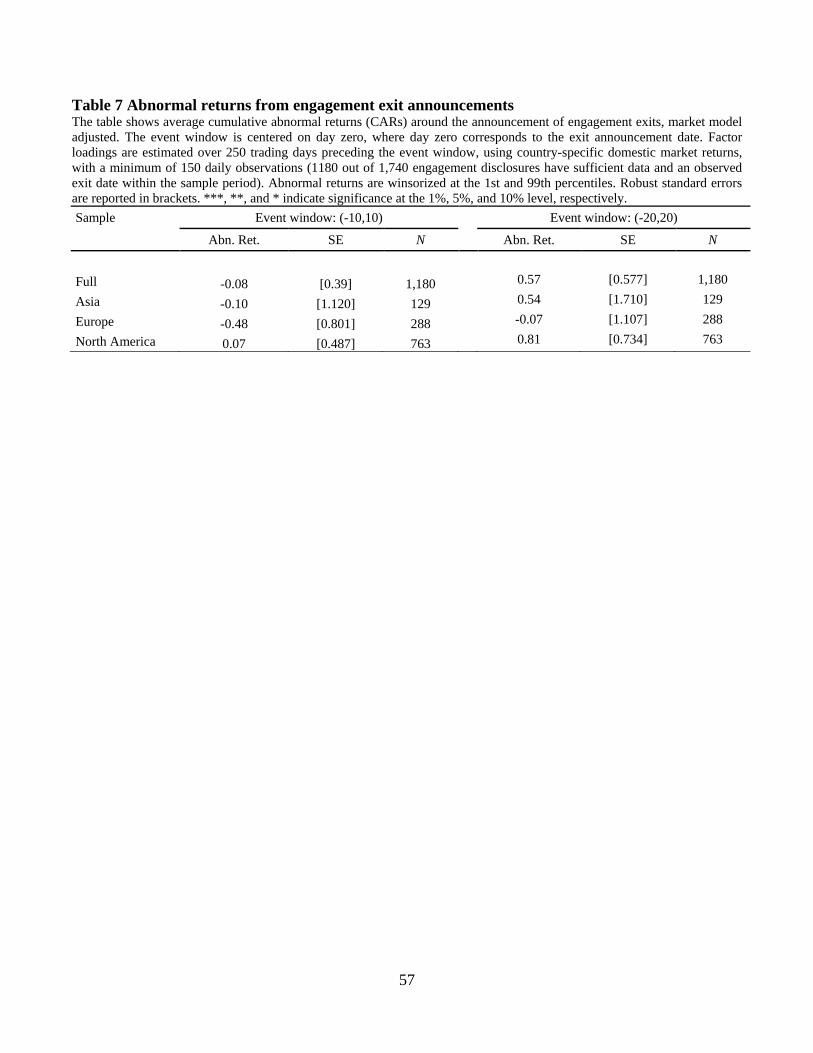
Table 7 Abnormal returns from engagement exit announcements The table shows average cumulative abnormal returns (CARs) around the announcement of engagement exits, market model adjusted. The event window is centered on day zero, where day zero corresponds to the exit announcement date. Factor loadings are estimated over 250 trading days preceding the event window, using country-specific domestic market returns, with a minimum of 150 daily observations (1180 out of 1,740 engagement disclosures have sufficient data and an observed exit date within the sample period). Abnormal returns are winsorized at the 1st and 99th percentiles. Robust standard errors are reported in brackets. ***, **, and * indicate significance at the 1%, 5%, and 10% level, respectively. Sample Event window: (-10,10) Event window: (-20,20)
Abn. Ret. SE N Abn. Ret. SE N
Full -0.08 [0.39] 1,180
0.57 [0.577] 1,180
Asia -0.10 [1.120] 129
0.54 [1.710] 129
Europe -0.48 [0.801] 288
-0.07 [1.107] 288
North America 0.07 [0.487] 763 0.81 [0.734] 763
57
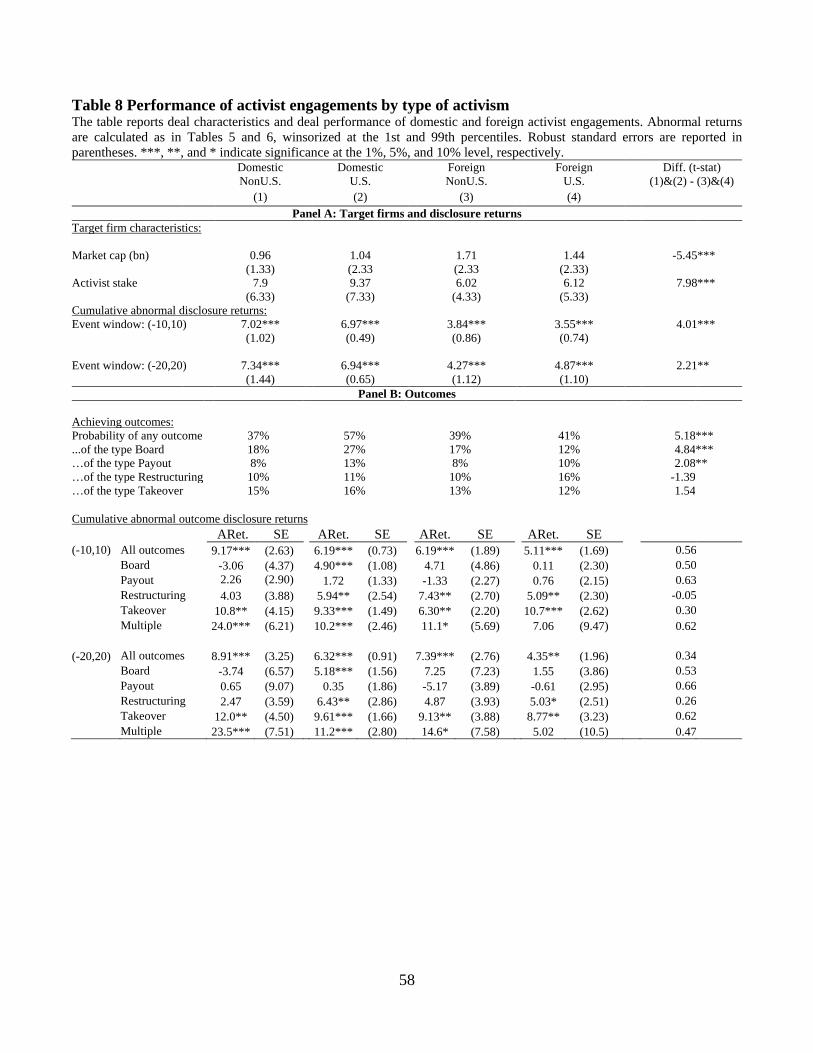
Table 8 Performance of activist engagements by type of activism The table reports deal characteristics and deal performance of domestic and foreign activist engagements. Abnormal returns are calculated as in Tables 5 and 6, winsorized at the 1st and 99th percentiles. Robust standard errors are reported in parentheses. ***, **, and * indicate significance at the 1%, 5%, and 10% level, respectively.
Domestic Domestic Foreign Foreign U.S. Diff. (t-stat)
(1)&(2) - (3)&(4) NonU.S. U.S. NonU.S. (1) (2) (3) (4)
Panel A: Target firms and disclosure returns Target firm characteristics:
Market cap (bn) 0.96 1.04 1.71 1.44
-5.45 ***
(1.33) (2.33 (2.33 (2.33) Activist stake 7.9 9.37 6.02 6.12
7.98 ***
(6.33) (7.33) (4.33) (5.33) Cumulative abnormal disclosure returns:
Event window: (-10,10) 7.02*** 6.97*** 3.84*** 3.55***
4.01 ***
(1.02) (0.49) (0.86) (0.74)
Event window: (-20,20) 7.34*** 6.94*** 4.27*** 4.87***
2.21 **
(1.44) (0.65) (1.12) (1.10)
Panel B: Outcomes Achieving outcomes:
Probability of any outcome 37% 57% 39% 41% 5.18 *** ...of the type Board 18% 27% 17% 12% 4.84 *** …of the type Payout 8% 13% 8% 10% 2.08 ** …of the type Restructuring 10% 11% 10% 16% -1.39
…of the type Takeover 15% 16% 13% 12% 1.54 Cumulative abnormal outcome disclosure returns
ARet. SE ARet. SE ARet. SE ARet. SE
(-10,10) All outcomes 9.17*** (2.63) 6.19*** (0.73) 6.19*** (1.89) 5.11*** (1.69) 0.56
Board -3.06 (4.37) 4.90*** (1.08) 4.71 (4.86) 0.11 (2.30)
0.50
Payout 2.26 (2.90) 1.72 (1.33) -1.33 (2.27)
0.76 (2.15)
0.63
Restructuring 4.03 (3.88)
5.94** (2.54)
7.43** (2.70) 5.09** (2.30)
-0.05
Takeover 10.8** (4.15)
9.33*** (1.49)
6.30** (2.20) 10.7*** (2.62)
0.30
Multiple 24.0*** (6.21) 10.2*** (2.46) 11.1* (5.69) 7.06 (9.47)
0.62
(-20,20) All outcomes 8.91*** (3.25) 6.32*** (0.91) 7.39*** (2.76) 4.35** (1.96)
0.34
Board -3.74 (6.57) 5.18*** (1.56) 7.25 (7.23) 1.55 (3.86) 0.53
Payout 0.65 (9.07) 0.35 (1.86) -5.17 (3.89) -0.61 (2.95)
0.66
Restructuring 2.47 (3.59)
6.43** (2.86) 4.87 (3.93) 5.03* (2.51)
0.26
Takeover 12.0** (4.50)
9.61*** (1.66) 9.13** (3.88) 8.77** (3.23)
0.62 Multiple 23.5*** (7.51) 11.2*** (2.80) 14.6* (7.58) 5.02 (10.5) 0.47
58
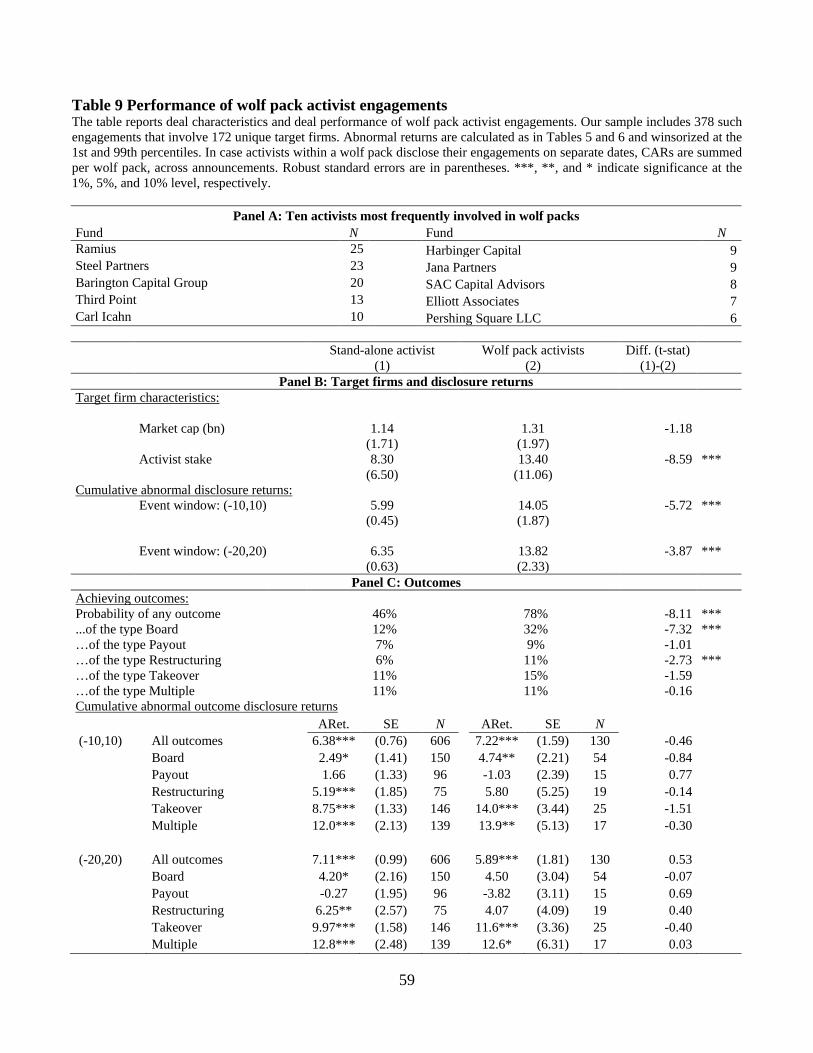
Table 9 Performance of wolf pack activist engagements The table reports deal characteristics and deal performance of wolf pack activist engagements. Our sample includes 378 such engagements that involve 172 unique target firms. Abnormal returns are calculated as in Tables 5 and 6 and winsorized at the 1st and 99th percentiles. In case activists within a wolf pack disclose their engagements on separate dates, CARs are summed per wolf pack, across announcements. Robust standard errors are in parentheses. ***, **, and * indicate significance at the 1%, 5%, and 10% level, respectively.
Panel A: Ten activists most frequently involved in wolf packs Fund N
Fund N
Ramius 25 Harbinger Capital 9 Steel Partners 23 Jana Partners 9 Barington Capital Group 20 SAC Capital Advisors 8 Third Point 13 Elliott Associates 7 Carl Icahn 10 Pershing Square LLC 6
Stand-alone activist Wolf pack activists
Diff. (t-stat)
(1) (2)
(1)-(2) Panel B: Target firms and disclosure returns
Target firm characteristics:
Market cap (bn) 1.14 1.31
-1.18 (1.71) (1.97)
Activist stake 8.30 13.40
-8.59 ***
(6.50) (11.06)
Cumulative abnormal disclosure returns:
Event window: (-10,10) 5.99 14.05
-5.72 ***
(0.45) (1.87)
Event window: (-20,20) 6.35 13.82
-3.87 ***
(0.63) (2.33)
Panel C: Outcomes Achieving outcomes:
Probability of any outcome 46% 78% -8.11 *** ...of the type Board
12% 32%
-7.32 ***
…of the type Payout
7% 9%
-1.01 …of the type Restructuring
6% 11%
-2.73 ***
…of the type Takeover 11% 15% -1.59 …of the type Multiple
11% 11%
-0.16
Cumulative abnormal outcome disclosure returns ARet. SE N ARet. SE N (-10,10) All outcomes 6.38*** (0.76) 606 7.22*** (1.59) 130 -0.46 Board 2.49* (1.41) 150 4.74** (2.21) 54 -0.84 Payout 1.66 (1.33) 96 -1.03 (2.39) 15 0.77 Restructuring 5.19*** (1.85) 75 5.80 (5.25) 19 -0.14 Takeover 8.75*** (1.33) 146 14.0*** (3.44) 25 -1.51 Multiple 12.0*** (2.13) 139 13.9** (5.13) 17 -0.30
(-20,20) All outcomes 7.11*** (0.99) 606 5.89*** (1.81) 130 0.53
Board 4.20* (2.16) 150 4.50 (3.04) 54 -0.07 Payout -0.27 (1.95) 96 -3.82 (3.11) 15 0.69 Restructuring 6.25** (2.57) 75 4.07 (4.09) 19 0.40 Takeover 9.97*** (1.58) 146 11.6*** (3.36) 25 -0.40 Multiple 12.8*** (2.48) 139 12.6* (6.31) 17 0.03
59
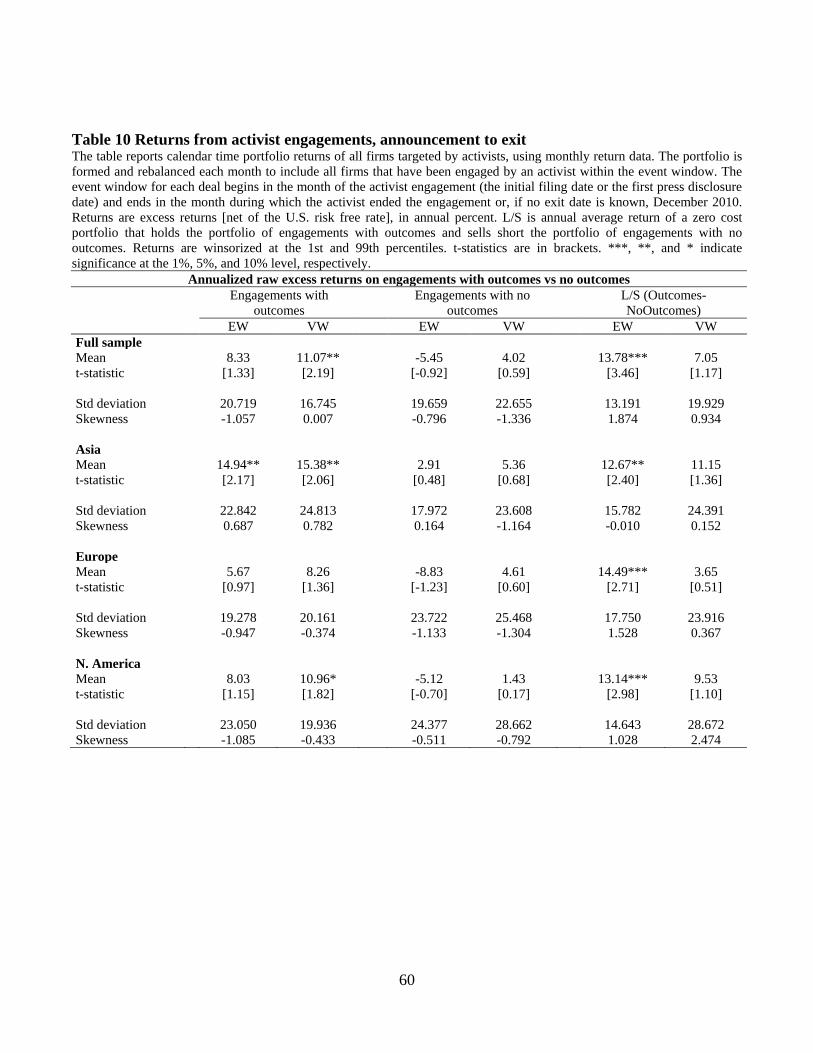
Table 10 Returns from activist engagements, announcement to exit The table reports calendar time portfolio returns of all firms targeted by activists, using monthly return data. The portfolio is formed and rebalanced each month to include all firms that have been engaged by an activist within the event window. The event window for each deal begins in the month of the activist engagement (the initial filing date or the first press disclosure date) and ends in the month during which the activist ended the engagement or, if no exit date is known, December 2010. Returns are excess returns [net of the U.S. risk free rate], in annual percent. L/S is annual average return of a zero cost portfolio that holds the portfolio of engagements with outcomes and sells short the portfolio of engagements with no outcomes. Returns are winsorized at the 1st and 99th percentiles. t-statistics are in brackets. ***, **, and * indicate significance at the 1%, 5%, and 10% level, respectively.
Annualized raw excess returns on engagements with outcomes vs no outcomes
Engagements with
outcomes Engagements with no
outcomes L/S (Outcomes-
NoOutcomes) EW VW EW VW EW VW Full sample Mean 8.33 11.07** -5.45 4.02 13.78*** 7.05 t-statistic [1.33] [2.19] [-0.92] [0.59] [3.46] [1.17] Std deviation 20.719 16.745 19.659 22.655 13.191 19.929 Skewness -1.057 0.007 -0.796 -1.336 1.874 0.934 Asia Mean 14.94** 15.38** 2.91 5.36 12.67** 11.15 t-statistic [2.17] [2.06] [0.48] [0.68] [2.40] [1.36] Std deviation 22.842 24.813 17.972 23.608 15.782 24.391 Skewness 0.687 0.782 0.164 -1.164 -0.010 0.152 Europe Mean 5.67 8.26 -8.83 4.61 14.49*** 3.65 t-statistic [0.97] [1.36] [-1.23] [0.60] [2.71] [0.51] Std deviation 19.278 20.161 23.722 25.468 17.750 23.916 Skewness -0.947 -0.374 -1.133 -1.304 1.528 0.367 N. America Mean 8.03 10.96* -5.12 1.43 13.14*** 9.53 t-statistic [1.15] [1.82] [-0.70] [0.17] [2.98] [1.10] Std deviation 23.050 19.936 24.377 28.662 14.643 28.672 Skewness -1.085 -0.433 -0.511 -0.792 1.028 2.474
60
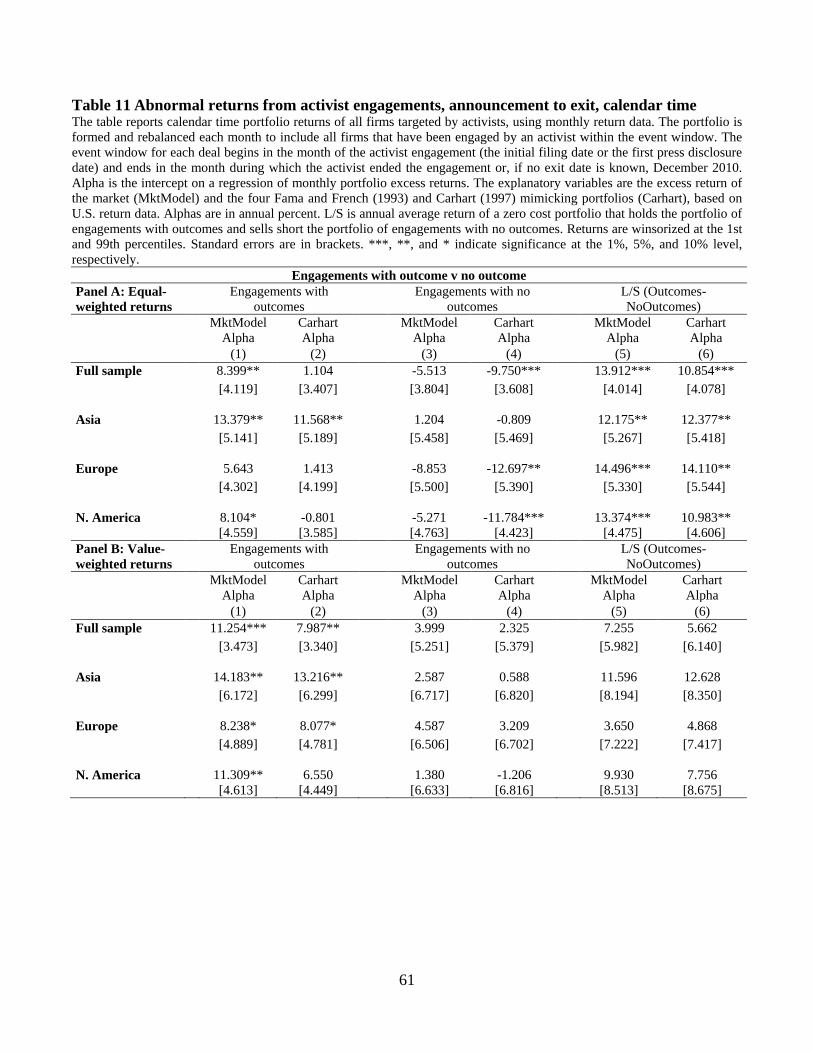
Table 11 Abnormal returns from activist engagements, announcement to exit, calendar time The table reports calendar time portfolio returns of all firms targeted by activists, using monthly return data. The portfolio is formed and rebalanced each month to include all firms that have been engaged by an activist within the event window. The event window for each deal begins in the month of the activist engagement (the initial filing date or the first press disclosure date) and ends in the month during which the activist ended the engagement or, if no exit date is known, December 2010. Alpha is the intercept on a regression of monthly portfolio excess returns. The explanatory variables are the excess return of the market (MktModel) and the four Fama and French (1993) and Carhart (1997) mimicking portfolios (Carhart), based on U.S. return data. Alphas are in annual percent. L/S is annual average return of a zero cost portfolio that holds the portfolio of engagements with outcomes and sells short the portfolio of engagements with no outcomes. Returns are winsorized at the 1st and 99th percentiles. Standard errors are in brackets. ***, **, and * indicate significance at the 1%, 5%, and 10% level, respectively.
Engagements with outcome v no outcome Panel A: Equal-weighted returns
Engagements with outcomes
Engagements with no outcomes
L/S (Outcomes-NoOutcomes)
MktModel
Alpha Carhart Alpha
MktModel Alpha
Carhart Alpha
MktModel Alpha
Carhart Alpha
(1) (2) (3) (4) (5) (6) Full sample 8.399** 1.104
-5.513 -9.750*** 13.912*** 10.854***
[4.119] [3.407]
[3.804] [3.608] [4.014] [4.078]
Asia 13.379** 11.568**
1.204 -0.809 12.175** 12.377**
[5.141] [5.189]
[5.458] [5.469] [5.267] [5.418]
Europe 5.643 1.413
-8.853 -12.697** 14.496*** 14.110**
[4.302] [4.199]
[5.500] [5.390] [5.330] [5.544] N. America 8.104* -0.801
-5.271 -11.784*** 13.374*** 10.983**
[4.559] [3.585]
[4.763] [4.423] [4.475] [4.606]
Panel B: Value-weighted returns
Engagements with outcomes
Engagements with no outcomes
L/S (Outcomes-NoOutcomes)
MktModel
Alpha Carhart Alpha
MktModel Alpha
Carhart Alpha
MktModel Alpha
Carhart Alpha
(1) (2) (3) (4) (5) (6) Full sample 11.254*** 7.987**
3.999 2.325 7.255 5.662
[3.473] [3.340]
[5.251] [5.379] [5.982] [6.140]
Asia 14.183** 13.216**
2.587 0.588 11.596 12.628
[6.172] [6.299]
[6.717] [6.820] [8.194] [8.350]
Europe 8.238* 8.077*
4.587 3.209 3.650 4.868
[4.889] [4.781]
[6.506] [6.702] [7.222] [7.417] N. America 11.309** 6.550
1.380 -1.206 9.930 7.756
[4.613] [4.449]
[6.633] [6.816] [8.513] [8.675]
61

Table 12 Determinants of activist engagement outcomes This table reports results of probit regressions of activist engagement outcomes. We focus on whether the activist achieves at least one outcome, and at least one specific type of outcome. Holding period is the log of the number of days between initial disclosure and exit of the activist; Previous target indicates whether (1) or not (0) the firm is a previous target of activism in our sample; Wolf pack indicates whether (1) or not (0) multiple activists engage the firm at the same time. Initial stake is the stake of the activist at initial announcement; Market cap is the log of market capitalization of the target in the year prior the engagement; Closely held is the percent of closely held equity of the target firm in the year prior to the engagement. Wolf pack engagements are considered as one observation; Holding period and Initial stake are averaged across activists for these observations. All specifications include entry year, exit year and one-digit SIC industry fixed effects. Coefficients are reported as marginal effects. Panel A reports the baseline regressions, with region fixed effects, and Asia as the base case. Panel B repeats that regression, but with country fixed effects, and the U.S. as the base case; countries with less than five engagements are classified as “Rest of world” and not shown. Robust standard errors of the marginal effects are reported in brackets. ***, **, and * indicate significance at the 1%, 5%, and 10% level, respectively.
Panel A: Determinants of activist engagement outcomes Dependent variable At least one outcome
achieved (1/0) Specific outcome types achieved
Board outcome (1/0)
Payout outcome (1/0)
Restructuring outcome (1/0)
Takeover outcome (1/0)
(1) (2) (3) (4) (5) (6) (7) (8) (9) (10) dF/dx dF/dx dF/dx dF/dx dF/dx dF/dx dF/dx dF/dx dF/dx dF/dx Region: Europe 0.324*** 0.377***
0.246*** 0.303***
0.029 0.038
0.123*** 0.124***
0.203*** 0.240***
[0.043] [0.046]
[0.048] [0.052]
[0.031] [0.034]
[0.031] [0.035]
[0.042] [0.047]
Region: N. America 0.424*** 0.492*** 0.329*** 0.379***
0.109*** 0.142***
0.107*** 0.134***
0.168*** 0.202***
[0.038] [0.039]
[0.045] [0.049]
[0.029] [0.030]
[0.030] [0.033]
[0.040] [0.045]
Holding period (log) 0.090*** 0.093*** 0.128*** 0.158***
0.052*** 0.046***
0.052*** 0.035**
0.003 0.002
[0.019] [0.022]
[0.021] [0.027]
[0.014] [0.015]
[0.015] [0.016]
[0.013] [0.014]
Previous target -0.066 -0.135**
-0.042 -0.120**
-0.031 -0.080*
0.016 0.021
0.006 0.007
[0.056] [0.060]
[0.045] [0.050]
[0.041] [0.047]
[0.039] [0.040]
[0.042] [0.043]
Wolf pack 0.276*** 0.267*** 0.100*** 0.081**
-0.001 0.005
0.009 -0.024
-0.029 -0.027
[0.041] [0.046]
[0.030] [0.036]
[0.025] [0.028]
[0.025] [0.028]
[0.029] [0.032]
Initial stake
0.005**
0.003
-0.001
0.003**
0.003**
[0.002]
[0.002]
[0.001]
[0.001]
[0.001]
Market cap (log)
0.020**
0.001
0.020***
0.032***
-0.002
[0.010]
[0.008]
[0.007]
[0.006]
[0.007]
Closely held (perc)
0.001*
0.001**
0.001
-0.000
0.000
[0.001]
[0.001]
[0.000]
[0.000]
[0.000]
Industry FE Yes Yes
Yes Yes
Yes Yes
Yes Yes
Yes Yes Entry and exit year FE Yes Yes
Yes Yes
Yes Yes
Yes Yes
Yes Yes
Observations 1,535 1,193
1,535 1,193
1,535 1,193
1,535 1,193
1,535 1,193 Pseudo R-squared 0.125 0.171 0.115 0.148 0.0910 0.107 0.0750 0.132 0.151 0.178
62
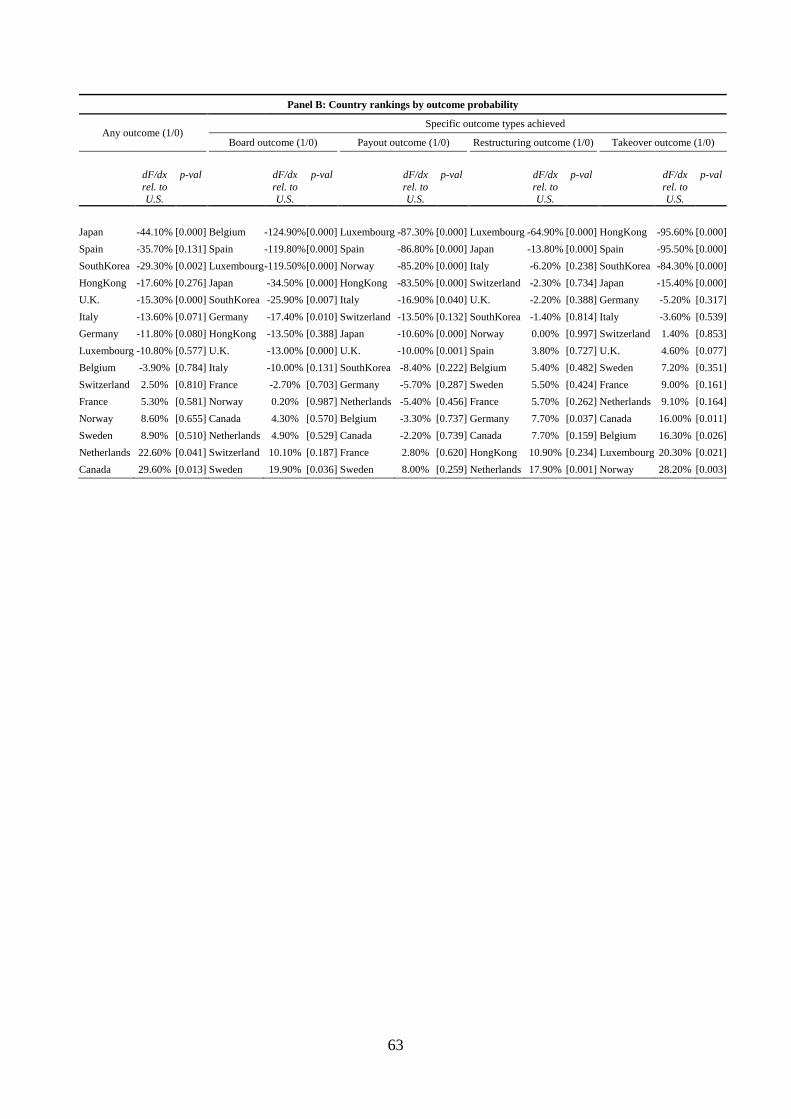
Panel B: Country rankings by outcome probability
Any outcome (1/0) Specific outcome types achieved
Board outcome (1/0) Payout outcome (1/0) Restructuring outcome (1/0) Takeover outcome (1/0)
dF/dx
rel. to U.S.
p-val dF/dx rel. to U.S.
p-val dF/dx rel. to U.S.
p-val dF/dx rel. to U.S.
p-val dF/dx rel. to U.S.
p-val
Japan -44.10% [0.000] Belgium -124.90% [0.000] Luxembourg -87.30% [0.000] Luxembourg -64.90% [0.000] HongKong -95.60% [0.000] Spain -35.70% [0.131] Spain -119.80% [0.000] Spain -86.80% [0.000] Japan -13.80% [0.000] Spain -95.50% [0.000] SouthKorea -29.30% [0.002] Luxembourg -119.50% [0.000] Norway -85.20% [0.000] Italy -6.20% [0.238] SouthKorea -84.30% [0.000] HongKong -17.60% [0.276] Japan -34.50% [0.000] HongKong -83.50% [0.000] Switzerland -2.30% [0.734] Japan -15.40% [0.000] U.K. -15.30% [0.000] SouthKorea -25.90% [0.007] Italy -16.90% [0.040] U.K. -2.20% [0.388] Germany -5.20% [0.317] Italy -13.60% [0.071] Germany -17.40% [0.010] Switzerland -13.50% [0.132] SouthKorea -1.40% [0.814] Italy -3.60% [0.539] Germany -11.80% [0.080] HongKong -13.50% [0.388] Japan -10.60% [0.000] Norway 0.00% [0.997] Switzerland 1.40% [0.853] Luxembourg -10.80% [0.577] U.K. -13.00% [0.000] U.K. -10.00% [0.001] Spain 3.80% [0.727] U.K. 4.60% [0.077] Belgium -3.90% [0.784] Italy -10.00% [0.131] SouthKorea -8.40% [0.222] Belgium 5.40% [0.482] Sweden 7.20% [0.351] Switzerland 2.50% [0.810] France -2.70% [0.703] Germany -5.70% [0.287] Sweden 5.50% [0.424] France 9.00% [0.161] France 5.30% [0.581] Norway 0.20% [0.987] Netherlands -5.40% [0.456] France 5.70% [0.262] Netherlands 9.10% [0.164] Norway 8.60% [0.655] Canada 4.30% [0.570] Belgium -3.30% [0.737] Germany 7.70% [0.037] Canada 16.00% [0.011] Sweden 8.90% [0.510] Netherlands 4.90% [0.529] Canada -2.20% [0.739] Canada 7.70% [0.159] Belgium 16.30% [0.026] Netherlands 22.60% [0.041] Switzerland 10.10% [0.187] France 2.80% [0.620] HongKong 10.90% [0.234] Luxembourg 20.30% [0.021] Canada 29.60% [0.013] Sweden 19.90% [0.036] Sweden 8.00% [0.259] Netherlands 17.90% [0.001] Norway 28.20% [0.003]
63
Top Related
Copyright © 2022 FDOKUMEN

