


Bahasa
Halaman
Hukum


Acc
epte
d A
rtic
le
This article has been accepted for publication and undergone full peer review but has not
been through the copyediting, typesetting, pagination and proofreading process, which may
lead to differences between this version and the Version of Record. Please cite this article as
doi: 10.1111/gcb.14156
This article is protected by copyright. All rights reserved.
DR. JAMES JOHNSON (Orcid ID : 0000-0002-9008-111X)
PROF. STEFANO CARNICELLI (Orcid ID : 0000-0001-5431-2569)
MR. ARNE VERSTRAETEN (Orcid ID : 0000-0002-8813-1261)
Article type : Primary Research Articles
The response of soil solution chemistry in European forests to
decreasing acid deposition
James Johnson1
Elisabeth Graf Pannatier2
Stefano Carnicelli3
Guia Cecchini3
Nicholas Clarke4
Nathalie Cools5
Karin Hansen6a,b
Henning Meesenburg7
Tiina M. Nieminen8
Gunilla Pihl -Karlsson9
Hugues Titeux10

Acc
epte
d A
rtic
le
This article is protected by copyright. All rights reserved.
Elena Vanguelova11
Arne Verstraeten5
Lars Vesterdal12
Peter Waldner2
Mathieu Jonard10
1School of Agriculture and Food Science, University College Dublin, Belfield, Dublin 4, Ireland
2WSL, Swiss Federal Institute for Forest, Snow and Landscape Research, Zürcherstrasse 111, CH-
8903 Birmensdorf, Switzerland
3Earth Sciences Department, University of Florence, Via La Pira 4, 50125 Firenze, Italy
4Norwegian Institute of Bioeconomy Research, P.O. Box 115, N-1431 Ås, Norway
5Research Institute for Nature and Forest (INBO), Havenlaan 88, 1000 Brussels, Belgium
6aIVL Swedish Environmental Research Institute, Box 210 60, SE-100 31 Stockholm, Sweden
6bSwedish Environmental Protection Agency, SE-106 48 Stockholm, Sweden
7Northwest German Forest Research Institute, Grätzelstrasse 2, D-37079 Göttingen, Germany
8Natural Resources Institute Finland Luke, Latokartanonkaari 9, 00790 Helsinki, Finland
9aIVL Swedish Environmental Research Institute, Box 530 21, SE-400 14 Göteborg, Sweden10UCL-
ELI, Université Catholique de Louvain, Earth and Life Institute, Croix du Sud 2, L7.05.09, BE-1348
Louvain-la-Neuve, Belgium
11Centre for Ecosystem, Society and Biosecurity, Forest Research, Farnham, Surrey, GU10 4LH, UK
12Department of Geosciences and Natural Resource Management, University of Copenhagen,
Rolighedsvej 23, DK-1958 Frederiksberg C, Denmark

Acc
epte
d A
rtic
le
This article is protected by copyright. All rights reserved.
Keywords: soil acidification, air pollution, acid deposition, aluminium, sulphur, nitrogen, DOC,
critical loads
Running head: Trends in soil solution in European forests
Corresponding author: James Johnson, tel: 353 86 1614924, email [email protected]
Abstract
Acid deposition arising from sulphur (S) and nitrogen (N) emissions from fossil fuel combustion and
agriculture has contributed to the acidification of terrestrial ecosystems in many regions globally.
However, in Europe and North America, S deposition has greatly decreased in recent decades due to
emissions controls. In this study we assessed the response of soil solution chemistry in mineral
horizons of European forests to these changes. Trends in pH, acid neutralising capacity (ANC), major
ions, total aluminium ( ), and dissolved organic carbon (DOC) were determined for the period
1995-2012. Plots with at least 10 years of observations from the ICP Forests monitoring network were
used. Trends were assessed for the upper mineral soil (10-20 cm, 104 plots) and subsoil (40-80 cm,
162 plots). There was a large decrease in the concentration of sulphate ( in soil solution; over a
ten-year period (2000-2010), decreased by 52% at 10-20 cm and 40% at 40-80 cm. Nitrate was
unchanged at 10-20 cm but decreased at 40-80 cm. The decrease in acid anions was accompanied by a
large and significant decrease in the concentration of the nutrient base cations, calcium, magnesium
and potassium (Bc + ) and over the entire dataset. The response of soil
solution acidity was non-uniform. At 10-20 cm, ANC increased in acid-sensitive soils (base saturation
≤10%) indicating a recovery, but ANC decreased in soils with base saturation >10%. At 40-80 cm
ANC remained unchanged in acid-sensitive soils (base saturation ≤20%, ≤4.5) and decreased

Acc
epte
d A
rtic
le
This article is protected by copyright. All rights reserved.
in better-buffered soils (base saturation >20%, >4.5). In addition, the molar ratio of Bc to
either did not change or decreased. The results suggest a long-time lag between emission
abatement and changes in soil solution acidity and underline the importance of long-term monitoring
in evaluating ecosystem response to decreases in deposition.
Introduction
Air pollution can impact forest health directly, through foliar damage, and indirectly, through soil-
mediated effects on nutrient availability and root functioning which in turn can exacerbate natural
stress factors such as drought and pest outbreaks (De Vries et al., 2000). Acid deposition arising from
emissions of sulphur (S) and nitrogen (N) from fossil fuel combustion and agriculture has contributed
to the acidification of terrestrial ecosystems in many regions globally (Bouwman et al., 2002). Acid
deposition increases the concentration of protons (H+) and strong acid anions (AA), including
sulphate ( ), nitrate (
) and chloride (Cl-), in soils, which increases the rate of base cation
leaching ( ) and associated soil acidification. In forest soils, acid deposition is
primarily buffered by Bc released from mineral weathering (Ulrich, 1983). However, when the rate of
proton deposition exceeds Bc weathering, soil solution becomes more acidic, with a decrease in pH
and acid neutralizing capacity (ANC) - the difference between Bc and AA (
–
. This in turn can bring potentially toxic forms of aluminium
(Al) and other metals into solution (Reuss and Johnson, 1986). In addition, soil exchangeable Bc
pools are depleted and base saturation (BSat) the proportion of Bc on the soil cation exchange
complex, decreases. As a result, in poorly buffered soils (BSat<20%), acid deposition results in
elevated inorganic Al and H+ in soil solution and drainage waters (Driscoll et al., 2001).

Acc
epte
d A
rtic
le
This article is protected by copyright. All rights reserved.
Ecological impacts on forests have been widely documented. Acid deposition has resulted in a decline
of sugar maple and red spruce stands in eastern North America due to soil depletion (DeHayes
et al., 1999; Sullivan et al., 2013; Battles et al., 2014). In Europe, high levels of Al in soil solution
have reduced nutrition in Norway spruce (de Wit et al., 2010; Lomský et al., 2012). High
inorganic Al in soil solution can also impact tree fine root growth and functioning (Godbold et al.,
2003; Vanguelova et al., 2007a). Acid deposition also significantly altered carbon (C) and N cycling
in soil organic horizons of Norway spruce forests in the Czech Republic (Oulehle et al., 2011). In
China, acid deposition has resulted in significant acidification of subtropical forest soils (Liu et al.,
2010; Larssen et al., 2011; Liu et al., 2011; Zhu et al., 2016).
In recent decades, air pollution reduction policies, such as the Convention on Long-Range
Transboundary Air Pollution (CLRTAP) (UNECE, 1979) in Europe and the Clean Air Act
Amendments in North America have resulted in large decreases in S emissions. Nitrogen emissions
also decreased but not to the same extent (EEA, 2016). As a result, there has been a large decrease in
atmospheric S deposition. In Europe, precipitation decreased by 73% between 1990-2012
(Colette et al., 2016). Meanwhile, in precipitation decreased by 33% for the same period
(Colette et al., 2016). In many parts of the world however, acid deposition is increasing due to rapid
economic expansion (Dentener et al., 2006) such that many forests will experience acid deposition in
the future (Posch et al., 2015). For example, in industrialized and agriculturally intensive areas of
China, rates of inorganic N deposition are like peak levels in northwestern Europe in the 1980s (Liu et
al., 2013). Evaluating responses to changes in acid deposition is thus key to supporting worldwide
effective emissions controls and recovery of impacted ecosystems.
There has been much focus on the response of sensitive soils and surface waters in Europe and North
America to acid deposition. In surface waters, there has been an almost universal decrease in
often accompanied by increasing pH and ANC (Stoddard et al., 1999; Skjelkvåle et al., 2007; Garmo

Acc
epte
d A
rtic
le
This article is protected by copyright. All rights reserved.
et al., 2014; Driscoll et al., 2016). The response varies regionally with delayed recovery of pH and
ANC in some areas (Strock et al., 2014) due to desorption of accumulated in soils and depletion
of soil Bc pools (Alewell et al., 2000a; Futter et al., 2014; Fakhraei et al., 2016; Watmough et al.,
2016).
Monitoring of the effects of air pollution on forest health has been carried out in Europe by ICP
Forests (International Co-operative Programme on Assessment and Monitoring of Air Pollution
Effects on Forests) under the CLRTAP. Soil solution has been monitored at the intensive monitoring
Level II plots in the ICP Forests network since the early 1990s (De Vries et al., 2003). The chemistry
of soil solution provides an indication of nutrient availability, potential acid stress to fine roots and
mycorrhizae (Binkley and Fisher, 2012) as well as potential exceedance of deposition critical loads.
The molar ratio of nutrient cations (Bc = + ), to total aluminium, Bc:Altot or the
to Altot ratio (Ca:Altot) are often used as indicators of toxic effects of Al on plant roots (Cronan et
al., 1989; Sverdrup and Warfvinge, 1993). They are also used as the chemical criteria in calculating
critical loads of acidity in forests; a Bc:Altot threshold of between 0.6 and 1.2 is applied depending on
tree species (CLRTAP, 2017).
In contrast to surface waters, there have been relatively few regional assessments of changes in soil
solution in response to decreasing acid deposition. Iost et al. (2012) found no change in the soil
solution Bc:Altot molar ratio or inorganic N at ICP Forests plots with at least 5 years of data up to the
mid-2000s. However, changes in S, pH, ANC and other parameters have yet to be assessed.
The soil solution data collected at intensively monitored plots in the ICP Forests network represent a
unique long-term dataset to assess the response of soil solution acidity to decreasing and
inorganic N deposition in recent decades. The data have been collected using harmonised methods for
sampling and analysis, making it possible to assess changes at the European scale. Specific objectives

Acc
epte
d A
rtic
le
This article is protected by copyright. All rights reserved.
were to characterise the chemistry of soil solution with respect to acidity (pH, ANC, ), major
ions and dissolved organic carbon (DOC) and to assess the temporal changes in these parameters
since the mid-1990s. It was expected that the decrease in and inorganic N deposition would
result in less and
in soil solution. This in turn was expected to result in an increase in
ANC, Bc:Altot and pH in poorly buffered soils and a decrease in soil solution Bc in better-buffered
soils. As such, trends were stratified by soil buffering capacity. Soil solution chemistry also varies
biogeographically (Garmo et al., 2014), between forest types (Kristensen et al., 2004) and by the
magnitude of atmospheric deposition. A second objective was to assess the influence of these factors
on soil solution trends.
Materials and methods
Sample collection and analysis
Soil solution, throughfall deposition and soil chemistry data from the ICP Forests Level II monitoring
network were used (Lorenz, 2010). Deposition data were processed by the ICP Forests Expert Panel
on Deposition as described by Waldner et al. (2014). Throughfall and soil solution data used for the
42 Swedish plots were collected within the SWETHRO network (Pihl Karlsson et al., 2011). Soil
and BSat, from a soil survey in the mid 1990s, were provided by the Forest Soil Coordinating
Centre (FSCC) of ICP Forests. Methods for soil solution collection, analysis and quality control have
been harmonized since 1995 and are described in the ICP Forests manual on soil solution collection
and analysis (Nieminen et al., 2016). The number of lysimeters varied among plots and depth
intervals and was generally reported as a single value either from analysis of a pooled sample or the
average of individual samples. A mandatory minimum of three lysimeters per depth interval was
required (Nieminen et al., 2016). Sampling took place weekly, fortnightly or monthly. After sample
collection, a subsample was taken for determination of pH and conductivity. The remaining sample
was passed through a 0.45 µm membrane filter and analysed for major ions ( , , ,
Acc
epte
d A
rtic
le
This article is protected by copyright. All rights reserved.
,
, , ), DOC and . Laboratories in ICP Forests network participating countries
carried out the analyses. Sample collection and analysis were subject to quality assurance and quality
control checks including the use of control charts for internal reference, charge balance and
participation in laboratory ring tests (König et al., 2013; Marchetto et al., 2009). Sampling below
canopy throughfall and of open field bulk precipitation was carried out at the plots, and on a nearby
opening, respectively, following the ICP Forests manual on sampling and analysis of deposition
(Clarke et al., 2016). In general, between 3 and 20 replicate collectors were used and samples
collected at weekly, fortnightly or monthly intervals.
Time series selection
Temporal changes were tested for plots that had at least 10 years of data between 1995 and 2012.
Time series with gaps of 5 years or more were excluded. Soil solution was sampled using a range of
lysimeters; the most common was the tension (suction-cup) lysimeter. To avoid artifacts due to
sampler type, the analysis was applied for tension lysimeters only. In addition, data from organic soils
(Histosols) were excluded, as they would be expected to respond differently than mineral soils to
changes in deposition. Sampling depths ranged from just below the forest floor (0 cm) down to 4 m,
with 90% of the lysimeters located between 0 and 80 cm. In general, lysimeters were installed in the
upper mineral soil corresponding to the rooting zone and at a deeper depth, considered to be below the
rooting zone. The time series were grouped into two depth intervals: upper mineral soil: 10-20 cm
representing the upper, more organic rich rooting zone and lower mineral soil: 40-80 cm representing
a deeper, more mineral horizon where water was draining from the soil profile. Where more than one
depth was sampled in an interval, the depth closest to the median of all the plots was selected; either
20 cm (for 10-20 cm interval) or 50 cm (40-80 cm interval).

Acc
epte
d A
rtic
le
This article is protected by copyright. All rights reserved.
Site and soil description
A total of 171 plots were included. Of these, 104 had soil solution data at 10-20 cm, 162 at 40-80 cm
(Fig. 1) and 95 at both depth intervals. Of the 171 plots, 120 were primarily coniferous stands and 51
were dominated by deciduous trees. The most common tree species were Picea abies (L.) Karst. (67),
Pinus sylvestris L. (35) and Fagus sylvatica L. (31). Median soil was 3.9 in the 10-20 cm
depth interval and 4.4 at 40-80 cm (Table 1). The number of plots with <5 was 93 (of 100) in
the upper depth interval and 124 (of 145) in the lower depth interval. The majority were acid soils and
buffered via silicate weathering, cation exchange and, at lower pH, the dissolution of aluminium
oxides and hydroxides (Ulrich, 1983). Base saturation was low, median values being 11% and 20% in
the two depth intervals, respectively. A BSat of 20% was observed as a threshold at which acid
deposition resulted in the mobilisation of Al and to surface waters (Driscoll et al., 2001). The
ranges of soil and BSat were representative of those reported from the ICP Forests Level I
network (Cools and de Vos, 2011).
Data pre-treatment
Values reported as below quantification limit were replaced either by a value submitted by individual
countries to represent the quantification limit over the time (10 countries), or by the limit of detection
values submitted to the ICP Forests database in 2010 (3 countries). Secondly, the precision of data
(number of decimal places) submitted to the database changed over the study period. Levene’s test
(Levene, 1960) was used to test for homogeneity of variance in the data at different levels of precision
and there were no significant differences so that trend analysis could be applied across the whole-time
series. At some plots, data from individual lysimeters were reported in the database, in which case the
median value was used. Soil solution data were aggregated to monthly time intervals by taking the
median of multiple observations per month, where present. Trends in pH, major ions ( ,
, , ,
, ), DOC, and the molar ratio were tested. trends were

Acc
epte
d A
rtic
le
This article is protected by copyright. All rights reserved.
also tested for soils with pHCaCl2 <5.0, where the ratio is closer to the critical limit. In addition, trends
were tested for AA, Bc and ANC. Ammonium in soil solution was close to or below detection limit
for most plots and was not analysed for trends. The normality of soil solution data was evaluated for
skewness and kurtosis (Pearson's kurtosis, R) using the ‘moments’ package in R. Except for pH and
ANC, the data were heavily skewed. Hence, a log-transformation was applied to improve normality
for all the other parameters ( , , , ,
, , DOC, , AA, Bc, ).
Deposition consisted of monthly fluxes of throughfall and open field bulk precipitation. Details of
data preparation and checks are described in Waldner et al. (2014).
Trends at the European scale
A linear mixed-effects model was used to detect temporal changes in soil solution at the European
scale, like that applied by Jonard et al. (2015). The intercept and slope of the model contained both
fixed and random effects. For the intercept, the fixed parameter ‘a’ corresponded to solute
concentration in the year 2000 and ‘month’ to the monthly intercept (Eqn. 1). As the intercept of the
linear model would correspond to the concentration in the year 0, the data were centred on the year
2000 by subtracting 2000 from the sampling year. Another random factor was used to account
for country effects (e.g. due to differences in sample collection or analysis among countries) and a
random factor was used to account for plot effects. Another random factor ( was
included to account for the non-linear interannual variability.
For the slope, parameter b is the fixed part describing the slope over time—the long-term change.
Random coefficients ( ) and plots ( ) were included to account for individual country and
plot changes (Eqn. 1).

Acc
epte
d A
rtic
le
This article is protected by copyright. All rights reserved.
(1)
where is the variance of the intercept (i) due to random factor country,
the variance of the
intercept (i) due to plot factor and the intercept variance due to random factor year.
is the
variance of the slope (s) due to random factor country and random slope variance due to plot
effects.
Several covariance structures were tested to test if accounting for serial autocorrelation would
improve the model. The structures tested were autoregressive (AR), Toeplitz, autoregressive moving
average (ARMA) and three forms of spatial covariance (exponential, linear and power). The tests
were carried out on a subset of data and evaluated by comparing the information criteria (AIC, BIC)
of the fitted model. The best fit was given by the autoregressive moving average (ARMA), which then
was used in the full dataset.
For log-transformed data, the fitted values of the fixed parameters were used to report the change
relative to the intercept over 10 years according to:
(2)
For untransformed data the relative change was described by:
(3)
The fitting of the linear model was carried out with the MIXED procedure of the SAS software
(version 9.3; SAS institute Inc., Cary, NC, USA).
Acc
epte
d A
rtic
le
This article is protected by copyright. All rights reserved.
Trends at individual plots
The linear mixed-effects model was run at individual plots with ‘year’ and ‘month’ as fixed factors
and ‘year’ as a random factor. At each plot, the intercept in the year 2000 gave the concentration for
that year. These values were used to calculate summary statistics for soil solution in the year 2000.
The linear model was run for throughfall chemical changes at individual plots and the relative change
was calculated as above. The plots were then assigned to two categories of throughfall and included in
the analysis by environmental factors.
Stratification by environmental factors
To assess the influence of environmental factors on soil solution trends, additional models were run
with these factors included as fixed factors. The models tested whether temporal trends differed
among levels of the factor. Factors were limited to two or three levels to avoid fragmenting the data
into too many small subsets of plots making the detection of trends difficult. The variables were
region, forest type, soil acidity, and trends in throughfall deposition.
The factor region was included to reflect regional changes in deposition, as well as biogeography and
climatic influences on soil acidity trends. Countries were assigned to three regions as follows: North
(Norway, Sweden, Finland), West (Belgium, Denmark, France, Ireland, United Kingdom) and Central
(Austria, Germany, Switzerland). Plots in Spain (1) and Italy (2) were not included as there were not
enough to form a category for southern Europe.
Soil solution trends could differ between deciduous and coniferous plots due to differences in nutrient
cycling, deposition magnitude and trends as well as soil fertility. For example, it has been shown that
there was a greater response in soil solution to atmospheric inputs at broadleaf forests in Europe,
as they are usually located on more fertile soils (Kristensen et al., 2004).
Acc
epte
d A
rtic
le
This article is protected by copyright. All rights reserved.
Soil acidity is an important determinant of soil solution chemistry and would be expected to moderate
the response to deposition changes. In more acidic soils, decreased acid input should result in less
inorganic Al and in soil solution, whereas Bc response should be more evident in less acidic soils.
We divided the plots into two categories of soil and BSat using their median values. The
values differed with depth interval, as the upper layer was more acidic.
For SO42-, throughfall provides an indication of the total deposition (Clarke et al., 2016). Plots were
divided into groups based on the change in flux for a ten-year period relative to the year 2000. For
throughfall , the plots were divided into two categories based on the median, e.g. for
the
median trend was a 60% decrease over ten years, so plots were grouped into those with a greater
decrease and those with a smaller (Table 2). Soil solution trends were tested between levels of
throughfall Bc, inorganic N (
) and potential acidity ( , which was used to account
for the potential acidifying effect due to nitrification of deposition. Potential acidity is the sum
of total deposition of non-marine AA plus minus non-marine Bc
(CLRTAP, 2017). The non-marine fraction was calculated
assuming all was of marine origin and then using the ratio of to other ions in seawater to
calculate their marine and non-marine fractions.
Results
Soil solution statistics
Soil solution was acidic at most plots with median ANC values of −47 and −26 in the year
2000, at 10-20 cm and 40-80 cm depth respectively (Table 3, Fig. 2, Fig. 3). Soil solution pH was
lower at 10-20 cm than at 40-80 cm; 5th and 95th percentiles were 3.7 and 7.0 at 10-20 cm, and 4.1 and
7.7 at 40-80 cm (Table 3). At 10-20 cm, made the greatest contribution to Bc, followed by
and . At 40-80 cm, was the most abundant Bc followed by and .

Acc
epte
d A
rtic
le
This article is protected by copyright. All rights reserved.
The difference between depths was likely due to the inclusion of 42 plots from Sweden at 40-80 cm.
These plots had a higher concentration due to marine deposition. Median ratio was 1.4
and 1.5 in both depth intervals, respectively. The concentration of DOC decreased with depth, with
median values of 12 mg L−1 at 10-20 cm and 6.8 mg L−1 at 40-80 cm (Table 3, Fig. 2, Fig. 3).
Sulphate was the anion in highest concentration in soil solution, and it increased markedly from
shallow to deeper soil depths (Table 3). Chloride concentrations were also relatively high; median
values were 94 and 106 at 10-20 cm and 40-80 cm. Median was 16 and 7.2 μeq L−1
(0.23 and 0.10 mg N L−1) at 10-20 cm and 40-80 cm, respectively. However, there were considerable
regional differences in with some areas having concentrations close to detection limit, while
others had elevated . At 10-20 cm, 46 plots (44%) had median concentrations greater than 1 mg
N L−1 (71 μeq L−1), a proposed threshold for critical N leaching and saturation (Gundersen et al.,
2006; Stoddard, 1994). At 40-80 cm, the number of plots with median higher than 1 mg N L−1 was 51
(31%).
Trends in soil solution: global model
There was a large and significant decrease in the concentrations of , Bc and at both soil
depths over the monitoring period (Table 4, Fig. 2, Fig. 3). Sulphate decreased by 52% and 40% at
10-20 cm and 40-80 cm respectively over a ten-year period, a change in concentration of −61 and −69
, respectively. Concentrations of decreased by −57 and −68 over a ten-year
period, while decreased by −24 and −18 and by −7.1 and −3.5 at the two
depths (Table 4). Nitrate was unchanged at 10-20 cm but showed a relative decrease of 30% at 40-80
cm. There was no change in or . Overall, Bc decreased by 47% and 26% over a ten-year
period. These decreases offset the decrease in AA such that ANC did not change (Table 4, Fig. 2, Fig.
3). In addition, there were no significant trends in soil solution pH. Total Al declined at both depths;
relative decreases were 19% at 10-20 cm and 17% at 40-80 cm over ten years. Despite the decrease in

Acc
epte
d A
rtic
le
This article is protected by copyright. All rights reserved.
, the Bc:Altot ratio of acidic soils ( <5.0) showed no change. The concentration of DOC
showed a small but significant decrease (17%) at 40-80 cm but no change at 10-20 cm (Table 4, Fig.
2, Fig. 3).
With the exceptions of DOC and , trends were similar between soil depths (Table 4). The
significance, direction and magnitude were similar when the analysis was carried out on the forest
plots common to both soil depths (Supporting Information; Table S1). The only differences were for
, which no longer was significant at 40-80 cm, and , which showed a small but significant
decrease at 10-20 cm.
There were also similarities between trends in soil solution and deposition. Significant decreasing
trends were found for , inorganic N and Bc in throughfall at the plots (Supporting Information;
Table S2). Throughfall decreased by 60% over a ten-year period, a change in concentration of
−35 (Table S2). Throughfall inorganic N decreased by 33% over ten years relative to 2000
and by a concentration of −17 . Trends were significant for both and
in throughfall
deposition. Base cation deposition in throughfall also decreased but not to the same extent as AA. The
relative ten-year change in Bc was −14%. As a result, ANC increased in throughfall, by +27
over ten years. ANC was unchanged in bulk precipitation, which suggests that dry deposition of S
and/or internal cycling of Bc influenced ANC in throughfall. pH increased significantly in both bulk
precipitation and throughfall (Supporting Information; Table S2). The difference in ANC and pH
trends in bulk precipitation was likely due to a difference in the datasets used, ANC was not available
at all plots, while other plots were missing pH in some years.
Acc
epte
d A
rtic
le
This article is protected by copyright. All rights reserved.
Trends in soil solution, stratified by environmental factors
There was a non-uniform response of soil solution acidity when stratified by soil buffering capacity.
At 40-80 cm, decreases in deposition resulted in greater changes in soil solution concentrations of Bc
in better-buffered soils ( >4.5, BSat>20%). This was due to the larger decrease in in soil
solution in these soils as might be expected due to their buffering capacity (Table 5). However, the
decrease in AA did not match that of Bc and ANC decreased in these soils as a result (Table 5). In
contrast, in soils with ≤ 4.5, there was a greater decrease in and
, but there was no
trend in ANC in these soils. Aluminium decreased significantly in both groups, but more in the more
acidic one ( ≤4.5, BSat≤20%). When sites were classified according to BSat, the trends were
similar; soils with BSat>20% experienced greater decrease in Bc and decreasing ANC trend
compared to those with BSat≤20% (Supporting Information; Table S3). As such, at 40-80 cm, soil
solution acidity was unchanged in the more acidic soil group but continued to increase in better-
buffered soils.
At 10-20 cm there was no difference in trends between soils classified by soil (Table 5);
however, soils with BSat≤10% showed a significant increase in ANC, whereas those with BSat>10%
had significantly decreasing ANC (Supporting Information; Table S3).
Forest type (coniferous/deciduous) had a significant influence on soil solution Bc trends. At both soil
depths, decreased more under deciduous plots while decreased more under coniferous plots
(Table 5). Magnesium, and Bc decreased significantly more in deciduous plots at 40-80 cm. The
relative change in these ions was generally higher in coniferous plots where concentrations were
lower. At 40-80 cm, there was a significant increase in ANC at coniferous plots and a decrease at
deciduous plots. At 10-20 cm, decreased significantly at coniferous plots. The trends for forest
type were somewhat like those for soil pH and BSat. This was due to covariance between factors;
coniferous plots had lower BSat and greater decreases in throughfall than deciduous plots
(Supporting Information; Table S4).
Acc
epte
d A
rtic
le
This article is protected by copyright. All rights reserved.
There were few regional differences in soil solution trends (Table 5). At 10-20 cm, the only difference
was for , which decreased more in the Central region compared to the North and West Europe.
At 40-80 cm, decreased more in the Central and West regions than in northern Europe and a
significant decrease in DOC was evident in the Central and Western regions but not in the North
(Table 5).
There were few differences in soil solution trends when plots were grouped by changes in throughfall
, , Bc or inorganic N. At 10-20 cm,
showed a response to throughfall; soil solution
decreased more at plots with larger decreases in throughfall
(Table 5). In contrast, at 40-
80 cm, decreased more in plots where throughfall decreased by less than 60% but ANC
declined significantly at these plots. Overall, there were few significant trends, or few consistent
trends between depth intervals or among throughfall , , Bc or inorganic N categories
(Supporting Information; Table S3).
Discussion
Large decrease in soil solution
The large decrease in deposition and soil solution at the European scale was similar to
observations from individual forest plots (Brumme et al., 2009; Vanguelova et al., 2010; Pihl
Karlsson et al., 2011; Verstraeten et al., 2012; Waldner et al., 2014) and surface waters
(Prechtel et al., 2001; Kvaalen et al., 2002; Garmo et al., 2014; Driscoll et al., 2016) and
consistent with the large decrease in SO2 emissions in Europe and North America (EEA,
2016). Trends in soil solution at 10-20 cm were similar in magnitude to changes in
throughfall. Larger changes were observed at plots with larger decreases in throughfall ,
suggesting that the upper soil layer responded rapidly to changes in inputs. However, the

Acc
epte
d A
rtic
le
This article is protected by copyright. All rights reserved.
magnitude of the soil solution decrease at 40-80 cm was lower than at 10-20 cm. Many
studies have reported a lag in response of in soil solution and surface waters to
decreasing deposition (Oulehle et al., 2006; Meesenburg et al., 2016). This has been
attributed to desorption of previously deposited SO42-
from soils (Sokolova and Alekseeva,
2008; Fakhraei et al., 2016), dissolution of Al-hydroxy-sulphates (Khanna et al., 1987) or
climate induced changes in S cycling (Mitchell and Likens, 2011). Release of from
soils is generally higher in areas with historically high deposition (Oulehle et al., 2006), and
desorption isotherms suggest it can take decades for soil solution to reach a steady state
with current inputs (Alewell et al., 2000a).
Decreasing Bc in soil solution
The strong temporal decline in soil solution
(and overall AA) was partly balanced by a
significant decrease in Bc. The comparable magnitudes of AA and Bc trends suggest that the
changes in strong acid anions drove trends in Bc and as such, that Bc weathering and release
were the primary buffering mechanism for acid deposition. Throughfall also
decreased significantly and likely contributed to decreasing Bc in soil solution. Where soil
exchangeable Bc pools and weathering rates were small, Bc deposition can influence soil
solution cations (Watmough et al., 2005). Several studies have pointed to Bc deposition as a
factor in temporal soil solution changes (Alewell et al., 2000a; Fölster et al., 2003;
Vanguelova et al., 2010; Ukonmaanaho et al., 2014). Tree uptake of Bc is an important flux,
but it is unlikely to have caused the large decrease in soil solution. Although forest growth
has increased in Europe (Ciais et al., 2008), the rate of Bc uptake has not kept pace.
Observations of foliar Bc nutrition at Level II plots indicate that there has been a progressive
deterioration of the foliar Bc nutrition of European beech and common oak, while no overall

Acc
epte
d A
rtic
le
This article is protected by copyright. All rights reserved.
change in foliar Bc nutrition has been observed for conifer plots (Jonard et al., 2015).
Conversely, it is not evident that changes in soil solution Bc and Altot have influenced foliar
nutrition in European forests. The changes observed in foliar Bc of broadleaved plots were
rather due to a dilution effect associated with an increased growth rate (Jonard et al., 2015).
In addition, in the ICP Forests network, most plots have normal foliar Bc levels. Berger et al.
(2016) similarly found adequate Bc nutrition in beech stands in Austria and declining foliar
Bc trends despite increasing soil exchangeable cations.
Trends in soil solution pH and ANC
The results indicate a non-uniform response to decreases in acid deposition. In the upper soil, poorly
buffered soils (BSat<10%) showed a significant increase in ANC as expected. However, at 40-80 cm,
ANC decreased in better-buffered soils (BSat >20%), which was not expected. In some respects, these
trends reflect those reported by individual studies. At some sites soil solution pH and ANC increased
(Vanguelova et al., 2010; Johnson et al., 2013; Fuss et al., 2015); however, in others acidity remained
unchanged or aggravated (Graf Pannatier et al., 2011; Verstraeten et al., 2012; Meesenburg et al.,
2016). Trends in acidity appear to be spatially variable, and dependent on factors including soil
conditions, forest type, deposition levels and climate. For example, in Sweden, sites in the south,
which historically received the highest deposition, showed a recovery in pH, ANC and inorganic Al,
while sites in other parts of the country did not (Pihl-Karlsson et al., 2011). In the UK, trends of
acidity (pH, ANC) were variable among 10 plots, with the greatest response occurring at sandy soil
sites with the largest deposition reductions (Vanguelova et al., 2010). When aggregated at the
European scale, it could be that opposing trends cancel each other out, as was the likely case here.

Acc
epte
d A
rtic
le
This article is protected by copyright. All rights reserved.
ANC decreased in better-buffered soils at 40-80 cm because and
did not decrease as much
as Bc. Ongoing acidification has been attributed to release of previously adsorbed S (Meesenburg et
al., 2016; Oulehle et al., 2006) as well as decreasing Bc deposition (Ukonmaanaho et al., 2014;
Verstraeten et al., 2012; Fölster et al., 2003; Alewell et al., 2000a) mentioned above. In addition,
forests in parts of Europe (Switzerland, Denmark, Belgium, Germany) are characterised by high N
deposition and in soil solution, which contributes to soil acidification (Hansen et al., 2007; Graf
Pannatier et al., 2011; Verstraeten et al., 2012; Waldner et al., 2014). The response has also been
hampered by mobilisation of acid cations ( ) due to marine ion deposition in Atlantic coastal
areas, which could have influenced the trends (Akselsson et al., 2013; Löfgren et al., 2011). Another
source of noise in the data arises from the nature of the suction cup lysimeters. In these samples, it is
not possible to determine how long the sample has had to equilibrate with the soil, which could vary
among collection periods making the detection of trends more difficult.
The differing acidification trends reflect the results of some repeat soil surveys. In a comparison of
soil pH and BSat between two soil surveys 12 years apart, Cools and De Vos (2011) found a recovery
of BSat in more acidic soils ( < 4.0, BSat <20%) but a decrease in less acidic soils ( >
4.0, BSat >20%). Lawrence et al. (2015) reported an initial recovery in the O horizon at sites in
northeastern US and eastern Canada, but BSat continued to decline in the B-horizon at a third of the
same sites. This suggests that the rate of S and inorganic N deposition might still exceed buffering
capacity in these soils and/or that the lag between deposition reductions and soil response is longer
than expected.
For deeper soils, ANC showed no change in poorly buffered soils. Recovery in these soils could be
limited by decreases in soil solution Bc due to historic depletion of soil exchangeable Bc pools (Houle
et al., 2006; Warby et al., 2005; van der Heijden et al., 2011). At one of the best-documented sites of
soil acidification, at Solling in Germany, soil exchangeable Bc pools were depleted by as much as

Acc
epte
d A
rtic
le
This article is protected by copyright. All rights reserved.
60% (Meesenburg et al., 2016). Weathering rates were low in these soils, and exchangeable pools
could take decades to recover (Reinds et al., 2009). Repeated soil surveys over 50 years in Germany
indicate that the rates of Bc and BSat loss from mineral soils have levelled off at many forest plots,
with some showing an increase in BSat (Wellbrock et al., 2016). Overall, the decrease in soil solution
Bc concentration indicates that the rate of Bc depletion has slowed. Soil exchangeable pools could
recover if the rates of Bc weathering were sufficient to balance the Bc loss. Further research should
focus on the magnitude and direction of Bc budgets at the plots to determine the potential for recovery
in poorly buffered soils.
Trends in soil solution Altot
Aluminium decreased in soil solution across the whole dataset and at 40-80 cm it decreased
more in acidic soils. This was expected given that Al dissolution is a buffering mechanism in
acidic soils. However, the Bc:Altot ratio did not increase in these soils. There are more
reasons for this. Data for Altot were used, which includes both the inorganic and organic Al
fractions (Fakhraei et al., 2015), of which the organic can be significant (Brumme et al.,
2009). For example, in Norway, Lange et al. (2006) found that the proportion of organically
bound Al in soil solution was 39% and 26% at 15 and 40 cm, respectively, while in the UK,
Vanguelova et al. (2007b) found the proportion to be 30-40% in podzols. There were no
changes in DOC at 10-20 cm and a relative decrease of 17% for a ten-year period at 40-80
cm. The small changes in DOC would have maintained the organic fraction of Al in solution,
potentially dampening the trends. However, organically bound Al is less toxic to biota and a
shift in favour of this fraction could support the recovery of drainage waters.

Acc
epte
d A
rtic
le
This article is protected by copyright. All rights reserved.
A second point relates to ionic strength of soil solution and cation exchange. Matschonat and
Vogt (1998) found that a decrease in cation concentration resulted in the preferential
adsorption of trivalent cations on the soil exchange complex relative to di- and mono-valent
cations. It would thus be expected that there would be more of a decrease in Al relative to
other cations, and an increase in ANC. However, this was not the case. A possible
explanation is that the dissolution and precipitation of Al oxides and hydroxides are strongly
pH dependent (Reuss and Johnson, 1986) and, as the pH of soil solution did not change, ionic
forms of Al remained soluble.
No change in DOC in the upper mineral soil
DOC showed no change (10-20 cm) or decreased (40-80 cm) in soil solution. National studies show
non-uniform results; some forest plots previously impacted by acid deposition show increasing DOC
concentrations (Hruška et al., 2009; Verstraeten et al., 2014), whereas no changes are evident in
others (Ukonmaanaho et al., 2014). In addition, surface horizons often show increasing DOC while
mineral horizons show no changes, or decreases (Borken et al., 2011; Sawicka et al., 2016). The
results at 10-20 cm are like those observed by Camino-Serrano et al. (2016) who previously examined
DOC time changes at 84 ICP Forests plots. They reported no consistent DOC concentration changes
in the mineral soil. Our result of decreasing DOC at a depth of 40-80 cm may have arisen due to
differences in the number of plots and spatial coverage; a larger proportion of plots were included
from Fennoscandia in this study, where DOC decreased or showed no changes (Clarke and Lindroos,
2010; Wu et al., 2010; Löfgren and Zetterberg, 2011). Many studies attribute changes in DOC to
climate effects (Worrall and Burt, 2009), reduced ionic strength (Hruška et al., 2009; Haaland et al.,
2010) or acidity (de Wit et al., 2007; Monteith et al., 2007). As climate is less of an influence on
DOC in deeper mineral soils, possible explanations include increased adsorption by mineral surfaces
due to desorption of , or changes in DOC stability as complexation with Al is decreased, leading
to faster DOC decay (Borken et al., 2011).

Acc
epte
d A
rtic
le
This article is protected by copyright. All rights reserved.
For both DOC and acidity, the trends here contrast with those of surface waters reported widely in
Europe and North America (e.g. Monteith et al., 2007; Garmo et al., 2014). One reason for the
difference is the spatial coverage of the sites. The dataset here includes many forest plots from central
Europe not included in studies of acid sensitive surface waters e.g. France, Switzerland, Germany,
Italy, Austria, Belgium. It has previously been reported that surface waters in Central Europe had not
recovered from acidification to the extent as for other parts of Europe (Alewell et al., 2000b).
Secondly, the processes controlling acidity in soil solution and surface waters are different. Soil
solution is naturally more acidic due to higher dissolved CO2 and DOC (Reuss and Johnson, 1986). In
addition, surface water chemistry is not determined by soil solution leachate alone but integrates
contributions from direct runoff, e.g. snow melt and storm events, groundwater and riparian water
(Shand et al., 2005; Fuss et al., 2015). The contribution of these components to surface waters varies
spatially within catchments and seasonally (Michalzik et al., 2003; James and Roulet et al. 2006;
Casson et al., 2014; Fuss et al., 2015). In addition, surface water DOC has been shown to be a
function of landscape features such as wetlands and riparian zones, as well as of catchment
connectivity and hydrology (Laudon et al., 2011; Knorr, 2013). Organic soils of upper horizons and
near-stream zones are considered to be the main sources of dissolved organic matter in headwater
catchments (e.g. Brooks et al., 1999; Billett et al., 2006; Evans et al., 2007; Winterdahl et al., 2011)
where trends in DOC have been observed in comparison to the mineral soils studied here.
Decline in in the lower mineral soil
Another important result was the decrease in at 40-80 cm depth. This most likely reflects the N
status of many plots in Western Europe as inorganic N deposition has decreased. Many plots in
Germany, Denmark, Belgium and the UK have elevated in soil solution and as such are
considered N saturated. Numerous studies have shown that decreases in N deposition have decreased
soil solution (e.g. Boxman et al., 2008; Vanguelova et al., 2010; Verstraeten et al., 2012;
Meesenburg et al., 2016). In contrast to Iost et al. (2012) where no changes were found at most plots,
Acc
epte
d A
rtic
le
This article is protected by copyright. All rights reserved.
the decreasing concentrations here potentially indicate an initial recovery from N saturation; however,
N critical loads are still exceeded in many areas in Europe (Waldner et al., 2015), a situation that is
likely to persist for several decades (Posch et al., 2015). This study was not focused specifically on
assessing changes in N status, and included plots that were strongly N limited, with
concentrations close to or below detection limit. As such, a more in-depth examination of N saturated
forests is necessary to evaluate their status.
Acknowledgements
We gratefully acknowledge the Programme Coordinating Centre of ICP Forests and all
observers, technicians and scientists who performed sampling in the field, analyses and data
handling. The evaluation was based on data in the UNECE ICP Forests PCC Collaborative
Database (see http://icp-forests.net). Data from the following countries (number of plots in
parentheses): France (13), Belgium (7), Germany (67), Italy (2), the United Kingdom (8),
Ireland (1), Denmark (4), Spain (1), Austria (2), Finland (8), Switzerland (7), Norway (8),
and Sweden (42) were part of the analyses. Throughfall and soil solution data in Sweden
were collected within the SWETHRO Network. Data from Switzerland were collected in the
Swiss Long-term Forest Ecosystem Research programme LWF. We acknowledge Jörg
Sintermann (WSL) for the development of a Shiny tool to visualize soil solution chemistry.
The Forest Soil Coordinating Centre (FSCC) of ICP Forests provided data from the first
Level II soil survey. The long-term collection of forest monitoring data was to a large extent
funded by national research institutions and ministries, with support from governmental
bodies, services and landowners. It was partially funded by the European Union under the
Regulation (EC) No. 2152/2003 concerning monitoring of forests and environmental
Acc
epte
d A
rtic
le
This article is protected by copyright. All rights reserved.
interactions in the Community (Forest Focus) and the project LIFE 07 ENV/D/000218
“Further Development and Implementation of an EU-level Forest Monitoring System
(FutMon)”.
References
Akselsson, C., Hultberg, H., Karlsson, P.E., Pihl Karlsson, G., Hellsten, S., 2013. Acidification trends
in south Swedish forest soils 1986-2008 — Slow recovery and high sensitivity to sea-salt episodes.
Science of The Total Environment 444, 271-287.
Alewell, C., Manderscheid, B., Gerstberger, P., Matzner, E., 2000a. Effects of reduced atmospheric
deposition on soil solution chemistry and elemental contents of spruce needles in NE-Bavaria,
Germany. Journal of Plant Nutrition and Soil Science-Zeitschrift fuer Pflanzenernaehrung und
Bodenkunde 163, 509-516.
Alewell, C., Manderscheid, B., Meesenburg, H., Bittersohl, J., 2000b. Is acidification still an
ecological threat? Nature 407, 856.
Battles, J.J., Fahey, T.J., Driscoll, C.T., Blum, J.D., Johnson, C.E., 2014. Restoring Soil Calcium
Reverses Forest Decline. Environmental Science & Technology Letters 1, 15-19.
Berger, T.W., Türtscher, S., Berger, P., Lindebner, L., 2016. A slight recovery of soils from Acid
Rain over the last three decades is not reflected in the macro nutrition of beech (Fagus sylvatica) at 97
forest stands of the Vienna Woods. Environmental Pollution 216, 624-635.
Billett, M.F., Deacon, C.M., Palmer, S.M., Dawson, J.J.C., Hope, D., 2006. Connecting organic
carbon in stream water and soils in a peatland catchment. J. Geophys.Res.: Biogeosci. 111, G02010.
Binkley, D., Fisher, R., 2012. Ecology and management of forest soils. John Wiley & Sons.
Borken, W., Ahrens, B., Schulz, C., Zimmermann, L., 2011. Site-to-site variability and temporal
trends of DOC concentrations and fluxes in temperate forest soils. Global Change Biol 17, 2428-

Acc
epte
d A
rtic
le
This article is protected by copyright. All rights reserved.
2443.
Bouwman, A.F., Van Vuuren, D.P., Derwent, R.G., Posch, M., 2002. A Global Analysis of
Acidification and Eutrophication of Terrestrial Ecosystems. Water, Air, and Soil Pollution 141, 349-
382.
Boxman, A.W., Peters, R., Roelofs, J.G.M., 2008. Long term changes in atmospheric N and S
throughfall deposition and effects on soil solution chemistry in a Scots pine forest in the Netherlands.
Environmental Pollution 156, 1252-1259.
Brooks, P.D., Mcknight, D.M., Bencala, K.E., 1999. The relationship between soil heterotrophic
activity, soil dissolved organic carbon (DOC) leachate, and catchment-scale DOC export in headwater
catchments. Water Resour. Res. 35,1895–1902.
Brumme, R., Meesenburg, H., Bredemeier, M., Jacobsen, C., Schönfelder, E., Meiwes, K.J.,
Eichhorn, J., 2009. Changes in Soil Solution Chemistry, Seepage Losses, and Input–Output Budgets
at Three Beech Forests in Response to Atmospheric Depositions. In: Brumme, R., Khanna, P.K.
(Eds.), Functioning and Management of European Beech Ecosystems. Springer Berlin Heidelberg,
Berlin, Heidelberg, pp. 303-336.
Camino-Serrano, M., Graf Pannatier, E., Vicca, S., Luyssaert, S., Jonard, M., Ciais, P., Guenet, B.,
Gielen, B., Penuelas, J., Sardans, J., Waldner, P., Etzold, S., Cecchini, G., Clarke, N., Galic, Z.,
Gandois, L., Hansen, K., Johnson, J., Klinck, U., Lachmanova, Z., Lindroos, A.J., Meesenburg, H.,
Nieminen, T.M., Sanders, T.G.M., Sawicka, K., Seidling, W., Thimonier, A., Vanguelova, E.,
Verstraeten, A., Vesterdal, L., Janssens, I.A., 2016. Trends in soil solution dissolved organic carbon
(DOC) concentrations across European forests. Biogeosciences 13, 5567-5585.
Casson, N.J., Eimers, M.C., Watmough, S.A., 2014. Controls on soil nitrification and stream nitrate
export at two forested catchments. Biogeochemistry 121, 355-368.
Ciais, P., Schelhaas, M.J., Zaehle, S., Piao, S.L., Cescatti, A., Liski, J., Luyssaert, S., Le-Maire, G.,
Schulze, E.D., Bouriaud, O., Freibauer, A., Valentini, R., Nabuurs, G.J., 2008. Carbon accumulation
in European forests. Nature Geosci 1, 425-429.

Acc
epte
d A
rtic
le
This article is protected by copyright. All rights reserved.
Clarke, N., Lindroos, A.-J., 2010. Concentrations and fluxes of DOC and DON at Level II sites in
Norway and Finland. John Derome, 27.
Clarke, N., Zlindra, D., Ulrich, E., Mosello, R., Derome, J., Derome, K., König, N., Lövblad, G.,
Draaijers, G., Hansen, K., Thimonier, A., Waldner, P., 2016. Part XIV. Sampling and analysis of
deposition. In, Manual on methods and criteria for harmonized sampling, assessment, monitoring and
analysis of the effects of air pollution on forests. Thünen Institute of Forest Ecosystems, Eberswalde,
Germany.
CLRTAP, 2017. Mapping critical loads for ecosystems, Chapter V of Manual on methodologies and
criteria for modelling and mapping critical loads and levels and air pollution effects, risks and trends.
UNECE Convention on Long-range Transboundary Air Pollution; accessed 01 May 2017 at
www.icpmapping.org.
Colette, A., Aas, W., Banin, L., Braban, C.F., Ferm, M., Gonzalez Ortiz, A., Ilyin, I., Mar, K.,
Pandolfi, M., Putaud, J.-P., 2016. Air pollution trends in the EMEP region between 1990 and 2012.
In. Norwegian Institute for Air Research.
Cools, N., De Vos, B., 2011. Availability and evaluation of European forest soil monitoring data in
the study on the effects of air pollution on forests. iForest - Biogeosciences and Forestry 4, 205-211.
Cronan, C.S., April, R., Bartlett, R.J., Bloom, P.R., Driscoll, C.T., Gherini, S.A., Henderson, G.S.,
Joslin, J.D., Kelly, J.M., Parnell, R.A., Patterson, H.H., Raynal, D.J., Schaedle, M., Schofield, C.L.,
Sucoff, E.I., Tepper, H.B., Thornton, F.C., 1989. Aluminum toxicity in forests exposed to acidic
deposition: The ALBIOS results. Water, Air, and Soil Pollution 48, 181-192.
De Vries, W., Klap, J.M., Erisman, J.W., 2000. Effects of environmental stress on forest crown
condition in Europe. Part I: Hypotheses and approach to the study. Water, Air, and Soil Pollution 119,
317-333.
De Vries, W., Vel, E., Reinds, G.J., Deelstra, H., Klap, J.M., Leeters, E.E.J.M., Hendriks, C.M.A.,
Kerkvoorden, M., Landmann, G., Herkendell, J., Haussmann, T., Erisman, J.W., 2003. Intensive
monitoring of forest ecosystems in Europe: 1. Objectives, set-up and evaluation strategy. Forest

Acc
epte
d A
rtic
le
This article is protected by copyright. All rights reserved.
Ecology and Management 174, 77-95.
de Wit, H.A., Mulder, J., Hindar, A., Hole, L., 2007. Long-term increase in dissolved organic carbon
in streamwaters in Norway is response to reduced acid deposition. Environ. Sci. Technol 41, 7706-
7713.
de Wit, H.A., Eldhuset, T.D., Mulder, J., 2010. Dissolved Al reduces Mg uptake in Norway spruce
forest: Results from a long-term field manipulation experiment in Norway. Forest Ecology and
Management 259, 2072-2082.
DeHayes, D.H., Schaberg, P.G., Hawley, G.J., Strimbeck, G.R., 1999. Acid Rain Impacts on Calcium
Nutrition and Forest Health: Alteration of membrane-associated calcium leads to membrane
destabilization and foliar injury in red spruce. BioScience 49, 789-800.
Dentener, F., Drevet, J., Lamarque, J.F., Bey, I., Eickhout, B., Fiore, A.M., Hauglustaine, D.,
Horowitz, L.W., Krol, M., Kulshrestha, U.C., Lawrence, M., Galy-Lacaux, C., Rast, S., Shindell, D.,
Stevenson, D., Van Noije, T., Atherton, C., Bell, N., Bergman, D., Butler, T., Cofala, J., Collins, B.,
Doherty, R., Ellingsen, K., Galloway, J., Gauss, M., Montanaro, V., Müller, J.F., Pitari, G.,
Rodriguez, J., Sanderson, M., Solmon, F., Strahan, S., Schultz, M., Sudo, K., Szopa, S., Wild, O.,
2006. Nitrogen and sulfur deposition on regional and global scales: A multimodel evaluation. Global
Biogeochemical Cycles 20, n/a-n/a.
Driscoll, C.T., Lawrence, G.B., Bulger, A.J., Butler, T.J., Cronan, C.S., Eagar, C., Lambert, K.F.,
Likens, G.E., Stoddard, J.L., Weathers, K.C., 2001. Acidic Deposition in the Northeastern United
States: Sources and Inputs, Ecosystem Effects, and Management Strategies: The effects of acidic
deposition in the northeastern United States include the acidification of soil and water, which stresses
terrestrial and aquatic biota. BioScience 51, 180-198.
Driscoll, C.T., Driscoll, K.M., Fakhraei, H., Civerolo, K., 2016. Long-term temporal trends and
spatial patterns in the acid-base chemistry of lakes in the Adirondack region of New York in response
to decreases in acidic deposition. Atmospheric Environment 146, 5-14.
EEA, 2016. Emissions of the main air pollutants in Europe. In. European Environment Agency,

Acc
epte
d A
rtic
le
This article is protected by copyright. All rights reserved.
Copenhagen.
Evans, C.D., Freeman, C., Cork, L.G., Thomas, D.N., Reynolds, B., Billett, M.F., Garnett,M.H.,
Norris, D., 2007. Evidence against recent climate-induced destabilization of soil carbon from 14C
analysis of riverine dissolved organic matter. Geophys.Res. Lett. 34, L07407.
Fakhraei, H., Driscoll, C.T., 2015. Proton and Aluminum Binding Properties of Organic Acids in
Surface Waters of the Northeastern U.S. Environmental Science & Technology 49, 2939-2947.
Fakhraei, H., Driscoll, C.T., Renfro, J.R., Kulp, M.A., Blett, T.F., Brewer, P.F., Schwartz, J.S., 2016.
Critical loads and exceedances for nitrogen and sulfur atmospheric deposition in Great Smoky
Mountains National Park, United States. Ecosphere 7(10):e01466.
Fölster, J., Bringmark, L., Lundin, L., 2003. Temporal and spatial variations in soilwater chemistry at
three acid forest sites. Water Air and Soil Pollution 146, 171-195.
Fuss, C.B., Driscoll, C.T., Campbell, J.L., 2015. Recovery from chronic and snowmelt acidification:
Long-term trends in stream and soil water chemistry at the Hubbard Brook Experimental Forest, New
Hampshire, USA. Journal of Geophysical Research: Biogeosciences 120, 2360-2374.
Futter, M.N., Valinia, S., Löfgren, S., Köhler, S.J., Fölster, J., 2014. Long-term trends in water
chemistry of acid-sensitive Swedish lakes show slow recovery from historic acidification. AMBIO 43,
77-90.
Garmo, Ø.A., Skjelkvåle, B.L., de Wit, H.A., Colombo, L., Curtis, C., Fölster, J., Hoffmann, A.,
Hruška, J., Høgåsen, T., Jeffries, D.S., Keller, W.B., Krám, P., Majer, V., Monteith, D.T., Paterson,
A.M., Rogora, M., Rzychon, D., Steingruber, S., Stoddard, J.L., Vuorenmaa, J., Worsztynowicz, A.,
2014. Trends in Surface Water Chemistry in Acidified Areas in Europe and North America from 1990
to 2008. Water, Air, & Soil Pollution 225, 1880.
Godbold, D.L., Fritz, H.-W., Jentschke, G., Meesenburg, H., Rademacher, P., 2003. Root turnover
and root necromass accumulation of Norway spruce (Picea abies) are affected by soil acidity. Tree
Physiology 23, 915-921.

Acc
epte
d A
rtic
le
This article is protected by copyright. All rights reserved.
Graf Pannatier, E., Thimonier, A., Schmitt, M., Walthert, L., Waldner, P., 2011. A decade of
monitoring at Swiss Long-Term Forest Ecosystem Research (LWF) sites: can we observe trends in
atmospheric acid deposition and in soil solution acidity? Environmental monitoring and assessment
174, 3-30.
Gundersen, P., Schmidt, I.K., Raulund-Rasmussen, K., 2006. Leaching of nitrate from temperate
forests effects of air pollution and forest management. Environmental reviews 14, 1-57.
Haaland, S., Hongve, D., Laudon, H., Riise, G., Vogt, R.D., 2010. Quantifying the Drivers of the
Increasing Colored Organic Matter in Boreal Surface Waters. Environmental Science & Technology
44, 2975-2980.
Hansen, K., Vesterdal, L., Bastrup-Birk, A., Bille-Hansen, J., 2007. Are Indicators for Critical Load
Exceedance Related to Forest Condition? Water Air and Soil Pollution 183, 293-308.
Houle, D., Ouimet, R., Couture, S., Gagnon, C., 2006. Base cation reservoirs in soil control the
buffering capacity of lakes in forested catchments. Canadian Journal of Fisheries and Aquatic
Sciences 63, 471-474.
Hruška, J., Krám, P., McDowell, W.H., Oulehle, F., 2009. Increased Dissolved Organic Carbon
(DOC) in Central European Streams is Driven by Reductions in Ionic Strength Rather than Climate
Change or Decreasing Acidity. Environmental Science & Technology 43, 4320-4326.
Iost, S., Rautio, P., Lindroos, A.J., 2012. Spatio-temporal Trends in Soil Solution Bc/Al and N in
Relation to Critical Limits in European Forest Soils. Water Air and Soil Pollution 223, 1467-1479.
James, A. L., Roulet, N. T., 2006. Investigating the applicability of end-member mixing analysis
(EMMA) across scale: A study of eight small, nested catchments in a temperate forested watershed,
Water Resources Research, 42, W08434
Johnson, J.A., Aherne, J., Cummins, T., 2013. Contrasting responses of two Sitka spruce forest plots
in Ireland to reductions in sulphur emissions: results of 20 years of monitoring. Biogeochemistry 116,
15-37.

Acc
epte
d A
rtic
le
This article is protected by copyright. All rights reserved.
Jonard, M., Fürst, A., Verstraeten, A., Thimonier, A., Timmermann, V., Potočić, N., Waldner, P.,
Benham, S., Hansen, K., Merilä, P., Ponette, Q., de la Cruz, A.C., Roskams, P., Nicolas, M., Croisé,
L., Ingerslev, M., Matteucci, G., Decinti, B., Bascietto, M., Rautio, P., 2015. Tree mineral nutrition is
deteriorating in Europe. Global Change Biol 21, 418-430.
Khanna, P., Prenzel, J., Meiwes, K., Ulrich, B., Matzner, E., 1987. Dynamics of sulfate retention by
acid forest soils in an acidic deposition environment. Soil Science Society of America Journal 51,
446-452.
Knorr, K.H., 2013. DOC-dynamics in a small headwater catchment as driven by redox fluctuations
and hydrological flow paths – are DOC exports mediated by iron reduction/oxidation cycles?
Biogeosciences 10, 891-904.
Kristensen, H.L., Gundersen, P., Callesen, I., Reinds, G.J., 2004. Throughfall Nitrogen Deposition
Has Different Impacts on Soil Solution Nitrate Concentration in European Coniferous and Deciduous
Forests. Ecosystems 7, 180-192.
König, N., Cools, N., Derome, K., Kowalska, A., De Vos, B., Fürst, A., Marchetto, A., O'Dea, P.,
Tartari, G.A., 2013. Chapter 22 - Data Quality in Laboratories: Methods and Results for Soil, Foliar,
and Water Chemical Analyses. In: Ferretti, M., Fischer, R. (Eds.), Developments in Environmental
Science. Elsevier, pp. 415-453.
Kvaalen, H., Solberg, S., Clarke, N., Torp, T., Aamlid, D., 2002. Time series study of concentrations
of SO42- and H+ in precipitation and soil waters in Norway. Environmental Pollution 117, 215-224.
Lange, H., Solberg, S., Clarke, N., 2006. Aluminum dynamics in forest soil waters in Norway.
Science of the total environment 367, 942-957.
Larssen, T., Duan, L., Mulder, J., 2011. Deposition and Leaching of Sulfur, Nitrogen and Calcium in
Four Forested Catchments in China: Implications for Acidification. Environmental Science &
Technology 45, 1192-1198.
Laudon, H., Berggren, M., Ågren, A., Buffam, I., Bishop, K., Grabs, T., Jansson, M., Köhler, S.,
2011. Patterns and Dynamics of Dissolved Organic Carbon (DOC) in Boreal Streams: The Role of

Acc
epte
d A
rtic
le
This article is protected by copyright. All rights reserved.
Processes, Connectivity, and Scaling. Ecosystems 14, 880-893.
Lawrence, G.B., Hazlett, P.W., Fernandez, I.J., Ouimet, R., Bailey, S.W., Shortle, W.C., Smith, K.T.,
Antidormi, M.R., 2015. Declining Acidic Deposition Begins Reversal of Forest-Soil Acidification in
the Northeastern U.S. and Eastern Canada. Environmental Science & Technology 49, 13103-13111.
Levene, H., 1960. Robust test for equality of variances. In: Olkin, I. (Ed.), Contributions to
Probability and Statistics: Essays in Honor of Harold Hotelling. Stanford University Press, Standford,
CA, pp. 278-292.
Liu, K.-H., Fang, Y.-T., Yu, F.-M., Liu, Q., Li, F.-R., Peng, S.-L., 2010. Soil Acidification in
Response to Acid Deposition in Three Subtropical Forests of Subtropical China. Pedosphere 20, 399-
408.
Liu, X., Duan, L., Mo, J., Du, E., Shen, J., Lu, X., Zhang, Y., Zhou, X., He, C., Zhang, F., 2011.
Nitrogen deposition and its ecological impact in China: An overview. Environmental Pollution 159,
2251-2264.
Liu, X., Zhang, Y., Han, W., Tang, A., Shen, J., Cui, Z., Vitousek, P., Erisman, J.W., Goulding, K.,
Christie, P., Fangmeier, A., Zhang, F., 2013. Enhanced nitrogen deposition over China. Nature 494,
459.
Lomský, B., Šrámek, V., Novotný, R., 2012. Changes in the air pollution load in the Jizera Mts.:
effects on the health status and mineral nutrition of the young Norway spruce stands. European
Journal of Forest Research 131, 757-771.
Lorenz, M., 2010. Objectives, Strategy and Implementation of ICP Forests. Manual. In, Manual on
methods and criteria for harmonized sampling, assessment, monitoring and analysis of the effects of
air pollution on forests. UNECE, ICP Forests, Hamburg, p. 22.
Löfgren, S., Zetterberg, T., 2011. Decreased DOC concentrations in soil water in forested areas in
southern Sweden during 1987-2008. The Science of the Total Environment 409, 1916-1926.
Löfgren, S., Aastrup, M., Bringmark, L., Hultberg, H., Lewin-Pihlblad, L., Lundin, L., Karlsson, G.P.,

Acc
epte
d A
rtic
le
This article is protected by copyright. All rights reserved.
Thunholm, B., 2011. Recovery of soil water, groundwater, and streamwater from acidification at the
Swedish Integrated Monitoring catchments. Ambio 40, 836-856.
Marchetto, A., Mosello, R., Tartari, G., Derome, J., Derome, K., König, N., Clarke, N., Kowalska, A.,
2009. Atmospheric Deposition and Soil Solution Working Ring Test 2009. In, Project FutMon.
C.N.R. Institute of Ecosystem Study, Verbania Pallanza.
Matschonat, G., Vogt, R., 1998. Significance of the total cation concentration in acid forest soils for
the solution composition and the saturation of exchange sites. Geoderma 84, 289-307.
Meesenburg, H., Ahrends, B., Fleck, S., Wagner, M., Fortmann, H., Scheler, B., Klinck, U.,
Dammann, I., Eichhorn, J., Mindrup, M., Meiwes, K.J., 2016. Long-term changes of ecosystem
services at Solling, Germany: Recovery from acidification, but increasing nitrogen saturation?
Ecological Indicators 65, 103-112.
Michalzik, B., Tipping, E., Mulder, J., Lancho, J.F.G., Matzner, E., Bryant, C.L., Clarke, N., Lofts, S.,
Esteban, M.A.V., 2003. Modelling the production and transport of dissolved organic carbon in forest
soils. Biogeochemistry 66, 241-264.
Mitchell, M.J., Likens, G.E., 2011. Watershed Sulfur Biogeochemistry: Shift from Atmospheric
Deposition Dominance to Climatic Regulation. Environmental Science & Technology 45, 5267-5271.
Monteith, D.T., Stoddard, J.L., Evans, C.D., de Wit, H.A., Forsius, M., Høgåsen, T., Wilander, A.,
Skjelkvåle, B.L., Jeffries, D.S., Vuorenmaa, J., 2007. Dissolved organic carbon trends resulting from
changes in atmospheric deposition chemistry. Nature 450, 537-540.
Nieminen, T., De Vos, B., Cools, N., Koenig, N., Fischer, R., Iost, S., Meesenburg, H., Nicholas,
M.P., Cecchini, G., Ferretti, M., de la Cruz, A.C., Derome, K., Lindroos, A.J., Graf Pannatier, E.,
2016. Part XI: Soil solution collection and analysis. In. Manual on methods and criteria for
harmonized sampling, assessment, monitoring and analysis of the effects of air pollution on forests.
Thünen Institute of Forest Ecosystems, Eberswalde, Germany, p. 29.
Oulehle, F., Hofmeister, J., Cudlín, P., Hruŝka, J., 2006. The effect of reduced atmospheric deposition
on soil and soil solution chemistry at a site subjected to long-term acidification, Načetín, Czech

Acc
epte
d A
rtic
le
This article is protected by copyright. All rights reserved.
Republic. Science of the Total Environment 370, 532-544.
Oulehle, F., Evans, C.D., Hofmeister, J., Krejci, R., Tahovska, K., Persson, T., Cudlin, P., Hruska, J.,
2011. Major changes in forest carbon and nitrogen cycling caused by declining sulphur deposition.
Global Change Biology 17(10), 3115-3129.
Pihl Karlsson, G., Akselsson, C., Hellsten, S., Karlsson, P.E., 2011. Reduced European emissions of S
and N–effects on air concentrations, deposition and soil water chemistry in Swedish forests.
Environmental Pollution 159, 3571-3582.
Posch, M., Duan, L., Reinds, G.J., Zhao, Y., 2015. Critical loads of nitrogen and sulphur to avert
acidification and eutrophication in Europe and China. Landscape Ecology 30, 487-499.
Prechtel, A., Alewell, C., Armbruster, M., Bittersohl, J., Cullen, J.M., Evans, C.D., Helliwell, R.,
Kopácek, J., Marchetto, A., Matzner, E., Meesenburg, H., Moldan, F., Moritz, K., Veselý, J., Wright,
R.F., 2001. Response of sulphur dynamics in European catchments to decreasing sulphate deposition.
Hydrol. Earth Syst. Sci. 5, 311-326.
Reinds, G.J., Posch, M., Leemans, R., 2009. Modelling recovery from soil acidification in European
forests under climate change. Science of the Total Environment 407, 5663-5673.
Reuss, J.O., Johnson, D.W., 1986. Acid deposition and the acidification of soils and waters. Springer
Science & Business Media, New York.
Sawicka, K., Monteith, D., Vanguelova, E., Wade, A.J., Clark, J.M., 2016. Fine-scale temporal
characterization of trends in soil water dissolved organic carbon and potential drivers. Ecological
Indicators 68, 36-51.
Shand, P., Haria, A.H., Neal, C., Griffiths, K., Gooddy, D., Dixon, A.J., Hill, T., Buckley, D.K.,
Cunningham, J., 2005. Hydrochemical heterogeneity in an upland catchment: further characterisation
of the spatial, temporal and depth variations in soils, streams and groundwaters of the Plynlimon
forested catchment, Wales. Hydrology and Earth System Sciences, 9 (6). 621-644.
Skjelkvåle, B.L., Borg, H., Hindar, A., Wilander, A., 2007. Large scale patterns of chemical recovery

Acc
epte
d A
rtic
le
This article is protected by copyright. All rights reserved.
in lakes in Norway and Sweden: Importance of seasalt episodes and changes in dissolved organic
carbon. Applied Geochemistry 22, 1174-1180.
Sokolova, T.A., Alekseeva, S.A., 2008. Adsorption of sulfate ions by soils (A Review). Eurasian Soil
Science 41, 140-148.
Stoddard, J., Jeffries, D., Lükewille, A., Clair, T., Dillon, P. J., Driscoll, C. T., Forsius, M.,
Johannessen, M., Kahl, J. S., Kellogg, J. H., Kemp, A., Mannio, J., Monteith, D. T., Murdoch, P. S.,
Patrick, S., Rebsdorf, A., Skjelkvåle, B. L., Stainton, M. P., Traaen, T., van Dam, H., Webster, K. E.,
Wieting J., Wilander A., 1999. Regional trends in aquatic recovery from acidification in North
America and Europe. Nature 401, 575-578.
Stoddard, J.L., 1994. Long-Term Changes in Watershed Retention of Nitrogen: Its Causes and
Aquatic Consequences. In. Environmental Chemistry of Lakes and Reservoirs. American Chemical
Society, 223-284.
Strock, K.E., Nelson, S.J., Kahl, J.S., Saros, J.E., McDowell, W.H., 2014. Decadal Trends Reveal
Recent Acceleration in the Rate of Recovery from Acidification in the Northeastern U.S.
Environmental Science & Technology 48, 4681-4689.
Sullivan, T.J., Lawrence, G.B., Bailey, S.W., McDonnell, T.C., Beier, C.M., Weathers, K.C.,
McPherson, G.T., Bishop, D.A., 2013. Effects of Acidic Deposition and Soil Acidification on Sugar
Maple Trees in the Adirondack Mountains, New York. Environmental Science & Technology 47,
12687-12694.
Sverdrup, H., Warfvinge, P., 1993. The effect of soil acidification on the growth of trees, grass and
herbs as expressed by the (Ca + Mg+ K)/Al ratio. In, Reports in ecology and environmental
engineering 2. Department of Chemical Engineering II, Lund University, Sweden, p. 178.
Ukonmaanaho, L., Starr, M., Lindroos, A.-J., Nieminen, T.M., 2014. Long-term changes in acidity
and DOC in throughfall and soil water in Finnish forests. Environmental Monitoring and Assessment
186, 7733-7752.
Ulrich, B., 1983. Soil acidity and its relations to acid deposition. In: Ulrich, B., J, P. (Eds.), Effects of

Acc
epte
d A
rtic
le
This article is protected by copyright. All rights reserved.
accumulation of air pollutants in forest ecosystems. D. Reidel Publishing Company, Dordrecht, pp.
127-146.
van der Heijden, G., Legout, A., Nicolas, M., Ulrich, E., Johnson, D.W., Dambrine, E., 2011. Long-
term sustainability of forest ecosystems on sandstone in the Vosges Mountains (France) facing
atmospheric deposition and silvicultural change. Forest Ecology and Management 261, 730-740.
Vanguelova, E.I., Hirano, Y., Eldhuset, T.D., Sas-Paszt, L., Bakker, M.R., Püttsepp, Ü., Brunner, I.,
Lõhmus, K., Godbold, D., 2007a. Tree fine root Ca/Al molar ratio – Indicator of Al and acidity stress.
Plant Biosystems - An International Journal Dealing with all Aspects of Plant Biology 141, 460-480.
Vanguelova, E.I., Nortcliff, S., Moffat, A.J., Kennedy, F., 2007b. Short-term effects of manipulated
increase in acid deposition on soil, soil solution chemistry and fine roots in Scots pine (Pinus
sylvestris) stand on a podzol. Plant and Soil 294, 41-54.
Vanguelova, E.I., Benham, S., Pitman, R., Moffat, A.J., Broadmeadow, M., Nisbet, T., Durrant, D.,
Barsoum, N., Wilkinson, M., Bochereau, F., Hutchings, T., Broadmeadow, S., Crow, P., Taylor, P.,
Houston, T.D., 2010. Chemical fluxes in time through forest ecosystems in the UK - Soil response to
pollution recovery. Environmental Pollution 158, 1857-1869.
Verstraeten, A., Neirynck, J., Genouw, G., Cools, N., Roskams, P., Hens, M., 2012. Impact of
declining atmospheric deposition on forest soil solution chemistry in Flanders, Belgium. Atmospheric
Environment 62, 50-63.
Verstraeten, A., De Vos, B., Neirynck, J., Roskams, P., Hens, M., 2014. Impact of air-borne or
canopy-derived dissolved organic carbon (DOC) on forest soil solution DOC in Flanders, Belgium.
Atmospheric environment 83, 155-165.
Waldner, P., Marchetto, A., Thimonier, A., Schmitt, M., Rogora, M., Granke, O., Mues, V., Hansen,
K., Pihl Karlsson, G., Žlindra, D., Clarke, N., Verstraeten, A., Lazdins, A., Schimming, C., Iacoban,
C., Lindroos, A.-J., Vanguelova, E., Benham, S., Meesenburg, H., Nicolas, M., Kowalska, A.,
Apuhtin, V., Napa, U., Lachmanová, Z., Kristoefel, F., Bleeker, A., Ingerslev, M., Vesterdal, L.,
Molina, J., Fischer, U., Seidling, W., Jonard, M., O'Dea, P., Johnson, J., Fischer, R., Lorenz, M.,

Acc
epte
d A
rtic
le
This article is protected by copyright. All rights reserved.
2014. Detection of temporal trends in atmospheric deposition of inorganic nitrogen and sulphate to
forests in Europe. Atmospheric Environment 95, 363-374.
Waldner, P., Thimonier, A., Graf Pannatier, E., Etzold, S., Schmitt, M., Marchetto, A., Rautio, P.,
Derome, K., Nieminen, T.M., Nevalainen, S., Lindroos, A.-J., Merilä, P., Kindermann, G., Neumann,
M., Cools, N., de Vos, B., Roskams, P., Verstraeten, A., Hansen, K., Pihl Karlsson, G., Dietrich, H.-
P., Raspe, S., Fischer, R., Lorenz, M., Iost, S., Granke, O., Sanders, T.G.M., Michel, A., Nagel, H.-D.,
Scheuschner, T., Simončič, P., von Wilpert, K., Meesenburg, H., Fleck, S., Benham, S., Vanguelova,
E., Clarke, N., Ingerslev, M., Vesterdal, L., Gundersen, P., Stupak, I., Jonard, M., Potočić, N.,
Minaya, M., 2015. Exceedance of critical loads and of critical limits impacts tree nutrition across
Europe. Annals of Forest Science 72, 929-939.
Warby, R.A.F., Johnson, C.E., Driscoll, C.T., 2005. Chemical Recovery of Surface Waters Across the
Northeastern United States from Reduced Inputs of Acidic Deposition: 1984−2001. Environmental
Science & Technology 39, 6548-6554.
Watmough, S.A., Aherne, J., Alewell, C., Arp, P., Bailey, S., Clair, T., Dillon, P., Duchesne, L.,
Eimers, C., Fernandez, I., Foster, N., Larssen, T., Miller, E., Mitchell, M., Page, S., 2005. Sulphate,
Nitrogen and Base Cation Budgets at 21 Forested Catchments in Canada, the United States and
Europe. Environmental Monitoring and Assessment 109, 1-36.
Watmough, S.A., Eimers, C., Baker, S., 2016. Impediments to recovery from acid deposition.
Atmospheric Environment 146, 15-27.
Wellbrock, N., & Bolte, A. Flessa, H., (Eds.) 2016. Dynamics and Spatial Patterns of Forest Sites in
Germany: Results of Soil Forest Surveys 2006 to 2008. Thünen Reports 43, Thünen Institute,
Germany
Winterdahl, M., Futter, M., Köhler, S., Laudon, H., Seibert, J., Bishop, K.C.W., 2011.Riparian soil
temperature modification of the relationship between flow and dissolved organic carbon concentration
in a boreal stream. Water Resour. Res.47,
Worrall, F., Burt, T.P., 2009. Changes in DOC treatability: Indications of compositional changes in

Acc
epte
d A
rtic
le
This article is protected by copyright. All rights reserved.
DOC trends. Journal of Hydrology 366, 1-8.
Wu, Y., Clarke, N., Mulder, J., 2010. Dissolved organic carbon concentrations in throughfall and soil
waters at Level II monitoring plots in Norway: short-and long-term variations. Water, air, and soil
pollution 205, 273-288.
Zhu, Q., De Vries, W., Liu, X., Zeng, M., Hao, T., Du, E., Zhang, F., Shen, J., 2016. The contribution
of atmospheric deposition and forest harvesting to forest soil acidification in China since 1980.
Atmospheric Environment 146, 215-222.

Acc
epte
d A
rtic
le
This article is protected by copyright. All rights reserved.
Tables
Table 1 Soil and base saturation (BSat) summary statistics of soil survey (1990-2000).
Layer Variable Min. Median Mean Max. n no data
10-20 cm 2.7 3.9 4.0 7.2 100 4
BSat (%) 2 11 23 100 98 6
40-80 cm 3.3 4.4 4.6 7.6 145 17
BSat (%) 2 20 34 100 136 26

Acc
epte
d A
rtic
le
This article is protected by copyright. All rights reserved.
Table 2 Environmental factors included as stratifying factors in the linear mixed-effects model. The
model tested if soil solution trends were different between factor levels.
Factor Soil depth Levels
Region
West, Central, North
Forest type
Deciduous, Coniferous
Soil Chemistry
pH (CaCl2) 10-20 cm ≤4.0, >4.0
40-80 cm ≤4.5, >4.5
BSat (%) 10-20 cm ≤10, >10
40-80 cm ≤20, >20
Throughfall trend
Relative change for a
ten-year period %
Absolute change for
ten years ( )
SO42− <,≥ −60 <,≥ −40
Bc <,≥ −11 <,≥ −10
N inorg <,≥ −22 <,≥ −13
<,≥ −46

Acc
epte
d A
rtic
le
This article is protected by copyright. All rights reserved.
Table 3 Summary statistics (5th, median, 95th percentile) of the intercept of the linear model
applied to individual plots. The intercept represents the value in the year 2000. Bc:Altot is the
molar ratio of nutrient base cations + ) to total Al.
10-20 cm 40-80 cm
5th Median 95th 5th Median 95th
pH 3.7 4.6 7.0 4.1 4.8 7.7
10 96 720 11 74 2039
12 59 245 9 61 464
2 12 73 2 11 69
20 84 373 22 123 631
14 94 541 13 106 702
2 16 441 1 7.2 583
41 131 464 37 212 739
ANC
−531 −47 489 −569 −26 2414
0.03 1.00 4.2 0.02 0.8 5.7
DOC
1.4 12 42 1.2 5.8 29
Bc:Altot 0.2 1.4 105 0.2 1.5 785

Acc
epte
d A
rtic
le
This article is protected by copyright. All rights reserved.
Table 4 Temporal trends in soil solution at the European scale. The change in concentration for a ten-year period is shown relative to the year 2000
and as absolute value. Bc:Altot trends are shown for soils with soil <5.0. Bc = , AA =
. Note: trends
in Bc, AA or ANC differ from the sum of individual ions as not all-time series had complete ions for all months and years.
10-20 cm 40-80 cm
Ten year change Ten year change
Variable Unit Significance Relative to 2000 (%)
Absolute Significance Relative to 2000 (%)
Absolute
ns +1.0 +0.05 ns +1.2 +0.07
*** −55 −57 *** −58 −68
** −35 −24 * −28 −18
** −57 −7.1 ** −32 −3.5
ns −9 −8.4 ns −6 −7.5
** −52 −61 *** −40 −69
ns −14 −2.3 (*) −30 −4.2
ns −9 −8.8 ns −5 −6.1
Bc+ *** −31 −110 * −30 −143
AA *** −34 −110 *** −28 −116
ANC ns −5 −19 ns −19 −36
** −19 −0.13 * −17 −0.08
DOC ns −4 −0.44 * −17 −1.14
Bc:Altot (soil <5.0) ns −18 −0.30 ns −11 −0.23
*** p<0.001, **p<0.01, *p<0.05, (*) p<0.1, ns = not significant
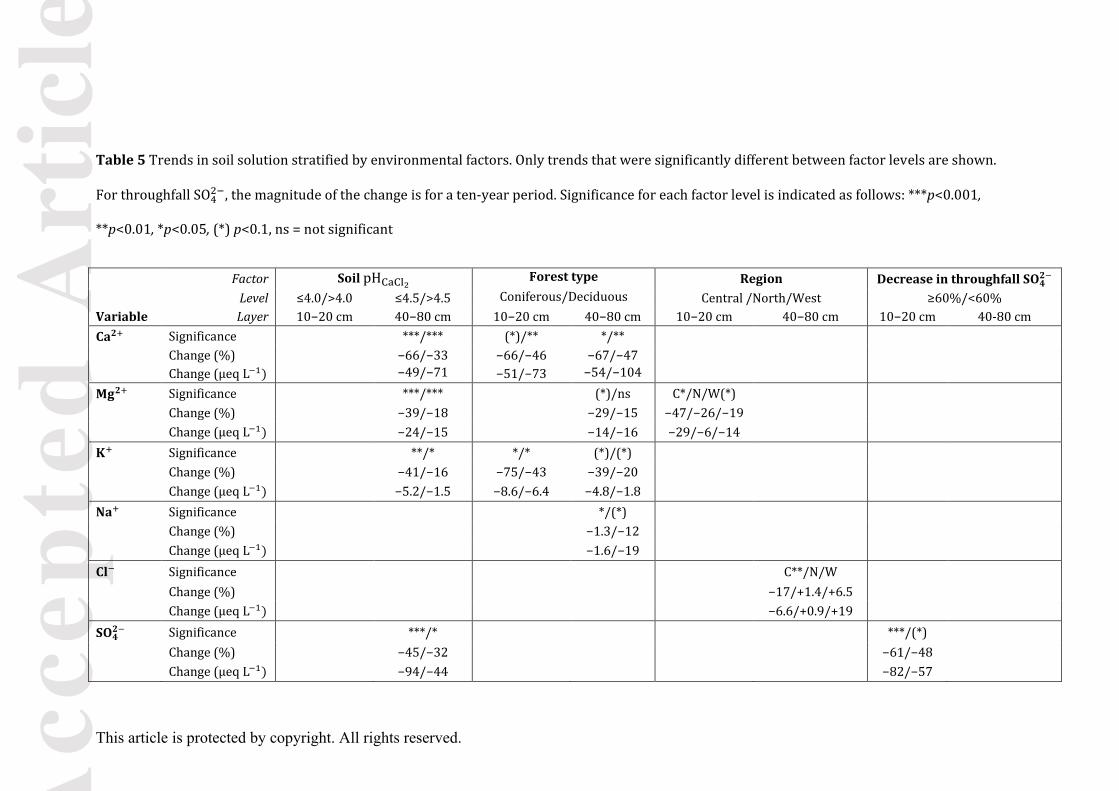
Acc
epte
d A
rtic
le
This article is protected by copyright. All rights reserved.
Table 5 Trends in soil solution stratified by environmental factors. Only trends that were significantly different between factor levels are shown.
For throughfall , the magnitude of the change is for a ten-year period. Significance for each factor level is indicated as follows: ***p<0.001,
**p<0.01, *p<0.05, (*) p<0.1, ns = not significant
Factor Soil Forest type Region Decrease in throughfall
Level ≤4.0/>4.0 ≤4.5/>4.5 Coniferous/Deciduous Central /North/West ≥60%/<60%
Variable Layer 10−20 cm 40−80 cm 10−20 cm 40−80 cm 10−20 cm 40−80 cm 10−20 cm 40-80 cm
Significance ***/*** (*)/** */**
Change (%) −66/−33 −66/−46 −67/−47
Change ( −49/−71
−51/−73 −54/−104
Significance ***/*** (*)/ns C*/N/W(*)
Change (%) −39/−18 −29/−15 −47/−26/−19
Change ( −24/−15 −14/−16 −29/−6/−14
Significance **/* */* (*)/(*)
Change (%) −41/−16 −75/−43 −39/−20
Change ( −5.2/−1.5 −8.6/−6.4 −4.8/−1.8
Significance */(*)
Change (%) −1.3/−12
Change ( −1.6/−19
Significance C**/N/W
Change (%) −17/+1.4/+6.5
Change ( −6.6/+0.9/+19
Significance ***/* ***/(*)
Change (%) −45/−32 −61/−48
Change ( −94/−44 −82/−57

Acc
epte
d A
rtic
le
This article is protected by copyright. All rights reserved.
Significance */*
Change (%) −50/−1.6
Change ( −6.1/−0.2
Significance ***/*** **/ns C**/N(*)/W*
ns/(*)
Change (%) −34/−2 −29/−3 −43/+0.3/−20
−28/−12
Change ( −0.4/−0.003 −0.28/−0.01 −0.15/+0.001/
−0.07 −0.22/−0.04
pH Significance
Change (%)
Change (pH unit)
DOC Significance C**/N/W**
Change (%) −4.8/−15/−27
Change ( −0.2/−0.8/−2.9
Bc Significance ***/*** (*)/**
Change (%) −53/−27 −45/−32
Change ( −92/−106 −80/−133
AA Significance ***/*
Change (%) −32/−19
Change ( −149/−67
Bc:Altot Significance
Change (%)
Change (absolute)
ANC Significance ns/** **/(*)
ns/*
Change (%) +23/−16 +40/−29 +179/−29
Change ( +40/−118 +14/−165 +10/−119

Acc
epte
d A
rtic
le
This article is protected by copyright. All rights reserved.
Figure Captions
Fig. 1 Location of the Level II ICP Forests plots included in the study, left plots at 10-20 cm soil
depth and right at 40-80 cm soil depth.
Fig. 2 Median concentrations at 10-20 cm for selected variables with the trend from the linear model
superimposed. The model was run for the period 1995-2012, but to be consistent, the period displayed
is for years that had at least 75 plots. Significance is indicated as: ***p<0.001, **p<0.01, *p<0.05, (*)
p<0.1. Boxplot whiskers represent 0.75 times the interquartile range.
Fig. 3 Median concentrations at 40-80 cm for selected variables with the trend from the linear model
superimposed. The model was run for the period 1995-2012, but to be consistent, the period displayed
is for years that had at least 120 plots. Significance is indicated as: ***p<0.001, **p<0.01, *p<0.05,
(*) p<0.1. Boxplot whiskers represent 0.75 times the interquartile range

Acc
epte
d A
rtic
le
This article is protected by copyright. All rights reserved.
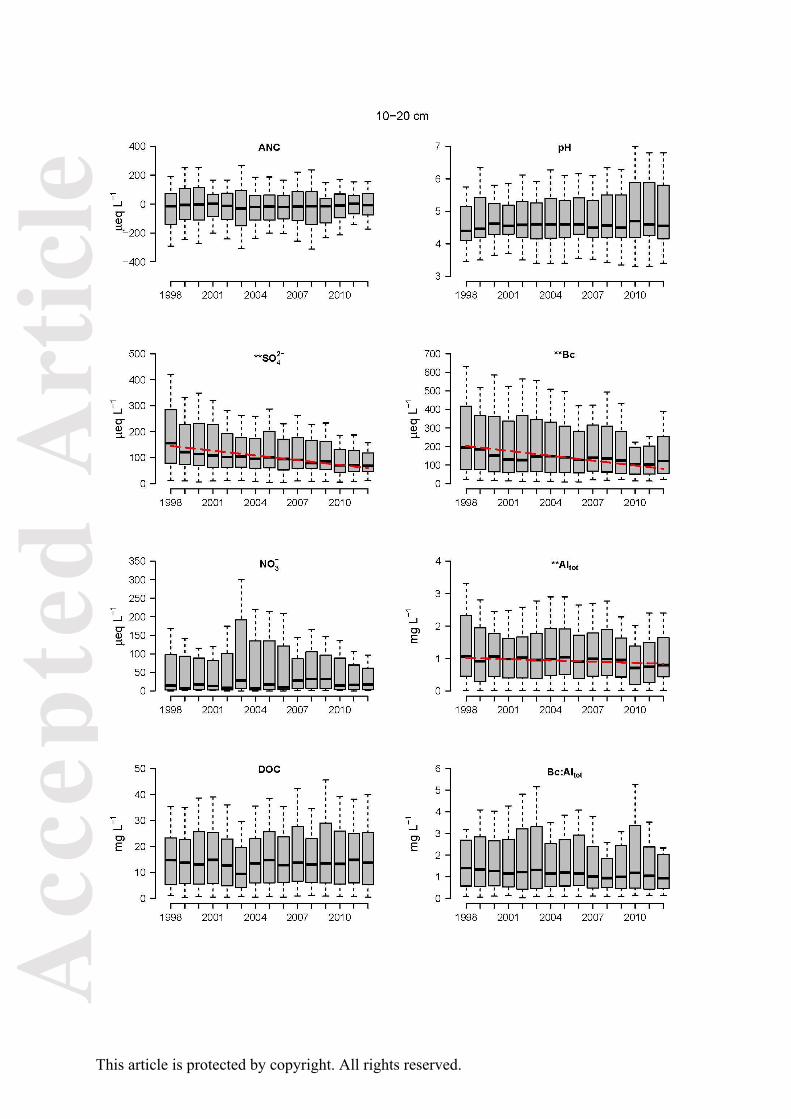
Acc
epte
d A
rtic
le
This article is protected by copyright. All rights reserved.

Acc
epte
d A
rtic
le
This article is protected by copyright. All rights reserved.
Top Related
Copyright © 2022 FDOKUMEN

