


Bahasa
Halaman
Hukum

Australian Orthodontic Journal Volume 30 No. 2 November 2014132 © Australian Society of Orthodontists Inc. 2014
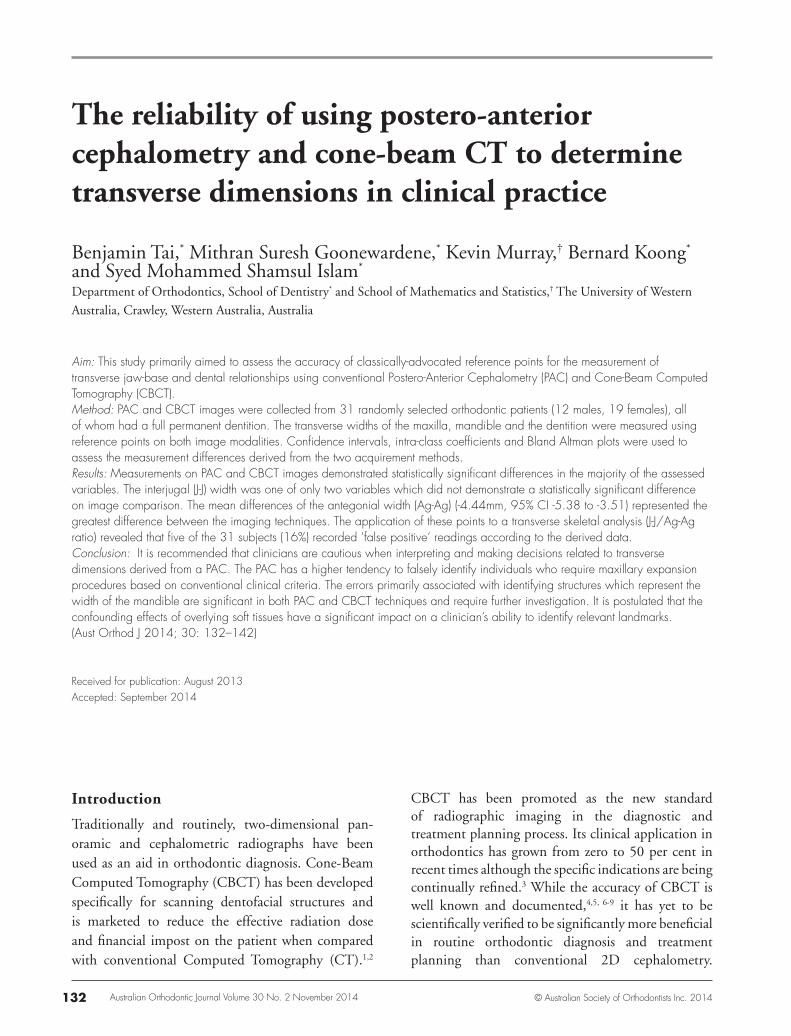
Aim: This study primarily aimed to assess the accuracy of classically-advocated reference points for the measurement of transverse jaw-base and dental relationships using conventional Postero-Anterior Cephalometry (PAC) and Cone-Beam Computed Tomography (CBCT).Method: PAC and CBCT images were collected from 31 randomly selected orthodontic patients (12 males, 19 females), all of whom had a full permanent dentition. The transverse widths of the maxilla, mandible and the dentition were measured using reference points on both image modalities. Confidence intervals, intra-class coefficients and Bland Altman plots were used to assess the measurement differences derived from the two acquirement methods. Results: Measurements on PAC and CBCT images demonstrated statistically significant differences in the majority of the assessed variables. The interjugal (J-J) width was one of only two variables which did not demonstrate a statistically significant difference on image comparison. The mean differences of the antegonial width (Ag-Ag) (-4.44mm, 95% CI -5.38 to -3.51) represented the greatest difference between the imaging techniques. The application of these points to a transverse skeletal analysis (J-J/Ag-Ag ratio) revealed that five of the 31 subjects (16%) recorded ‘false positive’ readings according to the derived data. Conclusion: It is recommended that clinicians are cautious when interpreting and making decisions related to transverse dimensions derived from a PAC. The PAC has a higher tendency to falsely identify individuals who require maxillary expansion procedures based on conventional clinical criteria. The errors primarily associated with identifying structures which represent the width of the mandible are significant in both PAC and CBCT techniques and require further investigation. It is postulated that the confounding effects of overlying soft tissues have a significant impact on a clinician’s ability to identify relevant landmarks.(Aust Orthod J 2014; 30: 132–142)
Received for publication: August 2013Accepted: September 2014
The reliability of using postero-anterior cephalometry and cone-beam CT to determine transverse dimensions in clinical practice
Benjamin Tai,* Mithran Suresh Goonewardene,* Kevin Murray,† Bernard Koong* and Syed Mohammed Shamsul Islam*
Department of Orthodontics, School of Dentistry* and School of Mathematics and Statistics,† The University of Western Australia, Crawley, Western Australia, Australia
Introduction
Traditionally and routinely, two-dimensional pan-oramic and cephalometric radiographs have been used as an aid in orthodontic diagnosis. Cone-Beam Computed Tomography (CBCT) has been developed specifically for scanning dentofacial structures and is marketed to reduce the effective radiation dose and financial impost on the patient when compared with conventional Computed Tomography (CT).1,2
CBCT has been promoted as the new standard of radiographic imaging in the diagnostic and treatment planning process. Its clinical application in orthodontics has grown from zero to 50 per cent in recent times although the specific indications are being continually refined.3 While the accuracy of CBCT is well known and documented,4,5, 6-9 it has yet to be scientifically verified to be significantly more beneficial in routine orthodontic diagnosis and treatment planning than conventional 2D cephalometry.
Australian Orthodontic Journal Volume 30 No. 2 November 2014 133
THE RELIABILITY OF USING POSTERO-ANTERIOR CEPHALOMETRY AND CONE-BEAM CT
It is uncommon for Postero-Anterior Cephalometry (PAC) to be routinely employed during orthodontic diagnosis and treatment planning.10 This may be attributed to the limitations and difficulties in accurate interpretation and analysis of these films, which may include traditional errors in identification and measurement of landmarks and errors in magnification.2 Many of the errors are related to the nature of PAC, as structures in the field of view are positioned at various distances from the film which produces a magnifying effect. Moreover, landmark identification is complicated by the superimposition of distant structures over areas of interest.
The application of PAC has predominantly focussed on the diagnosis of morphological variation in the transverse and vertical dimensions, particularly in patients with significant facial asymmetry. Analysed information, specifically the ratio of the relative widths of the maxilla and mandible, may directly influence treatment planning decisions.11,12 An assessment of the transverse dimensions of the maxilla derived from PAC has traditionally been used as a guide to determine the need for maxillary expansion procedures. However, the level of emphasis that the clinician should place on this information has not been validated. Recently, the validity of assessment of a transverse intermaxillary analysis has been reported on dry skulls and identified potential errors when using PAC compared with CBCT.13 However, this reported study did not account for confounding factors associated with superimposed soft tissue structures when utilised in a clinical scenario.
The present study aims to determine the reliability and accuracy of landmark identification using conventional PAC compared with CBCT in a group of patients who sought orthodontic treatment. Secondly, dental structures which have been routinely used to assess maxillary width were identified and measured to determine whether morphological variations of the underlying skeletal base could be explained. Finally, the accuracy of classically-advocated reference points for the measurement of transverse jaw-base and dental relationships were assessed to determine their impact in the subsequent recommendations related to the need for skeletal maxillary expansion.
Materials and method
The sample included 31 orthodontic patients (12 males, 19 females) aged between 12-18 years who were
randomly selected from a private orthodontic practice. All patients had a full complement of permanent teeth and each had a CBCT and a traditional PAC as part of their diagnostic records. The PAC data was acquired with the patient oriented in natural head position and radiographs deviating from this orientation were excluded. The CBCT data was collected using the Sirona Galileos Cone Beam Imaging System at a 15-inch field of view, 85 kVp, and 7 mA.
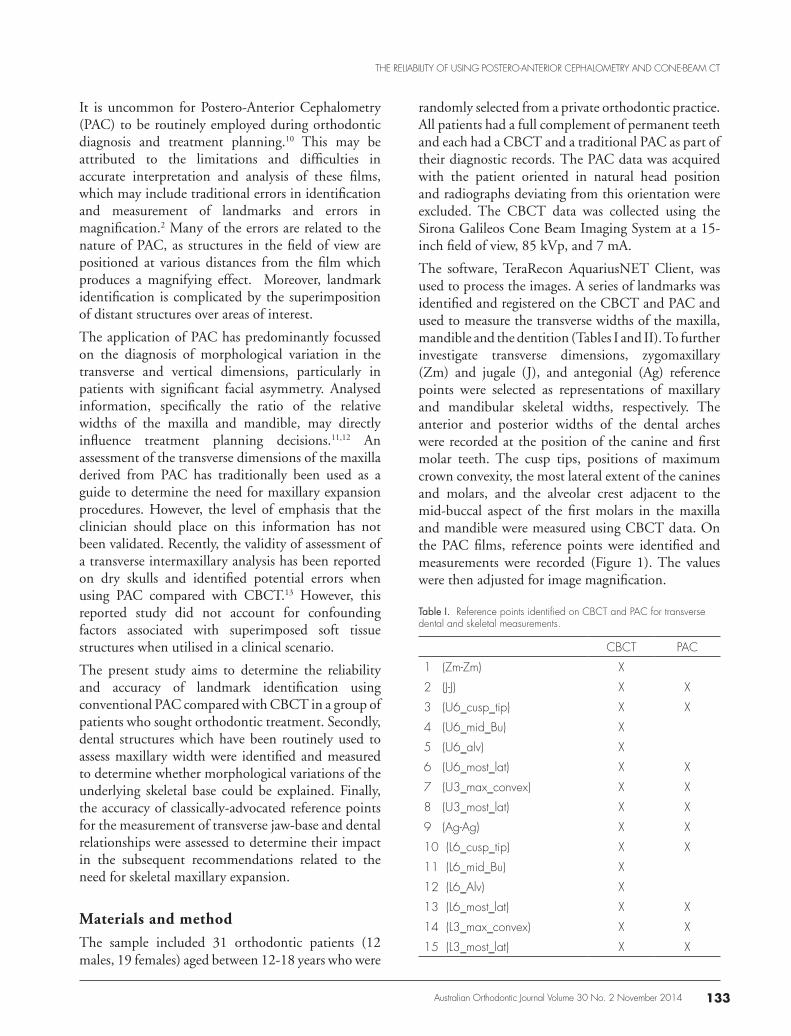
The software, TeraRecon AquariusNET Client, was used to process the images. A series of landmarks was identified and registered on the CBCT and PAC and used to measure the transverse widths of the maxilla, mandible and the dentition (Tables I and II). To further investigate transverse dimensions, zygomaxillary (Zm) and jugale (J), and antegonial (Ag) reference points were selected as representations of maxillary and mandibular skeletal widths, respectively. The anterior and posterior widths of the dental arches were recorded at the position of the canine and first molar teeth. The cusp tips, positions of maximum crown convexity, the most lateral extent of the canines and molars, and the alveolar crest adjacent to the mid-buccal aspect of the first molars in the maxilla and mandible were measured using CBCT data. On the PAC films, reference points were identified and measurements were recorded (Figure 1). The values were then adjusted for image magnification.
CBCT PAC
1 (Zm-Zm) X
2 (J-J) X X
3 (U6_cusp_tip) X X
4 (U6_mid_Bu) X
5 (U6_alv) X
6 (U6_most_lat) X X
7 (U3_max_convex) X X
8 (U3_most_lat) X X
9 (Ag-Ag) X X
10 (L6_cusp_tip) X X
11 (L6_mid_Bu) X
12 (L6_Alv) X
13 (L6_most_lat) X X
14 (L3_max_convex) X X
15 (L3_most_lat) X X
Table I. Reference points identified on CBCT and PAC for transverse dental and skeletal measurements.
Australian Orthodontic Journal Volume 30 No. 2 November 2014134
TAI ET AL
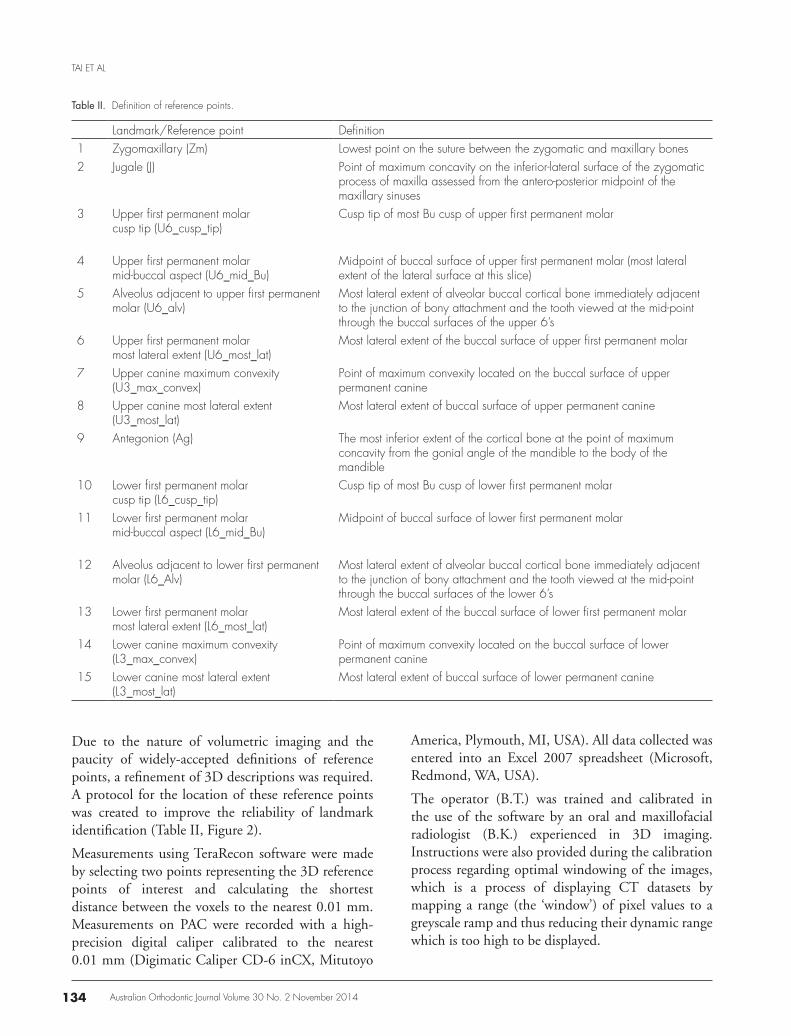
Landmark/Reference point Definition1 Zygomaxillary (Zm) Lowest point on the suture between the zygomatic and maxillary bones2 Jugale (J) Point of maximum concavity on the inferior-lateral surface of the zygomatic
process of maxilla assessed from the antero-posterior midpoint of the maxillary sinuses
3 Upper first permanent molarcusp tip (U6_cusp_tip)
Cusp tip of most Bu cusp of upper first permanent molar
4 Upper first permanent molar mid-buccal aspect (U6_mid_Bu)
Midpoint of buccal surface of upper first permanent molar (most lateral extent of the lateral surface at this slice)
5 Alveolus adjacent to upper first permanent molar (U6_alv)
Most lateral extent of alveolar buccal cortical bone immediately adjacent to the junction of bony attachment and the tooth viewed at the mid-point through the buccal surfaces of the upper 6’s
6 Upper first permanent molar most lateral extent (U6_most_lat)
Most lateral extent of the buccal surface of upper first permanent molar
7 Upper canine maximum convexity(U3_max_convex)
Point of maximum convexity located on the buccal surface of upper permanent canine
8 Upper canine most lateral extent(U3_most_lat)
Most lateral extent of buccal surface of upper permanent canine
9 Antegonion (Ag) The most inferior extent of the cortical bone at the point of maximum concavity from the gonial angle of the mandible to the body of the mandible
10 Lower first permanent molarcusp tip (L6_cusp_tip)
Cusp tip of most Bu cusp of lower first permanent molar
11 Lower first permanent molar mid-buccal aspect (L6_mid_Bu)
Midpoint of buccal surface of lower first permanent molar
12 Alveolus adjacent to lower first permanent molar (L6_Alv)
Most lateral extent of alveolar buccal cortical bone immediately adjacent to the junction of bony attachment and the tooth viewed at the mid-point through the buccal surfaces of the lower 6’s
13 Lower first permanent molar most lateral extent (L6_most_lat)
Most lateral extent of the buccal surface of lower first permanent molar
14 Lower canine maximum convexity (L3_max_convex)
Point of maximum convexity located on the buccal surface of lower permanent canine
15 Lower canine most lateral extent(L3_most_lat)
Most lateral extent of buccal surface of lower permanent canine
Table II. Definition of reference points.
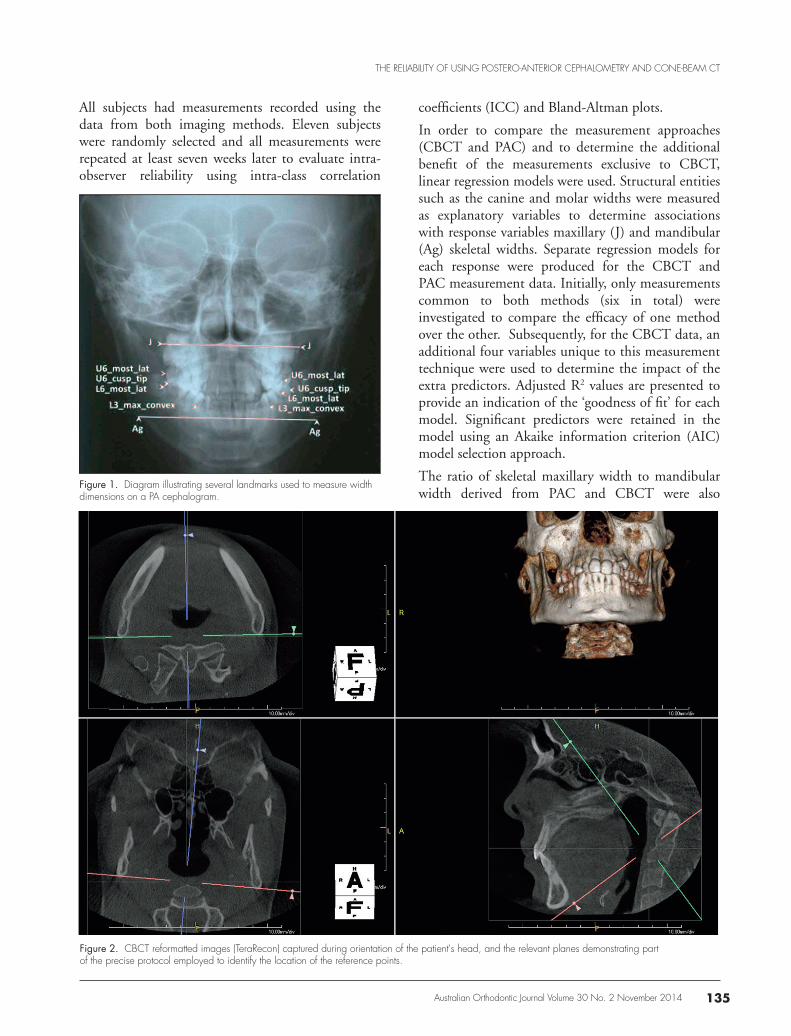
Due to the nature of volumetric imaging and the paucity of widely-accepted definitions of reference points, a refinement of 3D descriptions was required. A protocol for the location of these reference points was created to improve the reliability of landmark identification (Table II, Figure 2).
Measurements using TeraRecon software were made by selecting two points representing the 3D reference points of interest and calculating the shortest distance between the voxels to the nearest 0.01 mm. Measurements on PAC were recorded with a high-precision digital caliper calibrated to the nearest 0.01 mm (Digimatic Caliper CD-6 inCX, Mitutoyo
America, Plymouth, MI, USA). All data collected was entered into an Excel 2007 spreadsheet (Microsoft, Redmond, WA, USA).
The operator (B.T.) was trained and calibrated in the use of the software by an oral and maxillofacial radiologist (B.K.) experienced in 3D imaging. Instructions were also provided during the calibration process regarding optimal windowing of the images, which is a process of displaying CT datasets by mapping a range (the ‘window’) of pixel values to a greyscale ramp and thus reducing their dynamic range which is too high to be displayed.
Australian Orthodontic Journal Volume 30 No. 2 November 2014 135
THE RELIABILITY OF USING POSTERO-ANTERIOR CEPHALOMETRY AND CONE-BEAM CT
Figure 1. Diagram illustrating several landmarks used to measure width dimensions on a PA cephalogram.
Figure 2. CBCT reformatted images (TeraRecon) captured during orientation of the patient's head, and the relevant planes demonstrating part of the precise protocol employed to identify the location of the reference points.
coefficients (ICC) and Bland-Altman plots.
In order to compare the measurement approaches (CBCT and PAC) and to determine the additional benefit of the measurements exclusive to CBCT, linear regression models were used. Structural entities such as the canine and molar widths were measured as explanatory variables to determine associations with response variables maxillary (J) and mandibular (Ag) skeletal widths. Separate regression models for each response were produced for the CBCT and PAC measurement data. Initially, only measurements common to both methods (six in total) were investigated to compare the efficacy of one method over the other. Subsequently, for the CBCT data, an additional four variables unique to this measurement technique were used to determine the impact of the extra predictors. Adjusted R2 values are presented to provide an indication of the ‘goodness of fit’ for each model. Significant predictors were retained in the model using an Akaike information criterion (AIC) model selection approach.
The ratio of skeletal maxillary width to mandibular width derived from PAC and CBCT were also
All subjects had measurements recorded using the data from both imaging methods. Eleven subjects were randomly selected and all measurements were repeated at least seven weeks later to evaluate intra-observer reliability using intra-class correlation
Australian Orthodontic Journal Volume 30 No. 2 November 2014136
TAI ET AL
compared to explore possible relationships utilising correlation and linear regression. Moreover, the accuracy of using intermolar and alveolar distances to derive the width ratio was investigated using the CBCT data.
Results
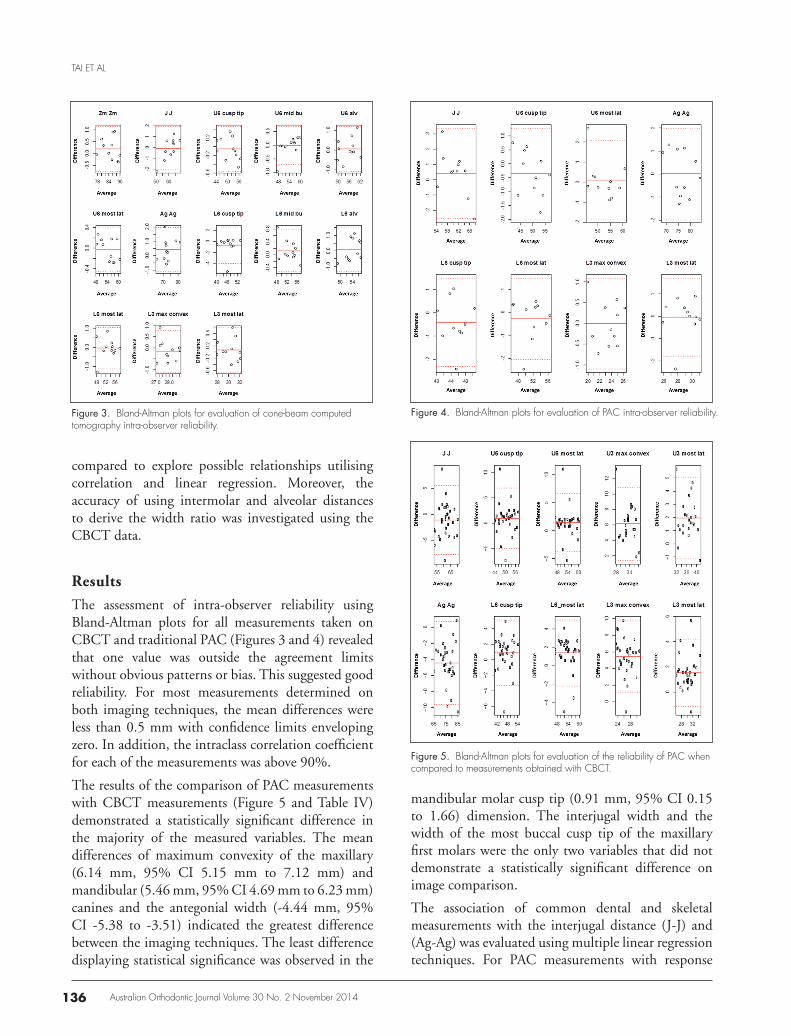
The assessment of intra-observer reliability using Bland-Altman plots for all measurements taken on CBCT and traditional PAC (Figures 3 and 4) revealed that one value was outside the agreement limits without obvious patterns or bias. This suggested good reliability. For most measurements determined on both imaging techniques, the mean differences were less than 0.5 mm with confidence limits enveloping zero. In addition, the intraclass correlation coefficient for each of the measurements was above 90%.
The results of the comparison of PAC measurements with CBCT measurements (Figure 5 and Table IV) demonstrated a statistically significant difference in the majority of the measured variables. The mean differences of maximum convexity of the maxillary (6.14 mm, 95% CI 5.15 mm to 7.12 mm) and mandibular (5.46 mm, 95% CI 4.69 mm to 6.23 mm) canines and the antegonial width (-4.44 mm, 95% CI -5.38 to -3.51) indicated the greatest difference between the imaging techniques. The least difference displaying statistical significance was observed in the
Figure 3. Bland-Altman plots for evaluation of cone-beam computed tomography intra-observer reliability.
Figure 4. Bland-Altman plots for evaluation of PAC intra-observer reliability.
Figure 5. Bland-Altman plots for evaluation of the reliability of PAC when compared to measurements obtained with CBCT.
mandibular molar cusp tip (0.91 mm, 95% CI 0.15 to 1.66) dimension. The interjugal width and the width of the most buccal cusp tip of the maxillary first molars were the only two variables that did not demonstrate a statistically significant difference on image comparison.
The association of common dental and skeletal measurements with the interjugal distance (J-J) and (Ag-Ag) was evaluated using multiple linear regression techniques. For PAC measurements with response
Australian Orthodontic Journal Volume 30 No. 2 November 2014 137
THE RELIABILITY OF USING POSTERO-ANTERIOR CEPHALOMETRY AND CONE-BEAM CT
J-J, only (U6_most_lat) was retained as a significant predictor in the final model, producing R2 = 47%. The corresponding model for CBCT data retained (U6_most_lat), (L6_most_lat) and (L3_max_convex) in the final model, producing a much larger R2
= 73%. In addition, when the same response was examined for CBCT data using the additional four potential predictors unique to CBCT measurements, the explanatory variables of greatest intermolar width (U6_most_lat), maxillary molar widths (U6_alv) and measurement from the mid-buccal surface (U6_mid_Bu), provided a higher R2 value of 80%. The response (Ag-Ag) was examined in a similar
manner. Modelling using PAC data provided an R2 = 41%, whilst the corresponding CBCT modelling gave R2 = 47%. Furthermore, modelling including the four additional CBCT variables increased R2 to 51%. These analyses indicated that the CBCT measurements appeared to not only provide more explanatory power for the J-J and Ag-Ag when comparing the same set of predictors as those used for the PAC, but also indicated the additional variables measured by CBCT provided more information for both responses. However, this was much more pronounced in the J-J response.
The linear correlation co-efficient between intermaxillary width ratios (J-J/Ag-Ag) on PAC and
CBCT PAC
VariableMean difference
(mm)Lower CL
(mm)Upper CL
(mm)ICC Mean difference
(mm)Lower CL
(mm)Upper CL
(mm)ICC
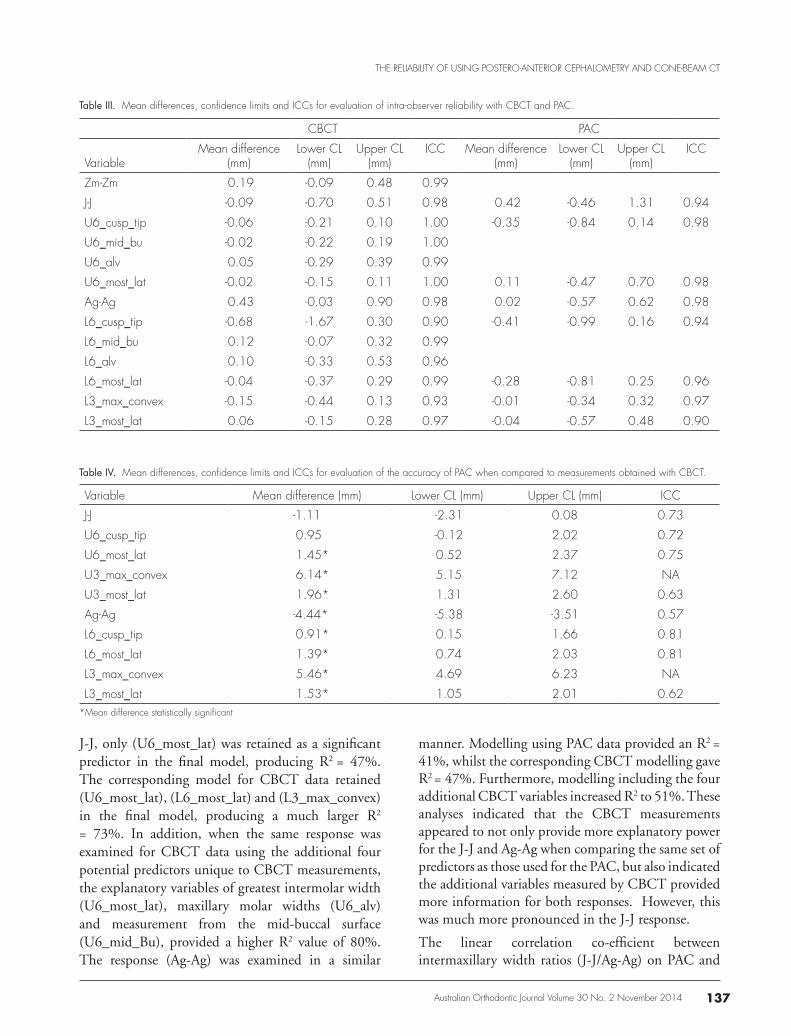
Zm-Zm 0.19 -0.09 0.48 0.99
J-J -0.09 -0.70 0.51 0.98 0.42 -0.46 1.31 0.94
U6_cusp_tip -0.06 -0.21 0.10 1.00 -0.35 -0.84 0.14 0.98
U6_mid_bu -0.02 -0.22 0.19 1.00
U6_alv 0.05 -0.29 0.39 0.99
U6_most_lat -0.02 -0.15 0.11 1.00 0.11 -0.47 0.70 0.98
Ag-Ag 0.43 -0.03 0.90 0.98 0.02 -0.57 0.62 0.98
L6_cusp_tip -0.68 -1.67 0.30 0.90 -0.41 -0.99 0.16 0.94
L6_mid_bu 0.12 -0.07 0.32 0.99
L6_alv 0.10 -0.33 0.53 0.96
L6_most_lat -0.04 -0.37 0.29 0.99 -0.28 -0.81 0.25 0.96
L3_max_convex -0.15 -0.44 0.13 0.93 -0.01 -0.34 0.32 0.97
L3_most_lat 0.06 -0.15 0.28 0.97 -0.04 -0.57 0.48 0.90
Table III. Mean differences, confidence limits and ICCs for evaluation of intra-observer reliability with CBCT and PAC.
Variable Mean difference (mm) Lower CL (mm) Upper CL (mm) ICC
J-J -1.11 -2.31 0.08 0.73
U6_cusp_tip 0.95 -0.12 2.02 0.72
U6_most_lat 1.45* 0.52 2.37 0.75
U3_max_convex 6.14* 5.15 7.12 NA
U3_most_lat 1.96* 1.31 2.60 0.63
Ag-Ag -4.44* -5.38 -3.51 0.57
L6_cusp_tip 0.91* 0.15 1.66 0.81
L6_most_lat 1.39* 0.74 2.03 0.81
L3_max_convex 5.46* 4.69 6.23 NA
L3_most_lat 1.53* 1.05 2.01 0.62
Table IV. Mean differences, confidence limits and ICCs for evaluation of the accuracy of PAC when compared to measurements obtained with CBCT.
*Mean difference statistically significant
Australian Orthodontic Journal Volume 30 No. 2 November 2014138
TAI ET AL
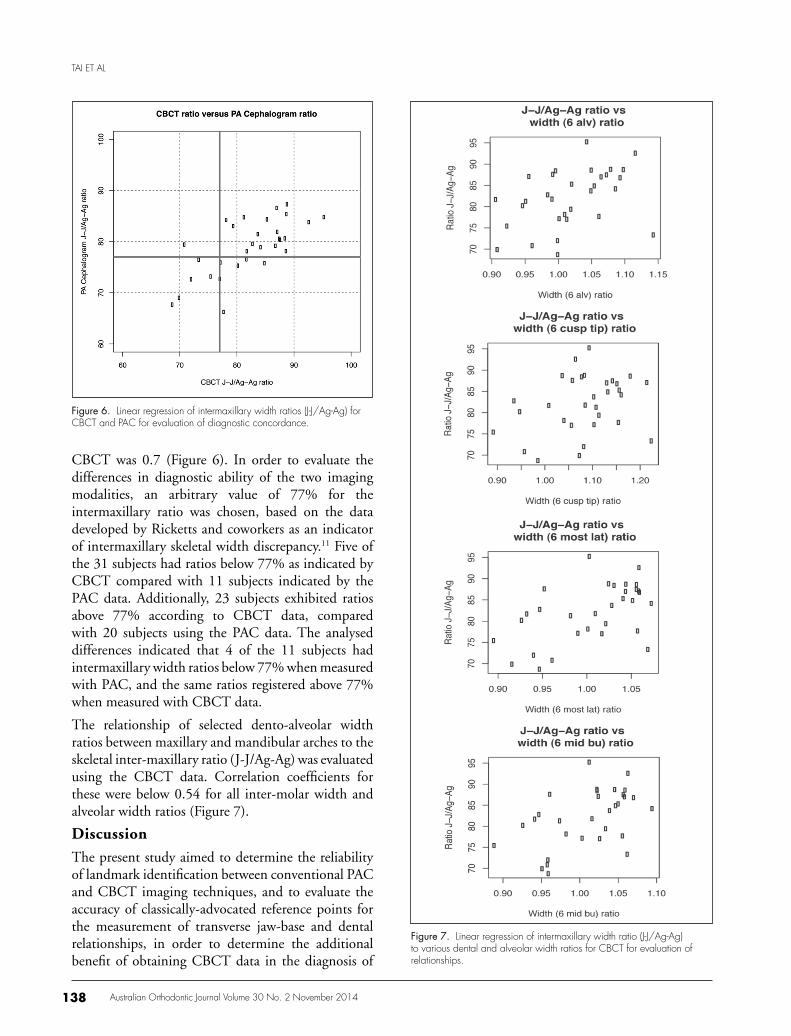
CBCT was 0.7 (Figure 6). In order to evaluate the differences in diagnostic ability of the two imaging modalities, an arbitrary value of 77% for the intermaxillary ratio was chosen, based on the data developed by Ricketts and coworkers as an indicator of intermaxillary skeletal width discrepancy.11 Five of the 31 subjects had ratios below 77% as indicated by CBCT compared with 11 subjects indicated by the PAC data. Additionally, 23 subjects exhibited ratios above 77% according to CBCT data, compared with 20 subjects using the PAC data. The analysed differences indicated that 4 of the 11 subjects had intermaxillary width ratios below 77% when measured with PAC, and the same ratios registered above 77% when measured with CBCT data.
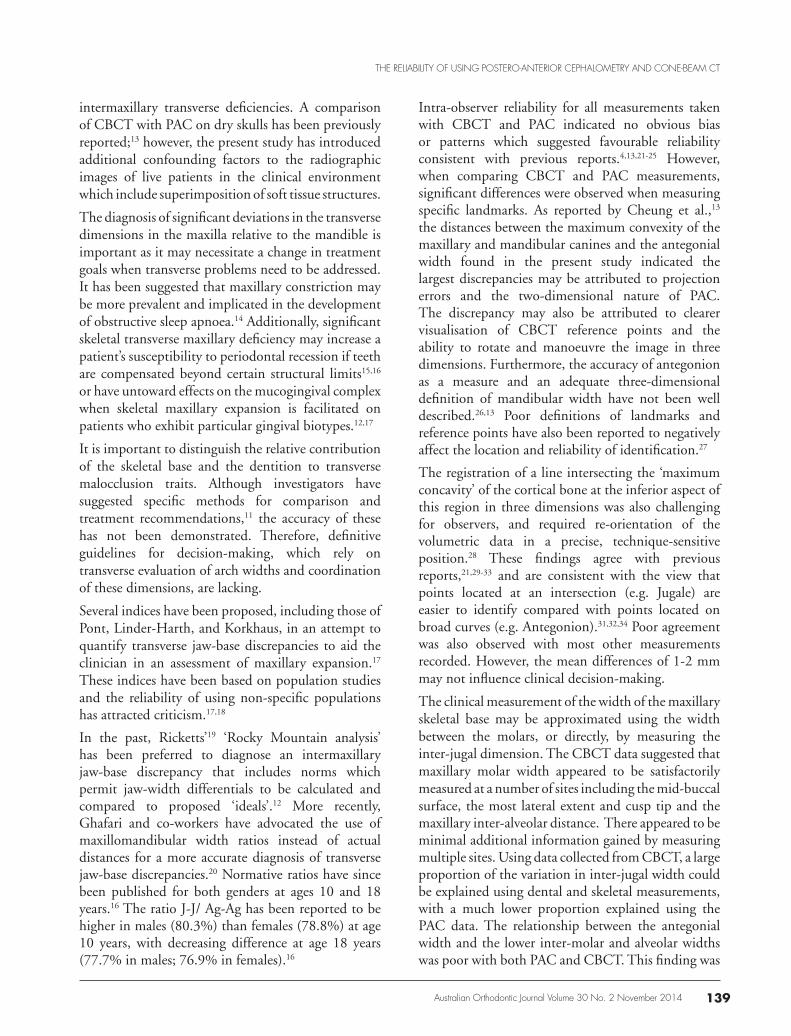
The relationship of selected dento-alveolar width ratios between maxillary and mandibular arches to the skeletal inter-maxillary ratio (J-J/Ag-Ag) was evaluated using the CBCT data. Correlation coefficients for these were below 0.54 for all inter-molar width and alveolar width ratios (Figure 7).
Discussion
The present study aimed to determine the reliability of landmark identification between conventional PAC and CBCT imaging techniques, and to evaluate the accuracy of classically-advocated reference points for the measurement of transverse jaw-base and dental relationships, in order to determine the additional benefit of obtaining CBCT data in the diagnosis of
Figure 6. Linear regression of intermaxillary width ratios (J-J/Ag-Ag) for CBCT and PAC for evaluation of diagnostic concordance.
Figure 7. Linear regression of intermaxillary width ratio (J-J/Ag-Ag) to various dental and alveolar width ratios for CBCT for evaluation of relationships.
Australian Orthodontic Journal Volume 30 No. 2 November 2014 139
THE RELIABILITY OF USING POSTERO-ANTERIOR CEPHALOMETRY AND CONE-BEAM CT
intermaxillary transverse deficiencies. A comparison of CBCT with PAC on dry skulls has been previously reported;13 however, the present study has introduced additional confounding factors to the radiographic images of live patients in the clinical environment which include superimposition of soft tissue structures.
The diagnosis of significant deviations in the transverse dimensions in the maxilla relative to the mandible is important as it may necessitate a change in treatment goals when transverse problems need to be addressed. It has been suggested that maxillary constriction may be more prevalent and implicated in the development of obstructive sleep apnoea.14 Additionally, significant skeletal transverse maxillary deficiency may increase a patient’s susceptibility to periodontal recession if teeth are compensated beyond certain structural limits15,16 or have untoward effects on the mucogingival complex when skeletal maxillary expansion is facilitated on patients who exhibit particular gingival biotypes.12,17
It is important to distinguish the relative contribution of the skeletal base and the dentition to transverse malocclusion traits. Although investigators have suggested specific methods for comparison and treatment recommendations,11 the accuracy of these has not been demonstrated. Therefore, definitive guidelines for decision-making, which rely on transverse evaluation of arch widths and coordination of these dimensions, are lacking.
Several indices have been proposed, including those of Pont, Linder-Harth, and Korkhaus, in an attempt to quantify transverse jaw-base discrepancies to aid the clinician in an assessment of maxillary expansion.17 These indices have been based on population studies and the reliability of using non-specific populations has attracted criticism.17,18
In the past, Ricketts’19 ‘Rocky Mountain analysis’ has been preferred to diagnose an intermaxillary jaw-base discrepancy that includes norms which permit jaw-width differentials to be calculated and compared to proposed ‘ideals’.12 More recently, Ghafari and co-workers have advocated the use of maxillomandibular width ratios instead of actual distances for a more accurate diagnosis of transverse jaw-base discrepancies.20 Normative ratios have since been published for both genders at ages 10 and 18 years.16 The ratio J-J/ Ag-Ag has been reported to be higher in males (80.3%) than females (78.8%) at age 10 years, with decreasing difference at age 18 years (77.7% in males; 76.9% in females).16
Intra-observer reliability for all measurements taken with CBCT and PAC indicated no obvious bias or patterns which suggested favourable reliability consistent with previous reports.4,13,21-25 However, when comparing CBCT and PAC measurements, significant differences were observed when measuring specific landmarks. As reported by Cheung et al.,13 the distances between the maximum convexity of the maxillary and mandibular canines and the antegonial width found in the present study indicated the largest discrepancies may be attributed to projection errors and the two-dimensional nature of PAC. The discrepancy may also be attributed to clearer visualisation of CBCT reference points and the ability to rotate and manoeuvre the image in three dimensions. Furthermore, the accuracy of antegonion as a measure and an adequate three-dimensional definition of mandibular width have not been well described.26,13 Poor definitions of landmarks and reference points have also been reported to negatively affect the location and reliability of identification.27
The registration of a line intersecting the ‘maximum concavity’ of the cortical bone at the inferior aspect of this region in three dimensions was also challenging for observers, and required re-orientation of the volumetric data in a precise, technique-sensitive position.28 These findings agree with previous reports,21,29-33 and are consistent with the view that points located at an intersection (e.g. Jugale) are easier to identify compared with points located on broad curves (e.g. Antegonion).31,32,34 Poor agreement was also observed with most other measurements recorded. However, the mean differences of 1-2 mm may not influence clinical decision-making.
The clinical measurement of the width of the maxillary skeletal base may be approximated using the width between the molars, or directly, by measuring the inter-jugal dimension. The CBCT data suggested that maxillary molar width appeared to be satisfactorily measured at a number of sites including the mid-buccal surface, the most lateral extent and cusp tip and the maxillary inter-alveolar distance. There appeared to be minimal additional information gained by measuring multiple sites. Using data collected from CBCT, a large proportion of the variation in inter-jugal width could be explained using dental and skeletal measurements, with a much lower proportion explained using the PAC data. The relationship between the antegonial width and the lower inter-molar and alveolar widths was poor with both PAC and CBCT. This finding was
Australian Orthodontic Journal Volume 30 No. 2 November 2014140
TAI ET AL
in agreement with other reports which suggested that the dental arches do not provide an accurate means of assessing the transverse skeletal dimension.35 It has been reported that, whilst a correlation between the maxillary inter-molar width and maxillary skeletal base dimension exists, the mandibular dental width measurements do not correlate with the transverse mandibular skeletal dimension.13
It is important for the clinician to appreciate that the measurement of the skeletal base of the maxilla and mandible may not be accurately represented by a single posterior determination of the maxillary or mandibular dental or skeletal width.35 The present study revealed a significant difference between the variation in arch widths measured at the canines in the maxilla and mandible which was not well related to the apparent maxillary or mandibular skeletal base width alone. The PAC may not be sensitive to these variations and complete comprehension of the individual morphological variation of the individual in three dimensions may not be appreciated because of the limitations of the two-dimensional technique.
The decision to expand the maxilla is based on a diagnosis of skeletal maxillary deficiency and this may be assessed either quantitatively by absolute size,11 or by a ratio between the maxillary and mandibular skeletal bases.20 However, it has recently been suggested that, because of the errors with PAC measurements, the ratio J-J/Ag-Ag13,36,37 is a more accurate assessment of inter-maxillary relationships. The present study also indicated that when this ratio was evaluated by CBCT and PAC, some patients were identified as maxillary deficient by CBCT and acceptable by PAC and vice versa. The use of J-J and Ag-Ag dimensions, as representations of the respective maxillary and mandibular skeletal bases, could not be substituted for other dental or dento-alveolar dimensions. Despite a linear correlation of only 0.7 when J-J and Ag-Ag were used to assess the transverse skeletal relationship according to an arbitrary ratio of 77%, the majority of the subjects from this sample who demonstrated a relative maxillary constriction according to both imaging methods, were in reasonable agreement. Despite this finding, 5 of the 31 subjects (16%) recorded ‘false positive’ records according to the data provided from either of the imaging methods. This may reflect the questionable accuracy of PAC in the diagnosis of inter-maxillary transverse discrepancy using the J-J/Ag-Ag ratio, for certain individuals.
The diagnosis of inter-maxillary width deficiency in
a small proportion of the sample would appear to depend on which radiographic technique was used to collect the data. This information must be viewed critically in the clinical setting as the ‘cut-off ’ ratio, for patient diagnosis is often made on an individual basis. Further studies are needed in order to identify the degree to which differences may occur and whether they are of clinical significance. Other factors such as posterior dental crossbite,16 severe crowding, the predominant mode of breathing, and buccal corridor width on smiling24 may be important considerations, and proposed ratios used in the diagnosis of transverse jaw-base discrepancies should only be used as a guide in the clinician’s decision-making process.
The difficulties experienced during the calibration phase of data collection highlight that, whilst PAC may not demonstrate acceptable accuracy, there are factors which could be standardised before the adoption of cone beam data in routine cephalometry. These include:
1. Strict definition of landmarks in all three planes of space (this may include re-definition of several traditional landmarks/reference points adopted from plane film cephalometry).
2. Consistency in establishing these planes accounting for asymmetries in patients, not just in a single focal region, but perhaps also in multiple regions and planes.
3. A protocol regarding optimum windowing and levelling of images.
Conclusions
The reliability of conventional PAC and CBCT was found to be favourable for all measurements representing dental and skeletal transverse dimensions. Agreement between the imaging techniques, however, was not acceptable for most measurements. Some of the commonly-used reference points appeared to lack an adequate three-dimensional definition. The accuracy of antegonion and upper and lower intercanine widths measured via the point of maximum convexity on PAC was questionable. Additionally, the relationship between dental arch widths and skeletal widths was poor.
Overall, there was worthwhile benefit in the information obtained from CBCT data. This was reflected in the difference between subjects who were identified with an inter-maxillary width discrepancy
Australian Orthodontic Journal Volume 30 No. 2 November 2014 141
THE RELIABILITY OF USING POSTERO-ANTERIOR CEPHALOMETRY AND CONE-BEAM CT
between imaging techniques. Despite enhanced accuracy using the CBCT technique, additional standardisation of anatomical structure identification and subsequent measurement process may enhance the quality of obtained data, and play an important role in the acceptance and routine use of this imaging method in the orthodontic profession. Further research may be required to validate the findings delivered by the present study.
Acknowledgments
This research is sponsored by the Australian Society of Orthodontists Foundation for Research and Education (ASOFRE) Special Donation grant and, by the School of Dentistry, The University of Western Australia. The authors would like to thank the staff at Envision Medical Imaging for their support in image acquisition and measurements.
Conflict of Interest
There was no conflict of interest between the authors and results from this study.
Corresponding author
Dr Syed Mohammed Shamsul IslamSchool of Dentistry (M512)The University of Western Australia35 Stirling HighwayCrawley, WA 6009Australia
Email: [email protected]
References1. Mozzo P, Procacci C, Tacconi A, Martini PT and Andreis IA. A new
volumetric CT machine for dental imaging based on the cone-beam technique: preliminary results. Eur Rad 1998;8:1558-64.
2. Jacobson A, Jacobson RL. Radiographic cephalometry. Quintessence, Hanover Park, 2006;267-92.
3. Hans M, Valiathan M, Palomo J. Cone beam computed tomography: a link with the past, a promise for the future. Semin Orthod 2011;17:81-7.
4. Berco M, Rigali PH Jr, Miner RM, DeLuca S, Anderson NK,Will LA. Accuracy and reliability of linear cephalometric measurements from cone-beam computed tomography scans of a dry human skull. Am J Orthod Dentofacial Orthop 2009;136:17.e1-9.
5. Damstra J, Fourie Z, Huddleston Slater JJ, Ren Y. Accuracy of linear measurements from cone-beam computed tomography-derived surface models of different voxel sizes. Am J Orthod Dentofacial Orthop 2010;137:16.e1-6.
6. Gribel BF, Gribel MN, Frazäo DC, McNamara JA Jr, Manzi F. Accuracy and reliability of craniometric measurements on lateral cephalometry and 3D measurements on CBCT scans. Angle Orthod
2011;81:26-35.7. Kobayashi K, Shimoda S, Nakagawa Y, Yamamoto A. Accuracy in
measurement of distance using limited cone-beam computerized tomography. Int J Oral Maxillofac Implants 2004;19:228-31.
8. Lascala C, Panella J, Marques M. Analysis of the accuracy of linear measurements obtained by cone beam computed tomography (CBCT-NewTom). Dentomaxillofac Radiol 2004;33:291-4.
9. Stratemann S, Huang J, Maki K, Miller A, Hatcher D. Comparison of cone beam computed tomography imaging with physical measures. Dentomaxillofac Radiol 2008;37:80-93.
10. Gottlieb E, Nelson AH, Vogels DS. 1990 study of orthodontic diagnosis and treatment procedures. 1. Results and trends. J Clin Orthod 1991;25:145-56.
11. Ricketts R, Roth RH, Chaconas SJ, Schulhof RJ, Engel GA. Orthodontic diagnosis and planning. Denver: Rocky Mountain Data Systems, 1982.
12. Vanarsdall RL Jr. Transverse dimension and long-term stability. Semin Orthod 1999; 5:171-80.
13. Cheung G, Goonewardene MS, Islam SM, Murray K, Koong B. The validity of transverse intermaxillary analysis on traditional PA cephalometry compared to cone-beam computed tomography, Aust Orthod J 2013;29:86-95.
14. Seto BH, Gotsopoulos H, Sims MR, Cistulli PA. Maxillary morphology in obstructive sleep apnoea syndrome. Eur J Orthod 2001;23:703-14.
15. Farman AG, Scarfe WC. The basics of maxillofacial cone beam computed tomography. Semin Orthod 2009;15:2-13.
16. Huertas D, Ghafari J. New posteroanterior cephalometric norms: a comparison with craniofacial measures of children treated with palatal expansion. Angle Orthod 2001;71:285-92.
17. Suri L, Taneja P. Surgically assisted rapid palatal expansion: a literature review. Am J Orthod Dentofacial Orthop 2008;133:290-302.
18. Nimkarn Y, Miles PG, O’Reilly MT, Weyant RJ. The validity of maxillary expansion indices. Angle Orthod 1995;65:321-6.
19. Ricketts R. Perspectives in the clinical application of cephalometrics: the first fifty years. Angle Orthod 1981;51:115-50.
20. Ghafari J, Cater PE, Shofer FS. Effect of film-object distance on posteroanterior cephalometric measurements: suggestions for standardized cephalometric methods. Am J Orthod Dentofacial Orthop 1995;108:30-7.
21. El-Mangoury NH, Shaheen SI, Mostafa YA, Landmark identification in computerized posteroanterior cephalometrics. Am J Orthod Dentofacial Orthop 1987;91:57-61.
22. Chien P, Parks ET, Eraso F, Hartfield JK, Roberts WE, Ofner S. Comparison of reliability in anatomical landmark identification using two-dimensional digital cephalometrics and three-dimensional cone beam computed tomography in vivo. Dentomaxillofac Radiol 2009;38:262-73.
23. de Oliveira A EF, Cevidanes LHS, Phillips C, Motta A, Burke B, Tyndall D. Observer reliability of three-dimensional cephalometric landmark identification on cone-beam computerized tomography. Oral Surg Oral Med Oral Path Oral Radiol Endod 2009;107:256-65.
24. Tikku T, Khanna R, Maurya RP, Ahmad N. Role of buccal corridor in smile esthetics and its correlation with underlying skeletal and dental structures. Indian J Dent Res 2012;23:187-94.
25. Brown AA, Scarfe WC, Scheetz JP, Silveira AM, Farman AG. Linear accuracy of cone beam CT derived 3D images. Angle Orthod 2009;79:150-7.
26. Legrell PE, Nyquist H, Isberg A. Validity of identification of gonion and antegonion in frontal cephalograms. Angle Orthod 2000;70:157-64.
27. Major PW, Johnson DE, Hesse KL, Glover KE. Landmark identification error in posterior anterior cephalometrics. Angle
Australian Orthodontic Journal Volume 30 No. 2 November 2014142
TAI ET AL
Orthod 1994;64:447-54.28. van Vlijmen O, Bergé S, Bronckhorst E, Swennen G, Katsaros C,
Kuijpers-Jagtman A. A comparison of frontal radiographs obtained from cone-beam CT and conventional frontal radiographs from human skulls. Int J Oral Maxillofac Surg 2009;38:773-8.
29. Leonardi R, Annunziata A, Caltabiano M. Landmark identification error in posteroanterior cephalometric radiography. A systematic review. Angle Orthod 2008;78:761-5.
30. Pirttiniemi P, Miettinen J, Kantomaa T. Combined effects of error in frontal-view asymmetry diagnosis. Eur J Orthod 1996;18:629-36.
31. Major P, Johnson D, Hesse K, Glover K. Landmark identification error in posterior anterior cephalometrics. Angle Orthod 1994;64:447-54.
32. Schlicher W, Nielsen I, Huang J, Maki K, Hatcher D, Miller A. Consistency and precision of landmark identification in three-dimensional cone beam computed tomgraph scans. Eur J Orthod
2012;34:263-75. 33. Wong R, Chau A, Hägg U. 3D CBCT McNamara’s cephalometric
analysis in an adult southern Chinese popluation. Int J Oral Maxillofac Surg 2011;40:920-5.
34. Baumrind S, Frantz R. The reliability of head film measurements 2. Conventional angular and linear measures. Am J Orthod 1971;60:505-17.
35. Vanarsdall RL, White RP Jr. Three-dimensional analysis for skeletal problems. Am J Orthod Dentofacial Orthop 1995;107:22A-23A.
36. Athanasiou AE, DroschI H, Bosch C. Data and patterns of transverse dentofacial structure of 6-to-15-year old children: a posterioranterior cephalometric study. Am J Orthod Dentofacial Orthop 1992;101:465-71.
37. Cortella S, Shofer F, Ghafari J. Transverse development of the jaws: norms for the posteroanterior cephalometric analysis. Am J Orthod Dentofacial Orthop 1997;112:519-22.
Top Related
Copyright © 2022 FDOKUMEN

