


Bahasa
Halaman
Hukum

...
.
...
.
...
.
...
.
...
.
...
.
...
.
...
.
...
.
...
.
The quirk signal at the FASER
arXiv:2108.06748
Junle Pei (ITP, CAS)
Co-authors: Jinmian Li (Sichuan University)Longjie Ran (Sichuan University)Wenxing Zhang (SJTU)
Tenth workshop of the LLP Community
November 10, 2021
Junle Pei The quirk signal at the FASER November 10, 2021 1 / 15
...
.
...
.
...
.
...
.
...
.
...
.
...
.
...
.
...
.
...
.
Quirk
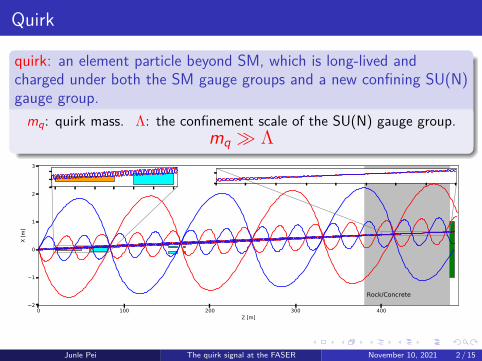
quirk: an element particle beyond SM, which is long-lived andcharged under both the SM gauge groups and a new confining SU(N)gauge group.
mq: quirk mass. Λ: the confinement scale of the SU(N) gauge group.mq ≫ Λ
where x = log10(βγ), C = 1− 2 ln(
~ωp
I
), and ~ωp =
√ρ〈Z/A〉.
A schematic drawing of quirk trajectories from the ATLAS IP to the FASER detectoris showing in FIG. 2. We will not consider the effects of magnetic fields for simplicity.However, such simplification is conservative since the quadrupole magnets which are used tofocus the beam will push the quirks toward the central region, leading to higher signal rateat the FASER detector. Although the dipole magnetic fields pull apart two quirks (notethat pz � px, py for the kinematic region of interest), their effects are small for Λ & 100 eV(due to the short time duration inside the magnetic field). When Λ ∼ O(10) eV, it is likelythat only part of the quirk trajectory is inside the magnetic field, the effects of magneticfield on two quirks with opposite charges will cancel with each other.
0 100 200 300 400Z [m]
2
1
0
1
2
3
X [m
]
Rock/Concrete
FIG. 2. The quirk trajectories and forward infrastructures from ATLAS IP to the FASER detector.Two fragments of quirk trajectory are magnified for clearer visibility. The quirk initial momenta are~p1 = (−132.146, 121.085, 1167.35) GeV and ~p2 = (136.381,−123.865, 2061.56) GeV and the quirkmass is 800 GeV. And three different confinement scales Λ = 50 eV, 100 eV, 400 eV are consideredfor illustration. The orange, cyan, grey, and green regions indicate the regions with quadrupolemagnetic field, dipole magnetic field, rock/concrete and the FASER detector, respectively.
We will focus on the ionization effects of quirk travelling down-stream from the ATLASIP, which not only leads to energy loss of each quirk, but also induces the angular momentumfor the quirk-pair system. The configurations of infrastructures between the ATLAS IP andthe FASER detector used in the simulation of this work are summarized in TABLE I [48].The TAS is a 1.8-meter-long copper block with an inner radius of 17 mm, which is put at19 m downstream. Note that we assume an infinite transverse size of the TAS, which is alsoused to represent other materials at around the beginning of quirks’ motion. The TAN at140 m downstream contains a 9.6 cm wide by 100 cm long by 60.7 cm deep slot, which isoccupied by copper bars. Finally, the quirk needs to travel through 10 m of concrete and 90m of rock before reaching the FASER at 480 m downstream. The designed transverse radiiof FASER and FASER 2 are R=10 cm and 1 m, respectively. As the quirk signal rate atthe FASER is quite small, we chose the FASER 2 parameter for representation.
According to Ref. [49], values of the variables relevant to the ionization energy loss incopper, concrete, and rock are listed in the TABLE II. It is noted that the values of a, k,x0, x1, C, and δ0 are obtained from the muon travelling through materials. We use them toestimate the ionization energy loss of the quirk in the corresponding materials.
6
Junle Pei The quirk signal at the FASER November 10, 2021 2 / 15
...
.
...
.
...
.
...
.
...
.
...
.
...
.
...
.
...
.
...
.
Quirk motion inside materials
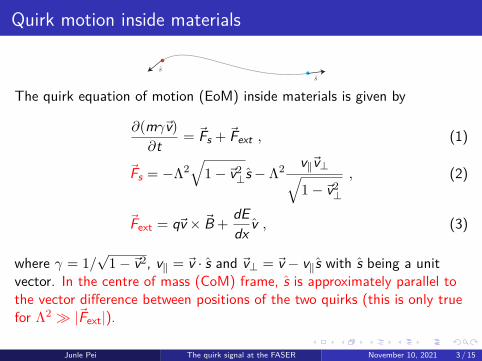
The quirk equation of motion (EoM) inside materials is given by
∂(mγv)∂t = Fs + Fext , (1)
Fs = −Λ2√1− v2⊥s − Λ2 v∥v⊥√
1− v2⊥, (2)
Fext = qv × B +dEdx v , (3)
where γ = 1/√1− v2, v∥ = v · s and v⊥ = v − v∥s with s being a unit
vector. In the centre of mass (CoM) frame, s is approximately parallel tothe vector difference between positions of the two quirks (this is only truefor Λ2 ≫ |Fext|).
Junle Pei The quirk signal at the FASER November 10, 2021 3 / 15
...
.
...
.
...
.
...
.
...
.
...
.
...
.
...
.
...
.
...
.
dE/dx
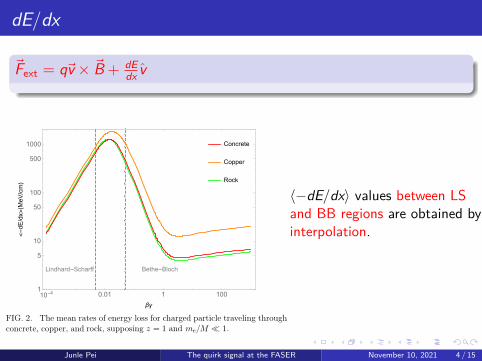
Fext = qv × B + dEdx v
Bloch-Scharff Bethe-Lindhard
Rock
Copper
Concrete
)cm/
MeV
>(
dx/dE
<-
βγ
1000
500
100
50
10
5
110010.014-10
FIG. 2. The mean rates of energy loss for charged particle traveling throughconcrete, copper, and rock, supposing z = 1 and me/M � 1.
⟨−dE/dx⟩ values between LSand BB regions are obtained byinterpolation.
Junle Pei The quirk signal at the FASER November 10, 2021 4 / 15
...
.
...
.
...
.
...
.
...
.
...
.
...
.
...
.
...
.
...
.
Infracolor glueball and electromagnetic radiations
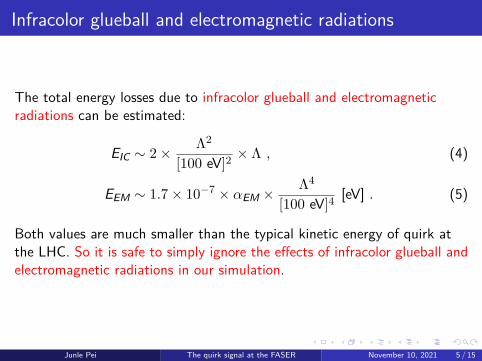
The total energy losses due to infracolor glueball and electromagneticradiations can be estimated:
EIC ∼ 2× Λ2
[100 eV]2 × Λ , (4)
EEM ∼ 1.7× 10⁻⁷ × αEM × Λ4
[100 eV]4 [eV] . (5)
Both values are much smaller than the typical kinetic energy of quirk atthe LHC. So it is safe to simply ignore the effects of infracolor glueball andelectromagnetic radiations in our simulation.
Junle Pei The quirk signal at the FASER November 10, 2021 5 / 15
...
.
...
.
...
.
...
.
...
.
...
.
...
.
...
.
...
.
...
.
Quirk production
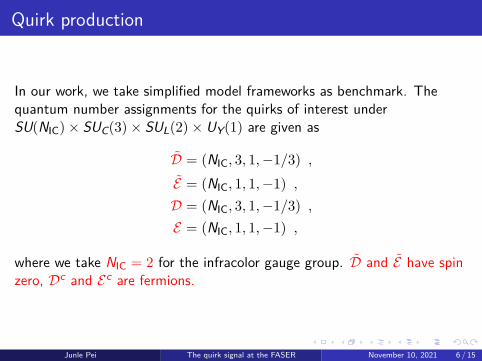
In our work, we take simplified model frameworks as benchmark. Thequantum number assignments for the quirks of interest underSU(NIC)× SUC(3)× SUL(2)× UY(1) are given as
D = (NIC, 3, 1,−1/3) ,
E = (NIC, 1, 1,−1) ,
D = (NIC, 3, 1,−1/3) ,
E = (NIC, 1, 1,−1) ,
where we take NIC = 2 for the infracolor gauge group. D and E have spinzero, Dc and Ec are fermions.
Junle Pei The quirk signal at the FASER November 10, 2021 6 / 15
...
.
...
.
...
.
...
.
...
.
...
.
...
.
...
.
...
.
...
.
Quirk production
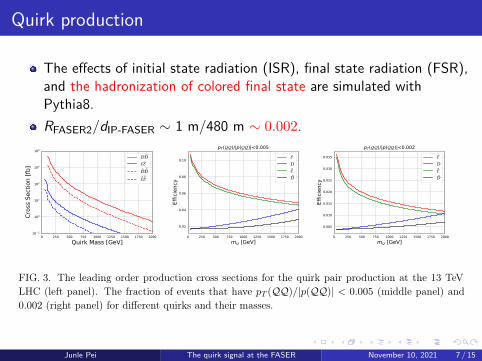
The effects of initial state radiation (ISR), final state radiation (FSR),and the hadronization of colored final state are simulated withPythia8.RFASER2/dIP-FASER ∼ 1 m/480 m ∼ 0.002.
0 250 500 750 1000 1250 1500 1750 2000Quirk Mass [GeV]
10 2
100
102
104
106
108
Cros
s Sec
tion
[fb]
0 250 500 750 1000 1250 1500 1750 2000m [GeV]
0.02
0.04
0.06
0.08
0.10
Effic
ienc
y
pT( )/|p( )|<0.005
0 250 500 750 1000 1250 1500 1750 2000m [GeV]
0.005
0.010
0.015
0.020
0.025
0.030
0.035
Effic
ienc
y
pT( )/|p( )|<0.002
FIG. 3. The leading order production cross sections for the quirk pair production at the 13 TeVLHC (left panel). The fraction of events that have pT (QQ)/|p(QQ)| < 0.005 (middle panel) and0.002 (right panel) for different quirks and their masses.
the gauge bosons, given the same mass and quantum numbers, the scalar quirk has muchsmaller production cross section than the fermionic quirk.
Although each quirk can be produced with large transverse momentum, the quirk pairsystem (QQ) is travelling along the beam axis (thus enters the FASER detector) if the initialstate and final state radiations are not taken into account. In event generation, the effectsof initial state radiation (ISR), final state radiation (FSR), and the hadronization of coloredfinal state are simulated with Pythia8 [46]. Those effects deflect the direction of the QQsystem from the beam axis, making many of the quirk production events undetectable at theFASER detector. In the middle and right panels of FIG. 1, we plot the fractions of events thathave pT (QQ)/|p(QQ)| < 0.005 and 0.002 for different quirks, where pT (QQ) and |p(QQ)|are the transverse momentum and the momentum size of the quirk-pair system, respectively.Note that these selections also keep events with QQ system travelling opposite to the Z-axis, which obviously can not reach the FASER. From the figure, we can observe that thereare ∼ 2− 10% events of QQ flying around the beam axis (pT (QQ)/|p(QQ)| < 0.005) afterincluding the ISR and FSR effects. And the fraction is reduced by a factor of 4 for morestringent condition (pT (QQ)/|p(QQ)| < 0.002). The ISR and FSR are much more intensivefor the colored quirk production processes than the color neutral ones, thus the fraction ofthe events that pass the deflection condition is lower for colored quirks. For colored quirkproduction, the FSR dominates over the ISR. Heavier quirk is more difficult to be deflectedby the FSR, so the selection efficiency is higher for heavier quirk. While for the color neutralquirk, only the ISR is important. And the energy scale of the ISR is proportional to thequirk mass, which means harder ISR will occur for heavier quirk, leading to lower selectionefficiency. The difference between the fermionic quirk and scalar quirk is owning to the factthat the phase space with larger momentum transfer is enhanced for scalar quirk productiondue to its momentum dependent coupling with the SM gauge bosons.
4
Junle Pei The quirk signal at the FASER November 10, 2021 7 / 15
...
.
...
.
...
.
...
.
...
.
...
.
...
.
...
.
...
.
...
.
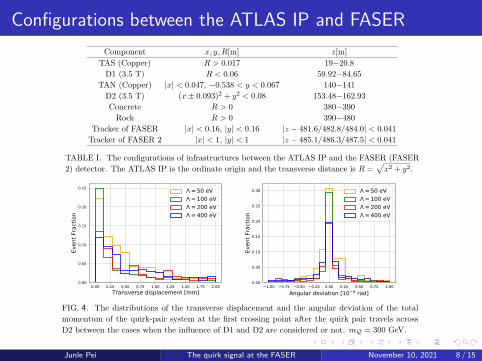
Configurations between the ATLAS IP and FASERComponent x, y,R[m] z[m]
TAS (Copper) R > 0.017 19−20.8D1 (3.5 T) R < 0.06 59.92−84.65
TAN (Copper) |x| < 0.047, −0.538 < y < 0.067 140−141D2 (3.5 T) (x± 0.093)2 + y2 < 0.08 153.48−162.93Concrete R > 0 380−390
Rock R > 0 390−480Tracker of FASER |x| < 0.16, |y| < 0.16 |z − 481.6/482.8/484.0| < 0.041
Tracker of FASER 2 |x| < 1, |y| < 1 |z − 485.1/486.3/487.5| < 0.041
TABLE I. The configurations of infrastructures between the ATLAS IP and the FASER (FASER2) detector. The ATLAS IP is the ordinate origin and the transverse distance is R =
√x2 + y2.
Material Z or ⟨Z⟩ ⟨Z/A⟩[mol/g] ρ[g/cm3] I[eV] a k x0 x1 C δ0Copper 29 29/63.546 8.960 322.0 0.14339 2.9044 -0.0254 3.2792 4.4190 0.08
Concrete 8.56 0.50274 2.300 135.2 0.07515 3.5467 0.1301 3.0466 3.9464 0.00Rock 11 0.50000 2.650 136.4 0.08301 3.4120 0.0492 3.0549 3.7738 0.00
TABLE II. Values of the variables relevant to the ionization energy loss in copper, concrete, androck. The values of a, k, x0, x1, C, and δ0 are for the muons [49].
In the region v/c < (7.33× 10⁻³) z2/3, the mean rate of energy loss is described by theLindhard-Scharff (LS) formula,⟨
−dE
dx
⟩LS
= 3.1× 10⁻¹¹GeV2 ρ
g/cm3
z7/6Z/A
(z2/3 + Z2/3)3/2
β . (III.7)
In FIG. 3, the mean rates of energy loss for charged particle travelling through concrete,copper, and rock are plotted, where we set z = 1. The ⟨−dE/dx⟩ is independent of the massof the incident particle because me/M ≪ 1 is assumed. It is noted that ⟨−dE/dx⟩ valuesbetween LS and BB regions are obtained by interpolation.
When solving the quirk EoM numerically, the mean energy loss⟨−dE
dx
⟩can not be used
directly for estimating |Fion|. The ionization energy loss for a charged particle travellinga distance δx in the material fluctuates, which, in the BB region, can be described by aGaussian distribution when δx is large enough such that ξ(δx)
Wmax> 10 [47], where
ξ(δx) =Kρz2Z
2Aβ2δx . (III.8)
This corresponds to our case, because the quirks travel through macroscopic region of ma-terials with v/c ∼ 1. The −dE/dx for each quirk satisfies the Gaussian distribution withprobability distribution function (PDF) [47]
f
(−dE
dx, δx
)=
1√2πσ(δx)
exp
[−(−dE
dx−
⟨−dE
dx
⟩BB
)22σ2(δx)
], (III.9)
σ2(δx) =ξ(δx)Wmax
δ2x(1− β2/2) . (III.10)
7
0.00 0.25 0.50 0.75 1.00 1.25 1.50 1.75 2.00Transverse displacement [mm]
0.00
0.05
0.10
0.15
0.20
0.25
Even
t Fra
ctio
n
= 50 eV= 100 eV= 200 eV= 400 eV
1.00 0.75 0.50 0.25 0.00 0.25 0.50 0.75 1.00Angular deviation [10 5 rad]
0.00
0.05
0.10
0.15
0.20
0.25
0.30
Even
t Fra
ctio
n
= 50 eV= 100 eV= 200 eV= 400 eV
FIG. 4. The distributions of the transverse displacement and the angular deviation of the totalmomentum of the quirk-pair system at the first crossing point after the quirk pair travels acrossD2 between the cases when the influence of D1 and D2 are considered or not. mQ = 300 GeV.
V. FEATURES OF THE QUIRK SIGNAL
In this section, we discuss a few features of the quirk signals at the FASER detector whichcan be used to separate them from possible backgrounds as well as resolve the quirk modelparameters if a discovery can be made.
50 100 200 300 400 500 600 700m [GeV]
0.0
0.2
0.4
0.6
0.8
1.0
Rm
in [m
]
Transverse displacement ( ) = 100 eV
50 100 200 300 400 500 600 700 800 900 1000m [GeV]
0.0
0.2
0.4
0.6
0.8
1.0
Rm
in [m
]
Transverse displacement ( ) = 100 eV
100 300 500 700 900 1100 1300 1500m [GeV]
0.0
0.2
0.4
0.6
0.8
1.0
Rm
in [m
]
Transverse displacement ( ) = 100 eV
100 300 500 700 900 1100 1300 1500 1700 1900m [GeV]
0.0
0.2
0.4
0.6
0.8
1.0
Rm
in [m
]
Transverse displacement ( ) = 100 eV
50 100 200 300 400 500 600 700m [GeV]
0.0
0.2
0.4
0.6
0.8
1.0
Rm
in [m
]
Transverse displacement ( ) = 300 eV
50 100 200 300 400 500 600 700 800 900 1000m [GeV]
0.0
0.2
0.4
0.6
0.8
1.0
Rm
in [m
]
Transverse displacement ( ) = 300 eV
100 300 500 700 900 1100 1300 1500m [GeV]
0.0
0.2
0.4
0.6
0.8
1.0
Rm
in [m
]
Transverse displacement ( ) = 300 eV
100 300 500 700 900 1100 1300 1500 1700 1900m [GeV]
0.0
0.2
0.4
0.6
0.8
1.0
Rm
in [m
]
Transverse displacement ( ) = 300 eV
FIG. 8. The distributions of the minimal transverse displacement (RminQ ) for quirks with different
masses and fixed Λ. The width of the band indicates the event number in a bin of RminQ . Upper
panels: Λ = 100 eV; Lower panels: Λ = 300 eV.
As has been discussed in previous section, the position where the quirk enters the FASERis highly correlated with the quirk oscillation amplitude and also mildly depends on thequirk quantum numbers (because quirks with different quantum numbers have differentmomenta distributions in their productions). In Fig. 8, we present the distributions ofthe minimal transverse displacement (Rmin
Q ) for quirks with different masses and fixed Λ.Events with at least one quirk entering the FASER are counted. For event with both
15
Junle Pei The quirk signal at the FASER November 10, 2021 8 / 15
...
.
...
.
...
.
...
.
...
.
...
.
...
.
...
.
...
.
...
.
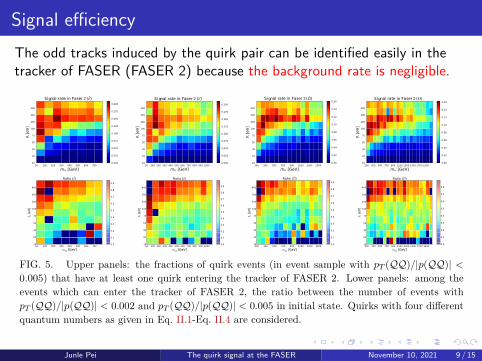
Signal efficiencyThe odd tracks induced by the quirk pair can be identified easily in thetracker of FASER (FASER 2) because the background rate is negligible.
B. Signal efficiency
Solving the EoM, we can test whether a quirk pair with given initial momenta could enterthe FASER detector. The odd tracks induced by the quirk pair can be identified easily inthe FASER because the background rate is negligible [26]. The quirk can enter the FASERfrom both the end-cap and the barrel, especially when its oscillation amplitude reaches thedetector size ∼ O(1) m (corresponds to Λ ≲ 100 eV).
50 100 200 300 400 500 600 700m [GeV]
10
20
30
50
75
100
200
300
400
[eV]
Signal rate in Faser ( )
0.000
0.025
0.050
0.075
0.100
0.125
0.150
0.175
0.200
50 100 200 300 400 500 600 700 800 900 1000m [GeV]
10
20
30
50
75
100
200
300
400
[eV]
( )
0.000
0.025
0.050
0.075
0.100
0.125
0.150
0.175
0.200
100 300 500 700 900 1100 1300 1500m [GeV]
10
20
30
50
75
100
200
300
400
[eV]
( )
0.00
0.02
0.04
0.06
0.08
0.10
0.12
0.14
0.16
100 300 500 700 900 1100 1300 1500 1700 1900m [GeV]
10
20
30
50
75
100
200
300
400
[eV]
( )
0.00
0.02
0.04
0.06
0.08
0.10
0.12
0.14
0.16
50 100 200 300 400 500 600 700
mQ [GeV]
10
20
30
50
75
100
200
300
400
Λ [
eV
]
Ratio (E)
0.0
0.1
0.2
0.3
0.4
0.5
0.6
0.7
0.8
0.9
50 100 200 300 400 500 600 700 800 900 1000
mQ [GeV]
10
20
30
50
75
100
200
300
400
Λ [
eV
]
Ratio (E)
0.0
0.1
0.2
0.3
0.4
0.5
0.6
0.7
0.8
0.9
100 300 500 700 900 1100 1300 1500
mQ [GeV]
10
20
30
50
75
100
200
300
400
Λ [
eV
]
Ratio (D)
0.0
0.1
0.2
0.3
0.4
0.5
0.6
0.7
0.8
0.9
100 300 500 700 900 1100 1300 1500 1700 1900
mQ [GeV]
10
20
30
50
75
100
200
300
400
Λ [
eV
]
Ratio (D)
0.0
0.1
0.2
0.3
0.4
0.5
0.6
0.7
0.8
FIG. 5. Upper panels: the fractions of quirk events (in event sample with pT (QQ)/|p(QQ)| <0.005) that have at least one quirk entering the tracker of FASER 2. Lower panels: among theevents which can enter the tracker of FASER 2, the ratio between the number of events withpT (QQ)/|p(QQ)| < 0.002 and pT (QQ)/|p(QQ)| < 0.005 in initial state. Quirks with four differentquantum numbers as given in Eq. II.1-Eq. II.4 are considered.
In the upper panels of FIG. 5, the fractions of quirk events (in the event sample whichsatisfies pT (QQ)/|p(QQ)| < 0.005) on the mQ−Λ plane that have at least one quirk enteringthe FASER detector (from either end-cap or the barrel) are shown. For quirk productionat the LHC, heavier quirk has lower velocity, thus suffers from stronger ionization force.For a heavy quirk-pair system with initial momentum pointing to the FASER detector, theionization force will continually change the moving direction and make the quirk pair systemfall outside the FASER eventually. So, the signal efficiency becomes lower for heavier quirk.
The dependence of the signal efficiencies on the confinement scale Λ is more interesting.In cases with |Fs| ≫ |Fion|, the characteristic oscillation amplitude of the quirk pair in thelab frame can be expressed as [50]
L =Rρℓc , (IV.14)
11
2 resaF ni etar langiS 2 resaF ni etar langiS 2 resaF ni etar langiS 2
Junle Pei The quirk signal at the FASER November 10, 2021 9 / 15
...
.
...
.
...
.
...
.
...
.
...
.
...
.
...
.
...
.
...
.
Dependence of the signal efficiency on quirk mass
For quirk production at the LHC, heavier quirk has lower velocity,thus suffers from stronger ionization force.For a heavy quirk-pair system with initial momentum pointing to thetracker of FASER 2, the ionization force will continually change themoving direction and make the quirk pair system fall outside theFASER 2 tracker eventually.The signal efficiency becomes lower for heavier quirk.
Junle Pei The quirk signal at the FASER November 10, 2021 10 / 15
...
.
...
.
...
.
...
.
...
.
...
.
...
.
...
.
...
.
...
.
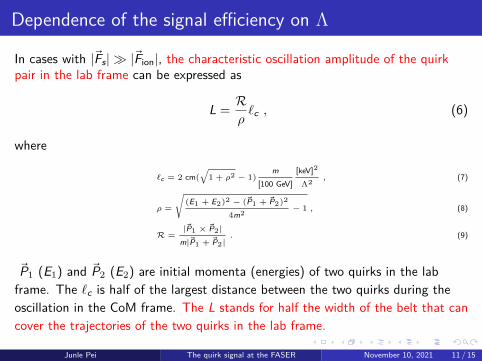
Dependence of the signal efficiency on Λ
In cases with |Fs| ≫ |Fion|, the characteristic oscillation amplitude of the quirkpair in the lab frame can be expressed as
L =Rρℓc , (6)
where
ℓc = 2 cm(
√1 + ρ2 − 1)
m[100 GeV]
[keV]2
Λ2, (7)
ρ =
√(E1 + E2)2 − (P1 + P2)2
4m2− 1 , (8)
R =|P1 × P2|
m|P1 + P2|. (9)
P1 (E1) and P2 (E2) are initial momenta (energies) of two quirks in the labframe. The ℓc is half of the largest distance between the two quirks during theoscillation in the CoM frame. The L stands for half the width of the belt that cancover the trajectories of the two quirks in the lab frame.
Junle Pei The quirk signal at the FASER November 10, 2021 11 / 15
...
.
...
.
...
.
...
.
...
.
...
.
...
.
...
.
...
.
...
.
Dependence of the signal efficiency on Λ
When the Λ is sizable such that the oscillation amplitude L ≪ O(1) m, onlythe quirk pairs satisfying pT(QQ)/|p(QQ)| < 0.002 can enter the FASER 2tracker.In the small Λ region where L ≳ O(10) m, many quirk events will bypass theFASER 2 detector even though the pT(QQ)/|p(QQ)| < 0.002 condition isfulfilled, leading to very low signal efficiency.The signal efficiency is highest in the moderate Λ region where L ∼ O(1) m.In this region, beside the events with pT(QQ)/|p(QQ)| < 0.002, others withpT(QQ)/|p(QQ)| ≳ 0.002 will also enter the FASER 2 tracker due to thesizable oscillation amplitudes.
Junle Pei The quirk signal at the FASER November 10, 2021 12 / 15
...
.
...
.
...
.
...
.
...
.
...
.
...
.
...
.
...
.
...
.
Sensitivity
The total number of quirk events in the FASER (FASER 2) can becalculated by
Nsig = σ × ϵfid × ϵ0.005 × L. (10)
σ is the quirk production cross section at the 13 TeV LHC.ϵfid corresponds to the efficiency of selecting events withpT(QQ)/|p(QQ)| < 0.005 in quirk pair production.ϵ0.005 is signal efficiency of events with pT(QQ)/|p(QQ)| < 0.005.The integrated luminosity L is taken as 150 (3000) fb−1 for FASER(FASER 2).
Junle Pei The quirk signal at the FASER November 10, 2021 13 / 15
...
.
...
.
...
.
...
.
...
.
...
.
...
.
...
.
...
.
...
.
Sensitivity
0 200 400 600 800 1000 1200m [GeV]
0
50
100
150
200
250
300
350
400
[eV]
Monojet, 12.9 fb
1
HSCP, 12.9 fb 1
Number of events at FASER(2) for
50 30 5 35 3
Monojet, 300 fb 1
HSCP, 300 fb 1
Co-planar, 300 fb 1
0 250 500 750 1000 1250 1500 1750 2000 2250m [GeV]
0
50
100
150
200
250
300
350
400
[eV]
Monojet, 12.9 fb
1
HSCP, 12.9 fb 1
Number of events at FASER(2) for
50 30 5 35 3
Monojet, 300 fb 1
HSCP, 300 fb 1
Co-planar, 300 fb 1
100 200 300 400 500 600 700m [GeV]
50
100
150
200
250
300
350
400
[eV]
Number of events at FASER(2) for
50 30 5 35 3
200 400 600 800 1000 1200 1400m [GeV]
50
100
150
200
250
300
350
400
[eV]
Number of events at FASER(2) for
50 30 5 3
5 3
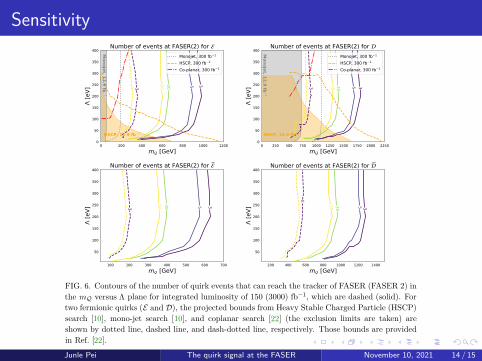
FIG. 6. Contours of the number of quirk events that can reach the tracker of FASER (FASER 2) inthe mQ versus Λ plane for integrated luminosity of 150 (3000) fb−1, which are dashed (solid). Fortwo fermionic quirks (E and D), the projected bounds from Heavy Stable Charged Particle (HSCP)search [10], mono-jet search [10], and coplanar search [22] (the exclusion limits are taken) areshown by dotted line, dashed line, and dash-dotted line, respectively. Those bounds are providedin Ref. [22].
detector. Moreover, the tracks of quirks have unique features (e.g. co-planarity, morefeatures will be discussed in next section), which can be used to distinguish them fromordinary tracks that are induced by the SM particles. Given negligible background, the 3events contours correspond to 2-σ exclusion limits and the 5 events contours correspond todiscovery prospects. As a result, we can conclude that the FASER will be able to excludethe E , D, E and D quirks with mass below 650 GeV, 1350 GeV, 380 GeV and 950 GeV,respectively, when Λ ≳ O(100) eV. The bounds on scalar quirks are much weaker than thoseon fermionic quirks when the gauge representations are the same because of their smallerproduction rates and lower signal efficiencies. For comparison, the projected bounds fromthe HSCP search, the mono-jet search, and the coplanar search as provided in Ref. [22] forfermionic quirks are shown as well. For Λ ≲ 50 eV, the HSCP search is most sensitive. Andthe FASER is much more sensitive than other searches when Λ ≳ O(100) eV, especially forthe color neutral E .
14
Junle Pei The quirk signal at the FASER November 10, 2021 14 / 15
...
.
...
.
...
.
...
.
...
.
...
.
...
.
...
.
...
.
...
.
Conclusion
The ionization effects in different materials are treated carefully whensolving the quirk EoM. The Gaussian distribution of the ionization energyloss for a charged quirk in the BB region is also taken into account.For an integrated luminosity of 3000 (150) fb−1, given negligiblebackground, the FASER 2 (FASER) will be able to exclude the E , D, E andD quirks with mass below 990 (360) GeV, 1800 (900) GeV, 630 (200) GeVand 1270 (580) GeV, respectively, when Λ ≳ O(150) eV. The FASER 2 ismuch more sensitive than other searches when Λ ≳ O(100) eV, especially forthe color neutral E .
Junle Pei The quirk signal at the FASER November 10, 2021 15 / 15
Top Related
Copyright © 2022 FDOKUMEN

