


Bahasa
Halaman
Hukum

sustainability
Article
The Impact of Socio-Economic Factors on SedimentLoad: A Case Study of the Yanhe River Watershed
Xue Zhong, Xiaohui Jiang *, Leilei Li, Jing Xu and Huanyu Xu
Shaanxi Key Laboratory of Earth Surface System and Environmental Carrying Capacity, Northwest University,Xi’an 710127, China; [email protected] (X.Z.); [email protected] (L.L.);[email protected] (J.X.); [email protected] (H.X.)* Correspondence: [email protected]
Received: 27 February 2020; Accepted: 13 March 2020; Published: 20 March 2020�����������������
Abstract: Under the influence of climate change and human activities, sediment load in rivers haschanged significantly, which has a profound impact on the stability of ecosystems and the sustainabledevelopment of human beings. Taking the Yanhe River watershed as a case, this paper expoundsthe dynamic relationship among the Grain for Green Project, social and economic development,population migration, and sediment transport. The variability of sediment load was detected byPettitt test, the double cumulative curve method, and the regression analysis method, and the effectsof climate and human activities on sediment load were quantitatively analyzed. The results showedthat 1) from 1956 to 2016, the precipitation of Yanhe River watershed rose slightly in the past 10years, but the sediment load decreased significantly; 1996 was identified as the catastrophic year ofthe study period, when the contribution of climate change and human activity to reduced sedimentload was 14.1% and 85.9%, respectively. 2) The Grain for Green Project increased the vegetationcoverage of the study area from 40.6% to 78.5%. 3) The proportion of agricultural GDP in total GDPdecreased from 52.26% to 7.3%, and the proportion of agricultural GDP was positively correlatedwith sediment transport and cultivated land area (p < 0.01). 4) Population migration resulted in theurbanization rate reaching 40.23%, and the urbanization rate is negatively correlated with sedimentload and cultivated land area (p < 0.01), while the cultivated land area is positively correlated withsediment load (p < 0.01). The decrease of cultivated land area makes the sediment load graduallydecrease. Therefore, socio-economic factors promote the sustainable development of the river basin.
Keywords: sediment load; economic development; population migration; Yanhe River watershed
1. Introduction
A watershed is a relatively independent and naturally formed ecosystem and also a significantplace for human habitation and socio-economic development [1]. In recent decades, the impact ofclimate change and human activities on the global ecological environment has become more and moreobvious. In particular, it has affected the spatial and temporal distribution of surface water resourcesand various factors in the water cycle (runoff and sediment load), which has led to the worldwideconcern. About 50% of the world’s rivers show a significant decline in river sediment load [2–6],affecting the structure, processes, and functions of societies and ecosystems [7–9]. The decrease ofsediment load is due to the change of underlying surface caused by human activities, which leadsto significant changes in sediment production mechanisms and sediment transport processes [10].Human activities are restricted by policies and socio-economic factors. Therefore, understanding andbalancing the relationship between policies, socio-economic factors, and sediment load is critical to thesustainable management of the basin.
Sustainability 2020, 12, 2457; doi:10.3390/su12062457 www.mdpi.com/journal/sustainability
Sustainability 2020, 12, 2457 2 of 18
River sediment transport is one of the major problems facing many countries [11–13]. Sedimentdeposition in excess supply will lead to bed aggradation, so as to raise the flood water level [14,15].In rivers, reduced sediment load can improve water quality, aquatic habitats and reduce floodingissues [16,17]. However, reduced sediment loads may also cause problems, such as channel erosion anderosion of the delta coastline when the critical shear stress threshold is exceeded and reduced nutrientinputs to aquatic and riparian ecosystems [18,19]. Therefore, the decrease of sediment discharge andits influence on river and ocean system has become a global issue [20–23].
The Yellow River is commonly held to be the birthplace of Chinese civilization, and the Yellow Riveris one of the rivers with the highest sand content in the world. In recent decades, in order to effectivelycontrol soil erosion and restore ecosystems, the government has adopted various water-saving measuresand policies—such as building silt dams [24,25], reservoirs [26], and terraces [21]—and other ecologicalmeasures and the policy of returning farmland to forests [27,28]. These measures have altered theprocess of sediment supply in natural watersheds and the geomorphology of rivers, thereby affectingthe connectivity of runoff, soil erosion, water, and sediment transport and drastically reducing sedimentload in the Yellow River watershed [29]. The amount of sediment transported by the Yellow Riverhas been restored to almost 600 Anno Domini before human activity [30,31]. Clarifying the impact ofvarious measures on the amount of sediment load is of great significance for future soil and waterconservation work [32]. Hu et al. [33] found that human activities accounted for an average of 47% and81% of the changes in runoff and sediment load, and the rest were due to climate change. Li et al. [34]found that silt dams have an important role in controlling sediment transport during heavy rains byusing a multivariate mixed model and watershed comparative analysis. Yang et al. [35] selected eightbasins on the Loess Plateau and found that the increase in vegetation coverage since 1996 has been themain factor for sediment reduction, accounting for 47.7% of total sediment reduction. Climate changeand terrace construction account for 9.1% and 18.6% of sediment emissions, respectively. However,current studies mainly focus on water and sediment changes, water and soil conservation, and rarelytake socio-economic factors as a starting point to explore their impact on sediment transport.
Different from natural factors (temperature and precipitation), socio-economic factors mainlychange natural conditions by controlling human activities and have an impact on sediment load.Increased rural population may exacerbate soil erosion, which may affect sediment load [36]. The policyof returning farmland to forest, rapid economic development and industrial structure adjustment haveprofoundly changed the land use types in the basin [37,38], effectively controlled soil erosion, reducedsoil erosion and improved ecological environment [39]. In this paper, Yanhe River watershed is selectedas an example. Based on the meteorological data, runoff and sediment data and socio-economicdata from the Yanhe River watershed are used to explore the relationship between the policy ofreturning farmland to forest, social and economic factors and sediment load, so as to clarify therelationship between social development and sediment load and promote the sustainable developmentof the watershed.
2. Data and Methods
2.1. Study Area
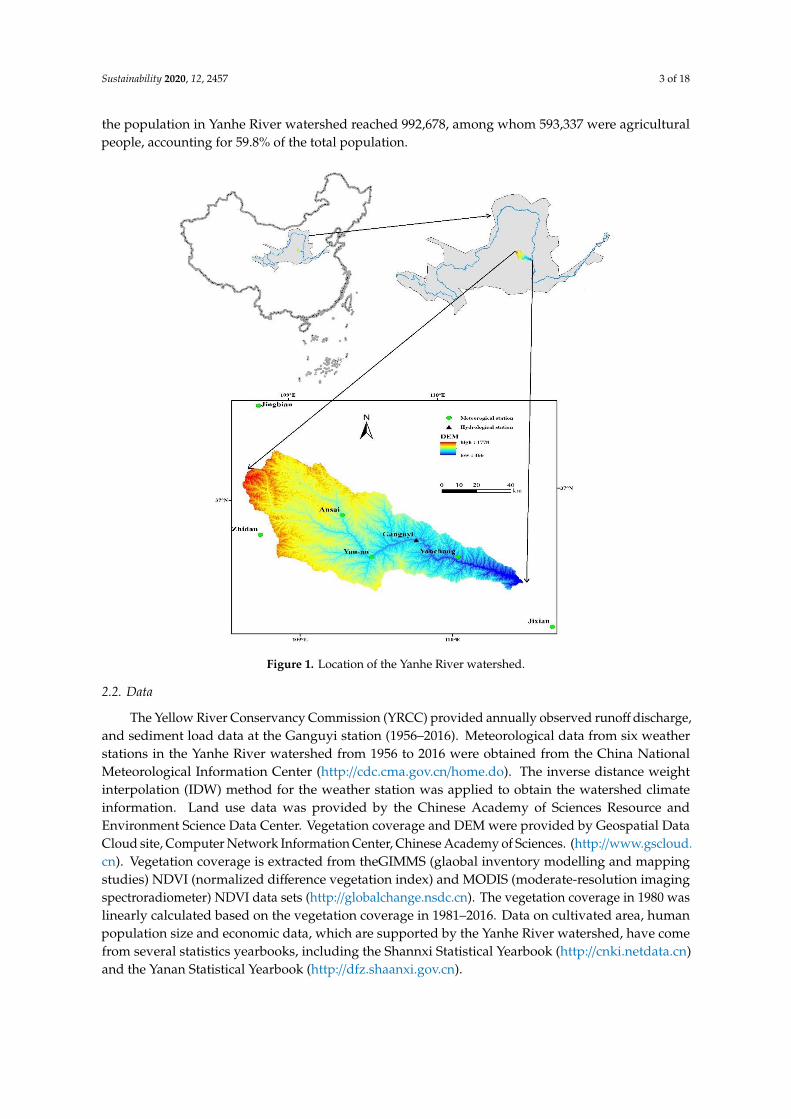
This paper presents a socio-hydrologic analysis centered on the Yanhe River watershed, which islocated in the middle of the Loess Plateau (Figure 1). The Yanhe River watershed is one of the mainsources of sediment in the Yellow River, with an area of 7725 km2, most of which is covered by loesshilly-gully areas with serious soil erosion. It experiences a semi-arid continental climate with thecatchment-wide average annual precipitation is 520 mm, of which the majority occurs in the summermonths of June–September. Since the implementation of the policy of the Grain for Green in 1997,the ecological environment of the Yanhe River watershed has been greatly improved. The averageannual runoff is 1.82 × 10⁸ m3, and the average annual sediment transport is 26.2 million tons. By 2016,
Sustainability 2020, 12, 2457 3 of 18
the population in Yanhe River watershed reached 992,678, among whom 593,337 were agriculturalpeople, accounting for 59.8% of the total population.
Figure 1. Location of the Yanhe River watershed.
2.2. Data
The Yellow River Conservancy Commission (YRCC) provided annually observed runoff discharge,and sediment load data at the Ganguyi station (1956–2016). Meteorological data from six weatherstations in the Yanhe River watershed from 1956 to 2016 were obtained from the China NationalMeteorological Information Center (http://cdc.cma.gov.cn/home.do). The inverse distance weightinterpolation (IDW) method for the weather station was applied to obtain the watershed climateinformation. Land use data was provided by the Chinese Academy of Sciences Resource andEnvironment Science Data Center. Vegetation coverage and DEM were provided by Geospatial DataCloud site, Computer Network Information Center, Chinese Academy of Sciences. (http://www.gscloud.cn). Vegetation coverage is extracted from theGIMMS (glaobal inventory modelling and mappingstudies) NDVI (normalized difference vegetation index) and MODIS (moderate-resolution imagingspectroradiometer) NDVI data sets (http://globalchange.nsdc.cn). The vegetation coverage in 1980 waslinearly calculated based on the vegetation coverage in 1981–2016. Data on cultivated area, humanpopulation size and economic data, which are supported by the Yanhe River watershed, have comefrom several statistics yearbooks, including the Shannxi Statistical Yearbook (http://cnki.netdata.cn)and the Yanan Statistical Yearbook (http://dfz.shaanxi.gov.cn).
Sustainability 2020, 12, 2457 4 of 18
2.3. Method
2.3.1. Change-Point Analysis
Identifying change points is one of the important analysis methods to study the impact of climatechange and human activities on runoff and sediment. This study uses the non-parametric methodproposed by Pettitt (1979) [40], which is widely used in the detection of mutation points in hydrologicaland climate records. This method detects a significant change in the mean of a time series when theexact time of the change is unknown [41].The test uses a version of the Mann–Whitney statistic Ut,N,which verifies whether two samples x1, . . . , xt and xt + 1, . . . , xN are from the same population.The test statistic Ut,N is expressed by
Ut,N = Ut−1,N +∑N
j=1sgn(xt − x j)(t = 2, . . . , N) (1)
where sgn(xi − xj) = 1if(xi − xj) > 0sgn(xi − xj) = 0if(xi − xj) = 0sgn(xi − xj) = −1if(xi − xj) < 0
(2)
The test statistic counts the number of times a member of the first sample exceeds that of thesecond. The null hypothesis of Pettitt’s test is the absence of a changing point. Its statistic k(t) and theassociated probabilities used in significance testing are expressed as (Pettitt, 1979) [40]
k(t) = Max1 ≤ t ≤ N|Ut,N|, (3)
andP � 2exp
{−6
[k(t)2
]/(N3 + N2
)}(4)
If P < 0.05, a significant change point exists. Therefore, the time series was divided into two partsat the location of the change point.
2.3.2. Climate Change and Human Impact Identification Methods
The double cumulative curve is a method widely used to study the consistency and long-termtrends of hydrometeorological time series and is used to quantitatively evaluate the impact of climatechange or human activities on runoff and sediment [42]. If the proportional relationship betweenthe two cumulants remains the same during the same period, the double accumulation curve isrepresented by a straight line [43]. The abrupt change in the slope of the curve may be caused by soiland water conservation measures, vegetation restoration or destruction, and climate change [44]. Inthis paper, the mutation point is determined by the Pettitt test [40], the period before the mutation pointis determined as the reference period, and the period after the mutation point is the research period.The relationship curve between rainfall and sediment in two periods was established, and a linearregression equation was established according to the base period, thereby reconstructing the annualsediment load not affected by human activities during the study period [45]. The following equationscan be used to calculate the contribution of climate change and human activities to sediment load:
∆Stotal = Sao − Spo (5)
∆Shum = Sao − Sac (6)
∆Scli = ∆Stotal − ∆Shum (7)
µcli =∆Scli
∆Stotal× 100% (8)
Sustainability 2020, 12, 2457 5 of 18
µhum =∆Shum
∆Stotal× 100% (9)
where ∆Stotal is the total change of annual average sediment transport volume (tons), Spo and Sao arethe average annual sediment transport volume during the reference period and the research period(tons), respectively, and Sac is the average annual sediment transport volume calculated during theresearch period (tons). ∆Scli and ∆Shum are changes in annual average sediment volume caused byclimate change and human activities(tons). µcli and µhum are the contribution rate of climate changeand human activities to sediment change [46].
3. Results
3.1. Changes in Runoff, Sediment Load, and Precipitation
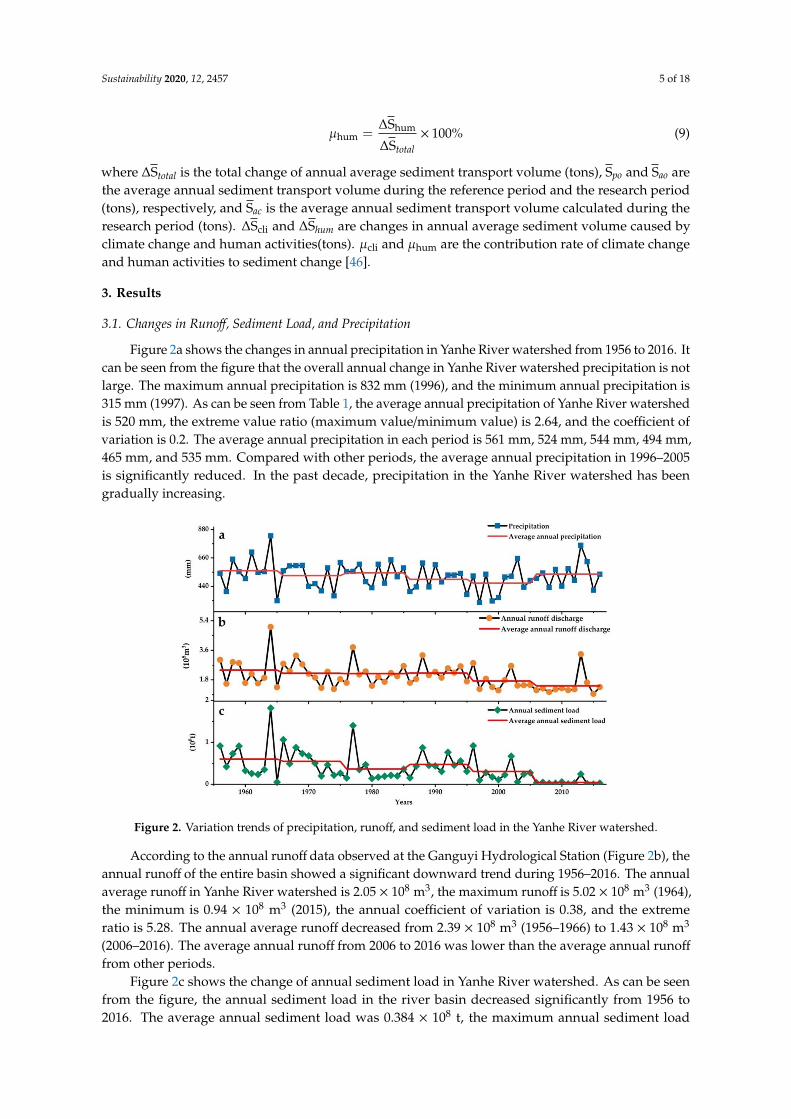
Figure 2a shows the changes in annual precipitation in Yanhe River watershed from 1956 to 2016. Itcan be seen from the figure that the overall annual change in Yanhe River watershed precipitation is notlarge. The maximum annual precipitation is 832 mm (1996), and the minimum annual precipitation is315 mm (1997). As can be seen from Table 1, the average annual precipitation of Yanhe River watershedis 520 mm, the extreme value ratio (maximum value/minimum value) is 2.64, and the coefficient ofvariation is 0.2. The average annual precipitation in each period is 561 mm, 524 mm, 544 mm, 494 mm,465 mm, and 535 mm. Compared with other periods, the average annual precipitation in 1996–2005is significantly reduced. In the past decade, precipitation in the Yanhe River watershed has beengradually increasing.
Figure 2. Variation trends of precipitation, runoff, and sediment load in the Yanhe River watershed.
According to the annual runoff data observed at the Ganguyi Hydrological Station (Figure 2b), theannual runoff of the entire basin showed a significant downward trend during 1956–2016. The annualaverage runoff in Yanhe River watershed is 2.05 × 10⁸ m3, the maximum runoff is 5.02 × 10⁸ m3 (1964),the minimum is 0.94 × 10⁸ m3 (2015), the annual coefficient of variation is 0.38, and the extremeratio is 5.28. The annual average runoff decreased from 2.39 × 10⁸ m3 (1956–1966) to 1.43 × 10⁸ m3
(2006–2016). The average annual runoff from 2006 to 2016 was lower than the average annual runoff
from other periods.Figure 2c shows the change of annual sediment load in Yanhe River watershed. As can be seen
from the figure, the annual sediment load in the river basin decreased significantly from 1956 to2016. The average annual sediment load was 0.384 × 10⁸ t, the maximum annual sediment load
Sustainability 2020, 12, 2457 6 of 18
was 1.818 × 10⁸ t (1964), and the minimum value was 0.005 × 10⁸ t (2015), the overall change wasbasically consistent with the runoff trend. However, the average annual sediment load from 1976to 1985 decreased significantly to 0.37 × 10⁸ t, and the average annual sediment load from 2006 to2016 decreased to 0.05 × 10⁸ t. The coefficient of variation of annual sediment load is 0.93, and theextreme ratio is as high as 363.6. Comparing precipitation and runoff, the trend of sediment load ismore obvious.
Table 1. The mean of precipitation, runoff, and sediment in the Yanhe River watershed.
YearsPrecipitation (mm) Runoff (108m3) Sediment (108t)
Mean Cv K Mean Cv K Mean Cv K
1956–1965 561 0.24 2.53 2.39 0.44 3.72 0.6 0.82 36.41966–1975 524 0.17 1.54 2.19 0.28 2.65 0.55 0.48 5.31976–1985 544 0.31 1.5 2.18 0.29 2.63 0.37 0.99 101986–1995 494 0.37 1.65 2.21 0.22 2.04 0.47 0.42 5.81996–2005 465 0.42 2.08 1.72 0.32 2.43 0.31 0.85 15.32006–2016 535 0.18 1.54 1.43 0.44 3.52 0.05 1.26 241956–2016 520 0.2 2.64 2.05 0.38 5.28 0.384 0.93 363.6
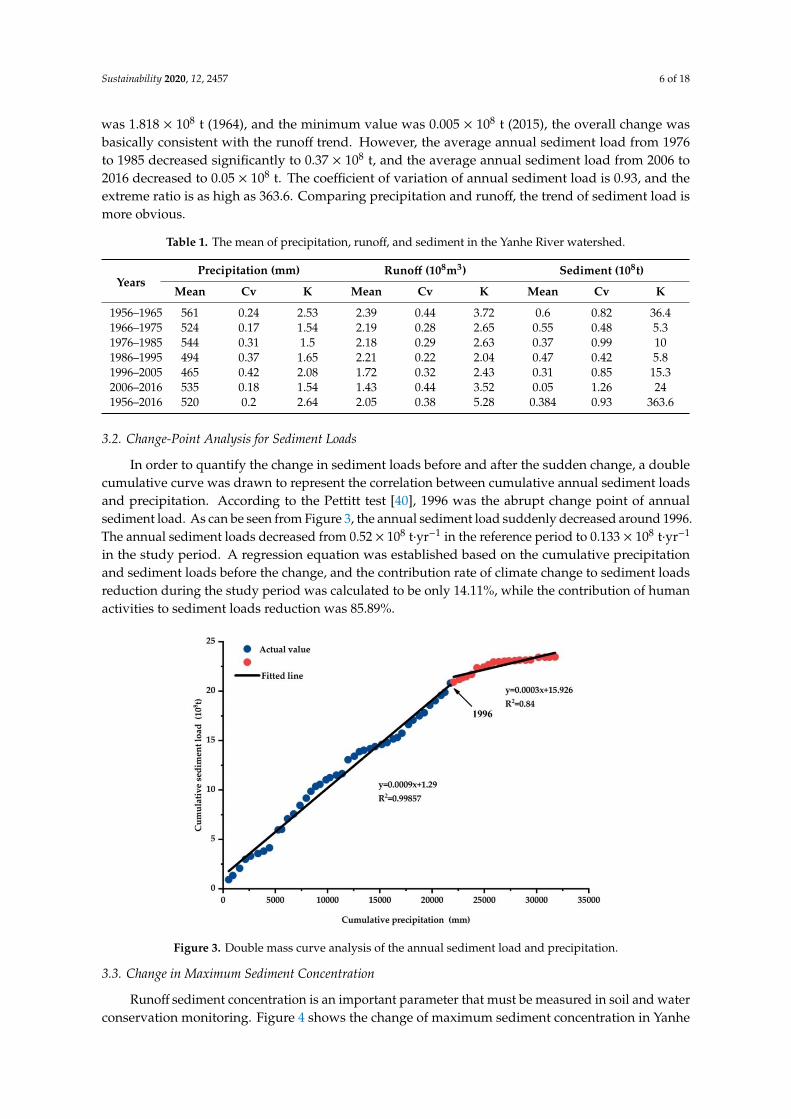
3.2. Change-Point Analysis for Sediment Loads
In order to quantify the change in sediment loads before and after the sudden change, a doublecumulative curve was drawn to represent the correlation between cumulative annual sediment loadsand precipitation. According to the Pettitt test [40], 1996 was the abrupt change point of annualsediment load. As can be seen from Figure 3, the annual sediment load suddenly decreased around 1996.The annual sediment loads decreased from 0.52 × 10⁸ t·yr−1 in the reference period to 0.133 × 10⁸ t·yr−1
in the study period. A regression equation was established based on the cumulative precipitationand sediment loads before the change, and the contribution rate of climate change to sediment loadsreduction during the study period was calculated to be only 14.11%, while the contribution of humanactivities to sediment loads reduction was 85.89%.
Figure 3. Double mass curve analysis of the annual sediment load and precipitation.
3.3. Change in Maximum Sediment Concentration
Runoff sediment concentration is an important parameter that must be measured in soil and waterconservation monitoring. Figure 4 shows the change of maximum sediment concentration in Yanhe
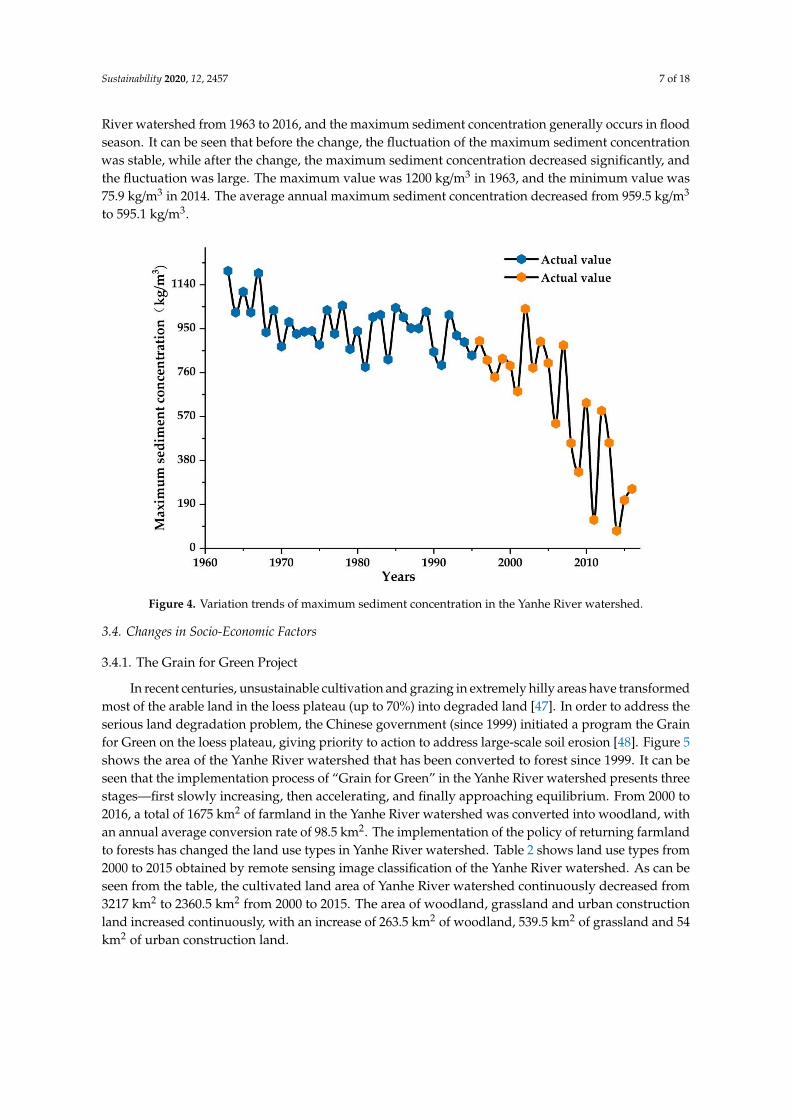
Sustainability 2020, 12, 2457 7 of 18
River watershed from 1963 to 2016, and the maximum sediment concentration generally occurs in floodseason. It can be seen that before the change, the fluctuation of the maximum sediment concentrationwas stable, while after the change, the maximum sediment concentration decreased significantly, andthe fluctuation was large. The maximum value was 1200 kg/m3 in 1963, and the minimum value was75.9 kg/m3 in 2014. The average annual maximum sediment concentration decreased from 959.5 kg/m3
to 595.1 kg/m3.
Figure 4. Variation trends of maximum sediment concentration in the Yanhe River watershed.
3.4. Changes in Socio-Economic Factors
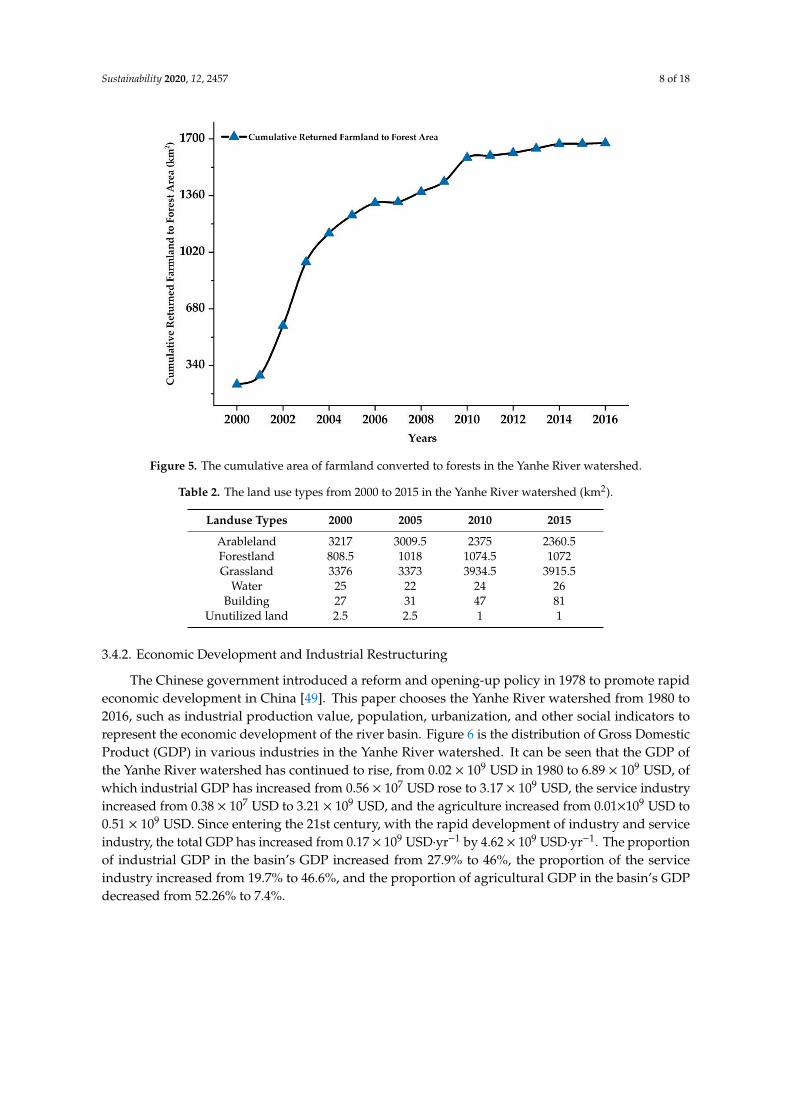
3.4.1. The Grain for Green Project
In recent centuries, unsustainable cultivation and grazing in extremely hilly areas have transformedmost of the arable land in the loess plateau (up to 70%) into degraded land [47]. In order to address theserious land degradation problem, the Chinese government (since 1999) initiated a program the Grainfor Green on the loess plateau, giving priority to action to address large-scale soil erosion [48]. Figure 5shows the area of the Yanhe River watershed that has been converted to forest since 1999. It can beseen that the implementation process of “Grain for Green” in the Yanhe River watershed presents threestages—first slowly increasing, then accelerating, and finally approaching equilibrium. From 2000 to2016, a total of 1675 km2 of farmland in the Yanhe River watershed was converted into woodland, withan annual average conversion rate of 98.5 km2. The implementation of the policy of returning farmlandto forests has changed the land use types in Yanhe River watershed. Table 2 shows land use types from2000 to 2015 obtained by remote sensing image classification of the Yanhe River watershed. As can beseen from the table, the cultivated land area of Yanhe River watershed continuously decreased from3217 km2 to 2360.5 km2 from 2000 to 2015. The area of woodland, grassland and urban constructionland increased continuously, with an increase of 263.5 km2 of woodland, 539.5 km2 of grassland and 54km2 of urban construction land.
Sustainability 2020, 12, 2457 8 of 18
Figure 5. The cumulative area of farmland converted to forests in the Yanhe River watershed.
Table 2. The land use types from 2000 to 2015 in the Yanhe River watershed (km2).
Landuse Types 2000 2005 2010 2015
Arableland 3217 3009.5 2375 2360.5Forestland 808.5 1018 1074.5 1072Grassland 3376 3373 3934.5 3915.5
Water 25 22 24 26Building 27 31 47 81
Unutilized land 2.5 2.5 1 1
3.4.2. Economic Development and Industrial Restructuring
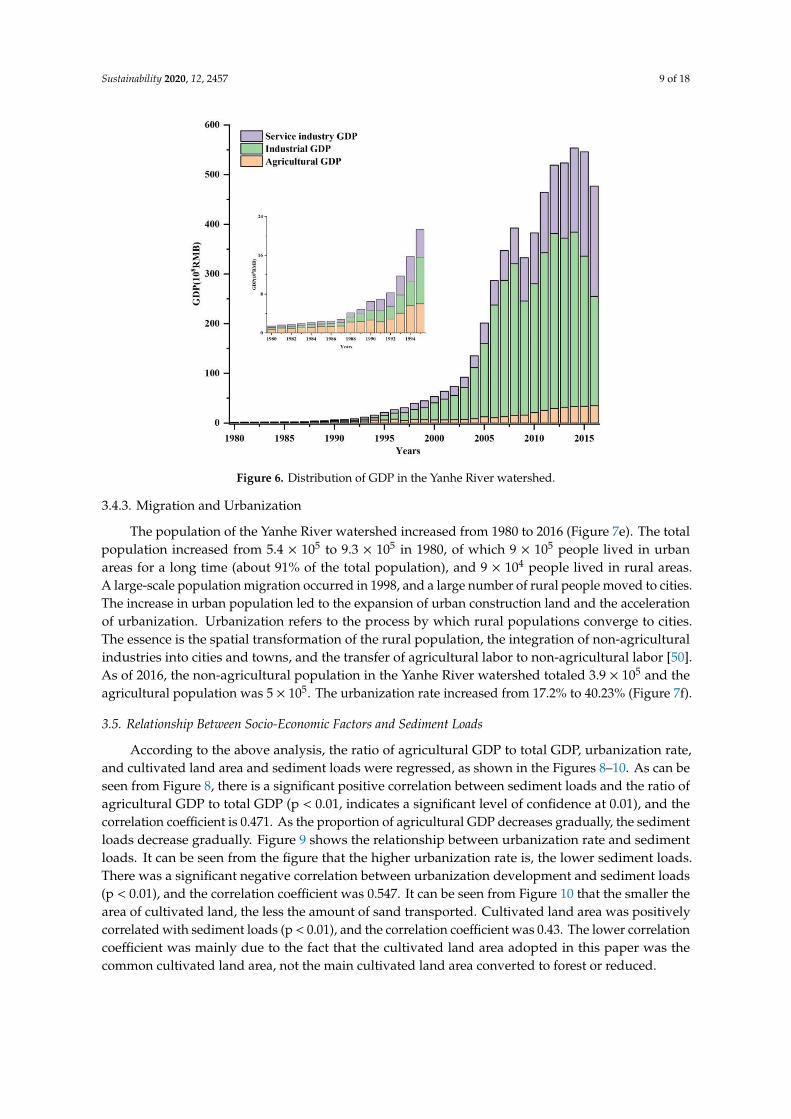
The Chinese government introduced a reform and opening-up policy in 1978 to promote rapideconomic development in China [49]. This paper chooses the Yanhe River watershed from 1980 to2016, such as industrial production value, population, urbanization, and other social indicators torepresent the economic development of the river basin. Figure 6 is the distribution of Gross DomesticProduct (GDP) in various industries in the Yanhe River watershed. It can be seen that the GDP ofthe Yanhe River watershed has continued to rise, from 0.02 × 10⁹ USD in 1980 to 6.89 × 10⁹ USD, ofwhich industrial GDP has increased from 0.56 × 10⁷ USD rose to 3.17 × 10⁹ USD, the service industryincreased from 0.38 × 10⁷ USD to 3.21 × 10⁹ USD, and the agriculture increased from 0.01×10⁹ USD to0.51 × 109 USD. Since entering the 21st century, with the rapid development of industry and serviceindustry, the total GDP has increased from 0.17 × 10⁹ USD·yr−1 by 4.62 × 109 USD·yr−1. The proportionof industrial GDP in the basin’s GDP increased from 27.9% to 46%, the proportion of the serviceindustry increased from 19.7% to 46.6%, and the proportion of agricultural GDP in the basin’s GDPdecreased from 52.26% to 7.4%.
Sustainability 2020, 12, 2457 9 of 18
Figure 6. Distribution of GDP in the Yanhe River watershed.
3.4.3. Migration and Urbanization
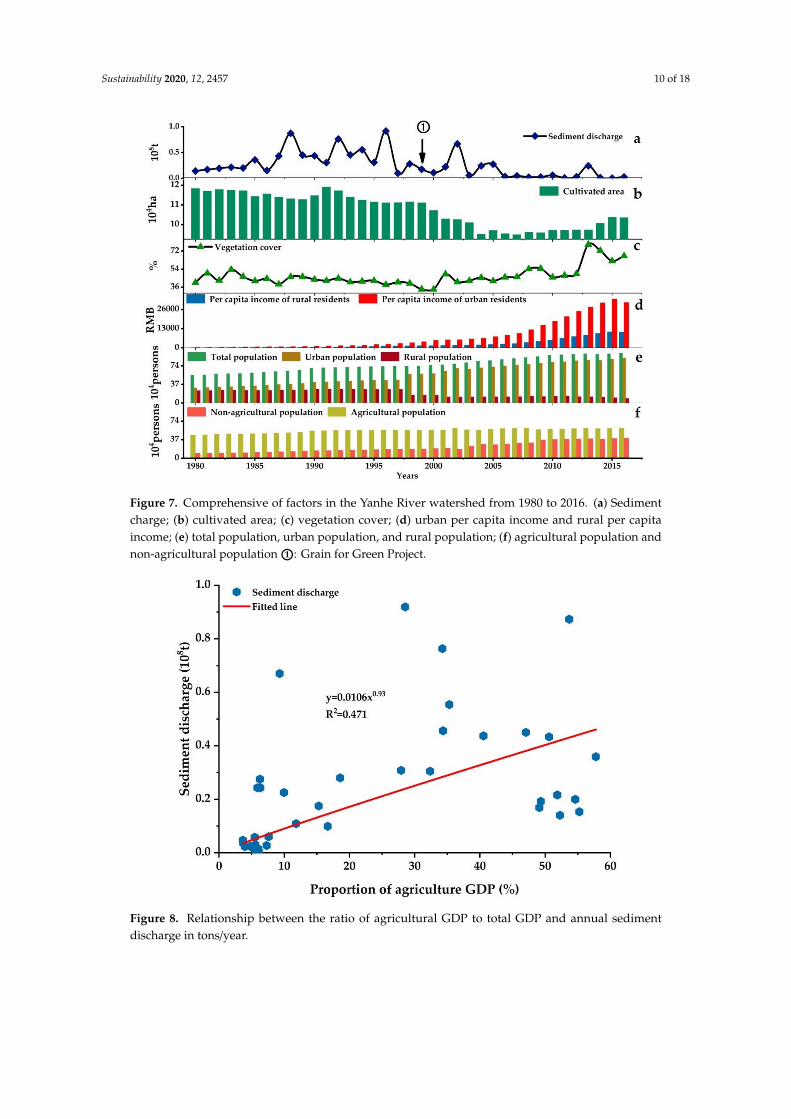
The population of the Yanhe River watershed increased from 1980 to 2016 (Figure 7e). The totalpopulation increased from 5.4 × 10⁵ to 9.3 × 10⁵ in 1980, of which 9 × 10⁵ people lived in urbanareas for a long time (about 91% of the total population), and 9 × 10⁴ people lived in rural areas.A large-scale population migration occurred in 1998, and a large number of rural people moved to cities.The increase in urban population led to the expansion of urban construction land and the accelerationof urbanization. Urbanization refers to the process by which rural populations converge to cities.The essence is the spatial transformation of the rural population, the integration of non-agriculturalindustries into cities and towns, and the transfer of agricultural labor to non-agricultural labor [50].As of 2016, the non-agricultural population in the Yanhe River watershed totaled 3.9 × 10⁵ and theagricultural population was 5 × 10⁵. The urbanization rate increased from 17.2% to 40.23% (Figure 7f).
3.5. Relationship Between Socio-Economic Factors and Sediment Loads
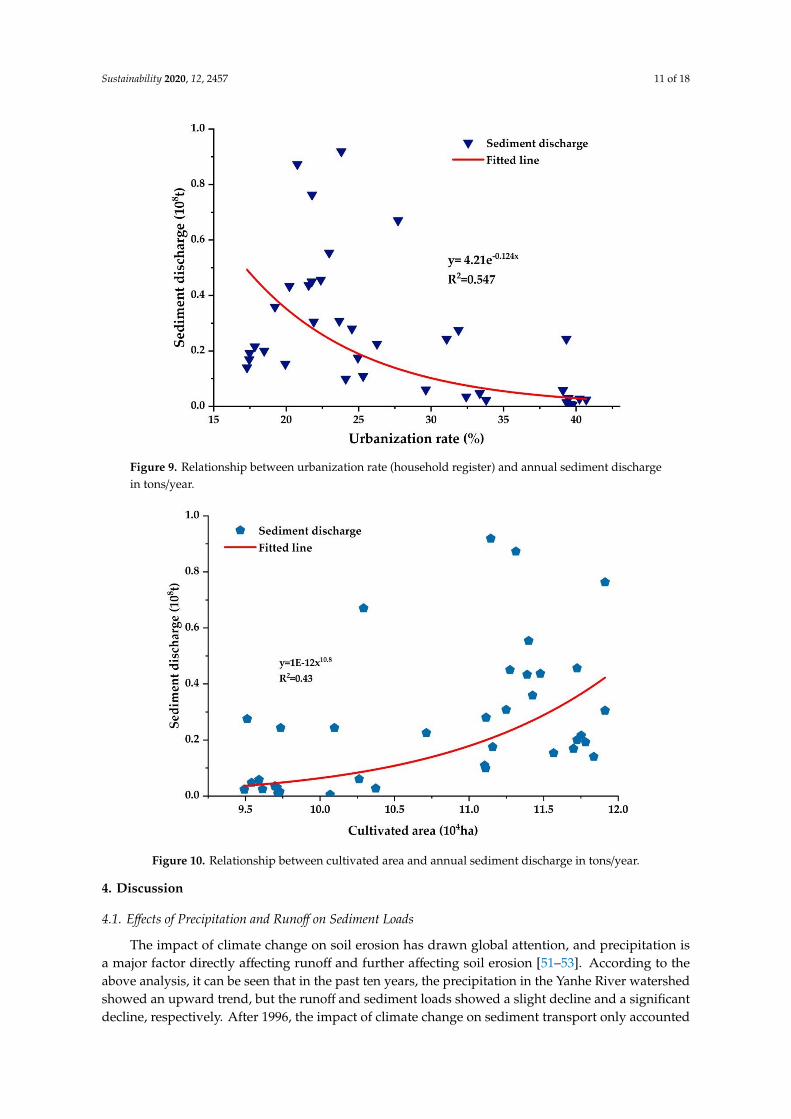
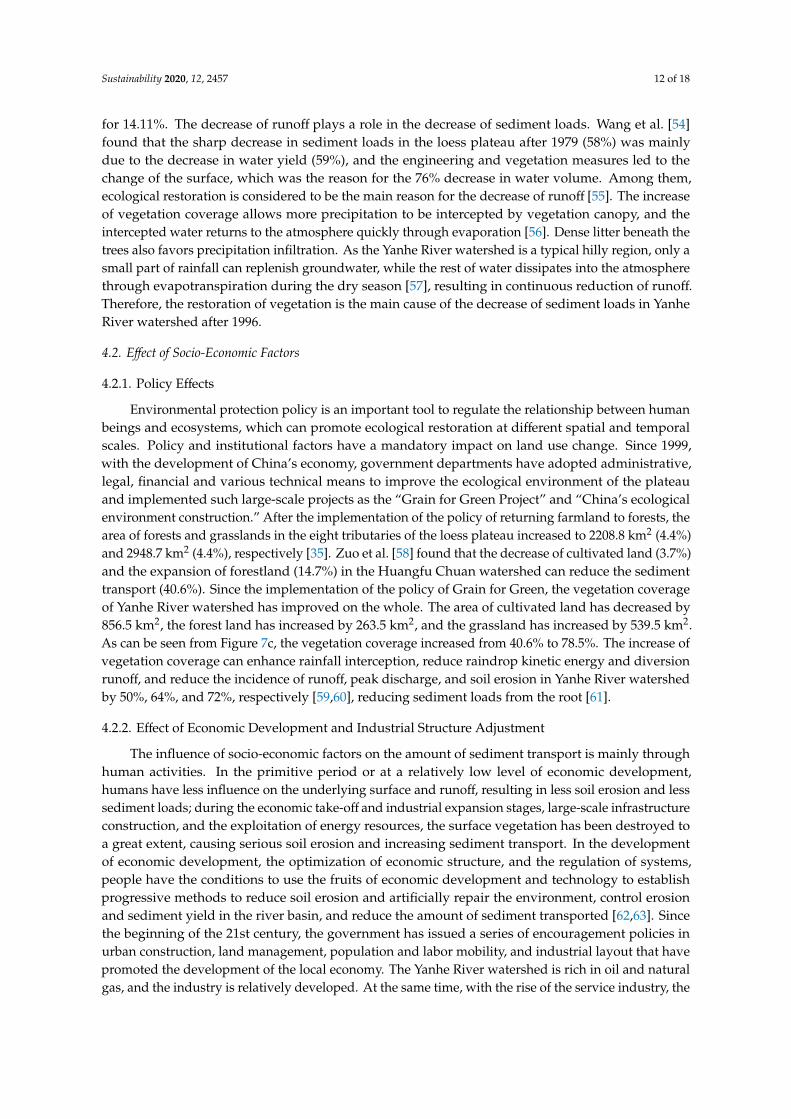
According to the above analysis, the ratio of agricultural GDP to total GDP, urbanization rate,and cultivated land area and sediment loads were regressed, as shown in the Figures 8–10. As can beseen from Figure 8, there is a significant positive correlation between sediment loads and the ratio ofagricultural GDP to total GDP (p < 0.01, indicates a significant level of confidence at 0.01), and thecorrelation coefficient is 0.471. As the proportion of agricultural GDP decreases gradually, the sedimentloads decrease gradually. Figure 9 shows the relationship between urbanization rate and sedimentloads. It can be seen from the figure that the higher urbanization rate is, the lower sediment loads.There was a significant negative correlation between urbanization development and sediment loads(p < 0.01), and the correlation coefficient was 0.547. It can be seen from Figure 10 that the smaller thearea of cultivated land, the less the amount of sand transported. Cultivated land area was positivelycorrelated with sediment loads (p < 0.01), and the correlation coefficient was 0.43. The lower correlationcoefficient was mainly due to the fact that the cultivated land area adopted in this paper was thecommon cultivated land area, not the main cultivated land area converted to forest or reduced.
Sustainability 2020, 12, 2457 10 of 18
Figure 7. Comprehensive of factors in the Yanhe River watershed from 1980 to 2016. (a) Sedimentcharge; (b) cultivated area; (c) vegetation cover; (d) urban per capita income and rural per capitaincome; (e) total population, urban population, and rural population; (f) agricultural population andnon-agricultural population 1O: Grain for Green Project.
Figure 8. Relationship between the ratio of agricultural GDP to total GDP and annual sedimentdischarge in tons/year.
Sustainability 2020, 12, 2457 11 of 18
Figure 9. Relationship between urbanization rate (household register) and annual sediment dischargein tons/year.
Figure 10. Relationship between cultivated area and annual sediment discharge in tons/year.
4. Discussion
4.1. Effects of Precipitation and Runoff on Sediment Loads
The impact of climate change on soil erosion has drawn global attention, and precipitation isa major factor directly affecting runoff and further affecting soil erosion [51–53]. According to theabove analysis, it can be seen that in the past ten years, the precipitation in the Yanhe River watershedshowed an upward trend, but the runoff and sediment loads showed a slight decline and a significantdecline, respectively. After 1996, the impact of climate change on sediment transport only accounted
Sustainability 2020, 12, 2457 12 of 18
for 14.11%. The decrease of runoff plays a role in the decrease of sediment loads. Wang et al. [54]found that the sharp decrease in sediment loads in the loess plateau after 1979 (58%) was mainlydue to the decrease in water yield (59%), and the engineering and vegetation measures led to thechange of the surface, which was the reason for the 76% decrease in water volume. Among them,ecological restoration is considered to be the main reason for the decrease of runoff [55]. The increaseof vegetation coverage allows more precipitation to be intercepted by vegetation canopy, and theintercepted water returns to the atmosphere quickly through evaporation [56]. Dense litter beneath thetrees also favors precipitation infiltration. As the Yanhe River watershed is a typical hilly region, only asmall part of rainfall can replenish groundwater, while the rest of water dissipates into the atmospherethrough evapotranspiration during the dry season [57], resulting in continuous reduction of runoff.Therefore, the restoration of vegetation is the main cause of the decrease of sediment loads in YanheRiver watershed after 1996.
4.2. Effect of Socio-Economic Factors
4.2.1. Policy Effects
Environmental protection policy is an important tool to regulate the relationship between humanbeings and ecosystems, which can promote ecological restoration at different spatial and temporalscales. Policy and institutional factors have a mandatory impact on land use change. Since 1999,with the development of China’s economy, government departments have adopted administrative,legal, financial and various technical means to improve the ecological environment of the plateauand implemented such large-scale projects as the “Grain for Green Project” and “China’s ecologicalenvironment construction.” After the implementation of the policy of returning farmland to forests, thearea of forests and grasslands in the eight tributaries of the loess plateau increased to 2208.8 km2 (4.4%)and 2948.7 km2 (4.4%), respectively [35]. Zuo et al. [58] found that the decrease of cultivated land (3.7%)and the expansion of forestland (14.7%) in the Huangfu Chuan watershed can reduce the sedimenttransport (40.6%). Since the implementation of the policy of Grain for Green, the vegetation coverageof Yanhe River watershed has improved on the whole. The area of cultivated land has decreased by856.5 km2, the forest land has increased by 263.5 km2, and the grassland has increased by 539.5 km2.As can be seen from Figure 7c, the vegetation coverage increased from 40.6% to 78.5%. The increase ofvegetation coverage can enhance rainfall interception, reduce raindrop kinetic energy and diversionrunoff, and reduce the incidence of runoff, peak discharge, and soil erosion in Yanhe River watershedby 50%, 64%, and 72%, respectively [59,60], reducing sediment loads from the root [61].
4.2.2. Effect of Economic Development and Industrial Structure Adjustment
The influence of socio-economic factors on the amount of sediment transport is mainly throughhuman activities. In the primitive period or at a relatively low level of economic development,humans have less influence on the underlying surface and runoff, resulting in less soil erosion and lesssediment loads; during the economic take-off and industrial expansion stages, large-scale infrastructureconstruction, and the exploitation of energy resources, the surface vegetation has been destroyed toa great extent, causing serious soil erosion and increasing sediment transport. In the developmentof economic development, the optimization of economic structure, and the regulation of systems,people have the conditions to use the fruits of economic development and technology to establishprogressive methods to reduce soil erosion and artificially repair the environment, control erosionand sediment yield in the river basin, and reduce the amount of sediment transported [62,63]. Sincethe beginning of the 21st century, the government has issued a series of encouragement policies inurban construction, land management, population and labor mobility, and industrial layout that havepromoted the development of the local economy. The Yanhe River watershed is rich in oil and naturalgas, and the industry is relatively developed. At the same time, with the rise of the service industry, the
Sustainability 2020, 12, 2457 13 of 18
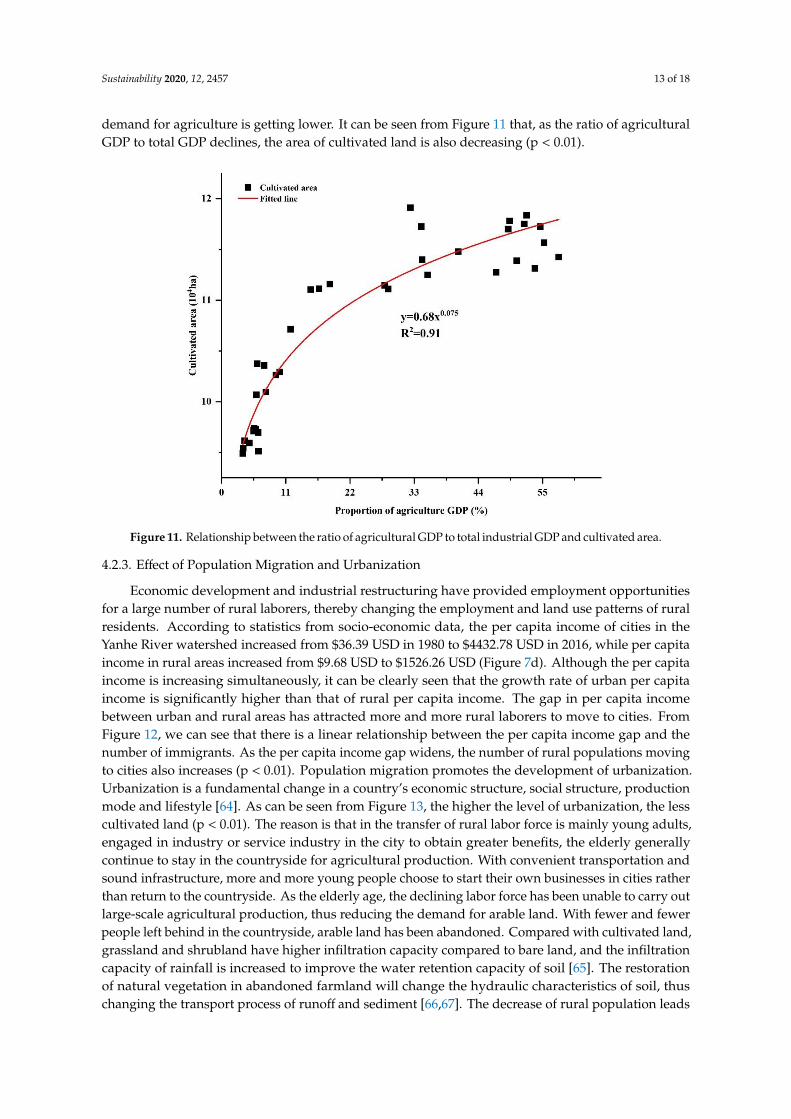
demand for agriculture is getting lower. It can be seen from Figure 11 that, as the ratio of agriculturalGDP to total GDP declines, the area of cultivated land is also decreasing (p < 0.01).
Figure 11. Relationship between the ratio of agricultural GDP to total industrial GDP and cultivated area.
4.2.3. Effect of Population Migration and Urbanization
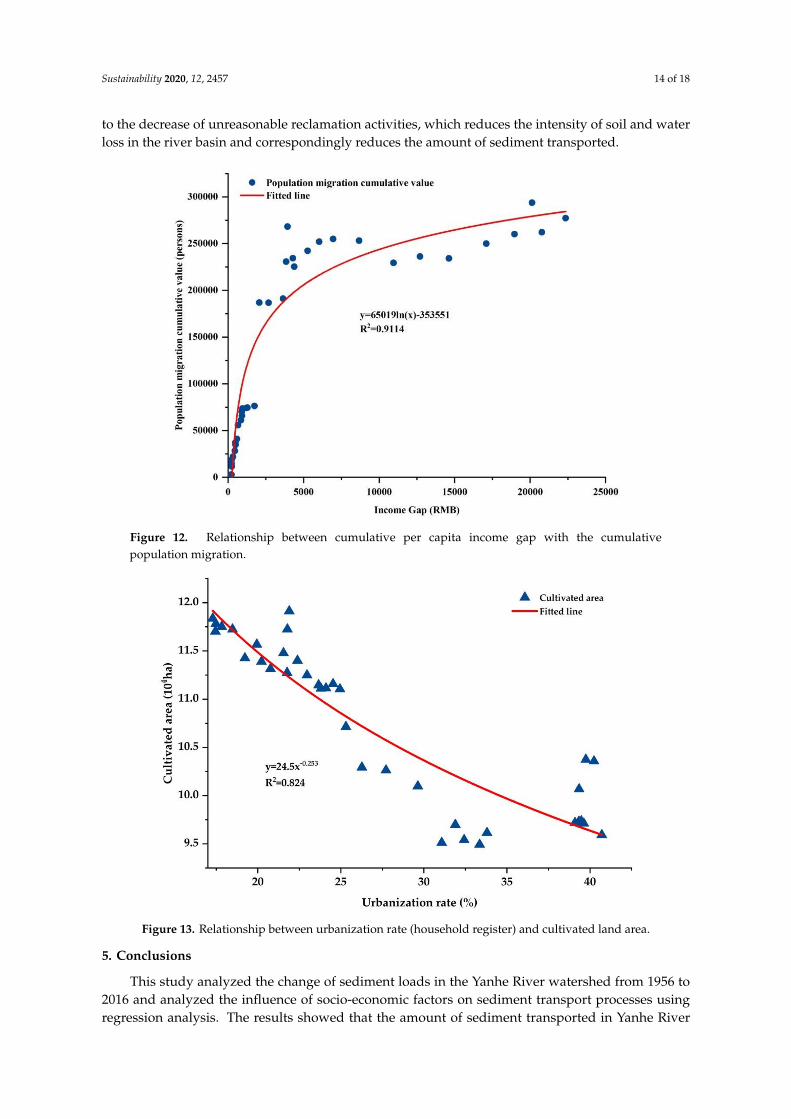
Economic development and industrial restructuring have provided employment opportunitiesfor a large number of rural laborers, thereby changing the employment and land use patterns of ruralresidents. According to statistics from socio-economic data, the per capita income of cities in theYanhe River watershed increased from $36.39 USD in 1980 to $4432.78 USD in 2016, while per capitaincome in rural areas increased from $9.68 USD to $1526.26 USD (Figure 7d). Although the per capitaincome is increasing simultaneously, it can be clearly seen that the growth rate of urban per capitaincome is significantly higher than that of rural per capita income. The gap in per capita incomebetween urban and rural areas has attracted more and more rural laborers to move to cities. FromFigure 12, we can see that there is a linear relationship between the per capita income gap and thenumber of immigrants. As the per capita income gap widens, the number of rural populations movingto cities also increases (p < 0.01). Population migration promotes the development of urbanization.Urbanization is a fundamental change in a country’s economic structure, social structure, productionmode and lifestyle [64]. As can be seen from Figure 13, the higher the level of urbanization, the lesscultivated land (p < 0.01). The reason is that in the transfer of rural labor force is mainly young adults,engaged in industry or service industry in the city to obtain greater benefits, the elderly generallycontinue to stay in the countryside for agricultural production. With convenient transportation andsound infrastructure, more and more young people choose to start their own businesses in cities ratherthan return to the countryside. As the elderly age, the declining labor force has been unable to carry outlarge-scale agricultural production, thus reducing the demand for arable land. With fewer and fewerpeople left behind in the countryside, arable land has been abandoned. Compared with cultivated land,grassland and shrubland have higher infiltration capacity compared to bare land, and the infiltrationcapacity of rainfall is increased to improve the water retention capacity of soil [65]. The restorationof natural vegetation in abandoned farmland will change the hydraulic characteristics of soil, thuschanging the transport process of runoff and sediment [66,67]. The decrease of rural population leads
Sustainability 2020, 12, 2457 14 of 18
to the decrease of unreasonable reclamation activities, which reduces the intensity of soil and waterloss in the river basin and correspondingly reduces the amount of sediment transported.
Figure 12. Relationship between cumulative per capita income gap with the cumulativepopulation migration.
Figure 13. Relationship between urbanization rate (household register) and cultivated land area.
5. Conclusions
This study analyzed the change of sediment loads in the Yanhe River watershed from 1956 to2016 and analyzed the influence of socio-economic factors on sediment transport processes usingregression analysis. The results showed that the amount of sediment transported in Yanhe River
Sustainability 2020, 12, 2457 15 of 18
watershed decreased significantly, and 1996 was the abrupt change year of sediment loads. Sedimentloads are positively correlated with the ratio of agricultural GDP to total GDP and cultivated landarea and negatively correlated with urbanization rate. The sharp decline in sediment transport since1996 is mainly due to the restoration of vegetation in the Yanhe River basin. The main measureto promote vegetation restoration was the conversion of Grain for Green Project implemented in1999, which changed the land use type of the study area and increased the area of forest andgrassland. Meanwhile, with the adjustment of economic development and industrial structure, therapid development of industry and service industry, a large portion of the rural labor force migratedto cities, promoting the process of urbanization, gradually reducing agricultural demand, and thusreducing the destruction of arable land and promoting the restoration of vegetation. In short, the drivingfactors behind sediment reduction are the Grain for Green Project, economic development and industrialrestructuring, population migration, and urbanization. Therefore, balancing the relationship betweensocio-economic development and ecological environment is conducive to sustainable development.
Author Contributions: Data curation, X.Z; Conceptualization, X.J.; methodology, X.J.; project administration,X.J.; supervision, X.J.; writing—original draft, X.Z.; writing—review & editing, X.Z., X.J., L.L., J.X., and H.X. Allauthors have read and agreed to the published version of the manuscript.
Funding: This work was supported by the National Natural Science Foundation of China (No. 51779209).
Acknowledgments: We would like to express our sincere thanks to the participants who provided us withvaluable advice during the data processing. We would also like to thank the editor and the anonymous refereesfor their critical feedback and valuable suggestions.
Conflicts of Interest: The authors declare no conflict of interest.
References
1. Downs, P.W.; Gregory, K.J. How Integrated is River Basin Management? Environ. Manag. 1991, 15, 299–309.[CrossRef]
2. Roy, E.D.; Nguyen, N.T.; White, J.R. Changes in estuarine sediment phosphorus fractions during a large-scaleMississippi River diversion. Sci. Total Environ. 2017, 609, 1248–1257. [CrossRef]
3. Vigiak, O.; Malagó, A.; Bouraoui, F. Modelling sediment fluxes in the Danube River Basin with SWAT.Sci. Total Environ. 2017, 599, 992–1012. [CrossRef]
4. Zhao, Y.F.; Zou, X.Q.; Liu, Q.; Yao, Y.L. Assessing natural and anthropogenic influences on water dischargeand sediment load in the Yangtze River, China. Sci. Total Environ. 2017, 607, 920–932. [CrossRef]
5. Liu, J.J.; Zhou, Z.H.; Yan, Z.Q.; Gong, J.G.; Jia, Y.W.; Xu, C.Y.; Wang, H. A new approach to separating theimpacts of climate change and multiple human activities on water cycle processes based on a distributedhydrological model. J. Hydrol. 2019, 578, 1–13. [CrossRef]
6. Shi, P.; Zhang, Y.; Ren, Z.Q.; Yu, Y.; Li, P.; Gong, J.F. Land-use changes and check dams reducing runoff andsediment yield on the Loess Plateau of China. Sci. Total Environ. 2019, 664, 984–994. [CrossRef]
7. Syvitski, J.P.M.; Vo¨ro¨smarty, C.J.; Kettner, A.J.; Green, P. Impact of humans on the flux of terrestrial sedimentto the global coastal ocean. Science 2005, 308, 376–380. [CrossRef]
8. Ukkola, A.M.; Prentice, I.C.; Keenan, T.F. Reduced streamflow in water-stressed climates consistent withCO2 effects on vegetation. Nat. Clim. Chang. 2015, 6, 75–78. [CrossRef]
9. Walling, D.E.; Fang, D. Recent trends in the suspended sediment loads of the world’s rivers. Glob. Planet Chang.2003, 39, 111–126. [CrossRef]
10. Sun, P.; Wu, Y.; Gao, J.; Yao, Y.; Zhao, F. Shifts of sediment transport regime caused by ecological restorationin the Middle Yellow River Basin. Sci. Total Environ. 2020, 698, 134261. [CrossRef]
11. Darby, S.E.; Hackney, C.R.; Leyland, J.; Kummu, M.; Lauri, H.; Parsons, D.R. Fluvial sediment supply to amega-delta reduced by shifting tropical-cyclone activity. Nature 2016, 539, 276–279. [CrossRef]
12. Evans, D.J.; Gibson, C.E.; Rossell, R.S. Sediment loads and sources in heavily modified Irish catchments:A move towards informed management strategies. Geomorphology 2006, 79, 93–113. [CrossRef]
13. Trombetta, T.B.; Marques, W.C.; Guimarães, R.C.; Costi, J. An overview of longshore sediment transport onthe Brazilian coast. Reg. Stud. Mar. Sci. 2020, 35, 101099. [CrossRef]
Sustainability 2020, 12, 2457 16 of 18
14. Schmidt, A.H.; Gonzalez, V.S.; Bierman, P.R.; Neilson, T.B.; Rood, D.H. Agricultural land use doubledsediment loads in western China’s rivers. Anthropocene 2018, 21, 95–106. [CrossRef]
15. Yamamoto, T.; Malingin, M.; Pepino, M.M.; Yoshikai, M.; Campos, W.; Miyajima, T.; Watanabe, A. Assessmentof coastal turbidity improvement potential by terrigenous sediment load reduction and its implicationson seagrass inhabitable area in Banate Bay, central Philippines. Sci. Total Environ. 2019, 656, 1386–1400.[CrossRef]
16. Mathers, K.L.; Rice, S.P.; Wood, P.J. Temporal effects of enhanced fine sediment loading on macroinvertebratecommunity structure and functional traits. Sci. Total Environ. 2017, 599, 513–522. [CrossRef]
17. Gray, A.B.; Pasternack, G.B.; Watson, E.B.; Warrick, J.A.; Goñi, M.A. Effects of antecedent hydrologicconditions, time dependence, and climate cycles on the suspended sediment load of the Salinas River,California. J. Hydrol. 2015, 525, 632–649. [CrossRef]
18. Bi, N.; Wang, H.; Yang, Z. Recent changes in the erosion–accretion patterns of the active Huanghe(YellowRiver) delta lobe caused by human activities. Cont. Shelf Res. 2014, 90, 70–78. [CrossRef]
19. Jun Peng, S.C.; Ping, D. Temporal variation of sediment load in the Yellow Riverbasin, China, and its impactson the lower reaches and the river delta. Catena 2010, 83, 135–147. [CrossRef]
20. Buendia, C.; Bussi, G.; Tuset, J.; Vericat, D.; Sabater, S. Effects of afforestation on runoff and sediment load inan upland Mediterranean catchment. Sci. Total Environ. 2016, 540, 144–157. [CrossRef]
21. Liu, C.; Walling, D.E.; He, Y. Review: The International Sediment Initiative case studies of sediment problemsin river basins and their management. Int. J. Sediment Res. 2018, 33, 216–219. [CrossRef]
22. Naden, P.S.; Murphy, J.F.; Old, G.H.; Newman, J.; Scarlett, P. Understanding the controls on deposited finesediment in the streams of agricultural catchments. Sci. Total Environ. 2016, 547, 366–381. [CrossRef]
23. Tuset, J.; Vericat, D.; Batalla, R.J. Rainfall, runoff and sediment transport in a Mediterranean mountainouscatchment. Sci. Total Environ. 2016, 540, 114–132. [CrossRef]
24. Zhao, G.J.; Kondolf, G.M.; Mu, X. Sediment yield reduction associated with land use changes and checkdams in a catchment of the Loess Plateau, China. Catena 2016, 148, 1–17. [CrossRef]
25. Jin, Z.; Cui, B.; Song, Y.; Shi, W.; Wang, K.; Wang, Y. How many check dams do we need to build on the LoessPlateau. Environ. Sci. Technol. 2012, 46, 8527–8528. [CrossRef]
26. Huang, L.; Li, X.; Fang, H.; Yin, D.; Si, Y.; Wei, J. Balancing social, economic and ecological benefits ofreservoir operation during the flood season: A case study of the Three Gorges Project, China. J. Hydrol. 2019,572, 422–434. [CrossRef]
27. Deng, L.; Shangguan, Z.P.; Sweeney, S. "Grain for Green" driven land use change and carbon sequestrationon the Loess Plateau, China. Sci. Rep. 2014, 4, 7039. [CrossRef]
28. Zhou, H.; Van Rompaey, A.; Wang, J.A. Detecting the impact of the “Grain for Green” program on the meanannual vegetation cover in the Shaanxi province, China using SPOT-VGT NDVI data. Land Use Policy 2009,26, 954–960. [CrossRef]
29. Yu, Y.; Wang, H.; Shi, X.; Ran, X.; Cui, T. New discharge regime of the Huanghe (Yellow River): Causes andimplications. Cont. Shelf Res. 2013, 69, 62–72. [CrossRef]
30. Zhang, C.; Liu, G.; Xue, S.; Wang, G. Changes in rhizospheric microbial community structure and functionduring the natural recovery of abandoned cropland onthe Loess Plateau. Ecol. Eng. 2015, 75, 161–171.[CrossRef]
31. Chen, Y.; Wang, K.; Lin, Y.; Shi, W.; Song, Y.; He, X. Balancing green and grain trade. Nat. Geosci. 2015, 8,739–741. [CrossRef]
32. Kondolf, G.M.; Schmitt, R.J.P.; Carling, P.; Darby, S. Changing sediment budget of the Mekong: Cumulativethreats and management strategies for a large river basin. Sci. Total Environ. 2018, 625, 114–134. [CrossRef][PubMed]
33. Hu, J.F.; Zhao, G.J.; Mu, X.M.; Tian, P.; Gao, P.; Sun, W.Y. Quantifying the impacts of human activities onrunoff and sediment load changes in a Loess Plateau catchment, China. J. Soil Sediment 2019, 19, 3866–3880.[CrossRef]
34. Li, P.; Xu, G.; Lu, K.; Zhang, X.; Shi, P. Runoff change and sediment source during rainstorms in an ecologicallyconstructed watershed on the Loess Plateau, China. Sci. Total Environ. 2019, 664, 968–974. [CrossRef]
35. Yang, X.N.; Sun, W.Y.; Li, P.F.; Mu, X.M.; Gao, P.; Zhao, G.J. Reduced sediment transport in the Chinese LoessPlateau due to climate change and human activities. Sci. Total Environ. 2018, 642, 591–600. [CrossRef]
Sustainability 2020, 12, 2457 17 of 18
36. Sklenicka, P.; Zouhar, J.; Molnarova, K.J.; Vlasak, J.; Kottova, B. Trends of soil degradation: Does thesocio-economic status of land owners and land users matter? Land Use Policy 2019, 1–8. [CrossRef]
37. Vávra, J.; Duží, B.; Lapka, M.; Cudlínová, E.; Rikoon, J.S. Socio-economic context of soil erosion: A comparativelocal stakeholders’ case study from traditional agricultural region in the Czech Republic. Land Use Policy2019, 84, 127–137. [CrossRef]
38. Whitehead, P.G.; Jin, L.; Macadam, I.; Janes, T.; Sarkar, S. Modelling impacts of climate change andsocio-economic change on the Ganga, Brahmaputra, Meghna, Hooghly and Mahanadi river systems in Indiaand Bangladesh. Sci. Total Environ. 2018, 636, 1362–1372. [CrossRef]
39. Liu, J.; Li, Z.; Zhang, X.; Li, R.; Liu, X.; Zhang, H. Responses of vegetation cover to the Grain for GreenProgram and their driving forces in the He-Long region of the middle reaches of the Yellow River. J. Arid Land.2013, 5, 511–520. [CrossRef]
40. Pettitt, A.N. A non-parametric approach to the change-point problem. J. R. Stat. Soc. 1979, 28, 126–135.[CrossRef]
41. Karabrk, M.C.; Kahya, E.; Kömüsçü, A.U. Analysis of Turkish precipitation data: homogeneity and theSouthern Oscillation forcings on frequency distributions. Hydrol. Process. 2007, 21, 3202–3210. [CrossRef]
42. Gao, P.; Mu, X.M.; Wang, F.; Li, R. Changes in streamflow and sediment discharge and the response to humanactivities in the middle reaches of the Yellow River. Hydrol. Earth Syst. Sci. 2011, 15, 1–10. [CrossRef]
43. Zuo, D.P.; Xu, Z.X.; Wu, W.; Zhao, J.; Zhao, F.F. Identification of streamflow response to climate change andhuman activities in the Wei River Basin. Water Resour. Manag. 2014, 28, 833–851. [CrossRef]
44. Gao, P.; Deng, J.C.; Chai, X.K.; Mu, X.M. Dynamic sediment discharge in the Hekou–Longmen region ofYellow River and soil and water conservation implications. Sci. Total Environ. 2017, 578, 56–66. [CrossRef][PubMed]
45. Li, Z.W.; Xu, X.L.; Yu, B.F.; Xu, C.H.; Liu, M.X. Quantifying the impacts of climate and human activities onwater and sediment discharge in a karst region of southwest China. J. Hydrol. 2016, 542, 836–849. [CrossRef]
46. Wu, J.W.; Miao, C.Y.; Zhang, X.M.; Duan, Q.Y. Detecting the quantitative hydrological response to changes inclimate and human activities. Sci. Total Environ. 2017, 586, 328–337. [CrossRef]
47. Liu, C.A.; Li, F.R.; Zhou, L.M.; Zhang, R.H.; Yu, J.; Lin, S.L. Effect of organic manure and fertilizer on soilwater and crop yields in newly-built terraces with loess soils in a semi-arid environment. Agr. Water Manag.2013, 117, 123–132. [CrossRef]
48. Xiao, J. Satellite evidence for significant biophysical consequences of the “Grain for Green” Program on theLoess Plateau in China. J. Geophys. Res. Biogeo. 2014, 119, 2261–2275. [CrossRef]
49. Liu, W.M.; Luk, M.K.R. Reform and opening up: Way to the sustainable and harmonious development of airtransport in China. Transp. Policy 2009, 16, 215–223. [CrossRef]
50. Cao, Y.G.; Zhou, W.; Qiao, L.Y.; Wang, J.X. Analysis on urban construction land changes and driving forcesin Qinghai Province, 2000-2008. J. Arid Land Resour. Environ. 2013, 27, 40–46. (In Chinese)
51. Naik, P.K.; Jay, D.A. Distinguishing human and climate influences on the ColumbiaRiver_ changes in meanflow and sediment transport. J. Hydrol. 2011, 404, 259–277. [CrossRef]
52. Wei, Y.; Jiao, J.Y.; Zhao, G.J.; Zhao, H.; He, Z.; Mu, X.M. Spatial-temporal variation and pe-riodic change instreamflow and suspended sediment discharge along the main-stream of the Yellow River during 1950–2013.Catena. 2016, 140, 105–115. [CrossRef]
53. Zhao, G.J.; Tian, P.; Mu, X.; Jiao, J.; Wang, F.; Gao, P. Quantifying the impact ofclimate variability and humanactivities on streamflow in the middle reaches of theYellow River basin, China. J. Hydrol. 2014, 519, 387–398.[CrossRef]
54. Wang, S.; Fu, B.J.; Liang, W.; Liu, Y.; Wang, Y. Driving forces of changes in the water and sediment relationshipin the Yellow River. Sci. Total Environ. 2017, 576, 453–461. [CrossRef]
55. Liang, W.; Bai, D.; Wang, F.; Fu, B. Quantifying the impacts of climate change and ecological restoration onstreamflow changes based on a Budyko hydrological model in China’s Loess Plateau. Water Resour. Res.2015, 51, 6500–6519. [CrossRef]
56. Xu, J.X. Variation in annual runoff of the Wudinghe River as influenced by climate change and humanactivity. Quatern. Int. 2011, 244, 230–237. [CrossRef]
57. Huang, M.; Zhang, L.; Gallichand, J. Runoff responses to afforestation in a watershed of the Loess Plateau,China. Hydrol. Process. 2003, 17, 2599–2609. [CrossRef]
Sustainability 2020, 12, 2457 18 of 18
58. Zuo, D.P.; Xu, Z.X.; Yao, W.Y.; Jin, S.Y. Assessing the effects of changes in land use and climate on runoff
and sediment yields from a watershed in the Loess Plateau of China. Sci. Total Environ. 2016, 544, 238–250.[CrossRef]
59. Qi, Y.X.; Liu, Z.R.; Wang, X.Z. Effect Analysis of Soil and Water Conservation from the Loess PlateauWatershed Rehabilitation Project ( Phase II). Res. Soil. Water Conserv. 2008, 15, 204–207. (In Chinese)
60. Su, C.H.; Fu, B.J.; Lü, Y.H.; Lu, N.; Zeng, Y.; He, A.N.; Lamparski, H. Land Use Change and AnthropogenicDriving Forces:A Case Study in Yanhe River watershed. Chin. Geogr. Sci. 2011, 21, 587–599. (In Chinese)[CrossRef]
61. Zhao, G.J.; Mu, X.M.; Gao, P. Soil Erosion, Conservation, and Eco-Environment Changes in the Loess Plateauof China. Land Degrad. Dev. 2013, 24, 499–510. [CrossRef]
62. Kandasamy, J.; Sounthararajah, D.; Sivabalan, P.; Chanan, A.; Vigneswaran, S.; Sivapalan, M. Socio-hydrologicdrivers of the pendulum swing between agricultural development and environmental health: a case studyfrom Murrumbidgee River basin, Australia. Hydrol. Earth Syst. Sci. 2014, 18, 1027–1041. [CrossRef]
63. Liu, J.; Dietz, T.; Carpenter, S.R.; Alberti, M. Complexity of coupled human and natural systems. Science2007, 317, 1513–1516. [CrossRef] [PubMed]
64. Lu, Z.; Wei, Y.; Xiao, H.; Zou, S.; Xie, J. Evolution of the human-water relationships in the Heihe River basinin the past 2000 years. Hydrol. Earth Syst. Sci. 2015, 19, 2261–2273. [CrossRef]
65. Lu, D.D. Ubranization Process and Spatial Sparwl in China. J. Urban Plan. 2007, 4, 47–52. (In Chinese)66. Baker, T.J.; Miller, S.N. Using the Soil and Water Assessment Tool (SWAT) to assess land use impact on water
resources in an East African watershed. J. Hydrol. 2013, 486, 100–111. [CrossRef]67. López-Moreno, J.I.; Vicente-Serrano, S.M.; Moran-Tejeda, E.; Zabalza, J.; Lorenzo-Lacruz, J.; García-Ruiz, J.M.
Impact of climate evolution and land use changes on water yield in the ebro basin. Hydrol. Earth Syst. Sci.2011, 15, 311–322. [CrossRef]
© 2020 by the authors. Licensee MDPI, Basel, Switzerland. This article is an open accessarticle distributed under the terms and conditions of the Creative Commons Attribution(CC BY) license (http://creativecommons.org/licenses/by/4.0/).
Top Related
Copyright © 2022 FDOKUMEN

