


Bahasa
Halaman
Hukum

THE FUNCTIONAL MOBILITY SCALE FOR
CHILDREN WITH CEREBRAL PALSY:
RELIABILITY AND VALIDITY
Adrienne Ruth Harvey
B.App.Sc (Physio), La Trobe University, Australia
Masters of Physiotherapy (Paediatrics), The University of Melbourne, Australia
A thesis submitted in total fulfilment of the requirements for the degree of
Doctor of Philosophy
February 2008
School of Physiotherapy
Faculty of Medicine, Dentistry and Health Sciences
The University of Melbourne
Australia

III
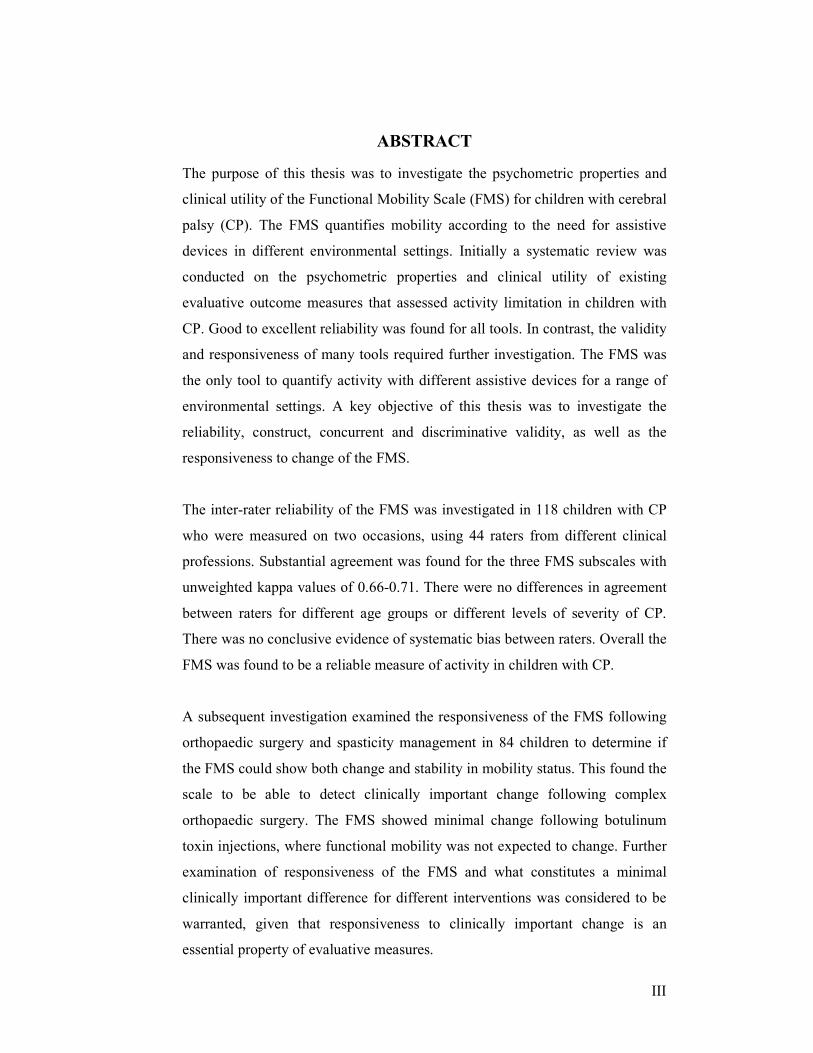
ABSTRACT
The purpose of this thesis was to investigate the psychometric properties and
clinical utility of the Functional Mobility Scale (FMS) for children with cerebral
palsy (CP). The FMS quantifies mobility according to the need for assistive
devices in different environmental settings. Initially a systematic review was
conducted on the psychometric properties and clinical utility of existing
evaluative outcome measures that assessed activity limitation in children with
CP. Good to excellent reliability was found for all tools. In contrast, the validity
and responsiveness of many tools required further investigation. The FMS was
the only tool to quantify activity with different assistive devices for a range of
environmental settings. A key objective of this thesis was to investigate the
reliability, construct, concurrent and discriminative validity, as well as the
responsiveness to change of the FMS.
The inter-rater reliability of the FMS was investigated in 118 children with CP
who were measured on two occasions, using 44 raters from different clinical
professions. Substantial agreement was found for the three FMS subscales with
unweighted kappa values of 0.66-0.71. There were no differences in agreement
between raters for different age groups or different levels of severity of CP.
There was no conclusive evidence of systematic bias between raters. Overall the
FMS was found to be a reliable measure of activity in children with CP.
A subsequent investigation examined the responsiveness of the FMS following
orthopaedic surgery and spasticity management in 84 children to determine if
the FMS could show both change and stability in mobility status. This found the
scale to be able to detect clinically important change following complex
orthopaedic surgery. The FMS showed minimal change following botulinum
toxin injections, where functional mobility was not expected to change. Further
examination of responsiveness of the FMS and what constitutes a minimal
clinically important difference for different interventions was considered to be
warranted, given that responsiveness to clinically important change is an
essential property of evaluative measures.

IV
The construct validity of the FMS was examined in a sample of 18 children by
comparing the FMS rating obtained by usual method of clinician interpretation
of self-report with direct observation of the children in their home and school
settings. Fair to moderate agreement between self-report and direct observation
was found with kappa values of 0.27-0.45. Children with CP were observed to
use a variety of mobility methods and often more than one method of mobility
was used in each setting. The study highlighted the need for further
investigation with larger studies of this important clinical issue of whether self-
report tools measure performance.
The concurrent and discriminative validity of the FMS were investigated in 172
children with CP to determine if the FMS measures activity limitation and can
distinguish between groups of children with CP based on severity of activity
limitation. Concurrent validity was supported by high correlations of the FMS
with the Gillette Functional Assessment Questionnaire with Spearman’s rho of
0.69-0.79, and with the Gross Motor Function Classification System (GMFCS)
with Spearman’s rho of 0.74-0.91. The FMS was able to discriminate between
children who walk independently (GMFCS levels I and II) from those who
require assistive devices to walk (GMFCS levels III and IV).
To conclude, the FMS has unique features not found in other measures of
activity limitation used for children with CP. It enables clinicians to assess
mobility according to the need for assistive devices within the different
environmental settings of home, school and the wider community. It was found
to be clinically useful and feasible, with sound psychometric properties. The
FMS can also be used to quantify mobility in children with CP in a range of
clinical settings, such as gait laboratories as well as settings with restricted
access to expensive technology. This thesis provides clinicians with a robust
tool for documenting mobility status at one point in time and for assessing
change over time and following therapeutic interventions.
V
DECLARATION
This is to certify that
i. This thesis comprises only my original work towards the PhD
ii. Due acknowledgement has been made in the text to all other material used
iii. The thesis is less than 100,000 words in length, exclusive of table, maps,
bibliographies and appendices
iv. The thesis reflects work done during the period of candidature
v. I have used no part of this work for the award of another degree
vi. This thesis was conducted according to the Code of Conduct for Research
vii. Research data and records collected, used and maintained in the conduct
of my research will be retained and accessible for five years from the point
of thesis submission unless publication or public release of the work of
research subsequently occurs, in which case the research data and records
will then be retained for five years after publication, or public release, of
the work of research
Adrienne Harvey
February 2008

VII
ACKNOWLEDGEMENTS
There are many people I would like to acknowledge for their patience,
assistance and support throughout my doctoral candidature. I thank my three
supervisors, Professor Meg Morris, Professor Kerr Graham and Associate
Professor Richard Baker, for their guidance, support and knowledge. Meg
Morris stepped up to the task one third of the way through and guided me along
so incredibly intuitively and professionally. Her remarkable supervision allowed
me to “smell the roses” along the way and gave me confidence in my own
ability. To Kerr Graham, I am indebted to all the opportunities and support he
has provided me throughout the last 10 years in this exciting and rewarding
field. His creative ideas and unfailing support and encouragement have been
instrumental in guiding me to where I am today. I thank Richard Baker for his
patience, availability and discerning advice, feedback and experience, not only
with this doctorate but also with general career advice.
To all of my colleagues and fellow students, I thank them for their patience,
support, advice and encouragement. In particular, Alicia Spittle who was my
PhD “buddy” throughout the past 3 years. With the help of those around the
PhD journey is more enjoyable and less isolating. I would like to thank Fiona
Dobson, Jenny McGinley and Jill Rodda. As recent PhD “graduates”, their
mentoring and experience was invaluable and very much appreciated,
particularly Fiona’s patience and assistance in the final stages. I would like to
thank all staff in the Hugh Williamson Gait Laboratory for their support,
friendship and help. I would also like to acknowledge my friends and colleagues
at Ormond College who provided a nurturing and supportive environment in
which to study and interact with others chasing similar pursuits.
To all of the surgeons and physiotherapists, both at RCH and in the community
who acted as raters for the reliability study, I am truly grateful for their
participation in ensuring the study was conducted in a timely fashion. I thank
them for the time and effort they all gave so graciously. To the staff and
students at Nepean School, I extend my gratitude for all their efforts in making
my visit and research out there enjoyable as well as efficient and successful. In

VIII
particular I would like to thank physiotherapists Janet Hough and Marty Hughes
for their invaluable contribution and involvement.
I would like to acknowledge biostatistician Rory Wolfe for all of his statistical
advice and support, not only throughout this doctorate but over many years. His
willingness and assistance allowed me to learn, and even enjoy, the statistical
analysis! I would also like to thank medical illustrator Bill Reid who was
instrumental in the design of the FMS educational material and other
illustrations used in this thesis.
I extend gratitude to my family and friends for their support, encouragement and
understanding throughout my doctoral candidature. I would like to thank the
Murdoch Children’s Research Institute and the National Health and Medical
Research Council for their support through scholarships and the University of
Melbourne for accepting me as a PhD candidate.
A very big thank you goes to the children and their families who kindly
participated in this research. I am truly indebted and grateful for their
involvement and for making the process so enjoyable. Their courage, strength
and stories are truly inspiring and motivate me to hopefully make a difference in
this challenging and incredibly satisfying field. I have always considered it an
enormous privilege to work with these inspirational children!
Finally, I would like to dedicate this thesis to Maddie, Angus and Hamish, who
constantly remind me how very precious our little ones are, and how they enrich
our lives in ways that words cannot describe.

IX
PUBLICATIONS AND PRESENTATIONS DURING
DOCTORAL CANDIDATURE
Publications
Harvey A, Robin J, Morris ME, Graham HK & Baker R (2008). A systematic
review of measures of activity limitation for children with cerebral palsy. Dev
Med Child Neurol. 50:190-198
Harvey A, Morris M, Graham HK, Baker R & Wolfe R (2007). The Functional
Mobility Scale (FMS): ability to detect change following single event multilevel
surgery. Dev Med Child Neurol. 49:603-607
Graham HK & Harvey A (2007). Assessment of mobility after multi-level
surgery for cerebral palsy. J Bone Joint Surgery (Br). 89-B: 993-994.
Ma F, Selber P, Nattrass GR, Harvey AR, Wolfe R and Graham HK (2006).
Hamstrings lengthening and transfer for knee flexion deformity in children with
cerebral palsy: technique and preliminary results. J Bone Joint Surgery (Br). 88-
B:248-254
Conference Presentations
Harvey A, Graham HK, Baker R & Wolfe R. The Functional Mobility Scale:
responsiveness to change. American Academy of Cerebral Palsy and
Developmental Medicine, Boston, USA. September 2006.
Awarded “Best Scientific Poster”
Harvey A, Graham HK, Baker R & Wolfe R. Responsiveness to change of the
Functional Mobility Scale after single event multilevel surgery in spastic
diplegia. Australasian Academy of Cerebral Palsy and Developmental
Medicine, Adelaide, Australia. March 2006.

X
Harvey A, Graham HK, Baker R & Wolfe R. Responsiveness to change of the
Functional Mobility Scale after single event multilevel surgery in children with
spastic diplegia. Australian Physiotherapy Association 6th National Paediatric
Conference, Alice Springs, Australia. September 2005.
Harvey A, Rodda J & Graham HK. Two-dimensional video gait analysis:
applying the lessons from 3 dimensional gait analysis. American Academy for
Cerebral Palsy and Developmental Medicine. Boston, USA 2006 and
Vancouver, Canada 2007.
Seminar Presentations
Harvey A. PhD Completion Seminar. The Functional Mobility Scale for
children with cerebral palsy: reliability and validity. School of Physiotherapy,
The University of Melbourne, Australia. November 2007.
Harvey A. Outcome measurement and function in children with cerebral palsy.
Australian Physiotherapy Association Paediatric Group. July 2007.
Harvey A. Gait and functional assessment for children with cerebral palsy. The
Spastic Centre, Sydney, Australia. December 2006 and Brisbane, Australia
February 2007.
Graham HK and Harvey A. Course for spasticity and gait dysfunction. Fleni
Rehabilitation Hospital, Buenos Aires, Argentina. April 2006
Scholarships
Murdoch Children’s Research Institute Postgraduate Scholarship – 2006
National Health and Medical Research Council Postgraduate Scholarship (co-
funded by the CP Institute) - 2007

XI
LIST OF ABBREVIATIONS
AH Adrienne Harvey
AF Adrienne Fosang
AIMS Alberta Infant Motor Scale
ANOVA analysis of variance
ASK Activities Scale for Kids
CAPE Children’s Assessment of Participation and Enjoyment
CHQ Child Health Questionnaire
CHQ-CF Child Health Questionnaire child form
CHQ-PF Child Health Questionnaire parent form
CI confidence interval
CONSORT consolidated standards of reporting trials
COPM Canadian Occupational Performance Measure
CP cerebral palsy
EE energy expenditure
ES effect size
FMAS Functional Motor Assessment Scale
FMS Functional Mobility Scale
GAS Goal Attainment Scale
GMFCS Gross Motor Function Classification System
GMFM Gross Motor Function Measure
GMFM-66 Gross Motor Function Measure – 66 item version
GMFM-88 Gross Motor Function Measure – 88 item version
HRQOL health related quality of life
IC internal consistency
ICC intraclass correlation coefficient
ICF International Classification of Functioning, Disability and Health
JH Janet Hough
JR Jonathan Robin
K kappa
MCID minimal clinically important difference
MH Marty Hughes
MM Meg Morris

XII
MOOSE meta-analysis of observational studies
OR odds ratios
PDMS Peabody Developmental Motor Scale
PEDI Pediatric Evaluation of Disability Inventory
PedsQL Pediatric Quality of Life Inventory
PODCI Pediatric Outcomes Data Collection Instrument
POSNA Pediatric Orthopaedic Society of North America
QOL quality of life
QUOROM quality of reporting of meta-analyses
RCT randomised controlled trial
ROC receiver operating characteristic
ROM range of movement
SD standard deviation
SDR selective dorsal rhizotomy
SEMLS single event multilevel surgery
SRM standardized response means
STARD standards for reporting of diagnostic accuracy
TUG Timed Up and Go
VDRO varus derotation osteotomy
WeeFIM Functional Independence Measure for Children
WHO World Health Organisation
3DGA three dimensional gait analysis

XIII
TABLE OF CONTENTS
ABSTRACT................................................................................................... III
DECLARATION............................................................................................. V
ACKNOWLEDGEMENTS...........................................................................VII
PUBLICATIONS AND PRESENTATIONS DURING DOCTORAL
CANDIDATURE ..................................................................................... IX
LIST OF ABBREVIATIONS.........................................................................XI
TABLE OF CONTENTS............................................................................. XIII
LIST OF FIGURES..................................................................................... XXI
LIST OF TABLES ....................................................................................XXIII
CHAPTER ONE: INTRODUCTION ............................................................... 1
1.1. The problem: mobility in children with cerebral palsy and how to
measure it ............................................................................................... 1
1.2. Aims and hypotheses ............................................................................. 3
1.2.1. Aims ............................................................................................... 3
1.2.2. Hypotheses...................................................................................... 4
1.3. Synopsis ................................................................................................ 6
1.4. Rationale of the thesis ............................................................................ 7
1.4.1. Study 1: Systematic review of the activity limitation outcome
measures used in children with cerebral palsy ..................................... 7
1.4.2. Study 2: Development of the FMS and pilot study........................... 7
1.4.3. Study 3: Reliability of the Functional Mobility Scale....................... 8
1.4.4. Study 4: Responsiveness to change of the FMS ............................... 8
1.4.5. Study 5: Construct validity of the FMS............................................ 9
1.4.6. Study 6: Discriminative and concurrent validity of the FMS............ 9
1.5. Significance of the research.................................................................. 10
CHAPTER TWO: OUTCOME MEASUREMENT FOR CHILDREN WITH
CEREBRAL PALSY................................................................................ 13
2.1. Cerebral palsy: definition and incidence............................................... 13
2.2. Clinical presentation of cerebral palsy within the International
Classification of Functioning, Disability and Health (ICF) .................... 14
2.2.1. What is the ICF ............................................................................. 14
2.2.2. Cerebral palsy within body functions and structure........................ 16
XIV
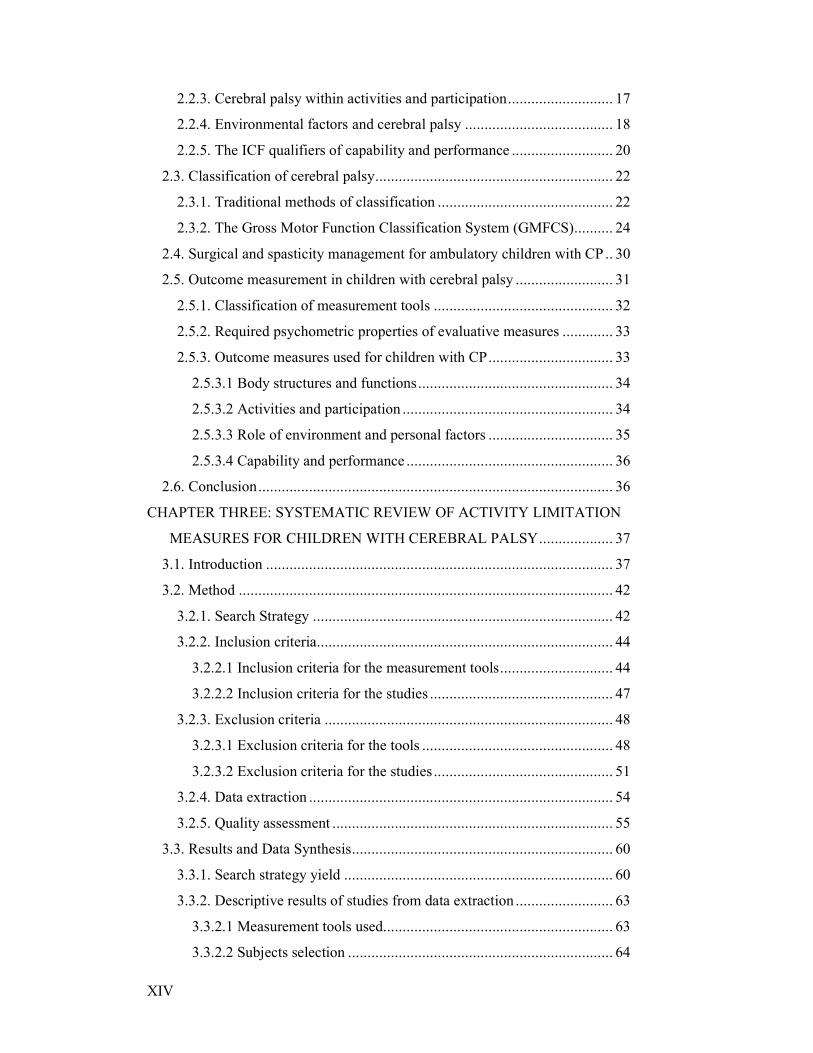
2.2.3. Cerebral palsy within activities and participation........................... 17
2.2.4. Environmental factors and cerebral palsy ...................................... 18
2.2.5. The ICF qualifiers of capability and performance .......................... 20
2.3. Classification of cerebral palsy............................................................. 22
2.3.1. Traditional methods of classification ............................................. 22
2.3.2. The Gross Motor Function Classification System (GMFCS).......... 24
2.4. Surgical and spasticity management for ambulatory children with CP .. 30
2.5. Outcome measurement in children with cerebral palsy ......................... 31
2.5.1. Classification of measurement tools .............................................. 32
2.5.2. Required psychometric properties of evaluative measures ............. 33
2.5.3. Outcome measures used for children with CP................................ 33
2.5.3.1 Body structures and functions.................................................. 34
2.5.3.2 Activities and participation ...................................................... 34
2.5.3.3 Role of environment and personal factors ................................ 35
2.5.3.4 Capability and performance ..................................................... 36
2.6. Conclusion........................................................................................... 36
CHAPTER THREE: SYSTEMATIC REVIEW OF ACTIVITY LIMITATION
MEASURES FOR CHILDREN WITH CEREBRAL PALSY................... 37
3.1. Introduction ......................................................................................... 37
3.2. Method ................................................................................................ 42
3.2.1. Search Strategy ............................................................................. 42
3.2.2. Inclusion criteria............................................................................ 44
3.2.2.1 Inclusion criteria for the measurement tools............................. 44
3.2.2.2 Inclusion criteria for the studies ............................................... 47
3.2.3. Exclusion criteria .......................................................................... 48
3.2.3.1 Exclusion criteria for the tools ................................................. 48
3.2.3.2 Exclusion criteria for the studies .............................................. 51
3.2.4. Data extraction .............................................................................. 54
3.2.5. Quality assessment ........................................................................ 55
3.3. Results and Data Synthesis................................................................... 60
3.3.1. Search strategy yield ..................................................................... 60
3.3.2. Descriptive results of studies from data extraction ......................... 63
3.3.2.1 Measurement tools used........................................................... 63
3.3.2.2 Subjects selection .................................................................... 64
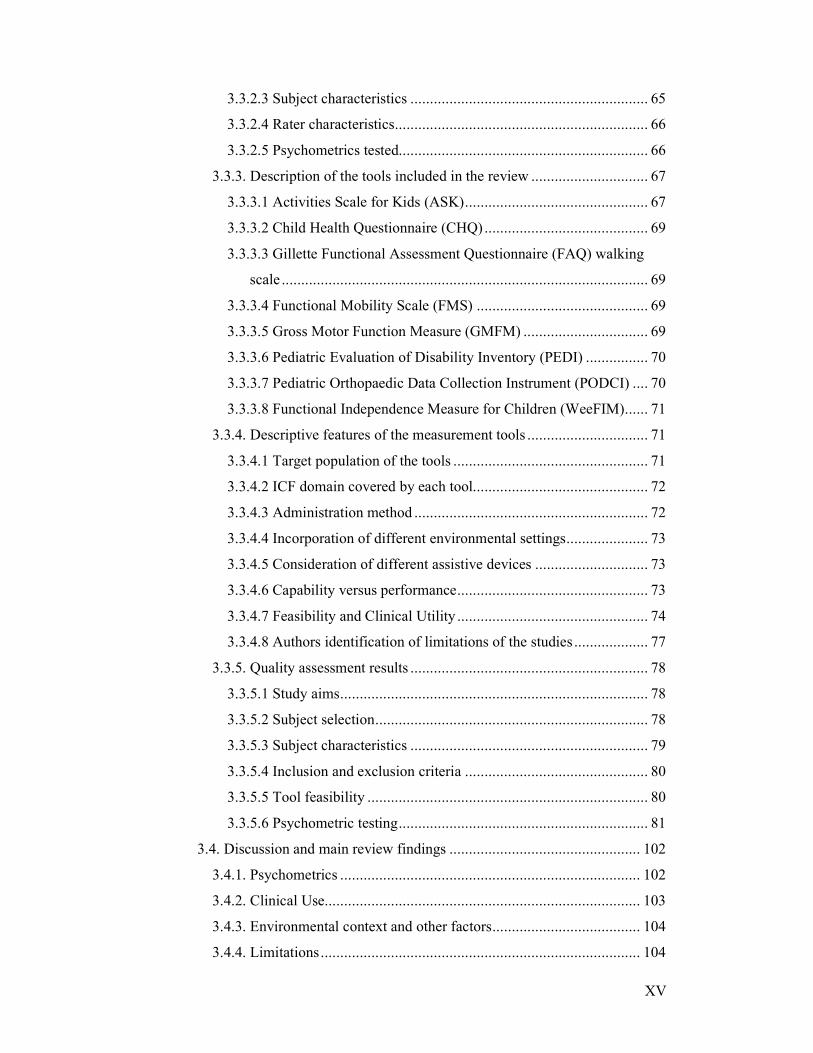
XV
3.3.2.3 Subject characteristics ............................................................. 65
3.3.2.4 Rater characteristics................................................................. 66
3.3.2.5 Psychometrics tested................................................................ 66
3.3.3. Description of the tools included in the review .............................. 67
3.3.3.1 Activities Scale for Kids (ASK)............................................... 67
3.3.3.2 Child Health Questionnaire (CHQ) .......................................... 69
3.3.3.3 Gillette Functional Assessment Questionnaire (FAQ) walking
scale .............................................................................................. 69
3.3.3.4 Functional Mobility Scale (FMS) ............................................ 69
3.3.3.5 Gross Motor Function Measure (GMFM) ................................ 69
3.3.3.6 Pediatric Evaluation of Disability Inventory (PEDI) ................ 70
3.3.3.7 Pediatric Orthopaedic Data Collection Instrument (PODCI) .... 70
3.3.3.8 Functional Independence Measure for Children (WeeFIM)...... 71
3.3.4. Descriptive features of the measurement tools ............................... 71
3.3.4.1 Target population of the tools .................................................. 71
3.3.4.2 ICF domain covered by each tool............................................. 72
3.3.4.3 Administration method ............................................................ 72
3.3.4.4 Incorporation of different environmental settings..................... 73
3.3.4.5 Consideration of different assistive devices ............................. 73
3.3.4.6 Capability versus performance................................................. 73
3.3.4.7 Feasibility and Clinical Utility ................................................. 74
3.3.4.8 Authors identification of limitations of the studies ................... 77
3.3.5. Quality assessment results ............................................................. 78
3.3.5.1 Study aims............................................................................... 78
3.3.5.2 Subject selection...................................................................... 78
3.3.5.3 Subject characteristics ............................................................. 79
3.3.5.4 Inclusion and exclusion criteria ............................................... 80
3.3.5.5 Tool feasibility ........................................................................ 80
3.3.5.6 Psychometric testing................................................................ 81
3.4. Discussion and main review findings ................................................. 102
3.4.1. Psychometrics ............................................................................. 102
3.4.2. Clinical Use................................................................................. 103
3.4.3. Environmental context and other factors...................................... 104
3.4.4. Limitations.................................................................................. 104
XVI
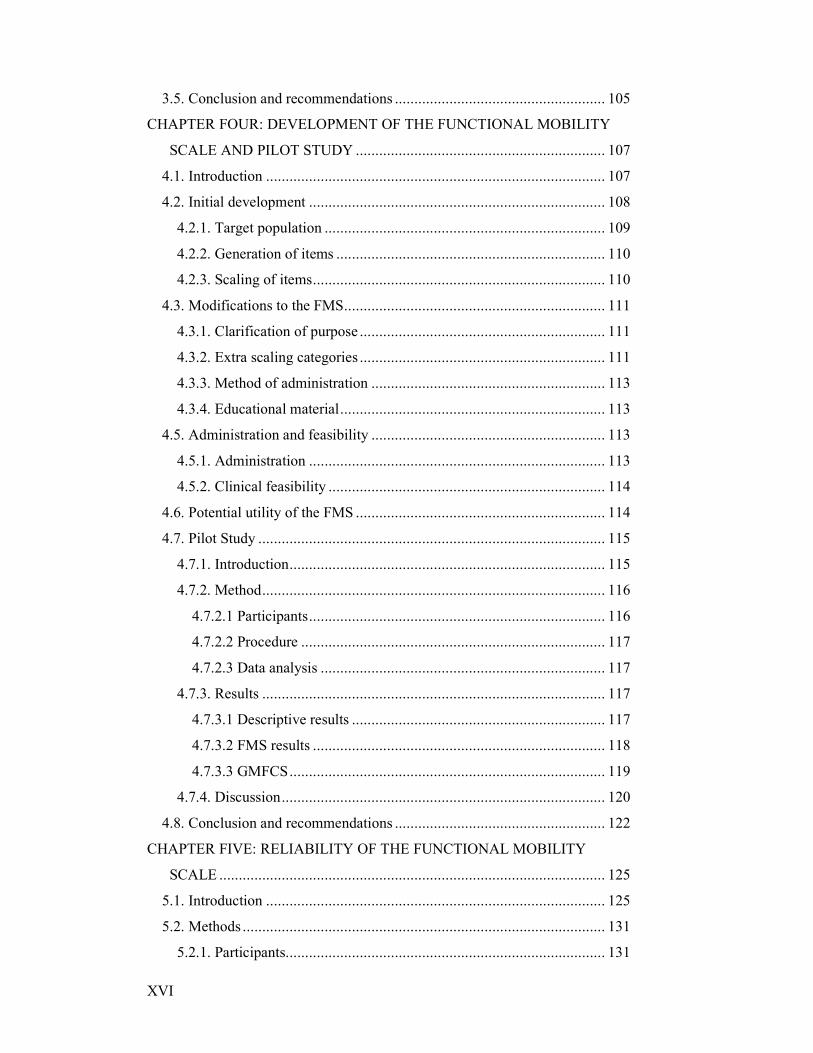
3.5. Conclusion and recommendations ...................................................... 105
CHAPTER FOUR: DEVELOPMENT OF THE FUNCTIONAL MOBILITY
SCALE AND PILOT STUDY ................................................................ 107
4.1. Introduction ....................................................................................... 107
4.2. Initial development ............................................................................ 108
4.2.1. Target population ........................................................................ 109
4.2.2. Generation of items ..................................................................... 110
4.2.3. Scaling of items........................................................................... 110
4.3. Modifications to the FMS................................................................... 111
4.3.1. Clarification of purpose ............................................................... 111
4.3.2. Extra scaling categories ............................................................... 111
4.3.3. Method of administration ............................................................ 113
4.3.4. Educational material.................................................................... 113
4.5. Administration and feasibility ............................................................ 113
4.5.1. Administration ............................................................................ 113
4.5.2. Clinical feasibility ....................................................................... 114
4.6. Potential utility of the FMS ................................................................ 114
4.7. Pilot Study ......................................................................................... 115
4.7.1. Introduction................................................................................. 115
4.7.2. Method........................................................................................ 116
4.7.2.1 Participants............................................................................ 116
4.7.2.2 Procedure .............................................................................. 117
4.7.2.3 Data analysis ......................................................................... 117
4.7.3. Results ........................................................................................ 117
4.7.3.1 Descriptive results ................................................................. 117
4.7.3.2 FMS results ........................................................................... 118
4.7.3.3 GMFCS................................................................................. 119
4.7.4. Discussion................................................................................... 120
4.8. Conclusion and recommendations ...................................................... 122
CHAPTER FIVE: RELIABILITY OF THE FUNCTIONAL MOBILITY
SCALE ................................................................................................... 125
5.1. Introduction ....................................................................................... 125
5.2. Methods ............................................................................................. 131
5.2.1. Participants.................................................................................. 131

XVII
5.2.1.1 Clinician raters ...................................................................... 131
5.2.1.2 Children ................................................................................ 132
5.2.1.3 Sample size of children.......................................................... 134
5.2.2. Procedures................................................................................... 134
5.2.2.1 Recruitment........................................................................... 135
5.2.2.2 Allocation of raters ................................................................ 135
5.2.2.3 Testing procedure .................................................................. 136
5.2.3. Data analysis ............................................................................... 138
5.3. Results ............................................................................................... 139
5.3.1. Descriptive results of participant characteristics .......................... 139
5.3.2. Inter-rater reliability results ......................................................... 141
5.3.3. Systematic biases of raters........................................................... 145
5.4. Discussion ......................................................................................... 148
5.4.1. Inter-rater agreement of the FMS................................................. 148
5.4.2. Systematic bias of raters .............................................................. 152
5.4.3. Factors affecting agreement......................................................... 153
5.4.4. Limitations and recommendations ............................................... 154
5.5. Conclusion......................................................................................... 156
CHAPTER SIX: RESPONSIVENESS TO CHANGE OF THE FUNCTIONAL
MOBILITY SCALE ............................................................................... 157
6.1. Introduction ....................................................................................... 157
6.2. Method .............................................................................................. 162
6.2.1. Participants ................................................................................. 162
6.2.1.1 Inclusion criteria.................................................................... 163
6.2.1.2 Exclusion criteria................................................................... 165
6.2.1.3 Sample size ........................................................................... 166
6.2.2. Procedure .................................................................................... 166
6.2.2.1 Recruitment........................................................................... 166
6.2.2.2 Testing procedure .................................................................. 167
6.2.3. Data Analysis .............................................................................. 169
6.3. Results ............................................................................................... 170
6.3.1. Descriptive results of participants................................................ 170
6.3.2. Descriptive statistics of change scores ......................................... 171
6.3.3. Correlations between change scores on the FMS and FAQ .......... 176

XVIII
6.4. Discussion.......................................................................................... 176
6.4.1. Responsiveness of the FMS......................................................... 176
6.4.2. Limitations and recommendations ............................................... 180
6.5. Conclusion......................................................................................... 182
CHAPTER SEVEN: OBSERVATION OF MOBILITY IN CHILDREN WITH
CEREBRAL PALSY: A STUDY OF CONSTRUCT VALIDITY OF THE
FUNCTIONAL MOBILITY SCALE...................................................... 183
7.1. Introduction ....................................................................................... 183
7.2. Method .............................................................................................. 185
7.2.1. Participants.................................................................................. 185
7.2.2. Procedures................................................................................... 187
7.2.2.1 Recruitment........................................................................... 187
7.2.2.2 Testing procedure .................................................................. 188
7.2.3. Data Analysis .............................................................................. 191
7.3. Results ............................................................................................... 192
7.3.1. Descriptive results ....................................................................... 192
7.3.1.1 Participant characteristics ...................................................... 192
7.3.1.2 Timing of ratings and observations ........................................ 192
7.3.1.3 Results from direct observation.............................................. 193
7.3.2. Agreement results........................................................................ 196
7.4. Discussion.......................................................................................... 197
7.4.1. Variety of mobility methods observed ......................................... 197
7.4.2. Agreement between self-report FMS and direct observation ........ 198
7.4.3. Limitations and recommendations ............................................... 204
7.5. Conclusion......................................................................................... 205
CHAPTER EIGHT: CONCURRENT AND DISCRIMINATIVE VALIDITY
OF THE FUNCTIONAL MOBILITY SCALE ....................................... 207
8.1. Introduction ....................................................................................... 207
8.2. Method .............................................................................................. 210
8.2.1. Participants.................................................................................. 210
8.2.2. Procedures................................................................................... 211
8.2.2.1 Recruitment........................................................................... 212
8.2.2.2 Concurrent Validity ............................................................... 212
8.2.2.3 Discriminative validity .......................................................... 213

XIX
8.2.3. Data Analysis .............................................................................. 213
8.2.3.1 Data analysis for concurrent validity...................................... 213
8.2.3.2 Data analysis for discriminative validity ................................ 214
8.3. Results ............................................................................................... 215
8.3.1. Descriptive results ....................................................................... 215
8.3.2. Concurrent validity results........................................................... 218
8.3.3. Discriminative validity results ..................................................... 222
8.4. Discussion ......................................................................................... 224
8.4.1. Concurrent validity...................................................................... 225
8.4.2. Discriminative validity ................................................................ 227
8.4.3. Limitations and recommendations ............................................... 229
8.5. Conclusion......................................................................................... 230
CHAPTER NINE: GRAND DISCUSSION AND CONCLUSIONS............. 231
9.1. Synthesis of findings.......................................................................... 231
9.1.1. The importance of robust tools to measure activity limitation ...... 231
9.1.2. The influence of the environment on mobility ............................. 232
9.1.3. Issues around self-report measures .............................................. 234
9.2. Clinical implications .......................................................................... 236
9.3. Limitations......................................................................................... 239
9.4. Future directions ................................................................................ 241
9.5. Conclusions ....................................................................................... 244
REFERENCES............................................................................................. 249
APPENDIX A .............................................................................................. 279
APPENDIX B .............................................................................................. 281
APPENDIX C .............................................................................................. 285
APPENDIX D .............................................................................................. 289
APPENDIX E............................................................................................... 291
APPENDIX F............................................................................................... 293
APPENDIX G .............................................................................................. 295
APPENDIX H .............................................................................................. 297
APPENDIX I................................................................................................ 309


XXI
LIST OF FIGURES
Figure 1.1 Concept map of thesis structure ....................................................... 5
Figure 1.2 Samples recruited for overall thesis.................................................. 6
Figure 2.1 Interactions between the components of the ICF (WHO 2001)....... 15
Figure 2.2 The Gross Motor Function Classification System (GMFCS) for
children aged 6-12 years................................................................ 26
Figure 3.1 Measurement tools included in the systematic review .................... 45
Figure 4.1 The Functional Mobility Scale (FMS).......................................... 112
Figure 4.2 Percentage of children in GMFCS levels post-operatively............ 119
Figure 6.1 Change in FMS 5m score for Botulinum toxin group ................... 174
Figure 6.2 Change in FMS 50m score for Botulinum toxin group ................. 174
Figure 6.3 Change in FMS 500m score for Botulinum toxin group ............... 174
Figure 6.4 Change in FMS 5m score for SEMLS group ................................ 175
Figure 6.5 Change in FMS 50m score for SEMLS group .............................. 175
Figure 6.6 Change in FMS 500m score for SEMLS group ............................ 175
Figure 7.1 Frequency of mobility methods observed..................................... 193
Figure 7.2 Typical posterior walker used by children independently ............. 202
Figure 7.3 More supported walker requiring adult assistance ........................ 202
Figure 8.1 Scatter plot FMS 5 metres with the FAQ...................................... 219
Figure 8.2 Scatter plot FMS 50 metres with the FAQ.................................... 219
Figure 8.3 Scatter plot FMS 500 metres with the FAQ.................................. 220
Figure 8.4 Scatter plot FMS 5 metres with the GMFCS ................................ 220
Figure 8.5 Scatter plot FMS 50 metres with the GMFCS .............................. 221
Figure 8.6 Scatter plot FMS 500 metres with the GMFCS ............................ 221
Figure 8.7 ROC curve for FMS 5 metres....................................................... 223
Figure 8.8 ROC curve for FMS 50 metres..................................................... 223
Figure 8.9 ROC curve for FMS 500 metres................................................... 223


XXIII
LIST OF TABLES
Table 2.1 Percentage of children in GMFCS levels in different countries........ 28
Table 3.1 Data extraction for the studies included in the review ..................... 61
Table 3.2 Features of the measurement tools .................................................. 68
Table 3.3 Measurement tools: feasibility and clinical utility............................ 75
Table 3.4 Psychometric properties of the ASK ................................................ 82
Table 3.5 Psychometric properties of the CHQ ............................................... 84
Table 3.6 Psychometric properties of the FAQ................................................ 86
Table 3.7 Psychometric properties of the FMS................................................ 88
Table 3.8 Psychometric properties of the GMFM............................................ 90
Table 3.9 Psychometric properties of the PEDI .............................................. 94
Table 3.10 Psychometric properties of the PODCI ......................................... 96
Table 3.11 Psychometric properties of the WeeFIM...................................... 100
Table 4.1 Odds ratios for each FMS distance at post-operative time points .. 118
Table 4.2 Children originally able to walk without assistive devices ............. 119
Table 5.1 Participant characteristics ............................................................ 140
Table 5.2 Kappa values for each FMS distance............................................. 141
Table 5.3 Kappa values and agreement for different age groups of children . 142
Table 5.4 Kappa values for each FMS distance for GMFCS level and
topographical distribution ............................................................. 143
Table 5.5 Kappa values for different rater combinations............................... 145
Table 5.6 Wilcoxon signed rank tests for FMS 5 metres ................................ 145
Table 5.7 Wilcoxon signed rank tests for FMS 50 metres .............................. 146
Table 5.8 Wilcoxon signed rank tests for FMS 500 metres ............................ 146
Table 5.9 Agreement between surgeons and hospital physiotherapists for
FMS 5 metres ................................................................................ 146
Table 5.10 Agreement between community and hospital physiotherapists for
FMS 5 metres ................................................................................ 147
Table 6.1 Participant characteristics ............................................................ 171
Table 6.2 Percentage of children in change categories for the FMS and FAQ
at post-intervention time points ..................................................... 172
Table 6.3 Correlations of change scores between the FMS and FAQ ............ 176
XXIV
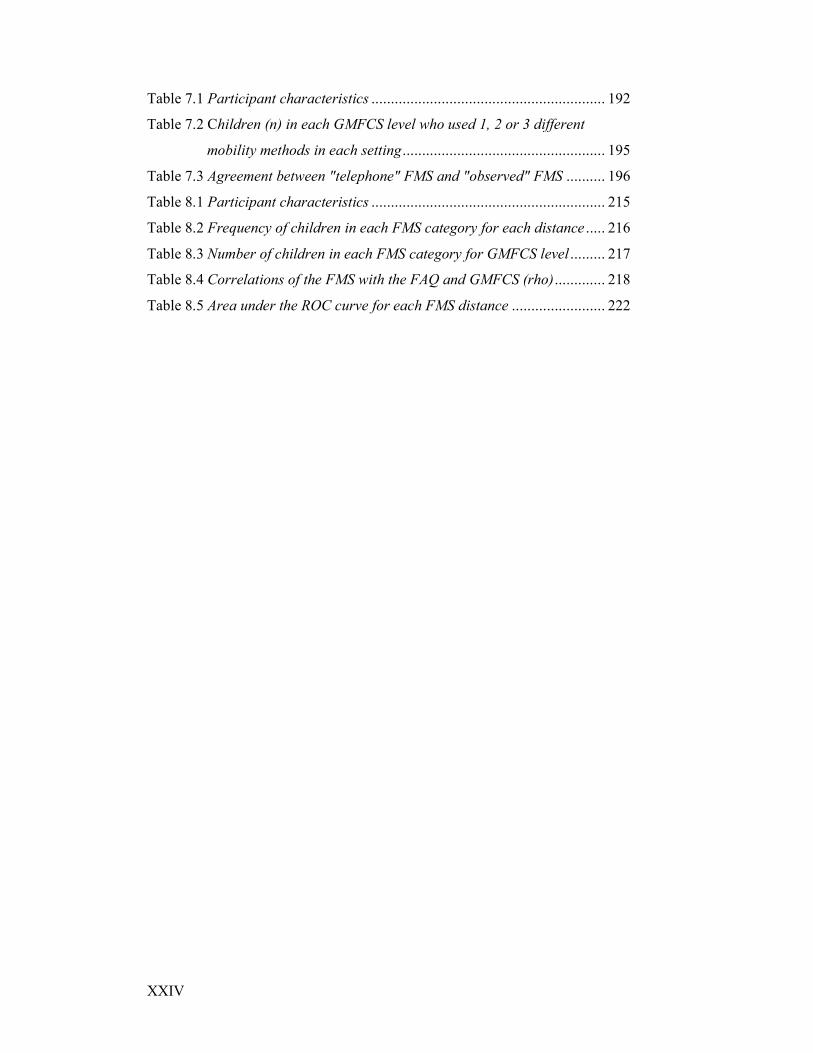
Table 7.1 Participant characteristics ............................................................ 192
Table 7.2 Children (n) in each GMFCS level who used 1, 2 or 3 different
mobility methods in each setting.................................................... 195
Table 7.3 Agreement between "telephone" FMS and "observed" FMS .......... 196
Table 8.1 Participant characteristics ............................................................ 215
Table 8.2 Frequency of children in each FMS category for each distance ..... 216
Table 8.3 Number of children in each FMS category for GMFCS level ......... 217
Table 8.4 Correlations of the FMS with the FAQ and GMFCS (rho)............. 218
Table 8.5 Area under the ROC curve for each FMS distance ........................ 222
Chapter 1 - Introduction
1
CHAPTER ONE: INTRODUCTION
1.1. The problem: mobility in children with cerebral palsy and
how to measure it
This thesis investigates the psychometric properties and clinical utility of a
recently developed scale, the Functional Mobility Scale (FMS) (Graham et al
2004). The FMS is an outcome measure used by physiotherapists and other
health professionals. It rates mobility in children with cerebral palsy (CP) in
different environmental settings according to their need for assistive devices.
Although a range of modalities can be employed for mobility, the FMS focuses
on walking. The mobility of children with CP can be limited by the physical
manifestations resulting from the positive and negative features of the upper
motor neurone syndrome, including spasticity, weakness, loss of selective motor
control and deficits in balance and coordination (Mayer and Esquenazi 2003).
The progressive neuromusculoskeletal pathology that occurs can include the
development of contractures and torsion of long bones (Graham et al 2004).
This can further limit mobility of children with CP and result in the need for
assistive devices to enable them to move around at home, at school and in the
community.
To be mobile is “the freedom to move from place to place” (Oxford English
Dictionary 1994). This is synonymous with being movable, portable or
transportable. “Mobility” falls into the ‘activities and participation’ component
of the International Classification of Functioning, Disability and Health (ICF)
(World Health Organisation 2001) that is explained further in Chapter Two. For
children with CP, mobility enables movement from place to place, participation
with their family and peers and the ability to function optimally in everyday life.
The heterogeneity of the population of children with CP means that there is the
potential for a very diverse and complex range of mobility states. For example,
some children may have difficulty with balance and coordination on uneven
surfaces as they walk from one place to another. Others who have more severe
motor impairment may require the use of assistive devices to mobilize, ranging
from crutches and walkers through to wheelchairs.

Chapter 1 - Introduction
2
Cerebral palsy is the most common cause of physical disability affecting
children in developing countries with an incidence of 2.0-2.5 per 1000 live
births (Stanley et al 2000). Physiotherapists and other clinicians require tools to
accurately measure and record changes in mobility across the spectrum of
mobility disorders observed in children with CP. Chapter Three of this thesis
will systematically examine the psychometric properties and clinical utility of
the available evaluative outcome measures that assess activity limitations in
children with CP. It will highlight that very few tools exist that measure
mobility in isolation and that many measure it within the context of a larger
inventory. It will also show that the FMS is the only tool to consider the
different assistive devices used by children with CP within the different
environmental settings of the home, school and wider community. The rationale
behind the development of the FMS will be explored in Chapter Four.
A preliminary study examined some aspects of reliability and validity of the
FMS (Graham et al 2004). Chapter Three will show that before the FMS can be
considered to be a psychometrically sound outcome measure to quantify
mobility in children with CP, further examination of its psychometric properties
is required. As well as ensuring that the FMS is based on a valid theoretical
construct, Chapters Five to Eight of the thesis investigate the inter-rater
reliability and concurrent, construct, and discriminative validity and
responsiveness to change of the scale. The extent to which the FMS can be used
with confidence as a performance measure of mobility for children with CP is
explored. The ultimate aim is to have a psychometrically sound and clinically
useful measurement tool that quantifies mobility in children with CP.
The key research questions to be addressed in the thesis are:
i. What are the psychometric properties and clinical utility of the available
evaluative measures of activity limitation for children with CP?
ii. What is the inter-rater agreement of the FMS when tested by a range of
clinicians from different professional backgrounds?

Chapter 1 - Introduction
3
iii. What is the responsiveness to change of the FMS for detecting clinically
significant change following orthopaedic surgery and spasticity
management?
iv. Does the information obtained from the FMS via self-report of the
assistance required in the different settings of the home, school and
community accurately reflect the mobility status of children with CP?
v. What is the concurrent validity of the FMS with a similar measure of
mobility and classification system of activity limitation as criterion
measures?
vi. Is the FMS able to discriminate the severity of activity limitation in
children with CP as classified by the Gross Motor Function Classification
System (GMFCS)?
1.2. Aims and hypotheses
1.2.1. Aims
In response to the key research questions, the aims of this thesis were to:
i. critically evaluate the literature on existing evaluative outcome measures
that assess activity limitation by systematically appraising the design of
the studies and the psychometric properties and clinical utility of the
measures;
ii. determine the inter-rater agreement of the FMS in children with CP using
a large number of clinicians as raters from different clinical professions.
This includes examining the agreement for different age groups and
severity of CP of the children and the existence of any systematic bias of
raters;
iii. examine the ability of the FMS to detect minimal clinically important
differences in mobility status following orthopaedic surgery and spasticity
management;
iv. examine one aspect of construct validity of the FMS by comparing FMS
ratings performed by usual administration method with direct observation
at home and school;

Chapter 1 - Introduction
4
v. determine the concurrent validity of the FMS by correlating it with the
walking scale of the Gillettte Functional Assessment Questionnaire (FAQ)
and the GMFCS;
vi. examine the discriminative validity of the FMS by determining if it can
discriminate severity of activity limitation of children with CP as
classified by the GMFCS.
1.2.2. Hypotheses
The hypotheses were:
i. The clinical utility of the available evaluative measures used in children
with CP that assess activity limitation will vary according to their proven
psychometric properties, the dimensions of activity they measure and their
purpose for application in CP.
ii. There will be a high level of inter-rater agreement for the FMS in children
with CP using a large group of raters from various clinical backgrounds.
The level of agreement will be different for children of different age
groups and severity of CP.
iii. The FMS will be able to detect clinically important differences in
functional mobility in children with CP where change in mobility occurs;
it will show change in children having orthopaedic surgery and will show
stability in children having botulinum toxin injections.
iv. The mobility status of children with CP observed within the environmental
settings of home and school will have substantial agreement with the self-
report ratings of the FMS.
v. The FMS will have a strong positive relationship with the FAQ and a
strong negative relationship with GMFCS levels.
vi. The FMS will discriminate severity of activity limitation in children with
CP using the GMFCS for children classified as GMFCS levels I-IV.

Chapter 1 - Introduction
5
Figure 1.1 Concept map of thesis structure
Chapter 7
Study 5: Construct
validity of the FMS
Variety of mobility methods used and
agreement between self-report FMS and
direct observation of children in their own
environments
Chapter 8
Study 6:
Discriminative and
concurrent validity of
the FMS
Concurrent validity of the FMS by
correlating it with a similar outcome
measure and ability of the FMS to
discriminate severity of CP as described
by GMFCS
Chapter 9 Grand discussion Synthesis of findings, clinical
implications, limitations, future
directions and conclusions
Chapter 6
Study 4:
Responsiveness to
change of the FMS
Responsiveness to change of the FMS for
children undergoing orthopaedic surgery
and spasticity management
Chapter 5 Study 3: Reliability
of the FMS
Inter-rater reliability of the FMS using a
range of clinicians
Chapter 1
Introduction: the research
question, synopsis, aims
and significance of the
studies in the thesis
There is a need for psychometrically
robust outcome measurement tools to
assess mobility in children with CP to
document status, particularly after
interventions
Chapter 3
Critical appraisal of literature on
evaluative activity limitation outcome
measures used for children with CP;
psychometrics, feasibility and clinical
utility
Study 1: Systematic
review
Chapter 2
Description and classification of CP
within the ICF. Purpose and requirements
for outcome measurement in CP.
Outcome measurement
for children with CP
Chapter 4
Original development of the FMS and
ability of the FMS to detect change after
multilevel surgery
Development of the
FMS and
Study 2: pilot study

Chapter 1 - Introduction
6
1.3. Synopsis
The overall structure and conceptual basis of this thesis is summarised in the
concept map shown in Figure 1.1. It shows that the concepts of measurement
and the systematic review of activity limitation measures set the framework for
the remaining studies exploring the psychometric properties of the FMS. Study
2 is a retrospective pilot study. Three separate samples of children were
recruited prospectively for studies 3-6. The association between each of these
samples with respect to the various studies is illustrated in Figure 1.2. This
demonstrates that sample 2 and 3 were combined for data analysis in Study 6.
Figure 1.2 Samples recruited for overall thesis
Sample 2
118 children with CP Study 3
Reliability
Sample 3
96 children with CP
Study 6
Concurrent and
discriminative
validity
Study 4 Responsiveness to
change
Sample 4
18 children with CP
recruited from one
special school
Study 5
Construct validity
Sample 1
Retrospective sample of
66 children with CP
Study 2
Pilot study: change
after surgery
Chapter 1 - Introduction
7
1.4. Rationale of the thesis
The rationale for each study is outlined below.
1.4.1. Study 1: Systematic review of the activity limitation outcome
measures used in children with cerebral palsy
Chapter Three presents the results from a systematic review of the evaluative
activity limitation measures used in children with CP. It critically examines the
psychometric properties of the available tools as well as their feasibility and
clinical utility. A thorough understanding of the reliability, validity and
responsiveness of existing tools and the dimensions of activity measured was
considered to be a necessary prerequisite before further investigation of the
validity of the FMS was implemented. The review was conducted with a
focused literature search strategy and a precise review protocol for study
selection, data extraction and quality assessment. The methodology utilised was
based on guidelines for the scientific process behind conducting a systematic
review. This allowed for decisions on the clinical utility of the available
measures to be made based on the best possible evidence (Cook et al 1997,
Verhagen et al 2001, Herbert et al 2005). The results from this review facilitated
the structuring for the remaining studies investigating the FMS. This study has
been accepted for publication in Developmental Medicine and Child Neurology.
1.4.2. Study 2: Development of the FMS and pilot study
The aim of Chapter Four is to provide the background to the initial development
of the FMS. It includes the rationale of why the scale was developed, the target
population and how it was developed. The administration method of the FMS
and the clinical feasibility of the scale are also described. This chapter reports an
initial pilot study of the FMS investigating its ability to detect change following
single event multilevel surgery in children with CP, a population for which the
scale was developed. This study has been published in Developmental Medicine
and Child Neurology (2007) 49:603-607. A copy of the FMS is provided in
Appendix A and a brochure is located inside the back cover of this thesis.
Chapter 1 - Introduction
8
1.4.3. Study 3: Reliability of the Functional Mobility Scale
Chapter Five reports the results from an investigation into the inter-rater
reliability of the FMS. The FMS was developed for use by clinicians from
different professional backgrounds to assess mobility in children with CP. Inter-
rater reliability is critical in the population of children with CP because they will
be assessed by many different clinicians over their lifetime. It is imperative that
consistency between clinicians be established before the FMS can be used
reliably. Not only does this imply consistency between large numbers of
clinicians, it also indicates a need to ensure consistency between clinicians from
different professional backgrounds and settings. This study examines the inter-
rater reliability using a large number of raters as clinicians and determines the
agreement between clinicians from the hospital setting as well as those in the
community setting. It also examines agreement using physiotherapists and
orthopaedic surgeons. If agreement between raters was found to be high then the
FMS could be considered a reliable measure of mobility for the population
examined in this study.
1.4.4. Study 4: Responsiveness to change of the FMS
Chapter Six examines whether the FMS is able to detect clinically important
change, that is, the responsiveness to change of the scale. Evaluative measures
are required to have proven responsiveness to change as a prerequisite
measurement property before they can be used confidently as outcome measures
(Kirschner and Guyatt 1985). The FMS was developed to assess mobility and,
in particular, to evaluate change in mobility following interventions such as
orthopaedic surgery. It is therefore essential that the ability of the FMS to detect
clinically important change in the population of children with CP undergoing
these types of interventions is investigated. As well as detecting change, it is
also important that the FMS can show stability where no change has occurred.
This study examines change in mobility in children following single event
multilevel surgery and Botulinum toxin injections. Change in mobility status
from the pre-intervention baseline are analysed at regular post-intervention
periods to determine if the FMS is able to detect change occurring. A
comparison of change in mobility following SEMLS and Botulinum toxin
injections are also examined. If the FMS is found to detect clinically important

Chapter 1 - Introduction
9
change, it would support the use of the tool in children with CP to monitor
change over time following such interventions.
1.4.5. Study 5: Construct validity of the FMS
Chapter Seven examines one aspect of construct validity of the FMS by
comparing FMS ratings obtained by usual administration method with direct
observation of the children at their schools and within their homes. The FMS is
administered by self report from the child or parents. Like other self-report
measures, there is an assumption that what is reported accurately reflects true
performance. One way to ascertain this is to compare self-report with direct
observation of performance. This is examined by comparing the clinical FMS
ratings of a group of children with direct observation of their mobility methods
at their school and home. This study was considered both a necessary and
interesting component of this thesis to investigate the validity of the FMS. It
was also considered to be a key concept to examine for the field of measurement
in CP because the issue of whether any self report measure reflects performance
has not been adequately investigated.
1.4.6. Study 6: Discriminative and concurrent validity of the FMS
Chapter Eight investigates the concurrent and discriminative validity of the
FMS. It examines the correlation of the FMS with another measure of mobility,
the Gillette Functional Assessment Questionnaire (FAQ), as well as the
correlation of the FMS and the GMFCS, a descriptor of gross motor function.
This was considered important to examine to ensure the FMS measures activity
and physical function, yet is not so similar to existing measures that its use is
not warranted. Discriminative validity was considered another factor to support
the overall validity of the FMS. The scale’s ability to discriminate severity of
motor impairment of CP as determined by the GMFCS level of the children was
examined using the combined sample for Study 2 and Study 3. The results of
these two investigations will provide further evidence to support the validity of
the FMS as a measurement tool for children with CP.

Chapter 1 - Introduction
10
1.5. Significance of the research
The results of this investigation have the potential to positively impact children
with CP and their families, physiotherapists and other clinicians who work with
children with CP, health care providers and the general community.
Physiotherapists and other clinicians require valid outcome measures that
quickly and easily measure mobility in children with CP. Not only do they have
to be available and show clinical utility, they also have to be reliable and valid
(Law et al 1999). Mobility is a key component of activity that enables children
with CP to negotiate the relevant environments of home, school and community
settings in order to participate in society with their family, peers and members
of the community. This research aims to provide a reliable and valid tool to
measure mobility for use by physiotherapists and other clinicians who manage
children with CP. The FMS will then be available and suitable for use in both
clinical and research settings.
The unique aspect of the FMS is its ability to quantify the variety of different
assistive devices that children use in a range of environments. Within the
clinical setting, it has the potential to document mobility status of children with
CP at one point in time and to assess change in mobility status over time. The
information obtained could be used to track improvement or deterioration in a
child’s mobility over time and to help guide decision-making for further
intervention or therapy. It also has a potential role in measuring change in
mobility following costly interventions such as orthopaedic surgery and
spasticity management. These interventions are implemented with the aim of
maintaining or improving functional abilities, such as mobility, in children with
CP (Graham and Harvey 2007). It is therefore essential that physiotherapists and
other clinicians can measure and document changes in mobility following
treatments. It can also be important to document both improvement and
deterioration (Harvey et al 2007). By measuring the changes in mobility
associated with interventions we can better gauge their effectiveness and
improve decision-making for intervention strategies. This could benefit children
and their families by ensuring that they receive the best possible care and obtain
the optimal outcome. This in turn could benefit health care providers and the

Chapter 1 - Introduction
11
general community with more targeted treatment and improved overall health of
children with CP.
Within the research setting, the FMS could become a key outcome measure for
epidemiological studies examining change in function in children with CP over
time, longitudinal studies investigating changes in mobility throughout
childhood into adulthood and trials into the effects of interventions. Because the
FMS is specific to mobility, it will provide information on activity levels. It
could be used in conjunction with other valid and reliable outcome measures
that focus on different domains of disability and health, such as body structures
and function and participation measures. This could enable a comprehensive
picture of the health status of children with CP to be obtained for research and
clinical purposes. Using the FMS within the research setting could add to the
current body of knowledge of activity patterns in children with CP, particularly
with respect to treatments. The results also have the potential to advance current
clinical management of children with CP by tailoring treatment to ensure
optimal mobility results from costly interventions, ensuring overall better health
care. Optimal mobility allows children to participate fully within their relevant
environments (Palisano et al 2003). By accurately measuring mobility with tools
such as the FMS, and by ensuring our interventions are optimizing mobility, the
participation of these children will also be optimized.
The unique features of the FMS with its focus on mobility and assistance
required warrant its development and validation. The FMS is clinically feasible
and can be used in many clinical settings, including those with limited
resources. It requires no equipment and minimal training for administration and
is not time consuming to complete. It therefore has the potential to be very
useful clinically. Before it is utilized more widely, the reliability and validity of
the FMS need to be thoroughly investigated to ensure that it is psychometrically
sound. This thesis examines these psychometric properties to determine whether
the FMS can be utilized more widely.


Chapter 2 – Outcome Measurement in CP
13
CHAPTER TWO: OUTCOME MEASUREMENT FOR
CHILDREN WITH CEREBRAL PALSY
This chapter will explore CP within the context of the International
Classification of Functioning, Disability and Health (ICF), with a focus on
outcome measurement. Cerebral palsy will be introduced briefly, followed by
discussion of how the clinical manifestations can be described, classified and
measured with consideration of the ICF domains. Most emphasis will be
directed towards activity limitation because this is the domain of the ICF that
the FMS quantifies. This background will provide the basis for the systematic
review on activity limitation outcome measures reported in Chapter Three. The
concepts of capability and performance and the influence of the environment on
activity will also be explored because these are key factors underpinning the
development of the FMS (see Chapter Four). The purposes and prerequisites for
outcome measurement using tools such as the FMS will be examined for
children with CP. This will provide a background against which the results of
the psychometric testing of the FMS can be interpreted.
2.1. Cerebral palsy: definition and incidence
The FMS was developed to quantify mobility in children with CP. Cerebral
palsy is the most common cause of physical disability affecting children in
developed countries with an incidence of 2.0-2.5 per 1000 live births (Stanley et
al 2000). The classic definition of CP is “a disorder of movement and posture
due to a defect or lesion of the immature brain” (Bax 1964). This definition was
modified in 1992 to encapsulate the heterogeneity of the disorders covered by
the term CP to; “an umbrella term covering a group of non-progressive, but
often changing, motor impairment syndromes secondary to lesions or anomalies
of the brain arising in the early stages of development” (Mutch et al 1992).
The definition of CP has been revised recently by an executive committee for a
report on the Definition and Classification of Cerebral Palsy, April 2006, to
incorporate concepts developed by the ICF (Rosenbaum et al 2007). The
proposed definition is;

Chapter 2 – Outcome Measurement in CP
14
‘Cerebral palsy describes a group of permanent disorders of the
development of movement and posture, causing activity limitation, that
are attributed to non-progressive disturbances that occurred in the
developing fetal or infant brain. The motor disorders of cerebral palsy
are often accompanied by disturbances of sensation, perception,
cognition, communication, and behaviour by epilepsy, and by secondary
musculoskeletal problems’ (Rosenbaum et al 2007).
2.2. Clinical presentation of cerebral palsy within the
International Classification of Functioning, Disability and
Health (ICF)
Cerebral palsy incorporates a wide variety of clinical presentations and the term
“cerebral palsies” is now often used to indicate the diversity and heterogeneity
of the disorder (Miller and Clark 1998, Stanley et al 2000). The ICF (World
Health Organisation 2001) is considered in this section because it is a
framework that can be utilised to describe the clinical manifestations of CP. The
framework and how CP presents clinically within it are outlined below.
Outcome measurement for children with CP can be tailored around the different
domains of the ICF as will be presented in section 2.5.3. The focus of this thesis
is mobility of children with CP as measured by the FMS. This corresponds to
the activities and participation domain of the ICF. For this thesis, the ICF was
used to assist with defining the features of CP and external influences that the
FMS aims to quantify. It also enabled structuring the critical evaluation of
available outcome measures used for children with CP.
2.2.1. What is the ICF
The ICF aims to provide a unified and standard language and framework for the
description of health and health-related states (World Health Organisation
2001). It incorporates biological and social perspectives of disablement to
represent more fully the impact of health conditions, such as CP, on an
individual’s life, including participation in society (Beckung and Hagberg
2002). The domains represented in the ICF are described from the perspective
of the body, the individual and society for body functions and structures, and
activities and participation (World Health Organisation 2001). They are
Chapter 2 – Outcome Measurement in CP
15
described along with the components of contextual factors of environmental and
personal factors which may impact a person’s health state (World Health
Organisation 2001). An individual’s functioning in a specific domain is an
interaction or complex relationship between the health condition and contextual
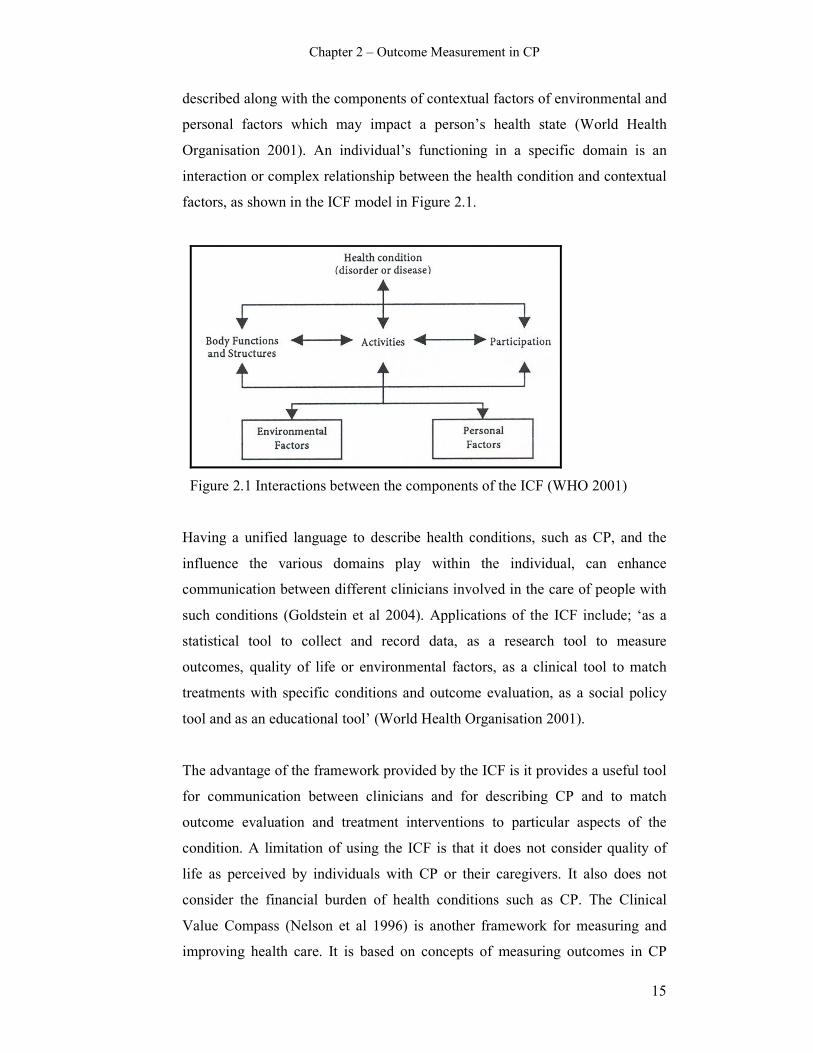
factors, as shown in the ICF model in Figure 2.1.
Figure 2.1 Interactions between the components of the ICF (WHO 2001)
Having a unified language to describe health conditions, such as CP, and the
influence the various domains play within the individual, can enhance
communication between different clinicians involved in the care of people with
such conditions (Goldstein et al 2004). Applications of the ICF include; ‘as a
statistical tool to collect and record data, as a research tool to measure
outcomes, quality of life or environmental factors, as a clinical tool to match
treatments with specific conditions and outcome evaluation, as a social policy
tool and as an educational tool’ (World Health Organisation 2001).
The advantage of the framework provided by the ICF is it provides a useful tool
for communication between clinicians and for describing CP and to match
outcome evaluation and treatment interventions to particular aspects of the
condition. A limitation of using the ICF is that it does not consider quality of
life as perceived by individuals with CP or their caregivers. It also does not
consider the financial burden of health conditions such as CP. The Clinical
Value Compass (Nelson et al 1996) is another framework for measuring and
improving health care. It is based on concepts of measuring outcomes in CP

Chapter 2 – Outcome Measurement in CP
16
(Goldberg 1991). It recognizes 4 domains; functional health status, costs,
clinical outcomes and satisfaction. Although the compass does include costs, the
ICF is more commonly used for describing health conditions, including CP, and
is the framework used as the model for conceptualizing activity in this thesis.
2.2.2. Cerebral palsy within body functions and structure
Within the ICF, body functions are the physiological functions of body systems
and body structures are anatomical parts of the body such as organs, limbs and
their components (World Health Organisation 2001). Impairments are problems
in body function or structure as a significant deviation or loss (World Health
Organisation 2001). The primary injury in CP is the brain lesion resulting in an
upper motor neurone lesion which is considered to have a number of positive
and negative features (Graham and Selber 2003, Mayer and Esquenazi 2003).
The positive features include spasticity, hyper-reflexia and co-contraction and
the negative features include weakness, loss of selective motor control and
deficits in balance and coordination (Gage and Novacheck 2001, Mayer and
Esquenazi 2003). The interaction between spasticity and weakness leads to both
neural and mechanical changes in muscle and progressive musculoskeletal
pathology (Bache et al 2003). The changes in muscle length and structure that
occur in the muscles and bones of the extremities are therefore secondary to the
central nervous system lesion (Gage and Novacheck 2001). Overall, whilst the
underlying brain lesion in CP is static, the musculoskeletal manifestations are
progressive (Bache et al 2003).
The upper motor neurone lesion and the progressive musculoskeletal pathology
in children with CP may produce gait deficits. Gait deficits in children with CP
can be considered as primary, secondary or tertiary (Davids et al 2003). They
are primary when they relate directly to the underlying disorder of the central
nervous system, for example spasticity. Secondary deficits occur as a
consequence of growth and development of the musculoskeletal system and are
usually progressive over time, for example skeletal deformities and muscle
contractures (Davids et al 2004). Tertiary coping responses are used to
counteract the effects of primary and secondary deviations and can be
compensatory (Bache et al 2003). Consideration and understanding of
Chapter 2 – Outcome Measurement in CP
17
progressive musculoskeletal changes are critical to the prevention and
management of impairments and disability in children with CP (Graham 2006).
The musculoskeletal pathology and resulting gait deficits can impact on
activities, including mobility. This can in turn affect the children’s participation
as will be described in the following section. Tools such as the FMS are
required to measure the impact of pathology on activity and participation in
children with CP.
2.2.3. Cerebral palsy within activities and participation
Within the ICF, activity is the execution of a task or action by an individual and
participation is involvement in a life situation (World Health Organisation
2001). Activity limitations are difficulties an individual may have in executing
activities and participation restrictions are problems an individual may
experience in involvement in life situations (World Health Organisation 2001).
In separating the two, activity limitation can be thought of as difficulty at the
person level and participation restriction at the societal level (Schneidert et al
2003).
The FMS quantifies mobility and this can be classified within the activities and
participation component of the ICF. Mobility involves “moving by changing
body position or location or by transferring from one place to another, by
carrying, moving or manipulating objects, by walking, running or climbing, and
by using various forms of transportation” (World Health Organisation 2001).
The FMS focuses on walking or wheelchair mobility in order for the child to get
from one place to another. How well children mobilise can be associated with
their levels of participation with their peers and family. Reduced mobility can
limit their participation. Activities and participation therefore, is a key area of
focus for outcome assessment and planning of interventions for children with
CP.
The influence of mobility and physical function on activities and participation
was examined in a study using family assessed instruments in 129 children with
CP aged 6-12 years (Morris et al 2006). It reported that physical independence
and mobility had the most influence on children’s activities and participation,

Chapter 2 – Outcome Measurement in CP
18
compared to clinical or economic burden and social integration. This finding is
not surprising given that mobility is closely related to activities and
participation, as found by the study. Another study examined participation
levels in 427 children with physical limitations aged 6-14 years using the
Children’s Assessment of Participation and Enjoyment (CAPE) (Law et al
2006). Children displayed a broad range of diversity and intensity of
participation with greater involvement in informal activities than formal
activities. Informal activities occur more spontaneously with less planning
whereas formal activities are more planned and tend to involve organised sports.
Children older than 12 years had lower overall participation levels than younger
children. Children with physical disabilities participated in an average of only
three out of 10 active physical activities. This descriptive study provided
important information showing reduced activity levels of children with CP,
particularly for older children. It also provided evidence that children with CP
tend to participate in formal activities less often.
Other studies have also shown that activity and participation levels in children
with CP are influenced by the severity of motor impairment, with more reduced
activity and participation levels in those children with greater motor impairment
(Beckung and Hagberg 2002, Schenker et al 2005). All of these studies suggest
that children with CP who have limited mobility participate less in physical
activities that might be important for both their physical and general well-being.
The effectiveness of interventions and treatments for children with CP that aim
to improve mobility and activity require examination. There is a need for
reliable and valid measures to assess the effects of such interventions on activity
and participation in children. This is the focus of the systematic review reported
in Chapter Three.
2.2.4. Environmental factors and cerebral palsy
This section of the thesis discusses how mobility and activity in children with
CP are influenced by environmental factors. When measuring activity, these
environmental factors require consideration. These concepts were instrumental
in the development of the FMS reported in Chapter Four.

Chapter 2 – Outcome Measurement in CP
19
Environmental factors are external to the individual and make up the physical,
social and attitudinal environment in which people conduct their lives (World
Health Organisation 2001). Awareness of the dynamic between the child and
surroundings and how this affects performance is important when considering
the range of interventions possible to increase participation in the home, school
and community (Goldstein et al 2004). Children’s environments change across
the stages of infancy, early childhood, middle childhood and adolescence and
these changes can influence the child’s interactions (Simeonsson et al 2003).
Outcome assessment for activity and participation in children with CP therefore
needs to consider the environments that are relevant to the age group of the
child being measured.
Participation in children with CP can be influenced by where they live (Hammal
et al 2004) and by the socio-economic status of the family (Law et al 2006).
Physical aspects of the environment that might affect mobility include
accessibility, surfaces, obstacles, distances as well as time constraints. A child is
more familiar with their home environment, which is likely to be more constant,
than the community setting which also has longer distances to adapt to (Palisano
et al 2003). The effect of the environmental setting on usual mobility methods in
children with CP has been investigated (Palisano et al 2003, Tieman et al 2004).
Both of these studies asked parents to report the usual methods their children
used for mobility in the settings of home, school and the wider community.
The first study examined methods in a stratified sample of 636 children with CP
aged 2-12 years, GMFCS levels I-IV (Palisano et al 2003). This found that
children used a range of different methods in different settings, particularly
those children classified GMFCS level II-IV. Children were more dependent on
adult assistance outdoors and in the community compared with at school and
less dependent at home. Children younger than 3 years were generally more
dependent on adult assistance for mobility than those aged 4-12 years. The
second study examined changes in methods over time and across settings in a
smaller group of 62 children aged 6-14 years who were classified as GMFCS
level II-IV (Tieman et al 2004). This group was studied because they had
previously shown to display more variability in their mobility methods
Chapter 2 – Outcome Measurement in CP
20
compared to children in levels I and V. At home the most common methods
were floor mobility or walking. At school walking with a mobility aid or
powered mobility was the most common method used. Wheelchairs were the
most common method used in the outdoors/community. Across settings children
used methods requiring less assistance at home than school and at school less
assistive methods than in the community.
A limitation of these two key studies is that they did not distinguish the different
types of assistive devices children with CP use, for example whether they use a
walker or crutches. However they are important because they highlight the
variety of mobility methods used by children with CP. They also demonstrate
that mobility methods can change as a result of environmental setting. The
results confirm that it is very important for clinicians to consider the
environmental setting when assessing an activity such as mobility. They also
emphasize the need to consider and quantify the range of mobility methods
children use within each setting because the same child may use more than one
method. The effect of environmental setting will also influence the mobility
methods used as children grow and change over time and following treatments
and interventions, such as orthopaedic surgery and spasticity management.
Because the environmental setting may influence mobility methods children
use, it is important that clinicians are able to measure this with reliable and valid
tools. The FMS aims to do this. These have been key studies in the development
of the FMS and will be explored further in Chapters Four and Seven.
2.2.5. The ICF qualifiers of capability and performance
It is important to consider whether an outcome tool is measuring capability or
performance because this can influence the level of ability recorded and how
that information is applied. Performance and capability are the two qualifiers
within the activities and participation component of the ICF (World Health
Organisation 2001). Performance describes what an individual does in his or her
current environment and can also be understood as “involvement in life
situation”. This includes the environmental factors. Capacity describes an
individual’s ability to execute a task or action and indicates the highest probable
level of functioning (World Health Organisation 2001). Performance can be
Chapter 2 – Outcome Measurement in CP
21
thought of as what a person “does do” in the usual circumstances of everyday
life and capability as what a person “can do” in a defined situation apart from
real life (Young et al 1996). Service providers usually want to know what a
child’s capability is, that is their capacity in the clinical setting, however in
natural environments there are different obstacles and barriers and performance
may be quite different (Rosenbaum and Stewart 2004).
Children with CP can show differences between capability and performance.
This relationship was examined in 28 physically disabled children using the
Activities Scale for Kids (ASK) (Young et al 1996). The ASK is a self-report
measure of activity that has both a performance and a capability version, the
difference being on how the questions are worded. Capability exceeded
performance in the total summary score and capability consistently exceeded
performance on all items. In another study, gross motor capability and
performance were compared in 307 children with CP aged 6-12 years across
environments using the Gross Motor Function measure (GMFM) (Tieman et al
2004). Children were grouped based on capability from their GMFM scores.
Those with similar capability demonstrated differences in performance across
settings as determined by a parent-completed questionnaire on usual mobility
methods.
These studies both suggest that what a child “can do” is often not what they “do
do”. This has implications for both the measuring function and planning
interventions. Treatments may improve capability in the clinical setting,
however if the improvements do not translate into improved performance the
child has not received benefit. This is because performance tells more about the
child’s usual function in their everyday settings and is more relevant to the child
and family (Young et al 1996). Information on capability cannot therefore be
automatically extrapolated to performance. Performance in the settings that are
important to the children and their usual daily life should be assessed and the
environmental factors that hinder or facilitate mobility should be considered
(Tieman et al 2004). These studies were important for ensuring that the FMS
measured performance during its development.
Chapter 2 – Outcome Measurement in CP
22
2.3. Classification of cerebral palsy
Within this thesis, classification of severity of the motor impairment of the
children involved was used to describe the samples and to examine various
aspects of validity. One of the striking characteristics of CP is its variability of
presentation (Liptak and Accardo 2004). It is a heterogeneous group of clinical
syndromes with a variety of manifestations (Stanley et al 2000, Graham and
Selber 2003). Because of this variability it is important that reliable
classifications systems exist for children with CP. Classification is required to
further categorise individuals with CP into groups with the purposes of;
describing the nature of the problem and its severity, predicting potential future
status, comparing different series of cases and evaluating change in individuals
at different points in time (Rosenbaum et al 2007). Classification can serve to
track incidence and features, educate families with respect to prognosis and
assist service planning for service providers (Gorter et al 2004).
2.3.1. Traditional methods of classification
Traditional methods of classification have focused on topographical distribution
(Balf and Ingram 1955, Minear 1956), severity and type of movement disorder
(Fay 1950, Perlstein 1952). Topographical distribution classifies children based
on the distribution of involvement of the limbs of the body. The most common
distribution terms used are hemiplegia, diplegia and quadriplegia, however
terms such as monoplegia and triplegia are also used (Delgado and Albright
2003).
Spastic diplegia describes a child with gross motor problems, particularly
marked in the lower limbs, with usually partially retained fine motor function in
the upper limbs (Stanley et al 2000, Bax et al 2007). Spastic quadriplegia refers
to the involvement of all four limbs and the trunk (Gorter et al 2004) with
severe motor involvement with virtually no hand movements and many have
very little speech and language (Bax et al 2007). The child with hemiplegia
typically has problems restricted to one side of the body (Bax et al 2007) with
involvement of both the upper and lower limb (Stanley et al 2000).
Chapter 2 – Outcome Measurement in CP
23
There is very little evidence of the reliability of using topographical distribution
to classify children with CP and there is also disagreement amongst clinicians
regarding the topographical patterns found. Poor reliability of topographical
classification can be due to the inconsistency of distinctions between ‘severe
diplegia’ and quadriplegia, and between asymmetrical hemi-syndromes and
bilateral CP (Howard et al 2005). The Surveillance of Cerebral Palsy in Europe
(SCPE) decided to use a simplified classification of spastic children of unilateral
or bilateral CP due to the difficulty in agreement between different
topographical categories (Surveillance of Cerebral Palsy in Europe (SCPE)
2002). Bilateral spastic CP is the most common syndrome among the different
types of CP (Krageloh-Mann et al 1995).
Classification of CP by movement disorder includes spastic CP (85% of the CP
population), dyskinetic (7%), ataxic (5%), hypotonic (0.5%) and mixed (2.5%)
(Stanley et al 2000). Spastic CP is the most common type of movement disorder
and is characterised by abnormal voluntary control, resistance to passive stretch
and exaggerated reflexes (Stanley et al 2000). Dyskinetic CP is characterised by
involuntary movements and fluctuating muscle tone (Delgado and Albright
2003). Mixed movement disorders often involve spastic with dyskinetic
disorders (Gorter et al 2004). Ataxic and hypotonic movement disorders are
relatively rare (Reddihough and Collins 2003).
Classification based on the severity of symptoms has used terms such as mild,
moderate and severe to help describe the degree of motor impairment (Balf and
Ingram 1955, Minear 1956, Blair and Stanley 1985). This method of
classification often requires individual judgement and can lack standardisation
(Palisano et al 1997, Oeffinger et al 2004). There is little evidence about the
reliability of classification systems based on motor impairment, severity and
topographical distribution (Gorter et al 2004). The few studies that have been
done have shown poor reliability for severity and motor impairment (Blair and
Stanley 1985) and classifications by motor type and topography are known to be
unreliable (Stanley et al 2000). Because of these issues with traditional
classifications, it has become apparent that additional characteristics should be
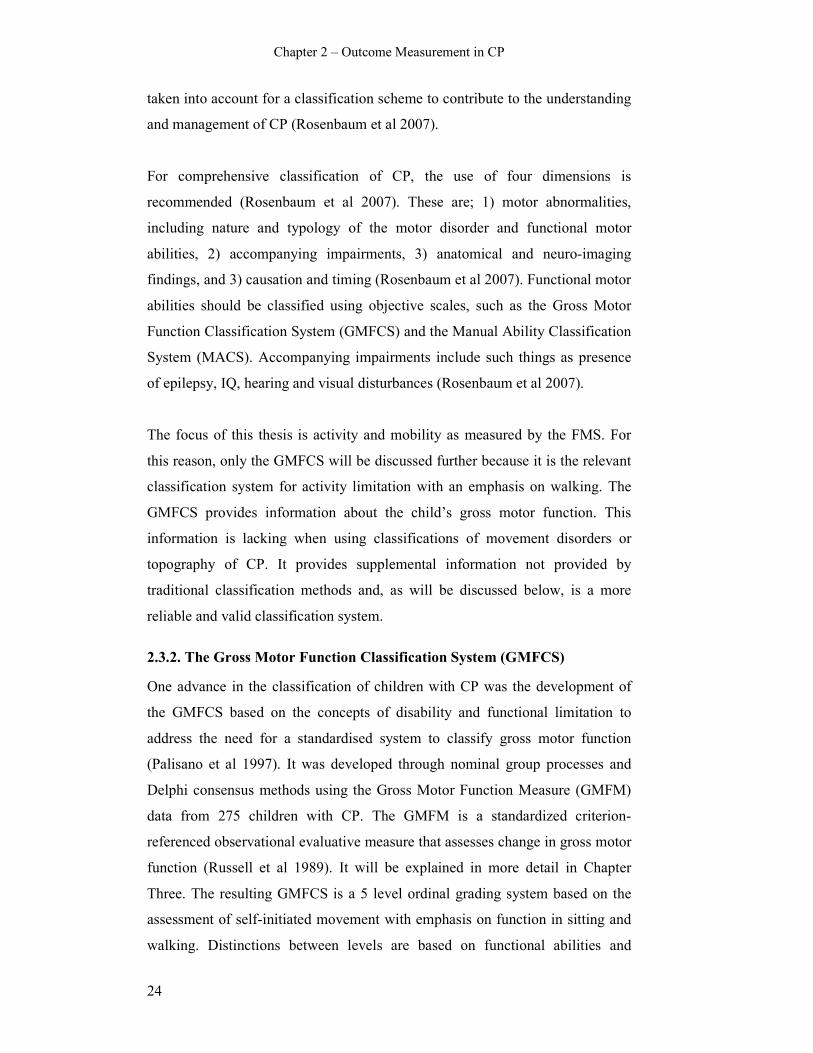
Chapter 2 – Outcome Measurement in CP
24
taken into account for a classification scheme to contribute to the understanding
and management of CP (Rosenbaum et al 2007).
For comprehensive classification of CP, the use of four dimensions is
recommended (Rosenbaum et al 2007). These are; 1) motor abnormalities,
including nature and typology of the motor disorder and functional motor
abilities, 2) accompanying impairments, 3) anatomical and neuro-imaging
findings, and 3) causation and timing (Rosenbaum et al 2007). Functional motor
abilities should be classified using objective scales, such as the Gross Motor
Function Classification System (GMFCS) and the Manual Ability Classification
System (MACS). Accompanying impairments include such things as presence
of epilepsy, IQ, hearing and visual disturbances (Rosenbaum et al 2007).
The focus of this thesis is activity and mobility as measured by the FMS. For
this reason, only the GMFCS will be discussed further because it is the relevant
classification system for activity limitation with an emphasis on walking. The
GMFCS provides information about the child’s gross motor function. This
information is lacking when using classifications of movement disorders or
topography of CP. It provides supplemental information not provided by
traditional classification methods and, as will be discussed below, is a more
reliable and valid classification system.
2.3.2. The Gross Motor Function Classification System (GMFCS)
One advance in the classification of children with CP was the development of
the GMFCS based on the concepts of disability and functional limitation to
address the need for a standardised system to classify gross motor function
(Palisano et al 1997). It was developed through nominal group processes and
Delphi consensus methods using the Gross Motor Function Measure (GMFM)
data from 275 children with CP. The GMFM is a standardized criterion-
referenced observational evaluative measure that assesses change in gross motor
function (Russell et al 1989). It will be explained in more detail in Chapter
Three. The resulting GMFCS is a 5 level ordinal grading system based on the
assessment of self-initiated movement with emphasis on function in sitting and
walking. Distinctions between levels are based on functional abilities and
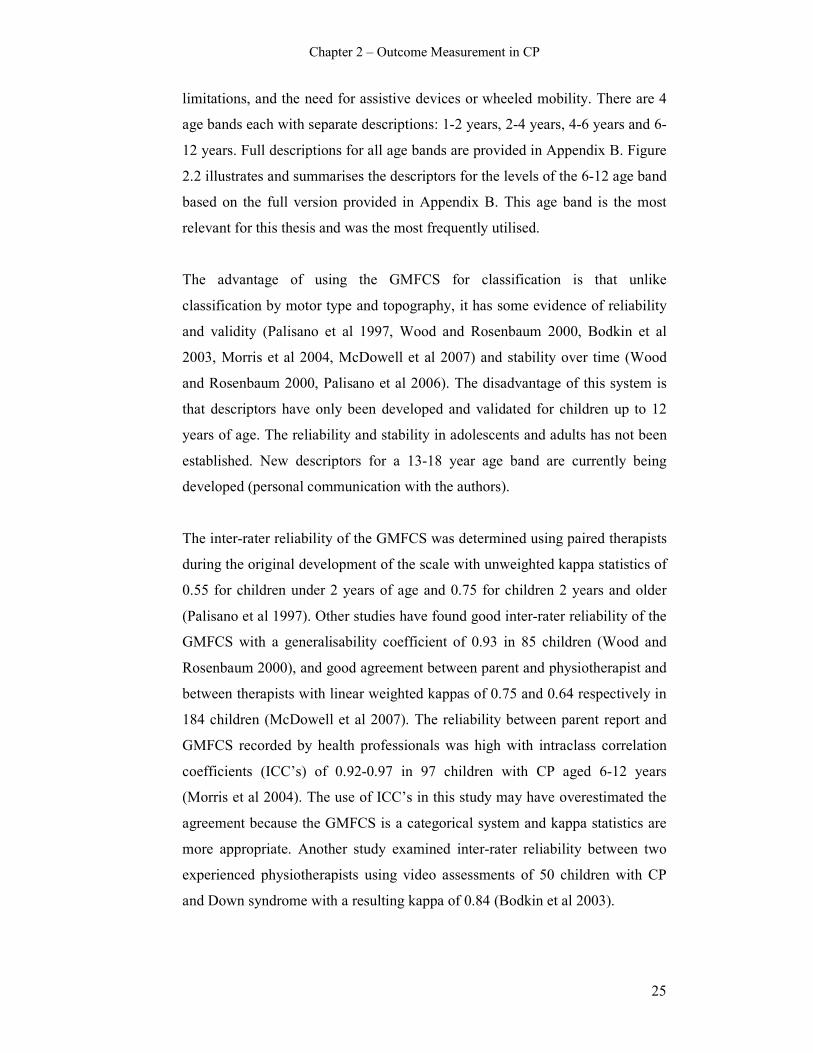
Chapter 2 – Outcome Measurement in CP
25
limitations, and the need for assistive devices or wheeled mobility. There are 4
age bands each with separate descriptions: 1-2 years, 2-4 years, 4-6 years and 6-
12 years. Full descriptions for all age bands are provided in Appendix B. Figure
2.2 illustrates and summarises the descriptors for the levels of the 6-12 age band
based on the full version provided in Appendix B. This age band is the most
relevant for this thesis and was the most frequently utilised.
The advantage of using the GMFCS for classification is that unlike
classification by motor type and topography, it has some evidence of reliability
and validity (Palisano et al 1997, Wood and Rosenbaum 2000, Bodkin et al
2003, Morris et al 2004, McDowell et al 2007) and stability over time (Wood
and Rosenbaum 2000, Palisano et al 2006). The disadvantage of this system is
that descriptors have only been developed and validated for children up to 12
years of age. The reliability and stability in adolescents and adults has not been
established. New descriptors for a 13-18 year age band are currently being
developed (personal communication with the authors).
The inter-rater reliability of the GMFCS was determined using paired therapists
during the original development of the scale with unweighted kappa statistics of
0.55 for children under 2 years of age and 0.75 for children 2 years and older
(Palisano et al 1997). Other studies have found good inter-rater reliability of the
GMFCS with a generalisability coefficient of 0.93 in 85 children (Wood and
Rosenbaum 2000), and good agreement between parent and physiotherapist and
between therapists with linear weighted kappas of 0.75 and 0.64 respectively in
184 children (McDowell et al 2007). The reliability between parent report and
GMFCS recorded by health professionals was high with intraclass correlation
coefficients (ICC’s) of 0.92-0.97 in 97 children with CP aged 6-12 years
(Morris et al 2004). The use of ICC’s in this study may have overestimated the
agreement because the GMFCS is a categorical system and kappa statistics are
more appropriate. Another study examined inter-rater reliability between two
experienced physiotherapists using video assessments of 50 children with CP
and Down syndrome with a resulting kappa of 0.84 (Bodkin et al 2003).
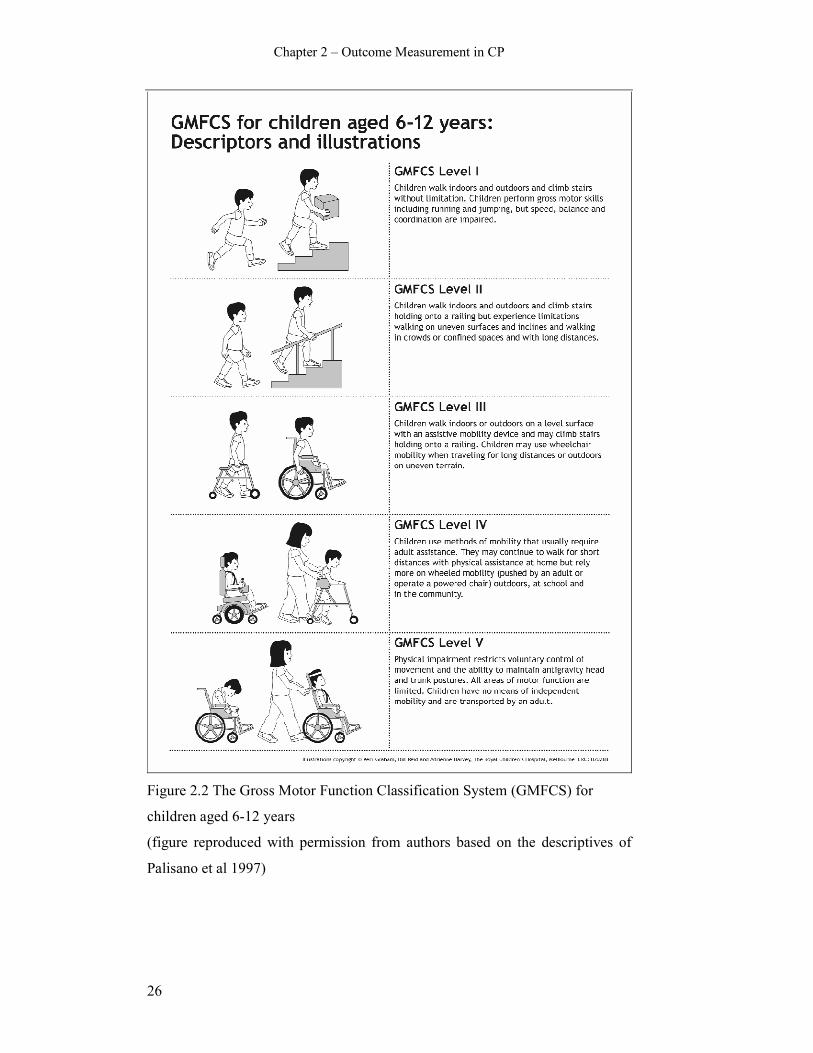
Chapter 2 – Outcome Measurement in CP
26
Figure 2.2 The Gross Motor Function Classification System (GMFCS) for
children aged 6-12 years
(figure reproduced with permission from authors based on the descriptives of
Palisano et al 1997)

Chapter 2 – Outcome Measurement in CP
27
The stability of the GMFCS has also been examined. This involves the extent to
which children remain in the same classification level over time. A study
examining stability over four different time periods in 85 children with CP
showed test-retest reliability to be 0.79 overall with ranges of 0.68-0.87 for
different time gaps (Wood and Rosenbaum 2000). A more recent prospective
study assessed the stability of the GMFCS in a large sample of 610 children
with CP aged 1-13 years (Palisano et al 2006). Children were assessed 2-7 times
with 73% of them remaining in the same level for all ratings. Weighted kappas
for agreement between first and last rating were 0.84 for children younger than
6 years and 0.89 for children 6-13 years. It is unclear in this study as to whether
any of the children had interventions between ratings, which might influence
whether children remain in the same level or change levels.
The GMFCS is now used internationally as a common language among
clinicians to describe and classify children with CP based on activity limitation
(Morris and Bartlett 2004). A review of the impact and utility of the GMFCS
found that it is now used extensively in developmental research to describe
relationships between functional limitations and comorbidities, for sampling
purposes and to select and describe samples, and in clinical practice to set goals
and devise interventions (Morris and Bartlett 2004).
Distribution of GMFCS levels among populations of children with CP from
Sweden, Canada, Australia and Europe vary slightly (Beckung and Hagberg
2000, Palisano et al 2000, Nordmark et al 2001, Howard et al 2005, Colver and
Group 2006, Himmelmann et al 2006). This is shown in Table 2.1. There is a
common trend of the highest percentage of children represented in level I and
varying spreads among the remaining levels.

Chapter 2 – Outcome Measurement in CP
28
Table 2.1 Percentage of children in GMFCS levels in different countries
GMFCS level
Authors
Sample
size
Country
I
II
III
IV
V
Palisano (2000)
586
Canada
28
13
19
21
19
Nordmark (2001)
167 Sweden 41 19 14 11 16
Howard (2005)
323 Australia 35 16 14 16 18
Beckung (2000)
116 Sweden 38 22 8 17 15
Himmelmann
(2006)
367 Sweden 32 29 8 15 16
Colver (2006) 818 9 European
centres
31 20 17 14 18
The GMFCS has been used to examine its relationship with limb distribution
(topographical distribution) and type of motor impairment in 657 children with
CP aged 1-13 years (Gorter et al 2004). Eighty eight percent of children with
hemiplegia were classified as GMFCS I. Children with bilateral CP were
represented in all GMFCS levels, with most in III, IV and V. This shows that
children with hemiplegia tended to have better activity levels as described by
GMFCS with the majority being able to walk independently. Children with
bilateral CP showed more diverse activity limitations with most requiring
assistance to ambulate and more limited mobility. The overall association
between classification at the impairment level (motor impairment and
topographical distribution) with that according to function (GMFCS), was
statistically significant but low. Grouping by impairment did not provide
additional prognostic information in terms of gross motor abilities (Gorter et al
2004).
A study comparing children with hemiplegia and diplegia within the same
GMFCS levels showed that children with hemiplegia performed consistently
better on gait and lower extremity function and poorer on upper extremity and
school function than those with diplegia (Damiano et al 2006). The authors
suggested that both means of describing and classifying children are required to
give full information because GMFCS level does not consider upper extremity

Chapter 2 – Outcome Measurement in CP
29
function. However, an alternative method of classification could include using
the GMFCS with the more recent MACS (Eliasson et al 2006). This could
potentially provide a more meaningful description of activity involving both
gross motor function focusing on walking with description and classification of
upper limb function.
Motor development curves for each GMFCS level have been created with
longitudinal data using the Gross Motor Function Measure (GMFM-66) in 657
children with CP aged 1-13 years (Rosenbaum et al 2002). The children were
observed serially for up to four years and the five curves created describe
differences in the rates and limits of gross motor development by severity of CP.
They show the estimated limit of development decreased as severity of
impairment increased with a trend for faster progression to the limit as severity
of impairment increased. For each curve an “age-90” was determined, which is
the age in years by which children were expected to reach 90% of their motor
development potential. Children with more severe impairment tended to reach
their limit more quickly, that is, they had a lower age-90. For children in level I
the age-90 was 4.8 years, in level II it was 4.4 years, in level III it was 3.7 years,
in level IV it was 3.5 years and for level V it was 2.7 years.
This longitudinal data makes it possible to consider prognosis of gross motor
development of children with CP based on severity of the initial motor
impairment. The information provides parents and clinicians with a way to plan
and implement treatments and judge progress. A potential limitation of these
curves is that children were classified on the GMFCS level once only, at initial
classification. It is possible that children may have changed levels over time;
however the authors believe that previous work determining the stability of the
GMFCS ensures reclassification would not be an issue (Wood and Rosenbaum
2000). Another potential limitation is that the children were assessed with the
GMFM-66 without the use of aids. Consequently, the curves potentially
represent the lower limit of the children’s gross motor function because those
who use aids would have scored higher on the GMFM if assessed using those
aids. Despite these limitations, the curves are an important development in the
prognostication of gross motor function and activity in children with CP.
Chapter 2 – Outcome Measurement in CP
30
2.4. Surgical and spasticity management for ambulatory
children with CP
It is not within the scope of this thesis to discuss all aspects of management of
children with CP because the focus is on outcome measurement. However,
because Chapter Six addresses changes in mobility after orthopaedic surgery
and spasticity management, a brief overview of these interventions will be
described. The focus is on surgery and spasticity management for the ambulant
child because the FMS is a mobility scale that primarily measures walking.
The secondary abnormalities seen in children with CP are amenable to
treatment, however the primary abnormalities are difficult to alter, with the
exception of spasticity (Gage and Novacheck 2001). One aim in the
management of spasticity is to prevent the development of fixed contractures
(Graham and Selber 2003). Options in spasticity management include
physiotherapy, orthotics, oral medications, intramuscular injections of
botulinum toxin, injections of Phenol to the motor nerves, selective dorsal
rhizotomy and intrathecal Baclofen (Gage and Novacheck 2001, Bache et al
2003). Botulinum toxin injections and/or casting are more effective for younger
children as are physiotherapy and orthoses, whereas older children often require
surgical intervention (Gage and Novacheck 2001).
Most children who have spasticity management will still require orthopaedic
surgery for the correction of fixed deformities due to the progressive nature of
the musculoskeletal deformities (Graham and Selber 2003). It is now generally
accepted that the surgical correction of musculoskeletal deformities for the
correction of gait deviations should be performed in one session (Browne and
McManus 1987, Nene et al 1993, Abel et al 1999, Fabry et al 1999, Saraph et al
2002, Bache et al 2003, Graham and Selber 2003). This ensures only one
admission to hospital and one rehabilitation period, and can be denoted as single
event multilevel surgery (SEMLS) (Bache et al 2003). The frequently used
procedures are muscle-tendon lengthenings, tendon transfers, rotational
osteotomies and bony stabilisation procedures (Bache et al 2003). The surgery
Chapter 2 – Outcome Measurement in CP
31
corrects anatomical deformities based on clinical and radiological examination
and a biomechanical analysis of gait deviations (Bache et al 2003).
2.5. Outcome measurement in children with cerebral palsy
Outcome research is necessary to quantify the effects of interventions and
justify the need for services (Majnemer and Limperopoulos 2002). Information
from outcome measurement is used to improve services and provide evidence of
the effectiveness of interventions (Law et al 1999). Reliable and valid outcome
measures need to be available to ensure this is done accurately (Majnemer and
Limperopoulos 2002). Outcome determination in the field of paediatric
rehabilitation is challenged by a lack of availability of sound instruments that
are appropriate across age groups from infancy to adolescence because the
evaluation of outcomes should occur in the context of ongoing growth and
development (Majnemer and Limperopoulos 2002).
Recent advances that have influenced outcome measurement include the
introduction of the ICF, recognition of the role of child and environmental
factors and the appreciation of the importance of key transitions in child
development in modifying outcome (Majnemer and Mazer 2004). The ICF can
guide the selection of measurement tools to inform goal setting and decision
making processes and to determine meaningful outcomes (Rosenbaum and
Stewart 2004). It helps promote a broader application of outcome measures to
ensure outcomes are being evaluated not only at the impairment level (body
functions and structures) but also at the individual and societal levels (activities
and participation) (Majnemer and Mazer 2004, Rosenbaum and Stewart 2004).
With a recent considerable increase in the number of published studies on
outcome assessment for children with CP there has been a trend towards a
broader perspective of well-being and level of community integration and an
increase in examining performance rather than capability (Majnemer and Mazer
2004).
In the past many outcome studies focused on the impairment rather than
functional limitations that result (Majnemer and Mazer 2004, Rosenbaum and
Stewart 2004). The focus has now shifted to comprehensively measure all areas
Chapter 2 – Outcome Measurement in CP
32
of the ICF and particularly at the activities and participation level which are
relevant and more meaningful to the children and their families. The ICF
encourages the use of a set of measures rather than one single one to assess all
dimensions.
2.5.1. Classification of measurement tools
Health status measures can be divided into three broad categories for application
of assessment (Kirschner and Guyatt 1985);
i. discriminative measures,
ii. predictive measures,
iii. evaluative measures.
The measurement of functioning and disability can be argued to have one of
those three aims (Dekker et al 2005). Discriminative measures are used to
distinguish between individuals or groups on an underlying dimension when no
external criterion is available (Kirschner and Guyatt 1985). Discriminative tools
can lead to the identification of children who are not functioning within age-
appropriate or performance-based expectations (Haley et al 1991). Predictive
measures are used to classify individuals into a set of predefined measurement
categories and generally used as a screening or diagnostic instrument (Kirschner
and Guyatt 1985). Evaluative measures are used to measure the magnitude of
longitudinal change in an individual or group (Kirschner and Guyatt 1985). This
classification of the different types of measures as they relate to children with
CP will be discussed further in the introduction of Chapter Three.
Evaluative tools are utilised more widely by clinicians working with children
with CP because they are interested in evaluating the effects of interventions
and treatments (Young and Wright 1995). The focus of this thesis is on the
FMS, which is an evaluative measure that assesses one aspect of activity
limitation. The remainder of this chapter and the systematic review in Chapter
Three will therefore concentrate on evaluative measures.
Chapter 2 – Outcome Measurement in CP
33
2.5.2. Required psychometric properties of evaluative measures
To ensure effective management of children, health service providers need to
evaluate the effects of their programs using outcome measures that have
demonstrated clinical utility, reliability, validity and clinical responsiveness
(Law et al 1999).
Reliability concerns the extent to which measurements are repeatable or
consistent (Nunnally 1978, Tooth and Ottenbacher 2004). Validity refers to the
degree to which an instrument measures what it is supposed to measure (Dekker
et al 2005). The validity of a test is one of its most important attributes and the
different aspects that need to be addressed are content, construct and criterion
validity (Baxter 2005). Some of these domains overlap which questions the
validity of separating them (Baxter 2005). Content validity covers the extent to
which the domains of interest are comprehensively sampled by the instrument
(Dekker et al 2005). Criterion-related validity entails both concurrent and
predictive validity. Concurrent validity concerns how a measure relates to a gold
standard while predictive correlates the scale with a future assessment for
predicting outcome (Baxter 2005). Construct validity refers to the extent to
which a measure scores on theoretically derived hypotheses concerning
constructs that are being measured (Dekker et al 2005). Discriminative validity
involves assessing the ability of a scale to distinguish between two groups, one
group that has the trait or behaviour in question and the other that does not
(Streiner and Norman 2003). Responsiveness refers to an instruments ability to
detect important change over time in the concept being measured and is very
important criteria for evaluative measures (Dekker et al 2005). Each of these
aspects of psychometric properties of measurement tools will be explored fully
in the relevant chapters of this thesis.
2.5.3. Outcome measures used for children with CP
In selecting an instrument to measure functioning and disability, the instrument
chosen should be best suited for the particular purpose in the specific context of
a clinical or research setting, not simply the instrument with the highest rating
(Dekker et al 2005). The assessment perspective is important when considering
what outcome measures to use and it is increasingly thought that the patient

Chapter 2 – Outcome Measurement in CP
34
perspective is considered to be one of the most important (Furlong et al 2005).
The age of the child impacts on the selection of assessment tools used
(Majnemer and Mazer 2004). Each instrument is validated for a specific age
range (Furlong et al 2005). With all of this in mind, each outcome measure
available for use in children with CP has been developed for a specific purpose,
a specific population and a specific age group. These factors need to be
considered when selecting instruments. The following section briefly covers the
measurement tools available as they relate to the different domains of the ICF,
and will focus largely on activity.
2.5.3.1 Body structures and functions
Tools used to assess body structures and function include such things as
goniometers, rulers and radiographs (Goldberg 1991). Diagnostic imaging can
evaluate skeletal alignment (Davids et al 2004). Clinical examination assesses
the range of motion of all major joints from the pelvis to the foot measured
using standardized techniques and goniometry and examination of selective
motor control and muscle strength (Davids et al 2004). Gait pathology can be
quantified using technical measures. Some clinicians believe that gait analysis is
mandatory for optimal treatment of problems relating to ambulation in CP by
accurately assessing dynamic gait problems and allowing more precise decision-
making (Gage and Novacheck 2001). A contrary view is that the variability seen
in gait analyses questions the routine use of this expensive and time-consuming
procedure in the management of children with CP (Wright 2003). Gait analysis
data provides a biomechanical basis for understanding pathological gait and
guides selection of various orthopaedic, neurosurgical and orthotic interventions
(Davids et al 2004). Some believe this has added greatly to the understanding of
pathological gait patterns and provides an objective outcome measure after
surgery for correction of gait (Graham and Selber 2003). Dynamic
electromyography data can provide valuable information concerning the timing
of muscle activation (Davids et al 2004).
2.5.3.2 Activities and participation
In the past, the focus of management of childhood disability has been to treat
the body structures and function with the assumption that improvements there
Chapter 2 – Outcome Measurement in CP
35
will translate to improvement in activity and hopefully to the child’s improved
participation (Rosenbaum 2007). Assessment of body structures and function
does not provide information about the impact on the day to day lives of
children. Functional health assessment concentrates on activities and
participation and these measures have been the focus in outcome measurement
in children with CP in more recent years. There are a number of tools available
that assess activity (often in conjunction with participation) and these will be
covered in the comprehensive systematic literature review in Chapter Three.
Many tools possibly assess both activity and participation and it is difficult to
separate the two. For example, the FMS (Graham et al 2004) and Gillette
Functional Assessment Questionnaire (FAQ) (Novacheck et al 2000) both
assess mobility primarily on an activity level but also include elements of
participation. Tools that focus on specifically on participation are summarised in
a systematic review of the clinimetric properties of measures of participation
(Sakzewski et al 2007) and a structured review of child or family assessed
measures of activity performance and participation (Morris et al 2005).
2.5.3.3 Role of environment and personal factors
The influence of factors on the child’s performance and functioning is important
to document as they change and grow (Simeonsson et al 2003). Intrinsic
variables such as the biological characteristics of CP and child’s personality
traits and external variables such as the school environment, family dynamics
and peer relationships, can also be determinants of outcome (Majnemer and
Mazer 2004). At any given capability level specific environmental factors may
have a profound impact on the actual functional performance and a focus on
environmental and contextual factors in assessment provides valuable
information (Haley et al 1991). Performance of walking, for instance, will
depend on the surface, the environmental setting and the social context in which
the child has chosen to move (Haley et al 1994). For this reason assessment
should include a strong contextual framework that includes all relevant
environments and activities that encompass the child’s essential life roles (Haley
et al 1994). The extent to which the environmental setting is a determining
factor in the lives of the child and family needs to be considered in outcome
measurement (Rosenbaum 2007).
Chapter 2 – Outcome Measurement in CP
36
2.5.3.4 Capability and performance
The environmental conditions are important when measuring because they help
define whether capability or performance are being measured (Young and
Wright 1995). The difference between capability and performance is related
strongly to environmental factors with capability suggesting it is free from
environmental constraints (Rosenbaum 2007). The primary advantages of
performance measures are they provide a direct assessment of community
function and measure limitations of direct relevance to patients, however in
some situations it may be that both capability and performance are measured to
identify areas of discrepancy (Young et al 1996). Many surgical and spasticity
management interventions might improve capability with a change seen in
measures used in the clinical setting. These changes may not necessarily
translate into improvements in performance, thus necessitating the need to
measure both capability and performance.
Chapter Three explores the available evaluative activity limitation measurement
tools that consider environmental setting and also explores whether these tools
measure performance or capability. The FMS is one tool that was developed as
a performance measure to incorporate the effect of the environmental setting on
one aspect of activity, mobility, in children with CP (Graham et al 2004). It is
particularly useful for assessing changes in assistance required following
complex orthopaedic surgery (Harvey et al 2007). The development of the FMS
will be described further in Chapter Four.
2.6. Conclusion
This chapter introduced CP by considering it with reference to the ICF. It also
argued the requirements for effective outcome measurement in CP with a focus
on evaluative tools that measure activity. Mobility lies within the activity
domain of the ICF. The effect of environmental settings on mobility in children
with CP was examined. It highlighted the need for the environmental setting to
be considered when quantifying mobility with evaluative measurement tools.
These background studies formed the basis of the development of the FMS
reported in Chapter Four. This chapter provides a foundation for the systematic
review reported in Chapter Three.

Chapter 3 – Systematic Review
37
CHAPTER THREE: SYSTEMATIC REVIEW OF ACTIVITY
LIMITATION MEASURES FOR CHILDREN WITH
CEREBRAL PALSY
3.1. Introduction
This chapter reports a systematic review and critical evaluation of the literature
on activity limitation outcome measures used for children with cerebral palsy
(CP). This review has been accepted for publication in Developmental Medicine
and Child Neurology (see Appendix I). The review concentrates on evaluative
measures used to measure the magnitude of longitudinal change in individuals
or groups over time (Kirschner and Guyatt 1985). This review assesses the
psychometric properties of evaluative activity limitation measures to determine
evidence of reliability, validity and responsiveness. The feasibility and clinical
utility of the measures will be examined to ascertain their value and benefit in
the clinical setting as well as their practicability. The review will also determine
if the measures adequately encompass key areas associated with activity
limitation.
In conceptualizing activity and activity limitation, the International
Classification of Functioning, Disability and Health (World Health Organisation
2001) defines activity as “the execution of a task or action by an individual” and
activity limitations as “difficulties an individual may experience in executing
activities”. Participation is “the involvement in life situations” and participation
restrictions are “problems an individual may experience in the involvement in
life situations” (page 18). For the child with CP, activity includes tasks such as
walking, running and climbing stairs while participation includes being involved
in recreational activities and taking part in school activities. Numerous
measurement tools are available for use in children with CP. A proportion of
these assess activity or activity limitation, sometimes in conjunction with
measuring participation. The psychometric properties of the tools have not
always been tested extensively. The clinical feasibility and practicability varies
among the different measures with respect to administration requirements and

Chapter 3 – Systematic Review
38
purpose, which can affect whether the measures are utilized as routine clinical
tools or research tools.
Three broad categories for assessing health indices have been defined
(Kirschner and Guyatt 1985). This includes:
i. discriminative indices which distinguish between individuals or groups on
an underlying dimension
ii. predictive indices that classify individuals into a set of predefined
measurement categories and
iii. evaluative indices that measure change.
In CP, discriminative measures need the capacity to distinguish between
individuals with and without a particular characteristic or function (Rosenbaum
et al 1990). Included in this category are tools such as the Peabody
Developmental Motor Scale (PDMS) (Folio and Fewell 1983) and the Alberta
Infant Motor Scale (AIMS) (Piper and Darrah 1994). Predictive measures in
children with CP predict possible future status from observations or measures
seen in earlier childhood. There are very few of these in the field of CP as
predictions for this group are difficult. In a systematic review of assessment
measure for functional motor abilities of children with CP no measures were
found that were developed for predictive purposes (Ketelaar et al 1998).
Evaluative measures will measure change over time or following treatments, for
example the Gross Motor Function Measure (GMFM) (Russell et al 1993).
Some tools have both a discriminative and evaluative purpose. The Pediatric
Evaluation of Disability Inventory (PEDI) (Haley et al 1992) is an example.
This review will concentrate on evaluative measures.
Outcome measures available for use in children have been developed for
distinct purposes and populations and may not be appropriate for alternative
purposes or populations. For example, the Bayley Scales of Infant Development
(Bayley 1969) was developed as a discriminative tool for children “at risk” aged
0-18 months. It should not be employed as an evaluative measure for school-
aged children because it has not been validated for that purpose in that
population. A number of tools which were developed for a specific purpose may

Chapter 3 – Systematic Review
39
be validated for an alternative purpose. For example, the PEDI was initially
developed and validated as a discriminative measure for chronically ill and
disabled children from 6 months to 7.5 years (Feldman et al 1990, Haley et al
1991, Haley et al 1993) and has also been validated as an evaluative measure for
children with CP (Wright and Boschen 1993, Nordmark et al 2000).
Given that tools for children with CP were developed and validated for varying
purposes, no single tool can comprehensively cover all domains required to be
assessed. For this reason tools are often used in conjunction to provide different
but complementary information.
To ensure a measurement tool is robust it needs to meet requirements of
reliability and validity. Reliability is the extent to which a measurement is
consistent (Streiner and Norman 2003). Validity concerns the extent to which an
instrument measures what it is intended to measure (Streiner and Norman 2003).
Evaluative tools are not only required to be reliable and valid, they are also
required to be responsive to change. Responsiveness to change is the ability of a
measure to detect minimal clinically important differences (Guyatt et al 1987).
The most essential feature of an evaluative measure is its responsiveness to
clinically important change over time (Rosenbaum et al 1990). These topics will
be investigated more thoroughly in the relevant chapters of this thesis.
Recent systematic and structured reviews on outcome measures have focused on
quality of life measures (Davis et al 2006), child or family assessed activity and
participation measures (Morris et al 2005) or participation measures alone
(Sakzewski et al 2007). Earlier reviews on activity based physical function
scales for children similar to those in this review covered all tools including
discriminative, predictive and evaluative tools (Young and Wright 1995,
Ketelaar et al 1998). The one review that has provided an overview of
functional assessment measures for children with CP that is most similar to this
review is a systematic literature review of measures (Ketelaar et al 1998). The
authors identified 17 instruments from the literature developed for evaluative,
discriminative and predictive purposes. They found there was a need for
measures that can evaluate change in functional abilities, however most
Chapter 3 – Systematic Review
40
measures are developed and validated for discriminative purposes. Five
measures were developed specifically as evaluative measures. Only two
measures, the GMFM and PEDI, fulfilled the criteria of reliability and validity
with respect to responsiveness to change. Of these two only the GMFM was
developed specifically for cerebral palsy. The authors stated that the GMFM and
PEDI are complementary as they focus on different aspects of function.
The current systematic review is necessary for a number of reasons. It is almost
10 years since the Ketelaar review was carried out and more recent studies
examining outcome measures in CP need to be considered. This review updates
the information but also differs from the previous review on a number of points.
The current review includes evaluative measures only. This is because the
clinical area of interest is measures that assess activity limitation either at one
point in time or change in status over time or following interventions. This will
be further explained in the inclusion criteria in the methods section. The
scientific approach to systematic reviews that is now routinely employed with
specific and precise methodology was not used in the Ketelaar review because it
pre-dated the more modern approach to systematic reviews. While the authors
performed literature searches they did not use a scientific approach to data
extraction, quality assessment or data synthesis.
This review will not only have a focused literature search strategy but also a
precise review protocol for study selection criteria and procedures, data
extraction and synthesis and quality assessment. This review has tighter
inclusion and exclusion criteria for both the tools and the studies involved as
will be reported in the methods section. The Ketelaar review listed the
psychometric testing that had been performed for the instruments included in
their review; however the results obtained were not questioned. In addition, the
methodology of the studies was not critically analysed. The current review will
critically analyse the methodology of the studies assessing psychometric
properties of the measures and evaluate whether each tool is robust. The clinical
utility and feasibility of the tools will be examined. Also explored will be
concepts of environmental setting, participation, assistive devices required and
Chapter 3 – Systematic Review
41
performance versus capability. These areas were not aims of the previous
review.
Of particular interest for this review was determining whether the available
tools accounted for different environmental settings, given that studies have
shown environmental setting can affect activity and activity limitation in
children with cerebral palsy (Palisano et al 2003, Tieman et al 2004). Also of
interest was whether the tools incorporated the amount of assistance required
and the range of assistive devices used in those different environments. This has
not been addressed adequately with the majority of the available measures and
will be elaborated further in the discussion.
Given these considerations, the research question for this systematic review was
“What are the psychometric properties and clinical utility of the available
evaluative measures of activity limitation for children with CP?”
The aims of this systematic review were to:
i. Identify the existing evaluative outcome measures used for children with
CP that assess activity limitation
ii. Identify which dimensions of activity limitation they measure;
iii. Identify the studies assessing the psychometric properties of the measures
iv. Critically evaluate the design of these studies;
v. Critically evaluate the psychometric properties of these measures
including reliability, validity and responsiveness to change;
vi. Determine if the measures incorporate:
a. different environmental settings
b. different assistive devices
c. performance and/or capability; and
vii. Evaluate the feasibility (including time taken, training and equipment
required to administer) and clinical utility of these measures.

Chapter 3 – Systematic Review
42
3.2. Method
Systematic reviews are designed to help the clinician base their clinical
decisions on the best available evidence (Verhagen et al 2001). A systematic
review involves the application of scientific strategies, in ways that limit bias, to
critically appraise and synthesize all relevant studies that address a specific
clinical question using explicit search strategies of comprehensive sources. The
scientific review method is the key feature that distinguishes them from
traditional narrative reviews (Cook et al 1997). Criteria are used to select studies
for inclusion in the review and precise methods used to assess the quality of
those studies, extract data from the studies and synthesize findings of the results
(Herbert et al 2005). For a systematic review of measurement instruments the
aim is to identify all measurements available for a specific purpose using
systematic searches and explicit criteria to include or exclude instruments which
are then described and evaluated (Dekker et al 2005).
3.2.1. Search Strategy
Electronic searching was performed through the Royal Children’s Hospital
library website (http://www.rch.org.au/library) and the University of Melbourne
School of Physiotherapy library website (http://www.physioth.unimelb.edu/au).
The databases of these collections were examined to locate the most relevant to
the review question. The databases that were subsequently searched were
selected from these collections because they indexed journals most relevant to
health, medicine, allied health and health outcome assessment and would
therefore include outcome measures used for children with cerebral palsy. These
databases were:
• Medline (1966 to July Week 3 2006)
• Embase (1980 to 2006 Week 30)
• CINAHL (1982 to July Week 4 2006)
• PsychINFO (1806 to July 2006)
• PubMed
• The Cochrane Library
Chapter 3 – Systematic Review
43
The keywords included in the search strategy were: “cerebral palsy”,
“psychometrics”, “reliability”, “validity” and “responsiveness”. These keywords
were used because the search was aimed specifically at the psychometric
properties of the tools. The search strategy is outlined below. The search did not
include keywords such as “evaluative” or “activity limitation” as this would
narrow the search excessively and produce a limited output, thus risking
exclusion of important tools and references. Several tools comprise a number of
domains of which activity limitation is one, therefore using this as a keyword
could potentially exclude relevant tools. The term “evaluative” was not used
because it is not always clear from first inspection what function a tool
performs. Initially terms such as “outcome assessment” and “health assessment”
were explored for searching. Matching of these to the other keywords narrowed
the search excessively and when matched to “cerebral palsy” the search was too
broad. These terms were therefore excluded from the main search.
Key terms were matched to MeSH subject headings and exploded (exp) where
relevant to include all subheadings and related terms to each key term used.
Terms were searched as keywords (mp) where there were no other thesaurus
terms. Terms were then linked to narrow the search. The following strategy was
employed to search each database:
1. exp Cerebral Palsy/
2. “Reproducibility of Results”/
3. exp Psychometrics/
4. responsiveness.mp.
5. reliability.mp.
6. validity.mp.
7. 2 or 3 or 4 or 5 or 6
8. 1 and 7
Following the initial main search when it was clear which measurement tools
would be included, each of these tools was searched individually as a keyword
e.g. WeeFIM.mp., Gross Motor Function Measure.mp. Targeted hand searches
were employed in addition to the electronic searching. One method of this
involved accessing the reference lists from key articles obtained from the
Chapter 3 – Systematic Review
44
electronic search. The other method involved searching key journals relevant to
outcome measurement in children with CP. The journals searched included
Developmental Medicine and Child Neurology and the Journal of Pediatric
Orthopaedics because they frequently publish studies using measurement tools
to either describe populations of children with CP or assess the effects of
treatments. The two methods of targeted hand searching and searching each tool
as a keyword electronically were employed to minimize the possibility of
missing key studies with the main electronic search.
3.2.2. Inclusion criteria
Initially the title and abstract were used to determine if the article matched the
inclusion criteria for the review. These are stated and justified below. Where
this was unclear the article was read fully to determine eligibility of inclusion.
The studies were reviewed by two people (AH and MM) and assessed for
inclusion in the study.
3.2.2.1 Inclusion criteria for the measurement tools
Included in this review were tools that:
i. were developed for children aged 0-18 years including tools that have an
upper age limit within this age bracket
ii. were developed for use in children with cerebral palsy or developmental
disabilities or neurological conditions including CP
iii. are evaluative measures
iv. quantitatively measure activity or activity limitation or have a subsection
measuring this, with particular emphasis on mobility and gross motor
function
v. are ordinal scales and are not timed tests or devices measuring metric
dimensions
Figure 3.1 shows the process for inclusion of measurement tools included in this
systematic review.
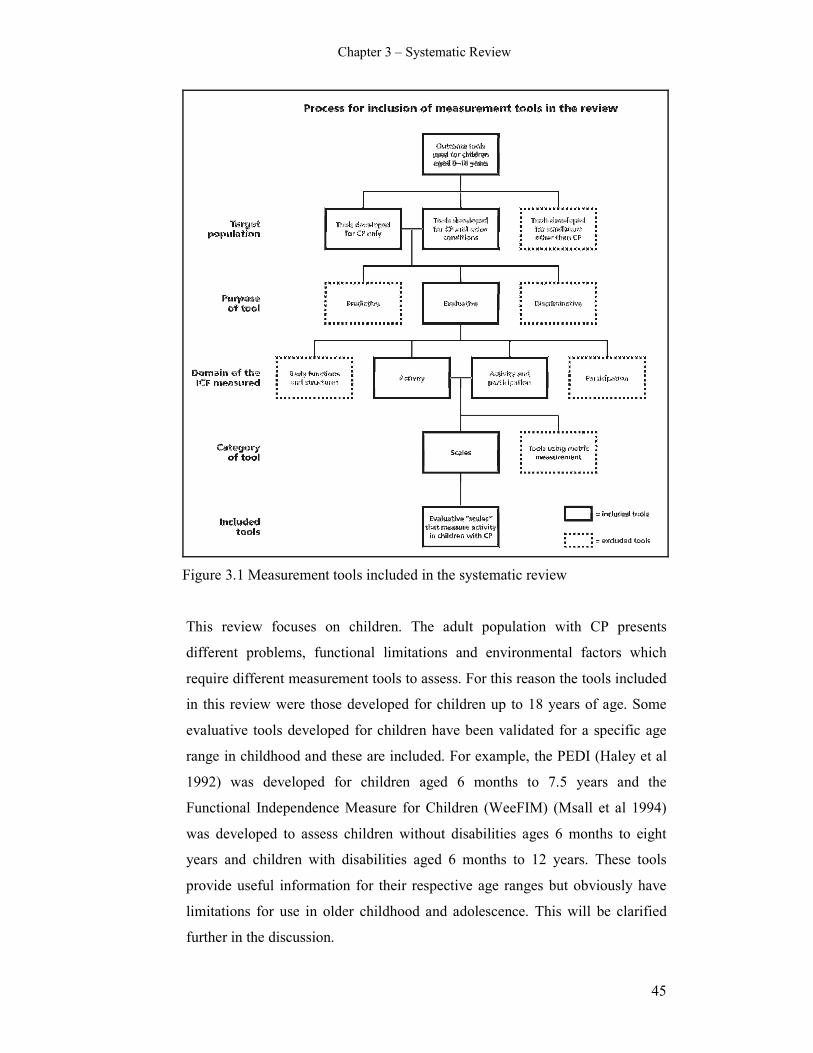
Chapter 3 – Systematic Review
45
Figure 3.1 Measurement tools included in the systematic review
This review focuses on children. The adult population with CP presents
different problems, functional limitations and environmental factors which
require different measurement tools to assess. For this reason the tools included
in this review were those developed for children up to 18 years of age. Some
evaluative tools developed for children have been validated for a specific age
range in childhood and these are included. For example, the PEDI (Haley et al
1992) was developed for children aged 6 months to 7.5 years and the
Functional Independence Measure for Children (WeeFIM) (Msall et al 1994)
was developed to assess children without disabilities ages 6 months to eight
years and children with disabilities aged 6 months to 12 years. These tools
provide useful information for their respective age ranges but obviously have
limitations for use in older childhood and adolescence. This will be clarified
further in the discussion.
Chapter 3 – Systematic Review
46
Measures were included if they had been developed for children with CP or
developmental disorders incorporating children with CP. The previous review
of outcome measures (Ketelaar et al 1998) included tools that were developed
or used in CP. Measurement tools should be used for the population for which
they were developed. If a tool has not been found to be reliable and valid for
children with cerebral palsy, then caution is required in using it in that
population. The Movement Assessment Battery for Children (ABC)
(Henderson and Sugden 1992), for example, was specifically developed for
children with motor impairment without any known physical disorder such as
cerebral palsy (Leemrijse et al 1999). It can be used to determine presence of
Developmental Coordination Disorder (Johnston 2006). Although it may be
possible to use this tool in children with mild forms of CP, it has not been
tested for reliability and validity in this population.
This review was confined to evaluative measures. Discriminative and
predictive measures were not included. The clinical question of interest with
this review is the availability of robust measurement tools than can evaluate
change over time and following interventions, not the diagnosis of the motor
problem or the ability to predict future status. Often the question is not if the
child has the condition (which may be determined by discriminative measures)
but what their current functional status is or how this is changing over time or
determining whether interventions have been effective. “Once the child is
diagnosed it is more important to have measures that assess changes in
functional capacities of a child over time or after intervention than measures
that are developed to answer the question whether or not the child has a motor
disorder” (Ketelaar et al 1998).
Tools that focus on participation only or body structures and functions as
described in the ICF (World Health Organisation 2001) were not included. The
focus of the review is activity or activity limitation measures, particularly those
concerned with gross motor skills and mobility. There are some tools which
include both activity limitation and participation, for example the Child Health
Questionnaire (CHQ) (Landgraf et al 1996) and the Pediatric Outcomes Data
Chapter 3 – Systematic Review
47
Collection Instrument (PODCI) (Daltroy et al 1998). These tools have been
included. Some of the tools included have a subsection of activity as part of a
larger and broader inventory. There are not many tools available that purely
measure activity or activity limitation.
The tools included in the review are ordinal scales or clinically based
judgements about activity. A scale is “a set of numerical values assigned to
responses that represent the degree to which the respondent possesses a
particular attitude, value or characteristic” (Portney and Watkins 1993) (page
262). They are constructed using a number of different items and often an
overall total score is obtained from the sum of the items and are used to quantify
performance, in this case activity. They can be self or parent reported measures
or measures of direct observation and have different administration methods
depending on the purpose of the scale. Other forms of measurement, such as
timed tests, assess different elements of activity. Although these are useful they
are not a focus of this review. These tests use metric measurement to quantify
activity and include tools such as the Uptimer (Pirpiris and Graham 2004) and
Timed Up and Go Test (Williams et al 2005). Reasons for excluding these are
explained in the exclusion criteria.
3.2.2.2 Inclusion criteria for the studies
Once the tools for inclusion were determined, the studies were deemed eligible
to be included in this review based on the following criteria which will be
justified below. The studies were eligible if they:
i. evaluated a measure that fulfilled the above criteria
ii. were full papers included in peer reviewed journals
iii. were published between 1966 and July 2006
iv. specifically tested the psychometric properties of the measurement tool
v. evaluated a sample of children with CP alone or the sample clearly
included children with CP.
All studies included evaluated one or more of the tools that fulfilled the
inclusion criteria for the tools stated above. Only full papers from peer
reviewed journals were eligible for inclusion to allow a reproducible search
Chapter 3 – Systematic Review
48
strategy. The studies included were published between 1966 and July 2006. The
review was performed in July 2006 and electronic databases record back to
1966, therefore literature published before that was excluded. It was essential
that the studies were assessing psychometric properties of the selected tools
including the various forms of reliability, validity or responsiveness to change.
Because the research question for the review concerned tools developed for
children with CP, it was essential that the sample within the studies included
children with CP alone or children with CP were clearly part of the sample.
3.2.3. Exclusion criteria
3.2.3.1 Exclusion criteria for the tools
Measurement tools not used in this review were those:
i. designed for discriminative (e.g. screening) or predictive purposes
ii. not quantitatively assessing activity or activity limitation
iii. assessing only fine motor, upper limb, communication, activities of daily
living or quality of life
iv. that are classifications rather than outcome measures
v. that are individualized for each child using semi-structured interviews
vi. not developed for children with CP or developmental disabilities including
CP
vii. designed for infants to assess developmental status
viii. using metric measurement of distance, speed or time parameters
Discriminative and predictive tools were excluded because the focus of the
review was evaluative tools. This excluded tools such as the Bruininks-
Oseretsky Test of Motor Proficiency (Bruininks 1978), the Bayley Scales
(Bayley 1969) and the Functional Motor Assessment Scale (FMAS) (Vermeer
1989). The Bruininks is a discriminative measure for children with motor
problems aged 4.5 to 14.5 years. The Bayley Scales is a discriminative measure
for “children at risk” aged 2-30 months. The FMAS is a discriminative measure
for children with CP aged 4-16 years.

Chapter 3 – Systematic Review
49
This review focused on physical function and mobility. Although activity can
include upper limb function, activities of daily living and communication, these
aspects were not the focus of this review. Therefore, tools that assess these
dimensions exclusively were not included. Some tools contain numerous
domains which include upper limb, communication and activities of daily
living, but provided there was a physical function or mobility domain they were
included. Pure quality of life tools without domains of activity were also
excluded. Furthermore, tools that measure quality and not quantity of activity
were excluded.
Classification systems such as the Gross Motor Function Classification System
(Palisano et al 1997) are not outcome measures. They perform different
functions and are not designed to evaluate change over time. They serve to
classify children with cerebral palsy on certain characteristics and allocate them
into groups that can be differentiated from one another based on a set of defined
variables. The differentiation of the children into clinically significant categories
may assist with clinical decision-making (Dobson et al 2007). These
classification systems include the classification of gait patterns (Rodda and
Graham 2001, Rodda et al 2004, Dobson et al 2006). This review aimed to
examine measurement tools that assess change over time and following
interventions. For this reason classification systems were excluded from the
review.
There are some tools available such as the Goal Attainment Scale (GAS)
(Ottenbacher and Cusick 1990) and Canadian Occupational Performance
Measure (COPM) (Law et al 1994) that use semi-structured interviews with the
child or parent. These tools are individualized for each child and do not have a
standard set of items that are applied to each individual (Law et al 1999). It is
therefore very difficult to compare results across children and they were not
included in this review. The COPM uses a family-centred approach to identify
problems, concerns and issues that are relevant to them and has three sections of
self-care, productivity and leisure while the GAS uses goal setting and
prediction for possible level of attainment with a 5 point scale (Cusick et al
2006). While these tools have the potential to provide very useful,

Chapter 3 – Systematic Review
50
individualized goals which could reflect important outcomes, this review only
includes standardized outcome measures which have a specific set of items that
are administered to each child in the same way.
Tools that have not been developed for children with CP or children with
developmental or neurological disabilities that include CP were excluded. This
includes tools such as the Movement ABC (Henderson and Sugden 1992) which
as stated earlier was not developed for children with CP but children with motor
impairments without any known physical disorder (Leemrijse et al 1999). The
Hoffer scale is sometimes used in the CP population but was developed for
children with myelomeningocoele (Hoffer et al 1973) and patients with spinal
cord injury (Stauffer et al 1978). It is a scale that divides ambulation into four
functional levels; community ambulators, household ambulators, non-functional
ambulators and non-ambulators. While this scale may provide a meaningful
description of ambulatory abilities of children, it has not been validated or
shown to be reliable in CP, therefore it was not included in this review.
Tools that were developed to assess developmental status were also excluded on
the basis that they focus on developing infants which is a select group. This
includes the Peabody Developmental Motor Scale (PDMS) (Folio and Fewell
1983) and AIMS (Piper and Darrah 1994). The PDMS is a discriminative
measure for children with delayed motor development aged 0-7 years but has
also been tested as an evaluative measure. It tends to be used in infants for
developmental status assessment and therefore was not included in this review.
The main purpose of the AIMS is to be a discriminative measure for the early
detection of motor problems in infants aged 0-18 months. Although the authors
report it can be used as an evaluative measure it has not been tested extensively
for this. Because it is used for infants as developmental screening it was not
included.
There are devices and tests that monitor activity levels using metric
measurements of time, speed and distance. These measure a different dimension
of activity limitation. They includes tests such as the Timed Up and Go test
(TUG) (Williams et al 2005) and devices such as the Uptimer (Pirpiris and
Chapter 3 – Systematic Review
51
Graham 2004) as well as other activity monitors. The Timed Up and Go test
assesses functional ambulatory mobility or dynamic balance by timing the task
of standing up from a seat, walking three metres, returning to the seat and sitting
down again. The Uptimer is a remote activity monitor that measures the time
children spend standing and walking. Other physical activity monitors include
pedometers which measure distance walked and/or steps taken over a period of
time and accelerometers which measure accelerations produced as a body
segment or limb part moves through space (Bjornson 2005). There are many
such devices available. These devices are very useful for providing information
regarding physical activity in children, and can complement the information
derived from scales that are clinically based judgements using self-report or
direct observation. As stated earlier this review examines measures that are
clinically-based judgements or scales. For this reason timed tests and activity
monitors were not included.
3.2.3.2 Exclusion criteria for the studies
Once it was established which tools were included and excluded, the studies
were assessed as to whether they were included or excluded. Studies were
excluded from the review if they were:
i. descriptive longitudinal health studies
ii. exploring relationships between measures without evaluating
psychometric properties
iii. investigations reporting normative data
iv. not inclusive of any children with cerebral palsy in their sample
v. evaluating children younger than 4 years old exclusively, for example the
developmental assessment of infants
vi. validating the tool in another language
vii. other adaptations of the tool e.g. computer adaptation
viii. systematic reviews
ix. manuals provided with the tools
x. establishing clinically significant differences
Studies that were descriptive cross-sectional or longitudinal health studies were
excluded on the basis that they were not investigating psychometric properties
Chapter 3 – Systematic Review
52
of the tools. These studies were using the tools to describe populations of
children at one point in time or over time or to compare groups of children with
the same tool (Liptak et al 2001, Kennes et al 2002, Vargus-Adams 2005,
Vargus-Adams 2006).
A group of studies was excluded because they examined relationships among
measures. These studies were not critically evaluating the psychometric
properties of the tools, they were looking at associations between different tools
without focusing on a particular aspect of psychometric testing (Damiano and
Abel 1996, Drouin et al 1996, Ottenbacher et al 1999, Azuala et al 2000,
Schneider et al 2001, Tervo et al 2002, Abel et al 2003, Oeffinger et al 2004,
Ostensjo et al 2004).
The focus population of this review was children with CP. Studies examining
the psychometric properties of the tools in normal populations were excluded.
Normative studies have been performed using the ASK (Plint et al 2003), the
WeeFIM (Msall et al 1994), the PEDI (Berg et al 2004), the PODCI (Haynes
and Sullivan 2001) and the CHQ (Waters et al 2000, Waters et al 2000, Raat et
al 2005). Although these studies provide additional information about the tools,
this review is concerned with the results of psychometric testing in children with
CP. Those studies were therefore excluded. For this same reason, studies that
examined the tools using populations that did not include any children with CP
in their sample were also excluded. These studies will be referred to in the
discussion section of this chapter.
The focus age group for this review included all children with CP up to 18 years
of age. Studies that included infants and children less than 4 years old only were
excluded. The studies investigating this young age group are primarily
evaluating developmental stage of the children and use the tools for
developmental screening and assessment purposes. The aim of this review was
to examine evaluative tools that measure change in activity over time or
following interventions. Consequently, the full spectrum of ages of children and
adolescents with CP requires consideration.
Chapter 3 – Systematic Review
53
Studies that were validating the tools in another language or using an adaptation
of the tool were excluded. It was felt these studies would not provide additional
relevant information to the review. This involved studies using a Dutch
adaptation of the PEDI (Custers et al 2002, Custers et al 2002, Wassenberg-
Severijnen et al 2003), the use of the PEDI in Sweden (Nordmark et al 1999)
and computer adaptive versions of the PEDI (Haley et al 2005).
This review concerned critically analyzing original studies that were assessing
the psychometric properties of the included tools. Other structured or systematic
reviews relevant to this topic (Young and Wright 1995, Ketelaar et al 1998,
Morris et al 2005, Davis et al 2006, Livingston et al 2007, Sakzewski et al 2007)
were excluded because they were not original studies. Also excluded were
manuals that are developed for the tools by the authors. These were excluded
because they were not published in peer-reviewed journals as stated in the
inclusion criteria. This involves the more comprehensive tools such as the
GMFM and PEDI that require manuals to administer the tool. The studies
reported in these original manuals have largely been published subsequently in
peer reviewed journals and hence included in this review. For this reason, it is
most unlikely that any crucial results have been overlooked by excluding these
manuals.
Studies establishing minimally clinically significant differences were excluded.
This concept is very closely related to responsiveness to change and can be
considered as an important precursor to testing responsiveness. However, for the
purposes of this review studies examining this were excluded because
reliability, validity or responsiveness was not assessed. One article on the PEDI
was excluded on this basis (Iyer et al 2003).
The inclusion and exclusion criteria for this review were extensive and tight in
order to provide a contained and reproducible topic as well as a high quality and
thorough critical analysis. The advantages and disadvantages of such extensive
and tight criteria will be argued in the discussion.
Chapter 3 – Systematic Review
54
3.2.4. Data extraction
Data extraction is the process by which the information is obtained from what is
reported in each article (Khan and Kleijnen 2007). Data extraction forms are
designed and tailored for each specific review to obtain the information relevant
to the purpose of that review.
The data extraction form that was developed for this review was individualized
to cover areas of general information (including reviewer name, the paper title,
authors, journal and publication details), study characteristics and study
outcomes. The specific headings on the form were:
i. Study aims
ii. Subject selection
iii. Subject characteristics
iv. Rater characteristics
v. Description of measurement tools
vi. Psychometric qualities including reliability, validity and responsiveness to
change
vii. Clinical utility
viii. Statement of findings
ix. Limitations
x. Main conclusions
These headings were deemed to be critical elements to analyse for this review.
The study aims included whether they were stated and justified. Subject
selection included sample size, population, recruitment procedures, sampling
procedures and inclusion and exclusion criteria. In order to analyse outcomes of
studies, a clear description of subject selection is required. Subject
characteristics included details of age, gender and description of severity of CP.
Rater characteristics were relevant for those studies assessing reliability and the
data extraction form included information on who the raters were and where
they were recruited from.

Chapter 3 – Systematic Review
55
Description of the measurement tools included which tools were used in each
study, whether they were described and what the tools were measuring. Also
included was the target population for the tools and information on tool
feasibility, such as time taken and training and equipment required for
administration of the tool. This information is necessary to have an
understanding of each tool’s purpose and from this clinical utility of the tools
can be appreciated.
The psychometric testing performed in each study was described including what
design of reliability or validity and what statistical analysis was performed. This
section provided the principal analysis of the results of the studies. This
combined with the quality assessment allowed objective statements to be made
regarding the psychometric properties of each tool.
Data were also extracted with respect to a statement of findings, authors
identification of limitations and main conclusions of each study. For each
thematic area of data extraction, quality assessment was performed. The data
extraction and corresponding quality assessment themes and items were
recorded on the same form and developed by one person (AH). A copy of this
form is included in Appendix C.
Pilot testing of the content of the combined form was carried out by two people
(MM and AH) with three articles to ensure all the relevant information was
being retrieved and all questions were understood. Revisions were made
following this initial testing on the basis of feedback from the two reviewers
testing the form.
3.2.5. Quality assessment
Quality can be described as “the extent to which all aspects of a study’s design
and conduct can be shown to protect against systematic bias, non-systematic
bias, and inferential error” (Lohr and Carey 1999) (p472). Quality assessment
involves appraising a study’s internal validity. External validity is usually
appraised and involves the extent to which the results are applicable outside of
the study (Khan et al 1996).

Chapter 3 – Systematic Review
56
Checklists or systems to assess the quality of included studies have been
developed and used in preceding systematic reviews. For the current review an
individualised quality assessment checklist was specifically developed by the
author (AH). No standardized checklists existed that matched the aims of the
review to comprehensively evaluate the type of studies included. There is a lack
of empirical evidence in the field of measurement properties to support explicit
quality criteria (Terwee et al 2007). The checklist developed included the data
extraction and quality assessment utilizing guidelines from other systematic
reviews on similar topics (Bialocerkowski et al 2000, Bot et al 2004, Jolles et al
2005, Dobson et al 2007, Eechaute et al 2007) as well as from literature on
measuring outcomes and developing quality criteria (Lohr et al 1996, Law et al
1998, Law 2004, Dekker et al 2005, Terwee et al 2007)
There are guidelines available that have been developed with the aim of
improving the quality of reporting various study designs. This includes the
QUOROM (Quality of Reporting of Meta-analyses) statement for systematic
reviews (Moher et al 2000), the CONSORT (Consolidated Standards of
Reporting Trials) statement for randomised controlled trials (Moher et al 2005),
the MOOSE (Meta-analysis Of Observational Studies in Epidemiology) group
for observational studies (Stroup et al 2000) and the STARD (Standards for
Reporting of Diagnostic Accuracy) initiative for diagnostic test accuracy
(Bossuyt et al 2004). However, these are not direct tools for evaluating the
quality of studies and they do not grade the quality to draw conclusions about
the strength of the aggregated evidence (Lohr 2004).
For randomized controlled clinical trials criteria lists have been developed,
including the Delphi List (Verhagen et al 1998) and the Overview Quality
Assessment Questionnaire (OQAQ) (Oxman and Guyatt 1991). However there
are no strict guidelines for use of quality assessment in such trials (van Tulder et
al 2003). Quality can be used as criterion for inclusion of studies in the review,
analysis of the results can be stratified, sensitivity analysis can be performed,
quality of studies can be weighted and cumulative meta-analyses of the results
can be performed (van Tulder et al 2003).
Chapter 3 – Systematic Review
57
A review of systematic reviews of prognosis studies found that quality
assessment in the primary studies is often incomplete and most of the reviews
developed their own set of quality items (Hayden et al 2006). Reviews have
been conducted to assess the content of quality assessment tools for non-
randomised studies and their use (Deeks et al 2003). The authors identified 194
tools. Many of these omitted key quality domains and six were deemed suitable
for systematic reviews, yet each of these required revision to cover all relevant
quality domains. A systematic review of 121 critical appraisal tools for allied
health research found that most tools were developed for experimental studies
and few of them had documented evidence of validity of their items or
reliability of use (Katrak et al 2004). There was also a lack of information on
tool development processes in most cases.
The validity of quality assessment can be difficult to examine as there is no gold
standard or external criterion of quality assessment and there is no widely
accepted generic tool that can be applied equally well across study types
(Verhagen et al 2001, Katrak et al 2004). “A detailed description of the quality
assessment procedure and other choices made in the conduct of the review
should enable clinicians and other readers to judge the validity of the procedure”
(Verhagen et al 2001) (pg654). The systematic review in this thesis has very
explicit methodology enabling it to be easily reproduced, thus supporting its
validity.
A grading scale was not used to quantify responses for the quality assessment.
Instead a descriptive appraisal of the methodological quality was employed
customized to this particular review to ensure relevance to the topic. Because of
the heterogeneity of the studies included, combined quantitative analysis is
difficult and grading scales are not always appropriate to use. Grading can be
used to provide a quality score as an estimate of the methodological quality, as a
threshold score for inclusion of the article in the review, as a weighting factor in
the statistical analysis or as the input sequence in a cumulative meta-analysis
(Verhagen et al 1998). There are many checklists and grading scales for
assessing individual reports available, however the reliability, validity,
Chapter 3 – Systematic Review
58
feasibility and utility of these are often not measured or are variable (Lohr and
Carey 1999). Most of the systems available for grading are aimed at randomised
controlled trials (Greer et al 2000). Hayden et al (2006) advise against using
“quality score” approaches that assign points on the basis of the number of
“positive” quality items because it reduces scientific judgement (Hayden et al
2006). Summarizing quality criteria into one overall score can be done in
systematic reviews of randomized trials, however it assumes all measurement
properties are equally important and is not appropriate for measurement studies
(Terwee et al 2007). Grading systems using levels such as (+), (-) and (0) as
grades for evidence are available (Greer et al 2000, Bot et al 2004), however
there is little evidence of the reliability of this method.
Lohr performed an extensive review of 121 systems for grading the quality of
research articles and rating the strength of evidence for four types of research
including systematic reviews, randomized controlled trials, observational
studies and investigations of diagnostic tests (Lohr 2004). She found that there
is no one best approach and that acceptable methods for grading the quality of
studies must match the topic and types of studies under review. For example,
approaches suitable for observational studies will not be applicable for
diagnostics tests.
Particular research questions will require specific approaches for quality
assessment. Many of the existing systems for assessing and grading quality are
designed for randomized controlled trials and more recently diagnostic studies.
The review in question for this thesis focuses on measurement studies and the
existing systems are not applicable. For this reason existing criteria lists were
not utilized and a quality assessment tool was developed tailored to the specific
needs of this review based on similar studies. A grading scale was not used due
to a lack of evidence of reliability, validity, feasibility and utility of such
systems. A very explicit methodology with quality assessment matched to the
aims of the review was employed.
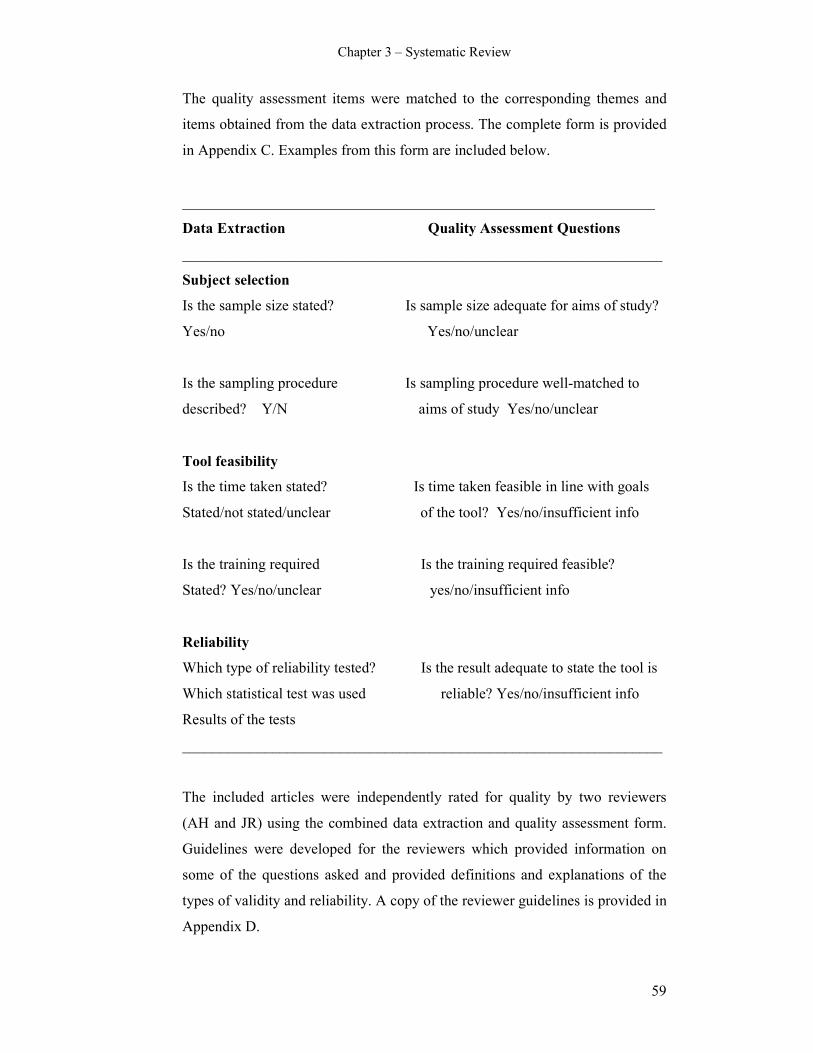
Chapter 3 – Systematic Review
59
The quality assessment items were matched to the corresponding themes and
items obtained from the data extraction process. The complete form is provided
in Appendix C. Examples from this form are included below.
_______________________________________________________________
Data Extraction Quality Assessment Questions
________________________________________________________________
Subject selection
Is the sample size stated? Is sample size adequate for aims of study?
Yes/no Yes/no/unclear
Is the sampling procedure Is sampling procedure well-matched to
described? Y/N aims of study Yes/no/unclear
Tool feasibility
Is the time taken stated? Is time taken feasible in line with goals
Stated/not stated/unclear of the tool? Yes/no/insufficient info
Is the training required Is the training required feasible?
Stated? Yes/no/unclear yes/no/insufficient info
Reliability
Which type of reliability tested? Is the result adequate to state the tool is
Which statistical test was used reliable? Yes/no/insufficient info
Results of the tests
________________________________________________________________
The included articles were independently rated for quality by two reviewers
(AH and JR) using the combined data extraction and quality assessment form.
Guidelines were developed for the reviewers which provided information on
some of the questions asked and provided definitions and explanations of the
types of validity and reliability. A copy of the reviewer guidelines is provided in
Appendix D.
Chapter 3 – Systematic Review
60
On completion of review of the articles, the reviewers held a consensus meeting
with a third person (MM). At this meeting any discrepancies between the
reviewers with the articles were discussed and a consensus reached with
assistance from the third person. Where consensus was not reached easily all
three people involved in this process read the article again until agreement was
obtained. This method of consensus for differences between reviewers is a
method of improving the agreement as the reliability of most criteria lists is
unknown (Verhagen et al 2001, Jackson et al 2005). Following consensus, data
synthesis of the extracted evidence was collated and tabulated and the results are
shown below.
3.3. Results and Data Synthesis
3.3.1. Search strategy yield
The search strategy included three different stages; the main search strategy,
searching each measurement tool as a keyword and hand searching. The initial
electronic search using the search strategy and the selected data bases stated
earlier yielded 386 articles. From this 56 articles were potential inclusions. On
reading the full abstracts or articles from this group and applying the inclusion
and exclusion criteria, 18 articles were included. From this initial search it was
clear which measurement tools would be included and these could then be
searched individually.
When each of the tools was searched as a keyword, 73 articles were retrieved as
potentially relevant. From this yield 8 extra articles not retrieved from the initial
search were included. Hand searching located another three articles for
inclusion. This made a total of 29 articles to be included in this review once the
two reviewers applied the inclusion and exclusion criteria. The details of these
studies are summarized in Table 3.1.
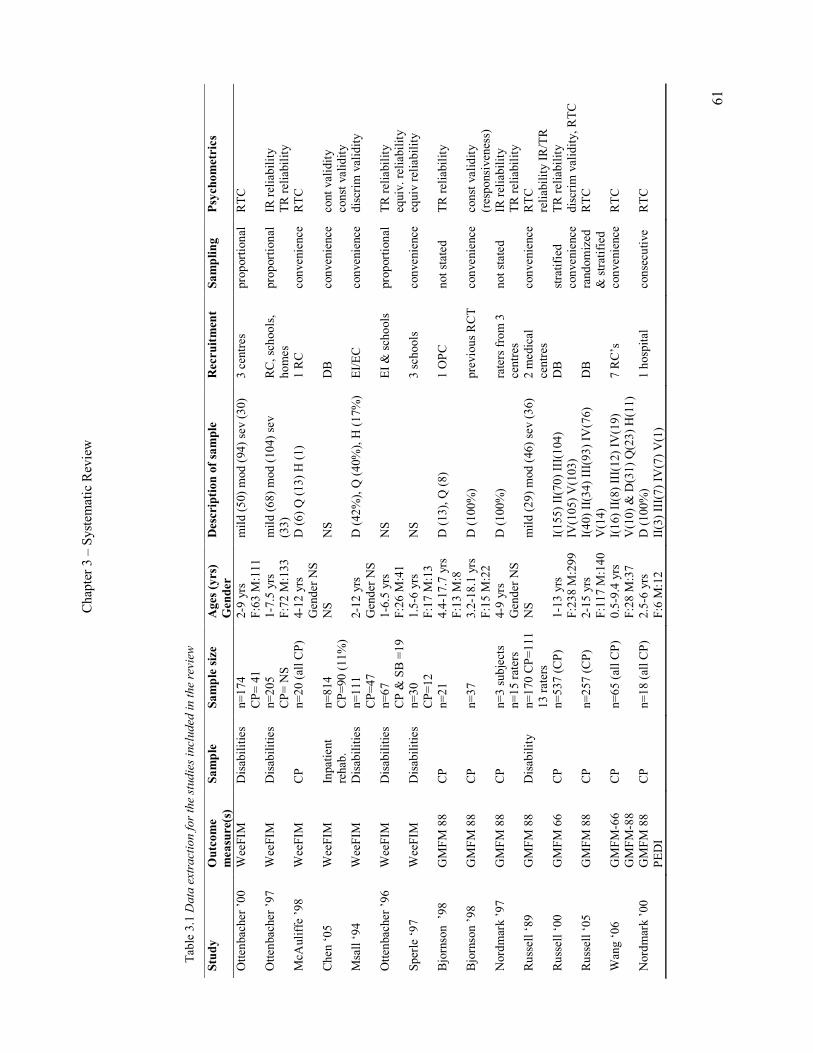
Chapter 3 – Systematic Review
61
Table 3.1 D
ata extraction for the studies included
in the review
Study
Outcome
measure(s)
Sample
Sample size
Ages (yrs)
Gender
Description of sample
Recruitment
Sampling
Psychometrics
Ottenbacher ’00
WeeFIM
Disabilities
n=174
CP= 41
2-9 yrs
F:63 M:111
mild (50) mod (94) sev (30)
3 centres
proportional RTC
Ottenbacher ’97
WeeFIM
Disabilities
n=205
CP= NS
1-7.5 yrs
F:72 M:133
mild (68) mod (104) sev
(33)
RC, schools,
homes
proportional IR reliability
TR reliability
McAuliffe ’98
WeeFIM
CP
n=20 (all CP)
4-12 yrs
Gender NS
D (6) Q (13) H (1)
1 RC
convenience RTC
Chen ‘05
WeeFIM
Inpatient
rehab.
n=814
CP=90 (11%)
NS
NS
DB
convenience cont validity
const validity
Msall ‘94
WeeFIM
Disabilities
n=111
CP=47
2-12 yrs
Gender NS
D (42%), Q (40%), H (17%) EI/EC
convenience discrim validity
Ottenbacher ’96
WeeFIM
Disabilities
n=67
CP & SB =19
1-6.5 yrs
F:26 M:41
NS
EI & schools
proportional TR reliability
equiv. reliability
Sperle ‘97
WeeFIM
Disabilities
n=30
CP=12
1.5-6 yrs
F:17 M:13
NS
3 schools
convenience equiv reliability
Bjornson ’98
GMFM 88
CP
n=21
4.4-17.7 yrs
F:13 M:8
D (13), Q (8)
1 OPC
not stated
TR reliability
Bjornson ’98
GMFM 88
CP
n=37
3.2-18.1 yrs
F:15 M:22
D (100%)
previous RCT convenience const validity
(responsiveness)
Nordmark ’97
GMFM 88
CP
n=3 subjects
n=15 raters
4-9 yrs
Gender NS
D (100%)
raters from 3
centres
not stated
IR reliability
TR reliability
Russell ‘89
GMFM 88
Disability
n=170 CP=111
13 raters
NS
mild (29) mod (46) sev (36)
2 medical
centres
convenience RTC
reliability IR/TR
Russell ‘00
GMFM 66
CP
n=537 (CP)
1-13 yrs
F:238 M:299
I(155) II(70) III(104)
IV(105) V(103)
DB
stratified
convenience
TR reliability
discrim validity, RTC
Russell ‘05
GMFM 88
CP
n=257 (CP)
2-15 yrs
F:117 M:140
I(40) II(34) III(93) IV(76)
V(14)
DB
randomized
& stratified
RTC
Wang ‘06
GMFM-66
GMFM-88
CP
n=65 (all CP)
0.5-9.4 yrs
F:28 M:37
I(16) II(8) III(12) IV(19)
V(10) & D(31) Q(23) H(11)
7 RC’s
convenience RTC
Nordmark ’00
GMFM 88
PEDI
CP
n=18 (all CP)
2.5-6 yrs
F:6 M:12
D (100%)
II(3) III(7) IV(7) V(1)
1 hospital
consecutive
RTC
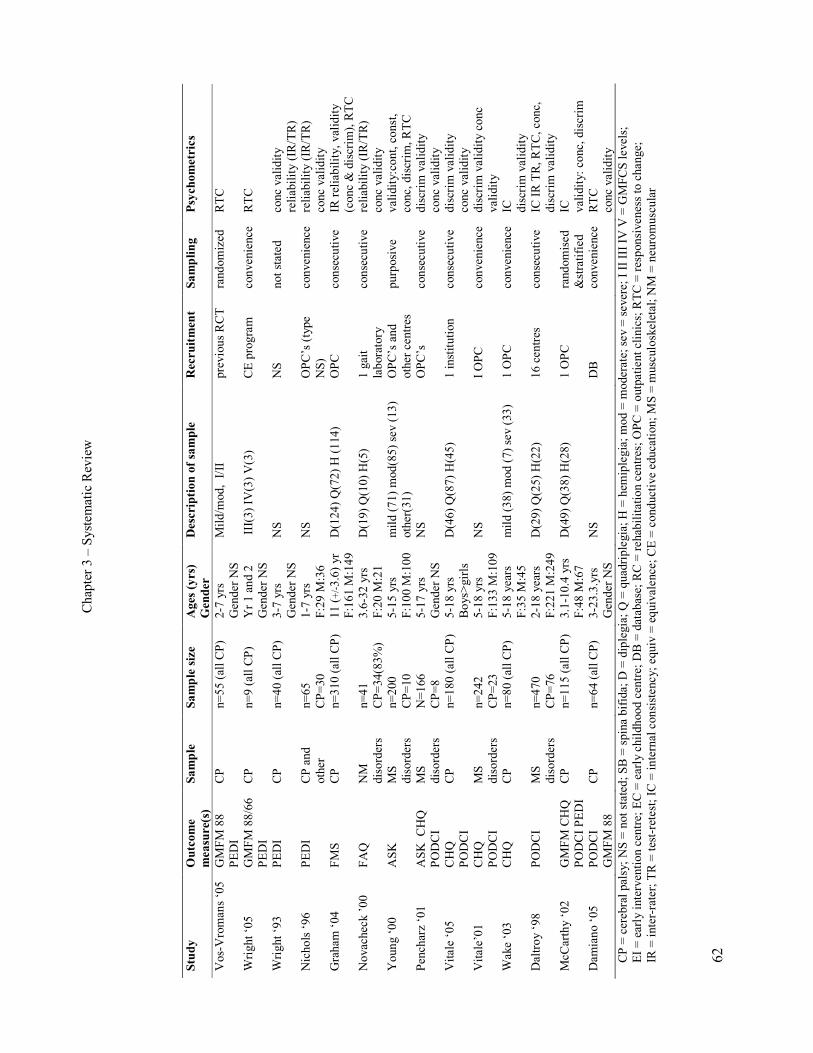
Chapter 3 – Systematic Review
62
Study
Outcome
measure(s)
Sample
Sample size
Ages (yrs)
Gender
Description of sample
Recruitment
Sampling
Psychometrics
Vos-Vromans ‘05 GMFM 88
PEDI
CP
n=55 (all CP)
2-7 yrs
Gender NS
Mild/mod, I/II
previous RCT randomized RTC
Wright ‘05
GMFM 88/66
PEDI
CP
n=9 (all CP)
Yr 1 and 2
Gender NS
III(3) IV(3) V(3)
CE program
convenience RTC
Wright ‘93
PEDI
CP
n=40 (all CP)
3-7 yrs
Gender NS
NS
NS
not stated
conc validity
reliability (IR/TR)
Nichols ‘96
PEDI
CP and
other
n=65
CP=30
1-7 yrs
F:29 M:36
NS
OPC’s (type
NS)
convenience reliability (IR/TR)
conc validity
Graham ‘04
FMS
CP
n=310 (all CP) 11 (+/-3.6) yr
F:161 M:149
D(124) Q(72) H (114)
OPC
consecutive
IR reliability, validity
(conc & discrim), RTC
Novacheck ’00
FAQ
NM
disorders
n=41
CP=34(83%)
3.6-32 yrs
F:20 M:21
D(19) Q(10) H(5)
1 gait
laboratory
consecutive
reliability (IR/TR)
conc validity
Young ‘00
ASK
MS
disorders
n=200
CP=10
5-15 yrs
F:100 M:100
mild (71) mod(85) sev (13)
other(31)
OPC’s and
other centres
purposive
validity:cont, const,
conc, discrim, RTC
Pencharz ‘01
ASK CHQ
PODCI
MS
disorders
N=166
CP=8
5-17 yrs
Gender NS
NS
OPC’s
consecutive
discrim validity
conc validity
Vitale ‘05
CHQ
PODCI
CP
n=180 (all CP) 5-18 yrs
Boys>girls
D(46) Q(87) H(45)
1 institution
consecutive
discrim validity
conc validity
Vitale’01
CHQ
PODCI
MS
disorders
n=242
CP=23
5-18 yrs
F:133 M:109
NS
I OPC
convenience discrim validity conc
validity
Wake ‘03
CHQ
CP
n=80 (all CP)
5-18 years
F:35 M:45
mild (38) mod (7) sev (33)
1 OPC
convenience IC
discrim validity
Daltroy ‘98
PODCI
MS
disorders
n=470
CP=76
2-18 years
F:221 M:249
D(29) Q(25) H(22)
16 centres
consecutive
IC IR TR, RTC, conc,
discrim validity
McCarthy ‘02
GMFM CHQ
PODCI PEDI
CP
n=115 (all CP) 3.1-10.4 yrs
F:48 M:67
D(49) Q(38) H(28)
1 OPC
randomised
&stratified
IC
validity: conc, discrim
Damiano ‘05
PODCI
GMFM 88
CP
n=64 (all CP)
3-23.3.yrs
Gender NS
NS
DB
convenience RTC
conc validity
CP = cerebral palsy; NS = not stated; SB = spina bifida; D = diplegia; Q = quadriplegia; H = hemiplegia; mod = moderate; sev = severe; I II III IV V = GMFCS levels;
EI = early intervention centre; EC = early childhood centre; DB = database; RC = rehabilitation centres; OPC = outpatient clinics; RTC = responsiveness to change;
IR = inter-rater; TR = test-retest; IC = internal consistency; equiv = equivalence; CE = conductive education; MS = musculoskeletal; NM = neuromuscular
Chapter 3 – Systematic Review
63
On reading one of the articles it was unclear as to whether there were children
with cerebral palsy in the sample of children with “neuromuscular conditions”
(Young et al 2000). Correspondence from the primary author (Nancy Young)
indicated that of the children with “neuromuscular conditions” in the sample
there were 10 children with CP (9 with complete data). Based on this
information the article was included in the review.
From these 29 articles eight different outcome measures were reported. The
tools included were the Activities Scale for Kids (ASK) (Young et al 1995), the
Child Health Questionnaire (CHQ) (Landgraf et al 1996), the Gillette
Functional Assessment Questionnaire (FAQ) (Novacheck et al 2000), the
Functional Mobility Scale (FMS) (Graham et al 2004), the Gross Motor
Function Measure (GMFM) (Russell et al 1989), the Pediatric Evaluation of
Disability Inventory (PEDI) (Haley et al 1992), the Pediatric Outcomes Data
Collection Instrument (PODCI) (Daltroy et al 1998), which is sometimes
referred to as the Pediatric Orthopaedic Society of North America (POSNA)
scale and the Functional Independence Measure for Children (WeeFIM) (Msall
et al 1994). Table 3.2 summarises the features of the eight tools in the review
and will be discussed further in section 3.3.3 and 3.3.4.
3.3.2. Descriptive results of studies from data extraction
Table 3.1 displays the tools evaluated in each study, the subject characteristics
of the samples, the recruitment and sampling processes and which aspect of
psychometric testing was involved for each study.
3.3.2.1 Measurement tools used
The GMFM was the most commonly used tool in this review with 12 studies
assessing its psychometric properties. The WeeFIM and PEDI were reported in
seven and six studies respectively. The CHQ was assessed in five studies and
the PODCI in six. The ASK, FMS and FAQ were reported less often.

Chapter 3 – Systematic Review
64
3.3.2.2 Subjects selection
Sample size varied in each study. Twelve studies had sample sizes of 1-50, four
had sample sizes of 50-100, five had sample sizes of 100-200 and eight had
sample sizes of greater than 200. The largest sample size was 814 with 90 of
those being children with CP (Chen et al 2005). The populations in each study
varied from children with CP only (17 studies) to children with a range of
diagnoses that included CP (12 studies). The children with CP could be
extracted out in 25 of the studies but not in four of them.
Table 3.1 illustrates the samples for the 12 studies that included children with
diagnoses other than CP. These samples were described as children with
disabilities (medical or developmental) in six studies, children with
musculoskeletal disorders in four studies, children with neuromuscular
conditions in one study and children receiving inpatient rehabilitation in one
study. These samples included children with other diagnoses such as spina
bifida, head injury, developmental delay, Down’s syndrome, congenital talipes
equinovarus, scoliosis and other spinal disorders, arthritic conditions, limb
deficiency, limb length discrepancy, multitrauma, fractures, congenital
impairments, Perthes disease and other miscellaneous orthopaedic and
neuromuscular conditions.
In 13 studies children were recruited from more than one centre, in 14 they were
recruited from one centre and it was unclear in two studies. The types of centres
children were recruited from are shown in Table 3.1. These included various
hospital and medical outpatient clinics (nine studies), rehabilitation centres (10
studies), schools or early childhood centres (five studies), motion analysis
laboratory (one study) and existing databases or from previous trials (six
studies). In five studies it was unclear as to the centre(s) that the children were
recruited from.
Thirteen studies used a sample of convenience, six used consecutive samples,
three used proportional sampling, three used random sampling (one from an
existing randomized trial) and one used purposive sampling. Sampling was not

Chapter 3 – Systematic Review
65
stated in three studies. Convenience sampling involves choosing subjects on the
basis of availability, consecutive being all participants who present within a set
time interval. Proportional sampling involves systematic sampling from a set
number of groups that represent the population being studied. Purposive
sampling involves hand-picking subjects on the basis of specific criteria.
Random sampling is a probability method of subject selection where every
subject in the population has an equal chance of being chosen (Portney and
Watkins 1993). Convenience, proportional and purposive sampling methods are
not probability methods of sampling. These methods increase the chance of the
sample not being truly representative of the population of interest.
3.3.2.3 Subject characteristics
Table 3.1 summarises the age and gender of the participants in each study. A
variety of age ranges was used in the samples usually according to the tools
involved and the age range appropriate for those measurement tools. Eight
studies included children up to 8 years and the majority of these were assessing
the WeeFIM and PEDI. Nine included children up to 15 years and eight
included children up to 18 years. Two studies included people over the age of
18 years while the age of subjects was not stated in two studies. Gender of
subjects was not stated in 11 of the investigations. In the remaining 18 the ratio
of males to females was relatively even.
Description of the severity or classification of the children in the samples
varied, as shown in Table 3.1. Six studies described severity of the children
involved as mild, moderate or severe. Six classified the children according to
GMFCS levels. Twelve described the samples of children with CP according to
topography i.e. diplegia, hemiplegia and quadriplegia. Eight studies provided no
descriptors of subjects. The larger number of studies using topography rather
than GMFCS levels is reflective of the year in which the study was performed
and published. The GMFCS has been used to classify children within the last 10
years.
Chapter 3 – Systematic Review
66
3.3.2.4 Rater characteristics
For the investigations that used raters as part of the procedures, the
characteristics of the raters were generally not well detailed. The number of
raters used ranged from 1 to 25. The raters used were therapists (in 11 studies),
nurses (in two), parents (in three) and doctors (in one). An important
consideration here is the difference between what is classified as a “rater”
compared to parents or therapists being “respondents” as usual administration of
the questionnaires/scales. For example, the PEDI can be administered by
therapists interviewing the parents. Inter-rater reliability of therapists
administering the tool examines the agreement between the therapists not
between the therapist and the parent responding. For some tools inter-rater
reliability is really inter-respondent reliability. For example, the FAQ is
completed by parents and reliability assesses agreement between parental
ratings and does not involve clinicians.
3.3.2.5 Psychometrics tested
Table 3.1 lists the psychometrics tested in each study while tables 3.4-3.11
separate the tools out and describe the testing implemented. These tables will be
discussed further in section 3.3.5.
The GMFM was most extensively tested of the tools. Inter-rater reliability was
examined in two studies, test-retest reliability in four and internal consistency in
one. Content and discriminative validity were tested in one study.
Responsiveness to change was examined in eight of the investigations.
The PEDI was examined in six studies. Inter-rater and test-retest reliability were
both tested in two separate studies and internal consistency in one. Concurrent
and discriminative validity were investigated in three studies and responsiveness
was examined in three.
The WeeFIM was cited in seven studies, three of which examined inter-rater,
test-retest and equivalence reliability. Only two examined validity (content,
construct and discriminative) and concurrent validity was not tested in this

Chapter 3 – Systematic Review
67
review. Two examined responsiveness, one of which examined it quite
extensively.
The FAQ is only cited in one study and this study examined inter-rater and test-
retest reliability and concurrent validity. Responsiveness and discriminative
validity were not tested. The FMS was examined for inter-rater reliability,
responsiveness and concurrent and discriminative validity in one study. The
ASK was examined extensively in one study assessing responsiveness as well as
inter-rater reliability and content, concurrent, discriminative and construct
validity. Another study also examined its concurrent and discriminative validity.
The CHQ and PODCI were both tested for concurrent and discriminative
validity in a number of studies (seven studies) but other forms of validity were
not investigated. One study examined the reliability of the PODCI and two
studies examined its internal consistency. The CHQ was examined for internal
consistency in two studies also but reliability was not investigated.
Responsiveness was examined in the PODCI but not the CHQ.
3.3.3. Description of the tools included in the review
3.3.3.1 Activities Scale for Kids (ASK)
The ASK is a self-report measure of childhood physical disability developed
from first principles using the perspectives of children. It is applicable for
children aged 5-15 years with a range of musculoskeletal disorders. It contains
30 items representing nine domains and scores are reported as a percentage of
full function. The domains are; personal care, dressing, eating and drinking,
play, locomotion, standing skills, stairs, transfers and miscellaneous. There are
two versions: a capability and a performance version each covering the same
activities but with different response options (Young et al 2000).

Chapter 3 – Systematic Review
68
Table 3.2 Fea
tures of the mea
suremen
t tools
Outcome
measure
Target population
Activities or
participation
Aspect of activity
measured
Administration:
Who and how
Incorporates
different
settings?
Differentiate
assistive
devices?
Performance or
capability
ASK
Children with
musculoskeletal disorders
5-15 yrs
Activity and
participation
Self-care, play,
mobility
Child report and
record
Yes
No
Both a performance and a
capability version
CHQ
Generic – all children
5-18 yrs
Activity and
participation
HRQOL with
physical function
subset
Child/parent report
& record
Yes
No
Performance
FAQ
Children with walking
disabilities. Age unclear
Activity and
participation
Mobility
Parent report and
record
Yes
No
Performance
FMS
Children with CP
4-18 yrs
Activity and
participation
Mobility
Clinician
interpretation of
child/parent report
Yes
Yes
Performance
GMFM
Children with CP
0-18 yrs
Activity
Gross motor
function
Trained therapist
observe & score
No
No
Capability
PEDI
Children with disabilities
0.5-7.5 yrs
Activity and
participation
Self-care, mobility
and social function
Trained therapist
record by observing
or interview parent
Yes
No
Capability (functional
skills)
Performance (assistance)
PODCI
Children with orthopaedic
problems
0-18 yrs
Activity and
participation
HRQOL with
physical function
subset
Child/parent report
& record
Yes
No
Performance
WeeFIM
Children with
developmental disabilities
0-7.5yrs
Activity and
participation
Self-care, mobility
and cognition
Clinician report or
observe & record.
Yes
No
Performance
Chapter 3 – Systematic Review
69
3.3.3.2 Child Health Questionnaire (CHQ)
The CHQ is a generic paediatric questionnaire designed to determine health-
related quality of life in children (Landgraf et al 1996). The 28-item parent form
(PF-28) consists of 12 domains and two summary scores (physical and
psychosocial) that are scored on a 0-100 scale (Vitale et al 2005). There is also a
50-item parent form (PF-50) consisting of 50 items covering 14 health domains
and the two summary scores that are also scored on a 0-100 scale (Vitale et al
2001). There are other elongated versions: the 98-item parent form (PF-98) and
an 87-item child form (CF-87). The PF-50 and PF-28 are more commonly used.
The domains include physical function, social-emotional, pain, social-physical,
behaviour, general health, mental health, self-esteem, parent impact
emotionally, family activities, parent impact on time, family cohesion and
change in health.
3.3.3.3 Gillette Functional Assessment Questionnaire (FAQ) walking scale
The FAQ walking scale is a 10-level (1-10), parent-report walking scale
encompassing a range of walking abilities from non-ambulatory to ambulatory
in a variety of community settings and terrains (Novacheck et al 2000). The
child is scored independent of the need for assistive walking devices.
3.3.3.4 Functional Mobility Scale (FMS)
The FMS classifies functional mobility in children with CP by rating walking
ability at three specific distances, 5, 50 and 500 metres according to the need for
assistive devices. The scale incorporates assistive devices ranging from
wheelchairs, walkers, crutches and sticks and also includes walking without the
need for assistive devices. It uses a six point ordinal scale (1-6) to rate the
assistance required at each distance which reflect home, school and community
distances (Graham et al 2004).
3.3.3.5 Gross Motor Function Measure (GMFM)
The GMFM was developed as an evaluative measure to assess change in gross
motor function in children over time. It is a standardized criterion-referenced
observational measure developed for children with cerebral palsy (Russell et al

Chapter 3 – Systematic Review
70
1989). The original form has 88 items each scored on a four point ordinal scale
(0-3). The items are grouped into five dimensions: lying and rolling, sitting,
crawling and kneeling, standing and walking, running, jumping. Scores for each
dimension are expressed as a percentage of the maximum score for that
dimension and the total score is obtained by averaging the percentage scores
across the five dimensions (Russell et al 2000). Rasch analysis was applied to
the GMFM-88 in order to improve its interpretability and clinical usefulness.
This resulted in a unidimensional interval-measure hierarchical scale, the
GMFM-66, consisting of 66 items from the original 88 (Russell et al 2000).
3.3.3.6 Pediatric Evaluation of Disability Inventory (PEDI)
The PEDI was designed as a “discipline free” judgement based method of
assessing functional capabilities and performance in chronically ill and disabled
children (Haley et al 1992). It is a standardized instrument using parent report
through a structured interview by clinicians (Vos-Vromans et al 2005). It
consists of three domains: self-care (73 items), mobility (59 items) and social
function (65 items) scored as “present” or “absent”. It is conceptualized with
three theoretical measurement dimensions: functional behaviours and skills,
assistance by caregivers and modifications/adaptive equipment required.
Caregiver assistance is determined for eight self-care items, seven mobility
items and five social function items scored on a 0-5 scale. Modification and
equipment required is scored on a four point scale (Ziviani et al 2001).
3.3.3.7 Pediatric Orthopaedic Data Collection Instrument (PODCI)
The PODCI was designed to measure quality of life and functional levels in
children with orthopaedic problems. It is available in three formats: one for
parents of younger children (0-10 years), one for parents of adolescents (11-18
years) and a self-report form for adolescents (11-18 years) (Pencharz et al
2001). It has 108 items. A global function scale encompasses four subscales of
upper extremity function, transfers and mobility, comfort and physical function
and sports. It also has a happy and satisfied scale as well as expectations for
treatment. It is scored on a 0-100 scale.
Chapter 3 – Systematic Review
71
3.3.3.8 Functional Independence Measure for Children (WeeFIM)
The WeeFIM is based on the format of the Functional Independence Measure
(FIM) for adults and measures functional independence in children (Ottenbacher
et al 1997). It is concerned with the amount of assistance required for children
with disabilities to perform basic life activities (Ottenbacher et al 1997). It aims
to evaluate disability using a minimal essential data set that is discipline free,
easy to use and designed to track outcomes across settings (Msall et al 1994). It
consists of 18 items categorized in six specific functional domains of self-care,
sphincter control, mobility, locomotion, communication and social cognition. A
seven level ordinal scale (1-7) is used to rate the amount of assistance needed
for each item (Chen et al 2005). The minimum total rating is 18 and the
maximum is 126 (Ottenbacher et al 1996).
3.3.4. Descriptive features of the measurement tools
Table 3.2 lists each of the eight measurement tools included in this review and
their characteristics. For each outcome measure it displays:
i. the target population and age range
ii. what domain of the ICF is covered
iii. what aspect of activity limitation is measured
iv. who administers the tool and how
v. whether the tool incorporates different environmental settings relevant to
children
vi. whether the tool differentiates the assistive devices used
vii. whether it measures performance or capability
3.3.4.1 Target population of the tools
For two of the tools, the GMFM and FMS, the target population is CP
exclusively (Russell et al 1989, Graham et al 2004). The GMFM has been
examined in other populations such as Downs’ Syndrome (Russell et al 1998)
but was developed and validated to assess children with CP (Russell et al 1989).
The PEDI and WeeFIM were both developed for children with developmental
disabilities. The FAQ is for children with walking disabilities associated with
neuromuscular disorders. The ASK and PODCI are intended for children with

Chapter 3 – Systematic Review
72
musculoskeletal or orthopaedic disorders. The CHQ is the only generic measure
included in this review with the target population including all children.
Two tools are for the full spectrum of childhood and adolescence (0-18 years),
the GMFM and PODCI. The PEDI and WeeFIM were both developed for
children aged 6 months to 7.5 years. The ASK is for children aged 5-15 years
and the CHQ is for children aged 5-18 years. The original article for the FMS
states the tool is for children aged 6 years to skeletal maturity, however further
development of the tool states that it is for children aged 4-18 years (personal
correspondence with author Kerr Graham). It is unclear from the one article on
the FAQ what age group it is targeted for, but the study includes the ages of 3.6
to 32 years, suggesting it can be used in both children and adults.
3.3.4.2 ICF domain covered by each tool
Seven of the tools measure both activity and participation as described by the
ICF (World Health Organisation 2001), while the GMFM measures activity
alone. It can be difficult to separate activity from participation as they can be
very closely linked. Some of the tools have items that incorporate the two
concepts, for example the FMS and FAQ. Others have different items that cover
activity and participation, for example the ASK and the PEDI. The different
tools measure different aspects of activity, as illustrated in Table 3.2. The FAQ
and FMS measure mobility and the GMFM measures gross motor function.
Three tools measure physical function as a subset of a larger inventory of
general function (PEDI, WeeFIM and ASK). The CHQ and PODCI are both
health related quality of life measures that have a subset on physical function.
3.3.4.3 Administration method
Methods of administration vary from direct observation to self (or parent)
report. The GMFM assesses children by direct observation with a trained
therapist observing and scoring the child. The PEDI is administered by a trained
therapist observing the child or by interviewing the parent. The WeeFIM is
recorded by either direct observation or clinician-report and usually a
combination of both. All other tools use self-report, which can be parent report
by proxy. The ASK uses child-report primarily while the FAQ tends to be
Chapter 3 – Systematic Review
73
parent-report. The FAQ, ASK, CHQ and PODCI are all completed by the child
or parent, whereas the FMS is clinician administered self-report.
3.3.4.4 Incorporation of different environmental settings
All tools except for the GMFM take into account different environments when
they evaluate the function of the children. The FMS, however, is the only one
that examines in detail the differences in function between these environments.
The FMS, FAQ, PODCI and CHQ incorporate community distances into items.
The WeeFIM and PEDI limit walking to 150 feet and the ASK does not specify
distances but includes indoor and outdoor activity. This concept will be
elaborated on further in the discussion.
3.3.4.5 Consideration of different assistive devices
Most of the tools do not differentiate between different assistive devices when
assessing function, in particular mobility and locomotion. The FMS clearly
distinguishes between different devices used by the same child and is the only
one to do so.
3.3.4.6 Capability versus performance
It is important to distinguish whether tools measure performance or capability.
Performance is what the child “does do” in the usual circumstances of everyday
life. This differs from capability which quantifies what they “can do” in a
defined situation apart from real life (Young et al 1996). Studies have shown
that performance can differ from actual capability in the same child (Young et al
1996) and across environmental settings (Tieman et al 2004).
Five of the included tools measure performance only (CHQ, FAQ, FMS,
PODCI and WeeFIM). The ASK has both a performance and capability version.
The PEDI section on functional skills measures capability and the caregiver
assistance section measures performance. The GMFM measures capability
despite some earlier studies claiming it is a performance measure. The
developers of the GMFM classified the tool as a performance measure because
it observes activity in a clinical setting (Russell et al 1989). However more
recent work on this concept defines capability and performance differently and
Chapter 3 – Systematic Review
74
terminology has changed. The ICF (World Health Organisation 2001) defines
performance as “what an individual does in his or her current environment and
can be understood as involvement in a life situation” (p19). Capacity “describes
an individual’s ability to execute a task or action in a standardized environment.
It aims to indicate the highest probable level of functioning” (p20). Using the
framework of the ICF and other work on the concept (Young et al 1996), the
GMFM is designed to measure the child’s “best ever performance” (Nordmark
et al 2000) and therefore is a capability measure.
3.3.4.7 Feasibility and Clinical Utility
Table 3.3 describes the feasibility and clinical utility for each of the tools
included in the review. Feasibility involves the time taken, equipment required
and training required to administer the tools (Law et al 1999, Morris et al 2005).
Eight studies stated the time taken for the tools involved yet it was not stated in
20 and in one it was unclear. The time taken to administer each tools varied
from 9-60 minutes. The GMFM and PEDI are the most time consuming with
administration times of 45-60 minutes each. The CHQ and PODCI take
approximately 30 minutes each, depending on which version is used. The
WeeFIM can be scored in less than 20 minutes and the ASK takes on average 9
minutes to complete. The articles included in this review did not provide any
information on time taken to administer the FMS and FAQ. It is the “clinical
impression” of experts that the FAQ can be completed by parents in 10 minutes
and the FMS completed by clinicians in 10 minutes (Professor Kerr Graham,
personal communication).

Chapter 3 – Systematic Review
75
Table 3.3 M
easuremen
t tools: feasibility and clinical utility
Tool
Feasibility:
Tim
e taken Equipment required Training required
Clinical utility
ASK
9 minutes
Not stated. Self-report,
assume none required.
Not required, child
is the respondent.
Measures functional ability, change and outcomes important to children. Can be used by mail.
Practical. Minimal floor and ceiling effects.
CHQ
30 minutes
Self-report, assume none
required.
Not required, child
or parents are
respondents
Generic tool. Broad picture of health status and well-being in wide range of paediatric
populations. Includes psychosocial as well as physical with some loss of specificity. Not for
whole range CP due to floor & ceiling effects. Discriminates healthy from sick children.
Provides parental perspective.
FAQ
Not stated
Not stated. Self-report,
assume none required
Not required,
parent completes
Assessment of community function specific to task of walking for range of walking abilities.
Authors state it can evaluate treatment, yet responsiveness has not been tested.
FMS
Not stated
Not stated. Self-report,
assume none required.
Not stated
Assesses mobility over 3 distances to represent home, school and community. Emphasis on
range of assistive devices required. Monitors change & discriminate level of disability.
GMFM
45-60
minutes
Manual, program to
score GMFM-66, “usual
therapy equipment”
Training using self-
instructional
CD-ROM
Clinical outcome measure. Assesses gross motor skills. Measures change in motor function
across the range of severity of CP. Assesses impact of aids/orthoses on motor skills. Measures
change post interventions. Possible ceiling effects.
PEDI
45-60
minutes
Testing manual and
software program to
score
Training and trial
use required but
extent unclear.
Describes function in community. Focus on self-care and mobility in everyday life. Considers
degree of caregiver assistance and independence. Clinical and research tool. Best as parental
report from interview. Can measure change after treatments.
PODCI
30 minutes
Self-report, assume none
required.
Not required, child
or parents are
respondents
Assesses functional health status over range of ages. Reports wide range of physical function.
Not for whole range CP due to floor & ceiling effects. Includes patient/proxy perspectives &
expectations. Measures change after surgery & efficacy of treatment.
WeeFIM
<20 minutes
Scoring manual to
calculate overall score
Training video and
practice ratings.
All disciplines. Tracks function. Used to set goals, treatment plans & evaluate change in ADL
over time and post treatment. Includes impact on caregivers. Practical. By observation,
interview or over phone.

Chapter 3 – Systematic Review
76
The amount of equipment and training required for most of the tools was not
described well in the studies. Equipment needs were stated in four studies only
and it was unclear or not stated in 25. Training requirements were stated in
seven studies and it was unclear or not stated in 22. It would appear that for the
ASK, CHQ, FAQ, FMS and PODCI little training or equipment is required.
These tools rely on self-report and not direct observation, thereby eliminating
the need for equipment to administer them. Questionnaire forms are required for
the ASK, CHQ, FAQ and PODCI. Formal training is not required for these tools
as the parents or child record the information (except for the FMS). The FMS is
administered by clinicians based on self-report. There is a brochure available
explaining the tool and rating procedure which is recommended to be read prior
to administration of the scale. Score sheets or scoring programs are available for
the ASK, CHQ and PODCI.
The GMFM requires training through a self-instructional CD ROM before
assessing children and a manual and scoring program is necessary. Some “usual
physiotherapy equipment” is required to be able to administer it. The PEDI
requires training sessions and trial use but the extent of this training is unclear.
A manual and score sheets are required as well as a software program to
transform raw scores into normative and scaled scores (Nordmark et al 2000).
Before using the WeeFIM training is recommended using the training video and
practice rating of children. A scoring manual is also available.
The clinical utility of each of the tools as described by the articles is described
in Table 3.3. This was addressed in 26 of the 29 studies and the table collates
the overall clinical utility of each tool from all studies. Because all measurement
tools are evaluative measures, they were all stated to measure change over time
or after interventions and assess the effectiveness of treatments. Some of the
tools can be administered over the telephone (WeeFIM) or via the mail (ASK).
The GMFM requires direct observation, the WeeFIM is either by observation or
interview and the PEDI is best obtained by parental report in interview. The
FMS requires interviewing the child and parents and the FAQ, CHQ, PODCI
and ASK are self report.

Chapter 3 – Systematic Review
77
The GMFM, FMS and FAQ are quite specific to one aspect of activity. The
ASK, PEDI and WeeFIM give a broader description of function by including
self-care (all three), social function (PEDI) cognition (WeeFIM) and play
(ASK) along with mobility and therefore provide more information. The CHQ
and PODCI are health-related quality of life measures that incorporate physical
function. They have the advantage of giving a broad picture of functional health
status but lose some specificity with that. Both also show floor and ceiling
effects in various domains (Pencharz et al 2001, Vitale et al 2001, McCarthy et
al 2002, Damiano et al 2005, Vitale et al 2005) and therefore are not appropriate
for use in the range of severity of CP seen in the population. The ASK has only
minimal ceiling effects and very low floor effects (Young et al 2000, Pencharz
et al 2001) suggesting it is appropriate for all severity of CP. Some ceiling
effects were seen for the GMFM (Damiano et al 2005, Vos-Vromans et al 2005)
indicating it is not able to distinguish higher functioning children while a
number of children showed floor effects on the WeeFIM (Ottenbacher et al
2000). The FMS and FAQ were not assessed for floor or ceiling effects.
Parental perspectives are provided on the CHQ and PODCI through parental
versions and the PEDI and FAQ because they are parental report scales. The
amount of caregiver assistance or impact on caregivers is an important factor
when assessing children with CP and this is included in the PEDI, WeeFIM and
CHQ. The PODCI also contains information on expectations.
3.3.4.8 Authors identification of limitations of the studies
Limitations of the individual studies were stated in 18 articles yet were
incomplete or not documented in 11 (Wright and Boschen 1993, Msall et al
1994, Nordmark et al 1997, Ottenbacher et al 1997, Daltroy et al 1998, Russell
et al 2000, Young et al 2000, Vitale et al 2001, Graham et al 2004, Damiano et
al 2005, Vos-Vromans et al 2005). There were four articles that described the
study limitations well (McAuliffe et al 1998, McCarthy et al 2002, Russell and
Gorter 2005, Wang and Yang 2006). One study of the GMFM stated limitations
of possible bias of raters confounding the results of change, a small sample size
and better statistical methods that could be used in the future (Wang and Yang
2006). Another study explained the disadvantages of using a pre-existing data

Chapter 3 – Systematic Review
78
set and lack of a standardized protocol for testing (Russell and Gorter 2005). For
responsiveness of the WeeFIM, a small sample size, subjective rating of
meaningful change and using parents as reporters was stated as limitations of
the study design (McAuliffe et al 1998). A study assessing reliability and
validity of the GMFM, PODCI, CHQ and PEDI stated small sample size and
not covering all aspects of psychometric testing as limitations of the study
(McCarthy et al 2002). Small sample sizes were a common theme in limitations,
reducing the generalisability of the results. For many of the other studies
limitations were lacking in detail or limitations of the tool rather than the study
were addressed.
3.3.5. Quality assessment results
3.3.5.1 Study aims
For the 29 studies, the aims were stated adequately and were justified except for
one (Vitale et al 2001). The aim of this investigation was vague. The authors
stated “the study seeks to evaluate the CHQ in orthopaedics and to compare it
with the PODCI”, without clarifying what aspects of the CHQ was being
evaluated.
3.3.5.2 Subject selection
The sample size was large enough to ensure adequate statistical power in 25 of
the studies. In four the sample sizes were small (Nordmark et al 1997,
McAuliffe et al 1998, Nordmark et al 2000, Wright et al 2005). Three of these
studies assessed responsiveness with sample sizes of 20 (McAuliffe et al 1998),
18 (Nordmark et al 2000) and 9 (Wright et al 2005). One had a small sample
size of three (Nordmark et al 1997). This study was examining reliability and
involved 15 raters. For all studies the population of participants was described
adequately. This includes the samples involving children with diagnoses other
than CP that were described as children with disabilities, neuromuscular or
musculoskeletal disorders.
The recruitment procedures were described and well-matched to the study aims
in 24 studies yet five were inadequately described. For these five (Wright and
Boschen 1993, Msall et al 1994, Ottenbacher et al 1996, Nordmark et al 1997,
Chapter 3 – Systematic Review
79
Vos-Vromans et al 2005) the recruitment procedures were unclear and it was
difficult to assess if they were well-matched to the study aims. The sampling
procedure was described well in 23 studies and well-matched to the study aims.
Sampling was unclear or not described at all in six (Wright and Boschen 1993,
Msall et al 1994, Nordmark et al 1997, Bjornson et al 1998, Bjornson et al 1998,
McAuliffe et al 1998, Vos-Vromans et al 2005). Whether the sampling
procedures were well-matched to the aims of the study was unable to be
determined.
3.3.5.3 Subject characteristics
Subject characteristics were described with various levels of detail, not all
satisfactory. Subject ages were adequately described in 23 studies yet were
lacking in detail in six (Russell et al 1989, Wright and Boschen 1993, Daltroy et
al 1998, Graham et al 2004, Chen et al 2005, Damiano et al 2005). In two
studies subject ages were not stated (Russell et al 1989, Chen et al 2005). In the
other four details were lacking such as mean age or range (Wright and Boschen
1993, Daltroy et al 1998, Graham et al 2004, Damiano et al 2005). Gender ratio
of the subjects was detailed well in only 17 studies and inadequate in 12
(Russell et al 1989, Wright and Boschen 1993, Msall et al 1994, Nordmark et al
1997, Daltroy et al 1998, McAuliffe et al 1998, Pencharz et al 2001, Chen et al
2005, Damiano et al 2005, Vitale et al 2005, Vos-Vromans et al 2005, Wright et
al 2005).
Description of the subjects using GMFCS levels, topography of CP (hemiplegia,
diplegia and quadriplegia) or severity of the condition (mild, moderate, severe)
was generally adequately described in 20 studies. This included those studies
with mixed samples where topography or GMFCS level is not applicable. It also
includes a large number where GMFCS level is not applicable due to the date of
the article being before the GMFCS was routinely used in the field of CP. There
were nine studies where the subjects were not described well in relation to CP
severity, topography or GMFCS level (Wright and Boschen 1993, Ottenbacher
et al 1996, Nordmark et al 1997, Sperle et al 1997, Pencharz et al 2001, Vitale et
al 2001, Chen et al 2005, Damiano et al 2005, Vos-Vromans et al 2005). One of
these was partially described but lacked some information (Vos-Vromans et al

Chapter 3 – Systematic Review
80
2005). There were five studies that described the sample of children with CP
very thoroughly by using more than one descriptor. Four of these described
them by GMFCS level and topography (Russell et al 2000, Wake et al 2003,
Wright et al 2005, Wang and Yang 2006). One described them by GMFCS level
and type of movement disorder (Russell and Gorter 2005).
3.3.5.4 Inclusion and exclusion criteria
The inclusion criteria were described adequately to satisfy the aims in 21
studies. There was insufficient information or the criteria were not stated at all
in eight (Msall et al 1994, Nordmark et al 1997, Sperle et al 1997, Bjornson et al
1998, Nordmark et al 2000, Novacheck et al 2000, Graham et al 2004, Vitale et
al 2005). Exclusion criteria performed poorly overall with only four studies
describing them well in order to reduce the effects of confounding factors such
as maturation, treatment interfering with results or diverse diagnostic groups
within the sample (Russell et al 2000, Vitale et al 2001, Chen et al 2005, Wang
and Yang 2006). The remaining 25 studies provided insufficient information or
often no information at all regarding exclusion criteria.
3.3.5.5 Tool feasibility
Tool feasibility was not explored particularly well in the studies. Many articles
did not state the time taken, the equipment required or training required for
administration. Although some tools require up to 60 minutes to complete
(PEDI, GMFM), these are aimed to be comprehensive. The time taken therefore
is in line with the aims of the tool. The tools that require less time to administer
aim to be less comprehensive. For the purpose of this review all tools
administration times are according to the aims.
It was difficult to extract information regarding equipment needs from the
included studies. Self-report measures do not require equipment (ASK, CHQ,
FAQ, FMS, PODCI). The GMFM requires “usual physiotherapy equipment”
and scoring manuals although the exact equipment required is not known
without sourcing the manual. The PEDI and WeeFIM require manuals or
software yet descriptions of these are vague.

Chapter 3 – Systematic Review
81
Training required for administration of the tools varies. This was also not
described well. The five tools that are self-report do not require training. The
WeeFIM, PEDI and GMFM do require some training and trial use and the
requirements appear to be in line with the aim of the tools. Similarly with
administration time, the tools that aim to be more comprehensive require more
training, such as the GMFM and PEDI.
3.3.5.6 Psychometric testing
The psychometric testing results are summarised in tables 3.4-3.11. The results
for each tool are presented separately with reliability, validity and
responsiveness listed. The reliability testing procedures and results were
comprehensible and easily interpreted in most studies. The validity questions
posed were clear yet interpretation of results was a little more difficult to
ascertain. Responsiveness was inconsistent among the studies with some
thoroughly examining it with sound statistical analysis while others appeared to
be investigating change after treatments rather than responsiveness of the tool.
These results were often difficult to interpret. Psychometric testing results will
concentrate on the total scores of the tools and mobility and physical function
domains. Social and cognitive domains will not be interpreted with any depth
because the focus of this review is tools that measure activity or activity
limitations.
Judgements on reliability are based on guidelines that 0.70 is recommended as a
minimum standard for reliability (Nunnally and Bernstein 1994). Criteria for
correlation coefficients describe good to excellent correlation if the coefficient
is over 0.75, moderate to good if it is 0.50-0.75, fair degree of correlation for
0.25-0.50 and little or no relationship if it is 0.00-0.25 (Portney and Watkins
1993)(pg 442). However, these are not strict cut-off points because they are
affected by sample size, measurement error, and the types of variables being
studied (Portney and Watkins 1993). Some of the studies used effect sizes to
analyse responsiveness. Effect size of 0.2 is considered small, 0.5 moderate and
0.8 large (Cohen 1977).
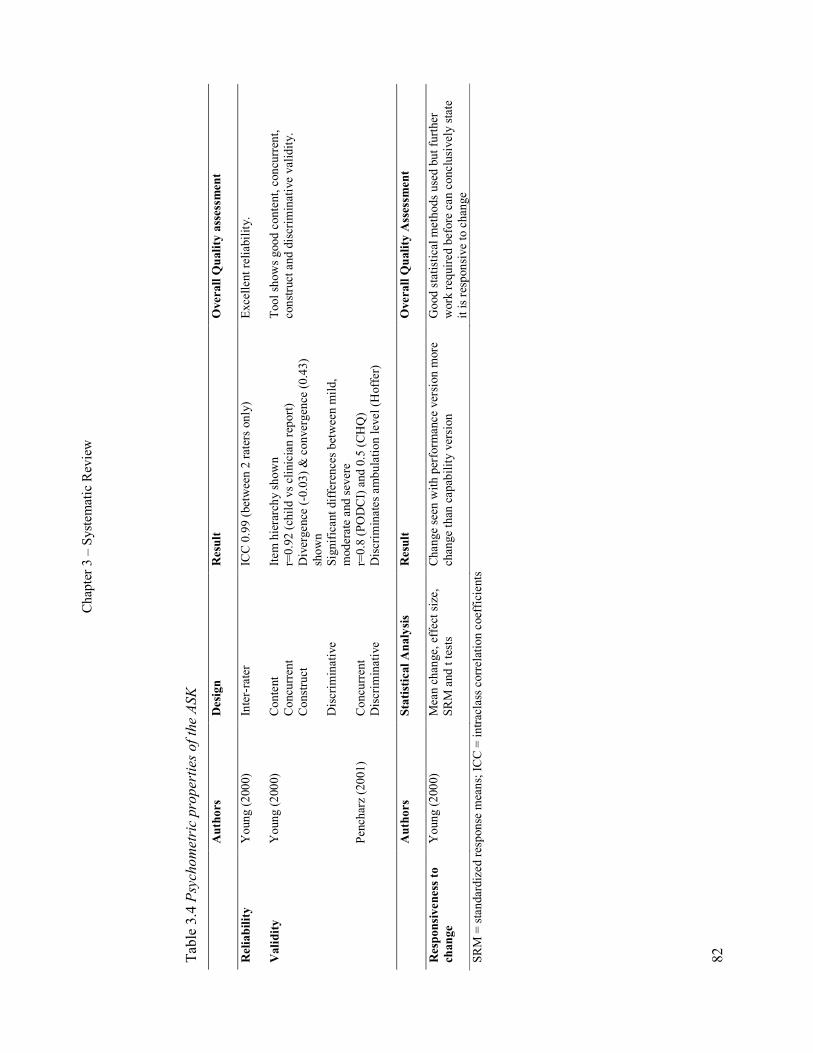
Chapter 3 – Systematic Review
82
Table 3.4 Psych
ometric pro
perties of the ASK
Authors
Design
Result
Overall Q
uality assessment
Reliability
Young (2000)
Inter-rater
ICC 0.99 (between 2 raters only)
Excellent reliability.
Validity
Young (2000)
Pencharz (2001)
Content
Concurrent
Construct
Discriminative
Concurrent
Discriminative
Item hierarchy shown
r=0.92 (child vs clinician report)
Divergence (-0.03) & convergence (0.43)
shown
Significant differences between mild,
moderate and severe
r=0.8 (PODCI) and 0.5 (CHQ)
Discriminates ambulation level (Hoffer)
Tool shows good content, concurrent,
construct and discriminative validity.
Authors
Statistical Analysis
Result
Overall Q
uality Assessm
ent
Responsiveness to
change
Young (2000)
Mean change, effect size,
SRM and t tests
Change seen with performance version more
change than capability version
Good statistical methods used but further
work required before can conclusively state
it is responsive to change
SRM = standardized response means; ICC = intraclass correlation coefficients
Chapter 3 – Systematic Review
83
The ASK
Table 3.4 shows the psychometric properties of the ASK. One study evaluated
reliability of the ASK in a large sample of children (Young et al 2000) as part of
a larger study examining validity and responsiveness. Excellent agreement was
found between two clinicians, however more extensive reliability testing is
required.
The content, concurrent, construct and discriminative validity of the ASK was
examined in two studies (Young et al 2000, Pencharz et al 2001). Rasch
analysis confirmed all items measured a single construct (physical disability)
and showed a hierarchical structure among the items (Young et al 2000).
Concurrent validity using Pearsons r showed high correlation of the child-
reported ASK scores with clinician–reported observation ASK score (Young et
al 2000). The second showed fair correlations between the ASK and the CHQ
physical function subscale and higher between the ASK and the PODCI global
function scale (Pencharz et al 2001). Construct validity was supported by low
correlations with dissimilar constructs on the Health Utilities Index (HUI)
proving divergence and higher for similar constructs proving convergence
(Young et al 2000). Discriminative validity testing showed significant
differences between the mild, moderate and severely disabled groups of children
(Young et al 2000). The ASK was also found to significantly discriminate
ambulation level using the Hoffer scale (Pencharz et al 2001). Overall the
studies provided evidence of the validity of the ASK.
Responsiveness of the ASK was examined thoroughly by comparing mean
change observed on the ASK compared with the CHQ, as well as calculating
effect size and t tests in a subset of 34 children (Young et al 2000). The ASK-
performance showed similar change to the CHQ and the ASK-capability
showed slightly less change. As the authors state, that it is difficult to ascertain
the clinical importance of the results and further work is required.

Chapter 3 – Systematic Review
84
Table 3.5 Psych
ometric pro
perties of the CHQ
Authors
Design
Results
Overall Q
uality Assessm
ent
Reliability
Wake (2003)
McCarthy (2002)
Internal consistency
Internal consistency
Cronbach ά 0.75-0.97
Cronbach ά 0.80-0.94
Good internal consistency. Requires
reliability testing in CP.
Validity
Vitale (2005)
Vitale (2001)
Pencharz (2001)
McCarthy (2002)
Wake (2003)
Concurrent
Discriminative
Concurrent
Discriminative
Concurrent
Discriminative
Concurrent
Discriminative
Discriminative
0.17-0.41 (vs subjective physician score)
Detect difference between quadriplegia and
hemi/diplegia but not between hemiplegia and
diplegia
0.31-0.71 (vs subjective clinician score)
CP lower than “normal”
0.5 (ASK) 0.6 (PODCI)
Weak ability to discriminate Hoffer
ambulation level
0.81 (PODCI) 0.75 (PEDI) 0.74 (GMFM)
Unable to detect topographical differences
Physical function scale able to discriminate
between mild and severe
Only concurrent and discriminative validity
tested in CP.
Concurrent validity shows moderate to good
correlation in 2 well designed studies
(Pencharz & McCarthy). Other studies use
subjective clinician scores.
Discriminative validity indicates that CHQ is
unable to discriminate severity or topography
adequately.
Other areas of validity require examining in
CP.
Authors
Statistical Analysis
Results
Overall Q
uality Assessm
ent
Responsiveness to
change
Not examined
Responsiveness to change needs to be
examined in the CP population

Chapter 3 – Systematic Review
85
The CHQ
Table 3.5 summarises the psychometric properties of the CHQ. Good internal
consistency of the items on the CHQ was demonstrated (McCarthy et al 2002,
Wake et al 2003). No other form of reliability testing was conducted. The
concurrent and discriminative validity of the CHQ was examined in a number of
studies yet other forms of validity were not addressed. Concurrent validity using
Spearman’s rho was supported overall by the studies. High correlations were
found between the physical function domain of the CHQ with the transfers and
mobility domain of the PODCI, and moderate correlations with the mobility
domain of the PEDI and the GMFM (McCarthy et al 2002). Low correlations
were found for dissimilar domains. The CHQ parent form physical subscale
correlated moderately with the ASK and PODCI (Pencharz et al 2001). A weak
correlation was found between a subjective physicians physical score with the
CHQ (Vitale et al 2005). One study compared the CHQ to subjective clinicians
physical scores and found low to moderate correlations (Vitale et al 2001).
Discriminative validity of the CHQ was examined in several studies (Pencharz
et al 2001, Vitale et al 2001, McCarthy et al 2002, Wake et al 2003, Vitale et al
2005). It showed a weak ability to discriminate ambulation level using the
Hoffer Scale (Pencharz et al 2001). It was not able to detect differences between
hemiplegia, diplegia and quadriplegia (McCarthy et al 2002). The CHQ was
only able to detect differences between quadriplegia and diplegia/hemiplegia
and not between hemiplegia and diplegia (Vitale et al 2005). In one study
children with CP were said to score lower on the CHQ than “normals” and those
with more comorbidities lower but the statistical evidence is not available to
support this comment (Vitale et al 2001). The physical function scale was able
to discriminate severity between mild and severe (Wake et al 2003) but those
children with moderate disability were not considered. These results suggest the
CHQ is not able to discriminate well. Testing of other forms of validity and
responsiveness is required for the CHQ in this population.

Chapter 3 – Systematic Review
86
Table 3.6 Psych
ometric pro
perties of the FAQ
Authors
Design
Result
Overall Q
uality Assessm
ent
Reliability
Novacheck (2000)
Inter-rater
Retest
ICC 0.81 & 0.92
ICC 0.92
Good to excellent reliability for walking
scale levels 6-10 only
Validity
Novacheck (2000)
Concurrent
Construct
r= 0.42-0.76 with a range of measures
Lowest with O2 cost, highest with PODCI
Good correlations with like measures.
Further validity testing required.
Responsiveness to
change
Not examined
Responsiveness requires examination
ICC = intraclass correlation coefficients

Chapter 3 – Systematic Review
87
The FAQ
The psychometric properties of the FAQ are summarized in Table 3.6.
Reliability of the FAQ was assessed in one study only with excellent inter-rater
reliability between parent and the school (Novacheck et al 2000). The higher
value was with a shorter time period between ratings. Intra-rater reliability
(using parents) was also excellent despite a long mean time between ratings of
13.91 weeks.
The same study aimed to assess content, construct and concurrent validity
(Novacheck et al 2000). Pearson correlation coefficients were calculated
between the FAQ and the WeeFIM motor subscale, the normalcy index, energy
data and PODCI (transfers and mobility and global function scales). The results
were all reported together with no distinct separation of what was content,
construct or concurrent validity. Correlations ranged between 0.42-0.76 with the
highest between the FAQ and PODCI transfers and mobility and lowest with
energy data. This study only included children who could walk (level 6-10 on
the FAQ) so the results can be applied to ambulant children only.
Responsiveness of the FAQ was not tested.
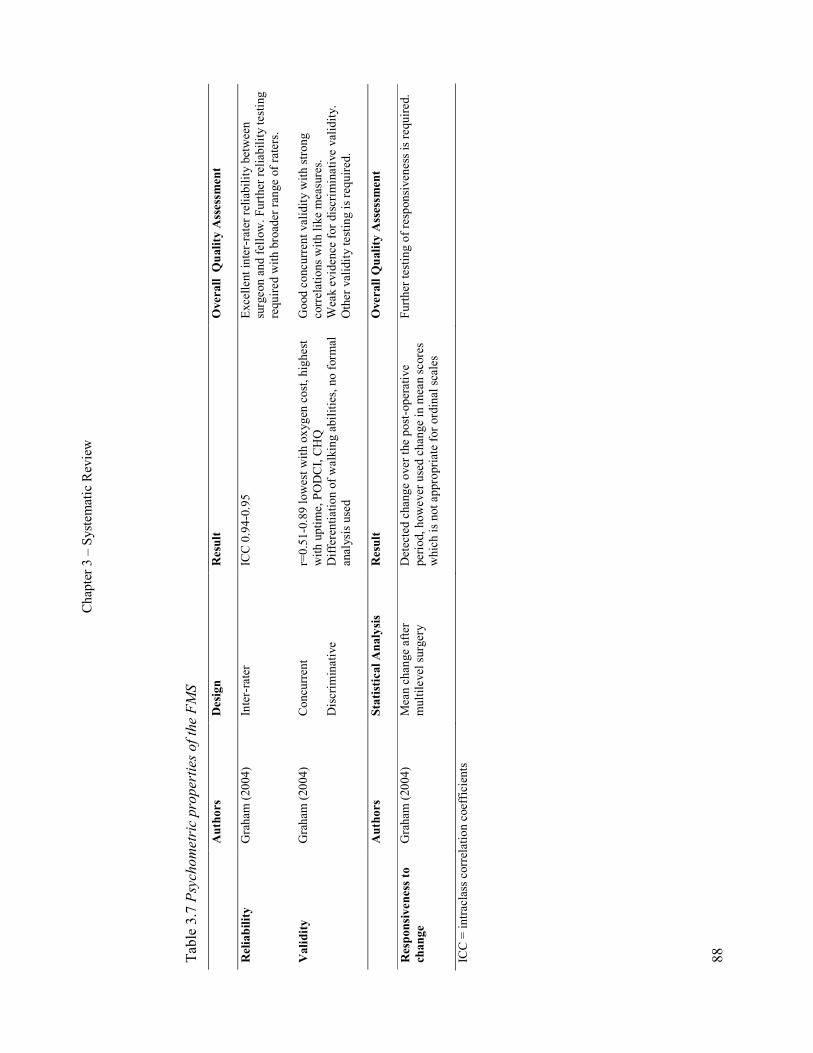
Chapter 3 – Systematic Review
88
Table 3.7 Psych
ometric pro
perties of the FMS
Authors
Design
Result
Overall Quality Assessment
Reliability
Graham (2004)
Inter-rater
ICC 0.94-0.95
Excellent inter-rater reliability between
surgeon and fellow. Further reliability testing
required with broader range of raters.
Validity
Graham (2004)
Concurrent
Discriminative
r=0.51-0.89 lowest with oxygen cost, highest
with uptime, PODCI, CHQ
Differentiation of walking abilities, no formal
analysis used
Good concurrent validity with strong
correlations with like measures.
Weak evidence for discriminative validity.
Other validity testing is required.
Authors
Statistical Analysis
Result
Overall Q
uality Assessm
ent
Responsiveness to
change
Graham (2004)
Mean change after
multilevel surgery
Detected change over the post-operative
period, however used change in mean scores
which is not appropriate for ordinal scales
Further testing of responsiveness is required.
ICC = intraclass correlation coefficients

Chapter 3 – Systematic Review
89
The FMS
Table 3.7 summarises the psychometric properties of the FMS. The one study
examining the FMS showed the scale has excellent inter-rater reliability
between two surgeons and one orthopaedic research fellow (Graham et al 2004).
Further reliability testing with a broader range of raters is required before
reliability of the tool is fully established.
The validity of the FMS was also examined. The study aimed to investigate the
content, concurrent and construct validity. Concurrent validity with other
measures showed strong correlations using Spearman’s rho with Uptime, the
PODCI and the CHQ. Moderate correlations existed with the Rancho scale (also
called the Hoffer Scale) and weak correlations with energy expenditure. No
formal statistical analysis was performed for the ability of the FMS to
differentiate varying degrees of walking ability (discriminative validity);
therefore the associations found are not strong evidence of this. Construct
validity was examined by examining the scales ability to detect change after
multilevel surgery which can be considered as responsiveness. Change over the
post-operative period was detected by the scale, however the authors appear to
use change in mean scores only which is not the most appropriate test for an
ordinal scale.

Chapter 3 – Systematic Review
90
Table 3.8 Psych
ometric pro
perties of the GMFM
Authors
Design
Result
Overall Q
uality assessment
Reliability
Bjornson (1998)
Nordmark (1997)
Russell (1989)
Russell (2000)
McCarthy (2002)
Retest
Inter-rater
Retest
Inter-rater
Retest
Retest
Internal consistency
ICC 0.76-1.0
Kendall coeff. 0.77-0.88
Kendall coeff 0.68
ICC 0.92-0.99
ICC 0.87-0.99
ICC 0.99
Cronbach ά =0.99
Overall reliability good to excellent.
Validity
Russell (2000)
Russell (1989)
Bjornson (1998)
Content
Discriminative
Concurrent
Construct
Item hierarchy shown
Severity hierarchy shown
0.82, 0.64 and 0.54
Significant correlation of change scores
by video with GMFM (not dimension A)
Content, concurrent and discriminative validity
supported.
Authors
Statistical Analysis
Result
Overall Q
uality Assessm
ent
Responsiveness to
Change
Nordmark (2000)
Russell (2005)
Russell (1989)
Russell (2000)
Vos-vromans (2005)
Wang (2006)
Wright (2005)
Friedman test, Wilcoxon
matched pairs
Paired t tests
ANOVA
ANOVA
Effect size and SRM
t tests and ROC
t tests, ES and SRM
Change detected in first 6 months after
SDR for total group and GMFCS II/III
but not IV/V (small sample = 18)
Signif. improvement with aids and AFO
vs barefoot in GMFCS III/IV for
dimension D and I-IV for E
More change in mild than moderate and
severe
Mean change on ANOVA significant
High for total score and D and E (less
effect for A, B and C)
Both versions showed change
Version 66 higher ES than 88 (small
sample = 9)
Appropriate statistics used in 3 studies yet one
had a small sample and another had a potential
for bias in ratings.
Dimensions D (standing) and E (walking,
running, jumping) show responsiveness.
Other studies tended to assess change after
treatment or over time rather than
responsiveness of the tool.
SDR = selective dorsal rhizotomy; ES = effect size; SRM = standardized response means; ROC = receiver operating curves; ANOVA = analysis of variance; ICC = intraclass
correlation coefficient
Chapter 3 – Systematic Review
91
The GMFM
Table 3.8 summarises the psychometric properties of the GMFM. The results
showed that the GMFM is a reliable tool for children with CP. Inter-rater
reliability and test-retest were high (Russell et al 1989, Nordmark et al 1997,
Bjornson et al 1998, Russell et al 2000). Internal consistency was very high
(McCarthy et al 2002). Overall reliability of the GMFM was good to excellent.
The GMFM was tested for concurrent, content, construct and discriminative
validity in three studies and these were all supported by the evidence (Russell et
al 1989, Bjornson et al 1998, Russell et al 2000). Change in GMFM-88 scores
were correlated with video-based evaluations, therapists judgement and parent’s
judgements, the higher correlation with the more objective measure (Russell et
al 1989). Content and discriminative validity were examined with the GMFM-
66 by investigating the hierarchy of items and correlating GMFM scores with
GMFCS levels (Russell et al 2000). A hierarchical structure and interval scaling
was determined through Rasch analysis and a clear relationship with milder
children scoring higher and more involved children scoring lower on the
GMFM. One study examined the construct validity by looking at change in
GMFM-88 score over time correlated with change judged by masked video
analysis (Bjornson et al 1998). Spearman rank coefficients showed significant
correlations at 12 months and 24 months post rhizotomy in all dimensions
except for lying/rolling. No statistics were used however to quantify the amount
of change in GMFM scores that occurred over the time period.
Responsiveness of the GMFM was examined in several studies (Russell et al
1989, Nordmark et al 2000, Russell et al 2000, Russell and Gorter 2005, Vos-
Vromans et al 2005, Wright et al 2005, Wang and Yang 2006). Initial testing of
the GMFM-88 showed a significant difference existed between two time points
in a “responsive” group as identified by both parent and clinician and milder
children changed more than the moderate and severe group (Russell et al 1989).
Another study examined the amount of change within 12 months based on
expected change using GMFCS level and age. Results of another study showed
a significant difference in mean GMFM-66 score (Russell et al 2000) with

Chapter 3 – Systematic Review
92
children younger than 5 years showing more change, particularly those in
GMFCS levels I and II.
Different studies used different statistical analysis to explore responsiveness.
Effect size and standardised response mean was used to examine the
responsiveness of the GMFM-88 (Vos-Vromans et al 2005). Effect size was
high for total GMFM score and the standing and walking dimensions (D and E)
but low for dimensions A, B and C. Change scores, effect size and standardized
response means were used to assess changes following a conductive education
program resulting in a medium effect size for the 88 version but higher for the
66 version (Wright et al 2005). The sample size in this study was small (9) so
caution is required with interpreting the results regarding the magnitude of
change.
One study examined the responsiveness of both GMFM versions (the 66 and 88)
using a therapist judgement on change as the external standard over a 3 month
period (Wang and Yang 2006). The change scores and the receiver operating
characteristic curve showed that significant differences existed in GMFM scores
for those judged as having large improvement. No significant improvement was
seen for those judged not to have changed. The sensitivity of the two versions
was similar but the 66 appeared to have higher association with therapist
judgement of change. A limitation of this study was that the same therapist
performed the judgement of change as well as the administering the GMFM.
The chance of bias from the therapists having prior knowledge of performance
on the GMFM before judging change must be considered.
Responsiveness of the GMFM-88 to detect changes in function with aids or
orthoses showed significant improvements when using aids compared to none
and when using orthoses versus barefoot in children GMFCS levels III and IV
for standing and levels I-IV for walking (Russell and Gorter 2005). However,
there is no comparable measure in this study to determine how much change
actually did occur so the study assesses change not responsiveness. Sensitivity
of the GMFM-88 and PEDI was examined for a small sample of children at 6
and 12 months following rhizotomy using to see at what stage change occurred

Chapter 3 – Systematic Review
93
(Nordmark et al 2000). The GMFM detected significant change in the group
over time in the second 6 months after rhizotomy, these changes seen in
moderate (GMFCS II and III) but not severely involved children (IV and V).
Overall responsiveness was tested well in two studies and showed that
dimensions D and E of the GMFM are responsive (Vos-Vromans et al 2005,
Wright et al 2005), despite one of these studies using a small sample size. The
other studies do show changes after treatments or interventions; however they
appear to be examining change after interventions rather than responsiveness of
the tool. This issue will be elaborated on in the discussion and in Chapter Six.

Chapter 3 – Systematic Review
94
Table 3.9 Psych
ometric pro
perties of the PEDI
Authors
Design
Result
Overall Q
uality assessment
Reliability
Nichols (1996)
Wright (1993)
McCarthy (2002)
Inter-rater
Retest
Inter-rater
Retest
Internal consistency
ICC 0.15-0.95
ICC 0.67-1.0
ICC 0.72-0.85
ICC >0.95
Cronbach ά 0.98-0.99
Very high internal consistency. Reliability of
mobility domain good to excellent yet lower
for self-care and social function domains.
Validity
Nichols (1996)
Wright (1993)
McCarthy (2002)
Concurrent
Concurrent
Concurrent
Discriminative
r=0.24-0.95 (PDMS)
r=0.59-0.85 (GMFM) – inadequate details in
method and results
r=0.91 (GMFM), 0.88 (PODCI), 0.74 (CHQ)
multivariate ANOVA - significant
differences for hemiplegia, diplegia and
quadriplegia
Concurrent validity generally very good with
high correlations for related domains and
lower for unrelated domains.
Good discriminative ability of tool for
topography of CP
Requires further testing in this population for
other forms of validity e.g. content, construct
Authors
Statistical Analysis
Result
Overall Q
uality Assessm
ent
Responsiveness
to Change
Nordmark (2000)
Vos-vromans (2005)
Wright (2005)
Friedman test, Wilcoxon
matched pairs
Effect size and SRM
Effect size and SRM
Detected change in 1st 6 months after SDR
for both moderately and severely involved
(small sample = 18)
Every dimension high vs parent change
score
Medium ES for PEDI part II and small for
part I after CE. Small sample size (9)
Good statistics used with tool showing
responsiveness as detected by parents in one
study, inconclusive in one study and third
study assessed change after SDR rather than
responsiveness of the tool.
SRM = standardized response mean; ICC = intraclass correlation coefficient; SDR = selective dorsal rhizotomy; ANOVA = analysis of variance; CE = conductive education

Chapter 3 – Systematic Review
95
The PEDI
The psychometric properties of the PEDI are summarized in Table 3.9 The
inter-rater and retest reliability was found to be high in the mobility domain and
total score (Wright and Boschen 1993, Nichols and Case-Smith 1996). Inter-
rater reliability was low in the self-care domain which may be due to differences
in familiarity of the child’s self-care function between the responding parents
and therapists (Nichols and Case-Smith 1996). Internal consistency was
excellent (McCarthy et al 2002).
Validity testing for the PEDI focused on concurrent validity. Strong
correlations, using Spearman’s rho, of the mobility and self-care domains were
shown with the GMFM and like domains of the PODCI and CHQ (McCarthy et
al 2002). Correlations were low in unrelated domains. The PEDI total score and
mobility score had slightly weaker correlations with the GMFM (Wright and
Boschen 1993). This study did not detail well the methodology or results;
therefore it is difficult to make a clear judgement. Moderate to high correlations
using Pearson’s r were shown of the PEDI with the related PDMS domains
(Nichols and Case-Smith 1996). Examination of discriminative validity of the
PEDI mobility domain showed differences in physical health using
topographical distribution of CP (McCarthy et al 2002).
Responsiveness of the PEDI was examined in three studies (Nordmark et al
2000, Vos-Vromans et al 2005, Wright et al 2005). Correlation of change on the
PEDI versus parent change score was high on every dimension (Vos-Vromans
et al 2005). The sensitivity of the PEDI for a small sample of children following
rhizotomy showed it was able to detect change within the first 6 months (earlier
than the GMFM) for both moderately and severely involved children (Nordmark
et al 2000). The responsiveness of the PEDI following a conductive education
program showed small and medium effects sizes (Wright et al 2005), however
the sample size in this study limits the ability to assess the magnitude of change
and hence responsiveness. Generally responsiveness of the PEDI was supported
by the evidence although one study had a small sample and one appears to be
assessing change after treatment rather than responsiveness of the tool.
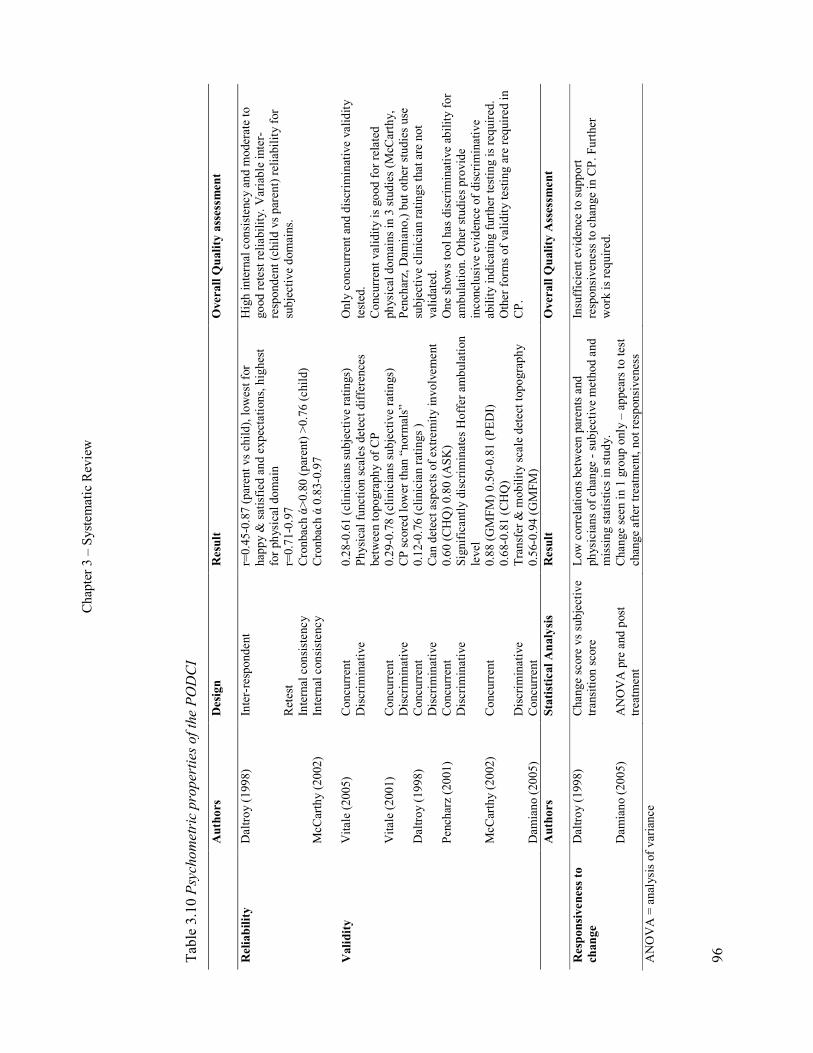
Chapter 3 – Systematic Review
96
Table 3.10 Psych
ometric pro
perties of the PODCI
Authors
Design
Result
Overall Q
uality assessment
Reliability
Daltroy (1998)
McCarthy (2002)
Inter-respondent
Retest
Internal consistency
Internal consistency
r=0.45-0.87 (parent vs child), lowest for
happy & satisfied and expectations, highest
for physical domain
r=0.71-0.97
Cronbach ά>0.80 (parent) >0.76 (child)
Cronbach ά 0.83-0.97
High internal consistency and moderate to
good retest reliability. Variable inter-
respondent (child vs parent) reliability for
subjective domains.
Validity
Vitale (2005)
Vitale (2001)
Daltroy (1998)
Pencharz (2001)
McCarthy (2002)
Damiano (2005)
Concurrent
Discriminative
Concurrent
Discriminative
Concurrent
Discriminative
Concurrent
Discriminative
Concurrent
Discriminative
Concurrent
0.28-0.61 (clinicians subjective ratings)
Physical function scales detect differences
between topography of CP
0.29-0.78 (clinicians subjective ratings)
CP scored lower than “normals”
0.12-0.76 (clinician ratings )
Can detect aspects of extremity involvement
0.60 (CHQ) 0.80 (ASK)
Significantly discriminates Hoffer ambulation
level
0.88 (GMFM) 0.50-0.81 (PEDI)
0.68-0.81 (CHQ)
Transfer & mobility scale detect topography
0.56-0.94 (GMFM)
Only concurrent and discriminative validity
tested.
Concurrent validity is good for related
physical domains in 3 studies (McCarthy,
Pencharz, Damiano,) but other studies use
subjective clinician ratings that are not
validated.
One shows tool has discriminative ability for
ambulation. Other studies provide
inconclusive evidence of discriminative
ability indicating further testing is required.
Other forms of validity testing are required in
CP.
Authors
Statistical Analysis
Result
Overall Q
uality Assessm
ent
Responsiveness to
change
Daltroy (1998)
Damiano (2005)
Change score vs subjective
transition score
ANOVA pre and post
treatment
Low correlations between parents and
physicians of change - subjective method and
missing statistics in study.
Change seen in 1 group only – appears to test
change after treatment, not responsiveness
Insufficient evidence to support
responsiveness to change in CP. Further
work is required.
ANOVA = analysis of variance
Chapter 3 – Systematic Review
97
The PODCI
Table 3.10 displays the psychometric properties of the PODCI. The reliability of
the PODCI has not been tested extensively. Internal consistency was found to be
high in two studies for the parent and adolescent version (Daltroy et al 1998,
McCarthy et al 2002). Correlations for test-retest reliability were good and
variable for inter-rater reliability between the parents and their child (Daltroy et
al 1998). The lowest correlations were for “happy and satisfied” and
“expectations”. The highest were for “physical function and sports” and
“transfers and mobility”. These areas of disagreement may reflect the different
perspectives of the child and parent on the effect of the disability in subjective
domains.
Concurrent and discriminative validity were tested in six studies yet other forms
of validity were not examined. Concurrent validity testing resulted in variable
results. One study investigating the “uniqueness” of the PODCI appears to be
testing concurrent validity by correlating it to the GMFM-88 using Pearson’s r
(Damiano et al 2005). Correlations were variable with the strongest for PODCI
transfers and mobility with total GMFM score and the standing dimension D
and the lowest for dimensions A, B and C with sports and physical function.
Two studies correlated PODCI scores to subjective ratings from the
clinicians/physicians treating the children (Vitale et al 2001, Vitale et al 2005).
Correlations ranged from low in the pain/comfort domain to high in the sports
and physical function domain (Vitale et al 2001, Vitale et al 2005). Using
clinician ratings that are subjective and not validated weakens the evidence of
validity of the PODCI. One of these studies correlated the PODCI to the CHQ
with the expectation that similar domains would correlate highly, however the
data was not presented in the article (Vitale et al 2005).
High correlations using Spearman’s rho were shown between the transfers and
mobility domain of the PODCI with the GMFM, the PEDI and the CHQ like
domains (McCarthy et al 2002). Lower correlations were found for unlike
domains as predicted. Correlations between the PODCI and CHQ were found to
be moderate to good and high with the ASK (Pencharz et al 2001). Correlations
between physician ratings of global function and parent scales with the PODCI

Chapter 3 – Systematic Review
98
were variable using Pearson’s r (Daltroy et al 1998). The lowest were in the
domains of “happy and satisfied”, “expectations” and “comfort” and the highest
in the physical function areas. Similar results were obtained with the adolescent
version. Overall the concurrent validity of the PODCI is supported form the
studies.
Discriminative validity was also examined in several studies (Daltroy et al 1998,
Pencharz et al 2001, Vitale et al 2001, McCarthy et al 2002, Vitale et al 2005).
One study examined whether the PODCI could differentiate differences
between subjects with and without lower extremity involvement and with and
without upper extremity involvement (Daltroy et al 1998). As could be
espected, the PODCI upper extremity function scale appeared to discriminate
with and without upper extremity problems and the physical function and sports
detected with and without lower extremity involvement the best. Other studies
of discriminative validity show a strong ability for it to discriminate ambulation
level using the Hoffer scale (Pencharz et al 2001). The transfer and mobility
scale can significantly detect differences between hemiplegia, diplegia and
quadriplegia (McCarthy et al 2002). One study described the mean scores in
relation to topographical distribution of CP and the physical function scales
detected differences between hemiplegia, diplegia and quadriplegia (Vitale et al
2005). Another study stated that children with CP scored lower on the PODCI
than “normals” and those with more comorbidities scored lower, however there
is no statistical evidence to support this (Vitale et al 2001). Other forms of
validity testing need to be examined before the tool is fully validated in this
population.
Responsiveness of the PODCI was examined in two studies (Daltroy et al 1998,
Damiano et al 2005). One compared change pre and post treatment in PODCI
and GMFM (Damiano et al 2005). Compared with a non-matched group of
children who had no intervention, changes were seen in GMFM for the groups
who had muscle/tendon surgery and rhizotomy. In the PODCI global function
scale only the muscle/tendon surgery group showed change. Neither showed
changes in the intrathecal Baclofen group. It is difficult to draw strong
conclusions from this study as the control group was not matched to the surgical

Chapter 3 – Systematic Review
99
groups. Also the study appears to be examining change after treatment rather
than responsiveness of the tool. In another study the correlation of change
scores with transition scores as rated by parents and physicians were low
(Daltroy et al 1998). t tests were used to examine the responsiveness of the
PODCI with the authors stating it is sensitive to change, particularly the global
scale, however there were no p values given and it is difficult to make a clear
statement on the results.
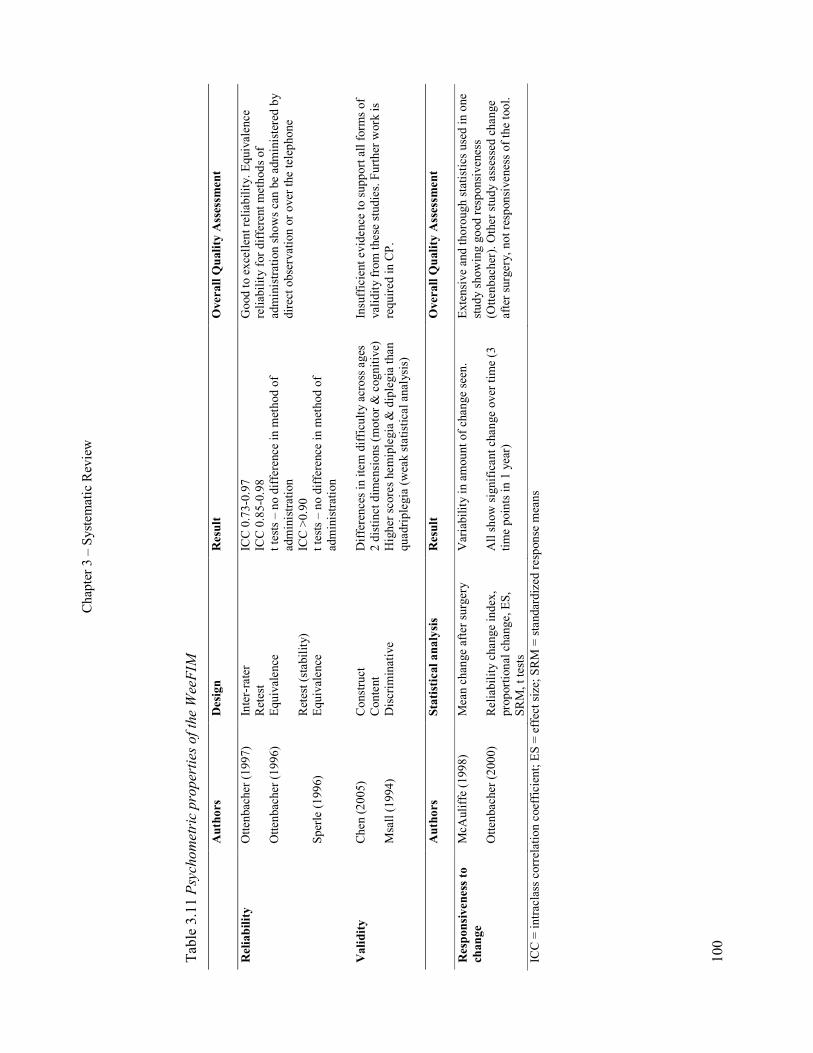
Chapter 3 – Systematic Review
100
Table 3.11 Psych
ometric pro
perties of the Wee
FIM
Authors
Design
Result
Overall Q
uality Assessm
ent
Reliability
Ottenbacher (1997)
Ottenbacher (1996)
Sperle (1996)
Inter-rater
Retest
Equivalence
Retest (stability)
Equivalence
ICC 0.73-0.97
ICC 0.85-0.98
t tests – no difference in method of
administration
ICC >0.90
t tests – no difference in method of
administration
Good to excellent reliability. Equivalence
reliability for different methods of
administration shows can be administered by
direct observation or over the telephone
Validity
Chen (2005)
Msall (1994)
Construct
Content
Discriminative
Differences in item difficulty across ages
2 distinct dimensions (motor & cognitive)
Higher scores hemiplegia & diplegia than
quadriplegia (weak statistical analysis)
Insufficient evidence to support all forms of
validity from these studies. Further work is
required in CP.
Authors
Statistical analysis
Result
Overall Q
uality Assessm
ent
Responsiveness to
change
McAuliffe (1998)
Ottenbacher (2000)
Mean change after surgery
Reliability change index,
proportional change, ES,
SRM, t tests
Variability in amount of change seen.
All show significant change over time (3
time points in 1 year)
Extensive and thorough statistics used in one
study showing good responsiveness
(Ottenbacher). Other study assessed change
after surgery, not responsiveness of the tool.
ICC = intraclass correlation coefficient; ES = effect size; SRM = standardized response means
Chapter 3 – Systematic Review
101
The WeeFIM
Table 3.11 summarises the psychometric properties of the WeeFIM. It was
found to have very good inter-rater and retest reliability (Ottenbacher et al
1997). This study also found that ICC values for a shorter interval between
ratings (3-7 days) were generally higher than for the long interval (20-30 days).
Equivalence reliability was tested in two studies where the authors compared
administration of the WeeFIM by direct observation with parental interview
(Sperle et al 1997) and direct observation and interview with over the phone
interview (Ottenbacher et al 1996). There were no significant differences found
between methods of administration in either study. Test-retest (stability) of
repeated administration over 7-14 days was excellent (Ottenbacher et al 1996).
Validity of the WeeFIM in the CP population has not been thoroughly assessed.
One study vaguely explored WeeFIM scores against topography of CP
(discriminative validity) and found that mean WeeFIM was higher for
hemiplegia and diplegia as compared to children with quadriplegia (Msall et al
1994). The analysis of this was not extensive and the study provides insufficient
information to make any strong statements about the discriminative ability of
the tool. The WeeFIM was investigated for item fit, dimensionality and motor
item difficulty in three different age groups (Chen et al 2005). Rasch analysis
found two distinct dimensions (motor and cognitive). Order of motor item
difficulty varied across age groups some of which can essentially be explained
by the developmental age and stage of the child.
Responsiveness of the WeeFIM was examined in two studies (McAuliffe et al
1998, Ottenbacher et al 2000). To assess change after orthopaedic surgery and
physiotherapy, mean change was used to measure difference from admission to
phone follow-up in 20 children with CP (McAuliffe et al 1998). For the mobility
items there was a lot of variability in the amount of change in the sample with
the greatest change in children with diplegia (compared with quadriplegia). The
study did not use a comparable measure to detect if change actually occurred;
hence it appears to be examining change after surgery not responsiveness of the
tool. A well controlled study used extensive statistical measures to assess the
Chapter 3 – Systematic Review
102
ability of the WeeFIM to detect change in functional status in a large sample of
children assessed three times over a 1 year period (Ottenbacher et al 2000). All
statistical methods showed statistically significant or reliable changes over time.
Effect size was moderate for the motor subscale and total score and small for
transfers and locomotion. The results of this study indicate the WeeFIM is a
responsive measure.
3.4. Discussion and main review findings
3.4.1. Psychometrics
The main finding from this systematic review was that some tools have been
extensively tested and performed well while others still require further testing in
this population before they can be classified as robust measurement tools. The
GMFM and the ASK performed the best overall with sound psychometric
properties in most areas. In general, the reliability of the eight tools included
was found to be adequate with most tools showing good to excellent reliability.
Validity testing results of all tools except the GMFM and ASK were variable
with more work in specific areas required. Concurrent validity of the tools was
tested extensively with good results, an area that has been covered amply in the
literature with studies excluded from this review exploring relationships among
outcome measures (Drouin et al 1996, Ottenbacher et al 1999, Azuala et al
2000, Schneider et al 2001, Tervo et al 2002, Abel et al 2003, Oeffinger et al
2004). Further research is required examining the construct validity of the tools.
Discriminative validity also requires more investigation, particularly the ability
of the tools to discriminate GMFCS levels (Palisano et al 1997) as this is now
the preferred classification system of severity of motor impairment for children
with CP. This has been addressed more recently for the GMFM, PODCI,
WeeFIM and FAQ (Bagley et al 2007).
This review examined evaluative measures. These need to be responsive to
change in order to be valid (Rosenbaum et al 1990). This has been examined
more extensively since the Ketelaar review which found that only the GMFM
and PEDI showed responsiveness (Ketelaar et al 1998). Confusion in the
literature regarding responsiveness arises from a lack of distinction between

Chapter 3 – Systematic Review
103
responsiveness defined as the effect of treatment and responsiveness defined as
the correlation of changes in the instrument with changes in other measures
(Terwee et al 2003). The studies included in this review examining
responsiveness to change used variable methods of analysis. As a result some of
the studies examined treatment effects without providing information about the
ability of the instrument to detect clinically important change. Often it is not
known the change in score that constitutes a clinically important difference
hence the use of indices estimating responsiveness (Guyatt et al 1987). Some
authors used several different measures due to lack of consensus on the single
best procedure for determining responsiveness (Ottenbacher et al 2000, Young
et al 2000, Vos-Vromans et al 2005). Responsiveness is perhaps not a separate
measurement property with current measures assessing longitudinal validity or
the magnitude of treatment effect (Terwee et al 2003). These concepts will be
explored further in Chapter Six. For this review responsiveness was examined
well for the ASK, GMFM, PEDI and WeeFIM. It was not examined at all for
the CHQ or the FAQ despite the authors of the FAQ stating it can be used to
measure change.
One of the difficulties experienced with conducting this review was examining
and comparing measures when some are multidimensional, such as the CHQ
and PODCI. This review focused on activity limitation measures. In many of the
studies the domains were not separated out clearly and it was difficult to
compare or examine the activity related domains in isolation.
3.4.2. Clinical Use
The main theme to emerge from examining the clinical utility of the tools was
that each has strengths and weaknesses. Some tools take longer to administer
and are more comprehensive (e.g. PEDI and GMFM) while others are quick to
administer and more practical (e.g. ASK, FAQ and FMS). The WeeFIM and
PEDI include similar domains, have sound psychometric properties and
correlate well on similar constructs (Ziviani et al 2001). The WeeFIM has a
minimum data set and therefore is more time efficient. It can be utilized when
the detail obtained from the PEDI is not required. Some of the tools are specific
to CP (e.g. GMFM, FMS) and some are specific to walking or mobility (e.g.
Chapter 3 – Systematic Review
104
FMS, FAQ). The two health-related quality of life measures (e.g. CHQ, PODCI)
give a broader perspective but lose some specificity and have floor and ceiling
effects. Different tools utilize reporting from the parent, the child or the
clinician therefore giving varied perspectives on the child’s function. These
perspectives can be vastly different depending on who reports. This issue will
be elaborated on further in the grand discussion. In general, no one tool can
cover all domains of the ICF effectively and a range of tools is required, some
of which are better suited for clinical use and others for research.
3.4.3. Environmental context and other factors
One aim of this systematic review was to determine if the tools incorporated
different environmental settings and different assistive devices. All apart from
the GMFM incorporate different environmental settings, however only the FMS
differentiates the difference in function between the home, the school and the
community. These are all important settings to children with CP. The FMS and
CHQ are the only tools to measure activity specific to the school environment.
The FMS is the only tool that differentiates the various assistive devices a child
with CP might use for activity, particularly mobility. Also of interest was
whether the tools measure performance or capability. Performance measures are
stated to be more reflective of community function and therefore more relevant
to children (Young et al 1996). All of the tools except the GMFM measure
performance with the ASK and PEDI incorporating both.
3.4.4. Limitations
It is important to discuss the limitations of this review. The inclusion and
exclusion criteria were extensive and focused. By restricting it to evaluative
tools a number of tools that are used for discriminative purposes were excluded.
In addition, by restricting it to tools used for children with CP and to studies that
must have children with CP in their sample, a number of studies were excluded.
Excluded were studies examining the psychometric properties of the ASK in
children with musculoskeletal disability without CP (Young et al 1995) and
children without musculoskeletal disability (Plint et al 2003) and the WeeFIM
in children without developmental delays (Msall et al 1994). Studies on
unimpaired children using the PODCI (Haynes and Sullivan 2001) and the CHQ

Chapter 3 – Systematic Review
105
(Waters et al 2000, Waters et al 2000, Raat et al 2005) were also excluded on
this basis. Several studies were excluded on the basis that they did not obviously
include children with CP in their sample. This essentially involved studies on
the validity and reliability of the PEDI (Feldman et al 1990, Ziviani et al 2001,
Berg et al 2004). These studies add to evidence of psychometric properties of
the tools. Although studies were excluded, it was necessary to have tight
methodology because the area of measurement tools in children with CP is
extremely broad. In order to examine it properly a number of well-designed and
thorough reviews on different aspects are required.
3.5. Conclusion and recommendations
This systematic review identified eight evaluative outcome measures that assess
activity limitations in children with CP. Each examines different dimensions of
activity limitation including mobility, gross motor function, self-care and
cognitive and social function. The designs of the 29 studies selected were
critically analysed in order to evaluate psychometric properties. Overall, the
ASK and GMFM showed the most robust psychometric properties. The
reliability of all tools was good, although further examination of validity and
responsiveness to change is required for the CHQ, FAQ, FMS and PODCI in
this population. The PEDI and WeeFIM require further examination of some
aspects of validity.
All tools measure performance except for the GMFM, which measures
capability. The PEDI and ASK consider both. Different environmental settings
are incorporated within all tools except for the GMFM. The FMS, which is
specific to mobility, is the only tool that addresses different environmental
contexts and different assistance required within those. However, the FMS also
requires further psychometric testing, such as inter-rater reliability for a range of
raters, better designed discriminative, concurrent and construct validity testing
and further investigation of responsiveness.
The feasibility and clinical utility of the measures were evaluated showing that
each has a different purpose for application in CP. Because no single measure
adequately addresses all aspects of the ICF, it is advisable in the clinical
Chapter 3 – Systematic Review
106
decision making process for the selection of the tool to be based on established
psychometric properties of the tool together with the goals of the measurement.
Chapter 4 – Development of the FMS
107
CHAPTER FOUR: DEVELOPMENT OF THE FUNCTIONAL
MOBILITY SCALE AND PILOT STUDY
4.1. Introduction
This chapter provides the background on the original development of the FMS
and reports on an early pilot study that investigates the clinical applicability of
the FMS. The systematic review in Chapter Two showed that, excluding the
FMS, no activity limitation measures considered the range of assistive devices
that a child with CP might use during mobility tasks. Although many other
measures incorporated different environmental settings, the FMS was the only
one to differentiate the difference in function between the settings. Prior to
development of the FMS, existing measures did not address mobility in children
with CP in different environments, particularly with respect to the different
levels of assistance required.
It is observed in the clinical setting that children with CP use different levels of
assistance for their mobility and this can impact on their long term function and
participation. In settings such as the gait laboratory it is important to be able to
quantify the precise level of support children require. This is particularly
important before and after interventions where clinical experience reveals that
assistive device requirements change over the post-operative rehabilitation
period. This was illustrated in a study before the development of the FMS that
examined the effects of proximal femoral varus rotation osteotomies on the gait
of children with CP (Murray-Weir et al 2003). The study recorded functional
walking status of the children; however the authors stated that not all changes in
ambulation status were reflected in their method of reporting, particularly
changes of assistive devices to less cumbersome ones. It was also known
clinically that some interventions increased dependency initially but the
question of whether the children were permanently adversely affected needed to
be addressed. The FMS was devised to fulfil this role by providing a new and
unique outcome measure specific to mobility.

Chapter 4 – Development of the FMS
108
Development of the FMS aimed to produce a simple and clinically feasible
evaluative measure for children with CP specific to mobility. Evaluative
measures are used to “measure the magnitude of longitudinal change in an
individual or group on the dimension of interest” (Kirschner and Guyatt 1985).
Using the ICF, mobility is conceptualized as part of the activities and
participation component and can be described as “moving by changing body
position or location or by transferring from one place to another, by carrying,
moving or manipulating objects, by walking, running or climbing, and by using
various forms of transportation” (page 135) (World Health Organisation 2001).
The aim of the FMS was to primarily address walking (d450 ICF), moving
around in different locations (d460) and moving around using equipment
(d465). This includes walking independently in various places as well as using
equipment such as walkers and wheelchairs yet excludes forms of transportation
and driving.
Mobility, thus defined, is important because it enables children to move around
within their homes, schools and other community settings. This enables them to
participate as fully as possible with their family and peers and gain satisfaction
from such participation. It is important that there are clinically feasible and
psychometrically sound tools available to measure mobility.
4.2. Initial development
The FMS was developed by the group working in the Hugh Williamson Gait
Laboratory of the Royal Children’s Hospital, Melbourne Australia. This group
consisted of two orthopaedic surgeons, one orthopaedic fellow, and two senior
physiotherapists with extensive clinical experience in children with CP. The
author of this thesis was one of those senior physiotherapists. The development
and scaling of items was based on clinical observation and experience. The team
developed the FMS prior to the commencement of this thesis. The scale had
been introduced in the clinical setting and a preliminary study performed
(Graham et al 2004). The aim of this thesis was to validate it further to ensure it
could be considered a reliable and valid outcome measure for use by clinicians
with children with CP.

Chapter 4 – Development of the FMS
109
There are two reasons for wanting to develop a new instrument. Firstly, the
construct is a new one and no scale exists which measures it. A second reason is
if people are dissatisfied with the existing tools and feel some key aspect of the
construct is omitted (Streiner and Norman 2003). The results of the systematic
review in Chapter Three showed that existing tools measuring physical function
of children with CP did not adequately consider different assistance children
may need in different environmental settings. There are few scales that
concentrate on mobility in isolation. It is more usually reported as a subsection
of a larger inventory. The FMS was developed to fulfil this need in outcome
measurement for children with CP.
4.2.1. Target population
The target population for the FMS was children with CP, GMFCS levels I to IV,
aged 4 to 18 years. It was aimed for children GMFCS levels I to IV because the
intent of the scale was to measure mobility. The FMS focuses on walking
mobility with one category for the use of wheelchairs. Children in GMFCS
levels I-IV have the ability to walk or mobilise in a wheelchair. Children
classified as level V have severe physical impairment with no means of
independent mobility and are transported by adults (Palisano et al 1997). The
FMS would have significant floor effects if children in level V were
incorporated.
The lower age limit was set at 4 years based on evidence of gross motor
development and the development of walking. Gait studies on 186 normally
developing children showed that a mature gait pattern, including temperospatial
parameters, is established at the age of 3 years (Sutherland et al 1980). Many
children with CP begin walking later than typically developing children.
Research has shown that walking can be achieved up to the age of 9 years
(Campos da Paz Jr et al 1994, Bottos et al 1995, Fedrizzi et al 2000). These
studies also show that children with hemiplegia and some with diplegia will
achieve walking at ages as young as 2-5 years. Motor development curves have
been created using longitudinal observations of children with CP to describe
patterns of gross motor development (Rosenbaum et al 2002). Based on these
curves, 90% of the potential GMFM-66 score is reached by age 3.5 for children
Chapter 4 – Development of the FMS
110
GMFCS level IV, by age 3.7 for children level III, by age 4.4 in level II and by
age 4.8 in level I. This suggests that children are still developing motor abilities
before these ages and would potentially have inconsistent mobility before the
age of 4 years. The upper age limit was set at 18 years because the FMS was
developed for children and adolescents with CP. Also, at the centre were the
scale was developed children tend to be transitioned to adult services at age 18.
4.2.2. Generation of items
One of the major aims in developing the scale was to represent the different
environmental settings that are relevant to children in order to differentiate
function in each. These environments include the home, school and wider
community. Chapter Two examined the studies that have evaluated the effect of
environmental setting on mobility methods of children with CP and showed that
children employ different mobility methods in different environments (Palisano
et al 2003, Tieman et al 2004).
Three items were developed and assigned distances in order to represent each
environmental setting;
i. 5 metres – to represent the home setting
ii. 50 metres – to represent the school setting
iii. 500 metres – to represent the community setting
The numbers were set as a guide for clinicians administering the tool, not as an
exact distance.
4.2.3. Scaling of items
The scaling of the three items involved the theoretical construct of incorporating
the range of assistive devices available that were most commonly used for
ambulation or mobility in Australian children with CP. A six point ordinal scale
from 1-6 was developed depending on the amount of assistance required from
the most to the least amount of assistance. The six levels were;
1. child uses a wheelchair (or wheeled devices) for mobility
2. child uses a walker such a posterior walker or an anterior walker
3. child uses forearm or Canadian crutches
4. child uses one or two single point sticks

Chapter 4 – Development of the FMS
111
5. child can walk independently on level surfaces without assistive devices
6. child can walk independently on all surfaces without assistive devices
The order of scaling was deliberately chosen to be the reverse order of the
GMFCS to minimise confusion between the two and to ensure that clinicians
thought carefully when rating children. Because the FMS primarily rates
independent mobility, walkers that provide large amounts of support where the
child requires adult assistance to be strapped in were excluded. Each item of the
scale represents different environments and provides unique information. For
this reason, the items are considered separate and are not weighted or summed
to produce one score.
4.3. Modifications to the FMS
The primary author of this thesis (AH) took on sole responsibility for clinical
implementation of the FMS and developed the scale further. This occurred in
the initial stages of this doctoral candidature following initial clinical use of the
scale and feedback from clinicians. Further development and modifications
were made as described below.
4.3.1. Clarification of purpose
The original description of the FMS (Graham et al 2004) made no reference to
whether it was designed to measure performance or capability. As explored in
Chapters Two and Three, performance measures are more reflective of everyday
function and are more relevant to the children and their families (Young et al
1996). To ensure that the FMS measured performance rather than capability, a
brochure was developed which included instructions on how to administer the
scale to obtain a performance rating. One of these brochures can be found at the
back of this thesis.
4.3.2. Extra scaling categories
On feedback from therapists administering the FMS, two more categories for
scoring were added including;
i. C – for crawling
ii. N – for does not do

Chapter 4 – Development of the FMS
112
Initial use discovered that a number of parents reported that children crawl at
home for independent mobility. The “C” was added for this reason. There were
also occasional reports that some children with CP never ventured anywhere for
distances of 500 metres other than in a car. Some parents reported that they did
not take their children with CP to shopping centres and other such places.
Therefore an “N” was designated as an option for the 500 metre distance for
these instances. Figure 4.1 shows the FMS items and scaling.
Figure 4.1 The Functional Mobility Scale (FMS)
Chapter 4 – Development of the FMS
113
4.3.3. Method of administration
Originally it was stated that parents could complete the FMS themselves
(Graham et al 2004). After trial use it was decided that to obtain a self or parent
report of mobility that reflected performance and not capability, administration
by the clinicians asking questions of the children or parents was preferred. The
FMS therefore is a clinician administered child or parent report measure of
performance.
4.3.4. Educational material
Early clinical experience showed considerable variability in the administration
of the test and interpretation of scale categories. Educational material was
developed to delineate these explicitly. A brochure of the FMS was produced
for distribution to clinicians. This included information on the reasoning behind
the scale’s development and guidelines for administration to ensure the rating
obtained reflects performance rather than capability. The brochure included
qualifiers to help distinguish a child’s function between levels and sample
questions and clinical examples. Also developed was a pocket sized version of
the scale for clinicians to carry with them while assessing children in the clinical
setting such as clinics, wards and gait laboratories. These are both located inside
the back cover of this thesis.
4.5. Administration and feasibility
4.5.1. Administration
The FMS is designed to be administered by physiotherapists, orthopaedic
surgeons and fellows, physicians and paediatricians who assess and manage
children with CP. Administration of the FMS requires the clinician to ask a few
questions of the child or parents regarding their “usual” methods of moving
around within the three environments. It is therefore based on clinician
interpretation of self report and not direct observation of the child. Depending
on the replies given, the clinician then assigns a number from 1-6 depending on
the assistance required for each distance that represents each environmental
setting. For example, if a child uses crutches indoors at home, a walker to go
from class to class at school and a wheelchair for longer distances such as the
Chapter 4 – Development of the FMS
114
shopping centre, they would be rated as 3, 2, 1. If a child is able to walk around
home without assistive devices but only on level surfaces and uses single point
sticks at school and a walker for the shopping centre, they would be rated as 5,
4, 2.
4.5.2. Clinical feasibility
Feasibility includes the time needed to administer the measurement as well as
the equipment and training required (Dekker et al 2005). In developing the FMS
the aim was to produce a measure that was not time consuming to administer,
nor require expensive equipment and extensive training. It was intended to be an
easily accessible clinical tool for utility in everyday clinical situations.
The FMS can be administered in less than 10 minutes. Because it is child or
parent report and not direct observation, no equipment is required for
administration. For this reason it has the potential to be administered over the
telephone. Training requirements are minimal. The brochure provides the
information necessary for the administering clinicians and it is recommended
that this is read before utilizing the FMS. There are no formal training
requirements or testing of clinicians in order to successfully use the tool. The
burden on clinicians using the tool is therefore small.
4.6. Potential utility of the FMS
The FMS could potentially be used to document functional mobility status of
children with CP. Used in conjunction with the GMFCS a very good overall
picture of a child can be obtained. For example, a child with CP who is
classified as GMFCS level III and rated 2, 2, 1 on the FMS indicates that the
child requires assistive devices for ambulation (GMFCS III) and the devices
required for mobility are a walker at home (2) and at school (2) and a
wheelchair for longer distances (1).
Because the FMS is quick and easy to administer it can be utilized by different
clinicians in many different clinical settings. It therefore has the potential to be
used in routine clinical practice as an outcome measure for activity in children
with CP. However, because it is specific to mobility, it provides information on

Chapter 4 – Development of the FMS
115
one aspect of activity only. In order to provide a complete assessment of a child
with CP a range of measures is required. Clinical utility of the FMS will be
further explored in Chapter Nine following the outcomes of the investigations in
this thesis.
The FMS has been developed as an evaluative measure. It has the potential to
measure change over time in children with CP and therefore track progress. It
also can be used to assess the effect of interventions such as orthopaedic
surgery, spasticity management and physiotherapy by measuring change before
and after the interventions. The FMS was initially developed because there were
no tools available that could quantify the changes in assistive devices children
with CP used throughout the rehabilitation period following major surgical
interventions. To investigate the potential of the FMS to track change following
major surgical interventions, an initial pilot study was performed studying a
group of children following single event multilevel surgery (SEMLS). The
details are outlined below.
4.7. Pilot Study
4.7.1. Introduction
This pilot investigation examined the ability of the FMS to detect change
following SEMLS in children with CP. This was an early small investigation to
determine how useful the FMS was at quantifying mobility in the children for
which the scale was originally developed. From this early work, future research
questions for examining the psychometric properties and clinical utility of the
FMS would be developed and investigated. The research questions formed as a
result of this pilot work are the subject matter for the rest of the thesis.
At the centre where this study was performed, the correction of musculoskeletal
deformities producing gait deviations in children with CP is usually performed
in one session (Bache et al 2003). SEMLS refers to the correction of all
orthopaedic deformities in one session (Graham and Selber 2003) and can be
defined as at least two orthopaedic procedures at different anatomical sites in
each limb, that is, a minimum of four procedures (Pirpiris et al 2003). In order

Chapter 4 – Development of the FMS
116
to determine the effects of major interventions such as SEMLS, there is a need
for tools that can accurately measure change over time in activities such as
mobility. The unique feature of the FMS being able to distinguish different
assistive devices is very important, particularly for monitoring post-surgical
progress when, for instance, progression from a walker to crutches represents a
functional improvement.
The major research question for this investigation was whether the FMS could
detect changes in mobility in children with CP following SEMLS. It was
hypothesized that the FMS would show change, both deterioration and
improvement, at set post-operative time points.
4.7.2. Method
A retrospective study was conducted of the gait laboratory records and videos of
a cohort of children with CP who had undergone SEMLS. The study was
approved by the Ethics in Human Research Committee of the Royal Children’s
Hospital (reference number 26086A) and The University of Melbourne Human
Ethics Research Committee (0606057). Written consent was obtained from each
participating child’s parent or legal guardian.
4.7.2.1 Participants
The participants were a consecutive sample of children with CP recruited from
the Hugh Williamson Gait Laboratory of the Royal Children’s Hospital, a
tertiary care hospital in Melbourne, Australia. Included were children with CP
aged 4-18 years at the time of surgery and who had SEMLS (planned on the
basis of a three dimensional gait analysis) between 1997 and 2002. A necessary
criterion for inclusion was attendance of the children at the Hugh Williamson
Gait Laboratory for their pre-operative and routine post-operative assessments
for a complete data set to be collected. A complete data set consisted of FMS
scores and GMFCS ratings pre-operatively and at 3, 6, 9 and 12 months post-
operatively. Excluded were children with a diagnosis other than CP, children
less than four years and older than 18 years of age and children with incomplete
follow-up. Four children were excluded because of incomplete data for the first
12 months post-operatively due to non-attendance at the laboratory.
Chapter 4 – Development of the FMS
117
4.7.2.2 Procedure
The gait laboratory records and video recordings of the included children were
reviewed by the principal investigator (AH). The FMS rating and Gross Motor
Function Classification System (GMFCS) level for each child were recorded
from their assessments performed pre-operatively and then at 3, 6, 9, 12 and
wherever possible 24 months post-operatively.
4.7.2.3 Data analysis
Odds ratios were calculated using ordinal logistic regression models (Agresti
2002) for FMS ratings at 5, 50 and 500 metres to quantify the change from pre-
operative status to each post-operative time. Odds ratio less than 1 indicated
lower FMS ratings on the average (children worse) at a post-operative time than
pre-operatively; odds ratios greater than 1 indicated higher FMS ratings
(children improved) at a post-operative time. Standard errors for significance
tests of these odds ratios and for the construction of 95% confidence intervals
for true change in FMS were calculated using the information sandwich formula
to account for the repeat measurements on the same children over time. All
analyses were performed using Stata [StataCorp 2005 Stata statistical software
Release 9.0. College Station; TX].
4.7.3. Results
4.7.3.1 Descriptive results
There were 66 participants in the study, 32 females and 34 males. All children
had spastic diplegic CP. Pre-operatively there were 18 children at GMFCS
levels I (28%), 24 at level II (36%) and 24 at level III (36%). They had a mean
age of 10 years (SD 2 years 6 months) at the time of surgery (range 6 to 16
years). There was an average of eight procedures per child (range 4 to 12
procedures). All children were assessed three-monthly to 12 months post-
operatively and 54 children (82%) were assessed at 24 months post-operatively.
Data was not available for 12 children at 24 months because they had not
attended the gait laboratory at this time point.
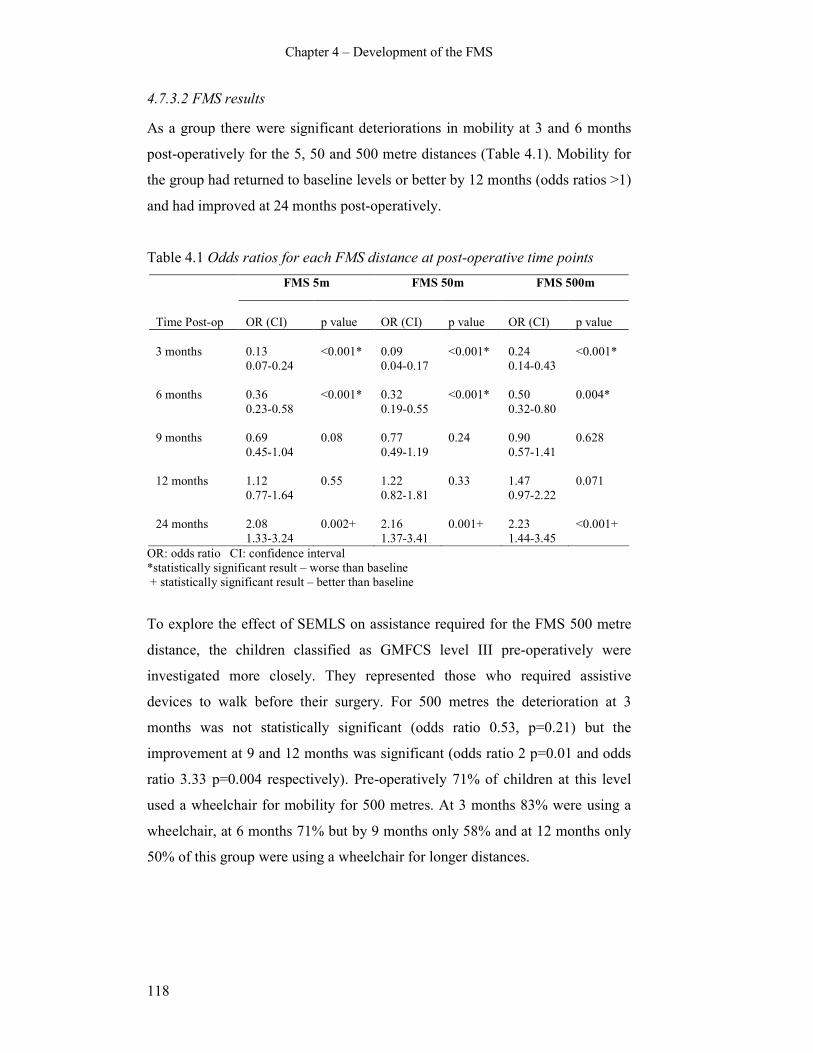
Chapter 4 – Development of the FMS
118
4.7.3.2 FMS results
As a group there were significant deteriorations in mobility at 3 and 6 months
post-operatively for the 5, 50 and 500 metre distances (Table 4.1). Mobility for
the group had returned to baseline levels or better by 12 months (odds ratios >1)
and had improved at 24 months post-operatively.
Table 4.1 Odds ratios for each FMS distance at post-operative time points
FMS 5m FMS 50m FMS 500m
Time Post-op
OR (CI)
p value
OR (CI)
p value
OR (CI)
p value
3 months
0.13
0.07-0.24
<0.001*
0.09
0.04-0.17
<0.001*
0.24
0.14-0.43
<0.001*
6 months 0.36
0.23-0.58
<0.001* 0.32
0.19-0.55
<0.001* 0.50
0.32-0.80
0.004*
9 months 0.69
0.45-1.04
0.08 0.77
0.49-1.19
0.24 0.90
0.57-1.41
0.628
12 months 1.12
0.77-1.64
0.55 1.22
0.82-1.81
0.33 1.47
0.97-2.22
0.071
24 months 2.08
1.33-3.24
0.002+ 2.16
1.37-3.41
0.001+ 2.23
1.44-3.45
<0.001+
OR: odds ratio CI: confidence interval
*statistically significant result – worse than baseline
+ statistically significant result – better than baseline
To explore the effect of SEMLS on assistance required for the FMS 500 metre
distance, the children classified as GMFCS level III pre-operatively were
investigated more closely. They represented those who required assistive
devices to walk before their surgery. For 500 metres the deterioration at 3
months was not statistically significant (odds ratio 0.53, p=0.21) but the
improvement at 9 and 12 months was significant (odds ratio 2 p=0.01 and odds
ratio 3.33 p=0.004 respectively). Pre-operatively 71% of children at this level
used a wheelchair for mobility for 500 metres. At 3 months 83% were using a
wheelchair, at 6 months 71% but by 9 months only 58% and at 12 months only
50% of this group were using a wheelchair for longer distances.
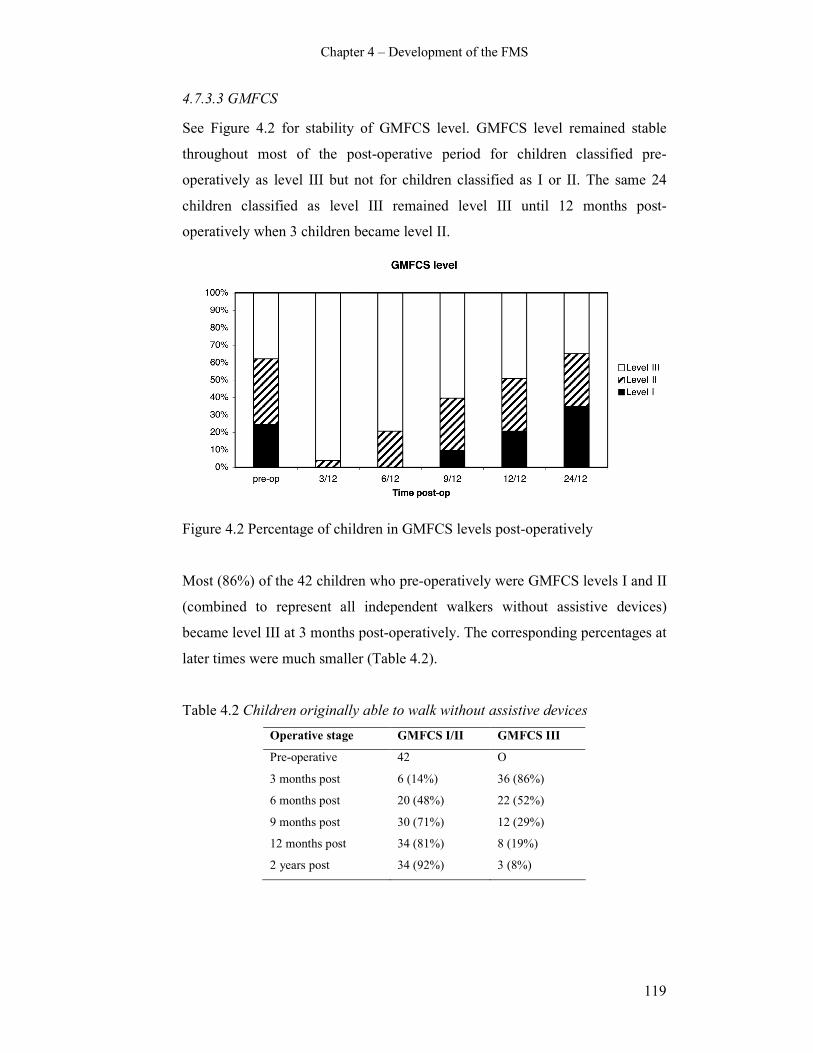
Chapter 4 – Development of the FMS
119
4.7.3.3 GMFCS
See Figure 4.2 for stability of GMFCS level. GMFCS level remained stable
throughout most of the post-operative period for children classified pre-
operatively as level III but not for children classified as I or II. The same 24
children classified as level III remained level III until 12 months post-
operatively when 3 children became level II.
Figure 4.2 Percentage of children in GMFCS levels post-operatively
Most (86%) of the 42 children who pre-operatively were GMFCS levels I and II
(combined to represent all independent walkers without assistive devices)
became level III at 3 months post-operatively. The corresponding percentages at
later times were much smaller (Table 4.2).
Table 4.2 Children originally able to walk without assistive devices
Operative stage GMFCS I/II GMFCS III
Pre-operative 42 O
3 months post 6 (14%) 36 (86%)
6 months post 20 (48%) 22 (52%)
9 months post 30 (71%) 12 (29%)
12 months post 34 (81%) 8 (19%)
2 years post 34 (92%) 3 (8%)
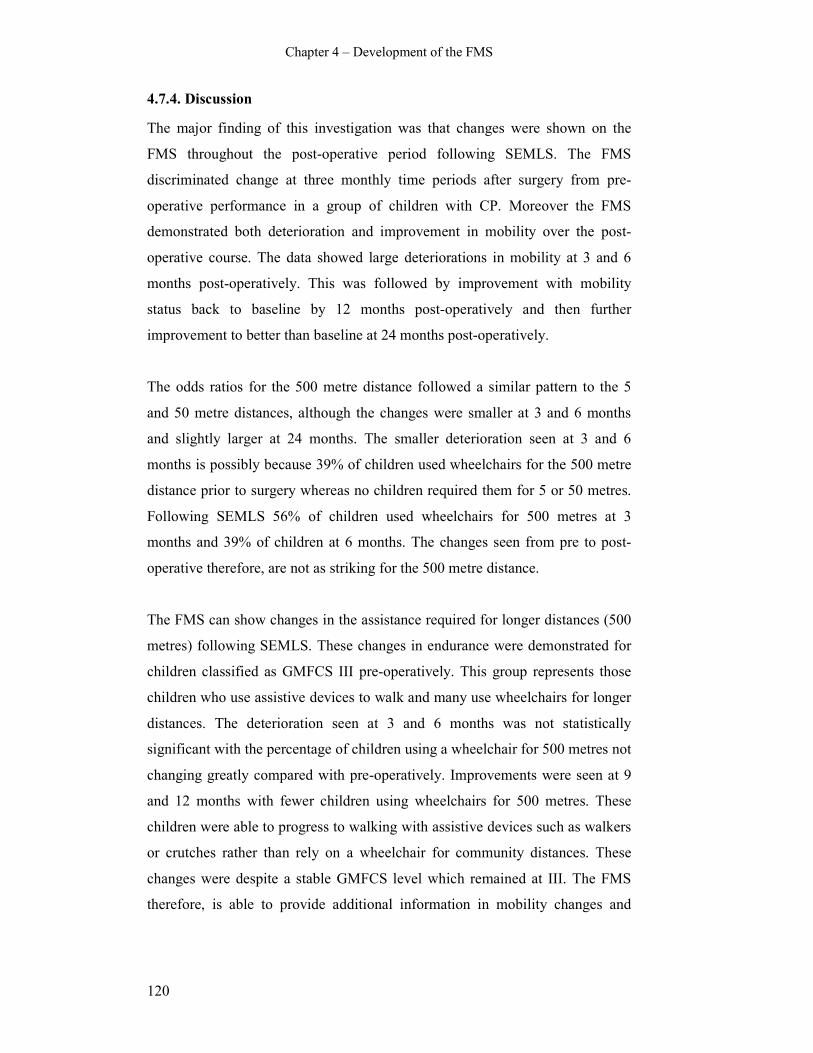
Chapter 4 – Development of the FMS
120
4.7.4. Discussion
The major finding of this investigation was that changes were shown on the
FMS throughout the post-operative period following SEMLS. The FMS
discriminated change at three monthly time periods after surgery from pre-
operative performance in a group of children with CP. Moreover the FMS
demonstrated both deterioration and improvement in mobility over the post-
operative course. The data showed large deteriorations in mobility at 3 and 6
months post-operatively. This was followed by improvement with mobility
status back to baseline by 12 months post-operatively and then further
improvement to better than baseline at 24 months post-operatively.
The odds ratios for the 500 metre distance followed a similar pattern to the 5
and 50 metre distances, although the changes were smaller at 3 and 6 months
and slightly larger at 24 months. The smaller deterioration seen at 3 and 6
months is possibly because 39% of children used wheelchairs for the 500 metre
distance prior to surgery whereas no children required them for 5 or 50 metres.
Following SEMLS 56% of children used wheelchairs for 500 metres at 3
months and 39% of children at 6 months. The changes seen from pre to post-
operative therefore, are not as striking for the 500 metre distance.
The FMS can show changes in the assistance required for longer distances (500
metres) following SEMLS. These changes in endurance were demonstrated for
children classified as GMFCS III pre-operatively. This group represents those
children who use assistive devices to walk and many use wheelchairs for longer
distances. The deterioration seen at 3 and 6 months was not statistically
significant with the percentage of children using a wheelchair for 500 metres not
changing greatly compared with pre-operatively. Improvements were seen at 9
and 12 months with fewer children using wheelchairs for 500 metres. These
children were able to progress to walking with assistive devices such as walkers
or crutches rather than rely on a wheelchair for community distances. These
changes were despite a stable GMFCS level which remained at III. The FMS
therefore, is able to provide additional information in mobility changes and

Chapter 4 – Development of the FMS
121
assistance requirements that may not be detected by other scales or
classifications.
An interesting finding on GMFCS stability was found. Previous studies have
shown that the GMFCS is stable over time with many children remaining in the
same GMFCS level (Wood and Rosenbaum 2000, Palisano et al 2006). The
current study found the GMFCS level changed for many children after SEMLS,
particularly for higher functioning children. This was in the initial post-
operative phase where children initially deteriorated in function and then
improved over the rehabilitation period. The GMFCS level was more stable
when comparing pre-operative level to 12 months post-operatively.
A key function of evaluative outcome measures is to detect longitudinal clinical
change in the functional performance of individuals or groups (Haley et al
1991). For children with CP undergoing SEMLS the FMS can be used to
monitor post-operative change. The FMS data combined with the changing
GMFCS distribution shows initial deterioration in mobility and function after
surgery was followed by improvement. Considering the extensive nature of
SEMLS, this deterioration in the early post-operative phase is not surprising.
This corresponds with what is observed in children in the clinical setting and the
information allows education of children and parents of the expected post-
operative progress. The data also showed that improvements can occur up until
2 years post-operatively. This is valuable information for the child and family
particularly when they may feel that progress is slow. It is important to note that
this study did not assess responsiveness of the FMS; it examined changes in
mobility after surgery as measured by the FMS. Responsiveness of the FMS
will be examined in Chapter Six of this thesis.
There is always the possibility that natural history may contribute to positive
changes observed following interventions in younger children who are still
developing motor skills. A study creating motor development curves using
longitudinal observations of children with cerebral palsy has been developed to
describe patterns of gross motor development (Rosenbaum et al 2002). From
these curves, 90% of the potential GMFM-66 score is reached by age 3.7 for

Chapter 4 – Development of the FMS
122
children GMFCS level III, by age 4.4 in children level II and by age 4.8 in
children level I. Using this information it is unlikely that the positive changes
seen after SEMLS in the present study were due to natural history because the
sample did not include children younger than 6 years and the majority of
children were aged 8-12 years.
The FMS is quick to administer and requires no equipment or formal training. It
is a readily available and practical tool that measures mobility. The FMS is
clinically useful, particularly when used in conjunction with other measures
such as video assessment and clinical examination in situations when it is
impractical to use three dimensional gait analysis. It has the unique feature of
distinguishing clearly the different assistive devices used in the different
environmental settings. Other measures group all assistive devices together and
therefore do not have the ability to detect changes that occur as children
progress from one assistive device to another. What is important from the
results of this study is that the FMS is able to detect both deterioration and
improvement in mobility; this is an important ability of the tool.
The main limitation of this study was that it was a retrospective analysis. The
FMS was not administered according to revised guidelines and there was less
ability to control procedures prior to data collection. One potential problem of
retrospective analyses is missing data. This was minimized in this study by
excluding children who did not have complete data for the first 12 months. Not
all GMFCS levels were represented in this study. The sample included levels I-
III only because those children with CP who attend a gait laboratory and
consequently have SEMLS tend to be ambulant, thus excluding levels IV and V.
The results therefore can only be generalized to this population.
4.8. Conclusion and recommendations
The FMS was developed to provide an activity outcome measure for children
with CP specific to mobility. It is unique because it distinguishes different levels
of assistance required for a range of environmental settings. It is a clinically
feasible measure that has many potential uses. Initial pilot work showed the
FMS detects changes in mobility following SEMLS at regular time points

Chapter 4 – Development of the FMS
123
during rehabilitation. This is particularly for children classified as GMFCS level
III, where other scales do not always show changes in the level of assistance
required over time. The pilot work is promising; however before it can be
described as a psychometrically robust tool it requires further examination. The
remainder of this thesis is dedicated to examining requirements including inter-
rater reliability, construct, concurrent and discriminative validity as well as
responsiveness to change. The grand discussion in Chapter Nine of this thesis
will examine possible changes to the FMS following all investigations.

Chapter 5 – Reliability
125
CHAPTER FIVE: RELIABILITY OF THE FUNCTIONAL
MOBILITY SCALE
5.1. Introduction
Chapter Three critically evaluated the psychometric properties of activity
limitation measures for children with CP, including the FMS. The development
and initial pilot testing of the FMS were reported in Chapter Four. The
systematic review highlighted the need for further testing of the inter-rater
reliability of the FMS for rating functional mobility in children with CP. This
was considered to be a necessary prerequisite before confirming its validity for
use by a range of clinicians. The current chapter describes the methodology and
results from experiments investigating the inter-rater reliability of the FMS.
All measurements contain a proportion of error (Guilford 1954, Nunnally 1978).
Reliability concerns the extent to which measurements are repeatable or
consistent (Nunnally 1978, Tooth and Ottenbacher 2004). Reliability also
concerns the error associated with measurement (Rothstein 2003). It is the
proportion of true variance in obtained scores where an obtained score includes
both a true component and an error component (Guilford 1954). There are a
number of potential sources of error and variability of scores that can affect the
reliability of results from a measurement procedure. These include variations
from the test or scale (the equipment used), the observers or raters (the people
collecting the data) and in the characteristic being measured in the participants
(Nunnally 1978, Streiner and Norman 2003).
In clinical practice it is important to have reliable measurement procedures to
enable appropriate and effective clinical decision making. Clinicians routinely
use measures to evaluate the current status of their patients as well as to measure
the effectiveness of treatments and interventions. For children with CP, there are
a number of tools to measure aspects of activity, such as the FMS which
measures mobility. These tools were appraised in Chapter Three. They can be
used to measure the child at one point in time and also to evaluate change over
time as the children grow and to assess the effectiveness of interventions such as

Chapter 5 – Reliability
126
spasticity management and orthopaedic surgery. To ensure that the information
obtained from these measurements is accurate and consistent, the measurement
procedure needs to be reliable. When outcome measurement is used for research
purposes, the process for measurement needs to be reliable to ensure that the
results obtained can be largely attributable to true change or variance and not
due to error in the measurement process.
Reliability testing of a measurement procedure determines how consistent the
measurement is (Streiner and Norman 2003). The decision as to whether a
particular measurement tool or method is reliable relates to whether the level of
measurement error is considered acceptable for practical use and what level of
reliability is considered to be clinically acceptable (Bruton et al 2000). A
measurement cannot be considered as either reliable or unreliable because it is
context dependent and relates to how the measurement will be used in practice
(Keating and Matyas 1998, Rothstein 2003). For example, the requirement for
reliability of a test to diagnose a life-threatening condition is very different to a
test that measures gross motor function of children with CP.
There are a number of other terms that are sometimes used interchangeably with
reliability such as ‘objectivity’, ‘reproducibility’, ‘stability’, ‘agreement’,
‘association’, ‘sensitivity’ and ‘precision’ (Streiner and Norman 2003). When
the unit of measurement is on a categorical scale, as is the case for the FMS,
reliability is typically assessed as a measure of agreement. Agreement refers to
the extent to which raters or instruments produce essentially the same score
(Tooth and Ottenbacher 2004).
There are several forms of reliability; inter-rater (or inter-observer), intra-rater
(or intra-observer) and retest reliability. Inter-rater reliability concerns
variations in scores between two or more raters who measure the same group of
participants. Intra-rater measures the variation that occurs within an observer
when observing the same group across two or more occasions (Streiner and
Norman 2003). Retest reliability involves administering the same test to the
same set of people after a period of time (Nunnally 1978). Intra-rater and retest
reliability are closely related. The term “retest” reliability tends to be used when
Chapter 5 – Reliability
127
there are no observers involved in measurement (Streiner and Norman 2003).
For example, there are measurement tools used for children with CP, such as the
FAQ, that require the parents to complete a questionnaire rather than a clinician
to administer it. Retest reliability is the most appropriate method of examining
this tool because there are no “raters” to examine for consistency and we are
interested in the ability of the tool to be consistent. The FMS requires a clinician
to administer it by asking a series of questions of the child and/or parent. It is
important that a high level of inter-rater reliability is demonstrated so that it can
be used by different observers consistently.
Streiner (2003) has stated:
Although many investigators maintain that demonstration of both inter-
and intra-observer reliability is a minimum requirement of a good test,
this may be unnecessary. If we recognize that inter-observer reliability
contains all the sources of error contributing to intra-observer reliability,
plus any differences that may arise between observers, then it is evident
that a demonstration of high inter-observer reliability is sufficient; the
intra-observer is bound to be higher (Streiner and Norman 2003) (page
137).
For the current study the focus was on the examination of inter-rater reliability
of the FMS with the stipulation that if low reliability was demonstrated, further
examination of intra-rater reliability would be conducted. If low inter-rater
reliability was demonstrated, the causes might be the result of differences within
or between observers. Further investigation of intra-rater reliability would be
required to identify where the source of the differences causing the low
reliability were.
CP is usually recognised in early childhood and persists through the lifespan
(Bax et al 2005, Rosenbaum et al 2007). Consequently children and adults with
CP are managed by various health professionals over extended periods. Because
management of patients with CP requires a multidisciplinary setting (Bax et al
2005), they will have many assessments by different clinicians throughout their
childhood and adolescent years. This includes clinicians working in both the
hospital and community settings. Inter-observer reliability is essential in this

Chapter 5 – Reliability
128
population because different clinicians will be involved in the care of each
person with CP. It is particularly important when using tools such as the FMS
that have been developed for use by a range of clinicians. Intra-observer
reliability is not as clinically relevant because it is unlikely that the same
clinician will measure the same person with CP on an ongoing basis. In
addition, as explained above, demonstration of high inter-observer reliability
implies high intra-observer reliability.
Internal consistency is another factor to consider when examining reliability of a
multi-item measurement scale. This concerns the estimates of reliability based
on the average correlation among the individual items within a test (Nunnally
1978). The items should be moderately correlated with each other and each
should correlate with the total score (Streiner and Norman 2003). Internal
consistency is usually calculated using Cronbach alpha (Cronbach 1951) and is
dependent on the number of items within a scale. For questionnaires in which
the items are merely different aspects of a clinical phenomenon that do not have
to be correlated, internal consistency is not relevant (Terwee et al 2007). This
principle applies to the FMS because it has only three items within it. Each of
those items measures the same construct over different distances. Examination
of internal consistency is not a priority in this study due to the low number of
items within the FMS and because each of those items would not be expected to
correlate. If it was calculated, the coefficient would be very low and would not
be clinically meaningful.
A preliminary study examined the inter-rater reliability of the FMS in 310
children with CP (Graham et al 2004). It reported high intraclass correlation
coefficients (ICC’s) of 0.95 for 5 metres, 0.94 for 50 metres and 0.95 for 500
metres. The study also used Cronbach alphas as another index to assess inter-
rater reliability with very similar results (0.95 for 5 metres, 0.94 for 50 metres
and 0.96 for 500 metres). Internal consistency was not examined. A major
limitation of the Graham study was the small number of raters used, all from the
same clinical profession. Only three raters in total were used; two orthopaedic
surgeons and one orthopaedic research fellow. This is an important limitation
because the FMS is intended to be used by a range of clinicians from different

Chapter 5 – Reliability
129
professional backgrounds. Reliability is specific to the population and raters it is
tested on. Although it is promising that inter-rater reliability was high, it is
important that reliability of the scale is examined further using a broader range
and number of clinicians. This will enable the results to be generalized further
and ensure the FMS can be administered reliably by a range of clinicians. It is
also important to determine if there are any systematic biases for raters related
to their clinical background. Surgeons might rate children differently to
physiotherapists and the recognition of any such biases would provide evidence
for the need to modify how the FMS is currently administered. This might
include training required for clinicians or developing stricter guidelines for
administration of the scale.
Another limitation of the Graham study was the use of ICC’s to analyse the
data. It has recently been recommended that the kappa statistic is the most
appropriate method of analysis for agreement between raters when the data are
categorical (Tooth and Ottenbacher 2004). ICC’s can only be applied to ordinal
data when the data fit the underlying assumptions of the ICC statistic, such as
the assumption that intervals are equivalent (Tooth and Ottenbacher 2004). For
the FMS, where it cannot be assumed that the intervals are equivalent, ICC’S
are therefore not appropriate. Given that an ICC yields equivalent results to
quadratic weighted kappas for ordinal data (Tooth and Ottenbacher 2004), it is
likely that an ICC would overestimate the level of agreement for the FMS
because there are only 6 levels within it. Unweighted kappa statistics would
provide the most clinically meaningful results of agreement for the FMS.
The FMS was devised to rate the mobility of children with CP presenting with a
wide range of severity of motor impairment (GMFCS levels I-IV). Within this
spectrum of motor impairment there is the potential for differences in agreement
between different observers. Children presenting with differing severity also
present with differing stability or consistency of their mobility status. Some
children may be very consistent with methods of mobility used and ability.
Rating the mobility status of these stable children would be easier for clinicians
than for those children whose mobility status is inconsistent or changing. It is
important that agreement within this variation be examined to ensure that the

Chapter 5 – Reliability
130
FMS is reliable for all severity of CP. Although the FMS was developed for
children aged 4-18 years, there may be differences in the agreement between
observers for different age groups within this range. At certain ages children
may be more inconsistent with their mobility status due to changes associated
with growth and motor development. During these periods it might be more
difficult for clinicians to consistently rate the mobility of the children. It is
important to examine the agreement for different age groups to ensure the FMS
is reliable for the entire age range it is intended for.
A thorough examination of the inter-rater reliability of the FMS is necessary to
provide evidence of its reliability across the spectrum of clinicians and children
with CP it is relevant for. This will ensure the clinical utility of the scale. The
research question of the current study was “what is the inter-rater agreement of
the FMS using kappa statistics with a large sample and range of clinicians as
raters”.
The specific aims were to determine;
i. the inter-rater agreement for each distance of the FMS in children with CP
using a large number of clinicians as raters from different clinical
professions
ii. the inter-rater agreement between clinicians for different age groups and
severities of CP of children
iii. the presence of any systematic bias of raters according to their clinical
professions
The main hypothesis was “the inter-rater agreement for each distance of the
FMS is greater than 0.8 as measured by kappa statistics in children with CP
using a large group of raters from various clinical backgrounds”. The value of
0.8 was chosen because kappa statistic values of 0.61-0.81 represent substantial
agreement and 0.81-1.00 represent almost perfect agreement (Landis and Koch
1977). Values lower than 0.6 would be considered as poor, slight, fair or
moderate. Although these divisions are arbitrary, they are useful for providing
benchmarks from which the results obtained can be discussed. It was anticipated

Chapter 5 – Reliability
131
that the FMS would show substantial agreement as a minimum to ensure its
validity and clinical utility.
It was also hypothesized that “the level of inter-rater agreement for the FMS in
children with CP is lower for children aged 2-6 years compared to children aged
6-12 or 12-18 years”. In addition, data analysis explored whether there are
differences for level of clinician agreement for the FMS when rating children
with CP depending on;
i. the severity of motor impairment, as described by GMFCS level or
topographical distribution
ii. clinician rater combinations and rater clinical profession.
5.2. Methods
5.2.1. Participants
Several clinician raters were required as well as a sample of children for testing.
Participants therefore included both clinicians as raters and children with CP.
5.2.1.1 Clinician raters
There were three categories of raters involved who were selected based on the
range of clinicians working with children with CP within the hospital setting
and in the community:
i. hospital physiotherapists involved with the gait laboratory or CP clinics,
ii. orthopaedic surgeons or fellows attending the clinics or gait laboratory
and
iii. community physiotherapists involved in the children’s management.
These categories represented a good balance of key users of the FMS. The
hospital physiotherapists were selected from the group of physiotherapists who
attend the clinics and the gait laboratory. The orthopaedic surgeons were
selected from those that consult at the clinics or gait laboratory. Selection was
based on which surgeon and physiotherapist was attending the appointments on
a particular day. The community physiotherapists were selected if they were the
primary physiotherapist involved in the care of a particular child recruited who

Chapter 5 – Reliability
132
had been randomized to have one rater as their community physiotherapist. This
spread of professional backgrounds was selected because these are the clinicians
who at that point in time were the primary users of the scale for children with
CP attending the CP clinics and gait laboratory. The spread ensured there was
more than one professional type represented with a large number of raters
involved. It also ensured both hospital and community clinicians were
represented.
5.2.1.2 Children
Inclusion criteria for the participants who were rated using the FMS were:
i. Children with CP aged 2-18 years
ii. Children classified as GMFCS levels I-IV
iii. Children who attended the CP clinics or gait laboratory of the Royal
Children’s Hospital, Melbourne
The age upper age limit was set at 18 years because the FMS has been primarily
devised for children and adolescents with CP aged 4-18 years. This study
included children from 2 years on because one aim was to examine reliability in
different age groups. Particular interest was whether reliability is lower in
younger children due to motor skills and gait patterns that are still developing.
Research on the development of walking in children with CP has shown that
walking can be achieved up to the age of 9 years (Campos da Paz Jr et al 1994,
Bottos et al 1995, Fedrizzi et al 2000). These studies also show that children
with hemiplegia and some with diplegia will achieve walking at ages as young
as 2-5 years. With this range of potential age of acquisition of walking, it was
thought that reliability might be lower in the younger children due to walking
skills that were still developing causing inconsistent performance. This could
cause a change in performance between ratings and also make assigning a
particular FMS category to the changing child more difficult due to
inconsistency. Children younger than 2 years were excluded also based on this
research. Many children would not be walking at all at 2 years of age and the
FMS is a scale that essentially describes walking mobility.
Chapter 5 – Reliability
133
Children classified as GMFCS levels I-IV were included because the FMS was
developed for these levels as explained in Chapter 4. Levels I-IV represent the
range of severity of motor impairment in children with CP with some form of
independent mobility. The FMS focuses on independent mobility. The children
were recruited from the two major clinics for children with CP at the Royal
Children’s Hospital, Melbourne, Australia.
Excluded were children:
i. with a diagnosis other than CP
ii. younger than 2 years and older than 18 years of age
iii. classified as GMFCS level V
iv. who had undergone orthopaedic surgery within the previous six months or
Botulinum toxin injections within the previous 3 months.
v. whose parents were not able to understand the information explaining the
study or the instructions due to language, cognitive or other difficulties
vi. whose parents were upset or anxious associated with their clinic or gait
laboratory appointment.
If children had a diagnosis other than CP they were excluded because the scale
has been devised for CP and the population of interest for this study was
children with CP. Children younger than 2 years and older than 18 years were
excluded for the same reasons as justified in the inclusion criteria. Children
classified as GMFCS level V were excluded because these children have severe
motor impairments and usually require adult assistance for all mobility with no
means of independent mobility (Palisano et al 1997). The FMS is not an
appropriate tool to use for these children because it focuses on independent
mobility.
Children who had received recent surgery or botulinum toxin injections were
excluded. In the initial post-intervention period the physical function of these
children was likely to be changing as a result of the interventions. This could
introduce change within the participants between the two ratings as a result of
treatment effect and produce a source of variation. In turn this could result in
different scores from the two raters not attributable to rater performance. The
Chapter 5 – Reliability
134
aim of the study was to examine inter-rater agreement and rater performance,
not the effect of treatment. These sources of variation in the participants were
therefore deliberately minimised. An exception was when both ratings were
performed on the same day. It would be most unlikely that change as a result of
treatment effect of an intervention prior to both ratings would occur within a 4
hour period. It was considered that ratings performed on the same day would not
introduce a source of variation within the participants.
Children whose parents were unable to understand due to language or cognitive
problems were excluded if they could not fully comprehend what was required.
Where interpreters were available for parents the children were included. Before
parents were approached to consider participation in the study, the principal
investigator consulted with the primary clinician involved in the care of each
child on the day of the clinic visit. If it was felt by either the clinician or
investigator that the parents were too upset or emotional, these parents were not
approached and those children not included.
5.2.1.3 Sample size of children
A large enough sample size to provide sufficient precision to result in
reasonably narrow confidence intervals around the observed kappa statistics was
required. Agreement of 0.8 or greater was aimed for because this is a very good
level of agreement (Landis and Koch 1977). Sample size was obtained using
table II in Walter et al (1998) using a method with a design of two raters per
participant, power of 80%, confidence interval of 95%, and the expected lower
limit for kappa as 0.7 (Walter et al 1998). To do this a sample of 117.1 (or 118)
participants was required. It was estimated that around 10% attrition of the
ratings would occur where community physiotherapists were involved (8
participants) because this required them to return the information via mail. A
sample size of 126 was aimed for to account for this potential attrition.
5.2.2. Procedures
The study was approved by the Ethics in Human Research Committee of the
Royal Children’s Hospital (reference number 25118A) and The University of
Melbourne Human Ethics Research Committee (reference number 060211).
Chapter 5 – Reliability
135
Written consent was obtained from each participating child’s parent or legal
guardian prior to data collection as outlined below.
5.2.2.1 Recruitment
A consecutive sample was utilized for this study in order to obtain the required
number of participants. A random sample was not used because it would not be
possible to recruit the required sample of 118 within a 4-6 month period based
on the number of eligible children who attend the clinics. The clinics where the
children were recruited from represent the majority of children that the FMS is
used with in clinical practice. By using a consecutive sample from these clinics
there was a high chance that the sample would be representative of the
population for which the study was aimed. The advantage of using a sample of
convenience was the required number of participants could be recruited within
the time frame stated above. The limitation was that it could not be assumed that
the sample exactly represented the target population.
The primary investigator (AH) approached potential participants and recruited
the children. Participants were recruited from the gait laboratory and three CP
clinics at the Royal Children’s Hospital, Melbourne, Australia. Potential
participants were identified by the primary investigator through prospective gait
laboratory and CP clinic appointment lists. Once eligibility from these lists was
determined the primary investigator attended the clinics and gait laboratory
appointments. The parents or guardians of eligible children were invited to
participate after a full explanation of the study was provided. On agreement for
their child to participate, full consent was obtained with signed consent forms
and a written information sheet given to the parents/guardians.
5.2.2.2 Allocation of raters
Each child was rated on the FMS on one occasion by two different raters with
two ratings per child the result. The decision to use only two raters per child
reflected the nature of administration of the scale. The FMS is administered
within 10 minutes by asking a few questions of the child and/or parents
regarding how they choose to “move around”. It was decided that if more than
two raters were assigned to each participant, the child and/or parents could

Chapter 5 – Reliability
136
potentially start “rehearsing” the answers by recalling what they had answered
previously, thus introducing an element of bias.
Participating children were assigned to two raters using rater combinations.
Possible rater combinations and order of raters were:
i. laboratory physiotherapist followed by orthopaedic surgeon
ii. laboratory physiotherapist followed by community physiotherapist
iii. orthopaedic surgeon followed by community physiotherapist
iv. orthopaedic surgeon followed by laboratory physiotherapist
v. community physiotherapist followed by laboratory physiotherapist
vi. community physiotherapist followed by orthopaedic surgeon.
The raters were allocated by computer randomization in a block design by a
statistician. Within each block of 6 participants, the order of the above six rater
combinations was selected randomly. This was then repeated for each
consecutive block of six participants so that within each the sequence of raters
occurred randomly.
5.2.2.3 Testing procedure
At the clinic or laboratory appointment the principal investigator (AH) was
responsible for recruiting the children, coordinating the ratings and collecting
key information including date of birth, age, severity of motor impairment of CP
as determined by GMFCS (Palisano et al 1997) and topographical distribution,
and the walking scale of the FAQ (Novacheck et al 2000). The principal
investigator was not a rater because she was required to be independent of the
rating process to minimize chance of bias. The collection of information such as
GMFCS level could influence the FMS rating and it was essential that each rater
be unaware of previous ratings obtained. Her role was to collect information and
coordinate the raters. After the parents or guardians had signed the consent
forms and the children were classified according to their GMFCS level, they
completed the FAQ. The data obtained from the FAQ were not utilized for this
study yet was part of data collection for discriminative and concurrent validity
(see Chapter Eight). A copy of the FAQ can be found in Appendix E.
Chapter 5 – Reliability
137
Each child was then rated by two different raters. Where the rater combination
allocated to a child was laboratory physiotherapist and orthopaedic surgeon,
both ratings were performed on the same day at the hospital. This was because
both raters were available to rate the children on the same day and minimized
the chance of change occurring between ratings influencing the results. Each
rating was performed in the absence of the other rater and raters were blind as to
the previous rating obtained. Where a community physiotherapist was involved,
the child was rated at the hospital appointment by one rater and the second
rating was performed by the child’s community physiotherapist within two
weeks. This was either before or after the hospital rating, depending on who was
allocated to rate the child first. If the child was due to see their community
physiotherapist within 2 weeks, the rating was performed in person either at
home or school depending on where sessions usually occurred. The rating was
performed via telephone if the physiotherapist was not due to see the child in
person within two weeks.
A time frame of 2 weeks was selected because this was deemed long enough for
the physiotherapist to either see the child in person or contact them over the
telephone yet not too long to allow changes in mobility to occur. Obtaining
some of the FMS ratings over the telephone could possibly introduce a source of
variation between raters with less information provided to those administering it
over the telephone. Although the FMS is administered by self-report and not
direct observation, the child is often present when scored. Information from
having the child present can inadvertently guide the clinician’s rating. Ratings
obtained over the telephone are not influenced by this extra information. To
determine the effect of this, data analysis involved comparing ratings obtained
over the telephone with those performed in person.
The raters were provided with an information package prior to testing children.
This included the FMS brochure that explains the scale and how to administer it
(Appendix A). Also provided were study information sheets and a standard form
to complete the rating obtained, date of rating and additional comments. The
community physiotherapists had this package mailed to them with a stamped,
self-addressed envelope for return of the rating to the principal investigator.

Chapter 5 – Reliability
138
Where the community physiotherapist was allocated as the first rater, the
package was sent ahead of the clinic visit to ensure the rating was performed
prior to the child attending their hospital appointment.
5.2.3. Data analysis
Descriptive statistics for participant characteristics were compiled including
means and standard deviations for continuous variables and frequency and
percentages for categorical variables. Kappa statistics with 95% confidence
intervals were used to analyse agreement between ratings due to the ordinal
nature of the data. Kappa is an extension of simple percent agreement and is
defined as “the proportion of the total amount of agreement not explained by
chance for which the observers accounted” (Cohen 1960) (p38). The data were
primarily analysed using unweighted Kappa statistics because the basic or
unweighted Kappa considers all disagreements in ratings as equal in seriousness
(Tooth and Ottenbacher 2004). For a scale such as the FMS with only six levels
it was decided that disagreement of one level is a clinically significant
difference that should be considered. Weighted Kappa was developed for use
with ordinal data (Cohen 1968) and reflects the degree of disagreement by
attaching greater emphasis to large differences between ratings to small
differences (Sim and Wright 2005). In this situation, the use of weighted Kappas
is likely to result in inflated agreement that is not clinically meaningful.
Kappa statistics for agreement were obtained for:
i. each FMS distance (5, 50 and 500 metres)
ii. each FMS distance for different GMFCS levels
iii. each FMS distance for different age groups (2-6 years, 6-12 years and 12-
18 years)
iv. each FMS distance comparing ratings performed in person and those
obtained over the telephone
v. each FMS distance according to different rater combinations
Kappa does not indicate whether disagreement is due to random differences or
systematic differences between clinicians ratings and the data should be
examined accordingly (Sim and Wright 2005). The presence of any systematic

Chapter 5 – Reliability
139
biases between raters was examined using Wilcoxon signed rank tests. This test
examines differences within paired scores and examines both the direction of
the difference and the relative amount of difference (Wilcoxon 1945). This test
was used to examine each FMS distance for different rater combinations
independent of the order of raters, resulting in comparisons between:
i. hospital physiotherapists and surgeons
ii. hospital physiotherapists and community physiotherapists
iii. surgeons and community physiotherapists.
The p value for the Wilcoxon signed-rank tests was set at 0.05 for rejecting the
null hypothesis. This represents a 5% probability of making a Type I error and
incorrectly rejecting the null hypothesis (Portney and Watkins 1993). This was
considered an appropriate level of significance for the study in question.
The data were stored and organized using the EpiData for Windows program
(http://www.epidata.dk/.). All analyses were performed using Stata [StataCorp
2005 Stata statistical software Release 9.0. College Station; TX. Stata Press.].
5.3. Results
5.3.1. Descriptive results of participant characteristics
The sample included 123 children who matched the inclusion criteria. Of these
123, five were lost due to attrition. For these five children one rating had been
completed by either a hospital physiotherapist or surgeon with the second rating
to be completed by a community physiotherapist. This second rating was either
not completed by the community physiotherapist or the package was sent to the
incorrect physiotherapist. These 5 participants lost to follow-up left a total
sample of 118.
The participants had a mean age of 10.3 years (SD 3.6) with a range of 2.5-18
years. There were 16 children aged 2-6 years, 66 aged 6-12 years and 36 aged
12-18 years. There were 74 males and 44 females. The children were classified
as GMFCS levels I-IV. There were 13 children GMFCS level I, 49 level II, 44
level III and 12 level IV. There were 21 children with a hemiplegic distribution
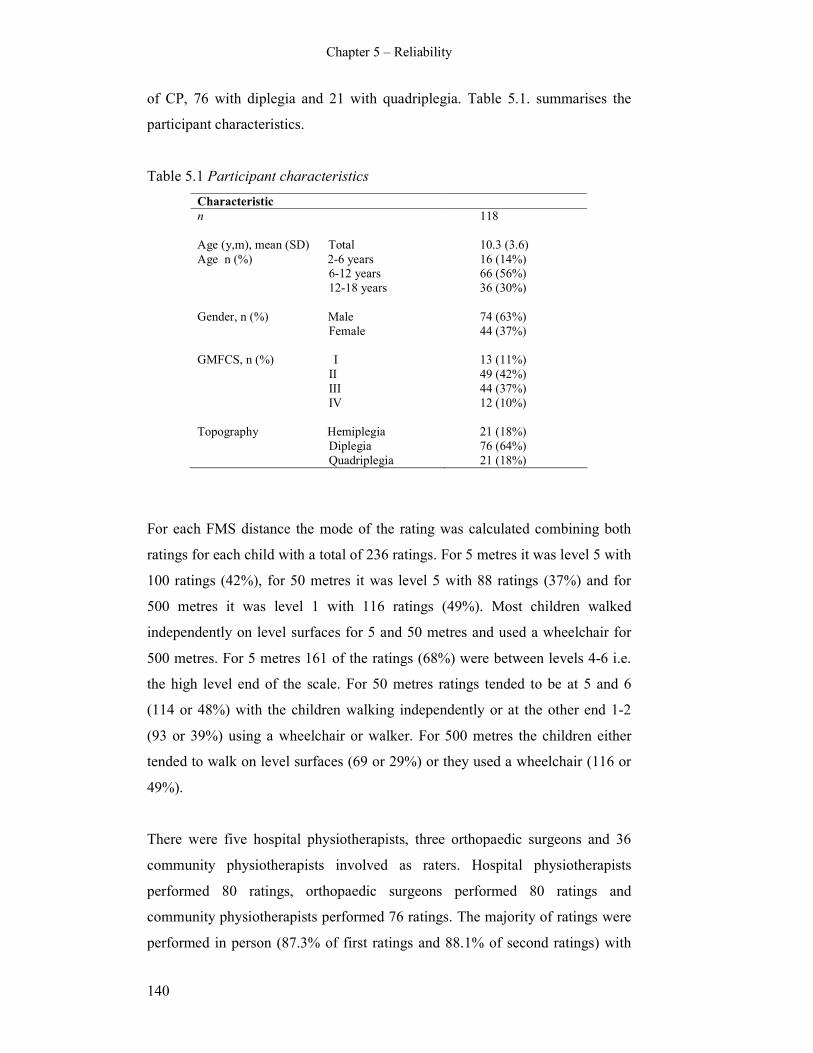
Chapter 5 – Reliability
140
of CP, 76 with diplegia and 21 with quadriplegia. Table 5.1. summarises the
participant characteristics.
Table 5.1 Participant characteristics
Characteristic
n 118
Age (y,m), mean (SD) Total 10.3 (3.6)
Age n (%) 2-6 years 16 (14%)
6-12 years 66 (56%)
12-18 years 36 (30%)
Gender, n (%) Male 74 (63%)
Female 44 (37%)
GMFCS, n (%) I 13 (11%)
II 49 (42%)
III 44 (37%)
IV 12 (10%)
Topography Hemiplegia 21 (18%)
Diplegia 76 (64%)
Quadriplegia 21 (18%)
For each FMS distance the mode of the rating was calculated combining both
ratings for each child with a total of 236 ratings. For 5 metres it was level 5 with
100 ratings (42%), for 50 metres it was level 5 with 88 ratings (37%) and for
500 metres it was level 1 with 116 ratings (49%). Most children walked
independently on level surfaces for 5 and 50 metres and used a wheelchair for
500 metres. For 5 metres 161 of the ratings (68%) were between levels 4-6 i.e.
the high level end of the scale. For 50 metres ratings tended to be at 5 and 6
(114 or 48%) with the children walking independently or at the other end 1-2
(93 or 39%) using a wheelchair or walker. For 500 metres the children either
tended to walk on level surfaces (69 or 29%) or they used a wheelchair (116 or
49%).
There were five hospital physiotherapists, three orthopaedic surgeons and 36
community physiotherapists involved as raters. Hospital physiotherapists
performed 80 ratings, orthopaedic surgeons performed 80 ratings and
community physiotherapists performed 76 ratings. The majority of ratings were
performed in person (87.3% of first ratings and 88.1% of second ratings) with
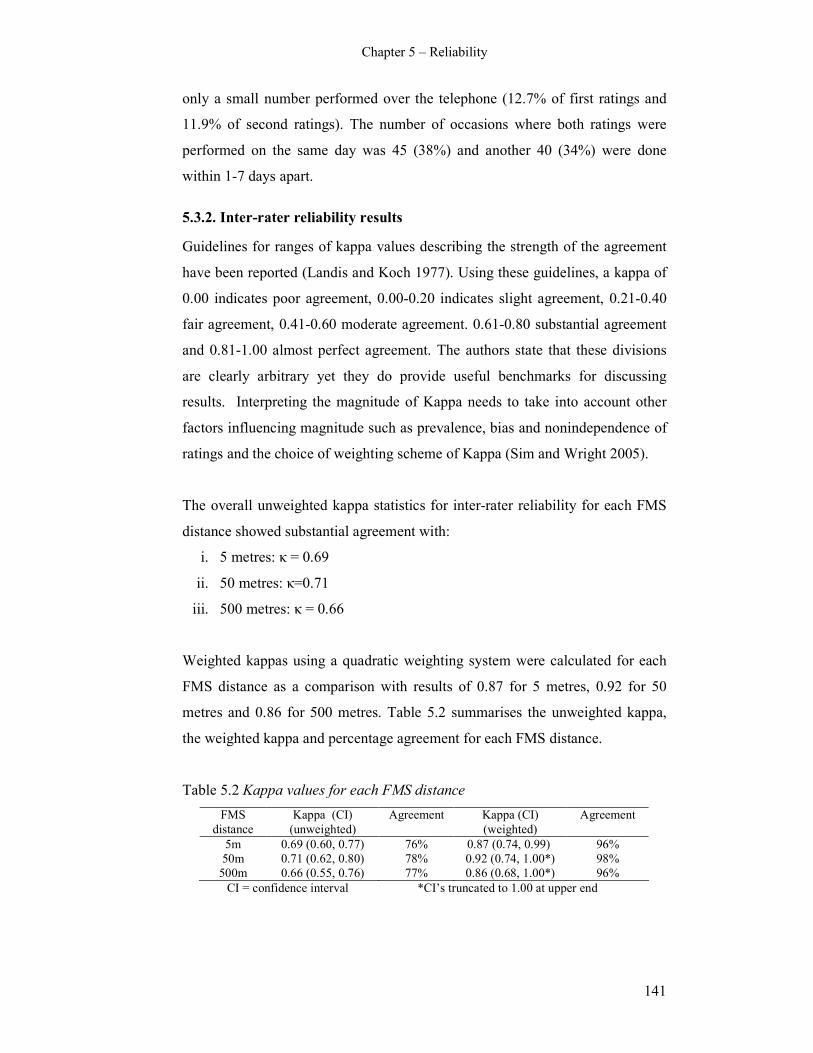
Chapter 5 – Reliability
141
only a small number performed over the telephone (12.7% of first ratings and
11.9% of second ratings). The number of occasions where both ratings were
performed on the same day was 45 (38%) and another 40 (34%) were done
within 1-7 days apart.
5.3.2. Inter-rater reliability results
Guidelines for ranges of kappa values describing the strength of the agreement
have been reported (Landis and Koch 1977). Using these guidelines, a kappa of
0.00 indicates poor agreement, 0.00-0.20 indicates slight agreement, 0.21-0.40
fair agreement, 0.41-0.60 moderate agreement. 0.61-0.80 substantial agreement
and 0.81-1.00 almost perfect agreement. The authors state that these divisions
are clearly arbitrary yet they do provide useful benchmarks for discussing
results. Interpreting the magnitude of Kappa needs to take into account other
factors influencing magnitude such as prevalence, bias and nonindependence of
ratings and the choice of weighting scheme of Kappa (Sim and Wright 2005).
The overall unweighted kappa statistics for inter-rater reliability for each FMS
distance showed substantial agreement with:
i. 5 metres: κ = 0.69
ii. 50 metres: κ=0.71
iii. 500 metres: κ = 0.66
Weighted kappas using a quadratic weighting system were calculated for each
FMS distance as a comparison with results of 0.87 for 5 metres, 0.92 for 50
metres and 0.86 for 500 metres. Table 5.2 summarises the unweighted kappa,
the weighted kappa and percentage agreement for each FMS distance.
Table 5.2 Kappa values for each FMS distance
FMS
distance
Kappa (CI)
(unweighted)
Agreement Kappa (CI)
(weighted)
Agreement
5m 0.69 (0.60, 0.77) 76% 0.87 (0.74, 0.99) 96%
50m 0.71 (0.62, 0.80) 78% 0.92 (0.74, 1.00*) 98%
500m 0.66 (0.55, 0.76) 77% 0.86 (0.68, 1.00*) 96%
CI = confidence interval *CI’s truncated to 1.00 at upper end

Chapter 5 – Reliability
142
The data were examined further for differences in agreement within different
age groups of children for: 1) children aged 2-6 years, 2) children aged 6–12
years and 3) children aged 12-18 years. There were too few children less than 4
years to analyse between 2-4 years. Table 5.3 summarises the unweighted
kappa statistics and percentage agreement for these age bands for each FMS
distance. For all three distances the 6-12 year group showed the highest
reliability and agreement. For 50 and 500 metres the lowest reliability and
agreement was for children aged 2-6 years. These can be considered descriptive
patterns only as the large confidence intervals suggest the differences are not
significant. There were differences in frequency of children in each group with
only 16 children in the 2-6 year group compared to 66 in the 6-12 years and 36
in the 12-18 years bands.
Table 5.3 Kappa values and agreement for different age groups of children
Age FMS distance Kappa (CI) % Agreement
2-6 years FMS 5m 0.66 (0.41, 0.91) 75%
FMS 50m 0.60 (0.37, 0.84) 69%
FMS 500m 0.38 (0.11, 0.66) 69%
6-12 years FMS 5m 0.75 (0.63, 0.87) 82%
FMS 50m 0.77 (0.64, 0.90) 83%
FMS 500m 0.73 (0.58, 0.89) 83%
12-18 years FMS 5m 0.56 (0.40, 0.72) 67%
FMS 50m 0.65 (0.49, 0.80) 72%
FMS 500m 0.69 (0.50, 0.88) 78%
Agreement was examined for differing levels of motor impairment as classified
by GMFCS levels. The results varied according to GMFCS level. Table 5.4.
summarises the unweighted kappa statistics and percentage agreement for each
GMFCS level at each FMS distance. For levels I and II at 5 and 50 metres and
level I at 50 metres the reliability and percentage agreement were lower than
for levels III and IV. For 500 metres level IV had the highest agreement with
level II the lowest. Caution needs to be exercised in interpreting this data. The
low kappa values for GMFCS levels I and II at 5 metres and for level I at 50
metres can in part be explained by the spread of scores rated. Examination of
the agreement tables for these comparisons show that the majority of scores are
up the highest end of the FMS, i.e. 5 and 6. With a reduced number of cells for
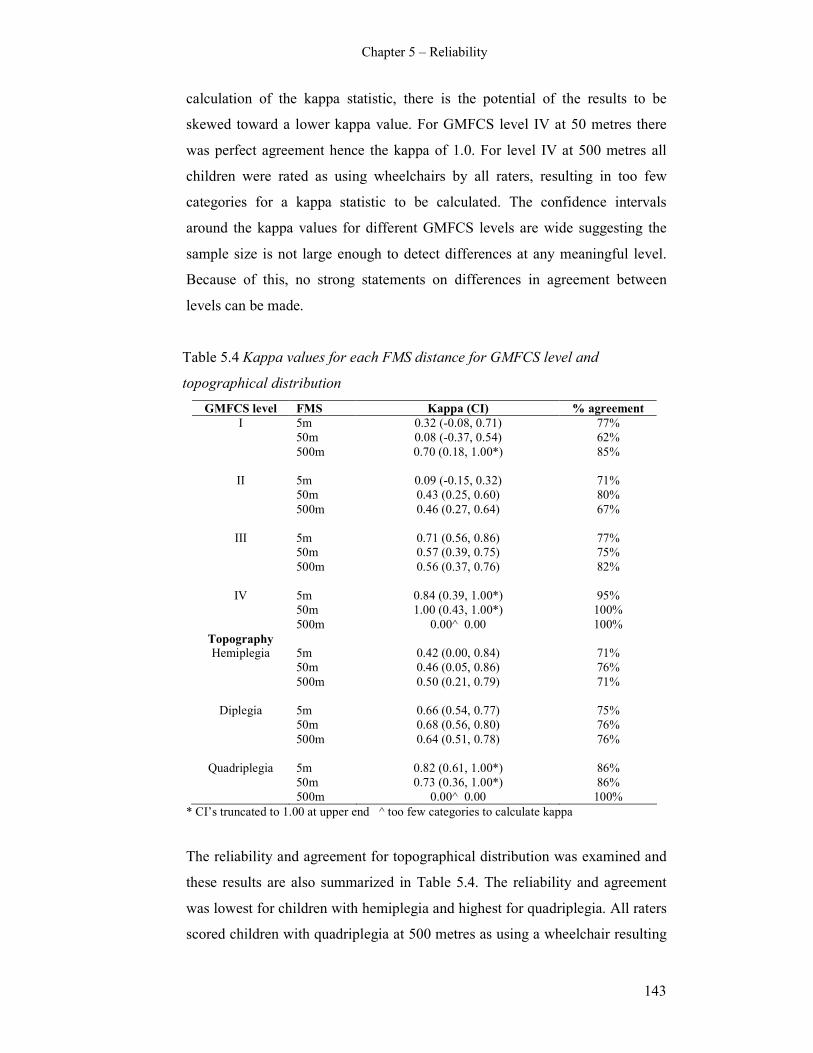
Chapter 5 – Reliability
143
calculation of the kappa statistic, there is the potential of the results to be
skewed toward a lower kappa value. For GMFCS level IV at 50 metres there
was perfect agreement hence the kappa of 1.0. For level IV at 500 metres all
children were rated as using wheelchairs by all raters, resulting in too few
categories for a kappa statistic to be calculated. The confidence intervals
around the kappa values for different GMFCS levels are wide suggesting the
sample size is not large enough to detect differences at any meaningful level.
Because of this, no strong statements on differences in agreement between
levels can be made.
Table 5.4 Kappa values for each FMS distance for GMFCS level and
topographical distribution
GMFCS level FMS Kappa (CI) % agreement
I 5m 0.32 (-0.08, 0.71) 77%
50m 0.08 (-0.37, 0.54) 62%
500m 0.70 (0.18, 1.00*) 85%
II 5m 0.09 (-0.15, 0.32) 71%
50m 0.43 (0.25, 0.60) 80%
500m 0.46 (0.27, 0.64) 67%
III 5m 0.71 (0.56, 0.86) 77%
50m 0.57 (0.39, 0.75) 75%
500m 0.56 (0.37, 0.76) 82%
IV 5m 0.84 (0.39, 1.00*) 95%
50m 1.00 (0.43, 1.00*) 100%
500m 0.00^ 0.00 100%
Topography
Hemiplegia 5m 0.42 (0.00, 0.84) 71%
50m 0.46 (0.05, 0.86) 76%
500m 0.50 (0.21, 0.79) 71%
Diplegia 5m 0.66 (0.54, 0.77) 75%
50m 0.68 (0.56, 0.80) 76%
500m 0.64 (0.51, 0.78) 76%
Quadriplegia 5m 0.82 (0.61, 1.00*) 86%
50m 0.73 (0.36, 1.00*) 86%
500m 0.00^ 0.00 100%
* CI’s truncated to 1.00 at upper end ^ too few categories to calculate kappa
The reliability and agreement for topographical distribution was examined and
these results are also summarized in Table 5.4. The reliability and agreement
was lowest for children with hemiplegia and highest for quadriplegia. All raters
scored children with quadriplegia at 500 metres as using a wheelchair resulting
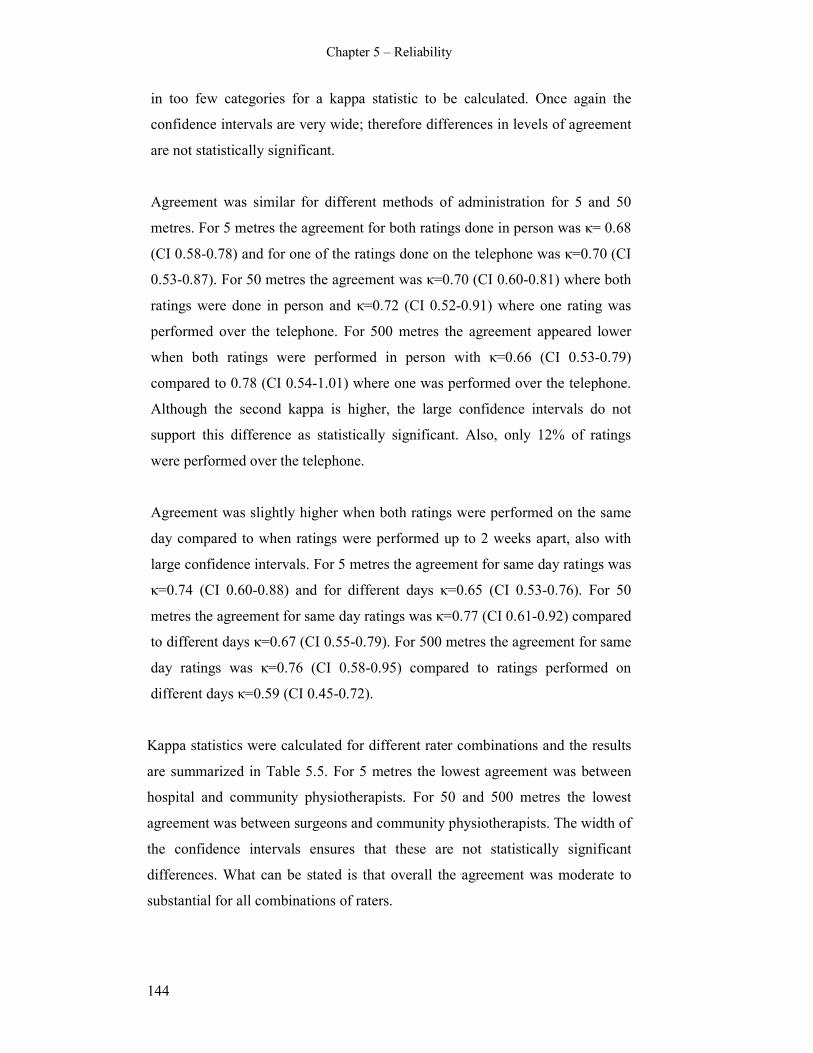
Chapter 5 – Reliability
144
in too few categories for a kappa statistic to be calculated. Once again the
confidence intervals are very wide; therefore differences in levels of agreement
are not statistically significant.
Agreement was similar for different methods of administration for 5 and 50
metres. For 5 metres the agreement for both ratings done in person was κ= 0.68
(CI 0.58-0.78) and for one of the ratings done on the telephone was κ=0.70 (CI
0.53-0.87). For 50 metres the agreement was κ=0.70 (CI 0.60-0.81) where both
ratings were done in person and κ=0.72 (CI 0.52-0.91) where one rating was
performed over the telephone. For 500 metres the agreement appeared lower
when both ratings were performed in person with κ=0.66 (CI 0.53-0.79)
compared to 0.78 (CI 0.54-1.01) where one was performed over the telephone.
Although the second kappa is higher, the large confidence intervals do not
support this difference as statistically significant. Also, only 12% of ratings
were performed over the telephone.
Agreement was slightly higher when both ratings were performed on the same
day compared to when ratings were performed up to 2 weeks apart, also with
large confidence intervals. For 5 metres the agreement for same day ratings was
κ=0.74 (CI 0.60-0.88) and for different days κ=0.65 (CI 0.53-0.76). For 50
metres the agreement for same day ratings was κ=0.77 (CI 0.61-0.92) compared
to different days κ=0.67 (CI 0.55-0.79). For 500 metres the agreement for same
day ratings was κ=0.76 (CI 0.58-0.95) compared to ratings performed on
different days κ=0.59 (CI 0.45-0.72).
Kappa statistics were calculated for different rater combinations and the results
are summarized in Table 5.5. For 5 metres the lowest agreement was between
hospital and community physiotherapists. For 50 and 500 metres the lowest
agreement was between surgeons and community physiotherapists. The width of
the confidence intervals ensures that these are not statistically significant
differences. What can be stated is that overall the agreement was moderate to
substantial for all combinations of raters.
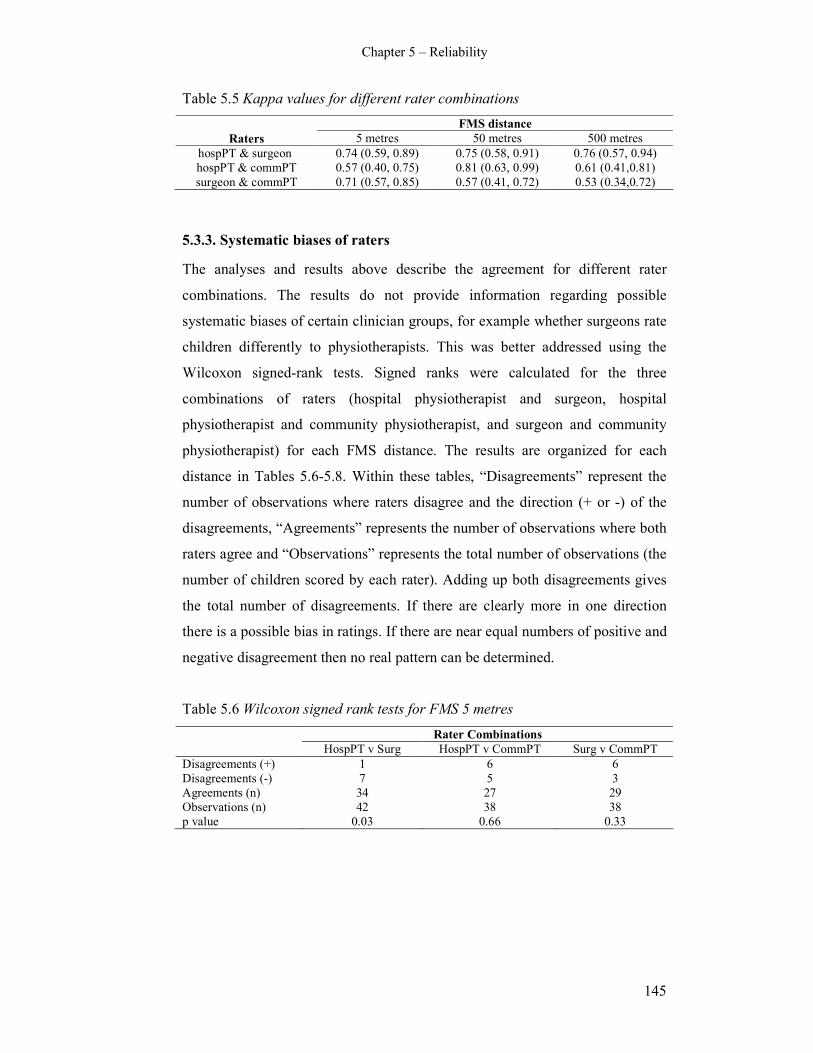
Chapter 5 – Reliability
145
Table 5.5 Kappa values for different rater combinations
FMS distance
Raters 5 metres 50 metres 500 metres
hospPT & surgeon 0.74 (0.59, 0.89) 0.75 (0.58, 0.91) 0.76 (0.57, 0.94)
hospPT & commPT 0.57 (0.40, 0.75) 0.81 (0.63, 0.99) 0.61 (0.41,0.81)
surgeon & commPT 0.71 (0.57, 0.85) 0.57 (0.41, 0.72) 0.53 (0.34,0.72)
5.3.3. Systematic biases of raters
The analyses and results above describe the agreement for different rater
combinations. The results do not provide information regarding possible
systematic biases of certain clinician groups, for example whether surgeons rate
children differently to physiotherapists. This was better addressed using the
Wilcoxon signed-rank tests. Signed ranks were calculated for the three
combinations of raters (hospital physiotherapist and surgeon, hospital
physiotherapist and community physiotherapist, and surgeon and community
physiotherapist) for each FMS distance. The results are organized for each
distance in Tables 5.6-5.8. Within these tables, “Disagreements” represent the
number of observations where raters disagree and the direction (+ or -) of the
disagreements, “Agreements” represents the number of observations where both
raters agree and “Observations” represents the total number of observations (the
number of children scored by each rater). Adding up both disagreements gives
the total number of disagreements. If there are clearly more in one direction
there is a possible bias in ratings. If there are near equal numbers of positive and
negative disagreement then no real pattern can be determined.
Table 5.6 Wilcoxon signed rank tests for FMS 5 metres
Rater Combinations
HospPT v Surg HospPT v CommPT Surg v CommPT
Disagreements (+) 1 6 6
Disagreements (-) 7 5 3
Agreements (n) 34 27 29
Observations (n) 42 38 38
p value 0.03 0.66 0.33
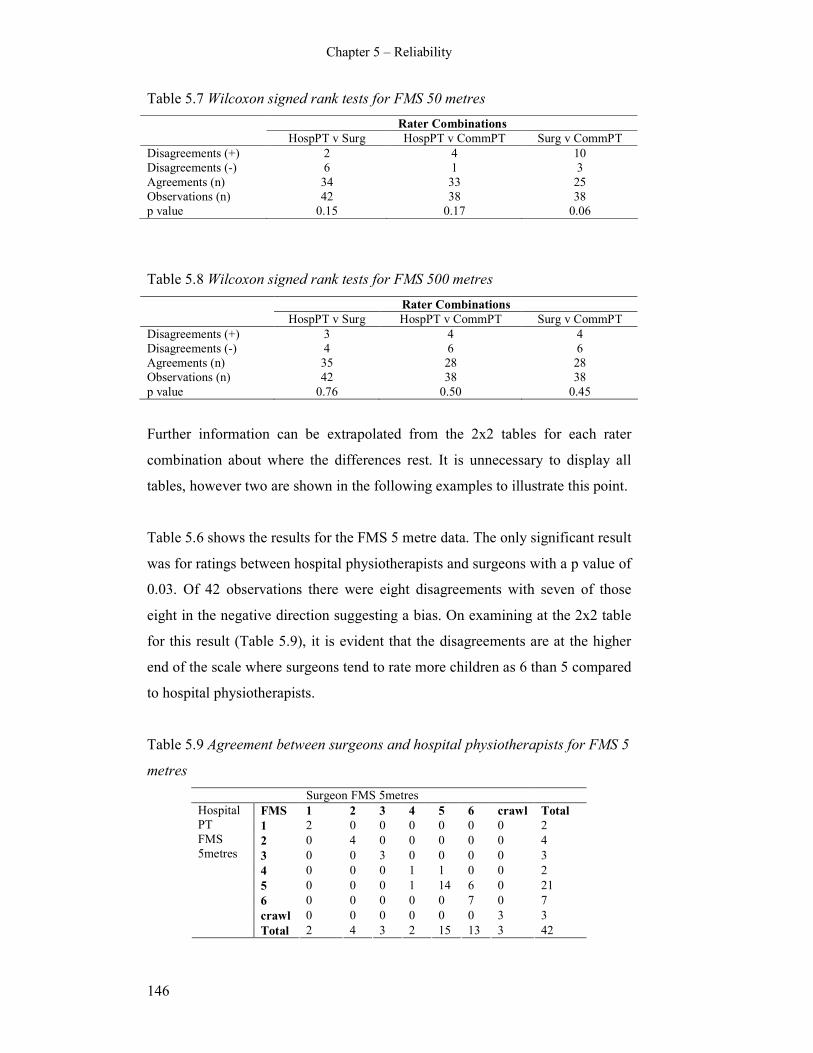
Chapter 5 – Reliability
146
Table 5.7 Wilcoxon signed rank tests for FMS 50 metres
Rater Combinations
HospPT v Surg HospPT v CommPT Surg v CommPT
Disagreements (+) 2 4 10
Disagreements (-) 6 1 3
Agreements (n) 34 33 25
Observations (n) 42 38 38
p value 0.15 0.17 0.06
Table 5.8 Wilcoxon signed rank tests for FMS 500 metres
Rater Combinations
HospPT v Surg HospPT v CommPT Surg v CommPT
Disagreements (+) 3 4 4
Disagreements (-) 4 6 6
Agreements (n) 35 28 28
Observations (n) 42 38 38
p value 0.76 0.50 0.45
Further information can be extrapolated from the 2x2 tables for each rater
combination about where the differences rest. It is unnecessary to display all
tables, however two are shown in the following examples to illustrate this point.
Table 5.6 shows the results for the FMS 5 metre data. The only significant result
was for ratings between hospital physiotherapists and surgeons with a p value of
0.03. Of 42 observations there were eight disagreements with seven of those
eight in the negative direction suggesting a bias. On examining at the 2x2 table
for this result (Table 5.9), it is evident that the disagreements are at the higher
end of the scale where surgeons tend to rate more children as 6 than 5 compared
to hospital physiotherapists.
Table 5.9 Agreement between surgeons and hospital physiotherapists for FMS 5
metres
Surgeon FMS 5metres
FMS 1 2 3 4 5 6 crawl Total
1 2 0 0 0 0 0 0 2
2 0 4 0 0 0 0 0 4
3 0 0 3 0 0 0 0 3
4 0 0 0 1 1 0 0 2
5 0 0 0 1 14 6 0 21
6 0 0 0 0 0 7 0 7
crawl 0 0 0 0 0 0 3 3
Hospital
PT
FMS
5metres
Total 2 4 3 2 15 13 3 42
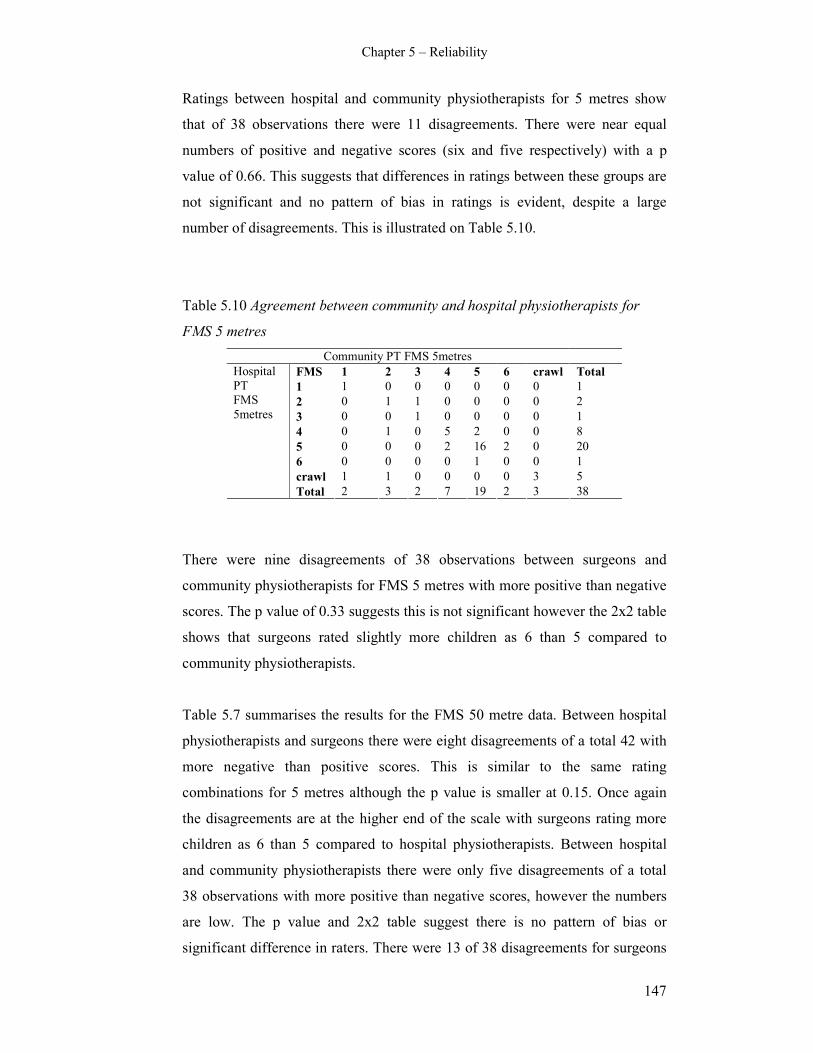
Chapter 5 – Reliability
147
Ratings between hospital and community physiotherapists for 5 metres show
that of 38 observations there were 11 disagreements. There were near equal
numbers of positive and negative scores (six and five respectively) with a p
value of 0.66. This suggests that differences in ratings between these groups are
not significant and no pattern of bias in ratings is evident, despite a large
number of disagreements. This is illustrated on Table 5.10.
Table 5.10 Agreement between community and hospital physiotherapists for
FMS 5 metres
Community PT FMS 5metres
FMS 1 2 3 4 5 6 crawl Total
1 1 0 0 0 0 0 0 1
2 0 1 1 0 0 0 0 2
3 0 0 1 0 0 0 0 1
4 0 1 0 5 2 0 0 8
5 0 0 0 2 16 2 0 20
6 0 0 0 0 1 0 0 1
crawl 1 1 0 0 0 0 3 5
Hospital
PT
FMS
5metres
Total 2 3 2 7 19 2 3 38
There were nine disagreements of 38 observations between surgeons and
community physiotherapists for FMS 5 metres with more positive than negative
scores. The p value of 0.33 suggests this is not significant however the 2x2 table
shows that surgeons rated slightly more children as 6 than 5 compared to
community physiotherapists.
Table 5.7 summarises the results for the FMS 50 metre data. Between hospital
physiotherapists and surgeons there were eight disagreements of a total 42 with
more negative than positive scores. This is similar to the same rating
combinations for 5 metres although the p value is smaller at 0.15. Once again
the disagreements are at the higher end of the scale with surgeons rating more
children as 6 than 5 compared to hospital physiotherapists. Between hospital
and community physiotherapists there were only five disagreements of a total
38 observations with more positive than negative scores, however the numbers
are low. The p value and 2x2 table suggest there is no pattern of bias or
significant difference in raters. There were 13 of 38 disagreements for surgeons
Chapter 5 – Reliability
148
and community physiotherapists with more positive scores. The p value is
nearly significant at 0.06 and the 2x2 table shows the disagreement is at the
higher end of the scale with surgeons rating more children at 6 than 5 compared
to the community physiotherapists.
Table 5.8 summarises the results for the FMS 500 metre distance. For all three
rater combinations there were between 7-10 disagreements and the numbers of
positive and negative scores were near equal. All p values are substantially
larger than 0.05. These results suggest there are no significant differences or
patterns between raters at this distance and the only patterns to emerge from the
2x2 tables were that surgeons tended to rate more children at 1 (using
wheelchairs) than both community and hospital physiotherapists, although the
difference is not striking.
5.4. Discussion
5.4.1. Inter-rater agreement of the FMS
The FMS was shown to have good inter-rater agreement for the 5, 50 and 500
metre distances using a range of clinicians as raters. This supports the tool as a
reliable measure of mobility for children with CP. Unweighted kappa statistics
were used primarily for data analysis with the understanding that a difference of
one level on the FMS was clinically meaningful and should be factored into the
analysis. The results obtained using no weights are particularly promising
because the use of weighted kappas produces a higher value, as evidenced by
the weighted kappas calculated for 5, 50 and 500 metres. If inter-rater reliability
is high it can be argued that it is unnecessary to test for retest reliability as it is
bound to be higher (Streiner and Norman 2003). Retest reliability was not
examined in the current study because the unweighted kappas calculated for
inter-rater reliability showed substantial agreement.
The preliminary study examining the reliability of the FMS used ICC’s with
results of 0.95 for 5 and 500 metres and 0.94 for 50 metres (Graham et al 2004).
Weighted kappa using quadratic weights with ordinal data has been shown to
yield equivalent results to that using the ICC (Tooth and Ottenbacher 2004).
Chapter 5 – Reliability
149
Quadratic weighted kappas were calculated in the current study for each FMS
distance to enable comparison with the previous study. They resulted in good
agreement although the values are slightly lower than the Graham study. The
current study examined reliability using a range of clinicians and more than 40
different raters. The previous study examined reliability between two surgeons
and one research fellow only. This may account for some of the difference. The
Graham study used ICC’s to analyse the data. These are designed primarily for
use with interval or ratio data. Although they can be applied to ordinal data with
the assumption that intervals are equivalent, the kappa statistic is more
appropriate to analyse categorical data such as the FMS (Tooth and Ottenbacher
2004).
The results of the reliability of the FMS found in this study are comparable to
the inter-rater reliability of tools that also focus on measuring or classifying
activity (Russell et al 1989, Young et al 1995, Nordmark et al 1997, Palisano et
al 1997, Novacheck et al 2000, Young et al 2000, McDowell et al 2007). The
inter-rater reliability of the GMFCS has been shown as 0.55 for children
younger than 2 years and 0.75 for children 2-12 years using unweighted kappas
(Palisano et al 1997) and 0.57-0.75 using linear weighted kappas (McDowell et
al 2007). The FAQ was shown to have good inter-rater reliability with ICC’s of
0.81-0.92 (Novacheck et al 2000). Inter-rater reliability of the GMFM is high
with Kendall coefficients of 0.77-0.88 (Nordmark et al 1997) and ICC’s of 0.92-
0.99 (Russell et al 1989). ICC’s of 0.96-0.99 was found for the ASK (Young et
al 1995, Young et al 2000). The reliability of other tools can be more variable
when there are several domains or subscales within them. For example, the
inter-rater reliability of the PEDI contains mobility, self-care and social function
domains. ICC’s vary from 0.18-0.94 (Nichols and Case-Smith 1996), 0.72-0.85
(Wright and Boschen 1993) and 0.64-0.74 (Berg et al 2004) with the mobility
domain having higher ICC’s. Physical function may be more consistent and
easier to score compared to domains such as social and cognition, particularly
when parental report is involved.
The sample used in this study comprised children who were predominantly
GMFCS level II or III, spastic diplegia and aged 6-12 years. An explanation of
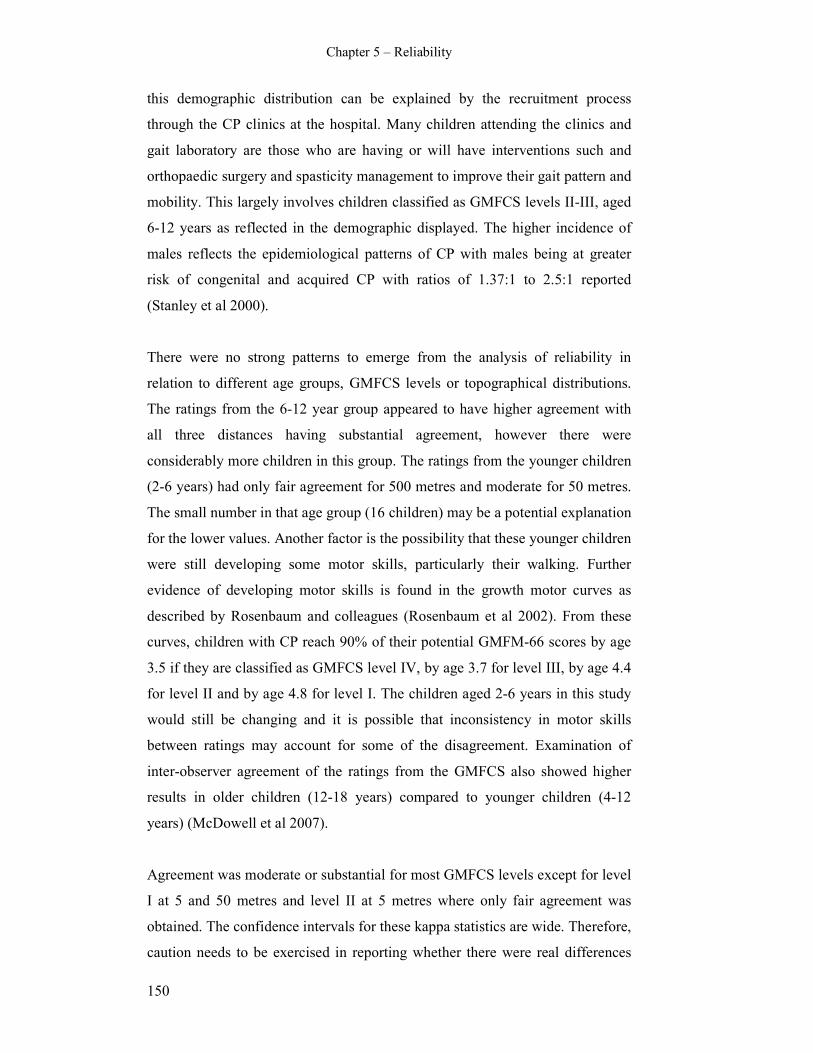
Chapter 5 – Reliability
150
this demographic distribution can be explained by the recruitment process
through the CP clinics at the hospital. Many children attending the clinics and
gait laboratory are those who are having or will have interventions such and
orthopaedic surgery and spasticity management to improve their gait pattern and
mobility. This largely involves children classified as GMFCS levels II-III, aged
6-12 years as reflected in the demographic displayed. The higher incidence of
males reflects the epidemiological patterns of CP with males being at greater
risk of congenital and acquired CP with ratios of 1.37:1 to 2.5:1 reported
(Stanley et al 2000).
There were no strong patterns to emerge from the analysis of reliability in
relation to different age groups, GMFCS levels or topographical distributions.
The ratings from the 6-12 year group appeared to have higher agreement with
all three distances having substantial agreement, however there were
considerably more children in this group. The ratings from the younger children
(2-6 years) had only fair agreement for 500 metres and moderate for 50 metres.
The small number in that age group (16 children) may be a potential explanation
for the lower values. Another factor is the possibility that these younger children
were still developing some motor skills, particularly their walking. Further
evidence of developing motor skills is found in the growth motor curves as
described by Rosenbaum and colleagues (Rosenbaum et al 2002). From these
curves, children with CP reach 90% of their potential GMFM-66 scores by age
3.5 if they are classified as GMFCS level IV, by age 3.7 for level III, by age 4.4
for level II and by age 4.8 for level I. The children aged 2-6 years in this study
would still be changing and it is possible that inconsistency in motor skills
between ratings may account for some of the disagreement. Examination of
inter-observer agreement of the ratings from the GMFCS also showed higher
results in older children (12-18 years) compared to younger children (4-12
years) (McDowell et al 2007).
Agreement was moderate or substantial for most GMFCS levels except for level
I at 5 and 50 metres and level II at 5 metres where only fair agreement was
obtained. The confidence intervals for these kappa statistics are wide. Therefore,
caution needs to be exercised in reporting whether there were real differences

Chapter 5 – Reliability
151
between levels. For some levels of the GMFCS, only two or three FMS levels
were represented in the calculations, affecting the kappas obtained. This further
clouds the ability to make strong statements about the results. However, there
are possible explanations for the fair agreement of levels I and II. These
GMFCS levels represent the more functionally able children. The difference
between these two levels is based on the abilities of the child to perform more
high levels activities such as running and incorporates concepts of balance,
speed and coordination (Palisano et al 1997). It is possible that difficulties in
distinguishing between these two levels would result in lower agreement. This is
supported by previous studies where there is less agreement between GMFCS
levels I and II (Palisano et al 1997, McDowell et al 2007). In relation to
topographical distribution of CP, this study found substantial agreement
between raters for children with diplegia and quadriplegia for all three distances
and moderate agreement for children with hemiplegia. Like the results for
GMFCS levels the confidence intervals are wide and the results need to be
interpreted with caution.
The FMS can be administered in person or over the telephone as demonstrated
by examination of different methods of administration. The scale is a self report
or parent report scale and does not require direct observation to administer it.
Results showed that for 5 and 50 metres, agreement was very similar for ratings
where both were performed in person and where one of the ratings was
performed over the telephone. For 500 metres there was a small difference with
a higher kappa where one rating was performed over the telephone however the
width of the confidence intervals suggests this is not a meaningful difference.
All results for method of administration showed substantial agreement. This
supports the reliable use of administering the FMS either in person or over the
telephone and this enhances the clinical utility of the scale.
Similar findings were ascertained for different administration methods of the
WeeFIM. There were no statistically significant differences on t tests when
comparing administering the WeeFIM via interview over the telephone or in
person (Ottenbacher et al 1996) or when comparing administration via direct
observation and interview with a parent (Sperle et al 1997). These results
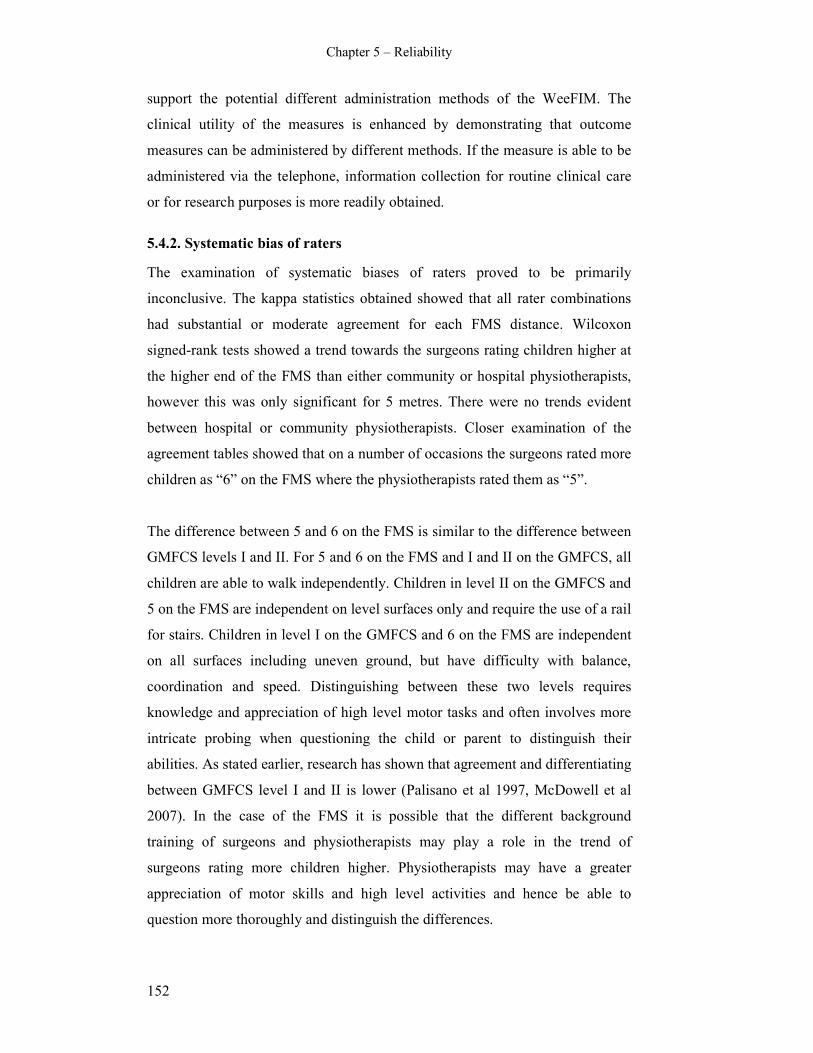
Chapter 5 – Reliability
152
support the potential different administration methods of the WeeFIM. The
clinical utility of the measures is enhanced by demonstrating that outcome
measures can be administered by different methods. If the measure is able to be
administered via the telephone, information collection for routine clinical care
or for research purposes is more readily obtained.
5.4.2. Systematic bias of raters
The examination of systematic biases of raters proved to be primarily
inconclusive. The kappa statistics obtained showed that all rater combinations
had substantial or moderate agreement for each FMS distance. Wilcoxon
signed-rank tests showed a trend towards the surgeons rating children higher at
the higher end of the FMS than either community or hospital physiotherapists,
however this was only significant for 5 metres. There were no trends evident
between hospital or community physiotherapists. Closer examination of the
agreement tables showed that on a number of occasions the surgeons rated more
children as “6” on the FMS where the physiotherapists rated them as “5”.
The difference between 5 and 6 on the FMS is similar to the difference between
GMFCS levels I and II. For 5 and 6 on the FMS and I and II on the GMFCS, all
children are able to walk independently. Children in level II on the GMFCS and
5 on the FMS are independent on level surfaces only and require the use of a rail
for stairs. Children in level I on the GMFCS and 6 on the FMS are independent
on all surfaces including uneven ground, but have difficulty with balance,
coordination and speed. Distinguishing between these two levels requires
knowledge and appreciation of high level motor tasks and often involves more
intricate probing when questioning the child or parent to distinguish their
abilities. As stated earlier, research has shown that agreement and differentiating
between GMFCS level I and II is lower (Palisano et al 1997, McDowell et al
2007). In the case of the FMS it is possible that the different background
training of surgeons and physiotherapists may play a role in the trend of
surgeons rating more children higher. Physiotherapists may have a greater
appreciation of motor skills and high level activities and hence be able to
question more thoroughly and distinguish the differences.

Chapter 5 – Reliability
153
5.4.3. Factors affecting agreement
There are a number of reasons for potential differences in ratings affecting the
reliability and agreement of the FMS. There are child/parent factors,
rater/clinician factors and scale factors. The stability of mobility status of the
child over the rating period and performance on the day of rating may impact
the results. Thirty eight percent of children had both ratings performed on the
same day where performance would be considered stable. The remaining 62%
had ratings performed up to 2 weeks apart. Although a time interval of 2-14
days between testing is considered usual (Streiner and Norman 2003), there is a
chance that mobility may have changed between ratings. This may have
produced different scores, resulting in lower agreement between raters.
Although not statistically significant due to the wide confidence intervals, the
agreement of ratings performed on the same day was shown to be higher than
those performed up to 2 weeks apart.
The FMS is administered by the clinician asking a few questions of the child
and/or parents to obtain a “performance” rating of the child’s mobility. The
manner in which the questions are worded is integral to the score obtained.
Different raters/clinicians may word the questions slightly differently, resulting
in slightly different answers. Some may ask vague questions in order to get a
true “performance” rating while others may be more direct. Some may probe
more intricately into differences between different levels, for example between
levels 5 and 6. The pamphlet gives direction for administering the scale but does
leave some room for clinical interpretation to ensure it is not too prescriptive or
rigid. A study examining similar questions from three different tools (the CHQ,
PODCI and PEDI) found that differences in wording of questions have a
significant effect on parents’ responses (Wren et al 2007). Another factor is the
response of the child or parent to the questions asked of them. On different
occasions they may respond differently to very similar questions.
The knowledge of parents and community physiotherapists of the child’s
mobility in different environments may also affect ratings. Because parents live
with their children they would have first-hand knowledge of what their child
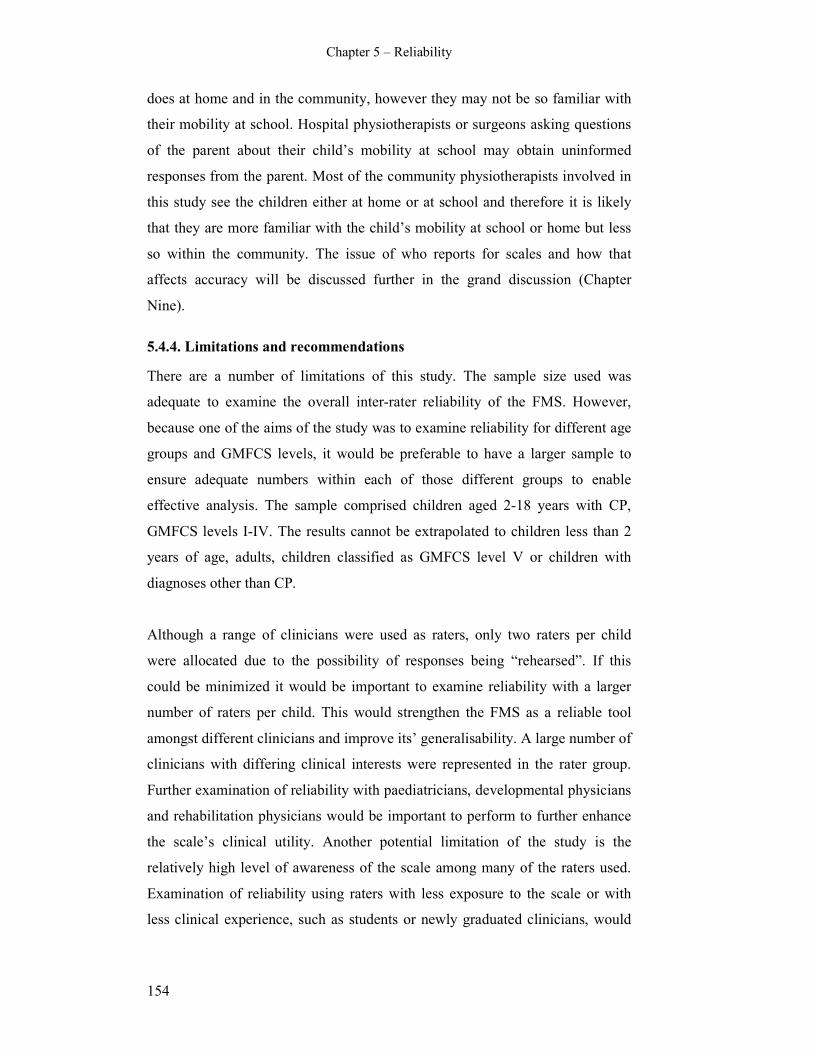
Chapter 5 – Reliability
154
does at home and in the community, however they may not be so familiar with
their mobility at school. Hospital physiotherapists or surgeons asking questions
of the parent about their child’s mobility at school may obtain uninformed
responses from the parent. Most of the community physiotherapists involved in
this study see the children either at home or at school and therefore it is likely
that they are more familiar with the child’s mobility at school or home but less
so within the community. The issue of who reports for scales and how that
affects accuracy will be discussed further in the grand discussion (Chapter
Nine).
5.4.4. Limitations and recommendations
There are a number of limitations of this study. The sample size used was
adequate to examine the overall inter-rater reliability of the FMS. However,
because one of the aims of the study was to examine reliability for different age
groups and GMFCS levels, it would be preferable to have a larger sample to
ensure adequate numbers within each of those different groups to enable
effective analysis. The sample comprised children aged 2-18 years with CP,
GMFCS levels I-IV. The results cannot be extrapolated to children less than 2
years of age, adults, children classified as GMFCS level V or children with
diagnoses other than CP.
Although a range of clinicians were used as raters, only two raters per child
were allocated due to the possibility of responses being “rehearsed”. If this
could be minimized it would be important to examine reliability with a larger
number of raters per child. This would strengthen the FMS as a reliable tool
amongst different clinicians and improve its’ generalisability. A large number of
clinicians with differing clinical interests were represented in the rater group.
Further examination of reliability with paediatricians, developmental physicians
and rehabilitation physicians would be important to perform to further enhance
the scale’s clinical utility. Another potential limitation of the study is the
relatively high level of awareness of the scale among many of the raters used.
Examination of reliability using raters with less exposure to the scale or with
less clinical experience, such as students or newly graduated clinicians, would
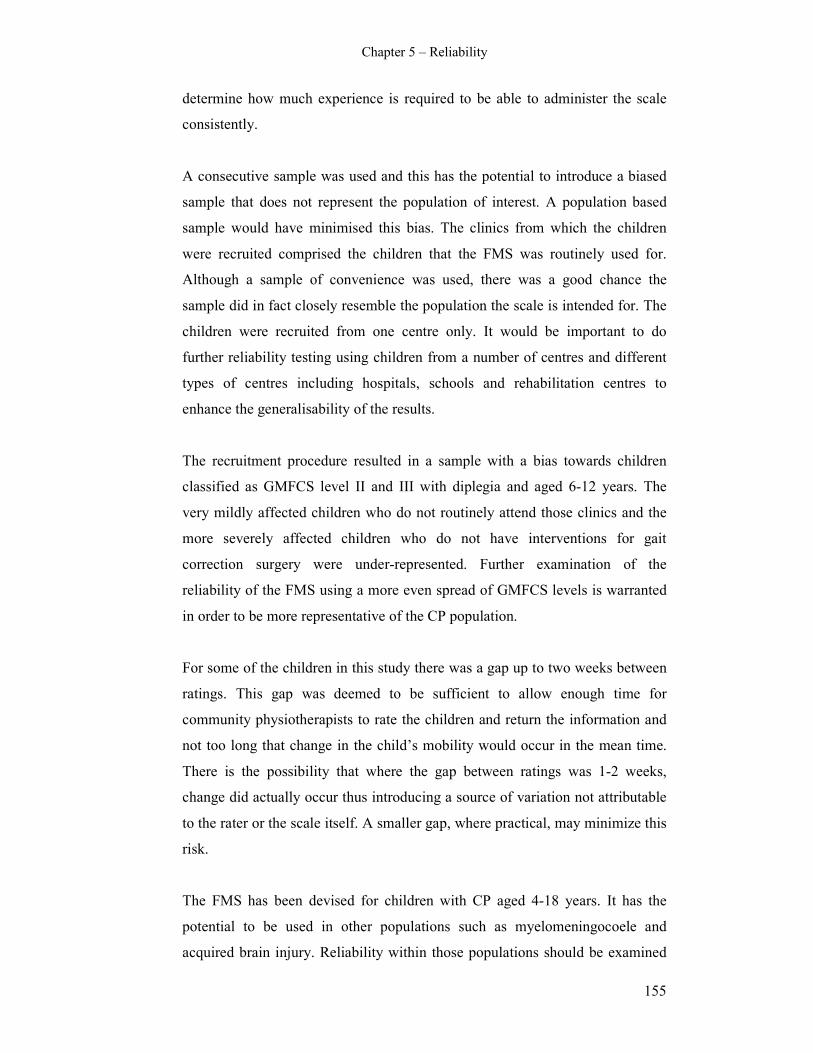
Chapter 5 – Reliability
155
determine how much experience is required to be able to administer the scale
consistently.
A consecutive sample was used and this has the potential to introduce a biased
sample that does not represent the population of interest. A population based
sample would have minimised this bias. The clinics from which the children
were recruited comprised the children that the FMS was routinely used for.
Although a sample of convenience was used, there was a good chance the
sample did in fact closely resemble the population the scale is intended for. The
children were recruited from one centre only. It would be important to do
further reliability testing using children from a number of centres and different
types of centres including hospitals, schools and rehabilitation centres to
enhance the generalisability of the results.
The recruitment procedure resulted in a sample with a bias towards children
classified as GMFCS level II and III with diplegia and aged 6-12 years. The
very mildly affected children who do not routinely attend those clinics and the
more severely affected children who do not have interventions for gait
correction surgery were under-represented. Further examination of the
reliability of the FMS using a more even spread of GMFCS levels is warranted
in order to be more representative of the CP population.
For some of the children in this study there was a gap up to two weeks between
ratings. This gap was deemed to be sufficient to allow enough time for
community physiotherapists to rate the children and return the information and
not too long that change in the child’s mobility would occur in the mean time.
There is the possibility that where the gap between ratings was 1-2 weeks,
change did actually occur thus introducing a source of variation not attributable
to the rater or the scale itself. A smaller gap, where practical, may minimize this
risk.
The FMS has been devised for children with CP aged 4-18 years. It has the
potential to be used in other populations such as myelomeningocoele and
acquired brain injury. Reliability within those populations should be examined
Chapter 5 – Reliability
156
before it is widely used to measure their mobility. The scale also has the
potential to be used in adults with CP and once again examination of reliability
in adults is required beforehand.
5.5. Conclusion
Substantial agreement for each of the three distances of the FMS was found
using a range of clinicians as raters. Although there were some differences in
agreement for children of different ages, GMFCS levels and topographical
categories, these differences were not significant. There was similar agreement
when administering the scale in person and by telephone, suggesting that the
FMS can be administered by either method. Closer examination of rater bias by
clinical background showed a tendency of surgeons to rate more of the higher
functioning children at the limit of the scale than physiotherapists, however only
one of the comparisons was statistically significant. The FMS can be used as a
reliable tool for different clinicians to assess mobility in children with CP.

Chapter 6 – Responsiveness
157
CHAPTER SIX: RESPONSIVENESS TO CHANGE OF THE
FUNCTIONAL MOBILITY SCALE
6.1. Introduction
This chapter reports the responsiveness to change of the FMS in children with
CP following orthopaedic surgery and spasticity management using botulinum
toxin injections. Evaluative measures such as the FMS are designed to measure
the magnitude of longitudinal change for individuals or groups over time
(Kirschner and Guyatt 1985). A fundamental component of the validating
process of evaluative instruments is to establish responsiveness to change to
ensure they can accurately detect change in function (Deyo and Inui 1984,
Kirschner and Guyatt 1985, Guyatt et al 1987, Guyatt et al 1989, Rosenbaum et
al 1990, Fitzpatrick et al 1992, Guyatt et al 1992, Lohr et al 1996). Evaluative
measures are also used to quantify treatment benefits (Kirschner and Guyatt
1985). It is important to establish responsiveness to show that the tool is able to
detect the effects of treatment over time (Furlong et al 2005).
There is a lack of clarity in the literature about the definition of responsiveness
(Husted et al 2000, Terwee et al 2003). In general terms, responsiveness can be
described as the ability of a measure to detect minimally clinical important
differences in function when change is believed to have occurred (Guyatt et al
1987). It relates to changes in scores that are due to change in health status and
not artefact of measurement (Guyatt et al 1992). A review of the literature on
this topic identified 25 definitions of responsiveness which could be grouped
into three categories (Terwee et al 2003). One category defined responsiveness
as the ability to detect change in general, regardless of whether it was relevant
or meaningful (Terwee et al 2003). A second category is the ability to detect
clinically important change and requires a judgement on what is considered to
be important change (Terwee et al 2003). The third category, an extension of the
previous two, is the ability to detect real changes in the construct being
measured (Terwee et al 2003). The third category requires a gold standard for
what constitutes a real change in the construct being measured. This third
Chapter 6 – Responsiveness
158
definition is most relevant to evaluative measures because it is important to
demonstrate that change has occurred (Vos-Vromans et al 2005).
Some authors have argued that responsiveness and validity are not separate
properties (Liang 2000, Terwee et al 2003). They argue that responsiveness is
an aspect of validity in a longitudinal setting because a responsive measure has
the purpose to measure change over time and validity concerns whether the
instrument is measuring what it intends to measure (Vos-Vromans et al 2005).
Others argue there is a difference between longitudinal construct validity and
responsiveness (Kirschner and Guyatt 1985, Guyatt et al 1989, Husted et al
2000). Longitudinal construct validity is the relationship between changes in an
index and external measures over time whereas responsiveness is the power of
the test to detect a clinically important difference (Kirschner and Guyatt 1985).
The necessity for distinguishing between responsiveness and validity remains
based on the fact that an instrument can be valid and still fail to detect clinically
important change when it occurs (Guyatt et al 1989). For the purposes of this
thesis, responsiveness is considered separate from validity and is operationally
defined as “an instrument’s ability to detect important change over time in the
concept being measured” (Dekker et al 2005).
Responsiveness can be classified into two major groups; internal and external
responsiveness (Husted et al 2000). Internal responsiveness describes the ability
of a measure to assess change over a prespecified time frame and is assessed
using various methods such as effect size, paired t tests and responsiveness
coefficients (Husted et al 2000). These methods are limited because they do not
relate changes in the measure to corresponding changes on an external criterion
at the individual patient level, and may report change without a true change
occurring in the health condition being measured (Husted et al 2000). External
responsiveness reflects the extent to which changes in a measure over a
specified time frame relate to corresponding changes in a reference measure of
health status. It is assessed using correlations, regression and receiver operating
characteristic (ROC) curves (Husted et al 2000). External responsiveness has a
broader application because it concerns the measure itself, not the treatment
under investigation (Husted et al 2000). This is important to understand in the
Chapter 6 – Responsiveness
159
context of this thesis because measures of external responsiveness were used to
examine the responsiveness of the FMS. This was to determine that it could
show change when a true change had occurred in the mobility of the children
being assessed.
An important aspect of determining responsiveness is determining what
constitutes a minimally clinical important difference (MCID) (Guyatt et al
1987). The MCID can be defined as “the smallest difference in score in the
domain of interest which patients perceive as beneficial and which would
mandate, in the absence of troublesome side effects and excessive cost, a change
in patients management” (Jaeschke et al 1989). The MCID is not a fixed
property of the instrument. It depends on the study setting in which it is going to
be used (Terwee et al 2003). One issue with newly developed instruments and
some established ones is that it is not known what change in score constitutes a
clinically important difference (Guyatt et al 1987). In many clinical settings no
“gold standard” exists for what represents a real change in clinical status (Deyo
and Inui 1984). Defining a MCID for a specific study requires a judgement from
someone as to what important change is, which is often subjective (Terwee et al
2003). For the purposes of this thesis, the MCID was defined by a small group
of clinicians experienced in the use of the FMS.
A clinically important change can be defined and evaluated from the perspective
of the patient, his or her proxy, society and the health professional (Liang 2000).
In the absence of a gold standard, the independent, concurrent agreement about
change by patient and physician can serve as a basis for defining the presence
and magnitude of functionally important changes (Deyo and Inui 1984).
However, a limitation of this method is that clinician judgements are not
completely independent of patient judgements because the patients self-report to
the clinician will influence that assessment (Deyo and Inui 1984). Using the
patient perspective introduces the possibility of varying criteria for important
changes (Ward et al 2000) and also introduces the possibility of response bias
and reliability issues (Liang 2000). Therefore, any estimate of MCID will be
associated with a degree of uncertainty (Guyatt et al 2002). For many measures
used in clinical practice clinicians develop an intuitive sense of the MCID
Chapter 6 – Responsiveness
160
through repeated use. Therefore, clinical experience with an instrument is a
feasible and valid method of determining the significance of changes in
instrument score (Jaeschke et al 1989).
There is a lack of consensus in the literature about the best methods to assess
responsiveness with many authors using multiple indices of responsiveness
(Husted et al 2000, Terwee et al 2003, Vos-Vromans et al 2005). A review of
the literature of the different methods used for calculating responsiveness found
31 different methods (Terwee et al 2003) which had two different frames of
reference (Vos-Vromans et al 2005). The first included methods based on the
changes due to treatment and/or time effect such as effect size, standardised
response means, paired t tests and analysis of variance. The second included
methods in which an external criterion (patient or professional) was used to
define whether a patient has changed or not, such as sensitivity and specificity
using receiver operating characteristic (ROC) curves, correlation of change with
an external criterion and regression models (Vos-Vromans et al 2005).
Many of the above methods for assessing responsiveness, such as mean change,
t tests, effect size, standardised response means, rely on the data being
continuous. The FMS is a categorical scale and these methods are therefore not
appropriate. Appropriate methods for analysing categorical data include
examining the magnitude of correlations of change with other measures (Guyatt
et al 1989), by ensuring that scores improve with application of a treatment of
known efficacy (Kirschner and Guyatt 1985) and by using ROC curves (Deyo
and Centor 1986). If one can clearly demonstrate a group of subjects who are
stable and group who have changed, responsiveness is readily measured (Guyatt
et al 1989). ROC curves can assess the ability of a measure to reflect both
change and no change in an external standard using sensitivity and specificity in
detecting improvement or deterioration, however information on the magnitude
of change in the external criterion is sacrificed because change must be
dichotomised (Deyo and Centor 1986). In order to be sure that the instrument
measures important changes, a correlational approach with some other measure
is required (Terwee et al 2003).
Chapter 6 – Responsiveness
161
For the current study, measures of external responsiveness appropriate for use
with categorical data were chosen to examine the responsiveness of the FMS.
Correlation of change scores on the FMS with change scores on an external
criterion, the Functional Assessment Questionnaire (FAQ) was chosen. The
FAQ is another measure of mobility and although it cannot be described as a
“gold standard”, it also measures mobility in children with CP on a categorical
scale.
Like validity, responsiveness is an abstract construct established incrementally
over time by the accumulation of evidence about the performance of a measure
(Rosenbaum et al 1990). A previous study on the FMS reported to assess
sensitivity to detect change after operative intervention in children with CP
(Graham et al 2004). Change in FMS scores was correlated with change on
other measures such as Hoffer ambulation level, Uptime, CHQ, PODCI and
energy expenditure with Spearman rank correlations ranging from 0.52-0.89.
These correlations are encouraging; however the tools used as external
criterions are not similar to the FMS. The FAQ, which is the most similar
measure of mobility to the FMS, was not used as an external criterion. The pilot
study reported in Chapter Four demonstrated that the FMS was able to detect
change following SEMLS in children with spastic diplegia (Harvey et al 2007).
That study examined change after surgery using the FMS, not the
responsiveness of the scale.
It was therefore considered necessary to further examine responsiveness of the
FMS using the FAQ as an external criterion to determine that it is able to detect
clinically important change where that change occurs. Because a useful measure
must reflect “no change” as well as it does “change” (Husted et al 2000), it was
considered necessary to prospectively show that the FMS is able to detect
clinically important change in mobility status as well as show stability where no
change occurs. To do this, a group of children with CP following single event
multilevel surgery who have been shown to change would be compared with
children having botulinum toxin injections where clinical experience suggests
that mobility does not change afterwards.
Chapter 6 – Responsiveness
162
The research question was “what is the responsiveness to change of the FMS for
detecting clinically important change in children with CP following orthopaedic
surgery and spasticity management”. The aim of this study was to examine the
ability of the FMS to detect minimal clinically important difference in mobility
status, judged as one level on the FMS, in a group of children with CP having a
range of interventions using the FAQ as an external criterion.
The hypothesis was “the FMS is able to detect clinically important differences
in functional mobility in children with CP where change in mobility occurs; it
will show change in children having SEMLS and will show stability in children
having botulinum toxin injections”.
6.2. Method
This study was prospective and longitudinal. Data were collected for a group of
children at predetermined stages before and following different interventions
involving surgery and spasticity management.
6.2.1. Participants
The participants were a consecutive population-based sample of children with
CP who were due to have interventions including spasticity management and
orthopaedic surgery. Consecutive population-based sampling was used to ensure
a large enough sample size was obtained for a representative group that would
show changes in mobility in the children as a group and for smaller subgroups
representing different types of interventions. It also ensured that adequate time
for follow-up after the interventions was considered. Although a random sample
would ensure that the sample obtained represented the target population, it was
considered that this was not feasible within the time constraints of the thesis.
Also, by recruiting the children through the clinics of The Royal Childrens
Hospital where surgical decision-making occurs, the final sample was
representative of the population of interest.
Chapter 6 – Responsiveness
163
6.2.1.1 Inclusion criteria
Inclusion criteria were:
i. children with CP aged 2-18 years
ii. children GMFCS levels I-IV
iii. children attending the CP orthopaedic surgical clinic or gait laboratory of
The Royal Childrens Hospital
iv. children scheduled to have orthopaedic surgery or spasticity management
between January 2006 and May 2007
The upper age limit was 18 years because the FMS has been developed for
children aged 4-18 years. This was explained in Chapter 4 (section 4.2.1).
Although the lower age limit for the scale is 4 years, this study did include
children aged 2 years and older. This was because a particular group of interest
was the younger children who have botulinum toxin injections for spasticity
management. This intervention is often used in younger children aged 2-6 years
and therefore these younger children were included. Children classified as
GMFCS levels I-IV were included. These are the levels that the FMS has been
developed for (see Chapter 4 section 4.2.1). The CP orthopaedic surgical clinics
and the gait laboratory of The Royal Childrens Hospital are the major clinics
where decisions regarding forthcoming surgery for children with CP are made.
This is where the children were recruited from. The children were required to be
having surgery between January 2006 and May 2007 to allow for adequate time
post-intervention for repeat assessments.
The interventions performed on the children examined in the study were:
i. single event multilevel surgery (SEMLS) for gait correction, involving
children with diplegia and hemiplegia
ii. single level orthopaedic surgery for deformity correction, for example,
foot surgery or hamstring lengthenings, in isolation
iii. two level simple orthopaedic surgery, for example hamstrings and calf
lengthening in combination
iv. surgery for hip displacement;
a. adductor lengthenings with phenol to the obturator nerve and

Chapter 6 – Responsiveness
164
b. varus derotation osteotomies of the femur (VDRO’s)
v. botulinum toxin injections into specific muscles for spasticity
management, at either one, two or three levels and involving;
a. calves
b. hamstrings
c. adductors
d. psoas
Single event multilevel surgery (SEMLS) refers to the correction of all
orthopaedic deformities in one session (Graham and Selber 2003). It can be
defined as at least two orthopaedic procedures at different anatomical sites in
each limb i.e. a minimum of four procedures (Pirpiris et al 2003). It is now
considered to be the most accepted approach to correct the musculoskeletal
deformities contributing to gait deviations (Browne and McManus 1987, Nene
et al 1993, Abel et al 1999, Fabry et al 1999, Saraph et al 2002, Bache et al
2003, Graham and Selber 2003). The frequently used procedures are muscle-
tendon lengthenings, tendon transfers, rotational osteotomies and bony
stabilisation procedures (Bache et al 2003). These procedures can also be
performed in isolation or in smaller combinations, such as single level or two
level simple surgery when the deformities are not as extensive.
Injections of Botulinum toxin A are used to treat spasticity in selected muscle
groups by resulting in temporary chemodenervation of muscle and improving
muscle length and joint range of motion (Cosgrove et al 1998). Injections are
indicated primarily in younger children aged between 2 and 6 years (Cosgrove
et al 1998, Graham et al 2000) to prevent the development of fixed contractures
(Graham and Selber 2003). Applications in children with CP include dynamic
equinus, adductor spasticity causing a scissoring gait and hamstrings spasticity
causing crouch gait (Corry et al 1998, Cosgrove et al 1998, Graham and Selber
2003). One aim of the injections is to defer the need for more extensive
deformity correction until the child is at an optimal age where the most benefits
are obtained from surgical intervention (Bache et al 2003).

Chapter 6 – Responsiveness
165
Injection of Phenol to the motor nerves is another option in spasticity
management (Bache et al 2003). Phenol has a small role as a neurolytic agent
for selected motor nerves such as the obturator nerve in the presence of adductor
spasticity (Graham and Selber 2003). For children with more advanced hip
displacement, derotation osteotomies of the femurs are performed for medial
femoral torsion and hip subluxation (Ounpuu et al 2002).
It is not within the scope of this thesis to describe in detail the range of
orthopaedic procedures used. For more information on the types of orthopaedic
procedures and their indications the reader is directed to the relevant literature
(Graham et al 2000, Gage and Novacheck 2001, Bache et al 2003, Graham and
Selber 2003, Davids et al 2004, Sussman and Aiona 2004). Relevant articles on
the use and indications of botulinum toxin injections are also available
(Cosgrove et al 1994, Graham et al 2000, Boyd and Hays 2001a, Boyd and
Hays 2001b, Baker et al 2002).
The orthopaedic surgeons responsible for each child’s management prescribed
the surgery and performed the surgical operations or injected the botulinum
toxin.
6.2.1.2 Exclusion criteria
Excluded were children:
i. aged younger than 2 years or older than 18 years
ii. with a diagnosis other than CP
iii. classified as GMFCS level V
iv. whose parents were not able to understand due to language or cognitive
problems
v. whose parents were upset or anxious associated with their clinic or gait
laboratory appointment.
Children whose parents were not able to comprehend what was required due to
language or cognitive problems were excluded. Also excluded were children
who themselves or their parents were too upset or anxious at the clinic
appointment. This was explained in Chapter 5 (section 5.2.1.2).
Chapter 6 – Responsiveness
166
6.2.1.3 Sample size
A sample size of 80-100 was aimed for. This was considered to be adequate for
exploring the responsiveness of the FMS over different time points because a
previous pilot study of the FMS examining change after multilevel surgery
showed that change was detected in a sample of 66 children with CP (Harvey et
al 2007). Another aim of this study was to compare change in mobility
following SEMLS with change following botulinum toxin injections. The
sample needed to include at least 20 children having each of those interventions
to enable adequate comparison. The sample size obtained was partly driven by
the practicalities of recruiting children through the hospital with the clinical
availability of participants having interventions. It was also dependent on
allowing adequate follow-up time for the subsequent assessments within the
timeframe of thesis completion. Based on the number of children who have
surgery and botulinum toxin injections per year at The Royal Children’s
Hospital, this number was considered to be achievable.
6.2.2. Procedure
The study was approved by the Ethics in Human Research Committee of the
Royal Children’s Hospital (reference number 25119A) and The University of
Melbourne Human Ethics Research Committee (reference number 060212).
Written consent was obtained from each participating child’s parent or legal
guardian prior to data collection.
6.2.2.1 Recruitment
Children were recruited through the CP orthopaedic surgical clinics and the gait
laboratory of The Royal Children’s Hospital. The primary investigator (AH)
obtained the operating, clinic and gait laboratory appointment lists in advance of
the children attending the clinics to determine eligibility for entry. Once
eligibility was determined, the parents of the children were approached prior to
the interventions and invited to participate following a full explanation of the
study. Consent forms were signed and a written information sheet provided to
those willing to participate. The primary investigator (AH) was responsible for
collection of the information pre-operatively and at each post operative time-
point.

Chapter 6 – Responsiveness
167
6.2.2.2 Testing procedure
The data collected for each child at the initial pre-operative time point included:
i. date of birth, age and gender,
ii. GMFCS level,
iii. FMS score,
iv. Gillette Functional Assessment Questionnaire (FAQ) score,
v. date of surgery and type of surgery.
The GMFCS level for each child was determined by the primary investigator
based on the descriptors for each level (Appendix B). Date of birth, gender and
topographical distribution of CP for each child was obtained from the hospital
records. The FMS was administered with the child and parents by the primary
investigator. The walking scale of the Gillette FAQ is a 10 level ordinal scale
that is completed by the parents. A copy of this scale is in Appendix E. It was
completed at each assessment with the primary investigator present. The date of
surgery and type of surgery was obtained from the hospital record at the pre-
operative consultation and checked against the operation report at the first
follow-up assessment. The age, GMFCS levels and type of surgery were
collected for descriptive purposes. The FMS and FAQ were collected for data
analysis of responsiveness after the interventions.
The children were then assessed at regular time points following the
interventions. The post-operative follow up time points varied according to the
interventions. The children were assessed at:
i. SEMLS; 3, 6, 9 and 12 months post-operatively.
ii. one-two level surgery - 3 months and 6 months post-operatively.
iii. adductor lengthening with phenol to the obturator nerve - 6 weeks, 3 and
6 months post-operatively.
iv. VDRO’s - 3, 6, 9 and 12 months post-operatively
v. botulinum toxin injections - 3, 6, 12 and 24 weeks post-injections.
The different time points were determined based on the amount of surgery
performed, the expected post-intervention recovery period based on clinical

Chapter 6 – Responsiveness
168
judgement and the routine post-intervention clinical follow-up that occurs.
Children who undergo SEMLS require at least 12 months of rehabilitation and
changes in mobility are seen up until 24 months (Harvey et al 2007). In the
clinical setting these children are monitored every 3 months for the first 12
months. Children who have surgery to one or two levels tend to recover sooner
because of the lesser amount of surgery. Following adductor lengthening and
phenol to the obturator nerve, improvements may be seen earlier, thus requiring
a 6 week assessment time point. Children who are injected with botulinum toxin
are able to return to usual activity as soon as they return home and the effects of
the injections can be seen by 3 weeks post-injection with the usual length of
time the benefit continues is up to 6 months (Cosgrove et al 1994, Eames et al
1999). These children were assessed at more frequent points earlier after the
injections.
At each of the follow-up assessments the information collected was:
i. GMFCS level
ii. FMS score
iii. FAQ score
The GMFCS classification was obtained while observing the child and
questioning the parents. The FMS was administered by the principal
investigator. The FAQ was completed by the parents. The information was
collected at the usual post-operative appointments in the clinic or the gait
laboratory by the principal investigator. It was not possible to blind the principal
investigator to the treatment path of the children because post-operative wounds
and the age of the child would make it obvious as to which group they were in.
Some of the children who had received botulinum toxin injections or single
level surgery were not required to attend the hospital for their routine clinical
appointments as often as the protocol of the collection of data for this study. To
prevent the child and family having to attend the hospital more than clinically
necessary, an alternative method of data collection was employed. This involved
the principal investigator administering the FMS over the telephone with the
parents and mailing the FAQ with a stamped, self-addressed envelope out to the
parents who then completed it and returned it.

Chapter 6 – Responsiveness
169
Wherever feasible the same parent filled in the FAQ and answered the questions
for the FMS rating. The principal investigator performed all telephone FMS
ratings and the clinic appointment ratings.
6.2.3. Data Analysis
Descriptive statistics for participant characteristics were calculated using means
and standard deviations for continuous variables and frequency and percentages
for categorical variables. A decision was made by a group of four clinicians
with extensive experience of administering the FMS, including one surgeon and
three physiotherapists, that a change of one category (up or down) on the FMS
was considered a minimal clinically important difference (MCID). This decision
was made based on the literature discussed in the introduction of this chapter
that clinical experience with a measure is a valid method of determining the
MCID where there is no “gold standard” for what represents a real change in
clinical status (Jaeschke et al 1989). This MCID formed the basis for reporting
the change scores.
The FAQ was used as an external criterion to assess change following the
interventions. The FMS and FAQ are both categorical measures. It is therefore
not appropriate to use statistical methods such as effect size, standardised
response means and mean change as has been used for continuous variables
(Terwee et al 2003). It was decided to use change scores (follow-up score minus
initial score) as a measure of responsiveness (Deyo and Inui 1984). Change
scores on the FMS and FAQ were generated at each post-intervention stage. The
percentage of children who either did not change or changed for the better (up)
or for the worse (down) were calculated at each time point. These descriptive
statistics were calculated for the group as a whole and the results presented.
In addition, Spearman rank correlation coefficients were calculated for the
correlation of change scores on each distance of the FMS with the FAQ over
each time period for the group as a whole. Spearman’s rho is a non-parametric
analog of the Pearson r (Siegel and Castellan 1988). It is appropriate for use
with categorical data such as the FMS and FAQ and is a measure of association

Chapter 6 – Responsiveness
170
(Norman and Streiner 2000). Spearman correlation coefficients were calculated
after change scores for the FMS and FAQ were grouped into no change,
improved (change up) or deteriorated (change down).
Descriptive change score statistics were also calculated for the group who
underwent SEMLS in isolation and compared with the group who had
botulinum toxin injections in isolation. This comparison was performed as
potential further evidence of the responsiveness of the FMS. Clinical experience
suggests that children who have botulinum toxin injections do not change
dramatically in their mobility status afterwards. On the other hand, the mobility
of children who have multilevel surgery does change significantly, initially for
the worse and then for the better throughout the post-operative period (Harvey
et al 2007). Not only is it important that the FMS is able to detect change where
it actually occurs, it is important to show that it shows no change in mobility
status when the child does not change.
The data were stored and organized using the EpiData for Windows program
(http://www.epidata.dk/.). All analyses were performed using Stata [StataCorp
2005 Stata statistical software Release 9.0. College Station; TX. Stata Press.].
6.3. Results
6.3.1. Descriptive results of participants
A total of 96 children were recruited for the study. Nine children dropped out of
the study throughout the course of follow-up assessments. This was due to
parents not returning the FAQ in the mail. Three children were recruited and
subsequently did not have their intervention. This left a sample size of 84
children.
Of the remaining 84, the age range was 2-16 years with a mean age of 8.8 years
(SD 3.28). There were 59 males and 25 females. Eight children had hemiplegia,
63 had diplegia and 13 had quadriplegia. The spread of GMFCS levels pre-
operatively was; 10 children level I, 31 children level II, 35 children level III

Chapter 6 – Responsiveness
171
and 8 children level IV. Table 6.1 summarises the descriptive characteristics of
the sample.
Table 6.1 Participant characteristics
Characteristic
n 84
Age (y,m), mean (SD) Total 8.8 (3.3)
Sex, n (%) Male 59 (70%)
Female 25 (30%)
GMFCS, n (%) I 10 (12%)
II 31 (37%)
III 35 (42%)
IV 8 (9%)
Topography Hemiplegia 8 (9%)
Diplegia 63 (75%)
Quadriplegia 13 (16%)
The numbers of children within each category of intervention were;
i. 24 (29%) with bilateral SEMLS (diplegia)
ii. 25 (30%) with botulinum toxin injections
iii. 35 (41%) with other types of surgery including; unilateral SEMLS,
adductor lengthening and Phenol injections, VDRO’s, single and two
level surgery.
All children were used to show change for the group as a whole and for
correlations of change scores between the FMS and FAQ. The children who had
SEMLS and Botulinum toxin injections were separated out to calculate
percentage of those who changed at each post-intervention time point.
6.3.2. Descriptive statistics of change scores
The children were grouped according to those who showed no change, those
who changed up one or more level (changed for the better) and those who
changed down one or more level (changed for the worse). The children were
grouped into change up or down based on the earlier decision that change of at
least one level on the FMS was clinically meaningful. The percentage of

Chapter 6 – Responsiveness
172
children in each of those categories at each post-operative time point (compared
to baseline) were calculated and these figures are presented in Table 6.2.
This table shows that for the group as a whole there were more than 50% of
children who did not change at each time point on the FMS. On the FAQ there
was more change at each time point with less than 50% of children showing no
change. For the group, there were more children showing deterioration than
improvement at the first post-operative time point compared to pre-operatively.
There were a relatively even number of children who deteriorated and improved
at the second post-operative time point. More children improved than
deteriorated at both the third and fourth post-operative time points.
Table 6.2 Percentage of children in change categories for the FMS and FAQ at
post-intervention time points
Time 1st time-pre 2
nd time-pre 3
rd time-pre 4
th time-pre
Change 0 ↓ ↑ 0 ↓ ↑ 0 ↓ ↑ 0 ↓ ↑
All children
(n=84)
5 60 33 7 74 14 12 73 8 19 65 15 20
50 57 38 5 67 17 16 60 13 27 63 13 24
500 67 27 6 70 12 18 71 9 20 85 6 9
FAQ 40 47 13 49 24 27 45 19 36 30 22 48
SEMLS
(n=24)
5 29 62 9 54 34 12 50 21 29 52 24 24
50 37 59 4 58 25 17 59 12 29 52 10 38
500 42 50 8 54 26 20 59 16 25 81 14 5
FAQ 25 67 8 52 26 22 44 26 30 24 23 53
BOTOX
(n=25)
5 88 4 8 92 4 4 88 0 12 74 9 17
50 84 12 4 80 4 16 71 8 21 74 13 13
500 96 4 0 100 0 0 96 0 4 92 0 8
FAQ 64 20 16 64 12 24 50 13 37 39 17 44
0; no change, ↓; changed down (worse), ↑; changed up (better)
When the children who had SEMLS were compared with those who had
Botulinum toxin injections, a definite pattern emerged. For each time point post-
operatively there were a greater number of children who showed no change on
the FMS and FAQ in the Botulinum toxin group. More children who had
SEMLS showed change; particularly at the first time point-postoperatively
where more than 50% of children deteriorated on all three FMS distances. By

Chapter 6 – Responsiveness
173
the third post-operative time point (9 months after SEMLS) more children were
showing improvement than deterioration. In contrast, many of the children who
had botulinum toxin injections showed no change, particularly for the 500 metre
FMS distance. The FAQ followed similar patterns, albeit with less children
showing no change.
The changes seen in the children who had SEMLS compared to those who had
Botulinum toxin can be seen clearly in Figures 6.1-6.6. The bar graphs in
Figures 6.1-6.3 show that the mobility status of children as measured by the
FMS in many children did not change following Botulinum toxin injections,
particularly for the 5 and 500 metre distances. The bar graphs in Figures 6.4-6.6
tell a different story with more children showing change in mobility status
following SEMLS, particularly the deterioration (change down) at the first post-
operative time point. On these graphs, no change represents the percentage of
children who did not change compared with pre-operatively. Up represents the
percentage of children who improved one or more level compared with pre-
operatively, for example changed from using a walker to using crutches. Down
represents the percentage of children who deteriorated one or more level
compared to pre-operatively, for example changed from using a walker to using
a wheelchair.
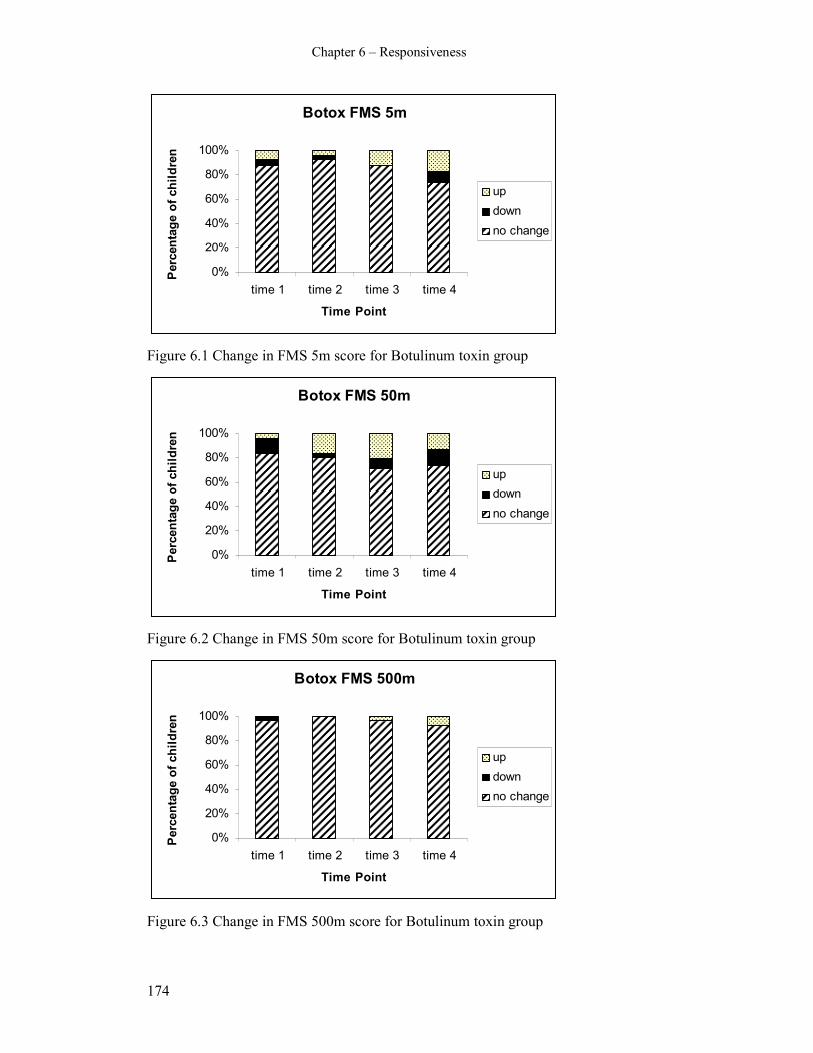
Chapter 6 – Responsiveness
174
Botox FMS 5m
0%
20%
40%
60%
80%
100%
time 1 time 2 time 3 time 4
Time Point
Percentage of children
up
down
no change
Figure 6.1 Change in FMS 5m score for Botulinum toxin group
Botox FMS 50m
0%
20%
40%
60%
80%
100%
time 1 time 2 time 3 time 4
Time Point
Percentage of children
up
down
no change
Figure 6.2 Change in FMS 50m score for Botulinum toxin group
Botox FMS 500m
0%
20%
40%
60%
80%
100%
time 1 time 2 time 3 time 4
Time Point
Percentage of children
up
down
no change
Figure 6.3 Change in FMS 500m score for Botulinum toxin group

Chapter 6 – Responsiveness
175
SEMLS FMS 5m
0%
20%
40%
60%
80%
100%
time 1 time 2 time 3 time 4
Time Point
Percentage of children
up
down
no change
Figure 6.4 Change in FMS 5m score for SEMLS group
SEMLS FMS 50m
0%
20%
40%
60%
80%
100%
time 1 time 2 time 3 time 4
Time Point
Percentage of children
up
down
no change
Figure 6.5 Change in FMS 50m score for SEMLS group
SEMLS FMS 500m
0%
20%
40%
60%
80%
100%
time 1 time 2 time 3 time 4
Time Point
Percentage of children
up
down
no change
Figure 6.6 Change in FMS 500m score for SEMLS group

Chapter 6 – Responsiveness
176
6.3.3. Correlations between change scores on the FMS and FAQ
The results of the Spearman rank correlation coefficients for all children are
presented in Table 6.3. This table shows that the correlation coefficients were
generally low with only six comparisons statistically significant. Change scores
on the FAQ were associated significantly with change scores on the FMS for the
5, 50 and 500 metre distances in the first time period post-operatively and for 50
metres at the third and fourth post-operative stages.
Table 6.3 Correlations of change scores between the FMS and FAQ
Change period FMS distance Rho p value
5 0.28 0.0088*
50 0.36 0.0007*
Change from first post-
op stage to pre-op
500 0.23 0.04*
5 0.17 0.1282
50 0.18 0.1075
Change from second
post-op stage to pre-op
500 0.06 0.6016
5 0.01 0.5815
50 0.26 0.03*
Change from third post-
op stage to pre-op
500 0.04 0.7391
5 0.05 0.7279
50 0.29 0.05*
Change from fourth post-
op stage to pre-op
500 0.22 0.14
* denotes statistically significant result
Although these showed associations, the correlations were low, with the highest
correlation 0.36. The Spearman correlations examined the association between
change scores on the two measures. There would be a trend towards low
coefficients where there were a higher percentage of children showing no
change. This may explain some of the very low correlations.
6.4. Discussion
6.4.1. Responsiveness of the FMS
The results of this study provide some evidence of responsiveness to change of
the FMS. The descriptive results of the change scores demonstrated more
change in children following SEMLS compared to those having botulinum toxin
injections. The correlations of change scores on the FMS with the FAQ were

Chapter 6 – Responsiveness
177
lower than expected. There are a number of potential reasons why these
correlations were low and these will be explored below. Although this study
adds to the evidence of responsiveness of the FMS, it has also highlighted issues
in assessing and reporting responsiveness, suggesting further investigations are
required.
The differences in changes reported for the children having SEMLS and those
having botulinum toxin injections are important for demonstrating that the FMS
is able to detect both change and stability in the mobility status of children with
CP. In order for a measure to be responsive, it is necessary for it to be able to
detect clinically important change as well as show no change where status of the
concept in question is stable (Husted et al 2000). The results of this study
support the ability of the FMS to detect different levels of mobility changes in
children with CP after different interventions.
The low correlations of change scores of the FMS and FAQ possibly reflect the
differences between the two measures. The walking scale of the FAQ is a one
item 10 level ordinal scale where one category is chosen to reflect the child’s
usual walking ability. The FMS is a six level ordinal scale with three different
items reporting three different levels of mobility according to environmental
setting. The FAQ is a parent report measure and is completed by the parent. The
FMS is a clinician interpretation of child or parent report and is administered by
the clinician asking a few questions of the child or parent. Although they are
both measuring mobility, the methods of reporting differ. Correlations were
performed for all three FMS items with the FAQ. It is interesting to note that
there were higher correlations of the FAQ with the 50 metre FMS distance. This
suggests that of the three FMS distances, the 50 metre distance is most closely
related to the FAQ.
The greater number of levels to select from on the FAQ may have resulted in a
higher variability of categories chosen. This is reflected in the results with an
overall smaller percentage of children showing no change on the FAQ
compared to the FMS. With more categories to choose from there is a smaller
chance of selecting the same category each time. Low correlations of change

Chapter 6 – Responsiveness
178
scores between the FMS and FAQ were shown in this study despite good
concurrent validity of the two measures as shown in Chapter Eight of this thesis.
Spearman correlation coefficients of the FAQ with FMS 5 metres was 0.69,
0.76 for the 50 metre distance and 0.79 for 500 metres (see Chapter Eight). This
suggests that in stable conditions the two scales are measuring similar
constructs, yet in detecting change over time they have differing abilities.
The FAQ was chosen as an external criterion to demonstrate change in mobility.
The differences in how and what the scale measures compared to the FMS may
suggest that it is not the most ideal external criterion to use. The biggest
difference between the two is that children can improve or deteriorate in
mobility as measured by the FMS and remain in the same category on the FAQ.
This is because the FAQ does not consider the different assistive devices the
children use. For example, if a child progresses from using a walker to using
crutches around the home and at school following orthopaedic surgery they will
go up a level on the FMS (from 2 to 3) for the 5 and 50 metre distances. It is
quite likely that their FAQ level will remain the same because the change in
assistive device will not be picked up by the FAQ. This implies that although
both scales are measuring mobility, their underlying constructs are different and
in fact they are measuring different aspects of mobility. There is, however, no
other scale or measure that can be considered a “gold standard” for mobility that
is equivalent to the FMS to use as an alternative external criterion.
A weakness of relying on an external standard to assess responsiveness is that a
new outcome measure, such as the FMS, may be designed specifically because
it reflects a different aspect than currently available measures (Husted et al
2000). This may be a reason why studies choosing to use an external criterion to
assess responsiveness have previously chosen parental or clinician rating of
change as an external criterion over using a different measurement tool.
Other methods of assessing responsiveness that do not require the use of an
external criterion, such as effect size and standardised response means, are not
appropriate for categorical data. These methods tend to assess the magnitude of
treatment effect rather than the ability of the tool to detect clinically important
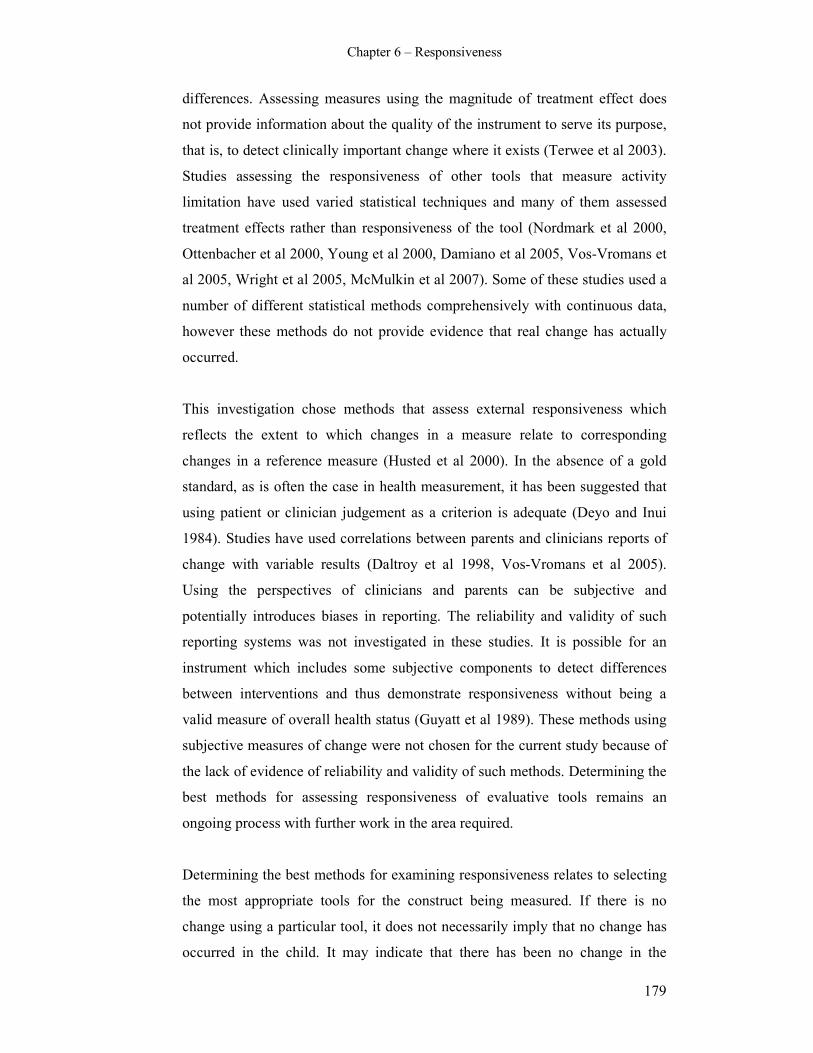
Chapter 6 – Responsiveness
179
differences. Assessing measures using the magnitude of treatment effect does
not provide information about the quality of the instrument to serve its purpose,
that is, to detect clinically important change where it exists (Terwee et al 2003).
Studies assessing the responsiveness of other tools that measure activity
limitation have used varied statistical techniques and many of them assessed
treatment effects rather than responsiveness of the tool (Nordmark et al 2000,
Ottenbacher et al 2000, Young et al 2000, Damiano et al 2005, Vos-Vromans et
al 2005, Wright et al 2005, McMulkin et al 2007). Some of these studies used a
number of different statistical methods comprehensively with continuous data,
however these methods do not provide evidence that real change has actually
occurred.
This investigation chose methods that assess external responsiveness which
reflects the extent to which changes in a measure relate to corresponding
changes in a reference measure (Husted et al 2000). In the absence of a gold
standard, as is often the case in health measurement, it has been suggested that
using patient or clinician judgement as a criterion is adequate (Deyo and Inui
1984). Studies have used correlations between parents and clinicians reports of
change with variable results (Daltroy et al 1998, Vos-Vromans et al 2005).
Using the perspectives of clinicians and parents can be subjective and
potentially introduces biases in reporting. The reliability and validity of such
reporting systems was not investigated in these studies. It is possible for an
instrument which includes some subjective components to detect differences
between interventions and thus demonstrate responsiveness without being a
valid measure of overall health status (Guyatt et al 1989). These methods using
subjective measures of change were not chosen for the current study because of
the lack of evidence of reliability and validity of such methods. Determining the
best methods for assessing responsiveness of evaluative tools remains an
ongoing process with further work in the area required.
Determining the best methods for examining responsiveness relates to selecting
the most appropriate tools for the construct being measured. If there is no
change using a particular tool, it does not necessarily imply that no change has
occurred in the child. It may indicate that there has been no change in the
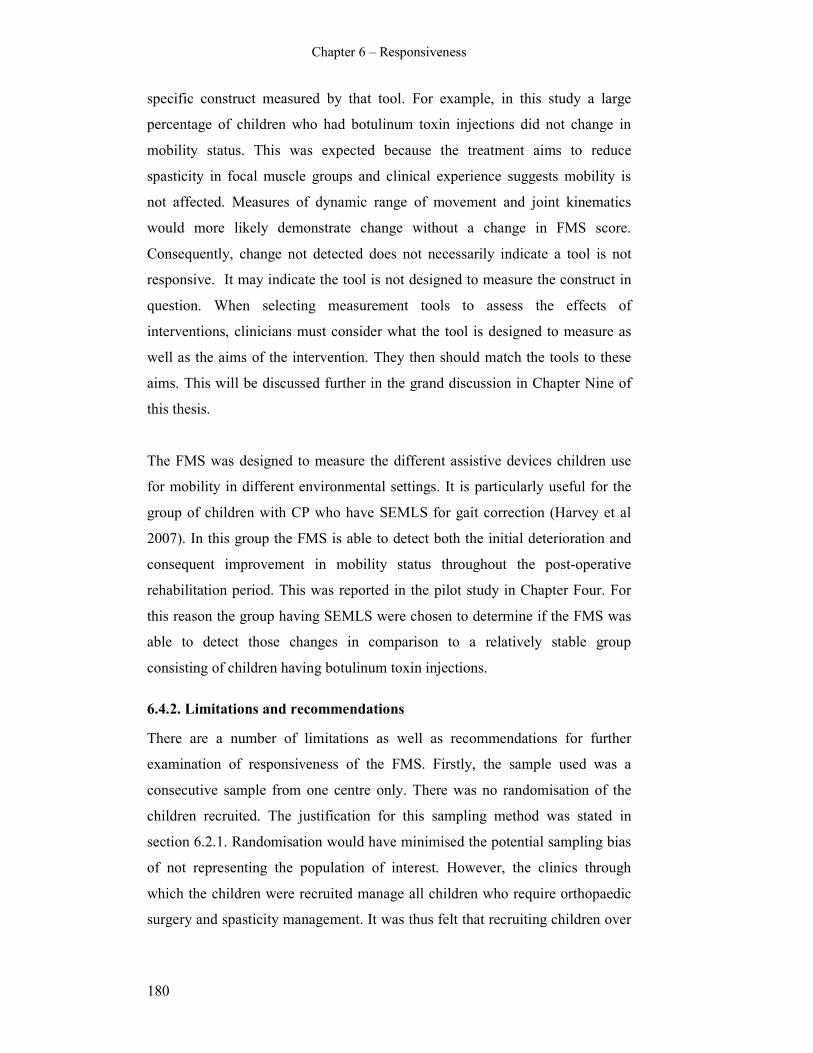
Chapter 6 – Responsiveness
180
specific construct measured by that tool. For example, in this study a large
percentage of children who had botulinum toxin injections did not change in
mobility status. This was expected because the treatment aims to reduce
spasticity in focal muscle groups and clinical experience suggests mobility is
not affected. Measures of dynamic range of movement and joint kinematics
would more likely demonstrate change without a change in FMS score.
Consequently, change not detected does not necessarily indicate a tool is not
responsive. It may indicate the tool is not designed to measure the construct in
question. When selecting measurement tools to assess the effects of
interventions, clinicians must consider what the tool is designed to measure as
well as the aims of the intervention. They then should match the tools to these
aims. This will be discussed further in the grand discussion in Chapter Nine of
this thesis.
The FMS was designed to measure the different assistive devices children use
for mobility in different environmental settings. It is particularly useful for the
group of children with CP who have SEMLS for gait correction (Harvey et al
2007). In this group the FMS is able to detect both the initial deterioration and
consequent improvement in mobility status throughout the post-operative
rehabilitation period. This was reported in the pilot study in Chapter Four. For
this reason the group having SEMLS were chosen to determine if the FMS was
able to detect those changes in comparison to a relatively stable group
consisting of children having botulinum toxin injections.
6.4.2. Limitations and recommendations
There are a number of limitations as well as recommendations for further
examination of responsiveness of the FMS. Firstly, the sample used was a
consecutive sample from one centre only. There was no randomisation of the
children recruited. The justification for this sampling method was stated in
section 6.2.1. Randomisation would have minimised the potential sampling bias
of not representing the population of interest. However, the clinics through
which the children were recruited manage all children who require orthopaedic
surgery and spasticity management. It was thus felt that recruiting children over

Chapter 6 – Responsiveness
181
a 12 month period through these clinics would be a fair representation of
children.
The sample used comprised children with CP, aged 2-18 years and classified as
GMFCS level I-IV. There was a higher representation of children with spastic
diplegia as well as those classified as GMFCS levels II or III. This reflects the
demographic of children who are appropriate for spasticity management and
orthopaedic surgery for gait correction. The results of this study can therefore
only be generalised to this age group and this demographic of children. Also,
the children within each group were different due to the type of intervention
they received. As a result, the children in the spasticity management group were
younger and more likely to be susceptible to natural change and development.
Further investigations of the responsiveness of the FMS should involve children
from different centres; with a more even spread of GMFCS levels that represent
the population of children with CP. It is also important to demonstrate that the
FMS is able to detect changes in mobility after other treatments such as
physiotherapy and other forms of spasticity management as well as changes that
occur as the children grow and develop over time that are not related to
interventions. This would involve both improvements as children gain motor
skills as well as potential deterioration as they develop increased spasticity,
muscle contractures and bony deformities.
The FMS is measured on a categorical scale and this limits the range of
statistical methods that can be used to analyse the data for responsiveness.
Methods using an external criterion (the FAQ) were chosen as well as
descriptive statistics on the percentage of children who changed. The results
suggest the FAQ is not the most appropriate external criterion because it
measures different constructs to the FMS. A more suited external criterion may
have resulted in higher correlations of change scores. The FAQ was chosen
because, like the FMS, it measure mobility in isolation. In hindsight,
consideration of other tools such as the mobility domains of the PEDI (Haley et
al 1992) or the ASK (Young et al 1995) may have been more suitable as an
external criterion to correlate with the FMS.

Chapter 6 – Responsiveness
182
As well as considering different options for an external criterion, the results may
have been strengthened by using ROC curves for the data analysis. They were
not used in this study because of a lack of a defined stable group of participants
to which change could be compared. The children having botulinum toxin were
chosen as a group that would show less change than those having SEMLS,
however this was based on clinical experience only. There is no direct evidence
to suggest this group is completely stable in their mobility status following the
injections. In hindsight, this study could have used a group of children having
no interventions (a stable group) to compare with children having various
interventions. Receiver operating characteristic curves could then have been
calculated to determine the responsiveness of the FMS. Another option for
categorical data is to use regression models to determine external
responsiveness (Husted et al 2000).
For the purpose of this study, the MCID of the FMS was determined prior to
data collection and analysis and defined as one level up or down on the FMS.
This was determined by consensus of three clinicians with extensive experience
in FMS administration. In the absence of a “gold standard” of what represents a
real change in clinical status (Deyo and Inui 1984), this method was considered
appropriate for the current study. Future investigation of what is considered a
MCID for the FMS could involve consensus methods using a larger number and
range of clinicians from different centres who have some experience of using
the FMS.
6.5. Conclusion
The FMS was able to detect changes in mobility in children with CP as defined
by one level of improvement or deterioration. The FMS was able to detect more
change in children who had SEMLS compared to those who had botulinum
toxin injections. Correlations of change scores with an external criterion were
low; however this may reflect the properties of the criterion chosen rather than
the responsiveness of the FMS itself. This study provides some evidence of the
ability of the FMS to detect clinically important change. Further investigations
are required into the responsiveness of the FMS to ensure that this essential
property of an evaluative measure is evident in a range of clinical settings.
Chapter 6 – Responsiveness
183
CHAPTER SEVEN: OBSERVATION OF MOBILITY IN
CHILDREN WITH CEREBRAL PALSY: A STUDY OF
CONSTRUCT VALIDITY OF THE FUNCTIONAL
MOBILITY SCALE
7.1. Introduction
The primary aim of this chapter is to describe the methodology and results of an
investigation of one aspect of construct validity of the FMS by comparing usual
administration of the scale with direct observation. Construct validity refers to
the extent to which scores on a particular instrument relate to other measures in
a manner consistent with theoretically derived hypotheses concerning the
concepts that are being measured (Kirschner and Guyatt 1985, Streiner and
Norman 2003). A construct is the extent to which a variable is abstract rather
than concrete (Nunnally 1978) and is often thought of as a “mini-theory” to
explain the relationships among various behaviours or attitudes (Streiner and
Norman 2003).
Construct validation involves a hypothesized relationship between a supposed
measure of a construct and a particular observable variable (Nunnally 1978). It
involves specifying the domain of observables related to the construct,
determining the extent to which the observables tend to measure the same thing,
and performing studies to determine the extent to which measures of the
construct produce results which are predictable from the theoretical hypotheses
concerning the construct (Nunnally 1978). Construct validity can be assessed by
testing predefined hypotheses about expected correlations between measures or
expected differences in scores between known groups (Terwee et al 2007). It
often involves theorizing intuitively how the variables relate to one another and
usually comes down to circumstantial evidence for the usefulness of a new
measurement method (Nunnally 1978).
For the FMS, the construct is mobility, with particular reference to the amount
of assistance required for mobility in different environmental settings. Uniquely,

Chapter 7 – Construct Validity
184
the FMS measures how the same child might use more than one method of
mobility as determined by the environmental setting. The FMS is a clinician
interpretation of self-report performance measure and direct observation is not
involved. There is an assumption that administration of the FMS through child
or parent report will accurately reflect the true performance of the child in his or
her usual environments, however this has not been established. Other measures
that rely on child or parent report include the FAQ (Novacheck et al 2000), the
ASK (Young et al 1995) and the two health related quality of life tools, the
CHQ (Landgraf et al 1996) and PODCI (Daltroy et al 1998). These tools use
self-report to obtain the perspectives of the child and/or parent while assuming
that what is reported reflects what is really happening. Other scales such as the
PEDI (Haley et al 1992) and WeeFIM (Msall et al 1994) use a combination of
observation and parent or clinician report. Tools that use direct observation
only, such as the GMFM (Russell et al 1989), usually measure capability rather
than performance and the observation occurs in the clinical setting.
Testing of construct validity of the FMS is required to ensure that it is
measuring what is actually occurring in the different environments of home,
school and community. It is also necessary to establish that it is based on the
different assistive devices children use in those different settings. One way to
determine if the scale is measuring what it is intended to measure is to compare
the self-reported FMS rating with direct observation of the mobility methods
children use in their own environments. Because validation is an ongoing
process, one study alone cannot empirically determine construct validity
(Streiner and Norman 2003). Other studies within this thesis, reported in
Chapters Six and Eight, also contribute to construct validity. These results will
be synthesized in the grand discussion. Although a previous study attempted to
examine construct validity of the FMS, the authors were examining change in
mobility status after surgery rather than testing predetermined hypotheses about
theoretical constructs (Graham et al 2004). Results from the examination of
concurrent validity in the Graham study add to the evidence of convergence and
divergence of the FMS; however the concepts that form the basis of the FMS
have not been adequately examined.
Chapter 7 – Construct Validity
185
The research question of the current study was “does the information obtained
from the FMS via self-report of the assistance required in the different settings
of the home, school and community accurately reflect the mobility status of
children with CP”.
The main aim was to examine one aspect of construct validity of the FMS in a
group of children with CP by comparing FMS ratings performed by usual
method with direct observation at home and school. This was to determine if the
FMS reflects the actual mobility status reported. A secondary aim was to
describe the different mobility methods the children used as a group and
individually.
The a priori hypothesis was “the mobility status of children with CP observed
within the environmental settings of home, school and the community agrees
with the self-report rating of the FMS with agreement of at least 0.6 using kappa
statistics”. The value of 0.6 was chosen based on guidelines that kappa statistics
of 0.61 and higher represent substantial to almost perfect agreement (Landis and
Koch 1977).
The secondary hypothesis was that “children with CP use different types of
mobility methods in the different environmental settings of home, school and
community”.
7.2. Method
7.2.1. Participants
The inclusion criteria for children involved in this study were those:
i. with CP aged between 4-18 years
ii. classified as GMFCS levels I-IV
iii. who were clients of the Royal Children’s Hospital, Victoria, Australia
iv. who attended Nepean Special School, Victoria, Australia
The first and second inclusion criteria are in accordance with the population the
FMS was devised for. This has been justified in Chapter 4 (section 4.2.1). The
Chapter 7 – Construct Validity
186
children were required to be clients of The Royal Childrens Hospital, Victoria
because this was where participants were recruited from. This study involved
observing children at home and at school. One special school, Nepean School,
was targeted for recruitment of participants. This was to ensure it was feasible to
observe enough children with CP at school and at home within the time
constraints of the thesis. For the one school utilized it was necessary that the
school have a large enough group of children with CP attending it to guarantee
adequate recruitment of participants. Using a special school assured this. Of the
special schools attended by children with CP from The Royal Childrens
Hospital that were appropriate, the staff at Nepean School were the first to
consent for the study to take place there. Nepean School is a special school in
Victoria, Australia. The children who attend there have significant cognitive or
behavioural impairments which preclude them from being integrated into
mainstream schools. Many of them also have significant physical impairments.
The population of children at the school tends to include more children
classified as GMFCS level IV than the usual CP population.
Excluded were children:
i. younger than 4 years and older than 18 years
ii. classified as GMFCS level V
iii. with a diagnosis other than CP
iv. whose parents were not able to understand the information explaining the
study or instructions due to language, cognitive or other difficulties.
Children younger than 4 years or older than 18 years and with a diagnosis other
than CP were excluded because the FMS was developed for children with CP
aged 4-18 years. Children classified as GMFCS level V were excluded also
because the scale is not appropriate for use with them. This has been explained
more comprehensively in Chapter 4 (section 4.2.1) and in Chapter 5 (section
5.2.1.2). Children whose parents were not able to understand due to language or
cognitive difficulties were excluded if they could not fully comprehend what
was required.
Chapter 7 – Construct Validity
187
This investigation was a feasibility study to examine one aspect of construct
validity. The study aimed to obtain some preliminary data on construct validity
from which further studies could be developed. An ideal sample size would
have been more than 72. This is based on an equation of 2c2 (Norman and
Streiner 2000). Using this equation c is the number of categories within a scale.
There are 6 categories in the FMS, therefore 2 x 62 = 72. Because each child was
required to be observed at home and school by a physiotherapist a sample size
of 20 was aimed for. This smaller sample size allowed adequate time for
recruiting the children through the hospital who attended the school and for the
direct observations to occur. It was unrealistic and impractical to attempt to
recruit more than this given the amount of time it would take to complete all
assessments within the time constraints.
7.2.2. Procedures
The study was accepted by the Ethics in Human Research Committee of the
Royal Children’s Hospital (reference number 25118A) and the University of
Melbourne Human Ethics Research Committee (number 060211). Approval for
the study was also obtained from the Department of Education and Training
(Victoria), the Regional Director for the Southern Metropolitan Region and the
school principal.
7.2.2.1 Recruitment
Recruitment of participants was via a sample of convenience. A sample of
convenience was used so that all children who attended Nepean School and
were clients of the Royal Children’s Hospital had a chance to participate. It was
also necessary to use this method to ensure an adequate sample size was
obtained as only one recruitment centre was utilized. This school was selected
because many of the children who attended there also attended the CP clinics or
gait laboratory of the hospital and the children represented a range of severity of
motor impairment as classified by GMFCS levels. The primary investigator
obtained a list of eligible children from the physiotherapist employed by the
school (JH). The parents of these children were sent a letter in the mail
explaining the study and inviting them to participate. A stamped, self-addressed
envelope was included in that letter for the parents to return their consent to

Chapter 7 – Construct Validity
188
participate. These returned forms designated the children to be included in the
sample. All children whose parents agreed for them to be involved in the study
had signed consent forms.
7.2.2.2 Testing procedure
There were three stages to data collection:
i. obtaining an FMS rating over the telephone as per usual administration of
the scale by an independent experienced physiotherapist
ii. direct observation of the child at school by the principal investigator
iii. direct observation of the child at home and in outside the home by one of
two Nepean school physiotherapists.
The FMS ratings obtained over the telephone for each child were administered
by one person (AF). This person was a physiotherapist working within the gait
laboratory of The Royal Childrens Hospital who was experienced in the use of
the FMS. She was independent of the study and the school and did not have
knowledge of the mobility status of the children. This ensured impartiality.
Ratings for all children were performed over the telephone with a parent or
guardian and recorded on a form. The person administering and recording these
ratings had no further involvement in the study.
Direct observation of the children at school was executed by the primary
investigator (AH). She attended the school for one entire school day and directly
observed the children moving around and recorded methods of mobility used.
The distances and settings observed for each child were:
i. from the bus to the classroom,
ii. within the classroom,
iii. from classroom to classroom and
iv. around the playground.
These four activities were selected because they represent the different settings
and situations at school children might be required move around in order to
participate within the school environment. A checklist on a recording sheet was

Chapter 7 – Construct Validity
189
composed for the observer to record the method of mobility the children used
for each activity (see Appendix F). The possible different methods included:
i. wheelchair
ii. walker
iii. crutches
iv. sticks
v. holds hands or walls
vi. independent walking (uses rails for stairs)
vii. independent walking (no rails for stairs)
viii. is carried
ix. crawls
These methods were chosen to reflect the categories on the FMS and to
represent the typical range of methods children with CP might use to move from
one place to another. Also recorded on the checklist were details including date
of birth and age, GMFCS level, type of assistive devices used and approximate
dimensions of the relevant areas the children moved around. While attending the
school the observer attempted to quietly observe and record the children
unobtrusively without disrupting or changing their “usual” routine. It was
important to record what the children usually did rather than what they could do,
so that a record of performance rather than capability was obtained to reflect the
purpose of the FMS.
The home observations were performed by the two physiotherapists from
Nepean School (JH and MH). These observers were employed because the
parents were familiar with them and were more likely to accept them entering
their homes. The children themselves would also be more relaxed with their
school physiotherapist visiting them at home. Similar to the school observations,
the aim of the home visit was to observe how the children chose to move around
rather than best effort. It is not uncommon for school physiotherapists to
perform home visits and it was felt that it was more likely to obtain a true
performance observation utilising the school physiotherapist rather than with an
unfamiliar clinician.

Chapter 7 – Construct Validity
190
Each child was visited at home by one of the physiotherapists who observed the
children moving around the home environment and outside the home. A similar
checklist with the same options of mobility methods was devised for the home
visits for the observers to record the methods used (see Appendix G). The areas
within the house recorded were
i. from room to room
ii. within one room
iii. outside the home
Once the child had been observed inside the home, the physiotherapist asked the
child to venture outside and travel more than 150 metres where possible and
practical, for example, down to the shop or around the block. This information
was aimed at providing data to compare with the 500 metre FMS score. All
attempts were made to ensure the children were moving around as they would
usually choose to, rather than giving their best effort because they were being
watched. The observers attempted to take the focus off how they moved,
explaining it was the place and distance that were important, not which method
they chose.
Each child had one rating performed over the telephone and was observed once
at school and once at home. For all three stages of data collection, the various
observers and raters were independent of previous information collected by
others and did not have access to each others information observed and
recorded.
The information obtained from the school and the home observations was used
to generate an “observed” FMS score. To generate this, the “within one room”
category for the home observation was used for the 5 metre distance and the
“outside the home” category was used for the 500 metre distance. At school the
“from class to class” category was used for the 50 metre distance. Within the
class was not used from the school observation because this is a similar distance
to within the home. The playground was not used for the 50 metre distance
because those distances were often greater than 50 metres. All methods used
were recorded to provide details of the variety and number of methods used in

Chapter 7 – Construct Validity
191
each environment and the number of different methods used by each child. The
“observed FMS” score was compared to the “telephone FMS” score for the data
analysis.
7.2.3. Data Analysis
Descriptive statistics of participant characteristics were obtained using means
and standard deviations for continuous variables or frequency and percentages
for categorical variables. Descriptive statistics were used to illustrate the
number and types of various methods of mobility the children used. The number
and variety of methods for each child was recorded as well as for the group as a
whole.
Kappa statistics with 95% confidence intervals were used to analyse agreement
between the “telephone FMS” obtained by usual administration method and the
“observed FMS” generated from the observations. The data obtained was
categorical, therefore the kappa statistic to examine agreement is the most
appropriate method of analysis for agreement (Tooth and Ottenbacher 2004).
Data analysis involved the use of unweighted kappa statistics based on the
justification in Chapter Five (section 5.2.3) that disagreement of 1 level on the
FMS is clinically significant and should be factored into the analysis. The basic
or unweighted Kappa considers all disagreements in ratings as equal in
seriousness (Tooth and Ottenbacher 2004). Quadratic weighted kappas were
also calculated as a comparison.
The data were stored and organized using the EpiData for Windows program
(http://www.epidata.dk/.). All analyses were performed using Stata [StataCorp
2005 Stata statistical software Release 9.0. College Station; TX. Stata Press.].

Chapter 7 – Construct Validity
192
7.3. Results
7.3.1. Descriptive results
7.3.1.1 Participant characteristics
Twenty seven children were eligible to enter the study based on the inclusion
and exclusion criteria. The parents or guardians of 18 of those 27 children
agreed for their child to be part of the study. There was no reply from the
parents or guardians of the remaining 9 children. The sample of 18 included 7
females and 11 males. The age range was 8.5 to 17 years (mean 12.7 and SD
2.63). There were 5 children classified as GMFCS level II, 4 as level III and 9
as level IV. Table 7.1 summarises the participant characteristics. The mode of
FMS scores based on the telephone ratings was level 1 for 5 metres with 6
children using a wheelchair around the home, level 1 for 50 metres with 8
children using a wheelchair at school and 1 for 500 metres with 15 children
using a wheelchair in the community.
Table 7.1 Participant characteristics
Characteristic
Total number 18
Age (yrs) mean (SD), range 12.7 (2.63), 8.5-17
Gender, n (%) male 11 (61%)
female 7 (39%)
GMFCS, n (%) II 5 (28%)
III 4 (22%)
IV 9 (50%)
7.3.1.2 Timing of ratings and observations
The time between FMS ratings performed over the telephone and direct
observation at home and school varied. The mean time between the home
observation and the FMS rating was 10.2 days (SD 5.44) with a range of 0-17
days. Nine children (50%) had the rating and observation performed within 10
days apart. There was an interval of 11-17 days for the remaining 9 children.
The mean time between the school observation and the FMS rating was 20.9
days (SD 6.36) with a range of 14-40 days. Thirteen (72%) of the children had
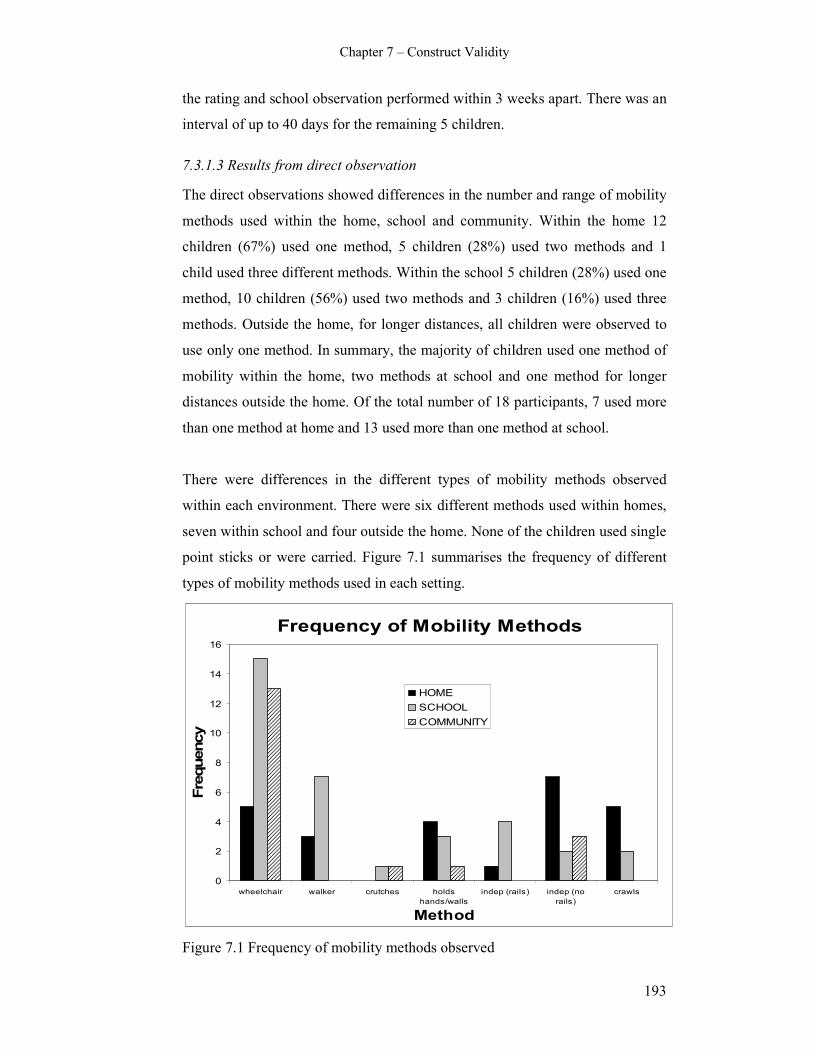
Chapter 7 – Construct Validity
193
the rating and school observation performed within 3 weeks apart. There was an
interval of up to 40 days for the remaining 5 children.
7.3.1.3 Results from direct observation
The direct observations showed differences in the number and range of mobility
methods used within the home, school and community. Within the home 12
children (67%) used one method, 5 children (28%) used two methods and 1
child used three different methods. Within the school 5 children (28%) used one
method, 10 children (56%) used two methods and 3 children (16%) used three
methods. Outside the home, for longer distances, all children were observed to
use only one method. In summary, the majority of children used one method of
mobility within the home, two methods at school and one method for longer
distances outside the home. Of the total number of 18 participants, 7 used more
than one method at home and 13 used more than one method at school.
There were differences in the different types of mobility methods observed
within each environment. There were six different methods used within homes,
seven within school and four outside the home. None of the children used single
point sticks or were carried. Figure 7.1 summarises the frequency of different
types of mobility methods used in each setting.
Frequency of Mobility Methods
0
2
4
6
8
10
12
14
16
wheelchair walker crutches holds
hands/walls
indep (rails) indep (no
rails)
crawls
Method
Frequency
HOME
SCHOOL
COMMUNITY
Figure 7.1 Frequency of mobility methods observed

Chapter 7 – Construct Validity
194
The percentages quoted below are the percentage of total number of different
methods for each setting, not the percentage of children, because some children
used more than one method. Within the home the most used method was
independent walking not requiring rails (28%), followed by crawling (20%) and
wheelchair (20%). Other methods included using a walker (12%), holding hands
(16%) and independent walking requiring rails for stairs (4%). Within the
school the method most used was wheelchair (44%) followed by walkers (21%).
Other methods included independent using rails for stairs (11%), holding hands
or walls (9%) and to a much lesser extent crawling, crutches and independent
with no rails. Outside the home for longer distances the method most used was
wheelchair (72%). Independent walking without rails, holding hands and
crutches were used by a very small number of children.
There were some subtle differences in number of mobility methods within each
environmental setting according to the GMFCS level of the children. This is
summarized in table 7.2.
i. GMFCS II. Children in GMFCS level II used mainly one method in the
home (4 of 5 children) and two methods in the school (3 of 5 children).
The home method was predominantly independent walking and the school
methods were independent walking or walking holding onto walls or
hands.
ii. GMFCS III. Children in GMFCS level III used mainly one method at
home (3 of 4 children) and three methods at school (3 of 4 children). The
methods used at home were independent walking, walker, crawling and
wheelchair. The methods used at school were walker, crutches,
wheelchair, and holding hands or walls.
iii. GMFCS IV. Children in GMFCS level IV used between one and two
methods at home (5 used one and 4 used two) and mainly two methods at
school (6 of 9 children). The methods used at home were crawling, walker,
wheelchair and holding hands or walls. The methods at school were
walker and wheelchair.
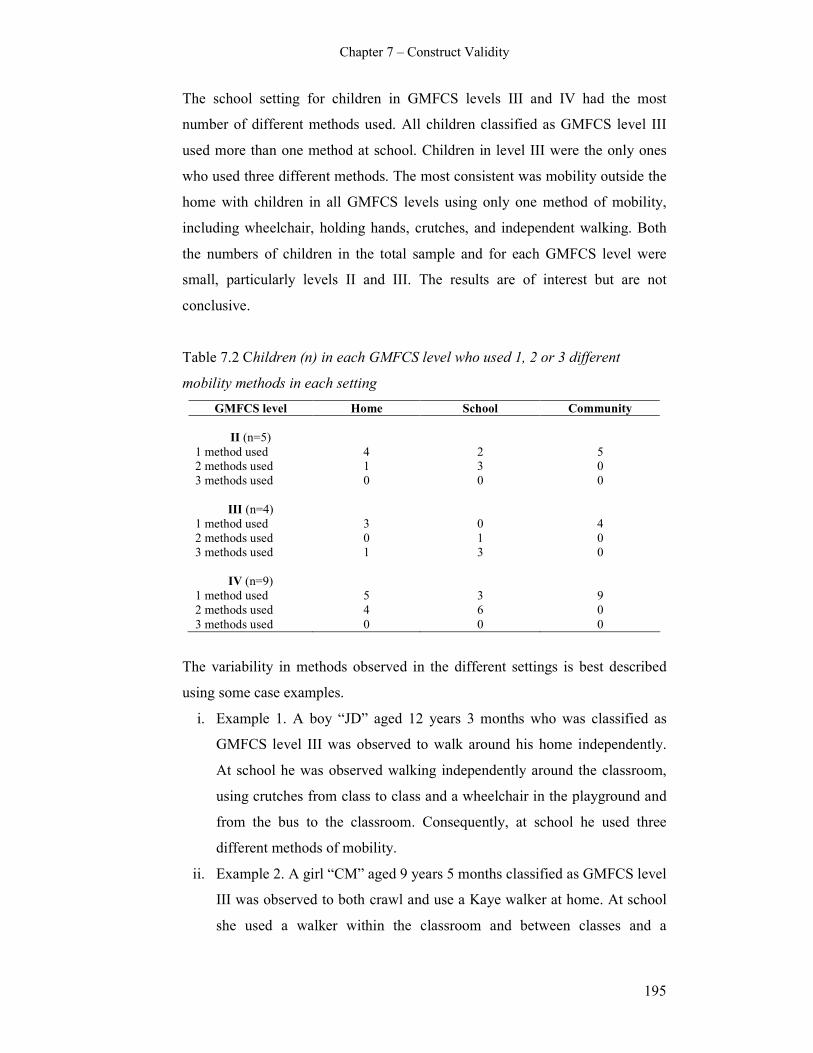
Chapter 7 – Construct Validity
195
The school setting for children in GMFCS levels III and IV had the most
number of different methods used. All children classified as GMFCS level III
used more than one method at school. Children in level III were the only ones
who used three different methods. The most consistent was mobility outside the
home with children in all GMFCS levels using only one method of mobility,
including wheelchair, holding hands, crutches, and independent walking. Both
the numbers of children in the total sample and for each GMFCS level were
small, particularly levels II and III. The results are of interest but are not
conclusive.
Table 7.2 Children (n) in each GMFCS level who used 1, 2 or 3 different
mobility methods in each setting
GMFCS level Home School Community
II (n=5)
1 method used 4 2 5
2 methods used 1 3 0
3 methods used 0 0 0
III (n=4)
1 method used 3 0 4
2 methods used 0 1 0
3 methods used 1 3 0
IV (n=9)
1 method used 5 3 9
2 methods used 4 6 0
3 methods used 0 0 0
The variability in methods observed in the different settings is best described
using some case examples.
i. Example 1. A boy “JD” aged 12 years 3 months who was classified as
GMFCS level III was observed to walk around his home independently.
At school he was observed walking independently around the classroom,
using crutches from class to class and a wheelchair in the playground and
from the bus to the classroom. Consequently, at school he used three
different methods of mobility.
ii. Example 2. A girl “CM” aged 9 years 5 months classified as GMFCS level
III was observed to both crawl and use a Kaye walker at home. At school
she used a walker within the classroom and between classes and a
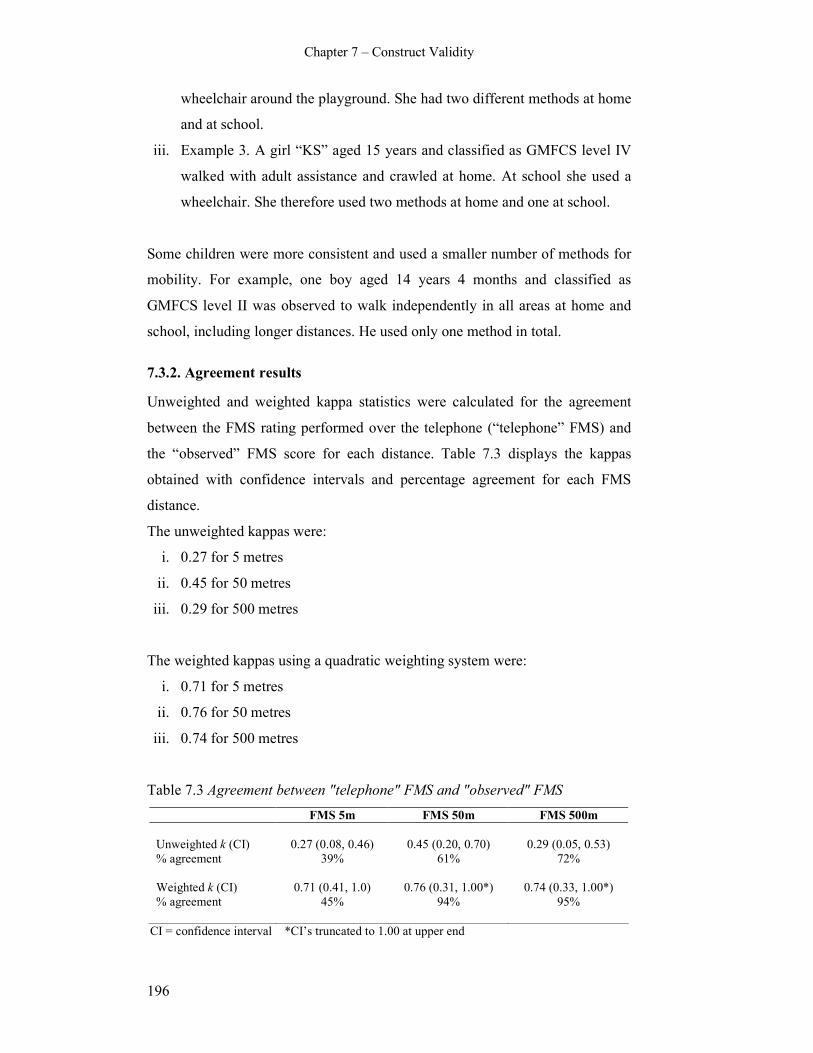
Chapter 7 – Construct Validity
196
wheelchair around the playground. She had two different methods at home
and at school.
iii. Example 3. A girl “KS” aged 15 years and classified as GMFCS level IV
walked with adult assistance and crawled at home. At school she used a
wheelchair. She therefore used two methods at home and one at school.
Some children were more consistent and used a smaller number of methods for
mobility. For example, one boy aged 14 years 4 months and classified as
GMFCS level II was observed to walk independently in all areas at home and
school, including longer distances. He used only one method in total.
7.3.2. Agreement results
Unweighted and weighted kappa statistics were calculated for the agreement
between the FMS rating performed over the telephone (“telephone” FMS) and
the “observed” FMS score for each distance. Table 7.3 displays the kappas
obtained with confidence intervals and percentage agreement for each FMS
distance.
The unweighted kappas were:
i. 0.27 for 5 metres
ii. 0.45 for 50 metres
iii. 0.29 for 500 metres
The weighted kappas using a quadratic weighting system were:
i. 0.71 for 5 metres
ii. 0.76 for 50 metres
iii. 0.74 for 500 metres
Table 7.3 Agreement between "telephone" FMS and "observed" FMS
FMS 5m FMS 50m FMS 500m
Unweighted k (CI) 0.27 (0.08, 0.46) 0.45 (0.20, 0.70) 0.29 (0.05, 0.53)
% agreement 39% 61% 72%
Weighted k (CI) 0.71 (0.41, 1.0) 0.76 (0.31, 1.00*) 0.74 (0.33, 1.00*)
% agreement 45% 94%
95%
CI = confidence interval *CI’s truncated to 1.00 at upper end

Chapter 7 – Construct Validity
197
Using the guidelines for the range of kappas describing the strength of the
agreement stated in Chapter 5 (section 5.3.2) (Landis and Koch 1977), the
agreement for the unweighted kappas for 5 and 500 metres is fair and for 50
metres is moderate. The weighted kappas show substantial agreement for all
three distances. The large confidence intervals around these kappa statistics
preclude any conclusion to be drawn about higher or lower agreement between
the three distances.
Due to the small numbers in the study, further examination of agreement
according to different GMFCS levels, age groups or number of mobility
methods used was unable to be performed. The numbers in each group are too
small for kappa statistics to be calculated.
7.4. Discussion
7.4.1. Variety of mobility methods observed
The children in this investigation displayed a range of methods of mobility used
within the different environmental settings of the home and school. There was
variety within the group as a whole with regard to the type and number of
methods used and variety within the children. Many of the children used more
than one method in either setting and used different methods at home than at
school.
This finding is supported by other reports on mobility methods across
environmental settings (Palisano et al 2003, Tieman et al 2004). Both of these
studies used data from a longitudinal study of children with CP from Ontario
and asked parents to report “usual” mobility methods their children used in the
home, school and outdoor/community setting. The Palisano study described the
mobility methods at one point in time in a random stratified sample of 636
children with CP, GMFCS levels I-V, aged 2-12 years (Palisano et al 2003).
Children in GMFCS levels II-IV demonstrated a variety of methods in all
settings. There was less variability for those in level I, where children mostly
walked independently, and level V, where they were pushed or carried. Children

Chapter 7 – Construct Validity
198
were more independent at home than school and used more dependent methods
in the community compared to school.
Following on from this study, 62 children aged 6-14 years, classified as GMFCS
levels II-IV, were examined more closely because they had showed the most
variability (Tieman et al 2004). Rather than examine mobility at one point in
time, the authors followed the children for 3-4 years to examine change over
three time points. At home the most common methods were floor mobility or
independent walking. At school the most common method was walking with a
walking aid or wheelchair. For the community a wheelchair was the most
common method. These results are very similar to the most common methods
demonstrated in the current investigation. In the Tieman study, the children used
methods requiring more gross motor function at the second time point compared
to the first. This suggests they had progressed with their skills. The difference
between the second and third time point was not significant. Both the Tieman
and Palisano studies provide important information regarding mobility methods
using large numbers of children. Both asked parents to choose only one method
their child used in each setting and neither study differentiated the type of
walking aid used. The current investigation reported all methods the children
used in each setting and described all types of walking aids.
7.4.2. Agreement between self-report FMS and direct observation
The agreement between the FMS rating performed over the telephone and that
observed at home and at school was lower than expected using unweighted
kappa statistics. Agreement was substantial when quadratic weighted kappas
were calculated; however unweighted kappas are more clinically meaningful, as
discussed in Chapter Five. This is because even one level of disagreement can
be considered a clinically meaningful difference for a scale such as the FMS
that has only six levels.
There are a number of factors that could have contributed to this agreement
being fair to moderate. Some of these including the variability of mobility
methods, the issue of self-report and the issue of measuring capability or
performance; could suggest that the disagreement is real. Other factors are

Chapter 7 – Construct Validity
199
methodological issues that suggest agreement could have been improved with
enhanced methodology.
One factor that is likely to have influenced the agreement is the number and
variety of mobility methods observed in the children. Many children were
observed to use more than one method at home and at school. It is possible that
this variety created difficulties for the clinicians administering the FMS and for
the child or parent reporting. It may have been challenging to choose which
FMS rating to assign for each of the three distances when more than one method
could have applied. It is likely that the 50 metre school rating was problematic
because some children used up to three different methods. Not only did the
parent have to make a choice of methods, it is also possible that they were not
fully informed of their child’s mobility at school. Most of the children in this
study travelled to and from school on the bus without the parents attending the
school. The parents may not have given an accurate report of school mobility.
Another factor related to the variety of methods used that could have affected
agreement was that the children were observed at home and school at one point
in time only. On a different day the children may have used other methods.
Another factor that potentially influenced the agreement was the self-report
nature of the FMS. Like other self-report scales used in children with CP, such
as the FAQ (Novacheck et al 2000), ASK (Young et al 2000), CHQ (Landgraf
et al 1996) and PODCI (Daltroy et al 1998), it is assumed that self-report
reflects what is truly happening. Self-report may not be the most reliable
method of obtaining information regarding activity for these complex children.
The agreement in the current study may in fact reflect the true difference
between self-report and direct observation.
Studies have examined the reliability of self-report measures. The reliability of
family report for the GMFCS was examined in 97 children aged 6-11 years by
comparing GMFCS classifications made by clinicians with a questionnaire
completed by the family (Morris et al 2004). ICC’s of 0.92-0.97 were found
suggesting family report is reliable. It is assumed in the Morris study that the
GMFCS classifications made by the clinicians were through observation in the
Chapter 7 – Construct Validity
200
clinical setting however it is not completely clear. During the development of
the ASK, 28 children aged 5-15 years completed one version two weeks apart to
assess the reliability of child-report (Young et al 1995). Retest reliability was
high with ICC’s of 0.97 and child report was also highly concordant with parent
report scores with ICC’s of 0.96. The Young study supports reliability of child
report but does not investigate the agreement between child report and direct
observation. Studies have examined the reliability of other self report measures,
such as the FAQ (Novacheck et al 2000) and the PODCI (Daltroy et al 1998).
These studies on the reliability are important; however there is a deficiency in
the literature of examining the agreement between self report and direct
observation, that is, the validity of the self-reporting method. Without evidence
of this agreement it is uncertain whether these measures are reporting what they
intend to report.
The FMS is intended to measure performance rather than capability. Despite all
efforts by clinicians asking the correct questions to obtain a performance rating,
there is the possibility that the parents reported what their child “can do” rather
than what they “do do”. Studies have shown differences between capability and
performance of activity in children (Young et al 1996, Tieman et al 2004). In
the Young study, both the capability and performance versions of the ASK was
administered to 28 children with physical disabilities aged 5-15 years.
Capability consistently exceeded performance with an 18% difference for total
summary scores. In the Tieman study, differences in the performance and
capability of mobility across environmental settings was examined in a random
stratified sample of 307 children with CP aged 6-12 years. Capability was based
on the highest item passed on the GMFM from three items based on mobility.
Performance was based on parent questionnaire. Children with similar
capabilities demonstrated differences in performance across settings. These
studies demonstrate that capability of activities, such as mobility is not the same
as performance during daily activities and routines. For the current study, it was
possible that some of the parents reported capability on the FMS telephone
rating. As a result, agreement would be lower because the observational ratings
of the children recorded performance.
Chapter 7 – Construct Validity
201
Differences in agreement between what is observed and what is reported is an
important issue that impacts on how we measure activity in children with CP. If
measuring performance reflects function relevant to these children and is more
meaningful, then it is likely that self-report is the method of information
collection. Even though observations in daily life are more valid than other
methods of observation, such as interviews (Nunnally 1978), it is impractical to
observe every child seen clinically within all their environmental settings.
Observing children within the formal clinical setting is not reflective of their
usual everyday settings and therefore it is difficult to measure typical
performance (Long 1992). Self-reporting therefore remains the most practical
and feasible method of measuring performance.
The nature of the sample recruited for this study may have influenced the lower
than expected agreement. The children who attended the school were complex
with intellectual disabilities as well as physical disabilities. Many mobility
options were dictated by safety related to behavioural and cognitive issues
rather than physical factors alone. A sample more representative of the CP
population would have more consistent mobility options and possibly be easier
to rate. Other methodological factors that possibly influenced the agreement
include the small sample size and the time that elapsed between the ratings and
observations. There were only 18 children included in the sample due to the
feasibility of recruitment, as stated in the methods section. A larger sample size
may have resulted in improved agreement with increased power and smaller
confidence intervals. The time between the FMS ratings performed over the
telephone and the direct observations ranged from 0-40 days. There is a
possibility that change occurred in the mobility status of some children that
would result in lower agreement between the two.
Also potentially influencing the agreement was the process of creating the
“observed” FMS. For the home and school observations there was more than
one category where mobility method was recorded that reflected different
distances. For example, at school, mobility within the class, from class to class
and in the playground was recorded. The problem of which category to choose
for the “observed” score was minimized by stating clearly that for the school
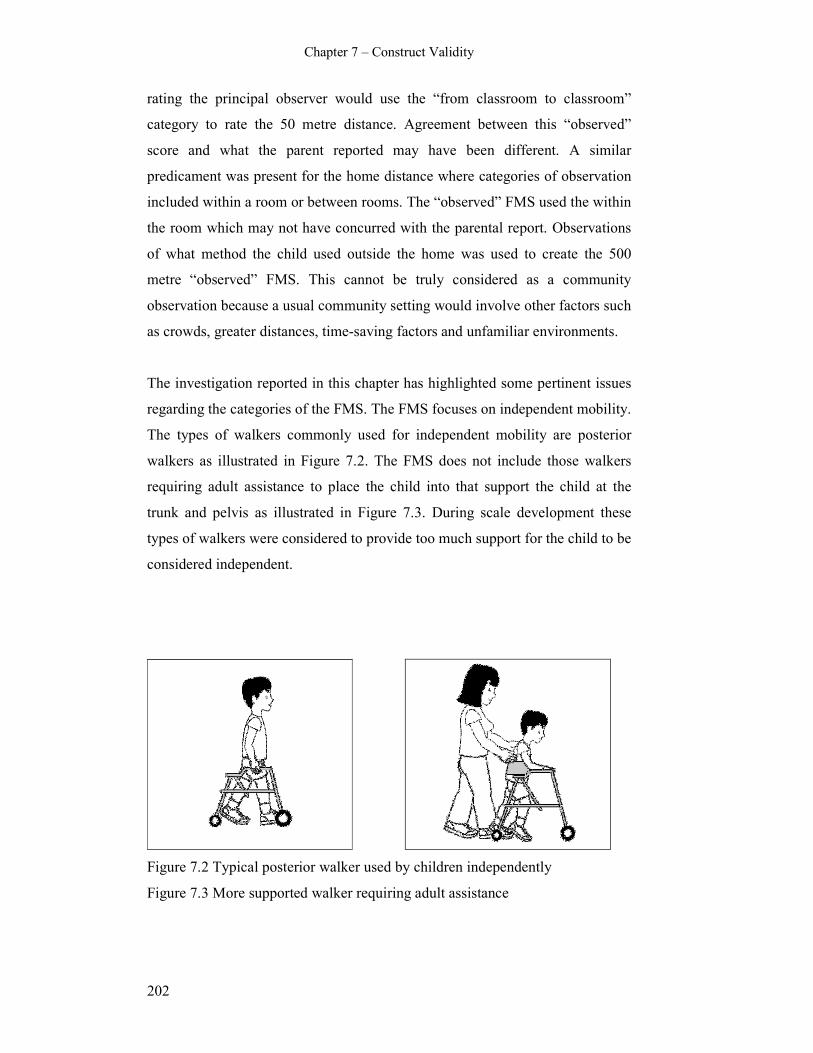
Chapter 7 – Construct Validity
202
rating the principal observer would use the “from classroom to classroom”
category to rate the 50 metre distance. Agreement between this “observed”
score and what the parent reported may have been different. A similar
predicament was present for the home distance where categories of observation
included within a room or between rooms. The “observed” FMS used the within
the room which may not have concurred with the parental report. Observations
of what method the child used outside the home was used to create the 500
metre “observed” FMS. This cannot be truly considered as a community
observation because a usual community setting would involve other factors such
as crowds, greater distances, time-saving factors and unfamiliar environments.
The investigation reported in this chapter has highlighted some pertinent issues
regarding the categories of the FMS. The FMS focuses on independent mobility.
The types of walkers commonly used for independent mobility are posterior
walkers as illustrated in Figure 7.2. The FMS does not include those walkers
requiring adult assistance to place the child into that support the child at the
trunk and pelvis as illustrated in Figure 7.3. During scale development these
types of walkers were considered to provide too much support for the child to be
considered independent.
Figure 7.2 Typical posterior walker used by children independently
Figure 7.3 More supported walker requiring adult assistance

Chapter 7 – Construct Validity
203
At the school visit it was noted by the principal investigator that some of the
children classified as GMFCS level IV could be independent in these more
supportive walkers once they were placed there and strapped in by an adult.
Once they were secured they were able to move around the playground at
lunchtime on their own, often covering distances greater than 200 metres. This
issue will be elaborated on further in the grand discussion.
There are a number of factors that might influence or determine why the same
child uses different mobility methods in different environmental settings, or
how the environmental setting determines what method is used. This includes
the amount of assistance required, safety and liability issues, therapy goals,
convenience and child or parent preferences.
Within the home there are shorter distances for the child to travel to get from
one place to another and furniture and walls that provide stability or a sense of
security. The child who normally uses assistive devices at school might walk on
their own at home because they feel safer. Many children choose to crawl at
home because they can get from one place to another quickly and independently
without having to pull themselves up into standing and onto an assistive device.
This provides them with more independence and gives the parents more time
within the busy schedule of family life. The distances and logistics of a school
setting tend to preclude children from crawling there.
Safety within the school environment and liability issues also potentially
influence mobility methods. Many schools are concerned that children might
harm themselves moving around within the school setting, particularly with
other children rushing around. This is less of an issue in special schools where
the environment and support is tailored for children with physical and cognitive
impairments. It is possible that children use wheelchairs more at school to
ensure safety and limit liability concerns. As an example, one boy in this study
aged 17 years and classified as GMFCS level II was observed to walk
independently at home. Significant behavioural issues placed him at risk of self-
harm at school. As a result, he used a wheelchair for the majority of the time at
school, except for within the classroom. Therapy goals at school might also
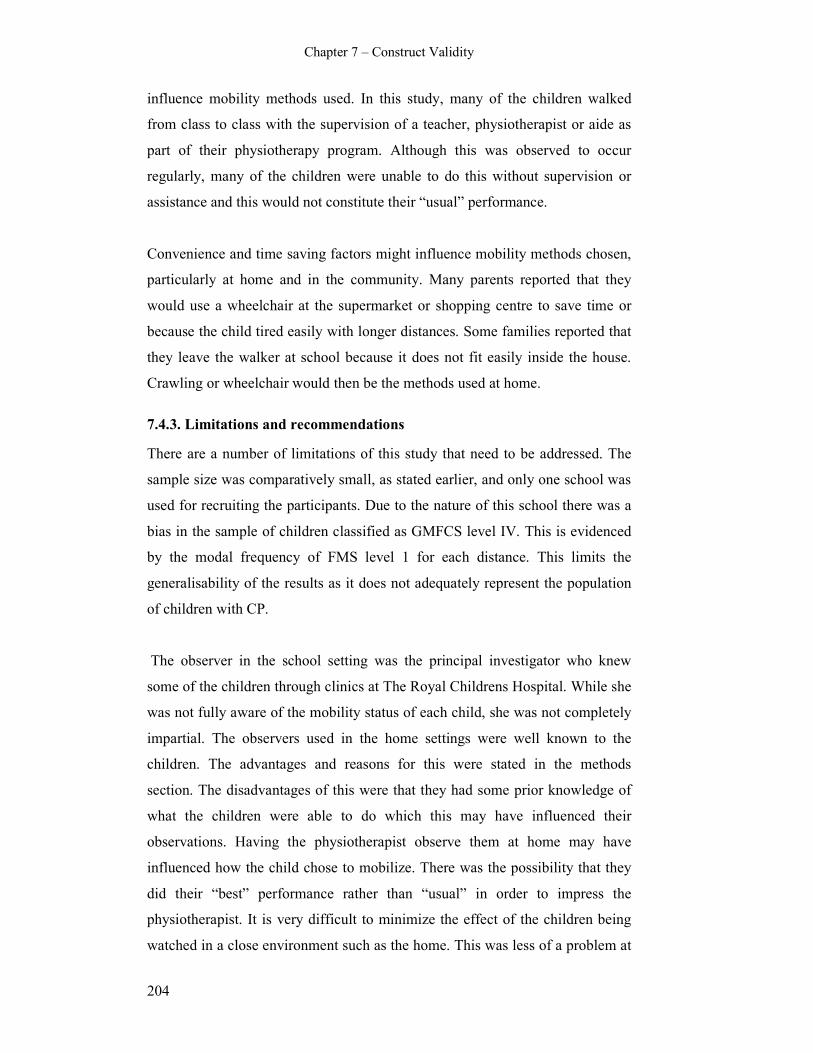
Chapter 7 – Construct Validity
204
influence mobility methods used. In this study, many of the children walked
from class to class with the supervision of a teacher, physiotherapist or aide as
part of their physiotherapy program. Although this was observed to occur
regularly, many of the children were unable to do this without supervision or
assistance and this would not constitute their “usual” performance.
Convenience and time saving factors might influence mobility methods chosen,
particularly at home and in the community. Many parents reported that they
would use a wheelchair at the supermarket or shopping centre to save time or
because the child tired easily with longer distances. Some families reported that
they leave the walker at school because it does not fit easily inside the house.
Crawling or wheelchair would then be the methods used at home.
7.4.3. Limitations and recommendations
There are a number of limitations of this study that need to be addressed. The
sample size was comparatively small, as stated earlier, and only one school was
used for recruiting the participants. Due to the nature of this school there was a
bias in the sample of children classified as GMFCS level IV. This is evidenced
by the modal frequency of FMS level 1 for each distance. This limits the
generalisability of the results as it does not adequately represent the population
of children with CP.
The observer in the school setting was the principal investigator who knew
some of the children through clinics at The Royal Childrens Hospital. While she
was not fully aware of the mobility status of each child, she was not completely
impartial. The observers used in the home settings were well known to the
children. The advantages and reasons for this were stated in the methods
section. The disadvantages of this were that they had some prior knowledge of
what the children were able to do which this may have influenced their
observations. Having the physiotherapist observe them at home may have
influenced how the child chose to mobilize. There was the possibility that they
did their “best” performance rather than “usual” in order to impress the
physiotherapist. It is very difficult to minimize the effect of the children being
watched in a close environment such as the home. This was less of a problem at

Chapter 7 – Construct Validity
205
school because the observer could blend in more and not be so obvious because
of more activity going on around the children.
The range of timing between the “telephone” FMS and direct observation could
have allowed for change to occur in the mobility status of some of the children.
This has the potential to influence the agreement negatively and provide a
source of variation. It would be preferable to have a smaller time period
between them to limit the possibility of such change occurring. An interval of 2-
14 days is suggested as usual (Streiner and Norman 2003).
This was a feasibility study with the aim to provide information for further
research. Further examination of construct validity exploring the same question
is required using larger numbers of children representing a more even spread of
GMFCS levels recruited from a larger and more varied number of schools.
Within this it would be preferable to observe the children directly in the
community with completely objective observers and with less time lapsing
between ratings and observations.
The study highlighted some issues around the administration of the FMS and
how to record other forms of mobility not currently covered by it. There is the
potential to modify the scale to improve its’ clinical utility. This will be
discussed further in Chapter Nine.
7.5. Conclusion
Fair to moderate agreement was found for each distance of the FMS when
comparing direct observation with FMS ratings in a group of children attending
a special school. Descriptive statistics from direct observation showed there was
variability in the number and type of mobility method used within different
environmental settings for the whole group and for individual children. The
diversity of mobility methods used, issues relating to self report measures, and
methodological limitations of this study are potential explanations for the
differences. Further research with larger and more representative samples is
required comparing self-report with direct observation for the FMS and similar
measures of activity limitation used in children with CP.


Chapter 8 – Concurrent and Discriminative Validity
207
CHAPTER EIGHT: CONCURRENT AND DISCRIMINATIVE
VALIDITY OF THE FUNCTIONAL MOBILITY SCALE
8.1. Introduction
This chapter explores the concurrent and discriminative validity of the FMS.
This further validation of the scale was considered to be important to ensure that
it is measuring activity limitation and can distinguish between groups of
children with CP based on severity of activity limitation.
Concurrent validity is a form of criterion validity and is sometimes referred to
as convergent validity (Streiner and Norman 2003). It involves correlating a
new scale with a criterion measure, ideally a ‘gold standard’ which has been
used and accepted in the field (Nunnally 1978, Streiner and Norman 2003). The
criterion measure is usually another measure of the disorder under study.
Examination of concurrent validity of the FMS is required to ensure that it
correlates well with other tools that also measure mobility. The correlation aims
to show a strong relationship between the FMS and a criterion measure, yet not
perfect, otherwise the two measures could be considered too similar.
The other form of criterion validity is predictive validity, which is examined
primarily in diagnostic or predictive tests (Streiner and Norman 2003). It allows
measurement done in the present to infer something about the future for
predicting outcome (Baxter 2005). Predictive validity is important to examine in
measurement tools that are designed to discriminate abnormal motor
development from normal development such as the AIMS (Piper and Darrah
1994) and the Peabody Developmental Motor Scales (Folio and Fewell 1983).
The FMS is an evaluative measure. It has been developed to assess change over
time rather than to diagnose or predict. Because of this the examination of
predictive validity is not a requirement; however the examination of concurrent
validity is important.
The FMS measures functional mobility in children with CP, for which there is
no gold standard. There are a number of tools that have mobility sections within

Chapter 8 – Concurrent and Discriminative Validity
208
a larger inventory such as the PEDI (Haley et al 1992), the WeeFIM (Msall et al
1994) and the ASK (Young et al 1995). The walking scale of Gillette FAQ
(Novacheck et al 2000) focuses on mobility and is also an ordinal scale. It
describes the typical walking abilities of children with a consideration of the
environment, yet does not consider the assistive devices used. The FMS
considers different assistive devices the children use. It also describes mobility
within each environmental setting of the home, school and community based on
the assistance required. Consequently, the FAQ reports one score or category
whereas the FMS reports three. The FAQ is a parent report measure, whereas
the FMS is a clinician interpretation of child or parent report. In the absence of a
“gold standard” the FAQ was chosen to be the criterion measure to correlate
with the FMS for examining concurrent validity. Despite some differences
between the two measures, the FAQ is the only tool that also measures mobility
in isolation in children with CP.
The GMFCS (Palisano et al 1997) is a classification system that is now used
internationally to describe the gross motor functional ability of children with
CP. Children are classified according to one of five ordered levels of severity of
motor impairment. Correlation of the FMS with the GMFCS was also
considered important. Although it is not an outcome measure, it does classify
children according to activity limitation and a strong correlation with it would
further support the concurrent validity of the FMS.
Discriminative validity involves assessing the ability of a scale to distinguish
between two groups, one group that has the trait or behaviour in question and
the other that does not (Streiner and Norman 2003). Discriminatory analysis is
employed when groups of persons are defined a priori and the purpose of the
analysis is to distinguish the groups from one another on the basis of their score
profiles (Nunnally 1978). It is sometimes called construct validation by extreme
groups (Streiner and Norman 2003). The FMS corresponds to the activity and
participation domain of the ICF. It is used clinically in conjunction with
classification systems such as the GMFCS (Palisano et al 1997) to classify and
measure the activity limitations of children with CP. The validity of the FMS
would be further supported by determining if it was able to discriminate severity

Chapter 8 – Concurrent and Discriminative Validity
209
of CP as classified by the GMFCS. This would provide evidence that the scale
was able to distinguish between groups based on their level of activity
limitation.
A preliminary study of the FMS examined aspects of concurrent and
discriminative validity in 310 children with CP (Graham et al 2004). Concurrent
validity was examined by correlating the FMS with the CHQ, PODCI, Uptimer,
energy expenditure and Rancho scale. Spearman rank correlations showed
strong correlation of the FMS with all measures (r>0.71) except for energy
expenditure (r=0.51-0.55). A limitation of the Graham study was that the FAQ
was not one of the measures involved in the examination of concurrent validity.
The Rancho scale (Hoffer et al 1973), sometimes called the Hoffer scale, was
developed for children with myelomeningocoele. It rates ambulation level on a
four point scale; community, household, non-functional ambulators or non-
ambulators. Although it has been used in children with CP the scale has not
been validated in CP. Uptime (Eldridge et al 2003) records the amount of time
children spend in the upright position each day. It uses metric measurement and
is not a categorical scale like the FMS. The CHQ and PODCI are both larger
inventories that include a section on physical function. The FAQ is the tool most
similar to the FMS and examination of concurrent validity with it as a criterion
measure is required.
In the Graham (2004) study, discriminative validity was examined by
determining the ability of the FMS to differentiate between different walking
abilities of the children based on the Rancho grading system (Hoffer et al 1973).
The authors stated that the FMS was able to differentiate children with varying
degrees of walking ability. However the results were descriptive with no formal
statistical analysis. Further examination of concurrent validity with the FAQ and
discriminative validity of the FMS is therefore required.
Chapter 8 – Concurrent and Discriminative Validity
210
The research questions for this study were:
i. “What is the concurrent validity of the FMS with the FAQ and the
GMFCS?”
ii. “Is the FMS able to discriminate severity of activity limitation in children
with CP as classified by the GMFCS?”
The aims of the study were to determine:
i. the concurrent validity of the FMS by correlating it with the walking scale
of the Gillette FAQ and the GMFCS
ii. if the FMS can discriminate severity of activity limitation of children with
CP as classified by the GMFCS
The hypotheses were:
i. The FMS will have a strong positive relationship with the FAQ using
correlation coefficients in a sample of children with CP at one point in
time
ii. The FMS will have a strong negative relationship with the GMFCS using
correlation coefficients in a sample of children with CP at one point in
time. This relationship will be negative due to the reverse scaling of the
FMS compared to the GMFCS.
iii. The FMS will discriminate severity of motor impairment in children with
CP as described by the GMFCS for children classified as GMFCS levels I-
IV.
8.2. Method
8.2.1. Participants
Participants involved in this study were recruited for the inter-rater reliability
(Chapter Five) and responsiveness to change (Chapter Six) studies. These were
sample 2 and sample 3 as illustrated in Chapter One (section 1.3). The current
study utilised the data collected in those studies for additional analyses. There
were a number of children who had participated in both studies. For these, only
the data obtained from the reliability study was used in the current study so that
one data set per child was utilised.

Chapter 8 – Concurrent and Discriminative Validity
211
The inclusion criteria for the participants were children:
i. with CP aged 2- 18 years,
ii. classified as GMFCS levels I-IV,
iii. who attended the CP clinics or gait laboratory of the Royal Children’s
Hospital, Melbourne, Australia.
Excluded were children:
i. with a diagnosis other than CP,
ii. younger than 2 years and older than 18 years,
iii. classified as GMFCS level V.
The inclusion and exclusion criteria were justified in Chapter Five (section
5.2.1.2) and Chapter Six (section 6.2.1). The aim of the current study was to
determine the concurrent and discriminative validity of the FMS for the sample
of children at one point in time.
The sample size was determined by the numbers in each of the combined
studies. The sample size of 118 used in the reliability study was a large sample
justified on the basis of obtaining a high level of agreement between raters with
95% confidence intervals. The sample size of 84 recruited in the responsiveness
study was based on obtaining adequate numbers to ensure a change following
interventions would be detected and on clinical availability of the children. A
combination of these two samples provided a large number of participants for
examining concurrent and discriminative validity.
8.2.2. Procedures
The study was approved by the Ethics in Human Research Committee of the
Royal Children’s Hospital (reference numbers 25118A and 25119A) and The
University of Melbourne Human Ethics Research Committee (reference
numbers 060211 and 060212) as stated in Chapters Five and Six. Written
consent was obtained from each participating child’s parent or legal guardian
prior to data collection.
Chapter 8 – Concurrent and Discriminative Validity
212
8.2.2.1 Recruitment
Recruitment was via the procedures explained in detail in Chapters Five and
Six. All children were recruited through the CP clinics or gait laboratory of the
Royal Children’s Hospital and were approached by the primary investigator
(AH). Following explanation of the study the parent/guardians signed consent
forms and were provided with information statements about the study. The data
from the studies in Chapter Five and Six that was required for the current study
were; GMFCS level, FMS score, FAQ score and descriptive details of the child
such as age, gender and topographical distribution of CP.
8.2.2.2 Concurrent Validity
The information required for analysis of concurrent validity for each child was
their FMS score, their GMFCS level and their FAQ score. Each child was
classified according to GMFCS level by the primary investigator at the initial
consultation for recruitment. This is described in Chapter Five (section 5.2.2.3)
and Chapter Six (section 6.2.2.3). The GMFCS was developed for children with
CP and has been shown to be reliable, valid and stable over time (Palisano et al
1997, Wood and Rosenbaum 2000, Morris et al 2004, Palisano et al 2006,
McDowell et al 2007).
The FMS score utilised for the current study was dependent on which study the
child was originally recruited for. In the reliability study each child had two
FMS ratings. The one used for the current study was that one obtained at the
Royal Children’s Hospital by either the physiotherapist or the surgeon. In the
responsiveness study the FMS for each child was administered by the principal
investigator. All FMS scores for the current study had been administered in
person.
For all children the FAQ was completed by the parents at the initial
consultation. The FAQ is a 10 level ordinal scale that the parents complete by
circling the most appropriate response from 1-10 that best describes their child’s
walking ability (see Appendix E). It ranges from “cannot takes any steps”
through to “fully independent on all surfaces” within different environmental
settings. The second part of the questionnaire involves the parents ticking the
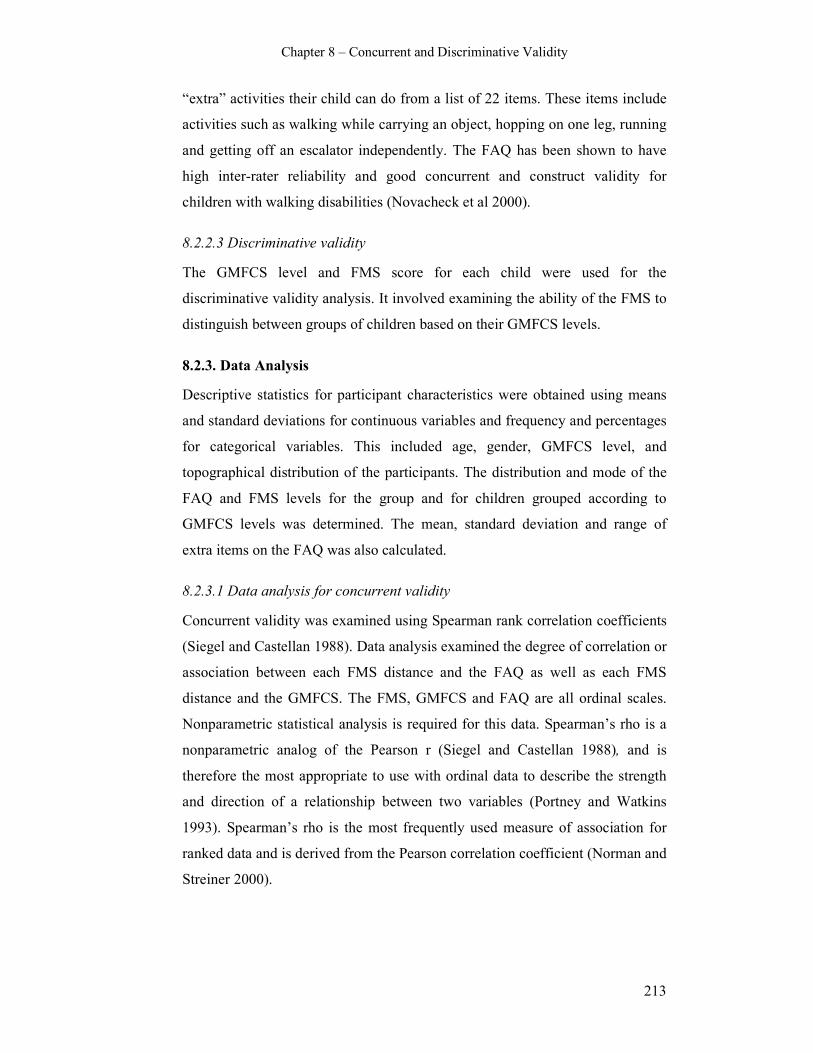
Chapter 8 – Concurrent and Discriminative Validity
213
“extra” activities their child can do from a list of 22 items. These items include
activities such as walking while carrying an object, hopping on one leg, running
and getting off an escalator independently. The FAQ has been shown to have
high inter-rater reliability and good concurrent and construct validity for
children with walking disabilities (Novacheck et al 2000).
8.2.2.3 Discriminative validity
The GMFCS level and FMS score for each child were used for the
discriminative validity analysis. It involved examining the ability of the FMS to
distinguish between groups of children based on their GMFCS levels.
8.2.3. Data Analysis
Descriptive statistics for participant characteristics were obtained using means
and standard deviations for continuous variables and frequency and percentages
for categorical variables. This included age, gender, GMFCS level, and
topographical distribution of the participants. The distribution and mode of the
FAQ and FMS levels for the group and for children grouped according to
GMFCS levels was determined. The mean, standard deviation and range of
extra items on the FAQ was also calculated.
8.2.3.1 Data analysis for concurrent validity
Concurrent validity was examined using Spearman rank correlation coefficients
(Siegel and Castellan 1988). Data analysis examined the degree of correlation or
association between each FMS distance and the FAQ as well as each FMS
distance and the GMFCS. The FMS, GMFCS and FAQ are all ordinal scales.
Nonparametric statistical analysis is required for this data. Spearman’s rho is a
nonparametric analog of the Pearson r (Siegel and Castellan 1988), and is
therefore the most appropriate to use with ordinal data to describe the strength
and direction of a relationship between two variables (Portney and Watkins
1993). Spearman’s rho is the most frequently used measure of association for
ranked data and is derived from the Pearson correlation coefficient (Norman and
Streiner 2000).

Chapter 8 – Concurrent and Discriminative Validity
214
8.2.3.2 Data analysis for discriminative validity
Discriminative validity was examined using the area under the receiver
operating characteristic (ROC) curves (Streiner and Norman 2003). ROC curves
can be used to judge the discrimination ability of various statistical methods
(Hanley and McNeil 1982). It is derived from the early days of radar and sonar
detection for finding the optimal setting where the largest ratio of signal to noise
is detected, and has since been used to detect the presence or absence of a state
or disease (Streiner and Norman 2003). The sensitivity (true positive rate) and
specificity (true negative rate) of a test are derived from 2x2 tables and the ROC
curve constructed from these values for each possible cut point of the test
(Streiner and Norman 2003). A certain cut point on the curve for the scale or
measure in question, in this case the FMS, is the optimal point where there are
the most number of true cases (signal) without wrongly labelling cases as “non-
cases” (noise).
For the current study ROC curves were created for each distance of the FMS
after grouping children into two groups based on their GMFCS levels. Those
who essentially were able to walk without assistive devices (GMFCS levels I
and II) were labelled as “independent walkers”. This group can be considered as
the true cases. Those who required assistive devices to mobilize (GMFCS levels
III and IV) were labelled as “assisted walkers”. This group can be considered
the non-cases. The aim of the data analysis was to determine if the FMS could
distinguish between these two groups and what level of the FMS was the best
discriminating level. ROC curves were created for each FMS distance. The
points on the curve are the plots of the sensitivity (true positive rate) and 1
minus the specificity (false positive rate) for each FMS level (from 1-6). This
will be explained further in the results section.
The area under the ROC curve measures the probability of a correct ranking of a
pair as to the disease state in question (Hanley and McNeil 1982). In this case
whether the FMS could distinguish between GMFCS I/II (“independent
walkers”) and III/IV (“assisted walkers”). The estimate of the area under the
curve can be calculated as well as confidence intervals constructed around this

Chapter 8 – Concurrent and Discriminative Validity
215
figure (Hanley and McNeil 1982). A non-discriminating test has an area of 0.5
and a perfect test has an area of 1.0 (Streiner and Norman 2003).
The data were stored and organized using the EpiData for Windows program
(http://www.epidata.dk/.). All analyses were performed using Stata [StataCorp
2005 Stata statistical software Release 9.0. College Station; TX. Stata Press.].
8.3. Results
8.3.1. Descriptive results
There were 213 sets of data available with 41 children included in both studies.
For these 41 children, only one of their data sets was included. This resulted in
172 children being included in the current study. The mean age of the
participants was 9.9 years (SD 3.7 years) with a range of 2-18 years. There were
111 males and 61 females. There were 27 children with hemiplegia, 114 with
diplegia and 31 with quadriplegia. The frequency of children within each
GMFCS level in the sample was; 19 children level I, 69 level II, 63 level III and
21 level IV. Table 8.1 summarises the participant characteristics.
Table 8.1 Participant characteristics
Characteristic
Age: mean (SD), range (yrs) 9.9 (3.7), 2-18 yrs
Gender n (%) male 111 (65%)
female 61 (35%)
GMFCS n (%) I 19 (11%)
II 69 (40%)
III 63 (37%)
IV 21 (12%)
Topography n (%) hemiplegia 27 (16%)
diplegia 114 (66%)
quadriplegia 31 (18%)
For the group, the modal score for 5 metres on the FMS was 5 with 70 children
(41%) rated as walking independently on level surfaces. For 50 metres the
modal FMS score was also 5 (64 children or 37%). For 500 metres the modal
score was 1 with 91 children (53%) using a wheelchair for community

Chapter 8 – Concurrent and Discriminative Validity
216
distances. Figure 8.2 summarises the number and percentage of children in each
FMS level for each distance.
Table 8.2 Frequency of children in each FMS category for each distance
FMS level FMS 5 FMS 50 FMS 500
6 25 (14%) 18 (11%) 10 (6%)
5 70 (41%) 64 (37%) 49 (29%)
4 16 (9%) 12 (7%) 8 (5%)
3 8 (5%) 8 (5%) 5 (3%)
2 18 (11%) 43 (25%) 7 (4%)
1 11 (6%) 25 (14%) 91 (53%)
C (crawl) 24 (14%) 2 (1%) 0
N (does not do) 0 0 2 (1%)
Total 172 172 172
The modal FAQ score for the whole group was 6 (“walks more than 15-50 feet
outside the home but usually uses a wheelchair or stroller for community
distances”) with 42 children (24%). The next frequent category was 9 (“walks
outside the home for community distances, easily gets around on level ground,
curbs and uneven terrain, but has difficulty or requires minimal assistance or
supervision with running, climbing and/or stairs”) with 37 children (22%). The
mean number of extra items the children were able to perform was 8.1 (SD 5.5)
with a range of 0-22. This range covers the whole possible range of extra items.
The mode of FMS level for each distance varied depending on the GMFCS
levels of the children. For 5 metres the mode was at FMS 6 (independent on all
surfaces) for children classified as GMFCS I, 5 (independent on level surfaces)
for level II, crawling for children level III and wheelchair for level IV. For 50
metres the mode was level 6 for children classified as level I, 5 for level II,
walking with walkers for level III and wheelchair for level IV. For 500 metres
the mode was 5 (walking on level surfaces) for GMFCS levels I and II and
wheelchair for levels III and IV. Table 8.3 shows the frequency of children in
each FMS level for each distance according to GMFCS level.
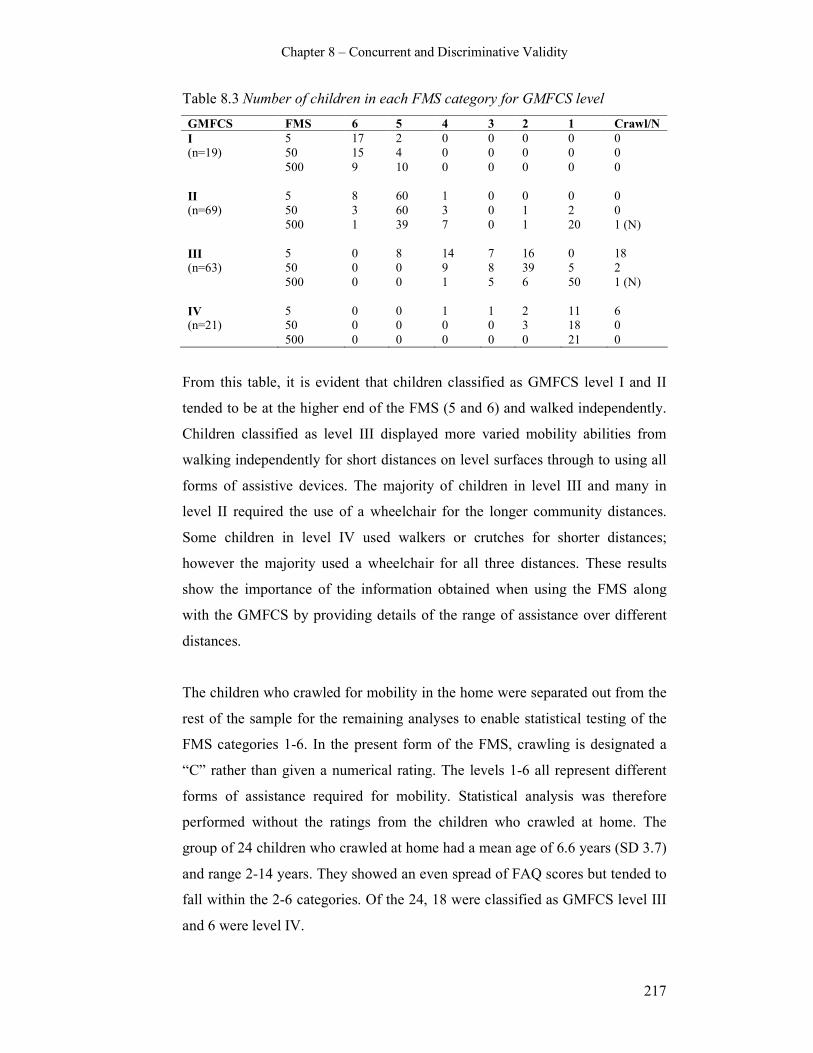
Chapter 8 – Concurrent and Discriminative Validity
217
Table 8.3 Number of children in each FMS category for GMFCS level
GMFCS FMS 6 5 4 3 2 1 Crawl/N
I 5 17 2 0 0 0 0 0
(n=19) 50 15 4 0 0 0 0 0
500 9 10 0 0 0 0 0
II 5 8 60 1 0 0 0 0
(n=69) 50 3 60 3 0 1 2 0
500 1 39 7 0 1 20 1 (N)
III 5 0 8 14 7 16 0 18
(n=63) 50 0 0 9 8 39 5 2
500 0 0 1 5 6 50 1 (N)
IV 5 0 0 1 1 2 11 6
(n=21) 50 0 0 0 0 3 18 0
500 0 0 0 0 0 21 0
From this table, it is evident that children classified as GMFCS level I and II
tended to be at the higher end of the FMS (5 and 6) and walked independently.
Children classified as level III displayed more varied mobility abilities from
walking independently for short distances on level surfaces through to using all
forms of assistive devices. The majority of children in level III and many in
level II required the use of a wheelchair for the longer community distances.
Some children in level IV used walkers or crutches for shorter distances;
however the majority used a wheelchair for all three distances. These results
show the importance of the information obtained when using the FMS along
with the GMFCS by providing details of the range of assistance over different
distances.
The children who crawled for mobility in the home were separated out from the
rest of the sample for the remaining analyses to enable statistical testing of the
FMS categories 1-6. In the present form of the FMS, crawling is designated a
“C” rather than given a numerical rating. The levels 1-6 all represent different
forms of assistance required for mobility. Statistical analysis was therefore
performed without the ratings from the children who crawled at home. The
group of 24 children who crawled at home had a mean age of 6.6 years (SD 3.7)
and range 2-14 years. They showed an even spread of FAQ scores but tended to
fall within the 2-6 categories. Of the 24, 18 were classified as GMFCS level III
and 6 were level IV.

Chapter 8 – Concurrent and Discriminative Validity
218
8.3.2. Concurrent validity results
The Spearman rank correlation coefficients for each FMS distance correlated
with the FAQ and GMFCS are presented in table 8.4. This calculation was
performed on the sample excluding the children who crawled for 5 or 50 metres
or who were rated as “N” (does not do) for 500 metres. After exclusion of these
children there were 148 observations for FMS 5 metres and 170 observations for
50 and 500 metres.
Table 8.4 Correlations of the FMS with the FAQ and GMFCS (rho)
FMS 5 (n=148) FMS 50 (n=170) FMS 500 (n=170)
GMFCS
r = -0.89
r = -0.91
r = -0.74
FAQ
r = 0.69 r = 0.76 r = 0.79
All p values for these correlations were 0.0000 rejecting the null hypothesis that
there was no relationship between the two variables. The negative correlations
with the GMFCS reflect the direction of the scale and classification. The FMS
categories range from 6 to 1; from independent walking (6) to requiring a
wheelchair (1). The GMFCS ranges from I-IV in the opposite direction.
Figures 8.1-8.3 display the correlations using scatter plots between each FMS
distance and the FAQ while figures 8.4-8.6 show the scatter plots between the
FMS and GMFCS. Because the FMS, FAQ and GMFCS are all measured on a
categorical level, the scatter plots were enhanced to ensure that all points were
considered. This is displayed on the graphs by the different sized circles on each
of the coordinates. This illustrates that for some coordinate points a number of
associations are represented.

Chapter 8 – Concurrent and Discriminative Validity
219
12
34
56
fms5
2 4 6 8 10faq
Figure 8.1 Scatter plot FMS 5 metres with the FAQ
12
34
56
fms50
0 2 4 6 8 10faq
Figure 8.2 Scatter plot FMS 50 metres with the FAQ
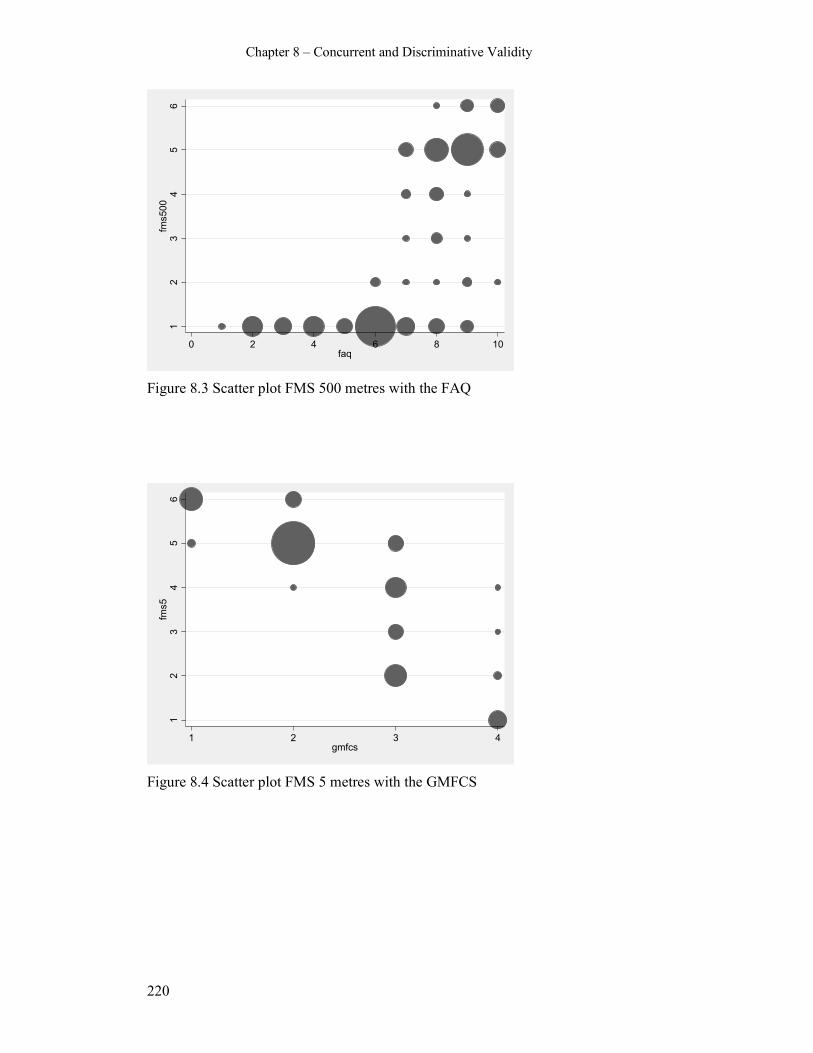
Chapter 8 – Concurrent and Discriminative Validity
220
12
34
56
fms500
0 2 4 6 8 10faq
Figure 8.3 Scatter plot FMS 500 metres with the FAQ
12
34
56
fms5
1 2 3 4gmfcs
Figure 8.4 Scatter plot FMS 5 metres with the GMFCS

Chapter 8 – Concurrent and Discriminative Validity
221
12
34
56
fms50
1 2 3 4gmfcs
Figure 8.5 Scatter plot FMS 50 metres with the GMFCS
12
34
56
fms500
1 2 3 4gmfcs
Figure 8.6 Scatter plot FMS 500 metres with the GMFCS
The scatter plots for correlation of the FMS with the FAQ (Figures 8.1-8.3)
show that there is a positive correlation for all three distances of the FMS. The 5
and 50 metre plots are similar with an increased number of points represented
by level 6 on the FAQ and a grouping of points at the higher end on both scales.
This suggests that those children who score higher on the FMS for 5 and 50

Chapter 8 – Concurrent and Discriminative Validity
222
metres also score higher on the FAQ. The 500 metre distance shows a slightly
different pattern with a large number of children who scored 1 on the FMS (use
a wheelchair) showing a range of scores on the FAQ. There is also a grouping of
scores at the higher end on both scales.
The scatter plots describing the relationship between the FMS and GMFCS
(Figures 8.4-8.6) show clear negative relationships for 5, 50 and 500 metres.
The negative direction is due to the opposite direction of categorisation for the
respective scales. All three plots show a collection of children who score 5 on
the FMS and are classified as GMFCS level II. Children classified as GMFCS
level III show a range of scores on the FMS, particularly at 5 and 50 metres.
Similar to the FAQ scatter plots for 500 metres, many children who score 1 on
the FMS (use a wheelchair) show a range of GMFCS levels.
8.3.3. Discriminative validity results
For the calculation of the area under the ROC curve the children were grouped
according to “independent walking” or “assisted walking”. There were 84
children in the “independent” group and 88 in the “assisted” group. The data for
the children who crawled or “does not do” were omitted for the purpose of
statistical analysis because they are not assigned a score between 1-6. Results
for the area under the ROC curves are summarized in table 8.5. A non-
discriminating test would have an area of 0.5 and a perfect test would score 1.0
(Streiner and Norman 2003). The results for each distance show the FMS to
have good ability to discriminate between independent and assisted walkers,
particularly for the 5 and 50 metre distances where the figures are close to 1.0.
The graphs of the ROC curves are displayed for each FMS distance in Figures
8.7-8.9.
Table 8.5 Area under the ROC curve for each FMS distance
Area under ROC
Standard error Confidence Interval
FMS 5
(n=148)
0.95 0.017 (0.92, 0.98)
FMS 50
(n=170)
0.97 0.015 (0.94, 1.0)
FMS 500
(n=170)
0.87 0.026 (0.82, 0.92)
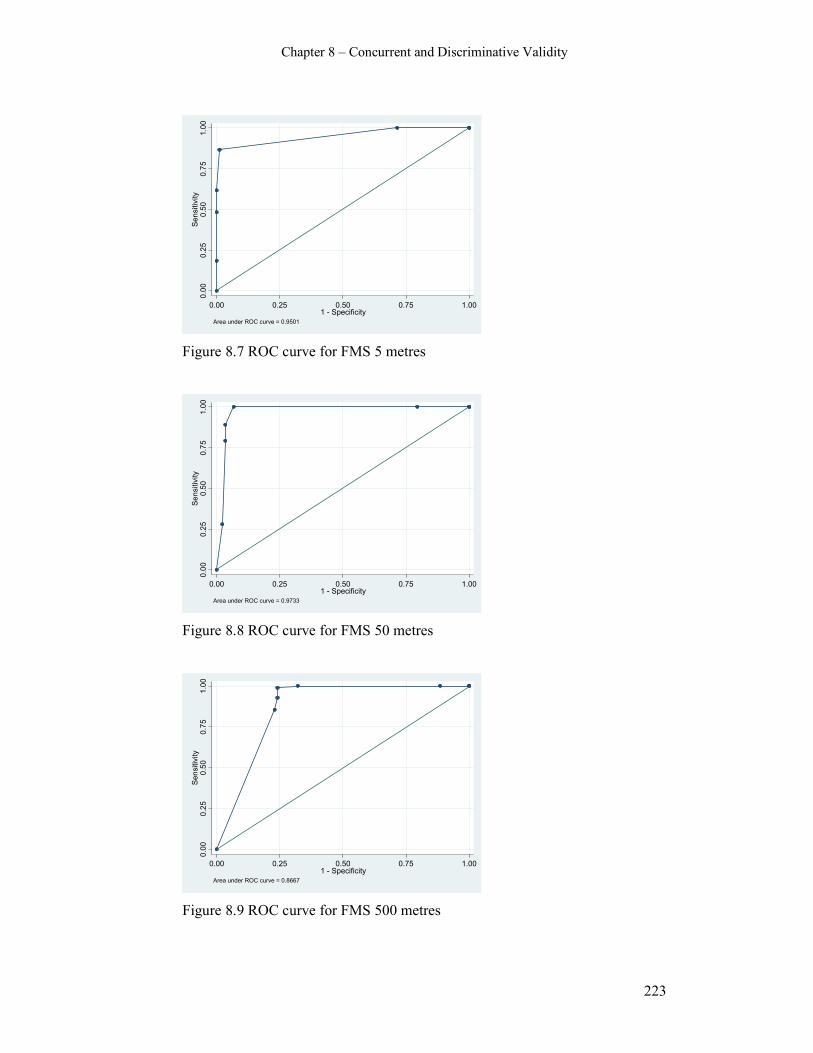
Chapter 8 – Concurrent and Discriminative Validity
223
0.00
0.25
0.50
0.75
1.00
Sensitivity
0.00 0.25 0.50 0.75 1.001 - Specificity
Area under ROC curve = 0.9501
Figure 8.7 ROC curve for FMS 5 metres
0.00
0.25
0.50
0.75
1.00
Sensitivity
0.00 0.25 0.50 0.75 1.001 - Specificity
Area under ROC curve = 0.9733
Figure 8.8 ROC curve for FMS 50 metres
0.00
0.25
0.50
0.75
1.00
Sensitivity
0.00 0.25 0.50 0.75 1.001 - Specificity
Area under ROC curve = 0.8667
Figure 8.9 ROC curve for FMS 500 metres
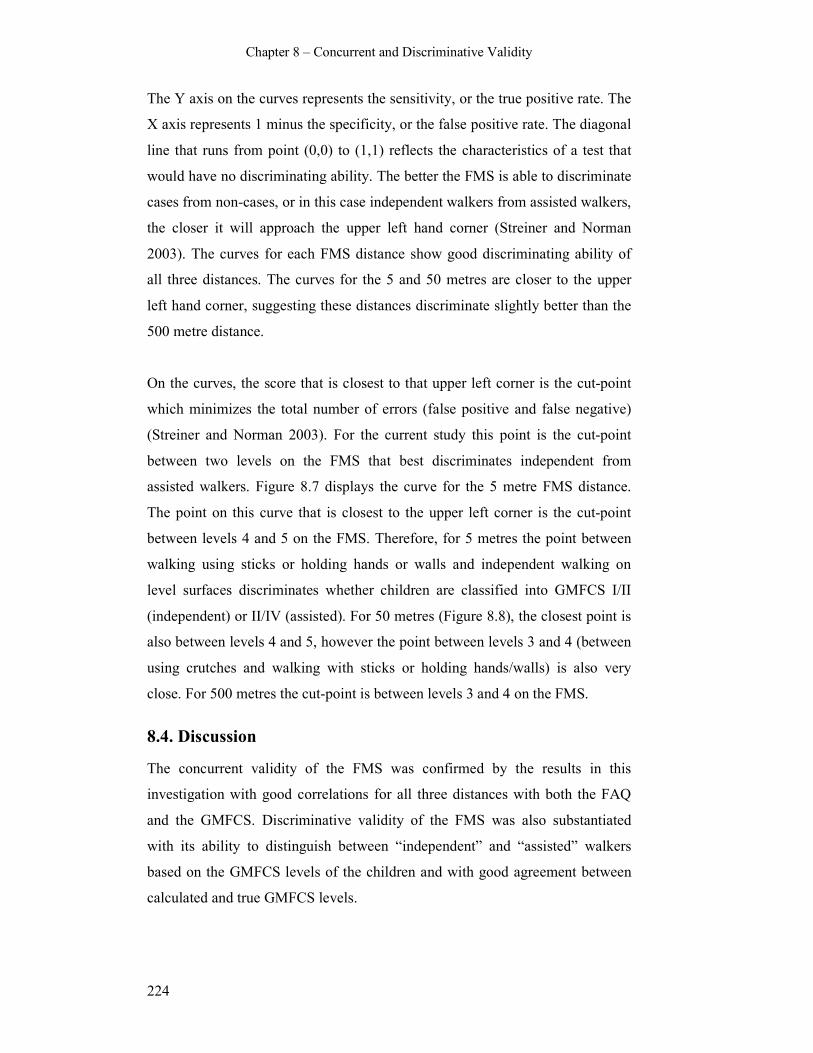
Chapter 8 – Concurrent and Discriminative Validity
224
The Y axis on the curves represents the sensitivity, or the true positive rate. The
X axis represents 1 minus the specificity, or the false positive rate. The diagonal
line that runs from point (0,0) to (1,1) reflects the characteristics of a test that
would have no discriminating ability. The better the FMS is able to discriminate
cases from non-cases, or in this case independent walkers from assisted walkers,
the closer it will approach the upper left hand corner (Streiner and Norman
2003). The curves for each FMS distance show good discriminating ability of
all three distances. The curves for the 5 and 50 metres are closer to the upper
left hand corner, suggesting these distances discriminate slightly better than the
500 metre distance.
On the curves, the score that is closest to that upper left corner is the cut-point
which minimizes the total number of errors (false positive and false negative)
(Streiner and Norman 2003). For the current study this point is the cut-point
between two levels on the FMS that best discriminates independent from
assisted walkers. Figure 8.7 displays the curve for the 5 metre FMS distance.
The point on this curve that is closest to the upper left corner is the cut-point
between levels 4 and 5 on the FMS. Therefore, for 5 metres the point between
walking using sticks or holding hands or walls and independent walking on
level surfaces discriminates whether children are classified into GMFCS I/II
(independent) or II/IV (assisted). For 50 metres (Figure 8.8), the closest point is
also between levels 4 and 5, however the point between levels 3 and 4 (between
using crutches and walking with sticks or holding hands/walls) is also very
close. For 500 metres the cut-point is between levels 3 and 4 on the FMS.
8.4. Discussion
The concurrent validity of the FMS was confirmed by the results in this
investigation with good correlations for all three distances with both the FAQ
and the GMFCS. Discriminative validity of the FMS was also substantiated
with its ability to distinguish between “independent” and “assisted” walkers
based on the GMFCS levels of the children and with good agreement between
calculated and true GMFCS levels.

Chapter 8 – Concurrent and Discriminative Validity
225
8.4.1. Concurrent validity
Concurrent validity was examined using an outcome measure, the FAQ, and a
classification system, the GMFCS. The highest correlations were between FMS
5 metres and the GMFCS and between FMS 50 metres and the GMFCS. The
GMFCS classifies children according to their gross motor function and is based
on activity limitation. A strong correlation of the FMS with the GMFCS
provides important evidence that it is measuring activity limitation. The highest
correlation of the GMFCS with FMS 50 metres suggests it is this distance that
clinicians consider when allocating a GMFCS level to a particular child. The
FAQ measures walking ability and is the most similar measure to the FMS. It is
reassuring that the correlations with the FAQ were high, suggesting they are
both measuring the same aspect of activity. It is also reassuring that the
correlations were not perfect, and varied between the three subscales of the
FMS, ensuring there is no issue of redundancy of the FMS.
The FMS and the FAQ are both measures of mobility. They differ on the
construct of assistance required for mobility with the FMS differentiating the
assistance required in different environmental settings. The FAQ is rated
independent of the assistive devices the child uses. If the correlations were
found to be very high it might indicate some overlap between the scales and
suggest redundancy of one of the measures. The correlations found show strong
yet imperfect relationships between the two measures. This suggests they
measure similar domains while being sufficiently different to ensure the clinical
utility of both. The FAQ is not considered a gold standard for measuring
mobility in children with CP. In the absence of such a gold standard it was
considered to be the most similar tool for correlation with the FMS. The FAQ
had not been considered in the preliminary work on the FMS (Graham et al
2004). The GMFCS is not an outcome measure, it is a classification system. The
good correlation with it provides evidence that the FMS is measuring gross
motor function and across the spectrum of severity of motor impairment seen in
children with CP.

Chapter 8 – Concurrent and Discriminative Validity
226
There is considerable literature on the correlation of outcome measures used for
children with CP. Many studies have examined the relationship between these
measures without formally examining concurrent validity of one particular
outcome measure (Drouin et al 1996, Ottenbacher et al 1999, Schneider et al
2001, Tervo et al 2002, Abel et al 2003, Oeffinger et al 2004, Sullivan et al
2007). The strongest relationships have been found between those tools
measuring change in physical function rather than those assessing social and
cognitive status (Oeffinger et al 2004, Sullivan et al 2007). Stronger
relationships were found between tools where both measure activity limitation
than where one measures activity and the other measures body structures and
function (Tervo et al 2002, Abel et al 2003).
Other studies examining outcome measures that concentrate on activity
limitation in children with CP have supported the concurrent validity of the
ASK (Young et al 2000, Pencharz et al 2001), the CHQ (Pencharz et al 2001,
McCarthy et al 2002), the FAQ (Novacheck et al 2000), the GMFM (Russell et
al 1989), the PEDI (Wright and Boschen 1993, McCarthy et al 2002), and the
PODCI (Daltroy et al 1998, Pencharz et al 2001, Vitale et al 2001, McCarthy et
al 2002, Damiano et al 2005, Vitale et al 2005). The overall theme for all of the
studies is that correlation was highest for like domains, such as the FAQ with
the PODCI transfers and mobility domain (Novacheck et al 2000) and for tools
that measure the same constructs, such as the WeeFIM and PEDI (Ziviani et al
2001). Correlations were found to be lower between tools measuring different
constructs such the FAQ with energy expenditure (Novacheck et al 2000) or
between unlike domains of multidimensional scales such as the CHQ and
PODCI (Pencharz et al 2001, McCarthy et al 2002).
The preliminary study of the concurrent validity of the FMS showed strong
correlations with Uptime, PODCI and CHQ, moderate with the Hoffer scale and
lower with energy expenditure (Graham et al 2004). Like the studies examining
concurrent validity of other activity limitation tools, it is expected that
correlations would be higher with tools measuring similar constructs. Lower
correlation with energy expenditure is not unexpected because it is measuring a
physiological response of the body to activity as opposed to the FMS that is a
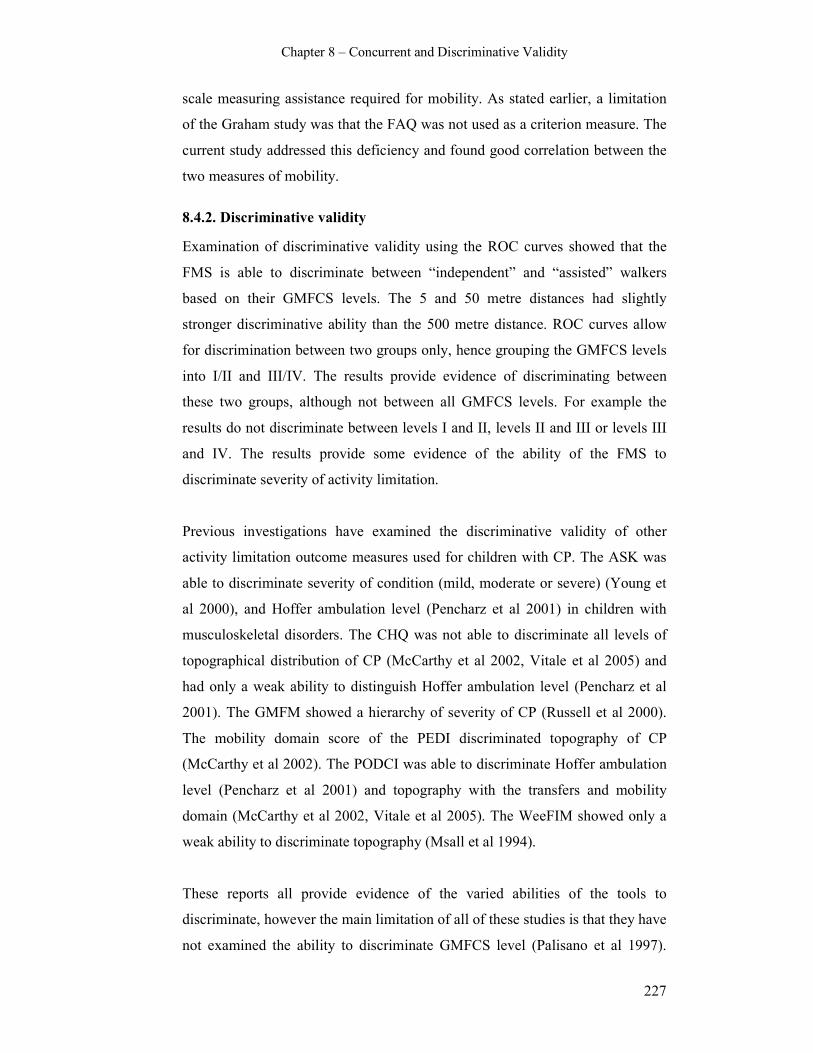
Chapter 8 – Concurrent and Discriminative Validity
227
scale measuring assistance required for mobility. As stated earlier, a limitation
of the Graham study was that the FAQ was not used as a criterion measure. The
current study addressed this deficiency and found good correlation between the
two measures of mobility.
8.4.2. Discriminative validity
Examination of discriminative validity using the ROC curves showed that the
FMS is able to discriminate between “independent” and “assisted” walkers
based on their GMFCS levels. The 5 and 50 metre distances had slightly
stronger discriminative ability than the 500 metre distance. ROC curves allow
for discrimination between two groups only, hence grouping the GMFCS levels
into I/II and III/IV. The results provide evidence of discriminating between
these two groups, although not between all GMFCS levels. For example the
results do not discriminate between levels I and II, levels II and III or levels III
and IV. The results provide some evidence of the ability of the FMS to
discriminate severity of activity limitation.
Previous investigations have examined the discriminative validity of other
activity limitation outcome measures used for children with CP. The ASK was
able to discriminate severity of condition (mild, moderate or severe) (Young et
al 2000), and Hoffer ambulation level (Pencharz et al 2001) in children with
musculoskeletal disorders. The CHQ was not able to discriminate all levels of
topographical distribution of CP (McCarthy et al 2002, Vitale et al 2005) and
had only a weak ability to distinguish Hoffer ambulation level (Pencharz et al
2001). The GMFM showed a hierarchy of severity of CP (Russell et al 2000).
The mobility domain score of the PEDI discriminated topography of CP
(McCarthy et al 2002). The PODCI was able to discriminate Hoffer ambulation
level (Pencharz et al 2001) and topography with the transfers and mobility
domain (McCarthy et al 2002, Vitale et al 2005). The WeeFIM showed only a
weak ability to discriminate topography (Msall et al 1994).
These reports all provide evidence of the varied abilities of the tools to
discriminate, however the main limitation of all of these studies is that they have
not examined the ability to discriminate GMFCS level (Palisano et al 1997).

Chapter 8 – Concurrent and Discriminative Validity
228
The studies have used the ability to discriminate topographical distribution of
CP, Hoffer ambulation level or severity of condition (mild, moderate or severe)
as their classification. As stated in Chapter Two, the GMFCS is now used
widely to classify the motor function of children with CP. It is important that the
GMFCS is considered when examining the discriminative validity of these
tools. For some of the above studies, the timing of the study in relation to the
timing of the introduction of the GMFCS into the field of measurement in CP
explains why it has not been examined. Further examination of discriminative
validity using the GMFCS is warranted.
A more recent investigation examined the ability of a number of tools to
discriminate GMFCS level in a large sample of 562 children with CP aged 4-18
years, GMFCS levels I-III (Bagley et al 2007). The data was analysed using
effect size indices, odds ratios, regression analysis and ROC curves. Overall the
study found that measures of physical function were able to differentiate
GMFCS levels better than those measuring cognitive function or quality of life.
In isolation the GMFM-66 was the best at discriminating between GMFCS I and
II and between II and III. Together the GMFM, gait velocity and the WeeFIM
mobility domain had the best ability to discriminate between levels I and II.
Together the GMFM, WeeFIM, cadence and FAQ had the best ability to
discriminate between levels II and III. It is not surprising that the GMFM in
isolation had the highest discriminatory ability. This can be explained by the
background to the development of the GMFCS, which is based on the GMFM
scores of 275 children with CP of differing severity (Palisano et al 1997). It is
also not surprising that the physical function measures were better able to
discriminate because the GMFCS is based on motor function not cognitive or
quality of life. This study is important because it does use the GMFCS, however
its main limitation is the children included represent levels I-III only, and the
results can only be generalized to this limited population.
The current study used the GMFCS in the examination of discriminative
validity. The sample included a broader range of GMFCS levels than the Bagley
study with children in levels I-IV represented. The FMS had not been
previously examined for discriminative validity using the GMFCS. The

Chapter 8 – Concurrent and Discriminative Validity
229
preliminary study examined its ability to distinguish Hoffer ambulation level
(Graham et al 2004), however as stated in the introduction of this chapter, no
formal statistical analysis was performed. The current study provides good
evidence of the ability of the FMS to discriminate one aspect of severity of
motor impairment based on the most widely used classification system of motor
impairment.
Because the FMS is an evaluative measure, the most important aspect of
validity to examine is its ability to detect clinically important change over time
(Kirschner and Guyatt 1985). This was examined in Chapter Six. Although it is
not imperative that the FMS is able to discriminate all levels of the GMFCS, the
results of the current study on concurrent and discriminative validity provide
further evidence of the construct validity of the tool by examining the
relationship between measures concerning the concept of interest (Nunnally
1978, Kirschner and Guyatt 1985, Streiner and Norman 2003). Together all
experiments on validity and responsiveness support the overall validity of the
FMS as a psychometrically sound measure of activity.
8.4.3. Limitations and recommendations
There are a number of limitations of this investigation. The sample used was a
combination of two cohorts of children recruited for the investigations into the
reliability and responsiveness of the FMS. Both of those samples were samples
of convenience and the children were recruited consecutively from the clinics
and gait laboratory of The Royal Childrens Hospital, Melbourne, Australia. The
limitations of using samples of convenience have been discussed previously.
The main limitation of such samples is the potential to introduce a biased
sample that does not represent the population of interest. Although a random
sample would minimise this bias, the clinics from which the children were
recruited comprise those children that the FMS is routinely used with. It is
therefore likely that the sample closely resembled the population of interest.
The sample used in the current study comprised more males (65%) than females
(35%) and children predominantly with spastic diplegia (66%) than hemiplegia
(16%) or quadriplegia (18%). The spread of GMFCS levels of the children was
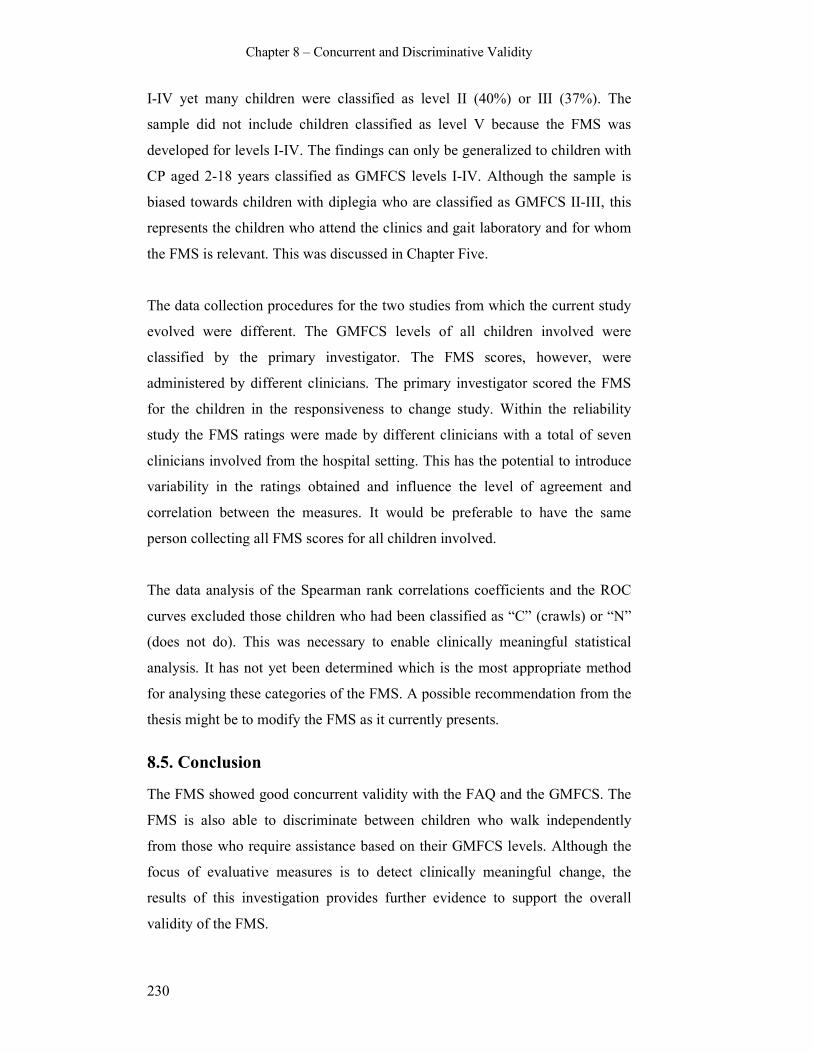
Chapter 8 – Concurrent and Discriminative Validity
230
I-IV yet many children were classified as level II (40%) or III (37%). The
sample did not include children classified as level V because the FMS was
developed for levels I-IV. The findings can only be generalized to children with
CP aged 2-18 years classified as GMFCS levels I-IV. Although the sample is
biased towards children with diplegia who are classified as GMFCS II-III, this
represents the children who attend the clinics and gait laboratory and for whom
the FMS is relevant. This was discussed in Chapter Five.
The data collection procedures for the two studies from which the current study
evolved were different. The GMFCS levels of all children involved were
classified by the primary investigator. The FMS scores, however, were
administered by different clinicians. The primary investigator scored the FMS
for the children in the responsiveness to change study. Within the reliability
study the FMS ratings were made by different clinicians with a total of seven
clinicians involved from the hospital setting. This has the potential to introduce
variability in the ratings obtained and influence the level of agreement and
correlation between the measures. It would be preferable to have the same
person collecting all FMS scores for all children involved.
The data analysis of the Spearman rank correlations coefficients and the ROC
curves excluded those children who had been classified as “C” (crawls) or “N”
(does not do). This was necessary to enable clinically meaningful statistical
analysis. It has not yet been determined which is the most appropriate method
for analysing these categories of the FMS. A possible recommendation from the
thesis might be to modify the FMS as it currently presents.
8.5. Conclusion
The FMS showed good concurrent validity with the FAQ and the GMFCS. The
FMS is also able to discriminate between children who walk independently
from those who require assistance based on their GMFCS levels. Although the
focus of evaluative measures is to detect clinically meaningful change, the
results of this investigation provides further evidence to support the overall
validity of the FMS.

Chapter 9 – Grand Discussion
231
CHAPTER NINE: GRAND DISCUSSION AND
CONCLUSIONS
The studies in this thesis have focused on specific aspects of psychometric
testing of the FMS and have critically evaluated measurement tools used to
assess activity in children with CP. This final chapter combines the findings to
emphasize the major themes to emerge. In addition to synthesizing the findings,
this chapter will also discuss the clinical implications of this research and the
limitations of the research. Future directions will be presented to include future
research using the FMS as well as potential changes to the scale, followed by
the overall conclusions.
9.1. Synthesis of findings
There were a number of major themes to emerge from this thesis. These themes
encompass; the importance of having clinically useful and psychometrically
sound tools available to measure activity, the influence of the environment on
assistance required for mobility and the issues around self-reporting and
whether it reflects performance.
9.1.1. The importance of robust tools to measure activity limitation
Mobility involves “changing location or transferring from one place to another”
(World Health Organisation 2001). It stands to reason that optimal mobility of
children with CP will encourage their participation with their peers and family.
This thesis has highlighted the need to quantify mobility using reliable and valid
tools. It has emphasized the importance of being able to measure the changes in
assistive devices utilized by children as they grow or following therapeutic
interventions (Harvey et al 2007). The influence of the environment on activity
limitation, in particlur mobility, constantly emerged throughout this thesis. The
ability to be able to quantify this influence is pertinent. The systematic review in
Chapter Three showed that despite there being several measurement tools
available that assess activity, the FMS is the only one that quantifies the
assistive devices required in the different environmental settings of the home,
school and community. The ability of the FMS to detect both the deterioration
and improvement following complex interventions such as SEMLS, as shown in

Chapter 9 – Grand Discussion
232
the pilot study in Chapter Four, is critical in the clinical setting where the aims
of costly interventions is to improve or maintain the mobility status of these
children.
The collective results of the studies in Chapters Five to Eight demonstrated that
the FMS, which has a high level of face validity, is a psychometrically sound
measurement tool. The results of the inter-rater reliability and concurrent and
discriminative validity studies were conclusive. The responsiveness to change
study provided some important evidence of the ability of the FMS to show
change where change occurred and also showed evidence of stability where no
change in mobility was expected. Further work in this area is required as will be
reported in future directions. The construct validity study was a feasibility study
and revealed some very important issues regarding the nature of self or parent
reporting. These will be discussed further later in this section. Although the
studies were classified as separate psychometric entities, many of the studies
provided evidence of the construct validity of the FMS, that is, Chapters Six,
Seven and Eight. Validation is an ongoing process and the studies in this thesis
have contributed greatly to the validation of the FMS as a clinical and research
tool for quantifying mobility.
9.1.2. The influence of the environment on mobility
Another theme to emerge overall was that children with CP use different
mobility methods. Chapter Seven found that not only is there a range utilised by
children generally, the same child often uses more than one method of mobility
across and within environmental settings. There are a number of potential
explanations for the variety seen within the group and for individual children.
The severity of the motor impairment of the child, as described by their GMFCS
level, will play a role in mobility methods used. Children in levels I and II walk
independently and therefore walk without assistive devices. Children in level III
use assistive devices to ambulate and it is this level where the most variety of
methods was seen. Children in level IV use a wheelchair for the majority of the
time with minimal walking for short distances only, usually with a walker and
adult assistance. Children in level V use wheelchairs for all forms of mobility.

Chapter 9 – Grand Discussion
233
The other significant influence on mobility methods used by children with CP is
the environmental setting. This thesis has shown that mobility and the methods
chosen can be influenced markedly by the environmental setting in which the
child is moving around. Within each setting, some of the factors that have the
potential to influence mobility are safety, familiarity with the environment,
access and liability issues. Within their home the child is very familiar with the
environmental conditions and distances are shorter. They would feel safe and be
able to move around with less assistance than at school or in the community,
where distances are longer and the environment is less familiar (Palisano et al
2003).
Some of the factors related to the school environment that can influence
mobility are liability issues around safety at school, greater time pressure, and
the presence of obstacles impeding free movement (Haley et al 1994). Legal
issues can determine methods used and in some instances may limit a child’s
potential function, as noted through clinical experience from parental report. For
example, a child who is able to use crutches might be instructed by the school to
use a walker or wheelchair at school due to concerns the child might hurt
themself. Without the everyday practise of using the crutches the child’s activity
is being compromised. Time pressure for the child at school is particularly
pertinent throughout the secondary school years where children are expected to
be more independent. The adolescent with CP might choose to use a wheelchair,
even electric wheelchair, so that they are able to get to class on time without
assistance.
Other determinants of mobility methods used might include time pressures,
convenience and choice. Clinical experience suggests that parents will often
push their child in a wheelchair when they go shopping because it takes less
time and behavioural issues can be better managed. Many children with CP
have high equipment needs. For a child who has more than one assistive device,
the parent might choose to leave one at school and one at home. For example,
the family of a child who uses crutches at home and a walker at school might
choose to leave the walker at school for convenience. This could limit the
choice for community distances where the only choice is now wheelchair
Chapter 9 – Grand Discussion
234
because the walker is at school. The other determinant is personal choice of the
child. For instance, some children might be physically able to use crutches, yet
they choose to use a walker because they are faster and more stable with it and
can keep up with their peers more easily.
9.1.3. Issues around self-report measures
Another major theme to emerge from the thesis is the issue of whether self-
report measures, such as the FMS, really do measure performance and whether
they reflect what is truly happening. The results from the investigation in
Chapter Seven revealed the question mark around whether self-report methods
are a valid way of measuring performance. Performance measures should reflect
what the child does in everyday function (Young and Wright 1995). Self-report
measures are thought to be effective in obtaining information on typical
performance because it can be difficult to obtain this from a formal assessment
situation (Long 1992). Clinicians assume that what is seen in the clinic or
reported from the parents about the child’s function reflects usual performance
(Rosenbaum 2007). It is usually assumed that respondents will answer honestly
to items in a questionnaire (Streiner and Norman 2003). There are a number of
factors that might influence the validity of self or parent report including;
knowledge of the child’s mobility at school, responder bias and wording of
questions from clinicians.
Chapter Seven discussed how parents might be less familiar with their child’s
mobility at school than the community physiotherapist who visits the child at
school. Alternatively the parent is likely to be more familiar with their child’s
mobility at home. These differences in familiarity of a child’s mobility in
different settings have the potential to influence the accuracy of the report
given. Responder bias can also influence self-report measuring. Parents might
want to report the capability of their child, that is their best function, if they feel
it might avoid an intervention. Alternatively they may rate their child lower if
they feel it would result in an intervention. The former situation can be
considered “faking good” or social desirability and the latter as “faking bad” or
deviation (Streiner and Norman 2003). These issues are also relevant if the child
is the respondent. The way the questions are asked can determine what is
Chapter 9 – Grand Discussion
235
reported. A study compared the answers to specific questions of the CHQ,
PODCI and PEDI from the parents of 66 children with CP (Wren et al 2007).
Differences in wording had an effect on parent’s responses suggesting that
wording and context of questions is important.
An example of a different ratings obtained from the same child was found in the
reliability study in Chapter Five. One of the ratings was performed by the
child’s usual community physiotherapist rating the child at school (who was 16
years old with no cognitive impairments) and a rating of 5, 1, 1 was obtained.
The second rating was performed by a hospital physiotherapist who was
unfamiliar with the child. It was performed within the clinic setting by asking
the father of the child and a rating of 4, 1, 1 was obtained. The difference in
scores could be the result of the responders (child report versus parent) or
because the community physiotherapist was less familiar with the child’s
performance at home and that influenced her rating.
Despite these issues with self-report measures, they remain the most convenient
method of measuring performance in activities of children with CP. A more
recent suggestion has been that services need to change the balance of focus
from the clinic to the home and community to observe the children in their
environments (Rosenbaum 2007). It is not always practical for clinicans to
observe children in their own environments. They rely on self-report measures
to gather that information.
Another issue of using self-report measures is determining who the best
responder is. The options include the child, the parent or a proxy. Each will
provide a different perspective of the child’s function. Other tools that measure
activity involve varying perspectives. The GMFM measures capability through
direct observation of the child by the therapist. The FAQ reports the parent
perspective. The FMS uses either child or parent report interpreted by the
clinican. The ASK reports the child perspective unless they are unable to
complete it themselves. The CHQ and PODCI have both adolescent and parent
versions. The WeeFIM reports the clinican perspective and the PEDI reports a
combination of parent and clinican perspective.
Chapter 9 – Grand Discussion
236
It is now thought that the child’s view should, where possible, be sought directly
rather than being inferred from proxy reports such as parents (Colver and Group
2006). However, age or cognitive ability may impair communication (Young
and Wright 1995). Children may not be able to convey information regarding
their own experience, thus relying on parental and caregiver proxy reports
(Simeonsson et al 2003). In a sample of 148 children with CP, 47% were able to
self-report using the PedsQL (Varni et al 2005). The reliability of child report
was examined in 28 children with musculoskeletal disorders using the ASK
(Young et al 1995). Retest reliability of the children was excellent and their
scores were highly concordant with parent-reported ASK scores. Child report
has been shown to differ from parent report on the PODCI and PedsQL with
child report values higher (Oeffinger et al 2007). Because different perspectives
may potentially give different responses, it might be clinically beneficial to
obtain both the child and parent perspective.
9.2. Clinical implications
The FMS is an evaluative measure that has unique characteristics by quantifying
and differentiating the assistance required in the different environmental settings
of home, school and community. No other outcome measure provides this
information. An evaluative measure must; contain relevant items, be applicable
to the population for whom it was developed, be feasible to use, be reliable and
valid for that purpose and be responsive to clinically important change over time
(Rosenbaum et al 1990). This thesis has provided evidence of these
requirements for the FMS.
The FMS has sound psychometric properties for children with CP aged 4-18
years who are classified as GMFCS levels I-IV. Although the FMS was not
developed with scientific rigor, the studies in this thesis have validated it and
proved that it is a clinically useful, reliable and valid measure that is able to
show change in mobility. The FMS is now available for use by physiotherapists
and other clinicians to quantify mobility in children with CP and measure
changes associated with growth and development and following costly
Chapter 9 – Grand Discussion
237
interventions, such as orthopaedic surgery. It is available as both a clinical
assessment tool and for use in research studies.
The FMS is a feasible outcome measure. Feasibility relates to the time needed to
perform the measurement, the equipment required and training required for
administration (Dekker et al 2005). The FMS can be administered within 10
minutes and does not require any equipment for administration. Formal training
is not required, however it is suggested that clincians read the brochure that has
been developed as part of this thesis prior to using the scale because it provides
guidelines for administration. The FMS can also be administered over the
telephone because it is a clinician interpreted self-report measure. This adds to
its feasibility. Outcome measures that are more time consuming to administer
and require equipment and/or training, such as the PEDI and GMFM, provide
more detailed information but may lose some clinical utility as a result.
Chapter Four showed that the FMS is a clinically useful tool that can measure
change in mobility following interventions (Harvey et al 2007). Many children
with CP have simple and complex interventions throughout their childhood and
it is important to have reliable and valid tools that can measure deterioration and
improvement in activites, including mobility, following these interventions.
Used in conjunction with other simple ordinal measures and classifications such
as the FAQ and GMFCS it is able to provide a good description of activity in
children with CP. The FMS is specific to mobility. Other measurement tools
available may be less specific, such as the ASK, CHQ, PODCI and PEDI. They
give broader picture of activity or health status in general, however there is the
potential to lose specificity with that.
Because the FMS is a clinically feasible tool that does not have high training or
equipment needs it can be used in many clinical settings. This includes settings
where clinicians do not have access to highly technical equipment as would be
found in a gait laboratory. This also includes rural settings and developing
countries where access to expensive technology may be uneven or restricted
(Graham and Harvey 2007). Another advantage of the FMS is it can be used by
a range of clinicians, as shown in the reliability study in Chapter Five. It is a

Chapter 9 – Grand Discussion
238
multidisciplinary tool for use by those who assess activity limitation in children
with CP, including physiotherapists, orthopaedic surgeons, rehabilitation
specialists, physicians and paediatricians.
Chapter Two introduced the ICF in relation to outcome measurement for
children with CP. The FMS does not claim to measure all aspects of activity, it
focuses on mobility. Used in conjunction with other tools that also assess
activity, such as the FAQ, GMFM and ASK, as well as those that examine
aspects of body structures and functions and participation, a comprehensive
assessment of a child with CP is provided. For example, a child with CP who
may require multilevel surgery could be assessed pre-operatively with three
dimensional gait analysis, radiology and range of movement measures to cover
body structures and functions. The FMS, FAQ, GMFM and ASK could be
included to examine activity and a measure, such as the CAPE, to cover
participation. The result could be a comprehensive set of tools providing
information from all areas of the ICF, including both aspects of performance
and capability and both self-report and direct observation. The same set could
then be used post-operatively to compare with pre-operative status to examine
the effects of the interventions.
Chapters Three and Six emphasize the importance of matching outcome
assessment tools to the aims of the measurement. If the measure selected is used
to assess change after an intervention, a consideration of the aims of that
intervention is necessary. This ensures that clinicians use the most appropriate
tools rather than basing selection on familiarity or popularity. For example, to
assess change after Botulinum toxin injections, the most appropriate measure
might be measures of spasticity and range of movement because the aim of the
intervention is to reduce spasticity and prevent the development of contractures
(Graham et al 2000). As shown in Chapter Six, the FMS may not show any
change because the mobility status of the child would not be expected to
change. Alternatively, the aim of SEMLS is to correct deformity, improve the
gait pattern and maintain or improve mobility. The appropriate measures in this
case could include three dimensional gait analysis to detect changes in gait
pattern, range of movement measures to show change in deformities and tools
Chapter 9 – Grand Discussion
239
such as the FMS to show changes in mobility. Using inappropriate tools for that
purpose might lead to inaccurate conclusions about no change in the concept
being measured, when in fact change has occurred in a domain not assessed by
the measure.
Use of the FMS in the clinical and research setiings has gained momentum since
its initial development and publication. Studies have used the FMS to show
changes in mobility following hamstrings surgery in children with bilateral CP
(Ma et al 2006). The 50 metre distance of the FMS was used to compare with
the Physiological Cost Index in children with CP to evaluate the efficiency of
ambulation (Raja et al 2007). The FMS has also been used in children with
myelomeningocele to compare the functional mobility of children who have a
ventriculoperitoneal shunt with those who have no shunt (Battibugli et al 2007).
It is anticipated that following publication of the results obtained in this thesis
that use of the FMS will continue to grow in the clinical and research arenas.
9.3. Limitations
The limitations of the individual studies were discussed in detail within the
relevant chapters. The main themes to emerge regarding the limitations of the
studies revolve around the sample biases, the sample sizes and the recruitment
process.
The samples in the reliability, responsiveness to change and concurrent and
discriminative studies had a bias towards children aged between 6-12 years,
with spastic diplegia classified as GMFCS levels II and III. This reflects the
demographic of children who attend the hospital clinics and gait laboratory.
This bias has thus meant that these studies focus on the target population for
which the FMS was developed and for whom the scale is used clinically. A
sample of convenience was used in the construct validity study and consecutive
sampling was used for the remaining studies. As stated within the chapters,
because random sampling was not employed there is a possibility of the samples
not being representative of the population for which the results are intended.
The consecutive sampling from the clinics that children of the target population
Chapter 9 – Grand Discussion
240
attend reduced this potential for bias through selective recruitment, suggesting
that the sample is in fact likely to be representative of the target population.
Time constraints and the logistics of ensuring adequate follow-up of participants
resulted in the sample for the construct validity study in Chapter Seven being
small. This study was intended as a feasibility study and further research into
the area of agreement between self-report FMS and direct observation is
warranted. Despite the results of that study being inconclusive due to the small
sample it did draw attention to some very important clinical issues around the
use of self-report measures and the measurement of performance.
The participants were recruited from one centre only. This centre is the major
tertiary care facility for children with CP within the state of Victoria, Australia.
Although there is the potential that the generalisability of the results are limited
due to using only one recruitment centre, the nature of the centre and its
catchment area ensures that the results can probably be generalised more
widely.
Some of the FMS ratings in the investigations in Chapters Six and Seven were
performed over the telephone. The results of the reliability study in Chapter
Five showed similar agreement between FMS administration over the telephone
and FMS administration in person. Despite this, there is the possibility that
ratings with the child present would be different to those obtained over the
telephone. It is difficult for clinicians to ignore a child’s function when they can
observe it. These clinical observations could influence ratings, particularly if
what is observed conflicts with the self or parent report. It would have been
preferential for all FMS ratings to be performed in person for the investigations
in those chapters to minimise the effect of such potential discrepancies.
All attempts were made prospectively to ensure that the effect of any limitations
would be minimised within each study. Although these limitations are present,
they are not significant enough to detract from the results obtained in the thesis
overall.

Chapter 9 – Grand Discussion
241
9.4. Future directions
The investigations in this thesis have comprehensively examined the FMS and
through this process areas for further work can be identified. Future directions
resulting from the findings include potential changes to the scale and further
research endeavours with the FMS that could advance knowledge into the field
of outcome measurement for children with disabilities.
A number of limitations of the FMS itself became evident throughout the
various investigations. The scale is called a “mobility” scale, however it focuses
on walking and the assistive devices used to ambulate, with one category for the
use of wheelchairs. It does not take into account all forms of mobility and
therefore could be considered a “walking” scale or an “ambulatory” scale. As
was emphasized in Chapter Seven, the scale does not include more supportive
walkers that the children require adult assistance to be strapped into because it
was developed to focus more on independent mobility. It is possible that these
types of walkers could be incorporated as a sub-category of category 2 within
the scale because these types of walkers are frequently used in school settings
for children classified as GMFCS level IV.
The wheelchair category of the FMS currently makes no distinction between
whether children push themselves independently, require an adult to push them
or use an electric wheelchair. It would be beneficial if the scale could
distinguish between these abilities because each represents differing levels of
function of the children. A study examining the anatomy of the dysplastic hip in
children with CP devised an assessment scale of locomotor function making
these distinctions (Vidal et al 1985). An ordinal scale from 0 to 8 described
function ranging from “bedridden with no motor function” to “independent
walking inside and outside”. Distinctions for wheelchair use included “without
self propulsion”, “self-propulsion for short distances” and “independent
wheelchair existence both in and out of the home”. Although the scale has not
been examined for reliability or validity, similar distinctions for wheelchair use
could be incorporated into and enhance the FMS.
Chapter 9 – Grand Discussion
242
Chapter Seven indicated that more explicit instructions or questions for
administration of the FMS may be required to obtain a true performance rating.
Currently the brochure provides guidelines for questioning without using set
questions. This allows for clinical judgement and reasoning to guide the
questioning process. During scale development it was thought that if it was
more prescriptive clinicians could miss key information. A more structured
questionnaire may be more direct and ensure more reliable answers. The
potential trade-off with that approach could be clinicians not using problem-
solving skills and missing information with the scale losing some validity in the
process.
The investigation in Chapter Seven also showed that within the home and
school settings there were different distances that children travel, for example
within the classroom or between classrooms at school. This has the potential to
create some confusion when rating, and consequently could affect agreement
between different clinicians (Chapters Five and Seven). The accuracy of the
FMS might be improved if FMS administration stipulated that clinicians
consider distances within one room at home (for the 5m FMS distance) and
between classrooms at school (for the 50m FMS distance). This would ensure
that the distances for each setting were distinct and might improve consistency
between ratings.
Feedback from some of the raters in the reliability study in Chapter Five
highlighted potential confusion regarding the “4” category of the FMS.
Currently “4” represents the use of single point sticks for ambulation. Category
“5” represents children who are independent on level surfaces and require the
use of a rail for stairs. The asterisk in category “5” states that if the child uses
furniture, walls, fences or shopfronts for support the child is rated as “4”. There
is the potential for confusion between using rails for stairs which rates as “5”
and walls for walking which rates as “4”. Other confusion was reported for the
situation where children hold hands with an adult rather than use an assistive
device. Clinicians tend to rate that as “4”; however there is a difference in the
levels of independence between using walls or holding hands and using single
point sticks. Clarification of these issues is required by ensuring that single

Chapter 9 – Grand Discussion
243
point sticks represents a distinct category from holding hands or walls for
support.
This thesis has shown that the FMS is a psychometrically sound and clinically
useful tool for children with CP. It has the potential, therefore, to also be a
useful tool in other populations. Further research of the FMS could involve
examining its reliability and validity in adults with CP and children with other
conditions such as myelomeningocoele and acquired brain injury. This would
enable it to be a more generic measure, with the advantage of comparing
children with different conditions (Dekker et al 2005). Interesting and important
epidemiological studies could then be performed to examine activity limitation
and mobility in children with a range of conditions.
The issue highlighted previously of whether self-report tools measure
performance of activity limitations in children with CP requires more research.
The study in Chapter Seven showed low agreement between self-report and
direct observation. Although the numbers in that study were small and there
were some methodological limitations, this is an important clinical and research
issue. There are a number of other activity limitation measures used in children
with CP that also rely on self-report. There has been some research on reliability
of self-reporting but little into whether this is a valid method of measuring
performance. Further examination of this for the FMS is required and for other
self-report measures such as the FAQ, the ASK, the PODCI and CHQ.
Researchers and clinicians need to be able to answer the fundamental question
of “What are we really measuring?”
The inter-rater reliability of the FMS examined in this thesis used a large
number of clinicians from different professional backgrounds. Further
investigation of the reliability of clinicians based on clinical experience would
be relevant. This could determine whether clinical experience is required to
reliably administer the scale by comparing students or newly graduated
clinicians with clinicians with more extensive clinical experience. The
generalisability and utility of the FMS would be augmented if reliability was
found to be good for clinicians with varying levels of expertise.
Chapter 9 – Grand Discussion
244
The FMS is an evaluative measure and proven responsiveness to change is an
important property for such measures. It is particularly important that the FMS
can detect clinically important change after treatments. The examination of
responsiveness in Chapter Six provided some evidence of this for the FMS. To
further establish its responsiveness, examinations of different interventions
using different statistical methods and a proven stable group of children to
compare with is required. In addition, a more scientific approach to establishing
the minimal clinically important difference for the FMS by seeking consensus
from a larger number of clinicians experienced in its use would be beneficial.
The statsistical analyses performed in all investigations in this thesis were
limited due to the categorical nature of the data. It would be advantageous to
better understand and develop statistical methods for expressing change in
categorical data when changes in single categories are significant.
9.5. Conclusions
There are four major issues to consider with measurement; specifying the
measurement goal (what to measure), ensuring the instrument selected actually
measures these concepts, understanding how well the instrument is able to
measure these concepts, and how to interpret the outcomes of the instrument
(Terwee et al 2003). The aim of this thesis was to provide a psychometrically
sound and clinically useful measurement tool that quantifies mobility in children
with CP. This aim has been fulfilled with the main conclusions from the
investigations listed below.
1. A systematic review was conducted of the psychometric properties and
clinical utility of the available evaluative measures of activity limitations
for children with CP (Chapter Three). This found:
i. Eight evaluative outcome measures (ASK, CHQ, FAQ, FMS,
GMFM, PODCI, PEDI, WeeFIM) with each examining different
dimensions of activity limitation.
ii. The ASK and GMFM to have the most robust psychometric
properties.

Chapter 9 – Grand Discussion
245
iii. The reliability of all tools to be good, although further examination
of validity and responsiveness to change is required for the CHQ,
FAQ, FMS and PODCI in children with CP.
iv. The GMFM to measure capability whilst all other tools measured
performance. The ASK and PEDI quantify both performance and
capability.
v. Different environmental settings to be incorporated within all tools
except for the GMFM.
vi. The FMS to be the only tool to describe activity with different
assistive devices within each of those settings. However it requires
further examination to establish inter-rater reliability, validity and
responsiveness.
vii. Each tool to have a different purpose for application in CP. A
range of tools may be required by clinicians to cover all domains
of the ICF for comprehensive assessment of children with CP.
2. Chapter Five examined the inter-rater agreement for each distance of the
FMS for children with CP using a large number of raters from different
clinical backgrounds and found:
i. Substantial agreement for each of the three FMS distances using a
range of clinicians as raters.
ii. There were no significant differences in agreement between raters
for different age groups, GMFCS levels or topographical
distribution of CP in the sample of children.
iii. Similar agreement between raters who administered the FMS in
person and those who administred it over the telephone, suggesting
it can be administered by either method.
iv. Although surgeons tended to rate more of the higher functioning
children at the upper end of the scale than physiotherapists, the
evidence was not conclusive.
v. The FMS can be used as a reliable tool for different clinicians to
assess mobility in children with CP
Chapter 9 – Grand Discussion
246
3. A study investigated the responsiveness to change of the FMS for
detecting clinically significant change following orthopaedic surgery and
spasticity management (Chpater Six). It found:
i. The FMS was able to detect changes in mobility in children with
CP as defined by improvement or deterioration of one category or
more on the FMS scale.
ii. The FMS was able to detect clinically important change in children
who had SEMLS. It also showed minimal change in children who
had botulinum toxin injections whose mobility status was not
expected to change.
iii. Correlations between change scores on the FMS with the FAQ
were low. This may, however, reflect the properties of the criterion
chosen rather than the responsiveness of the FMS itself.
iv. Some evidence exists of the ability of the FMS to detect clinically
important change. Further investigations are required to fully
establish the responsiveness of the FMS.
4. A study of construct validity examining whether the information
obtained from the FMS via self-report of the assistance required in the
different settings of home, school and community concurs with the
direct observation of mobility in children with CP (Chapter Seven). It
showed:
i. Fair to moderate agreement between self-report and direct
observation for each distance of the FMS in a group of children
attending a school for children with physical and cognitive
disabilities.
ii. Variability in the number and type of mobility method used within
different environmental settings. The group showed variability and
individual children often used more than one method between
settings.
iii. The variability in mobility methods observed may explain the
differences between observations and self-report.

Chapter 9 – Grand Discussion
247
iv. Small numbers and methodological limitations of this study
highlighted the need for further research into this clinically
important issue of whether self-report tools measure performance.
5. A study examined the concurrent validity of the FMS by correlating it
with the FAQ and the GMFCS and the discriminative validity of the
FMS by discriminating severity of motor impairment in children with
CP (Chapter Eight). It revealed:
i. Concurrent validity was supported by high correlations of the FMS
with the FAQ and the GMFCS.
ii. The FMS was able to discriminate between children who walk
independently from those who require assistance based on their
GMFCS levels.
These conclusions demonstrate that the psychometric properties of the FMS
have been extensively examined in this thesis. Validation is an ongoing process
for any outcome measure. Complex multi-dimensional measures, such as the
GMFM and PEDI, require more extensive examination over longer periods than
simple scales, like the FMS, before they can be accepted into widespread
clinical practice. The FMS is a simple scale with high face validity and obvious
clinical applicability. Evidence of this is in its growing widespread use
nationally and internationally including in the United States of America,
Canada, India, the Netherlands, Sweden, Egypt, South America and the United
Kingdom. It has also been translated into five languages. The collective results
of the studies in Chapters Five to Eight demonstrate sufficiently robust
psychometric properties of the FMS for widespread clinical implementation.
The thesis has thus established an adequate level of validation for this simple
and clinically applicable scale to become incorporated into routine clinical
practice.
Chapter 9 – Grand Discussion
248
Finally, to conclude on a more philosophical note with a conversation between
Alice and the Cat, from Alice’s Adventures in Wonderland, (Lewis Carroll
1865):
“Would you tell me, please, which way I ought to go from here?”
“That depends a good deal on where you want to get to” said the Cat.
“I don’t much care where..” said Alice.
“Then it doesn’t matter which way you go” said the Cat
“..so long as I get somewhere!” Alice added as an explanation
“Oh, you’re sure to do that” said the Cat, “if only you walk long enough”.

References
249
REFERENCES
Abel MF, Damiano DL, Blanco JS, Conaway M, Miller F, Dabney K,
Sutherland D, Chambers H, Dias L, Sarwark J, Killian J, Doyle S, Root L,
LaPlaza J, Widmann R, Snyder B (2003) Relationships among musculoskeletal
impairments and functional health status in ambulatory cerebral palsy. Journal
of Pediatric Orthopedics 23: 535-541.
Abel MF, Damiano DL, Pannunzio M, Bush J (1999) Muscle-tendon surgery in
diplegic cerebral palsy: functional and mechanical changes. Journal of Pediatric
Orthopedics 19: 366-375.
Agresti A (2002) Categorical data analysis. (Second ed.) New Jersey: Wiley.
Azuala M, Msall ME, Buck G, M.R. T, Wilczenski F, Rogers BT (2000)
Measuring functional status and family support in older school-aged children
with cerebral palsy: comparison of three instruments. Archives of Physical
Medicine & Rehabilitation 81: 307-311.
Bache CE, Selber P, Graham HK (2003) The management of spastic diplegia.
Current Orthopaedics 17: 88-104.
Bagley AM, Gorton G, Oeffinger D, Barnes D, Calmes J, Nicholson D,
Damiano D, Abel M, Kryscio R, Rogers S, Tylkowski C (2007) Outcome
assessments in children with cerebral palsy, Part II: discriminatory ability of
outcome tools. Developmental Medicine & Child Neurology 49: 181-186.
Baker R, Jasinski M, Maciag-Tymecka I, Michalowska-Mrozek J, Bonikowski
M, Carr L, MacLean J, Lin JP, Lynch B, Theologis T, Wendorff J, Eunson P,
Cosgrove A (2002) Botulinum toxin treatment of spasticity in diplegic cerebral
palsy: a randomized, double-blind, placebo-controlled, dose-ranging study.
Developmental Medicine & Child Neurology 44: 666-675.

References
250
Balf CL, Ingram TTS (1955) Problems in the classification of cerebral palsy.
British Medical Journal 2: 163-166.
Battibugli S, Gryfakis N, Dias L, Kelp-Lenane C, Figlioli S, Fitzgerald E,
Hroma N, Seshadri R, Sullivan C (2007) Functional gait comparison between
children with myelomeningocele: shunt versus no shunt. Developmental
Medicine & Child Neurology 49: 764-769.
Bax M (1964) Terminology and classification of cerebral palsy. Developmental
Medicine & Child Neurology 6: 295-307.
Bax M, Goldstein M, Rosenbaum P, Leviton A, Paneth N, Dan B, Jacobsson B,
Damiano D, Executive Committee for the Definition of Cerebral P (2005)
Proposed definition and classification of cerebral palsy, April 2005.[see
comment]. Developmental Medicine & Child Neurology 47: 571-576.
Bax MCO, Flodmark O, Tydeman C (2007) Definition and classification of
cerebral palsy. From syndrome toward disease. Developmental Medicine &
Child Neurology - Supplementum 109: 39-41.
Baxter P (2005) Invalid measurement validity. Developmental Medicine &
Child Neurology 47: 291.
Bayley N (1969) Bayley Scales of Infant Development. New York: The
Psychological Corporation.
Beckung E, Hagberg G (2000) Correlation between ICIDH handicap code and
Gross Motor Function Classification System in children with cerebral palsy.
Developmental Medicine & Child Neurology 42: 669-673.
Beckung E, Hagberg G (2002) Neuroimpairments, activity limitations, and
participation restrictions in children with cerebral palsy. Developmental
Medicine & Child Neurology 44: 309-316.
References
251
Berg M, Jahnsen R, Froslie KF, Hussain A (2004) Reliability of the Pediatric
Evaluation of Disability Inventory (PEDI). Physical & Occupational Therapy in
Pediatrics 24: 61-77.
Bialocerkowski AE, Grimmer KA, Bain GI (2000) A systematic review of the
content and quality of wrist outcome instruments. International Journal for
Quality in Health Care 12: 149-157.
Bjornson KF (2005) Physical activity monitoring in children and youths.
Pediatric Physical Therapy 17: 37-45.
Bjornson KF, Graubert CS, Buford VL, McLaughlin J (1998) Validity of the
gross motor function measure. Pediatric Physical Therapy 10: 43-47.
Bjornson KF, Graubert CS, McLaughlin JF, Kerfeld CI, Clark EM (1998) Test-
retest reliability of the Gross Motor Function Measure in children with cerebral
palsy. Physical and Occupational Therapy in Pediatrics 18: 51-61.
Blair E, Stanley F (1985) Interobserver agreement in the classification of
cerebral palsy. Developmental Medicine & Child Neurology 27: 615-622.
Bodkin AW, Robinson C, Perales FP (2003) Reliability and validity of the gross
motor function classification system for cerebral palsy. Pediatric Physical
Therapy 15: 247-252.
Bossuyt PM, Reitsma JB, Bruns DE, Gatsonis CA, Glasziou PP, Irwig LM,
Lijmer JG, Moher D, Rennie D, de Vet HCW, Group S (2004) Towards
complete and accurate reporting of studies of diagnostic accuracy: the STARD
initiative. Family Practice 21: 4-10.
Bot SDM, Terwee CB, van der Windt DAWM, Bouter LM, Dekker J, de Vet
HCW (2004) Clinimetric evaluation of shoulder disability questionnaires: a
systematic review of the literature. Annals of the Rheumatic Diseases 63: 335-
341.
References
252
Bottos M, Puato ML, Vianello A, Facchin P (1995) Locomotion patterns in
cerebral palsy syndromes. Developmental Medicine & Child Neurology 37: 883-
899.
Boyd RN, Hays RM (2001a) Current evidence for the use of botulinum toxin
type A in the management of children with cerebral palsy: a systematic review.
European Journal of Neurology 8 Suppl 5: 1-20.
Boyd RN, Hays RM (2001b) Outcome measurement of effectiveness of
botulinum toxin type A in children with cerebral palsy: an ICIDH-2 approach.
European Journal of Neurology 8 Suppl 5: 167-177.
Browne AO, McManus F (1987) One-session surgery for bilateral correction of
lower limb deformities in spastic diplegia. Journal of Pediatric Orthopedics 7:
259-261.
Bruininks RH (1978) Bruininks-Oseretsky test of motor proficiency.
Minneapolis: American Guidance Service.
Bruton A, Conway JH, Holgate ST (2000) Reliability: what is it, and how is it
measured? Physiotherapy 86: 94-99.
Campos da Paz Jr A, Burnett SM, Braga LW (1994) Walking prognosis in
cerebral palsy: a 22-year retrospective analysis. Developmental Medicine &
Child Neurology 36: 130-134.
Chen CC, Bode RK, Granger CV, Heinemann AW (2005) Psychometric
properties and developmental differences in children's ADL item hierarchy: a
study of the WeeFIM instrument. American Journal of Physical Medicine &
Rehabilitation 84: 671-679.
Cohen J (1960) A coefficient of agreement for nominal scales. Educational and
Psychological Measurement 20: 37-46.
References
253
Cohen J (1968) Weighted kappa: nominal scale agreement with provision for
scaled disagreement or partial credit. Psychological Bulletin 70: 213-220.
Cohen J (1977) Statistical power analysis for behavioural sciences - revised.
New York: Academic Press.
Colver A, Group S (2006) Study protocol: SPARCLE--a multi-centre European
study of the relationship of environment to participation and quality of life in
children with cerebral palsy. BMC Public Health 6: 105.
Cook DJ, Mulrow CD, Haynes RB (1997) Systematic reviews: synthesis of best
evidence for clinical decisions.[see comment]. Annals of Internal Medicine 126:
376-380.
Corry IS, Cosgrove AP, Duffy CM, McNeill S, Taylor TC, Graham HK (1998)
Botulinum toxin A compared with stretching casts in the treatment of spastic
equinus: a randomised prospective trial. Journal of Pediatric Orthopedics 18:
304-311.
Cosgrove AP, Corry IS, Graham HK (1994) Botulinum toxin in the
management of the lower limb in cerebral palsy. Developmental Medicine &
Child Neurology 36: 386-396.
Cosgrove AP, Corry IS, Graham HK (1998) Musculoskeletal modelling in
determining the effect of Botulinum toxin on the hamstrings of patients with
crouch gait. Developmental Medicine & Child Neurology 40: 622-625.
Cronbach LJ (1951) Coefficient alpha and the internal structure of tests.
Psychometrika 16: 297-334.
Cusick A, McIntyre S, Novak I, Lannin N, Lowe K (2006) A comparison of
goal attainment scaling and the Canadian Occupational Performance Measure
for paediatric rehabilitation research. Pediatric Rehabilitation 9: 149-157.

References
254
Custers JW, van der Net J, Hoijtink H, Wassenberg-Severijnen JE, Vermeer A,
Helders PJ (2002) Discriminative validity of the Dutch Pediatric Evaluation of
Disability Inventory. Archives of Physical Medicine & Rehabilitation 83: 1437-
1441.
Custers JWH, Wassenberg-Severijnen JE, Van der Net J, Vermeer A, Hart HT,
Helders PJM (2002) Dutch adaptation and content validity of the 'Pediatric
Evaluation Of Disability Inventory (PEDI)'. Disability & Rehabilitation 24:
250-258.
Daltroy LH, Liang MH, Fossel AH, Goldberg MJ (1998) The POSNA pediatric
musculoskeletal functional health questionnaire: report on reliability, validity,
and sensitivity to change. Pediatric Outcomes Instrument Development Group.
Pediatric Orthopaedic Society of North America. Journal of Pediatric
Orthopedics 18: 561-571.
Damiano D, Abel M, Romness M, Oeffinger D, Tylkowski C, Gorton G, Bagley
A, Nicholson D, Barnes D, Calmes J, Kryscio R, Rogers S (2006) Comparing
functional profiles of children with hemiplegic and diplegic cerebral palsy in
GMFCS Levels I and II: Are separate classifications needed? Developmental
Medicine & Child Neurology 48: 797-803.
Damiano DL, Abel MF (1996) Relation of gait analysis to gross motor function
in cerebral palsy. Developmental Medicine & Child Neurology 38: 389-396.
Damiano DL, Gilgannon MD, Abel MF (2005) Responsiveness and uniqueness
of the pediatric outcomes data collection instrument compared to the gross
motor function measure for measuring orthopaedic and neurosurgical outcomes
in cerebral palsy. Journal of Pediatric Orthopedics 25: 641-645.
Davids JR, Marshall AD, Blocker ER, Frick SL, Blackhurst DW, Skewes E
(2003) Femoral anteversion in children with cerebral palsy. Assessment with
two and three-dimensional computed tomography scans. Journal of Bone &
Joint Surgery - American Volume 85-A: 481-488.

References
255
Davids JR, Ounpuu S, DeLuca PA, Davis RB, 3rd (2004) Optimization of
walking ability of children with cerebral palsy. Instructional Course Lectures
53: 511-522.
Davis E, Waters E, Mackinnon A, Reddihough D, Graham HK, Mehmet-Radji
O, Boyd R (2006) Paediatric quality of life instruments: a review of the impact
of the conceptual framework on outcomes. Developmental Medicine & Child
Neurology 48: 311-318.
Deeks JJ, Dinnes J, D'Amico R, Sowden AJ, Sakarovitch C, Song F, Petticrew
M, Altman DG, International Stroke Trial Collaborative G, European Carotid
Surgery Trial Collaborative G (2003) Evaluating non-randomised intervention
studies. Health Technology Assessment 7: iii-x.
Dekker J, Dallmeijer AJ, Lankhorst GJ (2005) Clinimetrics in rehabilitation
medicine: current issues in developing and applying measurement instruments
1. Journal of Rehabilitation Medicine 37: 193-201.
Delgado MR, Albright AL (2003) Movement disorders in children: definitions,
classifications and grading systems. Journal of Child Neurology 18: S1-8.
Deyo RA, Centor RM (1986) Assessing the responsiveness of functional scales
to clinical change: an analogy to diagnostic test performance. Journal of
Chronic Diseases 39: 897-906.
Deyo RA, Inui TS (1984) Toward clinical applications of health status
measures: sensitivity of scales to clinically important changes. Health Services
Research 19: 275-289.
Dobson F, Morris ME, Baker R, Graham HK (2007) Gait classification in
children with cerebral palsy: A systematic review. Gait & Posture 25: 140-152.
Dobson F, Morris ME, Baker R, Wolfe R, Graham H (2006) Clinician
agreement on gait pattern ratings in children with spastic hemiplegia.
Developmental Medicine & Child Neurology 48: 429-435.
References
256
Drouin LM, Malouin F, Richards CL, Marcoux S (1996) Correlation between
the gross motor function measure scores and gait spatiotemporal measures in
children with neurological impairments. Developmental Medicine & Child
Neurology 38: 1007-1019.
Eames NW, Baker R, Hill N, Graham K, Taylor T, Cosgrove A (1999) The
effect of botulinum toxin A on gastrocnemius length: magnitude and duration of
response. Developmental Medicine & Child Neurology 41: 226-232.
Eechaute C, Vaes P, Van Aerschot L, Asman S, Duquet W (2007) The
clinimetric qualities of patient-assessed instruments for measuring chronic ankle
instability: a systematic review. BMC Musculoskeletal Disorders 8: 6.
Eldridge B, Galea M, McCoy A, Wolfe R, Graham HK (2003) Uptime
normative values in children aged 8 to 15 years. Developmental Medicine &
Child Neurology 45: 189-193.
Eliasson A-C, Krumlinde-Sundholm L, Rosblad B, Beckung E, Arner M,
Ohrvall A-M, Rosenbaum P (2006) The Manual Ability Classification System
(MACS) for children with cerebral palsy: scale development and evidence of
validity and reliability.[see comment]. Developmental Medicine & Child
Neurology 48: 549-554.
Fabry G, Liu XC, Molenaers G (1999) Gait pattern in patients with spastic
diplegic cerebral palsy who underwent staged operations. Journal of Pediatric
Orthopaedics, Part B 8: 33-38.
Fay T (1950) Cerebral palsy: medical considerations and classification.
American Journal of Psychiatry 107: 180-183.
Fedrizzi E, Facchin P, Marzaroli M, Pagliano E, Botteon G, Percivalle L, Fazzi
E (2000) Predictors of independent walking in children with spastic diplegia.
Journal of Child Neurology [NLM - MEDLINE] 15: 228-234.

References
257
Feldman AB, Haley SM, Coryell J (1990) Concurrent and construct validity of
the Pediatric Evaluation of Disability Inventory. Physical Therapy 70: 602-610.
Fitzpatrick R, Ziebland S, Jenkinson C, Mowat A (1992) Importance of
sensitivity to change as a criterion for selecting health status measures. Quality
in Health Care 1: 89-93.
Folio RM, Fewell RF (1983) Peabody Developmental Motor Scales. Nashville:
George Peabody College for Teachers.
Furlong W, Barr RD, Feeny D, Yandow S (2005) Patient-focused measures of
functional health status and health-related quality of life in pediatric
orthopedics: a case study in measurement selection. Health & Quality of Life
Outcomes 3: 3.
Gage JR, Novacheck TF (2001) An update on the treatment of gait problems in
cerebral palsy. Journal of Pediatric Orthopaedics, Part B 10: 265-274.
Goldberg MJ (1991) Measuring outcomes in cerebral palsy. Journal of
Pediatric Orthopedics 11: 682-685.
Goldstein DN, Cohn E, Coster W (2004) Enhancing participation for children
with disabilities: application of the ICF enablement framework to pediatric
physical therapist practice. Pediatric Physical Therapy 16: 114-120.
Gorter JW, Rosenbaum PL, Hanna SE, Palisano RJ, Bartlett DJ, Russell DJ,
Walter SD, Raina P, Galuppi BE, Wood E (2004) Limb distribution, motor
impairment, and functional classification of cerebral palsy. Developmental
Medicine & Child Neurology 46: 461-467.
Graham HK (2006) Absence of reference to progressive musculoskeletal
pathology in definition of cerebral palsy.[comment]. Developmental Medicine &
Child Neurology 48: 78-79; author reply 79.

References
258
Graham HK, Aoki KR, Autti-Ramo I, Boyd RN, Delgado MR, Gaebler-Spira
DJ, Gormley ME, Guyer BM, Heinen F, Holton AF, Matthews D, Molenaers G,
Motta F, Garcia Ruiz PJ, Wissel J (2000) Recommendations for the use of
botulinum toxin type A in the management of cerebral palsy. Gait & Posture
11: 67-79.
Graham HK, Harvey A (2007) Assessment of mobility after multi-level surgery
for cerebral palsy. Journal of Bone & Joint Surgery - British Volume 89-B: 993-
994.
Graham HK, Harvey A, Rodda J, Nattrass GR, Pirpiris M (2004) The
Functional Mobility Scale (FMS). Journal of Pediatric Orthopedics 24: 514-
520.
Graham HK, Selber P (2003) Musculoskeletal aspects of cerebral palsy. Journal
of Bone & Joint Surgery - British Volume 85-B: 157-166.
Greer N, Mosser G, Logan G, Halaas GW (2000) A Practical Approach to
Evidence Grading. Joint Commission Journal on Quality and Patient Safety 26:
700-712.
Guilford J (1954) Psychometric methods. New York: McGraw-Hill.
Guyatt G, Walter S, Norman G (1987) Measuring change over time: assessing
the usefulness of evaluative instruments. Journal of Chronic Disease 40: 171-
178.
Guyatt GH, Deyo RA, Charlson M, Levine MN, Mitchell A (1989)
Responsiveness and validity in health status measurement: a clarification.
Journal of Clinical Epidemiology 42: 403-408.
Guyatt GH, Kirschner B, Jaeschke R (1992) Measuring health status: what are
the necessary measurement properties? Journal of Clinical Epidemiology 45:
1341-1345.
References
259
Guyatt GH, Osoba D, Wu AW, Wyrwich KW, Norman GR, Clinical
Significance Consensus Meeting G (2002) Methods to explain the clinical
significance of health status measures. Mayo Clinic Proceedings 77: 371-383.
Haley SM, Coster WJ, Binda-Sundberg K (1994) Measuring physical
disablement: the contextual challenge. Physical Therapy 74: 443-451.
Haley SM, Coster WJ, Faas RM (1991) A content validity study of the pediatric
evaluation of disability inventory. Pediatric Physical Therapy 3: 177-184.
Haley SM, Coster WJ, Ludlow LH (1991) Pediatric functional outcome
measures. Physical Medicine and Rehabilitation Clinics of North America 2:
689-723.
Haley SM, Coster WJ, Ludlow LH, Haltiwanger JT, Andrellos PJ (1992)
Pediatric Evaluation of Disability Inventory: Examiners Manual. Boston: New
England Medical Centre.
Haley SM, Ludlow LH, Coster WJ (1993) Pediatric Evaluation of Disability
Inventory. Clinical interpretation of summary scores using Rasch rating scale
methodology. Physical Medicine and Rehabilitation Clinics of North America 4:
529-540.
Haley SM, Raczek AE, Coster WJ, Dumas HM, Fragala-Pinkham MA (2005)
Assessing mobility in children using a computer adaptive testing version of the
pediatric evaluation of disability inventory. Archives of Physical Medicine &
Rehabilitation 86: 932-939.
Hammal D, Jarvis SN, Colver AF (2004) Participation of children with cerebral
palsy is influenced by where they live.[see comment]. Developmental Medicine
& Child Neurology 46: 292-298.
Hanley J, McNeil B (1982) The meaning and use of the area under a receiver
operating characteristic (ROC) curve. Radiology 143: 29-36.
References
260
Harvey A, Graham HK, Morris ME, Baker R, Wolfe R (2007) The Functional
Mobility Scale: ability to detect change following single event multilevel
surgery. Developmental Medicine & Child Neurology 49: 603-607.
Hayden JA, Cote P, Bombardier C (2006) Evaluation of the quality of prognosis
studies in systematic reviews. Annals of Internal Medicine 144: 427-437.
Haynes RJ, Sullivan E (2001) The Pediatric Orthopaedic Society of North
America pediatric orthopaedic functional health questionnaire: an analysis of
normals. Journal of Pediatric Orthopedics 21: 619-621.
Henderson SE, Sugden DA (1992) Movement Assessment Battery for Children.
London: The Psychological Corporation.
Herbert R, Jamtvedt G, Mead J, Birger Hagen K (2005) Practical Evidence-
Based Physiotherapy. Edinburgh: Elsevier.
Himmelmann K, Beckung E, Hagberg G, Uvebrant P (2006) Gross and fine
motor function and accompanying impairments in cerebral palsy.
Developmental Medicine & Child Neurology 48: 417-423.
Hoffer MM, Feiwell E, Perry R, Perry J, Bonnett C (1973) Functional
ambulation in patients with myelomeningocele. Journal of Bone & Joint
Surgery - American Volume 55: 137-148.
Howard J, Soo B, Graham HK, Boyd RN, Reid S, Lanigan A, Wolfe R,
Reddihough DS (2005) Cerebral palsy in Victoria: motor types, topography and
gross motor function. Journal of Paediatrics & Child Health 41: 479-483.
Husted JA, Cook RJ, Farewell VT, Gladman DD (2000) Methods for assessing
responsiveness: a critical review and recommendations. Journal of Clinical
Epidemiology 53: 459-468.
References
261
Iyer LV, Haley SM, Watkins MP, Dumas HM (2003) Establishing minimal
clinically important differences for scores on the pediatric evaluation of
disability inventory for inpatient rehabilitation. Physical Therapy 83: 888-898.
Jackson N, Waters E, Guidelines for Systematic Reviews in Health P, Public
Health T (2005) Criteria for the systematic review of health promotion and
public health interventions. Health Promotion International 20: 367-374.
Jaeschke R, Singer J, Guyatt GH (1989) Measurement of health status.
Ascertaining the minimal clinically important difference. Controlled Clinical
Trials 10: 407-415.
Johnston L (2006) Movement Assessment Battery for Children. Australian
Journal of Physiotherapy 52: 68.
Jolles BM, Buchbinder R, Beaton DE (2005) A study compared nine patient-
specific indices for musculoskeletal disorders. Journal of Clinical Epidemiology
58: 791-801.
Katrak P, Bialocerkowski AE, Massy-Westropp N, Kumar S, Grimmer KA
(2004) A systematic review of the content of critical appraisal tools.[see
comment]. BMC Medical Research Methodology 4: 22.
Keating J, Matyas T (1998) Unreliable inferences from reliable measurements.
Australian Journal of Physiotherapy 44: 5-10.
Kennes J, Rosenbaum P, Hanna SE, Walter S, Russell D, Raina P, Bartlett D,
Galuppi B (2002) Health status of school-aged children with cerebral palsy:
information from a population-based sample. Developmental Medicine & Child
Neurology 44: 240-247.
Ketelaar M, Vermeer A, Helders PJ (1998) Functional motor abilities of
children with cerebral palsy: a systematic literature review of assessment
measures. Clinical Rehabilitation 12: 369-380.
References
262
Khan KS, Daya S, Jadad A (1996) The importance of quality of primary studies
in producing unbiased systematic reviews. Archives of Internal Medicine 156:
661-666.
Khan KS, Kleijnen J (2007) Centre for Reviews and Dissemination. York Uo.
York, UK.
Kirschner B, Guyatt G (1985) A methodological framework for assessing health
indices. Journal of Chronic Disease 38: 27-36.
Krageloh-Mann I, Hagberg G, Meisner C, Haas G, Eeg-Olofsson KE, Selbmann
HK, Hagberg B, Michaelis R (1995) Bilateral spastic cerebral palsy--a
collaborative study between southwest Germany and western Sweden. III:
Aetiology.[see comment]. Developmental Medicine & Child Neurology 37: 191-
203.
Landgraf JM, Abetz L, Ware JEJ (1996) Child Health Questionnaire (CHQ): a
user's manual. Boston: The Health Institute NEMC.
Landis JR, Koch GG (1977) The measurement of observer agreement for
categorical data. Biometrics 33: 159-174.
Law M (2004) Outcome measures rating form. Ontario, Canada, CanChild
Centre for Disability Research.
Law M, Baptiste S, Carswell-Opzoomer A, McColl M, Polatajko H, Pollock N
(1994) Canadian Occupational Performance Measure Manual. (2nd ed.)
Toronto: CAOT Publications ACE.
Law M, King G, King S, Kertoy M, Hurley P, Rosenbaum P, Young N, Hanna
S (2006) Patterns of participation in recreational and leisure activities among
children with complex physical disabilities. Developmental Medicine & Child
Neurology 48: 337-342.
References
263
Law M, King G, Russell D, MacKinnon E, Hurley P, Murphy C (1999)
Measuring outcomes in children's rehabilitation: a decision protocol. Archives of
Physical Medicine & Rehabilitation 80: 629-636.
Law M, Stewart D, Pollock N, Letts L, Bosch J, Westmorland M (1998) Critical
review form - quantitative studies. Ontario, Canada, McMaster University.
Leemrijse C, Meijer OG, Vermeer A, Lambregts B, Ader HJ (1999) Detecting
individual change in children with mild to moderate motor impairment: the
standard error of measurement of the Movement ABC. Clinical Rehabilitation
13: 420-429.
Liang MH (2000) Longitudinal construct validity: establishment of clinical
meaning in patient evaluative instruments.[see comment]. Medical Care 38:
II84-90.
Liptak GS, Accardo PJ (2004) Health and social outcomes of children with
cerebral palsy. Journal of Pediatrics 145: S36-41.
Liptak GS, O'Donnell M, Conaway M, Chumlea WC, Wolrey G, Henderson
RC, Fung E, Stallings VA, Samson-Fang L, Calvert R, Rosenbaum P,
Stevenson RD (2001) Health status of children with moderate to severe cerebral
palsy.[see comment]. Developmental Medicine & Child Neurology 43: 364-370.
Livingston MH, Rosenbaum PL, Russell DJ, Palisano RJ (2007) Quality of life
among adolescents with cerebral palsy: what does the literature tell us?
Developmental Medicine & Child Neurology 49: 225-231.
Lohr KN (2004) Rating the strength of scientific evidence: relevance for quality
improvement programs. International Journal for Quality in Health Care 16: 9-
18.
Lohr KN, Aaronson NK, Alonso J, Burnam MA, Patrick DL, Perrin EB,
Roberts JS (1996) Evaluating quality-of-life and health status instruments:
development of scientific review criteria. Clinical Therapeutics 18: 979-992.

References
264
Lohr KN, Carey TS (1999) Assessing "best evidence": issues in grading the
quality of studies for systematic reviews. Joint Commission Journal on Quality
Improvement 25: 470-479.
Long TM (1992) The use of parent report measures to assess infant
development. Pediatric Physical Therapy 4: 74-77.
Ma FYP, Selber P, Nattrass GR, Harvey AR, Wolfe R, Graham HK (2006)
Lengthening and transfer of hamstrings for a flexion deformity of the knee in
children with bilateral cerebral palsy: technique and preliminary results. Journal
of Bone & Joint Surgery - British Volume 88: 248-254.
Majnemer A, Limperopoulos C (2002) Importance of outcome determination in
pediatric rehabilitation. Developmental Medicine & Child Neurology 44: 773-
777.
Majnemer A, Mazer B (2004) New directions in the outcome evaluation of
children with cerebral palsy. Seminars in Pediatric Neurology 11: 11-17.
Mayer NH, Esquenazi A (2003) Muscle overactivity and movement dysfunction
in the upper motoneuron syndrome. Physical Medicine & Rehabilitation Clinics
of North America 14: 855-883.
McAuliffe CA, Wenger RE, Schneider JW, Gaebler-Spira DJ (1998) Usefulness
of the Wee-Functional Independence Measure to detect functional change in
children with cerebral palsy. Pediatric Physical Therapy 10: 23-28.
McCarthy ML, Silberstein CE, Atkins EA, Harryman SE, Sponseller PD,
Hadley-Miller NA (2002) Comparing reliability and validity of pediatric
instruments for measuring health and well-being of children with spastic
cerebral palsy. Developmental Medicine & Child Neurology 44: 468-476.
McDowell BC, Kerr C, Parkes J (2007) Interobserver agreement of the Gross
Motor Function Classification System in an ambulant population of children
with cerebral palsy. Developmental Medicine & Child Neurology 49: 528-533.

References
265
McMulkin ML, Baird GO, Gordon AB, Caskey PM, Ferguson RL (2007) The
pediatric outcomes data collection instrument detects improvements for children
with ambulatory cerebral palsy after orthopaedic intervention. Journal of
Pediatric Orthopedics 27: 1-6.
Miller G, Clark GD (1998) The cerebral palsies. Boston: Butterworth-
Heinemann.
Minear WL (1956) A classification system for cerebral palsy. Pediatrics 18:
841-852.
Moher D, Cook DJ, Eastwood S, Olkin I, Rennie D, Stroup DF (2000)
Improving the quality of reports of meta-analyses of randomised controlled
trials: the QUOROM statement. QUOROM Group. British Journal of Surgery
87: 1448-1454.
Moher D, Schulz KF, Altman D, Group C (2005) The CONSORT Statement:
revised recommendations for improving the quality of reports of parallel-group
randomized trials 2001. Explore-The Journal of Science & Healing 1: 40-45.
Morris C, Bartlett D (2004) Gross Motor Function Classification System:
impact and utility. Developmental Medicine & Child Neurology 46: 60-65.
Morris C, Galuppi BE, Rosenbaum PL (2004) Reliability of family report for
the Gross Motor Function Classification System. Developmental Medicine &
Child Neurology 46: 455-460.
Morris C, Kurinczuk JJ, Fitzpatrick R (2005) Child or family assessed measures
of activity performance and participation for children with cerebral palsy: a
structured review. Child: Care, Health & Development 31: 397-407.
Morris C, Kurinczuk JJ, Fitzpatrick R, Rosenbaum PL (2006) Do the abilities of
children with cerebral palsy explain their activities and participation?
Developmental Medicine & Child Neurology 48: 954-961.

References
266
Msall ME, DiGaudio K, Duffy LC, LaForest S, Braun S, Granger CV (1994)
WeeFIM. Normative sample of an instrument for tracking functional
independence in children. Clinical Pediatrics 33: 431-438.
Msall ME, DiGaudio K, Rogers BT, LaForest S, Catanzaro NL, Campbell J,
Wilczenski F, Duffy LC (1994) The Functional Independence Measure for
Children (WeeFIM). Conceptual basis and pilot use in children with
developmental disabilities. Clinical Pediatrics 33: 421-430.
Murray-Weir M, Root L, Peterson M, Lenhoff M, Daly L, Wagner C, Marcus P
(2003) Proximal femoral varus rotation osteotomy in cerebral palsy: a
prospective gait study.[erratum appears in J Pediatr Orthop. 2003 Jul-
Aug;23(4):563]. Journal of Pediatric Orthopedics 23: 321-329.
Mutch LW, Alberman E, Hagberg B, Kodama K, Velickovic MV (1992)
Cerebral palsy epidemiology: where are we now and where are we going?
Developmental Medicine & Child Neurology 34: 547-555.
Nelson EC, Mohr JJ, Batalden PB, Plume SK (1996) Improving health care,
Part 1: The clinical value compass. Joint Commission Journal on Quality
Improvement 22: 243-258.
Nene AV, Evans GA, Patrick JH (1993) Simultaneous multiple operations for
spastic diplegia. Outcome and functional assessment of walking in 18 patients.
Journal of Bone & Joint Surgery - British Volume 75: 488-494.
Nichols DS, Case-Smith J (1996) Reliability and validity of the pediatric
evaluation of disability inventory. Pediatric Physical Therapy 8: 15-24.
Nordmark E, Hagglund G, Jarnlo GB (1997) Reliability of the gross motor
function measure in cerebral palsy. Scandinavian Journal of Rehabilitation
Medicine 29: 25-28.

References
267
Nordmark E, Hagglund G, Lagergren J (2001) Cerebral palsy in southern
Sweden II. Gross motor function and disabilities. Acta Paediatrica 90: 1277-
1282.
Nordmark E, Jarnlo GB, Hagglund G (2000) Comparison of the Gross Motor
Function Measure and Paediatric Evaluation of Disability Inventory in assessing
motor function in children undergoing selective dorsal rhizotomy.
Developmental Medicine & Child Neurology 42: 245-252.
Nordmark E, Orban K, Hagglund G, Jarnlo GB (1999) The American Paediatric
Evaluation of Disability Inventory (PEDI). Applicability of PEDI in Sweden for
children aged 2.0-6.9 years. Scandinavian Journal of Rehabilitation Medicine
31: 95-100.
Norman GR, Streiner DL (2000) Biostatistics: The bare essentials. (Second ed.)
Hamilton: B.C. Decker Inc.
Novacheck TF, Stout JL, Tervo R (2000) Reliability and validity of the Gillette
Functional Assessment Questionnaire as an outcome measure in children with
walking disabilities. Journal of Pediatric Orthopedics 20: 75-81.
Nunnally JC (1978) Psychometric theory. (Second ed.) New York: McGraw-
Hill.
Nunnally JC, Bernstein IH (1994) Psychometric theory. (3rd ed.) New York:
McGraw-Hill.
Oeffinger D, Gorton G, Bagley A, Nicholson D, Barnes D, Calmes J, Abel M,
Damiano D, Kryscio R, Rogers S, Tylkowski C (2007) Outcome assessments in
children with cerebral palsy, Part I: descriptive characteristics of GMFCS
Levels I to III. Developmental Medicine & Child Neurology 49: 172-180.
Oeffinger DJ, Tylkowski CM, Rayens MK, Davis RF, Gorton GE, 3rd,
D'Astous J, Nicholson DE, Damiano DL, Abel MF, Bagley AM, Luan J (2004)
Gross Motor Function Classification System and outcome tools for assessing
References
268
ambulatory cerebral palsy: a multicenter study. Developmental Medicine &
Child Neurology 46: 311-319.
Ostensjo S, Carlberg EB, Vollestad NK (2004) Motor impairments in young
children with cerebral palsy: relationship to gross motor function and everyday
activities. Developmental Medicine & Child Neurology 46: 580-589.
Ottenbacher KJ, Cusick A (1990) Goal attainment scaling as a method of
clinical service evaluation. American Journal of Occupational Therapy 44: 519-
525.
Ottenbacher KJ, Msall ME, Lyon N, Duffy LC, Granger CV, Braun S (1999)
Measuring developmental and functional status in children with disabilities.
Developmental Medicine & Child Neurology 41: 186-194.
Ottenbacher KJ, Msall ME, Lyon N, Duffy LC, Ziviani J, Granger CV, Braun S,
Feidler RC (2000) The WeeFIM instrument: its utility in detecting change in
children with developmental disabilities. Archives of Physical Medicine &
Rehabilitation 81: 1317-1326.
Ottenbacher KJ, Msall ME, Lyon NR, Duffy LC, Granger CV, Braun S (1997)
Interrater agreement and stability of the Functional Independence Measure for
Children (WeeFIM): use in children with developmental disabilities. Archives of
Physical Medicine & Rehabilitation 78: 1309-1315.
Ottenbacher KJ, Taylor ET, Msall ME, Braun S, Lane SJ, Granger CV, Lyons
N, Duffy LC (1996) The stability and equivalence reliability of the functional
independence measure for children (WeeFIM). Developmental Medicine &
Child Neurology 38: 907-916.
Ounpuu S, DeLuca P, Davis R, Romness M (2002) Long-term effects of
femoral derotation osteotomies: an evaluation using three-dimensional gait
analysis. Journal of Pediatric Orthopedics 22: 139-145.
References
269
Oxman AD, Guyatt GH (1991) Validation of an index of the quality of review
articles. Journal of Clinical Epidemiology 44: 1271-1278.
Palisano R, Rosenbaum P, Walter S, Russell D, Wood E, Galuppi B (1997)
Development and reliability of a system to classify gross motor function in
children with cerebral palsy. Developmental Medicine & Child Neurology 39:
214-223.
Palisano RJ, Cameron D, Rosenbaum PL, Walter SD, Russell D (2006) Stability
of the gross motor function classification system. Developmental Medicine &
Child Neurology 48: 424-428.
Palisano RJ, Hanna SE, Rosenbaum PL, Russell DJ, Walter SD, Wood EP,
Raina PS, Galuppi BE (2000) Validation of a model of gross motor function for
children with cerebral palsy. Physical Therapy 80: 974-985.
Palisano RJ, Tieman BL, Walter SD, Bartlett DJ, Rosenbaum PL, Russell D,
Hanna SE (2003) Effect of environmental setting on mobility methods of
children with cerebral palsy. Developmental Medicine & Child Neurology 45:
113-120.
Pencharz J, Young NL, Owen JL, Wright JG (2001) Comparison of three
outcomes instruments in children. Journal of Pediatric Orthopedics 21: 425-
432.
Perlstein MA (1952) Infantile cerebral palsy: classification and clinical
correlations. Journal of the American Medical Association 149: 30-34.
Piper MC, Darrah J (1994) Motor assessment of the developing infant.
Philadelphia: W.B. Saunders.
Pirpiris M, Graham HK (2004) Uptime in children with cerebral palsy. Journal
of Pediatric Orthopedics 24: 521-528.

References
270
Pirpiris M, Trivett A, Baker R, Rodda J, Nattrass GR, Graham HK (2003)
Femoral derotation osteotomy in spastic diplegia. Proximal or distal? Journal of
Bone & Joint Surgery - British Volume 85: 265-272.
Plint AC, Gaboury I, Owen J, Young NL (2003) Activities scale for kids: an
analysis of normals. Journal of Pediatric Orthopedics 23: 788-790.
Portney LG, Watkins MP (1993) Foundations of clinical research. Applications
to practice. Norwalk: Appleton and Lange.
Raat H, Botterweck AM, Landgraf JM, Hoogeveen WC, Essink-Bot ML (2005)
Reliability and validity of the short form of the child health questionnaire for
parents (CHQ-PF28) in large random school based and general population
samples. Journal of Epidemiology & Community Health 59: 75-82.
Raja K, Joseph B, Benjamin S, Minocha V, Rana B (2007) Physiological cost
index in cerebral palsy: Its role in evaluating the efficiency of ambulation.
Journal of Pediatric Orthopaedics 27: 130-136.
Reddihough DS, Collins KJ (2003) The epidemiology and causes of cerebral
palsy. Australian Journal of Physiotherapy 49: 7-12.
Rodda J, Graham HK (2001) Classification of gait patterns in spastic hemiplegia
and spastic diplegia: a basis for a management algorithm. European Journal of
Neurology 8 Suppl 5: 98-108.
Rodda JM, Graham HK, Carson L, Galea MP, Wolfe R (2004) Sagittal gait
patterns in spastic diplegia. Journal of Bone & Joint Surgery - British Volume
86: 251-258.
Rosenbaum P (2007) The environment and childhood disability: opportunities
to expand our horizons. Developmental Medicine & Child Neurology 49: 643-
643.

References
271
Rosenbaum P, Paneth N, Leviton A, Goldstein M, Bax M, Damiano D, Dan B,
Jacobsson B (2007) A report: the definition and classification of cerebral palsy
April 2006. Developmental Medicine & Child Neurology - Supplementum 109:
8-14.
Rosenbaum P, Stewart D (2004) The World Health Organization International
Classification of Functioning, Disability, and Health: a model to guide clinical
thinking, practice and research in the field of cerebral palsy. Seminars in
Pediatric Neurology 11: 5-10.
Rosenbaum PL, Russell DJ, Cadman DT, Gowland C, Jarvis S, Hardy S (1990)
Issues in measuring change in motor function in children with cerebral palsy: a
special communication. Physical Therapy 70: 125-131.
Rosenbaum PL, Walter SD, Hanna SE, Palisano RJ, Russell DJ, Raina P, Wood
E, Bartlett DJ, Galuppi BE (2002) Prognosis for gross motor function in
cerebral palsy: creation of motor development curves.[see comment]. JAMA
288: 1357-1363.
Rothstein JM (2003) Editor's note. Living with error. Physical Therapy 83: 422-
423.
Russell D, Palisano R, Walter S, Rosenbaum P, Gemus M, Gowland C, Galuppi
B, Lane M (1998) Evaluating motor function in children with Down syndrome:
validity of the GMFM. Developmental Medicine & Child Neurology 40: 693-
701.
Russell DJ, Avery LM, Rosenbaum PL, Raina PS, Walter SD, Palisano RJ
(2000) Improved scaling of the gross motor function measure for children with
cerebral palsy: evidence of reliability and validity. Physical Therapy 80: 873-
885.
References
272
Russell DJ, Gorter JW (2005) Assessing functional differences in gross motor
skills in children with cerebral palsy who use an ambulatory aid or orthoses: can
the GMFM-88 help? Developmental Medicine & Child Neurology 47: 462-467.
Russell DJ, Rosenbaum PL, Cadman DT, Gowland C, Hardy S, Jarvis S (1989)
The gross motor function measure: a means to evaluate the effects of physical
therapy. Developmental Medicine & Child Neurology 31: 341-352.
Russell DJ, Rosenbaum PL, Gowland C, Hardy S, Lane M, Plews N, McGavin
H, Cadman DT, Jarvis S (1993) Gross Motor Function Measure manual. (2nd
ed.) Hamilton: McMaster University.
Sakzewski L, Boyd R, Ziviani J (2007) Clinimetric properties of participation
measures for 5- to 13-year-old children with cerebral palsy: a systematic review.
Developmental Medicine & Child Neurology 49: 232-240.
Saraph V, Zwick E-B, Zwick G, Steinwender C, Steinwender G, Linhart W
(2002) Multilevel surgery in spastic diplegia: evaluation by physical
examination and gait analysis in 25 children. Journal of Pediatric Orthopedics
22: 150-157.
Schenker R, Coster WJ, Parush S (2005) Neuroimpairments, activity
performance, and participation in children with cerebral palsy mainstreamed in
elementary schools.[see comment]. Developmental Medicine & Child
Neurology 47: 808-814.
Schneider JW, Gurucharri LM, Gutierrez AL, Gaebler-Spira DJ (2001) Health-
related quality of life and functional outcome measures for children with
cerebral palsy. Developmental Medicine & Child Neurology 43: 601-608.
Schneidert M, Hurst R, Miller J, Ustun B (2003) The role of environment in the
International Classification of Functioning, Disability and Health (ICF).
Disability & Rehabilitation 25: 588-595.

References
273
Siegel S, Castellan NJ (1988) Nonparametric statistics for the behavioural
sciences. (2nd ed.) New York: McGraw-Hill.
Sim J, Wright CC (2005) The kappa statistic in reliability studies: use,
interpretation, and sample size requirements. Physical Therapy 85: 257-268.
Simeonsson RJ, Leonardi M, Lollar D, Bjorck-Akesson E, Hollenweger J,
Martinuzzi A (2003) Applying the International Classification of Functioning,
Disability and Health (ICF) to measure childhood disability. Disability &
Rehabilitation 25: 602-610.
Sperle PA, Ottenbacher KJ, Braun SL, Lane SJ, Nochajski S (1997)
Equivalence reliability of the functional independence measure for children
(WeeFIM) administration methods. American Journal of Occupational Therapy
51: 35-41.
Stanley F, Blair E, Alberman E (2000) Cerebral palsies: epidemiology and
causal pathways. London: Mac Keith Press.
Stauffer ES, Hoffer MM, Nickel VL (1978) Ambulation in thoracic paraplegia.
Journal of Bone & Joint Surgery - American Volume 60: 823-824.
Streiner DL, Norman GR (2003) Health Measurement Scales. A practical guide
to their development and use. (Third ed.) New York: Oxford University Press.
Stroup DF, Berlin JA, Morton SC, Olkin I, Williamson GD, Rennie D, Moher
D, Becker BJ, Sipe TA, Thacker SB (2000) Meta-analysis of observational
studies in epidemiology: a proposal for reporting. Meta-analysis Of
Observational Studies in Epidemiology (MOOSE) group. JAMA 283: 2008-
2012.
Sullivan E, Barnes D, Linton JL, Calmes J, Damiano D, Oeffinger D, Abel M,
Bagley A, Gorton G, Nicholson D, Rogers S, Tylkowski C (2007) Relationships
among functional outcome measures used for assessing children with
ambulatory CP. Developmental Medicine & Child Neurology 49: 338-344.

References
274
Surveillance of Cerebral Palsy in Europe (SCPE) (2002) Prevalence and
characteristics of children with cerebral palsy in Europe. Developmental
Medicine & Child Neurology 44: 663-640.
Sussman MD, Aiona MD (2004) Treatment of spastic diplegia in patients with
cerebral palsy. Journal of Pediatric Orthopaedics, Part B 13: S1-12.
Sutherland DH, Olshen R, Cooper L, Woo SL (1980) The development of
mature gait. Journal of Bone & Joint Surgery - American Volume 62: 336-353.
Tervo RC, Azuma S, Stout J, Novacheck T (2002) Correlation between physical
functioning and gait measures in children with cerebral palsy. Developmental
Medicine & Child Neurology 44: 185-190.
Terwee CB, Bot SDM, de Boer MR, van der Windt DAWM, Knol DL, Dekker
J, Bouter LM, de Vet HCW (2007) Quality criteria were proposed for
measurement properties of health status questionnaires. Journal of Clinical
Epidemiology 60: 34-42.
Terwee CB, Dekker FW, Wiersinga WM, Prummel MF, Bossuyt PMM (2003)
On assessing responsiveness of health-related quality of life instruments:
guidelines for instrument evaluation. Quality of Life Research 12: 349-362.
Tieman B, Palisano RJ, Gracely EJ, Rosenbaum P, Chiarello LA, O'Neil M
(2004) Changes in mobility of children with cerebral palsy over time and across
environmental settings. Physical & Occupational Therapy in Pediatrics 24:
109-128.
Tieman BL, Palisano RJ, Gracely EJ, Rosenbaum PL (2004) Gross motor
capability and performance of mobility in children with cerebral palsy: a
comparison across home, school, and outdoors/community settings. Physical
Therapy 84: 419-429.
Tooth LR, Ottenbacher KJ (2004) The kappa statistic in rehabilitation research:
an examination. Archives of Physical Medicine & Rehabilitation 85: 1371-1376.
References
275
van Tulder M, Furlan A, Bombardier C, Bouter L, Editorial Board of the
Cochrane Collaboration Back Review G (2003) Updated method guidelines for
systematic reviews in the cochrane collaboration back review group. Spine 28:
1290-1299.
Vargus-Adams J (2005) Health-related quality of life in childhood cerebral
palsy. Archives of Physical Medicine & Rehabilitation 86: 940-945.
Vargus-Adams J (2006) Longitudinal use of the Child Health Questionnaire in
childhood cerebral palsy. Developmental Medicine & Child Neurology 48: 343-
347.
Varni JW, Burwinkle TM, Sherman SA, Hanna K, Berrin SJ, Malcarne VL,
Chambers HG (2005) Health-related quality of life of children and adolescents
with cerebral palsy: hearing the voices of the children. Developmental Medicine
& Child Neurology 47: 592-597.
Verhagen AP, de Vet HC, de Bie RA, Boers M, van den Brandt PA (2001) The
art of quality assessment of RCTs included in systematic reviews. Journal of
Clinical Epidemiology 54: 651-654.
Verhagen AP, de Vet HC, de Bie RA, Kessels AG, Boers M, Bouter LM,
Knipschild PG (1998) The Delphi list: a criteria list for quality assessment of
randomized clinical trials for conducting systematic reviews developed by
Delphi consensus. Journal of Clinical Epidemiology 51: 1235-1241.
Vermeer A (1989) Assessment of functional motor behaviour in the daily life of
cerebral palsied children. International Journal of Rehabilitation Research 12:
452-454.
Vidal J, Deguillaume P, Vidal M (1985) The anatomy of the dysplastic hip in
cerebral palsy related to prognosis and treatment. International Orthopaedics 9:
105-110.

References
276
Vitale MG, Levy DE, Moskowitz AJ, Gelijns AC, Spellmann M, Verdisco L,
Roye DP, Jr. (2001) Capturing quality of life in pediatric orthopaedics: two
recent measures compared. Journal of Pediatric Orthopedics 21: 629-635.
Vitale MG, Roye EA, Choe JC, Hyman JE, Lee FY, Roye DP, Jr. (2005)
Assessment of health status in patients with cerebral palsy: what is the role of
quality-of-life measures? Journal of Pediatric Orthopedics 25: 792-797.
Vos-Vromans DCWM, Ketelaar M, Gorter JW (2005) Responsiveness of
evaluative measures for children with cerebral palsy: the Gross Motor Function
Measure and the Pediatric Evaluation of Disability Inventory. Disability &
Rehabilitation 27: 1245-1252.
Wake M, Salmon L, Reddihough D (2003) Health status of Australian children
with mild to severe cerebral palsy: cross-sectional survey using the Child Health
Questionnaire. Developmental Medicine & Child Neurology 45: 194-199.
Walter SD, Eliasziw M, Donner A (1998) Sample size and optimal designs for
reliability studies. Statistics in Medicine 17: 101-110.
Wang H-Y, Yang YH (2006) Evaluating the responsiveness of 2 versions of the
gross motor function measure for children with cerebral palsy. Archives of
Physical Medicine & Rehabilitation 87: 51-56.
Ward MM, Marx AS, Barry NN (2000) Identification of clinically important
changes in health status using receiver operating characteristic curves. Journal
of Clinical Epidemiology 53: 279-284.
Wassenberg-Severijnen JE, Custers JWH, Hox JJ, Vermeer A, Helders PJM
(2003) Reliability of the Dutch Pediatric Evaluation of Disability Inventory
(PEDI). Clinical Rehabilitation 17: 457-462.
Waters E, Salmon L, Wake M (2000) The parent-form Child Health
Questionnaire in Australia: comparison of reliability, validity, structure, and
norms. Journal of Pediatric Psychology 25: 381-391.
References
277
Waters E, Salmon L, Wake M, Hesketh K, Wright M (2000) The Child Health
Questionnaire in Australia: reliability, validity and population means. Australian
& New Zealand Journal of Public Health 24: 207-210.
Wilcoxon F (1945) Individual comparisons by ranking methods. Biometrics 1:
8.
Williams EN, Carroll SG, Reddihough DS, Phillips BA, Galea MP (2005)
Investigation of the timed 'up & go' test in children. Developmental Medicine &
Child Neurology 47: 518-524.
Wood E, Rosenbaum P (2000) The gross motor function classification system
for cerebral palsy: a study of reliability and stability over time. Developmental
Medicine & Child Neurology 42: 292-296.
World Health Organisation (2001) International Classification of Functioning,
Disability and Health. Short Version. Geneva: WHO.
Wren TAL, Sheng M, Hara R, Otsuka NY, Bowen RE, Scaduto AA, Kay RM,
Chan LS (2007) Agreement among three instruments for measuring functional
health status and quality of life in pediatric orthopaedics. Journal of Pediatric
Orthopedics 27: 233-240.
Wright FV, Boschen K, Jutai J (2005) Exploring the comparative
responsiveness of a core set of outcome measures in a school-based conductive
education programme. Child: Care, Health & Development 31: 291-302.
Wright FV, Boschen KA (1993) The Pediatric Evaluation of Disability
Inventory (PEDI): validation of a new functional assessment outcome
instrument. Canadian Journal of Rehabilitation 7: 41-42.
Wright JG (2003) Pro: Interobserver variability of gait analysis. Journal of
Pediatric Orthopaedics 23: 288-289.

References
278
Young NL, Williams JI, Yoshida KK, Bombardier C, Wright JG (1996) The
context of measuring disability: does it matter whether capability or
performance is measured? Journal of Clinical Epidemiology 49: 1097-1101.
Young NL, Williams JI, Yoshida KK, Wright JG (2000) Measurement
properties of the activities scale for kids. Journal of Clinical Epidemiology 53:
125-137.
Young NL, Wright JG (1995) Measuring pediatric physical function. Journal of
Pediatric Orthopedics 15: 244-253.
Young NL, Yoshida KK, Williams JI, Bombardier C, Wright JG (1995) The
role of children in reporting their physical disability. Archives of Physical
Medicine & Rehabilitation 76: 913-918.
Ziviani J, Ottenbacher KJ, Shephard K, Foreman S, Astbury W, Ireland P
(2001) Concurrent validity of the Functional Independence Measure for
Children (WeeFIM) and the Pediatric Evaluation of Disabilities Inventory in
children with developmental disabilities and acquired brain injuries. Physical &
Occupational Therapy in Pediatrics 21: 91-101.
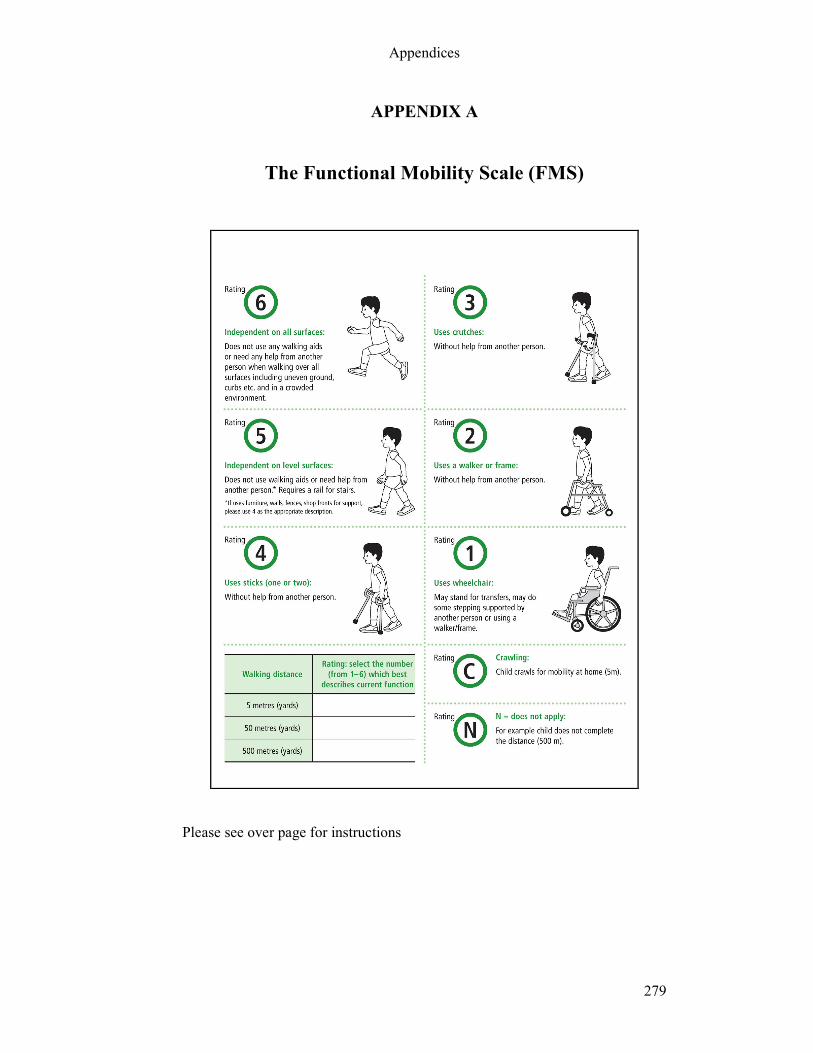
Appendices
279
APPENDIX A
The Functional Mobility Scale (FMS)
Please see over page for instructions
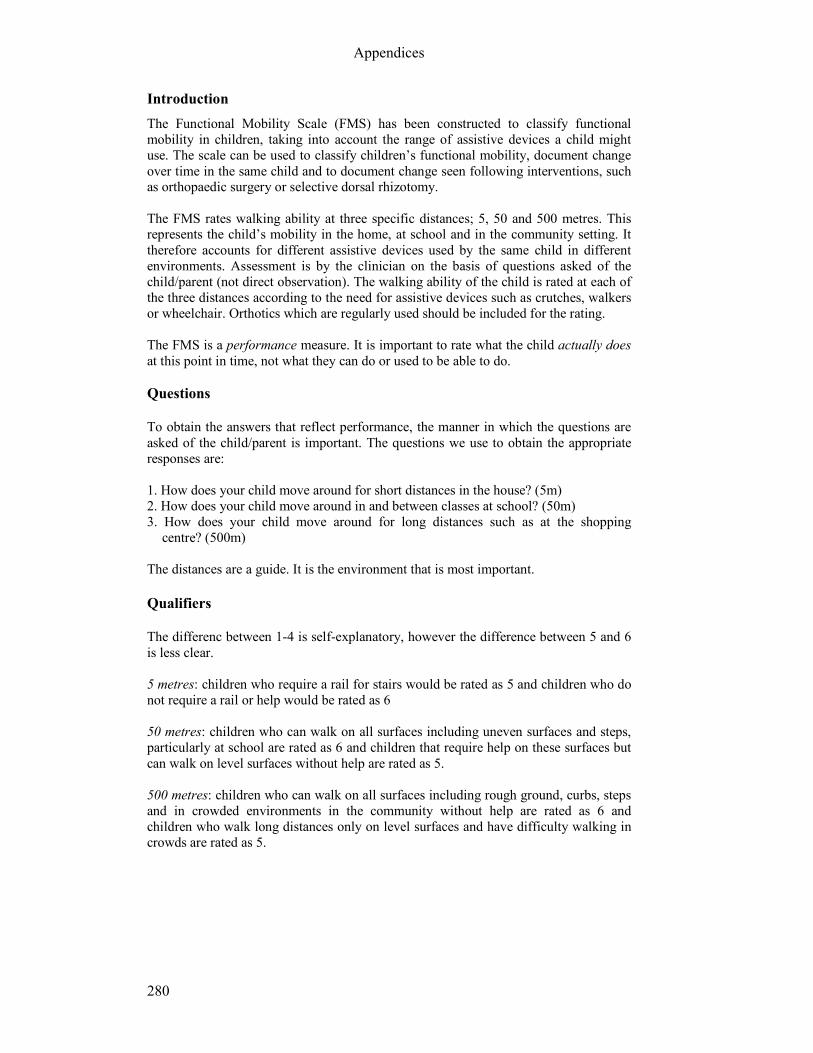
Appendices
280
Introduction
The Functional Mobility Scale (FMS) has been constructed to classify functional
mobility in children, taking into account the range of assistive devices a child might
use. The scale can be used to classify children’s functional mobility, document change
over time in the same child and to document change seen following interventions, such as orthopaedic surgery or selective dorsal rhizotomy.
The FMS rates walking ability at three specific distances; 5, 50 and 500 metres. This represents the child’s mobility in the home, at school and in the community setting. It
therefore accounts for different assistive devices used by the same child in different
environments. Assessment is by the clinician on the basis of questions asked of the
child/parent (not direct observation). The walking ability of the child is rated at each of
the three distances according to the need for assistive devices such as crutches, walkers
or wheelchair. Orthotics which are regularly used should be included for the rating.
The FMS is a performance measure. It is important to rate what the child actually does
at this point in time, not what they can do or used to be able to do.
Questions
To obtain the answers that reflect performance, the manner in which the questions are
asked of the child/parent is important. The questions we use to obtain the appropriate
responses are:
1. How does your child move around for short distances in the house? (5m)
2. How does your child move around in and between classes at school? (50m)
3. How does your child move around for long distances such as at the shopping
centre? (500m)
The distances are a guide. It is the environment that is most important.
Qualifiers
The differenc between 1-4 is self-explanatory, however the difference between 5 and 6
is less clear.
5 metres: children who require a rail for stairs would be rated as 5 and children who do
not require a rail or help would be rated as 6
50 metres: children who can walk on all surfaces including uneven surfaces and steps,
particularly at school are rated as 6 and children that require help on these surfaces but
can walk on level surfaces without help are rated as 5.
500 metres: children who can walk on all surfaces including rough ground, curbs, steps
and in crowded environments in the community without help are rated as 6 and
children who walk long distances only on level surfaces and have difficulty walking in
crowds are rated as 5.

Appendices
281
APPENDIX B
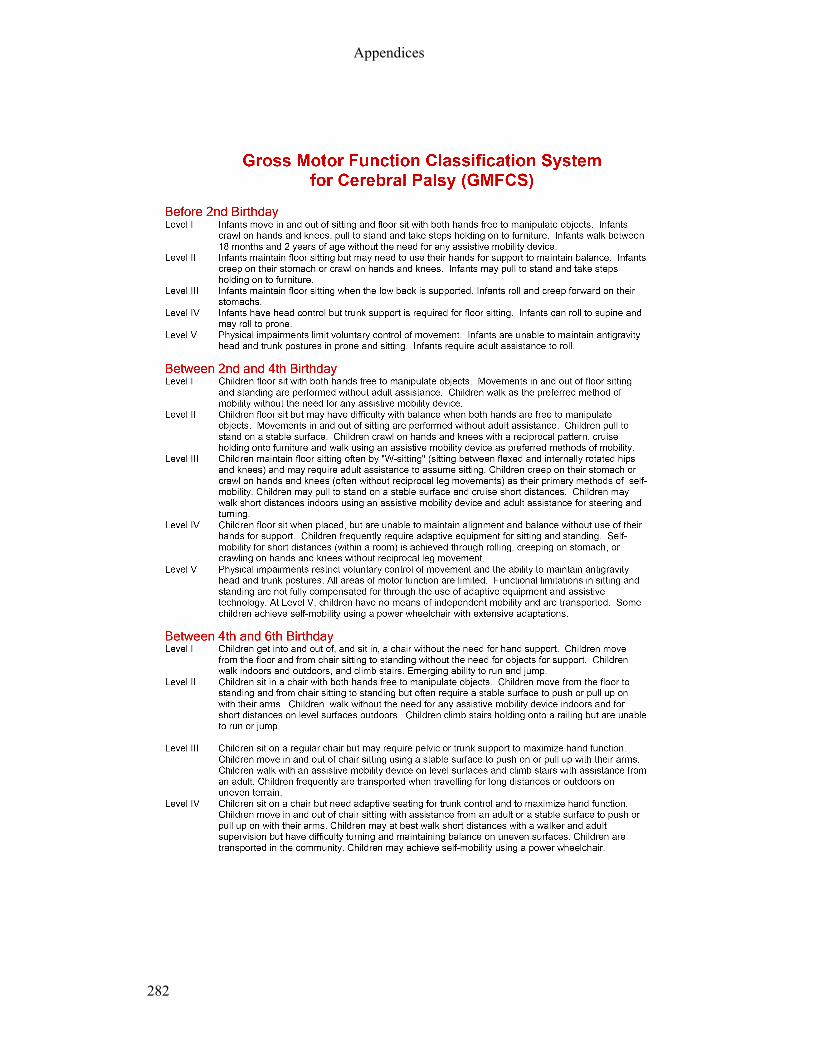
Appendices
282
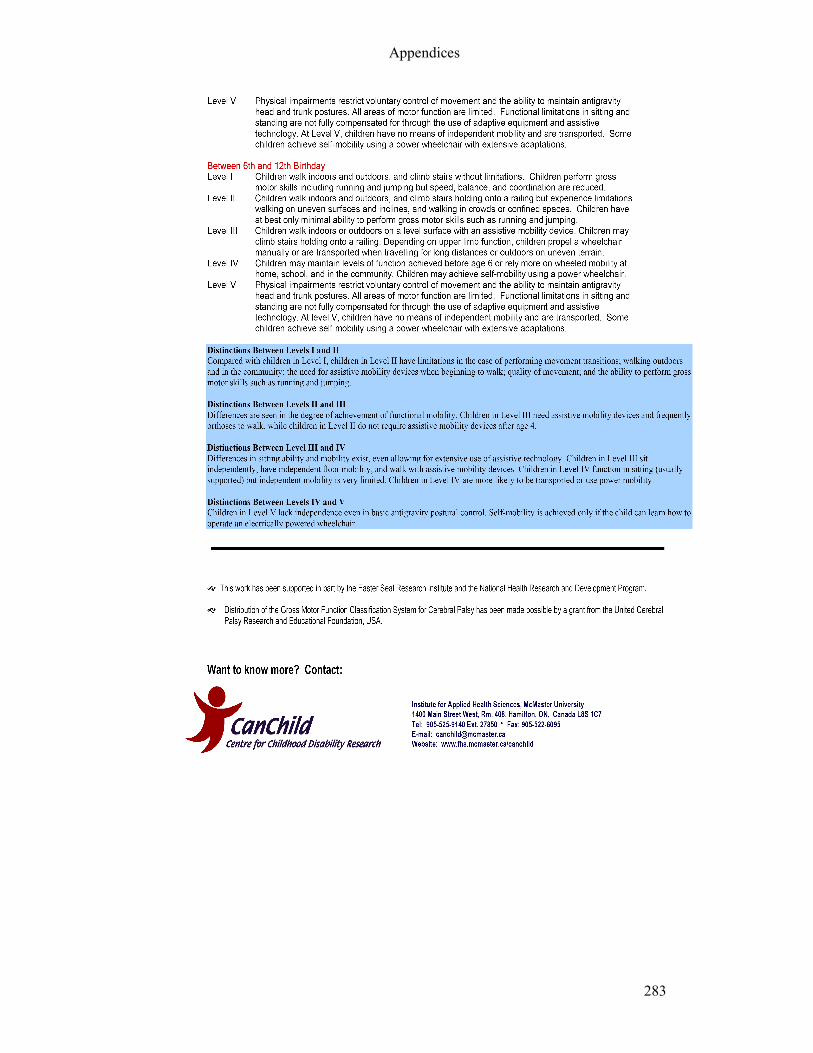
Appendices
283

Appendices
284

Appendices
285
APPENDIX
C
System
atic Review Data Extraction and Q
uality Assessm
ent Form
Reviewer: Paper title:
Authors: Journal name, volume, year:
Criteria
Description
Quality Assessment
1. Study aim
s
(objective or goal may
be stated instead).
Stated yes/no
Justified yes/no
Aim (write): ………………………………………...
.……………………………………………………...
Adequate/inadequate
Adequate/inadequate
…………………………………………………………………………
………..……………………………………………………….
2.Subject selection
a) Sample size
b) Population in this
study
c) Recruitment
d) Sampling
Stated? Yes/no If yes N= ………..
Is the population described? Yes/no.
If yes is it CP only or CP mixed with other
conditions? C
ircle other:
ABI/SB/DD/disability/other (state if other)………...
Numbers of each:…………………………………
…………………………………………………….
Is the recruitment procedure described? Yes/no.
If yes, where were subjects recruited from?
……………………………………………………
……………………………………………………
Is the sampling procedure described? Yes/no
If yes circle. Convenience, consecutive, purposive,
quota, random, systematic, other (state)
Is the sample size adequate for the aim of the study? Yes/no/unclear
Is it possible to extract only CP from the data? Yes/no/unclear
……………….
Is the recruitment procedure well-matched for the aims of the study?
Yes/no/unclear
Comments (if required):
Is the sampling procedure well-matched to aims of the study?
Yes/no/unclear

Appendices
286
d) Inclusion/exclusion
criteria
(i) Inclusion list:
(ii) Exclusion list
Comments:
Is the inclusion list enough to satisfy the aims of the study?
Yes/no/insufficient info
Is the exclusion list enough to reduce the effects of confounding
factors? Yes/no/insufficient info
3. Subject
characteristics
Subject ages
Subject gender
GMFCS levels (CP)
Topography of CP
Other (if not CP)
Mean, range……………………………………….
Ratio………………………………………………
Levels: ……………………………………………
Hemi/dipl/quad …………………………………..
……………………………………………………
Comments (if required)
Adequate/inadequate
Adequate/inadequate
Adequate/partial/inadequate/not applicable
Adequate/partial/inadequate/not applicable
4 Rater
characteristics
(if applicable)
If raters are used in this study, who are the raters?
Circle: therapists/parents/doctors/other
clinicians/teachers Number of raters………………
How were raters recruited?.......................................
……………………………………………………..
Are the rater characteristics well-matched for the study design?
Yes/no/unclear
Comments (if required)
5. Measurement
tools
a) Tool description
b) What is tool
measuring
List 2 key tools used in this study (if more than one)
1.
2.
Is the tool described in this study? Yes/no
If yes state (include whether tool is purely
motor/physical function or this is a subsection)…….
………………………………………………………
1. GF/PF/M/ QOL/GMF/unclear/other
2. GF/PF/M/ QOL/GMF/unclear/other
Does the tool(s) listed appear to have face validity for the study aims?
1. Yes/no
2. Yes/no
……………………………………………………………………….
……………………………………………………………………….
………………………………………………………………………..
Comments (if required):

Appendices
287
c) Target population
for this tool
What is the group(s) of children this tool has been
devised for? State:
1. Diagnosis…………………………….
2. Age group……………………………
Is this well matched for the population used in this particular study?
Yes/no
d) Environment
Does tool used incorporate different environments
of home/school/community?
Yes/ No/ Unclear
N/A
Comments (if required):
e) Assistive devices
Does tool used distinguish different assistive
devices
Yes/No/Unclear
N/A
Comments (if required):
f) Performance or
Capability
Does tool measure performance or capability?
Circle: Performance/Capability/Unclear
Is this adequately justified in light of the aims of the tool/study?
Yes/No/Not applicable
g) Tool feasibility
(i) time taken
(ii) equipment
required
(iii) training required
Stated/not stated/unclear.
If stated, time taken …………. …………………….
Stated/ not stated/unclear. If stated, list
……………………………….……………………
……………………………….……………………
Stated/not stated/unclear. If stated, list:
………………………………….…………………
(i) Is the time taken feasible in line with the goal of the tool?
Feasible/not feasible/insufficient info
(ii) Is this requirement feasible in line with the goal of the tool?
Feasible/not feasible/insufficient info
(iii) Is this requirement feasible in line with the goal of the tool?
Feasible/not feasible/insufficient info
6. Reliability
Circle which tested
a) Interrater
b) Retest/Intrarater
c) Not tested
Statistical test used and results (write values)
Is the result adequate to state the tool is reliable?
a) Yes/no/insufficient information
b) Yes/no/insufficient information
Comments (if required):
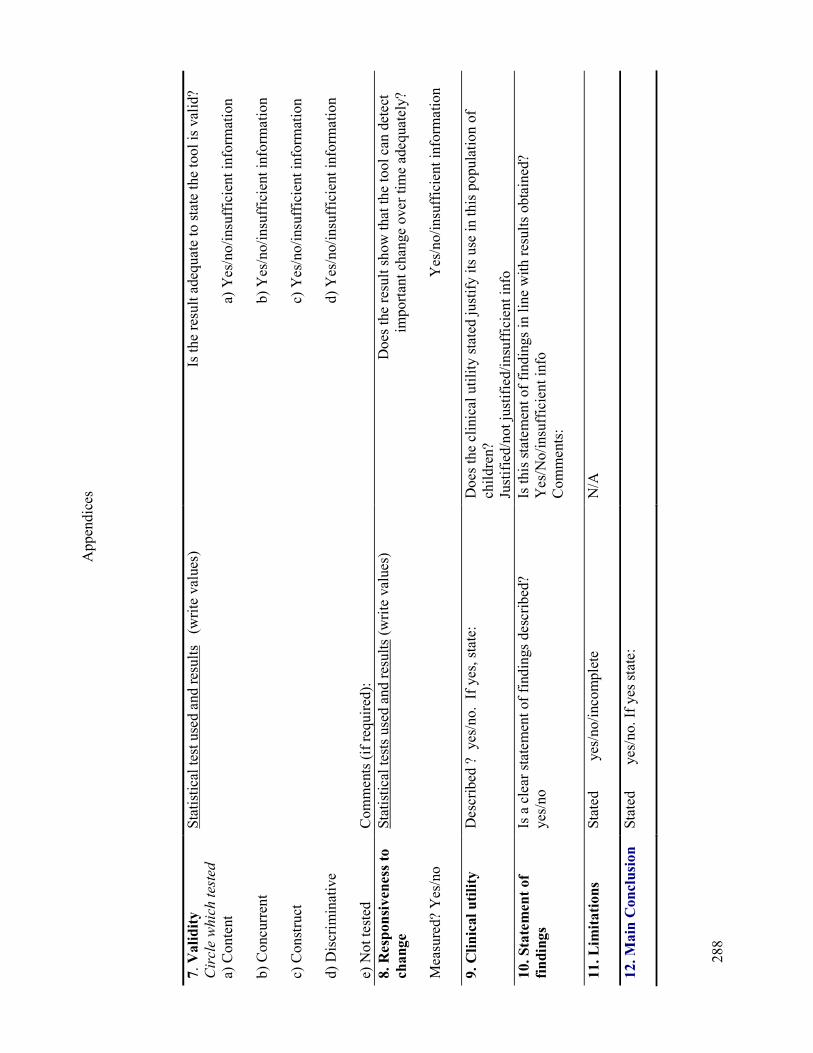
Appendices
288
7. Validity
Circle which tested
a) Content
b) Concurrent
c) Construct
d) Discriminative
e) Not tested
Statistical test used and results (write values)
Comments (if required):
Is the result adequate to state the tool is valid?
a) Yes/no/insufficient information
b) Yes/no/insufficient information
c) Yes/no/insufficient information
d) Yes/no/insufficient information
8. Responsiveness to
change
Measured? Yes/no
Statistical tests used and results (write values)
Does the result show that the tool can detect
important change over time adequately?
Yes/no/insufficient information
9. Clinical utility
Described ? yes/no. If yes, state:
Does the clinical utility stated justify its use in this population of
children?
Justified/not justified/insufficient info
10. Statement of
findings
Is a clear statement of findings described?
yes/no
Is this statement of findings in line with results obtained?
Yes/No/insufficient info
Comments:
11. Lim
itations
Stated yes/no/incomplete
N/A
12. Main Conclusion
Stated yes/no. If yes state:
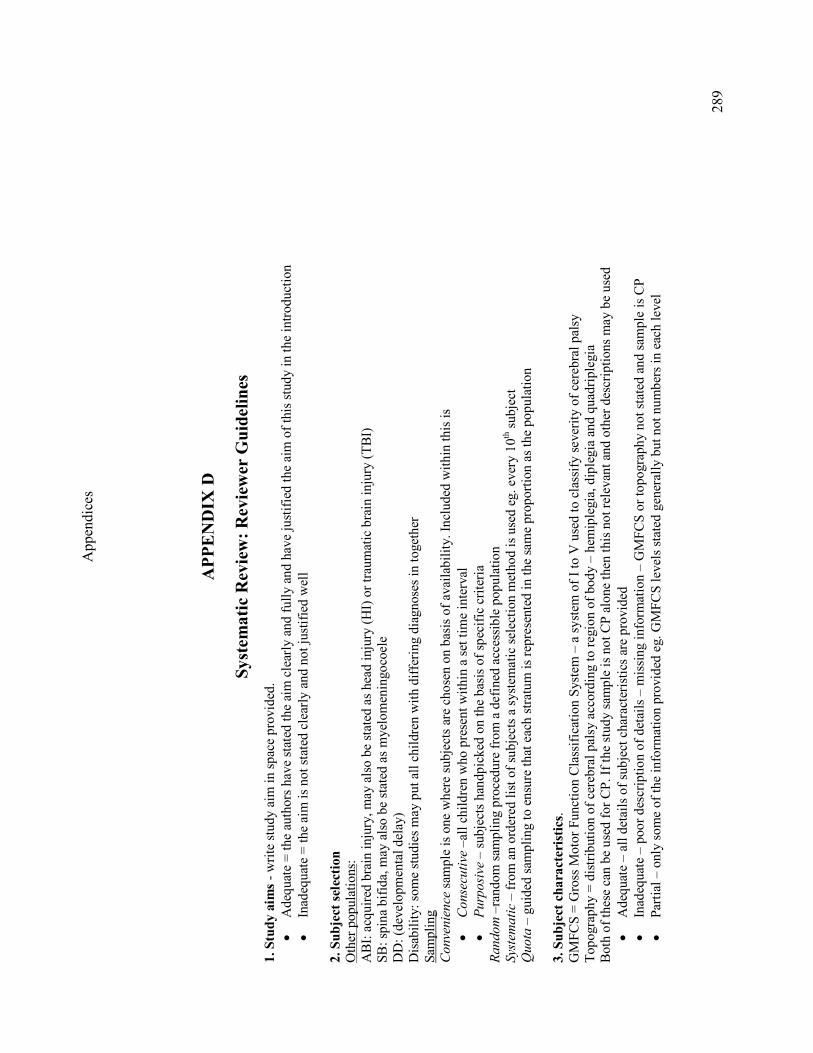
Appendices
289
APPENDIX
D
System
atic Review: Reviewer G
uidelines
1. Study aim
s - write study aim in space provided.
• Adequate = the authors have stated the aim clearly and fully and have justified the aim of this study in the introduction
• Inadequate = the aim is not stated clearly and not justified well
2. Subject selection
Other populations:
ABI: acquired brain injury, may also be stated as head injury (HI) or traumatic brain injury (TBI)
SB: spina bifida, may also be stated as myelomeningocoele
DD: (developmental delay)
Disability: some studies may put all children with differing diagnoses in together
Sampling
Convenience sample is one where subjects are chosen on basis of availability. Included within this is
•
Consecu
tive –all children who present within a set time interval
•
Purp
osive – subjects handpicked on the basis of specific criteria
Random –random sampling procedure from a defined accessible population
Systematic – from an ordered list of subjects a systematic selection method is used eg. every 10th subject
Quota – guided sampling to ensure that each stratum is represented in the same proportion as the population
3. Subject characteristics.
GMFCS = Gross Motor Function Classification System – a system of I to V used to classify severity of cerebral palsy
Topography = distribution of cerebral palsy according to region of body – hemiplegia, diplegia and quadriplegia
Both of these can be used for CP. If the study sample is not CP alone then this not relevant and other descriptions may be used
• Adequate – all details of subject characteristics are provided
• Inadequate – poor description of details – missing information – GMFCS or topography not stated and sample is CP
• Partial – only some of the information provided eg. GMFCS levels stated generally but not numbers in each level
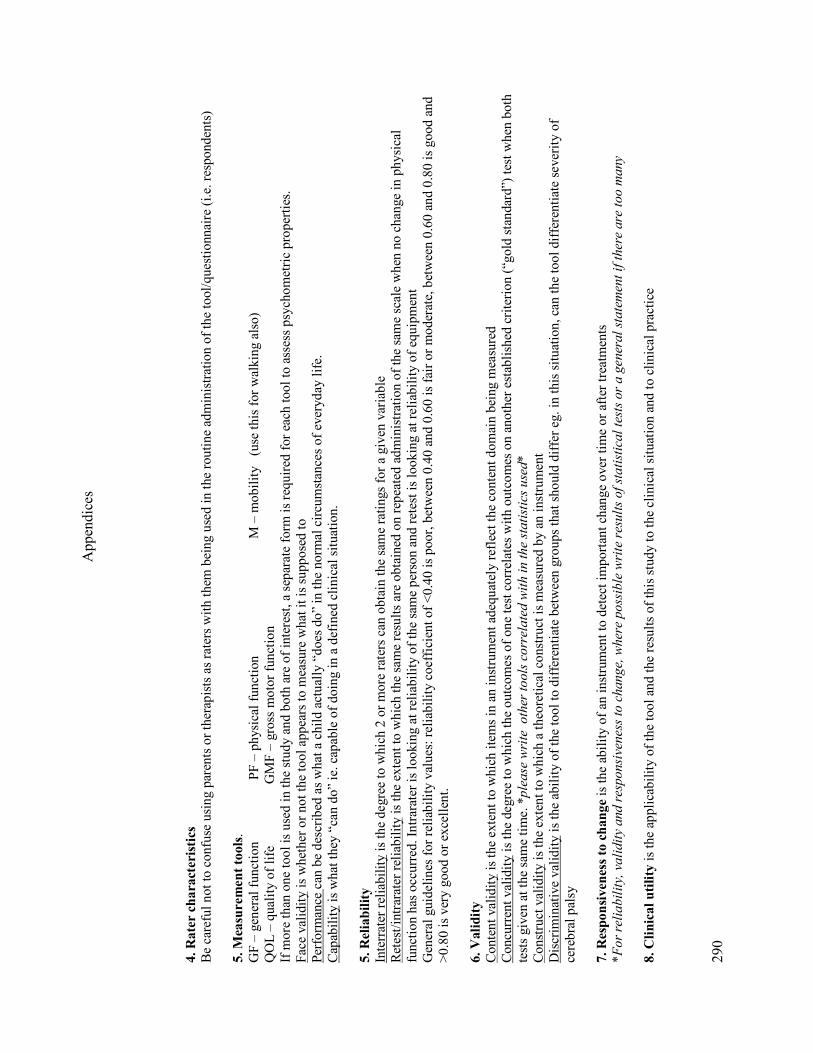
Appendices
290
4. Rater characteristics
Be careful not to confuse using parents or therapists as raters with them being used in the routine administration of the tool/questionnaire (i.e. respondents)
5. Measurement tools.
GF – general function PF – physical function M – mobility (use this for walking also)
QOL – quality of life GMF – gross motor function
If more than one tool is used in the study and both are of interest, a separate form is required for each tool to assess psychometric properties.
Face validity is whether or not the tool appears to measure what it is supposed to
Performance can be described as what a child actually “does do” in the normal circumstances of everyday life.
Capability is what they “can do” ie. capable of doing in a defined clinical situation.
5. Reliability
Interrater reliability is the degree to which 2 or more raters can obtain the same ratings for a given variable
Retest/intrarater reliability is the extent to which the same results are obtained on repeated administration of the same scale when no change in physical
function has occurred. Intrarater is looking at reliability of the same person and retest is looking at reliability of equipment
General guidelines for reliability values: reliability coefficient of <0.40 is poor, between 0.40 and 0.60 is fair or moderate, between 0.60 and 0.80 is good and
>0.80 is very good or excellent.
6. Validity
Content validity is the extent to which items in an instrument adequately reflect the content domain being measured
Concurrent validity is the degree to which the outcomes of one test correlates with outcomes on another established criterion (“gold standard”) test when both
tests given at the same time. *please w
rite other tools correlated w
ith in the statistics used*
Construct validity is the extent to which a theoretical construct is measured by an instrument
Discriminative validity is the ability of the tool to differentiate between groups that should differ eg. in this situation, can the tool differentiate severity of
cerebral palsy
7. Responsiveness to change is the ability of an instrument to detect important change over time or after treatments
*For reliability, validity and responsiveness to change, w
here possible w
rite results of statistical tests or a gen
eral statemen
t if there are too m
any
8. Clinical utility is the applicability of the tool and the results of this study to the clinical situation and to clinical practice

Appendices
291
APPENDIX E
The Gillette Functional Assessment Questionnaire
Name: UR: Date:
Please choose the answer below that best describes your child's usual or typical walking abilities
Circle one number which best describes the highest level of walking ability.
.
1 Cannot take any steps at all
2 Can do some stepping on his/her own with the help of another person. Does not take
full weight on feet; Does not walk on routine basis.
3 Walks for exercise in therapy and/or less than typical household distances.
4 Walks for household distances, but makes slow progress. Does not use walking at
home as preferred mobility. (primarily walks in therapy or as exercise).
5 Walks for household distances routinely at home and/or school. Indoor walking only.
6 Walks more than 15-50 ft. outside the home but usually uses a wheelchair or stroller
for community distances or in congested areas.
7 Walks outside for community distances, but only on level surfaces (cannot perform
curbs, uneven terrain, or stairs without assistance of another person).
8
Walks outside the home for community distances, is able to get around on curbs and
uneven terrain in addition to level surfaces, but usually requires minimal assistance or
supervision for safety.
9
Walks outside the home for community distances, easily gets around on level ground,
curbs, and uneven terrain, but has difficulty or requires minimal assistance or
supervision with running, climbing and/or stairs.
10 Walks, runs, and climbs on level and uneven terrain and does stairs without difficulty
or assistance.
Please tick all the things that your child is able to do, in addition to walking:
Walk carrying an object Jumps off a single step3
Walk carrying a fragile object or glass
of liquid Hop on right foot
4
Walk up and down stairs using the
railing Hop on left foot
4
Walk up and down stairs without
needing the railing Step over an object, right foot first4
Steps up and down curb independently Step over an object, left foot first4
Runs Kick a ball with right foot
4
Runs well including around a corner
with good control Kick a ball with left foot
4
Can take steps backwards Ride 2 wheel bike5
Can manoeuvre in tight areas
Ride 3 wheel bike
Get on and off a bus by him/herself
1 Ice skate or roller skate
6
Skip rope
2
Ride an escalator, can step on/off
without help 1Including first step without crawling. Use of railing permitted. 2Consistently with successive jumps. Twirling rope by self or by other people 3Without falling upon landing 4Without holding on, without falling upon landing 5Without
training wheels 6Without holding on to objects or another person

Appendices
292
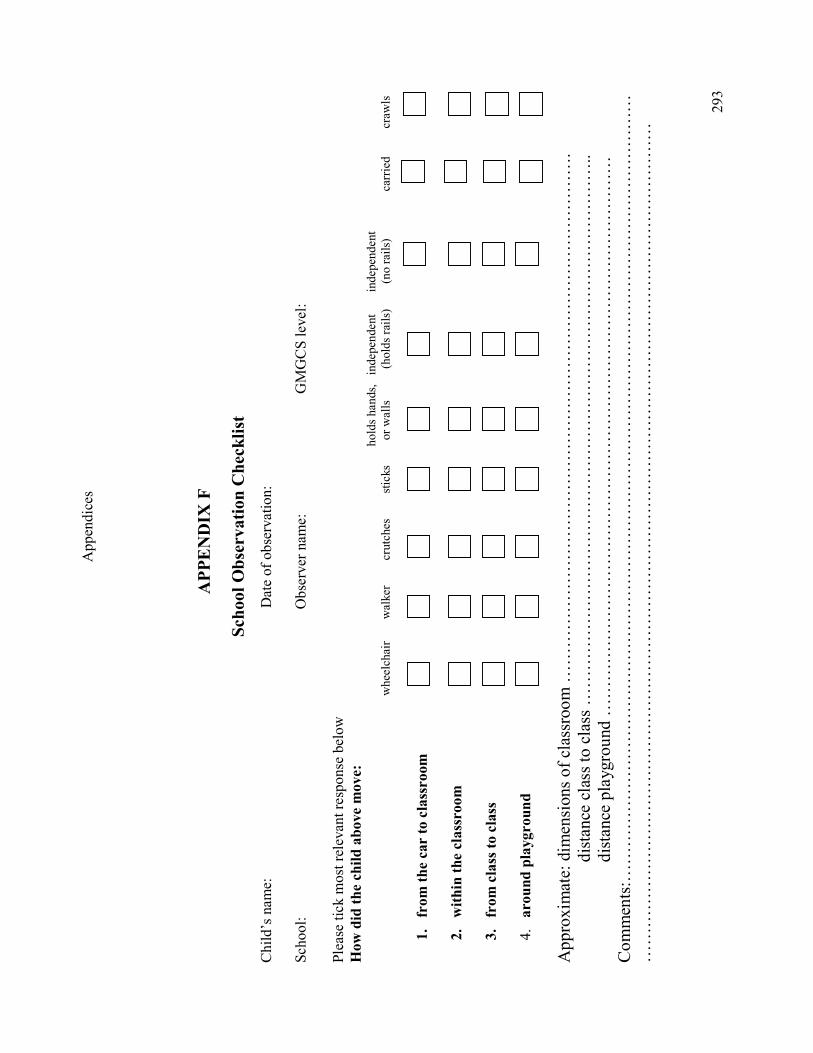
Appendices
293
APPENDIX
F
School Observation Checklist
Child’s name: Date of observation:
School: Observer name: GMGCS level:
Please tick most relevant response below
How did the child above m
ove:
holds hands, independent independent
wheelchair walker crutches sticks or walls (holds rails) (no rails) carried crawls
1. from the car to classroom
2. within the classroom
3. from class to class
4. around playground
Approximate: dimensions of classroom ……………………………………………………………………………….
distance class to class …………………………………………………………………………………..
distance playground ……………………………………………………………………………………
Comments:………………………………………………………………………………………………………………………
………………………………………………………………………………………………………………………………

Appendices
294

Appendices
295
APPENDIX
G
Home Observation Checklist
Child’s name: Date and time of observation:
Observer name:
Please tick most relevant response below
How did the child above m
ove:
holds hands, independent independent
wheelchair walker crutches sticks or walls (holds rails) (no rails) carried crawls
1. from room to room
2. within one room
3. outside the home
Approximate: dimensions of room ………………………………………………………………………………………
distance room to room ……………………………………………………………………………………
distance moved outside the house…………………………………………………………………………
pedometer…………………………………………………………………………………………………
Comments:
…………………………………………………………………………………………………………………………………
…………………………………………………………………………………………………………………………………
…………………………………………………………………………………………………………………………………

Appendices
296

Appendices
297
APPENDIX H
Ethics Approvals

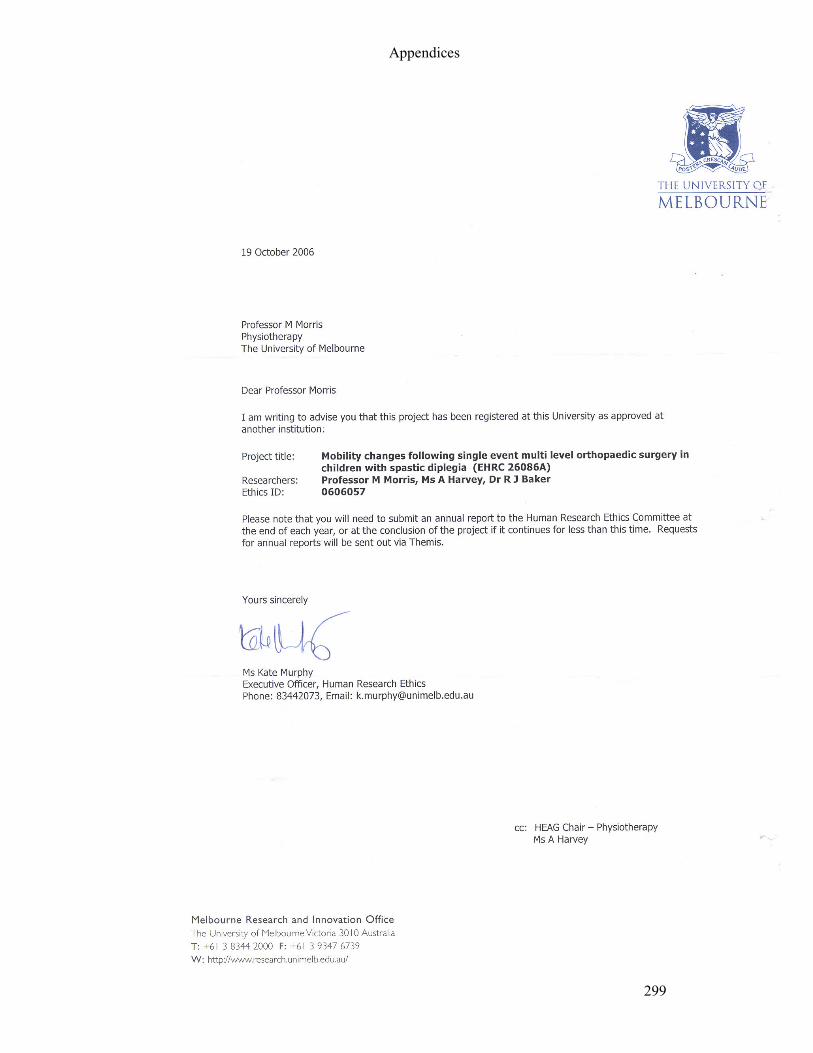
Appendices
299

Appendices
301

Appendices
303


Appendices
305


Appendices
307


Appendices
309
APPENDIX I
First author publications arising during candidature
Harvey A, Morris M, Graham HK, Baker R & Wolfe R (2007). The Functional
Mobility Scale (FMS): ability to detect change following single event multilevel
surgery. Dev Med Child Neurol. 49:603-607
Harvey A, Robin J, Morris ME, Graham HK & Baker R (2008). A systematic
review of measures of activity limitation for children with cerebral palsy. Dev
Med Child Neurol. 50:190-198

Minerva Access is the Institutional Repository of The University of Melbourne
Author/s:
HARVEY, ADRIENNE RUTH
Title:
The functional mobility scale for children with cerebral palsy: reliability and validity
Date:
2008-02
Citation:
Harvey, A. R. (2008). The functional mobility scale for children with cerebral palsy: reliability
and validity. PhD thesis, School of Physiotherapy, The University of Melbourne.
Publication Status:
Unpublished
Persistent Link:
http://hdl.handle.net/11343/39403
File Description:
The Functional Mobility Scale for children with cerebral palsy: reliability and validity
Terms and Conditions:
Terms and Conditions: Copyright in works deposited in Minerva Access is retained by the
copyright owner. The work may not be altered without permission from the copyright owner.
Readers may only download, print and save electronic copies of whole works for their own
personal non-commercial use. Any use that exceeds these limits requires permission from
the copyright owner. Attribution is essential when quoting or paraphrasing from these works.
Top Related
Copyright © 2022 FDOKUMEN

