


Bahasa
Halaman
Hukum

promoting access to White Rose research papers
White Rose Research Online [email protected]
Universities of Leeds, Sheffield and York http://eprints.whiterose.ac.uk/
This is an author produced version of a paper published in European Urology. White Rose Research Online URL for this paper: http://eprints.whiterose.ac.uk/10439
Published paper Catto, J.W.F., Abbod, M.F., Wild, P.J., Linkens, D.A., Pilarsky, C., Rehman, I., Rosario, D.J., Denzinger, S., Burger, M., Stoehr, R., Knuechel, R., Hartmann, A., Hamdy, F.C., The application of artificial intelligence to microarray data: identification of a novel gene signature to identify bladder cancer progression, European Urology, 57 (3), pp. 398-406 http://dx.doi.org/10.1016/j.eururo.2009.10.029
1
The application of artificial intelligence to microarray data: Identification of
a novel gene signature to identify bladder cancer progression
James W . F . Catto PhD1$*, Maysam F . Abbod PhD 2$, Peter J. Wild M D 3$, Derek A .
L inkens PhD4, Christian Pilarsky PhD5, Ishtiaq Rehman PhD1, Derek J. Rosario
M D1, Stefan Denzinger M D6, Maximilian Burger M D6, Robert Stoehr PhD7, Ruth
K nuechel M D8, A rndt Hartmann M D7# and F reddie C . Hamdy M D9#
1Academic Urology Unit and 4 Department of Automatic Control and Systems
Engineering, University of Sheffield, UK; 2 School of Engineering and Design, Brunel
University, West London, UB8 3PH; 3 Institute for Surgical Pathology, University
Hospital Zurich, Switzerland; 5 Department of Surgery, University of Dresden, Germany; 6 Department of Urology, University of Regensburg, Germany, 7 Department for
Pathology, University of Erlangen, Germany; 8 Institute of Pathology, University of
Aachen, Germany; 9 Nuffield Department of Surgery, University of Oxford, Oxford, UK;
$These authors contributed equally to this work # These authors share senior authorship of this work
*Address for correspondence; James Catto, Academic Urology Unit, K Floor, Royal
Hallamshire Hospital, Glossop road, SHEFFIELD, S10 2JF, United Kingdom, Tel: +44
+114 271 2154. Fax: +44 +114 271 2268 Email: [email protected]
Running title: Microarray interrogation using artificial intelligence
M ESH words: Artificial Intelligence, Gene array, Bladder Cancer, Prognosis
Word count:
T ext = 2344
F igures = 4 and Tables = 2
References = 30
Abstract word count: 257
*Manuscript
2
Abstract
Background: New methods to identify bladder cancer progression are required. Gene-
expression microarrays can reveal insights into disease biology and identify novel
biomarkers. However, these experiments produce large datasets that are hard to interpret.
Objective: To develop a novel method of microarray analysis combining two forms of
artificial intelligence (AI): NeuroFuzzy Modeling (NFM) and Artificial Neural Networks
(ANN). To validate this in a bladder cancer cohort.
Design, Setting, and Participants: We used AI and statistical analyses to identify
progression-related genes in a microarray dataset (n=66 tumors, n=2,800 genes). The AI-
selected genes were then investigated in a second cohort (n=262 tumors) using
immunohistochemistry.
Measurements: We compared the accuracy of AI and statistical approaches to identify
tumor progression.
Results and limitations: AI identified 11 progression-associated genes (OR=0.70 (95%
CI=0.56-0.87) p=0.0004) and these were more discriminate than genes chosen using
statistical analyses (OR=1.24 (95% CI=0.96-1.60) p=0.09). The expression of 6 AI-
selected genes (LIG3, Fas, KRT18, ICAM1, DSG2 and BRCA2) was determined using
commercial antibodies and successfully identified tumor progression (Concordance
3
Index=0.66, Logrank p=0.01). AI-selected genes were more discriminate than
pathological criteria at determining progression (Cox multivariate analysis p=0.01).
Limitations include the use of statistical correlation to identify 200 genes for AI analysis
and that we did not compare regression identified genes with immunohistochemistry.
C onclusions: AI and statistical analyses use different techniques of inference to
determine gene-phenotype associations and identify distinct prognostic gene signatures
that are equally valid. We have identified a prognostic gene signature, whose members
reflect a variety of carcinogenic pathways, which could identify progression in non-
muscle invasive bladder cancers.
4
Introduction
The care of patients with Urothelial Carcinoma of the bladder (UCC) could be
significantly improved if their tumor behavior was accurately identified at diagnosis.
Patients with non-progressive superficial disease could be spared endoscopic surveillance
and BCG immunotherapy, whilst those at high progression risk could opt for early
cystectomy. For invasive tumors the use of systemic chemotherapy could be rationalized
to cases with highest progression risk. Tumor behavior can be hard to determine from
histopathology alone. For example, the progression risk for non-muscle UCC varies
between <1% and >50% [1, 2]. Furthermore, as stage and grade are often linked, when
one is fixed (e.g. stage) the other performs poorly (e.g. grade) at identifying tumor
progression. It is hoped that molecular knowledge will reveal an understanding of tumor
biology that allows accurate phenotype identification.
As current biomarkers are insufficiently robust for clinical practice, microarrays have
been used to identify new candidates [3] [4]. Microarray experiments reveal great
insights into tumor biology but the cost and magnitude of these experiments prohibit
large sample size analyses. Thus, microarray datasets have high dimensionality (large
imbalance between gene number and sample size) that leads to analytical difficulties [5]
[6] [7]. Successful analysis requires the identification of genes related to tumor-class and
the removal of non-contributing variables. Poor analysis leads to data over-fitting and
irreproducible results [5]. Traditional analytical techniques, such as hierarchical
clustering, assume biological linearity and use statistical proximity to infer class-gene
relationships (so called ‘feature selection’). They perform poorly in datasets

5
contaminated with variable noise. Artificial intelligence (AI) is a machine learning
approach without these prerequisites. Various AI techniques exist [8] and successful
microarray analysis has been reported using artificial neural networks (ANN) [9] [10] and
support vector machines (SVMs) [11, 12] in non-urothelial malignancies. However, the
hidden working layer of an ANN prevents model understanding and hinders its
acceptance by the scientific community [13], whilst SVMs still use proximity to infer
class-gene associations and function poorly with respect to interpretability [14].
An alternative form of AI is the neurofuzzy model (NFM). This has a similar design to an
ANN, but uses a transparent fuzzy logic internal structure [8]. This transparency allows
model understanding, parameter interrogation and can facilitate the inclusion of priori
qualitative knowledge. When used to identify tumor progression we have previously
found that NFM is accurate, reproducible and appears superior to regression based
classifications [15, 16]. We hypothesized that NFM could improve microarray analysis
and identify prognostic gene panels that could accurately predict the behavior of UCC.
To test this hypothesis we examined a previously reported non-muscle invasive UCC
microarray dataset to find genes associated with progression to invasion. Genes
associated with progression were then tested in a new larger UCC cohort using
immunohistochemistry.

6
Materials and methods
Patients and Tumors
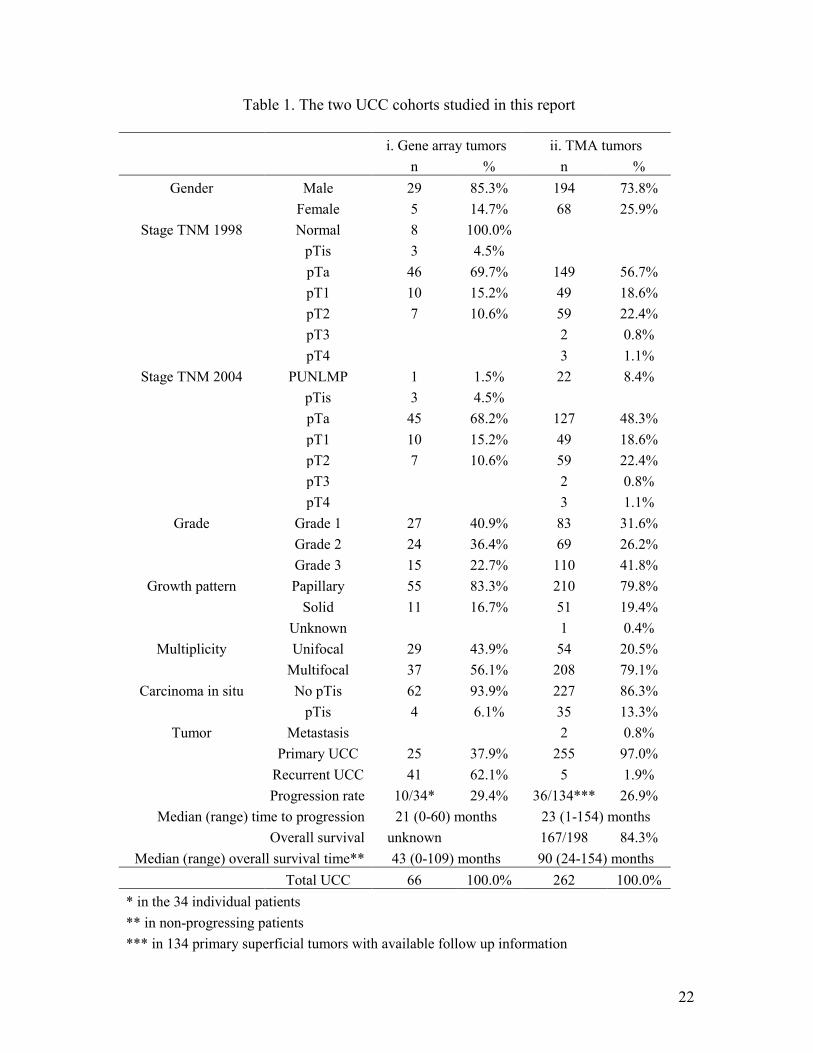
We studied two patient populations (Table 1). For microarray analysis we used 66 tumors
from 34 patients, treated at the Ludwig Maximilian University, Germany (detailed in
[17]). Progression to muscle invasion occurred in 10/34 patients (29%) and the median
follow up was 43 months. For immunohistochemical analysis we studied 262 tumors
from separate consecutive patients treated at the University of Regensburg, Germany. We
created a tissue microarray (TMA) using paraffin embedded formalin fixed tissues with 2
cores per cases (1.2mm) [18]. Progression information was available for 182/262 (69.5%)
patients and muscle invasion or new metastases occurred in 49 patients (26.9%). The
median follow up was 89 months (range 2-154). No patients were in both UCC
populations. Normal urothelium from patients with benign prostatic hyperplasia (n=20)
and co-existing UCC (n=15) was also analyzed. Institutional review board approval was
obtained from both institutions prior to study commencement.
RNA Extraction and Gene Expression Microarray Analysis
The microarray (metg001A) contained 2,800 genes (6,117 probesets) annotated by the
GoldenPath assembly. The microarray experiments and data processing are reported in
detail elsewhere [17].
Artificial Intelligence F eature Selection
To analyze the microarray data we used a ‘Committee of models’ approach that
assimilated findings from each individual AI model (Figure 1), as we wanted to
7
determine gene-progression relationships that were not dependent upon one AI structure.
We initially performed a dimension reduction using Pearson’s coefficient to identify the
200 genes most associated with progression. These selected genes were then analyzed
using iterative ANN and NFM models in two structures, which we termed ‘Selectivity’
and ‘Averaging’ (Figure 1). These structures enable simultaneous analysis of all genes,
rather than a ‘Leave-One-Out’ approach. ANNs were produced within Statistica (Version
7, StatSoft Ltd, Bedford, UK). NFMs were produced within Matlab (Version 6.5
www.mathworks.com) and progression predictions performed using an in-house software
suite [19, 20]. The data were divided into 90% for training (60% was learning and 30%
for validation) and 10% for testing. Ensembling and cross validation were used to
maximize data [21].
We ranked the 200 genes according to the size of model error induced by their alteration.
Those with largest error were ranked highest, as alteration of their values produced the
largest disturbance in the models accuracy. For each gene a ‘Committee’ ranking was
produced from the average score of the individual AI models. A panel of progression
related genes was produced from those with the highest ranking. This Committee panel
was compared with the ‘Original’ gene panel selected using Pearson’s linear regression
coefficient and GeneCluster 2.0 software [17]. This Original panel included 11 members
(FABP4, GSTM4, SERPINA1, HDAC1, C20ORF1, DNLC2A, PTK6 UBC, MGMT,
ITGB3BP and PAIP2).
Immunohistochemistry
8
To evaluate the Committee approach we analyzed the expression of its highest ranking
members using immunohistochemistry in a new UCC cohort [17, 22]. Commercially
manufactured antibodies were available for six members: LIG3 (clone 6G9; Abcam,
Cambridge, UK; dilution 1:50), BRCA2 (Abcam, Cambridge, UK; dilution 1:10),
TNFRSF6 (Abcam, Cambridge, UK; dilution 1:25), KRT18 (clone CK2; Chemicon,
Billerica, MA, USA; dilution 1:50), DSG2 (clone 3G132; Abcam, Cambridge, UK;
dilution 1:10), and ICAM1 (clone 23G12; Lab Vision, Fremont, CA, USA; dilution
1:10). For negative controls the primary antibody was omitted. Immunostained sections
were scored independently for the percentage of positive tumor cells by uropathologists
(PW, AH). The abnormal status for each protein was defined according to its cellular
function, its contrast with normal urothelial expression and from previous reports. For
ICAM1, a case was considered positive if > 30% of intra-tumoral blood vessels were
stained. For LIG3, BRCA2, TNFRSF6, and DSG2 abnormal expression was defined as a
loss or reduction of staining (0% or ≤30% positively stained cells). For both, normal
urothelium had expression in >50% of cells. Abnormal KRT18 expression was defined as
increased immunostaining (≥80% cells with positive staining) with respect to normal
samples, which were negative in 90% of cases.
Statistical Analysis
All analyses were two tailed and carried out using SPSS (version 14, SPSS Inc).
Categorical variables were compared using the 2 test and continuous variables with a T
test. Disease progression was defined when a non-muscle invasive tumor became
invasive or a muscle invasive tumor developed metastases. Progression-specific survival

9
probability following tumor resection was analyzed using the Kaplan-Meier method and
Log rank test. Patients without progression were censored when they were last reviewed
or when they died of other causes. The concordance index was calculated as reported
[23]. A P value of <0.05 was interpreted as statistically significant. Cox regression
multivariate analysis was used to compare the prognostic value of the various gene panels
with clinicopathological parameters.
10
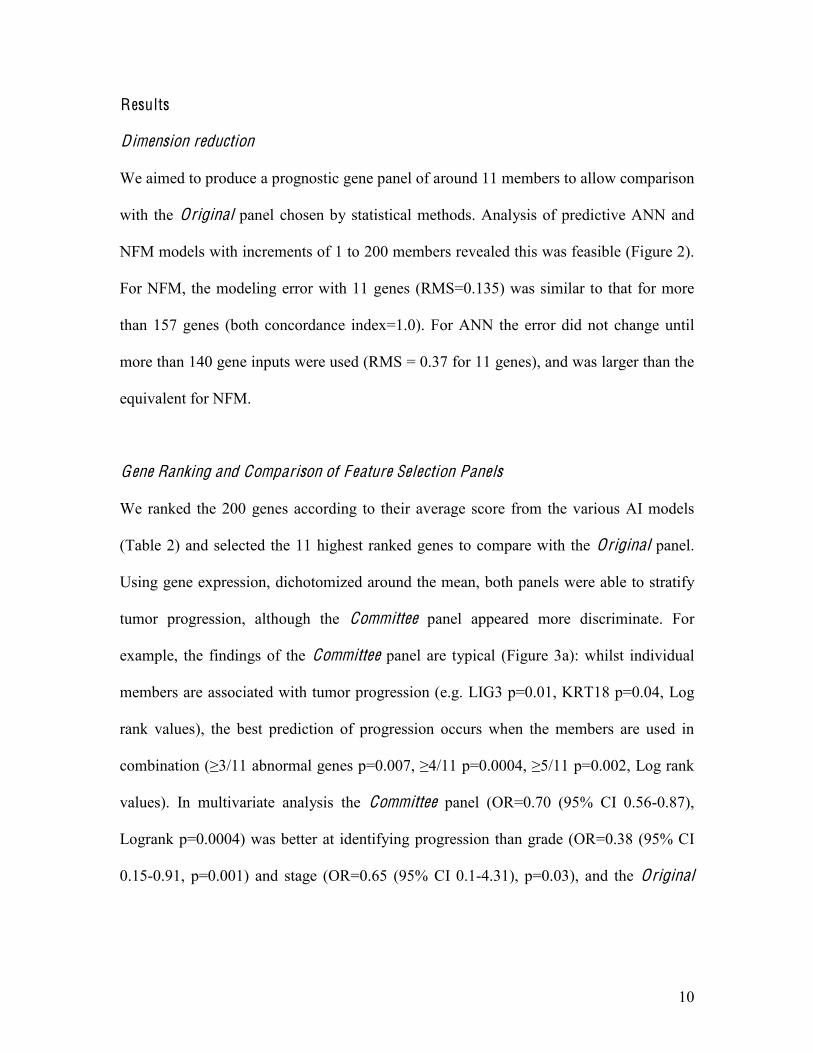
Results
Dimension reduction
We aimed to produce a prognostic gene panel of around 11 members to allow comparison
with the Original panel chosen by statistical methods. Analysis of predictive ANN and
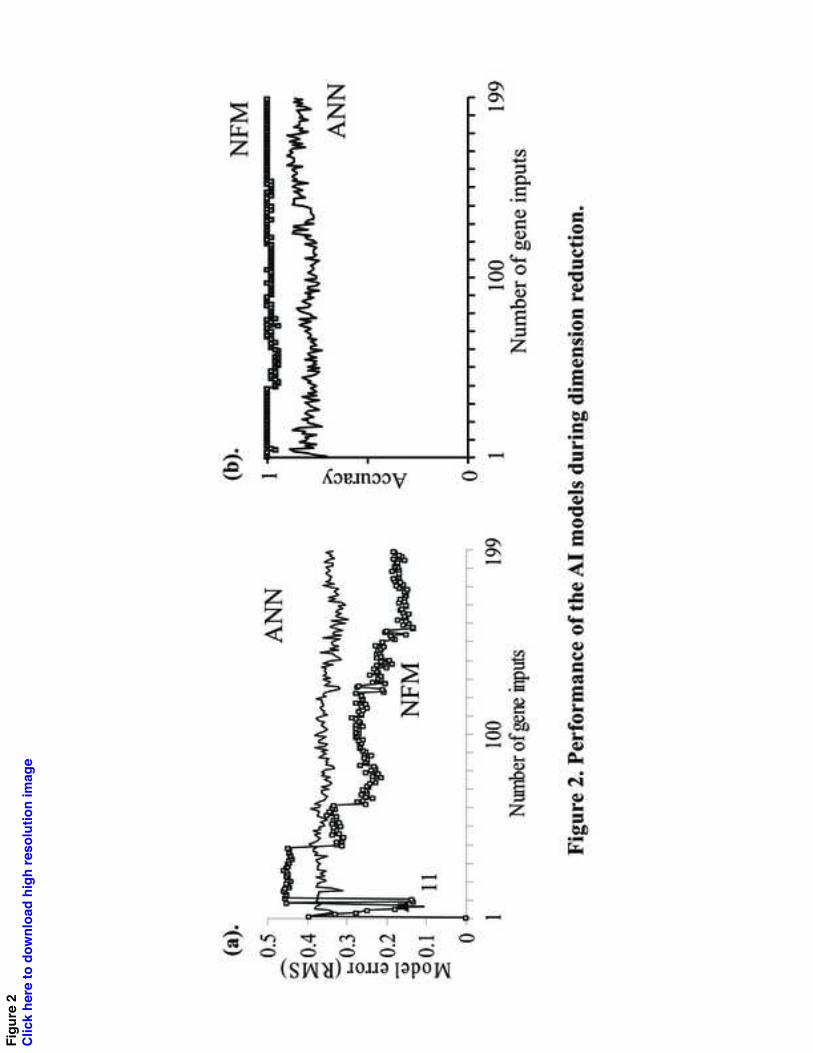
NFM models with increments of 1 to 200 members revealed this was feasible (Figure 2).
For NFM, the modeling error with 11 genes (RMS=0.135) was similar to that for more
than 157 genes (both concordance index=1.0). For ANN the error did not change until
more than 140 gene inputs were used (RMS = 0.37 for 11 genes), and was larger than the
equivalent for NFM.
Gene Ranking and Comparison of F eature Selection Panels
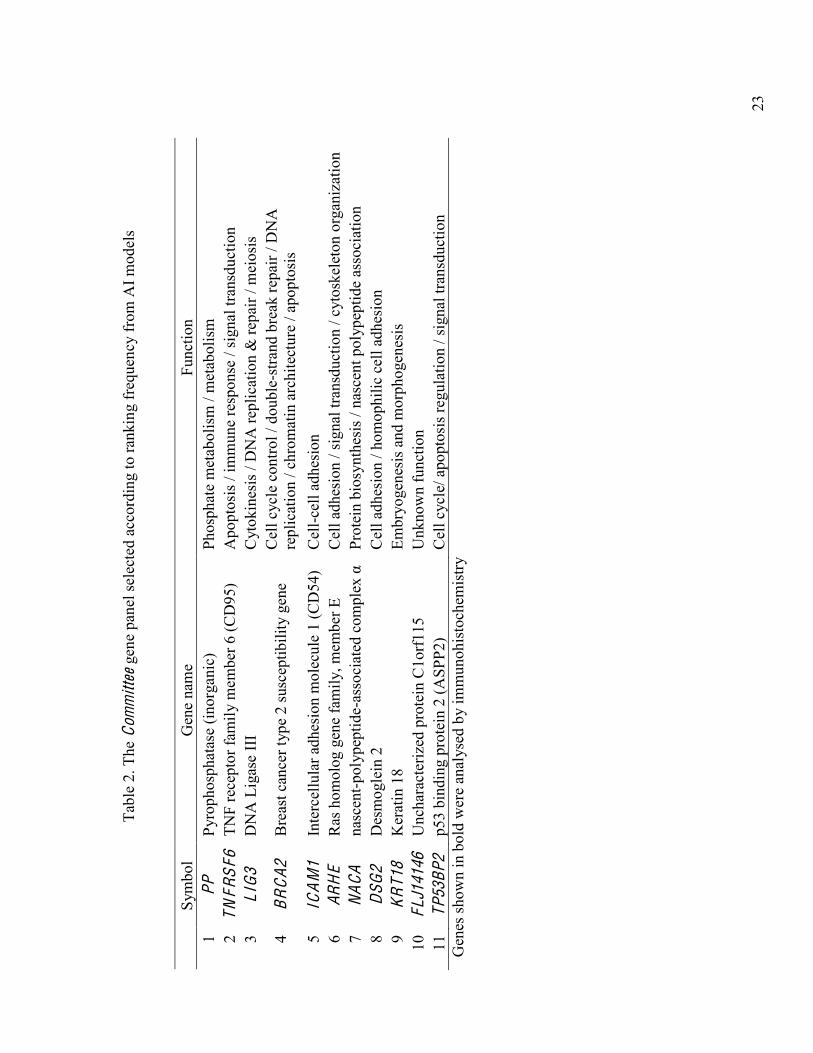
We ranked the 200 genes according to their average score from the various AI models
(Table 2) and selected the 11 highest ranked genes to compare with the Original panel.
Using gene expression, dichotomized around the mean, both panels were able to stratify
tumor progression, although the Committee panel appeared more discriminate. For
example, the findings of the Committee panel are typical (Figure 3a): whilst individual
members are associated with tumor progression (e.g. LIG3 p=0.01, KRT18 p=0.04, Log
rank values), the best prediction of progression occurs when the members are used in
combination (≥3/11 abnormal genes p=0.007, ≥4/11 p=0.0004, ≥5/11 p=0.002, Log rank
values). In multivariate analysis the Committee panel (OR=0.70 (95% CI 0.56-0.87),
Logrank p=0.0004) was better at identifying progression than grade (OR=0.38 (95% CI
0.15-0.91, p=0.001) and stage (OR=0.65 (95% CI 0.1-4.31), p=0.03), and the Original
11
panel (OR=1.24 (95% CI 0.96-1.60), p=0.09). No members were shared between the
Committee and Original panels.
Analysis of the Committee panel in a second tumor cohort
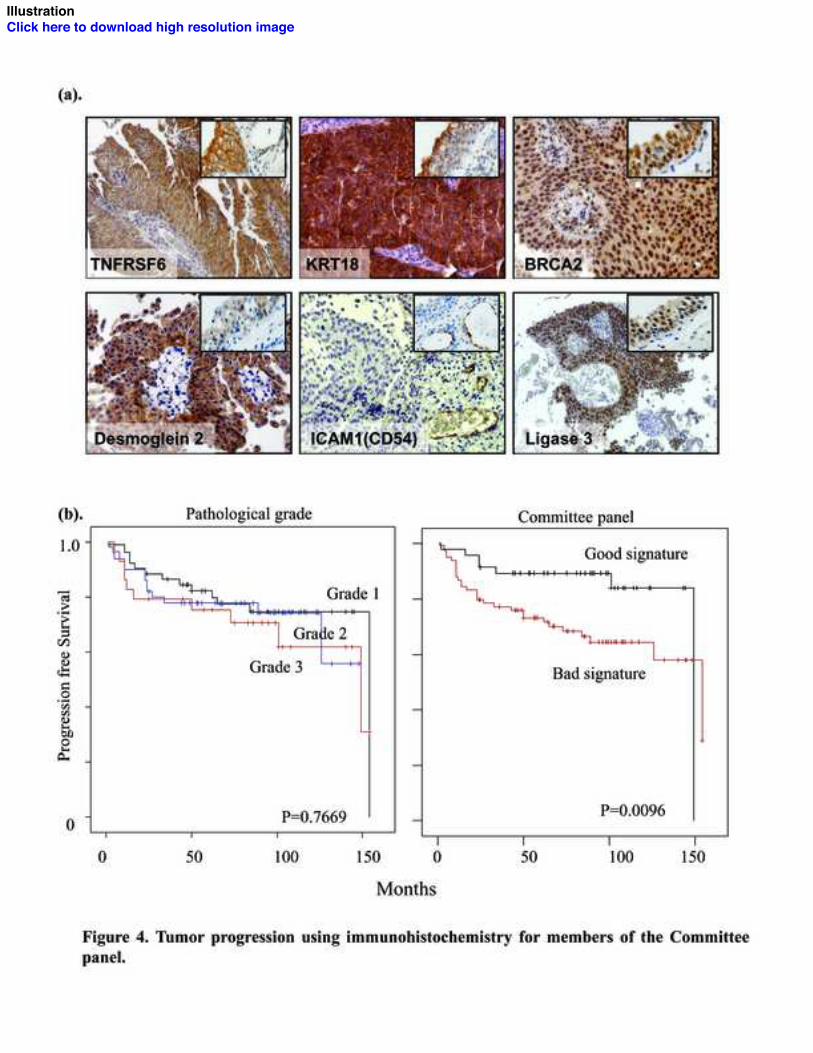
Six of the 11 members in the Committee panel (LIG3, BRCA2, TNFRSF6, KRT18,
DSG2 and ICAM1, Figure 4a) have commercially manufactured antibodies with proven
reproducible staining patterns in formalin fixed paraffin embedded tissue. Using these
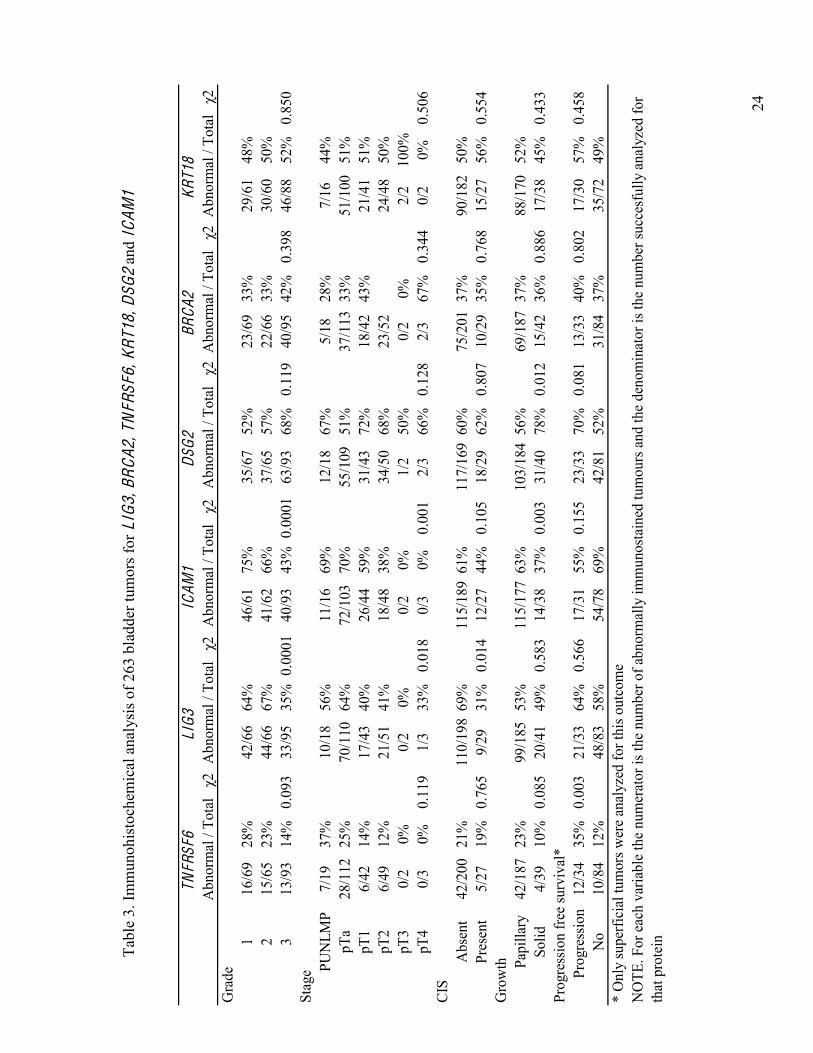
antibodies we performed immunohistochemistry on the 262 tumor TMA. When protein
expression was analyzed with respect to tumor histology, various associations were seen.
For example, LIG3 and ICAM1 were associated with tumor stage and grade (χ2 p<0.05)
(Table 3), when compared to tumors with normal expression. However, when expression
of individual proteins with respect to tumor behavior was analyzed, few significant
relationships were present. Only abnormal TNFRSF6 expression was significantly
associated with tumor progression (Log rank p=0.003).
We then analyzed the 6 proteins together as a Committee panel using only superficial
tumors (n=134). Each tumor was scored according to the number of proteins with
abnormal staining and this was expressed as a percentage of the total number successfully
immunostained for that sample. Only samples with ≥4 stained proteins were evaluated.
When progression was analyzed with respect to this score, significantly worse outcomes
were present in tumors with higher than lower scores (Figure 4b). As with its use in the
first tumor cohort, the panel’s discriminating ability was maximal at its mean content
(Concordance index =0.66, Log rank p=0.02 for 40% and p=0.01 for 50%). In

12
multivariate analysis, the Committee panel was better at stratifying progression (Cox
OR=1.2 (95% CI 1.1-1.3), p=0.014) than tumor stage (OR=1.44 (95% CI 0.82-2.53),
p=0.2), grade (OR=0.93 (95% CI 0.53-1.66), p=0.8), the presence of CIS (OR=1.3 (95%
CI 0.54-3.12), p=0.6), growth pattern (OR=0.74 (95% CI 0.26-2.12), p=0.6) and
multifocality (OR=1.61 (95% CI 0.61-4.24), p=0.3).
13
Discussion
Here we have used AI to examine the relationship between gene expression and
progression. To evaluate this approach, rather than specific model designs, we used a
Committee of models to merge gene rankings from individual models and structures. AI
can identify complex relationships within non-linear data contaminated by variable noise
and as such, can outperform statistical regression [8, 24]. AI modeling is a generic
process and these methods could be applied to re-interrogate microarray datasets for
prognostic and functional data.
Our approach reduced 200 genes to 11 with minimal deterioration in progression
identification. The highest ranked genes appeared better at predicting tumor outcome than
those selected using traditional analysis and pathological criteria. The fuzzy logic layer of
our Committee NFM is shown in Figure 3b. This rule-base consists of parallel rules in
which the fuzzy logic component can be visualized. In rule 1 (top line), high KRT18 in
combination with low DSG2 and TNFRSF6 expression leads to rapid tumor progression
(final box). This supports known carcinogenic functions of these genes as KRT18 is an
oncogene and the others are tumor suppressors [25]. One can also see that the
discriminatory effects in TP53BP2 are less apparent than for other genes (TP53BP2 was
ranked 11th, Table 2).
The ability of AI to determine non-linear relationships is demonstrated in our results. Of
the 11 genes that comprise the Committee panel, only TNFRSF6 was individually
associated with tumor progression. However, the cumulative use of this panel allowed
14
accurate progression discrimination (Figure 4b). The members of the Committee panel
represent various carcinogenic pathways. Their association with progression may be
directly through carcinogenic roles or as bystanders associated with progression. Their
diversity in roles suggests they may function as synergistic facilitators of progression.
Apoptosis evasion is represented by reduced expression of Fas (TNFRSF6), TP53BP2
and ARHE. Fas is important for apoptosis induction and decreased expression is
associated with advanced bladder cancer stage, grade and progression [26]. TP53BP2
(also ‘Apoptosis stimulating protein of p53 2’ (ASPP2)) plays a key role in apoptosis
induction through the activation of p53. Reduced TP53BP2 expression abrogates the
onset of apoptosis in cancer, but has not been reported in UCC. Tumor invasion is
represented by reduced cellular adhesion (ICAM1 and DSG2) and cytoskeletal re-
organization through increased KRT18 and reduced ARHE expression. DSG2 is a
cellular adhesion molecule whose loss reduces adhesion, increases invasion and speeds
tumor progression [27]. ICAM1 is also an intercellular adhesion molecule and is
frequently epigenetically silenced in UCC (>70%) [28]. KRT18 is a cytokeratin known to
be expressed in the umbrella layer of urothelium whose expression increases with
urothelial carcinogenesis [25]. ARHE (also ‘Rho family GTPase 3’ (RND3)) is a Rho
signal transduction member with roles in many cellular processes (cytoskeleton
organization, membrane trafficking, cell growth and apoptosis) [29], whose loss is
reported in prostate cancer. Deranged DNA repair is represented by BRCA2 and LIG3
[30].Whilst neither is directly linked with bladder carcinogenesis, it is possible that loss
of both is required for carcinogenic alteration. BRCA2-deficient cells have reduced DNA
ligation capacity which can be reversed by LIG3 administration [30].
15
Conclusion
AI can analyze microarray datasets in a complementary manner to statistical analyses.
Both methods use different techniques of inference to determine gene-phenotype
associations and thus identify distinct prognostic gene signatures that are equally valid.
We have identified a new prognostic gene signature in UCC, whose members reflect a
variety of carcinogenic pathways. This signature requires validation in new tumor cohorts
to assess its ability to identify progression in non-muscle invasive bladder cancers.

16
Conflict of interest
We declare no conflicts of interest with this work.
17
REFERENCES
1. van Rhijn BW, Burger M, Lotan Y, Solsona E, Stief CG, Sylvester RJ, et al. Recurrence and Progression of Disease in Non-Muscle-Invasive Bladder Cancer: From Epidemiology to Treatment Strategy. Eur Urol. 2009. Jun 26 [Epub] 2. Sylvester RJ, van der Meijden AP, Oosterlinck W, Witjes JA, Bouffioux C, Denis L, et al. Predicting recurrence and progression in individual patients with stage Ta T1 bladder cancer using EORTC risk tables: a combined analysis of 2596 patients from seven EORTC trials. Eur Urol. 2006;49:466-5 3. Dyrskjot L, Thykjaer T, Kruhoffer M, Jensen JL, Marcussen N, Hamilton-Dutoit S, et al. Identifying distinct classes of bladder carcinoma using microarrays. Nat Genet. 2003;33:90-6. 4. Dyrskjot L, Zieger K, Real FX, Malats N, Carrato A, Hurst C, et al. Gene expression signatures predict outcome in non-muscle-invasive bladder carcinoma: a multicenter validation study. Clin Cancer Res. 2007;13:3545-51. 5. Ransohoff DF. Rules of evidence for cancer molecular-marker discovery and validation. Nat Rev Cancer. 2004;4:309-14. 6. Hamdy FC, Catto JW. Less is more: artificial intelligence and gene-expression arrays. Lancet. 2004;364:2003-4. 7. Dupuy A, Simon RM. Critical review of published microarray studies for cancer outcome and guidelines on statistical analysis and reporting. J Natl Cancer Inst. 2007;99:147-57. 8. Abbod MF, Catto JW, Linkens DA, Hamdy FC. Application of artificial intelligence to the management of urological cancer. J Urol. 2007;178:1150-6. 9. Khan J, Wei JS, Ringner M, Saal LH, Ladanyi M, Westermann F, et al. Classification and diagnostic prediction of cancers using gene expression profiling and artificial neural networks. Nat Med. 2001;7:673-9. 10. Lancashire LJ, Powe DG, Reis-Filho JS, Rakha E, Lemetre C, Weigelt B, et al. A validated gene expression profile for detecting clinical outcome in breast cancer using artificial neural networks. Breast Cancer Res Treat. 2009. 11. Brown MP, Grundy WN, Lin D, Cristianini N, Sugnet CW, Furey TS, et al. Knowledge-based analysis of microarray gene expression data by using support vector machines. Proc Natl Acad Sci U S A. 2000;97:262-7. 12. Huang TM, Kecman V. Gene extraction for cancer diagnosis by support vector machines--an improvement. Artif Intell Med. 2005;35:185-94.
18
13. Schwarzer G, Vach W, Schumacher M. On the misuses of artificial neural networks for prognostic and diagnostic classification in oncology. Stat Med. 2000. 14. Hastie T, Tibshirani R, Friedman J. The Elements of Statistical Learning: Data Mining, Inference and Prediction. New York: Springer-Verlag; 2001. 15. Catto JW, Abbod MF, Linkens DA, Hamdy FC. Neuro-fuzzy modeling: an accurate and interpretable method for predicting bladder cancer progression. J Urol. 2006;175:474-9. 16. Catto JW, Abbod MF, Linkens DA, Larre S, Rosario DJ, Hamdy FC. Neurofuzzy modeling to determine recurrence risk following radical cystectomy for non-metastatic urothelial carcinoma of the bladder. Clin Cancer Res. 2009; 15(9):3150-5. 17. Wild PJ, Herr A, Wissmann C, Stoehr R, Rosenthal A, Zaak D, et al. Gene expression profiling of progressive papillary noninvasive carcinomas of the urinary bladder. Clin Cancer Res. 2005;11:4415-29. 18. van Oers JM, Wild PJ, Burger M, Denzinger S, Stoehr R, Rosskopf E, et al. FGFR3 mutations and a normal CK20 staining pattern define low-grade noninvasive urothelial bladder tumours. Eur Urol. 2007;52:760-8. 19. Chen M, Linkens DA. A systematic neurofuzzy modelling framework with application to material property prediction. IEEE Trans SMC Part B: Cybernetics. 2001;31(5):781-90. 20. Abbod MF, Catto JWF, Chen M, Linkens DA, Hamdy FC. Artificial intelligence for the prediction of bladder cancer. Biomed Eng Appl Basis Comm. 2004;16:49-58. 21. Molinaro AM, Simon R, Pfeiffer RM. Prediction error estimation: a comparison of resampling methods. Bioinformatics. 2005;21:3301-7. 22. Catto JWF, Xinarianos G, Burton JL, Meuth M, Hamdy FC. Differential expression of hMLH1 and hMSH2 is related to bladder cancer grade, stage and prognosis, but not microsatellite instability. Int J Cancer. 2003;105:484-90. 23. Begg CB, Cramer LD, Venkatraman ES, Rosai J. Comparing tumour staging and grading systems: a case study and a review of the issues, using thymoma as a model. Stat Med. 2000;19:1997-2014. 24. Catto JWF, Linkens DA, Abbod MF, Chen M, Burton JL, Feeley KM, et al. Artificial Intelligence in Predicting Bladder Cancer Outcome: A Comparison of Neuro-Fuzzy Modeling and Artificial Neural Networks. Clin Cancer Res. 2003;9:4172-7.
19
25. Reedy EA, Heatfield BM, Trump BF, Resau JH. Correlation of cytokeratin patterns with histopathology during neoplastic progression in the rat urinary bladder. Pathobiology. 1990;58:15-27. 26. Yamana K, Bilim V, Hara N, Kasahara T, Itoi T, Maruyama R, et al. Prognostic impact of FAS/CD95/APO-1 in urothelial cancers: decreased expression of Fas is associated with disease progression. Br J Cancer. 2005;93:544-51. 27. Rieger-Christ KM, Ng L, Hanley RS, Durrani O, Ma H, Yee AS, et al. Restoration of plakoglobin expression in bladder carcinoma cell lines suppresses cell migration and tumorigenic potential. Br J Cancer. 2005;92:2153-9. 28. Friedrich MG, Chandrasoma S, Siegmund KD, Weisenberger DJ, Cheng JC, Toma MI, et al. Prognostic relevance of methylation markers in patients with non-muscle invasive bladder carcinoma. Eur J Cancer. 2005;41:2769-78. 29. Bektic J, Pfeil K, Berger AP, Ramoner R, Pelzer A, Schafer G, et al. Small G-protein RhoE is underexpressed in prostate cancer and induces cell cycle arrest and apoptosis. Prostate. 2005;64:332-40. 30. Bogliolo M, Taylor RM, Caldecott KW, Frosina G. Reduced ligation during DNA base excision repair supported by BRCA2 mutant cells. Oncogene. 2000;19:5781-7.
20
F igure L egends
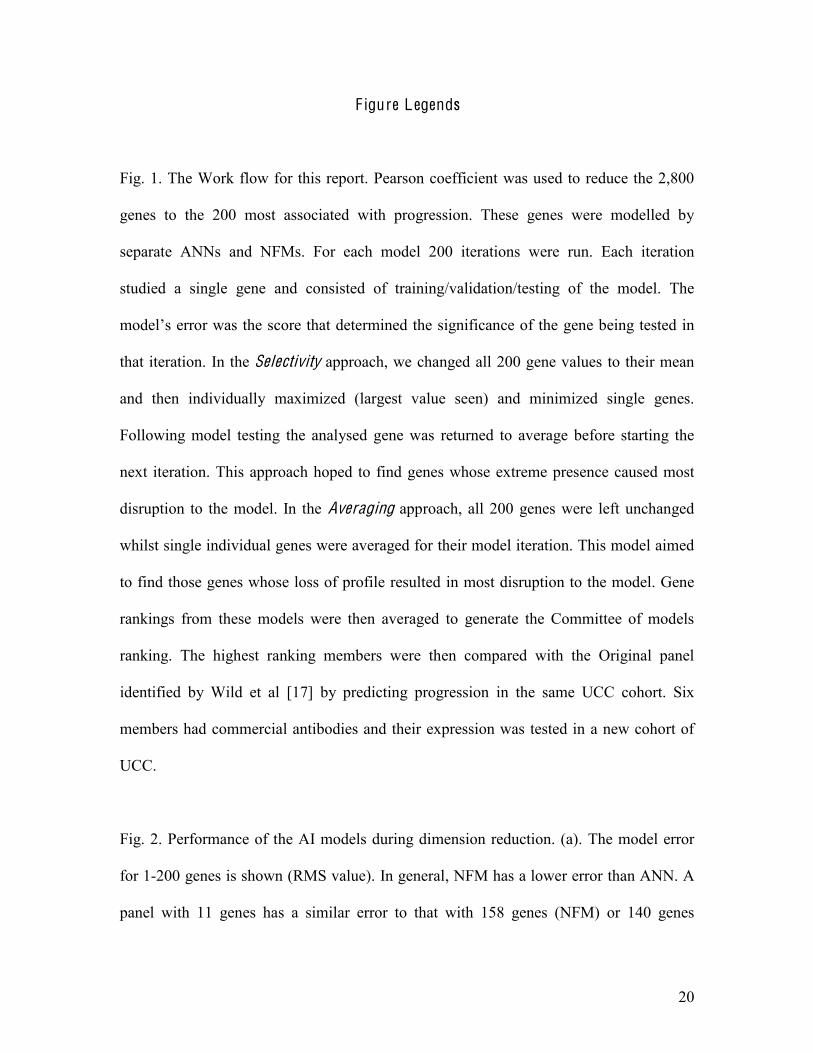
Fig. 1. The Work flow for this report. Pearson coefficient was used to reduce the 2,800
genes to the 200 most associated with progression. These genes were modelled by
separate ANNs and NFMs. For each model 200 iterations were run. Each iteration
studied a single gene and consisted of training/validation/testing of the model. The
model’s error was the score that determined the significance of the gene being tested in
that iteration. In the Selectivity approach, we changed all 200 gene values to their mean
and then individually maximized (largest value seen) and minimized single genes.
Following model testing the analysed gene was returned to average before starting the
next iteration. This approach hoped to find genes whose extreme presence caused most
disruption to the model. In the Averaging approach, all 200 genes were left unchanged
whilst single individual genes were averaged for their model iteration. This model aimed
to find those genes whose loss of profile resulted in most disruption to the model. Gene
rankings from these models were then averaged to generate the Committee of models
ranking. The highest ranking members were then compared with the Original panel
identified by Wild et al [17] by predicting progression in the same UCC cohort. Six
members had commercial antibodies and their expression was tested in a new cohort of
UCC.
Fig. 2. Performance of the AI models during dimension reduction. (a). The model error
for 1-200 genes is shown (RMS value). In general, NFM has a lower error than ANN. A
panel with 11 genes has a similar error to that with 158 genes (NFM) or 140 genes
21
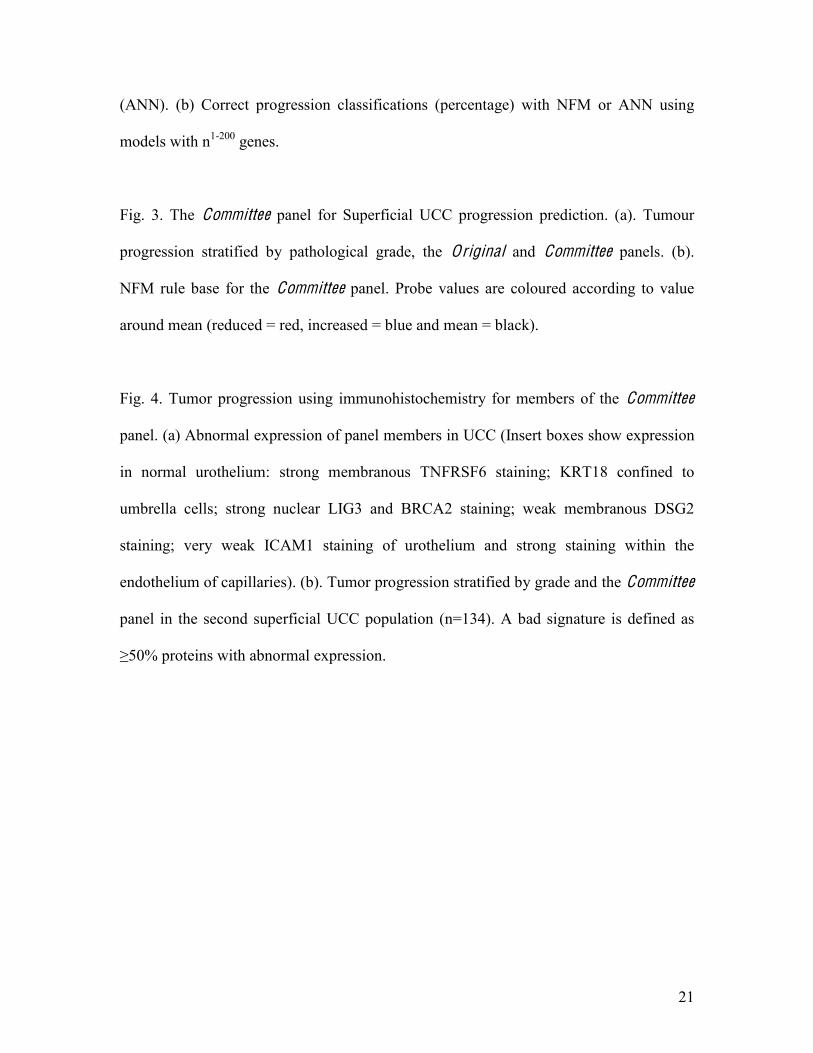
(ANN). (b) Correct progression classifications (percentage) with NFM or ANN using
models with n1-200 genes.
Fig. 3. The Committee panel for Superficial UCC progression prediction. (a). Tumour
progression stratified by pathological grade, the Original and Committee panels. (b).
NFM rule base for the Committee panel. Probe values are coloured according to value
around mean (reduced = red, increased = blue and mean = black).
Fig. 4. Tumor progression using immunohistochemistry for members of the Committee
panel. (a) Abnormal expression of panel members in UCC (Insert boxes show expression
in normal urothelium: strong membranous TNFRSF6 staining; KRT18 confined to
umbrella cells; strong nuclear LIG3 and BRCA2 staining; weak membranous DSG2
staining; very weak ICAM1 staining of urothelium and strong staining within the
endothelium of capillaries). (b). Tumor progression stratified by grade and the Committee
panel in the second superficial UCC population (n=134). A bad signature is defined as
≥50% proteins with abnormal expression.
22
Table 1. The two UCC cohorts studied in this report
i. Gene array tumors ii. TMA tumors n % n %
Gender Male 29 85.3% 194 73.8% Female 5 14.7% 68 25.9%
Stage TNM 1998 Normal 8 100.0% pTis 3 4.5% pTa 46 69.7% 149 56.7% pT1 10 15.2% 49 18.6% pT2 7 10.6% 59 22.4% pT3 2 0.8% pT4 3 1.1%
Stage TNM 2004 PUNLMP 1 1.5% 22 8.4% pTis 3 4.5% pTa 45 68.2% 127 48.3% pT1 10 15.2% 49 18.6% pT2 7 10.6% 59 22.4% pT3 2 0.8% pT4 3 1.1%
Grade Grade 1 27 40.9% 83 31.6% Grade 2 24 36.4% 69 26.2% Grade 3 15 22.7% 110 41.8%
Growth pattern Papillary 55 83.3% 210 79.8% Solid 11 16.7% 51 19.4% Unknown 1 0.4%
Multiplicity Unifocal 29 43.9% 54 20.5% Multifocal 37 56.1% 208 79.1%
Carcinoma in situ No pTis 62 93.9% 227 86.3% pTis 4 6.1% 35 13.3%
Tumor Metastasis 2 0.8% Primary UCC 25 37.9% 255 97.0% Recurrent UCC 41 62.1% 5 1.9%
Progression rate 10/34* 29.4% 36/134*** 26.9% Median (range) time to progression 21 (0-60) months 23 (1-154) months
Overall survival unknown 167/198 84.3% Median (range) overall survival time** 43 (0-109) months 90 (24-154) months
Total UCC 66 100.0% 262 100.0% * in the 34 individual patients ** in non-progressing patients *** in 134 primary superficial tumors with available follow up information
23
Tabl
e 2.
The
Com
mitt
ee g
ene
pane
l sel
ecte
d ac
cord
ing
to ra
nkin
g fr
eque
ncy
from
AI m
odel
s
Sy
mbo
l G
ene
nam
e Fu
nctio
n 1
PP
Pyro
phos
phat
ase
(inor
gani
c)
Phos
phat
e m
etab
olis
m /
met
abol
ism
2
TNFR
SF6
TN
F re
cept
or fa
mily
mem
ber 6
(CD
95)
Apo
ptos
is /
imm
une
resp
onse
/ si
gnal
tran
sduc
tion
3 LI
G3
DN
A L
igas
e II
I C
ytok
ines
is /
DN
A re
plic
atio
n &
repa
ir / m
eios
is
4 BR
CA2
B
reas
t can
cer t
ype
2 su
scep
tibili
ty g
ene
Cel
l cyc
le c
ontro
l / d
oubl
e-st
rand
bre
ak re
pair
/ DN
A
repl
icat
ion
/ chr
omat
in a
rchi
tect
ure
/ apo
ptos
is
5 IC
AM
1 In
terc
ellu
lar a
dhes
ion
mol
ecul
e 1
(CD
54)
Cel
l-cel
l adh
esio
n 6
ARH
E R
as h
omol
og g
ene
fam
ily, m
embe
r E
Cel
l adh
esio
n / s
igna
l tra
nsdu
ctio
n / c
ytos
kele
ton
orga
niza
tion
7 N
ACA
nasc
ent-p
olyp
eptid
e-associated complex α
Pr
otei
n bi
osyn
thes
is /
nasc
ent p
olyp
eptid
e as
soci
atio
n 8
DSG
2 D
esm
ogle
in 2
C
ell a
dhes
ion
/ hom
ophi
lic c
ell a
dhes
ion
9 KR
T18
Ker
atin
18
Embr
yoge
nesi
s and
mor
phog
enes
is
10
FLJ1
4146
U
ncha
ract
eriz
ed p
rote
in C
1orf
115
Unk
now
n fu
nctio
n 11
TP
53BP
2 p5
3 bi
ndin
g pr
otei
n 2
(ASP
P2)
Cel
l cyc
le/ a
popt
osis
regu
latio
n / s
igna
l tra
nsdu
ctio
n G
enes
show
n in
bol
d w
ere
anal
ysed
by
imm
unoh
isto
chem
istry
24
Tabl
e 3.
Imm
unoh
isto
chem
ical
ana
lysi
s of 2
63 b
ladd
er tu
mor
s for
LIG
3, B
RCA
2, T
NFR
SF6,
KRT
18, D
SG2
and
ICAM
1
Gra
de
116
/69
28%
42/6
664
%46
/61
75%
35/6
752
%23
/69
33%
29/6
148
%2
15/6
523
%44
/66
67%
41/6
266
%37
/65
57%
22/6
633
%30
/60
50%
313
/93
14%
0.09
333
/95
35%
0.00
0140
/93
43%
0.00
0163
/93
68%
0.11
940
/95
42%
0.39
846
/88
52%
0.85
0St
age PU
NLM
P7/
1937
%10
/18
56%
11/1
669
%12
/18
67%
5/18
28%
7/16
44%
pTa
28/1
1225
%70
/110
64%
72/1
0370
%55
/109
51%
37/1
1333
%51
/100
51%
pT1
6/42
14%
17/4
340
%26
/44
59%
31/4
372
%18
/42
43%
21/4
151
%pT
26/
4912
%21
/51
41%
18/4
838
%34
/50
68%
23/5
224
/48
50%
pT3
0/2
0%0/
20%
0/2
0%1/
250
%0/
20%
2/2
100%
pT4
0/3
0%0.
119
1/3
33%
0.01
80/
30%
0.00
12/
366
%0.
128
2/3
67%
0.34
40/
20%
0.50
6CI
SA
bsen
t42
/200
21%
110/
198
69%
115/
189
61%
117/
169
60%
75/2
0137
%90
/182
50%
Pres
ent
5/27
19%
0.76
59/
2931
%0.
014
12/2
744
%0.
105
18/2
962
%0.
807
10/2
935
%0.
768
15/2
756
%0.
554
Gro
wth Pa
pilla
ry42
/187
23%
99/1
8553
%11
5/17
763
%10
3/18
456
%69
/187
37%
88/1
7052
%So
lid4/
3910
%0.
085
20/4
149
%0.
583
14/3
837
%0.
003
31/4
078
%0.
012
15/4
236
%0.
886
17/3
845
%0.
433
Prog
ress
ion
free
surv
ival
*Pr
ogre
ssio
n 12
/34
35%
0.00
321
/33
64%
0.56
617
/31
55%
0.15
523
/33
70%
0.08
113
/33
40%
0.80
217
/30
57%
0.45
8N
o10
/84
12%
48/8
358
%54
/78
69%
42/8
152
%31
/84
37%
35/7
249
%*
Onl
y su
perfi
cial
tum
ors w
ere
anal
yzed
for t
his o
utco
me
NO
TE. F
or e
ach
varia
ble
the
num
erat
or is
the
num
ber o
f abn
orm
ally
imm
unos
tain
ed tu
mou
rs a
nd th
e de
nom
inat
or is
the
num
ber s
ucce
sful
ly a
naly
zed
for
that
pro
tein
Abnormal / Total χ2Abnormal / Total χ2
TNFR
SF6
LIG3
ICAM
1DS
G2BR
CA2
KRT1
8Abnormal / Total χ2Abnormal / Total χ2 Abnormal / Total χ2Abnormal / Total χ2
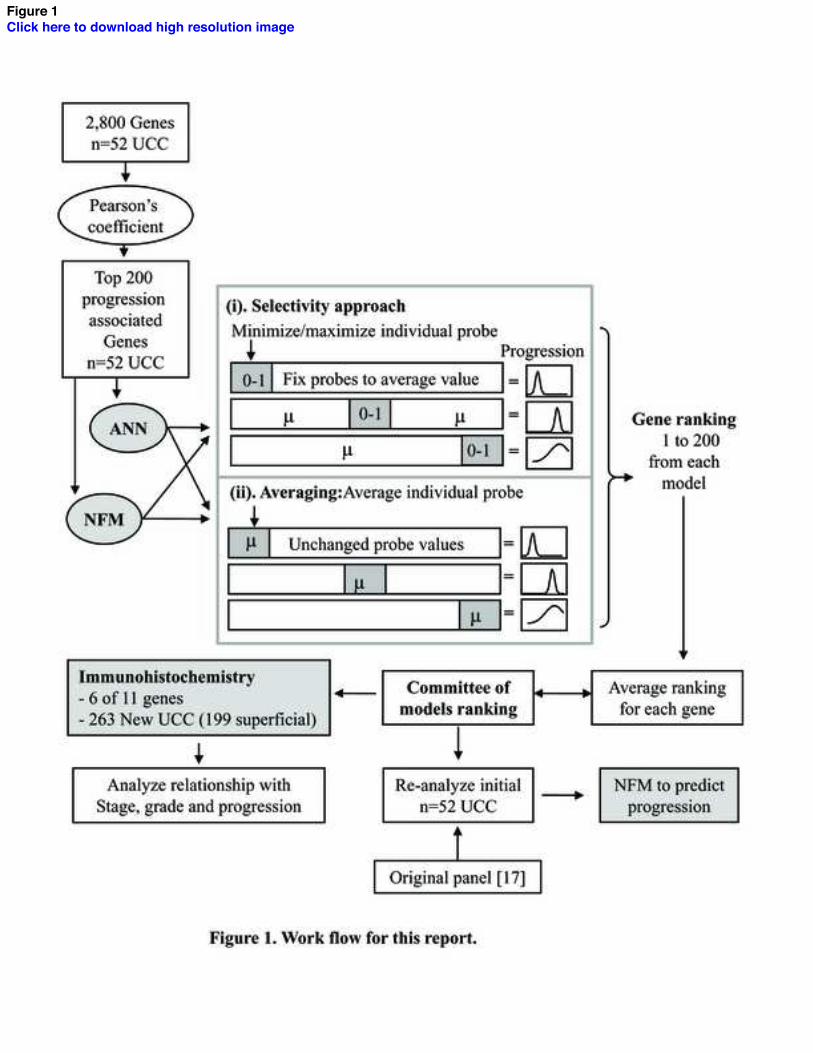
Figure 1Click here to download high resolution image
Figu
re 2
Clic
k he
re to
dow
nloa
d hi
gh re
solu
tion
imag
e
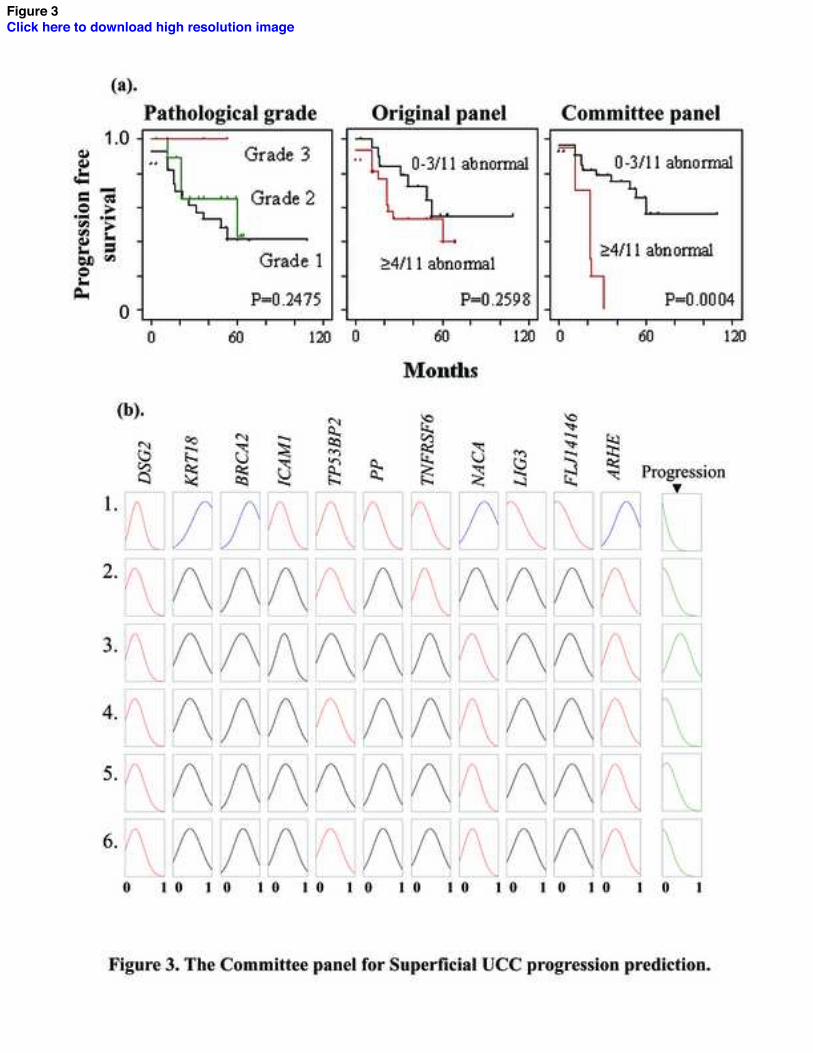
Figure 3Click here to download high resolution image
IllustrationClick here to download high resolution image
Top Related
Copyright © 2022 FDOKUMEN

