


Bahasa
Halaman
Hukum

sustainability
Article
Techno-Environmental Analysis of the Use of Green Hydrogenfor Cogeneration from the Gasification of Wood and Fuel Cell
Abigail Gonzalez-Diaz 1,* , Juan Carlos Sánchez Ladrón de Guevara 2, Long Jiang 3,*, MariaOrtencia Gonzalez-Diaz 4, Pablo Díaz-Herrera 2 and Carolina Font-Palma 5,*
�����������������
Citation: Gonzalez-Diaz, A.; Sánchez
Ladrón de Guevara, J.C.; Jiang, L.;
Gonzalez-Diaz, M.O.; Díaz-Herrera, P.;
Font-Palma, C. Techno-Environmental
Analysis of the Use of Green
Hydrogen for Cogeneration from the
Gasification of Wood and Fuel Cell.
Sustainability 2021, 13, 3232.
https://doi.org/10.3390/su13063232
Academic Editor: Deepak Pant
Received: 31 January 2021
Accepted: 12 March 2021
Published: 15 March 2021
Publisher’s Note: MDPI stays neutral
with regard to jurisdictional claims in
published maps and institutional affil-
iations.
Copyright: © 2021 by the authors.
Licensee MDPI, Basel, Switzerland.
This article is an open access article
distributed under the terms and
conditions of the Creative Commons
Attribution (CC BY) license (https://
creativecommons.org/licenses/by/
4.0/).
1 National Institute of Electricity and Clean Energy, Reforma 113, Col. Palmira,Cuernavaca Morelos 62490, Mexico
2 Facultad de Ingeniería, Universidad Nacional Autonoma de Mexico, Mexico City 04510, Mexico;[email protected] (J.C.S.L.d.G.); [email protected] (P.D.-H.)
3 Institution of Refrigeration and Cryogenics, Zhejiang University, Hangzhou 310027, China4 CONACYT—Centro de Investigación Científica de Yucatán, A.C., Calle 43 No. 130, Chuburná de Hidalgo,
Mérida 97200, Mexico; [email protected] Department of Engineering, University of Hull, Hull HU6 7RX, UK* Correspondence: [email protected] (A.G.-D.); [email protected] (L.J.);
[email protected] (C.F.-P.)
Abstract: This paper aims to evaluate the use of wood biomass in a gasifier integrated with a fuelcell system as a low carbon technology. Experimental information of the wood is provided by theliterature. The syngas is purified by using pressure swing adsorption (PSA) in order to obtain H2
with 99.99% purity. Using 132 kg/h of wood, it is possible to generate 10.57 kg/h of H2 that is usedin a tubular solid oxide fuel cell (TSOFC). Then, the TSOFC generates 197.92 kW. The heat generatedin the fuel cell produces 60 kg/h of steam that is needed in the gasifier. The net efficiency of theintegrated system considering only the electric power generated in the TSOFC is 27.2%, which islower than a gas turbine with the same capacity where the efficiency is around 33.1%. It is concludedthat there is great potential for cogeneration with low carbon emission by using wood biomassin rural areas of developing countries e.g., with a carbon intensity of 98.35 kgCO2/MWh whencompared with those of natural gas combined cycle (NGCC) without and with CO2 capture i.e.,331 kgCO2/MWh and 40 kgCO2/MWh, respectively. This is an alternative technology for placeswhere biomass is abundant and where it is difficult to get electricity from the grid due to limits ingeographical location.
Keywords: biomass; hydrogen; fuel cell; gasification; pressure swing adsorption; carbon intensity
1. Introduction
The 2 ◦C goal set by the Paris climate agreement places rigorous limits on greenhousegas (GHG) emission. Most climate and integrated assessment models project that theconcentration of CO2 in the atmosphere would have to decrease by the second half of the21st century to achieve the 2 ◦C target [1]. In this sense, the deployment of negative emissiontechnologies (NETs) becomes a key mitigation tool, which combines the production ofenergy from plant biomass to produce electricity. There are different NET technologies, themost important being [1]: e.g., coastal blue carbon (CBC), bioenergy with carbon captureand sequestration (BECCS), and direct air capture (DAC). According to experts on theIntergovernmental Panel on Climate Change (IPCC), the massive deployment of BECCStechnology represents a cost-effective strategy [2]. The International Energy Agency (IEA)considers that BECCS could play an important role in the decarbonization of the powersector, contributing with 5% of total CO2 emission reduction in this sector by 2070 [3].There are different BECCS technologies classified as a function of the biomass conversionpathways as follows: thermochemical, mechanical/chemical, thermo, and biochemical [4].
Sustainability 2021, 13, 3232. https://doi.org/10.3390/su13063232 https://www.mdpi.com/journal/sustainability
Sustainability 2021, 13, 3232 2 of 14
Among these options, the thermochemical and biological are the most used at commercialscale [1]. It is important to mention that biomass is abundant, especially in most developingcountries. For example, biomass such as bamboo, rice, maize, sugarcane, sorghum, andwheat represent 85% of the total amount of residue produced in Mexico [5,6].
On the other hand, the importance of H2 as an energy vector has increased in recentyears due to its widespread use and versatility e.g., in fuel cell vehicles, electricity, heat-ing, and industrial feedstock; therefore, H2 has been considered an essential fuel for adecarbonized world [7–11]. Steam methane reforming (SMR) is the most used process toproduce H2 due to its technological maturity and economical production at commercialsize [8,10]. Despite the economic benefits of SMR over other processes, it has a large carbonfootprint [8,12]. By stoichiometry, 5.5 kg of CO2 are produced per kg of H2 [13]. One optionto reduce its carbon footprint is the implementation of CCUS technology. The H2 obtainedthrough an SMR unit with CCS or CCUS is regarded as blue H2 (bH2). It can help to meetclimate change goals at acceptable costs [7,8]. However, the deployment of bH2 is notnecessarily CO2-free. CO2 capture efficiencies are expected to reach 85–95% at best, whichmeans that 5–15% of all CO2 is leaked [9,11].
One of the promising technologies to produce clean H2 is the electrolysis process withsurpluses of renewable energy (e.g., wind, solar), also known as “power-to-gas” (P2G)technology. The gas produced is called green H2 (gH2) due the fact that the electricityconsumed to produce it comes from a carbon-free process. However, the electrolysisprocess requires a high amount of electricity. The power required to generate 1 kg of H2 isapproximately 60.6 kWh, assuming an efficiency of 65% of the electrolyzer system, whichleads to it being considered a commercially available technology [8,13]. A cleaner versionthan gH2 is net negative emission H2, which is produced using BECCS technology.
The negative emission H2 is commonly produced via pyrolysis and gasification pro-cesses, transforming the biomass chemically into syngas, which is a fuel gas mixtureconsisting primarily of H2, CO, and CO2. However, the presence of N2 and CO2 in the syn-gas contributes to the reduction of the lower heating value (LHV), which reduces the heatcapacity of the syngas and in turn, limits its use in conventional power plant technologiesand future technologies e.g., fuel cells. For example, syngas produced from biomass in agasifier has a low content of H2 and CH4, which leads to an LHV of 5.6 MJ·(Nm)−3 [14].An internal combustion engine requires a minimum LHV of 4.6 MJ·m−3 [15] and micro-turbines require 13.04 MJ·m−3 [16]. In the case of H2 utilization on fuel cell applications,H2 purity varies depending on the type of fuel cell used. For example, in the case of protonexchange membrane (PEM) fuel cell applications, H2 concentration in the fuel stream mustbe almost pure (≤99.97%) in order to avoid damage of the power device, so its use andmarket is limited to gH2. Meanwhile, the solid oxide fuel cells (SOFC), in addition tooperating with H2, can work with different types of fuels such as synthesis gas, naturalgas, and methanol [17] due to their higher operating temperatures than PEM fuel cells(100–300 ◦C). Generally, the SOFC operates in the region of 600 to 1000 ◦C. This meansthat high reaction rates can be achieved without expensive catalysts [18], as is currentlynecessary for lower temperature fuel cells (PEM), and SOFCs are not vulnerable to carboncatalyst poisoning. Among the SOFC types, planar SOFC (PSOFC) and tubular (TSOFC)geometry are the most promising because high-temperature gas-tight seals are eliminated,but one of the major disadvantages of the planar design is the need for gas-tight sealingaround the edge of the cell components [18].
For H2 purification by CO2 capture, adsorption technologies have been widely in-vestigated, considered as the alternative for the amine-based absorption carbon capture,and are a nearly mature technology [19]. Solid adsorption capture uses solid sorbents thatare easy to control, require low regeneration heat and low capital investment. Adsorptionprocesses can generally be classified into two types i.e., pressure swing adsorption (PSAand temperature swing adsorption (TSA) [20]. For PSA, adsorption is performed at pres-sures higher than atmospheric whereas TSA is heated by a feed of hot steam. When theadsorption step is performed at atmospheric pressure or lower, PSA is termed VPSA. PSA
Sustainability 2021, 13, 3232 3 of 14
is commonly used for H2 production [21]. Liu et al. [22] investigated a two-stage VSA/PSAprocess for CO2 capture and H2 production from an SMR gas mixture. Results indicatedthe higher performance of PSA over their previous work i.e., single-stage PSA process.Wassie et al. [23] conducted a detailed thermodynamic and economic analysis of novelmembrane-assisted gas switching reforming (MA-GSR). Results showed that the MA-GSRprocess achieved a similar H2 production cost as conventional SMR without CO2 capture.
Several research studies have been carried out to evaluate different biomass-fuelledpower plant systems [24]. Zhen et al. [25] investigated the gasification performance of keycomponents, including polyethylene and bamboo of municipal solid waste in a bench-scalefixed bed. It was observed that an optimal temperature for bamboo is 700 ◦C for the bestsyngas quality and the highest LHV is 6.22 MJ·Nm−3. Chiang et al. [26] tested gasificationby using bamboo chopsticks as the feedstock. The syngas heating value was significantlyenhanced by CaO additions, which was related to the higher reaction rate of water–gasshift reaction. Usach et al. [27] studied a farm-based biogas fueled trigeneration systemwith different cooling pathways. Results indicated that none of the pathways increased theeconomic viability of the plant due to low electricity prices.
Based on the different challenges to decarbonize and meet environmental targets, thenovelty of this paper is the integration of gasification with PSA using activated carbon(AC) to purify the produced H2. Then for generating heat and electricity, a tubular solidoxide fuel cell (TSOFC) is integrated, due to its advantages over other type of fuel cellsas described above. SOFC can convert CO and H2, and the high operating temperatureallows internal reforming of gaseous fuel and the production of high quality heat for thecogeneration system, which definitely increases the efficiency of the system. The frameworkof this paper is illustrated as follows: methodology for wood gasification, H2 purification,and fuel cell simulations is presented in Section 2. Then, results of the simulation processand CO2 emission analysis are presented in an integrated system described in Section 3.Finally, a conclusion on the potential of the proposed system is reached.
2. Methodology2.1. Process Description
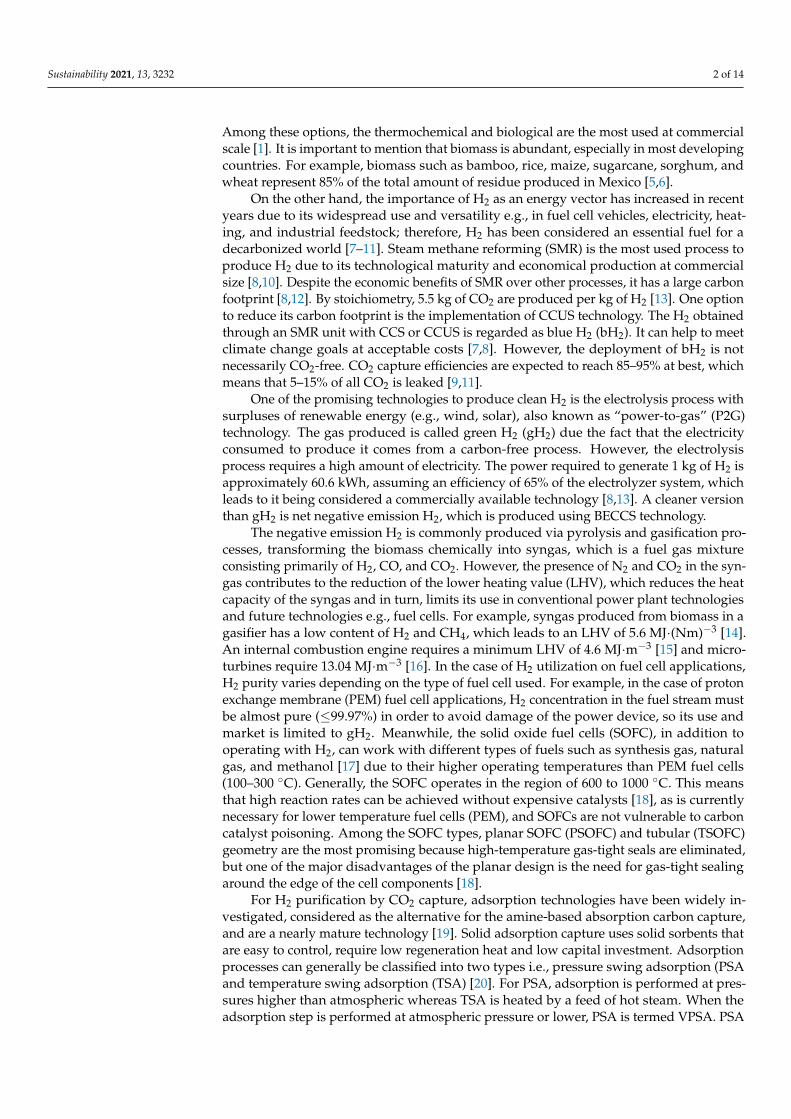
Figure 1 shows the process flow diagram of the integrated bioenergy-fuel cell cogen-eration plant simulated in Aspen Plus. This consists of three main processes: (a) syngasproduction from wood gasification, (b) H2 purification using a PSA unit; and (c) powerand heat generation through a tubular solid oxide fuel cell (TSOFC) stack. More details onthe modeling of each process are given below.
2.1.1. Syngas Production from Wood Gasification
The syngas production process is modeled using Aspen Plus® software. The modellingprocess consists of four physicochemical steps: decomposition, pyrolysis, gasification, andseparation. The amount of wood that is fed into the gasifier is 132 kg/h. Wood biomassfeedstock is a non-conventional material in Aspen library (Aspen Plus V11; Aspen, CO,USA, 2021), which cannot take part in the thermodynamic chemical reactions. Hence,the Ryield reactor (R1) represents decomposition, where biomass is first broken-downinto its elemental components e.g., ash, H2, N2, S, O2, C, the composition depends onthe type of wood or biomass used. This type of reactor is recommended when both thereaction kinetics and stoichiometry are unknown. Table 1 shows the thermodynamic inputdata used in the Ryield reactor (R1) model, which is based on the work developed byIslam [28]. The yield percentage is specified into the model using an inbuilt calculationblock via Fortran statement. Therefore, the products of this reactor are the percentageelemental composition of the biomass which is subsequently fed into the first Gibbs reactor(R2) where pyrolysis, combustion, and gasification reactions occur, reported in Table 2according to the reference [26]. When using air as gasifying agent, the ratio of air to biomassis indicated with the parameter equivalence ratio (ER). In this work, steam was used asthe gasifying agent to increase the LHV of the syngas. A separator (S1) is placed after the

Sustainability 2021, 13, 3232 4 of 14
R2 reactor to separate the products into syngas and ash. A second Gibbs reactor (R3) ispositioned after the separator to adjust the composition of the synthesis gas. The productis passed to the second separator (S2) where the remaining solids and entrainment gasfrom the gas synthesis are separated. Finally, a third separator (S3) extracts the remainingentrained gas from the solids, which is returned to R2. The ash from each separator iscollected for disposal in landfill.
Sustainability 2021, 13, x FOR PEER REVIEW 4 of 15
Figure 1. Process flow diagram of the integrated bioenergy-fuel cell cogeneration plant simulated in Aspen Plus.
2.1.1. Syngas Production from Wood Gasification The syngas production process is modeled using Aspen Plus® software. The model-
ling process consists of four physicochemical steps: decomposition, pyrolysis, gasification, and separation. The amount of wood that is fed into the gasifier is 132 kg/h. Wood biomass feedstock is a non-conventional material in Aspen library (Aspen Plus V11; Aspen, CO, USA, 2021), which cannot take part in the thermodynamic chemical reactions. Hence, the Ryield reactor (R1) represents decomposition, where biomass is first broken-down into its elemental components e.g., ash, H2, N2, S, O2, C, the composition depends on the type of wood or biomass used. This type of reactor is recommended when both the reaction ki-netics and stoichiometry are unknown. Table 1 shows the thermodynamic input data used in the Ryield reactor (R1) model, which is based on the work developed by Islam [28]. The yield percentage is specified into the model using an inbuilt calculation block via Fortran statement. Therefore, the products of this reactor are the percentage elemental composi-tion of the biomass which is subsequently fed into the first Gibbs reactor (R2) where py-rolysis, combustion, and gasification reactions occur, reported in Table 2 according to the reference [26]. When using air as gasifying agent, the ratio of air to biomass is indicated with the parameter equivalence ratio (ER). In this work, steam was used as the gasifying agent to increase the LHV of the syngas. A separator (S1) is placed after the R2 reactor to separate the products into syngas and ash. A second Gibbs reactor (R3) is positioned after the separator to adjust the composition of the synthesis gas. The product is passed to the second separator (S2) where the remaining solids and entrainment gas from the gas syn-thesis are separated. Finally, a third separator (S3) extracts the remaining entrained gas
Figure 1. Process flow diagram of the integrated bioenergy-fuel cell cogeneration plant simulated in Aspen Plus.
Table 1. Thermodynamic input data used in the Ryield reactor model. Capacity of the gasifier is132 kg/h of biomass.
Ultimate Analysis (wt.%, Dry) Wood Chip (Islam, 2020) [28]
Ash 0.450Carbon 52.463
Hydrogen 7.466Nitrogen 0.100
Sulfur 0.299Oxygen 39.223
Proximate analysis (wt.%, dry)
Fixed carbon 17.15Volatile matter 82.4
Ash 0.45Moisture 13.48
Low heating value (LHV) (MJ/kg) 19.54ER 0.25
Temperature (◦C) 827
Sustainability 2021, 13, 3232 5 of 14
Table 2. Reactions in each step of biomass gasification.
Pyrolysis endothermic stage Biomass↔ H2 + CO + CO2 + CH4 + H2O(g) + Tar + Char
Oxidation exothermic stageC + O2 → CO2 Char combustionC + 1
2 O2 → CO Partial oxidationH2 + 1
2 O2 → H2O Hydrogen combustion
Reduction endothermic stage
C + CO2 ↔ 2CO Boudouard reactionC + H2O↔ CO + H2 Reforming of the CharCO + H2O↔ CO2 + H2 Water shift reaction
C + 2H2 ↔ CH4 Methanation
For the modeling process, the Peng-Robinson with the Boston-Mathias modifications(PR-BM) state equation was selected because of its ability to calculate the thermodynamicproperties of the participating fluids at the operating temperature and pressure. Otherassumptions considered in the simulation are as follows:
• The system is isothermal and operates under steady-state conditions without transients.• Pressure drops are overlooked. The formation of tars is neglected.• The composition of the char is 100% carbon.• The process is carried out under atmospheric pressure.• Heat losses from the gasifier are ignored.
2.1.2. H2 Purification Using a PSA Unit
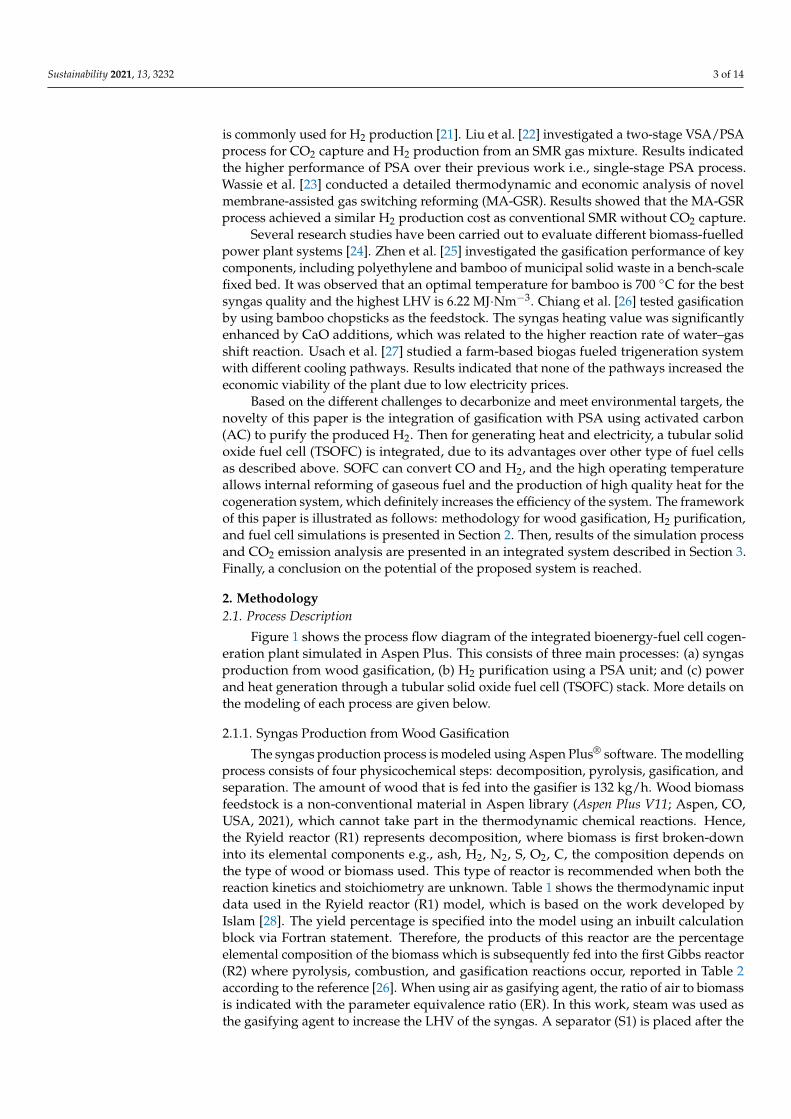
The syngas contains a high percentage of H2, which contains other components e.g.,CO2, CO, N2. Thus, in order to use it in a fuel cell, as mentioned previously, it mustbe purified, in this work in a PSA. Figure 2 shows the schematic diagram for the cyclesequence used in PSA simulations. For the cycle configuration, two cycles are a sequenceof adsorption-regeneration steps, which are important processes for cyclic stability. Theroom temperature 25 ◦C is considered for the PSA process. Activated carbon is selectedas the adsorbent. The average mass flow rate of H2 is 10.57 kg/h when S/B are 0.3 and0.4. Equations (1) and (2) describe the Dual Langmuir isotherm and Arrhenius equationused for PSA for H2 purification. Recovery rate and productivity are evaluated based onEquations (3) and (4). More detailed information can be found in reference [29].
qi =qmax1,ib1,i pi
1 + b1,i pi+
qmax1,ib1,i pi
1 + b1,i pi(1)
where qi is the adsorption capacity, mol·kg−1; qmax1,i and qmax2,i are the maximum capacity,mol·kg−1; b1,i and b2,i are the adsorption constant, Pa−1. The values for the parameters ofAC adsorption are as follows: qmax1 is 1.79 mol·kg−1; b0i is 1.33 × 10⁻⁸ Pa−1.
bi = b0i exp(−
∆Hads,i
RT
)bi = b0i exp
(−
∆Hads,i
RT
)(2)
where b0i is the pre-exponential factor and ∆Hads,i is the adsorption enthalpy which is5926 J·mol−1.
Recovery rate(%) =molH2, f eed −molH2,pro
molH2, f eed(3)
Productivity (molH2/kgs) =molH2, f eed −molH2,pro
kgAC, f eedtcycle(4)

Sustainability 2021, 13, 3232 6 of 14
Sustainability 2021, 13, x FOR PEER REVIEW 6 of 15
for PSA for H2 purification. Recovery rate and productivity are evaluated based on Equa-tions (3) and (4). More detailed information can be found in reference [29].
Figure 2. Cycle sequence used in the pressure swing adsorption (PSA) simulations.
𝑞 = 𝑞 , 𝑏 , 𝑝1 + 𝑏 , 𝑝 + 𝑞 , 𝑏 , 𝑝1 + 𝑏 , 𝑝 (1)
where qi is the adsorption capacity, mol·kg−1; qmax1,i and qmax2,i are the maximum capacity, mol·kg−1; b1,i and b2,i are the adsorption constant, Pa−1. The values for the parameters of AC adsorption are as follows: qmax1 is 1.79 mol·kg−1; b01 is 1.33 × 10⁻⁸ Pa−1. 𝑏𝑖 = 𝑏0𝑖 exp − ∆𝐻𝑎𝑑𝑠,𝑖𝑅𝑇 𝑏𝑖 = 𝑏0𝑖 exp − ∆𝐻𝑎𝑑𝑠,𝑖𝑅𝑇 (2)
where b0i is the pre-exponential factor and ΔHads,i is the adsorption enthalpy which is 5926 J·mol−1. 𝑅𝑒𝑐𝑜𝑣𝑒𝑟𝑦 𝑟𝑎𝑡𝑒(%) = 𝑚𝑜𝑙𝐻2,𝑓𝑒𝑒𝑑 − 𝑚𝑜𝑙𝐻2,𝑝𝑟𝑜𝑚𝑜𝑙𝐻2,𝑓𝑒𝑒𝑑 (3)
𝑃𝑟𝑜𝑑𝑢𝑐𝑡𝑖𝑣𝑖𝑡𝑦 (𝑚𝑜𝑙𝐻2/𝑘𝑔𝑠) = 𝑚𝑜𝑙𝐻2,𝑓𝑒𝑒𝑑 − 𝑚𝑜𝑙𝐻2,𝑝𝑟𝑜𝑘𝑔𝐴𝐶,𝑓𝑒𝑒𝑑𝑡 (4)
2.1.3. Power and Heat Generation through a TSOFC The model simulation of the TSOFC stack process was based on the work developed
by Tanim and coworkers [30], who assumed the following considerations: zero-dimen-sional; isothermal and steady state operation; all working fluids are treated as ideal gases; pressure drops are neglected. The zero-dimensional model generally assumes that chem-ical and thermodynamic equilibrium is present at the output streams [31].
Each TSOFC unit consists of two main components: one cathode and one anode. In general, a compressed and preheated air stream is fed to the cathode, which separates around 90% of the O2 contained in the air by an electrochemical process. Then, the purified O2 stream is fed to the anode, where it reacts with the H2, generating power and steam; this last is fed to a heat exchanger for air preheating. Since the steam is still hot (128 °C), it can be used for other heating purposes. The ANODE is simulated as an equilibrium Gibbs reactor with an operating temperature and pressure equal to 3 bar and 850 °C, re-spectively. The CATHODE is also simulated as an equilibrium Gibbs reactor but with the
Figure 2. Cycle sequence used in the pressure swing adsorption (PSA) simulations.
2.1.3. Power and Heat Generation through a TSOFC
The model simulation of the TSOFC stack process was based on the work developed byTanim and coworkers [30], who assumed the following considerations: zero-dimensional;isothermal and steady state operation; all working fluids are treated as ideal gases; pressuredrops are neglected. The zero-dimensional model generally assumes that chemical andthermodynamic equilibrium is present at the output streams [31].
Each TSOFC unit consists of two main components: one cathode and one anode. Ingeneral, a compressed and preheated air stream is fed to the cathode, which separatesaround 90% of the O2 contained in the air by an electrochemical process. Then, the purifiedO2 stream is fed to the anode, where it reacts with the H2, generating power and steam;this last is fed to a heat exchanger for air preheating. Since the steam is still hot (128 ◦C), itcan be used for other heating purposes. The ANODE is simulated as an equilibrium Gibbsreactor with an operating temperature and pressure equal to 3 bar and 850 ◦C, respectively.The CATHODE is also simulated as an equilibrium Gibbs reactor but with the differencethat includes a Fortran routine to calculate the actual operating voltage and the grosselectric power of the TSOFC. The actual operating voltage of the cell (Vc) can be determinedas follows [30]:
Vc = VN − (nohm + nact + ncon) (5)
VN = − ∆gf2 ∗ F
+Rg ∗ Tavg
2 ∗ Fln
PH2 ∗ P0.5H2
PH2O(6)
where VN is the Nerst’s voltage, in Volts; ∆gf is the molar Gibbs free energy of formationin J/mol; F is the Faraday constant (96,485 C/mol); Tavg is the average temperature ofthe TSOFC inlet and outlet streams (K); Pi is the partial pressure (bar) of the gaseousspecies. The variables nohm, nact, and ncon are the ohmic, activation, and concentrationlosses in the cell, respectively (V). In this work, the nohm and nact were calculated usingthe expressions proposed by Song and coworkers [32], and the geometry and materialsproperties published by Siemens-Westinghouse [30,32,33], resulting in values equal to0.089 V and 0.18 V, respectively. ncon is neglected because the diffusion at high operatingtemperature in the TSOFC is a very efficient process [34]. In turn, the gross electric power(Pel), defined in Watts, is calculated as follows [18]:
Pel = 4F ∗ nO2 ∗Vc (7)
Sustainability 2021, 13, 3232 7 of 14
where nO2 corresponds to the moles of oxygen consumption in the fuel cell. Finally, thegross electrical efficiency of the TSOFC can be expressed as follows [30]:
ηel,gross =Pel,AC
.ηfuel ∗ LHVfuel
(8)
where Pel,AC is the electrical AC power (W) after converting from DC power. In this workan inverter efficiency factor equal to 92% is used [35];
.ηfuel is the mass flow rate of H2 in
kg/s and LHVfuel is the lower heating value of H2 (120 kJ/kg).
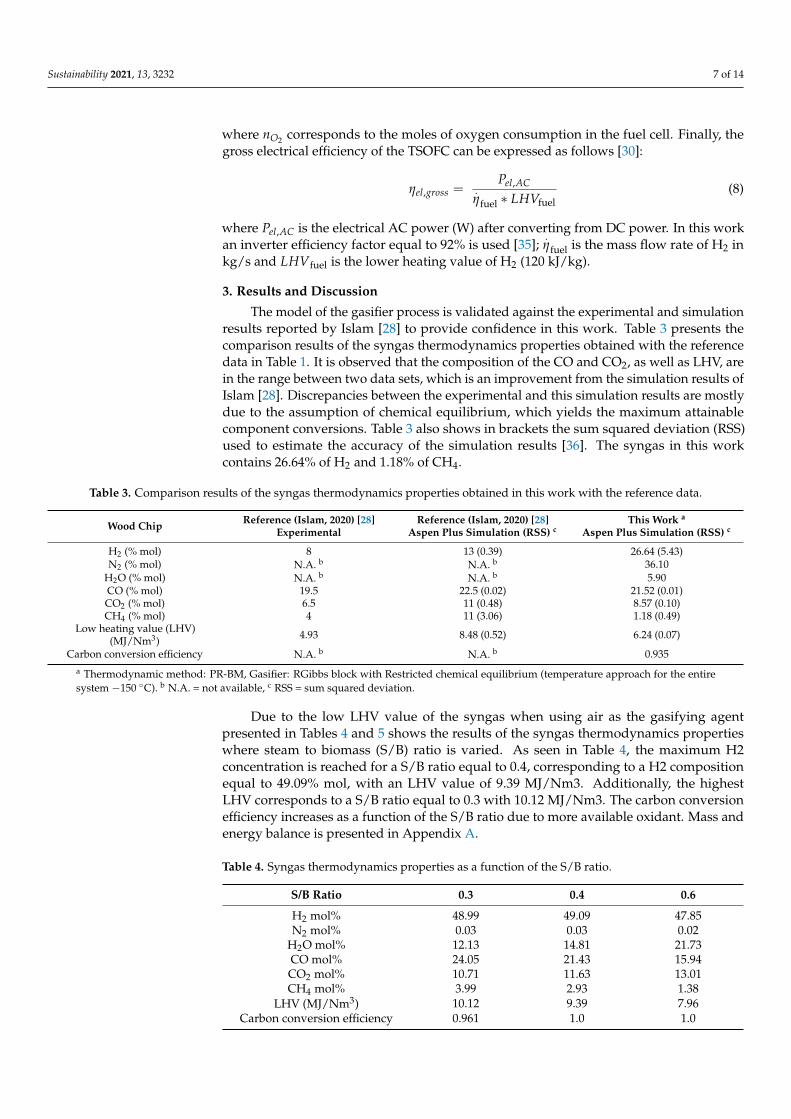
3. Results and Discussion
The model of the gasifier process is validated against the experimental and simulationresults reported by Islam [28] to provide confidence in this work. Table 3 presents thecomparison results of the syngas thermodynamics properties obtained with the referencedata in Table 1. It is observed that the composition of the CO and CO2, as well as LHV, arein the range between two data sets, which is an improvement from the simulation results ofIslam [28]. Discrepancies between the experimental and this simulation results are mostlydue to the assumption of chemical equilibrium, which yields the maximum attainablecomponent conversions. Table 3 also shows in brackets the sum squared deviation (RSS)used to estimate the accuracy of the simulation results [36]. The syngas in this workcontains 26.64% of H2 and 1.18% of CH4.
Table 3. Comparison results of the syngas thermodynamics properties obtained in this work with the reference data.
Wood Chip Reference (Islam, 2020) [28]Experimental
Reference (Islam, 2020) [28]Aspen Plus Simulation (RSS) c
This Work a
Aspen Plus Simulation (RSS) c
H2 (% mol) 8 13 (0.39) 26.64 (5.43)N2 (% mol) N.A. b N.A. b 36.10
H2O (% mol) N.A. b N.A. b 5.90CO (% mol) 19.5 22.5 (0.02) 21.52 (0.01)CO2 (% mol) 6.5 11 (0.48) 8.57 (0.10)CH4 (% mol) 4 11 (3.06) 1.18 (0.49)
Low heating value (LHV)(MJ/Nm3) 4.93 8.48 (0.52) 6.24 (0.07)
Carbon conversion efficiency N.A. b N.A. b 0.935a Thermodynamic method: PR-BM, Gasifier: RGibbs block with Restricted chemical equilibrium (temperature approach for the entiresystem −150 ◦C). b N.A. = not available, c RSS = sum squared deviation.
Due to the low LHV value of the syngas when using air as the gasifying agentpresented in Tables 4 and 5 shows the results of the syngas thermodynamics propertieswhere steam to biomass (S/B) ratio is varied. As seen in Table 4, the maximum H2concentration is reached for a S/B ratio equal to 0.4, corresponding to a H2 compositionequal to 49.09% mol, with an LHV value of 9.39 MJ/Nm3. Additionally, the highestLHV corresponds to a S/B ratio equal to 0.3 with 10.12 MJ/Nm3. The carbon conversionefficiency increases as a function of the S/B ratio due to more available oxidant. Mass andenergy balance is presented in Appendix A.
Table 4. Syngas thermodynamics properties as a function of the S/B ratio.
S/B Ratio 0.3 0.4 0.6
H2 mol% 48.99 49.09 47.85N2 mol% 0.03 0.03 0.02
H2O mol% 12.13 14.81 21.73CO mol% 24.05 21.43 15.94CO2 mol% 10.71 11.63 13.01CH4 mol% 3.99 2.93 1.38
LHV (MJ/Nm3) 10.12 9.39 7.96Carbon conversion efficiency 0.961 1.0 1.0

Sustainability 2021, 13, 3232 8 of 14
Table 5. Simulation results of the PSA at different S/B ratios, and H2 purity = 99.99 mol%.
PSA Results UnitsS/B
0.4 0.3
Composition in thePurge Gas
H2 mass fraction 0.0709 0.0744O2 mass fraction 9.747 × 10⁻¹⁹ 5.499 × 10⁻¹⁹
N2 mass fraction 0.000537 0.000601H2O mass fraction 0.1874 0.1464CO mass fraction 0.5181 0.5888CO2 mass fraction 0.2208 0.1869CH4 mass fraction 0.00055 0.00089H2S mass fraction 0.0017 0.0019H3N mass fraction 2.108 × 10⁻⁶ 2.354 × 10⁻⁶
S mass fraction 8.459 × 10⁻¹² 9.176 × 10⁻¹²
Flow rate of H2 kg/h 10.57 10.54
Work capacity kJ/molH2 4.76 4.80
H2 recovery % 75.1 74.3
Work capacity kW 6.98 7.02
As in Tables 4 and 5 shows the gas composition, after H2 is removed, at different S/Bratios. The purity of the H2 obtained is 99.99% and the rest of the gas consists basicallyof CO, CO2, and H2O, where CO is the most abundant component around 51.8–58.9%.Although the increment of the ratio S/B reduces the amount of N2, and increases thecontent of H2O, it is important to note that the work duty required for H2 separation in thePSA process decreases from 7.02 kW at S/B = 0.3 to 6.98 kW at S/B = 0.4 when flow ratesof hydrogen are 10.57 kg/h and 10.54 kg/h, respectively.
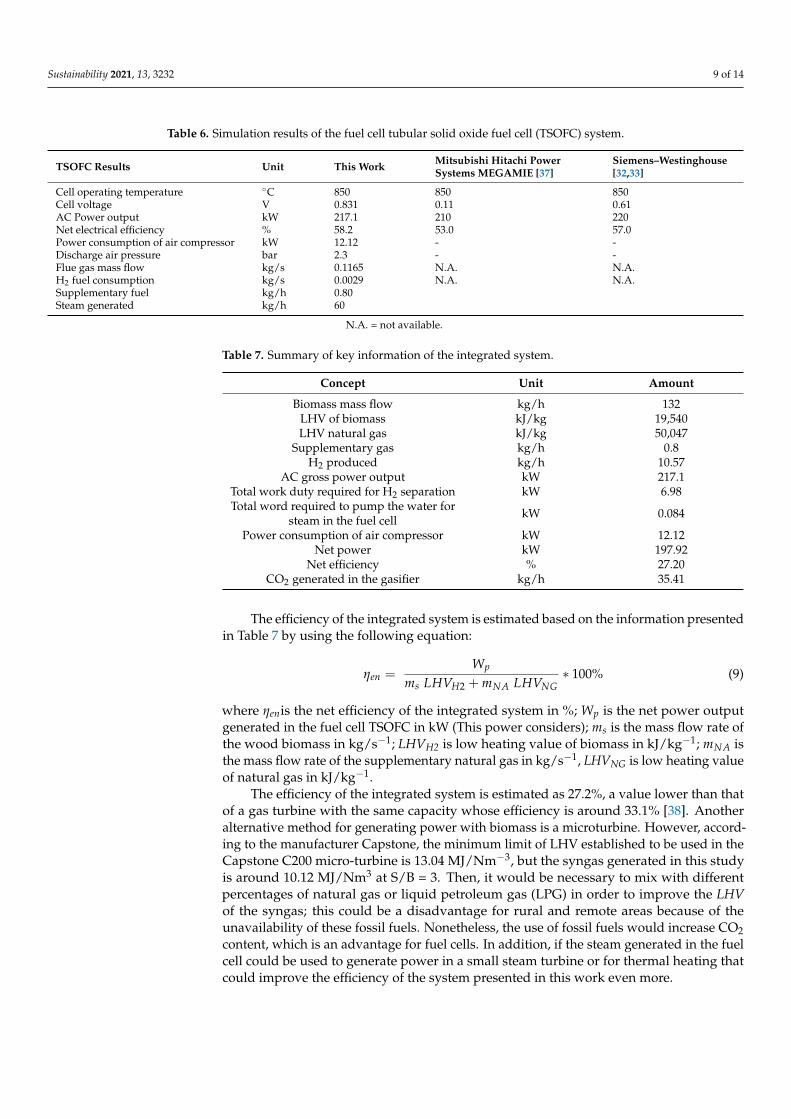
Table 6 shows the results of the fuel cell TSOFC system. The overall electrochemicalreaction in the anode took place at 3 bar and 850 ◦C, with an H2 feed of 0.0029 kg/s thatreacted stoichiometrically with O2 to produce 1.11 V at an average temperature of 425 ◦C;however, activation and ohmic losses (anode, cathode, electrolyte, and interconnector)were discounted, leaving a cell voltage of 0.831 V. The tubular cell produced an AC poweroutput of 217.1 kW with a net electrical efficiency of 58.2%, and as byproducts steam(0.0272 kg/s) and usable heat (100 kW). After comparing this work with the MitsubishiHitachi Power Systems, where the cell voltage changed by 86.76% and 8.93 % in netelectrical efficiency, the Mitsubishi showed lower cell voltage due to high cell packingthat allowed a higher current density. When using the Siemens–Westinghouse system, thechange was 26.59% for voltage and 2.06% in efficiency; the voltage change is mainly due tothe level of hydrogen purity since H2 is produced by hydrocarbon reforming. Nonetheless,Siemens–Westinghouse’s cell is integrated with a gas turbine that generates additionalpower and improves efficiency.
The 132 kg/h of biomass produces 10.57 kg/h or 0.0029 kg/s of H2 in the gasifier,after the PSA, which is fed to the fuel cell. The fuel cell generates 217 kW of electricity andthe exhaust gas so that fuel cell has enough heat to generates 40 kg/h of steam neededin the gasifier. In order to complete 60 kg/h, 0.8 kg/h of natural gas is needed to burn assupplementary firing, as shown in Table 6.
Table 7 summarizes the key information of the integrated system (gasification, PSA,and fuel cell) used to estimate the efficiency of the integrated system (gasification process,PSA, and TSOFC).
Sustainability 2021, 13, 3232 9 of 14
Table 6. Simulation results of the fuel cell tubular solid oxide fuel cell (TSOFC) system.
TSOFC Results Unit This Work Mitsubishi Hitachi PowerSystems MEGAMIE [37]
Siemens–Westinghouse[32,33]
Cell operating temperature ◦C 850 850 850Cell voltage V 0.831 0.11 0.61AC Power output kW 217.1 210 220Net electrical efficiency % 58.2 53.0 57.0Power consumption of air compressor kW 12.12 - -Discharge air pressure bar 2.3 - -Flue gas mass flow kg/s 0.1165 N.A. N.A.H2 fuel consumption kg/s 0.0029 N.A. N.A.Supplementary fuel kg/h 0.80Steam generated kg/h 60
N.A. = not available.
Table 7. Summary of key information of the integrated system.
Concept Unit Amount
Biomass mass flow kg/h 132LHV of biomass kJ/kg 19,540LHV natural gas kJ/kg 50,047
Supplementary gas kg/h 0.8H2 produced kg/h 10.57
AC gross power output kW 217.1Total work duty required for H2 separation kW 6.98Total word required to pump the water for
steam in the fuel cell kW 0.084
Power consumption of air compressor kW 12.12Net power kW 197.92
Net efficiency % 27.20CO2 generated in the gasifier kg/h 35.41
The efficiency of the integrated system is estimated based on the information presentedin Table 7 by using the following equation:
ηen =Wp
ms LHVH2 + mNA LHVNG∗ 100% (9)
where ηenis the net efficiency of the integrated system in %; Wp is the net power outputgenerated in the fuel cell TSOFC in kW (This power considers); ms is the mass flow rate ofthe wood biomass in kg/s−1; LHVH2 is low heating value of biomass in kJ/kg−1; mNA isthe mass flow rate of the supplementary natural gas in kg/s−1, LHVNG is low heating valueof natural gas in kJ/kg−1.
The efficiency of the integrated system is estimated as 27.2%, a value lower than thatof a gas turbine with the same capacity whose efficiency is around 33.1% [38]. Anotheralternative method for generating power with biomass is a microturbine. However, accord-ing to the manufacturer Capstone, the minimum limit of LHV established to be used in theCapstone C200 micro-turbine is 13.04 MJ/Nm−3, but the syngas generated in this studyis around 10.12 MJ/Nm3 at S/B = 3. Then, it would be necessary to mix with differentpercentages of natural gas or liquid petroleum gas (LPG) in order to improve the LHVof the syngas; this could be a disadvantage for rural and remote areas because of theunavailability of these fossil fuels. Nonetheless, the use of fossil fuels would increase CO2content, which is an advantage for fuel cells. In addition, if the steam generated in the fuelcell could be used to generate power in a small steam turbine or for thermal heating thatcould improve the efficiency of the system presented in this work even more.
Sustainability 2021, 13, 3232 10 of 14
Total CO2 emitted by the integrated system presented in this work is estimatedconsidering the CO2 emitted and the CO2 sequestered by wood. The CO2 sequestered bywood is estimated by the simple Equation (10):
CO2 per tree = [Tree mass× 0.65× 0.50× 1.20× 3.67]/[age of biomass] (10)
where CO2 per tree is the sequestered CO2 in kg/h; tree mass is the mass flow of freshbiomass in kg/h; 65% is the percentage of dry mass; 50% is the percentage of carbon.As 20% of tree biomass is below ground level in roots, the equation is multiplied by afactor of 120%. Finally, the equation is multiplied by 3.67, which is the ratio of CO2 to C:44/12 = 3.67.
Considering a 12-year old tree, total annual mass of tree is around 1,056,000 kg per year(132 kg/h, considering 8000 h of operation during the year). Using Equation (10), total CO2absorbed per year is 125,954 kg/y. CO2 generated in the gasifier per year is 283,360 kg/y.Total net CO2 emitted by the system is 157,406 kg/y or 19.67 kg/h, and the CO2 intensityis 98.3 kgCO2/MWh. Compared with a NGCC without and with carbon capture, theircarbon intensities are around 331 kgCO2/MWh and 40 kgCO2/MWh, respectively. Aneconomic analysis is needed to compare the proposed integrated system with an NGCCwith CO2 capture. However, this is beyond the scope of this work and will be presented asfuture work.
4. Conclusions
This study demonstrates that it is possible to combine biomass gasification and fuelcell technologies as an alternative option to generate clean electricity for remote areas. Thisconcept was tested by using wood to generate a H2-rich gas in a gasifier. The integratedsystem could generate a net power of 197.92 kW and 60 kg/h of steam (used in the gasifier)when using 132 kg/h of wood. The net efficiency of the integrated system, consideringonly the electric power generated in the TSOFC, is lower than a gas turbine with the samecapacity: 27.2% against 33.1%.
The carbon intensity of the system presented in this work is 98.3 kgCO2/MWh com-pared with those of NGCC without and with CO2 capture, i.e., 331 kgCO2/MWh and40 kgCO2/MWh, respectively. If CCUS is integrated in the system, power with negativecarbon emission is possible.
There is great potential for cogeneration with low carbon emission by using woodbiomass in rural areas of developing countries. This is an alternative technology for placeswhere biomass is abundant and where it is difficult to get electricity from the grid due togeographical location limits.
Author Contributions: Conceptualization, A.G.-D.; methodology, A.G.-D., C.F.-P., P.D.-H., M.O.G.-D.; software, A.G.-D., C.F.-P., L.J., and J.C.S.L.d.G.; validation, C.F.-P., L.J., J.C.S.L.d.G.; formal analysis,A.G.-D., C.F.-P., L.J.; investigation, J.C.S.L.d.G.; data curation, A.G.-D., C.F.-P., and J.C.S.L.d.G.;writing—original draft preparation, A.G.-D., C.F.-P., L.J., P.D.-H.; M.O.G.-D.; writing—review andediting, A.G.-D., C.F.-P., L.J., P.D.-H.; M.O.G.-D.; visualization, M.O.G.-D.; supervision, A.G.-D. andC.F.-P.; project administration, C.F.-P.; funding acquisition, C.F.-P. All authors have read and agreedto the published version of the manuscript.
Funding: This research received no external funding.
Institutional Review Board Statement: Not applicable.
Informed Consent Statement: Not applicable.
Data Availability Statement: Not applicable.
Acknowledgments: The authors would like to thank Sufyan Aslam Mukadam for his enthusias-tic support in the literature search related to biomass gasification and fuel cells. González-Diazwould like to thank the National Institute of Electricity for the support. Font-Palma was supported
Sustainability 2021, 13, 3232 11 of 14
by the Royal Academy of Engineering under the Leverhulme Trust Research Fellowship scheme(LTRF1920\16\18).
Conflicts of Interest: The authors declare no conflict of interest.
Abbreviations
AC Activated carbonBECC Bioenergy with carbon capture and sequestrationCBC Coastal blue carbonCCS carbon capture and storageCCUS carbon capture use and storageDAC Direct air captureER equivalence ratioGHG greenhouse gasHHV higher heating valueIEA International Energy AgencyLHV Lower heating valueLPG Liquid petroleum gasMA-GSR membrane-assisted gas switching reformingNET negative emissions technologiesNGCC Combined cycle power plantNG Natural gasPEM proton exchange membraneSMR steam methane reformingSOFT solid oxide fuel cellsPSA pressure swing adsorptionPSOFC planar SOFCS/B steam to biomassTCRS Terrestrial Carbon Removal and SequestrationTSA temperature swing adsorptionTSOFC tubular solid oxide fuel cellVPSA vacuum pressure swing adsorption
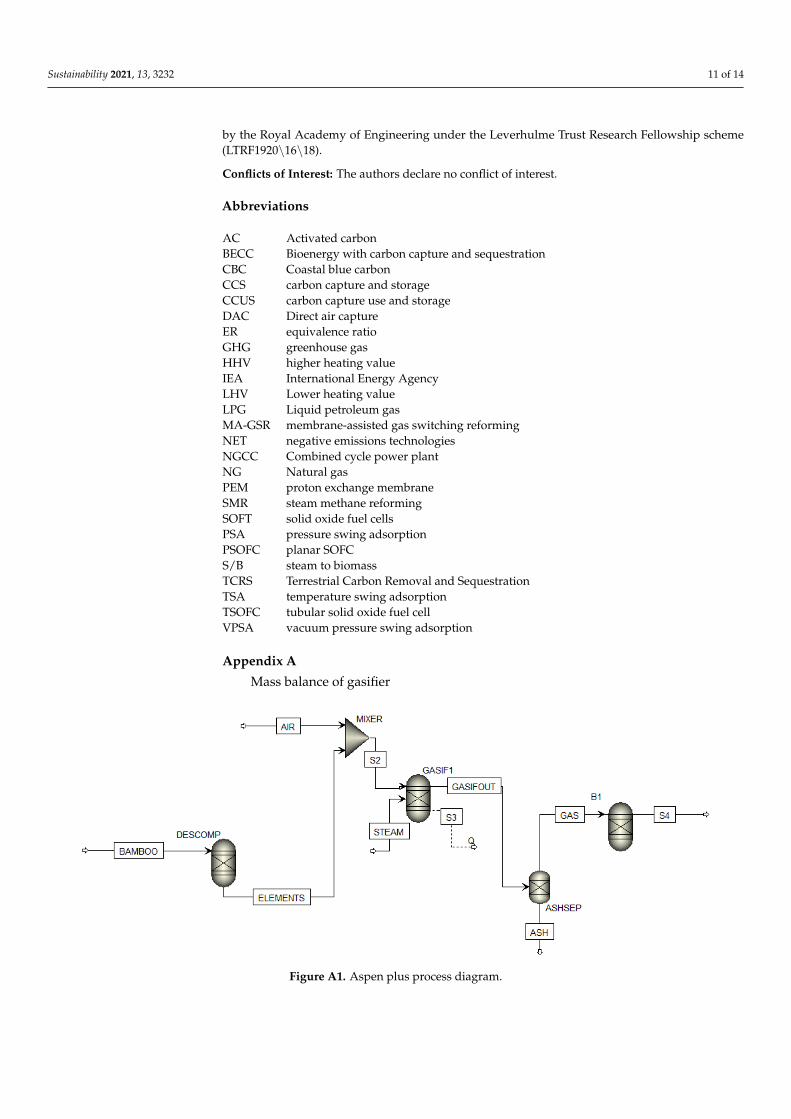
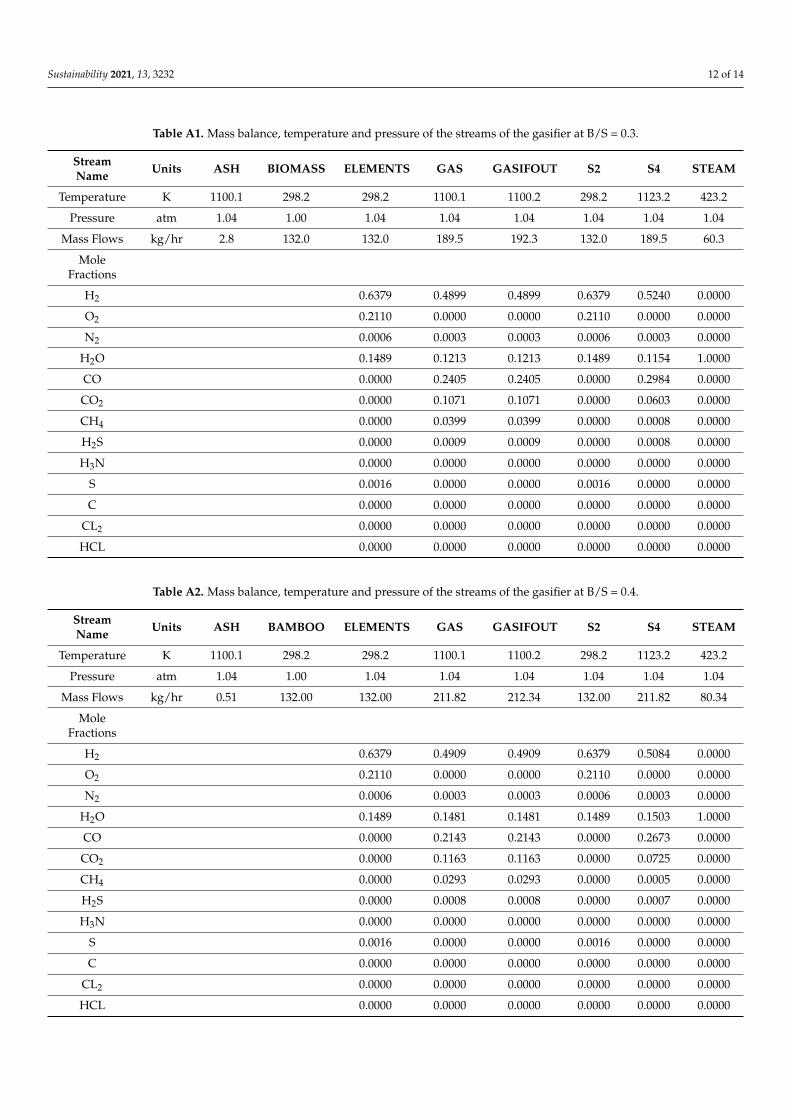
Appendix A
Mass balance of gasifier
Sustainability 2021, 13, x FOR PEER REVIEW 12 of 15
SOFT solid oxide fuel cells PSA pressure swing adsorption PSOFC planar SOFC S/B steam to biomass TCRS Terrestrial Carbon Removal and Sequestration TSA temperature swing adsorption TSOFC tubular solid oxide fuel cell VPSA vacuum pressure swing adsorption
Appendix A Mass balance of gasifier
Figure A1. Aspen plus process diagram.
Table A1. Mass balance, temperature and pressure of the streams of the gasifier at B/S = 0.3.
Stream Name Units ASH BIOMASS ELEMENTS GAS GASIFOUT S2 S4 STEAM Temperature K 1100.1 298.2 298.2 1100.1 1100.2 298.2 1123.2 423.2
Pressure atm 1.04 1.00 1.04 1.04 1.04 1.04 1.04 1.04 Mass Flows kg/hr 2.8 132.0 132.0 189.5 192.3 132.0 189.5 60.3
Mole Fractions
H2 0.6379 0.4899 0.4899 0.6379 0.5240 0.0000 O2 0.2110 0.0000 0.0000 0.2110 0.0000 0.0000 N2 0.0006 0.0003 0.0003 0.0006 0.0003 0.0000
H2O 0.1489 0.1213 0.1213 0.1489 0.1154 1.0000 CO 0.0000 0.2405 0.2405 0.0000 0.2984 0.0000 CO2 0.0000 0.1071 0.1071 0.0000 0.0603 0.0000 CH4 0.0000 0.0399 0.0399 0.0000 0.0008 0.0000 H2S 0.0000 0.0009 0.0009 0.0000 0.0008 0.0000 H3N 0.0000 0.0000 0.0000 0.0000 0.0000 0.0000
S 0.0016 0.0000 0.0000 0.0016 0.0000 0.0000 C 0.0000 0.0000 0.0000 0.0000 0.0000 0.0000
CL2 0.0000 0.0000 0.0000 0.0000 0.0000 0.0000 HCL 0.0000 0.0000 0.0000 0.0000 0.0000 0.0000
Figure A1. Aspen plus process diagram.
Sustainability 2021, 13, 3232 12 of 14
Table A1. Mass balance, temperature and pressure of the streams of the gasifier at B/S = 0.3.
StreamName Units ASH BIOMASS ELEMENTS GAS GASIFOUT S2 S4 STEAM
Temperature K 1100.1 298.2 298.2 1100.1 1100.2 298.2 1123.2 423.2
Pressure atm 1.04 1.00 1.04 1.04 1.04 1.04 1.04 1.04
Mass Flows kg/hr 2.8 132.0 132.0 189.5 192.3 132.0 189.5 60.3
MoleFractions
H2 0.6379 0.4899 0.4899 0.6379 0.5240 0.0000
O2 0.2110 0.0000 0.0000 0.2110 0.0000 0.0000
N2 0.0006 0.0003 0.0003 0.0006 0.0003 0.0000
H2O 0.1489 0.1213 0.1213 0.1489 0.1154 1.0000
CO 0.0000 0.2405 0.2405 0.0000 0.2984 0.0000
CO2 0.0000 0.1071 0.1071 0.0000 0.0603 0.0000
CH4 0.0000 0.0399 0.0399 0.0000 0.0008 0.0000
H2S 0.0000 0.0009 0.0009 0.0000 0.0008 0.0000
H3N 0.0000 0.0000 0.0000 0.0000 0.0000 0.0000
S 0.0016 0.0000 0.0000 0.0016 0.0000 0.0000
C 0.0000 0.0000 0.0000 0.0000 0.0000 0.0000
CL2 0.0000 0.0000 0.0000 0.0000 0.0000 0.0000
HCL 0.0000 0.0000 0.0000 0.0000 0.0000 0.0000
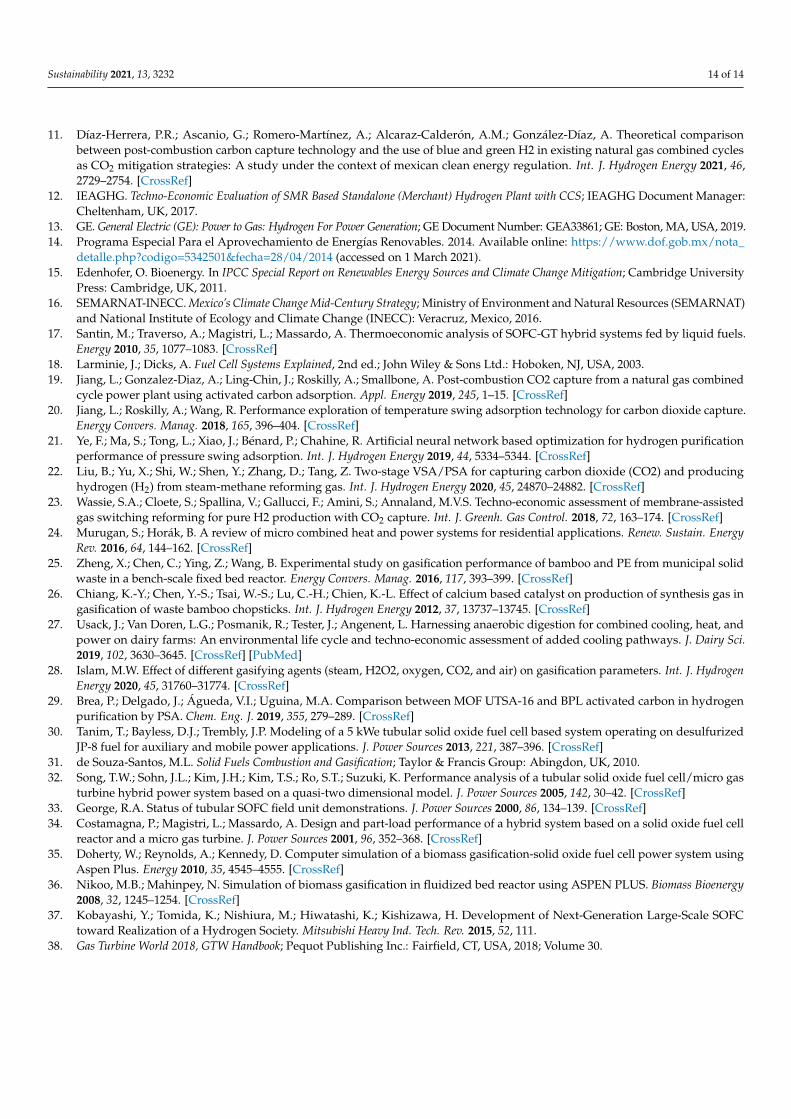
Table A2. Mass balance, temperature and pressure of the streams of the gasifier at B/S = 0.4.
StreamName Units ASH BAMBOO ELEMENTS GAS GASIFOUT S2 S4 STEAM
Temperature K 1100.1 298.2 298.2 1100.1 1100.2 298.2 1123.2 423.2
Pressure atm 1.04 1.00 1.04 1.04 1.04 1.04 1.04 1.04
Mass Flows kg/hr 0.51 132.00 132.00 211.82 212.34 132.00 211.82 80.34
MoleFractions
H2 0.6379 0.4909 0.4909 0.6379 0.5084 0.0000
O2 0.2110 0.0000 0.0000 0.2110 0.0000 0.0000
N2 0.0006 0.0003 0.0003 0.0006 0.0003 0.0000
H2O 0.1489 0.1481 0.1481 0.1489 0.1503 1.0000
CO 0.0000 0.2143 0.2143 0.0000 0.2673 0.0000
CO2 0.0000 0.1163 0.1163 0.0000 0.0725 0.0000
CH4 0.0000 0.0293 0.0293 0.0000 0.0005 0.0000
H2S 0.0000 0.0008 0.0008 0.0000 0.0007 0.0000
H3N 0.0000 0.0000 0.0000 0.0000 0.0000 0.0000
S 0.0016 0.0000 0.0000 0.0016 0.0000 0.0000
C 0.0000 0.0000 0.0000 0.0000 0.0000 0.0000
CL2 0.0000 0.0000 0.0000 0.0000 0.0000 0.0000
HCL 0.0000 0.0000 0.0000 0.0000 0.0000 0.0000

Sustainability 2021, 13, 3232 13 of 14
Sustainability 2021, 13, x FOR PEER REVIEW 13 of 15
Table A2. Mass balance, temperature and pressure of the streams of the gasifier at B/S = 0.4.
Stream Name Units ASH BAMBOO ELEMENTS GAS GASIFOUT S2 S4 STEAM Temperature K 1100.1 298.2 298.2 1100.1 1100.2 298.2 1123.2 423.2
Pressure atm 1.04 1.00 1.04 1.04 1.04 1.04 1.04 1.04 Mass Flows kg/hr 0.51 132.00 132.00 211.82 212.34 132.00 211.82 80.34
Mole Fractions
H2 0.6379 0.4909 0.4909 0.6379 0.5084 0.0000 O2 0.2110 0.0000 0.0000 0.2110 0.0000 0.0000 N2 0.0006 0.0003 0.0003 0.0006 0.0003 0.0000
H2O 0.1489 0.1481 0.1481 0.1489 0.1503 1.0000 CO 0.0000 0.2143 0.2143 0.0000 0.2673 0.0000 CO2 0.0000 0.1163 0.1163 0.0000 0.0725 0.0000 CH4 0.0000 0.0293 0.0293 0.0000 0.0005 0.0000 H2S 0.0000 0.0008 0.0008 0.0000 0.0007 0.0000 H3N 0.0000 0.0000 0.0000 0.0000 0.0000 0.0000
S 0.0016 0.0000 0.0000 0.0016 0.0000 0.0000 C 0.0000 0.0000 0.0000 0.0000 0.0000 0.0000
CL2 0.0000 0.0000 0.0000 0.0000 0.0000 0.0000 HCL 0.0000 0.0000 0.0000 0.0000 0.0000 0.0000
(a) (b)
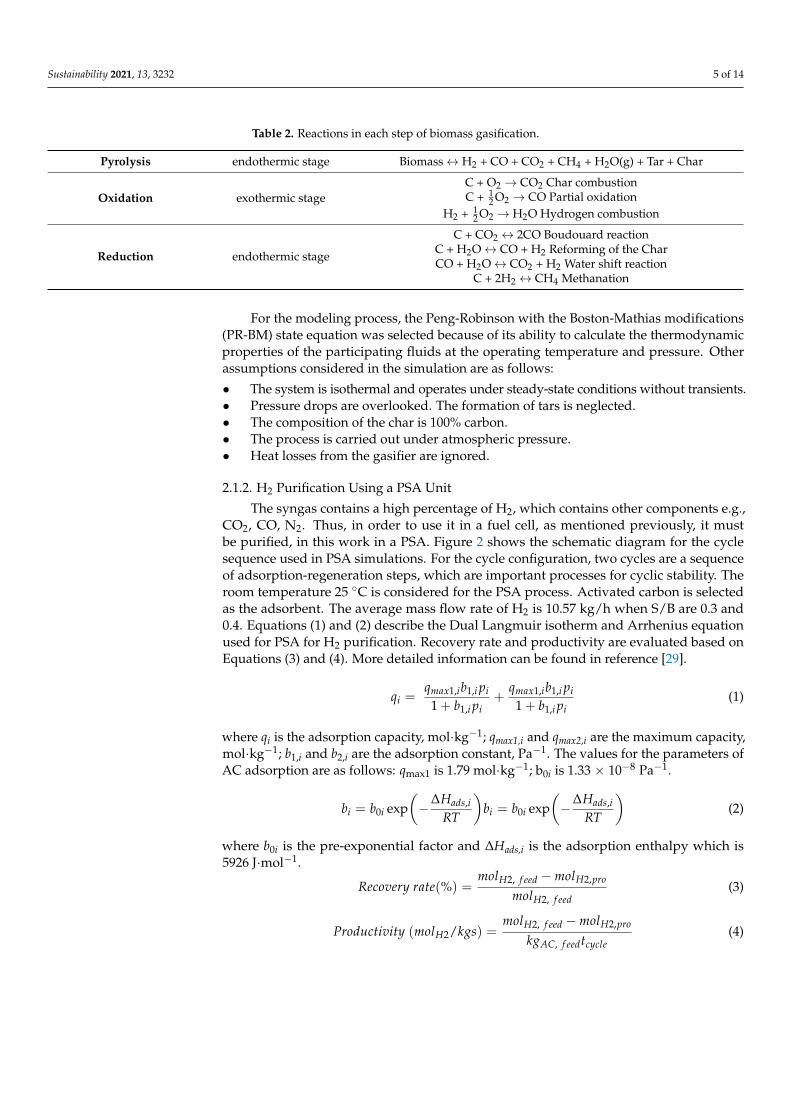
Figure A2. (a) Schematic mass balance for the TSOFC and (b) Schematic energy (enthalpy) balance for the TSOFC.
Table A3. Values for the mass and energy balance of TSOFC.
Item Unit Inlet Air mass flow kg/s 0.1133 Air pressure bar 2.3
Air temperature °C 320 Air enthalpy flow J/s 25,073.6
H2 mass flow kg/s 0.0029 H2 pressure bar 2
H2 temperature °C 105 H2 enthalpy flow J/s 138.215 Gas composition
O2 Mole fraction 0.019 N2 Mole fraction 0.658
H2O Mole fraction 0.322
Figure A2. (a) Schematic mass balance for the TSOFC and (b) Schematic energy (enthalpy) balance for the TSOFC.
Table A3. Values for the mass and energy balance of TSOFC.
Item Unit Inlet
Air mass flow kg/s 0.1133Air pressure bar 2.3
Air temperature ◦C 320Air enthalpy flow J/s 25,073.6
H2 mass flow kg/s 0.0029H2 pressure bar 2
H2 temperature ◦C 105H2 enthalpy flow J/s 138.215Gas composition
O2 Mole fraction 0.019N2 Mole fraction 0.658
H2O Mole fraction 0.322Flue gas flow rate kg/s 0.116Flue gas pressure Bar 2
Flue gas temperature ◦C 355.54Steam produced kg/h 45Steam pressure bar 3
Temperature ◦C 300Power pump kW 0.0084
References1. National Academies of Sciences, E. Negative Emissions Technologies and Reliable Sequestration: A Research Agenda; National
Academies Press: Washington, DC, USA, 2018.2. Meyer, L.; Brinkman, S.; van Kesteren, L.; Leprince-Ringuet, N.; van Boxmeer, F. Contribution of Working Groups I, II and III to the
Fifth Assessment Report of the Intergovernmental Panel on Climate Change; Synthesis Report: Geneva, Switzerland, 2014; p. 169.3. IEA. Energy Technology Perspectives 2020; IEA Webstore: London, UK, 2020.4. Stafford, W.; Lotter, A.; Brent, A.; von Maltitz, G. Biofuels Technology: A Look Forward; United Nations World Institute for
Development Economics Research: Helsinki, Finland, 2017.5. Rios, M.; Kaltschmitt, M. Bioenergy potential in Mexico—Status and perspectives on a high spatial distribution. Biomass Convers.
Biorefinery 2013, 3, 239–254. [CrossRef]6. Aldana, H.; Lozano, F.J.; Acevedo, J. Evaluating the potential for producing energy from agricultural residues in México using
MILP optimization. Biomass Bioenergy 2014, 67, 372–389. [CrossRef]7. IRENA. Hydrogen from Renewable Power: Technology Outlook for the Energy Transition; International Renewable Energy Agency:
Abu Dhabi, United Arab Emirates, 2018.8. IRENA. Hydrogen: A Renewable Energy Perspective; International Renewable Energy Agency: Abu Dhabi, United Arab Emirates, 2019.9. IRENA. Global Energy Transformation: A Roadmap to 2050, 2019th; International Renewable Energy Agency: Abu Dhabi, United
Arab Emirates, 2019.10. CCC. Hydrogen in a Low-Carbon Economy; Committee on Climate Change: London, UK, 2018.
Sustainability 2021, 13, 3232 14 of 14
11. Díaz-Herrera, P.R.; Ascanio, G.; Romero-Martínez, A.; Alcaraz-Calderón, A.M.; González-Díaz, A. Theoretical comparisonbetween post-combustion carbon capture technology and the use of blue and green H2 in existing natural gas combined cyclesas CO2 mitigation strategies: A study under the context of mexican clean energy regulation. Int. J. Hydrogen Energy 2021, 46,2729–2754. [CrossRef]
12. IEAGHG. Techno-Economic Evaluation of SMR Based Standalone (Merchant) Hydrogen Plant with CCS; IEAGHG Document Manager:Cheltenham, UK, 2017.
13. GE. General Electric (GE): Power to Gas: Hydrogen For Power Generation; GE Document Number: GEA33861; GE: Boston, MA, USA, 2019.14. Programa Especial Para el Aprovechamiento de Energías Renovables. 2014. Available online: https://www.dof.gob.mx/nota_
detalle.php?codigo=5342501&fecha=28/04/2014 (accessed on 1 March 2021).15. Edenhofer, O. Bioenergy. In IPCC Special Report on Renewables Energy Sources and Climate Change Mitigation; Cambridge University
Press: Cambridge, UK, 2011.16. SEMARNAT-INECC. Mexico’s Climate Change Mid-Century Strategy; Ministry of Environment and Natural Resources (SEMARNAT)
and National Institute of Ecology and Climate Change (INECC): Veracruz, Mexico, 2016.17. Santin, M.; Traverso, A.; Magistri, L.; Massardo, A. Thermoeconomic analysis of SOFC-GT hybrid systems fed by liquid fuels.
Energy 2010, 35, 1077–1083. [CrossRef]18. Larminie, J.; Dicks, A. Fuel Cell Systems Explained, 2nd ed.; John Wiley & Sons Ltd.: Hoboken, NJ, USA, 2003.19. Jiang, L.; Gonzalez-Diaz, A.; Ling-Chin, J.; Roskilly, A.; Smallbone, A. Post-combustion CO2 capture from a natural gas combined
cycle power plant using activated carbon adsorption. Appl. Energy 2019, 245, 1–15. [CrossRef]20. Jiang, L.; Roskilly, A.; Wang, R. Performance exploration of temperature swing adsorption technology for carbon dioxide capture.
Energy Convers. Manag. 2018, 165, 396–404. [CrossRef]21. Ye, F.; Ma, S.; Tong, L.; Xiao, J.; Bénard, P.; Chahine, R. Artificial neural network based optimization for hydrogen purification
performance of pressure swing adsorption. Int. J. Hydrogen Energy 2019, 44, 5334–5344. [CrossRef]22. Liu, B.; Yu, X.; Shi, W.; Shen, Y.; Zhang, D.; Tang, Z. Two-stage VSA/PSA for capturing carbon dioxide (CO2) and producing
hydrogen (H2) from steam-methane reforming gas. Int. J. Hydrogen Energy 2020, 45, 24870–24882. [CrossRef]23. Wassie, S.A.; Cloete, S.; Spallina, V.; Gallucci, F.; Amini, S.; Annaland, M.V.S. Techno-economic assessment of membrane-assisted
gas switching reforming for pure H2 production with CO2 capture. Int. J. Greenh. Gas Control. 2018, 72, 163–174. [CrossRef]24. Murugan, S.; Horák, B. A review of micro combined heat and power systems for residential applications. Renew. Sustain. Energy
Rev. 2016, 64, 144–162. [CrossRef]25. Zheng, X.; Chen, C.; Ying, Z.; Wang, B. Experimental study on gasification performance of bamboo and PE from municipal solid
waste in a bench-scale fixed bed reactor. Energy Convers. Manag. 2016, 117, 393–399. [CrossRef]26. Chiang, K.-Y.; Chen, Y.-S.; Tsai, W.-S.; Lu, C.-H.; Chien, K.-L. Effect of calcium based catalyst on production of synthesis gas in
gasification of waste bamboo chopsticks. Int. J. Hydrogen Energy 2012, 37, 13737–13745. [CrossRef]27. Usack, J.; Van Doren, L.G.; Posmanik, R.; Tester, J.; Angenent, L. Harnessing anaerobic digestion for combined cooling, heat, and
power on dairy farms: An environmental life cycle and techno-economic assessment of added cooling pathways. J. Dairy Sci.2019, 102, 3630–3645. [CrossRef] [PubMed]
28. Islam, M.W. Effect of different gasifying agents (steam, H2O2, oxygen, CO2, and air) on gasification parameters. Int. J. HydrogenEnergy 2020, 45, 31760–31774. [CrossRef]
29. Brea, P.; Delgado, J.; Águeda, V.I.; Uguina, M.A. Comparison between MOF UTSA-16 and BPL activated carbon in hydrogenpurification by PSA. Chem. Eng. J. 2019, 355, 279–289. [CrossRef]
30. Tanim, T.; Bayless, D.J.; Trembly, J.P. Modeling of a 5 kWe tubular solid oxide fuel cell based system operating on desulfurizedJP-8 fuel for auxiliary and mobile power applications. J. Power Sources 2013, 221, 387–396. [CrossRef]
31. de Souza-Santos, M.L. Solid Fuels Combustion and Gasification; Taylor & Francis Group: Abingdon, UK, 2010.32. Song, T.W.; Sohn, J.L.; Kim, J.H.; Kim, T.S.; Ro, S.T.; Suzuki, K. Performance analysis of a tubular solid oxide fuel cell/micro gas
turbine hybrid power system based on a quasi-two dimensional model. J. Power Sources 2005, 142, 30–42. [CrossRef]33. George, R.A. Status of tubular SOFC field unit demonstrations. J. Power Sources 2000, 86, 134–139. [CrossRef]34. Costamagna, P.; Magistri, L.; Massardo, A. Design and part-load performance of a hybrid system based on a solid oxide fuel cell
reactor and a micro gas turbine. J. Power Sources 2001, 96, 352–368. [CrossRef]35. Doherty, W.; Reynolds, A.; Kennedy, D. Computer simulation of a biomass gasification-solid oxide fuel cell power system using
Aspen Plus. Energy 2010, 35, 4545–4555. [CrossRef]36. Nikoo, M.B.; Mahinpey, N. Simulation of biomass gasification in fluidized bed reactor using ASPEN PLUS. Biomass Bioenergy
2008, 32, 1245–1254. [CrossRef]37. Kobayashi, Y.; Tomida, K.; Nishiura, M.; Hiwatashi, K.; Kishizawa, H. Development of Next-Generation Large-Scale SOFC
toward Realization of a Hydrogen Society. Mitsubishi Heavy Ind. Tech. Rev. 2015, 52, 111.38. Gas Turbine World 2018, GTW Handbook; Pequot Publishing Inc.: Fairfield, CT, USA, 2018; Volume 30.
Top Related
Copyright © 2022 FDOKUMEN

