


Bahasa
Halaman
Hukum


STUDIES ON PARAMETRIC APPRAISAL OF FRICTION STIR WELDING Ankit Kumar Pandey
Department of Mechanical Engineering National Institute of Technology Rourkela

STUDIES ON PARAMETRIC APPRAISAL OF FRICTION STIR WELDING
Dissertation submitted in partial fulfillment of the requirements of the degree of
Master of Technology (Research)
In
Mechanical Engineering
by
Ankit Kumar Pandey
(Roll Number: 614ME1001)
based on research work carried out
under the supervision of
Prof. S. S. Mahapatra
August, 2016
Department of Mechanical Engineering National Institute of Technology Rourkela

Department of Mechanical Engineering
National Institute of Technology Rourkela _________________________________________________
August 17, 2016
Certificate of Examination
Roll Number: 614ME1001
Name: Ankit Kumar Pandey
Title of Dissertation: STUDIES ON PARAMETRIC APPRAISAL OF FRICTION STIR
WELDING
We the below signed, after checking the dissertation mentioned above and the official record
book (s) of the student, hereby state our approval of the dissertation submitted in partial
fulfillment of the requirement of the degree of Master of Technology in Mechanical
Engineering at National Institute of Technology, Rourkela. We are satisfied with the volume,
quality, correctness, and originality of the work.
_______________________ Siba Sankar Mahapatra
Principle Supervisor
_______________________ ______________________
Sukesh Chandra Mohanty Debi Prasad Tripathy
Member, MSC Member, MSC
_______________________ ______________________ Braja Gopal Mishra
Member, MSC External Examiner
_______________________ _______________________ Kalipada Maity Siba Sankar Mahapatra
Chairperson, MSC Head of the Department
Department of Mechanical Engineering
National Institute of Technology Rourkela _________________________________________________
Prof. Siba Sankar Mahapatra
Professor
August 17, 2016
Supervisor’s Certificate
This is to certify that the work presented in this dissertation entitled “STUDIES ON
PARAMETRIC APPRAISAL OF FRICTION STIR WELDING” by “Ankit Kumar Pandey”, Roll
Number: 614ME1001, is a record of original research carried out by him under my
supervision and guidance in partial fulfillment of the requirements of the degree of Master in
Technology (Research) in Mechanical Engineering. Neither this dissertation nor any part of it
has been submitted for any degree or diploma to any institute or university in India or abroad.
______________________ Siba Sankar Mahapatra Professor

Dedicated To my
Sweet Family and Friends
Signature

Declaration of Originality
I, Ankit Kumar Pandey, Roll Number: 614ME1001 hereby declare that this dissertation
entitled “STUDIES ON PARAMETRIC APPRAISAL OF FRICTION STIR WELDING”
represents my original work carried out as a post graduate student of NIT Rourkela and, to
the best of my knowledge, it contains no material previously published or written by another
person, nor any material presented for the award of any degree or diploma of NIT Rourkela
or any other institution. Any contribution made to this research by others, with whom I have
worked at NIT Rourkela or elsewhere, is explicitly acknowledged in the dissertation. Works of
other authors cited in this dissertation have been duly acknowledged under the section
“Bibliography”. I have also submitted my original research records to the scrutiny committee
for evaluation of my dissertation.
I am fully aware that in case of my non-compliance detected in the future, the Senate of
NIT Rourkela may withdraw the degree awarded to me on the basis of the present
dissertation.
August 17, 2016 Ankit Kumar Pandey
NIT Rourkela
Acknowledgement
My special thanks goes to my helpful and honourable research supervisors Dr. S. S.
Mahapatra, Professor, Department of Mechanical Engineering, National Institute of
Technology, Rourkela for their able and continual guidance.
I owe a great many thanks to a great many people who helped and supported me during
the entire project work. Apart from the efforts of me, the success of any project depends
largely on the encouragement and guidelines of many others. I take this opportunity to
express my gratitude to the people who have been instrumental in the successful completion
of this project.
I express my heartfelt thanks to Prof. R. K. Sahoo, Director, N.I.T, Rourkela for providing
me the facilities to carry out this project.
I express my thanks to Dr. K. P. Maity, Dr. S. C. Mohanty, Dr. B. G. Mishra, Dr.
D.P.Tripathy and Dr. S. Dutta for their advice and constructive suggestion for the
improvement of my work.
My special thanks are also due to Mr. Suman chatteerjee, Mr. Amit kumar Mehar,
Raviteja Buddala and Kamlesh Kumar, Research scholars, Department of Mechanical
Engineering, N.I.T., Rourkela who have helped to very great extent for completion of this
dissertation.
Submitting this thesis would have been an extremely difficult job, without the constant
help, encouragement, support, and suggestions from my friends, especially Mr. Swayam
Bikash Mishra, Mr. Tijo D, Miss Subhasree Sahu, Miss Anweshi Mohapatra and Dr. Bijaya
Bijeta Nayak for their time to help. I would also thank my Institution and my faculty members
without whom this project would have been a distant reality. I also extend my heartfelt thanks
to my family and well-wishers.
My parents deserve special mention for their inseparable support and prayers. They are
the persons who show me the joy of intellectual pursuit ever since I was a child. I thank them
for sincerely bringing up me with care and love. I thank them for being supportive and caring.
Last, but not the least, I thank the one above all of us, the omnipresent God, for giving
me the strength during the course of this research work.
August 17,2016 Ankit Kumar Pandey
NIT Rourkela 614ME1001
Abstract
Friction Stir Welding (FSW) is a solid state welding process that uses a third body (tool) to join two faces of the work pieces. Heat is generated between the tool and work piece material due to friction of the tool shoulder with the work piece surface. This leads to rise in temperature which makes the material soft near the FSW tool. Then, both the work piece materials mechanically intermix at the place of the joint to produce the welding. FSW has been successfully used to join similar as well as dissimilar materials. It has also been effectively used to join materials that are difficult-to-weld materials by conventional fusion welding methods. Fusion welding when used to join dissimilar metals leads to defects like lack of fusion, distortion, crack formation, incomplete penetration and undercut. FSW, being solid state welding process, can successfully eliminate most of the defects which occur due to melting of material during welding. Some of the important parameters in FSW are tool rotation speed, transverse speed, tool pin dimension, tool tilt angle, offset of the tool from weld line and tool pin profile. From literature survey it was observed that these parameters affect the quality of weld. So, the influence of the parameters is needed to be established on the weld quality. In this context, the present work highlights the significance and effect of tool rotation speed, welding speed, tool pin profile and offset of the tool on weld quality. Different destructive and non-destructive tests have been carried out on the weld to get insight into the weld and its properties. Friction stir spot welding (FSSW) is a type of FSW, which is used to create a spot weld. The effect of tool rotation speed, dwell time and tool pin dimension has been investigated on spot welding of different materials. Three types of welding have been done in FSSW: similar metals, dissimilar metals and metal-polymer. Face centred central composite design of response surface methodology has been implemented to design the experimental layout for different experiments. Tensile strength test, bending strength test, visual inspection, radiography test and Vickers hardness test are the major tests that have been implemented on the weld to analyse the weld quality. Analysis of variance has been used to analyse the data, find the significant and non-significant parameters and estimate their effect.
Keywords: Friction stir welding; Friction stir spot welding; Similar metal welding; Dissimilar
metals welding; Metal-polymer welding; Destructive tests; Non-destructive tests.

viii
Contents
Chapter no. Title no. Page no.
Certificate of Examination ii
Supervisors’ Certificate iii
Dedication iv
Declaration of Originality v
Acknowledgment vi
Abstract vii
Contents viii
List of Figures x
List of Tables xii
Chapter 1 Introduction 1
1.1 Background and motivation 2
1.2 Work piece materials 3
1.3 Tool material 5
1.4 Friction Stir welding 6
1.5 Friction stir spot welding 7
1.6 Need for the research 8
1.7 Research objective 10
1.8 Structure of the thesis 10
1.9 Conclusion
11
Chapter 2 Literature review 12
1.10 Introduction 13
1.11 Classification of literature 14
1.12 Critical review 20
1.13 Conclusion
21
Chapter 3 Friction stir welding of similar metals 22
3.1 Introduction 23
3.2 Materials used and Experimental procedure 23

ix
3.3 Results and discussion 29
3.4 Conclusion
45
Chapter 4 Friction stir spot welding of similar metals 46
4.1 Introduction 47
4.2 Materials used and Experimental procedure 47
4.3 Results and discussion 51
4.4 Conclusion
61
Chapter 5 Friction stir spot welding of dissimilar metals 62
5.1 Introduction 62
5.2 Materials used and Experimental procedure 62
5.3 Results and discussion 66
5.4 Conclusion
70
Chapter 6 Friction stir spot welding of metal and polymer 71
5.1 Introduction 72
5.2 Materials used and Experimental procedure 72
5.3 Results and discussion 75
5.4 Conclusion
80
Chapter 7 Conclusion 81
8.1 Contribution of the present work 82
8.2 Scope for Further Research
84
References
85
List of publications 92

x
List of Figures
Figure No.
Caption Page No.
1.1 Schematic diagram of butt joint by FSW process 7
1.2 Schematic diagram of lap joint by FSSW process 8
2.1 Taxonomic framework for friction stir welding 14
2.2 Straight pin profile FSW tool 16 3.1 WEDM machine for cutting 24
3.2 Scanning electron microscopy-Energy Dispersive Spectroscopy Instrument (Model JEOL JSM-6048LV)
25
3.3 SEM-EDS detected element 25
3.4 FSW tools used for the experimentation 26
3.5 CNC milling machine used for the experiment 27
3.6 (a) Weld surface of weld 8 30 3.6 (b) Weld surface of weld 16 30
3.7 (a) Radiography of weld 8 31
3.7 (b) Radiography of weld 16 31
3.8 3.9
Variation of UTS with experimental run Normal plot of the UTS for the developed model
31 32
3.10 Surface plot of tool rotation speed and welding speed 34
3.11 Surface plot of welding speed and offset of the tool 35 3.12 Surface plot of tool rotation speed and tool pin profile 36
3.13 SEM image of fracture surface of weld 16 37
3.14 SEM image of fracture surface of weld 17 37
3.15 Magnified view of area 1 in weld 16 37
3.16 Magnified view of area 2 in weld 16 38
3.17 Magnified view of area 3 in weld 16 38
3.18 (a) View of the surface of weld 8 after flexural test 38
3.18 (b) View of the side of weld 8 after flexural test 38 3.19 (a) View of the surface of weld 28 after flexural test 39
3.19 (b) View of the side of weld 28 after flexural test 39
3.20 3.21
Variation in UFS with experimental run Normal plot of the UFS for the developed model
39 40
3.22 Surface plot of tool rotation speed and welding speed 42
3.23 Surface plot of tool rotation speed and offset of the tool 43
3.24 Surface plot of tool pin profile and offset of the tool 43 3.25 Surface hardness of weld 2, weld 5 and weld 21 44
4.1 Work piece used for experimentation 48
4.2 Tools used for experimentation 48
4.3. Schematic illustration of tool, work piece and back plate 50
4.4 Experimental and predicted temperature with time 51
4.5. (a) Surface image of weld 2 52
4.5. (b) Radiography image of weld 2 52
4.5. (c) Surface image of weld 11 52 4.5. (d) Radiography image of weld 11 52
4.6 Image of weld 19 showing different point at which micro hardness has been calculated
53

xi
4.7 (a) Micro hardness vs. observed points of weld 4 54 4.7 (b) Micro hardness vs. observed points of weld 6 54
4.7 (c) Micro hardness vs. observed points of weld 8 54
4.7 (d) Micro hardness vs. observed points of weld 11 54
4.7 (e) Micro hardness vs. observed points of weld 14 54
4.7 (f) Micro hardness vs. observed points of weld 17 54
4.8 (a) Microscopic images of left side of weld 19 55
4.8 (b) Microscopic images of right side of weld 19 55 4.8 (c) Microscopic images of left side of weld 11 55
4.8 (d) Microscopic images of right side of weld 11 55
4.9 Slice view of workpeice at tool inserted 56
4.10 Total energy with respect to time 57
4.11 4.12
Variation in UTL with experimental run Normal plot of the UTL for the developed model
57 58
4.13 Surface plot tool rotation speed and Dwell time 60
4.14 Surface plot for tool pin diameter and dwell time 61 5.1 Weld generated between dissimilar metals 64
5.2 Tools used for experiment 64
5.3 5.4
Variation in UTL with experimental run Normal plot of the UTL for the developed model
66 67
5.4 surface plot of tool rotation speed and dwell time 69
5.5 Surface plot of tool rotation speed and tool pin profile 70
6.1 Work piece and the weld generated 73 6.2 The tools used for experimentation 73
6.3 6.4
Value of UTL for experimental run Normal plot of the UTL for the developed model
76 76
6.5 Surface plot of tool rotation speed and tool pin length 78
6.6 Cross section of metal polymer weld 79
6.7 Magnified view of area 1 79
6.8 Magnified view of area 2 80

xii
List of Table
Table No.
Caption Page No.
1.1 Properties of aluminium 1060 alloy 3 1.2 Properties of aluminium 6061 alloy 4 1.3 Properties of PMMA 5 1.4 Properties of pure copper 5 1.5 Properties of H-13 tool steel 6 3.1 Material composition of work piece 25 3.2 Levels of parameters 28 3.3 Experimental layout 29 3.4 ANOVA for UTS 33 3.5 ANOVA for UFS 41 4.1 Level of parameters 49 4.2 Experimental layout and UTL of weld 49 4.3 ANOVA for UTL 59 5.1 Parameters level for experiment 65 5.2 Experimental layout for dissimilar metal joint 65 5.3 ANOVA for UTL 68 6.1 Parameters level for experiment 74 6.2 Experimental layout for dissimilar metal joint 75 6.3 ANOVA for UTL 77

1
CHAPTER 1
INTRODUCTION

2
Chapter 1 INTRODUCTION
1.1 Background and motivation
Welding is a permanent joining process that finds application in a varied and extensive manner
in metal working industries. In welding, a permanent joint is produced by the mixing of parent
material with or without application of filler material. There are two types of welding processes.
First is the fusion welding process in which parent materials are heated to molten state and
then materials solidify together. Second, the solid-state welding process in which the parent
materials are not melted but the welding occurs due to high temperature and pressure. Most
of the welding is done with fusion welding process because of its convenience and less critical
fixture requirement. Solid state welding process is carried out at a high pressure for which a
robust fixture is required. Due to less defects present in solid welding processes, it is used in
applications that require high strength.
Ferrous material can be easily welded with fusion welding process but non-ferrous material
like aluminum and copper are difficult to weld through this process due to high thermal
conductivity and low strength. Friction stir welding (FSW) is a revolutionary welding technique
which can used to join these materials (Nandan et al. 2008). Since FSW is a solid state welding
process, melting of material is absent in this process. Due to this, all the defects which occurs
due to melting of material during welding (e.g. porosity) are absent in this weld. It can be used
to join similar material as well as dissimilar materials which have different mechanical and
thermal properties (Plaine et al. 2016). This technique finds wide spread application to join
nonferrous and dissimilar materials. This process is widely utilized in welding of aluminum and
its alloy, copper, ferrous material and even polymers. As many welding processes are available
for welding ferrous material, more emphasis is given to welding of non-ferrous metals and
polymer.
The concept of welding through FSW is very simple. A high strength non-consumable rotating
tool with specially designed pin and shoulder is inserted into the plates to be welded and
transversely moved along the weld line (Nandan et al. 2008). For successful FSW, it is
necessary to have tool yield stress and rigidity higher than that of the work piece. The tool
serves two necessary purposes: a) Mixing of work piece material to create the joint. b) Heating
of the work piece through friction. As localized heating takes place in this process, the material
temperature increases and the material becomes soft. The motion of the tool pin and shoulder

3
mixes the material of the different bodies and produces the weld. The work piece material
moves around the tool pin during welding and is pushed from front to back when tool moves
in transverse motion.
1.2 Work piece materials
For the current study, different materials have been used for the investigation. This includes
metals and polymer. Due to the difficulty faced in welding aluminum and copper by fusion
welding process, emphasis is given in welding these materials and their alloys. The second
most widely used materials in sheet form, after metals, are the polymers. However, no welding
process has been widely accepted for welding metals with polymers. In this study, attempt has
been made to weld these materials together and study the effectiveness of the weld. Given
below are the materials which have been used as the work piece materials.
1.2.1 Aluminum alloy
Aluminum is used in manufacturing and fabrication industries due to its favorable properties.
Aluminum is a light weight metal which has high strength to weight ratio and corrosive
resistance property. It is highly ductile, malleable and machinability. Aluminum is widely used
in ship building, automobile, aerospace and infrastructure industries (Brown et al. 1995; Das
et al. 2007). Aluminum alloy makes a passive oxide layer on the surface when it comes in
contact with oxygen. Hence, it restricts further oxidation of the body. Aluminum 1060 alloy is
one of the most widely used aluminum alloy in the field of civil infrastructure projects. It is widely
used to make doors, windows, partition etc. This alloy, a low temperature and low strength
alloy, is used in applications where the temperature variation is less. It is highly corrosion
resistant and gives a very good material life. It is highly used in civil works and making interior
of houses. Table 1.1 shows some of the important properties of aluminum 1060 alloy. All the
properties of the material have been taken from MatWeb (http://www.matweb.com/)
Table 1.1 Properties of aluminum 1060 alloy
Density 2.7 g/cc
Tensile Strength: Ultimate (UTS) 68.9 MPa
Elastic (Young's, Tensile) Modulus 69 GPa
Poisson‘s Ratio 0.33
Thermal conductivity 234.2 W/m-K
Specific Heat Capacity 900 J/kg-K
Aluminum alloy 6061 is one of the most commonly used aluminum alloy. It has silicon and
magnesium as the major alloying elements. It has good strength and mainly finds its application
in the field of ship building, aerospace and automobile parts manufacturing industries. This
4
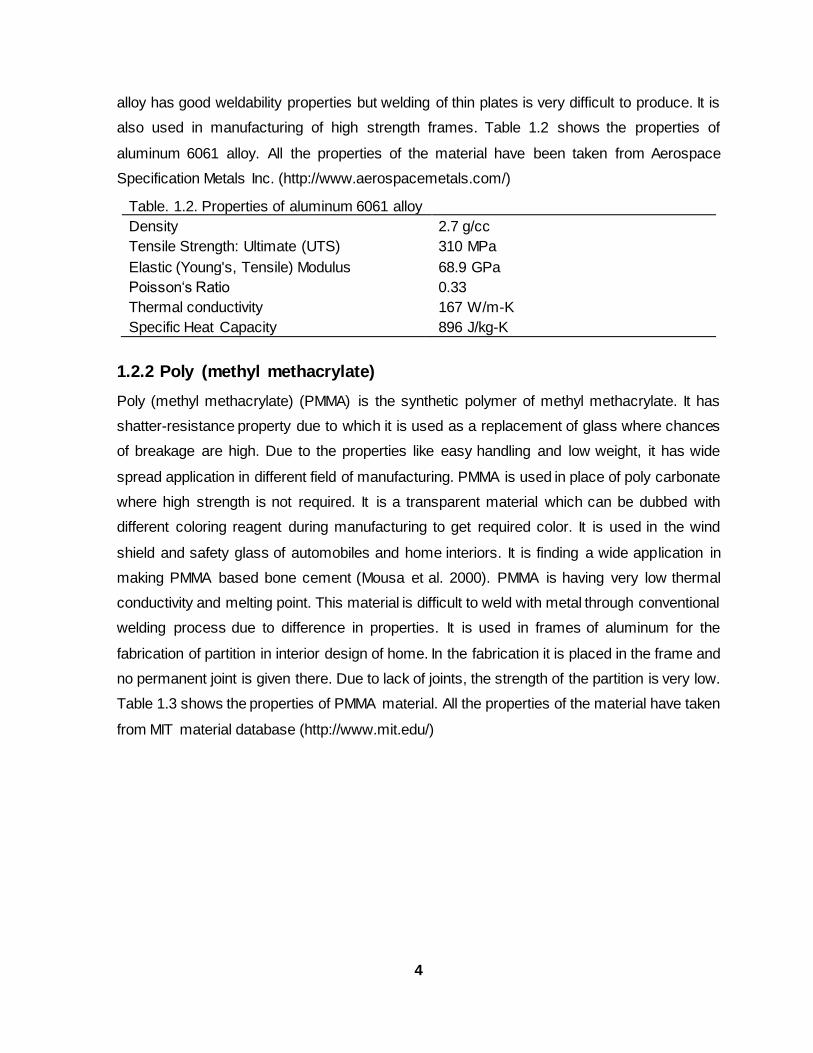
alloy has good weldability properties but welding of thin plates is very difficult to produce. It is
also used in manufacturing of high strength frames. Table 1.2 shows the properties of
aluminum 6061 alloy. All the properties of the material have been taken from Aerospace
Specification Metals Inc. (http://www.aerospacemetals.com/)
Table. 1.2. Properties of aluminum 6061 alloy
Density 2.7 g/cc
Tensile Strength: Ultimate (UTS) 310 MPa
Elastic (Young's, Tensile) Modulus 68.9 GPa
Poisson‘s Ratio 0.33
Thermal conductivity 167 W/m-K
Specific Heat Capacity 896 J/kg-K
1.2.2 Poly (methyl methacrylate)
Poly (methyl methacrylate) (PMMA) is the synthetic polymer of methyl methacrylate. It has
shatter-resistance property due to which it is used as a replacement of glass where chances
of breakage are high. Due to the properties like easy handling and low weight, it has wide
spread application in different field of manufacturing. PMMA is used in place of poly carbonate
where high strength is not required. It is a transparent material which can be dubbed with
different coloring reagent during manufacturing to get required color. It is used in the wind
shield and safety glass of automobiles and home interiors. It is finding a wide application in
making PMMA based bone cement (Mousa et al. 2000). PMMA is having very low thermal
conductivity and melting point. This material is difficult to weld with metal through conventional
welding process due to difference in properties. It is used in frames of aluminum for the
fabrication of partition in interior design of home. In the fabrication it is placed in the frame and
no permanent joint is given there. Due to lack of joints, the strength of the partition is very low.
Table 1.3 shows the properties of PMMA material. All the properties of the material have taken
from MIT material database (http://www.mit.edu/)

5
Table 1.3 Properties of PMMA
Density 1.17 g/cc
Tensile Strength: Ultimate (UTS) 48-76 MPa
Elastic (Young's, Tensile) Modulus 1800-3100 MPa
Poisson‘s Ratio 0.35-0.4 Thermal conductivity 0.167-0.25 W/m.K
Specific Heat Capacity 1466 J/kg-K
1.2.3 Pure copper
Copper is pure element material which has a wide spread utility in different fields due to its
high electrical and thermal conductivity. Copper has vast application in electrical and electronic
industry. But copper has very low weldability and is generally joined through brazing process.
Brazing process produces a weak joint and also a low temperature joint. It is very difficult to
join copper with any other metal due to large variation in properties. FSW being a solid state
welding technique can be used to join copper with other material. In the present study, copper
has been successfully welded with PMMA and aluminum 6061 alloy. Table 1.4 shows the
properties of pure copper. All the properties of the material have been taken from MatWeb
(http://www.matweb.com/)
Table 1.4 Properties of pure copper
Density 8.93 g/cc
Tensile Strength: Ultimate (UTS) 210 MPa
Elastic (Young's, Tensile) Modulus 110 GPa
Poisson‘s Ratio 0.343
Thermal conductivity 398 W/m-K
Specific Heat Capacity 385 J/kg-K
1.3 Tool material
H-13 tool steel has been used as the material for the manufacturing of tools. It is a chromium
molybdenum hot work steel that is widely used for hot and cold tooling application. H-13 tool
steel is used to manufacture tool which are used for high temperature and cyclic heating and
cooling operations. FSW experiences temperature up to 70-80% of the solidus temperature of
the material. The hardness of the H-13 tool is not affected much at this temperature. Heat
treatment processes can be applied on this material to increase its hardness. Table 1.5 shows
some of the properties of H-13 tool steel. All the properties of the material have been taken
from MatWeb (http://www.matweb.com/)

6
Table 1.5 Properties of H 13 tool steel
Density 7.80 g/cc
Tensile Strength: Ultimate (UTS) 1990 MPa
Elastic (Young's, Tensile) Modulus 210 GPa
Poisson‘s Ratio 0.30
Thermal conductivity 24.4 W/m-K
Specific Heat Capacity 460 J/kg-K
1.4 Friction Stir welding
Friction stir welding is a solid state welding process which uses a third body to mix the material
to produce weld. Figure 1.1 shows the schematic diagram of butt weld with FSW. Two work
piece plates are kept in contact with rigid fixture. The tool is inserted into the work piece and
then tool is moved transversely along the weld line. When the tool moves, material is pushed
from front to back and due to mixing the weld is generated. The side in which the tool rotation
direction and welding direction are in same direction that side is known as “advancing side”.
The side in which the tool rotation direction is opposite of the welding direction that side known
as the “retreating side”. Literature suggests that most of the work done on FSW of aluminum
alloy use high strength aluminum alloy as the work piece material (Trueba et al. 2015; Dwivedi
et al. 2014; Peel et al. 2003). However, in this work, an attempt has been made on FSW of 6
mm plate made of low strength aluminum alloy (aluminum 1060). The limitation of FSW
process is that it requires a rigid fixture. The tool generates very high stress in the work piece;
hence there is high chances of distortion and displacement of the work piece (Fratini et al.
2010). A small displacement in work piece can lead to defects like fullering, tunneling and root
gap defects.

7
Figure 1.1 Schematic diagram of butt joint by FSW process
1.5 Friction stir spot welding
Friction stir spot welding (FSSW) is s process in which a spot weld is generated between two
materials. This type of welding is done where less strength is required and the movement
between the given materials is to be restricted. A series of spot weld can lead to a very strong
weld. The basic difference between the FSW and FSSW is that no transverse direction motion
is given to the tool in FSSW. Welding of thin plate is always been more difficult than the welding
of thick plate due to less rigidity and strength of thin plate. The chances of distortion are very
high in thin plate during welding. Due to this, fixture is critical in performing the weld. Figure.1.2
shows the schematic diagram of lap weld with FSSW process.
In FSSW, a very high stress is generated on the work piece. To keep the work pieces in
position, a rigid and robust fixture is to be generated. A high pressure is applied by the fixture
on the work piece to keep the work piece in position. As aluminum and PMMA are having less
strength to volume ratio, it is difficult to weld thin plates. The current challenge is to spot weld
similar metals, dissimilar metals and metal-polymer materials. The design of fixtures has been
critically studied so that the weld is generated proper and without distortion.

8
Figure 1.2 Schematic diagram of lap joint by FSSW process
1.6 Need for the research
Through the extensive literature survey (chapter 2), it has been identified that limited work has
been done in many areas of friction stir welding and friction stir spot welding process. Strength
of the weld is one of the major concerns of any weld produced. It has been observed from
extensive literature review that the weld produced by FSW and FSSW is highly dependent on
the welding parameters. A change in parameters can increase or decrease the quality of the
weld. In order to achieve a good weld, significant parameters need to be identified and their
effect on weld quality must be assessed. Welding of thin sheets is very difficult through
conventional welding process due to high heat input during the welding. FSW and FSSW are
promising technique which can be used to weld sheets of thickness in fraction of millimeter.
Therefore, research needs to be directed in the area of welding of similar as well as dissimilar
thin sheet plates. Metal and polymers show a vast difference in their properties. A permanent
joint of these materials are hard to be produced. These materials are mostly joined by adhesive
bonds. Some attempts have been made in welding of these materials through FSW and FSSW
but rigorous study is required to assess the weld properly.
The following are the research gaps found after extensive literature survey:
Research on FSW of high strength aluminum alloy has been carried out to a large
extent but limited work has been reported on FSW of low strength alloys (Zhang et al.
2013; Peel et al. 2003; Gibson et al. 2014). FSW of low strength alloy is dominantly
found in application like interior design of house.

9
Most of the research on weld strength in FSW focuses on tensile strength of the weld
(Trueba et al. 2015; Dwivedi et al. 2014). Limited studies attempt to present flexural
strength of the material after welding.
Few experimental investigations have been attempted on FSSW of thin aluminum alloy
sheets (Plaine et al. 2015). The studies report large variation in micro hardness at weld
spot. Therefore, extensive investigation is needed to find out reasons for such variation.
Few attempts have been made to investigate the weld created through FSSW of
dissimilar materials (Dong et al. 2016; Fereiduni et al. 2015; Zhang et al. 2014). Welded
joints of aluminum alloy with copper are used in making the integrated parts of electrical
equipment. More research is needed to create good weld while joining dissimilar
metals.
FSSW is a promising technique to create joint between metals and polymers. Very few
attempts have been made in this field due to difficulty in welding of these materials.
Research is needed to emphasize on this field to design a method to weld these
materials and also investigate effect of various process parameters on weld strength.
In the present study, extensive experimentation has been carried out to investigate the effect
of process parameters on weld quality in FSW and FSSW. Face centered central composite
design of response surface methodology has been used to design the experimental layout in
order to obtain maximum process related information with reasonable number of experiments.
All the parameters in each of the experimental set are examined at three levels. A third level
for a continuous factor facilitates investigation of a quadratic relationship between the response
and each of the factors. So three level factor is used in place of two factor. This has been done
in order to conveniently set the parameters on the machine. During experimentation of FSW
of six mm thick plate, effect of tool rotation speed, welding speed, tool pin profile and offset of
the tool on the weld has been investigated. Tensile and flexural strength, surface roughness
and micro hardness of the cross-section of weld in addition to fractured surface are studied to
assess the weld quality.
FSSW has been carried out on similar metals, dissimilar metals and metal-polymer materials.
In all the FSSW experiments, parameters such as tool rotation speed, dwell time and tool pin
diameter/length have been examined. Tensile strength is used to assess the strength of the
weld. Cross-section surface of the weld has been studied to know the flow of material during
spot welding.
1.7 Research objective
10
The objectives of this dissertation rest on of research gap that was identified through extensive
literature survey presented in chapter 2. Literature review suggests that flexural property of the
joint produced by FSW needs to be examined. In addition influence of process parameters on
flexural strength should be assessed. In FSSW, effect of parameters on the weld needs to be
studied and significant parameters are to be identified.
To this end, the objectives for this research work are as follows:
To study effect of FSW parameters on weld quality of similar metals.
To study effect of FSSW parameters on weld quality of similar metals.
To study effect of FSSW parameters on weld quality of dissimilar metals.
To study effect of FSSW parameters on weld quality of metal-polymer joint.
1.8 Structure of the thesis
The dissertation is organized as follows:
Chapter 1: Introduction
The chapter introduces the concept of friction stir welding and friction stir spot welding with
emphasis on application of these processes in diverse fields. The property of the materials
used as work piece and tool has been described with the reason for choosing them. This
chapter also provides the summary of the problem for the present study.
Chapter 2: Literature review
The chapter relates to the review of the works published in the field of study in the last twenty-
five years. This helps in making a background of the work and emphasis on the relevance of
the present study. Only those articles have been reviewed for which full text are available. The
literature review has been classified into three parts: FSW process and innovations, effect of
parameters on the weld and material flow model.
Chapter 3: Friction stir welding of similar metals
The chapter investigates the effect tool rotation speed, welding speed, tool pin profile and
offset of the tool from weld line on the weld quality. Different mechanical and metallographic
tests have been conducted on the joint to get insight into mechanism of weld produced. The
study aims at finding out significance of different parameters and their relationship with weld
generated.
Chapter 4: Friction stir spot welding of similar metals
The chapter aims to investigate the effect of tool rotation speed, dwell time and tool pin
diameter on the weld generated. Through different nondestructive tests, attempt has been
made to explain the mechanism weld produced. A finite element model has been proposed

11
using Deform-3D to study temperature distribution and total energy consumption. The effect
of each parameter on the tensile strength of the weld has been investigated.
Chapter 5: Friction stir spot welding of dissimilar metals
The chapter investigates spot welding on aluminum 6061 alloy with copper. The effect of
parameters has been studied and significant parameters have been identified. The
dependency of weld quality on the parameters is analyzed.
Chapter 6: Friction stir spot welding of metals and polymer
The friction stir spot weld generated between copper and PMMA has been studied in this
chapter. The procedure to weld metal with PMMA has been described. The effect of tool pin
length, tool rotation speed and dwell time has been studied. Microscopic view of the cross-
section of the weld has been investigated to get insight into welding of metal with polymer.
Chapter 7: Conclusion
This chapter presents the brief summary of findings, major contribution to research work and
future scope of the research.
The dissertation enclosed with the references and list of publications.
1.9 Conclusion
The present chapter highlights the necessity of FSW and FSSW in the field of welding. This
chapter shows the limitation of conventional welding process. It suggests use of FSW and
FSSW to overcome the limitations of conventional welding methods. Different work piece
material and tool materials have been described with their major properties. This chapter also
focuses literature gap in the field of study and sets the objectives for the present investigation.
Finally, layout of the thesis has been discussed.

12
CHAPTER 2
LITERATURE REVIEW
13
Chapter 2 LITERATURE REVIEW
2.1 Introduction
Although non-ferrous materials like aluminum and copper has wide spread application in t
industries, these are difficult to weld due to their high thermal conductivity, low strength and
other non-favorable properties. Therefore, welding of these materials is avoided using
conventional welding route. These materials are joined through other joining processes like
riveting or brazing. But these processes are mostly less convenient or have less strength than
the welding. In many applications, joints of dissimilar materials are preferred. Due to high
variation in material properties, conventional welding processes are not suited to produce weld
of dissimilar materials. However, friction stir welding (FSW) is a convenient way of welding
similar as well as dissimilar materials. In this process, the material is heated due to friction to
a high temperature. Due to higher temperature, the fluidity of material increases and the
materials are mixed together mechanically at that state to form the weld. Materials with high
variation in their properties can be welded through this process. This is to be noted that FSW
is environmental friendly as it consumes less energy than other conventional welding
technique and does not produce any harmful gas (Shrivastava et al. 2015). No filler material
or flux is needed during FSW. This technique can be used to join similar and dissimilar material
with equal ease (Murr et al.1998; Li et al. 2000; Li et al. 1999). The benefits of FSW over friction
welding is that lap joints, butt joints, T-butt joints and fillet joints can be made in FSW which
are difficult to make by friction welding (Cary et al. (2002), Dawes et al. 1996). Fratini et al.
(2009) have made a T-joint weld by designing a special fixture to successfully accomplish the
welding.
Thomas et al. (1997) and Clarke et al. (2001) have stated the benefits of FSW over other
welding processes in the field of aerospace, railways, ship building and automotive. Infante et
al. (2016) and Ericsson et al. (2003) have compared the strength of FSW welds and Metal inert
arc welding (MIG)/ tungsten inert arc welding (TIG) welds. MIG and TIG welds show lower
static and dynamic strength than FSW welds. Shrivastava et al. (2015) have found that welding
energy consumption in FSW is less as compared to arc welding process. The current chapter
highlights different works and progress that has been accomplished in th0e field of friction stir
welding and friction stir spot welding process.

14
2.2 Classification of literature
A literature review is essential to know the development in the field of FSW and FSSW. It also
enlightens us with the different pertinent gap that needs more research work. An extensive
literature review has been carried out on current researches going on in this field of study. The
literature on FSW can be broadly divided into three areas: FSW process and innovation,
parametric appraisal of the process and material flow analysis (Figure 2.1).
Figure 2.1 Taxonomic framework for friction stir welding
2.2.1 FSW process and innovations
Friction stir welding (FSW) was invented by Wayne Thomas at “The Welding Institute” (TWI)
in early 1990’s (Thomas et al. 1991). Initially, it was used to join soft materials like aluminum
and its alloys which are difficult to weld through conventional welding processes (Dawes et al.
1995). Extensive research in the field leads to weld wide a variety of materials using FSW
(Plaine et al. 2015; Dorbane et al. 2016; Chen et al. 2015). In this process, a non-consumable
rotating tool is inserted into the work piece and moved along weld line to create the joint. The
material is moved and mixed around the tool pin. During this process, high stress is generated
in the work piece. Therefore, designs of fixtures have been suggested to work at high stress
environment (Fratini et al. 2010). Gibson et al. (2014) have studied the recent trends in the
process, control and application of FSW. Research related to FSW on aluminum and its alloy
sheets mainly focuses on studying three-dimensional heat transfer in the body (Mishra et al.
2005; Song et al. 2003), the material flow pattern in the stir zone (Schmidt et al. 2006; Schmidt
et al. 2004) and effect of parameters on the welding (Rajamanickam et al. 2009).
In FSW process, high temperature and stress are generated in the work piece. Due to this,
there are micro and macro-structural changes in the work piece. The areas in which the
changes take place are known as the weld zone. Frigaard et al. (2001) have observed that

15
weld zone can be divided into several zones with each zone having distinguished properties
depending on the amount of heat or stress generated within the zone. A typical cross-section
of weld zone produced during FSW is divided into heat affected zone (HAZ), thermo-
mechanically affected zone (TMAZ) and nugget zone (NZ) (Mahoney et al. 1998; Rhodes et
al. 1997; Liu et al. 1997). Xu et al. (2013) have shown the microstructural differences are
present in different zones of weld.
Heat affect zone is an area of the work piece that has been affected by high temperature
generated during FSW. Due to the high temperature, there is a change in micro structure of
the material that leads to change in the properties of the work piece materials. Chen et al.
(2003) have observed that the heat affected zone can be treated as a weak zone due to the
heating of the material and change in the grain structure. Zhang et al. (2013) have proposed
an underwater FSW to reduce heat affected zone.
The central region is the nugget zone; this region experiences maximum deformation during
FSW welding. This is the region formed due to the mixing of the material by the tool pin. The
region is observed to have “onion ring” shape and the deposition in this region is charac terized
by the tool pin geometry. Carlone et al. (2015) have reported that grain refinement is achieved
in the nugget zone of FSW.
The region between the nugget zone and heat affected zone is the thermo-mechanically
affected zone (TMAZ). This region is produced by the high temperature and high mechanical
stress generated during FSW process. Nandan et al. (2008) have concluded that this area has
the same microstructure as the base material but in deformed state.
The weld zone created during the FSW process lead to change in mechanical and thermal
properties of that area. Peel et al. (2003) have observed that there is change in hardness of
the material due to change in micro structure during welding. Lin et al. (2014) have concluded
that notch tensile strength and notch strength ratio of joint produced by friction stir welding are
higher than the joints made by TIG welding process. Silva et al. (2013) have investigated the
use of FSW to improve fatigue strength of the weld joints. It has been observed that fatigue
strength of the welded samples made by any welding process but post-treated with FSW can
be enhanced. Mishra et al. (2005) have discussed material flow and microstructure of work
piece material in the FSW to explain mechanism involved in FSW. Nandan et al. (2008) have
reviewed various developments and innovations taken place in the field of friction stir welding
to explain the process from metallurgical aspects. Oliveria et al. (2010) have shown that FSSW
is comparable to any welding technique available to weld PMMA and further investigation is
required to produce a better joint. Bilici et al. (2011) have created weld between high density

16
polyethylene sheets and found that dwell time is the most dominating parameter followed by
the tool rotation speed.
2.2.2 Parametric appraisal of the process
Friction stir welding is a solid-state welding process. This process is conducted on a machine
on which no external heat is supplied to the work piece and there is no melting of the material.
The heat required to soften the material is produced by the friction between work piece and
the tool. The tool mixes the material of different work pieces to create weld. One can change
the value of the parameters to obtain different amount of mixing and heat generation leading
to different weld quality (Nandan et al. 2008; Ma et al. 2008).
2.2.2.1 Tool geometry
FSW tool is a non-consumable body which produces the weld by mixing the work piece
material. In this process, tool geometry is a major influential factor of weld development. Tool
geometry plays a vital role in material flow around the tool. A FSW tool consists of pin, shoulder
and body (Figure 2.2).
Figure 2.2 Straight pin profile FSW tool
From the design point of view, the design of pin and shoulder are critical because heating and
mixing takes place from pin and shoulder area. The movement of the material depends on the
tool pin geometry and can usually be quite complex due to thermo-mechanical processes

17
taking place inside the weld (London et al. 2001). Li et al. (2016) have shown that weld profile
and bonding width of the weld zone differs with the tool profile. Su et al. (2003) have observed
that the interaction between the tool and work piece affects the thermal properties, plastic
deformation and recrystallization of the material. Scalpi et al.(2007) and Thomas et al. (1997)
have studied the effect of pin profiles designed in the shape of frustum. They have observed
that the designed tools are capable of reducing welding force and easy flow of plasticized
materials. Jesus et al. (2014) and Boz et al. (2014) have studied the effect of tool geometrics
on the weld morphology. Trueba et al. (2015) have observed that the shoulder size should be
optimal to get best strength. Between simple cylinder pin tool and threaded pin tool, threaded
pin tool produces good strength in weld (Zhang et al. 2014).
Zhao et al. (2006) have studied different effect of tool pin on weld produced. Simple cylindrical
tool hardly produce effective mixing of the material leading to work holes produced at the
bottom of the weld. Taper threaded tool produces a sound defect-free weld. Schmidt et al.
(2006) and Guerra et al. (2002) have studied effect of various tool pin profile and concluded
that threaded tool produces more heat and improve flow of softer material by exerting a
downward force. Worm hole are produced more when temperature of body is less due to
sluggish movement of the material at low temperature. Buffa et al. (2006) have studied the
effect of pin angle (angle between the pin axis and conical surface) and observed that increase
in the angle leads to more uniform temperature distribution along the vertical direction which
causes to reduce the distortion of work piece.
The rotation and translation motion of the tool pin produces asymmetry in the material flow and
heating across the tool pin. For this problem, TWI has proposed a new kind of tool known as
re-stir. A periodic reversal of tool motion is given in re-stir tool to eliminate most of the defect
originating due to the asymmetry of material flow. Dong et al. (2016) have demonstrated that
refilling type tool may lead to reduction in weld defects when dissimilar materials are welded
by friction stir welding. In order to reduce various weld defects, new type of tools have been
suggested, particularly related to key hole defect (Zhang et al. 2014; Li et al. (2012). Tozaki et
al. (2010) have developed a new kind of tool by replacing the probe with scroll groves which
plays a major role in mixing of material. Zhang et al. (2014) have used a retractable pin tool to
produce weld between two dissimilar materials. Hsieh et al. (2015) have compared assembly
embedded tool with cylindrical tool and observed that assembly embedded tool produces
higher temperature in the work piece.
2.2.2.2 Welding parameters
18
Tool rotation speed, welding speed, offset of the tool from weld line, tool tilt angle and the
vertical pressure are some of the major parameters which can affect the joint produced.
Nandan et al. (2008) have reviewed literature and concluded that the peak temperature
generated during welding increases with the increase in tool rotation speed but decreases with
increase in welding speed. Zhang et al. (2014) have observed that tool rotation speed has
significant influence on tensile strength of welded joints. Dwivedi et al. (2015) have observed
that higher tool rotation speed, lower axial force and higher welding speed produces better
weld strength with fewer defects. Sakthivel et al. (2009) have concluded that better mechanical
properties can be achieved at lower welding speed due to higher heat input to the weld zone.
Xue et al. (2011) have examined dissimilar (Al-Cu) metal joint using FSW process and reported
that a larger pin offset towards Cu in the advancing side leads to a sound defect free joints.
Costa et al. (2015) have concluded that strength of the advancing side monotonically increases
with increase in effective plate thickness. Khodaverdizadeh et al. (2012) have extensively
studied to optimize the shoulder size to improve best strength for various work piece and tool
combinations.
Friction stir spot welding is a part of friction stir welding in which the weld is produced on a spot
and no welding motion is provided. The tool pin is plunged into the work piece to generate
weld. When rotating tool is kept in contact with the work piece, there is movement of material
around the tool. This movement mixes the material and a joint is produced. The duration for
which the tool is kept rotating with work piece is known as dwell time. Sung-ook et al. (2012)
have observed that increase in plunge depth leads to increase in tensile shear load. However,
plunge depth and plunge speed have no remarkable effect on hardness. Sanusi et al. (2015)
have observed that tool rotation speed is most influential parameter that affects mechanical
strength of weld. Plaine et al. (2015) have conducted experiments based on full factorial design
to show that tool rotation speed followed by tool rotation speed × dwell time interaction have
significant effect on tensile strength of welded samples. Shirvan et al. (2016) have studied
FSSW joints of Ti-based bulk metallic glass. It is shown that the tensile/shear strength and
toughness increases with the increase in tool rotation speed and dwell time. Fereiduni et al.
(2015) have observed that low tool rotation speed causes joints with better tensile strength for
same dwell time while welding dissimilar materials. Rodriguez et al. (2015) have observed that
mechanical strength can be enhanced with increase in tool rotation speed while welding
dissimilar materials. Fei et al. (2016) have shown that joints with higher tensile strength is
observed in those welds in which intermetallic compound found in the weld zone to be thin
while welding steel with aluminum alloy. Pashazadeh et al. (2013) have observed that the grain

19
size of material in weld zone is reduced with increase in welding speed. Rodrigues et al. (2009)
have concluded that change in welding parameters leads to variation in micro structure and
material flow path while welding thin sheets and. Aval (2015) has concluded that better weld
quality can be obtained by better mixing of the material through increasing heat input per unit
length. Heat input can be increased by either increasing the rotational speed of the tool or
welding speed. This leads to atomic diffusion to take place at interface of material. Galvao et
al. (2011) have concluded that the weld zones can be created with higher dimension and
homogeneity if higher heat input is provided during welding. Reilly et al. (2015) have observed
that deformation zone increases progressively with dwell time due to increase in heating and
softening of material. Zapata et al. (2016) have used X-ray diffraction to calculate residual
stress and found that higher tool rotation speed leads to less residual stress. Rotational speed
was shown to have more effect than the welding speed on residual stress distribution. Uematsu
et al. (2012) have welded magnesium (Mg) plates and aluminum (Al) plates separately. They
have observed that material flow is less in case of Mg-Mg weld. Weld strength is found to be
more in case of Al-Al weld because of higher proof stress and elastic modulus of Al.
2.2.3 Material flow analysis
In the past, analyses have been made to get insight into the phenomenon occurring at the weld
zone during welding. The analyses leads to prediction on the flow of the material, strain rate,
stress generated, temperature at different areas of weld zone etc. (Cho et al. 2005). Reilly et
al. (2015) have developed a kinematic flow model to predict layer formation of dissimilar alloy
and heat generation in friction stir welding. Numerical modeling methods provide
understanding of the heat generation, mechanical stress generation, material flow etc. in a
quantitative manner. Buffa et al. (2006) have proposed a continuum based finite element model
for FSW. They have shown that strain distribution and material flow exhibit non-symmetrical
pattern but the temperature distribution exhibit symmetric pattern along weld line. Ji et al.
(2012) have used ANSYS Fluent to make a finite volume model of FSW. Ericsson et al. (2003)
have also prepared a model for the softening of material around the FSW weld zone. Different
authors have attempted to calculate the strain rate of the material during the process by
numerical models. Jata and Semiatin (2000) and Masaki et al. (2008) have estimated the strain
rate during welding. Gerlich et al. (2007) have observed that strain rate decreases as the tool
rotation speed increases. Fratini et al. (2009) have investigated numerical instabilities resulting
from the discontinuities present at the edge of two sheets. Mohanty et al. (2012) have
developed a mathematical model which can be successfully applied to predict the behavior of
FSW with different tool geometries.

20
Many attempts have been made by different authors to study the flow pattern of the material
in work piece by studying the weld produced. In FSW, the side of the work piece is known as
advancing side if the direction of rotation of the tool and welding direction. The other side of
the work piece is called as retreating side (Figure 1.1). Beygi et al. (2012) have observed that
materials flow upwards in advancing side and downwards in retreating side when FSW is
performed on Al-Cu bilayer sheet produced by cold rolling process. It is also shown that the
materials flows more from the advancing side to the retreating side (Nandan et al. 2007;
Nandan et al. 2013; Xue et al. 2011; Siedel et al. 2003; Siedel et al. 2001; Donatus et al. 2015).
The finest grain material is found in the region closest to the tool edge in the retreating side
(RS).
2.3 Critical review
From the literature review, it has been observed that many researchers have contributed in the
field of FSW. It can be observed that FSW process is more eco-friendly than other conventional
welding processes. FSW is a solid state welding process that leads to produce welds avoiding
defects caused due to melting of material during welding. This process was invented in early
1990s and was used for welding soft materials. But many innovations have been made over
the years to enhance its capability to produce welding for high strength materials. The
researches have been directed to focus on the weld zone to study the changes that take place
during FSW.
It has been noted by many authors that the quality of the weld is severely affected by the
parameters with which welding is made. Attempts have been made to study the effect of tool
geometry and welding parameters on the quality of weld. Tool rotation speed, welding speed,
tool pin profile, tool tilt angle and offset of the tool are found to be the most influencing
parameters in FSW process. Tensile strength of the weld has been widely studied to know the
strength of the joint crated with different settings of parameters.
During the FSW process, the properties of the materials are changed due to generation of high
temperature and stress. To assess the change in the properties of the weld, the researchers
have directed their attention to study flow pattern of the material during FSW. Due to thermo-
mechanical process involved in FSW, the flow of material follows a quite complex pattern in
the weld zone. Numerous analytical, numerical and experimental models have been proposed
to study the process parameters, tool geometries and material flow in FSW.
2.4 Conclusions

21
From this chapter, various influential parameters and their range that lead to good quality weld
have been identified. Since very high stress is induced in the work piece during FSW, a rigid
fixture is required during the welding in order to minimize welding defects. It is observed that
most of the studies on FSW relates to application of FSW on high strength aluminum alloy.
However, studies on welding of low strength aluminum alloy by FSW are not adequately
addressed in spite of its wide spread applications. Further, most of the research works use
tensile strength of the weld to assess the weld quality. Even flexural strength of the weld can
be studied elaborately in addition to tensile strength. It is found in the literature that limited
works have been done in the field of metal and polymer joining by FSW. The proposal of the
research work has been identified from the literature gap. Effect of process parameters on
weld quality represented by both tensile and flexural strength needs to be studied for welding
of thick sheets. In addition, study is required on parametric appraisal during welding of thin
sheet of aluminum alloy. Since aluminum and copper possess low weldability, FSW may be
used on these materials to study weld quality for production of similar as well as dissimilar
material joints between them. It is prudent to investigate on influence of various process
parameters on quality of weld achieved when metal is joined with polymer.

22
CHAPTER 3
FRICTION STIR
WELDING OF SIMILAR
METALS

23
Chapter 3 FRICTION STIR WELDING OF SIMILAR
METALS
3.1 Introduction
Friction stir welding (FSW) is a solid state welding process which finds a wide spread
application in many fields for welding similar and dissimilar materials. It has advantage that
many nonferrous materials, which cannot be welded by conventional welding processes, can
be welded through this process. FSW can be operated on any specialized machine or vertical
axis milling machine with proper fixture. In this process, a high strength rotating tool is inserted
into the work piece and moved transversely in the welding direction to create the weld. FSW
creates the weld by mixing the material in plastic state. Due to this, weld can be created even
if large difference in material properties exists. In this process, a high stress is generated on
the tool and work piece. Due to this, a robust fixture is required to hold the work piece during
the welding process. The current challenge in this process is assessment of parametric
influence on quality of the weld produced. To meet this challenge attempts has been made to
find significant parameters and their effect on weld. Tensile and flexural strength tests have
been carried out on welds to get knowledge about the strength of the weld. The effect of
parameters on both type of strength have been observed and analyzed. Radiography test and
Vickers hardness test has been done on weld to get insight in to weld.
3.2 Materials used and Experimental procedure
3.2.1 Material of work piece and the tool
In the present study, aluminum 1060 alloy six mm thick sheet has been used as work piece.
Cold rolled sheets of 6 mm thickness were cut to dimension 100 mm × 90 mm × 6 mm. A cold
rolled sheet has grain orientation in a single direction. The work piece was cut for welding in
such a manner that welding direction was perpendicular to the grain orientation. Hence, the
welded samples used for tensile and flexural strength test were having the grain direction of
base material along the axis of the samples.
FSW requires that the work piece should be in contact during welding without any root gap to
produce defect free weld. The surfaces kept in contact during FSW have been cut using Wire
electrical discharge machining (WEDM) to get a flat and smooth surface with no root gap.
24
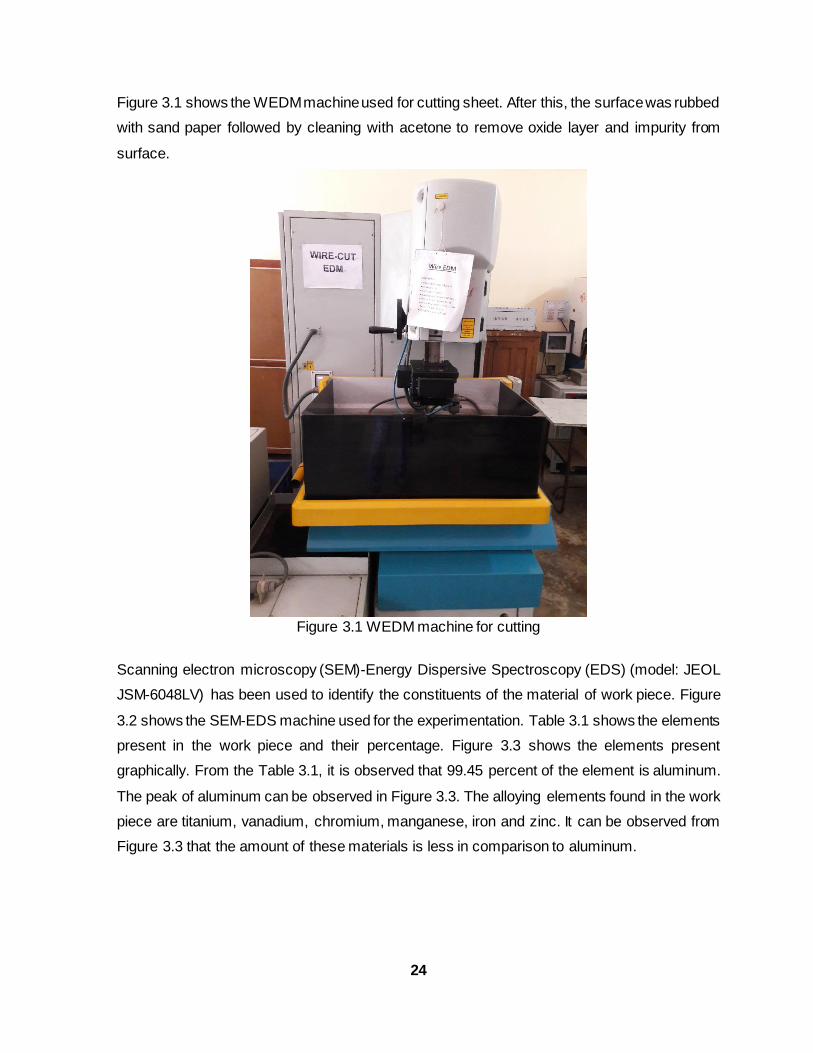
Figure 3.1 shows the WEDM machine used for cutting sheet. After this, the surface was rubbed
with sand paper followed by cleaning with acetone to remove oxide layer and impurity from
surface.
Figure 3.1 WEDM machine for cutting
Scanning electron microscopy (SEM)-Energy Dispersive Spectroscopy (EDS) (model: JEOL
JSM-6048LV) has been used to identify the constituents of the material of work piece. Figure
3.2 shows the SEM-EDS machine used for the experimentation. Table 3.1 shows the elements
present in the work piece and their percentage. Figure 3.3 shows the elements present
graphically. From the Table 3.1, it is observed that 99.45 percent of the element is aluminum.
The peak of aluminum can be observed in Figure 3.3. The alloying elements found in the work
piece are titanium, vanadium, chromium, manganese, iron and zinc. It can be observed from
Figure 3.3 that the amount of these materials is less in comparison to aluminum.

25
Figure 3.2 Scanning electron microscopy-Energy Dispersive Spectroscopy Instrument (Model
JEOL JSM-6048LV)
Table 3.1 Material composition of work piece
Element Aluminum Titanium Vanadium Chromium Manganese Iron Zinc
% 99.45 0.06 0.08 0.18 0.04 0.17 0.02
Figure 3.3 SEM-EDS detected element

26
In FSW process, FSW tool mixes work piece material plastically to create weld. During this
process, high stress is induced in the tool. The tool has been prepared with H-13 tool steel to
get high strength and tool rigidity during welding. After the manufacturing of tool, it was oil
quenched to increase the hardness of the body. Three tools have been used for
experimentation: threaded pin tool, straight pin tool and taper pin tool (Figure 3.4). The
shoulder of each of the tool is 16 mm in diameter. The pin length is kept 5.7 mm for all the
tools. 0.3 mm clearance is given to avoid any interference with the backing sheet during
welding. The straight pin tool is having the pin of diameter 6 mm throughout the length. The
taper tool is made with the head of the pin as 5 mm and bottom as 10 mm. The threaded pin
tool is made having 6 mm nominal diameter. The shoulder of each tool is given similar spiral
groove design to increase the friction with the work piece. Pin of each tool is given a slot on
two sides to enhance the movement of the work piece material around it. The tool was polished
to reduce any unnecessary inference with the work piece.
Figure 3.4 FSW tools used for the experimentation
3.2.2 Experimental procedure
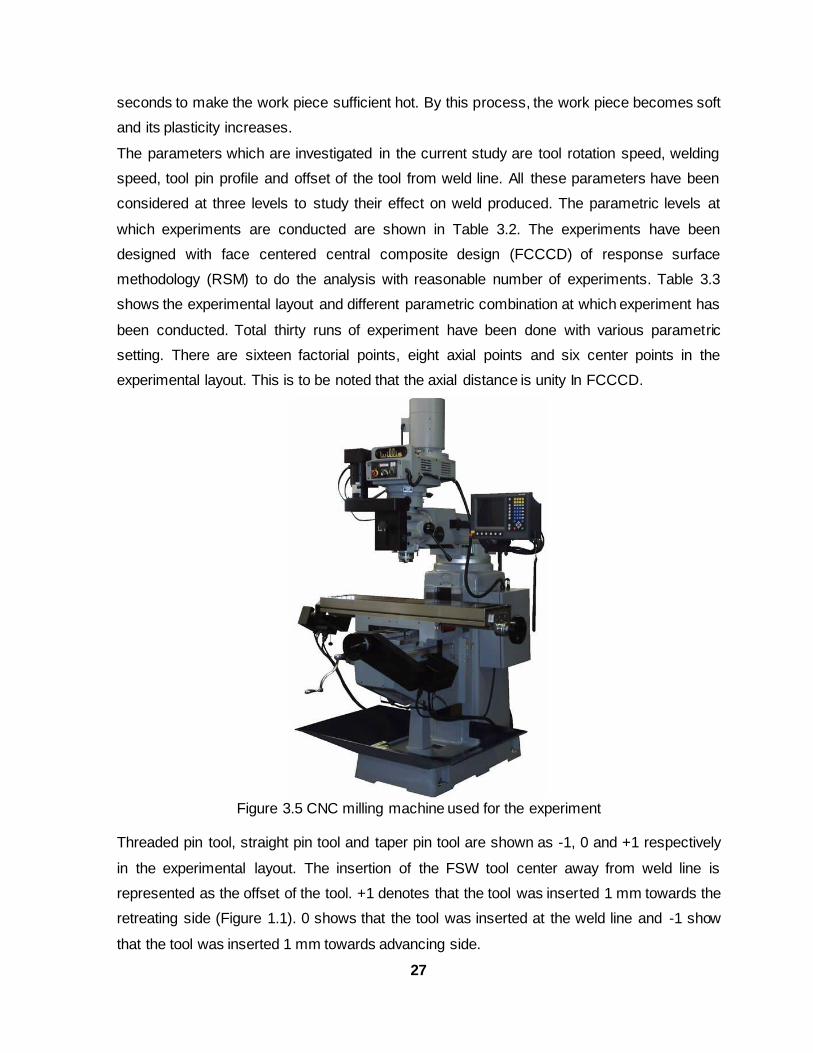
The experiments were conducted on a CNC vertical axis milling machine with suitable fixture.
Figure 3.5 shows CNC milling machine used for the experimentation. The tool was connected
with the spindle of the machine which provides the rotational motion and the downward motion
(Z-axis motion). Work piece was attached to the machine table which provides the transverse
motion (Y-axis motion). The tool was inserted 5.8 mm into the work piece. 0.1 mm interference
was given between tool and work piece to get good friction of tool with work piece during
welding. After insertion of the tool, the tool was kept rotating in contact with work piece for ten
27
seconds to make the work piece sufficient hot. By this process, the work piece becomes soft
and its plasticity increases.
The parameters which are investigated in the current study are tool rotation speed, welding
speed, tool pin profile and offset of the tool from weld line. All these parameters have been
considered at three levels to study their effect on weld produced. The parametric levels at
which experiments are conducted are shown in Table 3.2. The experiments have been
designed with face centered central composite design (FCCCD) of response surface
methodology (RSM) to do the analysis with reasonable number of experiments. Table 3.3
shows the experimental layout and different parametric combination at which experiment has
been conducted. Total thirty runs of experiment have been done with various parametric
setting. There are sixteen factorial points, eight axial points and six center points in the
experimental layout. This is to be noted that the axial distance is unity In FCCCD.
Figure 3.5 CNC milling machine used for the experiment
Threaded pin tool, straight pin tool and taper pin tool are shown as -1, 0 and +1 respectively
in the experimental layout. The insertion of the FSW tool center away from weld line is
represented as the offset of the tool. +1 denotes that the tool was inserted 1 mm towards the
retreating side (Figure 1.1). 0 shows that the tool was inserted at the weld line and -1 show
that the tool was inserted 1 mm towards advancing side.

28
Table 3.2 Levels of parameters
Coded value
Level 1 -1
Level 2 0
Level 3 1
Tool rotation speed (RPM) 700 1000 1300
Welding speed (mm/s) 16 32 48
Tool pin profile Threaded pin Straight pin Taper pin
Offset (mm) -1 0 1
After completion of weld, visual inspection of weld sample has been done to identify any defect
present on the surface. Surface roughness of the joint was measured. Radiography test has
been performed on welds to study the material distribution and any defect present inside weld
produced. Weld samples so obtained were cut perpendicular to the welding direction. From
each weld specimen, three samples parts were cut for tensile test, flexural test and
metallographic examination of weld. The tensile test and flexural test are performed according
to ASTM E8M-04 standards and E290-14 standards respectively. All sharp edges were round
off to remove any stress concentration.
The tensile test and flexural test has been performed with the cross head movement speed of
0.5 mm/s. Design expert software has been used to analyze the significance of different
parameters. After the completion of the tensile test, the surface morphology of fractured
sample was studied by SEM. The sample undergoing metallographic examination was
polished as per standard metallurgical polishing process. Vickers hardness test was conducted
on the weld area. Hardness has been calculated at 25 points at a difference of 1 mm including
the weld center and 12 points on each side of weld center.

29
Table 3.3 Experimental layout
Experimental run
Tool rotation speed
(A)
Welding speed
(B)
Tool pin
profile (C)
Offset (D)
Ultimate tensile strength (UTS) in
MPa
Ultimate flexural strength (UFS) in
MPa
1 -1 -1 -1 -1 73 219
2 +1 -1 -1 -1 85 208
3 -1 +1 -1 -1 83 236
4 +1 +1 -1 -1 96 202
5 -1 -1 +1 -1 78 216
6 +1 -1 +1 -1 76 188
7 -1 +1 +1 -1 68 217
8 +1 +1 +1 -1 86 178
9 -1 -1 -1 +1 91 200
10 +1 -1 -1 +1 99 226
11 -1 +1 -1 +1 82 205
12 +1 +1 -1 +1 96 202
13 -1 -1 +1 +1 84 200
14 +1 -1 +1 +1 83 210
15 -1 +1 +1 +1 69 199
16 +1 +1 +1 +1 80 204
17 -1 0 0 0 69 226
18 +1 0 0 0 78 205
19 0 -1 0 0 70 201
20 0 +1 0 0 75 206
21 0 0 -1 0 80 201
22 0 0 +1 0 71 188
23 0 0 0 -1 71 163
24 0 0 0 +1 65 157
25 0 0 0 0 72 192
26 0 0 0 0 70 185
27 0 0 0 0 71 195
28 0 0 0 0 66 186
29 0 0 0 0 72 189
30 0 0 0 0 74 189
3.3 Results and discussion
3.3.1 Visual inspection
Figure 3.6 (a and b) shows the surface of welds 8 and 16 respectively (Welding done with the
parametric setting of experimental run N, as specified in Table 3.3, is represented as weld N).

30
From the inspection, it was observed that the sheets have been successfully welded. No
surface crack was found on any of the surface of the weld. Surface roughness of the weld area
was found in range from 1.0 to 3.2 microns. Analysis of variance (ANOVA) indicates no
significant dependence of the roughness with welding parameters. The roughness was least
at the start of the weld and gradually increases towards the weld direction. All the blurs were
formed on the retreating side of the weld whereas advancing side was blur free. The blur was
mostly generated after a small travel of the tool. At the end of weld-travel, a hole was left as
observed in Figure 3.6. This is the area from where pin was retreated out. The weld generated
was of the same thickness as the base sheet. It is observed that defects like porosity and
unfilled crater were absent.
(a)
(b)
Figure 3.6 Weld surface of a) weld 8 b) weld 16
3.3.2 Radiography test
Radiography test is a non-destructive test used to get insight into the welded joint without
destroying the part. This is widely used to detect any internal cracks and study the distribution
of the material in the object. Figures 3.7a and b show the radiography test of weld 8 and 16
respectively. From the test, it is observed that the material concentration is least in the path in
which the tool pin passes along the weld line (nugget zone). This area is shown as 1 in the
Figure 3.7 (a and b). In radiography test, the area which has dark shade is the area which has
least material concentration. The area beside the dark area is area 2 (Thermo-mechanically
affected zone). This area is the brightest of the other areas. This shows that it has more
material concentration than other areas of the sheet. The material which has been pushed
from the area 1 is accumulated in area 2; therefore material concentration increases in area 2.
Area 2 is known as the thermos-mechanically affected zone. This area is affected due to the
high heat generation and also from high mechanical stress generated during mixing of material
by the tool shoulder.

31
(a)
(b)
Figure 3.7 Radiography of a) weld 8 b) weld 16
3.3.3 Tensile test
Table 3.3 shows the UTS of the welds at different experimental runs. Highest UTS obtained is
99 MPa for the weld 10 with the strain percentage at peak 4.776. The lowest UTS is 65 MPa
for the weld 24 with strain percentage at peak 0.8862. Figure 3.8 shows UTS of welds with
respect to experimental run. A high variation in the UTS is observed from the graph. This shows
that the weld strength is largely dependent on the welding parameters. A further investigation
of the effect of the parameters has been done through analysis of variance (ANOVA).
Figure 3.8 Variation of UTS with experimental run
Table 3.4 shows the ANOVA table to study parametric effect on UTS. The coefficient of
determination (R2) for the analysis is found to be 93.62%. A regression equation has been
generated in coded form as given in Eq. 3.1. The diagnostic check has been done to check
the adequacy of the developed model. The normality curve for the diagnostic check has been

32
shown in figure 3.9. The results show that the points are normally distributed in the curve.
These result validates the proposed model.
Figure 3.9 Normal plot of the UTS for the developed model
UTS = 69.9919 + 4.4449 × A - 0.2129 × B - 0.8870 × C + 1.8847 × D + 2.4573 × A × B - 1.3687
× A × C - 0.6166 × A × D - 1.7135 × B × C - 3.2302 × B × D - 1.4833 × C × D + 4.2564 × A2 +
3.2855 × B2 + 0.3772 × C2 - 0.8603 × D2 (3.1)
From the analysis, it can be observed that maximum tensile strength of 99 MPa is generated
with parametric setting of 1300 RPM of tool rotation speed, 48 mm/s of welding speed,
threaded pin tool and 0.28 mm of offset towards the advancing side. It can be observed that
different parameters are having different level of significance on UTS. Tool rotation speed and
tool pin profile are the most significant parameters followed by the offset of the tool from weld
line. Welding speed has no significant effect on the UTS in the range from 16 mm/s - 48 mm/s.
The interaction between the welding speed and offset of the tool from weld line is the most
significant interaction. Second significant interaction is found between the tool rotation speed
and welding speed. Hence, it can be concluded that welding speed itself is not a significant
parameter but has a high interaction with other parameters.

33
Table 3.4 ANOVA for UTS
Source Sum of Squares df
Mean Square F-Value
p-value Prob > F
Model 2259.49 14.00 161.39 13.48 < 0.0001 significant
A-Tool Rotation Speed
355.63 1.00 355.63 29.71 < 0.0001
B-Welding Speed 0.82 1.00 0.82 0.07 0.7975
C-Tool Pin Profile 429.89 1.00 429.89 35.91 < 0.0001 D-Offset of the Tool from weld line
63.94 1.00 63.94 5.34 0.0355
A×B 96.61 1.00 96.61 8.07 0.0124
A×C 29.98 1.00 29.98 2.50 0.1344
A×D 6.08 1.00 6.08 0.51 0.4868
B×C 46.98 1.00 46.98 3.92 0.0662
B×D 166.95 1.00 166.95 13.95 0.0020
C×D 35.20 1.00 35.20 2.94 0.1070
A2 46.94 1.00 46.94 3.92 0.0663
B2 27.97 1.00 27.97 2.34 0.1472
C2 105.37 1.00 105.37 8.80 0.0096
D2 1.92 1.00 1.92 0.16 0.6946
Residual 179.57 15.00 11.97
Lack of Fit 144.43 10.00 14.44 2.05 0.2208 not significant
Pure Error 35.15 5.00 7.03 < 0.0001
Cor Total 2439.06 29.00 < 0.0001
Figure 3.10 shows a surface plot of the effects of tool rotation speed and welding speed on the
UTS of the joint. It shows that an increase in tool rotation speed the UTS increases keeping
other parameter constant. As the tool rotation speed increases, the relative motion between
the tool and work pieces enhances breakage of bonds and causes more friction between the
bodies leading to more heat generation in the work piece (Nandan et al. 2008). This softens
the material of the work piece near the tool. At higher tool rotation speed, better mixing of the
material takes place. Hence, higher tool rotation speed produces weld with more UTS. It is
observed that increase of UTS with tool rotation speed is more pronounced at higher welding
speed.
At lower tool rotation speed, increase in welding speed leads to decrease in UTS but at higher
tool rotation speed it leads to increase in welding strength. This is because the tool advances
in the work piece before proper mixing of the material at low tool rotation speed and high
welding speed. Since the mixing of the material does not occur properly, the strength of the
joint is low. At high tool rotation speed, the mixing of the material can take place even in small

34
duration of time. Therefore, mixing of the material and good welding strength can be achieved
even if the welding speed is high.
Figure 3.10 Surface plot of tool rotation speed and welding speed
Figure 3.11 shows the surface plot for the effect of welding speed and offset of the tool on
UTS. At low welding speed with offset of 1 mm towards the retreating side, the UTS obtained
is higher than the UTS obtained with offset towards the advancing side. When offset is towards
the retreating side, more material is pushed from the retreating side. This material mixes with
the material of advancing side to create the joint. When offset is towards the advancing side,
more material is pushed from the advancing side. This material is deposited layer by layer at
the back of the tool as tool advances. At low welding speed with offset in retreating side, good
mixing of material takes place and produces joint having more strength than the joint produced
due to deposition when the offset is in the advancing side.
At high welding speed with offset of 1 mm towards the advancing side, the UTS obtained is
higher than the UTS obtained with offset towards the retreating side. At high welding speed
with tool towards the advancing side, fine deposition of material takes place. Therefore, the
joint produced with fine deposition is having more strength than the joint produced with mixing
when the offset is in the retreating side.
Design-Expert® Software
Factor Coding: Actual
UTS (MPa)
Design points above predicted value
Design points below predicted value
98.9083
65.2833
X1 = A: Tool Rotation Speed
X2 = B: Welding Speed
Actual Factors
C: Tool Pin Profile = 0.00
D: Offset of the Tool = 0.00
16.00
24.00
32.00
40.00
48.00
700.00
775.00
850.00
925.00
1000.00
1075.00
1150.00
1225.00
1300.00
60
70
80
90
100
UTS
(M
Pa)
A: Tool Rotation SpeedB: Welding Speed

35
Figure 3.11 Surface plot of welding speed and offset of the tool
Figure 3.12 shows surface plot for the effect of tool rotation speed and tool pin profile on UTS.
The threaded pin tool (coded as -1) produces the weld with highest strength whereas straight
pin tool (coded as 0) produces joint with lowest strength. Due to the thread on the surface of
threaded pin tool, work piece material flow is better around the tool. This enhances the UTS of
the weld produced by the threaded pin profile. The taper pin tool produces weld with moderate
UTS. While conducting experiment, least vibration in the machine was experienced while
welding with taper tool. The insertion of the tool in to work piece and movement of the tool in
work piece was smoother than with other pin tools. It is better to use taper pin tool for welding
purpose if the machine’s rigidity is low. However, manufacturing of straight pin tool is easy and
should only be used to produce weld were few welds are to be made or high weld tensile
strength is not desired.
Design-Expert® Software
Factor Coding: Actual
UTS (MPa)
Design points above predicted value
Design points below predicted value
98.9083
65.2833
X1 = B: Welding Speed
X2 = D: Offset of the Tool
Actual Factors
A: Tool Rotation Speed = 1000.00
C: Tool Pin Profile = 0.00
-1.00
-0.50
0.00
0.50
1.00
16.00
24.00
32.00
40.00
48.00
60
70
80
90
100
UTS
(M
Pa)
B: Welding Speed
D: Offset of the Tool

36
Figure 3.12 Surface plot of tool rotation speed and tool pin profile
3.3.4 Surface morphology of fractured sample
The fractured surface of the welds 16 and 17 are shown in the Figure 3.13 and Figure 3.14
respectively. The images show that three distinguished areas are formed on the fractured
surface during the tensile test: area 1, area 2 and area 3. Area 1 is the upper part of weld, area
2 is middle part and area 3 is the bottom part. During experimentation, it was observed that
the crack was initially produced in the bottom part of the weld and propagated towards the
upper area resulting in fracture of the specimen.
Design-Expert® Software
Factor Coding: Actual
UTS (MPa)
Design points above predicted value
Design points below predicted value
98.9083
65.2833
X1 = A: Tool Rotation Speed
X2 = C: Tool Pin Profile
Actual Factors
B: Welding Speed = 32.00
D: Offset of the Tool = 0.00
-1.00
-0.50
0.00
0.50
1.00700.00
775.00
850.00
925.00
1000.00
1075.00
1150.00
1225.00
1300.00
60
70
80
90
100
UTS
(M
Pa)
A: Tool Rotation Speed
C: Tool Pin Profile

37
Figure 3.13 SEM image of fracture surface of
weld 16
Figure 3.14 SEM image of fracture surface
of weld 17
Figure 3.15 shows the magnified image of area 1 in weld 16. It is observed that very fine dimple
formations are present in this area. Fine dimple formation shows that this area is ductile in
nature (Tan et al. 2013). The shoulder of the tool comes in contact with these regions of the
work piece. Heat is generated in this area and conducts towards the downward side. Therefore,
material gets the highest temperature and hence highest fluidity in this region. Mixing of
material in this region happens to be good because mixing occurs due to both pin and shoulder
of the tool. Due to the better mixing of the material, high ductility is observed in this region.
Figure 3.15 Magnified view of area 1 in weld 16
Figure 3.16 shows magnified image of area 2 in weld 16. It is observed that dimples present
in this region are bigger in size than the dimples in the area 1. The ductility of this area has
been observed to be less as compared to upper area but more than the area 3. High
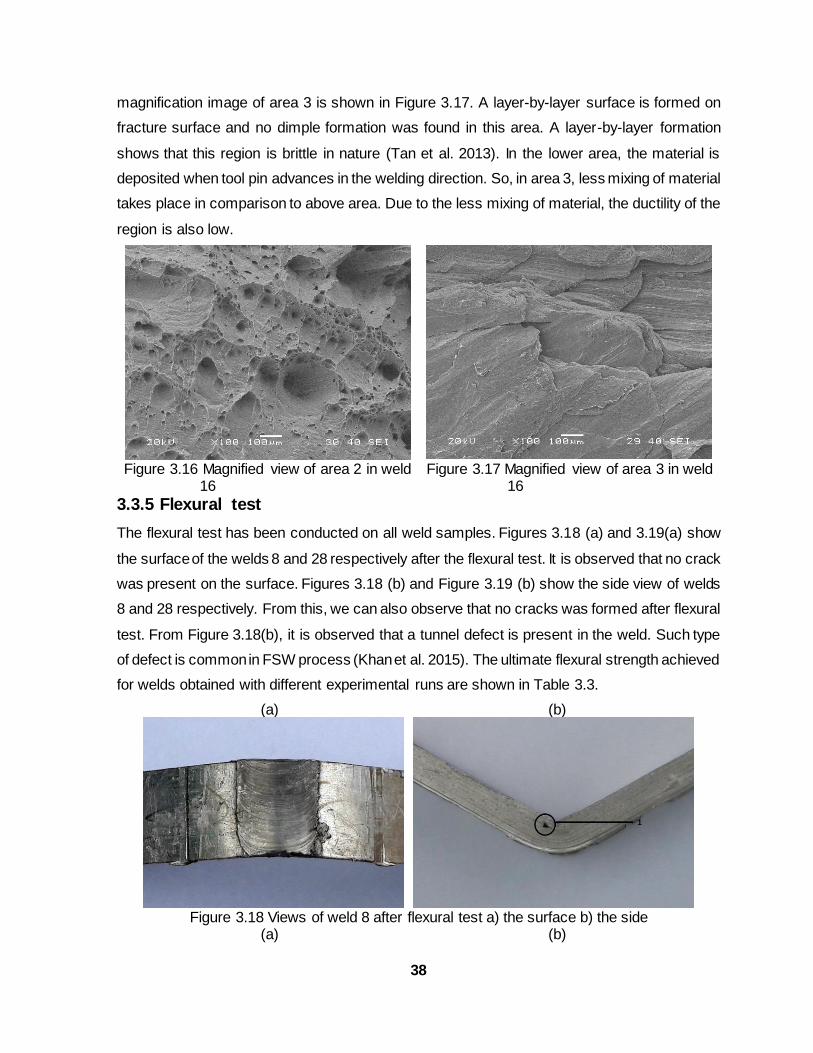
38
magnification image of area 3 is shown in Figure 3.17. A layer-by-layer surface is formed on
fracture surface and no dimple formation was found in this area. A layer-by-layer formation
shows that this region is brittle in nature (Tan et al. 2013). In the lower area, the material is
deposited when tool pin advances in the welding direction. So, in area 3, less mixing of material
takes place in comparison to above area. Due to the less mixing of material, the ductility of the
region is also low.
Figure 3.16 Magnified view of area 2 in weld
16
Figure 3.17 Magnified view of area 3 in weld
16
3.3.5 Flexural test
The flexural test has been conducted on all weld samples. Figures 3.18 (a) and 3.19(a) show
the surface of the welds 8 and 28 respectively after the flexural test. It is observed that no crack
was present on the surface. Figures 3.18 (b) and Figure 3.19 (b) show the side view of welds
8 and 28 respectively. From this, we can also observe that no cracks was formed after flexural
test. From Figure 3.18(b), it is observed that a tunnel defect is present in the weld. Such type
of defect is common in FSW process (Khan et al. 2015). The ultimate flexural strength achieved
for welds obtained with different experimental runs are shown in Table 3.3.
(a) (b)
Figure 3.18 Views of weld 8 after flexural test a) the surface b) the side
(a) (b)

39
b Figure 3.19 Views of weld 28 after flexural test a) the surface b) the side
Figure 3.20 shows the UFS of different welds with different experimental run. The minimum
UFS obtained is 158 MPa for weld 24 and maximum 236 MPa for weld 3. This shows that there
is variation in UFS with a change in parameters. Further investigation on the effect of the
parameters has been done with ANOVA analysis.
Figure 3.20 Variation in UFS with experimental run
Table 3.5 shows the ANOVA analysis for UFS. The coefficient of determination (R2) for this
analysis is found to be 96.16%. The adequacy of the developed model has been checked
through diagnostic check. The normality curve for the diagnostic check has been shown in
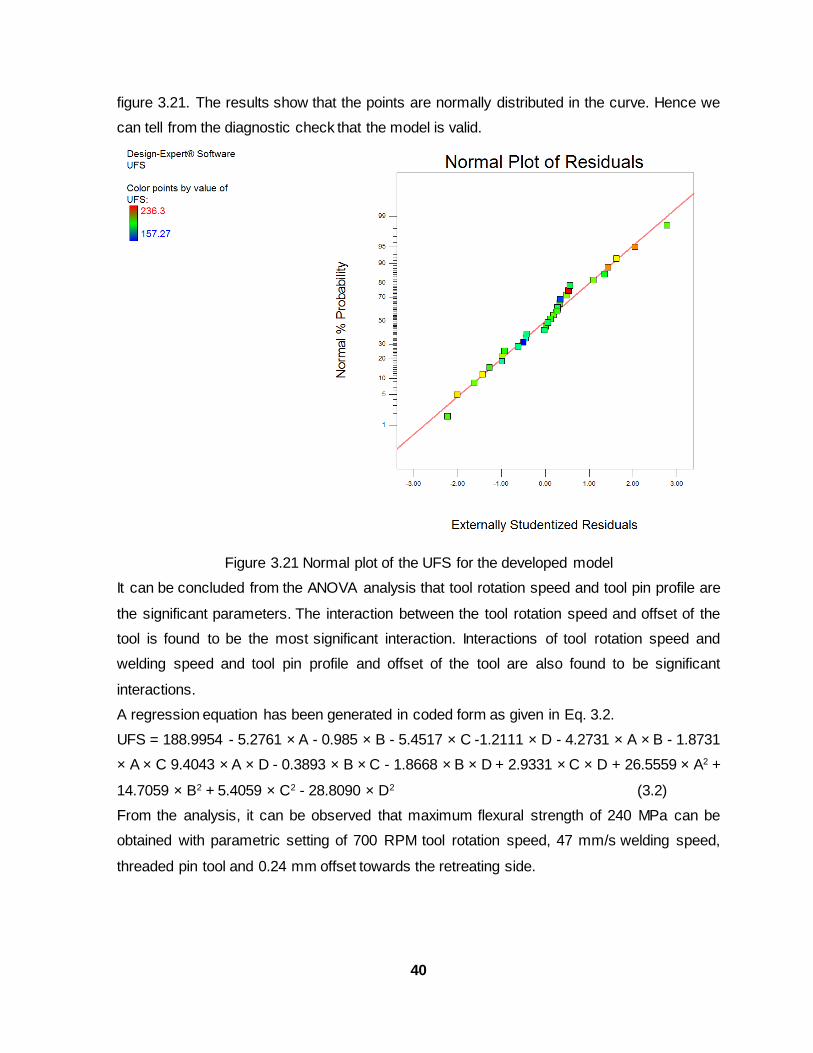
40
figure 3.21. The results show that the points are normally distributed in the curve. Hence we
can tell from the diagnostic check that the model is valid.
Figure 3.21 Normal plot of the UFS for the developed model
It can be concluded from the ANOVA analysis that tool rotation speed and tool pin profile are
the significant parameters. The interaction between the tool rotation speed and offset of the
tool is found to be the most significant interaction. Interactions of tool rotation speed and
welding speed and tool pin profile and offset of the tool are also found to be significant
interactions.
A regression equation has been generated in coded form as given in Eq. 3.2.
UFS = 188.9954 - 5.2761 × A - 0.985 × B - 5.4517 × C -1.2111 × D - 4.2731 × A × B - 1.8731
× A × C 9.4043 × A × D - 0.3893 × B × C - 1.8668 × B × D + 2.9331 × C × D + 26.5559 × A2 +
14.7059 × B2 + 5.4059 × C2 - 28.8090 × D2 (3.2)
From the analysis, it can be observed that maximum flexural strength of 240 MPa can be
obtained with parametric setting of 700 RPM tool rotation speed, 47 mm/s welding speed,
threaded pin tool and 0.24 mm offset towards the retreating side.

41
Table 3.5 ANOVA for UFS
Source Sum of Squares df
Mean Square
F Value
p-value Prob > F
Model 8258.94 14 589.92 26.8 < 0.0001 significant
A-Tool Rotation Speed 501.07 1 501.07 22.77 0.0002
B-Welding Speed 17.46 1 17.46 0.79 0.3871
C-Tool Pin Profile 534.97 1 534.97 24.31 0.0002
D-Offset of the Tool 26.4 1 26.4 1.2 0.2907
A×B 292.15 1 292.15 13.27 0.0024
A×C 56.14 1 56.14 2.55 0.1311
A×D 1415.08 1 1415.08 64.29 < 0.0001
B×C 2.43 1 2.43 0.11 0.7445
B×D 55.76 1 55.76 2.53 0.1323
C×D 137.65 1 137.65 6.25 0.0245
A2 1827.16 1 1827.16 83.02 < 0.0001
B2 560.32 1 560.32 25.46 0.0001
C2 75.72 1 75.72 3.44 0.0834
D2 2150.35 1 2150.35 97.7 < 0.0001
Residual 330.14 15 22.01
Lack of Fit 261.74 10 26.17 1.91 0.2456 not significant
Pure Error 68.4 5 13.68
Cor Total 8589.08 29
Figure 3.22 shows the surface plot for effect of tool rotation speed and welding speed on UFS.
With increase of tool rotation speed, initially UFS decreases and then increases. Increase in
the tool rotation speed causes increase in turbulence of the material flow. Due to turbulence,
there is irregular deposition of the material in the weld zone. This irregular deposition leads to
decrease in UFS of the weld. Hence, UFS decreases with increase in tool rotation speed.
However, further increase in the tool rotation speed, tool is capable of mixing of work piece
material in a better manner. The lattice distortion and intra granular dislocation density also
increases with increase in tool rotation speed (Xu et al. 2009). So, more number of nucleation
is produced during recrystallization that leads to large number of small grains. Finer grains
formation and better mixing of material increases UFS of weld. After a critical speed, this
phenomenon gives more strength than the strength reduced due improper deposition by
turbulence. Therefore, UFS increases with increase in tool rotation speed after a critical tool
rotation speed the.

42
Figure 3.22 Surface plot of tool rotation speed and welding speed
Figure 3.23 shows the surface plot for effect of tool rotation speed and offset of the tool from
weld line on UFS of the joint. Zero offset of the tool gives highest strength which means that
the joint produced with tool inserting at the weld line produces highest strength joints. When
tool is inserted at the center, equal deposition takes place both in advancing and retreating
side. Due to this, the flexural strength is more as no weak area is available for the bend to take
place with less stress. The effect of offset of the tool is more pronounced at higher tool rotation
speed than at lower tool rotation speed.
Figure 3.24 shows surface plot for effect of tool pin profile and offset of the tool from weld line
on UFS of joint. Threaded pin tool produces weld with highest UFS. Threaded pin profile mixes
the material better due to the threads present on the pin. The threaded pin provides more
surface area and path for the flow of material. Due to this, the weld produced is having finer
mixing in comparison to weld produced with other pin type tools. In straight pin tool, flow of
material is mainly due to the material pushed during the motion of the tool. So the mixing of
the material of different sheets is not as good as in the case of threaded pin tool. Hence, the
strength of the joint created with straight pin tool is less.
Design-Expert® Software
Factor Coding: Actual
UFS (MPa)
Design points above predicted value
Design points below predicted value
236.3
157.27
X1 = A: Tool Rotation Speed
X2 = B: Welding Speed
Actual Factors
C: Tool Pin Profile = 0.00
D: Offset of the Tool = 0.00
16.00
24.00
32.00
40.00
48.00
700.00
775.00
850.00
925.00
1000.00
1075.00
1150.00
1225.00
1300.00
140
160
180
200
220
240
UFS
(M
Pa)
A: Tool Rotation Speed
B: Welding Speed

43
Figure 3.23 Surface plot of tool rotation speed and offset of the tool
Figure 3.24 Surface plot of tool pin profile and offset of the tool
Design-Expert® Software
Factor Coding: Actual
UFS (MPa)
Design points above predicted value
Design points below predicted value
236.3
157.27
X1 = C: Tool Pin Profile
X2 = D: Offset of the Tool
Actual Factors
A: Tool Rotation Speed = 1000.00
B: Welding Speed = 32.00
-1.00
-0.50
0.00
0.50
1.00
-1.00
-0.50
0.00
0.50
1.00
140
160
180
200
220
240
UFS
(M
Pa)
C: Tool Pin Profile
D: Offset of the Tool

44
3.3.6 Surface hardness
Vickers hardness has been measured at the cross section area of the weld. Figure 3.25 shows
the Vickers hardness of welds 2, 5 and 21. Vickers hardness of the base sheet was calculated
at six points and the mean was found to be 45.3 HV. It has been observed that Vickers
hardness of all the point in the weld is below the hardness of the base sheet. Zero in x-axis
shows the center of the weld. The negative value in x-axis shows the distance of the point in
millimeter on the advancing side and positive value shows the distance towards the retreating
side. It is observed that in the weld zone the center part (nugget zone) has the lowest micro
hardness. As material is pushed from the nugget zone towards the thermo mechanically
affected zone during the tool travel the material concentration is reduced in this area. Due to
this the micro hardness of this area is less. In the thermo-mechanically affected zone the
hardness is more. Due to more material concentration this area shows a higher micro harness.
The tool shoulder was taken of 16 mm. So it can be concluded that after 8 mm in both side
heat affected zone is present. It is observed that after 8 mm there is reduction in micro
hardness. As high temperature obtained during FSW the grain orientation is affected in this
area. Due to this the material in this area becomes soft and shows less micro hardness.
Figure 3.25 Surface hardness of weld 2, weld 5 and weld 21
3.4 Conclusions

45
Aluminum alloy 1060 six mm sheets have been successfully welded using FSW. The main
conclusions drawn from the present study is summarized as follows.
Tool rotation speed is the most significant parameter which affects the weld. The tensile
strength increases with the increase in tool rotation speed. Higher heat generation and
better mixing of the material enhances the tensile strength of the material.
Threaded pin tool is observed to produce weld having more UTS and UFS than weld
produced with straight pin tool and taper pin tool. The threads present in the pin helps in
proper movement and mixing of the work piece material.
From the radiography test, it has been observed that least material concentration is
observed in the nugget zone after the welding process. The area adjacent to nugget zone
(thermo-mechanically affected zone) is found to have highest concentration of material.
From surface morphology of fractured surface, it can be concluded that the ductility of the
weld is highest at the upper surface of the weld and decreases towards the bottom of the
weld.
The Vickers hardness test shows that the welding zone has less hardness in comparison
to the base material. The weld center has the least hardness followed by heat affected
zone. The hardness was found more towards the advancing side than in the retreating
side.

46
CHAPTER 4
FRICTION STIR SPOT
WELDING OF SIMILAR
METALS

47
Chapter 4 FRICTION STIR SPOT WELDING OF
SIMILAR METALS 4.1 Introduction
The present study investigates friction stir spot welding (FSSW) of one mm sheet of aluminum
6061 alloy. FSSW is a friction stir welding process in which the weld is generated in a certain
area without giving the transverse motion. This produces a weld on an area and the weld size
depends on the size of the pin and the shoulder of the tool. In FSSW lap welding process, two
sheets are placed one above other as shown in Figure 1.2. The tool is inserted and retreated
after some dwell time to get the weld. The tool pin and tool shoulder comes in contact with the
work piece material and mix them to get the weld. The study attempts to analyse the effect of
tool rotation speed, dwell time and tool pin diameter on the weld created. Face centered central
composite design (FCCCD) of response surface methodology (RSM) is used to plan the
experimentation. Vickers’s micro hardness test has been conducted at eight points in each
sample. The cross section of the weld joint is examined to study the presence of any defect in
this area. A finite element model (FEM) has been proposed using DEFORM-3D to predict
temperature in the stir zone. Radiography images have been taken of the welds to study the
weld properties and the flaws. The ultimate tensile load of each weld specimen has been
analyzed to know the effect and significance of different parameters.
4.2 Materials used and Experimental procedure
4.2.1 Material used
Aluminum 6061 alloy one mm sheet has been cut into dimension of 100 mm × 25 mm × 1 mm.
Figure 4.1 shows work piece sample used for experimentation. Surface of work piece which
comes in contact with the other work piece was rubbed with sand paper followed by cleaning
with acetone to remove any impurity present on the surface. Three different tools have been
prepared for the experimentation having tool pin diameter 3 mm, 4 mm and 5 mm. Tools have
been prepared with H-13 tool steel having tool pin length of 1.7 mm and tool shoulder diameter
of ten mm. The shoulders of the different tools were given similar spiral groove to increase the
friction with the work piece. Figure 4.2 shows three tools with different tool pin diameter used
for experimentation.

48
Figure 4.1 Work piece used for experimentation
Figure 4.2 Tools used for experimentation
4.2.2 Experimental procedures
Experiment has been designed with three parameters: tool rotation speed, dwell time and tool
pin diameter. Dwell time is the time for which the tool is kept rotating in tool after completion of
insertion. Screening experiments and extensive literature survey have been carried out to
obtain parametric range with which good quality weld can be achieved. FCCCD of RSM has
been adopted to do the analysis with reasonable amount of experiment. All parameters have
been taken at three different levels to conduct the experiments. Table 4.1 shows different levels
at which experiment have been conducted. Table 4.2 shows the experimental layout with
parametric levels in coded value. Total twenty runs of experiments have been conducted with
various parametric setting. There are eight factorial points, six axial points and six center points
in the experimental layout.

49
Table 4.1 Level of parameters
Coded value
Level 1 -1
Level 2 0
Level 3 1
Tool rotation speed (RPM) 1000 1500 2000
Dwell time (Seconds) 4 6 8
Tool pin Diameter (mm) 3 4 5
Experiments were conducted on a CNC vertical axis milling machine with proper fixtures.
Figure 3.5 shows the machine used for the experimentation. The tools were attached to the
tool spindle for providing rotational as well as vertical motion. Two welds are created with each
parametric setting. One weld has been used for tensile strength test and second is used for
radiography, microscopic study and Vickers hardness test. Tensile test was conducted
according to ASTM D1002-2001 standard. This test has been conducted with cross head
speed of 0.5 mm/min. The ultimate tensile load (UTL) obtained for each weld is shown in Table
4.2. All the UTL was calculated in newton (N) unit. The welded samples were cut using wire
electrical discharge machine into two parts and polished using standard metallurgical polishing
process. Keller’s reagent was used for etching the polished samples.
Table 4.2 Experimental layout and UTL of weld
Experimental run
Tool rotation speed (RPM)
Dwell time (s)
Tool pin diameter (mm)
Ultimate tensile load (N)
1 -1 -1 -1 362
2 1 -1 -1 1349
3 -1 1 -1 425
4 1 1 -1 902
5 -1 -1 1 405
6 1 -1 1 1250
7 -1 1 1 836
8 1 1 1 1231
9 -1 0 0 772
10 1 0 0 1375
11 0 -1 0 756
12 0 1 0 698
13 0 0 -1 629
14 0 0 1 858
15 0 0 0 885
16 0 0 0 906
17 0 0 0 844
18 0 0 0 889
19 0 0 0 936
20 0 0 0 915

50
A finite element (FE) model has been developed using DEFORM-3D as shown in Figure 4.3.
Assembly of FE model consists of three parts: tool, work piece and backing plate. Work piece
is made with 22279 elements having 5403 nodes. Elements are made of equal size to get
result with accuracy all over the surface. Tool is made of 33751 elements having 7414 nodes
and backing plate with 3458 elements with 887 nodes. Dimension of work piece for model is
kept 25 mm × 20 mm × 2 mm and backing plate is taken 40 mm × 40 mm × 5 mm. Work piece
in model is considered to be rigid visco-plastic and welding tool and back plate is assumed to
be rigid. This assumption is reasonable as yield strength of work piece is significantly lower
than yield strength of tool used. Buffa et al. (2006) have proposed constitutive equations, finite
element formulation, thermal effect formulation and material model for the FE model of Friction
stir welding. These equations and formulations have been taken for formulation of this model.
Material model has been considered with thermal conductivity k=167 W/m-K and thermal
capacity c=2.4 N/(mm2 °C). Value of k and c are taken constant in this process. A constant
shear friction factor of 0.45 has been used for tool-sheet interface. The tool model is taken with
four mm dia of tool pin and the rotational speed is taken 1500 tool rotation speed. Insertion
speed is taken 0.5mm/s to a depth of 1.8 mm. Dwell time has been taken to be six second
after insertion of tool pin.
Figure 4.3. Schematic illustration of tool, work piece and back plate

51
During the experimentation, temperature was recorded using thermo couple. Thermo couple’s
end was inserted into bottom plate from below at a distance of one mm from the tool pin
circumference. The temperature reading was taken at an interval of one second from the start
of welding till thermocouple’s end was destroyed. The reading of the thermocouple has been
shown as diamond shape in Figure 4.4. Temperature was recorded from model at the same
point of weld area and has been shown as continuous line in Figure 4.4. It can be observed
that a good match is present between temperature predicted by the FE model and temperature
recorded during the experiment. The temperature predicted by the FE model is nearly accurate
to the value obtained during the process. Hence, proposed FE model can be used to predict
the temperature of different weld areas.
Figure 4.4. Experimental and predicted temperature with time
4.3 Results and Discussion
Figure 4.5 shows images of weld 2 and weld 11 (Welding done with parametric setting of
experimental run N, as specified in table 2, is represented as weld N). Figures 4.5a and c show
top view of weld 2 and weld 11 respectively. After visual inspection of the weld, it can be
concluded that there is no surface crack present on weld surface.
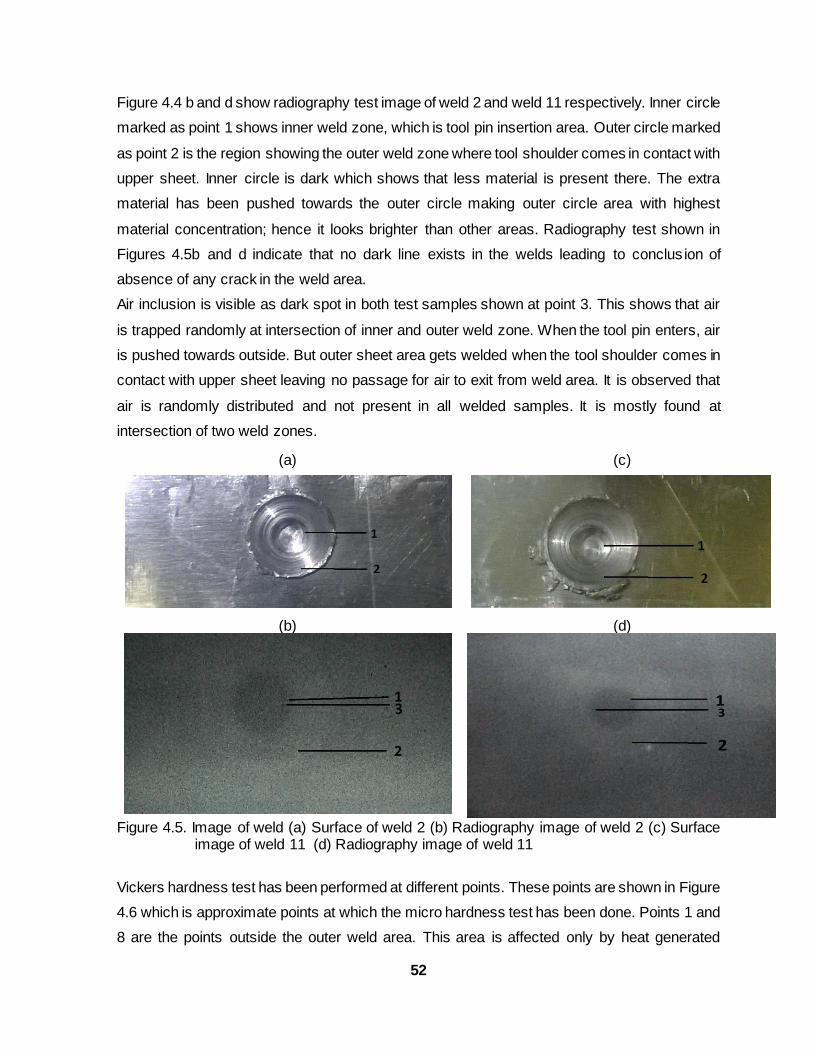
52
Figure 4.4 b and d show radiography test image of weld 2 and weld 11 respectively. Inner circle
marked as point 1 shows inner weld zone, which is tool pin insertion area. Outer circle marked
as point 2 is the region showing the outer weld zone where tool shoulder comes in contact with
upper sheet. Inner circle is dark which shows that less material is present there. The extra
material has been pushed towards the outer circle making outer circle area with highest
material concentration; hence it looks brighter than other areas. Radiography test shown in
Figures 4.5b and d indicate that no dark line exists in the welds leading to conclus ion of
absence of any crack in the weld area.
Air inclusion is visible as dark spot in both test samples shown at point 3. This shows that air
is trapped randomly at intersection of inner and outer weld zone. When the tool pin enters, air
is pushed towards outside. But outer sheet area gets welded when the tool shoulder comes in
contact with upper sheet leaving no passage for air to exit from weld area. It is observed that
air is randomly distributed and not present in all welded samples. It is mostly found at
intersection of two weld zones.
Figure 4.5. Image of weld (a) Surface of weld 2 (b) Radiography image of weld 2 (c) Surface image of weld 11 (d) Radiography image of weld 11
Vickers hardness test has been performed at different points. These points are shown in Figure
4.6 which is approximate points at which the micro hardness test has been done. Points 1 and
8 are the points outside the outer weld area. This area is affected only by heat generated
(a)
(c)
(b)
(d)

53
during welding. Points 2 and 7 are located at upper plate just beside the tool pin insertion area.
Points 3 and 6 are located in lower plate just beside tool pin insertion area. Points 4 and 5 are
the points just below tool pin insertion area.
Figure 4.6 Image of weld 19 showing different point at which micro hardness has been
calculated
During the analysis, no trend in micro hardness has been observed with parametric settings.
But a trend was visible depending on area at which Vickers hardness has been calculated.
Vickers hardness of base plate was measured at six different points in different sheets and
mean was found to be 90.3 HV. Hardness obtained at point 1 and points 8 are approximately
equal to base material hardness. It shows that heat-affected zone does not cause any major
change in Vickers hardness. Points 2 and 7 shows a sudden rise in hardness. It is observed
due to high material flow and more compressed material at that point. From the radiography
test, we have concluded that the outer weld zone has higher compressed material. Due to
mixed effect of material flow and compressed material, hardness obtained at these points is
high. Hardness observed at points 3 and 6 are approximately equal to base material. This is
due to the fact that stirring has not reached the lower part of the bottom plate; hence there is
no mixing at these points. Points 4 and 5 show maximum hardness in comparison to other
points. This area goes through maximum compression creating highest compressed material
leading to highest Vickers hardness.
Figure 4.7 shows the Vickers hardness at different point in welds 4, 6, 8, 11, 14 and 17 obtained
through different parametric arrangement. It can be observed that similar trend of hardness
variation is found in all the welds. The hardness pattern shows that hardness is more in the
area where high compression of material takes place during welding.

54
(a)
(b)
(c)
(d)
(e)
(f)
Figure 4.7 Micro hardness vs. observed points of different welds (a) Weld 4 (b) weld 6 (c) weld
8 (d) weld 11 (e) weld 14 (f) weld 17

55
Figure 4.8 shows microscopic optical images for welds 11 and 19. From the radiography test,
it was found that no cracks were detected in both the welds. Microscopic optical image of weld
19 shows that no crack is present and weld is good at both sides. But microscopic image of
weld 11 shows presence of fine crack at the joint of two sheets. The crack is present in
horizontal direction. This crack was found to be planar in nature and was spread in x-y plane.
This shows radiography test is unable to detect cracks which are formed in x-y plane and fine
examination is required to observe these defects.
(a)
(b)
(c)
(d)
Figure 4.8 Microscopic images of welds (a) Left side of weld 19 (b) Right side of weld 19 (c)
left side of weld 11 (d) right side of weld 11
Figure 4.9 shows the FE model slice view of work piece after completion of insertion of tool
into the work piece. Temperature profile shows that highest temperature is achieved at point
2, 4, 5 and 7. These are places where tool has interaction with work piece material. The friction
between the bodies and energy released during breakage of metallic bonds increases the
temperature of this part. As the highest mechanical work takes place at these areas so Vickers
hardness is maximum in this area. It also shows that temperature outside outer weld zone is
approximately 160°C so this area doesn’t get much affected due to heat. Hence properties of

56
material in these areas are not changed to much extend during welding. Hence this area was
observed to show similar micro hardness as the base material.
Figure 4.9 Slice view of workpeice at tool inserted
Total energy used with respect to time is shown in Figure 4.10. This shows that the energy
required during welding increases exponentially during insertion of tool pin. This is because
energy is required to insert tool pin into work piece and overcome friction produced between
tool material and work piece materials. After completion of sinking of tool into work piece, total
energy used rises at a very slow rate indicating that little interaction between tool and work
piece is present after the tool sinking is complete.

57
Figure 4.10 Total energy with respect to time
Tensile test was carried out on the welds obtained at different parametric settings. The UTL
obtained for each weld is shown in Table 4.2 and has been plotted vs. experimental run in
Figure 4.11. From the figure, we can conclude that with change in parametric setting for
welding the UTL changes. The maximum UTL obtained is 1375 N for weld 10 and minimum is
362 N for weld 1. This shows that there is variation in UTL with a change in parameters. Further
investigation on the effect of the parameters has been done with analysis of variance (ANOVA)
analysis.
Figure 4.11 Variation in UTL with experimental run
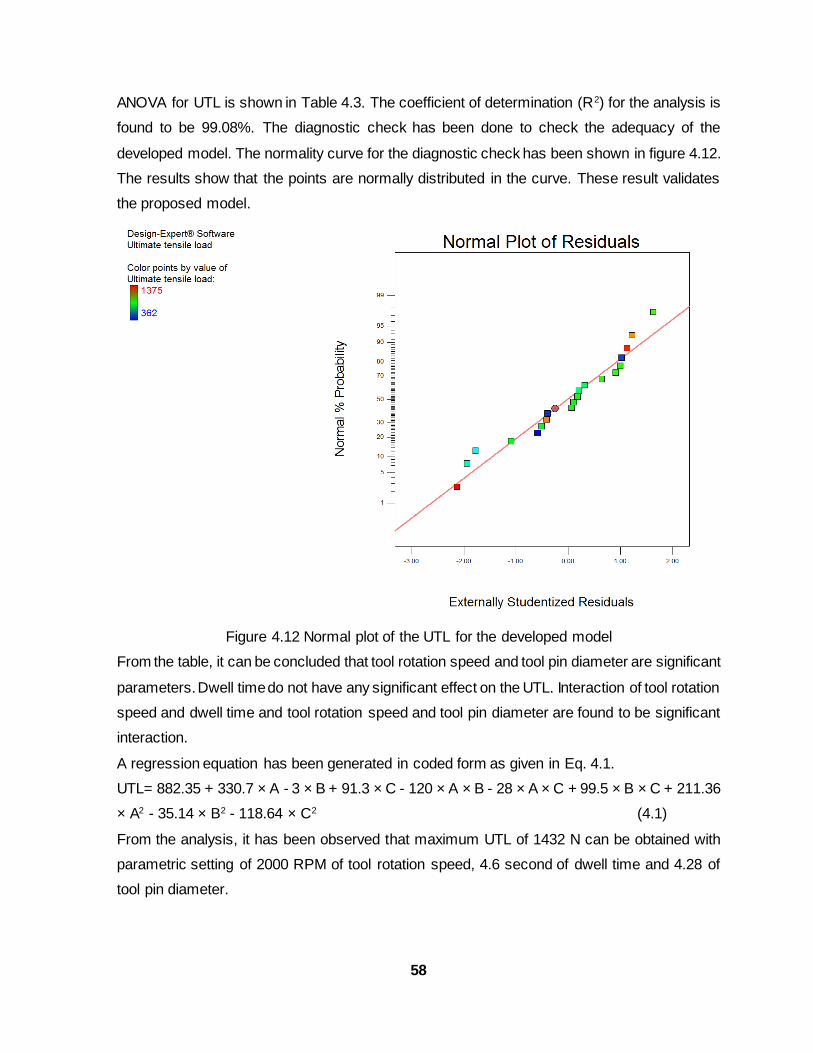
58
ANOVA for UTL is shown in Table 4.3. The coefficient of determination (R2) for the analysis is
found to be 99.08%. The diagnostic check has been done to check the adequacy of the
developed model. The normality curve for the diagnostic check has been shown in figure 4.12.
The results show that the points are normally distributed in the curve. These result validates
the proposed model.
Figure 4.12 Normal plot of the UTL for the developed model
From the table, it can be concluded that tool rotation speed and tool pin diameter are significant
parameters. Dwell time do not have any significant effect on the UTL. Interaction of tool rotation
speed and dwell time and tool rotation speed and tool pin diameter are found to be significant
interaction.
A regression equation has been generated in coded form as given in Eq. 4.1.
UTL= 882.35 + 330.7 × A - 3 × B + 91.3 × C - 120 × A × B - 28 × A × C + 99.5 × B × C + 211.36
× A2 - 35.14 × B2 - 118.64 × C2 (4.1)
From the analysis, it has been observed that maximum UTL of 1432 N can be obtained with
parametric setting of 2000 RPM of tool rotation speed, 4.6 second of dwell time and 4.28 of
tool pin diameter.

59
Table 4.3 ANOVA for UTL
Source Sum of Squares df Mean Square
F Value
p-value Prob > F
Model 1537163.41 9 170795.93 119.44 < 0.0001 significant
A-Tool rotation speed 1093624.9 1 1093624.9 764.81 < 0.0001
B-Dwell Time 90 1 90 0.06 0.8070 C-Tool pin Diameter 83356.9 1 83356.9 58.30 < 0.0001
A×B 115200 1 115200 80.56 < 0.0001
A×C 6272 1 6272 4.39 0.0627
B×C 79202 1 79202 55.39 < 0.0001
A2 122855.11 1 122855.11 85.91 < 0.0001
B2 50220.051 1 50220.05 35.12 0.0001
C2 38705.11 1 38705.11 27.07 0.0004
Residual 14299.13 10 1429.91
Lack of Fit 9364.30 5 1872.86 1.90 0.2495 not significant
Pure Error 4934.83 5 986.97
Cor Total 1551462.55 19
Figure 4.13 shows the surface plot for effect of tool rotation speed and dwell time on UTL of
weld. UTL increases with increase in tool rotation speed. High tool rotation speed leads to
more heat generation at the interference. Due to this, the material become soft and the flow
stress of the work piece material decreases. High tool rotation speed also leads to better mixing
of the material in the weld area. Due to these effects, UTL increases with increase in tool
rotation speed. At lower dwell time, rise is more rapid than the rise at higher dwell time.
At lower tool rotation speed, the UTL increase with rise in dwell time but at higher tool rotation
speeds UTL decreases with rise in dwell time. At lower welding speed, the mixing and heat
generation per unit time is less. As the dwell time is increased, more mixing and heat
generation takes place. This leads to rise in UTL of weld. But at higher tool rotation speed, the
mixing takes place for small duration of time. As the dwell time is increased, the tool rubs
against the work piece and material is removed from work piece in form of blurs. This reduces
the thickness of the weld zone. Due to this, the UTL of the weld decreases with increase in
dwell time.

60
Figure 4.13 Surface plot tool rotation speed and Dwell time
Figure 4.14 shows the surface plot for the effect of tool pin diameter and dwell time on UTL of
the weld. It is observed that UTL increases with increase in tool pin diameter initially and then
starts decreasing after reaching the peak point. As tool pin diameter increases, the area of the
pin which directly comes in contact with work piece increases. This area is the area where
highest mixing of the material takes place and gives maximum strength to the weld. Hence,
we observe a rise in UTL with increase in tool pin diameter. With increase in tool pin diameter
the area of sheet which gets welded below the tool shoulder decreases. This phenomenon
decreases the strength of the joint. After an optimum tool pin diameter, the decrease in strength
is more than increase in strength with increase in tool pin diameter. Hence, the UTL starts
decreasing. So, the tool pin diameter should be optimum to get highest UTL. At lower dwell
time the effect is less than at higher dwell time.
Design-Expert® Software
Factor Coding: Actual
UTL
Design points above predicted value
Design points below predicted value
1375
362
X1 = A: Tool rotation speed
X2 = B: Dwell Time
Actual Factor
C: Tool pin Diameter = 4.00
4.00
5.00
6.00
7.00
8.00
1000.00
1250.00
1500.00
1750.00
2000.00
200
400
600
800
1000
1200
1400
1600
UTL
A: Tool rotation speed
B: Dwell Time
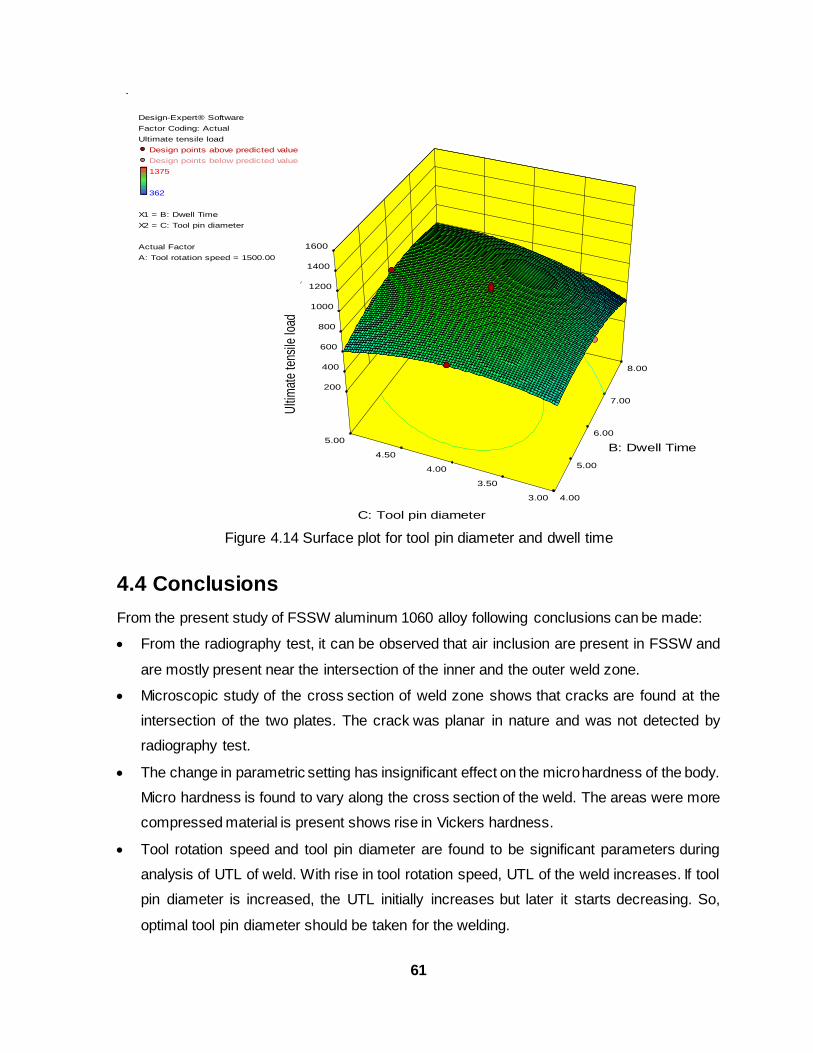
61
Figure 4.14 Surface plot for tool pin diameter and dwell time
4.4 Conclusions
From the present study of FSSW aluminum 1060 alloy following conclusions can be made:
From the radiography test, it can be observed that air inclusion are present in FSSW and
are mostly present near the intersection of the inner and the outer weld zone.
Microscopic study of the cross section of weld zone shows that cracks are found at the
intersection of the two plates. The crack was planar in nature and was not detected by
radiography test.
The change in parametric setting has insignificant effect on the micro hardness of the body.
Micro hardness is found to vary along the cross section of the weld. The areas were more
compressed material is present shows rise in Vickers hardness.
Tool rotation speed and tool pin diameter are found to be significant parameters during
analysis of UTL of weld. With rise in tool rotation speed, UTL of the weld increases. If tool
pin diameter is increased, the UTL initially increases but later it starts decreasing. So,
optimal tool pin diameter should be taken for the welding.
Design-Expert® Software
Factor Coding: Actual
Ultimate tensile load
Design points above predicted value
Design points below predicted value
1375
362
X1 = B: Dwell Time
X2 = C: Tool pin diameter
Actual Factor
A: Tool rotation speed = 1500.00
3.00
3.50
4.00
4.50
5.00
4.00
5.00
6.00
7.00
8.00
200
400
600
800
1000
1200
1400
1600
Ulti
mat
e te
nsile
load
B: Dwell Time
C: Tool pin diameter

62
CHAPTER 5
FRICTION STIR Spot
WELDING OF
DISSIMILAR METALS
63
Chapter 5
FRICTION STIR SPOT WELDING OF
DISSIMILAR METALS 5.1 Introduction
Conventional welding processes mostly creates joint by melting the materials and allowing
them to solidify together. Due to the difference in thermal conductivity and melting temperature
of different materials, good quality weld is difficult to achieve through this processes. FSSW is
a promising technique to create welds between dissimilar metals. In this process, materials
are mixed together in their solid state at high temperature and pressure. FSSW creates the
weld by mixing the material mechanically; therefore, no melting takes place. In the previous
chapter, we have discussed the friction stir spot welding (FSSW) of similar metals. In this
chapter, FSSW of dissimilar metals has been studied. In the present study, aluminum 6061
alloy has been welded with pure copper sheet. Copper and aluminum alloys are two of the
most widely used material in the field of manufacturing electrical appliances. Since both the
materials possess high thermal conductivity, their weldability characteristic is poor. The most
widely used method to join aluminum and copper is by riveted joint. But this is less convenient
than welding process. Brazing is used to join copper and its alloys but aluminum alloys are
difficult to be joined by brazing process. In the current chapter, the effect of tool rotation speed,
dwell time and tool pin diameter on ultimate tensile load (UTL) has been studied. Analysis of
variance has been done for the UTL to analyze effect and significance of different parameters
on the joint.
5.2 Materials used and Experimental procedure
5.2.1 Materials of the tool and work piece
For the current study, one millimeter sheet of aluminum 6061 alloy and pure copper has been
used as work pieces. These sheets were cut into the dimension of 100 mm × 20 mm × 1 mm.
Before the experiment, the surface which comes in contact during welding was rubbed with
sand paper followed by cleaning with acetone to remove any impurity present. The sheets
were made flat to avoid any space between them during welding. Figure 5.1 shows the work
piece plates after welding.
The tools for this experimentation were prepared with H-13 tool steel material. The yield
strength of this tool material is quite higher than the yield strength of work piece material. From

64
extensive literature survey, it has been observed that the particles of the tool may mix with the
work piece during welding process if the yields strength of tool material is lower than that of
work piece. Due to this, the properties of the weld zone changes. H-13 tool steel is a high
strength material which shows a good strength when exposed to cyclic heating and cooling of
materials. Figure 5.2 shows the tool used for the welding process.
Figure 5.1 Weld generated between dissimilar metals
Figure 5.2 Tools used for experiment
5.2.2 Experimental procedure
In the current work, analysis has been done to find the effect and significance of different
parameters on the FSSW of dissimilar metal. Extensive literature survey was carried out to
find different parameters that have effect on FSSW. It was found that tool rotation speed, tool
pin diameter, tool tilt angel and dwell time are the parameters which have effect on the FSSW
weld quality. Three parameters have been considered for the present analysis: tool rotation
speed, dwell time and tool pin diameter. Dwell time is the time for which the tool is kept rotating
at the point after the tool insertion was complete. Screening experiments have been conducted
to find the range in which good weld was achieved with these parameters. For the
experimentation, each of the parameter was taken at three levels. This was done for
convenient setting of the parameters on the machine. Table 5.1 shows the different parameters
and different level with which the experiments has been conducted. Face centered central
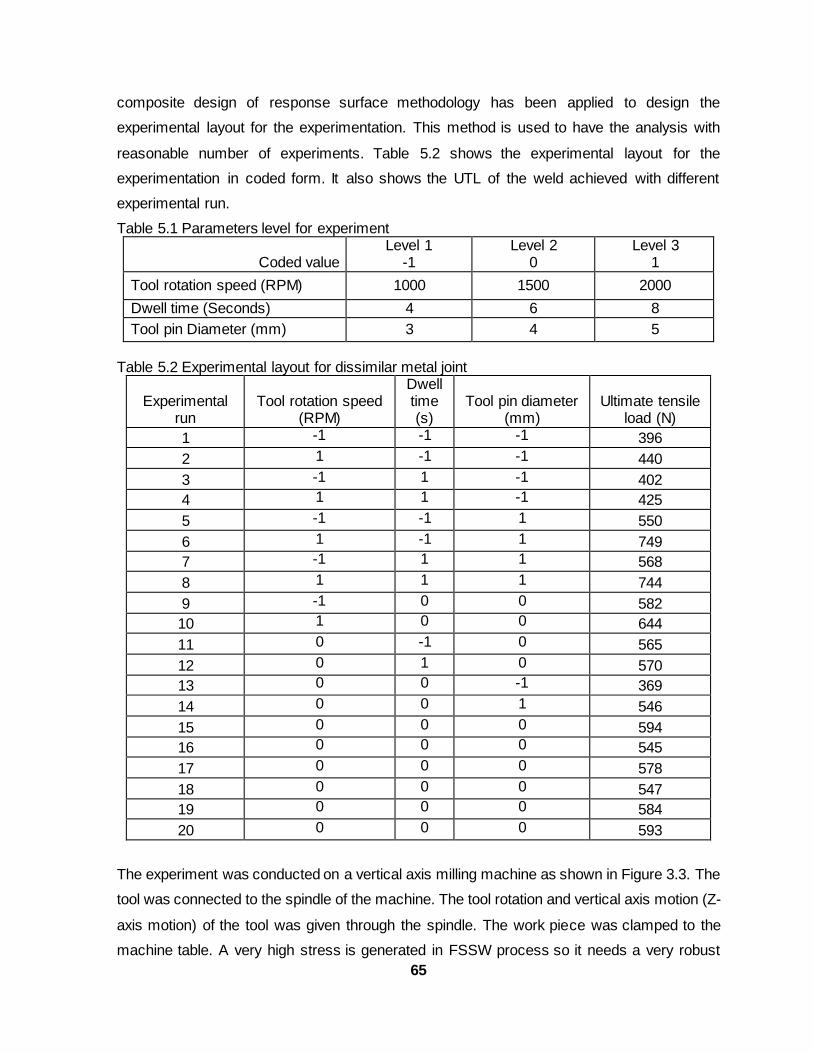
65
composite design of response surface methodology has been applied to design the
experimental layout for the experimentation. This method is used to have the analysis with
reasonable number of experiments. Table 5.2 shows the experimental layout for the
experimentation in coded form. It also shows the UTL of the weld achieved with different
experimental run.
Table 5.1 Parameters level for experiment
Coded value Level 1
-1 Level 2
0 Level 3
1
Tool rotation speed (RPM) 1000 1500 2000
Dwell time (Seconds) 4 6 8
Tool pin Diameter (mm) 3 4 5
Table 5.2 Experimental layout for dissimilar metal joint
Experimental run
Tool rotation speed (RPM)
Dwell time (s)
Tool pin diameter (mm)
Ultimate tensile load (N)
1 -1 -1 -1 396
2 1 -1 -1 440
3 -1 1 -1 402
4 1 1 -1 425
5 -1 -1 1 550
6 1 -1 1 749
7 -1 1 1 568
8 1 1 1 744
9 -1 0 0 582
10 1 0 0 644
11 0 -1 0 565
12 0 1 0 570
13 0 0 -1 369
14 0 0 1 546
15 0 0 0 594
16 0 0 0 545
17 0 0 0 578
18 0 0 0 547
19 0 0 0 584
20 0 0 0 593
The experiment was conducted on a vertical axis milling machine as shown in Figure 3.3. The
tool was connected to the spindle of the machine. The tool rotation and vertical axis motion (Z-
axis motion) of the tool was given through the spindle. The work piece was clamped to the
machine table. A very high stress is generated in FSSW process so it needs a very robust

66
fixture. Thin sheets are very weak in strength and gets easily destroyed and deformed when
high pressure is applied to hold them. So a suitable fixture was deveoped to hold the sheets
in position. Since no x-axis and y- axis motion is required in FSSW, the machine table was
fixed in its position. After the completion of the experiment, the specimens were taken for the
tensile strength test. The tensile test experiment was conducted according to ASTM D1002-
2001 standard. During the test, the cross-head motion was given at a velocity of 0.25 mm per
min. The results obtained were analyzed with analysis of variance.
5.3 Results and discussion
Figure 5.2 shows the weld achieved between the work pieces. It is observed that a sound spot
weld was produced between the work pieces. Figure 5.3 shows the UTL observed for the weld
with different experimental run. The highest UTL is 749 N for the weld 6 and lowest is 369 N
for the weld 13. It is observed that there is variation in the UTL for the weld achieved with
different parametric setting. Further analysis has been done with analysis of variance
(ANOVA).
Figure 5.3 Variation in UTL with experimental run
Table 5.3 shows the ANOVA for UTL of dissimilar metal joint. The coefficient of determination
(R2) for the analysis is found to be 97.17%. The diagnostic check has been done to check the
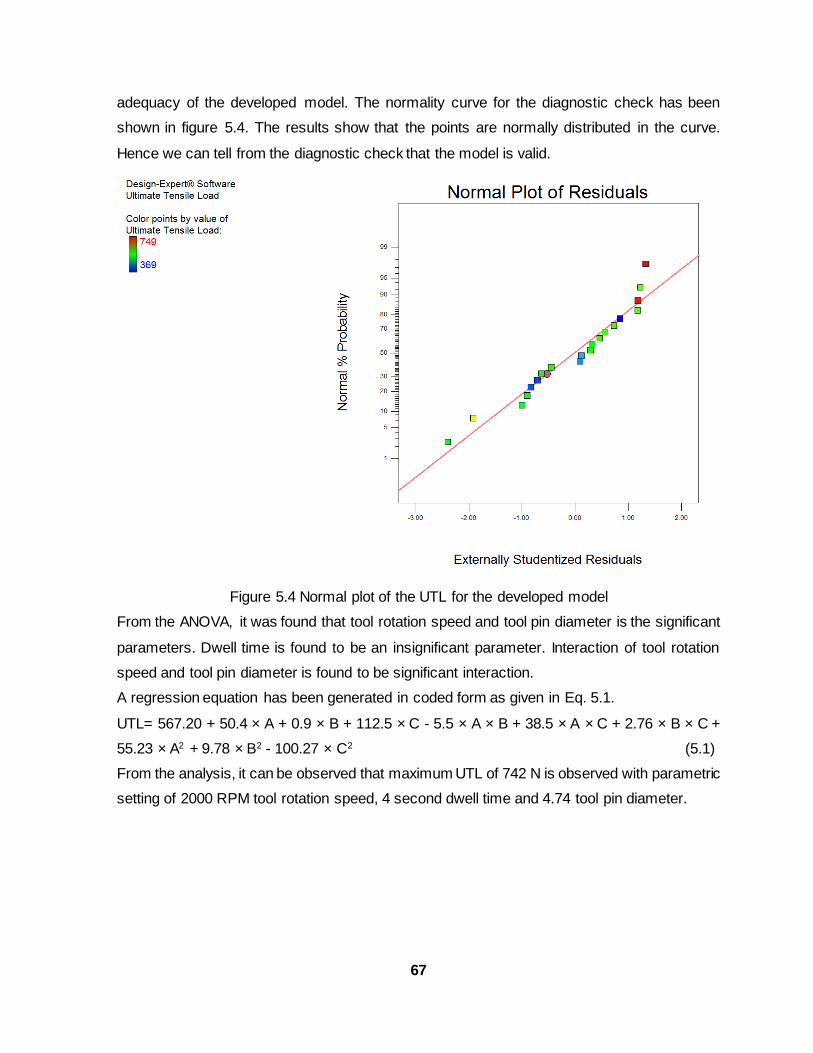
67
adequacy of the developed model. The normality curve for the diagnostic check has been
shown in figure 5.4. The results show that the points are normally distributed in the curve.
Hence we can tell from the diagnostic check that the model is valid.
Figure 5.4 Normal plot of the UTL for the developed model
From the ANOVA, it was found that tool rotation speed and tool pin diameter is the significant
parameters. Dwell time is found to be an insignificant parameter. Interaction of tool rotation
speed and tool pin diameter is found to be significant interaction.
A regression equation has been generated in coded form as given in Eq. 5.1.
UTL= 567.20 + 50.4 × A + 0.9 × B + 112.5 × C - 5.5 × A × B + 38.5 × A × C + 2.76 × B × C +
55.23 × A2 + 9.78 × B2 - 100.27 × C2 (5.1)
From the analysis, it can be observed that maximum UTL of 742 N is observed with parametric
setting of 2000 RPM tool rotation speed, 4 second dwell time and 4.74 tool pin diameter.

68
Table 5.3 ANOVA for UTL
Source Sum of Squares df
Mean Square F Value
p-value Prob > F
Model 194273.4 9 21585.93 38.21 < 0.0001 significant
A-Tool Rotation Speed 25401.6 1 25401.6 44.96 < 0.0001
B-Dual Time 8.1 1 8.1 0.014 0.9071
C-Tool Pin Diameter 126562.5 1 126562.5 224.02 < 0.0001
A×B 242 1 242 0.43 0.5276
A×C 11858 1 11858 20.9 0.0010
B×C 60.5 1 60.5 0.11 0.7502
A2 8387.64 1 8387.64 14.84 0.0032
B2 260.20 1 260.20 0.46 0.5128
C2 27650.2 1 27650.2 48.94 < 0.0001
Residual 5649.54 10 564.95
Lack of Fit 3204.04 5 640.80 1.31 0.3871 not significant
Pure Error 2445.5 5 489.1
Cor Total 199923 19
Figure 5.5 shows the surface plot for the effect of tool rotation speed and dwell time on the
UTL of the joint. We can observe that UTL of the weld increases with increase in tool rotation
speed. It is observed that effect of tool rotation speed is less significant below 1500 rpm of tool
rotation speed. After 1500 rpm, tool rotation speed has comparatively more significant effect.
Keeping other factors constant when tool rotation speed is increased the interaction of the tool
with work piece increases. This generates more friction between the tool and work piece
material that leads to increase in the temperature of the body. At higher temperature the flow
stress of the body reduces. Moreover, when the tool rotation speed is increased more mixing
of material takes place. Low flow stress and better mixing of work piece material leads to finer
mixing of the material. Hence finer mixing of material leads to increase in UTL of the joint with
increase in tool rotation speed. This is observed that at lower as well as higher dwell time the
same effect of tool rotation speed is present.

69
Figure 5.5 surface plot of tool rotation speed and dwell time
Figure 5.6 shows the surface plot for the effect of tool rotation speed and tool pin profile on
UTL of the joint. From the ANOVA analysis, it can be observed that the interaction between
tool rotation speed and tool pin diameter is significant. From the Figure 5.5 it can be observed
that with the rise in tool pin diameter initially the UTL increases but after a peak it starts
decreasing. When tool pin diameter is increased, the area of the tool pin which comes in
contact with work piece material during welding also increases. The material around the tool
pin gets highest mixing during the process and gives highest strength to the joint. Hence with
the rise in tool pin diameter the strength of the joint increases. With the increase in tool pin
diameter after a certain point the UTL starts decreasing. This can be explained as the pin
diameter increase the area of the key hole area also increases.
Design-Expert® Software
Factor Coding: Actual
Ultimate tensile load
Design points above predicted value
Design points below predicted value
749
369
X1 = A: Tool rotation speed
X2 = B: Dwell Time
Actual Factor
C: Tool Pin Diameter = 4.00
4.00
5.00
6.00
7.00
8.00
1000.00
1250.00
1500.00
1750.00
2000.00
300
400
500
600
700
800
Ulti
mat
e te
nsile
load
A: Tool rotation speed
B: Dwell Time

70
Figure 5.6 Surface plot of tool rotation speed and tool pin profile
This area is the area of least thickness and eventually least strength. There will also be
decrease in the region where bonding is formed between the two plates due to mixing by the
tool shoulder. The strength reduction due to these two factors will after some critical tool pin
diameter will overcome the effects which lead to increase in UTL with increase in tool pin
diameter. So the tool pin diameter should be optimal to get the highest UTL of weld.
5.4 Conclusions
A FSSW of dissimilar material has been successfully achieved between dissimilar materials.
The main conclusions drawn from the present study is summarized as follows.
For the analysis of UTL of the weld, the tool rotation speed is a found to be a significant
parameter. With increase in tool rotation speed UTL of weld increases. The effect of
tool rotation speed is less significant below 1500 RPM of tool rotation speed. But above
1500 RPM tool rotation speed the effect is if more significant.
The tool pin diameter should be made of optimum size. Initially with rise in tool pin
diameter the strength of the weld increases but eventually after a peak further increase
leads to a fall in UTL.
Design-Expert® Software
Factor Coding: Actual
Ultimate tensile load
Design points above predicted value
Design points below predicted value
749
369
X1 = A: Tool rotation speed
X2 = C: Tool Pin Diameter
Actual Factor
B: Dwell Time = 6.00
3.00
3.50
4.00
4.50
5.00
1000.00
1250.00
1500.00
1750.00
2000.00
300
400
500
600
700
800
Ulti
mat
e te
nsile
load
A: Tool rotation speedC: Tool Pin Diameter

71
CHAPTER 6
FRICTION STIR Spot
WELDING OF METAL
AND POLYMER

72
Chapter 6 FRICTION STIR SPOT WELDING OF
METAL AND POLYMER 6.1 Introduction
Friction stir spot welding (FSSW) is a spot welding process in which weld is created on a spot
area due to mechanical mixing of material at elevated temperature. In this process, a third
body (tool) is used to generate heating and mixing of the material. In the previous chapters
similar and dissimilar metals have been successfully welded by this process. In the current
chapter, an attempt has been made to join dissimilar material (metal and polymer). For the
current study, copper has been used as metal materials and Poly (methyl methacrylate)
(PMMA) is used as polymer material. PMMA has a wide spread application in which it is
attached with metals in civil infrastructure projects and home decorations projects. In most of
the cases adhesive joint is created between them but adhesive joint have less strength. Copper
has high strength, thermal conductivity and melting point. PMMA being a polymer have its
mechanical properties and thermal properties very much inferior to copper.
During literature survey it was found that very few attempts have been made to join metal with
polymer with FSSW. Due to lack of literature in this field, prior experiments were done to find
possibility of creating joint between copper and PMMA with FSSW. Different parameters for
weld were inspired by the parameters taken for other FSSW processes. The ranges of the
parameters were decided and each parameter was investigated at three levels. Face cantered
central composite design of response surface methodology was applied to do the analysis with
reasonable number of experiment. Analysis of variance was conducted to identify the
significant factors and there effect on the weld. Tensile strength of each of the weld has been
calculated and analysed. The material flow has been studied by observing the cross-section
of the weld.
6.2 Materials used and Experimental procedure
6.2.1 Material of work piece and tool
Copper is metal element which is widely acknowledged for its high thermal and electrical
conductivity. It also possesses a high ductility and malleability. Electrode grade copper has
been used in this experiment which has a copper content of more than 99.9 %. A thin sheet of
copper having 1 mm thickness has been used for present study. The copper sheet was cut to

73
a dimension of 100 mm × 20 mm × 1 mm. Figure 6.1 shows the work pieces and the weld. The
surface of the sheet which comes in contact with the PMMA during welding was rubbed with
the sand paper followed by cleaning with acetone to remove any oxide or impurity present on
the surface.
Figure 6.1 Work piece and the weld generated
The second work piece material taken is a 5 mm PMMA sheet. PMMA is a polymer of methyl
methacrylate. The thermal and electrical conductivity of PMMA is low due to absence of any
free electron in the body. PMMA is a transparent material which is dubbed with different
colouring material to get different colour sheet. In the present study, a black colour 5 mm
PMMA sheet has been used as work piece. The PMMA sheet was cut to dimension of 100 mm
× 20 mm × 5 mm. The surface of the material was cleaned with soup water followed by acetone
to remove any foreign material present on the surface.
The tool has been generated with H-13 tool steel. Figure 6.2 shows the tools used for
experimentation. Tool pin length has been taken as a parameter and tool has been made with
pin length of 2 mm, 3 mm and 4 mm. The entire set of tool has been prepared with a tool
shoulder diameter of 10 mm and tool pin diameter of 5 mm. The tool pin and tool shoulder
surface was made to high surface finish to avoid any unnecessary interference with the work
piece material.
Figure 6.2 The tools used for experimentation

74
6.2.2 Experimental procedure
In this study, the effect of tool rotation speed, dwell time and tool pin length has been
investigated. Face cantered central composite design of response surface methodology has
been implemented to design the experimental layout. All the parameters have been studied at
three levels for convenient setting on the machine. Due to the lack of sufficient literature on
FSSW of copper and PMMA with FSSW, prior experiments were done to find the range of
parameter in which good strength weld can be generated.
Table 6.1 shows the parameters and the different level at which the experiment has been
conducted. Table 6.1 shows the coded value for the each level. Table 6.2 shows the
experimental layout for the experimentation. Ultimate tensile load (UTL) is shown for all the
parametric setting. All the UTL in this chapter is measured in newton (N) unit. The design of
fixture was critical for the experimentation. With low pressure holding of the material lead to
the displacement of the material during welding and high pressure holding destroyed the low
strength polymer sheet dimension. Fixture was generated to get a robust hold on work piece
without deforming the sheets. The difference in dimension of the copper sheet and PMMA
sheet also raised the concerns.
Experiments were conducted on a vertical axis milling machine. The tool was attached to
spindle of the machine. It provided the tool with the rotational motion and vertical motion. The
work piece was fixed with the machine table with suitable fixture. After the completion of the
welding process the specimen were taken for the tensile test. The cross head speed was given
0.25 mm/min during the tensile test. The result obtained were analysed with analysis of
variance (ANOVA) to identify significant parameters and nature of their effect on the weld. The
weld samples were cut and cross-section of the weld has been studied to get insight into the
weld produced.
Table 6.1 Levels of parameters
Coded value
Level 1 -1
Level 2 0
Level 3 1
Tool rotation speed (rpm) 1000 1500 2000
Dwell time (Seconds) 4 6 8
Tool pin length (mm) 2 3 4

75
Table 6.2 Experimental layout for dissimilar metal joint
Experimental run
Tool rotation speed
Dwell time
Tool pin diameter
Ultimate tensile load
1 -1 -1 -1 383
2 1 -1 -1 250
3 -1 1 -1 437
4 1 1 -1 248
5 -1 -1 1 489
6 1 -1 1 431
7 -1 1 1 456
8 1 1 1 354
9 -1 0 0 346
10 1 0 0 234
11 0 -1 0 401
12 0 1 0 416
13 0 0 -1 274
14 0 0 1 444
15 0 0 0 372
16 0 0 0 362
17 0 0 0 342
18 0 0 0 365
19 0 0 0 393
20 0 0 0 395
6.3 Results and discussion
Table 6.2 shows the ultimate tensile load that was observed for the specimen with different
parametric setting. Figure 6.3 shows the graph between the UTS and experimental run. From
the graph it can be observed that a high variation in UTL is present. The highest UTL was
found to be 489 N for the weld 5 and the lowest UTL was found 234 N for the weld 10. This
shows that with change in parametric setting UTL of the joint is varied. For further investigation,
the results were analysed with ANOVA.
Table 6.3 shows the ANOVA for the UTL of the weld. The coefficient of determination (R2) for
the analysis is found to be 93.76%. The diagnostic check has been done to check the
adequacy of the developed model. The normality curve for the diagnostic check has been
shown in figure 6.4. The results show that the points are normally distributed in the curve.
Hence we can tell from the diagnostic check that the model is valid.
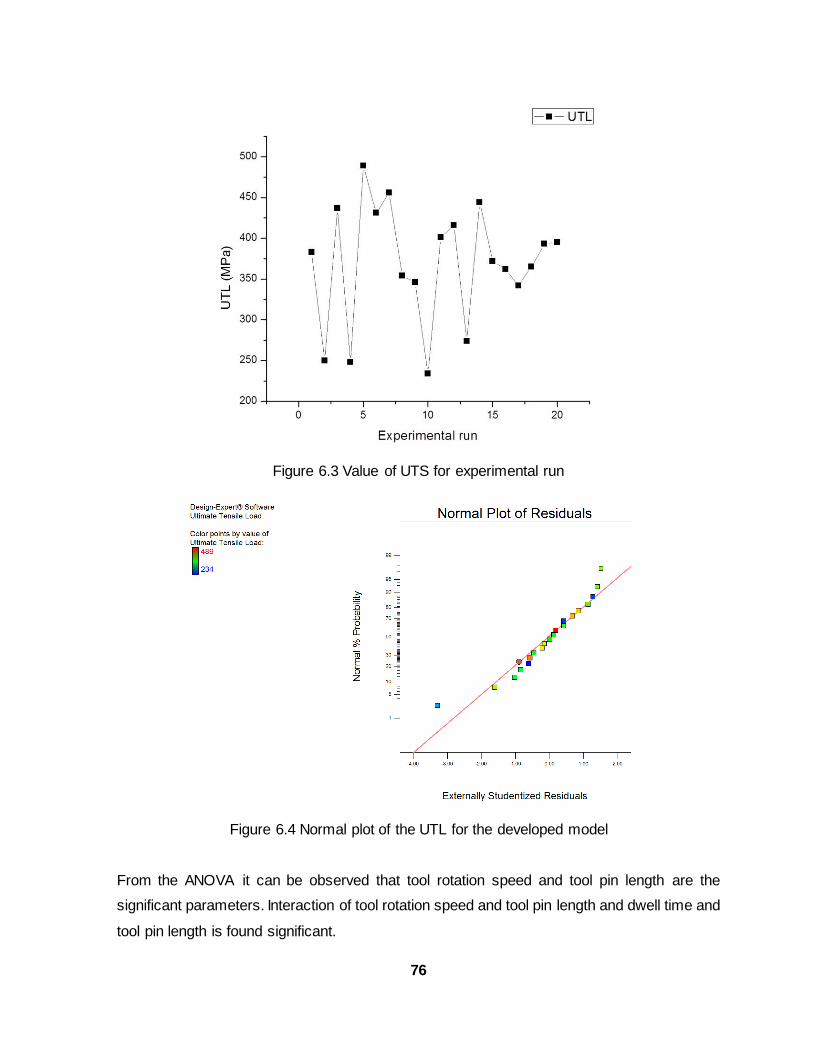
76
Figure 6.3 Value of UTS for experimental run
Figure 6.4 Normal plot of the UTL for the developed model
From the ANOVA it can be observed that tool rotation speed and tool pin length are the
significant parameters. Interaction of tool rotation speed and tool pin length and dwell time and
tool pin length is found significant.

77
A regression equation has been generated in coded form as given in Eq. 6.1.
UTL= 361.82 - 59.4 × A - 4.3 × B + 58.2 × C - 12.5 × A × B + 20.25 × A × C - 20.25 × B × C -
57.32 × A2 + 61.18 × B2 + 11.68 × C2 (6.1)
From the analysis it can be observed that maximum UTL of 521 N can be obtained with
parametric setting of 1384 rpm tool rotation speed, 4 second dwell time and 4 mm tool pin
length.
Table 6.3 ANOVA for UTL
Source Sum of Squares df
Mean Square F Value
p-value Prob > F
Model 92206.99 9 10245.22 16.69 < 0.0001 significant
A-Tool Rotation Speed 35283.6 1 35283.6 57.49
< 0.0001
B-Dwell Time 184.9 1 184.9 0.30 0.5951
C-Tool Pin Length 33872.4 1 33872.4 55.19 < 0.0001
A×B 1250 1 1250 2.04 0.1840
A×C 3280.5 1 3280.5 5.34 0.0434
B×C 3280.5 1 3280.5 5.34 0.0434
A2 9034.78 1 9034.78 14.72 0.0033
B2 10293.84 1 10293.84 16.77 0.0022
C2 375.28 1 375.28 0.61 0.4524
Residual 6137.80 10 613.78
Lack of Fit 4120.30 5 824.06 2.04 0.2260 not significant
Pure Error 2017.5 5 403.5
Cor Total 98344.8 19
Figure 6.5 shows the surface plot for effect of tool rotation speed and tool pin length on UTL
of weld. It can be observed that with the increase in tool rotation speed the UTL of weld
decreases. When the tool pin is pushed against the work pieces, the copper sheet material is
pushed into the polymer sheet to create the joint. During this process, the work piece material
near the tool pin is elongated and pushed into the polymer sheet. With the increase in rpm of
the tool there is a rise in the fluidity and movement of the work piece material. This leads to
more copper sheet material is pushed in to the polymer sheet. This phenomenon reduces the
thickness of the copper sheet material in the weld zone. During tensile test fracture occurs
from this less thickness area. Hence the UTL decrease with increase in tool rotation speed.
From the ANOVA analysis, it can be observed that tool pin length is also a significant
parameter. It is observed that with the increase in tool pin length, the weld strength increases.

78
This is because when the length of the tool pin is increased material from the copper sheet is
pushed deeper into the PMMA sheet. As the length of the penetration increases more bonding
is present between the copper material and the PMMA sheet material. Due to this, more
volume of the copper sheet and PMMA mixes and hence weld shows more strength. From
Figure 6.4 it can be observed that with least tool rotation speed and high tool pin length, highest
UTL is observed. This is because more penetration is achieved with higher tool pin length and
as the tool rotation speed is low the reduction in thickness of copper sheet is less.
Figure 6.5 Surface plot of tool rotation speed and tool pin length
Figure 6.6 shows the cross section of weld produced with 700 rpm tool rotation speed, 4
second dwell time and 4 mm tool pin length. Weld produced with these parametric settings
showed highest UTS in tensile test. It can be observed that thickness of the metal is less in the
weld spot weld area. The copper material has been pushed into the PMMA sheet to generate
the bond. Area 1 shown in the Figure 6.6 shows the area from where the work piece material
has bend to penetrate in to the PMMA sheet. Figure 6.7 shows the magnified image of area 1.
It can be observed that mixing of material has taken place at the intersection of the metal and
polymer sheet. Polymers have inserted into the gaps in the metal sheet due to the high
pressure generated during the welding. Figure 6.8 shows the magnified view of area 2 shown
Design-Expert® Software
Factor Coding: Actual
Ultimate Tensile Load (N)
Design points above predicted value
Design points below predicted value
489
234
X1 = A: Tool Rotation Speed
X2 = C: Tool Pin Length
Actual Factor
B: Dual Time = 0.00
-1.00
-0.50
0.00
0.50
1.00
-1.00 -0.50
0.00 0.50
1.00
100
200
300
400
500
Ulti
mat
e Te
nsile
Loa
d (N
)
A: Tool Rotation Speed (RPM)
C: Tool Pin Length (mm)

79
in Figure 6.7. It is observed that no gaps are present in the intersection of the metal and
polymer sheet. Fine mixing of material has taken place at intersection.
Figure 6.6 Cross section of metal polymer weld
Figure 6.7 Magnified view of area 1
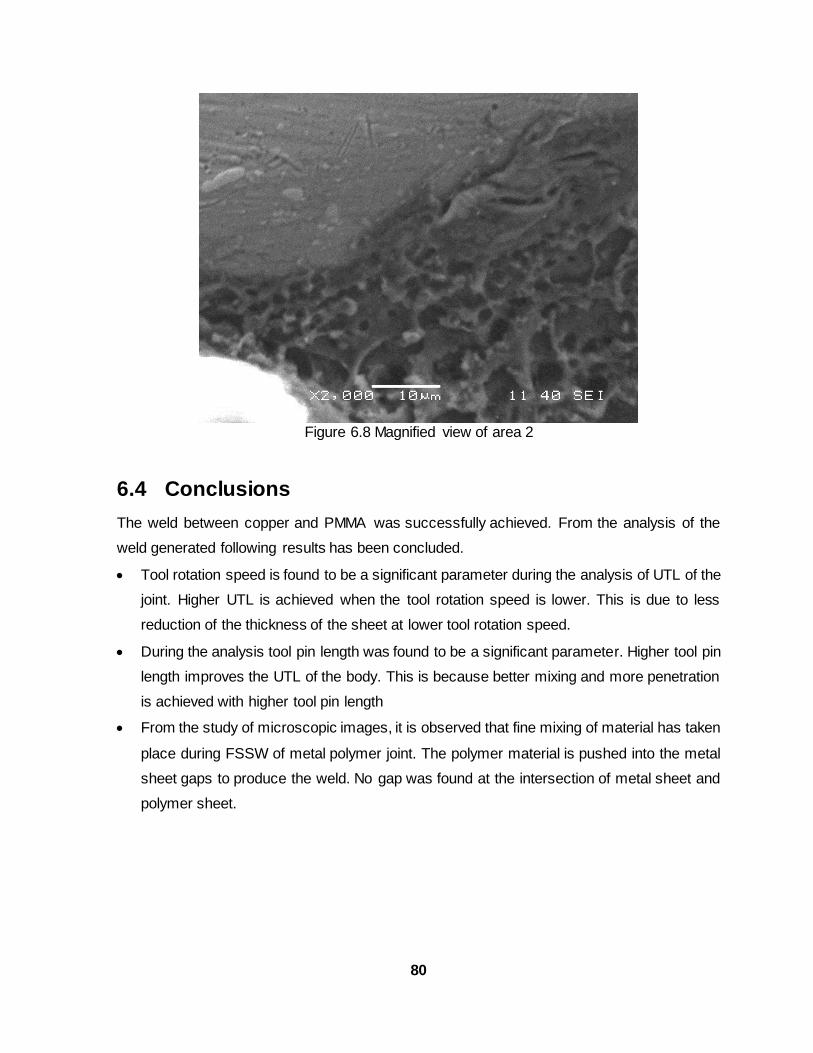
80
Figure 6.8 Magnified view of area 2
6.4 Conclusions
The weld between copper and PMMA was successfully achieved. From the analysis of the
weld generated following results has been concluded.
Tool rotation speed is found to be a significant parameter during the analysis of UTL of the
joint. Higher UTL is achieved when the tool rotation speed is lower. This is due to less
reduction of the thickness of the sheet at lower tool rotation speed.
During the analysis tool pin length was found to be a significant parameter. Higher tool pin
length improves the UTL of the body. This is because better mixing and more penetration
is achieved with higher tool pin length
From the study of microscopic images, it is observed that fine mixing of material has taken
place during FSSW of metal polymer joint. The polymer material is pushed into the metal
sheet gaps to produce the weld. No gap was found at the intersection of metal sheet and
polymer sheet.

81
CHAPTER 7
CONCLUSION

82
Chapter 7 CONCLUSION
7.1 Contribution of the present work
In the present study, friction stir welding (FSW) and friction stir spot welding (FSSW) have
been performed to produce similar as well as dissimilar material joints. From the observed
results, effects of various parameters and their significance on weld quality have been
estimated. The prime contributions of this research are as follows:
During FSW and FSSW processes, it has been observed that tool rotation speed is one of
the most significant parameters. Tensile strength on joints of similar/dissimilar metals
produced through FSW and FSSW increases with increase in tool rotation speed. Since
increase in tool rotation speed causes enhanced heat generation and mixing of the
material, it leads to achieve joints with superior strength. However, tensile strength of the
joint decreases with increase in tool rotation speed in welding of metal with polymer. In
FSSW process, the rotating tool is plunged into the work piece to create the joint. The metal
work piece material is pushed into the polymer sheet to create the weld. With rise in tool
rotation speed, the heat generation and movement of work piece material increases
leading to more flow of material from the upper metal sheet into the lower polymer sheet.
Since strength and density of polymer is less, easy movement of the metal into the polymer
occurs. As a result, thickness of the metal sheet is reduced and fracture occurs from the
less thickness zone. Hence, the tensile strength decreases with increase in tool rotation
speed.
During the analysis of tensile strength and flexural strength, it has been observed that many
joints exhibit good tensile strength but less flexural strength and vice-versa. Tool rotation
speed and offset of the tool from weld line have different effect on tensile and flexural
strengths. With increase in tool rotation speed, the tensile strength increase but the flexural
strength initially decreases then increases. Offset of one millimetre towards retreating side
produces weld having good tensile strength but for superior flexural strength the offset
should be kept zero millimetre. The difference in parameters effect on tensile and flexural
strength is due to deposition pattern of material in weld zone during welding. Higher rotation
speed and offset toward retreating side produces better mixing of material; hence tensile
strength increases. However, it produces joint that has low density in nugget zone. Hence,
the bending takes place with less force.

83
The fracture morphology of the specimen obtained from tensile test shows that the ductility
of the material decreases from top towards the bottom of the weld. This phenomenon is
observed due to the better mixing of the material in the upper part of the weld than the
lower part of the joint.
Tool pin profile is found to significantly affect the weld quality during FSW of six millimetre
aluminium alloy. Threaded pin tool was found to produce joint with superior strength. The
threads present in the pin enhance the flow of material leading to better mixing of material
in weld zone. Due to this, the tensile as well as the flexural strength increases. It has also
been observed that the taper tool produces the weld with least vibration in the machine. It
is recommended that taper tool should be used if the rigidity of the machine is low.
During the analysis of tensile and flexural strength, welding speed is observed to be an
insignificant parameter. But the interaction of welding speed with tool rotation speed and
offset of the tool from weld line is found to be significant.
In FSSW process, effect of tool pin diameter on weld quality has been studied for similar
as well as dissimilar metal joints. It is observed that increase in tool pin diameter initially
increases the tensile strength but it starts decreasing after the peak is reached. The pin
diameter should be less than the half of tool shoulder diameter for FSSW process.
In all the FSSW experiments, it is found that dwell time is an insignificance parameter. It is
observed that consumption of energy is small during the dwell time. This signifies that the
interaction of tool and work piece during dwell time is less. Hence, in the range of
investigation, the significance of dwell time is low. However, it shows a significant
interaction with tool rotation speed and tool pin diameter during welding FSSW of
aluminium sheet. It also shows significant interaction with tool pin length during FSSW of
metal-polymer joint.
During micro hardness study of weld zone produced through FSW and FSSW, it is found
that heat affected zone possesses less micro hardness than the base plate. This is
because the temperature produced in the region during welding makes the zone soft.
Fine planar cracks were found in the intersection of the similar metal joints. It was observed
that these cracks were not observed in the radiography test and fine investigation is
required to study them.
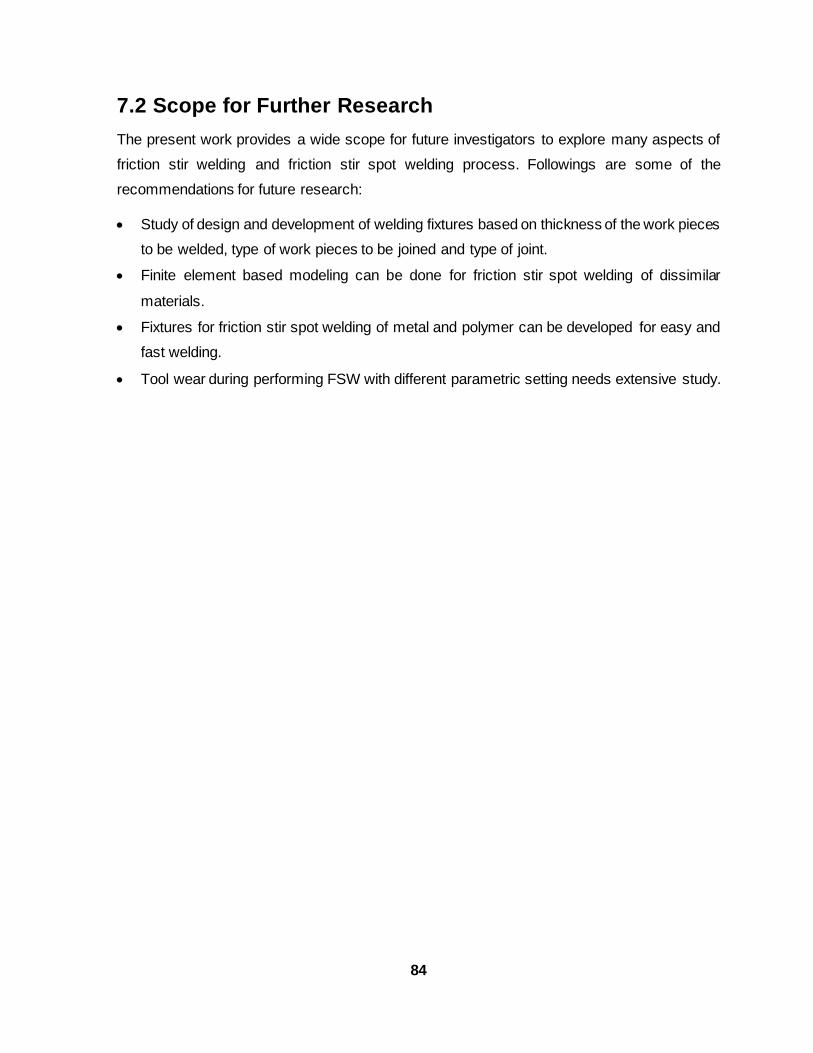
84
7.2 Scope for Further Research
The present work provides a wide scope for future investigators to explore many aspects of
friction stir welding and friction stir spot welding process. Followings are some of the
recommendations for future research:
Study of design and development of welding fixtures based on thickness of the work pieces
to be welded, type of work pieces to be joined and type of joint.
Finite element based modeling can be done for friction stir spot welding of dissimilar
materials.
Fixtures for friction stir spot welding of metal and polymer can be developed for easy and
fast welding.
Tool wear during performing FSW with different parametric setting needs extensive study.
85
REFERENCES
Aval, Hamed Jamshidi. "Microstructure and residual stress distributions in friction stir welding of
dissimilar aluminium alloys." Materials & Design 87 (2015): 405-413.
Beygi, R., M. Kazeminezhad, and A. H. Kokabi. "Butt joining of Al–Cu bilayer sheet through friction
stir welding." Transactions of Nonferrous Metals Society of China 22, no. 12 (2012): 2925-2929.
Bilici M. K., Ahmet İ. Y., and Memduh K.. "The optimization of welding parameters for friction stir
spot welding of high density polyethylene sheets." Materials & Design 32, no. 7 (2011): 4074-4079.
Boz, Mustafa, and Adem Kurt. "The influence of stirrer geometry on bonding and mechanical
properties in friction stir welding process." Materials & Design 25, no. 4 (2004): 343-347.
Brown, Kevin R., Michael S. Venie, and Ralph A. Woods. "The increasing use of aluminum in
automotive applications." JOM 47, no. 7 (1995): 20-23.
Buffa, G., J. Hua, R. Shivpuri, and L. Fratini. "A continuum based fem model for friction stir welding —
model development." Materials Science and Engineering: A 419, no. 1 (2006): 389-396.
Buffa, G., J. Hua, R. Shivpuri, and L. Fratini. "Design of the friction stir welding tool using the
continuum based FEM model." Materials Science and Engineering: A 419, no. 1 (2006): 381-388.
Carlone, P., and G. S. Palazzo. "Characterization of TIG and FSW weldings in cast ZE41A
magnesium alloy." Journal of Materials Processing Technology 215 (2015): 87-94.
Cary H.B., Modern Welding Technology, Prentice-Hall, New Jersey, 2002.
Chatterjee, Suman, Siba Sankar Mahapatra, and Kumar Abhishek. "Simulation and optimization of
machining parameters in drilling of titanium alloys." Simulation Modelling Practice and Theory 62
(2016): 31-48.
Chen, Binxi, Ke Chen, Wei Hao, Zhiyuan Liang, Junshan Yao, Lanting Zhang, and Aidang Shan.
"Friction stir welding of small-dimension Al3003 and pure Cu pipes." Journal of Materials Processing
Technology 223 (2015): 48-57.
Chen, Yingchun, Huijie Liu, and Jicai Feng. "Friction stir welding characteristics of different heat-
treated-state 2219 aluminum alloy plates." Materials Science and Engineering: A 420, no. 1 (2006):
21-25.
Cho, Jae-Hyung, Donald E. Boyce, and Paul R. Dawson. "Modeling strain hardening and texture
evolution in friction stir welding of stainless steel." Materials Science and Engineering: A 398, no. 1
(2005): 146-163.
Clarke, Jo Ann, and Bill Christy. "Aluminum 2001–Proceedings of the TMS 2001, Aluminum
Automotive and Joining Sessions." (2001).

86
Costa, M. I., D. Verdera, J. D. Costa, C. Leitao, and D. M. Rodrigues. "Influence of pin geometry
and process parameters on friction stir lap welding of AA5754-H22 thin sheets." Journal of Materials
Processing Technology 225 (2015): 385-392.
Das, Subodh, and Weimin Yin. "Trends in the global aluminum fabrication industry." JOM 59, no. 2
(2007): 83-87.
Dawes, C. J. "An introduction to friction stir welding and its development." (1995).
Dawes, C. J., and WAYNE M. THOMAS. "Friction stir process welds aluminium alloys: The process
produces low-distortion, high-quality, low-cost welds on aluminium." Welding journal 75, no. 3
(1996): 41-45.
Donatus, U., G. E. Thompson, X. Zhou, J. Wang, and K. Beamish. "Flow patterns in friction stir
welds of AA5083 and AA6082 alloys." Materials & Design 83 (2015): 203-213.
Dong, Honggang, Su Chen, Yang Song, Xin Guo, Xiaosheng Zhang, and Zhiyang Sun. "Refilled
friction stir spot welding of aluminum alloy to galvanized steel sheets." Materials & Design 94 (2016):
457-466.
Dorbane, Abdelhakim, Bilal Mansoor, Georges Ayoub, Vasanth Chakravarthy Shunmugasamy, and
Abdellatif Imad. "Mechanical, microstructural and fracture properties of dissimilar welds produced
by friction stir welding of AZ31B and Al6061." Materials Science and Engineering: A 651 (2016):
720-733.
Dwivedi, Shashi Prakash. "Effect of process parameters on tensile strength of friction stir welding
A356/C355 aluminium alloys joint." Journal of Mechanical Science and Technology 28, no. 1 (2014):
285-291.
Ericsson, Mats, and Rolf Sandström. "Influence of welding speed on the fatigue of friction stir welds,
and comparison with MIG and TIG." International Journal of Fatigue 25, no. 12 (2003): 1379-1387.
Fei, Xinjiang, Xiangzhong Jin, Ying Ye, Tengfei Xiu, and Hongliang Yang. "Effect of pre-hole offset
on the property of the joint during laser-assisted friction stir welding of dissimilar metals steel and
aluminum alloys." Materials Science and Engineering: A 653 (2016): 43-52.
Fereiduni, E., M. Movahedi, and A. H. Kokabi. "Aluminum/steel joints made by an alternative friction
stir spot welding process." Journal of Materials Processing Technology 224 (2015): 1-10.
Fratini, L, Gandolfo Macaluso, and Salvatore Pasta. "Residual stresses and FCP prediction in FSW
through a continuous FE model." Journal of Materials Processing Technology 209, no. 15 (2009):
5465-5474.
Fratini, L., F. Micari, G. Buffa, and V. F. Ruisi. "A new fixture for FSW processes of titanium alloys."
CIRP Annals-Manufacturing Technology 59, no. 1 (2010): 271-274..
Fratini, L., G. Buffa, and R. Shivpuri. "Influence of material characteristics on plastomechanics of
the FSW process for T-joints." Materials & Design 30, no. 7 (2009): 2435-2445.
Frigaard, Øyvind, Øystein Grong, and O. T. Midling. "A process model for friction stir welding of age
hardening aluminum alloys." Metallurgical and materials transactions A 32, no. 5 (2001): 1189-1200.

87
Galvao, I., J. C. Oliveira, A. Loureiro, and D. M. Rodrigues. "Formation and distribution of brittle
structures in friction stir welding of aluminium and copper: influence of process parameters." Science
and Technology of Welding and Joining 16, no. 8 (2011): 681-689.
Gerlich, Adrian, Peter Su, Motomichi Yamamoto, and Tom H. North. "Effect of welding parameters
on the strain rate and microstructure of friction stir spot welded 2024 aluminum alloy." Journal of
Materials Science 42, no. 14 (2007): 5589-5601.
Gibson, B. T., D. H. Lammlein, T. J. Prater, W. R. Longhurst, C. D. Cox, M. C. Ballun, K. J.
Dharmaraj, G. E. Cook, and A. M. Strauss. "Friction stir welding: process, automation, and control."
Journal of Manufacturing Processes 16, no. 1 (2014): 56-73.
Guerra, M., C. Schmidt, J. C. McClure, L. E. Murr, and A. C. Nunes. "Flow patterns during friction
stir welding." Materials characterization 49, no. 2 (2002): 95-101.
Hsieh, Ming-Jer, Yuang-Cherng Chiou, and Rong-Tsong Lee. "Friction stir spot welding of low-
carbon steel using an assembly-embedded rod tool." Journal of Materials Processing Technology
224 (2015): 149-155.
Infante, V., D. F. O. Braga, F. Duarte, P. M. G. Moreira, M. de Freitas, and P. M. S. T. de Castro.
"Study of the fatigue behaviour of dissimilar aluminium joints produced by friction stir welding."
International Journal of Fatigue 82 (2016): 310-316.
Jata, KVa, and SLa Semiatin. Continuous dynamic recrystallization during friction stir welding of
high strength aluminum alloys. No. AFRL-ML-WP-TP-2003-441. AIR FORCE RESEARCH LAB
WRIGHT-PATTERSON AFB OH MATERIALS AND MANUFACTURING DIRECTORATE, 2000.
Jesus, J. S., A. Loureiro, J. M. Costa, and J. M. Ferreira. "Effect of tool geometry on friction stir
processing and fatigue strength of MIG T welds on Al alloys." Journal of Materials Processing
Technology 214, no. 11 (2014): 2450-2460.
Ji, S. D., Q. Y. Shi, L. G. Zhang, A. L. Zou, S. S. Gao, and L. V. Zan. "Numerical simulation of
material flow behavior of friction stir welding influenced by rotational tool geometry." Computational
Materials Science 63 (2012): 218-226.
Khan, Noor Zaman, Arshad Noor Siddiquee, Zahid A. Khan, and Suha K. Shihab. "Investigations
on tunneling and kissing bond defects in FSW joints for dissimilar aluminum alloys." Journal of Alloys
and Compounds 648 (2015): 360-367.
Khodaverdizadeh, H., A. Mahmoudi, A. Heidarzadeh, and E. Nazari. "Effect of friction stir welding
(FSW) parameters on strain hardening behavior of pure copper joints." Materials & Design 35
(2012): 330-334.
Lewis, Gladius, and Scott Mladsi. "Correlation between impact strength and fracture toughness of
PMMA-based bone cements." Biomaterials 21, no. 8 (2000): 775-781.
LI, Xia-wei, Da-tong ZHANG, Q. I. U. Cheng, and Wen ZHANG. "Microstructure and mechanical
properties of dissimilar pure copper/1350 aluminum alloy butt joints by friction stir welding."
Transactions of Nonferrous Metals Society of China 22, no. 6 (2012): 1298-1306.
Li, Ying, E. A. Trillo, and L. E. Murr. "Friction-stir welding of aluminum alloy 2024 to silver." Journal
of Materials Science Letters 19, no. 12 (2000): 1047-1051.

88
Li, Ying, L. E. Murr, and J. C. McClure. "Flow visualization and residual microstructures associated
with the friction-stir welding of 2024 aluminum to 6061 aluminum." Materials Science and
Engineering: A 271, no. 1 (1999): 213-223.
Li, Zhengwei, Yumei Yue, Shude Ji, Chai Peng, and Ling Wang. "Optimal design of thread geometry
and its performance in friction stir spot welding." Materials & Design 94 (2016): 368-376.
Lin, Jau-Wen, Hsi-Cherng Chang, and Ming-Hsiu Wu. "Comparison of mechanical properties of
pure copper welded using friction stir welding and tungsten inert gas welding." Journal of
Manufacturing Processes 16, no. 2 (2014): 296-304.
Liu, G., L. E. Murr, C. S. Niou, J. C. McClure, and F. R. Vega. "Microstructural aspects of the friction -
stir welding of 6061-T6 aluminum." Scripta materialia 37, no. 3 (1997): 355-361.
London B., Mahoney M., Bingel B., Calabrese M., Waldron D., in: Proceedings of the Third
International Symposium on Friction Stir Welding, Kobe, Japan, 27–28 September, 2001.
Ma, Z. Y. "Friction stir processing technology: a review." Metallurgical and Materials Transactions A
39, no. 3 (2008): 642-658.
Mahoney, M. W., C. G. Rhodes, J. G. Flintoff, W. H. Bingel, and R. A. Spurling. "Properties of friction -
stir-welded 7075 T651 aluminum." Metallurgical and materials transactions A 29, no. 7 (1998): 1955 -
1964.
Masaki, Kunitaka, Yutaka S. Sato, Masakatsu Maeda, and Hiroyuki Kokawa. "Experimental
simulation of recrystallized microstructure in friction stir welded Al alloy using a plane-strain
compression test." Scripta Materialia 58, no. 5 (2008): 355-360.
Mishra, Rajiv S., and Z. Y. Ma. "Friction stir welding and processing." Materials Science and
Engineering: R: Reports 50, no. 1 (2005): 1-78.
Mohanty, H. K., M. M. Mahapatra, P. Kumar, P. Biswas, and N. R. Mandal. "Modeling the effects of
tool shoulder and probe profile geometries on friction stirred aluminum welds using response
surface methodology." Journal of Marine Science and Application 11, no. 4 (2012): 493-503.
Mousa, Weam F., Masahiko Kobayashi, Shuichi Shinzato, Masaki Kamimura, Masashi Neo, Satoru
Yoshihara, and Takashi Nakamura. "Biological and mechanical properties of PMMA-based
bioactive bone cements." Biomaterials 21, no. 21 (2000): 2137-2146.
Murr, L. E., Ying Li, R. D. Flores, Elizabeth A. Trillo, and J. C. McClure. "Intercalation vortices and
related microstructural features in the friction-stir welding of dissimilar metals." Material Research
Innovations 2, no. 3 (1998): 150-163.
Nandan, R., G. G. Roy, T. J. Lienert, and T. DebRoy. "Numerical modelling of 3D plastic flow and
heat transfer during friction stir welding of stainless steel." Science and Technology of Welding &
Joining (2013).
Nandan, R., G. G. Roy, T. J. Lienert, and T. Debroy. "Three-dimensional heat and material flow
during friction stir welding of mild steel." Acta Materialia 55, no. 3 (2007): 883-895.

89
Nandan, R., T. DebRoy, and H. K. D. H. Bhadeshia. "Recent advances in friction-stir welding–
process, weldment structure and properties." Progress in Materials Science 53, no. 6 (2008): 980 -
1023.
Nayak, Bijaya Bijeta, and Siba Sankar Mahapatra. "A utility concept approach for multi-objective
optimization of taper cutting operation using WEDM." Procedia Engineering 97 (2014): 469-478.
Oliveira, P. H. F., S. T. Amancio-Filho, J. F. Dos Santos, and E. Hage. "Preliminary study on the
feasibility of friction spot welding in PMMA." Materials Letters 64, no. 19 (2010): 2098-2101.
Pashazadeh, Hamed, Abolfazl Masoumi, and Jamal Teimournezhad. "Numerical modelling for the
hardness evaluation of friction stir welded copper metals." Materials & Design 49 (2013): 913-921.
Peel, M., A. Steuwer, M. Preuss, and P. J. Withers. "Microstructure, mechanical properties and
residual stresses as a function of welding speed in aluminium AA5083 friction stir welds." Acta
materialia 51, no. 16 (2003): 4791-4801.
Plaine, A. H., A. R. Gonzalez, U. F. H. Suhuddin, J. F. dos Santos, and N. G. Alcântara. "The
optimization of friction spot welding process parameters in AA6181-T4 and Ti6Al4V dissimilar
joints." Materials & Design 83 (2015): 36-41.
Plaine, A. H., U. F. H. Suhuddin, C. R. M. Afonso, N. G. Alcântara, and J. F. dos Santos. "Interface
formation and properties of friction spot welded joints of AA5754 and Ti6Al4V alloys." Materials &
Design 93 (2016): 224-231.
Rajamanickam, N., V. Balusamy, G. Madhusudhanna Reddy, and K. Natarajan. "Effect of process
parameters on thermal history and mechanical properties of friction stir welds." Materials & Design
30, no. 7 (2009): 2726-2731.
Reilly, Aidan, Hugh Shercliff, Yingchun Chen, and Philip Prangnell. "Modelling and visualisation of
material flow in friction stir spot welding." Journal of Materials Processing Technology 225 (2015):
473-484.
Rhodes, C. G., M. W. Mahoney, W. H. Bingel, R. A. Spurling, and C. C. Bampton. "Effects of friction
stir welding on microstructure of 7075 aluminum." Scripta materialia 36, no. 1 (1997): 69-75.
Rodriguez, D. M., A. Loureiro, C. Leitao, R. M. Leal, B. M. Chaparro, and P. Vilaça. "Influence of
friction stir welding parameters on the microstructural and mechanical properties of AA 6016-T4 thin
welds." Materials & Design 30, no. 6 (2009): 1913-1921.
Rodriguez, R. I., J. B. Jordon, P. G. Allison, T. Rushing, and L. Garcia. "Microstructure and
mechanical properties of dissimilar friction stir welding of 6061-to-7050 aluminum alloys." Mater Des
83 (2015): 60-65.
Sakthivel, T., G. S. Sengar, and J. Mukhopadhyay. "Effect of welding speed on microstructure and
mechanical properties of friction-stir-welded aluminum." The International Journal of Advanced
Manufacturing Technology 43, no. 5-6 (2009): 468-473.
Sanusi, Kazeem O., Esther T. Akinlabi, Edison Muzenda, and Stephen A. Akinlabi. "Enhancement
of Corrosion Resistance Behaviour of Frictional Stir Spot Welding of Copper." Materials Today:
Proceedings 2, no. 4 (2015): 1157-1165.
90
Schmidt, Hattel, and Jesper Hattel. "A local model for the thermomechanical conditions in friction
stir welding." Modelling and simulation in materials science and engineering 13, no. 1 (2004): 77.
Schmidt, Henrik Nikolaj Blicher, T. L. Dickerson, and Jesper Henri Hattel. "Material flow in butt
friction stir welds in AA2024-T3." Acta Materialia 54, no. 4 (2006): 1199-1209.
Scialpi, A., L. A. C. De Filippis, and P. Cavaliere. "Influence of shoulder geometry on microstructure
and mechanical properties of friction stir welded 6082 aluminium alloy." Materials & design 28, no.
4 (2007): 1124-1129.
Seidel, T. U., and Anthony P. Reynolds. "Two-dimensional friction stir welding process model based
on fluid mechanics." Science and technology of welding and joining 8, no. 3 (2003): 175-183.
Seidel, T. U., and Anthony P. Reynolds. "Visualization of the material flow in AA2195 friction-stir
welds using a marker insert technique." Metallurgical and materials transactions A 32, no. 11 (2001):
2879-2884.
Shrivastava, Amber, Manuela Krones, and Frank E. Pfefferkorn. "Comparison of energy
consumption and environmental impact of friction stir welding and gas metal arc welding for
aluminum." CIRP Journal of Manufacturing Science and Technology 9 (2015): 159-168.
Silva, J., J. M. Costa, A. Loureiro, and J. M. Ferreira. "Fatigue behaviour of AA6082-T6 MIG welded
butt joints improved by friction stir processing." Materials & Design 51 (2013): 315-322.
Song, M., and R. Kovacevic. "Thermal modeling of friction stir welding in a moving coordinate
system and its validation." International Journal of Machine Tools and Manufacture 43, no. 6 (2003):
605-615.
Su, J-Q., T. W. Nelson, R. Mishra, and M. Mahoney. "Microstructural investigation of friction stir
welded 7050-T651 aluminium." Acta materialia 51, no. 3 (2003): 713-729.
Sung-Ook, YOON, KANG., Myoung-Soo, KWON. Yong-Jai, HONG. Sung-Tae, PARK. Dong-Hwan,
LEE Kwang-Hak, LIM Chang-Yong, and SEO Jong-Dock. "Influences of tool plunge speed and tool
plunge depth on friction spot joining of AA5454-O aluminum alloy plates with different thicknesses."
Transactions of Nonferrous Metals Society of China 22 (2012): s629-s633.
Tan, C. W., Z. G. Jiang, L. Q. Li, Y. B. Chen, and X. Y. Chen. "Microstructural evolution and
mechanical properties of dissimilar Al–Cu joints produced by friction stir welding." Materials &
Design 51 (2013): 466-473.
Thomas, W. M., and E. D. Nicholas. "Friction stir welding for the transportation industries." Materials
& Design 18, no. 4 (1997): 269-273.
Thomas, W. M., E. D. Nicholas, J. C. Needham, M. G. Murch, P. Templesmith, and C. J. Dawes.
"GB Patent application no. 9125978.8." International Patent Application No. PCT/GB92/02203
(1991).
Tozaki, Y., Y. Uematsu, and K. Tokaji. "A newly developed tool without probe for friction stir spot
welding and its performance." Journal of Materials Processing Technology 210, no. 6 (2010): 844 -
851.

91
Trueba, Luis, Georgina Heredia, Daniel Rybicki, and Lucie B. Johannes. "Effect of tool shoulder
features on defects and tensile properties of friction stir welded aluminum 6061-T6." Journal of
Materials Processing Technology 219 (2015): 271-277.
Uematsu, Y., T. Kakiuchi, Y. Tozaki, and H. Kojin. "Comparative study of fatigue behaviour in
dissimilar Al alloy/steel and Mg alloy/steel friction stir spot welds fabricated by scroll grooved tool
without probe." Science and Technology of Welding and Joining 17, no. 5 (2012): 348-356.
Xu, S., A. P. Reynolds, and T. U. Seidel. "Finite element simulation of material flow in friction stir
welding." Science and Technology of Welding & Joining (2013).
Xu, Weifeng, Jinhe Liu, Guohong Luan, and Chunlin Dong. "Microstructure and mechanical
properties of friction stir welded joints in 2219-T6 aluminum alloy." Materials & Design 30, no. 9
(2009): 3460-3467.
Xu, Weifeng, Jinhe Liu, Hongqiang Zhu, and Li Fu. "Influence of welding parameters and tool pin
profile on microstructure and mechanical properties along the thickness in a friction stir welded
aluminum alloy." Materials & Design 47 (2013): 599-606.
Xue, P., D. R. Ni, D. Wang, B. L. Xiao, and Z. Y. Ma. "Effect of friction stir welding parameters on
the microstructure and mechanical properties of the dissimilar Al–Cu joints." Materials science and
engineering: A 528, no. 13 (2011): 4683-4689.
Zapata, J., M. Toro, and D. López. "Residual stresses in fric tion stir dissimilar welding of aluminum
alloys." Journal of Materials Processing Technology 229 (2016): 121-127.
Zhang, Hui-jie, Hui-jie Liu, and Y. U. Lei. "Thermal modeling of underwater friction stir welding of
high strength aluminum alloy." Transactions of Nonferrous Metals Society of China 23, no. 4 (2013):
1114-1122.
Zhang, Zhong-ke, Xi-jing Wang, Pei-chung Wang, and Z. H. A. O. Gang. "Friction stir keyholeless
spot welding of AZ31 Mg alloy-mild steel." Transactions of Nonferrous Metals Society of China 24,
no. 6 (2014): 1709-1716.
Zhao, Y-H., S-B. Lin, F-X. Qu, and L. Wu. "Influence of pin geometry on material flow in friction stir
welding process." Materials Science and Technology 22, no. 1 (2006): 45-50.

92
LIST OF PUBLICATIONS
Pandey A. K. and S.S. Mahapatra, “Study of Weld zone obtained by Friction Stir Spot Welding (FSSW) of Aluminium 6061 Alloy”. Going to present in 6th International & 27th All India Manufacturing Technology, Design and Research Conference at College of Engineering Pune. (communicated)
Buddala R., A. K. Pandey and S. S. Mahapatra, “An effective jaya optimization for flexible job shop scheduling.” Going to present at ICFAI University. 1st International Conference on
Emerging Trends in Mechanical Engineering, Hyderabad, Telangana 2016. (Accepted)
Pandey A. K., S. Chatterjee, R. Buddala, S. B. Mishra and S. S. Mahapatra, “Improvements in
Tensile Strength of Friction Stir Welded Parts by Parametric Control” Going to present at ICFAI University. 1st International Conference on Emerging Trends in Mechanical Engineering, Hyderabad, Telangana 2016. (Accepted)
Top Related
Copyright © 2022 FDOKUMEN

