


Bahasa
Halaman
Hukum


CPD7, 1195–1233, 2011
Sensitivity of RedSea circulationduring the last
interglacial
G. Trommer et al.
Title Page
Abstract Introduction
Conclusions References
Tables Figures
J I
J I
Back Close
Full Screen / Esc
Printer-friendly Version
Interactive Discussion
Discussion
Paper
|D
iscussionP
aper|
Discussion
Paper
|D
iscussionP
aper|
Clim. Past Discuss., 7, 1195–1233, 2011www.clim-past-discuss.net/7/1195/2011/doi:10.5194/cpd-7-1195-2011© Author(s) 2011. CC Attribution 3.0 License.
Climateof the Past
Discussions
This discussion paper is/has been under review for the journal Climate of the Past (CP).Please refer to the corresponding final paper in CP if available.
Sensitivity of Red Sea circulation to sealevel and insolation forcing during the lastinterglacial
G. Trommer1,2, M. Siccha1,3, E. J. Rohling4, K. Grant4, M. T. J. van der Meer5,S. Schouten5, U. Baranowski1, and M. Kucera1
1Department of Geosciences, University of Tubingen, Tubingen, Germany2Europole Mer, European Institute for Marine Studies, Plouzane, France3Laboratoire des Bio-Indicateurs actuels et fossils, UFR Sciences, Angers, France4National Oceanography Centre, University of Southampton, Southampton, UK5Department of Marine Organic Biogeochemistry, NIOZ Royal Netherlands Institute for SeaResearch, Den Burg, Texel, The Netherlands
Received: 9 March 2011 – Accepted: 1 April 2011 – Published: 8 April 2011
Correspondence to: G. Trommer ([email protected])
Published by Copernicus Publications on behalf of the European Geosciences Union.
1195

CPD7, 1195–1233, 2011
Sensitivity of RedSea circulationduring the last
interglacial
G. Trommer et al.
Title Page
Abstract Introduction
Conclusions References
Tables Figures
J I
J I
Back Close
Full Screen / Esc
Printer-friendly Version
Interactive Discussion
Discussion
Paper
|D
iscussionP
aper|
Discussion
Paper
|D
iscussionP
aper|
Abstract
This study investigates the response of Red Sea circulation to sea level and insola-tion changes during termination II and across the last interglacial, in comparison withtermination I and the Holocene. Sediment cores from the central and northern partof the Red Sea were investigated by micropaleontological and geochemical proxies.5
The recovery of the planktonic foraminiferal fauna following high salinities during MIS6 took place at similar sea-level stand (∼50 m below present day), and with a simi-lar species succession, as during termination I. This indicates a consistent sensitivityof the basin oceanography and the plankton ecology to sea-level forcing. Based onplanktonic foraminifera, we find that increased water exchange with the Gulf of Aden10
especially occurred during the sea-level highstand of interglacial MIS 5e. From MIS6 to the peak of MIS 5e, northern Red Sea SST increased from 21 ◦C to 25 ◦C, withabout 3 ◦C of this increase taking place during termination II. Changes in planktonicforaminiferal assemblages indicate that the development of the Red Sea oceanogra-phy during MIS 5 was strongly determined by insolation and monsoon strength. The15
SW Monsoon summer circulation mode was enhanced during the termination, causinglow productivity in northern central Red Sea core KL9, marked by high abundance ofG. sacculifer, which – as in the Holocene – followed summer insolation. Core KL11records the northern tip of the intruding intermediate water layer from the Gulf of Adenand its planktonic foraminifera fauna shows evidence for elevated productivity during20
the sea-level highstand in the southern central Red Sea. By the time of MIS 5 sea-levelregression, elevated organic biomarker BIT values suggest denudation of soil organicmatter into the Red Sea and high abundances of G. glutinata, and high reconstructedchlorophyll-a values, indicate an intensified NE Monsoon winter circulation mode. Ourresults imply that the amplitude of insolation fluctuations, and the resulting monsoon25
strength, strongly influence the Red Sea oceanography during sea-level highstands byregulating the intensity of water exchange with the Gulf of Aden. These processesare responsible for the observation that MIS 5e/d is characterized by higher primaryproductivity than the Holocene.
1196

CPD7, 1195–1233, 2011
Sensitivity of RedSea circulationduring the last
interglacial
G. Trommer et al.
Title Page
Abstract Introduction
Conclusions References
Tables Figures
J I
J I
Back Close
Full Screen / Esc
Printer-friendly Version
Interactive Discussion
Discussion
Paper
|D
iscussionP
aper|
Discussion
Paper
|D
iscussionP
aper|
1 Introduction
The Red Sea is an ideal natural laboratory to investigate the interplay between sea-level rise and atmospheric forcing during and after terminations, due to its sensitiv-ity to sea-level fluctuations (Winter et al., 1983; Locke and Thunell, 1988; Thunell etal., 1988; Rohling and Zachariasse, 1996; Rohling et al., 1998, 2008a, b; Fenton et5
al., 2000; Siddall et al., 2003, 2004) and to monsoon-driven oceanographic changes(Almogi-Labin et al., 1991; Hemleben et al., 1996; Biton et al., 2010; Trommer et al.,2010). The restricted connection to the Indian Ocean, the Strait of Bab-el-Mandeb inthe south, and high evaporation rates over the entire basin (Sofianos et al., 2002) de-termine the water exchange with the Gulf of Aden, which results in a circulation pattern10
with a strong gradient of environmental parameters along the basin axis (Weikert etal., 1987; Siccha et al., 2009). Today, the exchange with the Gulf of Aden alternatesseasonally between a three-layer mode during the summer SW Monsoon and a two-layer mode during the winter NE Monsoon (Smeed, 1997, 2004). In winter, a winddriven surface water layer enters the basin from the south (Patzert, 1974), whereas in15
summer, nutrient enriched Gulf of Aden waters enter the basin in an intermediate layer(Souvermezoglou et al., 1989). Evaporation rates in the Red Sea reach ∼2 m a−1 inthe north of the basin, which is reflected by high salinities and relatively cool surfacewater conditions (Sofianos et al., 2002). Overall, the circulation system of the Red Seais anti-estuarine and driven by thermohaline forcing with deep water formation in the20
north (Cember, 1988; Eshel et al., 1994; Sofianos and Johns, 2002, 2003; Manasrah etal., 2004). Large parts of the Red Sea experience highest primary productivity duringthe winter (Veldhuis et al., 1997; Siccha et al., 2009), except of the very southern RedSea, which is influenced by the inflow of the nutrient-rich intermediate water from theGulf of Aden during the summer (Smeed, 1997).25
Since the circulation and water exchange system are primarily dependent on sealevel (Siddall et al., 2003, 2004; Biton et al., 2008), the abundance of plankticforaminifera reflects in first instance salinity conditions (Winter et al., 1983; Locke and
1197

CPD7, 1195–1233, 2011
Sensitivity of RedSea circulationduring the last
interglacial
G. Trommer et al.
Title Page
Abstract Introduction
Conclusions References
Tables Figures
J I
J I
Back Close
Full Screen / Esc
Printer-friendly Version
Interactive Discussion
Discussion
Paper
|D
iscussionP
aper|
Discussion
Paper
|D
iscussionP
aper|
Thunell, 1988; Thunell et al., 1988; Fenton et al., 2000). The sea-level dependent re-covery of the planktic fauna after termination I was investigated for several organismgroups (Winter et al., 1983; Almogi-Labin et al., 1991; Legge et al., 2006; Trommer etal., 2010), and an analysis of the salinity sensitive planktic foraminifera revealed thatsea level must have risen to less than 50–55 m below the present-day level to allow5
establishment of a “normal” marine plankton community (Trommer et al., 2010). It hasbeen inferred that during the Holocene sea-level highstand, atmospheric forcing be-came a key control on the circulation system throughout the Red Sea (Biton et al.,2010; Trommer et al., 2010). In addition, it has been found that the Indian Monsoonexerted an important influence on Red Sea oceanography and its planktic communi-10
ties (Hemleben et al., 1996) due to changes in nutrient availability (Siccha et al., 2009;Trommer et al., 2010) and stratification of the water column (Almogi-Labin et al., 1991).
Compared to present-day and Holocene conditions, the Last Interglacial or marineisotopic stage (MIS) 5e was characterised by unusually high summer insolation, re-sulting in global temperatures up to 2 ◦C higher than today (Otto-Bliesner et al., 2006;15
Jouzel et al., 2007) and significantly reduced continental ice volume (Anklin et al., 1993;Cuffey and Marshall, 2000; Lambeck and Chappell, 2001; Otto-Bliesner et al., 2006;Rohling et al., 2008b; Kopp et al., 2009). Sea-level reconstructions suggest that duringtermination II sea level rose in two steps with similar rates as during termination I (Sid-dall et al., 2003, 2006; Rohling et al., 2008b), reaching a mean level at 4–6 m above the20
present, with potential peaks up to 8±1 m (Plaziat et al., 1995; McCulloch and Esat,2000; Orszag-Sperber et al., 2001; Siddall et al., 2006; Rohling et al., 2008b, Koppet al., 2009; Muhs et al., 2011). As a consequence of the strong summer insolation,intensified monsoonal conditions with levels of rainfall exceeding that observed duringthe corresponding early Holocene insolation maximum are recorded from regions re-25
flecting the African Monsoon (Rossignol-Strick, 1983; Rohling et al., 2004; Weldeabet al., 2007), the Asian Monsoon (Wu et al., 2002; Chen et al., 2003; Yuan et al.,2004; Wang et al., 2008) and the Indian Monsoon (Van Campo et al., 1982; Clemenset al., 1991). The high summer insolation seems to have led to a northward shift of
1198
CPD7, 1195–1233, 2011
Sensitivity of RedSea circulationduring the last
interglacial
G. Trommer et al.
Title Page
Abstract Introduction
Conclusions References
Tables Figures
J I
J I
Back Close
Full Screen / Esc
Printer-friendly Version
Interactive Discussion
Discussion
Paper
|D
iscussionP
aper|
Discussion
Paper
|D
iscussionP
aper|
monsoonal rainfall as recorded by speleothems in Oman (Burns et al., 1998, 2001;Fleitmann et al., 2003), and Mediterranean sapropels (Rohling et al., 2002, Osborne etal., 2008). Such a northward migration of the summer position of the Intertropical Con-vergence Zone (ITCZ) is also supported by model simulations (Montoya et al., 2000;Herold and Lohmann, 2009).5
However, it remains to be established to what extent, and according to what re-lationships, the more intense monsoon and higher sea level of MIS 5e affected theRed Sea oceanography. To provide answers, we investigate termination II (which hadsimilar rates of sea-level rise as termination I; Siddall et al., 2003, 2006; Rohling etal., 2008b), and MIS 5e, when summer insolation was enhanced and sea level stood10
higher relative to the Holocene. For this purpose, we present new high-resolution mi-cropaleontological data from marine sediment cores in the Red Sea, along with organicgeochemical data. Primary productivity, an indicator of circulation modes in the RedSea (Veldhuis et al., 1997) is estimated using planktic foraminiferal transfer functions(Siccha et al., 2009). Sea surface temperature (SST) is estimated for the northern15
Red Sea using the TEX86 proxy (TetraEther Index of ketones with 86 carbon atoms,Schouten et al., 2002), with a Red Sea-specific calibration (Trommer et al., 2009). Thisindex is based on glycerol dialkyl glycerol tetraether (GDGT) membrane lipids of ma-rine Crenarchaeota, which are widespread in open ocean settings (Fuhrman et al.,1992; Hoefs et al., 1997; Schouten et al., 2000; Sinninghe Damste et al., 2002; Herndl20
et al., 2005). Recent investigations suggest that the Red Sea may harbour an endemicpopulation of Crenarchaeota with a specific TEX86 vs. SST relationship (Trommer etal., 2009). Today, this endemic Crenarchaeota population occurs in the central andsouthern Red Sea together with the open ocean population (Kim et al., 2008, 2010)that enters the basin from the south, which results in a mixture of two different GDGT25
signals in the southern and central Red Sea (Trommer et al., 2009). We use this mixedGDGT signal in the central Red Sea to estimate the exchange rate with the Gulf ofAden relative to modern conditions, based on a simple two end-member mixing model(Biton et al., 2010).
1199

CPD7, 1195–1233, 2011
Sensitivity of RedSea circulationduring the last
interglacial
G. Trommer et al.
Title Page
Abstract Introduction
Conclusions References
Tables Figures
J I
J I
Back Close
Full Screen / Esc
Printer-friendly Version
Interactive Discussion
Discussion
Paper
|D
iscussionP
aper|
Discussion
Paper
|D
iscussionP
aper|
2 Material and methods
In order to detect shifts in the circulation pattern and corresponding changes in primaryproductivity in the Red Sea, planktic foraminiferal faunal assemblages were investi-gated from two marine sediment cores in the central Red Sea (Meteor cruise M5/2, pis-ton core GeoTu-KL9, 19◦57.6′ N, 38◦06.3′ E, and piston core GeoTu-KL11, 18◦45.6′ N,5
39◦21.3′ E, Fig. 1).The core section of KL9 corresponding to MIS 6 – MIS 5d (387 cm–510 cm, ∼107–
148 ka BP, see also Rohling et al., 2008a, b) was sampled in 1 cm resolution and indi-vidual samples (n= 77) were dried, weighed and washed over a >63 µm mesh; driedagain, sieved over >150 µm and split with an ASC Scientific microsplitter. For KL11,10
the >150 µm fraction of existing samples (653 cm–700 cm, Schmelzer, 1998) was anal-ysed and combined with newly taken additional samples (620 cm–653 cm), which wereprocessed as for KL9. Altogether a total of 77 samples were analysed for KL11. Wherepossible, aliquots containing at least 300 planktic foraminifera were counted and iden-tified to species level, following the taxonomy of Hemleben et al. (1989). Existing mi-15
cropaleontological data (size fraction >250 µm) from a sediment core in the northernRed Sea (KL23, 25◦44.9′ N, 35◦03.3′ E, Fig. 1, Geiselhart, 1998; Schmelzer, 1998)were used to compare trends in faunal community composition along the basin axis, todetermine which changes occurred in the entire Red Sea, possibly reflecting the influ-ence of variability in the Indian Monsoon system. Additionally, we applied for the central20
Red Sea cores several transfer function approaches (see Siccha et al., 2009) to recon-struct chlorophyll-a concentrations in surface waters based on the planktic foraminiferalassemblage composition in the sediments. To this end, we used the software C2 (Jug-gins, 2003) and performed transfer functions with the Weighted Average-Partial LeastSquare (WA-PLS) method, the Modern Analogue Technique (MAT) and the Imbrie and25
Kipp method (IKM). Analogy of the fossil assemblages to modern ones was tested byapplying a principal component analysis (PCA) on log-transformed faunal data afterremoval of species with total overall abundances <1% (Siccha et al., 2009).
1200

CPD7, 1195–1233, 2011
Sensitivity of RedSea circulationduring the last
interglacial
G. Trommer et al.
Title Page
Abstract Introduction
Conclusions References
Tables Figures
J I
J I
Back Close
Full Screen / Esc
Printer-friendly Version
Interactive Discussion
Discussion
Paper
|D
iscussionP
aper|
Discussion
Paper
|D
iscussionP
aper|
In addition to the faunal counts, the abundance of GDGT membrane lipids of marineCrenarchaeota were analysed in sediment samples from cores KL9 (n=15) and KL23(n= 15). The northern Red Sea core KL23 is well suited for reconstructing SST byapplying the TEX86 proxy with the Red Sea calibration (Trommer et al., 2009). In thecentral Red Sea, TEX86 can potentially be used to detect changes in the mixing regime5
during the termination between the endemic Red Sea GDGT signal and the intrudingGulf of Aden water carrying an open ocean GDGT signal. In addition to the TEX86,the BIT (Branched Isoprenoid Tetraether) index (Hopmans et al., 2004) can be derivedfrom GDGT analyses that include the soil derived branched tetraether lipids (Hopmanset al., 2004). The BIT index is used as an indicator for the relative contribution of soil10
organic matter (Kim et al., 2006; Weijers et al., 2006; Walsh et al., 2008), transportedinto the Red Sea in the past. Today, the surrounding desert conditions and the lack oflarge rivers draining into the basin do not suggest a large input of soil derived GDGTsas shown by low BIT values (<0.1) in the Red Sea surface sediments (Trommer et al.,2009).15
For the extraction of GDGTs, at least 8 g of sediment were freeze-dried and ho-mogenized before being extracted with an accelerated solvent extractor (ASE 200,Dionex) using dichloromethane (DCM)/MeOH, 9:1 (v:v) at 100 ◦C and 7.6×10⁶ Pa.For GDGT analyses, the extract was dried under N2, separated in an apolar and polarfraction, the polar fraction was re-dissolved in hexane/isopropanol (99:1) and filtered20
before performing high performance liquid chromatography (HPLC) atmospheric pres-sure chemical ionization (APCI) mass spectrometry (MS), according to Hopmans etal. (2000) and Schouten et al. (2007). Areas of GDGTs in mass chromatograms weremanually integrated and the TEX86 index was calculated after Schouten et al. (2002),where GDGTs 1–3 represent GDGTs with 1–3 cyclopentane moieties, respectively,25
and GDGT 4′ represents the regio-isomer of crenarchaeol:
TEX86 =[GDGT2]+ [GDGT3]+ [GDGT4′]
[GDGT1]+ [GDGT2]+ [GDGT3]+ [GDGT4′](1)
1201

CPD7, 1195–1233, 2011
Sensitivity of RedSea circulationduring the last
interglacial
G. Trommer et al.
Title Page
Abstract Introduction
Conclusions References
Tables Figures
J I
J I
Back Close
Full Screen / Esc
Printer-friendly Version
Interactive Discussion
Discussion
Paper
|D
iscussionP
aper|
Discussion
Paper
|D
iscussionP
aper|
For the northern Red Sea core KL23, TEX86 values were used to reconstruct SST byapplying the northern Red Sea calibration of Trommer et al. (2009):
SST= (TEX86+0.09)/0.035 (2)
The BIT index is based on the relative abundance of branched GDGTs, represent-ing soil organic matter, and crenarchaeol, representing aquatic organic matter, and is5
defined as:
BIT=[GDGT5]+ [GDGT6]+ [GDGT7]
[GDGT5]+ [GDGT6]+ [GDGT7]+ [GDGT4](3)
With GDGT 5–7 being the soil derived branched GDGTs with 4–6 methyl groups andGDGT 4 being crenarchaeol, the biomarker for Crenarchaeota (Hopmans et al., 2004).
3 Results10
3.1 Age model
For the age model development, oxygen isotope data for KL23 (Badawi et al., 2005)and high resolution data for KL9 and KL11 (Rohling et al., 2008b) were correlated.Recently, Rohling et al. (2009) correlated a high resolution δ18O record of KL9 withthe Antarctic Temperature anomaly (∆TAA) record (Jouzel et al., 2007). However, to15
maintain our records comparable with other studies from the Red Sea, the Gulf ofAden and the latest sea-level study on the last interglacial (Kopp et al., 2009), we haveused the age model of Rohling et al. (2008b). Since there is no scientific concordanceabout the exact stratigraphic location of the MIS 5e boundaries (Shackleton et al.,2003) or their ages (e.g., Imbrie et al., 1984; Winograd et al., 1992; Henderson and20
Slowey, 2000; Thompson and Goldstein, 2005; Thomas et al., 2009), the boundariesare not used for developing the age model, but are indicated only for visual orientationin the graphics. Following Lisiecki and Raymo (2005) and Rohling et al. (2008b), sea-level maximum was set at 123 ka BP and other control points were defined by visual
1202

CPD7, 1195–1233, 2011
Sensitivity of RedSea circulationduring the last
interglacial
G. Trommer et al.
Title Page
Abstract Introduction
Conclusions References
Tables Figures
J I
J I
Back Close
Full Screen / Esc
Printer-friendly Version
Interactive Discussion
Discussion
Paper
|D
iscussionP
aper|
Discussion
Paper
|D
iscussionP
aper|
correlation of the benthic foraminiferal δ18O record of Lisiecki and Raymo (2005) andthe SPECMAP δ18O record (Imbrie et al., 1984, Table 1, Fig. 2). The simple agemodel for relative comparison of the Red sea cores was derived by linear interpolationbetween these control points.
3.2 Planktic foraminiferal analyses5
Foraminiferal faunal assemblages were analysed in 77 samples of the central Red Seacore KL9 from ∼148–107 ka BP. Seven samples (∼143–129 ka BP) originate from an“aplanktonic zone” (Fenton et al., 2000), where the total number of planktic foraminiferawas below 300 per sample (1.6 cm3). For the 77 samples of KL11 the observed timeperiod lasts from ∼133–111 ka BP (Fig. 3) with the “aplanktonic zone” from the begin-10
ning of our record until ∼130 ka BP (nine samples).We observed a total of 24 species in KL9 (22 in KL11), of which 17 occur at least
once with relative abundance >1%. The assemblage is dominated by eight species,which make up >97% (>90% in KL11) of the fauna: Globigerinita glutinata, Globiger-inella calida, Globigerinella siphonifera, Globigerinoides ruber, Globigerinoides sac-15
culifer, Globoturborotalita rubescens, Globoturborotalita tenella, and Tenuitella park-erae. Concerning the species G. ruber, in KL11 occasionally the pink variety wasfound (∼1.5% of all G. ruber ) until ∼125 ka BP, in KL9 only specimens of the white va-riety were found. The pink variety is known to have survived in the Indian Ocean untilabout 120 ka BP ago (Thompson et al., 1979). The foraminiferal fauna of the two cores20
(Fig. 3) resembles that of the nearby core MD1017 (Fenton et al., 2000) and showssimilarities to KL23 (Fig. 3, Schmelzer, 1998; Geiselhart, 1998).
The glacial MIS 6 is only represented by some samples of KL9. Up to the aplanktoniczone, G. ruber dominates the foraminiferal fauna, while G. glutinata reaches higherabundances at the boundary of the aplanktonic zone. At termination II, the transition25
into MIS 5e, absolute foraminiferal numbers increase faster in KL11 than in KL9 and G.sacculifer is the leading species during the reestablishment of the foraminiferal fauna
1203

CPD7, 1195–1233, 2011
Sensitivity of RedSea circulationduring the last
interglacial
G. Trommer et al.
Title Page
Abstract Introduction
Conclusions References
Tables Figures
J I
J I
Back Close
Full Screen / Esc
Printer-friendly Version
Interactive Discussion
Discussion
Paper
|D
iscussionP
aper|
Discussion
Paper
|D
iscussionP
aper|
in the central to northern Red Sea (Fig. 3). The period of reestablishment lasts until∼126–127 ka BP, when absolute abundances reach values similar to those after termi-nation I (Trommer et al., 2010), indicating that the surface salinity was within tolerancelimits of all registered species. Highest planktic foraminiferal abundances occur beforethe sea-level maximum in KL11 at ∼125 ka BP and ∼2.5 ka later in KL9, and in each5
case the three main species (G. glutinata, G. ruber, and G. sacculifer ) occur in more orless equal numbers. After the absolute abundance maxima, G. glutinata dominates theforaminiferal fauna for the next 12 ka in KL9, reaching a second absolute abundancemaximum at ∼116.5 ka BP and maintaining the dominant species until the end of therecord in KL11. G. ruber shows similar trends as G. glutinata, whereas G. sacculifer10
almost completely vanishes. At the end of the KL9 record, G. glutinata abundancesbreak down and G. ruber dominates a depauperate assemblage with low total num-bers, indicating rising salinity due to sea-level lowering.
The general trend for G. ruber and G. sacculifer can also be observed in the>250 µm fraction counts from KL23 (Fig. 3). G. sacculifer is dominating the15
foraminiferal fauna after termination II, followed by G. ruber, which reaches maximumabundances at ∼116 ka BP. G. glutinata is present in very low abundances in the north-ern Red Sea today (Siccha et al., 2009), but due to the analysed large size fraction inKL23 this small species is underrepresented in this core. Between ∼112 and 106 ka BP,G. sacculifer takes over as most abundant species in KL23, whereas G. ruber and G.20
glutinata continue to dominate the assemblage in central Red Sea cores (Fig. 3).
3.3 Reconstruction of surface productivity using foraminiferaltransfer functions
To ensure the correct interpretation of the applied transfer functions, the analysedforaminiferal assemblages of KL9 and KL11 were first tested for analogy with mod-25
ern assemblages by a common PCA with the calibration data set (Siccha et al., 2009).Analogy between the fossil assemblages and the calibration data set is achieved forsamples with overlapping component values (Fig. 4a). This is the case for samples
1204

CPD7, 1195–1233, 2011
Sensitivity of RedSea circulationduring the last
interglacial
G. Trommer et al.
Title Page
Abstract Introduction
Conclusions References
Tables Figures
J I
J I
Back Close
Full Screen / Esc
Printer-friendly Version
Interactive Discussion
Discussion
Paper
|D
iscussionP
aper|
Discussion
Paper
|D
iscussionP
aper|
in the periods ∼129–121 ka BP and ∼112–107 ka BP in KL9, and in KL11 only from127 until 121 ka. Non-analogue conditions in both cores were determined for glacialconditions and highest G. glutinata abundances. At present, high abundances of G.glutinata are observed in the southern Red Sea (Auras-Schudnagies et al., 1989; Sic-cha et al., 2009), but the difference between MIS 6/5d and the calibration data set most5
likely derives from the continuous presence of G. tenella in the MIS 6/5d samples. G.tenella is found in core top samples only in the northern Red Sea (Siccha et al., 2009)and is almost absent in regions were G. glutinata is present, causing non-analogueconditions between MIS 6/5d to the calibration data set (Fig. 4b). It is not known un-der which specific conditions G. tenella thrives and it must be concluded that absolute10
reconstructed chlorophyll-a values of the transfer functions are not reliable during theperiod that has no modern analogue.
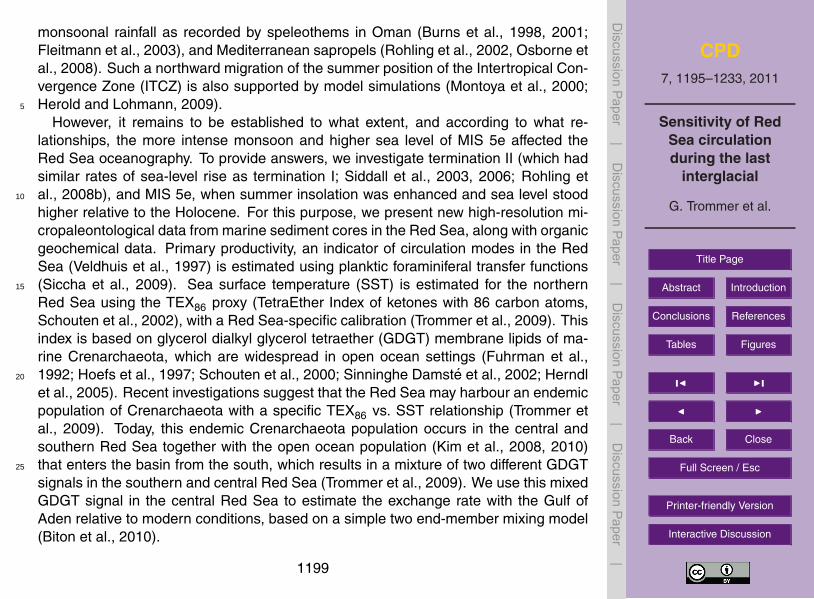
All applied transfer functions (MAT-, WA-PLS- and IKM-approaches) on theforaminiferal assemblages of the observed period displayed the same trends in produc-tivity, which is why we show only the WA-PLS results (best performance after Siccha et15
al., 2009, Fig. 5b). During termination II, when G. sacculifer reaches maximum abun-dances (Fig. 5c), reconstructed chlorophyll-a values are low and lie mostly under thepresent day value at the core position in the central Red Sea (Fig. 5b). With increas-ing G. glutinata abundances, reconstructed chlorophyll-a values increase, reachingmodern productivity conditions in the central Red Sea between 127–125 ka BP. The20
increasing productivity trend continues, following the increase in G. glutinata and de-crease in G. sacculifer, until chlorophyll-a values return to modern conditions in KL9 at∼110 ka BP. Absolute values between 121–112 ka BP are not reliable due to the lackof present day faunal analogues, but the high abundance of G. glutinata indicates thatproductivity was higher than today and during the Holocene (Trommer et al., 2010)25
in the central Red Sea, as this species is often associated with elevated productivity(Cullen and Prell, 1984; Naidu and Malmgren, 1996; Schulz et al., 2002).
1205

CPD7, 1195–1233, 2011
Sensitivity of RedSea circulationduring the last
interglacial
G. Trommer et al.
Title Page
Abstract Introduction
Conclusions References
Tables Figures
J I
J I
Back Close
Full Screen / Esc
Printer-friendly Version
Interactive Discussion
Discussion
Paper
|D
iscussionP
aper|
Discussion
Paper
|D
iscussionP
aper|
3.4 TEX86 and BIT index
TEX86 and BIT indices of cores KL9 and KL23 display similar trends. TEX86 increasesin both cores from glacial to interglacial (Fig. 6b), while KL23 shows generally lowerTEX86 values than KL9, which is consistent with recent temperature differences in thenorthern compared to in the central Red Sea (Conkright et al., 2001). TEX86 values5
from KL9 range from 0.68 to 0.86 and for KL23 from 0.63 to 0.79. From ∼129 to125 ka BP, a steep increase in the TEX86 of KL23 is observed, which coincides with thedecrease in foraminiferal δ18O during the termination (Fig. 6).
In contrast to the TEX86 trends, the BIT indices of the core records of KL23 andKL9 show strong fluctuations (Fig. 6c). During the MIS 6/5 transition the BIT values10
are relatively low (0–0.2), and they rise in both cores to around 0.45–0.55 in the latterpart of MIS 5e. In KL9 an earlier maximum can be observed during the glacial, around∼145 ka BP. At present, BIT values in subsurface sediments throughout the Red Seaare lower than 0.1 (Trommer et al., 2009) and the observed peak values during MIS 5eare comparable with coastal settings in southern France, where significant amounts of15
soil organic matter is supplied through fluvial transport in the Mediterranean Sea (Kimet al., 2006, 2010). An enhanced input of soil organic matter (SOM) can potentiallyinfluence the TEX86. But since there is no conspicuous total organic carbon maximumrecorded from this time in the central Red Sea (Rohling et al., 1998) and there does notseem to be a consistent change in TEX86 coinciding with the change in BIT, it seems20
that the TEX86 is not biased to a large degree by influx of SOM in the Red Sea and wepreliminary consider SST to control the TEX86 signal.
Therefore, we use the TEX86 in the northern Red Sea core KL23 to estimate SSTwith the recently developed Red Sea TEX86 calibration (Trommer et al., 2009). Cal-culated SSTs indicate a SST increase from 21 to 25 ◦C (±0.5 ◦C, combined analytical25
(Schouten et al., 2007) and calibration error, Trommer et al., 2009) from the glacialto interglacial with a possible minor SST peak of 24.5 ◦C shortly before the δ18Ominimum/sea-level maximum (Fig. 6b). SST can not be directly inferred from the Red
1206

CPD7, 1195–1233, 2011
Sensitivity of RedSea circulationduring the last
interglacial
G. Trommer et al.
Title Page
Abstract Introduction
Conclusions References
Tables Figures
J I
J I
Back Close
Full Screen / Esc
Printer-friendly Version
Interactive Discussion
Discussion
Paper
|D
iscussionP
aper|
Discussion
Paper
|D
iscussionP
aper|
Sea TEX86 calibration in KL9 as this core lies in an area which is considered to beinfluenced by an open ocean GDGT signal advected from the open ocean during in-terglacials (Trommer et al., 2009). In the discussion, we therefore explore whetherthe central Red Sea TEX86 signal can be interpreted as a relatively pure (endemic)SST signal during glacials, and as a mixture of (endemic) Red Sea and (advected)5
open-ocean signals during the termination and interglacial.
4 Discussion
4.1 Climate conditions during termination II and sea-level maximum
Planktic foraminifera reappeared in the central Red Sea at about 130 ka BP, which isabout 2 ka earlier than in the northern Red Sea (128 ka BP in KL23) (Fig. 3). At this10
time, sea level stood about 70 m lower than today (Fig. 3, 5a) and salinity must havedropped below 47, the salinity tolerance limit of G. sacculifer (Hemleben et al., 1989).The complete recovery of the foraminiferal fauna in terms of abundance occurred ataround 127–126 ka BP, at similar sea level to the complete recovery during terminationI (approximately 50–55 m below the present-day level) (Trommer et al., 2010), and is15
also characterised by a similar succession of species. This finding indicates a regularresponse of the Red Sea oceanography and planktic foraminifera community duringterminations with similar rates of sea-level rises.
The dominance of G. sacculifer in KL9 after termination II, lasting approximately∼5 ka, is similar to what was observed during termination I (overlapping samples in20
Fig. 7) (Geiselhart, 1998; Schmelzer, 1998; Fenton et al., 2000; Trommer et al., 2010).For termination I, this has been interpreted as the result of oligotrophic conditions inthe central Red Sea caused by strengthened summer circulation mode (Trommer etal., 2010), which was corroborated by modelling results (Biton et al., 2010). Duringtermination II, G. sacculifer abundance changes appear to follow the summer insola-25
tion trend, in a similar manner as during the early Holocene (Fig. 8). The temporal
1207

CPD7, 1195–1233, 2011
Sensitivity of RedSea circulationduring the last
interglacial
G. Trommer et al.
Title Page
Abstract Introduction
Conclusions References
Tables Figures
J I
J I
Back Close
Full Screen / Esc
Printer-friendly Version
Interactive Discussion
Discussion
Paper
|D
iscussionP
aper|
Discussion
Paper
|D
iscussionP
aper|
coincidence of the changes in foraminiferal abundances during both insolation maximapoints towards the same cause and effect mechanism acting during MIS 5e and theearly Holocene period, with a dominating effect of the enhanced Indian SW Monsoon.Although KL11 lies in the central Red Sea, the foraminiferal faunas are rich in G. gluti-nata, as found today only in the southern Red Sea. We propose that this results from a5
strong summer circulation during a regime of enhanced Indian SW Monsoons (shadedarea in Fig. 8). This would cause the KL11 site being affected by intruding nutrient-rich(intermediate-depth) waters from the south, causing chlorophyll-a values that are morethan twice as high as today (Fig. 5b). At the same time, KL9 site remained beyondthe influence of the intruding waters, and thus its reconstructed chlorophyll-a values10
remained comparable to present-day values (Fig. 5b). Such an intensified inflow ofsubsurface water into the Red Sea during MIS 5e could also explain the discrepancybetween the oxygen isotope records of KL9 and KL11 and the resulting sea-level re-construction (Fig. 5a). Whereas the annual mean sea surface temperature at the site ofKL11 today is 0.5 ◦C higher than at the site of KL9 (Conkright et al., 2001), a northward15
shift of the warm surface waters to KL9 and penetration of cooler waters from the southto KL11 would result in a lighter oxygen isotope ratio in planktic foraminiferal tests inKL9, relative to KL11. A temperature difference of +1 ◦C (annual mean) at KL9, relativeto KL11, would explain the ∼0.2‰ difference in the oxygen isotope ratios between thecores (Fig. 2) and the sea-level reconstruction incongruity as indicated by Rohling et20
al. (2009).TEX86 values for the northern Red Sea (KL23) during termination II reveal an SST
increase of ∼3 ◦C from 129 to 125 ka (Fig. 6, 9), which is consistent with estimates ofSST increases in the Arabian Sea (Emeis et al., 1995; Rostek et al., 1997; Saher etal., 2009) and similar to the magnitude of SST changes in tropical oceans across ter-25
mination II (McCulloch and Esat, 2000; Kukla et al., 2002). The SST increase duringthe termination I in the northern Red Sea was reported as about 1 ◦C (TEX86 recon-struction, Trommer et al., 2010) or 2 ◦C (UK
37 reconstruction, Arz et al., 2007).
1208

CPD7, 1195–1233, 2011
Sensitivity of RedSea circulationduring the last
interglacial
G. Trommer et al.
Title Page
Abstract Introduction
Conclusions References
Tables Figures
J I
J I
Back Close
Full Screen / Esc
Printer-friendly Version
Interactive Discussion
Discussion
Paper
|D
iscussionP
aper|
Discussion
Paper
|D
iscussionP
aper|
The TEX86 trend during termination II in central Red Sea core KL9 must be consid-ered as a mixed signal between an endemic Red Sea GDGT signal and an advectedopen ocean signal. At present, the calibration of Trommer et al. (2009) suggests about72% of the endemic Red Sea Crenarchaeota population and 28% from the open-oceanpopulation, at the site of KL9. The degree of admixture of the open ocean Crenar-5
chaeota signal could be influenced by sea-level change, because this severely affectsthe water exchange between the Red Sea and the open ocean. At low sea level, suchas during the time before the recovery of planktic foraminiferal faunas in termination II,exchange between the Red Sea and Gulf of Aden was severely restricted (Rohling andZachariasse, 1996; Rohling et al., 1998; Siddall et al., 2003, 2004; Biton et al., 2008),10
such that enhanced water residence times cause salinities in the Red Sea strongly inexcess of 47. With such limited exchange, advection of significant amounts of open-ocean GDGTs into the Red Sea is unlikely. Assuming no exchange over the entireobserved period, this would theoretically imply an SST increase of 4–4.5 ◦C in totalfrom MIS 6 to MIS 5e, with only ∼1 ◦C change during the actual termination (Fig. 9,15
100/0). But as sea level rose, improved exchange caused salinity to drop below the 47threshold, and also would have increased the potential for advection (and maybe sur-vival) of the open-ocean GDGT signal into the Red Sea. Accordingly, we assume thatbefore 130 ka BP the central Red Sea TEX86 signal derived exclusively from NorthernRed Sea Crenarchaeota (and hence TEX86 values reflect SST following the Trommer20
et al. (2009) calibration) (Fig. 9). Given that sea level rose towards higher levels thantoday during MIS 5e (Plaziat et al., 1995; McCulloch and Esat, 2000; Orszag-Sperberet al., 2001; Siddall et al., 2006; Rohling et al., 2008b, Kopp et al., 2009; Muhs et al.,2011), it is highly likely that after 130 ka BP mixing between the two populations wouldhave had taken place, so that the TEX86 values cannot be straightforwardly interpreted25
in terms of SST. Instead, they would represent a mixing product between the endemicRed Sea and open ocean populations.
Following Biton et al. (2010), we calculate the contributions of the different GDGT sig-nals by assuming that the SST trend at KL9 was similar to that at KL23, with a constant
1209

CPD7, 1195–1233, 2011
Sensitivity of RedSea circulationduring the last
interglacial
G. Trommer et al.
Title Page
Abstract Introduction
Conclusions References
Tables Figures
J I
J I
Back Close
Full Screen / Esc
Printer-friendly Version
Interactive Discussion
Discussion
Paper
|D
iscussionP
aper|
Discussion
Paper
|D
iscussionP
aper|
offset of 3 ◦C, as found today. These calculations suggest that the Crenarchaeota pop-ulation at the site of KL9 would consist of 69% Northern Red Sea population and 31%of the open ocean population during MIS 5e (Fig. 9), which is within the uncertaintiessimilar to the observed modern mixing relationship at that site (Trommer et al., 2009).
Unlike at termination I, there is no sapropel-like (anoxic sediment) layer at or af-5
ter termination II in the investigated cores. Since rates of sea-level rise were roughlysimilar during termination II and termination I (Siddall et al., 2003, 2006; Rohling etal., 2008b), other processes need to be inferred to explain the lack of a terminationII sapropel. Arid climate conditions and water mass cooling through high evaporationrates promote deep water formation today in the northern Red Sea (Eshel et al., 1994;10
Eshel and Naik, 1997; Manasrah et al., 2004). In addition to very arid climate con-ditions during termination II (Bar-Matthews et al., 2003; Fleitmann et al., 2003), wepropose that the mid-termination drop in sea level (Esat, 1999; Siddall et al., 2006;Thomas et al., 2009) may have caused intermittently sufficient salinity increase in theRed Sea to cause improved ventilation and prevent the build-up of anoxic conditions15
during termination II.After termination II, we observe an increase in the BIT index in both cores that culmi-
nates between 122 and 120 ka BP, 1.5–3 ka after the sea-level highstand. The elevatedBIT index suggests a relative increase in the input of SOM (Hopmans et al., 2004; Wei-jers et al., 2006; Kim et al., 2006; Walsh et al., 2008). A first potential mechanism for20
delivering soil material into the Red Sea would be through flooding of the basin’s wideshelf areas during sea-level rise, but this does not agree with the timing of the GDGTdeposition several millennia after the actual sea-level rise (Fig. 6). A second potentialexplanation might be that the higher BIT values resulted from decreased levels of cre-narchaeol and thus Crenarchaeota productivity (cf. Castaneda et al., 2010). But given25
that chlorophyll-a reconstructions suggest higher productivity during this period, andthat the TEX86 index (which considers the Crenarchaeol isomer) shows no consistentchange, the increase of BIT as a sign of decrease in Crenarchaeol is not supportable.
1210

CPD7, 1195–1233, 2011
Sensitivity of RedSea circulationduring the last
interglacial
G. Trommer et al.
Title Page
Abstract Introduction
Conclusions References
Tables Figures
J I
J I
Back Close
Full Screen / Esc
Printer-friendly Version
Interactive Discussion
Discussion
Paper
|D
iscussionP
aper|
Discussion
Paper
|D
iscussionP
aper|
The third, and most likely, explanation for the observed increase in the BIT indexmight be through enhanced river-discharge of SOM. There is a plausible river systemthat drains the Baraka (Tokar) catchment in Sudan (Fig. 1), which today is active 40–70 days per year (mainly during autumn), discharging between 200 and 970×106 m3
water at 18.5 ◦ N into the Red Sea (Whiteman, 1971). Records from the Red Sea Moun-5
tains in Egypt also show depositions from a wet period of local significance (Moeyer-sons et al., 2002) and speleothem records around the Red Sea suggest increasing rain-falls/humidity with the beginning of MIS 5e in Oman (Fleitmann et al., 2003) and from124–119 ka BP in Israel (Bar-Matthews et al., 2003). This period of relatively enhancedprecipitation was coincident with a period of strong insolation-forced African Monsoons10
that caused intense sapropel formation in the eastern Mediterranean (Rossignol-Strick,1983; Rohling et al., 2002; van der Meer et al., 2007; Osborne et al., 2008). It is possi-ble that, as aridity increased and vegetation weakened after ∼122–120 ka BP, season-ally still significant rainfalls were able to wash out SOM into the Red Sea and causedthese elevated BIT values. Although SOM import from such a system could be locally15
measurable, it has to be emphasised that the system’s modern freshwater flux is equiv-alent to at most 2 mm of sea level when distributed over the entire Red Sea. Even ahypothetical 100-fold increase in its flux during MIS 5e, the total freshwater flux wouldremain a negligible term in the overall Red Sea freshwater budget, and hence in theRed Sea sea-level method.20
4.2 Oceanography of MIS 5 after the sea-level maximum
After the sea-level maximum and with rising BIT, G. glutinata starts to dominate theassemblage at the KL9 core position for over 10 ka. This differs from the faunal assem-blage changes at this site during the Holocene and the present (Figs. 4, 7) and likelyreflects a different oceanographic situation. The observed dominance of G. glutinata in25
the central Red Sea (see also Fenton, 1998) is unique, since highest G. glutinata abun-dances in the Red Sea are today observed only in the very south (Auras-Schudnagieset al., 1989; Siccha et al., 2009). G. glutinata occurs in general in productive regions
1211

CPD7, 1195–1233, 2011
Sensitivity of RedSea circulationduring the last
interglacial
G. Trommer et al.
Title Page
Abstract Introduction
Conclusions References
Tables Figures
J I
J I
Back Close
Full Screen / Esc
Printer-friendly Version
Interactive Discussion
Discussion
Paper
|D
iscussionP
aper|
Discussion
Paper
|D
iscussionP
aper|
(Cullen and Prell, 1984; Naidu and Malmgren, 1996; Schulz et al., 2002; Storz et al.,2009), suggesting that the cause of this increase is indeed linked to productivity, asindicated by our transfer function results, although absolute values have to be takenwith care due to non-analogy to modern conditions (Fig. 5). Concomitant with the G.glutinata trend in the central Red Sea, a G. ruber maximum occurs in the record of5
KL23 (Fig. 3), which points to a significant change in the circulation system affectingthe Red Sea far north.
The timing of the G. glutinata increase in KL11 could be viewed as an expression ofincreased nutrient advection from the Gulf of Aden into the Red Sea due to high sealevel and strong SW Monsoon circulation. But this scenario does not explain the further10
rise of G. glutinata abundances as also seen in KL9, following the winter insolation in-crease (Fig. 8), while sea level was falling (Rohling et al., 2008b) and the SW Monsoonwas weakening (Fleitmann et al., 2003). After ∼ 120 ka BP, productivity reconstructionsfor KL9 and KL11 reach similar levels (Fig. 5b) and oxygen isotope ratios are also sim-ilar (Fig. 5a), which suggests that the foraminifera lived in same water masses at the15
core positions. Modern observations show that winter is the more productive seasonin the central to northern Red Sea (Veldhuis et al., 1997). Consequently, the observedproductivity increase may suggest more pronounced winter conditions, which followedthe period of enhanced Indian SW Monsoon circulation.
Strong SW Monsoons were obviously limited to peak interglacial MIS 5e (Burns20
et al., 1998, 2001; Fleitmann et al., 2003) before sea-level regression heralds moreglacial conditions (Anklin et al., 1993) and the NE Monsoon became enhanced (Ros-tek et al., 1997). At the same time as our G. glutinata peak, Reichart et al. (1997)report dry glacial-like conditions from Murray Ridge in the Arabian Sea, and there isevidence for increased NE winter monsoonal winds over the Arabian Sea (Montoya25
et al., 2000), which are held responsible for a productivity maximum (Rostek et al.,1997; Ivanova et al., 2003). Benthic foraminiferal faunas from the Red Sea (Badawiet al., 2005) and the Gulf of Aden (Almogi-Labin et al., 2000) also suggest a shortproductivity peak under enhanced NE Monsoon conditions. The sensitivity of Red Sea
1212

CPD7, 1195–1233, 2011
Sensitivity of RedSea circulationduring the last
interglacial
G. Trommer et al.
Title Page
Abstract Introduction
Conclusions References
Tables Figures
J I
J I
Back Close
Full Screen / Esc
Printer-friendly Version
Interactive Discussion
Discussion
Paper
|D
iscussionP
aper|
Discussion
Paper
|D
iscussionP
aper|
circulation to atmospheric forcing is perhaps best demonstrated by the fact that therelative abundance changes of G. glutinata not only follow the changes in winter inso-lation (Fig. 8), but even reflect the higher amplitude of the insolation changes duringMIS 5 relative to those during the Holocene.
5 Conclusions5
The investigation of termination II and interglacial stages MIS 5e-d with newly devel-oped multi-proxy data reveals similarities to termination I and the Holocene. Duringboth terminations, the planktic foraminiferal faunas recovered from glacial aplanktonicconditions at similar rates and with a similar sensitivity to sea level, following the samespecies succession (with G. sacculifer as the leading species). We find that higher10
sea level during MIS 5e alone had no superior effect on the Red Sea circulation, butthat it was instead dominated by the insolation-driven intense Indian SW Monsoon.Changes in the abundance of G. sacculifer closely followed the summer insolation pat-tern. The abundance of this species reflects oligotrophic summer conditions during astrong prevailing SW monsoon, which is reflected in low chlorophyll-a reconstructions15
for the central Red Sea. A subsequent productivity maximum is reconstructed between122 and 112 ka BP, based on high abundances of especially G. glutinata. This is in-terpreted in terms of more pronounced winter circulation at a time when the climateconditions became characterized by an intensification of the NE monsoon.
Our GDGT results suggest that the application of the TEX86 on glacial-interglacial20
timescales in the Red Sea gives reasonable SST estimates in the northern Red Seawith the newly developed Red Sea calibration. SST in the northern Red Sea is found tohave increased from 21 ◦C during the glacial to 25 ◦C during MIS 5d. Our interpretationof the TEX86 record for the central Red Sea (only KL9) suggests that the mixing ratiobetween endemic and open-ocean Crenarchaeota was about 70:30 during the Last25
Interglacial, which is similar to that reconstructed for the present. Around ∼120 ka BP,we find relatively enhanced amounts of soil-derived organic matter input, which likely
1213

CPD7, 1195–1233, 2011
Sensitivity of RedSea circulationduring the last
interglacial
G. Trommer et al.
Title Page
Abstract Introduction
Conclusions References
Tables Figures
J I
J I
Back Close
Full Screen / Esc
Printer-friendly Version
Interactive Discussion
Discussion
Paper
|D
iscussionP
aper|
Discussion
Paper
|D
iscussionP
aper|
reflect the impact of soil out-wash due to seasonal runoff events in a period of generallyincreasing aridity and reducing vegetation.
Acknowledgements. This project contributes to the German Science Foundation projectDFG KU 2259/3-1 “RedSTAR” and UK Natural Environment Research Council ProjectsNE/H004424/1 and NE/E01531X/1. Gabriele Trommer received financial support by the De-5
partmental Council of Finistere, France and Michael Siccha by the Departmental Council ofVendee, France. Marcel van der Meer was funded by a Dutch Organization for Scientific Re-search (NWO) VIDI grant and Stefan Schouten by a NWO VICI grant. Sofie Jehle (Univer-sity of Tubingen) is thanked for help with the micropaleontological sample preparation. An-chelique Mets (NIOZ) is thanked for help with the organic geochemical measurements. We are10
thankful to crew and cruise leader of RV Meteor 5/2.
References
Almogi-Labin, A., Hemleben, C., Meischner, D., and Erlenkeuser, H.: Paleoenvironmentalevents during the last 13 000 years in the central Red Sea as recorded by pteropoda, Paleo-ceanography, 6, 83–98, 1991.15
Almogi-Labin, A., Schmiedl, G., Hemleben, C., Siman-Tov, R., Segl, M., and Meischner, D.:The influence of the NE winter monsoon on productivity changes in the Gulf of Aden, NWArabian Sea, during the last 530 ka as recorded by foraminifera, Mar. Micropaleontol., 40,295–319, 2000.
Anklin, M., Barnola, J. M., Beer, J., Blunier, T., Chappellaz, J., Clausen, H. B., Dahljensen,20
D., Dansgaard, W., Deangelis, M., Delmas, R. J., Duval, P., Fratta, M., Fuchs, A., Fuhrer,K., Gundestrup, N., Hammer, C., Iversen, P., Johnsen, S., Jouzel, J., Kipfstuhl, J., Legrand,M., Lorius, C., Maggi, V., Miller, H., Moore, J. C., Oeschger, H., Orombelli, G., Peel, D.A., Raisbeck, G., Raynaud, D., Schotthvidberg, C., Schwander, J., Shoji, H., Souchez, R.,Stauffer, B., Steffensen, J. P., Stievenard, M., Sveinbjornsdottir, A., Thorsteinsson, T., and25
Wolff, E. W.: Climate instability during the last interglacial period recorded in the GRIP icecore, Nature, 364, 203–207, 1993.
Arz, H. W., Lamy, F., Ganopolski, A., Nowaczyk, N., and Patzold, J.: Dominant Northern Hemi-sphere climate control over millennial-scale glacial sea-level variability, Quaternary Sci. Rev.,26, 312–321, 2007.30
1214

CPD7, 1195–1233, 2011
Sensitivity of RedSea circulationduring the last
interglacial
G. Trommer et al.
Title Page
Abstract Introduction
Conclusions References
Tables Figures
J I
J I
Back Close
Full Screen / Esc
Printer-friendly Version
Interactive Discussion
Discussion
Paper
|D
iscussionP
aper|
Discussion
Paper
|D
iscussionP
aper|
Auras-Schudnagies, A., Kroon, D., Ganssen, G., Hemleben, C., and Van Hinte, J. E.: Dis-tributional pattern of planktonic foraminifers and pteropods in surface waters and top coresediments of the Red Sea, and adjacent areas controlled by the monsoonal regime andother ecological factors, Deep-Sea Res., 36, 1515–1533, 1989.
Badawi, A., Schmiedl, G., and Hemleben, C.: Impact of late Quaternary environmental changes5
on deep-sea benthic foraminiferal faunas of the Red Sea, Mar. Micropaleontol., 58, 13–30,2005.
Bar-Matthews, M., Ayalon, A., Gilmour, M., Matthews, A., and Hawkesworth, C.: Sea-landoxygen isotopic relationships from planktonic foraminifera and speleothems in the East-ern Mediterranean region and their implication for paleorainfall during interglacial intervals,10
Geochim. Cosmochim. Ac., 67, 3181–3199, 2003.Biton, E., Gildor, H., and Peltier, W. R.: Red Sea during the Last Glacial Maximum: Implications
for sea level reconstruction, Paleoceanography, 23, PA1214, doi:10.1029/2007PA001431,2008.
Biton, E., Gildor, H., Trommer, G., Siccha, M., Kucera, M., van der Meer, M. T. J.,15
and Schouten, S.: Sensitivity of Red Sea circulation to monsoonal variability duringthe Holocene: An integrated data and modeling study, Paleoceanography, 25, PA4209,doi:10.1029/2009PA001876, 2010.
Burns, S. J., Matter, A., Frank, N., and Mangini, A.: Speleothem-based paleoclimate recordfrom northern Oman, Geology, 26, 499–502, 1998.20
Burns, S. J., Fleitmann, D., Matter, A., Neff, U., and Mangini, A.: Speleothem evidence fromOman for continental pluvial events during interglacial periods, Geology, 29, 623–626, 2001.
Castaneda, I. S., Schefuss, E., Patzold, J., Sinninghe Damste, J. S., Weldeab, S., andSchouten, S.: Millennial-scale sea surface temperature changes in the eastern Mediter-ranean (Nile River Delta region) over the last 27 000 years, Paleoceanography, 25, PA1208,25
doi:10.1029/2009PA001740, 2010.Cember, R. P.: On the sources, formation and circulation of Red Sea Deep Water, J. Geophys.
Res., 93, 8175–8191, 1988.Chen, F. H., Qiang, M. R., Zeng, Z. D., Wang, H. B., and Bloemendal, J.: Stable East Asian
monsoon climate during the Last Interglacial (Eemian) indicated by paleosol S1 in the west-30
ern part of the Chinese Loess Plateau, Global Planet. Change, 36, 171–179, 2003.Clemens, S., Prell, W., Murray, D., Shimmield, G., and Weedon, G.: Forcing mechanisms of the
Indian Ocean monsoon, Nature, 353, 720–725, 1991.
1215

CPD7, 1195–1233, 2011
Sensitivity of RedSea circulationduring the last
interglacial
G. Trommer et al.
Title Page
Abstract Introduction
Conclusions References
Tables Figures
J I
J I
Back Close
Full Screen / Esc
Printer-friendly Version
Interactive Discussion
Discussion
Paper
|D
iscussionP
aper|
Discussion
Paper
|D
iscussionP
aper|
Conkright, M. E., Locarnini, R. A., Garcia, H. E., O’Brian, T. D., Boyer, T. P., Stephens, C., andAntonov, J. I.: World Ocean Atlas 2001, http://odv.awi.de/en/data/ocean/world ocean atlas2001/, 2001.
Cuffey, K. M. and Marshall, S. J.: Substantial contribution to sea-level rise during the last inter-glacial from the Greenland ice sheet, Nature, 404, 591–594, 2000.5
Cullen, J. L. and Prell, W. L.: Planktonic foraminifera of the northern Indian Ocean: distributionand preservation in surface sediments, Mar. Micropaleontol., 9, 1-52, 1984.
Emeis, K. C., Anderson, D. M., Doose, H., Kroon, D., and Schulz-Bull, D.: Sea-Surface Tem-peratures and the History of Monsoon Upwelling in the Northwest Arabian Sea during theLast 500 000 Years, Quaternary Res., 43, 355–361, 1995.10
Esat, T. M., McCulloch, M. T., Chappell, J., Pillans, B., and Omura, A.: Rapid fluctuations insea level recorded at Huon Peninsula during the penultimate deglaciation, Science, 283,197–201, 1999.
Eshel, G. and Naik, N. H.: Climatological Coastal Jet Collision, Intermediate Water Formation,and the General Circulation of the Red Sea, American Meteorological Society, 27, 1233–15
1257, 1997.Eshel, G., Cane, M. A., and Blumenthal, M. B.: Modes of subsurface, intermediate, and deep
water renewal in the Red Sea, J. Geophys. Res., 99, 15941–15952, 1994.Fenton, M.: Late quaternary history of Red Sea outflow, Ph. D. Thesis, School of Ocean and
Earth Science, Southampton University, Southampton, 226 pp., 1998.20
Fenton, M., Geiselhart, S., Rohling, E., and Hemleben, C.: Aplanktonic zones in the Red Sea,Mar. Micropaleontol., 40, 277–294, 2000.
Fleitmann, D., Burns, S. J., Neff, U., Mangini, A., and Matter, A.: Changing moisture sourcesover the last 330 000 years in Northern Oman from fluid-inclusion evidence in speleothems,Quaternary Res., 60, 223–232, 2003.25
Fuhrman, J. A., McCallum, K., and Davis, A.: Novel major archaebacterial group from marineplankton, Nature, 356, 148–149, 1992.
Geiselhart, S.: Late Quaternary paleoceanographic and paleoclimatologic history of the RedSea during the last 380 000 years: Evidence from stable isotopes and faunal assemblages,Tubinger Mikropalaontologische Mitteilungen, 17, 1–87, 1998.30
Hemleben, C., Meischner, D., Zahn, R., Almogi-Labin, A., Erlenkeuser, H., and Hiller, B.: Threehundred eighty thousand year long stable isotope and faunal records from the Red Sea:Influence of global sea level change on hydrography, Paleoceanography, 11, 147–156, 1996.
1216

CPD7, 1195–1233, 2011
Sensitivity of RedSea circulationduring the last
interglacial
G. Trommer et al.
Title Page
Abstract Introduction
Conclusions References
Tables Figures
J I
J I
Back Close
Full Screen / Esc
Printer-friendly Version
Interactive Discussion
Discussion
Paper
|D
iscussionP
aper|
Discussion
Paper
|D
iscussionP
aper|
Hemleben, C., Spindler, M., and Anderson, O.: Modern Planktonic Foraminifera, Springer-Verlag, New York, 363 pp., 1989.
Henderson, G. M. and Slowey, N. C.: Evidence from U-Th dating against Northern Hemisphereforcing of the penultimate deglaciation, Nature, 404, 61–66, 2000.
Herndl, G. J., Reinthaler, T., Teira, E., van Aken, H., Veth, C., Pernthaler, A., and Pernthaler,5
J.: Contribution of Archaea to total prokaryotic production in the deep Atlantic Ocean, Appl.Environ. Microb., 71, 2303–2309, 2005.
Herold, M. and Lohmann, G.: Eemian tropical and subtropical African moisture transport: anisotope modelling study, Clim. Dyn., 33, 1075–1088, doi:10.1007/s00382-008-0515-2, 2009.
Hoefs, M. J., Schouten, S., de Leeuw, J. W., King, L. L., Wakeham, S. G., and Sinninghe10
Damste, J. S.: Ether Lipids of Planktonic Archaea in the Marine Water Column, Appl. Environ.Microb., 63, 3090–3095, 1997.
Hopmans, E. C., Schouten, S., Pancost, R. D., van der Meer, M. T. J., and Sinninghe Damste, J.S.: Analysis of intact tetraether lipids in archaeal cell material and sediments by high perfor-mance liquid chromatography/atmospheric pressure chemical ionization mass spectrometry,15
Rapid Communications in Mass Spectrometry, 14, 585–589, 2000.Hopmans, E. C., Weijers, J. W. H., Schefuss, E., Herfort, L., Sinninghe Damste, J. S., and
Schouten, S.: A novel proxy for terrestrial organic matter in sediments based on branchedand isoprenoid tetraether lipids, Earth Planet. Sc. Lett., 224, 107–116, 2004.
Imbrie, J., Hayes, J., Martinson, D., McIntyre, A., Mix, A., Morley, J., Pisias, N., Prell, W.,20
Shackleton, N., and Berger, A.: The orbital theory of Pleistocene climate: support from arevised chronology of the marine δ18O record, in: Milankovitch and Climate, Understandingthe Response to Orbital Forcing, Part 1, edited by: Berger, A., Imbrie, J., Hays, J., Kukla, G.,and Saltzman, B., D. Reidel Publishing Company, Norwell, Massachusetts, 269–305, 1984.
Ivanova, E., Schiebel, R., Singh, A. D., Schmiedl, G., Niebler, H. S., and Hemleben, C.: Primary25
production in the Arabian Sea during the last 135 000 years, Palaeogeogr. Palaeocl., 197,61–82, 2003.
Jouzel, J., Masson-Delmotte, V., Cattani, O., Dreyfus, G., Falourd, S., Hoffmann, G., Minster, B.,Nouet, J., Barnola, J. M., Chappellaz, J., Fischer, H., Gallet, J. C., Johnsen, S., Leuenberger,M., Loulergue, L., Luethi, D., Oerter, H., Parrenin, F., Raisbeck, G., Raynaud, D., Schilt, A.,30
Schwander, J., Selmo, E., Souchez, R., Spahni, R., Stauffer, B., Steffensen, J. P., Stenni,B., Stocker, T. F., Tison, J. L., Werner, M., and Wolff, E. W.: Orbital and millennial Antarcticclimate variability over the past 800 000 years, Science, 317, 793–796, 2007.
1217

CPD7, 1195–1233, 2011
Sensitivity of RedSea circulationduring the last
interglacial
G. Trommer et al.
Title Page
Abstract Introduction
Conclusions References
Tables Figures
J I
J I
Back Close
Full Screen / Esc
Printer-friendly Version
Interactive Discussion
Discussion
Paper
|D
iscussionP
aper|
Discussion
Paper
|D
iscussionP
aper|
Juggins, S.: C2 Data Analysis, 2003.Kim, J. H., Schouten, S., Buscail, R., Ludwig, W., Bonnin, J., Sinninghe Damste, J. S., and
Bourrin, F.: Origin and distribution of terrestrial organic matter in the NW Mediterranean(Gulf of Lions): Exploring the newly developed BIT index, Geochem. Geophy. Geosy., 7,Q11017, doi:10.1029/2006GC001306, 2006.5
Kim, J., Schouten, S., Hopmans, E. C., Donner, B., and Sinninghe Damste, J. S.: Globalsediment core-top calibration of the TEX86 paleothermometer in the ocean, Geochim. Cos-mochim. Ac., 72, 1154–1173, 2008.
Kim, J. H., Zarzycka, B., Buscail, R., Peterse, F., Bonnin, J., Ludwig, W., Schouten, S., andSinninghe Damste, J. S.: Contribution of river-borne soil organic carbon to the Gulf of Lions10
(NW Mediterranean), Limnol. Oceanogr., 55, 507–518, 2010.Kopp, R. E., Simons, F. J., Mitrovica, J. X., Maloof, A. C., and Oppenheimer, M.: Proba-
bilistic assessment of sea level during the last interglacial stage, Nature, 462, 863–867,doi:10.1038/nature08686, 2009.
Kukla, G., Bender, M., de Beaulieu, J., Bond, G., Broecker, W., Cleveringa, P., Gavin, J., Her-15
bert, T., Imbrie, J., Jouzel, J., Keigwin, L. D., Knudsen, K.-L., McManus, J. F., Merkt, J.,Muhs, D. R., Muller, H., Poore, R. Z., Porter, S. C., Seret, G., Shackleton, N. J., Turner, C.,Tzedakis, P. C., and Winograd, I. J.: Last Interglacial Climates, Quaternary Res., 58, 2–13,2002.
Lambeck, K. and Chappell, J.: Sea level change through the last glacial cycle, Science, 292,20
679–686, 2001.Legge, H. L., Mutterlose, J., and Arz, H. W.: Climatic changes in the northern Red Sea dur-
ing the last 22 000 years as recorded by calcareous nannofossils, Paleoceanography, 21,PA1003, doi:10.1029/2005PA001142, 2006.
Lisiecki, L. E. and Raymo, M. E.: A Pliocene-Pleistocene stack of 57 globally distributed benthic25
δ18O records, Paleoceanography, 20, PA1003, doi:10.1029/2004PA001071, 2005.Locke, S. and Thunell, R.: Paleoceanographic record of the last glacial/interglacial cycle in the
Red Sea and Gulf of Aden, Palaeogeogr. Palaeocl., 64, 163–187, 1988.Manasrah, R., Badran, M., Lass, H. U., and Fennel, W.: Circulation and winter deep-water
formation in the northern Red Sea, Oceanologia, 46, 5–23, 2004.30
McCulloch, M. and Esat, T.: The coral record of last interglacial sea levels and sea surfacetemperatures, Chem. Geol., 169, 107–129, 2000.
Moeyersons, J., Vermeersch, P. M., and Van Peer, P.: Dry cave deposits and their palaeoen-
1218

CPD7, 1195–1233, 2011
Sensitivity of RedSea circulationduring the last
interglacial
G. Trommer et al.
Title Page
Abstract Introduction
Conclusions References
Tables Figures
J I
J I
Back Close
Full Screen / Esc
Printer-friendly Version
Interactive Discussion
Discussion
Paper
|D
iscussionP
aper|
Discussion
Paper
|D
iscussionP
aper|
vironmental significance during the last 115 ka, Sodmein Cave, Red Sea Mountains, Egypt,Quaternary Sci. Rev., 21, 837–851, 2002.
Montoya, M., von Storch, H., and Crowley, T. J.: Climate simulation for 125 kyr BP with acoupled ocean-atmosphere general circulation model, J. Climate, 13, 1057–1072, 2000.
Muhs, D. R., Simmons, K. R., Schumann, R. R., and Halley, R. B.: Sea-level history of the past5
two interglacial periods: new evidence from U-series dating of reef corals from south Florida,Quaternary Sci. Rev., 30, 570–590, doi:10.1016/j.quascirev.2010.12.019, 2011.
Naidu, P. D. and Malmgren, B. A.: A high-resolution record of late quaternary upwelling alongthe Oman Margin, Arabian Sea based on planktonic foraminifera, Paleoceanography, 11,129–140, 1996.10
Orszag-Sperber, F., Plaziat, J., Baltzer, F., and Purser, B.: Gypsum salina-coral reef relation-ships during the Last Interglacial (Marine Isotopic Stage 5e) on the Egyptian Red Sea coast:a Quaternary analogue for Neogene marginal evaporites?, Sediment. Geol., 140, 61–85,2001.
Osborne, A. H., Vance, D., Rohling, E. J., Barton, N., Rogerson, M., and Fello, N.: A humid15
corridor across the Sahara for the migration of early modern humans out of Africa 120 000years ago, P. Natl. Acad. Sci. USA, 105, 16444–16447, 2008.
Otto-Bliesner, B. L., Marsha, S. J., Overpeck, J. T., Miller, G. H., and Hu, A. X.: Simulatingarctic climate warmth and icefield retreat in the last interglaciation, Science, 311, 1751–1753, 2006.20
Patzert, W. C.: Wind-induced reversal in Red Sea circulation, Deep-Sea Res., 21, 109–121,1974.
Plaziat, J. C., Baltzer, F., Choukri, A., Conchon, O., Freytet, P., Orszag-Sperber, F., Purser,B., Raguideau, A., and Reyss, J. L.: Quaternary changes in the Egyptian shoreline of thenorthwestern Red Sea and Gulf of Suez, Quatern. Int., 30, 11–22, 1995.25
Reichart, G. J., den Dulk, M., Visser, H. J., van der Weijden, C. H., and Zachariasse, W. J.:A 225 kyr record of dust supply, paleoproductivity and the oxygen minimum zone from theMurray Ridge (northern Arabian Sea), Palaeogeogr. Palaeocl., 134, 149–169, 1997.
Rohling, E. J. and Zachariasse, W. J.: Red Sea outflow during the last glacial maximum,Quatern. Int., 31, 77–83, 1996.30
Rohling, E. J., Fenton, M., Jorissen, F. J., Bertrand, P., Ganssen, G., and Caulet, J. P.: Magni-tudes of sea-level lowstands of the past 500 000 years, Nature, 394, 162–165, 1998.
Rohling, E. J., Cane, T. R., Cooke, S., Sprovieri, M., Bouloubassi, I., Emeis, K. C., Schiebel, R.,
1219

CPD7, 1195–1233, 2011
Sensitivity of RedSea circulationduring the last
interglacial
G. Trommer et al.
Title Page
Abstract Introduction
Conclusions References
Tables Figures
J I
J I
Back Close
Full Screen / Esc
Printer-friendly Version
Interactive Discussion
Discussion
Paper
|D
iscussionP
aper|
Discussion
Paper
|D
iscussionP
aper|
Kroon, D., Jorissen, F. J., Lorre, A., and Kemp, A. E. S.: African monsoon variability duringthe previous interglacial maximum, Earth Planet. Sc. Lett., 202, 61–75, 2002.
Rohling, E. J., Sprovieri, M., Cane, T., Casford, J. S. L., Cooke, S., Bouloubassi, I., Emeis, K.C., Schiebel, R., Rogerson, M., and Hayes, A.: Reconstructing past planktic foraminiferalhabitats using stable isotope data: a case history for Mediterranean sapropel S5, Mar. Mi-5
cropaleontol., 50, 89–123, 2004.Rohling, E. J., Grant, K., Hemleben, C., Kucera, M., Roberts, A. P., Schmeltzer, I., Schulz,
H., Siccha, M., Siddall, M., and Trommer, G.: New constraints on the timing of sea levelfluctuations during early to middle marine isotope stage 3, Paleoceanography, 23, PA3219,doi:10.1029/2008PA001617, 2008a.10
Rohling, E. J., Grant, K., Hemleben, C., Siddall, M., Hoogakker, B. A. A., Bolshaw, M., andKucera, M.: High rates of sea-level rise during the last interglacial period, Nat. Geosci., 1,38–42, 2008b.
Rohling, E. J., Grant, K., Bolshaw, M., Roberts, A. P., Siddall, M., Hemleben, C., and Kucera,M.: Antarctic temperature and global sea level closely coupled over the past five glacial15
cycles, Nat. Geosci., 2, 500–504, 2009.Rossignol-Strick, M.: African monsoons, and immediate climate response to orbital insolation,
Nature, 304, 46–49, 1983.Rostek, F., Bard, E., Beaufort, L., Sonzogni, C., and Ganssen, G.: Sea surface temperature
and productivity records for the past 240 kyr in the Arabian Sea, Deep-Sea Res. Pt. II, 44,20
1461–1480, 1997.Saher, M., Rostek, F., Jung, S. J. A., Bard, E., Schneider, R., Greaves, M., Ganssen, G.,
Elderfield, H., and Kroon, D.: Western Arabian Sea SST during the penultimate inter-glacial: A comparison of UK ′
37 and Mg/Ca paleothermometry, Paleoceanography, 24, PA2212,doi:10.1029/2007PA001557, 2009.25
Schmelzer, I.: High-frequency event-stratigraphy and paleoceanography of the Red Sea, Ph.D. Thesis, Institute of Geosciences, University of Tubingen, Tubingen, 124 pp., 1998.
Schouten, S., Hopmans, E. C., Pancost, R. D., and Sinninghe Damste, J. S.: Widespreadoccurrence of structurally diverse tetraether membrane lipids: Evidence for the ubiquitouspresence of low-temperature relatives of hyperthermophiles, P. Natl. Acad. Sci. USA, 97,30
14421–14426, 2000.Schouten, S., Hopmans, E. C., Schefuss, E., and Sinninghe Damste, J. S.: Distributional vari-
ations in marine crenarchaeotal membrane lipids: a new tool for reconstructing ancient sea
1220

CPD7, 1195–1233, 2011
Sensitivity of RedSea circulationduring the last
interglacial
G. Trommer et al.
Title Page
Abstract Introduction
Conclusions References
Tables Figures
J I
J I
Back Close
Full Screen / Esc
Printer-friendly Version
Interactive Discussion
Discussion
Paper
|D
iscussionP
aper|
Discussion
Paper
|D
iscussionP
aper|
water temperatures?, Earth Planet. Sc. Lett., 204, 265–274, 2002.Schouten, S., Huguet, C., Hopmans, E. C., Kienhuis, M. V. M., and Sinninghe Damste, J.
S.: Analytical Methodology for TEX86 paleothermometry by high-performance liquid chro-matography/atmospheric pressure chemical ionization-mass spectrometry, Anal. Chem., 79,2940–2944, 2007.5
Schulz, H., von Rad, U., Ittekkot, V., Clift, P. D., Kroon, D., Gaedicke, C., and Craig, J.: Plankticforaminifera, particle flux and oceanic productivity off Pakistan, NE Arabian Sea: modernanalogues and application to the paleoclimatic record, in: The Tectonic and Climatic Evolu-tion of the Arabian Sea Region, No. 195, Geological Society Special Publications, London,499–516, 2002.10
Shackleton, N. J., Sanchez-Goni, M. F., Pailler, D., and Lancelot, Y.: Marine Isotope Substage5e and the Eemian interglacial, Global Planet. Change, 36, 151–155, 2003.
Siccha, M., Trommer, G., Schulz, H., Hemleben, C., and Kucera, M.: Factors controlling thedistribution of planktonic foraminifera in the Red Sea and implications for the development oftransfer functions, Mar. Micropaleontol., 72, 146–156, 2009.15
Siddall, M., Rohling, E., Almogi-Labin, A., Hemleben, C., Meischner, D., Schmelzer, I., andSmeed, D.: Sea-level fluctuations during the last glacial cycle, Nature, 423, 853–858, 2003.
Siddall, M., Smeed, D., Hemleben, C., Rohling, E. J., Schmelzer, I., and Peltier, W.: Under-standing the Red Sea response to sea level, Earth Planet. Sc. Lett., 225, 421–434, 2004.
Siddall, M., Bard, E., Rohling, E. J., and Hemleben, C.: Sea-level reversal during Termination20
II, Geology, 34, 817–820, 2006.Sinninghe Damste, J. S., Rijpstra, W. I. C., Hopmans, E. C., Prahl, F. G., Wakeham, S. G., and
Schouten, S.: Distribution of membrane lipids of planktonic Crenarchaeota in the ArabianSea, Appl. Environ. Microb., 68, 2997–3002, 2002.
Smeed, D.: Seasonal variation of the flow in the strait of Bab al Mandab, Oceanol. Acta, 20,25
773–781, 1997.Smeed, D.: Exchange through the Bab el Mandab, Deep-Sea Res. Pt. II, 51, 455–474, 2004.Sofianos, S. and Johns, W.: An Oceanic General Circulation Model (OGCM) investigation of the
Red Sea circulation: 1. Exchange between the Red Sea and the Indian Ocean, J. Geophys.Res., 107, 3196, doi:10.1029/2001JC001184, 2002.30
Sofianos, S. and Johns, W.: An Oceanic General Circulation Model (OGCM) investigation ofthe Red Sea circulation: 2. Three-dimensional circulation in the Red Sea, J. Geophys. Res.,108, 3066, doi:10.1029/2001JC001185, 2003.
1221

CPD7, 1195–1233, 2011
Sensitivity of RedSea circulationduring the last
interglacial
G. Trommer et al.
Title Page
Abstract Introduction
Conclusions References
Tables Figures
J I
J I
Back Close
Full Screen / Esc
Printer-friendly Version
Interactive Discussion
Discussion
Paper
|D
iscussionP
aper|
Discussion
Paper
|D
iscussionP
aper|
Sofianos, S., Johns, W., and Murray, S.: Heat and freshwater budgets in the Red Sea fromdirect observations at Bab el Mandeb, Deep-Sea Res. Pt. II, 49, 1323–1340, 2002.
Souvermezoglou, E., Metzl, N., and Poisson, A.: Red Sea budgets of salinity, nutrients andcarbon calculated in the Strait of Bab-El-Mandab during the summer and winter seasons, J.Mar. Res., 47, 441–456, 1989.5
Storz, D., Schulz, H., Waniek, J. J., Schulz-Bull, D. E., and Kucera, M.: Seasonal and interan-nual variability of the planktic foraminiferal flux in the vicinity of the Azores Current, Deep-SeaRes. Pt. I, 56, 107–124, 2009.
Thomas, A. L., Henderson, G. M., Deschamps, P., Yokoyama, Y., Mason, A. J., Bard, E.,Hamelin, B., Durand, N., and Camoin, G.: Penultimate Deglacial Sea-Level Timing from10
Uranium/Thorium Dating of Tahitian Corals, Science, 324, 1186–1189, 2009.Thompson, P. R., Be, A. W. H., Duplessy, J. C., and Shackleton, N. J.: Disappearance of pink-
pigmented Globigerinoides ruber at 120 000 yr BP in the Indian and Pacific Oceans, Nature,280, 554–558, 1979.
Thompson, W. G. and Goldstein, S. L.: Open-system coral ages reveal persistent suborbital15
sea-level cycles, Science, 308, 401–404, 2005.Thunell, R. C., Locke, S., and Williams, D. F.: Glacio-eustatic sea-level control on Red Sea
salinity, Nature, 334, 601–604, 1988.Trommer, G., Siccha, M., van der Meer, M. T. J., Schouten, S., Sinninghe Damste, J. S., Schulz,
H., Hemleben, C., and Kucera, M.: Distribution of Crenarchaeota tetraether membrane lipids20
in surface sediments from the Red Sea, Org. Geochem., 40, 724–731, 2009.Trommer, G., Siccha, M., Rohling, E. J., Grant, K., van der Meer, M. T. J., Schouten, S., Hem-
leben, C., and Kucera, M.: Millennial-scale variability in Red Sea circulation in responseto Holocene insolation forcing, Paleoceanography, 25, PA3203, doi:10.1029/2009PA001826,2010.25
Van Campo, E., Duplessy, J. C., and Rossignol-Strick, M.: Climatic conditions deduced from a150-kyr oxygen isotope-pollen record from the Arabian Sea, Nature, 296, 56–59, 1982.
van der Meer, M. T. J., Baas, M., Rijpstra, W. I. C., Marino, G., Rohling, E. J., SinningheDamste, J. S.- and Schouten, S.: Hydrogen isotopic compositions of long-chain alkenonesrecord freshwater flooding of the Eastern Mediterranean at the onset of sapropel deposition,30
Earth Planet. Sc. Lett., 262, 594–600, 2007.Veldhuis, M., Kraay, G., Van Bleijswijk, J., and Baars, M.: Seasonal and spatial variability
in phytoplankton biomass, productivity and growth in the northwestern Indian Ocean: the
1222

CPD7, 1195–1233, 2011
Sensitivity of RedSea circulationduring the last
interglacial
G. Trommer et al.
Title Page
Abstract Introduction
Conclusions References
Tables Figures
J I
J I
Back Close
Full Screen / Esc
Printer-friendly Version
Interactive Discussion
Discussion
Paper
|D
iscussionP
aper|
Discussion
Paper
|D
iscussionP
aper|
southwest and northeast monsoon, 1992–1993, Deep-Sea Res. Pt. I, 44, 425–449, 1997.Walsh, E., Ingalls, A., and Keil, R.: Sources and transport of terrestrial organic matter in Van-
couver Island fjords and the Vancouver-Washington Margin: A multiproxy approach usingδ13Corg, lignin phenols, and the ether lipid BIT index, Limnol. Oceanogr., 53, 1054–1063,2008.5
Wang, Y. J., Cheng, H., Edwards, R. L., Kong, X. G., Shao, X. H., Chen, S. T., Wu, J. Y., Jiang,X. Y., Wang, X. F., and An, Z. S.: Millennial- and orbital-scale changes in the East Asianmonsoon over the past 224 000 years, Nature, 451, 1090–1093, 2008.
Weijers, J., Schouten, S., Spaargaren, O., and Sinninghe Damste, J. S.: Occurrence anddistribution of tetraether membrane lipids in soils: Implications for the use of the TEX86 proxy10
and the BIT index, Org. Geochem., 37, 1680–1693, 2006.Weikert, H., Edwards, F., and Head, S.: Plankton and the pelagic environment, in: Red Sea
(key environments), edited by: Edwards, A. J. and Head, S. M., Pergamon Press, Oxford,90-111, 1987.
Weldeab, S., Lea, D., Schneider, R., and Andersen, N.: 155 000 years of West African Monsoon15
and ocean thermal evolution, Science, 316, 1303–1307, 2007.Winograd, I. J., Coplen, T. B., Landwehr, J. M., Riggs, A. C., Ludwig, K. R., Szabo, B. J., Kolesar,
P. T., and Revesz, K. M.: Continuous 500 000-Year Climate Record from Vein Calcite in DevilsHole, Nevada, Science, 258, 255–260, 1992.
Winter, A., Almogi-Labin, A., Erez, Y., Halicz, E., Luz, B., and Reiss, Z.: Salinity tolerances20
or marine organisms deduced from Red Sea Quaternary record, Mar. Geol., 53, M17-M22,1983.
Whiteman, A.: The Geology of the Sudan Republic, Clarendon Press, Oxford, 290 pp., 1971.Wu, G. J., Pan, B. T., Guan, Q. Y., Liu, Z. G., and Li, J. J.: Loess record of climatic changes
during MIS5 in the Hexi Corridor, northwest China, Quatern. Int., 97–8, 167–172, 2002.25
Yuan, D., Cheng, H., Edwards, R., Dykoski, C., Kelly, M., Zhang, M., Qing, J., Lin, Y., Wang,Y., Wu, J., Dorale, J. A., An, Z., and Cai, Y.: Timing, Duration, and Transitions of the LastInterglacial Asian Monsoon, Science, 304, 575–578, 2004.
1223

CPD7, 1195–1233, 2011
Sensitivity of RedSea circulationduring the last
interglacial
G. Trommer et al.
Title Page
Abstract Introduction
Conclusions References
Tables Figures
J I
J I
Back Close
Full Screen / Esc
Printer-friendly Version
Interactive Discussion
Discussion
Paper
|D
iscussionP
aper|
Discussion
Paper
|D
iscussionP
aper|
Table 1. Age model tie points of the observed Red Sea cores.
KL23 core KL9 core KL11 core age (ka BP) Referencedepth (cm) depth (cm) depth (cm)
660 392.25 613 109 5.4 Lisiecki and Raymo (2005)730 451.25 663 123 5.5 Rohling et al. (2008b);
Lisiecki and Raymo (2005)870 504.25 753 146 6.3 Imbrie et al. (1984)
1224

CPD7, 1195–1233, 2011
Sensitivity of RedSea circulationduring the last
interglacial
G. Trommer et al.
Title Page
Abstract Introduction
Conclusions References
Tables Figures
J I
J I
Back Close
Full Screen / Esc
Printer-friendly Version
Interactive Discussion
Discussion
Paper
|D
iscussionP
aper|
Discussion
Paper
|D
iscussionP
aper|
35˚E 40˚E 45˚E10˚N
15˚N
20˚N
25˚N
30˚N
KL9
KL 23
Red
Gulf of Aden
Sea
Baraka catchment
KL11
Fig. 1. Map of the Red Sea with the investigated cores KL23 (Geiselhart, 1998; Schmelzer,1998), KL9 and KL11, including the seasonally active Baraka catchment.
1225

CPD7, 1195–1233, 2011
Sensitivity of RedSea circulationduring the last
interglacial
G. Trommer et al.
Title Page
Abstract Introduction
Conclusions References
Tables Figures
J I
J I
Back Close
Full Screen / Esc
Printer-friendly Version
Interactive Discussion
Discussion
Paper
|D
iscussionP
aper|
Discussion
Paper
|D
iscussionP
aper|
[‰V
PD
B]
6.3
5.5
5.4
Fig. 2. Age models of the sediment cores used in this study: δ18O records from KL9 and KL11(data from Rohling et al., 2008b) and KL23 (data from Badawi et al., 2005) (control points 6.3,5.5 and 5.4 as indicated by vertical lines). Dashed vertical lines mark the MIS 5e/d (116 ka BP)and MIS 6/5e boundary (132 ka BP, Shackleton et al., 2003).
1226

CPD7, 1195–1233, 2011
Sensitivity of RedSea circulationduring the last
interglacial
G. Trommer et al.
Title Page
Abstract Introduction
Conclusions References
Tables Figures
J I
J I
Back Close
Full Screen / Esc
Printer-friendly Version
Interactive Discussion
Discussion
Paper
|D
iscussionP
aper|
Discussion
Paper
|D
iscussionP
aper|
rel.
ab
un
da
nce
sre
l.a
bu
nd
an
ce
s
rel.
ab
un
da
nce
s
5
4
No
.fo
ram
inife
ra/k
a
KL11
KL9
KL23
KL9
KL11
se
ale
ve
l[m
]
Fig. 3. Relative abundances of the main abundant planktonic foraminifera species in KL23(Geiselhart, 1998; Schmelzer, 1998), KL9 and KL11 (data from this study); KL9 and KL11numbers foraminifera/ka and sea-level reconstructions from oxygen isotopes (Rohling et al.,2008b based on Siddall et al., 2004) of. Grey bars indicate “aplanktonic zone” (Fenton et al.,2000). Dashed vertical lines mark the MIS 5e/d (116 ka BP) and MIS 6/5e boundary (132 ka BP,Shackleton et al., 2003).
1227

CPD7, 1195–1233, 2011
Sensitivity of RedSea circulationduring the last
interglacial
G. Trommer et al.
Title Page
Abstract Introduction
Conclusions References
Tables Figures
J I
J I
Back Close
Full Screen / Esc
Printer-friendly Version
Interactive Discussion
Discussion
Paper
|D
iscussionP
aper|
Discussion
Paper
|D
iscussionP
aper|
G. glutinata abundances
G. te
nella
abundances
a b
Fig. 4. Comparison of KL9 foraminiferal faunal assemblage data of MIS 6-5d and the calibrationdata set (circles). Left: analogy analyses of the most abundant species (according to Sicchaet al., 2009). Plotted is PCA component 1 vs. PCA component 2. Right: G. glutinata vs. G.tenella relative abundances. Overlapping areas display analogue assemblages.
1228
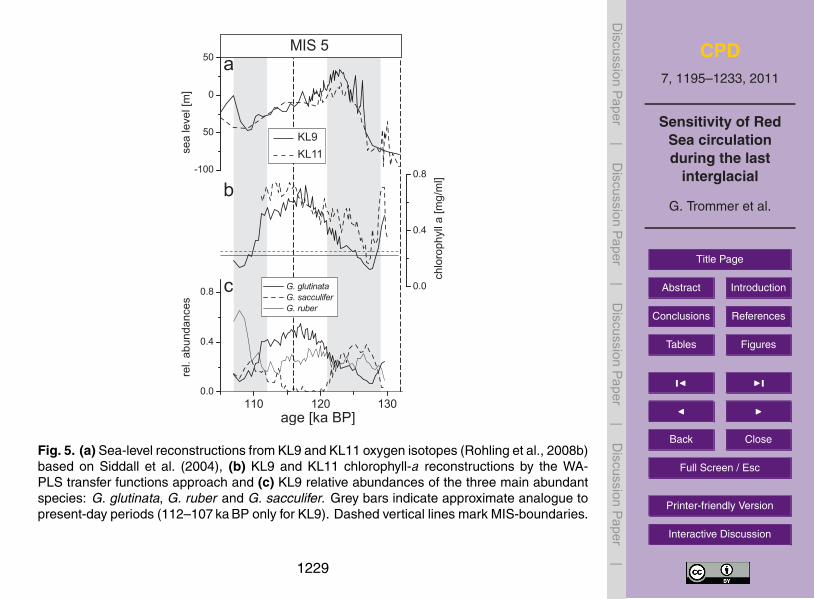
CPD7, 1195–1233, 2011
Sensitivity of RedSea circulationduring the last
interglacial
G. Trommer et al.
Title Page
Abstract Introduction
Conclusions References
Tables Figures
J I
J I
Back Close
Full Screen / Esc
Printer-friendly Version
Interactive Discussion
Discussion
Paper
|D
iscussionP
aper|
Discussion
Paper
|D
iscussionP
aper|
rel.
ab
un
da
nce
s
ch
loro
ph
yll
a[m
g/m
l]
KL9
KL11se
ale
ve
l[m
]
a
b
c
Fig. 5. (a) Sea-level reconstructions from KL9 and KL11 oxygen isotopes (Rohling et al., 2008b)based on Siddall et al. (2004), (b) KL9 and KL11 chlorophyll-a reconstructions by the WA-PLS transfer functions approach and (c) KL9 relative abundances of the three main abundantspecies: G. glutinata, G. ruber and G. sacculifer. Grey bars indicate approximate analogue topresent-day periods (112–107 ka BP only for KL9). Dashed vertical lines mark MIS-boundaries.
1229
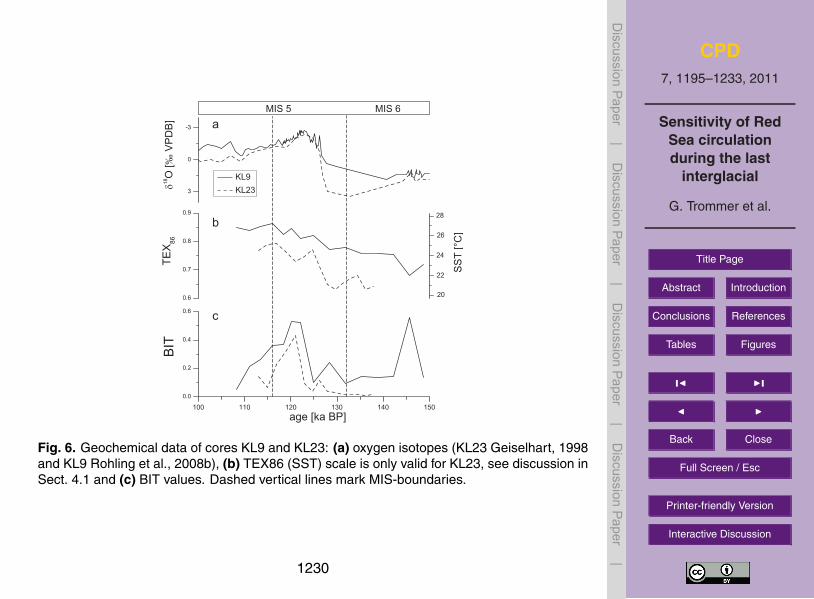
CPD7, 1195–1233, 2011
Sensitivity of RedSea circulationduring the last
interglacial
G. Trommer et al.
Title Page
Abstract Introduction
Conclusions References
Tables Figures
J I
J I
Back Close
Full Screen / Esc
Printer-friendly Version
Interactive Discussion
Discussion
Paper
|D
iscussionP
aper|
Discussion
Paper
|D
iscussionP
aper|
�18O
[V
PD
B]
‰
age [ka BP]
SS
T[°
C]
a
b
c
MIS 5 MIS 6
KL9
KL23
Fig. 6. Geochemical data of cores KL9 and KL23: (a) oxygen isotopes (KL23 Geiselhart, 1998and KL9 Rohling et al., 2008b), (b) TEX86 (SST) scale is only valid for KL23, see discussion inSect. 4.1 and (c) BIT values. Dashed vertical lines mark MIS-boundaries.
1230

CPD7, 1195–1233, 2011
Sensitivity of RedSea circulationduring the last
interglacial
G. Trommer et al.
Title Page
Abstract Introduction
Conclusions References
Tables Figures
J I
J I
Back Close
Full Screen / Esc
Printer-friendly Version
Interactive Discussion
Discussion
Paper
|D
iscussionP
aper|
Discussion
Paper
|D
iscussionP
aper|
Fig. 7. Comparison of foraminiferal assemblages of MIS 6-5d and Holocene in core KL9 (mostabundant species according to Siccha et al., 2009). Plotted is PCA component 1 vs. PCAcomponent 2. Overlapping areas display similar assemblages.
1231

CPD7, 1195–1233, 2011
Sensitivity of RedSea circulationduring the last
interglacial
G. Trommer et al.
Title Page
Abstract Introduction
Conclusions References
Tables Figures
J I
J I
Back Close
Full Screen / Esc
Printer-friendly Version
Interactive Discussion
Discussion
Paper
|D
iscussionP
aper|
Discussion
Paper
|D
iscussionP
aper|
rel.
abundances
of
G.sacculif
er
rel.
abundances
of
G.glu
tinata
July
Insola
tion
20°N
[W/m
²]
Decem
ber
1050
1000
950
900
650
600
550
5001500 10 100 110 120 130 140
KL9
KL11
Fig. 8. Comparison of species abundances with insolation data (20◦ N). Left: Holocene dataonly for KL9 (Trommer et al., 2010), right: this study including KL9 and KL11, above: July inso-lation and G. sacculifer abundances, below: December insolation and G. glutinata abundances.Grey shading indicates KL11 period of influence of intruding intermediate waters during pro-nounced summer circulation.
1232

CPD7, 1195–1233, 2011
Sensitivity of RedSea circulationduring the last
interglacial
G. Trommer et al.
Title Page
Abstract Introduction
Conclusions References
Tables Figures
J I
J I
Back Close
Full Screen / Esc
Printer-friendly Version
Interactive Discussion
Discussion
Paper
|D
iscussionP
aper|
Discussion
Paper
|D
iscussionP
aper|
KL23
KL9 mixing ratios of Crenarchaeota populations(Red Sea/open ocean population): 69/31
100/0
Fig. 9. TEX86-based SST interpretations. KL23 SST record (dotted line, horizontal dot-ted=modern SST at the core site) and KL9 SST signal based on different mixing ratios of RedSea versus open ocean Crenarchaeota population: before 130 ka BP 100/0 Red Sea/openocean population (solid line) and after 130 ka BP assuming constant mixing ratios of 100/0(solid) and 69/31 (bold) Red Sea/open ocean population (vertical solid line=modern SST atthe core site).
1233
Top Related
Copyright © 2022 FDOKUMEN

