


Bahasa
Halaman
Hukum

International Journal of Advanced Research in
Management and Social Sciences ISSN: 2278-6236
Vol. 2 | No. 2 | February 2013 www.garph.co.uk IJARMSS | 96
SALES PROMOTION SCHEMES: CONSUMER’S PICK
Swati Chopra*
Abstract: A sales promotion or “sale” works as a branding tool. It is an effective way to
stimulate demand. But to perform better and stay ahead in the competition, retailers need
to understand the cause and effect relationship of sales promotion.
In this paper we present the Hypothesis Testing to distinguish the mind-set of customers
towards cash discount with respect to Demographic variables such as gender, family
income, educational qualification.
*Asst. Prof., MBA Dept., Ambalika institute of management and Technology
International Journal of Advanced Research in
Management and Social Sciences ISSN: 2278-6236
Vol. 2 | No. 2 | February 2013 www.garph.co.uk IJARMSS | 97
1. INTRODUCTION
Given the growing importance of sales promotion, there has been considerable interest in
its effect on different dimensions, such as the consumers’ price perceptions, brand choice,
brand switching behaviour, evaluation of brand equity, effect on brand perception and so
on. The concept of sales promotion in India is as popular as in any other Western country.
But unlike the West, the number of retailers factoring the expenses of sales promotion is
negligible.
In a country like India, sales promotion takes place at least four times a year. The
approach and the strategies of an Indian retailer are different compared to the West. An
average Indian retailer is only interested in the sales figures. Few look at the footfalls,
conversion, average bill size, etc. during promotions. And even fewer measure profits by
relating revenues to costs of promotions. Isolating the effect of different promotions in a
situation of promotion overlap is not even considered.
The primary objective of a sales promotion is to bolster sales by predicting and modifying
the purchasing behaviour and pattern of target customers. Not only that, it also attracts
new customers while retaining the existing ones. With so much cut-throat competition, no
retailer wants to lag behind in capitalising every emotion and sentiment of the consumer.
Once one big retailer starts, it becomes a trend.
Today, the Indian consumer has more disposable income and is more inclined towards the
higher-end brands. They wait for the time when brands offer the best discounts. Last year,
retailers preponed festival sales or ran them for extended periods to be able to clear the
inventory. Many brands went on sale before the usual last week of July. Moreover, stores
are still stocking more discounted items than fresh merchandise.
1.1 Sales Promotion: Advantages & Disadvantages:
Sales promotions draw attention to a particular product or service being offered. They distinguish
a business from competitors through pricing. Dryden Sales, explains that when sales promotions
are offered for a limited time, it creates urgency among the customers because they have to act
before the promotion expires. As a result, the limited offer reduces the time customers have to
think about the product. In most cases, they will stop comparing the alternatives and buy the
featured item or service.
International Journal of Advanced Research in
Management and Social Sciences ISSN: 2278-6236
Vol. 2 | No. 2 | February 2013 www.garph.co.uk IJARMSS | 98
Promotions in sales are a disadvantage when they are offered too regularly. The key to making
them successful is offering them irregularly, catching the customer off guard and unprepared. If
they are provided too regularly then they create price sensitivity among customers. Dryden
outlines price sensitivity as intentional waiting by customers to purchase items only when they
are promoted in a sale, rather than buying them at the regular retail price. Profits decrease.
1.2 Intention of sales promotion:
Before designing a promotional campaign, you must identify the target groups. This is done
by breaking up of your product markets and identification of small groups of consumers
whose wants and needs are not the same as the mass market as a whole- this is one of
the key to success in sales promotion. For finding the target group you need to take a
qualitative research on the market to determine your groups of customers, if the target
group exists then find out their needs & wants, and what drives them to buy your
product. After learning about the target groups, you must set the objectives of sales
promotion which is all about why you want to achieve in sales promotion campaign and
how your customers will be benefits. Other aspects of sales objectives are: budget of the
promotion and duration of the promotional offer[2].
1.3 Paradigm of Sales objectives
Sales Growth
The most basic of sales force objectives is to raise the total sales numbers in each period,
generally each week, month or quarter. Sales forces record the number of customers
served daily, and sales managers view detailed reports displaying trends in daily sales
volume. An example of a strategy used to achieve a revenue growth objective is to
institute a commission compensation program for salespeople in addition to base salaries.
This can motivate salespeople to push themselves harder to beat their personal sales
records.
Sales Force Turnover
The sales component of marketing can experience one of the highest employee turnover
rates of any area of business, as new salespeople are often ill equipped for the stresses
and demands of the job. One possible objective of sales forces is to continually reduce
their level of employee turnover, which can increase sales productivity and reduce training
costs. Two possible strategies to achieve this objective include rewriting job postings to
International Journal of Advanced Research in
Management and Social Sciences ISSN: 2278-6236
Vol. 2 | No. 2 | February 2013 www.garph.co.uk IJARMSS | 99
make sure job applicants fully understand the nature of the work, and adding stress and
conflict management role-playing scenarios to new-hire training programs.
Repeat Customers
Repeat customers can be a company's most profitable customers. One possible objective
of a sales team is to increase the number of sales made to existing customers compared to
first-time buyers. Customer-relationship management or CRM strategies can help to
achieve this objective, strengthening relationships with customers and turning repeat
customers into champions for the brand.
Up-Sell Strategies
In settings where customers come to salespeople, such as retail outlets and inbound call
centers, sales forces commonly have an objective of increasing the average total amount
of each transaction through a technique called up-selling. Up-selling is the art of
strategically suggesting one more item to compliment what a customer has already
ordered. While up-selling can contribute to the sales growth objective mentioned above, it
can also reduce inventory holding costs, reduce inventory cycle time and boost
profitability. Sales team competitions with rewards that employees actually want can
motivate team members to try up-selling with each customer and to be more strategic in
their up-selling pitches. [3].
2. STIMULUS FOR THE STUDY
With the growth of population and spending power of the consumer has created the
opportunities and challenges for the FMCG companies in the world market[1]. Simultaneously,
competition to win consumers has been increased drastically. World is becoming the small village
and Many MNC‘s have entered in India and other countries. Marketing paradigm is shifting from
consumer satisfaction to consumer delight. Enticing consumers with the various sales promotion
schemes is the order of the day. If this tool is not used strategically, company has to follow the
trend of promotions to maintain the market share[5]. Considering almost universal applications
of designing the sales promotion schemes and understanding its impact on business has
motivated to take the steps in the direction to study this crucial aspect of promotion
management[4].
3. RESEARCH DESIGN:
3. 1 Sampling Element:
International Journal of Advanced Research in
Management and Social Sciences ISSN: 2278-6236
Vol. 2 | No. 2 | February 2013 www.garph.co.uk IJARMSS | 100
Each and every individual who purchases the FMCG products in the state of Uttar Pradesh
and neighboring states has been identified as a sampling element.
3.2 Sampling Design & Data gathering:
The universe of the study consists of all FMCG consumers in the state of Uttar Pradesh and
neighboring states.
Sample Size: 500
Sampling Method: Convenient Sampling Method
Data Type: Primary Data & Secondary Data
Data Collection Tool: Structured Questionnaire
Scope of Research : Uttar Pradesh and neighboring states.
The buyer may belong to any age group and any sex of metropolitan cities.
4. ANALYSIS AND INTERPRETATION OF DATA
Testing Hypothesis:
Testing hypothesis provides the scientific base for the interpretation. Herewith, stated
hypothesis are tested with the help of various parametric and non paramet ric tests as
mentioned below.
H1: There is no momentous divergence between Consumer mind-set towards the cash
discount as a sales promotion scheme and demographic variables.
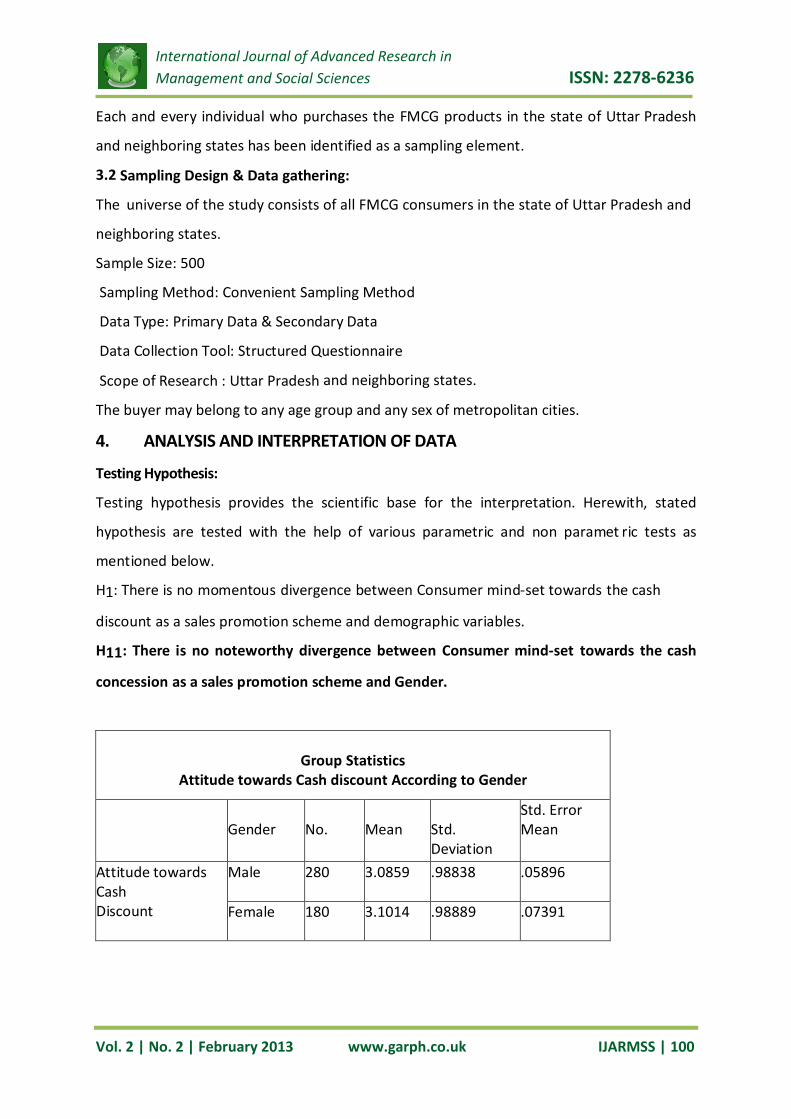
H11: There is no noteworthy divergence between Consumer mind-set towards the cash
concession as a sales promotion scheme and Gender.
Group Statistics
Attitude towards Cash discount According to Gender
Gender
No.
Mean
Std. Deviation
Std. Error Mean
Attitude towards Cash Discount
Male 280 3.0859 .98838 .05896
Female 180 3.1014 .98889 .07391
International Journal of Advanced Research in
Management and Social Sciences ISSN: 2278-6236
Vol. 2 | No. 2 | February 2013 www.garph.co.uk IJARMSS | 101
If we perform One-Sample Kolmogorov-Smirnov Test (Test of Normality) it is found that the
sample distribution is not the normal (0.001 < 0.005) distribution. Hence Normality of the
sample does not validate the Z test for testing the hypothesis.
Here, it is to test whether two samples are coming from the same population. More clearly,
there is any significance difference between the mean of two samples. It is a comparing of
two means with large sample size. If the distribution of the attitude towards the cash
discount is normal probability distribution, Z test as a test of comparing two means should
be used. But the interested variable is not normally distributed.
In this context, it is advisable and required to apply non parametric test to test the
significance difference between two samples.
So, Non parametric tests have been used to test the hypothesis as mentioned below.
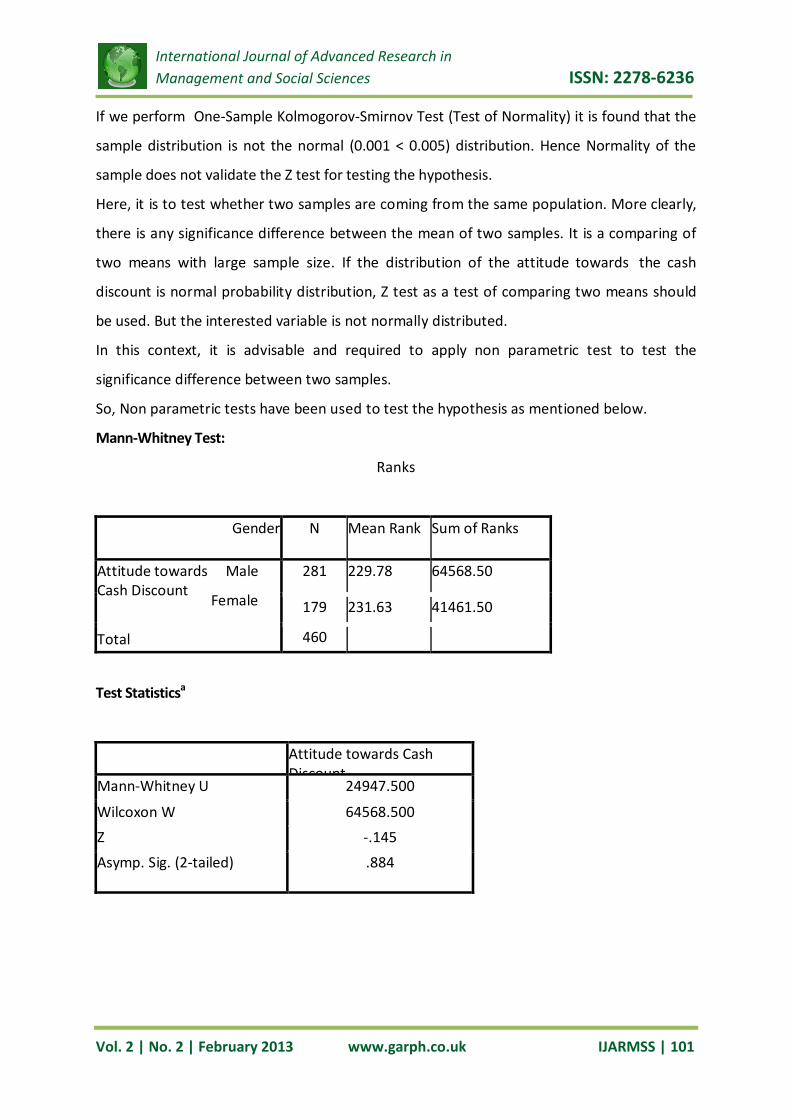
Mann-Whitney Test:
Ranks
Gender N Mean Rank Sum of Ranks
Attitude towards Male Cash Discount
Female
Total
281 229.78 64568.50
179 231.63 41461.50
460
Test Statisticsa
Attitude towards Cash Discount
Mann-Whitney U 24947.500
Wilcoxon W 64568.500
Z -.145
Asymp. Sig. (2-tailed) .884
International Journal of Advanced Research in
Management and Social Sciences ISSN: 2278-6236
Vol. 2 | No. 2 | February 2013 www.garph.co.uk IJARMSS | 102
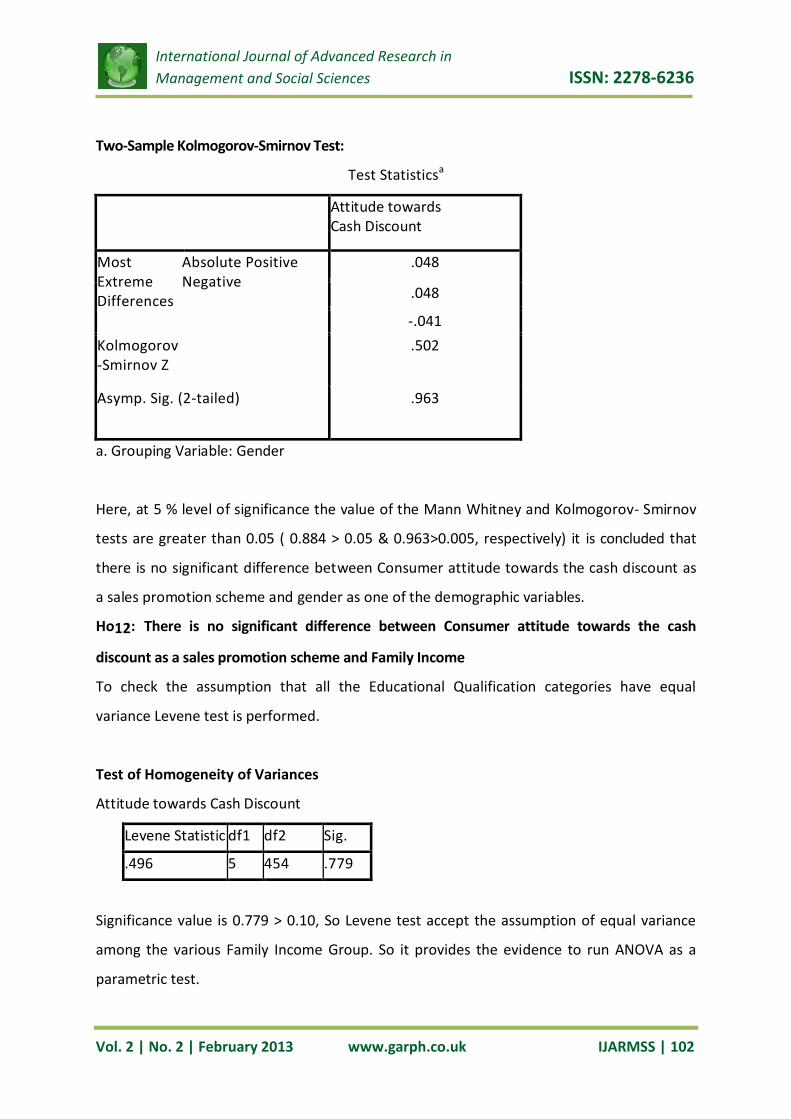
Two-Sample Kolmogorov-Smirnov Test:
Test Statisticsa
Attitude towards Cash Discount
Most Extreme Differences
Absolute Positive Negative
.048
.048
-.041
Kolmogorov-Smirnov Z
.502
Asymp. Sig. (2-tailed) .963
a. Grouping Variable: Gender
Here, at 5 % level of significance the value of the Mann Whitney and Kolmogorov- Smirnov
tests are greater than 0.05 ( 0.884 > 0.05 & 0.963>0.005, respectively) it is concluded that
there is no significant difference between Consumer attitude towards the cash discount as
a sales promotion scheme and gender as one of the demographic variables.
Ho12: There is no significant difference between Consumer attitude towards the cash
discount as a sales promotion scheme and Family Income
To check the assumption that all the Educational Qualification categories have equal
variance Levene test is performed.
Test of Homogeneity of Variances
Attitude towards Cash Discount
Levene Statistic df1 df2 Sig.
.496 5 454 .779
Significance value is 0.779 > 0.10, So Levene test accept the assumption of equal variance
among the various Family Income Group. So it provides the evidence to run ANOVA as a
parametric test.
International Journal of Advanced Research in
Management and Social Sciences ISSN: 2278-6236
Vol. 2 | No. 2 | February 2013 www.garph.co.uk IJARMSS | 103
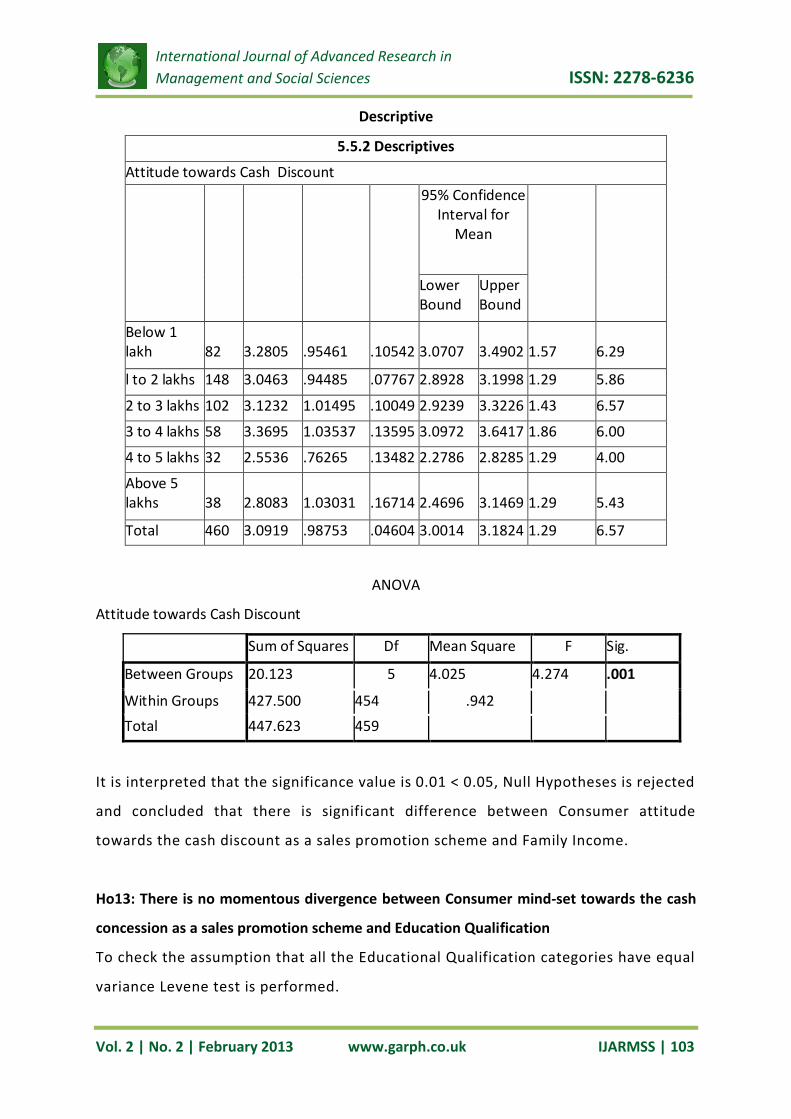
Descriptive
5.5.2 Descriptives
Attitude towards Cash Discount
N
Mean
Std. Deviation
Std. Error
95% Confidence Interval for
Mean
Minimum
Maximum
Lower Bound
Upper Bound
Below 1 lakh
82
3.2805
.95461
.10542
3.0707
3.4902
1.57
6.29
l to 2 lakhs 148 3.0463 .94485 .07767 2.8928 3.1998 1.29 5.86
2 to 3 lakhs 102 3.1232 1.01495 .10049 2.9239 3.3226 1.43 6.57
3 to 4 lakhs 58 3.3695 1.03537 .13595 3.0972 3.6417 1.86 6.00
4 to 5 lakhs 32 2.5536 .76265 .13482 2.2786 2.8285 1.29 4.00
Above 5 lakhs
38
2.8083
1.03031
.16714
2.4696
3.1469
1.29
5.43
Total 460 3.0919 .98753 .04604 3.0014 3.1824 1.29 6.57
ANOVA
Attitude towards Cash Discount
Sum of Squares Df Mean Square F Sig.
Between Groups 20.123 5 4.025 4.274 .001
Within Groups 427.500 454 .942
Total 447.623 459
It is interpreted that the significance value is 0.01 < 0.05, Null Hypotheses is rejected
and concluded that there is significant difference between Consumer attitude
towards the cash discount as a sales promotion scheme and Family Income.
Ho13: There is no momentous divergence between Consumer mind-set towards the cash
concession as a sales promotion scheme and Education Qualification
To check the assumption that all the Educational Qualification categories have equal
variance Levene test is performed.
International Journal of Advanced Research in
Management and Social Sciences ISSN: 2278-6236
Vol. 2 | No. 2 | February 2013 www.garph.co.uk IJARMSS | 104
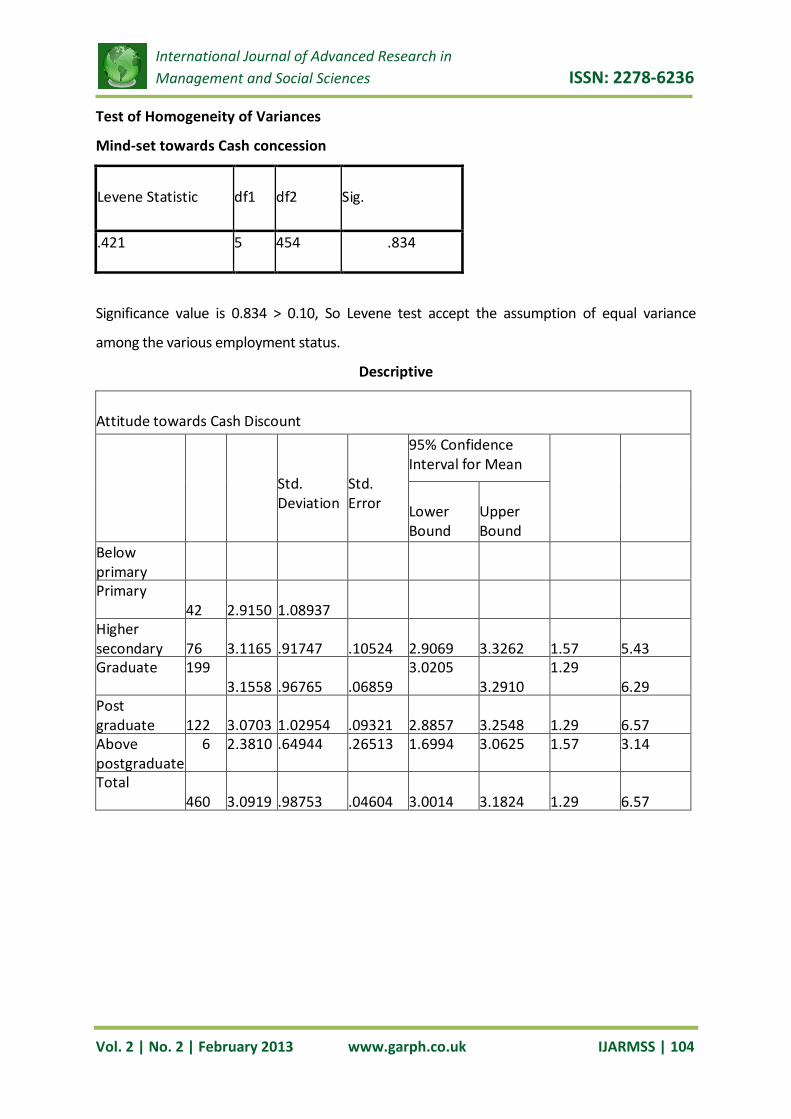
Test of Homogeneity of Variances
Mind-set towards Cash concession
Levene Statistic
df1
df2
Sig.
.421 5 454 .834
Significance value is 0.834 > 0.10, So Levene test accept the assumption of equal variance
among the various employment status.
Descriptive
Attitude towards Cash Discount
N
Mean
Std. Deviation
Std. Error
95% Confidence Interval for Mean
Minimum
Maximum
Lower Bound
Upper Bound
Below primary
15
3.0762
1.02855
.26557
2.5066
3.6458
1.57
5.57 Primary
42 2.9150
1.08937
.16809
2.5755
3.2544
1.57
6.29 Higher
secondary 76
3.1165
.91747
.10524
2.9069
3.3262
1.57
5.43
Graduate 199 3.1558
.96765
.06859
3.0205 3.2910
1.29 6.29
Post graduate
122
3.0703
1.02954
.09321
2.8857
3.2548
1.29
6.57
Above postgraduate
6 2.3810 .64944 .26513 1.6994 3.0625 1.57 3.14
Total 460
3.0919
.98753
.04604
3.0014
3.1824
1.29
6.57
International Journal of Advanced Research in
Management and Social Sciences ISSN: 2278-6236
Vol. 2 | No. 2 | February 2013 www.garph.co.uk IJARMSS | 105
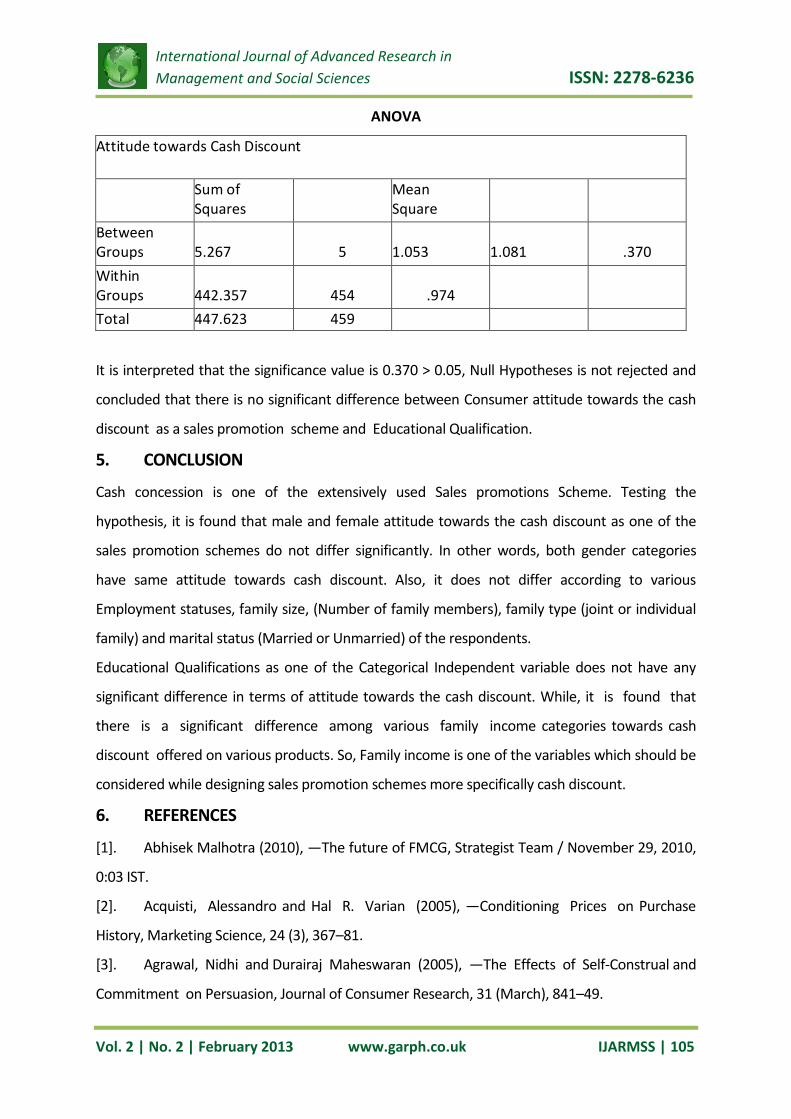
ANOVA
Attitude towards Cash Discount
Sum of Squares
Df
Mean Square
F
Sig. Between Groups
5.267
5
1.053
1.081
.370
Within Groups
442.357
454
.974
Total 447.623 459
It is interpreted that the significance value is 0.370 > 0.05, Null Hypotheses is not rejected and
concluded that there is no significant difference between Consumer attitude towards the cash
discount as a sales promotion scheme and Educational Qualification.
5. CONCLUSION
Cash concession is one of the extensively used Sales promotions Scheme. Testing the
hypothesis, it is found that male and female attitude towards the cash discount as one of the
sales promotion schemes do not differ significantly. In other words, both gender categories
have same attitude towards cash discount. Also, it does not differ according to various
Employment statuses, family size, (Number of family members), family type (joint or individual
family) and marital status (Married or Unmarried) of the respondents.
Educational Qualifications as one of the Categorical Independent variable does not have any
significant difference in terms of attitude towards the cash discount. While, it is found that
there is a significant difference among various family income categories towards cash
discount offered on various products. So, Family income is one of the variables which should be
considered while designing sales promotion schemes more specifically cash discount.
6. REFERENCES
[1]. Abhisek Malhotra (2010), ―The future of FMCG, Strategist Team / November 29, 2010,
0:03 IST.
[2]. Acquisti, Alessandro and Hal R. Varian (2005), ―Conditioning Prices on Purchase
History, Marketing Science, 24 (3), 367–81.
[3]. Agrawal, Nidhi and Durairaj Maheswaran (2005), ―The Effects of Self-Construal and
Commitment on Persuasion, Journal of Consumer Research, 31 (March), 841–49.
International Journal of Advanced Research in
Management and Social Sciences ISSN: 2278-6236
Vol. 2 | No. 2 | February 2013 www.garph.co.uk IJARMSS | 106
[4]. Barwise, P. and Farley, J.U. 2004. ‗Marketing Metrics: Status of Six Metrics in Five
Countries‘, European Management Journal, 22 (3): 257-262
[5]. Begona Alvarez Alvarez and Rodolfo Vazquez Casielles (2008), ―Effects of price
decisions on product categories and brands, Asia Pacific Journal of Marketing and Logistics,
20(1) p.p. 23-43
[6]. Darke, P.R. and Chung, C.M.Y. (2005), ―Effects of pricing and promotion on consumer
perceptions: it depends on how you frame it, Journal of Retailing, Vol. 81 No. 1, pp. 35- 7.
[7]. DelVecchio, D., Henard, D.H. and Freling, T.H. (2006), ―The effects of sales promotion
on post-promotion brand preference: a meta-analysis, Journal of Retailing, Vol. 82 No. 3, pp.
203-13.
[8]. Henkel, S., Tomczak, T, Heitmann, M. & Herrmann, A. (2007), Managing brand
consistent employee behaviors: relevance and managerial control of behavioral branding.
Journal of Product & Brand management, 16 (5): 310-320
Top Related
Copyright © 2022 FDOKUMEN

