


Bahasa
Halaman
Hukum

Editorial Manager(tm) for Hydrobiologia
Manuscript Draft
Manuscript Number:
Title: Relating macroinvertebrate community structure to environmental characteristics and
sediment contamination at the scale of the St. Lawrence River
Article Type: SI: St. Lawrence 50 year overview
Keywords: macroinvertebrates, St. Lawrence River, community structure, sediment contamination,
environmental characteristics, indicator taxa
Corresponding Author: Stephane Masson,
Corresponding Author's Institution:
First Author: Stephane Masson
Order of Authors: Stephane Masson; Mélanie Desrosiers; Bernadette Pinel-Alloul; Louis Martel
1
Relating macroinvertebrate community structure to environmental characteristics 1
and sediment contamination at the scale of the St. Lawrence River2
3
4
Stéphane Masson1*, Mélanie Desrosiers23, Bernadette Pinel-Alloul2, & Louis Martel35
6
1Aquarium du Québec, SÉPAQ, 1675 av. des Hôtels, Québec, QC, Canada, G1W 4S37
8
2GRIL, Département de Sciences Biologiques, Université de Montréal, C.P. 6128, Succ Centre-Ville, 9
Montréal, Québec, Canada, H3C 3J710
11
3CEAEQ, Ministère du Développement durable de l’Environnement et des Parcs du Québec, 2700 rue 12
Einstein, Québec, Canada, GIP 3W813
14
Key words: macroinvertebrates, St. Lawrence River, community structure, sediment contamination,15
environmental characteristics, indicator taxa16
17
*Corresponding author: Stéphane Masson18
Aquarium du Québec, SÉPAQ, 1675 av. des Hôtels, Québec, QC, Canada, G1W 4S3. 19
email : [email protected]
21
This paper has not been submitted elsewhere in identical or similar form nor will it be during the first 22
three months after its submission to Hydrobiologia23
ManuscriptClick here to download Manuscript: Hydrobiol Masson et al VF.doc Click here to view linked References

2
Abstract24
The St. Lawrence River is one of the most important rivers in the world located in the most populous 25
region of eastern Canada and subjected to multiple stressors induced by human activities. There is still 26
no assessment of the impact of sediment chemicals and environmental conditions on macroinvertebrate 27
community at the scale of the St. Lawrence River continuum. This study aims to characterize the 28
community structure of macroinvertebrates in the fluvial section of the St. Lawrence River including 29
the three fluvial lakes and the Montreal harbour using several taxonomic levels (genus and family) and 30
data (abundance, presence/absence and indicator taxa). The goal of the study is to relate changes in 31
macroinvertebrate community to sediment chemical conditions and environmental characteristics of 32
habitats. A special effort was made for identifying indicator taxa characteristic of the different 33
macroinvertebrate assemblages along the river fluvial continuum. Furthermore, this study also aims to34
determine the taxonomic level and the data suitable for a good assessment of the relative contribution 35
of sediment chemical conditions and environmental characteristics of habitats using variance 36
partitioning. Four different macroinvertebrate assemblages were found distributed along environmental 37
gradients in the fluvial continuum both when using abundance or presence/absence data at the genus 38
and family levels. Specific indicator taxa were characteristics of the different macroinvertebrate 39
communities and were associated to the contamination gradient. Environmental characteristics of the 40
habitats (water masses, sulphur and DOC in sediments) had higher influence on macroinvertebrate 41
assemblages than sediment chemical conditions, with strong interactive effects. However together they 42
explain less than 30% of the total variance in macroinvertebrate communities. Our study confirms that 43
family level can give comparable information than genus level using presence-absence or abundance 44
of macroinvertebrates, however, higher number of indicator taxa were detected at the genus level.45
46
47
3
Introduction48
49
The St. Lawrence River is one of the most important large rivers in the world and represents almost 50
25% of freshwater reserves in earth. It drains an area of 1 610 000 km2 and flows throughout 1000 km 51
from Lake Ontario to the Gulf of St. Lawrence in one of the most populous regions of Canada. 52
Intensive agriculture, urbanization and industrialization in its watershed and shores maintain a constant 53
pressure to this river. In the mid-1980s, the most heavily contaminated areas of the St. Lawrence River 54
were the fluvial lakes (Saint-Louis and Saint-Pierre) and the harbour areas of Montreal and Quebec 55
cities (Loiselle et al., 1997). Since the fifties, industrialization has caused the contamination of the St. 56
Lawrence River by trace metals and organic pollutants (Allen, 1986; Carignan et al., 1994). Although 57
a decline in contamination has been noted in recent years, there are still some sources of local pollution 58
from human activities such as discharges of industrial, agricultural and municipal wastewaters. Other 59
sources also contaminate the river as landfills coastal shipping, port and dredging activities, and 60
pharmaceutics contaminants.61
62
Macroinvertebrate communities have been extensively used for bioassessment of freshwater systems 63
(Hellawell, 1986; Rosenberg & Resh, 1993; Chessman et al., 2007). In the St. Lawrence River, the 64
distribution and community structure of macroinvertebrates were shown to be related to multiple 65
environmental factors including habitat vegetation, water quality, sediment grain size and 66
contamination (Cook & Johnson, 1974; Cyr & Downing, 1988; Pinel-Alloul et al., 1996). However, 67
most of these studies differ by the level of taxonomic analysis, the metrics describing 68
macroinvertebrate communities, the sampling methods, the statistical approaches, and the 69
contaminants measured (Pinel-Alloul et al., 2004). Furthermore, they are limited to specific 70
ecosystems, either one of the fluvial lakes or harbours of the river. Pinel-Alloul et al. (1996) assessed 71

4
the relative importance of environmental characteristics and sediment contamination, and of their 72
interaction, in explaining the composition and abundance of macroinvertebrate communities in Lake 73
Saint-François. It is the less polluted lake of the St-Lawrence River upward Montreal, while the main 74
sources of contamination dues to municipal effluents and extensive agriculture are located downward 75
Montreal. Tessier et al. (2008) evaluated the variation in macroinvertebrate community among three 76
vegetation types (emergent and submerged vegetation, filamentous algal mats) and water masses,77
whereas Tall et al. (2008) evaluated the potential of emergent vegetation and sediment habitats for 78
developing a bioassessment program with reference conditions using macroinvertebrates in Lake 79
Saint-Pierre only. There is still no assessment of the impact of sediment quality on macroinvertebrate 80
community at the scale of the St. Lawrence River continuum.81
82
This study establishes large scale patterns of macroinvertebrate community structure in relation to 83
sediment contamination and environmental characteristics along a 240-km continuum of the fluvial 84
section of the St. Lawrence River. It covers the full range of habitats including the three fluvial lakes 85
(Saint-François, Saint-Louis, and Saint-Pierre) and the Montreal harbour area. The goals of the study 86
are three folds: 1) to describe the geographical patterns in macroinvertebrate community structure 87
using different taxonomic levels (genus and family) and data (presence/absence or abundance), 2) to 88
determine indicator taxa of the different macroinvertebrate communities distributed along the fluvial 89
section of the St. Lawrence River, and 3) to establish the link between macroinvertebrate community 90
structure and spatial variation in the water and sediment quality along the St. Lawrence River, and 91
evaluate their relative contribution using variance partitioning. 92
93
94
95
5
Materials and methods96
Study area97
98
The study area covers a 240-km long section of the fluvial continuum of the St. Lawrence River 99
(Canada) from Lake Saint-François at the outlet of Lake Ontario to the outlet of Lake Saint-Pierre 100
(Fig. 1). Sampling stations were located in sedimentation zones of the three main fluvial lakes and the 101
Montreal harbour at sites impacted by fine-particle deposition, potential dredging, and past or present 102
anthropogenic contamination point sources. A total of 59 stations were visited during fall 2004 and 103
2005. Ten stations were located in Lake Saint-François, 21 stations in Lake Saint-Louis, 15 stations in 104
Lake Saint-Pierre, 11 stations in the Montreal harbour and 2 others downstream towards Montreal 105
Island close to a major municipal wastewater dispersion plume (Fig. 1). The location of each sampling 106
station within the different water masses coming from the Great Lakes waters on the south shores and 107
from the Ottawa River on the north shores that flow along the fluvial corridor of the St. Lawrence 108
River was determined using cartographic tools (Désilets & Langlois, 1989; Nettleton, 1996).109
110
Sediment sampling and analyses111
112
Surface sediments were collected with a Shipek grab sampler (400 cm2). In each station, 20 to 25 L of 113
sediment were randomly collected in the sampling zone and placed in clear polyethylene bags. All 114
bags were placed on ice in a container during 24 - 30 hrs until their arrival at the laboratory where they 115
were stored in a cold chamber (4oC). Twenty four to 48 hours after sampling, sediment samples116
collected at each station were sieved on a 2-mm mesh sieve and manually homogenized before sub-117
sampling for each type of chemical analyses (Tables 1 and 2). Sediment pore water was extracted by 118

6
two centrifugation processes: first with the entire sediment sample (3000 G; 20 min) and then after on 119
the retrieved pore water (10000 G; 30 min). Sub-samples of interstitial water were kept for measuring 120
dissolved organic carbon (DOC). 121
122
In each sediment sample, we measured the grain size, the concentrations of nutrients (Total Kjeldahl 123
Nitrogen: TKN; Total phosphorus: TP; total sulphur, total organic carbon (TOC), calcium (Ca), metals124
(Al, As, Cd, Cr, Cu, Fe, Mn, Ni, Pb, Zn, and total mercury: THg), and organic contaminants (PCBs, 125
PAHs, four pesticides groups, and petroleum hydrocarbons) (see Tables 1 and 2 for details on 126
analytical methods and detection limits). All chemical methods were based on AC/QC standardized 127
protocols developed and validated at the “Centre d'expertise en analyse environnementale du Québec”128
(CEAEQ) (see references in Tables 1 and 2). Sediment conditions varied among and within the 129
sampling areas and covered a large range of grain size, organic matter, nutrient, organic chemical, 130
metal, and metalloid concentrations with the highest chemical concentrations generally observed in the 131
Montreal harbour area (Desrosiers et al., 2008).132
133
Macroinvertebrate sampling and analyses134
135
Five samples of macroinvertebrates were randomly collected at each station using a Shipek grab (400 136
cm2) and placed into a clear polyethylene bag (food grade; 30 x 37 cm). Samples were preserved on 137
site in 10% formaldehyde solution stained with Rose Bengal to fix and colour macroinvertebrates in 138
order to reduce sorting time. Three replicates of macroinvertebrates samples were analyzed in 139
laboratory. Sediment samples were rinsed with tap water and macroinvertebrates were collected on a 140
sieve of 500 µm mesh size and sorted at coarse taxonomic level under a lighting magnifying glass. The 141
organisms were then stored in 70% glycerol-coated alcohol for later identification. In 30% of the 142
7
samples, it was necessary to carry out subsampling because of the high quantity of sediment collected. 143
In these cases, the entire sediment sample was weighted before being sieved on the 500-um mesh 144
screen and homogenized by dipping it in water in a container. Thereafter, the sample was removed 145
from the water and a fraction of it was taken, weighed to estimate the proportion (%) analysed and 146
checked for macroinvertebrates. At least 25% of the sample was retained in order to respect a 147
maximum of eight hours of time for sorting macroinvertebrates. 148
149
Taxonomic analysis of macroinvertebrates was carried out by a private firm (Laboratoires SAB inc.) at 150
the family, genera and species levels using several identification keys and methods (Klemm et al., 151
1990; Merritt & Cummins, 1996; Thorp & Covich, 2001; Environment Canada, 2005). In some 152
stations where the abundances of oligochaetes, chironomids and gastropods were very high, a 153
minimum of 100 individuals were randomly taken in the flask and identified. The frequencies of the 154
different taxa were applied to the total number. A reference collection was provided to specialised 155
taxonomists at the Université de Montréal (Québec, Canada) who validated all identifications made at 156
the genus level. 157
158
Statistical analyses159
160
To describe the spatial patterns of distribution of macroinvertebrates assemblages along the fluvial 161
continuum and identify indicator taxa, we applied multivariate statistical analyses following Dufrêne 162
and Legendre (1997). First, we performed Principal Coordinate Analysis (PCoA) to identify clusters of 163
stations presenting similarity in their macroinvertebrate communities using abundance, and 164
presence/absence data at genus and family levels. For each set of the four matrices (59 stations x 165
abundance and presence/absence of genus and families), data were normalized using the Hellinger 166
8
transformation (Legendre & Gallagher, 2001) and then used to build the similarity matrices using the 167
index distance Hellinger (D17). Secondly, a non-hierarchical clustering analysis (K-means) was168
performed to identify different clusters of stations (Legendre & Legendre, 1998). Although the simple 169
structure index (SSI) was used to determine the optimum number of clusters (e.g.: for instance, 7 170
groups represented the optimum similarity in the macroinvertebrate abundances at the genus level for 171
all stations), we looked at various possibilities for clustering (4 to 10 groups). Thirdly, we used the 172
IndVal method developed by Dufrêne and Legendre (1997) to identify indicator taxa associated to the 173
typology of macroinvertebrate assemblages obtained by PCoA clustering. This method enabled us to 174
group taxa on the basis of their indicator value (IndVal) for each clustering level (4 to 10). For each 175
taxa i in each group j, we computed the product of Aij, which is the mean abundance of taxa i in the 176
sites of group j compared to all groups, by Bij, which is the relative frequency of occurrence of taxa i177
in the sites of group j, as follows :178
Aij = N individualsij / N individualsi179
Bij = N sitesij / N sitesj180
IndValij = Aij * Bij * 100181
Where IndVal is the indicator value of taxa i in the group j. Aij is a measure of specificity of the taxa 182
in a group, while Bij is a measure of fidelity of this taxa within that group (Dufrêne & Legendre, 183
1997).184
185
Redundancy analyses (RDAs) were performed to establish a model relating macroinvertebrate 186
community to environmental characteristics and chemical contamination. RDA measured all the 187
variance of macroinvertebrate matrix in relation to chemical concentrations in sediment and 188
environmental characteristics using Monte Carlo unrestricted 999 permutation tests (Legendre & 189
Legendre, 1998). RDA analyses were performed with chemical and environmental data considered 190
9
separately or put together. Only the variables presenting significant relationships (p < 0.05) after 191
stepwise selection were kept in the final RDA model obtained using macroinvertebrate data at the 192
genus and family level. We used Hellinger transformation for the macroinvertebrate abundance matrix 193
containing many zeros, as recommended by Legendre and Gallagher (2001). Partial RDAs were 194
performed for determining the relative contribution of chemical and environmental characteristics of 195
the sediment in the model explaining variation in macroinvertebrate community structure along the 196
fluvial continuum.197
The free software environment R (version 2.6.1) was utilized for multivariate statistical computing and 198
graphics (Ihakam & Gentleman, 1996): http://www.r-project.org/). Statistical analyses were performed 199
with different R libraries: Labsbv library and Duleg function for IndVal; Vegan for K-mean, and 200
partial RDA. Finally for RDA we used Vegan and Packford libraries using forward selection with 201
permutation test (999).202
203
Results204
205
Spatial distribution, clustering and indicator taxa of macroinvertebrate communities206
207
PCoA and K-means analyses discriminated four clusters of stations (groups A to D) which showed 208
similarity in macroinvertebrate community structure based on abundances of genus and family taxa 209
(Fig. 2). These analyses were also performed to obtain various possibilities of stations clustering from 210
4 to 10 groups. Finally, we retained only the model with four groups of stations because no indicator 211
taxa were found for each group when the number of clusters of stations was more than four. At the 212
genus level (Fig. 2A), the Montreal harbour stations (group A) and the Lake Saint-François stations 213
10
associated with few stations of Lake Saint-Louis and Lake Saint-Pierre (group B) formed two distinct 214
clusters located at both ends of the first axis of the ordination. The clusters C and D were only 215
composed of stations of Lake Saint-Louis and Lake Saint-Pierre. At the family level (Fig. 2B), we 216
obtained similar geographical patterns with the Montreal harbour stations and few stations of Lake 217
Saint-Louis and Lake Saint-Pierre in group A, most of the stations of Lake Saint-François stations in 218
groups B and D, and other stations of Lake Saint-Pierre and Lake Saint-Louis in group C.219
220
At the genus level, we identified two to nine indicator taxa in the four clusters (Fig. 2A). Two 221
Oligochaeta Tubificidae (IIyodrilus and Quistadrilus) were representative taxa for macroinvertebrate 222
community of the cluster A in the Montreal harbour. Nine (9) indicator taxa were characteristic of the 223
macroinvertebrate community in the cluster B; they included one Hirudinae, one Arachnida, two 224
Malacostraca, four insect larvae (three Chironomidae and one Leptoceridae) and one Planariidae. Two 225
indicator taxa (the Nemerta and the Oligochaeta Tubificidae, Spirosperma) were also identified for the 226
cluster C. Four taxa were characteristic of the cluster D, one Ephemera (Hexagenia), and three Diptera 227
chironomidae (Axarus, Ablabesmyia and Coelotanypus). At the family level, clusters A and C had no228
significant indicator taxa; cluster D had one indicator taxa (the insect larvae of Ephemeridae) and the 229
cluster B, like at the genus level, has the greatest number of indicator taxa (five families including two 230
Malacostraca, two insect larvae (Hydroptilidae, Leptoceridae) and the Planariidae) (Fig. 2B). 231
232
PCoA and K-means analyses based on presence/absence of genus and family taxa (Fig. 3) also 233
discriminated four clusters of stations (groups A to D) which showed similar distribution of 234
macroinvertebrate communities along the first axis of the ordination, like for the abundance data. 235
However, we did not find as much indicator taxa at the genus level (Fig. 3A). No indicator taxa were 236
characteristic for the clusters A and B, only one Oligochaeta Tubificidae for the cluster C and six 237
11
indicator taxa were identified for the cluster D (including one Arachnida, one Malacostraca and four 238
insect larvae: three Chironomidae and one Leptoceridae). With presence/absence data at the family 239
level (Fig. 3B), we obtained indicator taxa in three groups (A, C, D) compared to two groups (C, D) at 240
the genus level, and more indicator taxa than when using abundance data.241
242
There were also some differences and similarities in the detection of indicator taxa when using 243
abundance or presence/absence data at the genus and family levels. For instance, indicator taxa for the 244
group A were very different between analyses. Two Oligochaeta were identified when using 245
abundances at the genus level (Fig. 2A), while the Gastropoda Planorbidae and Planariidae were 246
retained when using presence/absence data at the family level (Fig. 3B).. At the opposite, no matter the 247
taxonomic level used, some common indicator taxa were identified for the group D in the four 248
analyses, such as the Gammaridae and Leptoceridae. 249
250
Influence of sediment quality and environment on macroinvertebrate communities 251
252
When using only sediment contamination by inorganic and organic chemicals, we explained a very 253
low percentage of the total variance of the indicator taxa along the fluvial continuum of the St. 254
Lawrence River (cumulative r2 from 0.10 to 0.17: Table 3). Similar results were obtained for 255
abundance or presence/absence data at the genus or family level (Table 3). The first explanatory 256
variables were Pb or Zn, while the other variables were total mercury (THg) and total PAH (PAHtot), 257
as well as As and Ni for presence/absence data at the family level (Table 3). 258
259
Higher percentages of the total variance in macroinvertebrate communities were explained when using 260
environmental characteristics alone (cumulative r2 from 0.18 to 0.25; Table 4). The significant 261
12
explanatory variables were different depending on the invertebrates community descriptor and 262
taxonomic level. Macroinvertebrate community structure at the genus level was mainly explained by 263
differences in water masses originating from the Ottawa River in the north shores and from the Great 264
Lakes in the south shores, Montreal municipal wastewater (CUM), total sulphur, DOC, sandy sediment 265
and Mn concentrations (Table 4). When using only significant indicator taxa at the genus level, 266
community structure was explained by DOC, total sulphur, % of sand and water depth. On the other 267
hand, community structure at the family level was also explained by different water masses, by the N/P 268
ratio in sediment, NH3, sulphur and DOC concentrations and by the water depth. 269
270
Highest percentage of explained variance in macroinvertebrate community structure were obtained 271
when chemical concentrations in sediments and environmental characteristics were mixed in a single 272
RDA model. Then, we explained 29% of the variance in macroinvertebrate abundances at the genus 273
level, and the significant explanatory variables were sulphur, THg, and the percentage of water in 274
sediment (humidity) along the positive end of the first axis and DOC, Pb, Zn, and HAPtot along the 275
negative end (Fig. 4A). On the first axis, the Oligocheata Limnodrilus and Quistadrilus were 276
associated to high concentrations of DOC, HAPtot, Pb and Zn located in the stations of the Montreal 277
harbour. At the opposite end of axis 1, THg gradient was related to stations located in Lake Saint-278
François and Lake Saint Louis (Fig. 4A). Two gastropods (Amnicola and Gyraulus), the amphipod 279
(Gammarus), the Trichoptera Nectopsyche and Leptocerus and the Diptera Chironomidae 280
Clinotanypus were associated to the THg contamination. A third gradient on axis 2 was associated to 281
sulphur concentrations and water percentage (humidity) in sediments. Some Diptera Chironomidae 282
(Chironomus, Dicrotendipes, Tribelos), the Gastropoda Bithynia and the Isopoda Caecidatea and 283
Lirceus were related to sediments with higher sulphur concentrations and percentage of water. On the 284
negative side of the axis 2, macroinvertebrate community were associated to the less contaminated 285
13
area located in Lake Saint-Louis and Lake Saint-Pierre and were dominated by several genus of 286
Nematoda, Nemerta, Oligochaeta, Bivalva and Ephemera. 287
288
N/P ratio in sediment, Zn, sulphur, THg, high molecular weight HAPs, and the Saint-Louis River 289
water mass explained 34% of the variance in macroinvertebrate abundances at the family level (Fig. 290
4B). As for abundance data at the genus level, Oligochaeta Tubificidae dominated in stations 291
contaminated by HAPs and Zn. At the opposite side, again, we observed the gradient of THg related to 292
Saint-Louis River water mass. The Trichoptera Dipseudopsidae, the Oligochaeta Naididae and the 293
Gastropoda Hydrobiidae were associated to these variables. Along the second axis, sulphur294
concentrations and N/P ratio were related to isopod Asellidae and Gastropoda Bithyniidae. The Diptera 295
Chironomidae were associated to both THg and N/P ratio. The Nematoda inhabited the less 296
contaminated stations.297
298
Variation in macroinvertebrate community structure based on presence/absence data at the genus and 299
family levels was explained by similar variables than abundance data such as water masses (Ottawa 300
River, Great Lakes, CUM wastewater), metals or metalloids concentrations (As, Pb, Zn), DOC, total 301
sulphur, and sediment granulometry (silt) and humidity (Fig. 5A). Many Oligocheata taxa, the Porifera 302
Spongillidae Eunapius, the platyhelminthes and the Nematoda were associated to the contaminated 303
area. As observed with abundance data, sulphur concentrations were retained as an explanatory 304
variable with presence/absence data with similar genus and family indicator taxa (Crustacea, 305
Trichoptera and Diptera). Once again, a lot of species were identified in the less contaminated zones, 306
such as the Ephemera Hexagenia, the Diptera Probezzia, Cryptochironomus, Coelotanypus, 307
Ablabesmyia, the Polycheata Manayunkia, the Nemerta Prostoma and the Coleoptera Dubiraphia.308
309
14
Variations in abundances of macroinvertebrate indicator genus were explained by concentrations of 310
Zn, sulphur and DOC, sand and silt percentages, and Great Lakes water mass with a cumulated r2 of 311
0.31 (Fig. 6). The most contaminated areas in the Montreal harbour and some stations in lakes Saint-312
Louis and Saint-Pierre were associated to higher concentrations in Zn and DOC and were dominated 313
by the two Oligocheata Tubificidea IIyodrilus and Quistadrilus. As previously observed for the entire 314
community, the Chironomidae Chironomus and Dicrotendipes were associated with the sulphur315
gradient. The Ephemera Hexagenia, the Nemerta and the Oligochaeta Spirosperma were located in 316
less contaminated stations of lakes Saint-Louis and Saint-Pierre.317
318
Partial redundancy analyses showed similar results with all datasets whatever the taxonomic level 319
(Fig. 7). In general, environmental characteristics related to water masses, DOC and sulphur 320
concentrations in sediments explained between 7 to 10% of macroinvertebrate community structure 321
whereas sediment contamination accounted for less that 2% of the total variance. The interactions 322
between environmental characteristics and sediment contamination also accounted for as much 323
explained variance as the environmental characteristics alone. All models showed high percentages 324
(78-84%) of unexplained variance or residuals (Fig. 7). 325
326
Discussion327
328
Macroinvertebrate assemblages and indicator taxa329
330
Our study showed that four different assemblages of macroinvertebrates were detected along the 331
fluvial section of the St. Lawrence using either abundance or presence/absence data at the genus or 332
family levels. These four types of community were characterized by indicator taxa. Macroinvertebrate 333
15
community occurring in the most contaminated areas of the Montreal harbour and some stations of the 334
Lake Saint-Louis and Lake Saint-Pierre (Cluster A) was characterized by tolerant taxa such as the 335
Oligochaeta Tubificidae (IIyodrilus and Quistadrilus). The presence of Oligochaeta Tubificidae is 336
often associated with degraded conditions (Hynes, 1959; Goodnight, 1973; Milbrink, 1973). Some 337
species of the genus Quistadrilus and IIyodrilus are generally found in areas where the oxygen supply 338
is reduced (Lang, 1984) and where organic enrichment is important, particularly throughout the 339
Laurentian Great Lakes (Brinkhurst & Cook, 1974; Burt et al., 1991). In Port Hope harbour, as in 340
several other harbours in Lake Ontario, Hart et al. (1986) found highest abundances of three species of 341
Oligochaeta Tubificidae in the most contaminated sediments, among which Quistadrilus was the 342
second dominant genus.343
344
Most stations of Lake Saint-François and some stations of Lake Saint-Louis, located in productive 345
waters originating from the Great Lakes, have macroinvertebrate assemblages (Cluster B) similar to 346
these previously observed in Lake Saint-Francois by Pinel-Alloul et al. (1996). Nine indicator genus 347
were characteristics of these habitats, including the Isopoda Caecidotae, the Chironomidae348
Chironomus, Tribelos, and Diaotendipes, the Trichoptera Leptoceridae Triaenodes and the Amphipoda 349
Gammarus. The Chironomid Diaotendipes and the Trichoptera Triaenodes are known to be tolerant to 350
productive environment (Klemm et al., 1990; Johnson et al., 1993). The other indicator taxa such as 351
the Hirudinae, the Hydracarina and the Planarians present important plasticity in their habitat 352
preference (Thorp & Covich, 2001).353
354
Some stations of Lake Saint-Pierre and Lake Saint-Louis, which presented the lowest contamination355
level in sediments, have been grouped together (Cluster C) and were characterized by two indicator 356
taxa: the Nemerta and the Oligochaeta Tubificidae Spirosperma. The freshwater species of Nemerta357
16
are recognized to be patchy and distributed locally in littoral macrophytes (Smith & Pennak, 2001). 358
Nemerteans, with rare exceptions, are carnivorous or scavenging macrophages. Their presence at 359
different stations could simply reflect the presence of preys. On the other hand, the presence of the 360
Oligochaeta Spirosperma in the lowest contaminated environment agrees with some studies which 361
have identified this genus as sensitive to organic pollution and indicator of undisturbed environments362
(Klemm, 1985; Griffiths, 1991; Johnson et al., 1993).363
364
Another group of stations from Lake Saint-Louis and Lake Saint-Pierre (Cluster D) forms a specific 365
assemblage associated to indicator taxa, mainly Chironomidae and Ephemeridae. At the exception of 366
the chironomid Ablabesmyia, all indicator taxa identified for this group are recognized to be 367
representative of oligotrophic medium (low in organic matter) and uncontaminated sites (Klemm et al., 368
1990; Johnson et al., 1993). It is especially the case of the Ephemera Hexagenia. This genus is369
intolerant to organic rich medium, acidic conditions and contaminated sites (Fremling, 1967; Klemm 370
et al., 1990; Reynoldson et al., 2001). The mayflies have been proposed as a good indicator of 371
ecosystem health in many countries (e.g. Fremling, 1970; Landa & Soldan, 1995; Edsall, 2001). The 372
potential of this genus as indicator of good habitat quality is related to its historically abundance in 373
many unpolluted habitats, its disappearance following pollution, and its ability to recover after 374
pollution abatement (Reynoldson et al., 2001). The Ephemera Hexagenia and the three Chironomid375
genus (Axarus, Ablabesmyia and Coelotanypus) found in cluster D were totally absent in all polluted 376
stations of the Montreal harbour. As the Ephemera, the Chironomids have been proposed as indicators 377
of water quality because they may be found in many different physical and chemical conditions in 378
freshwaters (Pinder, 1986). 379
380
17
As suggested by Pearson and Rosenberg (1978), our study supports the idea that it may be more useful 381
to use several indicator taxa rather than a unique indicator taxa to characterize macroinvertebrate 382
community variation along pollution or perturbation gradients. One reason is that the presence of a 383
single tolerant species in a site did not signify that this area is polluted or contaminated because many 384
tolerant species can be found in both perturbed and pristine areas.385
386
Influence of sediment contamination and environmental characteristics on macroinvertebrates387
388
When using separately sediment chemical variables and environmental descriptors, we could only 389
explain few of the total variance in macroinvertebrate communities along the studied fluvial section. 390
However for all taxonomic levels (genus vs family) and data (abundance, indicator taxa and 391
presence/absence), environmental descriptors related to water masses, granulometry, DOC and sulphur 392
concentrations in sediments explained higher percentages of macroinvertebrate variation than sediment 393
chemical contamination which had very low influence. Furthermore, the interactions between 394
environmental descriptors and sediment contamination had as much importance as the environmental 395
conditions alone. In many studies, environmental conditions also had a stronger influence on 396
macroinvertebrate communities than sediment contamination (Griffiths, 1991; Clements et al., 1992; 397
Gower et al., 1994). The strong variability in the physical and chemical conditions among water 398
masses flowing in the three fluvial lakes, in the Montreal harbour area, and among stations within each 399
of these four areas, could explain the greatest importance of the environmental variables (water400
masses, depth, sediment grain size, DOC, sulphur, etc.) in structuring the macroinvertebrate 401
communities in the St. Lawrence River. Water masses flowing from the Great Lakes, the Ottawa River 402
and the CUM wastewater are the primary factors explaining the variance in macroinvertebrate 403
abundances at the genus level and the presence/absence of taxa at the genus and family levels. As 404
18
physical and chemical conditions of water masses vary along space and time, macroinvertebrates 405
exposed to changes in these waters must be tolerant to such variations. Pinel-Alloul et al. (2004)406
indicated that environmental stressors also differ along the fluvial section of the St. Lawrence River, 407
depending to inflows of tributaries in the fluvial lakes and the main fluvial channel. Demers and 408
Levasseur (1976) noted strong differences in macroinvertebrate assemblages among 87 stations 409
located in seven sections of the St. Lawrence River (upstream from Lake Saint-François to 410
downstream of Lake Saint-Pierre) in relation to physical and chemical variations in the several water 411
masses differing in their charge in particles, their concentrations of toxic substances in particular and 412
dissolved phases, in trace and major elements and in nutrients (Rondeau et al., 2005). All these factors 413
are known to affect benthic communities (Hellawell, 1986; Burt et al., 1991; Griffiths, 1991).414
415
In RDA ordinations, we found that higher concentrations of Zn, Pb, DOC, and HAP were associated to416
most stations of the Montreal Harbour and stations in Lake Saint-Louis and Lake Saint-Pierre in417
waters originating from the Ottawa River and the CUM wastewater effluent. Many Oligochaeta 418
Tubificidae identified to the family and genus levels were associated with these high levels of 419
contamination. As previously discussed, these groups of organisms are tolerant to high levels of 420
contamination (Hynes, 1959; Goodnight, 1973; Milbrink, 1973). Same taxa were often identified in the 421
RDAs performed using the different taxonomic levels. It is especially the case of the Oligochaeta 422
Tubificidae IIyodrilus, Quistadrilus and Limnodrilus. Many species of these three genus have largely 423
been cited as tolerant organisms to inorganic and organic contaminants (e.g. Klemm, 1985; Burt et al., 424
1991; Adams, 1996; Reynoldson et al., 2001). Since the seventies, the oligochaetes were the group of 425
macroinvertebrates the most often enlisted for biomonitoring and bioassessment of sediment quality in 426
European freshwaters and elsewhere throughout the world (see Brinkhurst & Cook, 1980) for an 427
exhaustive overview) because their development is enhanced in sediments contaminated by organic 428
19
and inorganic pollutants (Lang, 1984; Lafont & Juget, 1985; Verdonschot, 1989). Our study indicated 429
that these three Oligochaeta are also relevant indicator taxa for assessing sediment quality in the St. 430
Lawrence River.431
432
The Porifera Spongillidae Eunapius (POEuna and POSpon) was identified by its presence – absence in 433
the highest concentration of Zn, Pb and DOC occurring in the area of the Montreal harbour. According 434
to Kleem et al. (1990), this genus is strongly tolerant to high concentration of heavy metals. However, 435
the distribution of the Porifera Eunapius was not only restricted to the stations presenting high levels 436
of contaminants. We found this invertebrate in all four studied zones and more specifically in 27 437
stations. Its presence was probably due to its tolerance to a large range of physico-chemical conditions. 438
A recent review on freshwater sponges indicated that sponges can colonize an extremely wide variety 439
of habitats (springs, streams, rapids, estuaries, freshwater and salt lakes, etc.) and are able to tolerate 440
and survive in extreme physico-chemical conditions ranging from permafrost, thermal waters, 441
fluctuating water levels, stagnant to high speed waters, anoxy, oligotrophy to eutrophy, high levels of 442
chemicals, and natural or man-made pollution by hydrocarbons and heavy metals (Manconi & 443
Pronzato, 2008). Some other organisms have also been identified in this zone, such as Platyhelminthes 444
(PLHydr, PLPlag) and Nematods. Kleem et al. (1990) classified these invertebrates as organisms 445
having a wide range of tolerance that are frequently associated with moderate to high levels of organic 446
contamination. In his study carried out in St. Clair River, (Griffiths, 1991) observed the presence of 447
many species of worms and flatworms tolerant to organic and inorganic contamination in the sediment 448
(metals, greases, oil, etc.).449
450
Sometimes associated with percentage of water (humidity) or N/P ratio in the sediment, sulphur was 451
also an important factor explaining variations of macroinvertebrates with all taxonomic levels and data 452
20
used in this study. In our study area sulphur mainly originates from geological source and its gradient 453
corresponding to upstream to downstream gradient with higher concentration observed in the Lake 454
Saint-François. High concentration of sulphur is often associated to low level of oxygen in the 455
sediment. Species more tolerant to hypoxia are also tolerant to sulphide, such as Diptera (Wiederholm, 456
1976; Wiederholm, 1984; Pinder, 1986) and Gastropoda (Goodnight, 1973). In our study, all of these 457
groups of macroinvertebrates have been related to the gradient of sulphur concentrations. Some genus 458
and family of Amphipoda and Isopoda (Caecidotea, Gammarus, Lirceus), Diptera (Chironomus, 459
Dicrotendipes, Tribelos) and Gastropoda (Amnicola, Bithynia, Planorbella and Physella) were 460
identified in stations presenting high concentrations of sulphur. Pinel-Alloul et al. (1996) observed that 461
gastropods can tolerate severe conditions in sediments in Lake Saint-François. They observed an 462
increase in species richness and relative abundance of this group in sediments rich in organic and 463
inorganic pollutants. Some macroinvertebrates may colonize the sides of zones rich in sulphide in such 464
a way to be able to use limited oxygen available and resist toxic effects of hydrogen sulphides. It is 465
probably the case of crustaceans and gastropods in our study, at the opposite of Diptera, these 466
organisms are more motile and can avoid more severe conditions of anoxia and high concentrations of 467
sulphur. Macroinvertebrates may have physiological adaptations to sustain anoxia by producing 468
haemoglobin or ventilating their tubes as for the chironomids (Stief et al., 2005) or by changing their 469
motile behaviour (e.g. movement for gastropods and crustaceans; Salánki et al., 2003). These 470
adaptations could possibly explain why snails were found in areas of low levels of Pb, Zn and HAP 471
contamination.472
473
When using the environmental characteristics only, the N/P ratio was an important variable explaining 474
the variation in macroinvertebrate abundances. This variable was associated with other variables such 475
as NH3, sulphur and depth. The N/P ratio was also identified as primary variable when using both 476
21
explanatory matrices (sediment contamination and environmental characteristics), especially with 477
many stations of Lake Saint-François which presented the highest N/P ratio (5 to 7) because of higher 478
nitrogen concentrations in Lake Saint-François. In this lake, as indicated by vector of environmental 479
descriptors in RDA ordinations, N/P gradient was associated to higher concentrations of TOC and 480
sulphur and a greater proportion of silt in the sediments. Many studies established the correlation 481
between nutrient enrichment of sediment and changes in macroinvertebrate assemblages (Weston, 482
1990; Griffiths, 1991; Gao et al., 2005). The diversity of macroinvertebrates is generally reduced in 483
nutrient-rich stations, reflecting the adverse impacts of nutrient enrichment. Some tolerant organisms 484
thrive in severely organic-rich sediment with high loadings of nutrients and sulphide with low oxygen 485
levels (Milbrink, 1973; Brinkhurst & Cook, 1974; Weston, 1990). In RDA ordinations, the Diptera 486
Chironomidae was closely associated to the N/P ratio. These organisms are extremely tolerant to harsh 487
conditions (Wiederholm, 1976; Pinder, 1986). The chironomids was also associated to high 488
concentrations in THg. This result shows that some taxa of Diptera Chironomidae are well adapted to 489
severe conditions in sediments (e.g. Pinder, 1986; Griffiths, 1991; Stief et al., 2005).490
491
Although THg was retained in all RDA conducted on chemical variables only (Table 3), THg was only492
selected in the RDA performed on abundance at the genus and family levels when using both sediment 493
mixed-contamination and environmental characteristics. The highest concentrations (0.49 to 9.9 494
mg/kg) were mainly observed in the stations located close to the St. Louis River in the south shores of 495
Lake Saint-Louis, and were related to the presence of many industries in this region, and particularly 496
of a former chlore-alkali plant located in the lower reaches of the St. Louis River. It has already been 497
identified as the major source of Hg contamination (Fortin et al., 1994). The area under the influence 498
of the St. Louis River waters is recognized as highly contaminated by mercury in sediments and 499
macroinvertebrates as Gastropods (Désy et al., 2000). Apart the Diptera Chironomidae, other 500

22
macroinvertebrates such as the Gastropoda Amnicola and Gyraulus, the Amphipoda Gammarus, the 501
Trichoptera Nectopsyche and Leptocerus and the Diptera Clinotanypus were associated to stations 502
contaminated in THg. In stations located upstream and downstream of the Saint-Louis River, Willsie 503
& Costan (1996) have observed a greater percentage of Gastropoda, Trichoptera and Amphipoda in the 504
upstream stations where the sediment was the most contaminated in organic and inorganic chemicals. 505
In the St. Marys River, (Griffiths, 1991) found that the Amphipoda Gammarus, and the Gastropoda 506
Amnicola and Gyraulus were associated to stations presenting moderate to severe environmental 507
contamination by THg which concentrations varied between 0.11 to 15.03 mg/kg. Differences among 508
groups of aquatic insects in their sensitivity to heavy metals are well known. Many studies have shown 509
that Trichoptera and some Chironomidae are quite tolerant to high concentrations of heavy metals (e.g. 510
(Warnick & Bell, 1969; Winner et al., 1980; Clements et al., 1988). In agreement with this study, 511
many works carried out in area contaminated by mercury have identified tolerant taxa (e.g. Moore et 512
al., 1979; Suchanek et al., 1995; Willsie & Costan, 1996).513
514
Taxonomic resolution and macroinvertebrate data 515
516
The four different approaches used in this study (genus vs family; abundance vs presence/absence) did 517
not produced the same assemblages of taxa within the four macroinvertebrate groups and did not allow 518
to detect equal and similar indicator taxa within each group. The abundance of taxa at the genus level 519
was found the best approach for detecting more indicator taxa and obtaining better community-520
environment explanatory models. The abundance of taxa at the family level and the presence/absence 521
of taxa at the genus and family levels did not allow identifying indicator taxa in the four associations 522
of stations. In the context of this study, these approaches cannot be used as biological tools to establish 523
relationship between macroinvertebrate assemblages and environmental conditions of sediments and 524
23
waters in the St. Lawrence River. A good biological tool should give a complete scheme of the 525
situation prevailing in all stations and within groups of stations representing the total variation in 526
macroinvertebrate communities. Abundance data at the genus level seems to offer advantage for 527
detecting indicator taxa for the four assemblages of macroinvertebrates along the fluvial section of the 528
St. Lawrence River and gave the more powerful RDA model. In one hand, reducing taxonomic 529
resolution by identifying macroinvertebrates at the family level facilitates sorting, requires a much 530
lower degree of specialisation and lessens time and cost. In the other hand, lack of taxonomic 531
resolution (at the genus level) can decrease sensitivity and reduce the ability to detect more subtle 532
changes (Resh & McElravy, 1984). This is exactly the case of this study when using family level to 533
determine indicator taxa of macroinvertebrate assemblages. Comparing the overall results of the RDA 534
models, we cannot assert that a taxonomic level is better than the other one to establish 535
macroinvertebrate-environment relationships. The percentage of variance in macroinvertebrates 536
explained by chemicals in sediments and environmental characteristics, and their interactions were 537
quite low and comparable among taxonomic levels. Common models also resulted from different data 538
(abundance and presence/absence). Discrepancy exists in the literature about which taxonomic level to 539
use in bioassessment studies. (Reynoldson et al., 2001) found that by increasing the taxonomic level to 540
classify reference sites based on similar macroinvertebrate assemblages (species genus, and family), 541
the family level ranked best, followed by the genus and species levels. Thompson et al. (2003) found 542
that differences between locations were detected when species were aggregated to the family level, but 543
further aggregations at the order and class levels altered the perceived pattern of differences. Resh &544
McElravy (1984) have reviewed 34 papers addressing on the taxonomic considerations, and found that 545
18 studies emphasized the importance of species-level identification while nine studies recommended 546
to use lower resolution at the genus and family levels under appropriate circumstances. According to 547
Resh and McElravy (1984), the importance of identifications level in biomonitoring depends on the548
24
purpose of the study, the level of sensitivity required, the type of analysis being used, and the 549
particular group of organisms of primary interest. The consensus that seems to emerge in the literature 550
is that identification taxa into coarse taxonomic levels is generally quicker, less expensive and needs 551
less taxonomic expertise than identifying to species, thus providing a cost effective method for 552
monitoring responses of macroinvertebrate to environmental changes and contamination. As in our 553
study, many studies have found similar results when using various taxonomic levels (e.g. Olsgard et 554
al., 1998; Urkiaga-Alberdi et al., 1999; Karakassis & Hatziyanni, 2000). Olsgard et al. (1998)555
indicated that patterns of variation among macroinvertebrate community for the various taxonomic 556
levels become more similar with increasing disturbance. As mentioned by Thompson et al. (2003), the 557
cost-efficiency of a benthic monitoring study can be greatly improved if the design of the study 558
optimises the taxonomic resolution necessary to reliably detect an impact. Our study confirms that 559
family level can give comparable information than genus level using presence-absence or abundance560
of macroinvertebrates; However, higher number of indicator taxa were detected at the genus level.561
562
Acknowledgments 563
564
This study is a part of a larger collaborative program funded by the 3rd and 4th phase of the St. 565
Lawrence Action Plan, with the active participation of Environment Canada (Environmental Protection 566
Operations ; Science and Technology Branch), of the Ministère du Développement durable, de 567
l'Environnement et des Parcs du Québec (Centre d’expertise en analyse environnementale du Québec ; 568
Direction des évaluations environnementales ; Direction du suivi de l'état de l'environnement) and 569
Cemagref from Lyon (France). The project was also associated with the sustainable navigation strategy 570
for the St. Lawrence River, which includes aspects such as sustainable dredging management, 571
contaminated site restoration and revision of sediment quality guidelines for contaminated sediment. 572
25
We address special thanks to project steering committee members: C. Bélanger, C. Gagnon, M. 573
Pelletier, and S. Thibodeau from Environment Canada and L. Boudreau, I. Guay, P. Michon and 574
Gaëlle Triffaut-Bouchet from Ministère du Développement durable, de l'Environnement et des Parcs 575
du Québec and Marc Babut from Cemagref. We also want to acknowledge all fieldwork participants, 576
particularly M. Arseneault, G. Brault, A. Lajeunesse, and P. Turcotte who helped over the two 577
sampling years. The identification of the organisms was realized by a private firm (Laboratoires SAB 578
inc.).579
580
References581
Adams, D. D. 1996. I. Introduction and overview: Aquatic cycling and hydrosphere to troposphere 582
transport of reduced trace gases - A review. Mitt Internal Verein Limnol 25: 1.583
Allen, R. J. 1986. The limnological units of the lower Great Lakes St. Lawrence corridor and their role 584
in the source and aquatic fate of toxic contaminants. Water Pollution Research Journal of Canada 21: 585
168-186.586
Brinkhurst, R. O. & D. G. Cook. 1974. Aquatic earthworms. In Hart, C. W. & S. L. H. Fuller (eds), 587
Pollution Ecology of Freshwater Invertebrates. Academic Press, New York: 143-156.588
Brinkhurst, R. O. & D. G. Cook. 1980. Aquatic Oligochaete biology. Plenum Press. New York and 589
London.590
Burt, A. J., P. M. McKee, D. R. Hart & P. B. Kauss. 1991. Effects of pollution on benthic invertebrate 591
communities of the St. Marys River, 1985. Hydrobiologia 219: 63-81.592
Carignan, R., S. Lorrain & K. Lum. 1994. A 50-yr record of pollution by nutrients, trace metals, and 593
organic chemicals in the St. Lawrence River. Canadian Journal of Fisheries and Aquatic Sciences 51: 594
1088-1100.595
26
CEAEQ. 2002. Dosage des hydrocarbures pétroliers C10 à C50 dans les sols et les sédiments MA 416-596
C10-C50 1.1: 15. Ministère de l'Environnement du Québec.597
CEAEQ. 2003a. Détermination de pesticides de type organochloré dans les sols et des sédiments : 598
Extraction avec acétone et hexane : Dosage par chromatographie en phase gazeuse couplée à un 599
spectromètre de masse. MA. 416 P. Ocl 1.0: 25. Ministère de l'Environnement du Québec.600
CEAEQ. 2003b. Détermination de pesticides de type organophosphoré, triazine, carbamate urée 601
substituée, phtalimide et pyréthrinoïde : extraction avec de l'acétate d'éthyle; dosage par 602
chromatographie en phase gazeuse couplée à un spectromètre de masse. MA. 416 - PEST 1.0: 32. 603
Ministère de l'Environnement du Québec.604
CEAEQ. 2003c. Détermination des biphényles polychlorés; méthode par congénères. MA. 400 – BPC 605
1.0: 45. Ministère de l’Environnement du Québec.606
CEAEQ. 2003d. Détermination des hydrocarbures aromatiques polycycliques; Dosage par 607
chromatographie en phase gazeuse couplée à un spectromètre de masse MA 400-HAP 1.1: 44. 608
Ministère de l’Environnement du Québec.609
CEAEQ. 2003e. Détermination du carbone inorganique dissous, du carbone organique dissous et du 610
carbone organique total : méthode par détection infrarouge. MA. 300 – C 1.0: 13. Ministère de 611
l’Environnement du Québec.612
CEAEQ. 2003f. Détermination du toxaphène dans les sols par chromatographie en phase gazeuse. 613
MA. 405 - Toxaphène 1.0: 15. Ministère de l'Environnement du Québec.614
CEAEQ. 2006a. Détermination de l'azote total kjeldahl et du phosphore total : digestion acide -615
méthode colorimétrique automatisée MA. 300-NTPT 1.1: 18. Ministère du Développement durable, de 616
l'Environnement et des Parcs du Québec.617
CEAEQ. 2006b. Détermination de pesticides de type aryloxyacide dans les sols et les sédiments : 618
extraction aqueuse en milieu basique, passage sur C-18 suivi d'une estérification: dosage par 619
27
chromatographie en phase gazeuse couplé à un spectromètre de masse. MA. 416 - P. Chlp 1.1: 23. 620
Ministère du Développement durable, de l'Environnement et des Parcs du Québec.621
CEAEQ. 2006c. Détermination du carbone et du soufre : méthode par combustion et dosage par 622
spectrophotometrie infrarouge, MA. 310 - CS 1.0: 9. Ministère du Développement durable, de 623
l'Environnement et des Parcs du Québec.624
CEAEQ. 2007. Détermination du mercure dans les tissus biologiques et les sédiments par 625
décomposition thermique : dosage par photométrie UV M.A. 207 - Hg 2.0: 13. Ministère du 626
Développement durable, de l'Environnement et des Parcs du Québec.627
Chessman, B. C., S. A. Williams & C. Besley. 2007. Bioassessment of streams with 628
macroinvertebrates: effect of sampled habitats and taxonomic resolution. Journal of the North 629
American Benthological Society 26: 546.630
Clements, W. H., D. S. Cherry & J. Cairns. 1988. The impact of heavy metals on macroinvertebrate 631
communities : A comparison of observational and experimental results. Canadian Journal of Fisheries 632
and Aquatic Sciences 45: 2017-2025.633
Clements, W. H., D. S. Cherry & J. H. Van Hassel. 1992. Assessment of the impact of heavy metals on 634
benthic communities at the Clinch River (Virginia): evaluation of an index of community sensitivity. 635
Canadian Journal of Fisheries and Aquatic Sciences 49: 1686-1694.636
Cook, D. G. & M. G. Johnson. 1974. Benthic macroinvertebrates of the St. Lawrence Great Lakes. 637
Journal of Fisheries Research Board of Canada 3: 763-782.638
Cyr, H. & J. A. Downing. 1988. Empirical relationships of phytomacrofaunal abundance to plant 639
biomass and macrophyte bed characteristics. Canadian Journal of Fisheries and Aquatic Sciences 45: 640
976-984.641
Demers, R. & H. Levasseur. 1976. Étude de la diversité du benthos Phase 1. Étude sur le fleuve Saint-642
Laurent. Direction de la connaissance et de la qualité du milieu.643
28
Désilets, L. & C. Langlois. 1989. Variation spatiale et saisonnière de la qualité de l'eau du fleuve 644
Saint-Laurent. Environnement Canada, Conservation et protection, région du Québec, Centre Saint-645
Laurent.646
Desrosiers, M., C. Gagnon, S. Masson, L. Martel & M. P. Babut. 2008. Relationships among 647
extractable and reactive metals and metalloid in the St. Lawrence River sediment: Bioaccumulation by 648
chironomids and implication for ecological risk assessment. Science of the Total Environment 389: 649
101-114.650
Désy, J. C., J. F. Archambault, B. Pinel-Alloul, J. Hubert & P. G. C. Campbell. 2000. Relationships 651
between total mercury in sediments and methyl mercury in the freshwater gastropod prosobranch 652
Bithynia tentaculata in the St. Lawrence River, Quebec. Canadian Journal of Fisheries and Aquatic 653
Sciences 57: 164-173.654
Dufrêne, M. & P. Legendre. 1997. Species assemblages and indicator species: the need for a flexible 655
asymmetrical approach. Ecological Monographs 67: 345-366.656
Edsall, T. A. 2001. Burrowing mayflies (Hexagenia) as indicators of ecosystem health. Aquatic 657
Ecosystem Health & Management 4: 283-292.658
Environment Canada. 2005. The 2005 Pulp and Paper EEM Technical Guidance Document. 659
(http://www.ec.gc.ca/eem/English/PulpPaper/Guidance/default.cfm).660
Fortin, G., D. Leclair & A. Sylvestre. 1994. Synthèse des connaissances sur les aspects physiques et 661
chimiques de l’eau et des sédiments du lac Saint-Louis. Rapp. tech., zones d’intervention prioritaire 662
nos. 5 et 6. Environnement Canada, Conservation et Protection, Région du Québec, Centre Saint-663
Laurent, Montréal, Québec.664
Fremling, C. R. 1967. Methods for mass-rearing Hexagenia mayflies (Ephemeroptera-Ephemeridae). 665
Transactions of the American Fisheries Society 96: 407-.666
29
Fremling, C. R. 1970. Mayfly distribution as a qater quality index. Environmental Protection Agency, 667
Water Quality Office. Washington, DC, Water Pollution Control Research Series: 1-39.668
Gao, Q.-F., K. Cheung, S.-G. Cheung & P. K. S. Shin. 2005. Effects of nutrient enrichment derived 669
from fish farmingactivities on macroinvertebrate assemblages in a subtropical region of Hong Kong. 670
Marine Pollution Bulletin 51: 994-1002.671
Goodnight, C. J. 1973. The use of aquatic macroinvertebrates as indicators of stream pollution. 672
Transaction of the American Microscopical Society 92: 1-13.673
Gower, A. M., G. Myers, M. Kent & M. E. Foulkes. 1994. Relationships between macroinvertebrate 674
communities and environmental variables in metal-contaminated streams in south-west England. 675
Freshwater Biology 32: 199-221.676
Griffiths, R. W. 1991. Environmental quality assessment of the St.Clair River as reflected by the 677
distribution of benthic macroinvertebrates in 1985. Hydrobiologia 219: 143.678
Hart, D. R., P. M. McKee & A. J. Burt. 1986. Benthic community and sediment quality assessment of 679
port Hope harbour, Lake Ontario. Journal of Great Lakes Research 12: 206-220.680
Hellawell, J. M. 1986. Biological indicators of freshwater pollution and environmental management. 681
Elsevier. London.682
Hynes, H. B. N. 1959. The use of invertebrates as indicators of river pollution. Proceedings of the 683
Linnean Society of London 170: 165-169.684
Ihakam, R. & R. Gentleman. 1996. R: a language for data analysis and graphics. Journal of 685
Computational and Graphical Statistics 5: 299-314.686
Johnson, R. K., T. Wiederholm & D. M. Rosenberg. 1993. Freshwater biomonitoring using individual 687
organisms, populations, and species assemblages of benthic macroinvertebrates. In Rosenberg, D. M. 688
& V. H. Resh (eds), Freshwater biomonitoring and benthic macroinvertebrates. Chapman and Hall, 689
New York: 40-125.690
30
Karakassis, I. & E. Hatziyanni. 2000. Benthic disturbance due to fish farming analyzed under different 691
levels of taxonomic resolution. Marine Ecology Progress Series 203: 247-253.692
Klemm, D. J. 1985. A guide to the freshwater annelida (Polychaeta, Naidid and Tubificid Oligochaeta 693
and Hirudinea) of North America. Kendall/Hunt Publishing Co., Dubuque Iowa, 198 p. ISBN 0-8403-694
3577-6.695
Klemm, D. J., P. A. Lewis, F. Fulk & J. M. Lazorchak. 1990. Macroinvertebrate field and laboratory 696
methods for evaluating the biological integrity of surface waters, U.S Environmental Protection 697
Agency, Office of Research and Development of the Environmental Monitoring Systems Laboratory, 698
Cincinnati, Ohio: 1-206.699
Lafont, M. & J. Juget. 1985. Les oligochètes de quelques lacs français : proposition en vue de leur 700
utilisation pratique pour apprécier l’état biologique des sédiments profonds. Verh Internal Verein 701
Limnol 22: 3019-3023.702
Landa, V. & T. Soldan. 1995. Mayflies as indicators of water quality and environmental change on 703
regional and global scale. In Corkum, L. D. & J. J. H. Ciborowski (eds), Current directions in research 704
on Ephemeroptera. Canadian Scholar’s Press, Toronto: 21-29.705
Lang, C. 1984. Eutrophication of Lakes Leman and Neuchatel (Switzerland) indicated by oligochaete 706
communities. Hydrobiologia 115: 131-138.707
Legendre, P. & E. D. Gallagher. 2001. Ecologically meaningful transformations for ordination of 708
species data. Oecologia 129: 271-280.709
Legendre, P. & L. Legendre. 1998. Numerical Ecology. Elsevier Science BV, Amsterdam.710
Loiselle, C., G. Fortin, S. Lorrain & M. Pelletier. 1997. Dynamics and Contamination of St. Lawrence 711
River Sediment, Montreal : Environment Canada - Quebec Region, Environmental Conservation, St. 712
Lawrence Centre, State of the Environment: 1-127.713
31
Manconi, R. & R. Pronzato. 2008. Global diversity of sponges (Porifera: Spongillina) in freshwater. 714
Hydrobiologia 595: 27–33.715
Merritt, R. W. & K. W. Cummins. 1996. An introduction to the aquatic insects of North America 716
Kendall/Hunt Publishing Company. Dubuque, Iowa. .717
Milbrink, G. 1973. Communities of oligochaeta as indicators of the water quality in Lake Hjalmaren. 718
Zoon 1: 77-88.719
Moore, J. W., V. A. Beaubien & D. J. Sutherland. 1979. Comparative effects of sediment and water 720
contamination on benthic invertebrates in four lakes. Bulletin of Environmental Contamination and 721
Toxicology 23: 840-847.722
Nettleton, P. 1996. Modelling Component Report for the Cornwall MISA Pilot Site Study: Technical 723
procedures for the derivation of water quality-based effluent loading limits for point-source discharges 724
to large rivers. Report prepared for Ontario Ministry of Environment and Energy, May 1996. PIBS 725
3426E. ISBN 0-7778-5221-7.726
Olsgard, F., P. J. Somerfield & M. R. Carr. 1998. Relationship between taxonomic resolution, 727
macrobenthic community patterns and disturbance. Marine Ecology Progress Series 172: 25-36.728
Pearson, T. H. & R. Rosenberg. 1978. Macrobenthic succession in relation to enrichment and pollution 729
of the marine environment. Oceanography and Marine Annual Review 16: 229-311.730
Pelletier, M. 2008. Évolution spatiale et temporelle de la dynamique et de la géochimie des sédiments 731
du lac Saint-Pierre, Rapport scientifique et technique ST- 240: 150. Environnement Canada - Sciences 732
et de la technologie, Monitoring et surveillance de la qualité de l'eau - Région du Québec.733
Pinder, L. C. V. 1986. Biology of freshwater Chironomidae. Annual Review of entomology 31: 1-23.734
Pinel-Alloul, B., G. Methot & D. Borcard. 2004. Évaluation de l’état des données sur les 735
macroinvertébrés benthiques du fleuve Saint-Laurent et de ses tributaires pour une application d’un 736
32
modèle de suivi environnemental avec l’approche des conditions de référence (CABIN): 68. Centre 737
Saint-Laurent, Environnement Canada.738
Pinel-Alloul, B., G. Méthot, L. Lapierre & A. Willsie. 1996. Macroinvertebrate community as a 739
biological indicator of ecological and toxicological factors in lake Saint-François (Québec). 740
Environmental Pollution 91: 64-87.741
Resh, V. H. & E. P. McElravy. 1984. Contemporary quantitative approaches to biomonitoring using 742
benthic macroinvertebrates. In Rosenberg, B. & V. H. Resh (eds), Freshwater biomonitoring and 743
benthic macroinvertebrates. Chapman and Hall, New York: 159-194.744
Reynoldson, T. B., D. M. Rosenberg & V. H. Resh. 2001. Comparison of models predicting 745
invertebrate assemblages for biomonitoring in the Fraser River catchment, British Columbia. Canadian 746
Journal of Fisheries and Aquatic Sciences 58: 1395-1410.747
Rondeau, B., D. Cossa, P. Gagnon, T. T. Pham & C. Surette. 2005. Hydrological and biogeochemical 748
dynamics of the minor and trace elements in the St. Lawrence River. Applied Geochemistry 20: 1391-749
1408.750
Rosenberg, D. M. & V. H. Resh. 1993. Freshwater biomonitoring and benthic macroinvertebrates. 751
Chapman and Hall. New-york.752
Salánki, J., A. Farkas, T. Kamardina & K. S. Rózsa. 2003. Molluscs in biological monitoring of water 753
quality. Toxicology Letters 140-141: 403-410.754
Smith, D. G. & R. W. Pennak. 2001. Pennak's Freshwater Invertebrates of the United States: Porifera755
to Crustacea. John Wiley and Sons.756
Stief, P., L. Nazarova & D. D. Beer. 2005. Chimney construction by Chironomus riparius larvae in 757
response to hypoxia: microbial implications for freshwater sediments. Journal of the North American 758
Benthological Society 24: 858-871.759
33
Suchanek, T. H., P. J. Richerson, L. J. Holts, B. A. Lamphere, C. E. Woodmansee, D. G. Slotton, E. J. 760
Harner & L. A. Woodward. 1995. Impacts of mercury on benthic invertebrate populations and 761
communities within the aquatic ecosystem of Clear Lake, California. Water Air and Soil Pollution 80: 762
951.763
Tall, L., G. Méthot, A. Armellin & B. Pinel-Alloul. 2008. Bioassessment of benthic 764
macroinvertebrates in wetland habitats of Lake Satin-Pierre (St. Lawrence River). Journal of Great 765
Lakes Research 34: 599-614.766
Tessier, C., A. Cattaneo, B. Pinel-Alloul, C. Hudon & D. Borcard. 2008. Invertebrate communities 767
associated with metaphyton and emergent and submerged macrophytes in a large river. Aquatic 768
Sciences 70: 10-20.769
Thompson, B. W., M. J. Riddle & J. S. Stark. 2003. Cost-efficient methods for marine pollution 770
monitoring at Casey stations, East Antarctica : the choice of sieve mesh-size and taxonomic resolution. 771
Marine Pollution Bulletin 46: 232-243.772
Thorp, J. H. & A. P. Covich. 2001. Ecology and classification of North American freshwater 773
invertebrates. Academic Press. San Diego.774
Urkiaga-Alberdi, J., S. Pagola-Carte & J. I. Saiz-Salinas. 1999. Reducing effort in the use of benthic 775
bioindicators. Acta Oecologica 20: 489-497.776
Verdonschot, P. F. M. 1989. The role of oligochaetes in the management of waters. Hydrobiologia 777
180: 213-227.778
Warnick, S. L. & H. L. Bell. 1969. The acute toxicity of some heavy metals to different species of 779
aquatic insects. Journal of Water Pollution 41: 280-284.780
Weston, D. P. 1990. Quantitative examination of macrobenthic community changes along an organic 781
enrichment gradient. Marine Ecology Progress Series 61: 233-244.782
34
Wiederholm, T. 1976. Chironomids as indicators of water quality in Swedish lakes. NLU Information 783
10.Paper presented at the 6th International symposium on Chironomidae. Prague: 17.784
Wiederholm, T. 1984. Responses of aquatic insects to environmental pollution. In Resh, V. H. & D. 785
M. Rosenberg (eds), The ecology of aquatic insects. Praeger Publisher, New York: 508-557.786
Willsie, A. & G. Costan. 1996. Analyse des communautés benthiques comme indicateur de santé des 787
écosystèmes du Saint-Laurent. Centre Saint-Laurent, Environnement Canada: 68.788
Winner, R. W., B. W. Boesel & M. P. Farrell. 1980. Insect community structure as an index of heavy-789
metal pollution in lotic ecosystems. Canadian Journal of Fisheries and Aquatic Sciences 37: 647-655.790
791
792
35
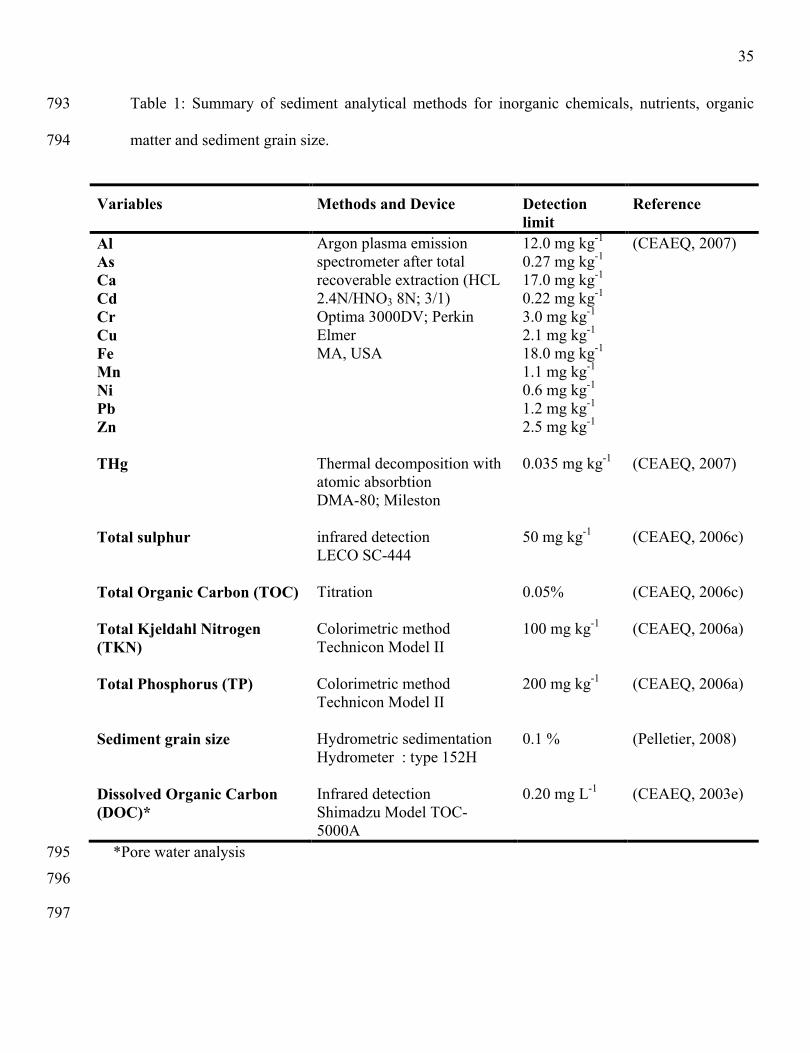
Table 1: Summary of sediment analytical methods for inorganic chemicals, nutrients, organic 793
matter and sediment grain size. 794
Variables Methods and Device Detection limit
Reference
Al As Ca Cd Cr Cu Fe Mn Ni Pb Zn
Argon plasma emission spectrometer after total recoverable extraction (HCL 2.4N/HNO3 8N; 3/1) Optima 3000DV; Perkin ElmerMA, USA
12.0 mg kg-1
0.27 mg kg-1
17.0 mg kg-1
0.22 mg kg-1
3.0 mg kg-1
2.1 mg kg-1
18.0 mg kg-1
1.1 mg kg-1
0.6 mg kg-1
1.2 mg kg-1
2.5 mg kg-1
(CEAEQ, 2007)
THg Thermal decomposition with atomic absorbtionDMA-80; Mileston
0.035 mg kg-1 (CEAEQ, 2007)
Total sulphur infrared detectionLECO SC-444
50 mg kg-1 (CEAEQ, 2006c)
Total Organic Carbon (TOC) Titration 0.05% (CEAEQ, 2006c)
Total Kjeldahl Nitrogen (TKN)
Colorimetric methodTechnicon Model II
100 mg kg-1 (CEAEQ, 2006a)
Total Phosphorus (TP) Colorimetric methodTechnicon Model II
200 mg kg-1 (CEAEQ, 2006a)
Sediment grain size Hydrometric sedimentationHydrometer : type 152H
0.1 % (Pelletier, 2008)
Dissolved Organic Carbon (DOC)*
Infrared detectionShimadzu Model TOC-5000A
0.20 mg L-1 (CEAEQ, 2003e)
*Pore water analysis795
796
797

36
Table 2: Summary of analytical methods for organic chemical in sediment798
Variables Methods and device Detection limit ReferencePCBs Congener method Performed by
Gas Chromatography / Mass Spectrometry Extracted with with acetone/hexane (60:40) and dichloromethanePurification with silica and freshly activated copperGC/MS; Agilent, GC 6890N, MS 5973N
2 - 6 µg kg-1 (CEAEQ, 2003c)
PAHs Performed by Gas Chromatography / Mass Spectrometry Extracted with with acetone/hexane (60:40) and dichloromethanePurification on silicaGC/MS; Agilent, GC 6890N, MS 5973N
0.02 - 0.10 mg kg-1 (CEAEQ, 2003d)
Pesticides organochlorine Performed by Gas Chromatography / Mass Spectrometry Extraction with acetone/hexanePurification on FlorisilGC/MS ; Thermo Quest, GC trace GC et MS trace MS
1-18 µg kg-1 (CEAEQ, 2003a)
Pesticides organophosphate Performed by Gas Chromatography / Mass Spectrometry Extraction acétate d’éthyleGC/MS; Agilent, GC 6890N, MS 5973N
5-260 µg kg-1 (CEAEQ, 2003b)
Pesticides aryloxyacid Performed by Gas Chromatography / Mass Spectrometry Extraction with NaHCO3 and on C-18 columnPurification on silica gelGC/MS; Agilent, GC 6890N, MS 5973N
1-7 µg kg-1 (CEAEQ, 2006b)
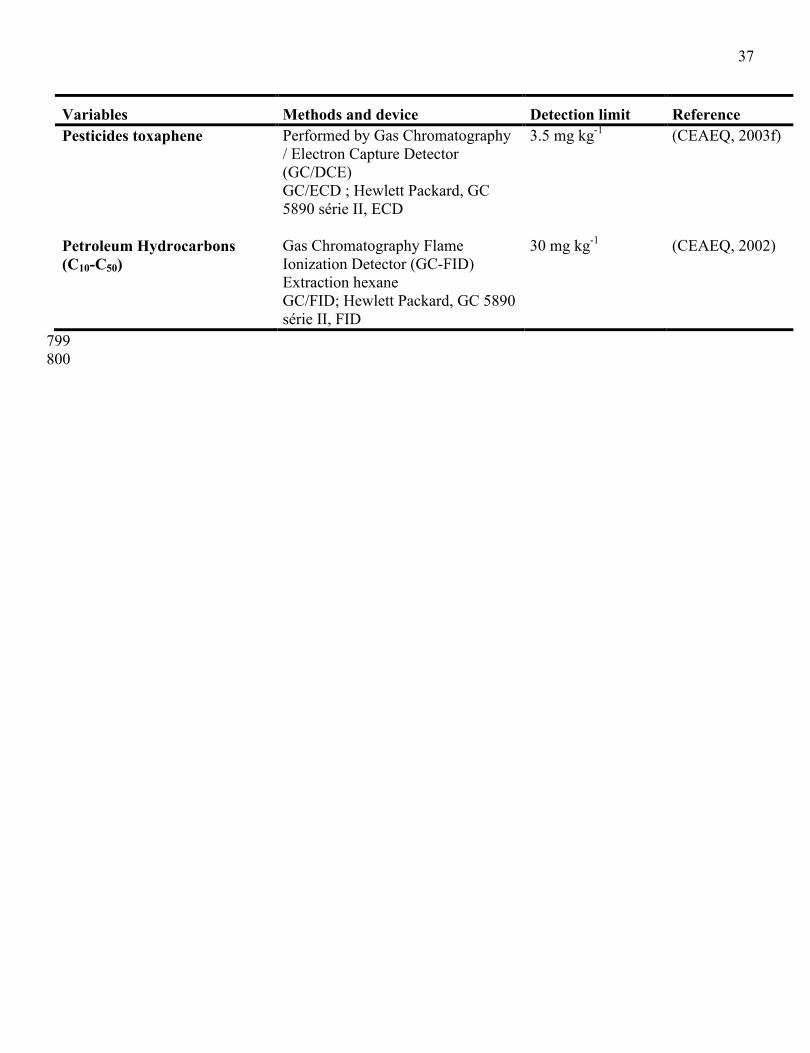
37
Variables Methods and device Detection limit ReferencePesticides toxaphene Performed by Gas Chromatography
/ Electron Capture Detector (GC/DCE)GC/ECD ; Hewlett Packard, GC 5890 série II, ECD
3.5 mg kg-1 (CEAEQ, 2003f)
Petroleum Hydrocarbons (C10-C50)
Gas Chromatography Flame Ionization Detector (GC-FID)Extraction hexaneGC/FID; Hewlett Packard, GC 5890 série II, FID
30 mg kg-1 (CEAEQ, 2002)
799800
38
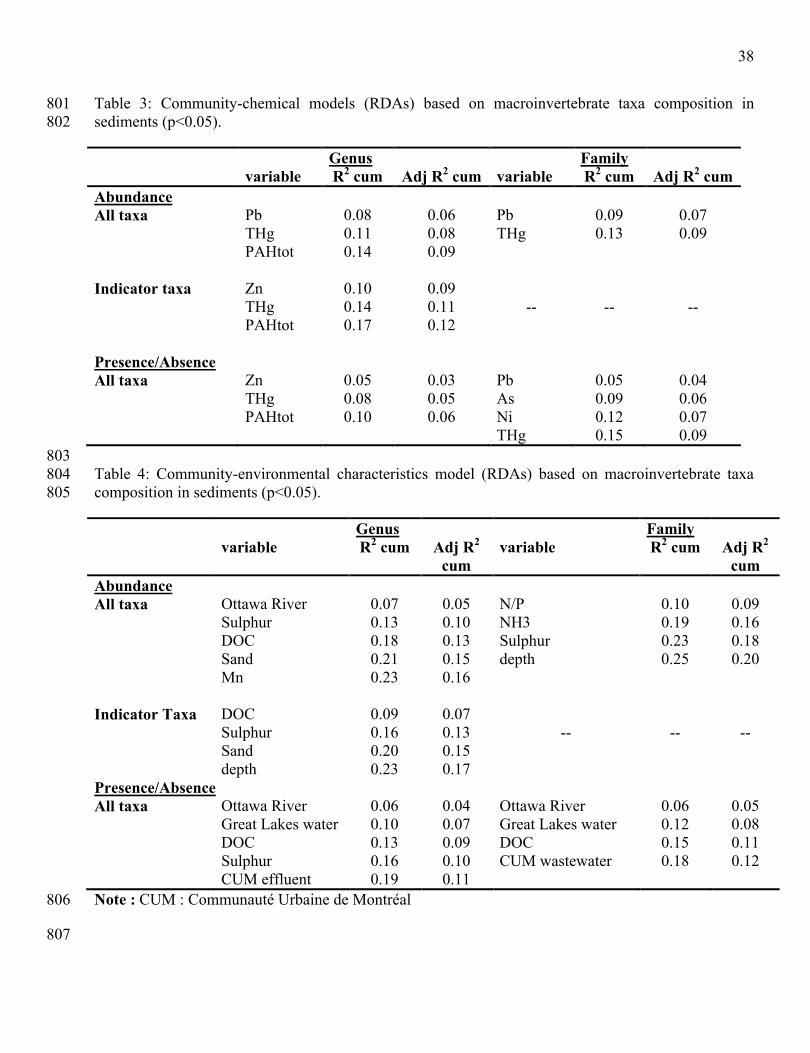
Table 3: Community-chemical models (RDAs) based on macroinvertebrate taxa composition in 801sediments (p<0.05).802
Genus Familyvariable R2 cum Adj R2 cum variable R2 cum Adj R2 cum
AbundanceAll taxa Pb
THgPAHtot
0.080.110.14
0.060.080.09
PbTHg
0.090.13
0.070.09
Indicator taxa ZnTHgPAHtot
0.100.140.17
0.090.110.12
-- -- --
Presence/AbsenceAll taxa Zn
THgPAHtot
0.050.080.10
0.030.050.06
PbAsNiTHg
0.050.090.120.15
0.040.060.070.09
803Table 4: Community-environmental characteristics model (RDAs) based on macroinvertebrate taxa 804composition in sediments (p<0.05).805
Genus Familyvariable R2 cum Adj R2
cumvariable R2 cum Adj R2
cumAbundanceAll taxa Ottawa River
SulphurDOCSandMn
0.070.130.180.210.23
0.050.100.130.150.16
N/PNH3Sulphurdepth
0.100.190.230.25
0.090.160.180.20
Indicator Taxa DOCSulphurSanddepth
0.090.160.200.23
0.070.130.150.17
-- -- --
Presence/AbsenceAll taxa Ottawa River
Great Lakes waterDOCSulphurCUM effluent
0.060.100.130.160.19
0.040.070.090.100.11
Ottawa RiverGreat Lakes waterDOCCUM wastewater
0.060.120.150.18
0.050.080.110.12
Note : CUM : Communauté Urbaine de Montréal806
807
39
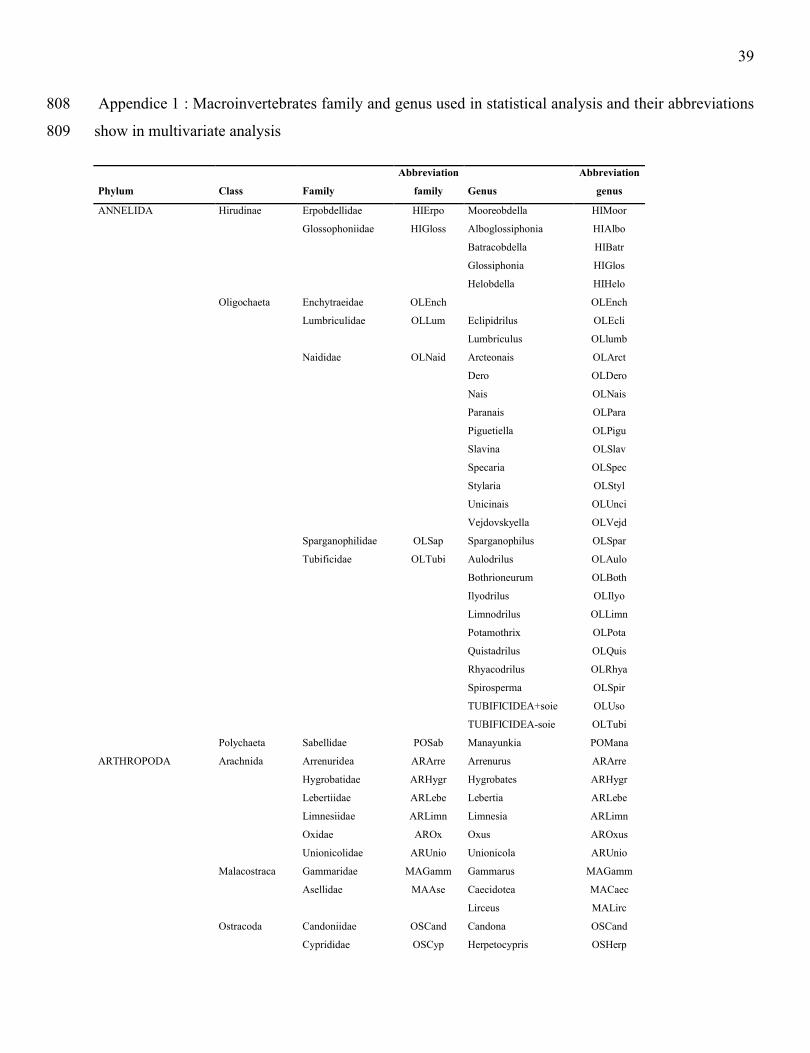
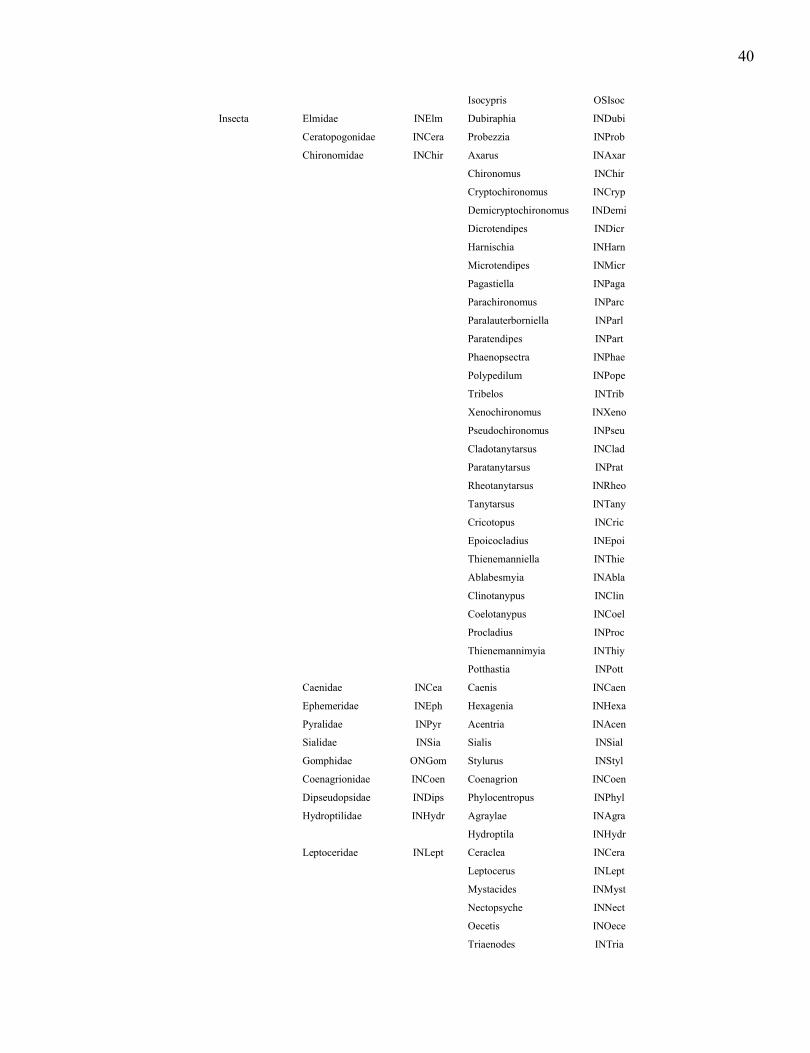
Appendice 1 : Macroinvertebrates family and genus used in statistical analysis and their abbreviations 808
show in multivariate analysis809
Phylum Class Family
Abbreviation
family Genus
Abbreviation
genus
ANNELIDA Hirudinae Erpobdellidae HIErpo Mooreobdella HIMoor
Glossophoniidae HIGloss Alboglossiphonia HIAlbo
Batracobdella HIBatr
Glossiphonia HIGlos
Helobdella HIHelo
Oligochaeta Enchytraeidae OLEnch OLEnch
Lumbriculidae OLLum Eclipidrilus OLEcli
Lumbriculus OLlumb
Naididae OLNaid Arcteonais OLArct
Dero OLDero
Nais OLNais
Paranais OLPara
Piguetiella OLPigu
Slavina OLSlav
Specaria OLSpec
Stylaria OLStyl
Unicinais OLUnci
Vejdovskyella OLVejd
Sparganophilidae OLSap Sparganophilus OLSpar
Tubificidae OLTubi Aulodrilus OLAulo
Bothrioneurum OLBoth
Ilyodrilus OLIlyo
Limnodrilus OLLimn
Potamothrix OLPota
Quistadrilus OLQuis
Rhyacodrilus OLRhya
Spirosperma OLSpir
TUBIFICIDEA+soie OLUso
TUBIFICIDEA-soie OLTubi
Polychaeta Sabellidae POSab Manayunkia POMana
ARTHROPODA Arachnida Arrenuridea ARArre Arrenurus ARArre
Hygrobatidae ARHygr Hygrobates ARHygr
Lebertiidae ARLebe Lebertia ARLebe
Limnesiidae ARLimn Limnesia ARLimn
Oxidae AROx Oxus AROxus
Unionicolidae ARUnio Unionicola ARUnio
Malacostraca Gammaridae MAGamm Gammarus MAGamm
Asellidae MAAse Caecidotea MACaec
Lirceus MALirc
Ostracoda Candoniidae OSCand Candona OSCand
Cyprididae OSCyp Herpetocypris OSHerp
40
Isocypris OSIsoc
Insecta Elmidae INElm Dubiraphia INDubi
Ceratopogonidae INCera Probezzia INProb
Chironomidae INChir Axarus INAxar
Chironomus INChir
Cryptochironomus INCryp
Demicryptochironomus INDemi
Dicrotendipes INDicr
Harnischia INHarn
Microtendipes INMicr
Pagastiella INPaga
Parachironomus INParc
Paralauterborniella INParl
Paratendipes INPart
Phaenopsectra INPhae
Polypedilum INPope
Tribelos INTrib
Xenochironomus INXeno
Pseudochironomus INPseu
Cladotanytarsus INClad
Paratanytarsus INPrat
Rheotanytarsus INRheo
Tanytarsus INTany
Cricotopus INCric
Epoicocladius INEpoi
Thienemanniella INThie
Ablabesmyia INAbla
Clinotanypus INClin
Coelotanypus INCoel
Procladius INProc
Thienemannimyia INThiy
Potthastia INPott
Caenidae INCea Caenis INCaen
Ephemeridae INEph Hexagenia INHexa
Pyralidae INPyr Acentria INAcen
Sialidae INSia Sialis INSial
Gomphidae ONGom Stylurus INStyl
Coenagrionidae INCoen Coenagrion INCoen
Dipseudopsidae INDips Phylocentropus INPhyl
Hydroptilidae INHydr Agraylae INAgra
Hydroptila INHydr
Leptoceridae INLept Ceraclea INCera
Leptocerus INLept
Mystacides INMyst
Nectopsyche INNect
Oecetis INOece
Triaenodes INTria
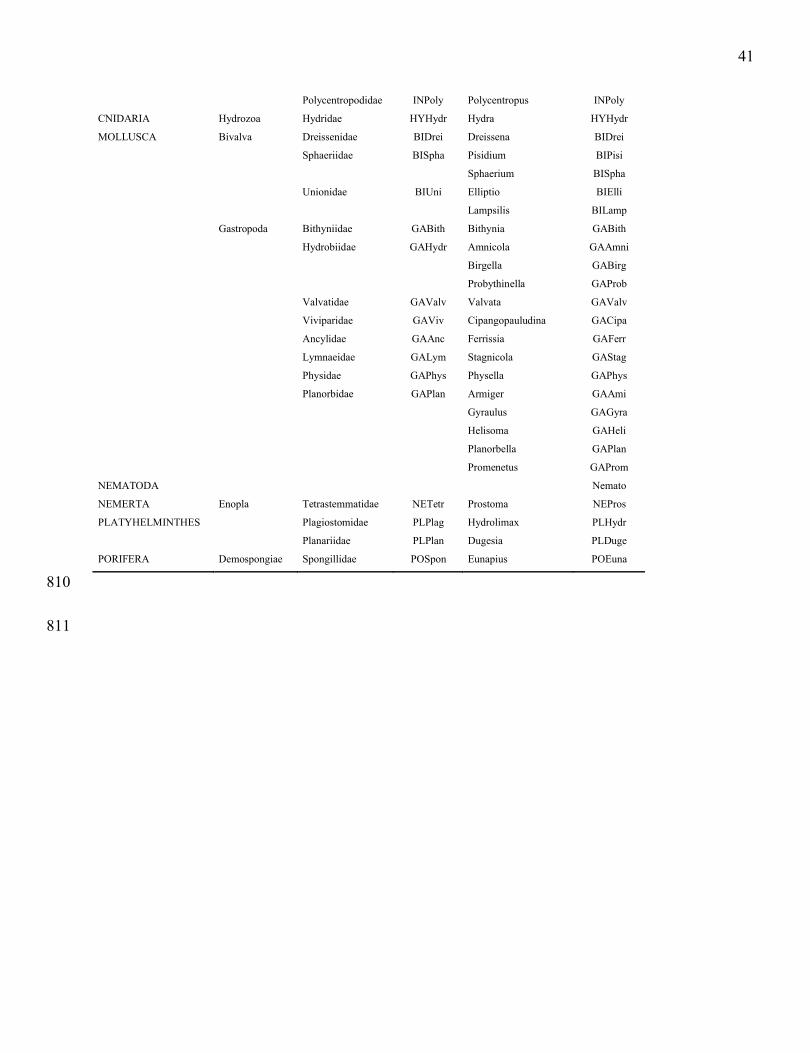
41
Polycentropodidae INPoly Polycentropus INPoly
CNIDARIA Hydrozoa Hydridae HYHydr Hydra HYHydr
MOLLUSCA Bivalva Dreissenidae BIDrei Dreissena BIDrei
Sphaeriidae BISpha Pisidium BIPisi
Sphaerium BISpha
Unionidae BIUni Elliptio BIElli
Lampsilis BILamp
Gastropoda Bithyniidae GABith Bithynia GABith
Hydrobiidae GAHydr Amnicola GAAmni
Birgella GABirg
Probythinella GAProb
Valvatidae GAValv Valvata GAValv
Viviparidae GAViv Cipangopauludina GACipa
Ancylidae GAAnc Ferrissia GAFerr
Lymnaeidae GALym Stagnicola GAStag
Physidae GAPhys Physella GAPhys
Planorbidae GAPlan Armiger GAAmi
Gyraulus GAGyra
Helisoma GAHeli
Planorbella GAPlan
Promenetus GAProm
NEMATODA Nemato
NEMERTA Enopla Tetrastemmatidae NETetr Prostoma NEPros
PLATYHELMINTHES Plagiostomidae PLPlag Hydrolimax PLHydr
Planariidae PLPlan Dugesia PLDuge
PORIFERA Demospongiae Spongillidae POSpon Eunapius POEuna
810
811
42
Figure captions812
Figure 1: Study area and location of the 59 stations in the three fluvial lakes (Saint-François, Saint-813
Louis and Saint-Pierre) and the Montreal harbour area in the St. Lawrence River (Canada).814
Figure 2: Biplots of the first two axes of the PCoA ordination of sites explained by macroinvertebrate815
assemblages based on A) genus and B) family abundances.816
Figure 3: Biplots of the first two axes of the PCoA ordinations of sites explained by macroinvertebrate 817
assemblages based on A) genus and B) family presences/absences.818
819
Figure 4: Biplots of the first two axes of the RDA ordination of the macroinvertebrate taxa 820
composition explained by chemical concentrations in sediments and environmental characteristics 821
based on A) genus and B) family abundances (for legend see Appendice 1).822
823
Figure 5: Biplots of the first two axes of the RDA ordination of the macroinvertebrate taxa 824
composition explained by chemical concentrations in sediments and environmental characteristics 825
based on A) genus and B) family presences/absences (for legend see Appendice 1).826
827
Figure 6: Biplots of the first two axes of the RDA ordination of the macroinvertebrate taxa 828
composition explained by chemical concentrations in sediments and environmental characteristics for 829
significant indicator genus (for legend see Appendice 1)830
831
Figure 7: Proportion of variance in macroinvertebrate communities explained by chemical 832concentrations in sediments, environmental characteristics and their interactions for A) genus 833abundances, B) significant indicator genus abundances, C) family abundances, D) genus 834presences/absences data and E) family presences/absences data.835
836

43
Masson et al ; Figure 1837
838
839
840
841
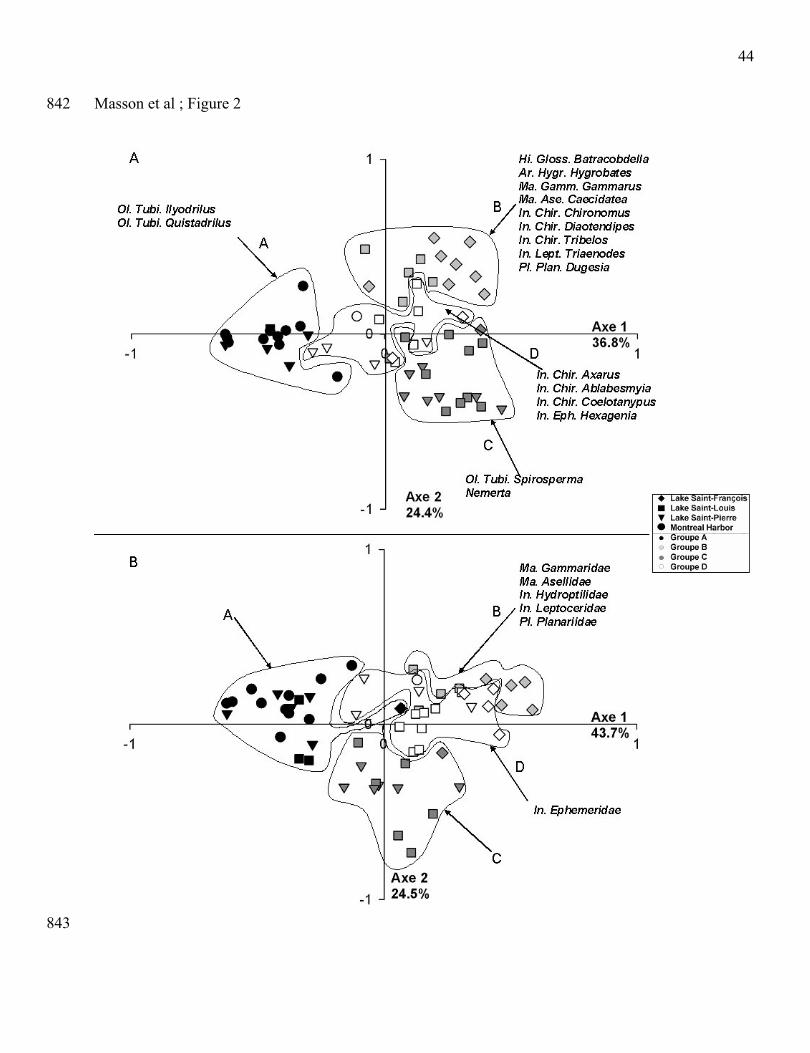
44
Masson et al ; Figure 2842
843
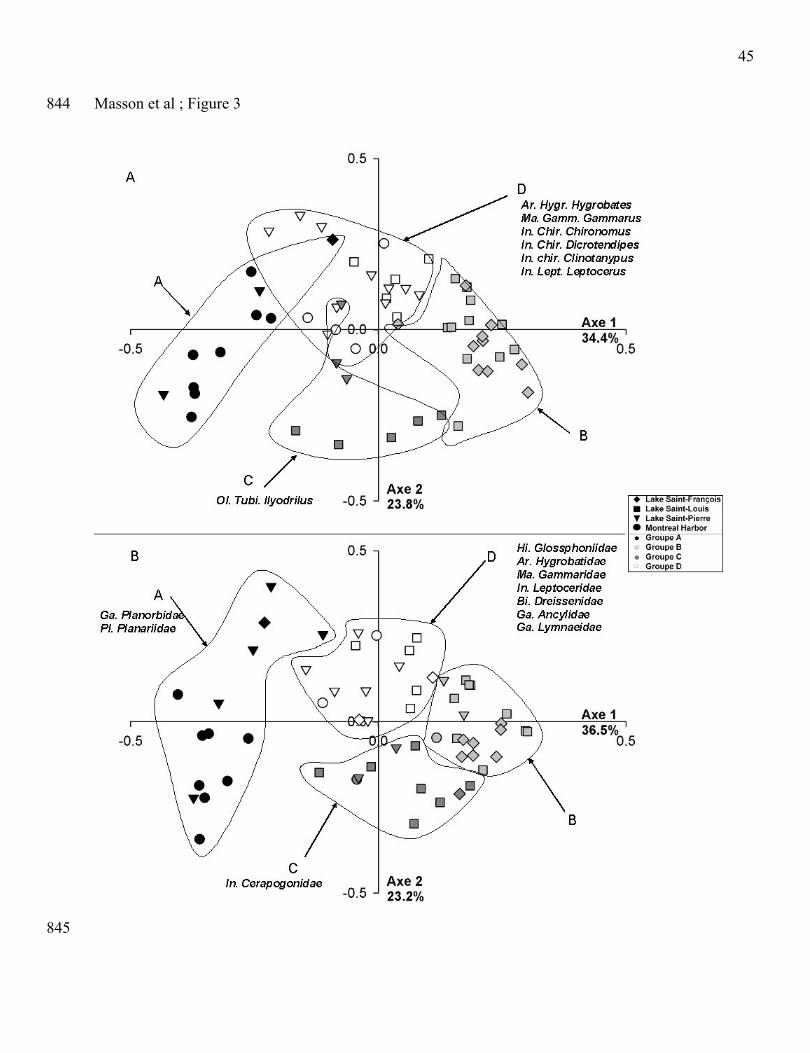
45
Masson et al ; Figure 3844
845
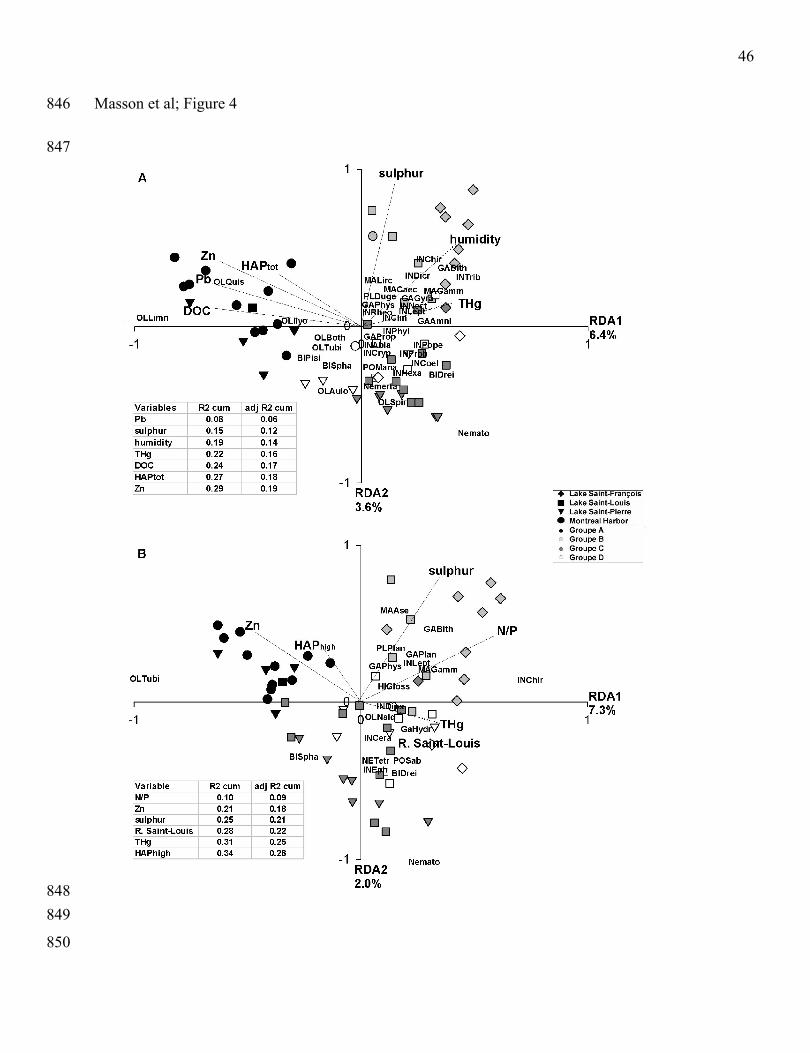
46
Masson et al; Figure 4846
847
848
849
850
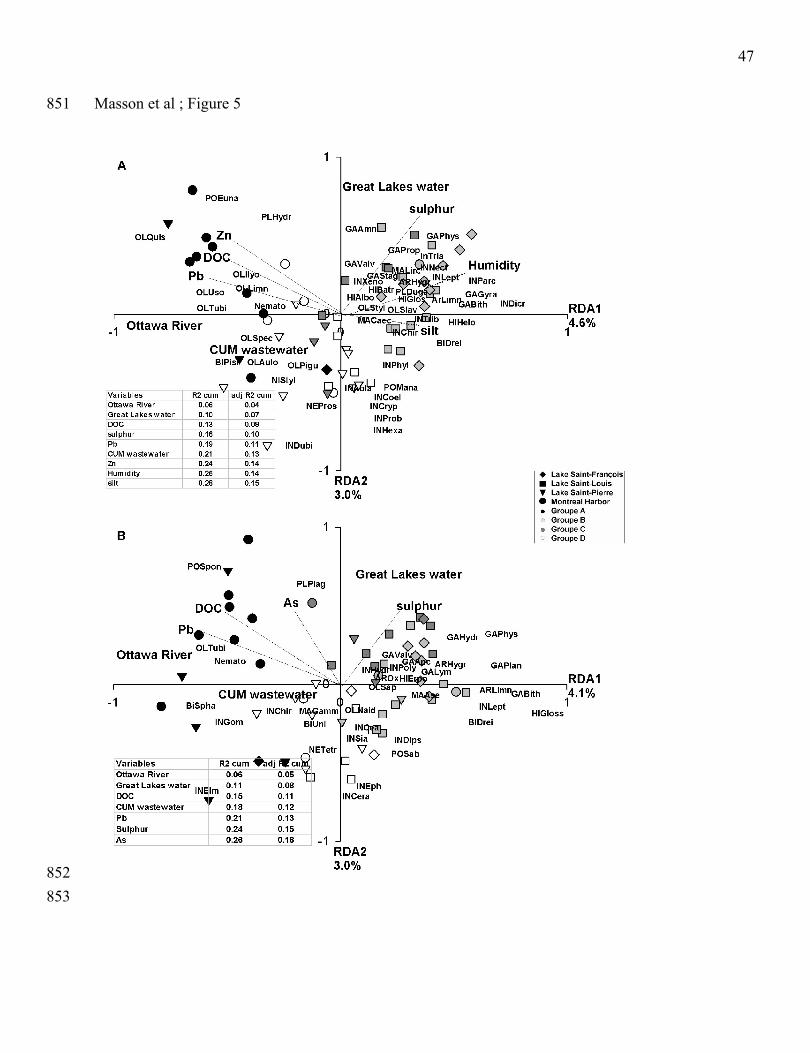
47
Masson et al ; Figure 5851
852
853
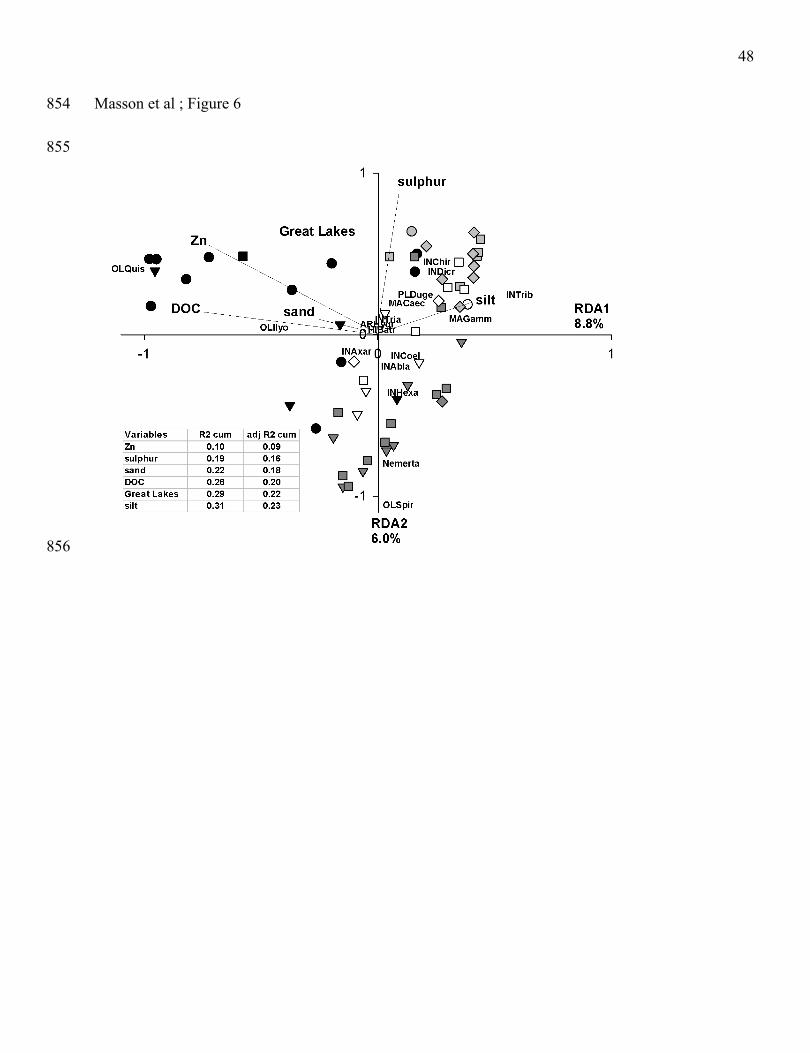
48
Masson et al ; Figure 6854
855
856

49
Masson et al ; Figure 7857
858
859
860
861
Top Related
Copyright © 2022 FDOKUMEN

