


Bahasa
Halaman
Hukum


REINFORCED CONCRETE DEEP BEAMS WITH WEB OPENINGS
I
by
GRAHAMS RICHARD SHARP, B. Sc.
A thesis submitted to the University of Nottingham for the degree of Doctor of Philosophy
Department of Civil Engineering, University of Nottingham
October 1977

BEST COPY
AVAILABLE
Variable print quality

PAGE NUMBERING AS FOUND IN
THE ORIGINAL THESIS

ACKNOWLEDGMENTS
The Author is'most sincerely grateful to Professor
R. C. Coates of Nottingham University and Dr. F. K. Kong of
Cambridge University for their supervision of the research
work and for their much valued encouragement and advice.
The experiments were carried out in the Department
of Civil Engineering, University of Nottingham, and the
Author is grateful to Messrs. J. Barlow, J. Ellis, and
other members of staff in the Structures Laboratory for
their co-operation and assistance.
Sincere thanks are due to Mrs. Ruth Shawcross for the
typing of this thesis; to Mr. I. Conway for his valuable
help with the preparation of the drawings; and to Mr. J. C.
Kaern, a visiting research student to Cambridge from the
Technical University of Denmark, for the numerical check-
ing of some of the calculations.
The final draft of this thesis was prepared in Cambridge
in June and July 1977. Sincere thanks are due to Professor
J. Heyman for extending the facilities of the University
Engineering Department, Cambridge, to the Author during
this period; sincere thanks are also due to Allott and
Lomax, Consulting Engineers, for leave of absence to enable
the Author to complete the thesis in Cambridge.
The, research reported in this thesis was supported by
the Science Research Council.

ii
SYNOPSIS
The design of reinforced concrete deep beams is not
yet covered by the current British Code CP110: 1972. Some
provisions are given in the CEB-FIP Recommendations (1970)
and the AC1318-71 Building Code, and the new (1977) CIRIA
design guide contains more comprehensive guidance including
a number of recommendations for the design of deep beams
with web openings.
This thesis is concerned with the general behaviour
in shear of single-span reinforced concrete deep beams
and in particular the effects of web openings on their
ultimate strength and serviceability.
The test specimens comprised seventy-five lightweight
and sixteen normal weight reinforced concrete deep beams
with span/depth ratios ranging from one to two. The effects
of a varied range of web openings on deflections , crack
widths, cracking loads, failure modes, and ultimate shear
strengths were studied, and the influence of web rein-
forcement was investigated.
The exact analysis of reinforced concrete deep beams
with web openings presents formidable problems. However,
the ultimate shear strengths of such beams can be predicted
with reasonable accuracy using a simple structural ideal-
ization, which was derived from the results of the test
programme. A simple design method is explained and design
hints are given.
The procedures currently used by practising engineers

iii
for the design of deep beams are outlined and discussed,
and a more detailed review of the new CIRIA guide is pre-
sented. Design examples are given to illustrate the use
of the various methods.
In all the current procedures, the design assumptions
regarding the anchorage requirements of the longitudinal
tension reinforcement are necessarily conservative. Appendix
1 describes the details of nine tests carried out to provide
information on the effects of various amounts of end an-
chorage on the strength and crack, control of deep beams.
In Appendix 2 details are given of three tests carried
out to investigate the behaviour of deep beams under re-
peated loading conditions.

iv
TABLE OF CONTENTS
Acknowledgments
Synopsis
List of Tables and Figures
Symbols and Units of Measurement
CHAPTER 1 INTRODUCTION AND BACKGROUND
1.1 Introduction
1.2 Background
1.2.1 Elastic analysis
1.2.2 Deep beam tests
1.2.2.1 de Paiva and Siess's tests
1.2.2.2 Leonhardt and Walther's tests
1.2.2.3 Crist's tests
1.2.2.4 Nottingham-Cambridge tests
CHAPTER 2 THE DESIGN OF R. C. DEEP BEANS IN CURRENT PRACTICE
2.1 Introduction
2.2 Outlines of current design methods
2.2.1 CEB-FIP Recommendations
2.2.2 ACI Building Code
2.2.3 Portland Cement : association
2.3 General comments
CHAPTER 3 THE EXPERIMENTAL PROGRADL'1E
3.1 Introduction
3.2 Materials
3.2.1 Cement
3.2.2 Lightweight aggregates
-1
Page
i
ii
viii
xiii
1
3
3
3
4
7
9
12
17
17
17
21
25
28
31
33
33
33

V
3.2.3 Normal weight aggregates 34
3.2.4 Reinforcement 34
3.3 Concrete mixes 35
3.3.1 Lightweight concrete 35
3.3.2 Normal weight concrete 35
3.4 1
Beam manufacture 36
3.4.1 Formwork 36
3.4.2 Reinforcement fabrication 37
3.4.3 Casting and curing 38
3.5 Control specimens 39
3.6 Testing 40
3.6.1 Test equipment 40
3.6.2 Test preparation 41
3.6.3 Test procedures 42
CHAPTER 4 LIGHTWEIGHT CONCRETE DEEP BEAMS WITH WEB OPENINGS: PILOT STUDY
4.1 Test programme 44
4.2 Test results 45
4.2.1 Crack patterns and modes of failure 45
4.2.2 Crack widths and deflection 48
4.2.3 Ultimate loads 50
4.3 General comments 53
CHAPTER 5 LIGHTWEIGHT CONCRETE DEEP BEVIS WITH WEB OPENINGS: FURTHER TESTS
5.1 Introduction 56
5.2 Test programme 57
5.3 Test results 59
5.3.1 Crack patterns and modes of failure 59

vi
Page
5.3.2 Crack widths and deflection 63
5.3.3 Ultimate loads 66
CHAPTER 6 NORMAL WEIGHT CONCRETE DEEP BEAMS WITH WEB OPENINGS
6.1 Introduction 72
6.2 Test programme 73
6.3 Test results 74
6.3.1 Crack patterns and modes of failure 74
6.3.2 Crack widths and deflection 75
6.3.3 Ultimate loads 77
CHAPTER 7A STRUCTURAL IDEALIZATION FOR DEEP BEANS WITH WEB OPENINGS
7.1 The structural idealization 81
7.2 General discussion 88
CHAPTER 8A PROPOSED METHOD FOR THE DESIGN OF DEEP BEAMS WITH WEB OPENINGS
8.1 " Introduction 91
8.2 Proposed design equations for shear 91
8.3 Design hints 94
8.4 Design example 96
CHAPTER 9A CRITICAL. REVIEW OF THE CIRIA DESIGN GUIDE FOR DEEP BEANS
9.1 Introduction 100
9.2 CIRIA design method: solid top-loaded deep 101 beams
9.3 Comparison of design loads with test results 113
9.4 CIRIt Guide: Provisions for deep beams with 114 holes

vii
Page
CHAPTER 10 CONCLUSIONS AND SUGGESTIONS FOR FURTHER RESEARCH
10.1 Conclusions 119
10.2 Suggestions for further research 120
APPENDIX I ANCHORAGE OF TENSION REINFORCEMENT IN LIGHTWEIGHT CONCRETE DEEP BEANS
A1.1 Introduction and background 122
A1.2 Test programme 123
A1.3 Test results 125
A1.3.1 Deflection control 125
A1.3.2 Crack control 125
A1.3.3 Crack patterns and modes of failure 126
A1.3.4 Ultimate loads 127
A1.4 General comments 127
APPENDIX 2 SHEAR STRENGTH OF LIGHTWEIGHT DEEP BEAMS SUBJECTED TO REPEATED LOADS
A2.1 Introduction and background 130
A2.2 Test programme 131
A2.2.1 Test specimens 131
A2.2.2 Testing 132
A2.3 Test results 132
A2.3.1 Deflections and crack widths 132
A2.3.2 Crack patterns and modes of failure 133
A2.3.3 Ultimate loads 134
A2.4 Summary 135
REFER ENCES 136

viii
LIST OF TABLES AND FIGURES
All full page tables and diagrams appear at the
end of the text, in groups as listed below. Page
CHAPTER 1
Figure 1.1 Effect of inclined cracking on 145 steel and concrete strains
Figure 1.2 Leonhardt and Walther: Reinforcement 146 arrangement
Figure 1.3 Meanings of symbols 147
Figure 1.4 Comparison of computed and measured 148 ultimate loads
Figure 1.5 Nottingham tests: Details of web rein- 149 forcement
CHAPTER 2
Figure 2.1 Reinforcement pattern: CEB-FIP 150 Recommendations
Figure 2.2 Deep beam in design examples 151
Figure 2.3 Beam designed to CEB-FIP Recommendations 152
Figure 2.4 Beam designed to ACI Building Code 152
Figure 2.5 PCA's Design chart 153
Figure 2.6 Beam designed to PCA design guide 153
CHAPTER 3
Table 3.1 Sieve analysis of Lytag aggregates 154
Table 3.2 Sieve analysis of Hoveringham gravel 155 aggregates
Table 3.3 Tensile properties of reinforcements 156
Figure 3.1 Load v. extension diagrams for rein- 157 forcement
Figure 3.2 The loading apparatus: general arrange- 158 ment
Figure 3.3 The loading apparatus: detail at the 159 supports

ix
Page CHAPTER 4
Table 4.1 Properties of test beams 160 (Pilot tests; lightweight concrete)
Table 4.2 Measured ultimate loads 161 (Pilot tests; lightweight concrete)
Figure 4.1 Dimensions and reinforceme nt details 162 (Pilot tests; lightweight concrete)
Figure 4.2 Opening reference numbers: applicable 163 to beams in Table 4.1
Figure 4.3 Typical crack patterns at failure 164
Figure 4.4 Typical sequence in which the cracks 166 appeared
Figure 4.5 Typical failure modes of deep beams 167 with web openings
Figure 4.6 Maximum crack widths 168
Figure 4.7 Development of cracking in Beam M-0.4/4 170
Figure 4.8 Development of cracking in Beam 0-0.4/4 171
Figure 4.9 Average crack widths 172
Figure 4.10 Central deflections 174
Figure 4.11 Load transmission paths 176
Figure 4.12 Explanation of symbols 177
CHAPTER 5
Table 5.1 Properties of test beams 178 (Further tests; lightweight concrete)
Table 5.2 Measured ultimate loads 180 (Further tests; lightweight concrete)
Figure 5.1 Dimensions and reinforcement details 181 (Further tests; lightweight concrete)
Figure 5.2 Opening reference nos: applicable to 182 lightweight beams in Table 5.1 and normal weight beams in Table 6.1
Figure 5.3 Four point loading - for beams W1(A) 183 113(A), w4(A) and W7(A)

x Page
Figure 5.4 Typical crack patterns at failure 184
Figure 5.5 Maximum crack widths 189
Figure 5.6 Central deflections 191
Figure 5.7 Ultimate strengths of deep beams 193 with web openings
Figure 5.8 Beam W6-0.3/4 after failure 194
Figure 5.9 Beam W7-0.3/4 after failure 195
Figure 5.10 Beam W5-0.3/4 after failure 196
CHAPTER 6
Table 6.1 Properties of the normal weight 197 test beams
Table 6.2 Measured ultimate loads of the 198
normal weight beams
Table 6.3 Comparison of the ultimate strength 199 of normal weight and lightweight test specimens
Figure 6.1 Dimensions and reinforcement details 200
of the normal weight concrete beams
Figure 6.2 Crack patterns at failure of the 201 normal weight beams
Figure 6.3 Maximum crack widths 203
Figure 6.4 Central deflections 204
CHAPTER 7
Table 7.1 Measured and computed ultimate loads 205
Figure 7.1 The structural idealization 209
Figure 7.2 Explanation of symbols 210
Figure 7.3 Properties and dimensions of Beam 211 WW3-o. 3/4
Figure 7.4 Comparison of computed and measured 212 ultimate loads
CHAPTER 8
Figure 8.1 Design equations: geometrical notation 213

Xi
Page
Figure 8.2 Design example: geometry and loading 214
Figure 8.3 Design example: main steel and web 215 steel details
CHAPTER 9
Table 9.1 Comparison of computed design loads 216
Figure 9.1 Basic dimensions of deep beams: CIRIA Guide 217
Figure 9.2 Meanings of symbols: CIRIA Guide 217
Figure 9.3 CIRIA design tables 218
Figure 9.4 Beam designed to CIRIA Guide 219
Figure 9.5 Assessment of hole admissibility: 220 CIRIA Guide
Figure 9.6 CIRIA Guide condition of admissibility 221 applied to test specimens
Figure 9.7 System of notional deep beams around an 222 opening: CIRIA Guide
Figure 9.8 Principal stresses: CIRIA Guide 222
Figure 9.9 Reinforcement around openings: 223 CIRIA Guide
APPENDIX 1
Table A1.1 Properties of test beams 224
Table A1.2 Ultimate loads 225
Figure A1.1 Singh's test specimens 226
Figure A1.2 Dimensions and reinforcement details 226 of the present test specimens
Figure A1.3 Central deflection curves 227
Figure A1.4 Maximum crack widths 228
Figure A1.5 Crack patterns at failure 229
APPENDIX 2
Table A2.1 Properties of test specimens 230
Table A2.2 Measured and computed loads 231

xii Page
Figure A2.1 General arrangement and details 232 of web reinforcement
Figure A2.2 Central deflections 233
Figure A2.3 Maximum diagonal crack widths 233
Figure A2.4 Comparison of Singh's and present 234 test results: central deflections
Figure A2.5 Crack patterns at failure 235

xiii
SYMBOLS AND UNITS OF MEASUREMENT
A area of an individual web bar (for the purpose of Eqns. (1.9), (4.1), (4.2), (7.1), (7.2), (7.3), (8.1) and (8.2), the main longitudinal bars are also regarded as web bars)
I
As area of main longitudinal reinforcement
Ah area of horizontal web reinforcement
Av area of vertical web reinforcement
Aw area of web reinforcement
Ar used in Egn. (9.4), see symbol A
a1, a2 coefficients defining the dimensions of an opening (Figures 4.2 and 5.2)
a distance between the line of action of the load and the face of the supporting member
b width (breadth) of beam section
C length of support measured in the direction of the span of the beam
C empirical coefficient in Eqns. (1.9), (4.1), (4.2), (7.1), (7.2)and (7.3) for normal weight concrete, C=1.40; for lightweight concrete, C=1.31 where the cylinder- splitting strength ft is determined in accord- ance with 1STM Standard C330, C1 = 1.0 where ft is determined in accordance with BS 1881)
C2 empirical coefficient in Eqn. (1.9), (4.1), (4.2),., (7.1) and (7.3) (for deformed bars,
2C2 = 300 N/mm ; for plain round bars, C2 = 130 N/mm )

xiv
C1 empirical coefficient in Egn3. (8.1) and (8.2) (for normal weight concrete c; = 0.44; for lightweight concrete C1= 0.36)
" C2 empirical coefficient in Eqns. (8.1) ang (8.2) (for deformed bars C2 = 195 N/j2m ; for plain round bars C2 = 97.5 N/mm )
D over-all depth of beam (Figs. 4.1,5.1,6.1)
d effective depth of beam, measured to centroid
of A s
fI characteristic (or specified) cylinder compressive strength of concrete
fcu characteristic cube strength of concrete
ft characteristic cylinder splitting strength of concrete
fy characteristic (or specified) yield strength of reinforcement
f allowable tensile stress in reinforcement s
ha effective height of beam (Fig. 9.1)
ks shear stress modifying factor
k1k2 coefficients defining the position of an kl, k' opening (Figs. 4.2,5.2,7.1)
12
L simple span of beam (Figs. 4.1,5.1,6.1)
1 effective span (Fig. 9.1); in Chapter 2.2.2,1 = clear distance between faces of supports

xv
10 clear distance between faces of supports (Fig. 9.1)
M design bending moment
Diu design bending moment at critical section (Egn. 2.4)
Ps modified Psý according to de Paiva and Siess
Pý =2v bD SS
Pt steel ratio used in Laupa, Siess and Newmark's formula (page 6)
P main steel ratio A /bd s
Pweb web steel ratio = ratio of volume of web steel to that of the concrete in the beam
PmsPwh'Pwv modified percentage of main steel; horizontal web steel; vertical web steel (Fig. 9.3)
Qult ultimate shear strength (Ault s W2/2)
s spacing of web reinforcement, measured in a vertical direction for horizontal
reinforcement and in a horizontal direction for vertical and inclined reinforcement
9h spacing of horizontal web reinforcement
sv spacing of vertical web reinforcement
T total tensile force resisted by A s
V design shear force
Vc shear capacity of a beam (Eqn. 9.6)

XV1
u V design shear force at critical
section (Eqn. 2.4)
v allowable shear stress (Eqn. 2.9)
vc ultimate concrete shear stress; in Eqn. (2.4) v= nominal shear stress
1 carried by thecconcrete
vu limiting concrete shear stress; in Eqn. (2.2), v= nominal shear stress at critical section.
vs nominal shear stress in Laupa, Siess and Newrnark's formula
Vmax9 vx'vms concrete shear stress parameters and
Vwh' Fwv steel shear stress parameters (Fig. 9.3
and Eqn. 9.6)
W total load on beam
W measured ultimate load of solid beam (Table 4.2)
W1 measured ultimate load
W2 ultimate load computed from Eqn. (7.2) (Table 7.1 and Fig-7-4); in Fig. (1.4) W2 = ultimate load computed from Eqn. (1.9)
W4 through W? computed design loads (Chapter 9.3, Table 9.1)
w uniformly distributed load, axial load per unit length
x clear-shear-span distance (Figs. 4.1, 5.1,6.1)
xe effective clear-shear-span (Eqn. 9.2)

xvii
y depth at which a typical bar intersects the potential critical diagonal crack in a solid deep beam, which is approximately the line joining the loading and reaction points
yi depth at which a typical bar inter-
sects a potential critical diagonal
crack in a deep beam with openings, idealized as the line EA or CB in Fig. (7.2)
yr used in Egn. (9.4), see symbol y
z lever arm
a angle of intersection between a typical bar and the potential critical diagonal crack described in the defin- ition of y above 0
a angle of inclination of reinforcement ° to horizontal (Eqn. 1.2)
al angle of intersection between a typical bar and a potential critical diagonal
crack in a deep beam with openings, idealized as the line EA or CB in Fig. (7.2)
0a characteristic ratio (Eqns. 2.6 and 2.7)
ß1, ß2, ß3 constants (Eqn. 9.6)
Yf partial safety factor for loading
Ym partial safety factor for materials
Fa characteristic ratio (Eqns. 2.6 and 2.7)
Ar angle between reinforcement and diagonal crack (Egn. 9.4)
empirical coefficient, equal to 1.5 for web bars and 1.0 for main bars

Xvlll
x1, A2 constants '(Egn. 9.4)
angles defining the directions of the potential critical diagonal cracks (lines EA and CB in Fig-7.2); in Chapter 2.2.2 0= capacity reduction factor (Eqn. 2.2)
7
UNITS OF MEASUREMENT
The SI system of measurement is used throughout this thesis, unless otherwise stated.

CHAPTERONE
INTRODUCTION AND BACKGROUND -1
1.1 INTRODUCTION
1.2 BACKGROUND
1.2.1 ELASTIC ANALYSIS
1.2.2 DEEP BEAM TESTS
1.2.2.1 de Paiva and Siess's tests.
1.2.2.2 Leonhardt and Walther's tests.
1.2.2.3 Crist's tests.
1.2.2.4 Nottingham - Cambridge tests.

1.
CHAPTERONE
INTRODUCTION AND BACKGROUND
1.1 INTRODUCTION
At a Mechanics Colloquium 1 given at the University of
Cambridge, it became clear that the strength and behaviour
of reinforced concrete deep beams, and, in particular, the
strength and behaviour of deep beams with web openings, were
topics that recurred in design 2. Often, it may be found
necessary to provide openings for services or for access
but the practical design of deep beams with web openings is
not yet covered by any of the major codes of practice: such
as CP11O3 in the U. K.; the ACI Building Code 4
in the U. S. A.;
and the CEB-FIP Recommendations 5 in Europe. Indeed, the
British code CP110: 1972, as yet, provides little guidance
on the design of deep beams.
It is only during the last decade or so that research
in reinforced concrete deep beams has been carried out on a
practical scale , 7. In 1970, the Comite Europeen du Beton 6
(CEB) and Federation Internationale de la Precontrainte (PIP)
first included provisions for solid deep beams in their
International Recommendations . In 1971, the ACI Building 5
Code for the first time included recommendations for solid
deep beams. These two documents, together with the Portland
Cement Association's widely known Concrete Information ST668
and the Construction Industry Research and Information
Association's recently published CIRIA design guide 9 (1977),
form the major design guides currently available in the U. K.

v
Deep beams are becoming increasingly employed in
modern construction and have useful applications in a variety
of structures. In modern building construction for example,
in department stores, hotels, buildings housing a theatre,
municipal buildings and so on, it is often desired to have I
the lower floors entirely free of columns. Here, instead of
heavy frame construction, the use-of Vierendeel trusses in
concrete or even structural steel trusses, it may be simpler
to utilise the external and partition walls as deep beams to
span across the column free space and carry the building above
them. Other uses of deep beams may be found in cooling-water
pumphouses for power stations; in foundation engineering, where
a deep beam may be provided to distribute column loads into the
foundation; and in bunkers and silos, where the walls may act
as deep beams spanning between column supports.
At the University of Nottingham several research pro-
jects 10-12 on reinforced concrete deep beams have been reported.
These projects, which were carried out on deep beams without
web openings, have shown that their post-cracking behaviour is
so complex that, at least for some time yet, design procedures
must be based on tests. Since recent surveys 9-12
of the lit-
erature have shown that little information and experimental data
are available on reinforced concrete deep beams with web opening g a
an experimental study, which concentrated on the effects of web
openings, was carried out.
In this chapter, as a background to the present in-
vestigation, a review of selected previous investigations on
reinforced concrete deep beams is presented.

3.
1.2 BACKGROUND
1.2.1 ELASTIC ANALYSIS
A substantial library of work is available, covering
the behaviour of deep beams in terms of elastic linear an-
alysis 13-21.
The pioneering work in this field was done by
Dischinger 13, who used trigonometric series to determine the
stresses in continuous deep beams. The Portland Cement Assoc-
iation 8
have produced an expanded version of Dischinger's
paper and added solutions for simply supported spans to give
guidance for the design of deep beams. Photoelastic methods
have also been used to investigate deep beam behaviour. It
is pertinent to note that Saad and Hendry 22 have pointed out
that, where there were holes in a deep beam, any theoretical
elastic solution became very difficult or even impracticable.
The PCA $
and other design methods i8,21
which were
based on the prediction of interal forces in deep beams from
elastic theory were, in the past, consistent with the then
accepted design criteria of service load requirements; but,
because the elastic assumptions become increasingly invalid
in reinforced concrete after the onset of cracking, these
methods are no longer compatible with the current design
criteria of ultimate limit states. For this reason, further
review of research which related primarily to elastic analysis
would not be appropriate.
1.2.2 DEEP BEAM TESTS
In 1964, in the Introduction to the'Recommendations for

4.
an International Code of Practice for Reinforced Concrete 23,
it was stated, "the Comite Europeen du Beton considered that
the Principles and Recommendations should be fundamentally and
solely based on experimental knowledge of the actual behaviour
of the combination of steel and concrete conceived as forming
a single whole....... subjected to the action of external or
internal forces and tested to failure".
In 1965 and 1966 respectively, the results of the
practical deep beam tests conducted by de Paiva and Siess 24
in Illinois, and Leonhardt and Walther 25 at Stuttgart, were
reported. These two test centres, together with the more re-
cent work of Crist 26 at New Mexico, have expanded the knowledge
of actual deep beam behaviour and have significantly influenced
design practice. Over the last seven years, a comparatively
large volume of research has been carried out on deep beams
by the Nottingham - Cambridge team under the direction of
Kong 1,27-38.
In what follows, a brief description of details of
the test studies carried out by de Pa-va and Siess, Leonhardt
and Walther, and Crist is presented, together with an outline
of previous work by the Nottingham - Cambridge team.
1.2.2.1 de Paiva and Siess's tests 24,
Possibly the earliest comprehensive study of deep
beam behaviour based on practical tests on reinforced concrete
specimens was made by de Paiva 24' 39 and colleagues
40,41
working at the University of Illinois. This work, a digest
of which was reported in a paper by de Paiva and Siess 24 in

J0
1965, has since been a guiding influence on the projects of
other deep beam research workers 11,12,26
The tests, that were reported in 1965, consisted of
19 simply supported reinforced concrete beams subjected to thitd
point top loading (Fig. 1.1). The object of the test programme
was to investigate the behaviour of moderately deep beams; that
is beams with span/depth ratios(L/D) of between 2 and 6. The
major variables studied were the quantity of main tensile steel,
the quantity of web (shear) reinforcement, and the span/depth
ratio. The beams were tested over a constant span of 610 mm
and their depths varied from 178 mm to 330 mm, to give L/D
ratios of 1.8 to 3.4. The main longitudinal reinforcement
consisted of one or two intermediate grade deformed bars in a
single layer, anchored at the ends by welded steel plates.
Web reinforcement, where provided, consisted of vertical or
inclined stirrups of No-7 black annealed wire.
From the results of the tests, it was deduced that
the inclined cracks, that originate in deep beams near the
support and propagate upward and inward toward the midspan,
had a greater influence on behaviour than the flexural type
cracks at sections of maximum moment. Evidence from concrete
and steel strain measurement showed that the propagation of
the inclined cracks led to a redistribution of internal forces
resulting in the formation of a 'tied arch'. (Fig. 1.1). This
arch behaviour causes high stresses in the tension reinforce-
ment at the supports and hence provision must be made for
positive end anchorage of the reinforcement.

b.
Three failure modes were defined to describe the
collapse of the beams: 'flexure' failure which occurred
through rupture of the steel tie; 'shear proper' failure
which resulted from crushing of the inclined 'strut' that
formed between two inclined cracks; and 'flexure-shear'
where the failure was not clearly either of the former modes.
The effect of the type and amount of web reinforce-
ment provided was found to be not significant in changing the
failure modes, but it was observed that increasing the quantity
of main steel changed the failure mode from flexure to shear.
From an analysis of the test results, de Paiva and
Siess 24 derived the following equation to compute the ultimate
shear strength, Ps:
Ps = 0.8 (1- o. 6D ) Ps
(1.1)
where P' was determined using Laupa's 41
formula for shear s
stress (vs), as derived from the results of tests on ordinary
shallow beams (large L/D) with small shear span/depth ratios.
P=2v bD ss (1.2)
where vs = 200 + 0.188 f' + 21,300 Pt
in which Pt =A (1 + sina0)
bD
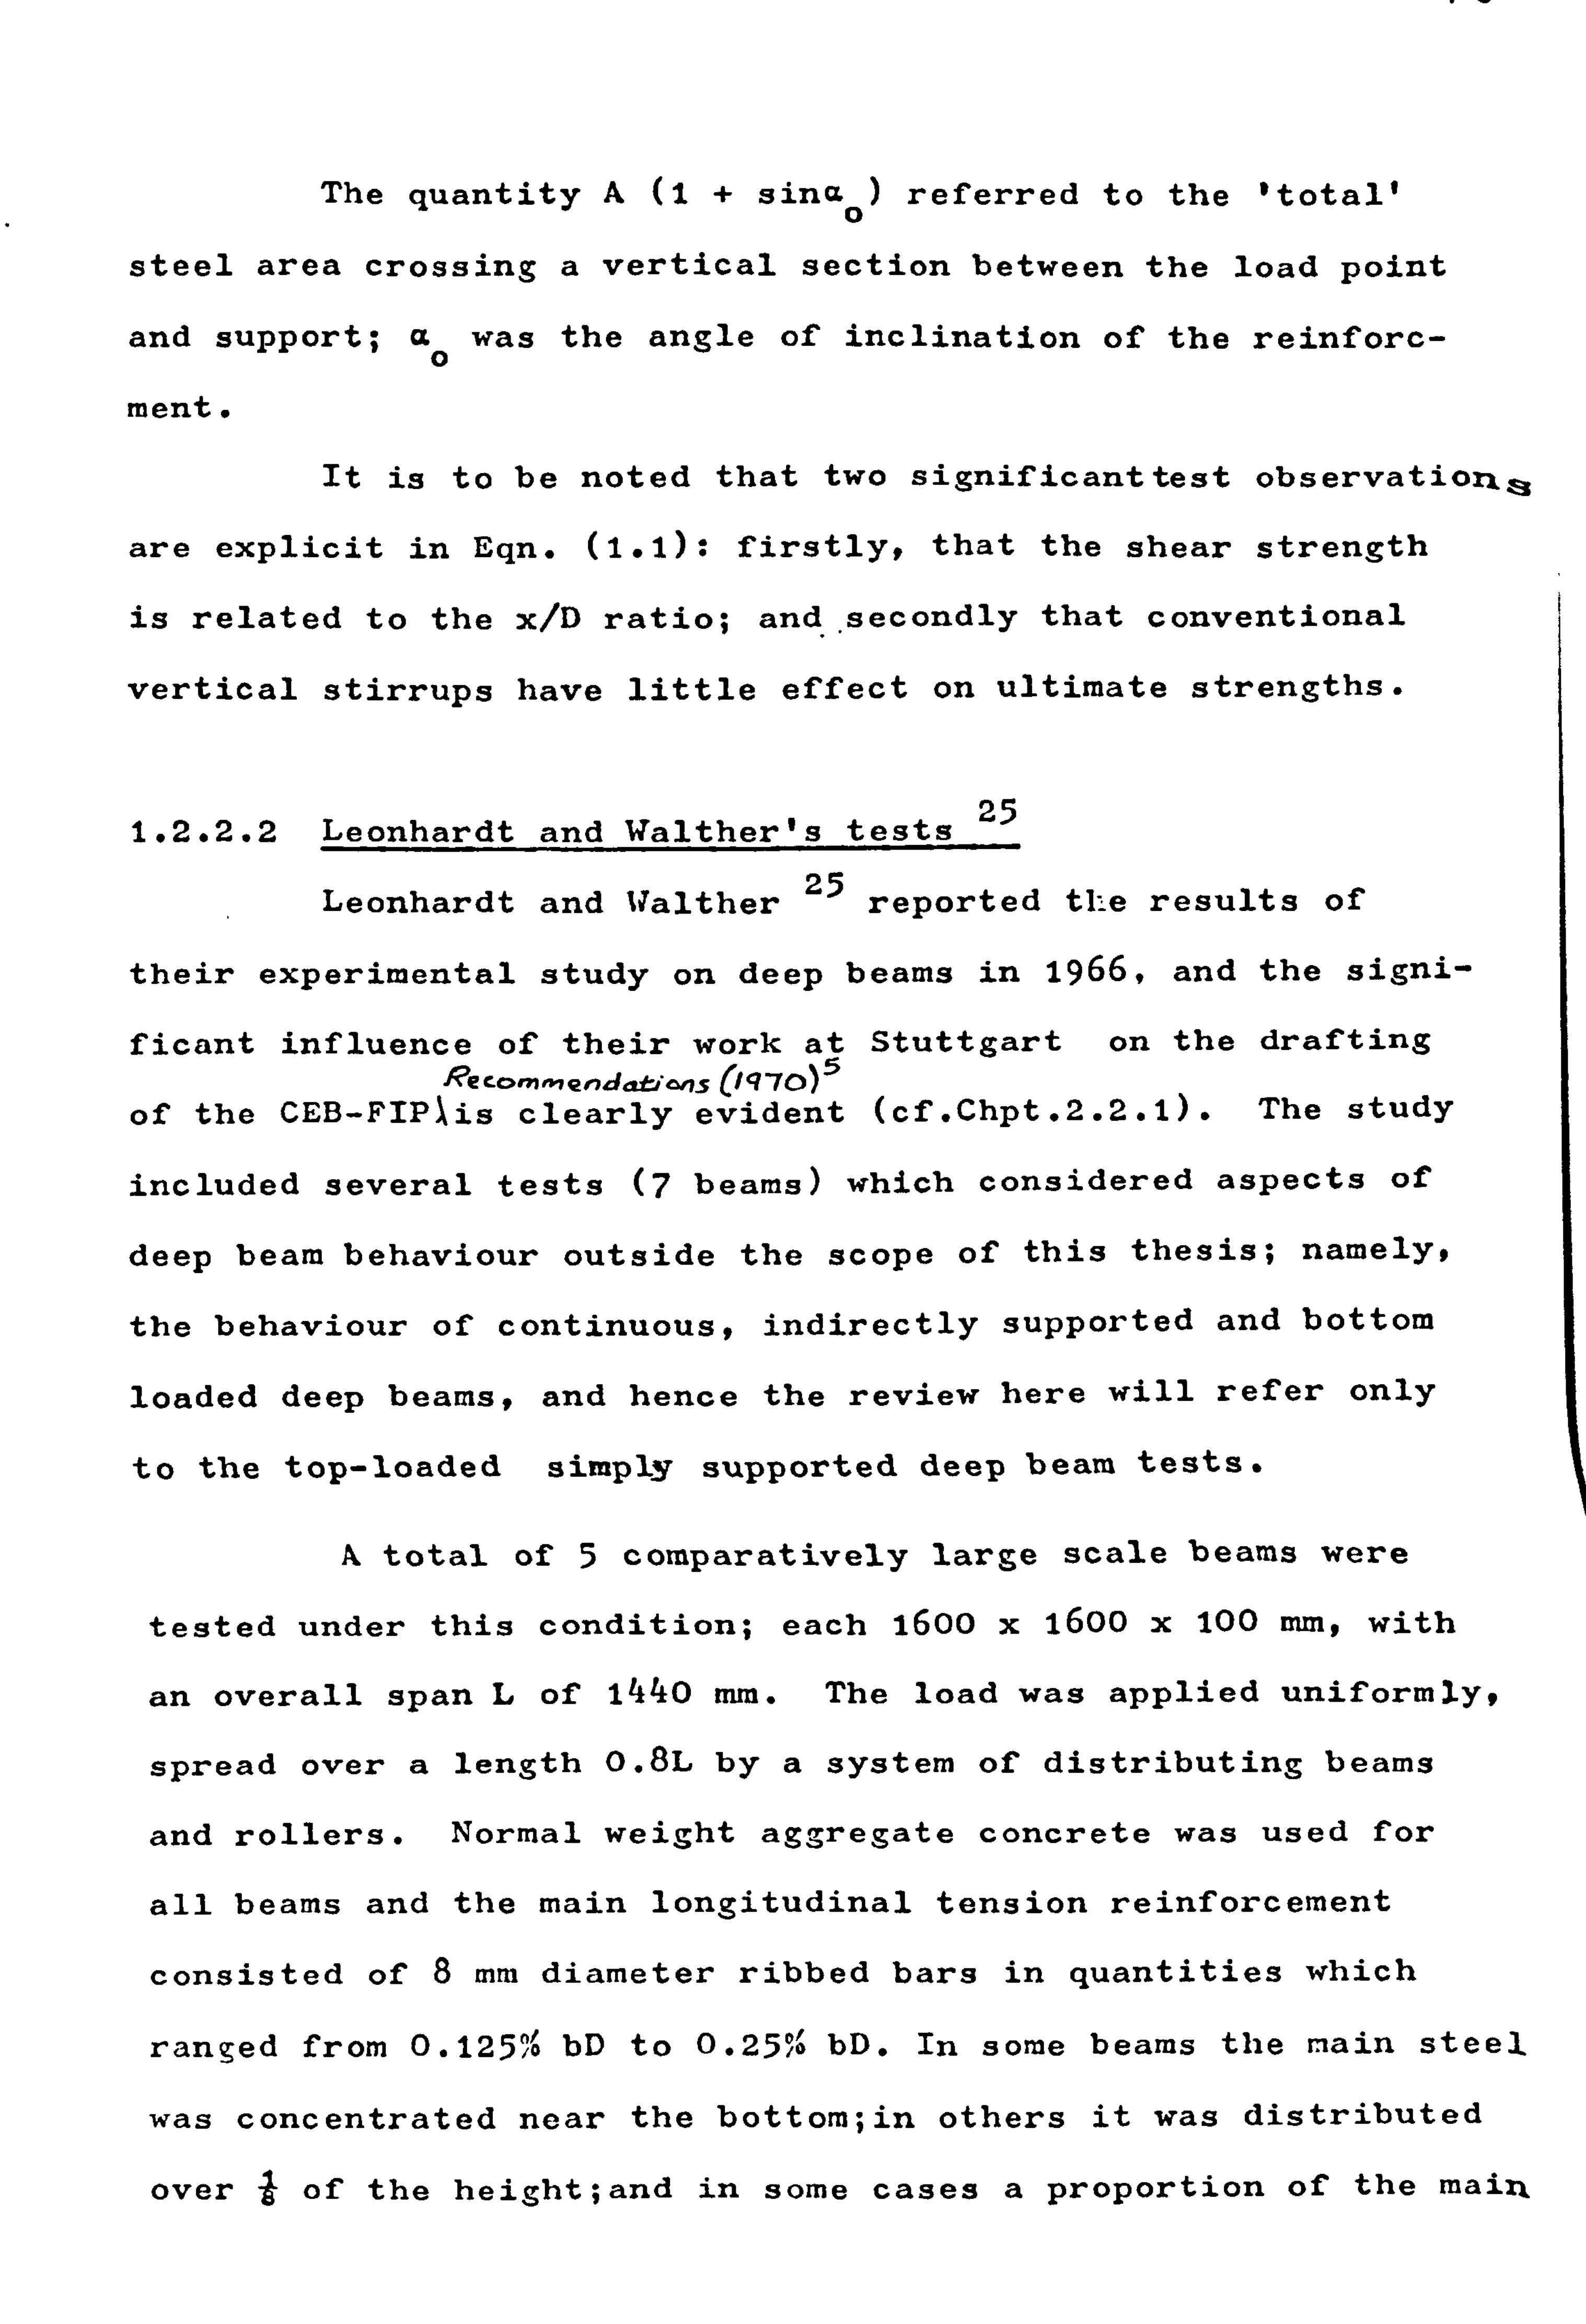
The quantity A (1 + sinao) referred to the 'total'
steel area crossing a vertical section between the load point
and support; a0 was the angle of inclination of the reinforc-
ment.
It is to be noted that two significant test observatiozis
are explicit in Eqn. (1.1): firstly, that the shear strength
is related to the x/D ratio; and secondly that conventional
vertical stirrups have little effect on ultimate strengths.
1.2.2.2 Leonhardt and Walther's tests 25
Leonhardt and Walther 25 reported the results of
their experimental study on deep beams in 1966, and the signi-
ficant influence of their work at Stuttgart on the drafting Rec(>m^nenda
, c,, s C1g70)5
of the CEB-FIPlis clearly evident (cf. Chpt. 2.2.1). The study
included several tests (7 beams) which considered aspects of
deep beam behaviour outside the scope of this thesis; namely,
the behaviour of continuous, indirectly supported and bottom
loaded deep beams, and hence the review here will refer only
to the top-loaded simply supported deep beam tests.
A total of 5 comparatively large scale beams were
tested under this condition; each 1600 x 1600 x 100 mm, with
an overall span L of 1440 mm. The load was applied uniformly,
spread over a length 0.8L by a system of distributing beams
and rollers. Normal weight aggregate concrete was used for
all beams and the main longitudinal tension reinforcement
consisted of 8 mm diameter ribbed bars in quantities which
ranged from 0.125% bD to 0.25% bD. In some beams the main steel
was concentrated near the bottom; in others it was distributed
over j of the height; and in some cases a proportion of the main

steel was bent up over the supports. Anchorage of the rein-
forcement was achieved by the use of either vertical or hori-
zontal hooks, and in all of the beams a nominal amount of web
reinforcement was provided, consisting of an orthogonal mesh
of 5 mm diameter bars. A
Analysis of concrete and steel strain measurements
confirmed that considerable redistribution of internal forces
takes place in reinforced concrete deep beams compared with
the elastic theory of vertical plates, and arch action behaviour
of deep beams was apparent. The more common mode of failure
was found to be flexural, caused by the collapse of the tension
chord. Failure also occurred as a result of destruction of the
concrete at the supports: it was thought that the failure there
might have been caused by the unfavourable action of the vertical-
anchorage hooks.
In summary, from the basis of the test experience
Leonardt and Walther 25 recommended the following design rules:
1. The quantity of main longitudinal steel should be determined
from Egns. (1.3), which follow
for L/D >1T= M/O. 6D
for L/D <1T= M/O. 6L (1.3)
where 11 is the maximum applied bending moment, and T is the
resulting tension chord force.
2. The reinforcement determined from the above should extend
from support to support and be positively anchored using

9. 4
horizontal hooks or anchor plates.
3. To limit crack widths, the main reinforcement should be
uniformly distributed over the bottom 0.15 to 0.2 times the
beam depth. (Fig. 1.2).
4. A light orthogonal mesh of vertical stirrups and horizgntal
bars, arranged more closely at the supports, should be provided
for web reinforcement. (Fig. 1.2).
Rule No. 4 above, reflected the view that shear failure
was not a problem in deep beams. It was contended that shear
cracks would not occur if the main reinforcement was well
anchored and extended from support to support without cut-offs. wiý1
(In retrospect, it might be mentioned here that, the benefit of
later deep beam tests, it seems likely that shear failure was
not observed in Leonhardt's tests because early collapse
occurred as a result of either premature flexural failure -
it is to be noted that +hempi_T_+r? +y ^f reinfnrcam6rit
r' l a+i v°1 y smal - or premature bearing failure at the supports. )
1.2.2.3 Crist's tests 26
Together with the work of de Paiva and colleagues24,39-41 26
at Illinois, Crist's experimental work at the University of
New Mexico formed the main basis of the deep beam design guidance s
which is given in the current issue of the ACI Building Code 4
.
Crist's experimental programme consisted of 9 static
tests and 3 dynamic tests on uniformly top-loaded reinforced
concrete beams. The object of the research was to develop
behavioural equations for reinforced concrete deep beams;

10.
especially as regards shear capacity.
All the test specimens were 203 mm thick and were
simply supported over a span of 2438 mm. The depths of the
beams were varied to give a range of L/D ratios of 1.6 to 3.8.
Normal weight concrete with a nominal compressive strength
of 25.9 N/mm 2 and intermediate grade ASTM A15 steel reinforce-
ment were used. All of the beams contained longitudinal
tensile reinforcing, and in five of the statically tested
beams, an orthogonal array of web reinforcement coincident
with the longitudinal axis of the beam was provided.
The statically loaded beams were all tested to collapse.
There were no beams that failed prior to beam yield, and the
failure modes were predominantly flexure in those beams with
web reinforcement and shear in those without. None of the
dynamically loaded beams was taken to complete failure, but
each was found to behave similarly, as regards crack form-
ation and development, to the companion statically tested
beams.
Static behavioural equations for deep beams were
derived on the lower boundary of data represented by nine
tests mentioned above and seventy-three tests from other
research. The total static shear capacity, it was argued,
can be given conservatively at a critical section, xc= O. 2L
or xc : d), by
V=V+V u uc us (1.4)
. gin which the concrete capacity is
vuc =[3-5 -3vd1.9 fý + 2500 (i)i pa (1.5) cc

11.
and the web reinforcement capacity is
Vus = 1.5 fyd Av 1+L+ Ah 1 /11
-L svv 12 d sh 12 ld
where M= Ratio of applied moment to applied shear force v
c at the critical section.
Av, Ah- the area of vertical and horizontal web steel
in spacing sv and sh respectively.
d= the effective depth measured to the centroid
of the main longitudinal steel.
p= the ratio of main steel area to the area bxd
of the concrete section.
Upper limits on nominal shear stress were established
in the capacity calculations and these were found to control
in a minor number of cases. The limits were as follows:
X1.7) Vuc/bd <6 fco
Vu/bd <8 f' (1.8)
Crist concluded that reinforced concrete deep beam
inclined-cracking-load behaviour is little different from that
observed in normal beams with large L/d ratios, but that in
deep beams there is a reserve of strength beyond diagonal crack-
ing, which is not usually available in normal beams. Hence, in
Eqn. (1.5), the second bracketed term is conveniently the same
term as that used in the ACI Building-Code 4
for the inclined
cracking load of normal beams: in such beams the diagonal
cracking load is taken as a measure of the useful capacity of

12.
the beam without shear reinforcement. The first bracketed
term gives a measure of the reserve of strength of deep beams
beyond diagonal cracking and was derived empirically from the
test data.
The web reinforcement capacity, given by Eqn. (1.6), A
represents the capacity of an orthogonal array of reinforce-
ment coincident with the longitudinal axis of a beam. The
equation was based on a shear friction analogy originally
developed by blast 42.
The analogy assumes that normal forces,
developed on an inclined crack plane by web bars crossing the
plane, give rise to frictional forces which resist the applied
shear force.
1.2.2.4 NOTTINGH01 - CAMBRIDGE tests
Research by the Nottingham-Cambridge team on the behav-
four of reinforced concrete beams has been ongoing under the
general guidance of Dr. F. K. Kong for the past nine years. At
the beginning of the research programme, computer solutions
based on the assumption of an uncracked section were sought10+43
but as the research progressed, there was mounting experimental
evidence that practical tests on concrete specimens would provide
the most fruitful approach. Many of the details and results
of the tests have been published in technical journals 27-32,
and the new CIRIA design guide contains some design guidance
which is based on the design proposals of the Nottingham -
Cambridge team 33.
The culmination of the research up to 1972 on deep beams
without openings was the publication of a proposed formula 33

13.
for the design of solid reinforced concrete deep beams, which
it was argued, embodied many of the recorded test observations.
The proposed method was based on a further evaluation of the
research experiments previously carried out at Nottingham 30
and the proposed formula took the following form: - -1
Qult - C1 (1 - 0.35X D' ftbD +Cn 2AY sin a_ i1. D 9ý
2 for two-point top loading -w
where, with reference to Fig. (1.3):
-ult is the ultimate shear strength of the beam, in Newtons.
L4 is the ultimate shear load, in Newtons, computed from
the above formula; in the case of two-point top loading,
W2 Qult
C1 is an empirical coefficient equal to 1.4 for normal weight
concrete and 1.0 for lightweight concrete.
C2 is an empirical coefficient equal to 130 N/mm2 for plain
round bars and 300 N/mm2 for deformed bars.
ft is the cylinder splitting tensile strength, in N/mm2, or
0.1 times the cube strength if ft is not available.
b is the breadth or thickness of the beam, in mm.
D is the overall depth of the beam, in mm.
A is the area of the individual web bar, in mm 2,
and for
the purpose of this equation the main longitudinal bars
are also considered as web bars.
y is the depth, in rim, measured from the top of the beam,
at which an individual bar intersects the line joining
the inside edge of the bearing block at the support to
14.
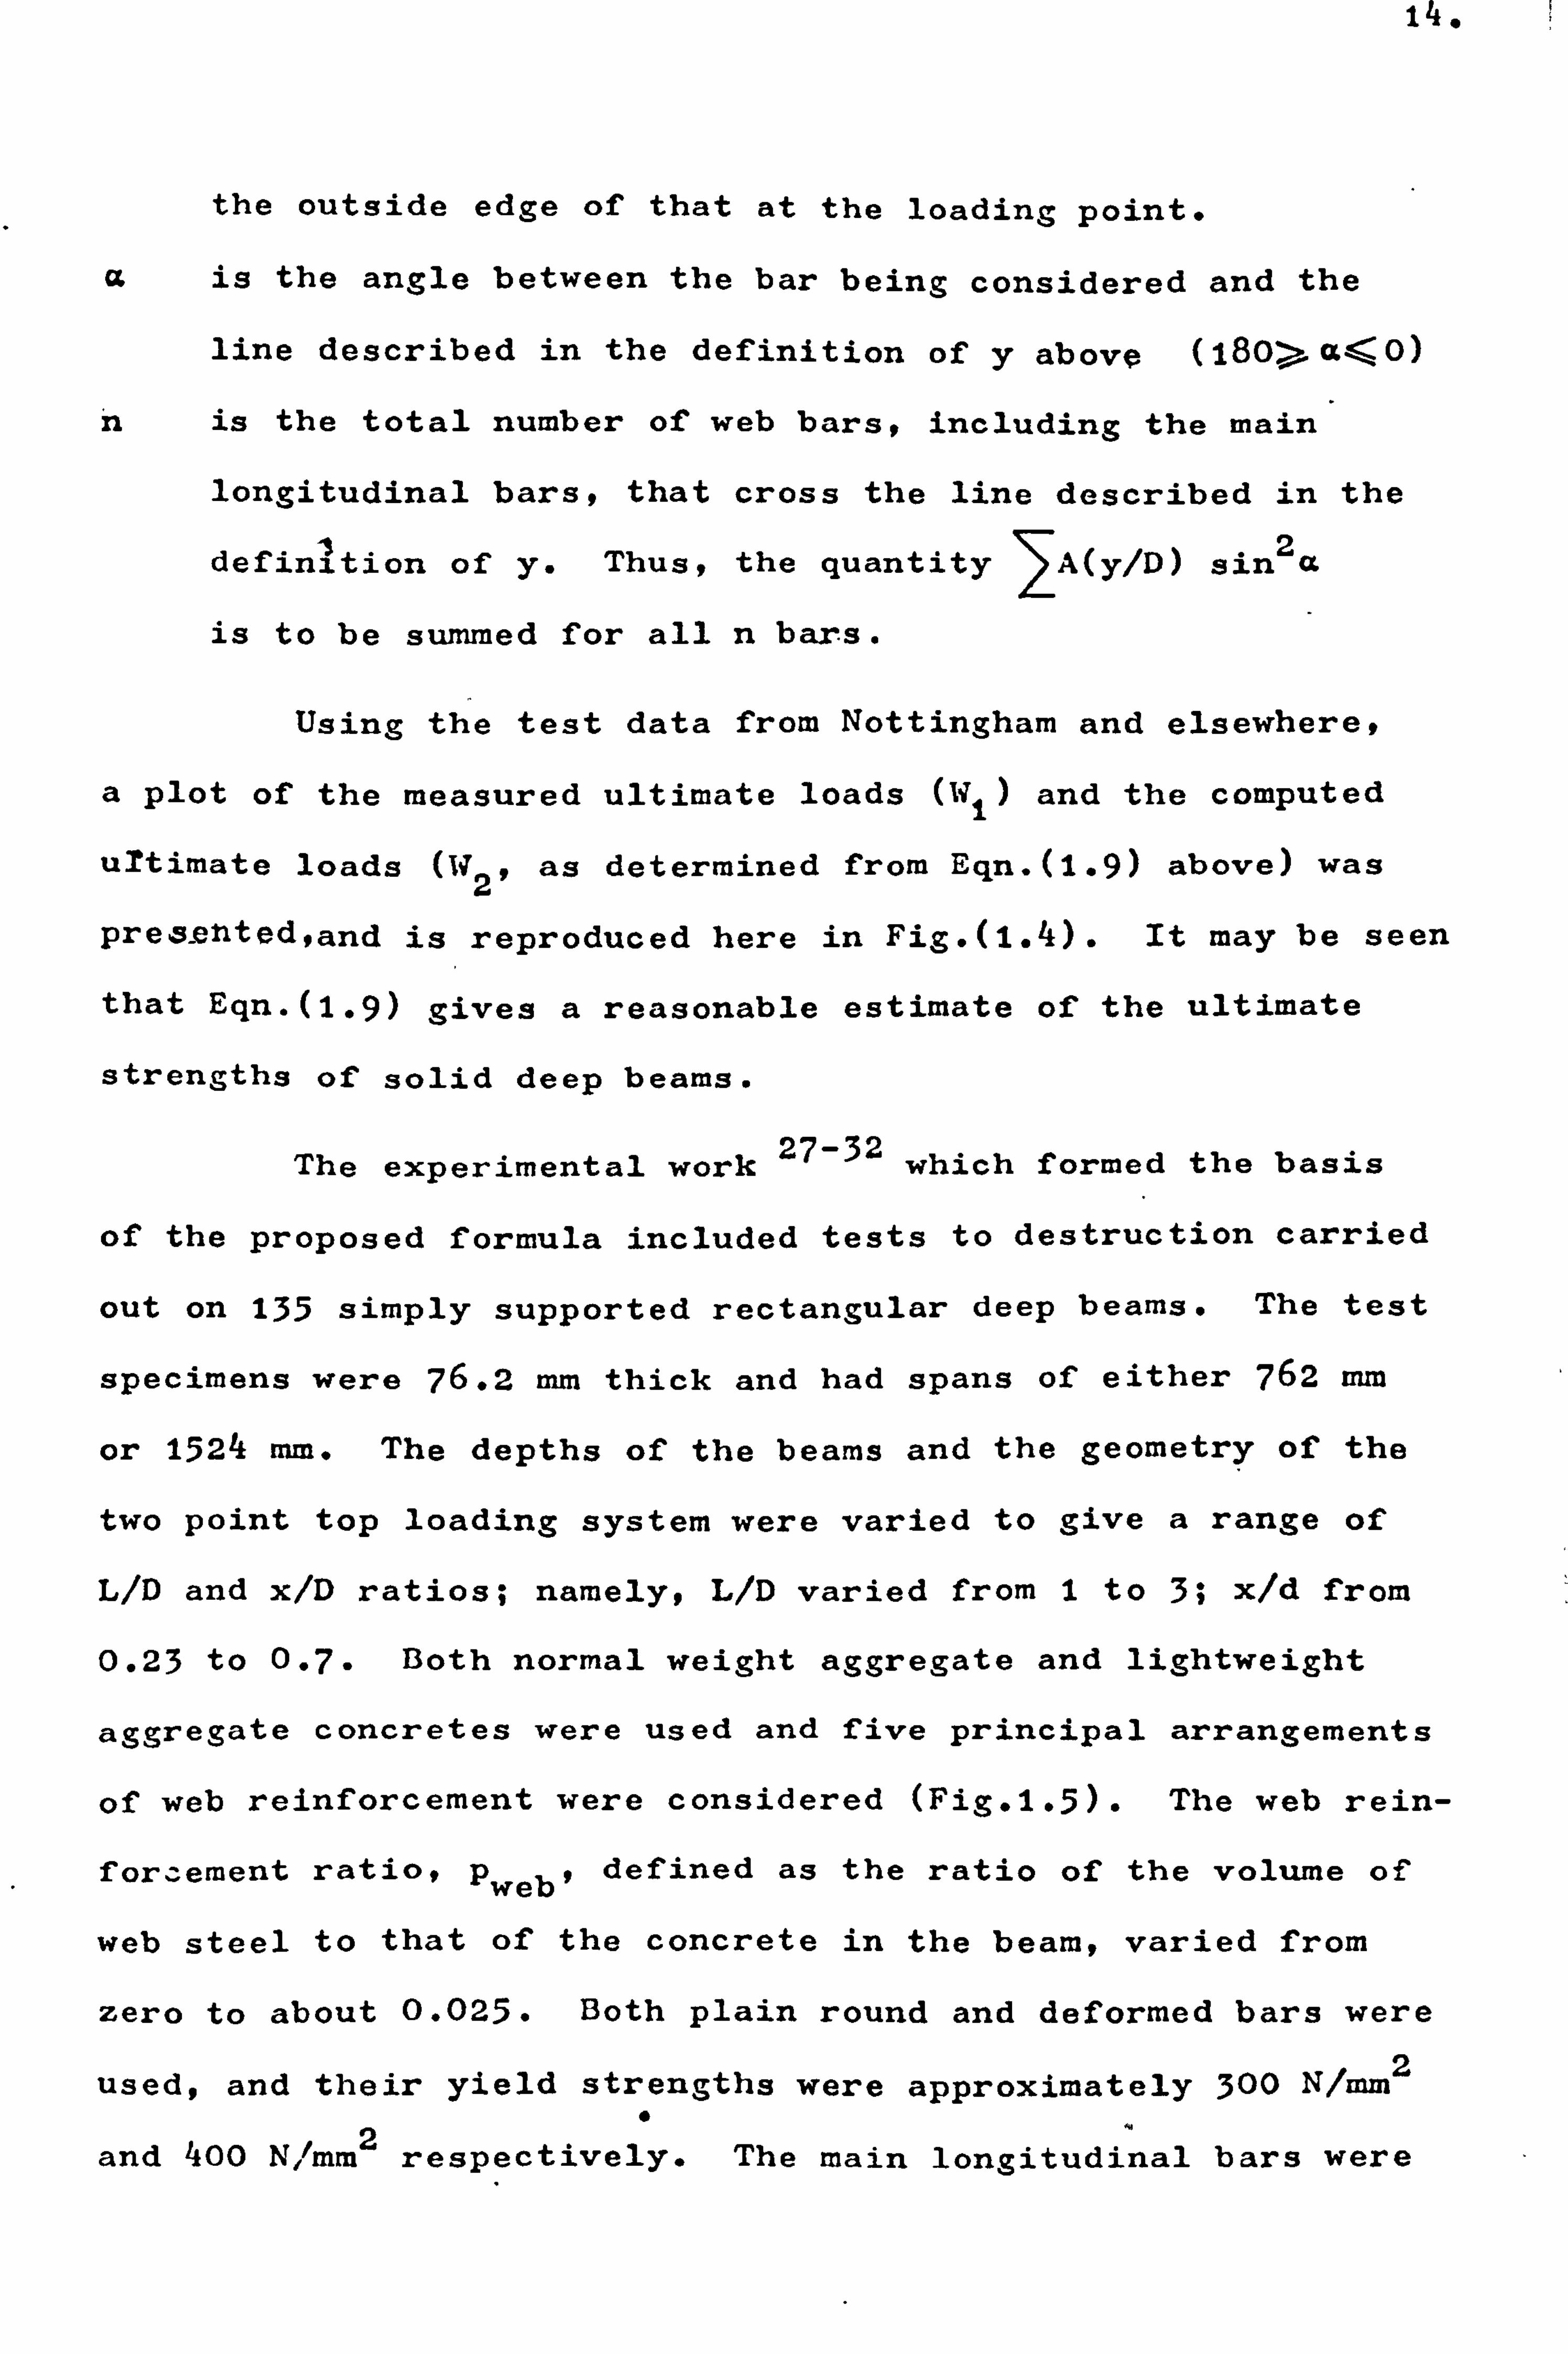
the outside edge of that at the loading point.
a is the angle between the bar being considered and the
line described in the definition of y above (180> a< 0)
n is the total number of web bars, including the main
longitudinal bars, that cross the line described in the
definition of y. Thus, the quantity JA(y/D)
sin2a
is to be summed for all n bars.
Using the test data from Nottingham and elsewhere,
a plot of the measured ultimate loads («1) and the computed
urtimate loads («2, as determined from Eqn. (1.9) above) was
presehted, and is reproduced here in Fig. (1.4). It may be seen
that Egn. (1.9) gives a reasonable estimate of the ultimate
strengths of solid deep beams.
The experimental work 27-32
which formed the basis
of the proposed formula included tests to destruction carried
out on 135 simply supported rectangular deep beams. The test
specimens were 76.2 mm thick and had spans of either 762 mm
or 1524 mm. The depths of the beams and the geometry of the
two point top loading system were varied to give a range of
L/D and x/D ratios; namely, L/D varied from 1 to 3; x/d from
0.23 to 0.7. Both normal weight aggregate and lightweight
aggregate concretes were used and five principal arrangements
of web reinforcement were considered (Fig. 1.5). The web rein-
foraement ratio, pweb' defined as the ratio of the volume of
web steel to that of the concrete in the beam, varied from
zero to about 0.025. Both plain round and deformed bars were
used, and their yield strengths were approximately 300 N/mm2
and 400 N/mm respectively. The main longitudinal bars were 2

15.
anchored at their ends to steel blocks to prevent possible
anchorage failure.
The more important test observations reported 27-32,
itemised here for brevity, are as follows: -
1. The ultimate shear strength of a deep beam is composed of
two parts, the contribution of the concrete and that of
the web reinforcement.
2. The concrete contribution increased linearly with a, de-
crease in the x/D ratio, and is more closely related to
the cylinder splitting strength ft than to the cube
strength f. cu
3. The potential diagonal crack is approximately the line
joining the inside face of the load-bearing block at the
support to the outside face of that at the loading point,
i. e., it is inclined at cot-1 (x/D) to the horizontal.
4. The more nearly a web bar is perpendicular to the diagonal
crack, the more effective it is in resisting shear: its
effectiveness also increases with the depth at which it
intersects the. diagonal crack.
5. Within practical limits, ultimate shear strength is inde-
pendent of the yield stress of the reinforcement.
6. The main longitudinal reinforcement forms an important
contribution to the shear strength of reinforced concrete
deep beams.
It is to be noted that observation (2) above means
that the clear-shear span ratio x/D is interpreted to be more
important than the span/depth ratio L/D. Observation (2) also

16.
implies that diagonal cracking in a deep beam is akin to
the splitting of a cylinder in the Brazilian test, an analogy
which was first described by Brock 44,45
y, in connection with
normal beams with small shear span/depth ratio (a v
/d), and
subsequently applied to deep beams by Ramakrishnan and
Ananthanarayana 416.
(Brock's 'split-cylinder' analogy is
explained in Section (1.12) and Fig. (1.12) of the Shear
Study Group's Report 47).
As regards web reinforcement, there are two significant
and interesting differences between the results of Crist's
tests and those of the Nottingham-Cambridge team. Firstly,
Crist assumes that the contribution of the reinforcement
crossing the diagonal crack is uniformly distributed down
the effective depth. The expression given above, Egn. (1.9),
reflects a triangular distribution with the maximum ordinate
at the beam soffit. The second difference is that Crist
assumes that the yield strain of the reinforcement develops
before failure whereas observation (5) above, states that
it may not.

CHAPTERTW0
THE DESIGN OF R. C. DEEP BEAMS IN CURRENT PRACTICE
2.1 INTRODUCTION
2.2 OUTLINES OF CURRENT DESIGN METHODS
2.2.1 CEB-FIP Recommendations
2.2.2 ACI Building Code
2.2.3 Portland Cement Association
+ý 2.3 GENERAL COMMENTS

17.
CHAPTERTW0
THE DESIGN OF RC. DEEP BEAMS IN CURRENT PRACTICE
2.1 INTRODUCTION
With the issue of the CIRIA design guide 9 in January
1977, some form of authorative, British guidance on the design
of reinforced concrete deep beams became available for the first
time. The guide joined ranks with (but provides more detailed
guidance than) the CEB-FIP Recommendations 5, theACI Building
Code 4, and the PCA ST668; each of which containing some pro-
visions for deep beams is currently used in British design
practice.
In this chapter the three major design methods mention-
ed above are described, and design examples are given to illus-
trate their usage. The CIRIA guide, which is likely to have a
significant impact on future design practice and also contains
some provisions for the design of deep beams with web openings,
is reviewed in greater detail in Chapter 9.
2.2 OUTLINES OF CURRENT DESIGN METHODS
2.2.1 The CEB-FIP Recommendations 5.
According to the CEB-FIP Recommendations 59 simply
supported beams of span/depth ratio L/D less than 2 or contin-
uous beams of L/D ratio less than 2.. 5 are to be designed as
deep beams. The area of the main longitudinal steel should
be calculated from the largest bending moment in the span,

LU"
using the following values for lever arm z: -
z= 0.2 (L + 2D) for 1<L/D<2 (2.1)
z=0.6 L for L/D< 1
It is thus seen that for L/D <1,, the lever arm z
is independent of the depth D of the beam: for L/D trom 1 to 2,
z increases with D but at a lower rate.
The main longitudinal reinforcement, determined as
explained above, should extend without curt,
support to another and be anchored securely
the required area of the steel is not to be
level, but should be uniformly distributed
to (0.25D - 0.05L), as shown in Fig. (2.1).
attention to the importance of detailing of
the form of a number of small diameter bars
and development of cracks and to facilitate
supports.
ailment from one
at the ends. Also,
concentrated at one
over a depth equal
The CEB-FIP drew
the main steel in
to limit the width
anchorage at the
The design shear force should not exceed
0.1bDfo/Ym or O. 1bLfc/ym (whichever is less)
where b is the beam width, D the depth, L the span, fc the
characteristic cylinder strength, of the concrete and ym the
partial safety factor for materials.
As regards web reinforcement, the Recommendations state
that it will generally besufficient to provide an orthogonal
mesh consisting of vertical stirrups and horizontal bars placed
near each face and surrounding the extreme vertical bars. The
1y.
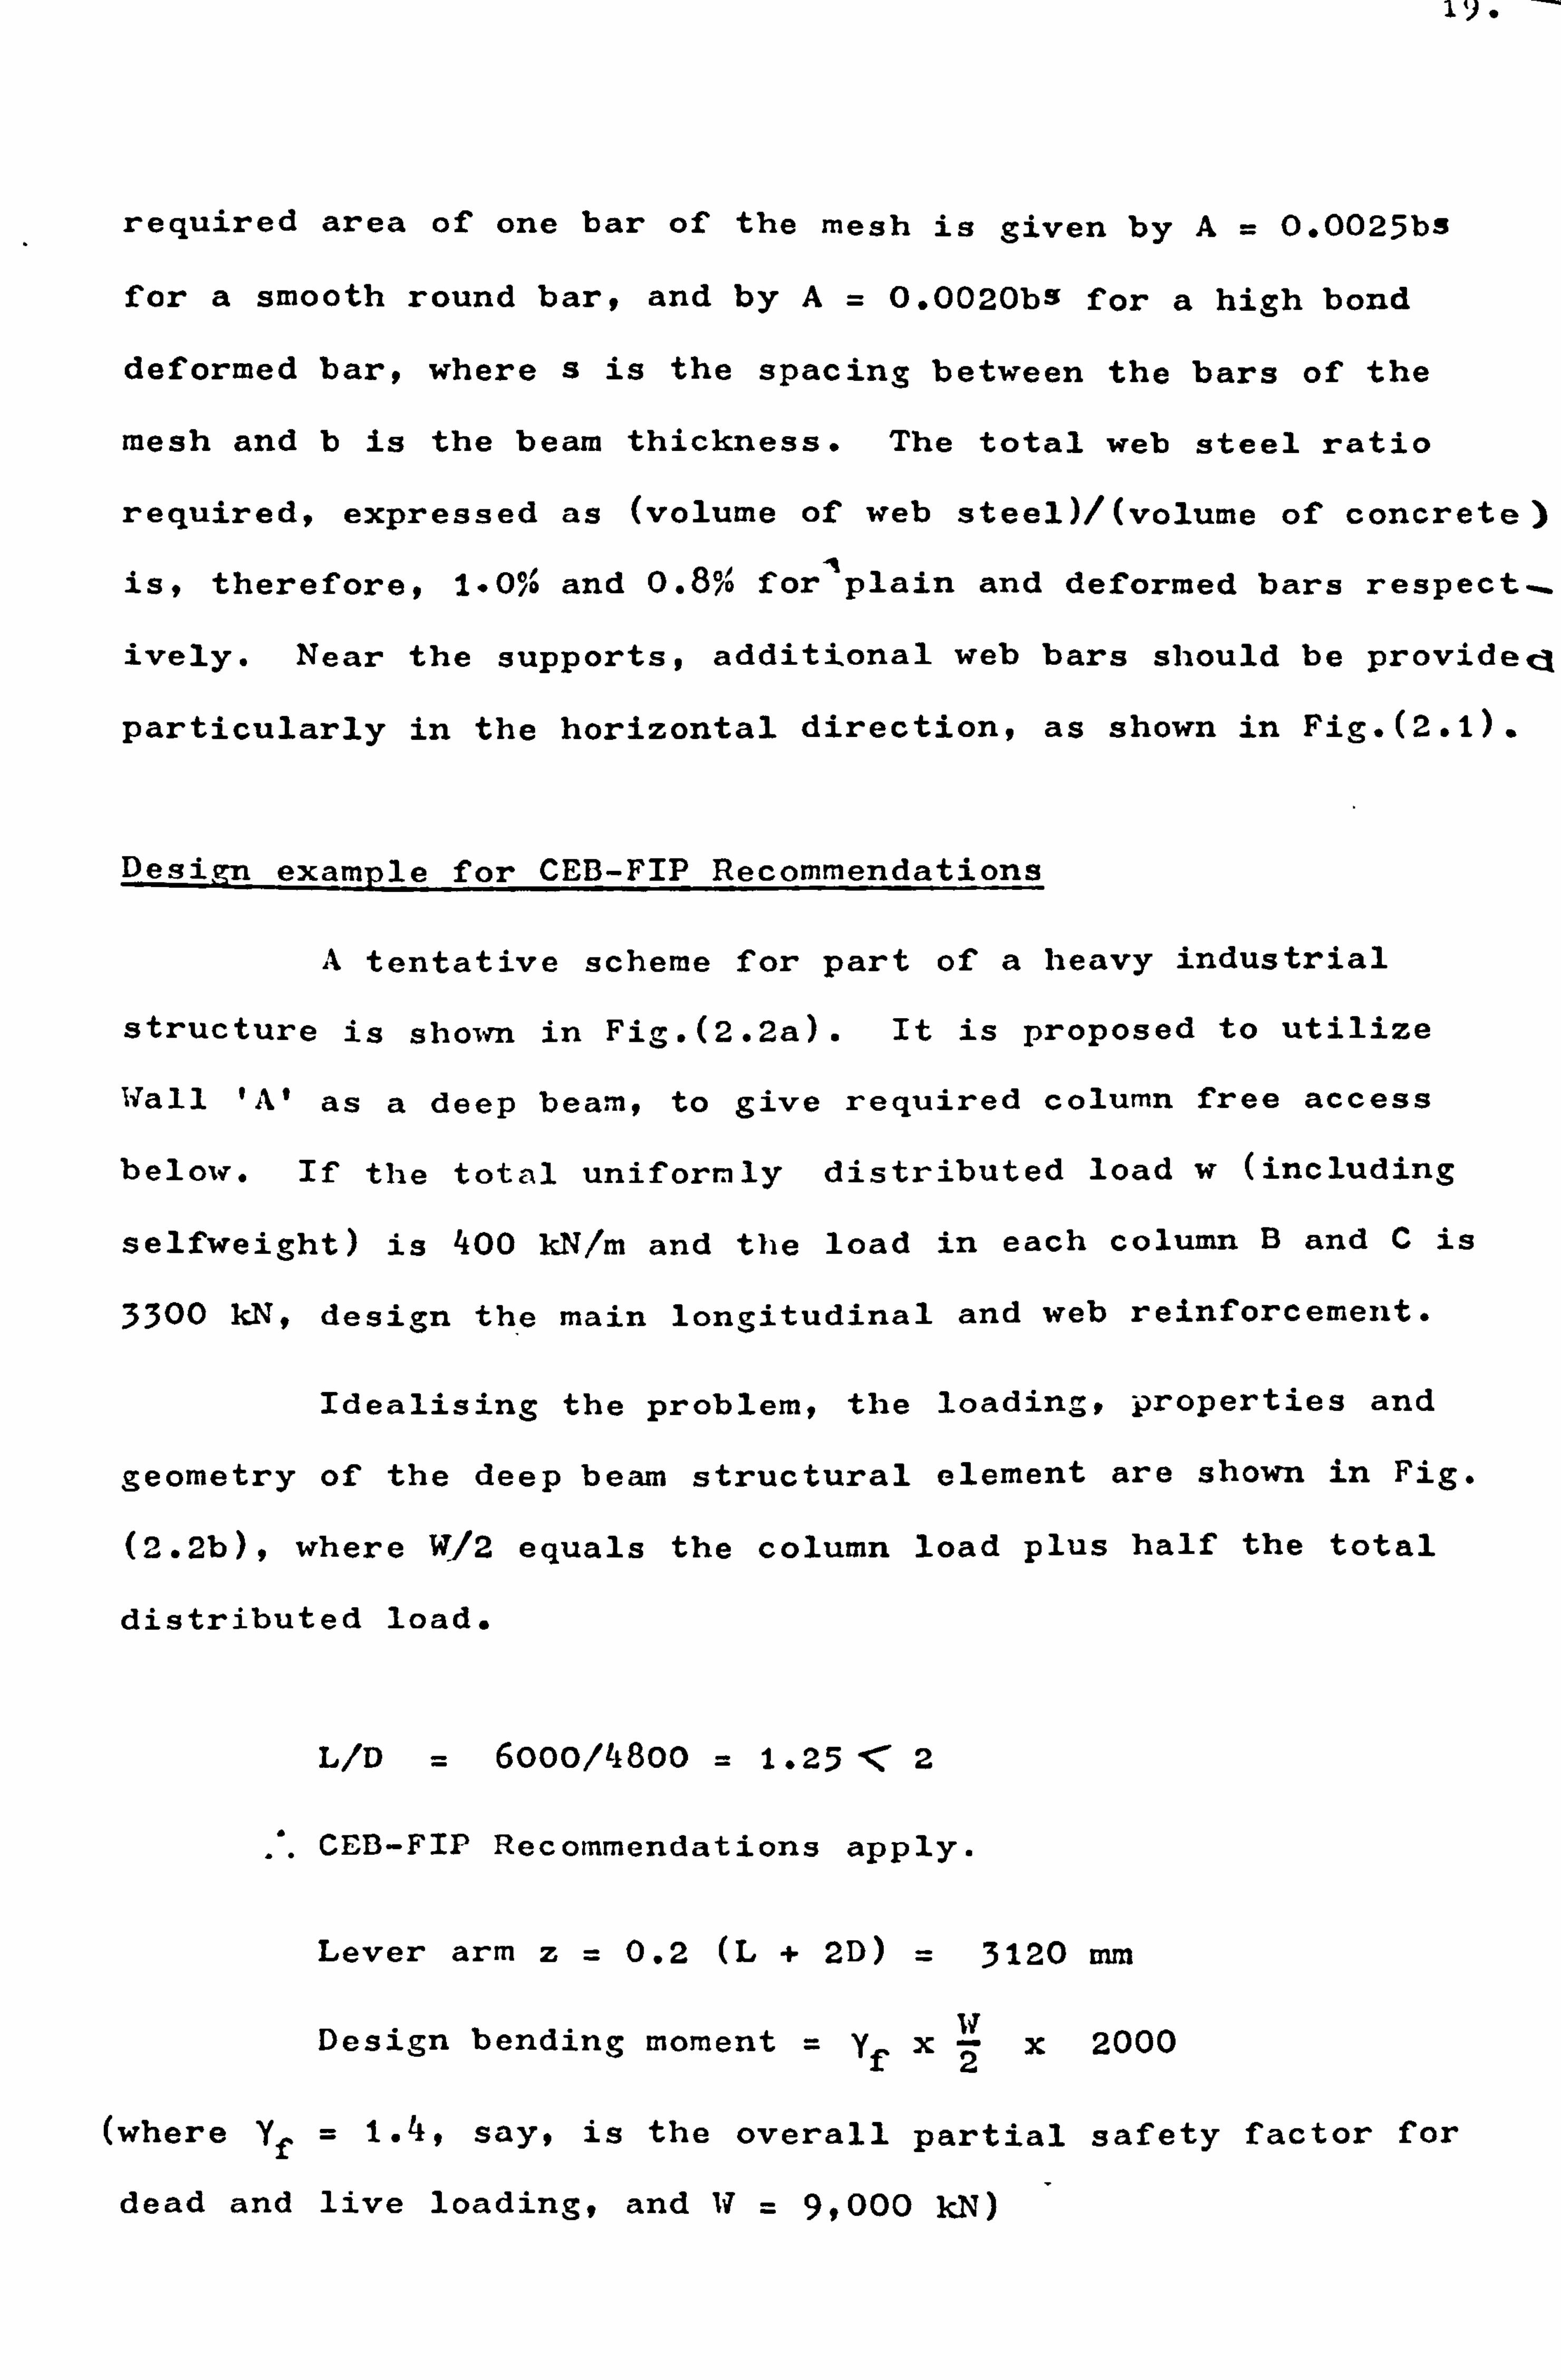
required area of one bar of the mesh is given by A=0.0025ba
for a smooth round bar, and by A=0.0020bs for a high bond
deformed bar, where s is the spacing between the bars of the
mesh and b is the beam thickness. The total web steel ratio
required, expressed as (volume of web steel)/(volume of concrete)
is, therefore, 1.0% and 0.8% for'plain and deformed bars respect,
ively. Near the supports, additional web bars should be provide cl
particularly in the horizontal direction, as shown in Fig. (2.1).
Design example for CEB-FIP Recommendations
A tentative scheme for part of a heavy industrial
structure is shown in Fig. (2.2a). It is proposed to utilize
Wall 'A' as a deep beam, to give required column free access
below. If the total uniformly distributed load w (including
selfweight) is 400 kN/m and the load in each column B and C is
3300 kN, design the main longitudinal and web reinforcement.
Idealising the problem, the loading, properties and
geometry of the deep beam structural element are shown in Fig.
(2.2b), where W/2 equals the column load plus half the total
distributed load.
L/D = 6000/4800 = 1.25< 2
CEB-FIP Recommendations apply.
Lever arm z=0.2 (L + 2D) = 3120 mm
Design bending moment =yfx2 ff x 2000
(where Yf = 1.4, say, is the overall partial safety factor for
dead and live loading, and if = 9,000 kN)

: -10.
Moment of resistance =x As
xz Ym
(where Ym, the partial safety factor for material, is 1.15 for
steel, fy = 410 N/mm2 and z= 3120 mm as calculated)
1.4 9000 x 103
x 2000 410
x As
x 3120 2 1.15
Longitudinal steel area As= 11327 mm2
Use 24 No. 25 mm diameter bars (11782 mm 2)
These main bars are arranged in 8 rows of three bars,
extended without curtailment from support to support, and
distributed over a depth of (0.25D - O. 05L) = (0.25 x 4800-0.05
x 6000) = 900 mm measured from the bottom.
Next, the required beam width b is determined from the
condition that:
Design shear force Yf x20.1 bD fc
Ym
Taking yf = 1.4 and ym = 1.5 for concrete
1.4 x 9000 x 103 . {> 0.1 xbx 48001x522.5
'. b= 875 mm .
1Jeb reinforcement: say, bar spacing s= 150 mm.
Area required for each bar = 0.2 per cent of bxs
2 i. e., 0.002 x 150 x 875 = 262 mm.
Provide an orthogonal mesh of 20 mm diameter deformed
bars at 150 mm centres in each face (A V=
Ah = 314.2 mm2/bar)
and at 75 mm spacing near supports.
The detailing is shown in Fig. (2.3).

21.
2.2.2 ACI Building Code: ACI 318-714.
Special provisions are given in the 1971 ACI code 4
for deep beams; the emphasis is on the capacity to resist
shear force. These shear provisions apply to both simple and
continuous beams when the span/depth ratio L/D is less than 5. i
The calculations are carried out for the critical section,
which is defined as follows. For a concentrated load, the
critical section is located midway between the load and the
face of the support; for a uniformly, distributed load it is
at 0.15 1 from the support where 1 is the clear span distance
face to face of supports.
First the nominal shear stress vu is calculated from
the given design shear force Vu:
V Yu u-
bd
where 0 is the capacity reduction factor (taken as 0.85)
b is the width of the beam
d is the effective depth measured to the centroid
of the main longitudinal steel.
(2.2 )
The designer should ensure that the dimensions b and
d of the beams are large enough for vu not to exceed the follow-
ing limits:
vu 8 when 1/d< 2
vu J 2/3 (10 + 1/d) ifwhen
2G 1/d C5 (2.3 )
where f' is the concrete cylinder compressive strength.

22.
Next, the nominal shear stress vc carried by the
concrete is calculated: -
vc = 3.5 - 2.5 Mu
x 1.9 Vud
2.5 .9 Ffc,
+ 2500p
6
fc+ 2500p Vud
M u
VUd
M. u
(2.4)
(2.4$ ,
where Mu is the design bending moment at the critical section
f' is the specified concrete cylinder compressive
strength.
p is the ratio of the main steel As to the area bxd
of the concrete section.
Vu, b and d are as defined in Eqn. (2.2)
Irrespective of the values of vu and vc so calculated,
an orthogonal mesh of web reinforcement is mandatory; the area
of the vertical web steel should not be less than 0.15 per cent
of the horizontal concrete section bL, and that of the horizon-
tal web steel not less than 0.25 per cent of the vertical con-
crete section bd. When vu exceeds vc the web reinforcement
should also satisfy the requirements of Eqn. (2.5)below: -
rlý1/dl+Ah[11_1/dl (vu - vý)b
v 12 sh 12 f
Y
(2.5)
where Av is the area of the vertical web steel within a spacing s. v
Ah is the area of the horizontal web steel within a spacing sh

23.
1 is the clear span distance.
b is the beam width.
fy is the snscified yield strength of the steel.
Design example for ACI code.
Consideration is given again to the design of the
beam shown in Fig. (2.2). (In using the ACI code it must be
noted that all equations are intended for use with Imperial
units. However, in practice, Imperial units need only be used
in Eqn. (2.4) and in evaluating If-cf, ).
The ACI code does not contain detailed requirements
for designing deep beams for flexure. In the commentary 48
and notes 49
to the code, the designer is referred to other
documents, such as the PCA bulletin 8.
The PCA method is ex-
plained later, and only the final result of the flexural cal-
culations will be given here.
Main steel provided: 13 No. 40 mm diameter bars
(16336 mm 2).
The critical section is located (Fig. 2.2) at 0.5
x (2000 - 0.5 x 600) = 850 mm from the face of support, or
850 + 0.5 x 600 = 1130 mm from the centre of support.
Design bending moment Mu = 1.4 x 9200
x 1150 = 7245 kNIK
(where 1.4 is the partial safety factor for loading).
Design shear force Vu = 1.4 x 9000
= 6300 kN 2
A suitable beam width b may be chosen from Egn. (2.3).

IQ.
V=8f, Fe
Obd
(Assuming d: 4500 mm say)
(fc = 22.5 N/rnm2= 3260 lbf/in2. '. fl= 57.2 lbf/in2= 0.394 N/mm2)
6300 x 103 =8x0.394 0.85 bx 500
b 525 mm say
Referring to Eqn. (2.4),
3.5 - 2.5 Mu _
2.5 x 7245 x 103 Vd- 3S 63oo x 500
U-
= 2.86 > 2.5
Use 2.5 (See Egn. (2.4)
vc = 2.5 1.9 fC + 2500 p Vud
ri u
= 2.5 [1.9
x 57.2 + 2500 x 16336 x
6300 x 4500 2 525 x 500 7245000 lbf/in
= 441 lbf/in2 = 3.04 N/mm2
But 6 ff-c7l
=6x0.394 = 2.36 N/mm2
From Eqn. (2.2)
6300 x 103 2 °u - o. 5x 525 x 500 = 3.14 h/mm
Since vu exceeds vc, the web reinforcement must
satisfy the requirement of equation (2.5). Only orthogonal
web reinforcement is acceptable to the code. Assuming the
same size bars (AWeb) are used in a square patter-i at, say,
'_5.
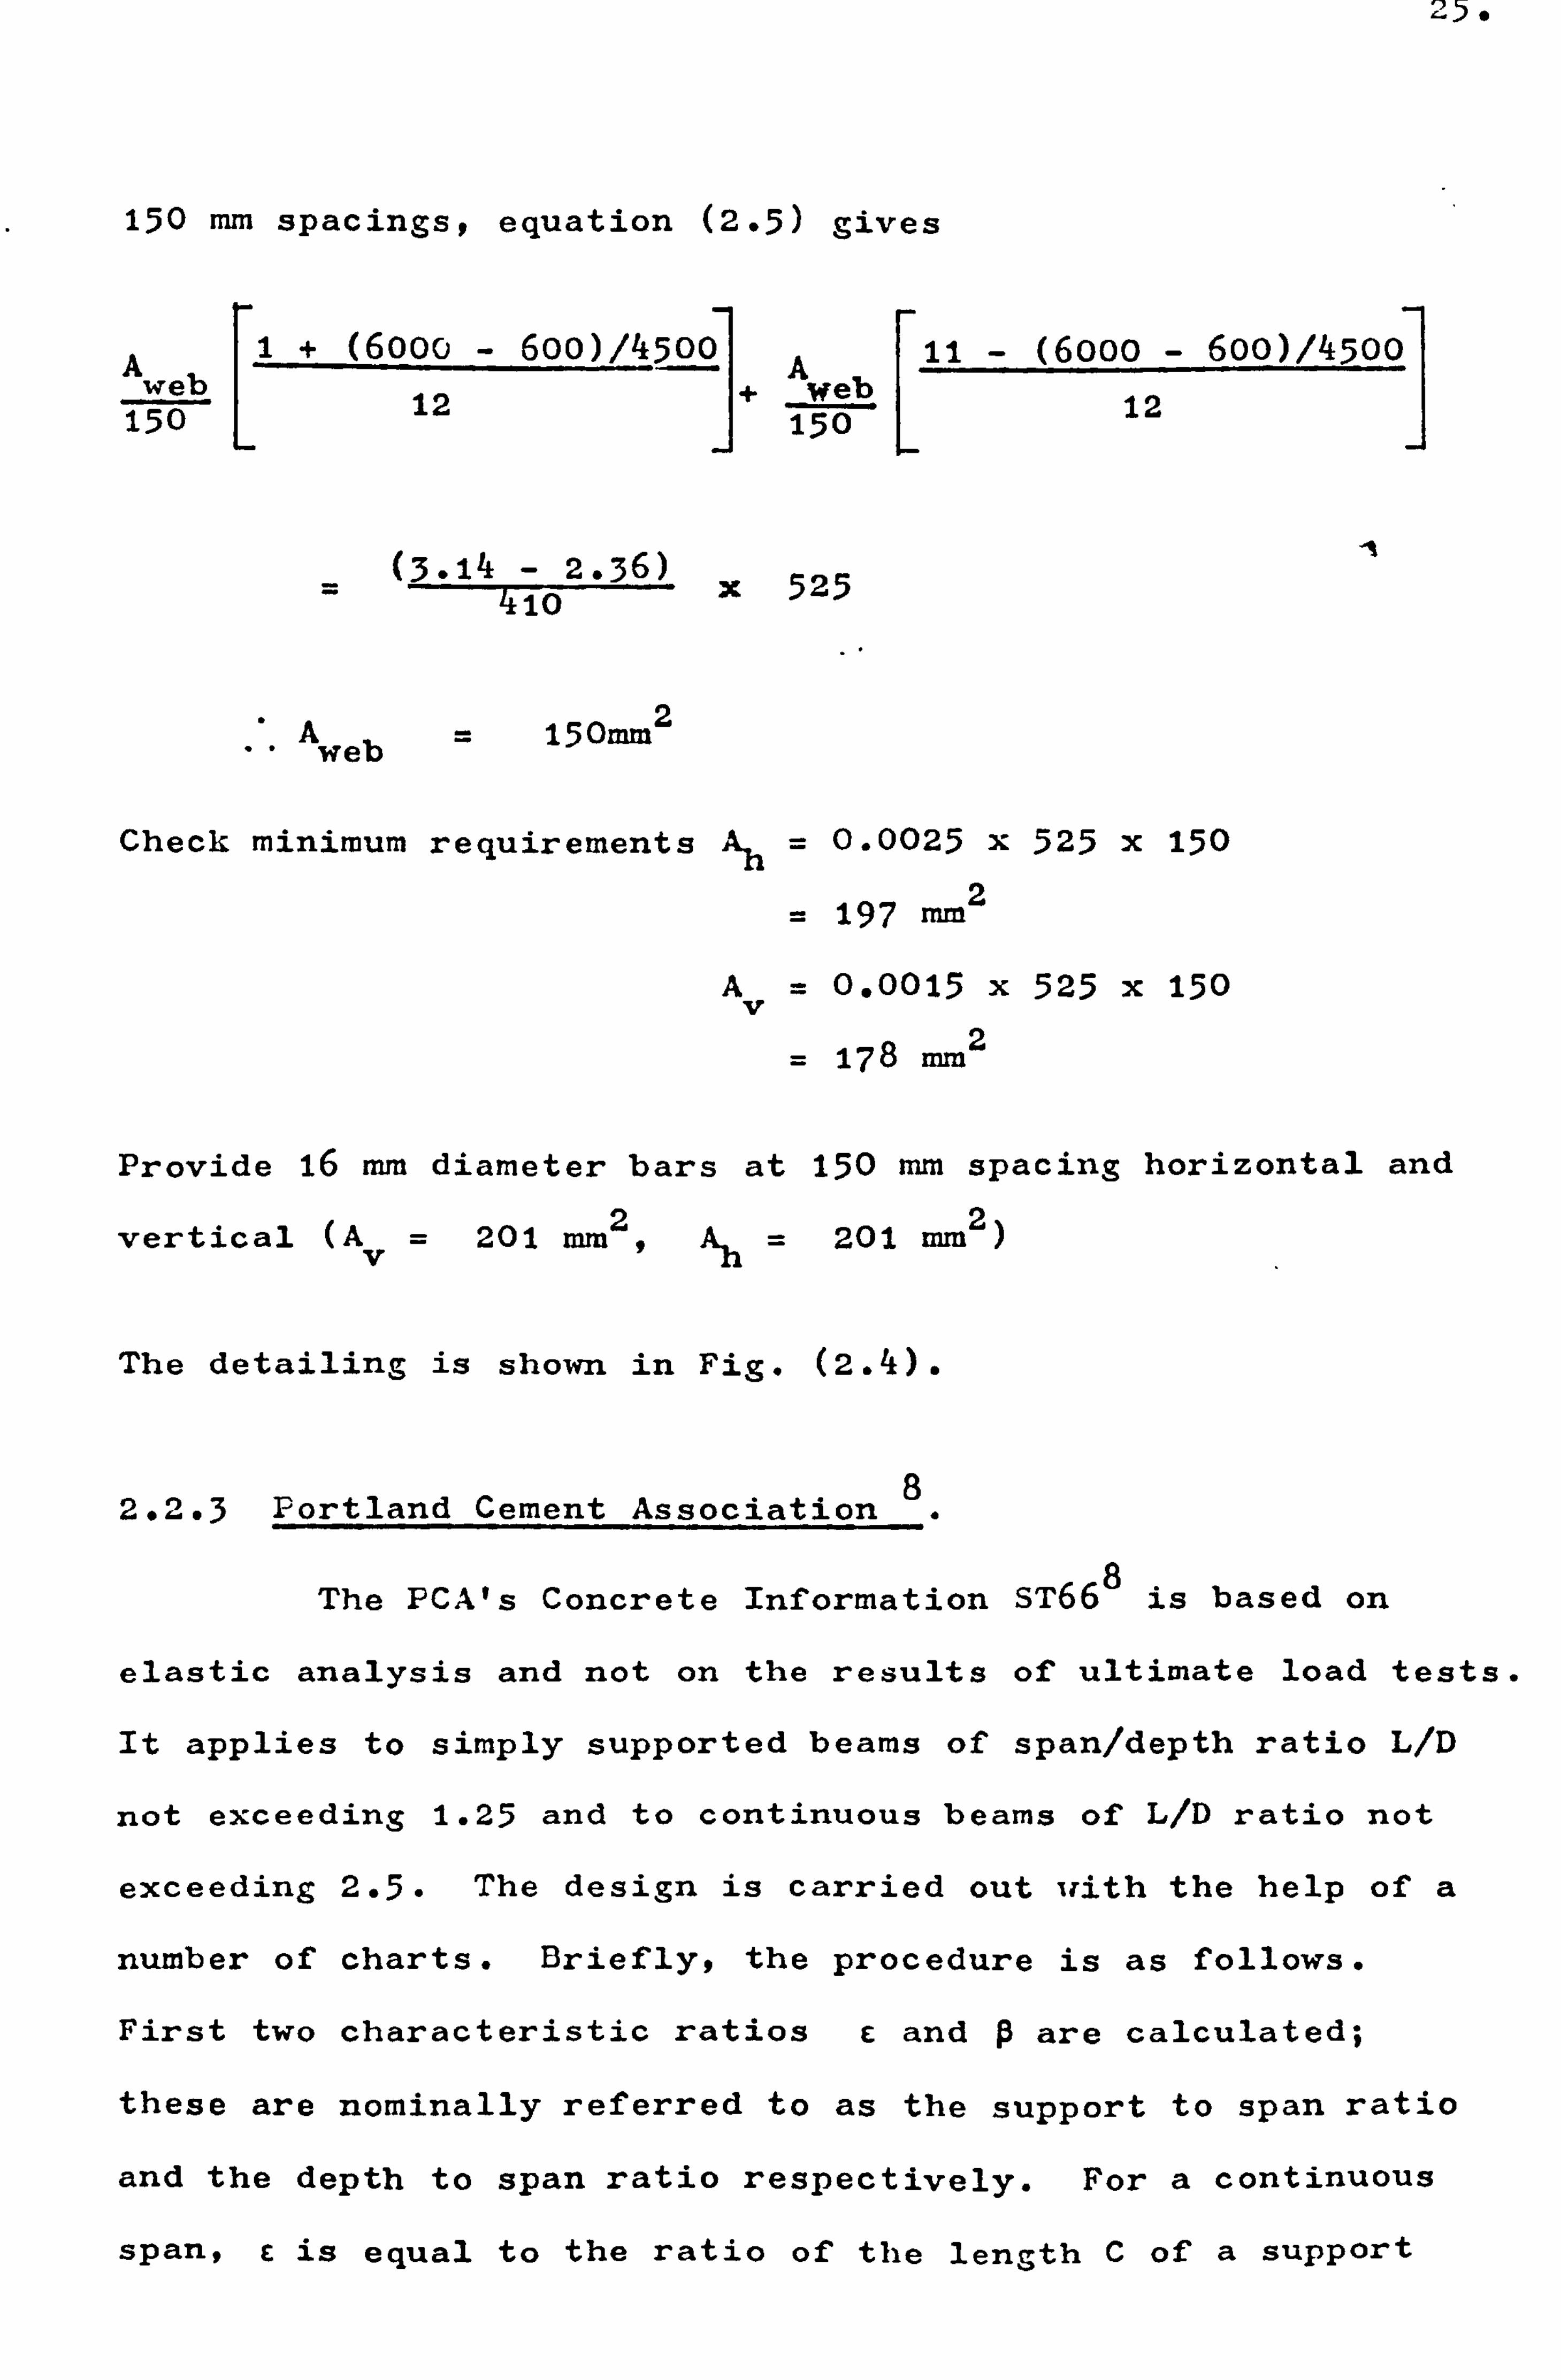
150 mm spacings, equation (2.5) gives
A web 1+ (600o - 600)/4500
j+ Aweb 11 - (6000 - 600)/4500 150 12
150 12
(3.14 - 2.36) x 525
10
""" Aweb = 150mm2
Check minimum requirements Ah = 0.0025 x 525 x 150
2 = 197 mm
A=0.0015 x 525 x 150 v 2
= 178 mm
-1
Provide 16 mm diameter bars at 150 mm spacing horizontal and
vertical (Av = 201 mm2, Ah = 201 mm2)
The detailing is shown in Fig. (2.4).
2.2.3 Portland Cement Association 8.
The PCA's Concrete Information ST668 is based on
elastic analysis and not on the results of ultimate load tests.
It applies to simply supported beams of span/depth ratio L/D
not exceeding 1.25 and to continuous beams of L/D ratio not
exceeding 2.5. The design is carried out with the help of a
number of charts. Briefly, the procedure is as follows.
First two characteristic ratios F and ß are calculated;
these are nominally referred to as the support to span ratio
and the depth to span ratio respectively. For a continuous
span, E is equal to the ratio of the length C of a support

4. V "
(for example, the dimension of a column in the direction of
the span) to the span L, and ß is D/L. For a simple span, C
and ß need careful interpretation. It would seem that for a
simply supported beam under uniformly distributed load,
12 and 2D L (2.6
For a simply supported beam under a point load applied at
midspan,
£= 2L and 2L (2.7
From the values of c and ß, the tensile force T to be resisted
by the main longitudinal steel As is obtained from a chart,
reproduced here in Fig. (2.5).
Then As = T/fs (2.8
where fs is the allowable stress in the steel; the value of
fs is left to the judgment of the designer.
As regards shear resistance, the PCA document 8
states
that conventional vertical stirrups as used in ordinary beams
are ineffective in deep beams. No specific recommendations
are given for the design of the web reinforcement, but it is
suggested that the shear force V applied to the beam should
not exceed that given by Eqn. (2.9).
g b-D 3 i1 +
LD (2. q
where v is the allowable shear stress for an ordinary beam

27.
made of similar quality concrete; the value of v is again
left to the discretion of the designer.
Design example for PCA method.
Once again, consideration is given to the design
of the beam shown in Fig. (2.2). (Note: the PCA method is
based on allowable stresses. Therefore, the partial safety
factors of yf and ym do not appear).
The beam is under point loads W/2 applied at third
points. To apply PCA's design chart (Fig. 2.5) it is first
necessary to approximate the beam to one with a span of 2L/3
having a point load at midspan; the maximum moments in the
two beams are then the same. Next, the characteristic ratios
F and ß are calculated from Egn. (2.7) by writing 2L/3 for L: -
C 600 x31 2(2L/3) x 6000 = 13.3
ß_D 4800 x3=0.6
2(2L/3) x 6000
Referring to Fig. (2.5) it will be conservative to use the
solid curves to interpolate T for E= 1/13.3 and ß=0.6.
By visual interpolation
T=0.2917 = 0.29 x 9000 kN = 2610 kN
To determine As from Eqn. (2.8) it is necessary to
adopt a value for the allowable steel stress fs. A reasonable
value (see Section 8.10.1 of ACI code 4)
would be f= s
24000 lbf/in2 = 165 N/mm2. Then

28.
As T 2610 x 103 = 15818 mm2
s 165
Provide 13 No. 40 mm diameter bars (16336 mm2)
and note the PCA guide requires the main tensile steel
to be placed close to the bottom of the beam.
Next, the required beam width is determined from
Eqn. (2.9) using a reasonable value of 1.1 /7%
for the c
allowable shear stress v (see ACI code 4:
Sections 8.10.3
and 11.4.1).
v=1.1 Ffc,
= 63 lbf/in2 = 0.44 N/mm2
Using Eqn. (2.9) with D/L replaced by D/(2L/3)
0.5 x 9000 x i03 i5x 4800
xbx 4800 3 (1 +2x 6000/3
)xo. 44
b= 1050 mm (say)
The PCA method does not call for web reinforcement. The
detailing is shown in Fig. (2.6).
2.3 GENERAL COMENTS
The most widely used of the four methods, namely, 8
that of the PCA, was prepared some. thirty years ago when
little experimental data on reinforced concrete deep beams
were available. Consequently, it was based on tae theoretical
work of Dischinger 13, who used the classical theory of elast-
ticity and assumed the beam to be homogeneous. The method,

'9.
therefore, cannot be expected to reflect accurately actual
behaviour. For example, the stress distribution in a con-
crete deep beam at ultimate load is not the same as that
predicted. However, because of the built-in factors of
safety, the PCA method is likely to be conservative in most
cases, although its use would not be recommended.
The CEB-FIP Recommendations , published in 1970 5
were based mainly on the tests of Leonhardt and Walther 25,
although they may have been influenced by the earlier tests
carried out in Sweden by Nylander and Holst 50. The Recommen-
dations concentrate on flexural design and do not give specific
guidance on how to calculate the web steel areas to resist
specified shear forces. In contrast, the ACI's recommendations4,
which were based mainly on tests carried out in America by
Grist 26, de Paiva and Siess 24, emphasize shear design and
do not give specific guidance on how to calculate flexural
steel areas to resist specified bending moments.
Since the publication of the ACI and CEB-FIP's
recommendations, a comparatively large volume of research has
27-32 It is now been carried out on deep beams in the U. K.
known for example, that inclined web reinforcement (which is
not covered by the ACI code and the CEB-FIP Recommendations)
is the most efficient type of web reinforcement for deep beams,
that the effectiveness of a web bar depends on where and how
it in-ý'_-rcepts the critical diagonal crack, and that the main
longitudinal reinforcement is an integral part of the web re-
inforcement. Many of these aspects of deep beam behaviour are
reflected in the design method proposed by the Nottingham -

30.
Cambridge team 33P34 (Chapter 1.2.2.4: Eqn. (1.9)). This
method gives reasonable estimates of the ultimate shear
capacity of reinforced concrete deep beam without openings
and now forms part of the provisions given in the new CIRIA
design guide.
The design of deep beams with web openings is not
covered by any of the design methods outlined in this chapter
and, as will be shown, the CIRIA provisions for openings are
rather restrictive (Chapter 9). As in the case of solid deep
beams previously, data on the ultimate behaviour of deep beams
with openings are required to facilitate the development of
reasonable methods of predicting the ultimate shear capacity.
As a step towards providing such data, the present experimental
programme was carried out, a description and the results of
which are presented in the succeeding four chapters.

CHAPTERTHREE
THE EXPERIMENTAL PROGRM 1E
3.1 INTRODUCTION
3.2 MATERIALS
3.2.1 Cement
3.2.2 Lightweight aggregates
3.2.3 Normal weight aggregates
3.2.4 Reinforcement
3.3 CONCRETE MIXES
3.3.1 Lightweight concrete
3.3.2 Normal weight concrete
3.4 BEAM MANUFACTURE
3.4.1 Formwork
3.4.2 Reinforcement fabrication
3.4.3 Casting and curing
3.5 CONTROL SPECIMENS
3.6 TESTING
3.6.1 Test equipment
3.6.2 Test preparation
3.6.3 Test procedures

31.
CH APT ERTHREE
THE EXPERIMENTAL PROGRA! fl1E
3.1 INTRODUCTION
Previous work using practical laboratory tests on
reinforced concrete specimens has proved fruitful in providing
an appreciation of deep beam behaviour and has led to the
development of practical design guidance. It is possible that,
in the near future, advances in mathematical techniques such
as refinements to the finite element method 51
could provide
mathematical models capable of simulating post cracking behaviour
on the computer; but at the present time, because of the complex
nature of the behaviour of deep beams after cracking, laboratory
testing would remain the primary investigatory tool available
to the researcher. Such testing, as drafting committees for
codes of practice have emphasized, should form the basis of
practical design recommendations.
The primary object of the present experimental pro-
gramme was to study the behaviour of reinforced concrete deep
beams with web openings; a topic which, as mentioned earlier,
has received little attention in the past, and one which may
be expected to occur frequently in practice because of the wall
like geometry and uses of deep beams. Due to the lack of pre-
vious test data, the present investigation was, of necessity,
a developing one. It began with a pilot investigation in which
24 lightweight concrete specimens were tested to destruction.
These exploratory tests, during which crack development, crack
widths and beam deflection were recorded, covered a wide range

32.
of opening size, shape and position and broadly investigated
the effect of beam geometry. Further tests were then planned
as a follow up and a series of 39 beams was designed to system-
atically test the more important observations recorded in the
pilot study and provide information on the effects of web re-
inforcement.
In both of these two test series, lightweight aggregates
were used in concrete making because test data of lighweight
concrete beams were particularly scarce; for example, ACI
Committee 408 has recommended that "experimental research
should be conducted on lightweight concrete elements, which
would evaluate the ability of lightweight concrete to develop
bond in a variety of environments" 52. Furthermore, some
engineers 53,54
expect that, in the not too distant future,
"lightweight concrete will achieve greatly enhanced use"
In a final series of tests, which comprised 16 beams,
normal weight aggregates were used in concrete making to provide
information on any differences in behaviour between lightweight
concrete deep beams and normal weight concrete deep beams. Nine
of the second series of lightweight concrete test specimens were
thus repeated and a further seven complementary normal weight
deep beams with openings were designed to investigate the effect-
iveness of an inclined system of web reinforcement.
Some guidance for the early planning of the test pro-
gramme wzs derived from a survey of the literature appertaining
to the effects of openings on ordinary shallow beams (large span/
depth ratios). The main conclusion drawn from the survey was
that openings located in the predominantly flexural regions do

33.
not reduce capacity, whereas openings located in regions of
high shear may significantly do so. For this reason all the
openings in the present tests were located within the shear
spans. The test specimens were also designed to be complement-
ary to the previous tests at Nottingham on solid deep beams,
and a similar simple two point loading configuration was. normally
adopted.
In this chapter, the general experimental details of
the test programme are described. The description and notation
of each of the three series of the test specimens, together with
the presentation and discussion of each set of test results, are
given separately in the succeeding three chapters.
Two subsidiary deep beam topics were also investigated:
the requirements for end anchorage of the main longitudinal
tension reinforcement (9 tests), and the effects of repeated
loading on deep beams (3 tests). These tests and their results
are described in Appendices I and 2 respectively.
3.2 MATERIALS
3.2.1 Cement
Ordinary Portland Cement conforming to B. S. 12 was
used for both normal weight and lightweight concrete. Quantities
of cement, sufficient to permit cement from the same batch to be
used for the manufacture of all beams within each test series,
were successively ordered and carefully stored in airtight con-
tainers. All cement was supplied by the Blue Circle Group.
3.2.2 Lightweight aggregates

34.
Lightweight aggregates of sintered pulverized fuel
ash (supplied in two grades under the name "Lytag") were used
for the lightweight concrete test specimens: -
Fine aggregates: Lytag fine grade (5 mm down).
Coarse aggregates: Lytag medium grade (13 mm nominal size). I
Both grades were well dried before use. Storage problem a
necessitated two batches being ordered, but, as shown by the
results of sieve analysis presented in Table (3.1), the difference ft
between the batches were not significant.
3.2.3 Normal weight aggregates
The following aggregates were used in normal weight
concrete: -
Fine aggregates: dried Hoveringham River Sand (5 mm down)
Coarse aggregates: dried Hoveringham River Gravel (10 mm nominal)
3.2.4
The results from sieve analysis are given in Table (3.2).
Reinforcement
Deformed bars of high yield steel (Unisteel 410) were
used throughout. The reinforcement was ordered as a single
batch and, for quality control, samples of reinforcement picked
at random from the fabrication workshop were simply tested for
ultimate tensile strength. The coefficient of variation for
the results of these tests was satisfactory, being approximately
3%. The typical tensile properties of the reinforcement (Table
3.3) were determined by tests on a smaller random sample, using
the standard test procedures recommended in B. S. 18: 1962 and
B. S. 4449: 1969. Typical load v. extension curves for the 20 mm

35.
and 8 mm diameter bars are presented in Fig. (3.1). It is to
be noted that the 8 mm bars and similarly the 6 mm and 10 mm
bars possessed no definite yield point: for these bars the value
of the 0.2 per cent proof stress was taken as representative of
the 'yield strength'.
I
3.3 CONCRETE MIXES
3.3.1 Lightweight concrete
The proportion of dry weight of materials used was in
accordance with recommendations 56
given by the manufacturers:
Mix proportions by weight 1: 1.25: 1.55
Total water/cement ratio 0.8
Cement per cu m. 383 kg/m3
The average wet and hardened properties of the concrete
produced were as follows: -
Slump, immediately after mixing
Wet density
Air dry density
Cube strength (28 day)
Cylinder crushing strength (28 day)
Cylinder splitting strength (28 day)
3.3.2 Normal weight concrete
70 mm
1810 kg/m3
1780 kg/m3
37.90 N/mm2 (5.4%4' coeff. of variation)
31.60 N/mm2
(5.4, o coeff. of variatiorn )
2.5 N/mm2
(9.4; 101 coeff. of variation i
The mix was designed for a target strength comparable
to that of the lightweight concrete and after A series of trial

36.
mixes, a mix of the following proportions was selected: -
Mix proportions by weight 1: 1.75: 3.25
Total water/cement ratio 0.47
Cement per cu. m 350 kg/m3
Representative values for the properties of the mix
are as follows: -
Slump
Wet mix density
Cube strength (28 day)
Cylinder crushing strength (28 day)
Cylinder splitting strength (28 day)
3.4 BEAM MANUFACTURE
3.4.1 Formwork
70 mm
2450 kg/m3
53.25 N/mm2 (6.0%ocoeff. of variation)
41.95 N/mm2 (6.0% coeff. of variation)
3.75 N/m2 (5.7% coeff. of variation)
Four upright wooden moulds were used to cast the beams.
Each mould was a bolted assembly of 20 mm thick Wisaform sides,
with stop-ends and a base of 100 mm x 75 mm planed softwood.
Prior to assembling, all the internal surfaces were coated with
a thin release oil and all joint surfaces were liberally coated
with thick heavy grease. This application of grease served
successfully to seal the mould.
The openings in the test specimens were formed by blocks
of expanded polystyrene. These blocks, which were easily and
accurately shaped on a purpose built hot-wire cutter, were
coated with grease during assembling to prevent the ingress of

37.
of mortar. An array of 8 mm diameter holes drilled through
the sides of each mould facilitated the fixing of the blocks
in any of a wide range of locations. Each block was sandwiched
between the sides of the mould and secured in compression by
four lateral bolts 150 mm long. Those 8 mm diameter holes, 1
which were not required for the opening location of a particular
test specimen, were plugged effectively with plasticine.
Lateral bulging of the mould was prevented by three
U-shaped metal frames positioned at the third points of each
mould. The outer frames also functioned as mountings for two
Bosch external vibrators, which were fixed across the top by
bolts. The frames in turn were mounted on rubber pads, which
served to reduce the clatter and give smoother vibration.
3.4.2 Reinforcement fabrication
The reinforcement for all the beams was fabricated
in the workshop of the University's Applied Science Faculty.
The main longitudinal reinforcement for all beams consisted
of 1 No. 20 mm diameter deformed bar which, for the purpose
of affixing external end anchorage blocks, had been cut longer
than the beam and had screw threaded ends. All joints on the
web reinforcement were made with light tack welds. After
degreasing, the reinforcement was positioned in the mould
and held in position by spacers at the top and by the main
longitudinal bar passing through the ends of the formwork at
the bottom. In order to simplify transportation of the beams,
two 12 mm diameter lifting bolts to be cast in were fixed to
the top bar of each reinforcement assembly.

38.
3.4.3 Casting and curing
The beams for each test series were cast consecutively
at weekly intervals in groups of 3 or 4. Each mixing session
normally consumed approximately two tonnes of concrete and to
spread the work load, the aggregates and cement were carefully
weighed out into tins on a previous day.
Both normal weight and lightweight concretes were mixed
for about 3 minutes in a3 cu ft. (0.085 m3) capacity Cumflow
horizontal drum mixer. Prior to the first mix, the drum was
'buttered' to compensate for initial loss of mortar. Slump
tests were carried out on each batch, with compaction factor
tests being carried out at random. For most batches of concrete
a slump of 70 mm was obtained; however, slumps 20 mm either side
were accepted. If the slump was less than 50 mm additional
water was added and following remixing, a new slump taken.
The concrete was placed in the forms with shovels and
continuously compacted with the external Bosch vibrators. A
set of control specimens, consisting of 3 standard cubes (100 mm)
and 6 standard cylinders (150 mm diameter) for each deep beam,
were cast in steel moulds and compacted on a vibrating table.
Several hours after casting, the top surface of the beams in
the region of the loading points was trowelled smooth and the
control cylinders were capped with neat cement paste.
On the following day, the test beams were removed from
their moulds and cured for a further 6 days under three layers
of wet hessian. The beams were then stored in the laboratory
(at approximately 23°C and 50% R. H) until tested.

39.
3.5 CONTROL SPECIMENS
The properties of the concrete in each test beam were
determined from tests on 3 cubes (100 mm) and 6 cylinders
(150 mm diameter x 300 mm). The control specimens were manu-
factured and cured in accordance with B. S. 1881-1970, with the
exception of the cylinders of lightweight concrete. B. S. 1881-1970
does not differentiate between normal weight and lightweight
concretes and the special procedure recommended by ASTM Stand-
ard C330 for lightweight cylinders was adopted; namely, moist
cured for 7 days followed by storage at 50 per cent relative
humidity until the time of test. It is to be noted that the
main effect of the curing conditions is on t'"e tensile splitting
strength, and in a separate study consisting of tests on 30
cylinders it was found that the ASTM method curing resulted in
a reduction in the splitting strength (t); the average ratio
t (ASTM)/t (B. S. 1881) being 0.74. Similar results have been
reported by Teychenne 57 and Hanson
58. For this reason, it
was important that the test beams and control cylinders of
lightweight aggregates were cured under comparable conditions.
Each set of control specimens was tested on a 120 tonne
capacity Denison grade 'A' machine, immediately following the
testing of the corresponding deep beam. The three cubes and
three capped cylinders were used to determine the crushing
strength. The cylinder splitting strength was determined from
tests on the further three cylinders, the load being applied
through 3 mm thick plywood strips along diametrically opposite
lines.

40.
3.6 TESTING
3.6.1 Test equipment
The beams were tested under static top-loading
applied hydraulically by means of a 500 tonne capacity M. A. N.
testing machine and frame. The applied load was measured by
a precision pendulum manometer operating a load indicator hand
over a large 3600 scale.
The test set-up and its mode of operation are illus-
trated in Fig. (3.2).
The beam to be tested was mounted on the travelling
base beam which was then winched along rails into position
under the upper load distribution beam. The height of the
upper beam on the screwed columns could be adjusted by an A. C.
motor. Early in the test programme particular attention was
, riven to making the process of mounting a beam up for test a
safe and speedy one-man operation. To this end special steel
jigs were designed which were clamped to each end of the base
beam (Fig-3.2). The jigs ensured that the test beam automatically
assumed a correct alignment as it was lowered by crane onto the
support reactions and provided temporary lateral support whilst
the travelling base beam was being winched into position.
All the test specimens were simply supported and the
support reactions were applied through 527 mm (2Z in. ) diameter
rollers attached to the top surface of the base beam. The
rollers were free to rotate in planes both parallel and per-
pendicular to the axis of the trolley and each permitted a
limited horizontal translation of approximately 2 mm. The

41.
loading to the top surface of the test beam was applied
through 25 mm diameter rollers sandwiched between the steel
bearing plates: the upper distribution beam itself had
rotational freedom about a spherical seating joint.
The deflections of a test beam were measured by
three Mercer dial gauges (1 div = 0.01 mm). The gauges were
attached to a rigid frame, which was clamped to the travelling
base beam of the M. A. N. test frame, and operated on three
right-angled brackets fixed just above the soffit of the test
beam with Devcon plastic steel (Fig. 3.3). The two outer
gauges above the supports registered the support settlements,
the average of which was used to correct the central gauge
reading.
Crack widths were measurad to 0.025 mm using an
illuminated hand microscope of 25 magnifications.
3.6.2 Test preparation
The casting and testing programme was organised
into cycles of 4 weeks of one day per week casting followed
by 4 weeks of testing. Each set of beams cast together was
therefore tested during week five after casting, with the
result that all the beams had the similar test age of 28 days
plus or minus a maximum of 2 days.
A week prior to testing, the face of each beam was
painted with a thin coat of white emulsion paint to assist
crack detection and measurement, and a 100 mm square reference

42.
grid was marked on in pencil. Steel anchor blocks (100 x 75
x 25 mm), each having a central hole through which the main
reinforcement bar could pass, were bedded to each end of the
beam on a thin (3 mm) layer of high-alumina cement mortar.
After hardening of the mortar, nuts threaded on each end of
the main bar were tighten. ed up with a torque spanner.
On the day prior to testing, the prepared test beam
was installed into the loading frame. By using a small screw
jack to raise each end of the beam in turn, steel bearing
blocks (100 x 100 x 30 mm) were positively bedded to the beam
at the support points on a thin layer of quick-setting gypsum
plaster. Similar blocks were bedded to the concrete at the
loading points by using the A. C. motor operating the upper
distribution beam to apply a fractional top-loading. Finally,
the right-angled brackets for deflection measurement were affixed
and, following a check on the beam's position and verticality,
the beam was ready for test: the lateral temporary support
offered by the alignment jigs was then released.
3.6.3 Test procedures
The single cycle of loading, which was adopted, had
the advantage of producing identical, simple loading histories
for all the test beams. The load was applied incrementally in
units of 20 kN up to collapse of the test specimen . (Note:
some tests were carried out to investigate the effect of re-
peated loading on deep beam behaviour; these tests are reported
in Appendix 2).

43.
After each increment of load, the deflection gauge
readings were observed and recorded and., with the aid of a
hand lamp and lens, the surface of the beam was inspected to
detect the development of cracks. The width of each significant
crack was measured on formation and its position and extent was A
marked on the beam surface with a thin pencil line, together
with the value of the load which was written at the two extrem-
ities of the crack. Subsequent growth was similarly monitored
at later load increments.
After collapse, the final crack pattern was recorded
in a sketch and by photography. The beam was then removed from
the test rig for storage for a minimum of five weeks, during
which time the test data was processed.

CHAPTERFOUR
LIGHTWEIGHT CONCRETE DEEP BEAMS WITH OPENINGS: PILOT STUDY
4.1 TEST PROGRAMME
4.2 TEST RESULTS
4.2.1 Crack patterns and modes of failure
4.2.2 Crack widths and deflection
4.2.3 Ultimate loads
4.3 GENERAL COMMENTS

if If
CHAPTERF0UR
LIGHTWEIGHT CONCRETE DEEP BEAMS WITH OPENINGS: PILOT STUDY
4.1 TEST PROGRAbüfE I
The test specimens consisted of 24 simply supported
deep beams (Fig. 4.1 and Table 4.. 1) of span L 1500 mm, overall
depth D 750 mm and width (thickness) b 100 mm. Two clear
shear spans x were used, giving x/D ratios of 0.4 and 0.25
respectively. The span/depth ratio L/D was kept constant
at 2, because it is believed 31 that the x/D ratio is a more
important parameter than the L/D ratio.
The test beams were divided into two groups: Group
0 beams had no web reinforcement, whilst Group M beams had
a rectangular-mesh web reinforcement of 6 mm diameter de-
formed bars of 425 N/mm2 yield stress, giving a total web
steel ratio of 0.0048 (0.0020 vertical and 0.0028 horizontal).
The longitudinal tension reinforcement consisted of one 20 mm
diameter deformed bar of 430 N/mm2 yield stress, anchored to
steel blocks at the ends. Reinforcement cages were used at
the support and loading points (Fig. 4.1) to avoid local
crushings which had been observed at these places in a pre-
vious investigation of beams without openings 31. Lytag
sintered fly-ash lightweight aggregates were used in concrete
making; details of concrete strengths are given in Table (4.1).
All the web openings were rectangular and, in the
Group M beams, each opening was trimmed with one loop of 6 mm

diameter deformed bar (Fig. 4.1: Note 2 (ii)). The positions
and sizes of the openings are indicated by reference numbers,
which range from 0 to 13 and which are explained in Fig. (4.2).
The beams were tested under static two-point loading
as shown in Fig. (4.1).
The general experimental details have been given in
Chapter 3.
4.2 TEST RESULTS
4.2.1 Crack patterns and modes of failure.
The crack patterns at failure of all the beams are
shown in Fig. (4.3), where the beam notation is as explained
in the footnote to Table (4.1). The circled numbers indicate
the sequence in which the cracks were observed. and the other
figures, giving the load in 10 kN units, mark the extent of
cracking at a particular load interval. (Note: the vertical
steel supports seen at each end of a beam (Fig. 4.3) served
only to support the beam laterally during test preparations -
see Chapter 3.6).
A study of the crack patterns revealed that the
crack patterns and modes of failure depended mainly on the
extent to which the opening intercepted a note ional 'load-
path' joining the loadbearing blocks at the support and load-
ing point (Fig. 4.4), and that the size, shape and position
of an opening were significant only in so far as these
affected the extent and location of such an interception.
Where an opening was reasonably clear of the above-mentioned
'load-path' the crack pattern and mode of failure were

46.
essentially those of a comparable beam without openings.
For example, Beams 11-0.4/5, M-0.4/11,0-0.4/5,0-0.25/51,
which had openings, all collapsed following the formation
and propagation of diagonal cracks, which ultimately caused
the beams to be split into two approximately along a line
7 joining the inside and outside edges of the loadbearing
blocks at the support and loading point respectively. The
failure mode, designated Mode 1, is shown diagrammatically
in Fig. (4.5a). Previous work 27,28 has demonstrated that
this failure mode is typical of solid top-load deep beams
containing little or ineffective arrangements of web rein-
forcement.
Where an opening intercepted the load path as
shown in Fig. (4.4), the general sequence of behaviour was
as follows: -
(a) The first cracks to form were those at the
beam soffit and at the corners A and C of the opening (Fig.
4.4: cracks 1 and 2), which were being opened by the applied
load. Corners B and D which were being closed by the applied
load remained intact at this stage.
(b) As the load was increased the corner cracks 1
and 2 became wider and propagated rapidly towards-the load
bearing blocks. Other cracks might form in the flexural
region, for example crack 7. More important was the possible
formation of crack 5, which initiated from the vertical edge
of the beam, and crack 6, which initiated from the top surface
of the beam, as these cracks could influence later behaviour.

47.
(c) Upon further increase in loading the diagonal
cracks 8 and (or) 9 would appear. These were the dangerous
cracks because they either caused the immediate collapse of
the beam or led to its eventual failure; for this reason
cracks 8 and 9 were referred to respectively as the 'critical
lower diagonal crack' and the 'critical upper diagonal crack'.
These critical diagonal cracks possessed two distinctive
properties: (1) They usually formed with a definite noise
and (2) they initiated not from the opening nor from the load-
bearing blocks regions, but from the region between the open-
ing and the bearing blocks where subsequently the width of
the crack was at a maximum. These two properties had prev-
iously been observed to be characteristic of the critical
diagonal cracking in deep beams without openings 27928,32
and
this provided evidence that the formation of the critical
lower and upper diagonal cracks in the present beams was due
to the same cause as that of the diagonal cracks in the pre-
vious beams without openings.
(d) The final increment in loading caused collapse
in either of two distinct modes. In the first, which is
designated Mode 2 (Fig. 4.5b), the propagation of the critical
upper diagonal crack or the sudden appearance of a new upper
diagonal crack completely split the chord above the opening,
along a line joining the outside edge of the bearing-block
at the loading point to the outside top corner of the opening.
Similar simultaneous failure of the lower chord or the widen-
ing of an existing crack resulted in the beam being split into
two over its full height. In the second failure mode, desig-
nated Mode 3 (Fig. 4.5c), diagonal cracking in the chord above

48.
the opening did not occur and collapse occurred as a result
of the lower critical diagonal crack splitting the lower
chord into two, whilst that portion of the beam outside the
opening deformed plastically with hinges at the head of
cracks 1 and 5 (or possibly 6) (Fig. 4.4).
Typical examples of those beams which failed in Mode
2 were Beams M-0.4/3, M-0.4/8 and 11-0.4/12, and in Mode 3,
Beams M-0.4/9, M-0.4/13,0 0.4/4 and 0-0.. 25/4 (Fig. 4.3).
4.2.2 Crack widths and deflection
The maximum crack widths of the beams are shown in
Fig. (4.6), where the beam notation is as explained in the
footnote to Table (4.1). The maximum crack width in each
beam was generally recorded across a corner crack close by
the opening. An illustrative example of the behaviour of
crack widths under increasing load is given in Fig. (4.7),
which depicts the behaviour observed in Beam 11-0.4/4. The
flexural cracks in the central region of the beam were rarely
found to exceed 0.2 mm, whilst the corner cracks frequently
grew to exceed 1.0 mm before the instant of collapse. At
collapse, the critical diagonal cracks became the widest
and the corner cracks frequently closed up.
It was found that each group of beams could be
divided into sub-groups according to the maximum crack widths.
For example, the Group M beams in Fig. (4.6a) could be divided
into:
Sub-group Ni: comprising beams 14-0.4/O, M-0.4/1,
M-0.4/5 and M-O. 4/11,

49.
Sub-group M2: comprising Beams M-0.4/12, M-0.4/8,
M-0.4/4, M-0.4/3 and M-0.4/2,
and
Sub-group 113: comprising Beams M-0.4/13,11-0.4/10,
M-O. 4/9 and M-0.4/6.
Maximum crack widths were smallest in sub-group M1,
in which the beams either had no web openings or had openings
which were reasonably clear of the 'load path'; they were
widest in sub-group M3, in which the openings seriously
interrupted the 'load path'. An examination of Fig. (4.6a)
in conjunction with Table (4.2) shows further that openings
which resulted in low ultimate loads also resulted in large
maximum crack widths.
A study of Fig. (4.6b) shows that the above observa-
tions on the effects of the openings applied equally to the
beams in Group 0, which had no web reinforcement. A com-
parison of the crack widths in Fig. (4.6a) with those in the
top part of Fig. (4.6b) shows that, in beams having the same
type of openings, the web reinforcement was highly effective
in controlling maximum crack widths. This may be demonstrated
further by a comparison of Figs. (4.7) and (4.8), which depict
the behaviour under increasing load of Beams 11-0.4/4 and
0-O. 4/4 respectively. It is evident that, whilst the web
reinforcement predictably had little effect on the load at
which the corner cracks appeared, significant control was
subsequently exercised over the width of the corner cracks
and also as a consequence over the width of the horizontal
edge cracks.
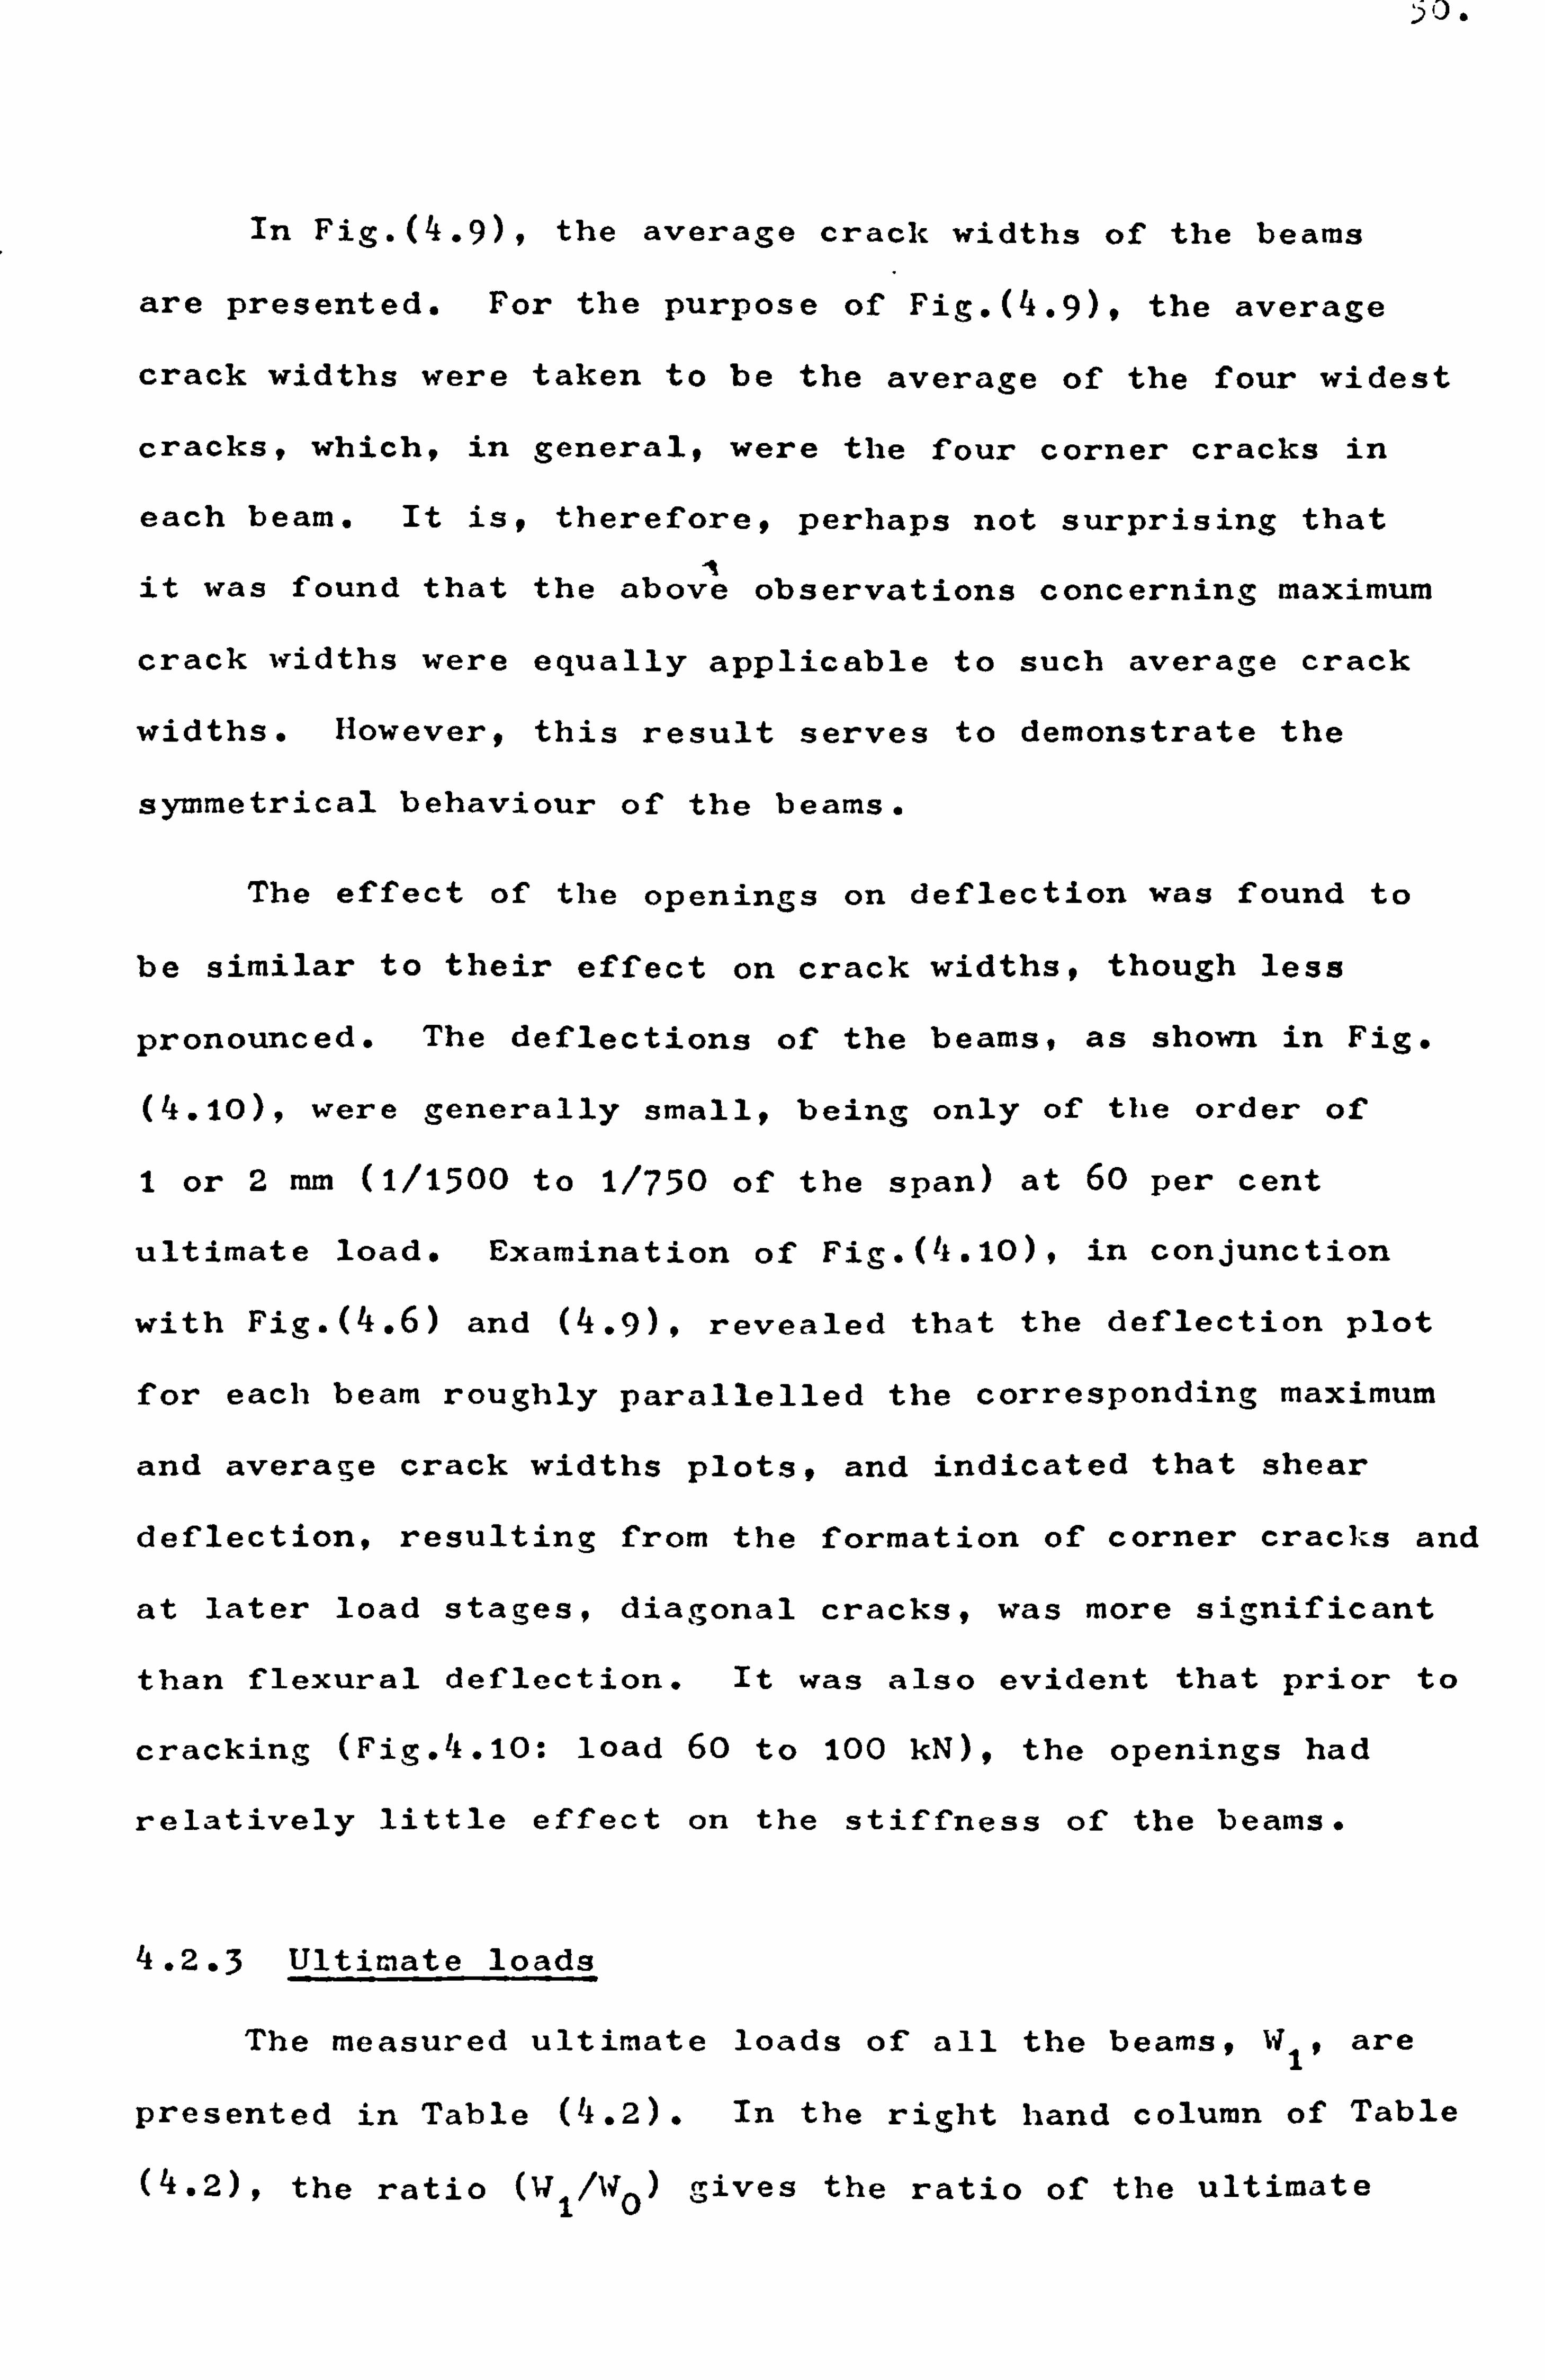
)O.
In Fig. (4.9), the average crack widths of the beams
are presented. For the purpose of Fig. (4.9), the average
crack widths were taken to be the average of the four widest
cracks, which, in general, were the four corner cracks in
each beam. It is, therefore, perhaps not surprising that
it was found that the above observations concerning maximum
crack widths were equally applicable to such average crack
widths. However, this result serves to demonstrate the
symmetrical behaviour of the beams.
The effect of the openings on deflection was found to
be similar to their effect on crack widths, though less
pronounced. The deflections of the beams, as shown in Fig.
(4.10), were generally small, being only of the order of
1 or 2 mm (1/1500 to 1/750 of the span) at 60 per cent
ultimate load. Examination of Fig. (4.10), in conjunction
with Fig. (4.6) and (4.9), revealed that the deflection plot
for each beam roughly parallelled the corresponding maximum
and average crack widths plots, and indicated that shear
deflection, resulting from the formation of corner cracks and
at later load stages, diagonal cracks, was more significant
than flexural deflection. It was also evident that prior to
cracking (Fig. 4.10: load 60 to 100 kN), the openings had
relatively little effect on the stiffness of the beams.
4.2.3 Ultimate loads
The measured ultimate loads of all the beams, W1, are
presented in Table ('k. 2). In the right hand column of Table
(4.2), the ratio (U1/1i0) gives the ratio of the ultimate
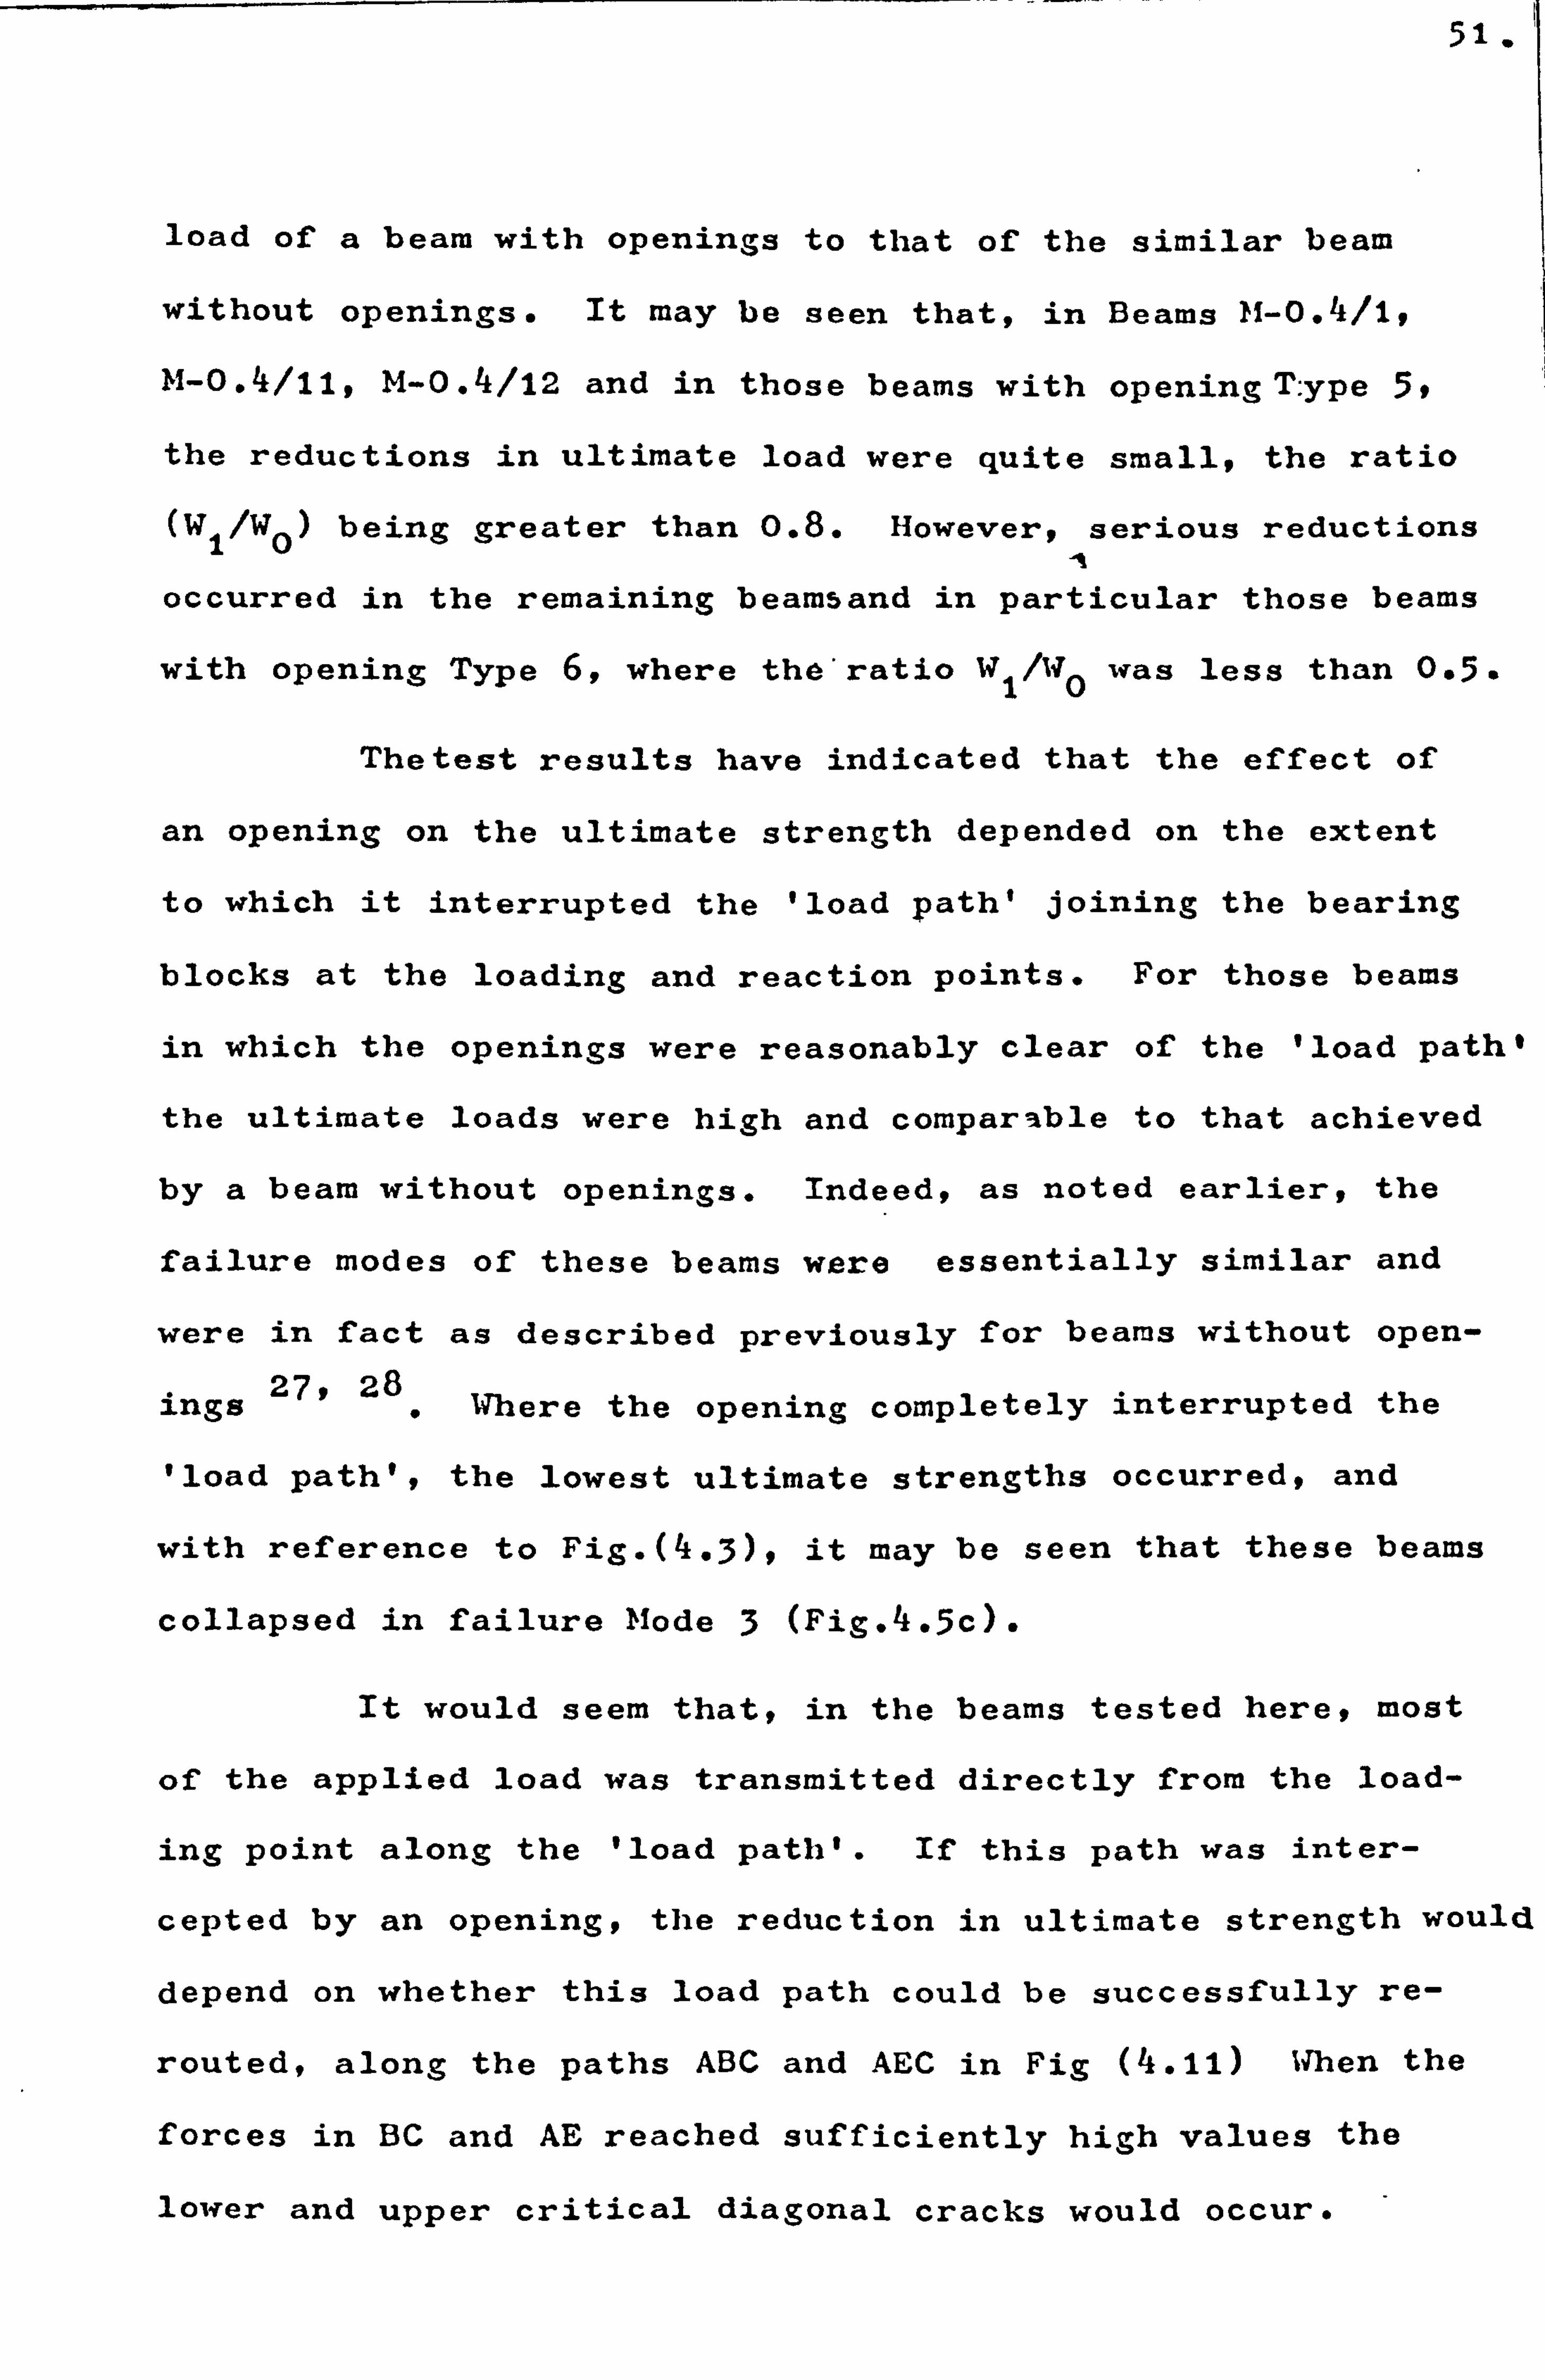
'I 51 .
load of a beam with openings to that of the similar beam
without openings. It may be seen that, in Beams }1-0.4/1,
M-0.4/11, M-0.4/12 and in those beams with opening Type 5,
the reductions in ultimate load were quite small, the ratio
(W1/WO) being greater than 0.8. However, serious reductions
occurred in the remaining beamsand in particular those beams
with opening Type 6, where the'ratio W1/W0 was less than 0.5.
Thetest results have indicated that the effect of
an opening on the ultimate strength depended on the extent
to which it interrupted the 'load path' joining the bearing
blocks at the loading and reaction points. For those beams
in which the openings were reasonably clear of the 'load path'
the ultimate loads were high and comparable to that achieved
by a beam without openings. Indeed, as noted earlier, the
failure modes of these beams were essentially similar and
were in fact as described previously for beams without open-
ings 27' 28. Where the opening completely interrupted the
'load path', the lowest ultimate strengths occurred, and
with reference to Fig. (4.3), it may be seen that these beams
collapsed in failure Mode 3 (Fig. 4.5c).
occurred in the remaining beamsand in particular those beams
with opening Type 6, where the'ratio W1/WO was less than 0.5.
Thetest results have indicated that the effect of
It would seem that, in the beams tested here, most
of the applied load was transmitted directly from the load-
ing point along the 'load path'. If this path was inter-
cepted by an opening, the reduction in ultimate strength would
depend on whether this load path could be successfully re-
routed, along the paths ABC and AEC in Fig (4.11) When the
forces in BC and AE reached sufficiently high values the
lower and upper critical diagonal cracks would occur.

52.
For a given applied load the forces in AE and BC depended on
the angles which were made with the horizontal, i. e., the
angles and 0 in Fig. (4.11), which, in turn, depended on
the size and location of the opening. It is, therefore,
reasonable to expect the ultimate load carrying capacity of
the beam to depend on the locations of corners B and E of the
opening. Table (4.2) shows that, where the locations were
such that the angles 0 and 0ý were little different from the
inclination of the critical diagonal crack of a beam without
openings, the ultimate load was high; for example, Beam
M-0.4/12 (520 kN). The lower ultimate loads in Table (4.2)
were recorded for those beams in which an upper diagonal
crack did not occur. [lith reference to Fig. (4.11), it may
be seen that the upper path AEC would be comparatively in-
effective, because a substantial tensile force EE would be
required except when the angle 0d between AE and EE was large.
In these beams the capacity was mainly dependent on the effect-
iveness of the lower path ABC, and when the 'strut' BC failed
as a result of the propagation of the lower critical diagonal
crack collapse occurred by Node 3 (Fig. 4.5).
The amount of web reinforcement provided in Group 11
beams was found to have an effect on the ultimate strength
of only certain beams. Comparison of the ultimate loads of
the Group M beams with similar beams in Group 0 (Table 4.2)
shows that where the beams were without openings or where the
openings were reasonably clear of the 'load-path' (as in Beams
M-0.4/5 and 0-0.4/5 for example) the web reinforcement had
little effect on ultimate strengths. However, where the

53.
openings intercepted the 'load path' (as in Beam M-0.4/6
and 0-0.4/6) the effect of the web reinforcement was to
significantly increase the ultimate strength. In beams
such as M-0.4/6 the lower path was clearly not highly effect-
ive (Fig. 4.3): the effect of the web reinforcement was there-
fore to provide a horizontal tensile capacity along EE , and
increase the capacity of the upper path and hence the ultimate
capacity of the beam. Again, comparison of the ultimate loads
of Beam M-0.4/4 (Table 4.2: 450 kN) and Beam 0-0.4/4 (Table
4.2: 340 kN) shows a similar result, and with reference to
Fig. (4.3) it may also be seen that the web reinforcement
caused a change in the failure mode. Hence, it seemed likely
that the effects of web reinforcement could be more important
in deep beams with openings than in deep beams without. How-
ever, the type and amount of reinforcement provided had little
effect on the growth of the critical diagonal cracks, which
were the prime cause of collapse in all three failure modes
(Fig. 4.5). Therefore, on the basis of the pilot test results
it was concluded that, in general, the web reinforcement
provided had little effect on ultimate strengths.
4.3 GENERAL COMMENTS
It is noted that discussions of the experimental
results of the pilot tests have also been presented else-
where 35,
and that certain of the deductions then reported 35
have since been developed in the light of further testing.
Further analysis of the results of pilot tests is therefore
deferred, here, until after the presentation of the results
of the follow-up tests in both lightweight concrete (Chapter 5)

54.
and normal weight concrete (Chapter 6), where in Chapter
7a structural idealization of deep beams with openings
is argued from a basis of all the test data.
However, it would be useful and interesting to
illustrate the developing nature of the investigat4on and,
in what follows, a brief description of the previously
proposed method of analysis 35
and a list of the previously
reported conclusions 35 is given.
It was suggested that the following equations
offered a simple means of calculating the ultimate shear
strength of reinforced concrete deep beams with web openings: -
'ult = C1 `1 - 0.35 D) ft bD + C2>IA D sin2oc (4
. 1)
Ault = C1 ý1 - 0.35 k1X ) ft b k2 D+ C2 AD sin2ot (4.2)
k2D
in which the notation is as explained in Fig. (4.12).
Egn. (4.1) is the equation derived from the results
of earlier tests at Nottingham of deep beams without openings
(cf. Chapter 1.2.2.4). On the basis of the pilot test results,
it was argued that this equation could be used for estimating
the ultimate strength of deep beams, which had openings that
were clear of the 'load path' joining the loading point and
support. There an opening intercepted the load path, an
approximate estimate of the ultimate strength might then be
made using Eqn. (4.2), which was based on the proposition that
the lower load path ABC was the primary path and that the web
reinforcement in deep beams both with and without openings

55.
had similar functions. Hence, the first term of Egn. (4.1)
which estimates the concrete contribution was modified by
the factors kIx and k2 D to give the capacity of the lower
chord, whilst the second term, the reinforcement contribution,
was left unchanged. 7
The main conclusions from the test results were
then as follows: -
(i) The effect of an opening on the ultimate shear
strength depends primarily on the extent to which it inter-
cepts the 'load path' joining the load bearing blocks at the
loading point and the support reaction point and on the
location at which this interception occurs.
(ii) Where an opening is reasonably clear of the
'load path', the ultimate shear strength may be computed as
for a beam without openings using Egn. (4.1) above.
(iii) Where the opening intercepts the 'load path'
the ultimate shear strength may be calculated using Eqn. (4.2).
(iv) Web reinforcement of the type and amount pro-
vided can be effective in controlling crack widths but its
contribution to the ultimate strength is not as important.
(v) Trimming the openings with reinforcement loops
has no beneficial effect on ultimate shear strengths.

CHAPTERFIVE
LIGHTWEIGHT CONCRETE DEEP BEAMS WITH OPENINGS: FURTHER TESTS.
-A
5.1 INTRODUCTION
5.2 TEST PROGRANNE
5.3 TEST RESULTS
5.3.1 Crack Patterns and modes of failure
5.3.2 Crackwidths and deflection.
5.3.3 Ultimate loads.
56.
CHAPTERFIVE
LIGHTWEIGHT CONCRETE DEEP BEAMS WITH OPENINGS: FURTHER TESTS
5.1 INTRODUCTION
Since it was thought that the results and conclusions
of the pilot study had potential applications in deep beam design
where openings had to be provided for access or for services,
and since the design of such beams was not yet covered by the
major codes of practice, a further study including tests on 39
beams was carried out. The purpose of the tests was to provide
further data to establish the behaviour and failure modes of
deep beams with web openings, and in particular the tests had
four specific aims. The first aim was to check the validity of
Conclusion No. 1 of the pilot study (Chpt. 4.2.4), using a series
of beams in which the position and size of the openings were
systematically varied. Secondly, the pilot tests had shown
that in a deep beam with web openings, there could be two crit-
ical diagonal cracks (lower and upper) as against only one in a
deep beam without openings; therefore the mere inclusion of the
parameters k1 and k2 to modify Egn. (4.1) into Eqn. (4.2) needed
further examination, particularly as there was an ambiguity
regarding the value of a (Egn. 4.2) which depended on the dir-
ection assumed for the critical diagonal crack. Thirdly, the
type and amount of web steel used in the pilot study failed to
provide information on the function of such steel and hence
failed to provide guicblinesfor the proper design of the web
steel. Fourthly, Conclusion No-5 was unexpected and merited
confirmation.

57.
5.2. TEST PROGRAMME
The test specimens were designed to complement those
in the pilot study, and consisted of 39 simply supported
lightweight concrete deep beams (Fig. 5.1 and Table 5-1)-
Thirty-six of the beams, of which four were duplicate specimens
to test repeatability (see Beam notation; Table 5.1), were of
overall depth D 750 mm, width b 100 mm, with span lengths L of
1125 mm and 750 mm, giving L/D ratios of 1.5 and 1 respectively.
Similarly, two clear-shear span distances x were used, giving
x/D ratios of 0.3 and 0.2 respectively. The other three beams
(prefix WM; see Beam notation, Table 5.1)" were manufactured nn
from Imperial sized moulds, giving b 76 mm (3 ), D 762 mm (30 ),
n L 1524 mm (60 ), and L/D and x/D ratios of 2 and 0.4 respectively.
The test beams were divided into two groups: the Group
0 beams had no web reinforcement while the Group W beams in-
corporated seven special types of web reinforcement (Fig. 5.1;
Type W1 to W7) and a uniform orthogonal mesh type of reinforce-
ment (Fig. 5.1; Type IM). The seven special types of reinforce-
2 ment each consisted of 10 mm diameter deformed bars of 460 N/mm
yield strength and the web steel ratio " was as near as possible
constant at 1.2 per cent (Table 5.1) so that the weight of the
web steel in each of these beams was very nearly the same.
The Type WM reinforcement consisted of a mesh of 6 mm diameter
deformed bars in each face, giving a web steel ratio of 1.13
per cent (0.38% vertical and 0.75% horizontal); in addition,
beam prefixed WM contained a single loop in each face of 6 mm
" The web steel ratio Pweb was calculated as the ratio
(volume of steel)/(volume of concrete)

58.
diameter deformed bar around each opening. The main long-
itudinal steel in each beam consisted of one 20 mm diameter
deformed bar of 430 N/mm2 yield strength, anchored to external
steel blocks at the ends (Fig. 5.1). Lytag sintered fly-ash
lightweight aggregates were again used in concrete making;
details of the concrete strengths are given in Table (5.1).
The positions and sizes of. the web openings complemented
those in the pilot study, and are indicated by reference numbers
ranging from 0 to 18 as explained in Fig. (5.2). Briefly, in
openings referenced 0 to 16, the size of an opening is given by
al x by a2D, where the height factor a2 was kept constant at
0.2 but the breadth factor al varied by increments from 0.3 to
1.5. As illustrated clearly in Fig. (5.4). where the notation
is as explained in the footnote to Table (5.1), the centroids
of opening I to 10 were at mid-depth of the beam; those of
openings 11.12 and 13 were at 175 mm from the beam top. while
those of 14,15 and 16 at 175 mm from the beam soffit. Opening
reference number 17 was used in the next series of tests using
normal weight concrete specimens. Opening reference number 18
was located at the centre of the shear span at mid-depth. with
both ai and a2 equal to 0.25.
In the pilot study, all of the beams were tested under
two-point loading; in the present investigation 35 of the beams
were also tested this way. However. in practice the distributed
load condition is a common one for deep beams; and, as a crude
but convenient approximation for this condition, four-point top
loading (Fig. 5.3) was used for four of the beams, to give
some indication of whether the conclusions drawn from

59.
tests using two-point loading could be broadly applicable to
the uniformly distributed load condition.
5.3 TEST RESULTS
5.3.1 Crack patterns and modes of failure.
The crack patterns at-failure of the Group 0
beams without web reinforcement are shown in Fig. (5.4a) and
(5.4b).
The present tests broadly confirmed the observat-
ions recorded in the pilot study and
further evidence to substantiate the
effect of an opening on the behavioii:
dependent of the extent to which the
'load path' between the load bearing
and loading point.
in particular provided
observation that, the
r of a deep beam was mainly
opening intercepted the
blocks at the support
As in the pilot tests, the present tests have shown
that, where the opening was clear of the load path the failure
mode remained essentially that of a comparable solid deep beam:
a comparison of the crack patterns of beams 0-0.3/0,0-0.3/12
and 0-0.3/14 clearly shows that in each beam the failure plane
was defined by the positions of the load bearing blocks at the
support and loading point and was unaffected by the presence
of an opening (cf. Chapter 4: Fig. 4,5a; failure Mode 1). Where
an opening intercepted the load path the typical sequence of
crack formation was again basically that described in the pilot
tests, but from a study of the crack patterns at failure of
the beams in the present tests, clear trends in ultimate be-

60.
haviour now became obvious. Examination of the crack patterns
of Beams 0-0.3/1,0-0.3/2,0-0.3/3 and 0-0.3/4 (Fig-5.4a),
shows that as the horizontal dimension of the opening was
increased, effecting an increased interception to the load
path, the diagonal failure planes which occurred in the chords
above and below the opening were consistently defined by the
corners of the opening, until in Beam 0-0.3/4 the upper failure
plane ceased to occur. It is therefore evident that failure
Mode 2, which was described in Chapter 4 and of which Beam
0-0.3/2 (Fig. 5.4) is a typical example, would occur only in
those beams - without web reinforcement - in which the opening
intercepted the load path from the interior of the beam: that
is, for large values of angle 00 (Fig. 4.11). In the majority
of the beams the failure mode was found to be Mode 3 (Chapter
4: Fig. 4.5) and it occurred not only in those beams in which
the opening completely intercepted the load path, for example,
beams with openings Types 4,13*, 16 (Fig. 5.2), but also for
any beam in which the opening encroached into the load path
from the support side of the beam, as for example, in Beam
0-0.3/7 (Fig. 5. "). Hence, the crack patterns of Beams 0-0.3/7,
0-0.3/8,0-0.3/9,0-0.3/4 and 0-0.3/10 were sensibly similar
and were unaffected by changes in the size of the opening.
In Fig. (5.4d) the crack patterns at failure of
Beams 0-0.3/28,0-0.3/38,0-0.3/48 and 0-0.3/58 are presented:
these beams were duplicates of Beams 0-0.3/2,0-0.3/3 etc. A
comparison of the crack patterns recorded for the two sets of
beams would not immediately suggest any great differences in
behaviour. However, it was found that the ultimate loads of
the beams in a similar pair could differ by an amount which

6t.
seemed greater than that which might typically be the result
of the effects of normal experimental scatter and the small
measured differences in concrete strengths (Table 5.1): for
example, the difference in ultimate load between Beam 0-0.3/4
(Table (5.2); 260 kN) and Beam 0-0.3/4R (215 kN) would have
been more reasonably expected. In the other pairs of beams the
difference in ultimate load could be as large as 50% (Table 5.2).
In beams without web reinforcement it would seem that the regions
above and below the openings are very susceptible to diagonal
cracking, and that if a diagonal crack occurred at an early load,
the ultimate load would be reduced. The results would indicate
that the formation of the early corner cracks had an influence
on the diagonal cracking load: in beams where the lower corner
crack (Fig. 4.4 crack 2) propagated sufficiently rapidly, the
critical lower diagonal crack (Fig. 4.4: crack 8) would form at
a very late stage, or might not form until the collapse load
was reached. This happened for example in Beam 0-0.3/2 as com-
pared with beam 0-0.3/2R. Also, the early formation of an exten-
sive flexural-shear crack near to the support reaction point
(Fig. 4.4: crack 4) was likely to inhibit the formation of the
critical lower diagonal crack and hence increase the ultimate
strength of the beam. This happened. for example, in Beam
0-0.3/5R as compared with 0-0.3/5.
As pointed out earlier, the pilot tests did not show
how the web reinforcement should be most effectively arranged.
The present tests have yielded useful information on this
point. Fig. (5.4c) shows the crack patterns at failure of the
Group W beams which incorporated the seven types of web rein-
forcement as described in Fig. (5.1). The sequence of early

62.
behaviour in these beams was in general similar, and was
comparable to Beam 0-0.3/4, which had no web reinforcement;
that is, the formation of cracks at the corners (Fig. 4.4
cracks 1 and 2) was followed by cracks 3,4 and 7 (Fig. 4.4).
The effect of the different types of web reinforce-
ment on later behaviour and on the failure modes will be more
fully discussed in the section on 'Ultimate Loads'. Suffice
to says here, that where the web reinforcement was wholly
below the opening (as in Beam W1-0.3/4) or wholly above the
opening (as in Beam W2-0.3/4) the consequent failure modes
resulted in only moderate increases in ultimate load. The
trimming of an opening by surrounding it with several loops
of reinforcement (Beam 'i5-0.3/4) only served to locally control
the propagation of the corner cracks without being able to
control that of the critical diagonal cracks - in fact such
trimming resulted in a rather low ultimate strength and the
failure mode was little different from that of a beam with no
web reinforcement. However, the inclined web reinforcement in
Beam W4-0.3/4, and particularly that in Beam W6-0.3/4, most
effectively restrained the width of the critical diagonal
cracks so that they remained narrow up to the instant of
collapse. The crack pattern for Beam 116-0.3/4 clearly shows
that the collapse was due to failure of that portion of the
beam outside the support reaction point; also, there were
fairly wide flexural cracks near the midspan. This is evidence
that the inclined web reinforcement effectively protected the
diagonal cracking region above and below the web opening so
that the final failure of the beam had to occur by a different
mode, and the result was an outstandingly high ultimate load.

63.
The crack patterns at failure of the beams with
the commonly used orthogonal mesh type reinforcement are
shown diagrammatically in Fig. (5.4e). (Note: the photographic
record of these beans was unfortunately destroyed in processing).
The failure mode of the beam without openings was typical of
similar beams which have been reported elsewhere 28. The crack
patterns of the two beams with openings were nearly identical
and again it is clear that the bops of reinforcement trimming
the openings in Beam WM - 0.4/4 had little effect on ultimate
behaviour. Fiore important, it is apparent from the failure
mode that the reinforcement had only moderate effect on the
control of the upper and lower critical diagonal cracks.
5.3.2 Crack widths and deflection
The maximum crackwidths for the Group 0 beams are
presented in Fig. (5.5) and the results confirm the conclusion
drawn from the pilot tests, namely, that the maximum crack-
widths increased with the extent to which the web opening
intercepted the 'load path'. For example, Fig. (5.5a) illus-
trates clearly how the progressive increases in the extent of
such interception led to progressive increases in maximum
crack width.
Some new observations are presented in Fig. (5.5c),
which shows the crack widths of the four beams with L/D: 1
and x/D z 0.2: Beams 0-0.2/0,0-0.2/4,0-0.2/13 and 0-0.2/16.
It can be seen that opening No. 16 led to the widest crack width,
No. 4 the second widest, followed by No. 13 and No. O. This
agreed with the results from Beams 0-0.3/16,0-0.3/4,0-0.3/13

64.
and 0-0.3/0, in which L/D = 1.5 and x/D = 0.3. In the pilot
study only a single L/D ratio of 2 was used and it was not
then possible to say whether the conclusion referred to above
would not be affected by a change in the L/D ratio. The
present tests have shown that it is unlikely to be so affected. I
The pilot tests and the present tests together covered L/D
ratios of 1,1.5 and 2; in deep'beams the L/D ratio usually
lies within the range 1 to 3.
Fig. (5.5d) shows the effects of different types of
web reinforcement on maximum crack widths. The crack width
curves are drawn against a grid mesh of 0.3 mm unit width.
This represents a limit state for maximum crack-width commonly
accepted in design, and it can be seen that this limiting width
was quickly exceeded in Beams W1-0.3/4, W2-0.3/4 and, particu-
larly, in Beam W5-0.3/4 where the web steel was used to surround
the opening. The inclined web reinforcement in Beam W6-0.3/4,
however, not only substantially increased the ultimate strength
but also effectively restrained the crack width so that the
0.3 mm limit was not exceeded until the applied load reached
580 kN, and, as was noted earlier, the widest cracks were not
diagonal cracks but flexural cracks at mid-span. The combined
vertical horizontal system in W7-0.3/4 was also effective; the
vertical bars restrained the lower and upper diagonal cracks
(Fig. 4.4: crack 8 and 9), while the horizontal bars restrained
the corner cracks (Fig. 4.4: crack 1 and 2). Similarly, the
combined inclined-horizontal system in Beam 4-0.3/4 was also
effective.
Fig. (5.5e) also shows the four beams with suffix A

"15
which were tested under four-point loading to simulate a
uniformly distributed load condition; apart from the
difference in lo-tding, Beam i/(A) was identical to Beam
111-0.3/4, Beam : 15(A) to Beam w3-0-3/4, and so on. The
figure shows that the behaviour of Beam W7(. t) and that of
Beam 'T7-0.3/4, were remarkably similar; this was true of
Beams :: 4(A) and t: 4-O. 3/4, and 'also of W3(A) and W3-0-3/4-
Beams W1(.. ) and WI-0.3/4 formed the exceptional pair and
hence it would seem from the other results, that the effect
of loading condition becomes less important for beams with
effective arran1ements of reinforcement. Judging from the
results of the latter mentioned beams, it may be deduced that,
in fact, as far as crack widths were concerned the four-point
loading syste^i was a less severe form of loading, possibly as
a result of the better distribution of the load obtained
around the opening.
The maximum crack widths of the three beams contain-
ing the uniform mesh reinforcement (Fig-5.1 Type 14M) are
shown in rig. (5.5f). In the pilot study it was found that
the amount of mesh reinforcement used in the pilot test beans
(Table 4.1; .
48,. ) was insufficient to control the width of
diagonal cracks. The present tests have shown that at least
1.0% web reinforce"hent is required to make any significant
effect. For example, in Dean )1-0.14/0 the 0.3 mm limit on
crack width was exceeded at 50% ultimate load (Fig. 4.6a)
whereas in B- ým U -M-0.4110 the limit was not exceeded until 85%
ultimate lo-id. The tesh reinforcement, however, was not so
effective in controlling the crack widths in the beams with
oi'enin. s (Fit. 5.5f: Beams '"01 - 0.4/18 and WM-0.4/18): the
limit of 0.3 mm was exceeded at 600,: ultimate load.

66.
The behaviour of the beams as measured by central
deflection is illustrated in Fig-(5.6). As in the pilot study
the effect of openings on deflection was found to be similar
to their effect on crack widths, and a comparison of Fig. (5.5)
with Fig. (5.6) shows again that the deflections were a result I
primarily of the effects of cracking within the shear spans.
Examination of Fig. (5.6d) showed the effect of the different
types of reinforcement on deflection and it was noticeable that
the deflection plot for Beam W6-0.3/4, which had inclined web
reinforcement, was particularly linear up to 650 kN: this
provided a further indication of the ability of this type of
. reinforcement to control crack widths within the shear span.
After approximately 650 kN, the flexural crack widths and the
deflection resulting from flexural beam behaviour, increased
more rapidly until collapse of the beam.
5.2.3 Ultimate Loads
The measured ultimate loads of all of the beams
are presented in Table (5.2). The results of the Group 0
beams broadly confirmed the deduction made from the pilot test
results; namely, that the effect of a web opening on the
ultimate strength of a deep beam depends primarily on where and
by how much it intercepts the 'load path' joining the load
bearing blocks at the loading point and the support reaction
point.
, here the opening was clear of the load path, for
example, in Beams 0-0.3/12 and 0-0.3/14 (Fig-5.4b), the
ultimate loads (Table 5.2; 560 kN each) were comparable to that

67.
of the beam without openings, Beam 0-0.3/0 (595 kN). A
close examination of the crack patterns at failure of these
three beams shows that the openings were located either in
regions which remained uncracked in the solid beam (as in
the case of opening No. 12), or in regions where inclined
flexure-shear cracks originated from the beam soffit (as in
the case of o; Ening No. 14). The only significant effect
opening No. 14 had on the crack pattern, was to reduce the
load at which the inclined flexure-shear cracking developed;
that is the corner cracks numbered I and 3 of Beam 0-0.3/14
(Fig-5.4) had a similar secondary effect on the ultimate load
and behaviour as the inclined flexure-shear crack numbered 6
of the solid beam, 0-0.3/0. The results of numerous previous
tests 11,12
of solid deep beams have indicated that this type
of cracking has indeed little effect on ultimate strength,
unless, the proportion of main steel is so small that as a
result, a flexure-shear type failure mode occurs similar to
24 that reported by de Paiva .
Where the opening intercepted the load path, the
crack pattern typical of a solid deep beam was no longer
obtained and as a result significant reductions in ultimate
load were then recorded. A study of the drack patterns at
failure (Fig. 5.! ) in conjunction with the ultimate loads
(Table 5.2) showed that the amount of interception required
to cause some reduction was quite small. Fig. (5.7a), in
which the ultimate loads are shown against the opening breadth
factor al (Fig-5.2), gives an idea of the way in which the
ultimate load reduced as the opening size increased, from

68.
opening type 1 through opening types 2,3,4,5 to 6 (Fig-5.4),
to effect a greater interception of the load path. Similarly,
opening type 7 through types 8,9,4 to type 10, which were
increasing in breadth from the support side'of the beam (Fig.
5.4), caused progressive reductions in the ultimate loads as
illustrated in Fig. (5.7b). It is worth mentioning that these
figures serve only to indicate the trends: indeed, the post-
cracking behaviour of the beams was so complex that it would
be difficult to isolate uniquely the particular effect of
particular geometrical parameters on the ultimate load. However.
a simple structural idealization was found which did offer a
useful understanding and visualization of the load transfer
mechanism in deep beams with openings and gave reasonable
predictions of their ultimate strengths. The idealization
will be explained in Chapter 7 after the results of all the
tests have been presented; as mentioned in Chapter 4, the
idealization was a development of the method of anal ysis
tentatively proposed on the basis of the results of the pilot
tests.
The tests on the Group 0 beams provided useful in-
formation on the behaviour of deep beams with web openings in
circumstances that were not complicated by the effects of web
reinforcement. The Group W beams, which contained web rein-
forcement. yielded further complementary information and de-
monstrated that the effects of web reinforcement on ultimate
strength could be substantial. For example, the inclined type
web reinforcement increased the ultimate strength of Beam
1; 6-0.3/'1 to 825 kN (Table 5.2), as compared with the ultimate
strength of 260 kN for Beam 0-0.3/4 which had no web reinforce- ment.

69.
As has been mentioned earlier, the
without web reinforcement have shown that
vulq , 3ýerable regions to be protected by web
one above and one below the opening. The
loads in Table (5.2), studied in conjunct
steel details in Fig. (5.1), and the crack
(5.4c), show that:
tests on beans
there are two
reinforcement:
measured ultimate
ion with the web
patterns in Fig.
(a) '.. 'here the web reinforcement protected only the lower
region (Fig-5.1: Type ºJ1) or only the upper region (Type W2)
or where it was used to trim the opening (Type W5), the
ultimate loads were low - Table (5.2): Seam W1-0.3/4 (100 kN),
Beam : T2-0.3/4 (490 kN) ; Beam 115-0.3/4 (370 kN).
(b) ý'here the reinforcement protected both the upper and
lower regions, as in Oeams W4-0.3/4 (660 kN), '.: 6-0.3/4
(825 kN) and W7-0.3/4 (530 kN), the ultimate loads were much
higher - higher in fact than that of the solid beam 0-0.3/0
(595 W.
(c) '. eb steel was most efficiently used in the form of Type
: r6 inclined web reinforcement. The Group W beams each had
the same amount of web steel, but the ultimate load of Beam
'-: 6-0.3/4 was much higher than those of the others.
(d) The failure of Beams '"16-0.3/4 and 1: 4-0.3/4 was the result
of tensile failure of the concrete outside the shear span and
hence the shear capacity of the web reinforcement was not in
fact achieved. (Pig. (5.3) shows the result of maintaining
the applied load after the onset of serious breakdown in the
re, ion above the support and it can be seen that the failure
was a result of splitting along the line of anchorage hooks

70.
of the reinforcement. In contrast, Fig. (5.9) shows the
effect of maintaining the applied load on Beam 177-0.3/4 and
it is clear that the failure was within the shear span and
was a consequence of loss of anchorage to the vertical bars
of the reinforcement system. Fig. (5.10) of Beam 115-0.3/4
shows that the web reinforcement Type W5 was totally in-
effective because of its inability to distribute the load
into adjacent region of the beam, and the distortion of the
opening due to shear is clearly visible.
1
(e) The web reinforcement Type W3 effected a useful increase
in ultimate load mainly as a result of controlling the corner
cracks and hence changing the failure mode from Mode 3 to Mode
2 (Fig. 4.5).
(f) The effects of the loading condition, that is whether
two point or four point. were insignificant compared with the
effects of the relative positions of the openings and the
effects of web reinforcement. It would seem from the present
test results, that for a uniformly distributed load the
assumption of a statically equivalent two point loading system
would be a safe one.
(g) It was noted earlier that as a result of the susceptability
to diagonal : racking, the duplicate sets of beams without re-
inforcement had significant differences in the measured ultimate
load. Following on from (f) above, if it is tentatively
assumed that the difference in loading condition had very
little effect, then it would be seen by comparing the results
of any, Beam '. 14 (A) with [team 'J4-0.3/4, and so on (Table 5-2)9

71.
that the web reinforcement acted to produce much more
reliable and consistent results. This point is amplified
further by a comparison of the ultimate load of Beam WM-O. 4/4
and Beam 14711 - 0.4/4; as mentioned previously their ultimate
loads were identical.
I
(h) One final point concerning the effect of web reinforcement
on deep beams without openings. In the pilot study, as
mentioned previously, the amount of web reinforcement then
provided was found to have little effect on ultimate loads.
Beam WI-0.4/0 in the present tests and Beam M-0.4/0 of the
pilot study differed primarily in as much that the beam
thickness of the former beam was 25% less but contained
approximately 0.5% additional web reinforcement (Table 4.1
and 5.1). The ultimate load recorded for both beams being
the same would indicate that significant savings in concrete
costs and self weight might be gained by the provision of a
relatively snail, additional quantity of web reinforcement.
As will be seen in the next Chapter, the use of an inclined
arrangement of web reinforcement could result in much greater
benefits still.

C If APTERSIX
NOR}IAL WEIGHT CONCRETE DEEP BEANS WITH WEB OPENINGS
I
6.1 INTRODUCTION
6.2 TEST PROGRA}fl1E
6.3 TEST RESULTS
6.3.1 Crack patterns and modes of failure
6.3.2 Crack widths and deflection
6.3.3 Ultimate loads

72.
c 11 .1PTERSIX
NORMAL WEIGHT CONCRETE DEEP BEAMS WITH WEB OPENINGS
INTRODUCTION
A third test programme was carried out to invest-
irate the behaviour of normal weight reinforced concrete
deep beams with web openings and to determine the Zeneral
effectiveness of the inclined system of web reinforcement.
In studies of previous test results, significant
differences have been reported 27' 28 between the behaviour
of lightweight concrete and normal weight concrete deep beams.
However, in these previous studies the data available con-
sisted of r. ormal weight beams reinforced with glair. round
bars nd lightweight beams reinforced with deformed bars.
Hence, it is not clear whether the reported differences in
behaviour were actually due to concrete type or to reinforce-
ment type.
The effectiveness of an inclined arrangement of
web reinforcement in deep beams with web opening was demon-
strated in the lightweight deep beam tests reported earlier
in this thesis. Only a single type of opening was then
considered, and it was therefore desirable to test the be-
haviour of deep beans with inclined reinforcement, for a
number of different opening locations.
In this chapter the results of the tests on
normal weight concrete deep beams are presented, and whenever

73.
possible their performance is discussed in relation to the
lightweight test specimens.
6.2 TEST PROGRAM E
The test specimens were designed to complement
those used in the lightweight concrete test programmes, and
comprised 16 simply supported normal weight concrete deep
beams (Fig. 6.1 and Table 6.1) of overall depth D 750 mm and
width b 100 min. A single span length L of 1125 mm and a
single clear shear span length x of 225 mm were used, giving
L/D and x/D ratios of 1.5 and 0.3 respectively.
Nine of the tests specimens were repeats of nine
of the lightweight concrete beams. These beams are designated
as their lightweight twins but have been given an additional
prefix N to discriminate between the two types of concrete.
Hence, for example, Be-m NO-0.3/4 in normal weight concrete
- like Beam 0-0.3/4 in lightweight concrete - contained no
web reinforcement and opening reference No. 4 (Fig. 5.2). All
of the lightweight beams with the special types of web rein-
forcement (Fig. 5.1) were repeated together with the solid
beam and the beam mentioned above, both of which contained
no web reinforcement.
The other seven beams all contained the same in-
clined pattern of web reinforcement; one beam was a control
beam and had no openings, the others each contained openings
as shown in Fig. (6.2b) and explained in Fig. (5.2 ). The
weu reinforcenent in each of these beams consisted of 6 mm
diameter deformed bars of 425 N/mca2 yield stress, arranged

74.
in each face at 30° to the horizontal and at a uniform
horizontal spacing of 125 mm (Fig. 6.1: web reinforcement
type 6A). Reinforcement bars that were in line with the
openings were onmitted, so that the total web steel ratio
for each beam varied slightly and was in a range 0.0049
to 0.0065 (Table G. O.
Details of the concrete mix and other general
experimental details are given in Chapter 3. Details of
the concrete strengths for each beam are given in Table X6.1).
6.2 TEST RESULTS
6.2.1 Crack patterns and modes of failure.
The crack patterns at failure of all the normal
weight beams are presented in Fig. (6.2).
A comparison of the similar bea'is in normal weight
and lightweight concrete (Fig. 6.2a and $. 4a & c) showed that
the crack pattern and mode of failure were little affected
by concrete type - in fact the crack patterns of each pair
of similar beams were near identical. In general it was
found that the cracking in the normal weight beams occurred
at only slightly higher applied loads.
The crack patterns at failure of the series of
beams containing the type W6A inclined web reinforcement
(Fig. 6.2b) showed that the reinforcement provided was effect-
ive in controlling the propagation of the corner cracks (Fig.
4.4 crack types 1 and 2), so that the failure mode of each
beam was similar and was typically Mode 2 as described in

75.
Chapter 4 (Fig. 4.5). More important the web reinforcement
protected the vulnerable regions above and below the opening
and acted to control the width and propagation of the critical
diagonal cracks with the result that high ultimate loads were
achieved in all of the beams. It is clear from a comparison I
of the crack patterns at failure of Beams NW6-0.3/4 and
NW,; 6A-0.3/4 that the amount of Type ww6A reinforcement could
be increased to effectively prevent the diagonal failure mode.
In Beam 'ß'W6-0.3/4 the web steel ratio (Table 6.1) was 1.25%
compared to 0.47% in the latter mentioned beam and, as in
the case of the lightweight concrete specimens, collapse in
beams containing this greater quantity of inclined web rein-
forcement followed as a result of failure outside the shear
span.
A comparison of the crack patterns at failure of
the two solid beams N0-0.3/0 and : ß, 76A-0.3/0 revealed some
interesting information on the behaviour of deep beams with-
out openings. It has been argued recently that web rein-
forcement has only limited effect on the behaviour of deep
beams (CIRIt guide 9
1977). }however, the ovidence of these
two tests, which will be discussed more fully in the Section
on 'Ultimate Loads', would support results of previous
investi; ations 27, `B' 29,
which have reported the benefits
of inclined web reinforcement.
6.2.2 Crack wi(iths and deflections
It was found that the effect of web reinforcement
on the crack widths in normal weight concrete deep beams with
web openings %ras similar to that in the lightweight concrete

76.
specimens. It may be seen (Fig. 6.3a) that, of the special
types of reinforcement the inclined web reinforcement, Type
: d6 again, produced the most effective control over crack widths:
the 0.3 mm maximum crack width limit was not exceeded until
approximately 650 k; l and as in the similar lightweight beam
'of the previous tests the maximum crack width was again in
fact on a flexural crack. Lxamination of Fig. (5.5d) in con-
junction with Fig. (6.3a) showed that the difference in crack-
ing behaviour, between similar beams of lightweight and normal
weight concrete, was not significant: in general the light-
weight beams reached the 0.3 mm crack width slightly earlier
than the normal weight beans. This similarity between the
behaviour of the two types of concrete is evidence that the
effects of the reinforcement predominate.
The effectiveness of the Type W6A web reinforce-
went is demonstrated clearly in Fig. (6.3b). It is to be noted
that the 0.3 mm limit for each beam containing the smaller
openings was not exceeded for applied loads up to approximately
500 kN and in several of the beams the applied load at this
serviceability limit state of cracking was considerably
greater than the collapse load of the solid Beam NO-0-3/0-
As mentioned earlier, it is also clear that the amount of
web reinforcement provided is a major factor in controlling
beam behaviour: the performance of Seam N: r6-0.3/4 with 1.25%
inclined steel was far superior to Beam NW6A-0.3/4 with O. 47%
inclined web steel (Fig. 6.3b).
The effect of the inclined web reinforcement on
the behaviour of the solid beam NW6A-0.3/0 was found to be

77.
substantial. Vhereas in the similar beam without web
reinforcement, Beam NO-0.3/O, the crack width limit of
0.3 ixi was reached at 350 kN, in Beam W6. ß-0.3/0 containing
0.655 web steel the load at this serviceability limit state
of cracking was 1000 kN - an increase in load of over 200%.
In Fig. (6 . 1t) , the deflections recorded for the
beams are presented. generally, these resultsagain confirmed
the observations made in the lightweight concrete tests and
as before the deflection behaviour was found to reflect the
ability of each type of web reinforcement to control crack
widths in the shear spans.
6.2.3 Ultimate Loads
: he present normal weight concrete tests have
broadly shown that the effects of web openings on the ultimate
behaviour of deep beams is little affected by the type of
structural concrete used. A study of the measured ultimate
loads of the i: ormal weight beams containing opening ref. No. 4
(Table 6.2), made in conjunction with the web steel details
in Fig. (6.1) and the crack patterns in Fig. (6.2 ), resulted
in observations similar to those drawn previously from the
results of the tests on the comparable beams of lightweight
concrete (Chapter 5.3.3). (fence, it seer-is reasonable to
deduce that all the observations made from the results of
both the Filot tests and further tests (Chapters 4 and 5)
would be broadly applicable to normal weight reinforced
concrete deep beams.

78.
In general, from a comparison of the ultimate
loads of each pair of similar be_, ms (Tables 5.2 and 6.2)
it was found that the higher ultimate loads recorded for the
normal weight beams were not inconsistent with the higher
strength - as measured by the control cube and cylinders I
tests - of the normal weight concrete. An interesting
result was obtained by dividing-the ultimate loads of each
beam in each particular set of beans by the corresponding
solid beam without reinforcement: thus the ultimate load
of Beam NW1-0.314 was divided by that of Beam N0-0.3/0, and
Bean 111-0.3/4 by 0-0.3/0 and so on. In Table (6.3) it may
be seen that the result of this exercise is to produce two
sets of figures which are clearly comparable. This result
provided further evidence to suggest that the performance
of the reinforcement - as regards bond in particular - was
similar in both normal weight and lightweight reinforced
concrete deep beams.
The results of the series of beams containing the
same type of inclined web reinforcement provided some new
information on the behaviour of deep beams with web openings.
It was found that, by the provision of approximately 0.50:
(Table 6.1) of web reinforcement i's an inclined pattern, the
ultimate loads of deep beams containing openings in any of
a number of locations could achieve high ultimate loads.
For example, in Beam NWJ6A-0.3/15 the location of the opening
was such that the 'load path' joining the load bearing blocks
at the supports was intercepted ataposition c]oye to the
bean soffit. The results of the tests on lightweight beams

79.
have shown that such openings could drastically reduce the
strength of deep beams without effective systems of web
reinforcement. In contrast, Table (6.2) shows that due to
the web reinforcement the measured ultimate load of Beam
NW6A-0.3/15 was high; indeed, it was greater than that of A
the solid beam NO-0.3/0. Similarly all of the other beams,
with similarly sized openings and Type 116A web reinforce-
ment, recorded ultimate loads which were greater than the
measured capacity of the solid beam; and even Beam N. 16A-0.3/4,
which contained openings that completely intercepted the
'load path', obtained a load comparable to that of the
unreinforced solid deep beam (Table 6.3).
As mentioned earlier some reservations have been
expressed 9
over the ability of web reinforcement to increase
the strength of beams without openings. In the case of in-
clined web reinforcement, the present tests have shown by
the performance of Beam N"J6. ß-0.3/0, which contained 0.65%
inclined web steel, that the increase in ultimate load
could be in fact substantial: Table (6.2) shows that the
ultimate load of Beam NW6A-0.3/0 was 1215 kN compared with
695 kN for the similar beam without web reinforcement, Beam
\'0-0.3/0. In the tests on solid beams with little or no
web reinforcement reported herein (Chapter 4. Beams 21-0.4,10,
0-0.4/0.0-0.25/0; Chapter 5, beams 0-0.3/0,0-0.2/0; and
Chapter 6. Beam N0-0.3/O), shear failure occurred as a result
of the formation and progagation of a single critical dia-
goneAl crack, which at collapse split the beam into two.
However. in Beam N:: 6. ß-0.3/0 examination of the crack pattern

8o.
at failure (Fig. 6.2) shows that the web reinforcement acted
to control the propagation of the diagonal cracks such that
failure occurred as a result of a pure shearing action on
the 'strut'- like portion of the beam between two diagonal
cracks. This result would also suggest that, the apparent
crushing failure of this strut-like portion observed in
previous tests 24' 27, should not be construed as an axial comp-
pression failure of the web: indeed, the present tests of
beams with web openings and larger quantities of effective
web reinforcement have shown that such a compression failure
mode is unlikely to occur. In summary, therefore, the results
of the present tests have shown and confirmed that shear
failure in reinforced concrete deep beams both with and
without openings is essentially a diagonal splitting type
failure. which may be controlled - and even realistically
prevented - by the proper arrangement of the web steel.

CHAPTERSEVEN
A STRUCTURAL IDEALIZATION FOR DEEP BEAMS WITii WEB OPENINGS
7.1 THE STRUCTURAL. IDEALIZATION
7.2 GENERAL DISCUSSION

81.
CHAPTERSEVEN
A STRUCTURAL IDEALIZATION FOR DEEP BEAMS 61I111 WE© OPENINGS
7.1 THE STRUCTURAL IUEALIZ %TION
The arguments that follow are based on the sum total
of the evidence from all of the tests reported in Chapters
4,5 and 6. In summary, the tests, a total of 79 beams,
together covered: (a) span/depth ratios L/D of 1,1.5 and 2;
(b) clear-shear span/depth ratios x/D of 0.2,0.25,0.3 and 0.4;
(c) 13 combinations of the opening-size factors a1 and
a2 (Fig. 4.2 and Fig. 5.2); (d) 22 combinations of the
opening-location factors kI and k2; (e) 8 arrangements of web
reinforcement (Fig. 4.1, Fig. 5.1 and Fig. 6.1), (f) both normal
weight and lightweight concrete.
The ultimate shear strength of a deep beam may be
calculated using the structural idealization of Fig. (7.1),
which shows that the applied load is transmitted to the support
mainly by a 'lower path' ABC and partly by an'upper path' AEC.
The structural idealization suggests that the effectiveness of
the lower path should increase with the angle 0. whilst that
of the upper path with 0. Let us consider, for the time being, `
that the opening occurs at a fixed level, i. e., the dimensions
to k,, D and k2 D are fixed. Then. if 0 is kept constant by keep- 6.
ing the dimension kix constant, and 0 is progressively reduced
by increasing the dimension kix, it would be reasonable to
expect a progressive reduction in ultimate strength. Beams 0-
0.3/7 to 0-0.3/10(Fig. 5.4a) were designed to test this argument,
and the W1 values in Table (5.2)shows that ultimate loads were
indeed progressively red-iced: from ßt20 kN for Beam 0-0.3/7
`Tn

82.
through 380 kN, 280 kN, 260 kN, to 210 kN for Beam 0-0.3/10.
On the other hand in Beams 0-0.3/1 to 0-0.3/6 (Fis-5.4a), the
angle 0 was kept constant while 0 was progressively reduced;
again, the W1 valuesin Table (5.2) confirm that the general
trend was a reduction in the ultimate load.
In the absence of the opening, the upper and lower
paths in Fig. (7.1) become one, which is the 'natural load path'
joining the loading and reaction points; for such a solid beam,
it has been shown 33
that the ultimate shear strength Qult could
be predicted by Egn. (7.1) below
Quit C1 (1 - 0.35 D) ft bD + C2 AÜ sin2a (%. 1)
where the notation is explained in Fig. (7.2a).
The structural idealization suggests that if the
opening is small or is so located as not to interfere signifi-
cantly with the natural load path, a reasonable estimate of the
ultimate strength should be obtainable from Egn. (7.1). This
was indeed supported by the test results; in Table (7.1) the
W2 values marked with asyrnbol (+) have been calculated using
Egn. (7.1) and the W1/W` ratios for these beams are reasonably
close to unity.
If the opening interrupts the natural load path,
the ultimate strength equation takes the modified form:
Yk Qult C1 (1 ' 0.35
kIx ) ft b k2 Df AC2 A pl sin2ai (7.2)
0
:ý
2
s W2/2
where the notation is explained in Fig. (7.2b).
1711

83.
It should be noted that yl is now the depth at
which a typical reinforcement bar intersects the 'strut' EA
of the upper path or the 'strut' CB of the lower path as the
case may be, and al is the angle between the typical bar and
the strut EA or EB. 1
The anomoly in the previously proposed equation,
which was based on the pilot study test data (Chapter 4; Eqn.
4.2), has thus been corrected: in the pilot study the proposed
equation took the form:
Quit II C1 1-0.35 kD ) ft b k2D + C2
>A p sin2a (7-3)
I- V
where a and y were measured with reference to the natural load
path, which often bears little relation to the critical dia-
gonal cracks in a beam with openings.
In the first term on the right-hand side of Eqn. (7.2),
the quantity C1 ft b k2 D (s C2 ft b Ci sin 0) is a measure of
the load-carrying capacity of the 'strut' CB of the lower path
in Fig. (7.1), and the factor (1-0.35 kix/k`D) allows for the
experimental observation of the way in which the load capacity
varied with cot 0, where 0 is the inclination of the 'strut'
CB to the horizontal. The first term is therefore a semi-
empirical expression for the capacity of the lower path; when
this capacity is reached, the 'strut' Cß fails in a splitting
mode (hence the splitting strength ft is used) resulting in the
formation of a so-called critical diagonal crack along CB.
The second tern on the right-hand side of Egn. (7.2)
represents the contribution of the reinforcement to the shear
71

84.
strength of the beam; experimental observation has shown that
the reinforcement has two functions. Firstly, it controls the
widening and propagation of corner cracks (Fig. 4.4; crack types
1 and 2) which would otherwise cause failure in Mode 3 (Fig. 4.5).
Hence, the reinforcement enables a proportion of the load to be
carried along the 'upper path' AEC. However, the capacity of
'strut' EA itself has not explicitly been included in Eqn. (7.2)
because, in the absence of web reinforcement, the upper path
was found to be ineffective except for very large values of ' 0(say 750), when the behaviour of the beam is then better
described by Eqn. (7.1). Hence, the concrete contribution in
Eqn. (7.2) has been restricted, conservatively, to that given
by the lower path, while the contribution of the upper path is
implicitly allowed for in the reinforcement contribution term,
as explained later. The second important function of the web
reinforcement is to restrain the propagation and widening of
any critical diagonal cracks along EA and CD. Unless arrested,
such propagation and widening leads to failure Mode 2 (F19-4-5),
in which the beam is split into two by the diagonal cracks
along EA and CD. The ability of the reinforcement to restrain
the diagonal cracks was shown by the test results to depend on
the quantity of reinforcement provided and on the angle with
which the typical reinforcement bar crosses a critical diagonal
crack. It would also seem that the propagation and widening of
the diagonal cracks could result in the end portion of the beam
moving outwards in a predominantly rotational motion about the
loading point. The structural idealization (Fig-7.1) explains
why the ability of a reinforcement bar to restrain such rot-
ation increases with the distance yl and similarly y in Egns.

I -, a
(7.2) and (7.1) respectively.
It is appropriate to point out one significant
difference between the function of the web reinforcement
in a beam without openings and that of a beam with openings.
In a deep beam without openings 27,33, the vu l% nerable region
is between the soffit and about D/3from it. As mentioned above
the term C2 AY sin`a/D in Egn. (7.1) increases with the
distance y; this suggests that one way to detail the web steel
is to arrange it in a closely spaced band near the beam soffit;
and previous experience 25,27' 32,
has shown that this is in-
deed acceptable, especially for the deeper beams (L/D greater
than 1.5). However, in a deep beam with openings the upper
and lower paths are less efficient in carrying loads than the
natural path of a solid beam, and are more sensitive to imper-
fections - such as diagonal cracks. The effect of web rein-
forcement is hence more pronounced in deep beams with openings
and also, as noted earlier, the effectiveness of the upper path
is in any case largely dependent on the provision of web rein-
forcement to provide a tensile capacity along EE (Fig. 7.1).
It was therefore required to introduce a further
empirical factor into Eqn. (4. i) (repeated above as Egn. 7.3)
in order to implicitly allow for the contribution of the upper
load path and to allow for the increase in strength which was
experimentally observed for the types of web reinforcements
that protected both the vulnerable regions above and below
the opening. By a systematic process of inspection and trial
it was found that the empirical factor A could reasonably
allow for tl: e experimental observations: the factor A distin-

guishes between the main longitudinal reinforcement and the
web steel proper; for the main steel X=1; for the web steel
proper, that is reinforcement detailed above and below the
opening. A= 1.5. (See General Discussion below: Item 1).
The use of Egn. (7.2) is perhaps best illustrated A
by a simple worked example, and for this purpose the ultimate
shear capacity of Beam W3-O. 3/4 will be calculated.
EXA`tl'LE :
The properties of the Beam W3-0.3/4 have been
extracted from Fig. (5.1) and Table (5.1) and are shown in
Fig. (7.3)"
. %'ith reference to Fig. (7.2) and Fig. (7.3)
ft = 2.87 ', /mm2 D= 750 mm
k1x = 225 mm b= 100 mm
k2D = 300 mm C1= 1.35
then the shear strength contribution of the concrete is given
by the first term on the right hand side of Egn. (7.2)as follows
1.35 (1 - 0.35 k1X ) ft b k2 D k2D
)x2.87 x 100 x 300 x 10-3 kN = 1.35 (1 - 0.35 300 5
85.7 kti.
The shear 3tren; th contribution of the steel is
calculated usin,; the second term on the right hand side of
Egn. (7.2). Referring to Fig. (7.2)and Fig. (7.3)"the steel
contribution is given by
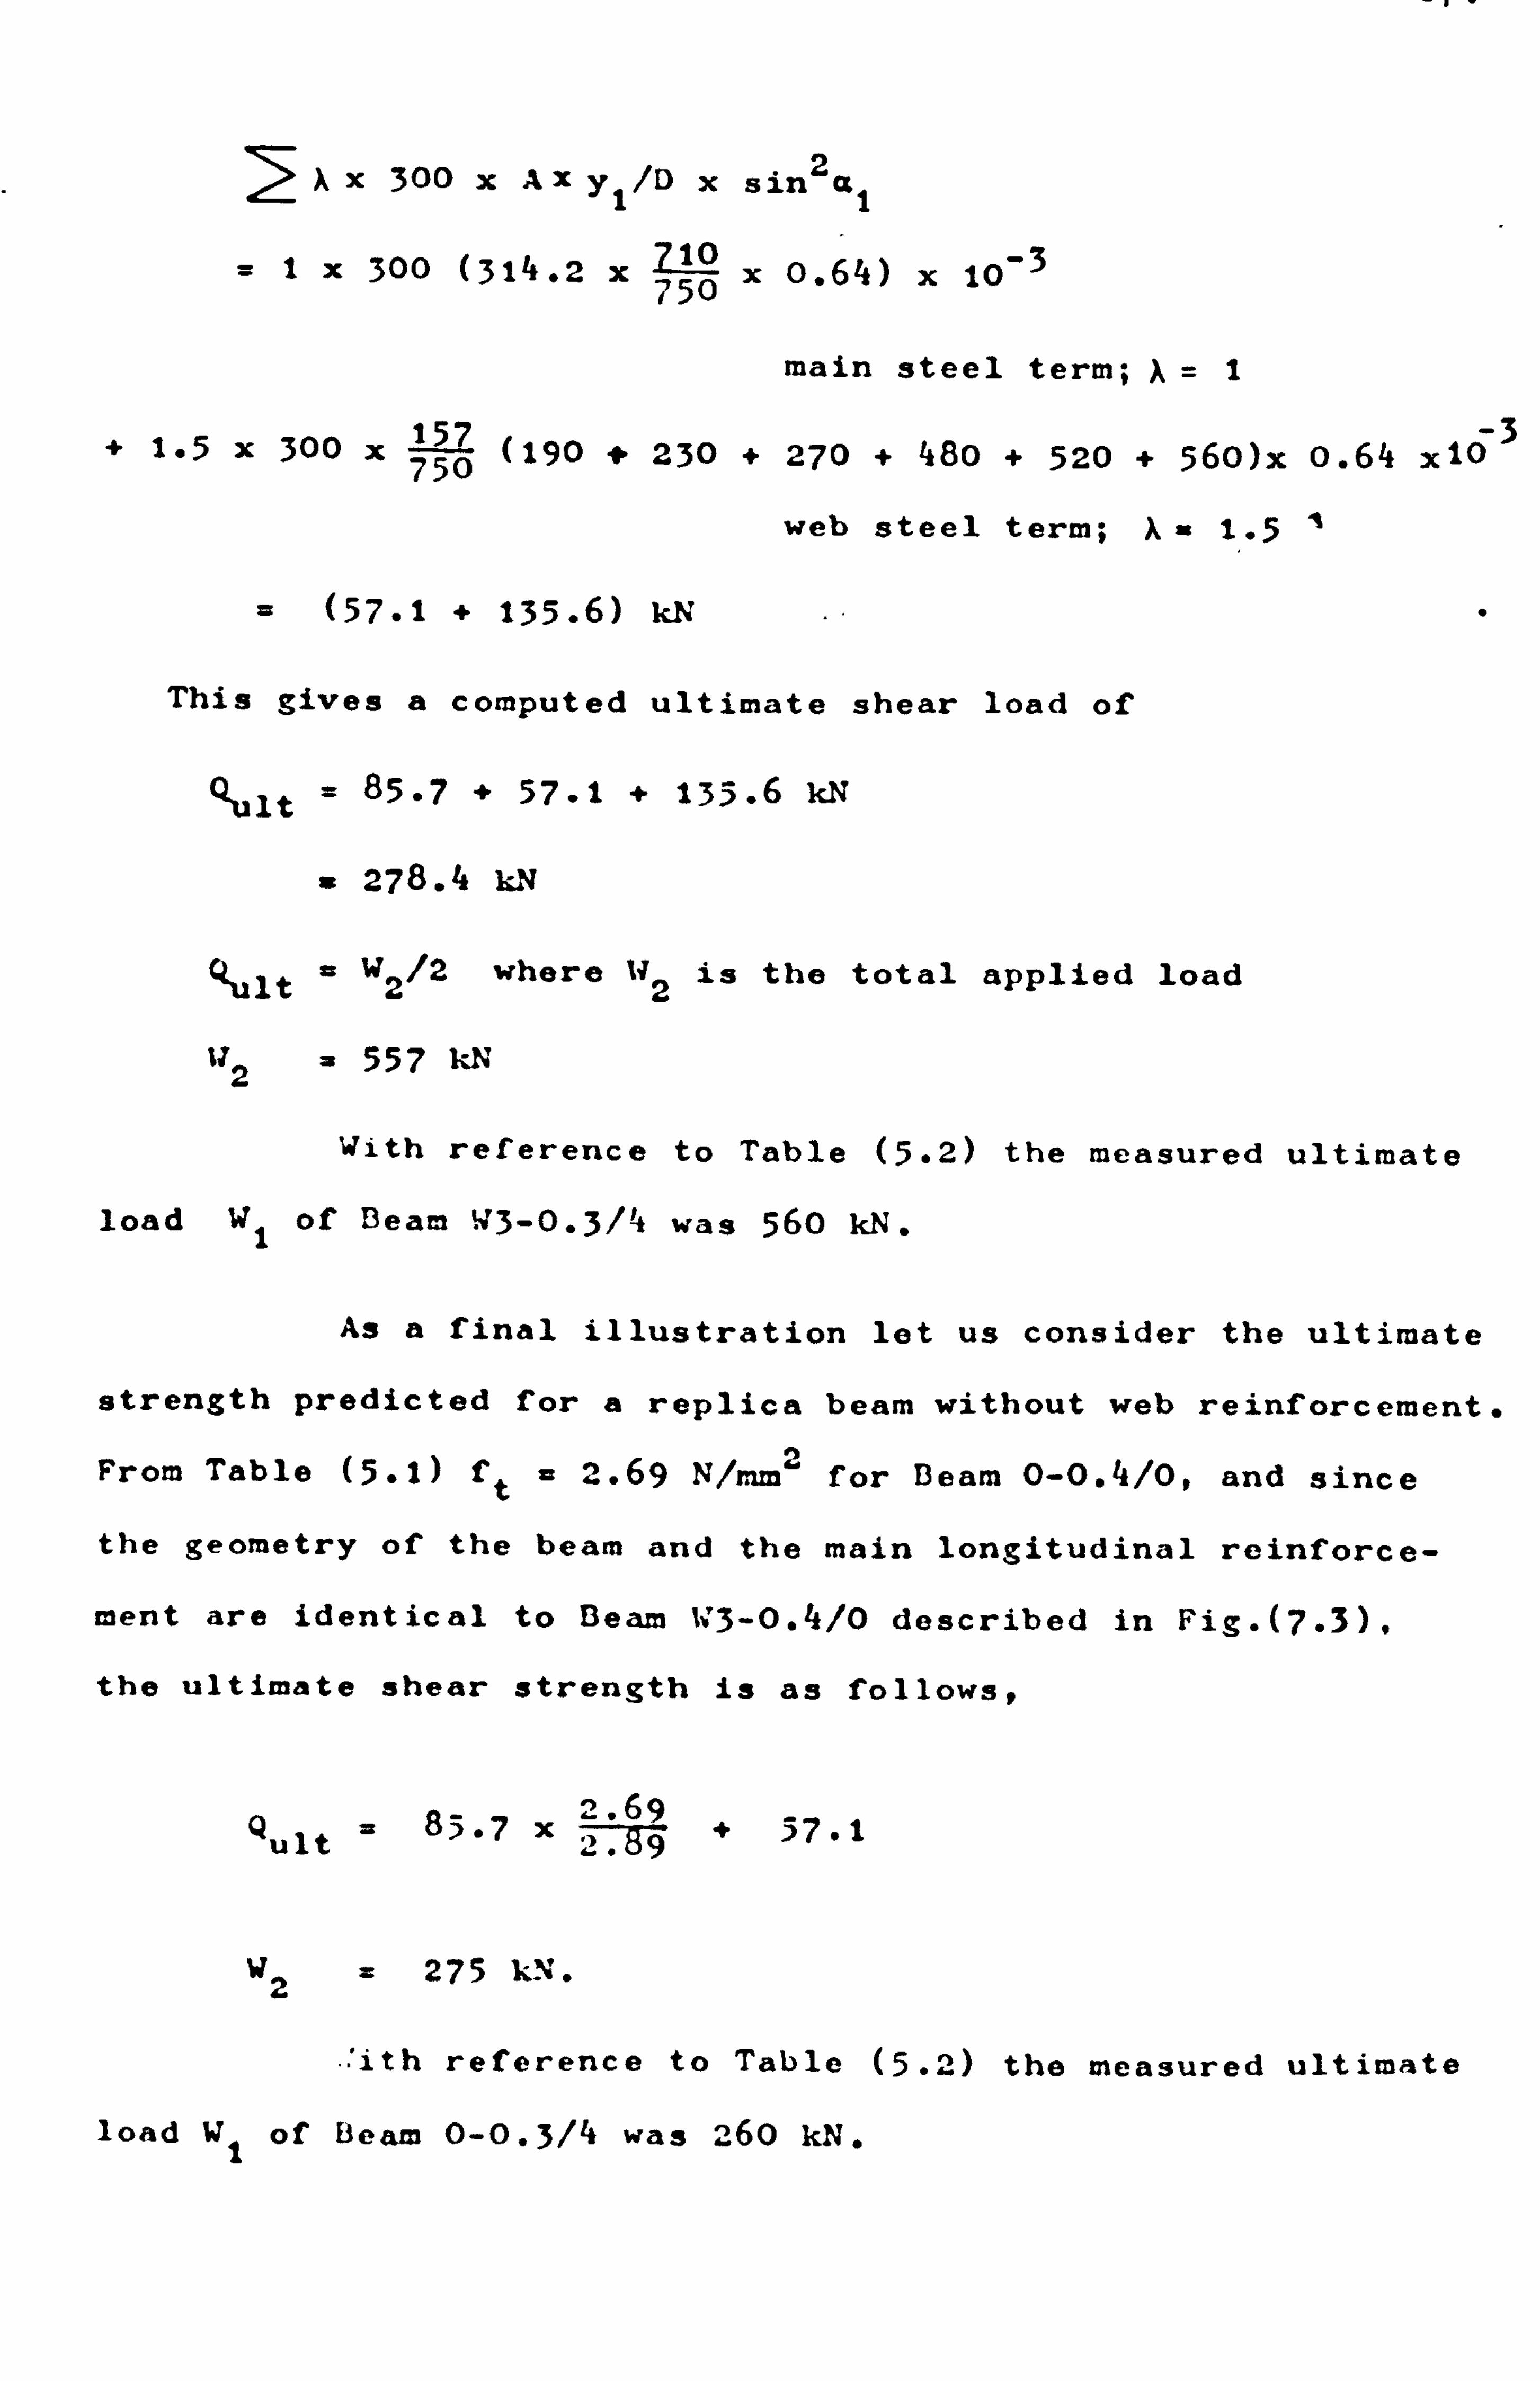
Xx 300 xAx y1/D x sin2a1
=1x 300 (314.2 x 71 0x0.64)
x 10-3
main steel term; A= 1
+ 1.5 x 300 x 1557
0 (190 t 230 + 270 + 480 + 520 + 560)x 0.64 x10
3
web steel term; X- 1.5
(57.1 + 135.6) kN
This gives a computed ultimate shear load of
Qult = 85.7 + 57.1 + 135.6 kN
- 278.4 kN
4ult = W2/2 where W2 is the total applied load
112 557 kN
With reference to Table (5.2) the measured ultimate
load W1 of Deam W3-0.3/4 was 560 kN.
As a final illustration let us consider the ultimate
strength predicted for a replica beam without web reinforcement.
From Table (5.1) ft - 2.69 N/mm2 for Beam 0-0.4/O, and since
the geometry of the beam and the main longitudinal reinforce-
ment are identical to Beam W3-0.4/0 described in Fig. (7.3),
the ultimate shear strength is as follows,
qf 37.1 Qult = 85.7 x 2,
$6
W2 275 kN.
.. ith reference to Table (5.2) the measured ultimate
load W1 of Beam 0-0.3/4 was 260 kN.

In Table (7.1) the computed ultimate loads for all
the beams, using Cgn. (7.2) or Egn. (7.1) as appropriate, are
compared with the measured values and it can be seen that
apart from a few exceptions the agreement is generally good.
This agreement is exhibited further in Fig. (7.4) where it can
be seen that the line W1 = W` represents a reasonable mean
profile.
7.2 GENERAL DISCUSSION
1. ) In Table (7.1). W2 values are not shown against Beams
W1-0.3/4, '2-0.3/4, W5-0.3/4, W1(A) and the similar beams of
normal weight concrete. If, for example, Eqn. (7.2) is applied
to Beam ti: b'1-0.3/4, the computed W2 will be over 800 kN; this
artificially high computed load arises from the fact that the
web reinforcement detailing (Fig. 6.1: Type W1) was such as to
leave the upper region weak and hence the potential capacity
of the lower path could not be realized before the collapse of
the beam occurred.
2. ) In Egn. (7.2) the concrete contribution, as represented by
the first term on the right-hand side, is based on the capacity
of the lower path, which without proper detailing of the web
reinforcement is normally the primary path. Under special
circumst. inces, however, the lower path might be much weaker
than the upper path. This happened, for example, in beams
0-0.3/16 and 0-0.2/16 which were designed to test the struct-
ural idealization. It is clear from Fig. (5.4) that the lower
laths in these beams were weak relative to the upper paths;
Table (7.1) shows that for such beam Eqn. (7.2) is grossly

09.
conservative. In any event, however, the shear strength of
a beam is likely to be low if the values of k2 and the angle
0 (a cot-1 (klx/k2 D); see Fig. (7.1) are low, unless special
attention is given to the detailing of the web reinforcement;
and hence, the conservative estimate from Eqn. (7.2) is just-
ified. If proper web reinforcement is provided, then, as shown
by ßeam N'16A-0.3/15 (Fig. 6.1), the predicted ultimate load
becomes reasonably less conservative for such an opening loc-
ation: in Table (7.1) the ratio W1/W2 for Beam NW6A-0.3/15 is
2.0.
3. ) neams W1(A), w3(-A), 44(A) and 117(A) were tested under
four-point loading to simulate the distributed-load condition,
as shown in Fig. (5.3). The results in Table (7.2) show that
Egn. (7.2) may also be used for this loading condition. In
Eqn. (7.2), the dimensions kix and k2D are independent of the
loading condition. To define all the yi and ai values, it is
only necessary to choose a reasonable line to represent the
strut EA in Fig. (7.2).
4. ) -pith reference to Egn. (7.2), it is reasonable to expect,
that, for a given beam. there is an upper limit to the shear
strength, irrespective of how much web steel is used. In
the tests, that limit was not reached at a web steel ratio
of 1.2%, which already represented a rather heavy web rein-
forcement for a deep beam.
In beans with normal span/depth proportions, recent
testy have shown that sheer beh. iviour could be influenced by
the scale of the test specimens. The size of the test specimens
used in the present test programme was chosen to be as large

as practicable in consideration of the wide range of parameters
to be tested. At the University of Cambridge a test programme
using large deep beams has commenced; the test specimens both
in normal weight and lightweight concretes are of depth 1800 mm,
thickness 250 mm and span length 3,500 mm and contain openings
across the shear span at mid-depth similar to opening type 4
(Fig. 5.2) of the present tests. - The webs of the beam are rein-
forced either by an orthogonal mesh or by inclined arrange-
ments of reinforcement. Only a single result has, at present,
been reported ` but the indications are that the prediction
of ultimate strength given by Eqn. (7.2) is not likely to be
significantly affected by a scale effect. The measured ultimate
load of a beam, containing openings as described above and
approximately 1.34% of web reinforcement in an orthogonal mesh,
was 3000 kN; using Eqn. (7.2) a predicted ultimate load of
2530 kN was obtained. Hence as seen by the ratio of measured
to calculated ultimate load, 1.18, the agreement was reasonably
good and comparable to the results of the present tests.

CHAPTEREIGHT
PROPOSED METHOD FOR THE DZSIGN OF DEEP BEAMS WITH WEB OPENINGS
3.1 INTRODUCTION
8.2 PROPOSED DESIGN EQU%TIONS FOR SHEAR
8.3 DESIGN HINTS
8.4 DESIGN EXAMPLE

510
C If APTEREIGHT
A PROPOSED METHOD FOR THE DESIGN OF DEEP DEANS WITH WED OFENINGS
8.1 INTRODUCTION. 1
The design of reinforced concrete deep beams with web
openings is not yet covered by the major codes of practice 3-5.
In Great Britain, the Construction Industry Research and
Information Association, has just issued a design guide 9 for
practising engineers, but the provisions for web openings are
necessarily very restrictive because extensive surveys 6.7,9,
have shown that little information is available in the liter-
ature. on the effects of web openings on the ultimate load
behaviour of concrete deep beams.
The exact analysis of reinforced concrete deep beams
with openings presents formidable problems 36,
but the
results of the experimental research presented in this thesis
indicates that the restrictions on web openings need not be
so severe. The structural idealization presented in Chapter
7 should prove a powerful tool to the designer, both for the
visualization of the load transfer mechanism in deep beams
with web openings and for the prediction of their ultimate
strengths. In this chapter. a simple method for the design
of deep beams with openings is suggested, and design hints
are given together with a design example to illustrate the
method's ease of use.
8.2 PI OPO. iCD DE.. 3IGN EqUATIONS FOR SITE\1t
It -should be noted that Egn3. (7.1)and (7.3) are

intended to predict actual collapse loads. Hence, there is
no built-in factor of safety and also there is likely to be
a certain amount of scatter in comparing predicted and actual
strengths. Therefore, in order to modify the equations to be
appropriate for design. it is necessary to multiply the
empirical coefficients C1 and C2 by a factor to obtain a safe
lower bound. Examination of Fig. (7.4), showed that a reason-
able lower Lound to the experimental results is given by a
factor of 0.75. In addition, it is necessary to relate the
lower bound strengths to the ultimate limit state design
loads by the application of the partial safety factor for
material, Y©"
It is also noted that the characteristic cube strength
is usually the concrete strength parameter adopted in design
practice, and hence it is appropriate to substitute an estim-
ated value based on the cube strength, for the cylinder splitt-
ing strength which is used in Eqn. (7.1) and (7.2) and which
may not normally be available. In the CIRIA design guide
the relationship between the cube and cylinder splitting
strength is taken as ft - 0.52 jfcu.
For normal weight
aggregate concrete this relationship is within the experi-
mental range of the present tests and will be adopted here.
For lightweight aggregate concrete, however, this relation-
ship over estimates the splitting strength: from the results
of the testing of the control specimens a relationship
ft-0.44 fcu wa3 obtained. and this is the value adopted
for lijhtwei,; ht concrete. (It is pertinent to point
out again, that the splitting stren. th of lightweight concrete

93.
is dependent on curing conditions: in the present tests ft
for lightweight concrete was obtain: --, d in accordance with
A3TM 330 - see Chapter 3.5). Taking into account the partial
factor of safety for material, which is given in CP1103 as
1.5 for concrete, the concrete strength parameters for design
purposes are derived as follows:
0 . 42 if- for normal weight concrete ft
= 0.52 EC-U5
y 1cu m
ft 0,1}4
fcu 0.36 Ff u
for lightweight concrete ym i. )
The design equations for ultimate shear strength then become:
"-u it C1 (1-0.35 x/D) ffcu bD +
>C2 Ap sin2a (8.1)
"" Y1 2 cu
bk2D + xc2 Ap sin a1(8.2) Quit = C1 (1-0.35 kix/k2D) j1'
where the geometrical notation is as explained again in Fig. 8.1
and C1 = 0.44 for normal weight aggregate concrete
C1 = 0.36 for lightweight aggregate concrete
C 1 95 ',, '/mm for deformed bars (f = 410 N/mm2) 2 y
C _ 85 = 250 N/mm2) N/mm2 for plain round bars (f ` y
A = 1.0 )near beam soffit for main longitudinal bars (A s
A a 1.5 for web reinforcement proper (A ) N
f a char acteristic cube strength of concrete cu
A = area of main steel bar or web bar as the case may be

7 `t 0
8.3 uE5ISh HINTS
The following design hints based on the experimental
observations, are given to qualify and to aid the use of
Eqns. (8.1) and (8.2).
(1) Equations (8.1) and (8.2) are intended to apply to beams
with span/depth ratios and clear shear-span/depth ratios
comparable to those of the test specimens: namely, 1L/D<2
and 0.2< x/D < 0.4. The equations should be applied only to
deep beams under top loading conditions; static loads only
are covered.
(2) '. henever possible, web openin; s should be kept clear of
the natural 'load path' joining the loading and reaction
points. If the opening is reasonably clear of the natural
load path, the ultimate shear strength may be calculated
from Egzi. (8.1).
(3) In using Egn. (8.1), it is recommended that the steel
contribution. as given by the second term of the equation,
should not be less than 20;: of the design shear force (Ault
(4) If the opening intercepts the natural load path. the
desi; ner should ensure that the factor k2 is not less than
approximately 0.2 and the angle cot-1 (kix/k2D) not less
than about 300 (Fi;. 8.1). The ultimate shear strength may
then be calcul. ited from Eqn. (8.2).
(3) In usin; Eqn. (S. 2), it is possible that the contribution
from the concrete term to,; ether with that of the main steel
(A ) might be found to be sufficient to meet the design shear

95.
loads, However, the test experience has shown that to ensure
the mobilisation of the potential capacity of the unreinforced
web, it is advisable to provide web reinforcement to protect
the regions above and below the opening. For this purpose
it is recommended that where the total steel contribution
exceeds 20`: of Qult, then at least 25% of the steel contri-
bution should be made by the web steel proper (A w
), and the
web steel Aw must be detailed properly.
(6) It is worth noting that in meeting the recommendation
given in (5) above, the total quantity of web reinforcement
so provided is unlikely to be significantly greater than the
mandatory quantity of reinforcement required for temperature
and shrinkage effects by CPI103 (Clause 5.5) and may be less
than the so-called nominal web reinforcement required for
solid deep beams by the OED-FIP Recommendations 5 (see
Charter
(7) The ultimate shear strength may be substantially in-
creased by providing designed quantities of web reinforcement.
In detailing the web reinforcement the designer should again
ensure that both the regions above and below the opehing are
protected. : Veb reinforcenent not meeting this requirement
should be disregarded when using Egn. (8.2).
(8) Inclined web reinforcement (Fig. 6.1: Type W6 and W6A)
is particularly effective for increasing the ultimate shear
strength (and for crack control - see Chpts. 5.2.2 and 6.2.2).
This type of web reinforcement is likely to be more expensive
to bend and fix than others. However, where there are re-
strictions on the overall dimensions of the beam, and an

96.
adequate ultimate strength is the main concern, then Type
W6 may be the best choice.
(9) Trimming web openings locally with loops of reinforce-
ment has little beneficial effect on ultimate shear strengths
and any reinforcement that is provided locally for crack
control should be disregarded in using Eqn. (8.2).
(10) In the design of shallow beams and of the majority of
solid deep beams 31,32 it is usually necessary to consider
shear for the ultimate limit state only. In the design of
deep beams with openings, however, shear may also be an
important consideration for the serviceability limit state
of cracking (see Chpts. 5.2.2 and 6.2.2).
(11) It is suggested that the equations should be applied
only where positive end anchorage is provided for the main
longitudinal steel. Little experimental data on the end
anchorage requirements in deep beams are available, and both
the %CI Building code 4
and the CE©-FIP Recommendations 5
are very cautious on this point. In all of the present tests,
the main longitudinal bars were anchored at their ends to
steel blocks as a precautionary measured against load failure
(see also %ppendix 1).
8.4 ILi: -iI'i\ ;: _`i
VPLE FOR A DEEP I).: ki i ,: ITii Of i; ": INGS
The geometry and properties of the beam used for
this example aro siri1ºr to those used previously in the
illustration of the design of solid deep beans as given in
Ch º}ter 2. It is required to include an opening, in the beam
located is shown in design the i ain steel and web

yi.
steel.
Examination of Fig. (8.2) shows that the opening
I
intercepts the notional loadpath joining the load and support
reaction and is therefore likely to seriously disrupt the
normal distribution of internal forces and stresses within
the bean. It is therefore necessary to compute the ultimate
shear strength using Eqn. (8.2).
First, though. an estimate should be made of the
necessary main bending steel required.
Because the proportion of main steel required is
normally relatively small and the amount provided also
contributes to the ultimate shear strength, a simple approx-
imate estimate is only necessary (cf. Chpt. 9.2).
In this example it is su; gested that the main
longitudinal reinforcement be conservatively calculated as
follows: -
f Design bending moment M=0.75 kD A (8.3)
2S .m
': ith reference to Fig. (8.2) and using a partial
safety factor of 1.4 for loading, the design shear force and
moment are then as follows: -
)esi-n shtr force V=1.4 x 4500 = 6300 kN
Design bending moment M=1.41 x 4500 x 2.0 = 12600 kNm
Using 1: gn. (8.3) with y=1.15 for steel

95.
12600 a 0.75 x 2600 x As x 410
x 10-6 1.15
As - 18124 (As/bD = 0.58%)
Use 6 No. 40 mm bars + 14 No. 32 mm bars (18792 mm 2)
Next, we consider shear. From Fig. (8.2) kIx/k2D b0.462
The concrete resistance to shear is given by the first
term in Equation (8.2) as -
0.44 (1-0.35 x 0.462) 30 x 2600 xb=5.25 b kN
Dimension b may be chosen so that the concrete resists
say 55 per cent of the design shear force, then
5.25b - 6300 x 0.55
bs 650 mm say
From Eqn. (8.2) the shear resistance of the beam
with main bars (As) only is
5.25 x 6501 f1x 195 x 18792 x 400 (say) x sin2al x 10-3 J
(where a1 0 cot-i kix/k2D = 65°; sin2(z 1a0.82)
. (3412 + 2754) - 6166 kN
The contribution required by the web reinforce-
went s 6300 -6 166 - 134 kN, but it is noted that the required
total steel contribution (6300 - 3412 = 2888 kN) is greater
than 20: " `pult and therefore a minimum amount of web reinforce-
ment is required: web steel proper should contribute 25:: x
2888 = 722 kN.

From Lqn. (R. 2)
Y 722 x 103 -
ý1.5 x 195 x A. x 81 sin2a1
lssuminq horizontal stirrups at uniform spacing
are uNed to protect the regions above and below the opening:
sin`a1 0.82 as before and sin 2
al = sin '' ` (cot- 1 750/1200)
0.72. For design purposes it is sufficient to take an
average value of sin2ai and sin2aI and an average value
of yi (say yi a 1800).
From above,
Aw : R548 mm2 (%w/bD = 0.271,: )
Use 18 No. 25 mm diameter bars (8836 mm 2)
"
These bars must be arranged to protect both
regions above and below the opening. The detailing is
shown in Fig. (8.3). (Note: secondary nominal reinforce-
ment, which might be provided elsewhere in the beam for
temperature and shrinkage effects. and additional rein-
forcE"mrnt at the supports and loading points to provide
adequite bearing capacity has been omitted for clarity).

CHAPTERNINE
A CRITICAL REVIEW OF THE CIRIA DESIGN GUIDE FOR DEEP BEANS
I
9.1 INTRODUCTION
9.2 CIRIA DESIGN METHOD: SOLID TOP-LOADED DEEP BEAMS
9.3 COMP. %RISON OF DESIGN LOADS WITH TEST RESULTS
9.4 CIRIA GUIDE: PROVISIONS FOR DEEP BE. VIS WITH HOLES

100.
CHAPTERNINE
A CRITICAL REVIEW OF THE CIRIA DESIGN GUIDE FOR DEEP HEMS
9.1 I`. TRODUCTION A
The recently issued CIRIA Guide 'The design of
deep beams in reinforced concrete' 9
is the most comprehensive
design Guide published to date (1977)" Because of its likely
impact on future design practice and on future revisions of
codes of practice, the Guide is reviewed and discussed here
in some detail.
The Guide 9 is based on an exhaustive study of pub-
lished literature and of research reports on deep beams, and it
is stated. "owes much to the work of Leonhardt 25,
Kong 27-35
and to the CEB-FIP International Recommendations 5".
It contains
'simple rules' for designing the simpler forms of reinforced
concrete deep beams and 'supplementary rules' to cover the more
complex cases, in which the load capacity may be affected by
elastic instability, or where the applied loads are concentrated
or indirect, or where the supports are indirect. The Guide is
also unique in including for the first time some provisions for
the design of deep bear's with web openings.
In the review here it will be appropriate to examine
only those sections of the Guide which are relevant to the ex-
perimental research of this thesis; namely, simply supported
top loaded deep beacas and deep beams with web openings. In
what follows, the recommendations for the design of solid deep
beams are explained and illustrated with a simple design example

101,
in section (9.2); in section (9.3) comparison is drawn between
the measured ultimate loads of the test beams (solid) reported
herein and the design loads which would obtain both according
to the CIRIA Guide and according to the three currently used
design methods (cf. Chapter 2); and finally in section (9.4)
the CIRIA provisions for the design of beams with openings
are examined.
9.2 CIRIA DESIGN ? METHOD: SOLID TOP-LOADED DEEP BEAMS
According to the Guide 9 the 'simple rules' may be
applied to a beam which satisfies the conditions of being a
flat plate, with no significant openings, subjected to essen-
tially uniformly distributed loading. Then, using the simple
rules for bonding the main tension steel required is calculated
from Equation (9.1) as follows:
An >M f
yz ( 9.1 ) 0 . 87
where H is the design moment at ultimate limit state
z is the lever arm and for single spans z=0.21 + 0.3 h
1 is the effective span (Fig. 9.1)
ha is the effective height (Fig. 9.1)
If 1/h n>1.5
it is required to confirm the strength
of the concrete in compression due to bending and the condition n
M<0.12 fcu b ha " must be satisfied.
The reinforcement calculated by Eqn. (9.1) above is not
to be curtailed in the span and may be distributed over a depth

a v'.
of 0.2 ha. The bars must be anchored to develop 80% of the
maximum ultimate force beyond the face of the support, and
205 of the maximum ultimate force at or beyond a point 0.2 1 0
from the face of the support or at or beyond the far face of
the support, whichever is less (Fig. 9.1). 11
It is worth noting that the provisions for flexural
design are similar to those contained in the CEB-FIP Recommen-
dations (cf. Chapter 2.2.1) and are therefore related to the
work of Leonhardt (cf. Chapter 1.2.2.2). The lever arm factors
for bending are in fact based upon the elastic stress distri-
bution which obtains prior to cracking and hence, as might be
expected. there is a substantial in-built factor of safety on
collapse for simply supported beams. (Note: Appendix (1) of
this thesis includes a description of some test beams that
collapsed in the flexural failure mode). Compared to, say,
the flexural design of normal beams (large span/depth ratios)
Equation (9.1) would therefore seem irrational in the context
of the philosophy of limit state of collapse: however, it is
the philosophy of the Nottingham/Cambridge team that the foll-
owing good reasons may be found as to why the equation is accept-
able from a practical design point of view 33,34,51.
Firstly, because of t1&e relatively large size of the
internal lever trm flexural failure due to flexural crushing
of Vie concrete j, rior to t'ie'd of the main steel will rarely
occur: flexuril collapse of deep bear. is is therefore a lesser
problem than in nor-nal beams. : Secondly, the proportion of main
" teel re ; aired is rel ttively small compared to that required
in rior: n*1 be. ir.; and hc"nce, whet'ier the lever arm is nominally

av).
taken as 0.6D or say. O. 8D, would not make significant differences /
to the cost. Thirdly, and more important, any reinforcement bar
that intersects the critical diagonal crack (Fig. 9.2) will form
an integral part of the shear reinforcement 27 34. Therefore,
all the main bars provided in accordance with Eqn. (9.1) also act
as web bars; that is, to quote Kong, Robins and Sharp 34 "the
laws of equilibrium are unaware of the designer's discrimination
between bars labelled as 'flexural reinforcement' and bars lab-
elled as 'shear reinforcement' ".
The requirements for anchorage of the main steel stem
from the understanding of the manner in which the stress in the
steel becomes uniform within the span as the beam approximates
to a'tied-arch'(cf. 'Chapter 1.2.2.1 and 1.2.2.2). However, it
does seem that the anchorage capacity of the tension reinforce-
ment might be significantly increased in the presence of the
high compressive stresses in the support regions, although Kong,
Singh and Sharp 37 have commented that the experimental evidence
is insufficient as yet to recommend a relaxation in the current
prudent recommendations. (Note: Appendix I describes the details
of a series of exploratory tests 37 carried out to investigate
the requirements for end anchorage of the main steel).
As regards shear, the 'simple rules' specify two
conditions for the shear capacity of beams with unreinforced
webs; these are to be satisfied as follows: -
V< 2 bh 2vk /x acae
V< bh v au
(9.2)
(9.3)
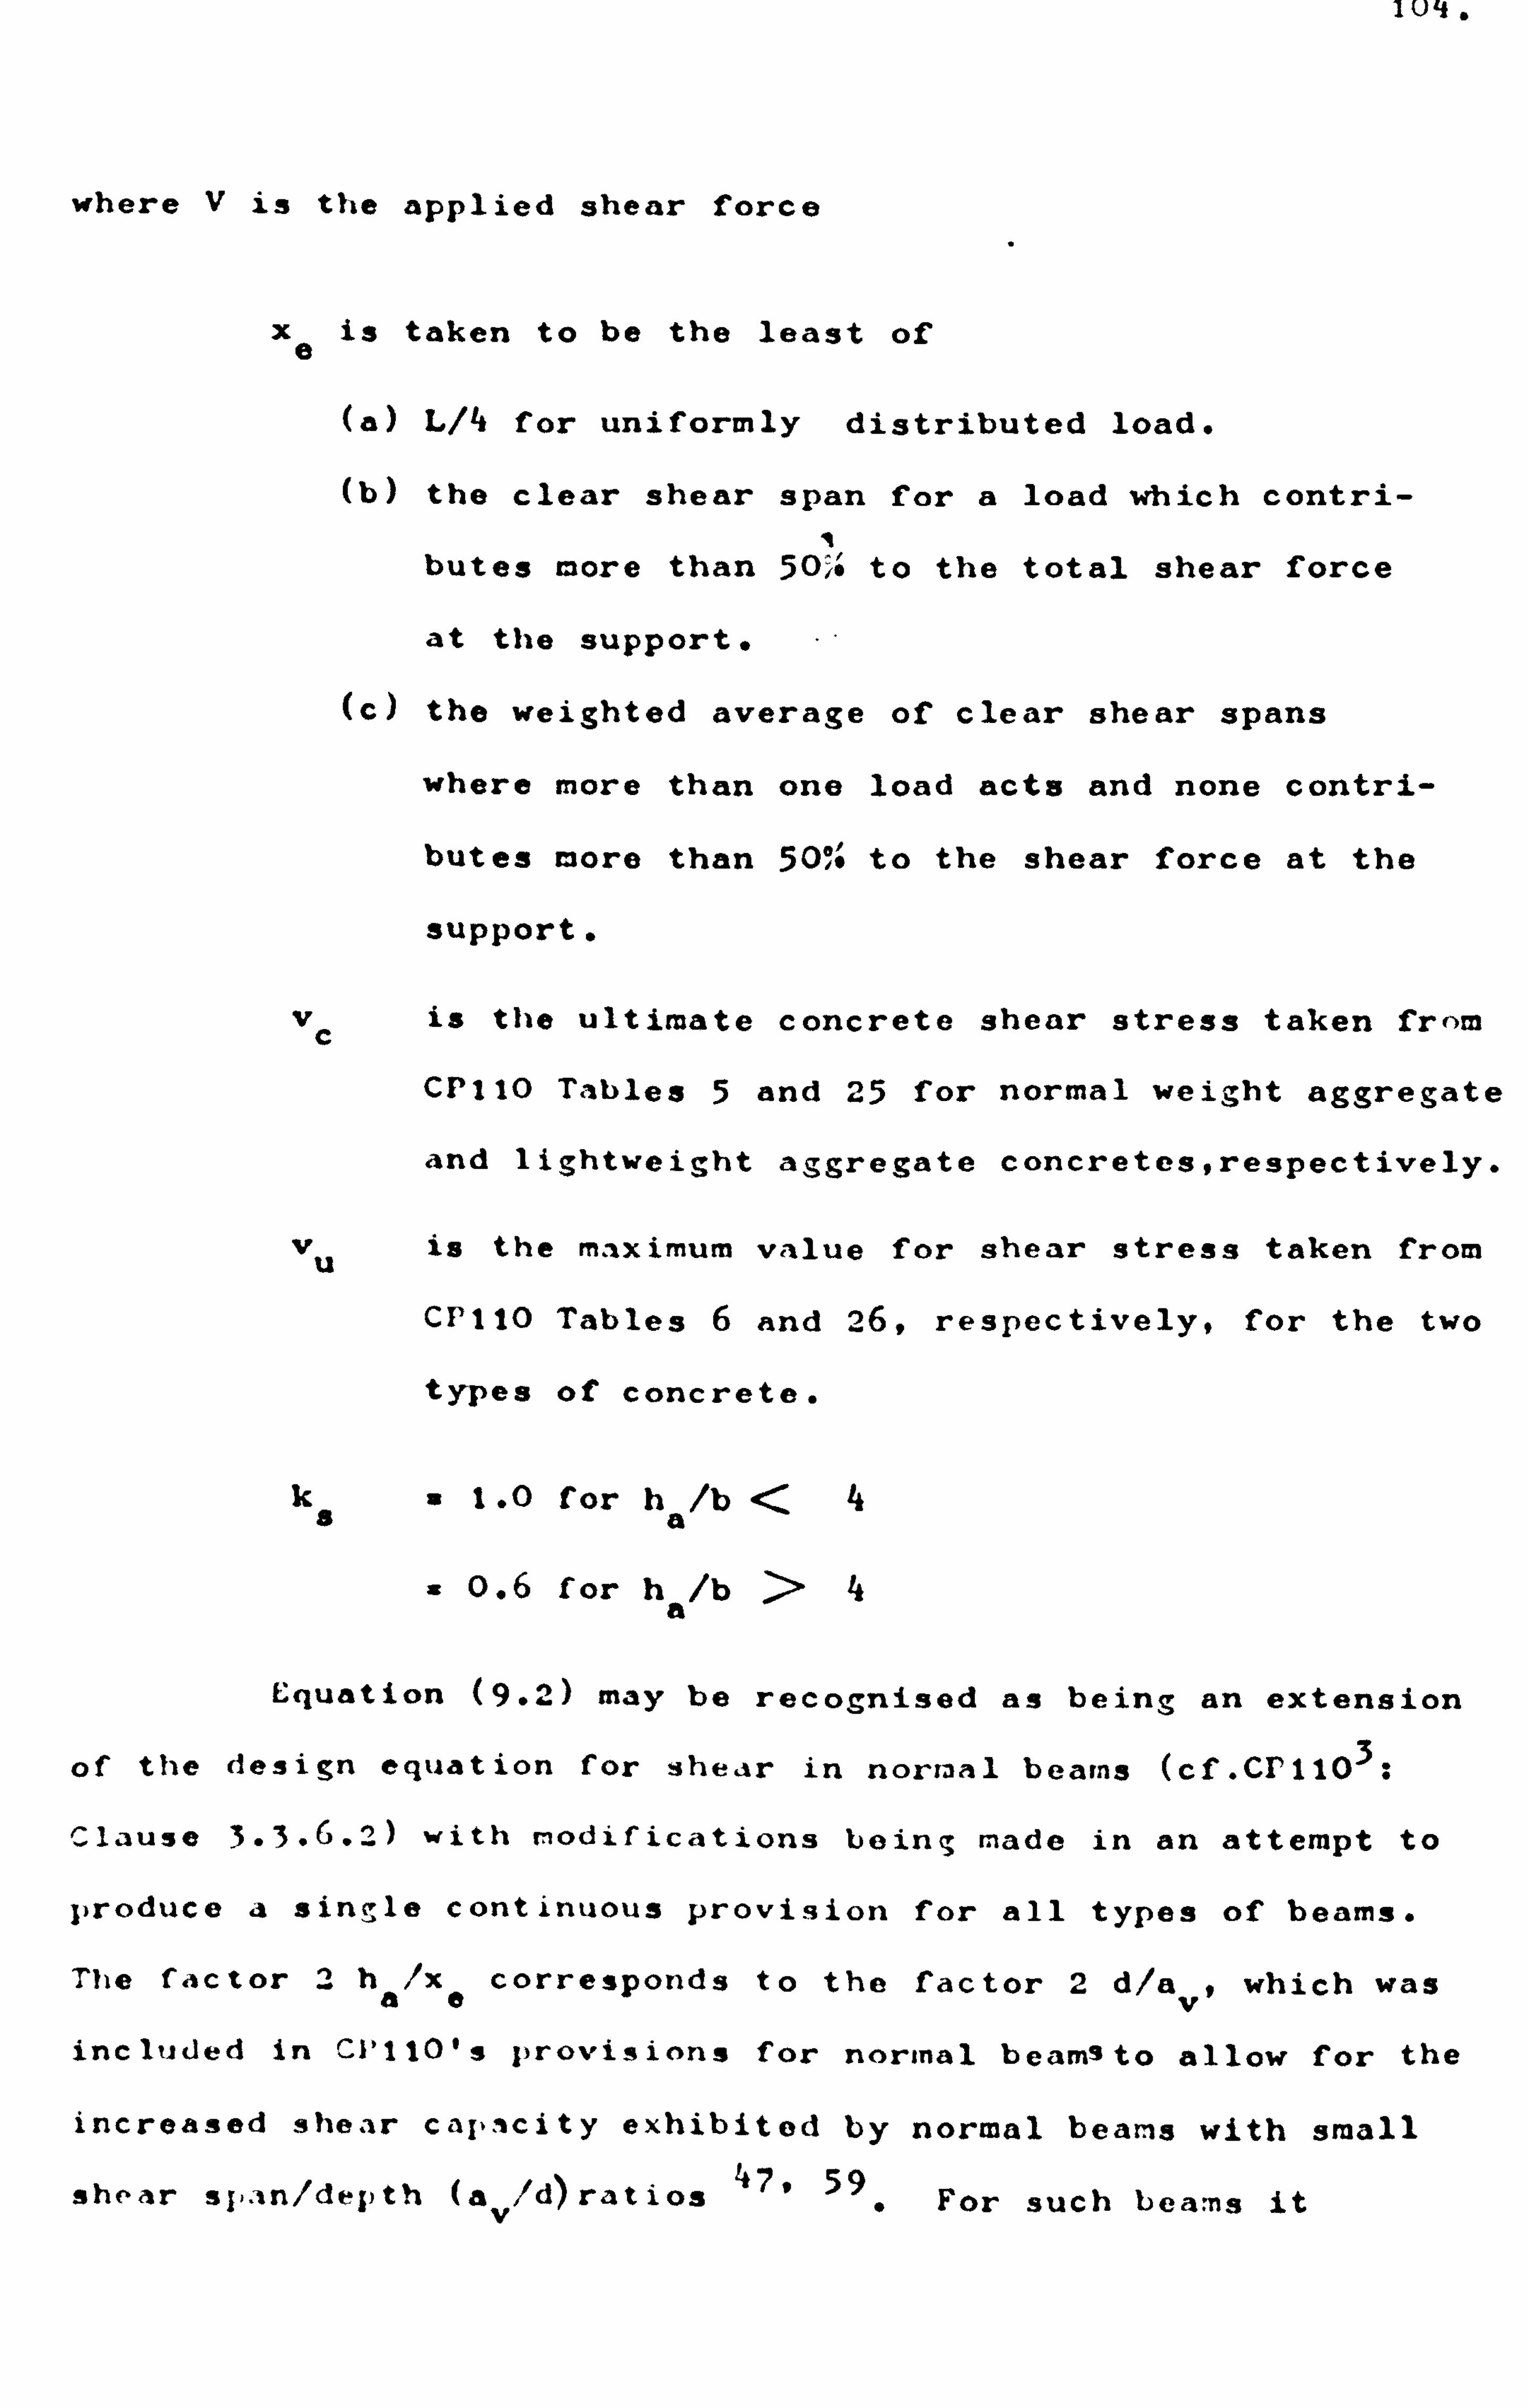
1U4.
where V is the applied shear force
xe is taken to be the least of
(a) L/4 for uniformly distributed load.
(b) the clear shear span for a load which contri- 11
butes more than 5O to the total shear force
at the support.
(c) the weighted average of clear shear spans
where more than one load acts and none contri-
butes more than 50% to the shear force at the
support.
vc is the ultimate concrete shear stress taken from
CP1IO Tables 5 and 25 for normal weight aggregate
and lightweight aggregate concretes, respectively.
vu is the maximum value for shear stress taken from
CPI1O Tables 6 and 26, respectively, for the two
types of concrete.
ks = 1.0 for ha/b <4
0.6 for hA/b >4
Equation (9.2) may be recognised as being an extension
of the design equation for shear in normal beams (cf. CF1103:
Clause 3.3.6.2) with modifications being made in an attempt to
produce a single continuous provision for all types of beams.
The factor 2 ha/xe corresponds to the factor 2 d/aw, which was
included in Ci'110's provisions for normal beamsto allow for the
increased shear capacity exhibited by normal beams with small
47 shear span/depth (a /d ratios ý 59
v% For such beans it

Lv>.
has been reported 4 that the failure mode in shear in certain
respects resembles a deep beam failure mode; namely, that failure
in both types of beam may be initiated by the formation of
diagonal (splitting) cracks between the loading and support points
There is a further factor k8 included in Equation (9.1),
the value of which depends on the aspect ratio ha/b. As deep
beams usually have aspect ratios greater than the minumum of 4,
the effect of the factor ka is to reduce the CP110 values by 40%.
The explanation regarding ks. as given in the Guide, is that
Kani 60
and later Taylor 6i
have drawn attention to the pro-
bability that beams unreinforced for shear with aspect ratios
exceeding 4 will exhibit reduced shear capacity against that pre-
dicted on the basis of normal shallow beam theory. It is not
clear how these results can be directly extended to deep beams,
as the shear failure mode in both Kani's and Taylor's tests was
typical of that of shallow beams with large (av/d) ratios and
hence bore little resemblance to a deep beam failure mode. how-
ever. the reduction of 4O°: may be seen to be certainly necessary
by comparing the nominal shear stresses obtained for the present
tests with that given by Equation (9.2) without the ks factor.
For example, feam NO-O. 3/0 (Chapter 6: Table 6.2) achieved a
measured ultimate nominal shear stress of 4.5 N/mm2 which compares
with nn allowable ultimate shear stress from Egn. (9.2) of 3.66
x k5 N/mm2. These figures would imply a factor of safety of
4.5/3.66 k3 z 1.23/ka which, taking k8 at its value of 0.6 then
becomes 2.05.
The upper limit for shear stress is fixed by the con-
dition given in Egn. (9.3). It is worth mentioning that the use

I'D.
of this limit in the simple rules is strictly not appropriate,
as the limit has been derived as an upper limit for the shear
strength of normal beams with designed quantities of shear
reinforcement. However, in practice, under the simple rules
either Eqn. (9.2) or more usually the rather conservative limit
on support bearing pressures will govern 9. The Giiide re-
commends that the bearing pressures at the support should not
exceed 0.4 f. cu
The simple rules do not give specific recommendations
for the design of web steel but stipulate the provision of
nominal quantities of web reinforcement. The minimum amount
should not be less than the reinforcement for shrinkage and
temperature effects required for a wall under Clauses 3.11 and
5.5 of 03'110: namely, 0.25% (for high yield steel) or 0.3% (for
mild steel) times the volume of the concrete is to be provided
both horizontally and vertically. In the support regions the
proportion of steel, related to the local area of concrete in
which it is embedded, should not be less than 0.52 Jr '/0.87 f; Y
that is sufficient steel to provide a tensile resistance of not
less than that of the uncracked concrete: for example, taking
fcu = 30 N; csm2 and fy : X10 N 'mm2 the percentage required in
each direction would equal 0.8ýö.
',: here a beam is subjected to concentrated loads or
where the unreinforced web shear capacity given by Egn. (9.2)
is exceeded. then the nominal web reinforcement may be augmented
un-! er the 'supplementary rules' to improve the top load capacity.
Under the supplementary rules 9
the ultimate shear
capacity is given by. with reference to Fig. (9.2):

2 al(i-o. 35 "e ) Jfcu
+ A2 Ar yr sin ar (9.4)
W- 2 abh
a
where s 0.44 for normal weight aggregate concrete
. 0.32 for lightweight aggregate concrete
1.95 N/mm2 for deformed bars
: 0.85 N/mm2 for plain round bars
Equation (9.4) is based on the analysis 3304
of the
results of the Nottingham - Cambridge tests 27-32:
it is, in
fact, Egn. (1.9) as given in Chapter 1. The equation is in-
tended to apply to beams under top loads with clear shear span/
depth ratios (ze/h$)in the range 0.23 to 0.7; this being the
range considered in the tests 27-32 The coefficients Al 9
and X2 are based on the empirical coefficients C1 and C2 of
Equation (1.9 ), having been modified 34 by a factor of 0.75
to give a lower bound to experimental results, and by the
partial factor of safety for materials.
The ultimate shear capacity is subject to the condition
expressed as follows:
V/bha < 1.3 Al rcu
This limit, judging from the Nottingham-Cambridge
(9.5)
tests `7-3`, may or may not be very conservative depending,
for example, on how well the beam is reinforced against bear-
ing failure. In the tests 27-32
the measured nominal shear
stress acting over the cross-sectional area (width x depth)
varied from about 4 `: /mm` to 7 N/mm` depending on geometry
(mainly the c1e. ar-shear- sp. n/depth ratio) and on the effect-
iveness of the web reinforcement. The limit given by Egn. (9.5),

for example, equals 3.12 N/mm2 for a normal weight aggregate
concrete of 30 N/mm2 cube strength. For beams with effective
inclined web reinforcement, the present tests reported herein
would indicate that the limit restricts the possible ultimate
shear stress potential by a factor of at least 2 (cf. Chapter 6:
Table (6.2) , the ultimate load of beam NW6A - 0.3/0 is 1215 kN
which represents a nominal shear stress of 8.1 N/mm2 and nominal
support bearing pressures of 60.8 N/mm2).
As regards bearing capacity, the Guide permits the
maximum bearing stress at the support to be increased from the
limit of 0.4 fcu in the simple rules to 0.6 fcu, provided that
suitable binding reinforcement is added to the support zones to
provide lateral confinement to the concrete. It will be generally
found, in fact, that the bearing capacity stipulation for simply
supported beams is the limiting factor governing the design
capacity of the beam. . r'hil4t it is at present reasonable to
expect conservative limits to be placed on bearing pressures -
for the reason that the bearing pressures achieved under lab-
oratory conditions may not be achieved, it is thought 9,
in
practice - it also seems likely that too great an importance
has been attlched to the bearing failures reported by Leonhardt 25
(cf. Chapter 1.2.2.2). %t Nottingham 32, tests have indicated
by the tine of eine-film that bearing failure might be a second-
ary effect of the propagation of diagonal cracks into the support
zones: by proper arrangement of web reinforcement to control
diagonal cracking, be. iring failures might therefore be avoidable.
It is notable also that in the present tests simple confining
ct", es of reinforcement at the load and support points helped to
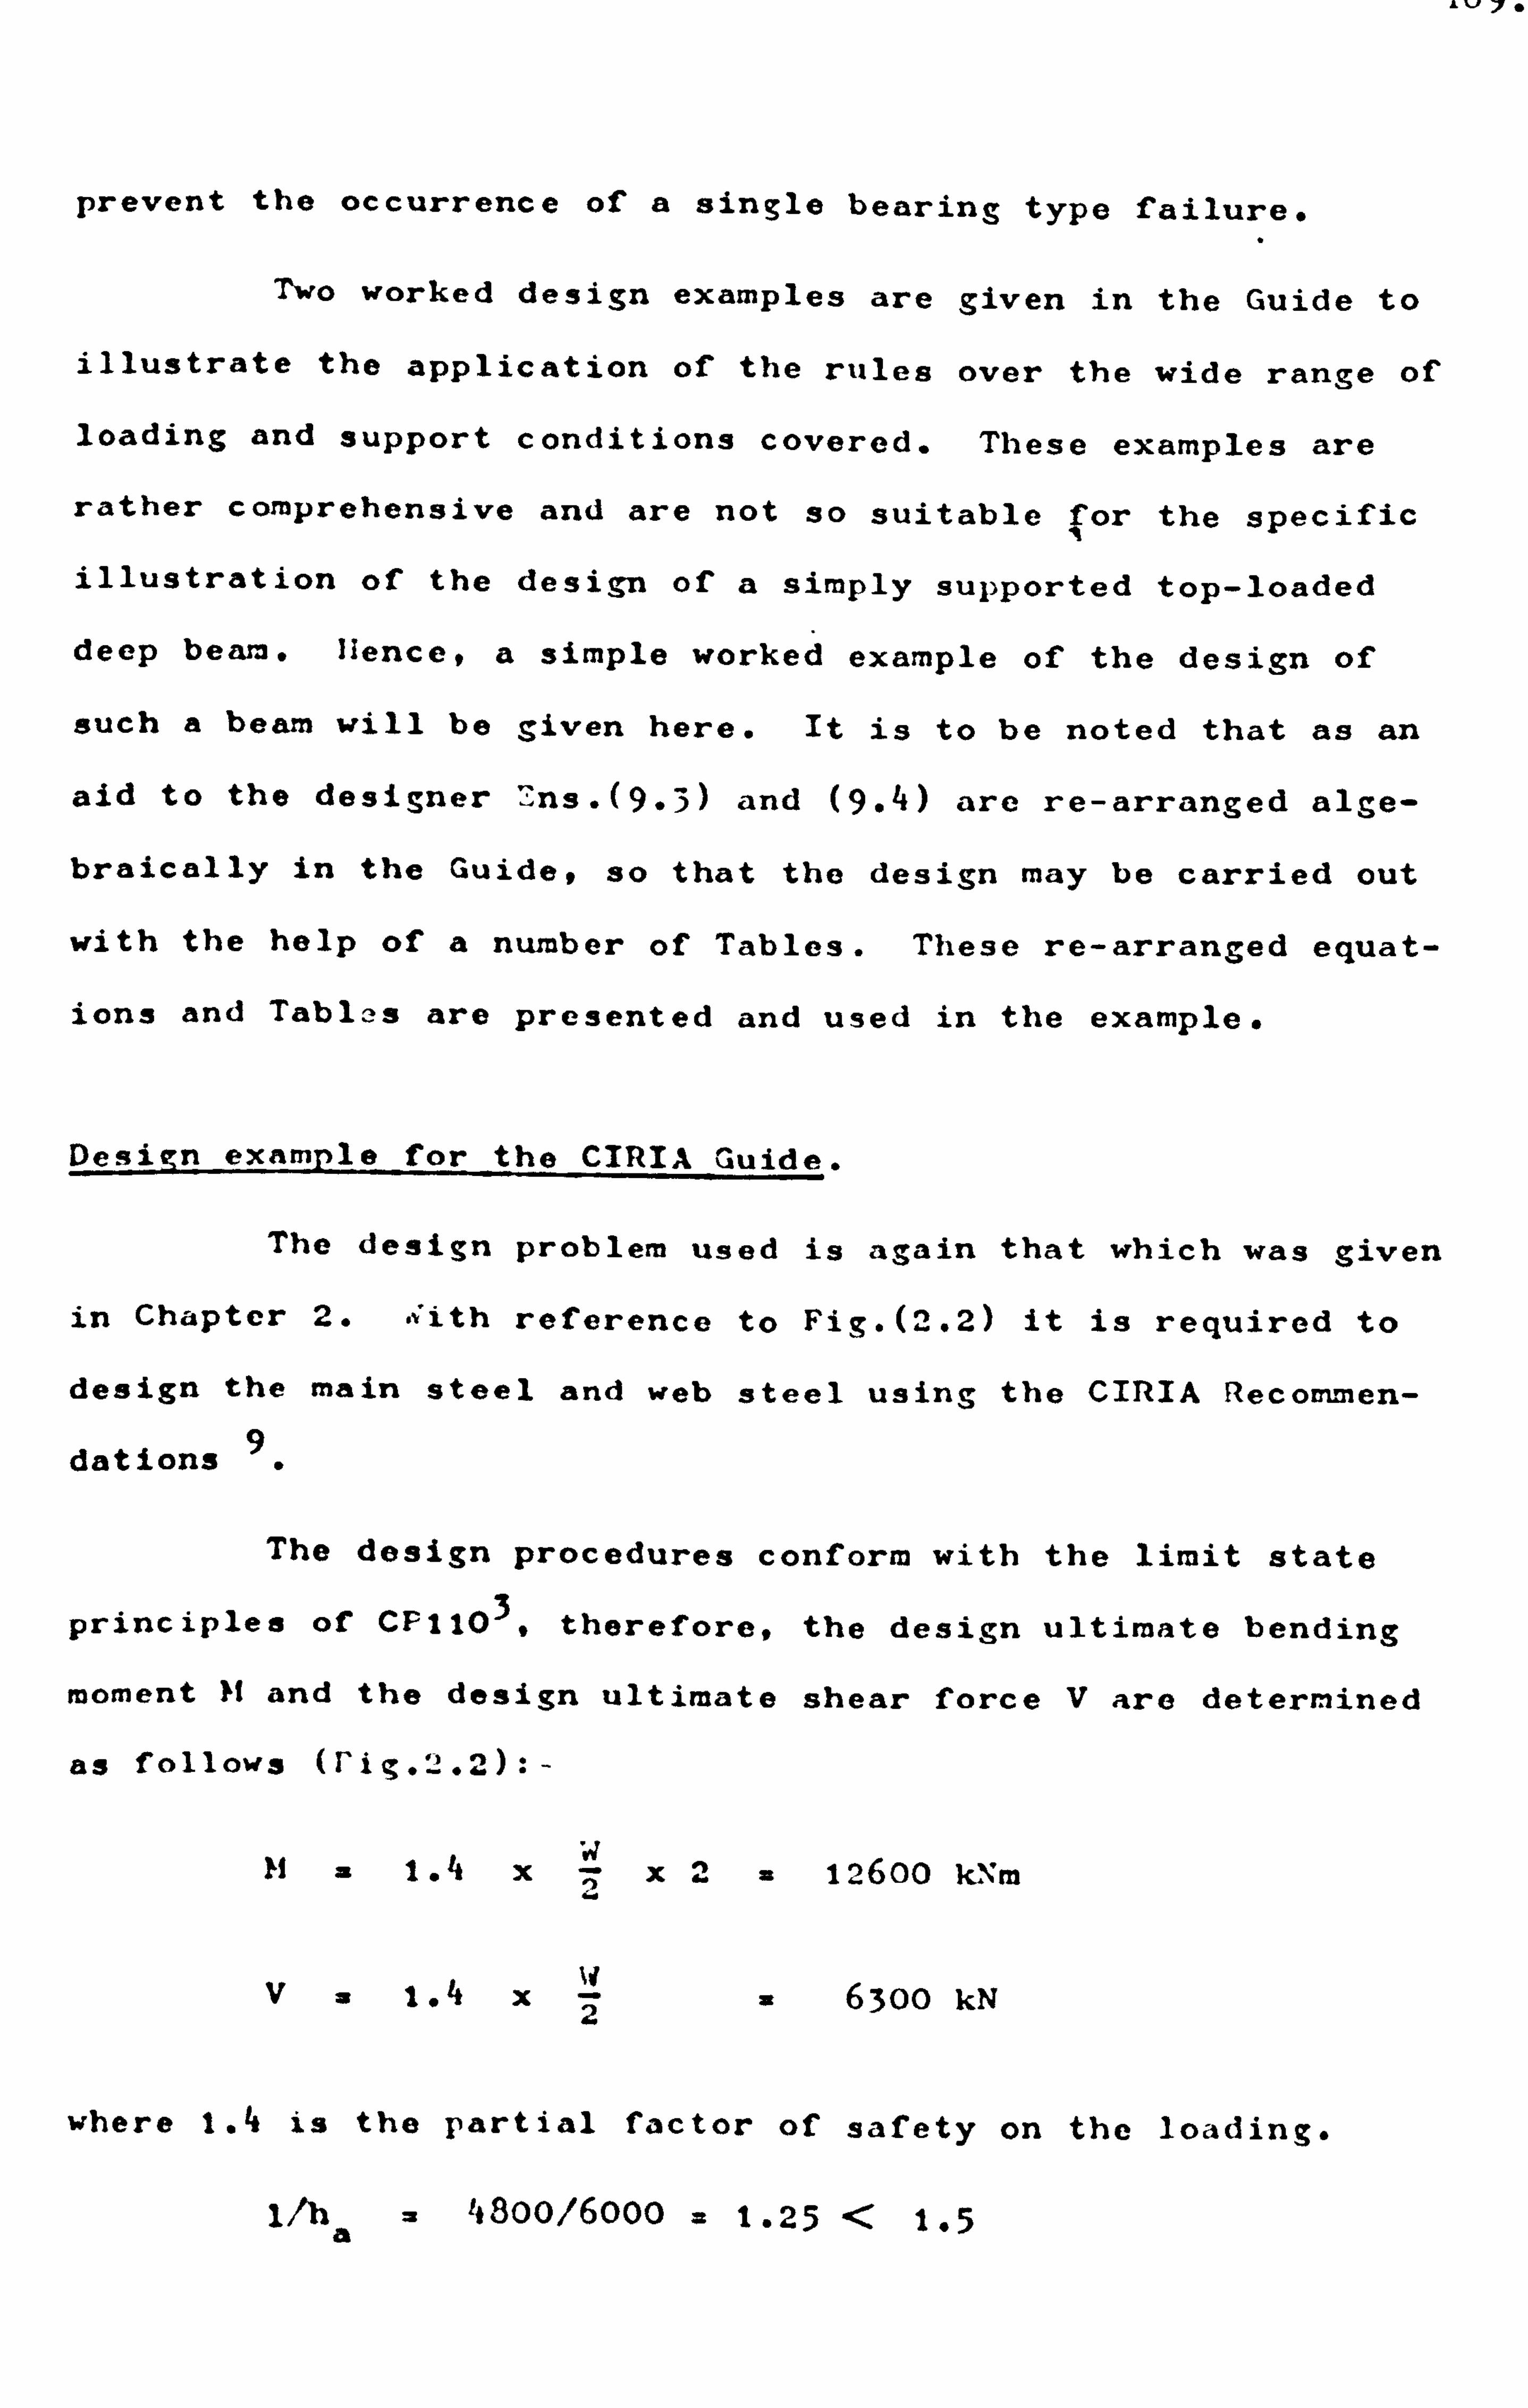
fv 7"
prevent the occurrence of a single bearing type failure.
Two worked design examples are given in the Guide to
illustrate the application of the rules over the wide range of
loading and support conditions covered. These examples are
rather comprehensive and are not so suitable for the specific
illustration of the design of a simply supported top-loaded
deep beam. Hence, a simple worked example of the design of
such a beam will be given here. It is to be noted that as an
aid to the designer -ns. (9.3) and (9.4) are re-arranged alge-
braically in the Guide, so that the design may be carried out
with the help of a number of Tables. These re-arranged equat-
ions and Tables are presented and used in the example.
Design example for the CIRIA Guide.
The design problem used is again that which was given
in Chapter 2. With reference to Fig. (2.2) it is required to
design the main steel and web steel using the CIRIA Recommen-
dations 9.
The design procedures conform with the limit state
principles of CF11O39 therefore, the design ultimate bending
moment It and the design ultimate shear force V are determined
as fo1loW3 (f ig. '2.2): -
?; ai .4XX2a 12600 k. \m 2
V 1.4 x2 6300 kN
where 1.4 is the partial factor of safety on the loading.
1/ha 1*800/6000 = 1.25 < 1.5

live
hence there is no need to check the compression stresses (from
bending) in the concrete.
The area of main steel (A s) required is given by Eqn.
(9.1)
ýs 0.87 fyz
z=0.2 x 6000 + 0.4 x 4800 = 3120 mm.
As= 12600 x 106 11322 mm 2.
0.87 x 410 x 3120
Provide 24 No. 25 wm diameter bars (11782 cunt; p= As
= 0.497, ) bh
a
This reinforcement will be distributed in a band over
a height 0.2 x 4800 = 1000 mm (say) and extend and be fully
anchored across the complete span.
Next, consideration is given to the shear capacity of
the beam.
The 'simple rules' of the Guide 9
are not applicable
for concentrated loads, therefore, the supplementary rules 9
might be used,
Equations (9.2) and (9.3) have been algebraically
re-arranged in the Guide as follows: -
v c=A vX " bh
a
yc Amax
bh a
(ßl vms + ß2 vwh + ß3 vwv ) (9.6)
(9.7)
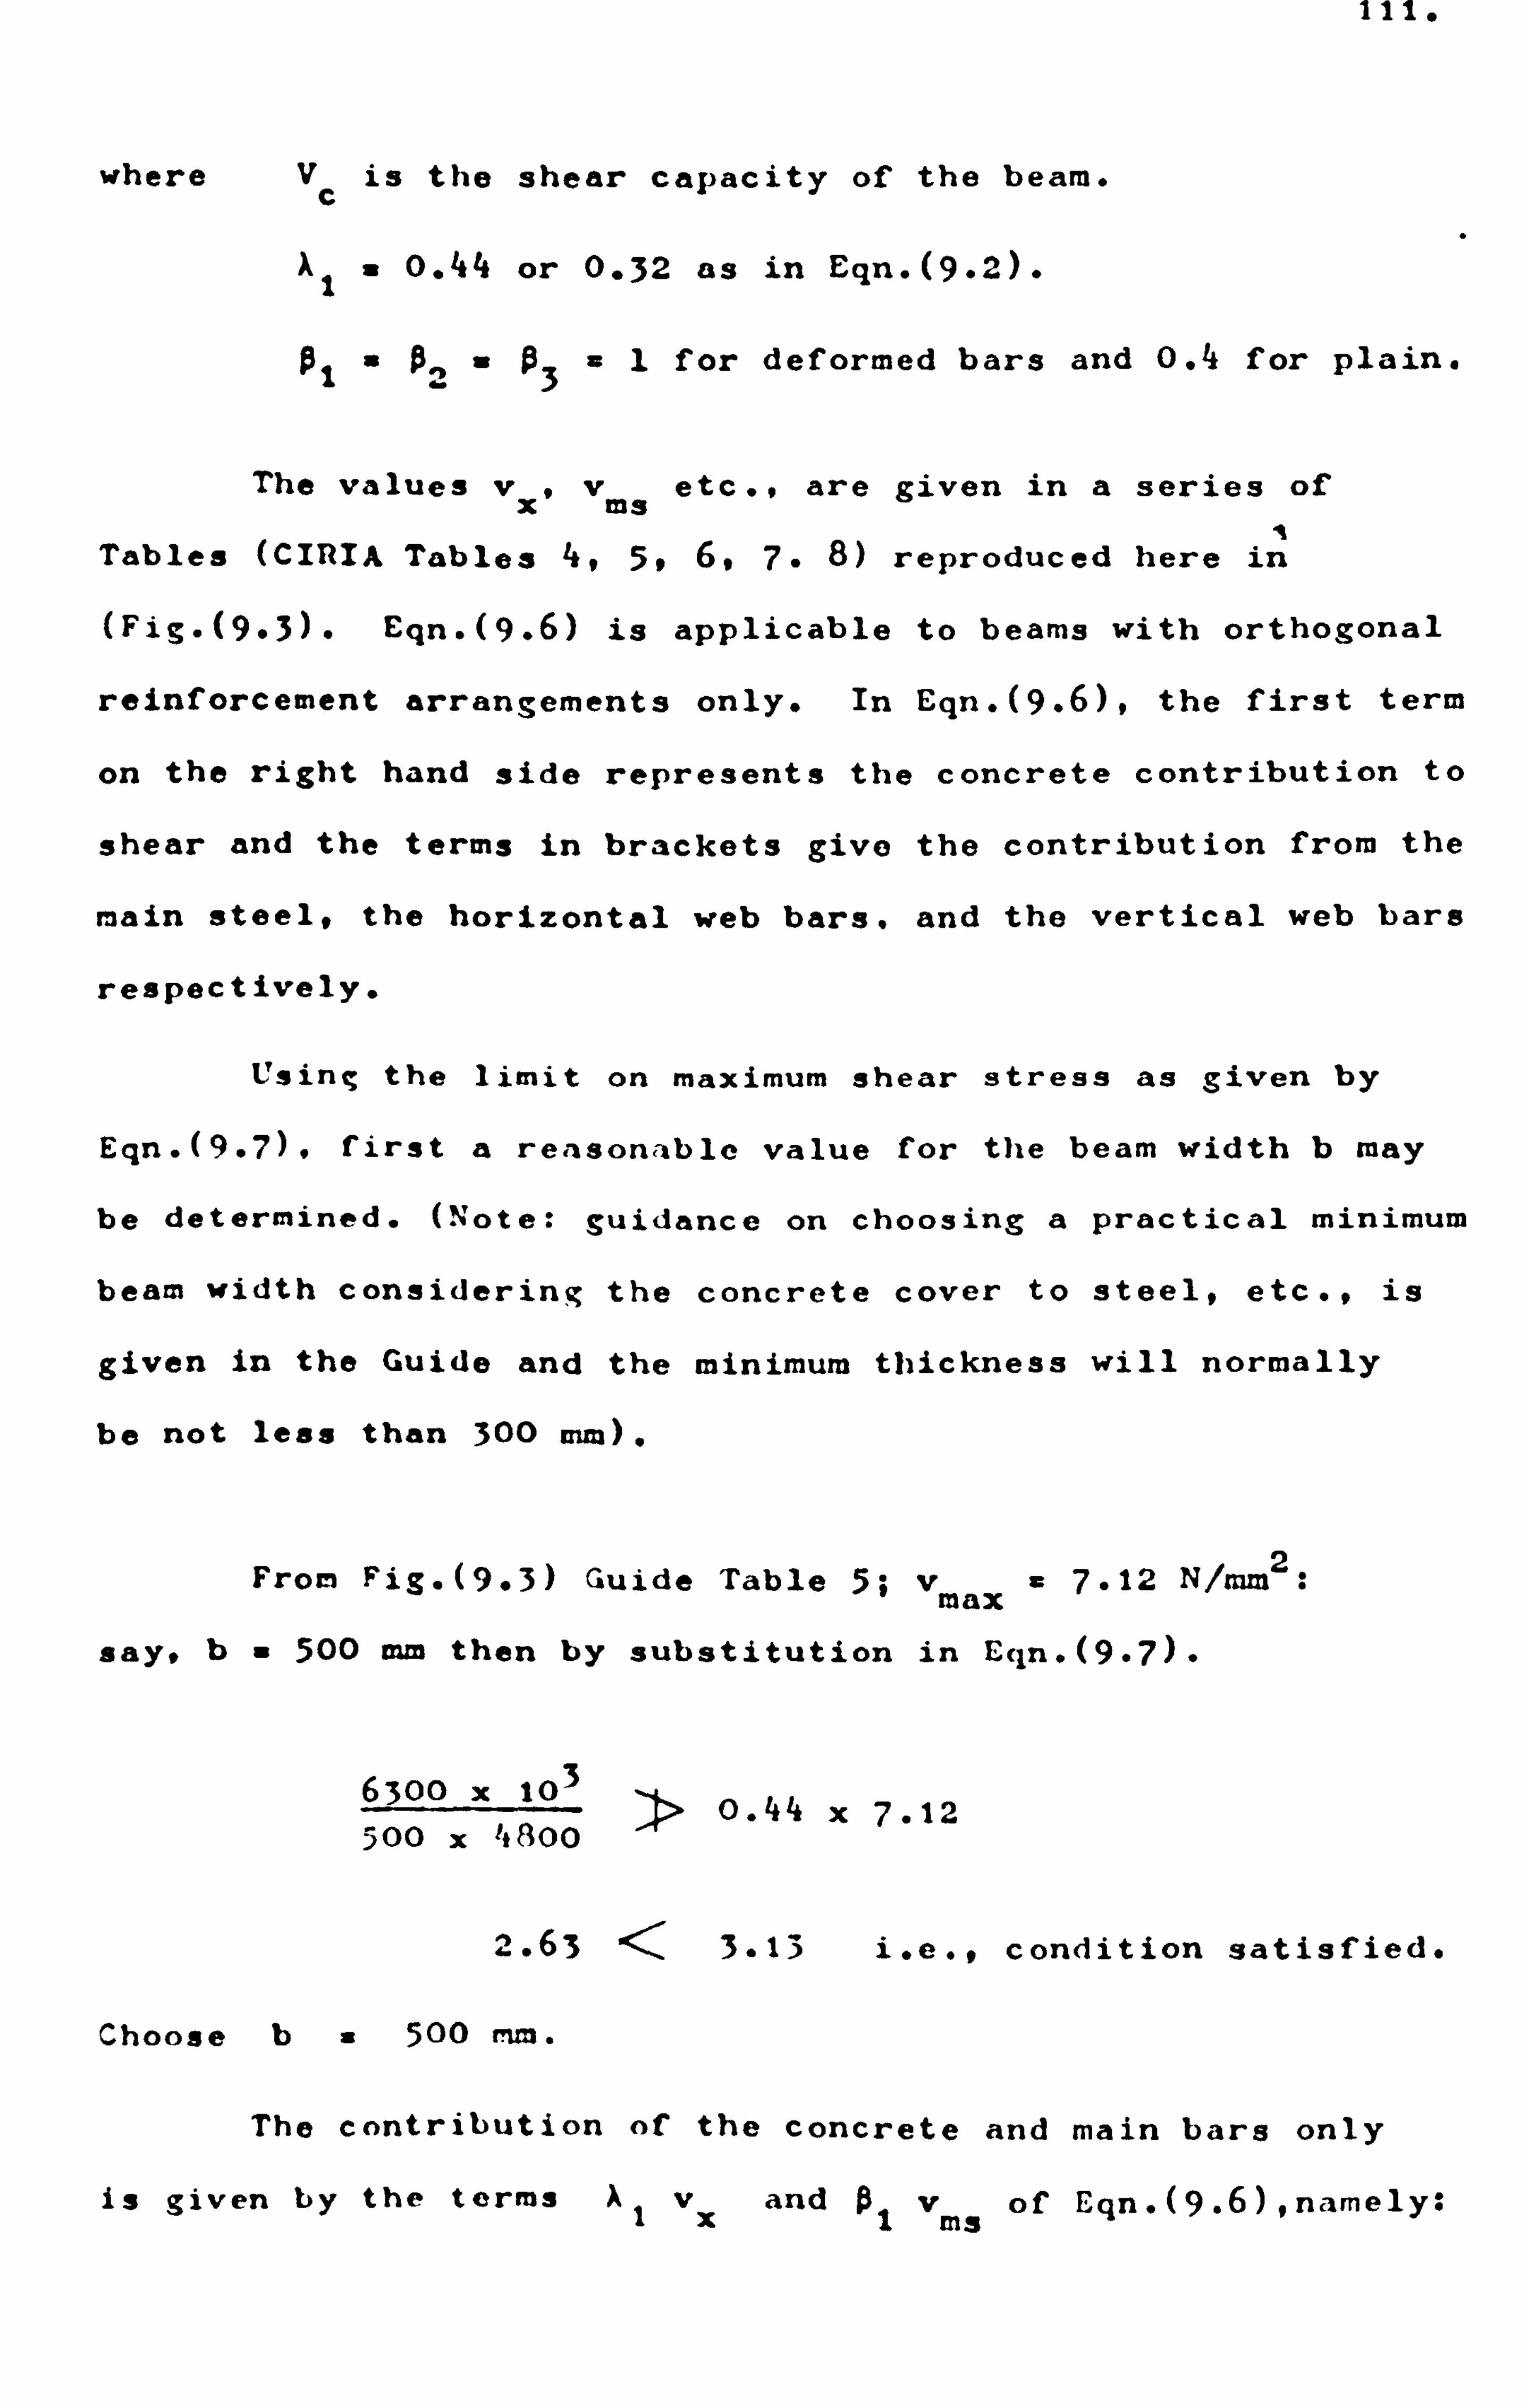
111,
where Vc is the shear capacity of the beam.
x1 : 0.44 or 0.32 as in Eqn. (9.2).
01 a ß2 = ß3 a1 for deformed bars and 0.4 for plain.
The values vx, v ms etc., are given in a series of
Tables (CIRIA Tables 4,5,6,7.8) reproduced here in
(Fig. (9.3). Eqn. (9.6) is applicable to beams with orthogonal
reinforcement arrangements only. In Eqn. (9.6), the first term
on the right hand side represents the concrete contribution to
shear and the terms in brackets give the contribution from the
main steel, the horizontal web bars. and the vertical web bars
respectively.
Using the limit on maximum shear stress as given by
Eqn. (9.7). first a reasonable value for the beam width b may
be determined. (Note: guidance on choosing a practical minimum
beam width considering the concrete cover to steel, etc., is
given in the Guide and the minimum thickness will normally
be not less than 300 mm).
From Fig. (9.3) Guide Table 5; vmax = 7.12 N/mm2:
say, b- 500 Mm then by substitution in Egn. (9.7)"
6300 x 103 > 0.44 x 7.12 500 x 4800
2.63 < 3.13 i. e., condition satisfied.
Choose b 500 mm.
The contribution of the concrete and main bars only
is given by the terms Al vx and 01 vm' of Egn. (9.6), namely:

IIC. .
(0.44 x vx f1x vag) x 500 x 4800 N
Where Fi3. (9.3); Guide Table 4 for fcu = 30 N/mm2 and
x/h = 1400/4800 = 0.29, vx = 4.9 N/mm2
Guide Table 6 for p= ms 0.4959 and x/h = 0.29,
vas = 0.86 N/mm 2
then (2.156 + 0.86) x 500 x 4800 x 10-3 = 7238 kN.
Hence. the capacity of the concrete and main bars only
is sufficient. It may be noted that the main steel bars contri-
bute a significant proportion of shear strength: if, for example,
the main steel for bending had been determined from a more
rigorous equation (than Eqn. 9.1) then it would have been necessary
to provide extra horizontal web bars above the main steel to
compensate for the loss to the shear capacity.
The CIZIA Guide requires in all cases the provision
of a nominal quantity of web reinforcement; 0.25%10 both hori-
zontally and vertically.
'! ith reference to Eqn. (9.6) and Guide Tables 7 and 8
(Fig. 9.3) the contribution given by the nominal mesh is
(0.22 + 0) 500 x 4800 x 10"3 = 528 k. N.
. Qt2l1 V 7238 f 528 a 7766 'C. N
i. e.. V /V = 1.2
The detailing of the reinforcement is shown in

(Note that the CIZIA Suide requires an increased minimum
percentage of reinforcement in the support zones; as mentioned
previously for fy = 410 NIMM 2
and
quired equals (0.8% xbx s) both
where b is the beam thickness and
that it is preferable to continue
vided across the full span).
fcu = 30 N/mm2 the area re-
vertically and horizontally,
s bar spacings. Note also
the horizontal bars so pro-
9.3 COMPARISON OF DESI N LOADS WITH TEST RESULTS
The design ultimate shear loads of those beams tested
herein without web openings have been calculated using the
three comzaonly used design Guides (which were described in
Chapter 2; namely, the CED-FIP Recommendations 5,
and ACI
Building code 4
and the PCA document ST668) and the new (1977)
I
CIRIA design Guide.
By comparing the design shear load with the correspond-
ing measured ultimate load (W it is possible to estimate the
effective in-built factor of safety against shear collapse.
In Table (9.1) the ratios (W1/W4 to W1/W7) represent the factors
of safety for each of the above design methods respectively.
With reference to Table (9.1), it may be seen that the PCA
method is very conservative; the average value for the factor
of safety on the working load is over 6.
The CUB-FIP Recommendations are also rather conser-
vative for those beams with web reinforcement, which would
imply, since a relatively heavy percentage of nominal reinforce-
ment is mandatory, that the minimum factor of safety on the
design ultimate load may be significantly greater than 2.

Z
The ACI and the CIRIA Guides are reasonably less conservative
and are more consistent; and of the two, the CIRIA Guide as
may be seen would result in the more satisfactory design.
As stated in Chapter 2, the earlier workers concentrated
on the elastic analysis of deep beams, and the PCA method,
published in 1946, is based on the results of Dischinger's
theoretical work. The CEB-FIP Recommendations, which are based
mainly on the tests carried out by Leonhardt and Walther, centre
on flexural design and do not give specific guidance on how to
calculate the . reb steel area to resist specified shear forces.
The ACI's recommendations and CIRIA's recommendations are based
on the test studies of Crist, de Paiva and Siess, and the
Nottingham - Cambridge team respectively, both of which centred
on the shear behaviour of reinforced concrete deep beams.
9.4 CIRIA GUIDE: PROVISIONS FOR DEEP BEAMS WITH HOLES
The exhaustive literature study conducted by CIRIA
during the compilation of the Guide 9, failed to find sufficient
test data on the effects of web openings on deep beams. Indeed,
the only reference quoted in the CIRIA Guide is a paper co-
authored by the Author 35. As a result the recommendations
are necessarily restrictive.
%ny opening, which is likely to significantly disturb
the stress pattern that would obtain in a solid deep beam, is
deemed 'inadmissible' under the rules. Typical stress patterns
derived by elastic analysis are given in a series of diagrams
which detail the conditions to be satisfied for an opening to
be considered Iadmissible '. As an example, the diagram which
gives the conditions for a top-loaded beam is reproduced here

Li
in Fig. (9.5). The Guide does not include a diagram for the
two point loading condition if the present tests, but from an
examination of Fig. (9.5) it may be deduced that the spirit of
the iuide's recommendations would result in restrictions similar
to that s'"o", en in Fig. (9.6). It may be seen (Fig. 9.6) that,
except for opening type 11 (Fig-5.2), all of the other openings
in the present tests (cf. Fig. 4.2 and 5.2) o. re deemed 'inadmissible
OpeninZs, that are a'rnissible under the rules, are
assumed by the Guide to be unlikely to disturb the overall be-
haviour of the beam. The Guide, therefore, requires that rein-
forcement around the opening, need only be provided to prevent
local excessive cracking. For this purpose, the opening is con-
sidered to be located in a sensibly uniform, possibly biaxial,
field of stress, . -id the amount of reinforcement required is to
be determined as follows. Each side of the opening is considered
to act as a simply supported deep beam, subjected to the resolved
forces set up within the primary deep beam. This system of
notional deep beams is shown in Fi-. (9.7). The load system
assumed to act on each notional beam is derived either directly
from a consideration of the primary loading or by the use of a
number of principal stress diagrams. One such diagram is repro-
duced here in Fig. (9.8). The load acting on each pair of no-
tional deep beams is determined by calculating, from the given
stresses at the centre of the opening, the total force in each
direction that would have crossed that region in the solid beam
occupied by the opening. Having established the loading system
each notional beam is then reinforced according to the 'simple
rules' as described earlier. Where the principal stresses are

not orthogonal to the opening, the reinforcement is determined
from consideration of an equivalent hole as shown in Fig. (9.9),
which also shows the recommended local reinforcement pattern.
; he origins of the theoretical elastic basis of the
CIRIA provisions for openings would appear to be founded in a
method described by Uhlmann 13 in 1952. Ulhmann's method was
similarly based on a calculation of notional forces acting on
an opening and similarly made use of the elastic stress patterns
obtained for solid deep beams. To determine the design tensile
forces, from which the required amounts of reinforcement would
be calculated, Uhlmann modified the notional forces by stress
concentration factors; these having been derived from a photo-
elastic study of the effects of holes on uniform stress fields.
To sum up this section, it may be broadly concluded
that the results of the tests on deep beams with openings,
which are reported herein, would indicate that the CIRIA pro-
visions for openings should produce serviceable designs. It
has been stated 35
that 'the effect of an opening on the ulti-
mate stren,; th of a deep beam depends primarily on the extent
to which it intercepts the load path joining the load bearing
blocks at the loading point and at the support reaction point':
hence, by definition, the type of small opening considered
'admissible' by the wide has little effect on the overall
behaviour of a beam and ht-nce on the ultimate limit state. As
regards the provisions for the design of the reinforcement
around the 'admissible' opening; it does seem that these are
rather over elaborate when it is considered that their purpose
is to attempt to satisfy serviceability limit state conditions.

117.
Indeed, the elastic assumptions on which the reinforcement
provisions are based, are only applicable at best, to the
service load condition.
In the absence of any specific test evidence on the
behaviour of small 'admissible' openings, it may reasonably be
inferred from the broad experience gained from the present
range of tests, that the serviceability problem of possible
local cracking at such openings could be solved simply by a
provision which specified a minimum gnntity of nominal rein-
forcement. The amount of reinforcement required might be con-
servatively based on the 'lost' tensile capacity of the opening;
that is (a) x (b) x (ft) where (a) is the dimension of the open-
ing for the direction being considered; (b) is the beam thick-
ness; and (ft) is the tensile strength of the concrete (or
assume say (ft) = 0.52 fcufor normal weight concrete). For
example, taking fy a 410 N/mm` and fcu = 30 N/mm` the percentage
of reinforcement along each side of the opening (size say (a)
x (a)) would be 1 (0.52 /0.87 x 410) x (a) x (b) x 100
0.44o: x (a) x (b). It is recommended here, that bars detailed
to trim the opening should be fully anchored and preferably
extend at least a length 2x (a) each side of the opening, to
ensure an effective distribution of the tensile forces into the
surrounding concrete. (Note: the tests reported herein demon-
strated that too local a system of reinforcement(for example
Fig. (5.1) and Fig. (6. i): web reinforcement Type 5) - and this
could include the one recom-, ended by CIIIIA (Fig. 9.9) - might
not be satisfactory).
'here the location or size of a particular opening is

118.
unavoidable and it is such that it fails to satisfy the
admissibility criteria given in the Guide, then consider-
ation has to be given to the opening's possible effect on
the ultimate limit state capacity. The tests reported
herein have demonstrated that the best thing then is to
consider the actual failure mode, but this is not easy
because engineers do not yet have sufficient experience
with deep beams. However, it is suggested that the proposed
structural idealization given in Chapter 7 of this thesis
and the simple design method presented in Chapter 8 are
useful in this respect. The proposed structural ideal-
ization should prove a powerful tool to the designer. both
for the visualization of the load transfer mechanism in
deep beams with openings and for the prediction of their
ultimate strengths.

C11 APTERTEN
CONCLUSIONS AND SUGGESTIONS FOR FURTHER RESEARCH
10.1 CONCLUSIONS
10.2 SUGGESTIONS FOR FURTUER RESE'1RCH

li9.
CHAPTERTEN
CONCLUSIONS AND SUGGESTIONS FOR FURTHER RESEARCH
10.1 CONCLUSIONS
The design of"reinforcod concrete deep beams with
web openings is not yet covered by the major codes of
practice, stich as CP1IO: 1972, AC1318-71, and the CED-FIP
Recommendations (1970). Little information is available
in the literature on the effects of web openings, and as
a result the provisions for the design of deep beams with
web openings as given in the (new) CIRIA guide are necessar-
ily restrictive.
It is hoped that the conclusions of the research
work presented here will be of direct use to engineers
engaged in this branch of reinforced concrete design and
that it will assist in the advancement of this aspect of
engineering science.
It is to be noted that discussions of some of the
experimental results have already been presented elsewhere
35,6; The following list of conclusions is based on the
sum total of the work reported herein, which included tests
to destruction carried out on 79 reinforced concrete deep
beams:
(i) The effect of a web opening on the ultimate shear
strength, on crick widths, and on deflection depends prim-
arily on the extent to which the opening intercepts the
natural 'load path' joining the loadbearing blocks at the

120.
loading point and the support reaction point, and on the
location at which this interception occurs.
(ii) Where the opening is clear or reasonably clear of
the 'load path' mentioned in paragraph (i), the ultimate
shear may be estimated from Egn. (7.1). Where the opening
intercepts the 'load path' the ultimate shear strength may
be estimated from Eqn. (7.2).
(iii) Web reinforcement substantially increases the ult-
imate load capacity of deep beams with web openings, but
proper detailing of the reinforcement is critically import-
ant. Inclined web reinforcement is the most effective type
as regards both ultimate shear strength and crack width
control. Local reinforcement in the form of bars trimming
the openings has little effect on ultimate shear strength.
(iv) The general behaviour of normal weight concrete and
lightweight concrete deep beams is very similar, and any
differences in cracking loads and in ultimate shear strengths
may be accounted for by the difference between the potential
tensile capacity of structural normal weight concrete and
that of structural lightweight concrete.
(v) The simple design method suggested in this thesis is
reasonably satisfactory and is applicable to a wide range
of opening locations. The proposed structural idealization
should prove a powerful tool to the designer, both for the
visualization of the load transfer mechanism in deep beams
and for the prediction of their ultimate strengths.
10.2 SUGrFSTIONS FOR FUItT)IER RESEARCH
(i) The size of the test specimens used in the present
121.
investigation was as large as was compatible with the range
of variables investigated. Further selective tests using
large scale specimens are required to confirm that the
present results are not affected by scale.
(ii) Inclined web reinforcement ýs more expensive to bend
and fix than conventional orthogonal mesh reinforcement
but the performance of inclined reinforcement is signifi-
cantly better than all other types used in current practice.
Further tests to investigate the optimum percentage of
inclined reinforcement would be valuable.
(iii) Taylor 61
of the Cement and Concrete Association has
conducted some special tests on ordinary shallow beams in
shear, and made some useful deductions about the relative
significance of the various shear parameters, such as
aggregate interlock, dowel action, and the compression zone.
Parallel tests of deep beams may lead to some interesting
observations.
(iv) The results of the exploratory tests on end anchorage
of the main steel (Appendix 1) have indicated that further
tests are desirable to establish design criteria for an-
chorage requirements in deep beams.
(v) The deep beam data collected by the Nottingham -
Cambridge team would seem to be the most comprehensive to
date and would justify further detailed examination and
re-evaluation, which might well lead to yet a better under-
standing of deep beam behaviour and a yet more efficient
design procedure.

AP I' ENDIXONE
ANCHOR %GE OF TENSION REINFORCEMENT IN LI! 'i}{TW'EICG}IT CONCRETE DEEP BEANS
A1.1 INTRODUCTION AND BACKGROUND
Al .2 TEST PROGRAMOME
41.3 TEST RESULTS
A1.3.1 Deflection control
x1.3.2 Crack control
4,1.3.3 Crack patterns and modes of failure
%1.4 GENERAL COMMENTS

122.
APPENDIXONE
ANCHORAGE OF TENSION REINFORCEMENT IN
LIGHTWEIGHT CONCRETE DEEP BEVIS.
A1.1 INTRODUCTION AND BACKGROUND
It would seem that, -for some time yet, the design
assumptions regarding the end anchorage requirements of the
longitudinal tension reinforcement must remain rather conser-
vative, because extensive surveys 6,7,9-12
have confirmed that
very few systematic investigations have been carried out to
provide information on the effects of various amounts of end
anchorage on the strength and crack control of deep beams. For
example, many of the conclusions previously reported were based
on tests in which end-anchorage failure had been precluded by
anchoring the longitudinal tension bars to steel blocks 11,12,24
`6, or by using other devices
64
In deep reinforced concrete beams, the full tensile
force must be developed in anchorage at the supports, because
of the arch action behaviour which is thought to occur at
ultimate loads 24 "5. Untrauer and Henry 66
have reported that
pressures normal to the tension reinforcement may have signifi-
cant influenc* on bond strength: in tests made on 37 pull-out
specimens, which were subjected to a range of normal pressures,
the bond strength was found to increase in proportion to the
square root of the applied normal pressure 66
At the University of Nottingham. tests recently
carried out by Singh 12 have indicated that the usual design

1'23.
assumptions. regarding end anchorage of the main steel in deep
beams, might be unnecessarily conservative. In a test programme
consisting of 24 lightweight concrete deep beams, the amount of
end anchorage provided for the main longitudinal tension steel
was varied systematically from zero to an embedment length of
'twenty-five times bar diameter. In all of the beams web rein-
force-nent was provided; either inclined web reinforcement or an
orthogonal mesh satisfying Section 11.9.6 of AC1318-71 4. (Fig.
A1.1).
Singh's tests provided some valuable information
on deep beam behaviour but it was not clear what effects the
provision of web reinforcement had had on the requirements for
end anchorage, particularly as analysis of the flexural strengths
showed that the quantity of web reinforcement provided could hive
contributed as much as 50: & of the ultimate flexural strength.
It was therefore desirable to supplement Singh's test programme
with further tests on compar: tble deep be_t. ns but without web
reinforcement. In this %ppendix, the details and results of
nine follow-up tests are given, and general observations are
drawn from the evidence of all thirty-three tests.
%1. A TEST I AOC R a? C! r.
The test specimens were designed to be complement-
ary to Singh's 12 tests and as previously
12 , in planning the
test I. rogramme where reference to a code of practice was des-
it ble, %CI318-71 4
was used as the main guide (the current
British Code CP110: 1972 ;
does not yet cover deep beams).

124.
The test specimens consisted of 9 simply supported
sintered-fly-ash lightweight concrete deep beams
Table %1.1)" of width b 102 mm and overall depth
the beams were cast in Imperial sized moulds).
span lengths L were used: 1524 mm span in three
clear-shear-span/depth ratio x/D of 0.55 and 952
beams with an x/D ratio of 0.30..
(Fig. A1.2 and
D 762 mm (Note:
iwo different
beams with a
I rum in six
The concrete materials and proportions, reinforce-
ment properties and other general experimental details were the
same as those given in Chapter 3" Details of concrete strengths
are given in Table (A1.1).
The main longitudinal reinforcement in each beam
consisted of two 8 aim dia. deformed bars; no web reinforcement
was provided. These bars were anchored by different embedment
lengths beyond the centre line of the support reaction (Table
A1.1. Column 4). In those bears with an x/D ratio of 0.3, the
anchorage was either an %CI standard hook (: \C1318-71: Section
7.1.1.1)4 or one of the following embedment lengths: 25 times
bar diameter db, 20 db, 15 db. 10 db, or nil, plus one of (25 db
+ standard hook). In those beams with an x/D ratio of 0.55.
the anchorage was either a standard hook or 10 db embedment
length or nil. The equivalent embedment length of a standard
hook. computed from iection 12.3.2 of , 1CI318-71, is 17.25 db.
Hence all the embedment lengths used in the tests (except for
the one beam with 25 db+ hook) were substantially less than the
development length 1d specified by Section 12.5 of ACI318-71,
which is 305 mm (12 in), i. e., 38.1 db for 8 can diameter bars.
Details of the test procedures and equipment have

1'25
been given in Chapter 3" Briefly, the loads and reactions
(Fig. A1.2) were applied through circular rollers and 102 x
89 x 29 mm steel bearing blocks bedded to the concrete with
quick setting plaster. One of the support reaction assemblies
was specially mounted on steel rollers to give freedom for a
larger range of axial translation (Fig. A1.5, see Beam 0-0.3(0)
for example, left hand support).. -Central deflections were
measured with 0.01 mm dial gauges, compensation being made for
support settlements as measured; crack widths were measured
with a hand microscope of 25 magnifications.
A1.3 TEST RESULTS
A1.3.1 Deflection control
Fig. (A1.3) shows that within the individual series
of each group of beams with the same x/D ratio, progressive
reduction of the embedment length of the tension reinforce-
ment did not increase deflections by significantly large amounts.
. Ui of the beans exhibited a marked increase in deflections at
the load producing the first flexural crack, indicating that
the tension bars yielded at the first-cracking load. Beams
0-0.55(0) and 0-0.30(0) failed prematurely as a result of
complete loss of end anchorage. Apart from these two beams,
the effect of the amount of end anchorage was not clearly
observable.
A1.3.2 Crack control
The flexural cracks were usually widest at the beam
soffit at formation, but after a few more load increments the

b.
widest part of a flexural crack was always about 150 mm to
300 mm up the soffit, irrespective of the embedment length.
Fig. (A1.4). shows that the crack widths were usually as wide
as I mm at formation, and the cracks opened up to about 10 mm
before ultimate collapse occurred. As in the case of deflection
control, Fig. (A1.4) shows that the anchorage of tine tension re-
inforcement did not have a clearly observable effect except for
Beams 0-0.55(0) and 0-0.30(0) which had zero embedment lengths
and failed prematurely.
A1.3.3 Crack patterns and modes of failure.
The tests showed the crack pattern and failure
mode (Fig. (A1.4) were not influenced by the amount of end
anchorage, except that the two beams 0-0.55(0) and 0-0.30(0)
failed by the pulling-out of the tension reinforcement. The
failure node in all of the other beams was in flexure: collapse
was preceded by yielding of the reinforcement and a single
central flexural crack, to which all other flexural and inclined
flexure-shear cracks were like tributaries, penetrated the com-
pression zone to within 25 mm of the beam top to cause crushing
of the concrete adjacent to the loading point. Similar flexural
failures for beams with small amounts of tension reinforcement
(0.125' in the present tests) have been reported by others,
for example, Leonhardt and Walther (see Chpt. 1.2.2.2). It is
noted that the diagonal splitting type cracks which caused
failure in those solid beans without web reinforcement reported
in Chpts. 4.5 and 6 did not occur. In those beams the amount of
tension reinforcement provided was O. 42%.

127.
AI-3-4 Ultimate loads
Table (A1.2) shows the measured ultimate loads
and, again, except for Beams 0-0.55(0) and 0-0.3(0). no
observable effects of the amount of end anchorage were evident.
knalysils of the ultimate loads showed that at
collapse the stress in the reinforcement approached the ultimate
tensile stress of the steel. In the flexural design of deep
beams, the usual procedure in current practice is to calculate
the main steel requirements on the basis of an assumed value
for the internal lever arm of approximately 0.6D. where D is
the overall depth. For example, in the new CIRIA design guide 9
the lever arm z is taken as z=0.2 L+0.3D and the required
amount of tension reinforcement As is given by
As a Al
0. H7 fyz (see Chapter 9: Eqn. 9.1)
In Column 2 of Table (A1.2) the ratios of measured
ultimate load to the design load according to the equation given
above are pregccnted, and it may be seen that there is an in-built
factor of safety on collapse of approximately 3 for beam with
x/D of 0.3, and 2.3 for beams of x, -D equal to 0.55.
11. ßt *1 iL CO \T3
The tests here reported together with those of
Singh 12 were necessarily exploratory in nature; hence it is
desirable to sumadrise the main observations rather than draw
firm conclusions. It was observed that: 37
1. The progressive reduction of the end anchorage of the tension

1 28.
reinforcement down to an embedment length of ten bar diameters
did not produce clearly observable detrimental effects on
ultimate loads, maximum crack widths, or deflections
2. Within each series of test beams, an embedment length of
ten bar diameters was not less efficient than an ACI standard
hook.
3. The present tests showed that web reinforcement as provided
in Singh's beams could contribute significantly to the flexural
strength. The provision of an orthogonal mesh satisfying Sect-
ion 11.9.6 of ACI 318-71 or of an equivalent amount of inclined
web reinforcement could almost double the ultimate load.
Observation 3 above follows from the laws of
equilibrium, which are unaware of the designer's distinction
between "flexural reinforcement" and "shear reinforcement".
Observation 2 was unexpected, and Observation 1 indicates that
the current assumptions regarding the end-anchorage require-
ments of the tension reinforcement are possibly too conservative,
particularly for deep beams with web reinforcement ( and, in
practice, the provision of a proper system of web reinforcement
is virtually mandatory). However, it is not prudent to recommend
a relaxation of the current end-anchorage requirements on the
evidence from one test programme. The ACI Committee 408 has
called for further experimental research on bond and develop-
ment in lightweight concrete structural elements 52
and the
ACI Committee 439 has also pointed out that "there has been
little experimental research on the bond strength of reinforcing

i-19
bars with a minimum yield strength greater than 414 N/mm2
(60 ksi)� 65.
It is hoped that. together with Singh's
tests at Nottingham, the test results presented herein,
besides providing information on deep beam behaviour,
will stimulate others to further investigations. It does
seem that the anchorage capacity of the tension reinforce-
ment might be significantly increased in the presence of
the high compressive stresses in the support regions of
deep beams.

APPENDIXTWO
SHEAR STRENGTH OF LIGHTWEIGHT DEEP BEAMS
SUBJECTED TO REPEATED LOADS
A2.1 INTRODUCTION
A2.2 TEST PAOGR. t !E
A2.2.1 Test specimens
X2.2.2 Testing
A2.3 TEST RESULTS
A2.3.1 Deflection and cracl: widths
A21.3.2 Crack patterns and modes of failure
A2.3.3 Ultimate loads
A2.4 SUMMARY

130.
APPENDIX2
SHEAR STRENGTH OF LIGHTWEIGHT DEEP BEAMS
SUBJECTED TO REPEATED LOADS.
A2.1 INTRODUCTION AND BACKGROUND
Recent literature surveys 9111
have shown that
little teat data are available on lightweight concrete deep
beams subjected to repeated loadings. Indeed, the effect of
repeated loading on all types of structural reinforced concrete
members has received scant consideration from codes of practice:
codes merely mention that vibrations should be considered, but
without stating how. Contrary to general opinion. Crockett 67
has recently claimed that reinforced concrete structures designed
to current codes may collapse under fatigue loading conditions
and that the number of load applications should be as important
a design factor as load magnitude if progressive cracking and
failure is to be avoided.
At the University of Nottingham an exploratory
programme of repeated load tests was carried out by Singh 12932
on i8 lightweight concrete deep beams. The aims of the pro-
gramme were to investigate whether the various static shear
strength formulas proposed for deep beams could be applied to
lightweight beams which had a repeated-load history, and to
compare the relative effectiveness of three types of web rein-
forcement under the repeated loading condition. From the results
of the tests, it was observed that the loadeyelings had no
appreciable over-all effects on the ultimate shear strengths.

ijl.
However, it was suggested that it would seem desirable to
investigate the effect of substantially increasing the number
of cycles.
In this Appendix, the details and results of three
further tests carried out to supplement Singh's test programme
are presented. In these tests the repeated-loading history
given to each beam consisted of 520,000 cycles; in Singh's tests
each beam was subjected to 45,000 load cycles. Whenever possible
the results of the present tests are discussed in relation to
the previous tests carried out by Singh.
A2.2 TEST PROGR»? CIE
A2.2.1 Test specimens
The test specimens (Table A2.1) consisted of 3
sintered fly-ash lightweight concrete deep beams of constant
thickness b equal to 76 mm; the other dimensions are as shown
in Fig. (A2.1). Each beam was designed to be identical to one
of Singh's 32 test specimens. The longitudinal tension rein-
forcement in each beam consisted of one 20 mm diameter deformed
bar of yield stress 4iO N/mm2 6 mm deformed bars of yield
stress 445 N/mm were used for all web reinforcement. The
three types of web reinforcement were used as shown in Fig. (A2.1)
(A) An orthogonal system satisfying the steel ratio requirements
of Section 11.9.6 of ACI318-71 (as given here in Chpt. 2.2.2);
(E3) An orthogonal system in which the horizontal stirrups were
more closely spaced near the beam soffit, and (C) An inclined
. system, which had previously been found to be highly effective

ýJý"
for static loading condition 28,29,31
The web steel ratio
pweb for all the beams was kept constant at 0.012, being 3 times
the minimum value specified by Section 11.9.6 of AC1318-71.
The general experimental details of beam manufacture
were the same as those given in Chapter 31 Details of concrete
strengths are given in Table (A2.1).
A2.2.2 Testing
Two-point top loading (Fig. A2.1 and Fig. A2.5)
was applied through hydraulic pulsatable jacks; steel load-
bearing blocks of size 89 x 76 x 29 mm were used. Each beam
was first loaded, statically, to the ACI design load, 2 Vu,
where Vu is the design shear force computed from AC1318-71
(see Chapter 2.2.2). The load was then cycled in stages at
a frequency of about 10 cycles per minute. Stage 1 consisted
of 120,000 cycles between the ACI load and 0.5 ACI load. The
load was next increased statically to 1.25 times the ACI load
and Stage 2 cycling was applied; this consisted of 300,000
cycles between 1.25 ACI load and 0.5 ACI. For the first of
the three beams tested, Beam C-2/0.4, the load was then in-
creased statically until collapsed occurred. For Beams
A-2/0.4 and 8-2/0.4 a third cycling stage was introduced prior
to loading to collapse; Stage 3 consisted of 100,000 cycles
between 1.5 ACI load and 0.5 ACI load.
A2.3 TEST ltr: SU'LTS
A2.3.1 Deflection and crack widths

1 i>.
In Fig. (. 12.2) and (A2.3). the mid-span deflections
and maximum diagonal cracks widths are, respectively, plotted
against the applied loads. Figure (A2.2) shows that deflections
increased during each stage of load cycling. During Stage 1
the initial central deflection was increased by about 25% for
Beam . 1-2/0.4 and ©-2/0.4, but substantially less for Beam C-2/0.4,
13%. In Stage 2 the increase in -deflection was comparable for
all three beams, being about 20':. Stage 3 produced much smaller
increases in deflection, about 6?. These increases in deflection
were significantly greater than the increases observed in the
previous tests: however, in Fig. (A2.4) the overall deflection
behaviour of both the present and corresponding previous tests
are compared, and it would seem that the increased repeated-
loading history had very little overall effect (excluding the
inexplicably poor performance of iingh's beam C-2/O. 4'). It
is also to be noted that no appreciable difference in the effect-
iveness between each type of web reinforcement was observable,
and that the deflection just prior to collapse was in any case
small, being only about 3 mm in each beam (1/500 times the span).
%2.3.2 Crack patterns and modes of failure
The crack patterns at failure are shown in Fig. (A2.5).
In Beams %-2, '0.11 . %nd B-2/04. which contained. respectively,
a mesh system and a modified mesh system of web reinforcement
(Fig. %2.1). diagonal cracks formed before the Stage 1 cycling
at the 1CI load. In Beam C-0.2/01 the diagonal cracks occurred
generally during the load cycling and the effectiveness of
the web reinforcement in controlling the growth and

134 .
propagation of diagonal cracks is evident from the appearance
of the crack pattern, which shows a large number of relatively
small discontinuous cracks. The widths of these diagonal cracks
remained small up to collapse, whereas the web reinforcements
in Beam A-2/O. 4 and B-2/O. 4 were not so efficient; and the
maximum diagonal crack widths for these beams exceeded 0.4 mm
just prior to collapse (Fig. A2.3).
The failure modes of the beams were similar to
those previously observed by Singh 32. In all of the beams
substantial crushing of the concrete occurred at collapse. In
Beam C-2/O. 4 (Fig. A2.5) flexural cracks penetrated into the
compression zone below the loading point to cause an extensive
crushing failure there. In Beam B-2/O. 4 the failure mode would
seem to be a pure bearing type failure at the supports, although
cine-film records of Singh's tests have showed that such crush-
ings were preceded by the penetration of diagonal cracks into
the concrete zones near the bearing blocks 32. In Beam A-2/O. 4,
diagonal cracking, accompanied by crushings at the loading and
support points, caused the beam to be split into two. It is
worth mentioning that at collapse the bearing pressures at the
supports and loading points in all of the beams were greater
than the cube strength of the concrete; the average bearing
pressures were 52 N/mm2 compared with cube strengths of 43 N/mm2
(Table A2.1).
t2.3.3 Ultimate loads
The measured ultimate loads together with the
computed ACI design loads and the measured diagonal cracking

15).
loads are shown in Table (\2.2). The results. being not
significantly different to the measured ultimate loads in
Singh's tests (Table %2.2: Column 5), would indicate that the
increased repeated load history had little effect on ultimate
strengths. In connection with tho ACI load computations, it
should be pointed out that Sect ons 11.9.5 and 11.9.6 of
. ACI318-71 do not cover the web reinforcement types D., and Co
however, in the computation of the ACI load here, the contri-
bution of types D and C web reinforcement was assumed to be
the same as that of type A web reinforcement. This approach
was thought to be more reasonable than neglecting any web
reinforcement not covered by %CI318-71.
A2.4 SUI . %RY
The three tests reported herein were specifically
designed to supplement similar previous tests carried out at
Nottingham. The results of the tests would indicate that the
observations previously recorded were not affected by the
substantial increase in the number of loading cycles. However,
it should be mentioned that fatigue failure in reinforced
concrete normally follows gradual increase of cracking and de-
flection as progressive bond failure occurs between steel and
concrete. In both the previous and the present tests, the main
steel reinforcement was inchored to steel bearing blocks and
deformed reinforcement bars were used. These two factors, which
have 4 substantial influence on bond, may have contributed to
the observed overall lack of sensitivity to repeated loading.
Further testing of reinforced concrete deep beams with plain
mild steel reinforcement would be valuable.

136.
REFERENCES
1. KONG, F. K., and SHARP, G. R. Reinforced concrete deep
beams with web openings. Paper presented at Cambridge
University Mechanics Colloquium, 8 November 1973"
2. STEVENS, A., et al. (Draft) Design guidance for
deep beams. Prepared under CIRIA's supervision,
Ova Arup and Partners, 1975 (see also reference 9)"
3. BRITISH STANDARDS INSTITUTION. CP 110: Part 1: 1972.
The structural use of concrete. London. pp. 154.
4. ACI COMMITTEE 318. Building code requirements for
reinforced concrete: . ACI 318-71. Section 11.9 -
Special provision for deep beams. Detroit, American
Concrete Institute. 1971. pp. 78.
5. COMITE LUltOPEEN DU BETON AND FEDEI ATION INTERNATIONALE
DE LA PRECONTRAINT. CE©-FIP International recommendations
for the design and construction of concrete structures.
pp. 80. Appendix 3: International recommendations for the
design and construction of deep beans. London, Cement
and Concrete tssociation, 1970. pp. 17-24.
6. %NON. Bibliography on deep beams. London, Cement and
Concrete 8ssociation, 1969. pp. 8. Library Bibliography
No. Ch. 71.
ý. AL©RITTON. G. E. Review of literature pertaining to the
analysis of deep beams. Vicksburg, U. S. Army Engineer
'daterways Experiment Station, November 1965. pp-80
Technical Report No. 1-701.

137.
8. PORTLAND CEMENT %SSOCIATION. Concrete Information
ST66: design of deep girders. Chicago 1946.
9. OVE ARUP and P%RTNERS. The design of deep beams in
reinforced concrete. London, Construction Industry
Research and Information Association, January 1977,
pp 131. CIRIA Guide 2.
10. COLE, D. F. Behaviour of deep reinforced concrete
beams. M. Sc. thesis, University of Nottingham, 1968.
325 pp.
11. ROBINS, P. J. fleinforced concrete deep beams studied
experimentally and by the finite element method.
PhD. thesis. University of Nottingham, 1971.258 pp.
12. SINGU, %. Static and repeated loads on lightweight
concrete deep beams. MPhil. thesis, University of
Nottingham. 1972- 111 pp.
13. DISCNINGER, F. fleitragzur Theorie der Halbscheibe
und des wandartigen Balken. Int. Assn. for Bridge
and Structural Engineers Publications, Zurich, Vol. 1,
1932. pp. 69-93.
i4. COULL, A. Stress analysis of deep beams and walls.
The Engineer. Vol. 22, No. 5744. February 1966.
pp. 310-312.
15- SCI. L'LM RELLA. C. %. Effect of holes in deep beams
with reinforced vertical edges. Engineering Progress
at the University of Florida. Vol. l'7. ;: 0.12.
December 1963.

1ý.
16. SA%D, S., and HENDRY, A. W. Gravitational stresses
in deep beams. The Structural Engineer. Vol. 39"
No. 6. June 1961. pp. 185-194.
17. ARCHER, F. E.. and KITCHEN, E. M. Stress distribution
in deep beams. Civil Engineering and Public Works
Review. Vol. 55, No. 643. February 1960. pp. 230-234.
18. CHOU, L. E.. CONi; %Y, FI. D., and WINTER, G. Stresses
in deep beams. Transactions - American Society of
Civil Engineers. Vol. 118. Paper 2557.1953. pp. 686 -
708.
19. SAVIN, G. N. Stress concentrations around holes.
Pergamon Press. 1961.
20.1AVILLE, M. E.. and McCOtU1ICK, F. J. Stresses in
deep beams subjected to central and thirdpoint
loading. rroc. . %. S. T. bi.. Vol-59.1959. pp. 1230-1236.
21. UtILAIANN. IL. L. ß. The theory of girder walls with
special references to reinforced concrete design.
The Structural Engineer. Vol. 30. August 1952.
pp. 172-181 .
22. S& D. S.. and }iENURY, A. W. Stresses in a deep
beam with a central concentrated load. Exp. Mech.,
ß'o1.1. No. 6. June 1961. pp. 192-198.
23. : 11 MITE EL'ROPEEN DU BETON. Recommendations for an
International Code of Practice for Reinforced
Concrete (English ed. ). London. American Concrete
Institute and Cement and Concrete Association. 1')64.

159,
24. DE PAIVA, II. A. R., and SIESS, C-1- Strength and
behaviour of deep beams in shear. Proceedings
A. S. C. E., Vol. 91. No. ST5. October 1965"pp"19-41.
25. LEONIWARDT. F.. and WALTHER, R. Wandartige Träger
(Deep Beams). Deutscher Ausschuss fur Stahlebeton. I
Bulletin 178.1966, %Jilholm Ernst und Sohn (Berlin).
CIRIA Translation, January 1970.
26. CRIST. R. A. Static and dynamic shear behaviour
of uniform ly reinforced concrete deep beams.
Ph. D. thesis, University of New Mexico, 1971"
27. KONG, F. K.. : tOBINS, Y. J., and COLE, D. F. Web
reinforcement effects on deep beams. Journal of
the tmerican Concrete Institute. Proceedings
Vol. 67, ! ßo. 12. December 1970. pp. 1010-1017.
28. KONG, F. A.. and ROBINS, P. J. Web reinforcement
effects on lightweight concrete deep beams.
Journal of the American Concrete Institute.
Proceedings Vol. 68, No. 7. July 1971" pp"514-520.
29. KONG, F. K.. ROBINS, P. J., KIRBY, D. F., and
SIIOrtT, U. R. Deep beams with inclined web rein-
forcement. Journal of the American Concrete
Institute. Proceedings Vol. 69, No. 3 March 1972.
pp. 172-176.
30. KONG. F. K., and ROBINS, F. J. Shear strength of
reinforced concrete deep beams. Concrete. Vol. 6,
No. 3. March 1972. pp. 3'*-36.

1 'I O
31. KONG, F. K., and SINGH, A. Diagonal cracking and
ultimate loads of lightweight concrete deep beams.
Journal of the American Concrete Institute.
Proceedings Vol. 69, No. 8. August 1972. pp. 513-527"
32. KONG, F. K., and SINGH, A. Shear strength of light-
weight concrete deep beams subjected to repeated
loads. Shear in reinforced concrete. Detroit,
American Concrete Institute, 1974. ACI-ASCE Special
Publication SP-42. Vol. 2. pp. 461-476.
33" KONG, F. K. 9 ROBINS, P. J., SING!!, A., and SHARP, G. R.
Shear analysis and design of reinforced concrete
deep beams. The Structural Engineer. Vol-50, No. 10.
October 1972. pp. 405-409.
34. KONG, F. K., ROBINS, P. J., and SHARP, G. R.
The design of reinforced concrete deep beams in
current practice. The Structural Engineer. Vol-53,
No. 4. April 1975" pp. 173-180.
35" KONG, F. K., and SHARP, G. R. Shear strength of
lightweight reinforced concrete deep beams with
web openings. The Structural Engineer. Vol-5, No. 8.
August 1973. pp. 267-275.
36. KONG, F. K., and KUBIK9 L. A. Discussion of:
Collapse load of deep reinforced concrete beams
by P. KUMAR. Magazine of Concrete Research.
Vol. 29, No. 98. March 1977. pp. 42-43.
37. KONG, F. K., SINGH, A., and SHARP, G. R. Anchorage
of tension reinforcement in lightweight concrete

1111.
deep beams. Cambridge University Engineering
Dept., Technical Report (in preparation).
38. STEVENS, A., and KONG, F. K. Reinforced concrete
deep beams and CIRIA's draft design guide. Paper
presented at Cambridge University Mechanics
Colloquium, 8 May 1975.
39" DE PAIVA, H. A. R. Strength and behaviour in shear
of reinforced concrete deep beams under static
and dynamic loading. Ph. D. thesis, University of
Illinois, 1961.
40. UNTRAUER, R. E. Strength and behaviour in flexure
of deep reinforced concrete beams under static
and dynamic loading. Ph. D. thesis, University of
Illinois, 1961.
41. LAUPA, A., SIESS, C. P., and NEWANARK, N. M.
Strengh in shear of reinforced concrete deep beams.
Bulletin No. 428. Eng. Expt. Station, University of
Illinois. 1955. P. 59.
42. MAST. D. R. Design of auxiliary reinforcement in
precast concrete connections. A. S. C. E. Structural
Engineering Conference, Miami Beach, Florida,
January 1966.
43. rIOFFET, D. R. Stresses and strain in deep beams
studied experimentally and by the finite-difference
method. B. Sc. (lions. ) thesis, University of
Nottingham, 1969.

Ti2
44. BROCK, G. Effect of shear on the ultimate
strength of beams with tensile reinforcement.
ACI Journal. Proceedings Vol-56. January 1960.
PP. 619-637.
45. BROCK, G. Discussion of: The riddle of shear
failure and its solution by N. J. KANI. ACI
Journal. Proceedings Vol. 61, No. 12. December
1964. Pp. 1587-1590.
46. RAMAKRISIINAN, V., and AN ANATHANARAYANA, Y.
Ultimate shear strength of deep beqms in shear.
ACI Journal. Proceedings Vo1.65. No. 2. February
1968. pp. 87-98.
47. SHEAR STUDY GROUP. The shear strength of rein-
forced concrete beams. Institution of Structural
Engineers, London. January 1969.170 pp.
48. ACI COMMITTEE 318. Commentary on building code
requirements for reinforced concrete (AC1318-71).
Detroit, American Concrete Institute, 1971.
49. PCA ENGINEERING SERVICES DEPT. Notes on AC1318-71..
Chicago, Portland Cement Association, 1972.
50. NYLANDER. H., and HOLST, H. Reinforced concrete
deep beams and slabs. Royal Technical University,
Stockholm, 1946. (In Swedish; English translation
by courtesy of Ove Arup and Partners, London).
51. ROBINS, P. J., and KONG, F. K. Modified finite element
method applied to reinforced concrete deep beams.
Civil Engineering and Public Works Review, Vol. 68
November 1973. pp. 963.

1'º3"
52. ACI COMMITTEE 408. Opportunities in bond research.
ACI Journal. Proceedings Vol. 67, No. 11. November
1970- pp"857-867.
53. ANON. Lightweight concrete. News article. NCE,
Magazine of the Institution of Civil Engineers.
Thomas Telford Ltd., June 1974.
54. ANON. Lightweight concrete. Construction News
Supplement. Northwood Publications Ltd., 6th. May
1976.
55. ACI BOARD COMMITTEE. Concrete - Year 2000.
ACI Journal. Proceedings Vol. 68, No. 8. August 1971.
pp. 581-589.
56. ANON. The all-round lightweight aggregate.
Lytag general information brochure. September 1967-
8 pp.
57. TEYCHENNE. D. C. Structural concrete made with
lightweight aggregates. Concrete. Vol. 1, No. 4
April 1967. pp. 111-122.
58. HANSON, J. A. Tensile strength and diagonal tensile
resistance of structural lightweight concrete.
ACI Journal. Proceedings Vol-58. July 1961. pp. 1-37.
59. KONG, F. K., and EVANS, R. H. Reinforced and pre-
stressed concrete. Nelson, London, 1975.229 pp.
60. NANI, G. N. J. How safe are our large concrete beams?
ACI J ournal. Proceedings Vol. 65. rlarch, 1967"pp. 124-141.

I 44.
61. TAYLOR, H. P. J. Strength of large beams. Proceedings
A. S. C. E., Vol. 98, ST11. November 1972. pp. 2473-2490"
62. BEAUMONT, C. J. An investigation of the behaviour of
reinforced concrete deep beams. M. A. thesis,
University of Cambridge, 1975" I
63. KONG, F. K., and SHARP, G. R. Structural idealization
for deep beams with web openings. Magazine of
Concrete Research. Vol. 29s No. 99. June 1977. pp. 81-91.
64. SMITH, K. N. and FEREIG, S. M. Effect of loading and
supporting conditions on the shear strength of deep
beams. ACI Publication SP42: Shear in reinforced
concrete. American Concrete Institute, 1974, pp. 441-460.
65. ACI COMMITTEE 439. Uses and limitations of high
strength steel reinforcement. ACI Journal. Proceed-
ings Vol. 72, No. 2. February 1973" pp"70-104.
66. UNTRAUER, R. E. and HENRY R. L. Influence of normal
pressure on bond strength. ACI Journal. Proceed-
ings Vol. 62, No. 5. May 1965. pp. 577-586.
67. ANON. Concrete fatigue - evidence of failure revealed.
News article. NCE, Magazine of the Institution of
Civil Engineers. Thomas Telford Ltd., 25 August 1977.
(a paper for ICE is in preparation).

1It5.
Cracked ý"'ý Uncracked
CONCRETE STRAIN
y
Uncracked Cracked `.
STEEL STRAIN
FIG. 1.1 EFFECT OF INCLINED CRACKING ON
STEEL AND CONCRETE STRAINS

L
-1
146.
0
0.15 D to
0.20D
&Main
steel
:::::::::::::::: O2 Web steel
FIG. 1.2 LEONH)RDT LND WALTh ER: REINFORCEHENT ARR aNGEMENT

r 1 -: 7.
L
r'--I
FIG. 1 .3 MEANINGS OF SYMBOLS

Z
1
.-
'v cl O
N r
E
a)
N O
X48.
FIG. 1.4 COMPARISON OF COMPUTED AND MEASURED ULTIMATE LOADS
100 200 300 400 500 600 700 Computed ultimate loads W2 (k N) : E%n. (1.9)

149.
E E
In N QJ t0
C1 ý
E E
U, N
FIG. 1.5 NOTTINGHAM TESTS: DETAILS OF WEB REINFO; tCi11ENT
(Further details are given in references 27 to 31)

150.
D
2.1(a) General layout
Zone in which additional vertical reinforcement is needed
A A=0.2Dor0.2L whichever is smaller
Zone in which additional horizontal reinforcement is needed Zone of principal normal reinforcement
0.3D or 0.3L whichever is smaller
2.1(b) Detail at support
. -L 0-25D -0-05L
. -r
I-T- 0.5D or 0.5L whichever is smaller
FIG. 2.1 REINFORCEMENT PATTERN: CEB-FIP RECOMMEND XTIONS

3300kN 3300kN 151
11 COLUMN COLUMN
BC
WALL A EFFECTIVE HT. 4800mm
SUPPORT LENGTH 600 mm
l 5400mm
ag 2.2(a) General arrangement
4500kN 4500kN
L 16,, OOmm
NORMAL WT. CONCRETE fc = 22.5 N/mm2 fcu= 30 N/mm2 ft= 3NI mm2 fy= 410N/mm2
L= 6000mm
2.2(b) Structural deep beam element
D= 4800mm
FIG. 2.2 DEEP BEM's IN DESIGN EXAMPLES

20mm DIA. BARS AT 75 CTS. EACH FACE
20mm DIA. BARS AT 150 CTS. EACH FACE
20mm DIA. STIRRUPS AT 150 CTS.
Z
REQUIRED BEAM WIDTH = 875 mm
24 NO. 25mm DIA. MAIN BARS (IN THREES)
20mm DIA. STIRRUPS AT 150 CTS.
FIG. 2.3 BEAM DESIGNED TO CEB-FIP RECOMENDATIONS
16mm DIA. BARS AT 150 CTS.
FIG. 2.4 BEAM DESIGNED TO ACI BUILDING CODE
16mm DIA. BARS AT 150 CTS.
WIDTH = 525 mm BARS (3+5 PAIRS)

153.
06 Iy LOAD AT
0.5 BOTTOM
0-4-- 0
0.3 c=
\1/2O
w 1o 1/s
Zj _ýho 0.2
0ý1-ý- L0TOPAT
0' '"1 yt 1
0 0.2 0.4 0.6 0.8 1.0 8
FIG. 2.5 PCA's DESIGN CHART
FIG. 2.6 BEAM DESIGNED TO PCÄ DESIGN GUIDE
IJ 1V V. yV111111 LJIM. IJP 1%J
WIDTH =1050 mm (3+5 PAIRS)

(A) LYTAG BATCH No. 1
MEDIUM GRADE
Cumulative B. S. Sieve Size % retained
0 11.8
3/16 97.4
7 98.3
Pan 100.0
Fineness modulus = 6.075
FINE GRADE
Cumulative B. S. Sieve Size ;ö retained
3/16 0
7 15.4
14 34.7
25 48.4
52 55.8
100 63.2
Pan 100.0
Fineness modulus = 2.175
(B) LYTAG BATCH No. 2
MEDIUM GRADE Cumulative
B. S. Sieve Size % retained
FINE GRADE Cumulative
B. S. Sieve Size a, ,o retained
0 10.0
3/16 96.0
7 98.0
Fan 100.0
Fineness modulus = 6.030
3/16 0
7 27.8
14 47.4
25 51.3
52 55.2
100 59.9
Pan 100.0
Fineness modulus = 2.696
TABLE 3.1 SIEVE ANALYSIS OF LYTAG AGGREGATES.

ý .'>.
COARSE GRADE
Cumulative B. S. Sieve Size
% retained
I 3/16
7
Pan
0
48.0
97.6
99.6
100.0
Fineness modulus = 6.452
FINE GRADE
Cumulative D. S. Sieve Size
% retained
3/16 4.1
7 19.3
14 32.1
25 49.3
52 89.2
100 99.6
Pan 100.0
Fineness modulus = 2.936
TABLE 3.2 SIEVE ANALYSIS OF HOVE INGH»i GRAVEL AGGREGATES.

t /ý
ULTIMATE BAR DIAMETER YIELD STRESS
TENSILE STRESS
mm N/mm2 N/mm2
6 425 614
8 441 643
10 452 634
20 432 602
TABLE 3.3 TENSILE PROPERTIES OF REINFORCEMENTS.

157.
200
C 0 J
150
100
Sc
0
01. Extension
Z
90 0 0 J
20
10
"/. Extension
FIG. 3.1 LOAD v. i XTi; NSION DIS\GR kNS FOR REINFORCEMENT
0.1 02 0.3 0.4 05
0.6 0.7 0.8 0.9 0

158.
Z
Load beam
Test
Travell i beam
Winch
i
J4
ed I
otor
gating
irary rt jig
FIG. 3.2 TUE LOWING . &1PA: ZATUS: GLNER %L %RRANGEMENT

159.
I
a0 III
Bearing Block
Reaction Assembly
Test Specimen
Dial Gauge
Steel Bracket
Anchor Block
FIG-3.3 TIIE LOADING . APP aR. TUS : DETAIL AT TILE SUPPORTS

ýI
Beam " Ref. No.
L
D
x
D
++ Web
++
opening R ef. No .
Web Steel
iö
f cu
11
2 Nimm
XX
fc xx
N/mm
ft""
N/mm2
M-0.4/0 2 0.4 0 0.48 39.6 31.6 2.84 rs-o. 4/1 2 0.4 1 0.48 39.5 26.5 2.90 M-0.4/2 2 0.4 2 0.48 38.9 30.1 2.50 M-o. 4/3 2 0.4 3 0.48 41.5 32.5 2.18 ri-o. 4/4 2 0.4 4 0.48 36.4 29.3 2.16 M-0.4/5 2 0.4 5 0.48 40.9 31.3 2.30 . i-o. 4/6 2 0.4 6 0.48 33.2 32.4 2.84 ri-o. 4/8 2 0.4 8 0.48 35.3 30.4 2.74 r1-o. 4/9 2 0.4 '9 0.48 35.8 29.2 2.60 ri-o. 4/10 2 0.4 10 0.48 35.8 34.0 2.78 rs-o. 4/11 2 0.4 11 0.48 38.7 33.8 2.62 ri-o. 4/12 2 0.4 12 0.48 38.1 32.0 2.60 M-0.4/13 2 0.4 13 0.48 38.7 33.8 2.62
0-0.4/0 2 0.4 0 0 37.1 32.6 2.50 0-0.4/2 2 0.4 2 0 38.1 32.4 2.45 0-0.4/4 2 0.4 4 0 39.8 32.2 2.72 0-0.4/5 2 0.4 5 0 39.3 32.7 2.28 0-0.4/6 2 0.4 6 0 39.9 34.7 2.63 0-0.4/7 2 0.4 7 0 38.0 31.0 2.46
0-0.25/0 2 0.25 0 0 38.4 34.0 2.68 0-0.25/2 2 0.25 2 0 42.6 36.4 2.80 0-0.25/4 2 0.25 4 0 37.5 34.1 2.80 0-0.25/5 2 0.25 5 0 41.4 35.8 2.83 0-0.25/6 2 0.25 6 0 41.8 37.2 2.58
Beam notation: A letter M before the hyphen indicates a rectangular mesh web reinforcement, whilst a letter 0 indicates no web reinforcement; the x/D ratio is given after the hyphen, followed by the web-opening reference number. Thus 0-0.4/2 refers to a beam with no web rein- forcement, having an x/D ratio of 0.4 and a web opening type 2.
%++ Details of web openings are given in Figs. 4.2 and 4.3
fcu = cube strength (100 mm).
xx xxfc
= cylinder compressive strength (300 mm x 150 mm).
ft cylinder splitting tensile strength (300 mm x 150 mm) in accordance with ASTM Standard C330.
T. OLE 4.1 PROPERTIES OF TEST BEAMS (Pilot tests; lightweight concrete).

Beam t Ref. No.
Measured W1 kN
st w1
W0
M-o. 4/o 660 1.0 M-0.4/1 580 0.88 M-0.4/2 360 0.55 M-0.4/3 445 0.67 N-0.4/4 450 0.68 m-0.4/5 600 0.91 ri-o. 4/6 270 0.41 m-o. 4/8 340 0.52 M-o. 4/9 240 0.36 N-0.4/10 300 0.45 M-0.4/11 600 0.91 N-0.4/12 520 0.79 M-0.4/13 130 0.20
0-0.4/0 660 1.0 0-0.4/2 370 0.56 0-0.4/4 340 0.52 0-0.4/5 540 0.82 0-0.4/6 190 0.29 0-0.4/7 420 0.64
0-0.25/0 660 1.0 0-0.25/2 360 0.55 0-0.25/4 460 0.70 0-0.25/5 560 0.85 0-0.25/6 280 0.42
" Beam notation as in Table 4.1
W1/W0 is the ratio of the measured ultimate load of a beam with openings to that of the corresponding solid deep beam.
TABLE 4.2 ME%SUIRED ULTIMATE LOADS (Pilot tests; lightweight concrete)

162.
x 925 mm forxýD=0.25 100x100mm 300mm 700 mm for X/D= 0.40 Bearing blocks
, or 188 mm '
D 750
170mm 6mm DIA.
6mm DIA. Square stirrups
6mm DIA. bars
20mm. DIA Bar
L 1500 mm
I-
NOTES: - I. Reinforcement details of group 0 beams were as
shown above. 2. Reinforcement details of group M beams include in
addition and as shown below: (i) A rectangular mesh of 6mm dia. bars at 100mm
vertical spacings and 140mm horizontal spacings and
(ii) A 6mm dia. rectangular loop to trim each opening.
FIG. 4.1 DIMENSIONS AND REINFORCEMENT DETAILS (Pilot tests; lightweight concrete)

163.
Xý
1
i
C) U, t- n
0
x= 300mm for x/D = 0.4
. 188 mm for x/D = 0.25
a1x
a2 D I ..
kl- ºi i
k2 DI
REF NO.
SIZE a1 a2
POSITION k, k2
0 N O WEB OPENI NG 1 0.5 0.2 1.0 0.8 2 0.5 0.2 1.0 0.6 3 0.5 0.2 1.0 0.4 4 0.5 0.2 0.75 0.4 5 0.5 0.2 1.0 0.12 6 0.5 0.2 0.5 0.12 7 0.5 0.2 0.5 0.6 8 0.25 0.4 1.0 0.3 9 1.0 0.1 1.0 0.45 10 0.25 0.4 0.63 0.3 11 0.25 0.1 1.0 0.45 12 0.25 0.1 0.63 0.45 13 1.0 0.4 1.0 0.3
FIG. 492 OPENING REFERENCE NUMBERS: : IPPLIC? 1BLE TO BEAMS IN TABLE 4.1

164. FIG. 1&. 3e TYPICAL. CRACK PATT ; INS XT FAILURE
- GROUP M BEAM
(The circled numbers show the sequence in which the cracks were observed; the other numerical figures show the
_losd, in 10 kN unitq, eßt which the extent of the
M-0.4/1 M-U 4/2 M-0 4/3
M-0.4/4 NI u 4i J 1'M1 u 4i b
M-0.4/8 M-0.4/9 M--(j 4/ iU
H_

- GROUP 0 BEAMS
(Tue circled numbers; sham the*, sequence in which the craucks were observed; the o"tther numerical figures show the for d, in 1 it whic' the extent of the
0-0-4/5 0-0.4/6 U-U-4/7
1Vý"
FIG. 4.3b TYPICAL CRACK PATTERNS AT FAILURE
0-0.25/0 0-0.2512 0-0.25/4
_I

ie6.
-1
.I
'/2 / f'////
i'ij/
I (1 ®
FIG. 4.4 TYPICAL SEQUENCE IN WHICH THE CRACKS
I APPEARED 7

167.
'ý
-ý$ K
JI
FIG. 4.5 TYPICAL FAILURE MODES OF DEED BE. \NS WITH WEB OPENINGS
(a) FAILURE MODE 1
(b) FAILURE MODE 2
(c) FAILURE MODE 3

168.
Z a
0 J
-. 5 z 64 0
3 0 J
2
00
00
00
00
00
00 "2s M' mm
peam notation as in Table (4.1)
FIG. 4.6(a) MAXIMUM CRACK WIDTHS - GROUP M BEANS

169.
. -. Z
0
9
600
Z 500
400 0 ö 300 J
200
100 m
(b) Group 0 beams with X/ D=0.25
Beam notation as in Table(4.1)
FIG. 4.6(b) MAXIMUM CRACK WIDTHS - GROUP 0 DEANS
(a) Group 0 beams with X/D = 0.4

170.
12
1/2
6 1L4
1/4
3 3/4
22 8
5
3 46 10
24
lOOkN
-1
200kN
400kN
After Collapse (0kN)
The numbers give the width of each crack in units of 0.05mm.
FIG. 4.7 DEVELOPMENT OF CRACKING IN BEAN N-0.4/4

$ 14
14
i
100kN
-200 kN 16
10
2
26 2 15
al
300kN
After collapse (OkN)
The numbers give the width of each crack in unit of 0.05mm
FIG. 4.8 DEVELOPMENT OF CRACKING IN BEAM 0-0.4/4
171.

" 172- .
Z 4 v
0 0 J
z Y
0
00 00 00 00
00 0 ý\ v
00 mm
Beam notation as in Table (4.1)
}IG. 4 .9 (a) AVERAGE CRACK WIDTHS - GROUP M BE %MS

173.
Z
Q'
Oý J
60,
�50 z . 401 0
30 0 J
20
10 m
(b) Group 0 beams with X/D =0 . 25
Beam notation as in Table (4.1)
FIG. 4.9(b) AVERAGE CRACK WIDTHS - GROUP 0 BEAMS
(a) Group 0 beams with X/D = 0.4

174.
6 ,5 z
0 ö3 J
2
600 z 500 ö 400 °
ý. ý ö 300 ° J200
100 M 0413 0.4 mm
Beam notation as in Table (4.1)
F'IG. 4.1O(a) CENTRAL DEFELECTIONS - GROUP M BEAMS

175.
14-
6
-. 5
z Y4 0 ö3 J
2
DO
00 II 00 0r
00 oo.
u ýu 00 O. 4 0
mm 00
(a) Group 0 beams with X/D = 0.4
600
500 z
400 h 0
C)300 200 0.4 o' o 100 mm
(b) Group 0 beams with x/0=0-25
Beam notation as in Table (4.1)
FIG. 4.1O(b) CENTRAL DEFLECTIONS - GROUP 0 BEANS

176.
-1
WW 22
E1 r-P=2- -º--ý- -ý-ý- -º-#-r-ý E 0'
4
} B' gý
i/i
W k1 x
22
k2D
- FIG. 4.11 LOAD-TRANSMISSION PATHS

177.
QI . 14 Qult
-1
0
Notatation for equations (4.1) and (4.2)
k2 D
1. Geometrical notation as shown above; all dimensions in millimetres.
2. C, and C2 are empirical coefficients, being equal, respectively, to 1.35 and 300 N/mm?
a tt is the cylinder splitting tensile strength - in accordance with A. STM. standard C 330.
FIG. 4.12 EXPLANATION OF SYMBOLS
Qult (=W2/2) Qult

178.
Beam *
Ref. No.
L D
x D
++ '. eb
++
opening ief. No.
Beb steel
f cu
N/mm2
Oxx fc
N/mm2
** ft
N/ium2
o >- h O
c i
0-0.3/0 1.5 0.3 0 M H 39.0 37.0 2.69 0-0.3/1 1.5 0.3 1 0 40.4 35.6 2.61 0-0.3/2 1.5 0.3 2 +) +J 41.3 36.9 3.06 0-0-3/3 1.5 0.3 3 M M 41.7 35.5 2.69 0-0.3/4 1.5 0.3 4 40.8 34.7 2.69 0-0.3/5 1.5 0.3 5 39.2 35.0 2.74
0-0.3/6 1.5 0.3 6 0 r. 33.4 33.3 2.89 0-0.3/7 1.5 0.3 7 b 43.7 39.2 3.04 0-0.3/8 1.5 0.3 8 33.0 31.8 2.61 0-0.3/9 1.5 0.3 9 45.0 38.1 2.80 0-0.3/10 1.5 0.3 10 E 36.0 33.6 2.85
0-0.3/11 1.5 0.3 11 .0 a 30.8 33.3 2.78
0-0.3/12 1.5 0.3 12 0 0 36.7 33.1 3.11 0-0.3/13 1.5 0.3 13 a a 41.3 37.8 2.92 0-0.3/14 1.5 0.3 i4 33.2 30.2 2.76 0-0.3/15 1.5 0.3 15 0 0 35.2 33.6 2.92 0-0.3/16 1.5 0.3 16 43.4 37.6 3.07
0-0.2/0 1.0 0.2 0 W CD 39.6 37.4 2.93
0-0.2/4 1.0 0.2 4 42.0 39.6 3.19 0-0.2/13 1.0 0.2 13 38.5 39.5 2.85 0-0.2/16 1.0 0.2 16 40.4 38.9 2.76
(continued on next page) s
Beare notation: A letter 0 before the hyphen indicates
no web reinforcement, whilst a letter 1; indicates the
presence of web reinforcement; the x/D ratio is given after the hyphen, followed by web-opening reference number., Thus t1-0.3/4 refers to a beam with web reinforcement Type W1 (see Fig. 3.1), having an x/D ratio of 0.3 and a web opening type 4.
+The four beams with a suffix A were tested under 4-
point loading (see Fig-5-3); otherwise Beam ZJ1(A) was identical to Beam '41-0.3/4. Beam W3(A) identical to Beam X13-0.3/4 and so on.
X XThe four beams with a suffix Z were repeat tests; viz.,
Beam 0-0.3/28 was identical to Beam 0-0.3/2, Beam 0-0.3/38 identical to Beam 0-0.3/3 and so on.
-+F +,
xx x#
99 see continuation next page.
TABLE 5.1 PROP RTIr' S OF TLST BEAMS (Further tests; lightweight concrete)

i(9.
Beam s
L D
x D
Web ++
opening Web
steel
71 fcu
xx
I xx fc
ss ft
Ref. No. Ref. No. N/mm2 N/mm
2 N/mm2
+) ý4
H i
C-U
x x
O-0.3/2R 1.5 0.3 2 34.2 32.1 2.84 0-0.3/3R 1.5 0.3 3 40.7 35.9 2.54 0-0.3/4R 1.5 0.3 4 45.0 35.3 3.03 0-0.3/5R 1.5 0.3 5 37.3 31.7 3.03
W1-0.3/4 1.5 0.3 4 «1 1.19 39.5 34.2 2.93 W2-0.3/4 1.5 0.3 4 W2 1.19 40.5 34.6 2.96 W3-0.3/4 1.5 0.3 4 w3 1.19 40.9 33.7 2.87 A-0.3/4 1.5 0.3 4 w4 1.24 39.1 33.3 2.89 W5-0.3/4 1.5 0.3 4 115 1.11 36.8 35.3 2.93 w6-o. 3/4 1.5 0.3 4 w6 1.25 37.8 31.9 2.91 117-0.3/4 1.5 0.3 4 ºa7 1.13 37.4 33.0 3.03
W1 (A)+ 1.5 0.3 4 111 1.19 34.5 31.8 2.82 W3 (A) 1.5 0.3 4 113 1.19 34.3 33.6 3.04 114 (A( 1.5 0.3 4 4 1.24 35.2 32.5 2.89 117 (A) 1.5 0.3 4 W7 1.13 37.7 31.9 3.04
:: rri-0 . 4/0 2 0.4 0 '17ý1 1.13 30.6 26.4 3.03 WMi-0.4/18 2 0.4 18 1Yfi1 1.13 35.1 26.1 3.16 wii-o. 4/18 2 0.4 18 VIM 1 . 13 31.6 26.1 3.16
v
+xx
,9 see previous page.
++ ++
Details of web openings are given in Figs-5.2 and 5.4
P( fcu = cube strength (100 mm)
XXfc = cylinder compressive strength (300 mm x 150 mm)
ft = cylinder splitting tensile strength (300 mm x 150 mm) - in accordance with ASTM C330.
TABLE 5.1 PROPERTIES OF TEST BEAMS (Continued).

Beam Ref.
No.
Measured
W1 kN
0-0.3/0 595 0-0.3/1 460 0-0.3/2 390 0-0.3/3 280 0-0.3/4 260 0-0.3/5 200
0-0.3/6 250 0-0.3/7 420
0-0.3/8 380 0-0.3/9 280 0-0.3/10 210
0-0.3/11 360 0-0.3/12 560 0-0.3/13 300 0-0.3/14 560 0-0.3/15 260 0-0.3i16 195
0-0.2/0 655 0-0.2/4 360 0-0.2/13 500 0-0.2/16 340
*Beam notation as in Table 5.1
Beam Ref.
No.
Measured
W1 kN
0-0.3/2R 260 0-0.3/3R 400 0-o. 3/4R 215 0-0.3/58 330
111-013/4 400
1; 2-0-3/4 490 113-0.3/4 560 w4-0.3/4 660 , r5-0.3/4 370 w6-o. 3/4 825 W7-0.3/4 630
wl(A) 475 ß+W3(A) 500 A(A) 650 W7(A) 670
lal-0.4/ 0 660 10,1-0 . 4/18 500 irrt'-o . 4/18 500
TABLE 5.2 MEASURED ULTIMATE LOADS (Further tests; lightweight concrete).

181.
j_. --T-100X100 mm. L bearing blocks
TYPE W1 QQ
TYPE W4 ED 0
TYPE
W7 QO
TYPE
W2 QÜ
TYPE W5
TYPE WM D
lw
TYPE
W3 13 []
TYPE QQ we
TYPE WM' C, ýJ
NOTES: (1) Reinforcement details of Group 0 Learns (no web reinforcement)
as shown in top diagrau above. (2) Web reinforcement. Tyre W; to W7 consisted of 10 mm diameter
stirrups (web steel ratio : 1.2Sä)
(3) weh reinforcement Tyres WH and ti? t consisted of 6 mm diamuter stirrups (web steel ratio - 1.13%)
ý°ýl 1
1
6 mm Dia
D Beam tAlckneac b
16 i 20 mm Dia H
Beam Geometry (mm) LDxb
For *10.2 750 750 150 º00 "" s O. 3 1125 750 225 100
-6 it 0.4 1524 762 304 76
i 20 mm Dia nu h i
s
FIG-5.1 DIMENSIONS AND REINFORCEMENT DETAILS (Further tests in lightweight concrete)

182.
750m D
btx
tx=150 mm for x/D =02 =225 mm for X/D = 0.3 =304mm for x/D = 0.4
x ai-ý
a2 D
ký x k2D
REF No.
SIZE al a2
POSITION ki k2
0 NO O PENING
1 0.30 0.20 1.00 0.40 2 0.50 0.20 1.00 0.40
.3 0.70 0.20 1.00 0.40
4 1.00 0.20 1.00 0.40
5 1.20 0.20 1.00 0.40
6 1.50 0.20 1.00 0.40 7 0.30 0.20 0.30 0.40
8 0.50 0.20 0.50 0.40
9 0.70 0.20 0.70 0.40
10 1.30 0.20 1.30 0.40
11 0.30 0.20 1.00 0.666 12 0.30 0.20 0.30 0.666
13 1.00 0.20 1.00 0.666 14 0.30 0.20 1.00 0.134
15 0.30 0.20 0.30 0.134
16 1.00 0.20 1.00 0.134 17 0.30 0.20 0.65 0.40 18 0.25 0.25 0.622 0.375
FIG. 5.2 OPENING REFERE14CE NUMBERS: APPLICABLE TO LIGHTWEIGHT BE. * IS IN TABLE 5.1 AND NO. UL L WEIGHT BEAMS IN TABLE 6.1

183.
Five at 225 mm 1125mm
750mm i ,o 0i
FIG-5.3 FOUR POINT LOADING - FOR BEANS W1(A), w3(A), w4(A) and W7(A)

,ýý ý ._
�r ý:.
0-0310 0-03/1 0-0-3/2
I
Ll
0-0-3/3 0-0 3/4 0-0-3/5
0-0.3/6 0-03/7 0-0.3/6
0-0.3/9 0-u-3/1U 0-0.3/11 FIG. 5.4n TYPICAL CRACK t' 1T'I',. RN .) AT FAILURK
- r. ROUP 0 (First twelve)
(The circled numbers show the sequence in which the erac>; a were observed; the other numerical figures show the load in 10 kN units, at which the extent of the cracks were .» mirked. ; earn notation as in Table 5.1)

'4ý Z
FIG. 5 . 4b TYPICAL CRACK PATTERNS AT FAILURE (The remaining Group 0 beams)
(The circled numbers show the sequence in which the cracks were observed; the other numerical figures show the load in 10 kN units, at which the extent of the cracks were as marked. `seam notation as in Table j. 1)
0-0.3/12 0-0.3/13 0-0.3/14
0-0.3/15 0-0.3/16 0-0.2/0
0-0.2/4 0-0.2/13 0-0.2/16

1i
\& 4-03/4 W5-0.3/4
FI(ä. 5 . 'tc TYiýIC. L CRACK 1 -iTT. .; ir I: tºILUiiE - GROUP W BEMIS
W6-03/4
(The circled numbers show the sequence in which the cracks ,.,, er(, observed; the other numerical figures show the load
ý. rere 1
W1-0.3/4 W2-0.3/4 W3-0.3/4
W7-0.3/4 W1 (A)
W3 (A) W4(A) W7 (A)

Beam notation as in Table 5.1
(The circled numbers show the sequence in which the cracks were observed; the other figures show the load, in 10 kN units, it : ihi. cli tho extent of the cracks were as marke(I)
FIrs. 3.4d TYPICAL CRACK 1 1TT-, i(N.; AT F. \ILUilE
L%, -
(continued )
0-0-3/2R
0-0-3/3R 0-0.3/4R 0-0.3/5R
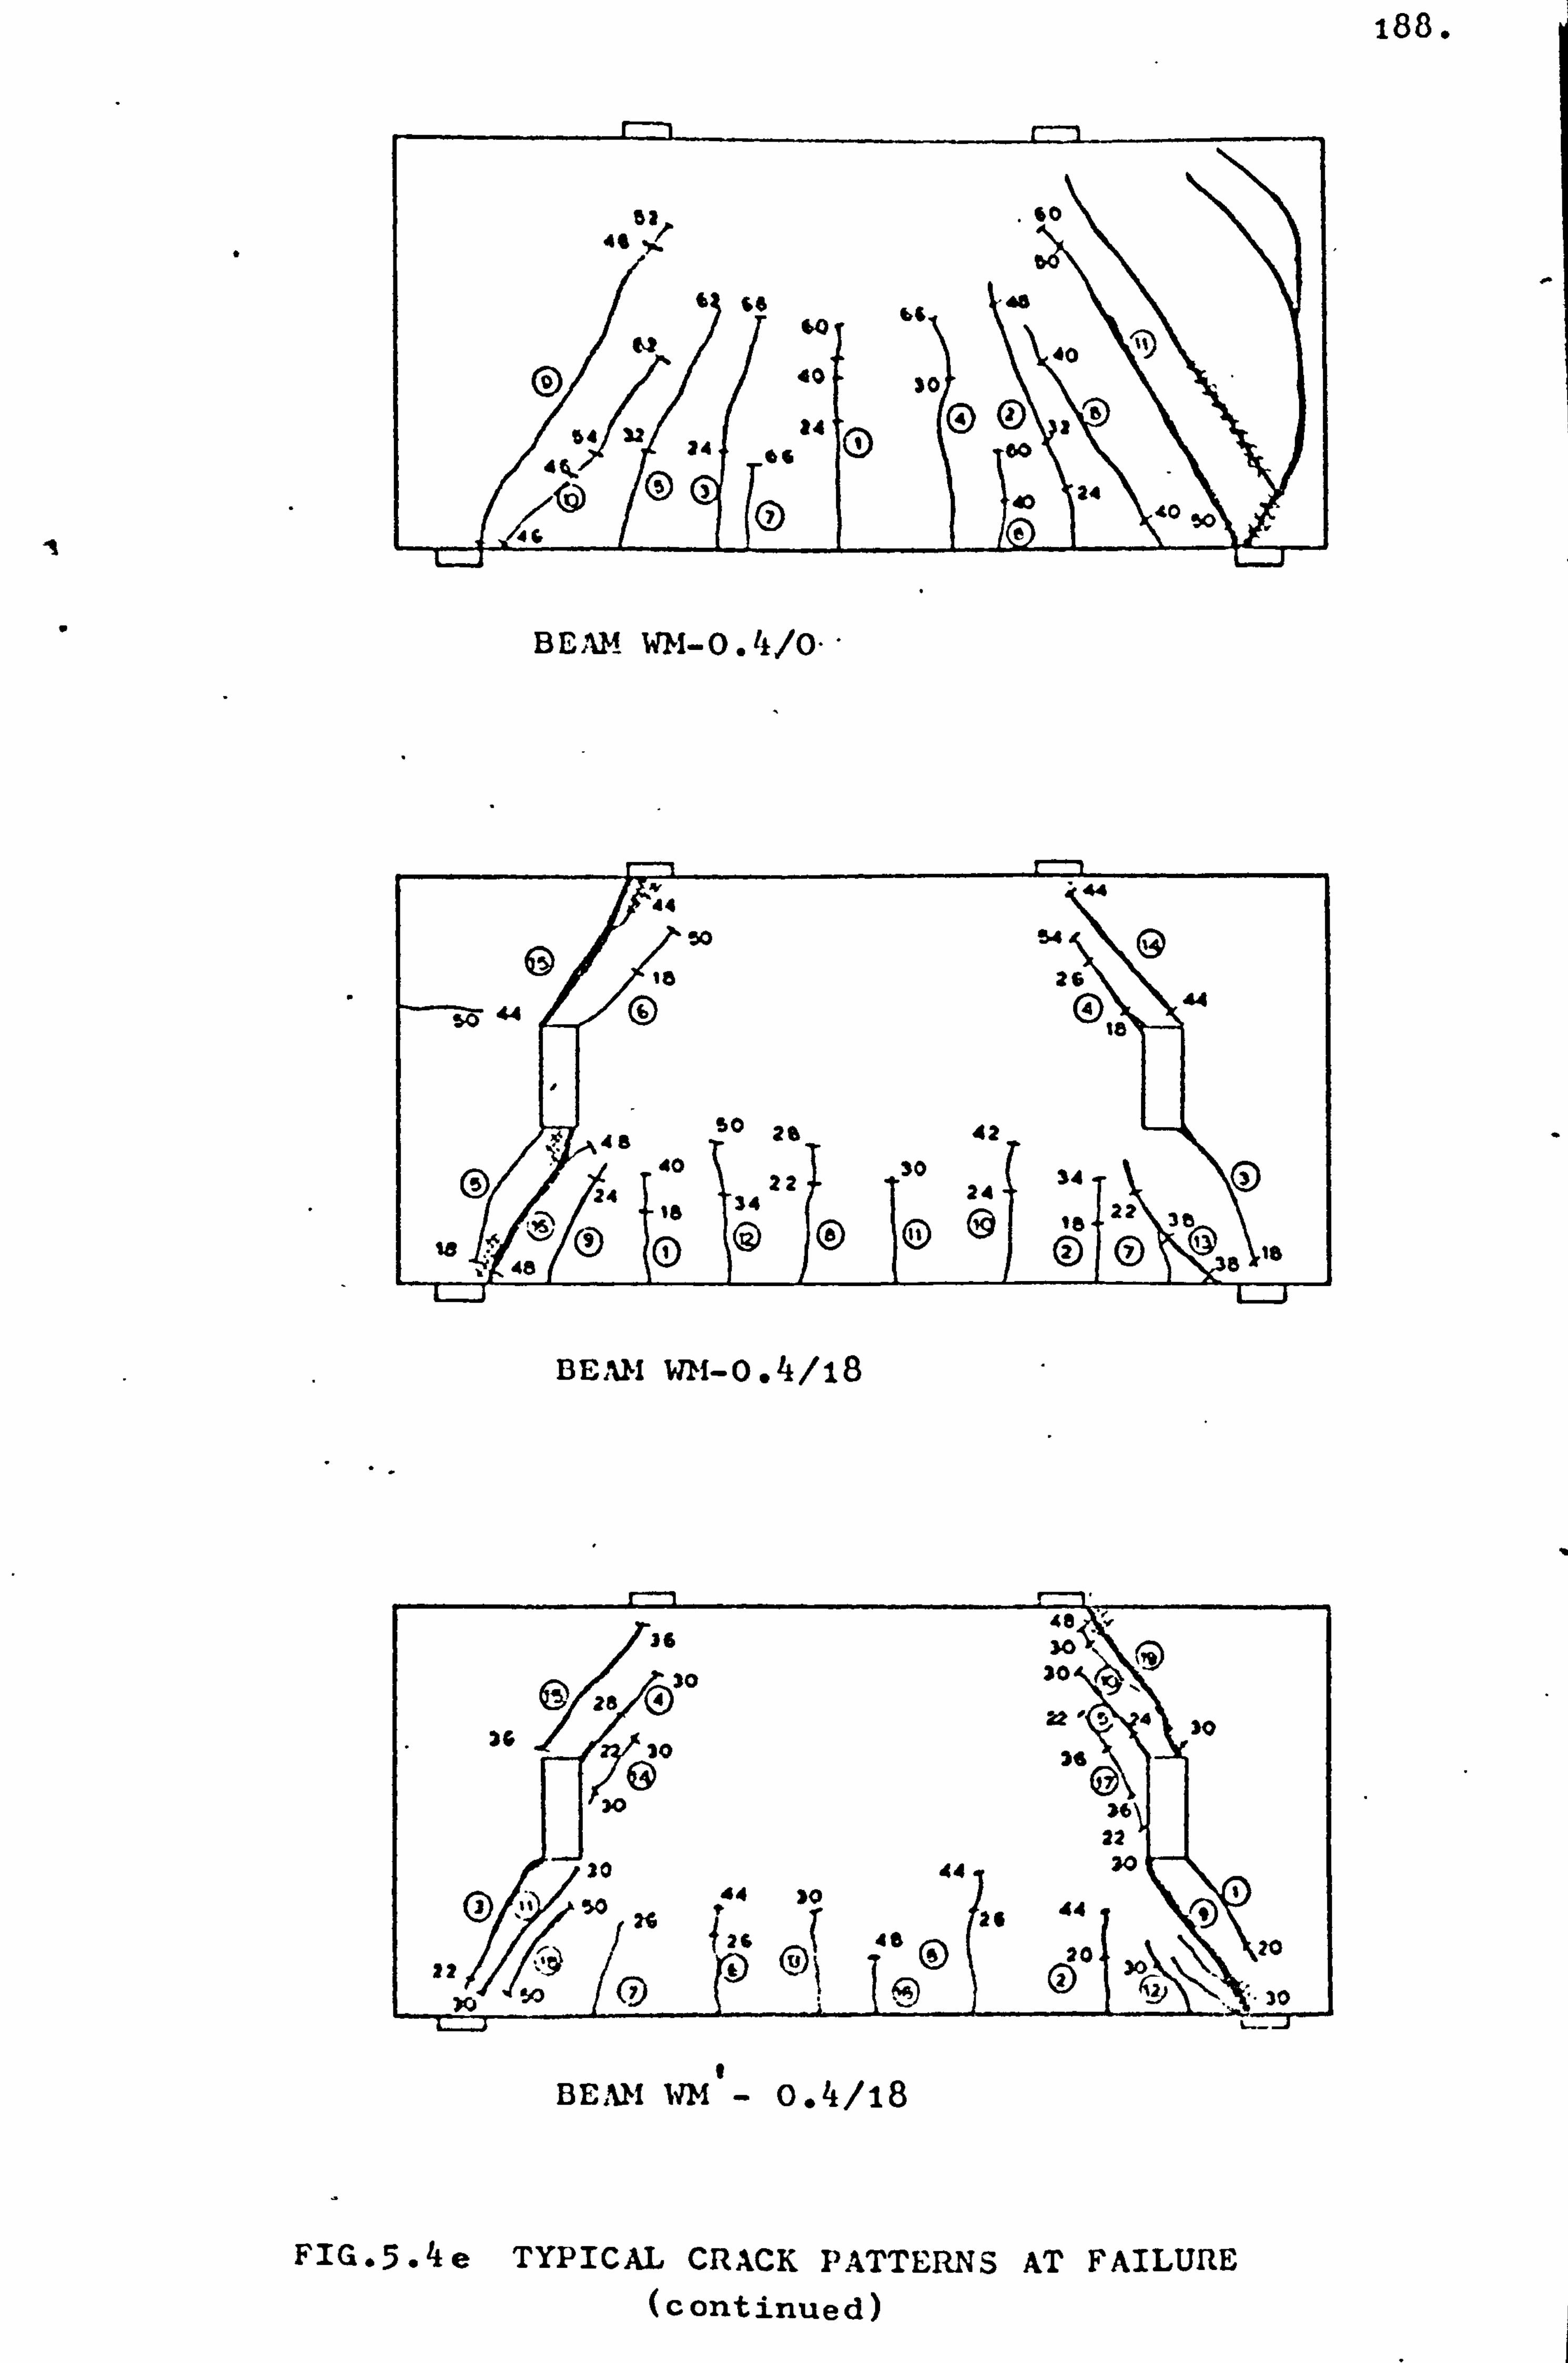
51 N
I
6 ý6 6ý
40 60 \\.
\\ 1
Q `0 30
tý Ob
b1 3O1 80
/166
`O1
to p t,
40 to
BEAIM WINo. It/o- .
y 44 44
50 54
+a 2e a 44
so "© @t8
48 So 26 42
40 Ov9,
la 34 22
30 34 O 24
O It ® +a 22 fat
i 48 OOO©a to
BEAN WN-0.4/18
se ss ý' ý
Oso 30 ýKy`
se 4 22'ý e so 36
�ýc®o
36 22
20 44 30
O `$
r4 3O 2f 44
22 `ý !4 Oý 40 O 20 \ 20
)0 yo ýý .9O ýJ`. '- so
BEAM WM - 0.4/18
FIG-5.4e TYPICAL CRACK PATTERNS AT FAILURE (continued)
188.
-i

189.
600
Z 500 Y
-400
300
200
100
Z
0
O J
Z
0
0 J
(b) No Web steel; X%D =0.3; openings 7-73
Beam notation as in Table (5.1)
IZF 0'
3 0"0' 4 p-0 5R
0 p p'3 ý a
p-0' ý 6 E
0 3 (5 mm
(a) No web steel ; x/D=O. 3; openings 0-6
600-
500-
ýVll 400 0 0
.o ßß
300 0 03 0' 3ý 11
. 'ý ý 200
0- '3 100 0.3
mm
FIG. 5.5 MAXIMUM CRACK WIDTHS
(c) No web steel; x/0 = 0.3 or 0-2; opening 0,4,13-16

190,
70
60
1ý50 z 40
030
20
10
0o
0 3l ýý . w5_ 31 4
0.3 mm
(d) Web steel as in fig5.1; x/D=0.3; opening No. 4
600
Z 500
%" 400 ö 300
200
100 0.3 mm
(e) Web steel as in fig 5.1; 4pt. loading; opening No. 4
Z 4 0 Q O J
(f) Type WM web steel ; X/D =0 .4; opening NO. 18
FIG-5-5 MAXIMUM CRACK iiIDTH3 (continued)

191.
60(
50(
40(
30(
201
10(
1
ö o
O4 O. mm
(a) No web steel-, x/0 - 0.3; opening 0-6
600-
500.
40 0/1 .1mI 300 -'
200
100 mm
(b) No web steel; X/D -0 . 3; opening 7 -13
600-
500-
400 Po .ý 300- o ry
20
10 04 mm
(a) No web steel ; X/ D=0 .3 or 0 .2; openings 0,4,13 -16
Beam notation as in Table 5.1
FIG. 5.6 CENTRAL DEFLECTIONS

192.
Z Y v 01 Q
O J
Z Y v 0 Q
O J
60
Z 500 Y. ö 400
o300- - J
200-
100.0.4 mm
(f) Type WM web steel; x/ 0 =0.4; opening No. 18
FIG-5.6 CENTRAL DEFLECTIONS (continued)
(d) Web steel as in Fig 5.1; x/D = 0-3. opening No. 4.
(e)Web steel as in Fig 5.1; 4pt loading; opening No. 4.

193.
500 -'] -ýsr -
-, " a1
- 400 ai varies from zero to 1.5
0 J
300
200- 11 12345g Opening
ref nos. 0.3 0.5 0.7 0.9 1.1 1.3 1.5
al
(a) Opening breadth increased towards support (For breadth equal to x, a1 W 1)
50
Z 40
0 0 J
30
201
X
i %7r
0
k1 varies from zero to 1.3
0
I 7894 10 Opening
ref nos. 0.3 0.5 0.7 0.9 1.1 1.3
kj
(b) Opening breadth increased towards loading
point (For breadth equal to x, kl = i)
FIG. 5.7 ULTIP1ATL STRENGTHS OF DEEP BEANS WITH WEB OPENINGS

FIG. 5.8 i3I APi 46. o. 3/4 , FTIý t FAILUW
194.
A

195.
i
/1--
1Q"1
rIG. 5.9 t3;: \ii �7". 0.3/4 ýF`1ý..... it 1ILUIZL

196.
NIG. 5.10 BEAN W5-0.3/4 AFTER FAILURE

I.
s Beam L
D x D
++
Web opening
Web fcu
xx
fcxx is
ft Ref. No.
lef. No. Ty e % N/mm2 N/mm2 N/mm2 p
N0-0.3/0 1.5 0.3 0 0 0 50.4 44.8 3.71 N0-0.3/4 1.5 0.3 4 0 0 57.9 43.7 4.09
NW1-0.3/4 1.5 0.3 4 Ill 1.19 51.7 36.8 3.94 NW2-0.3/4 1.5 0.3 4 W2 1.19 51.1 43.4 3.43 N113-0.3/4 1.5 0.3 4 W3 1.19 60.0 46.2 3.80 NW4-0.3/4 1.5 0.3 4 w4 1.24 45.3 39.5 3. 'i4 NW5-0.3/4 1.5 0.3 4 W5 1.11 50.9 43.5 4.03 NW6-o. 3/4 1.5 0.3 4 w6 1.25 56.9 42.7 4.00 NW7-0.3/4 1.5 0.3 4 . 'W7 1.13 53.1 42.9 3.74
NW+T6A-0.3/0 1.5 0.3 0 w6A 0.65 55.2 40.8 3.58 NW6A-o. 3/1 1.5 0.3 1 W6A 0.57 50.2 39.4 3.41 Nw6A-0.3/4 1.5 0.3 4 IT6A 0.47 52.7 41.2 3.74 Nw6A-0.3/17 1.5 0.3 17 w61 0.49 54.2 40.7 3.60 N116. A-0.3/7 1.5 0.3 7 W6A 0.49 55.0 40.7 3.72 NW6AA-0.3/11 1.5 0.3 11 W6: A 0.58 51.2 41.7 3.79 N W6, A-0.3/15 1.5 0.3 15 w6A o. 61 56.2 40.7 3.92
s Beam notation: The letter N signifies normal weight concrete; a letter 0 before the hyphen indicates no web reinforcement whilst a letter W indicates the presence of web reinforcement; the x/D ratio is given after the hyphen, followed by the web- opening reference number. Thus N'W1-0.3/4 refers to a beam of normal weight concrete with web reinforcement Type W1 (see Fig. 6.1 ), having an x/D ratio of 0.3 and a web opening type 4.
++ ++ Details of web openings are given in Figs-5.2 and 6.2
f= cube strength (100 mm) Cu
xx XX t
fc = cylinder compressive strength (300 mm x 150 mm)
s" ft = cylinder splitting tensile strength (300 x 150nm) -
in accordance with [IS 1881
TABLE 6.1 PROPERTIES OF THE NORMAL WEIGHT CONCRETE TEST BEAMS.
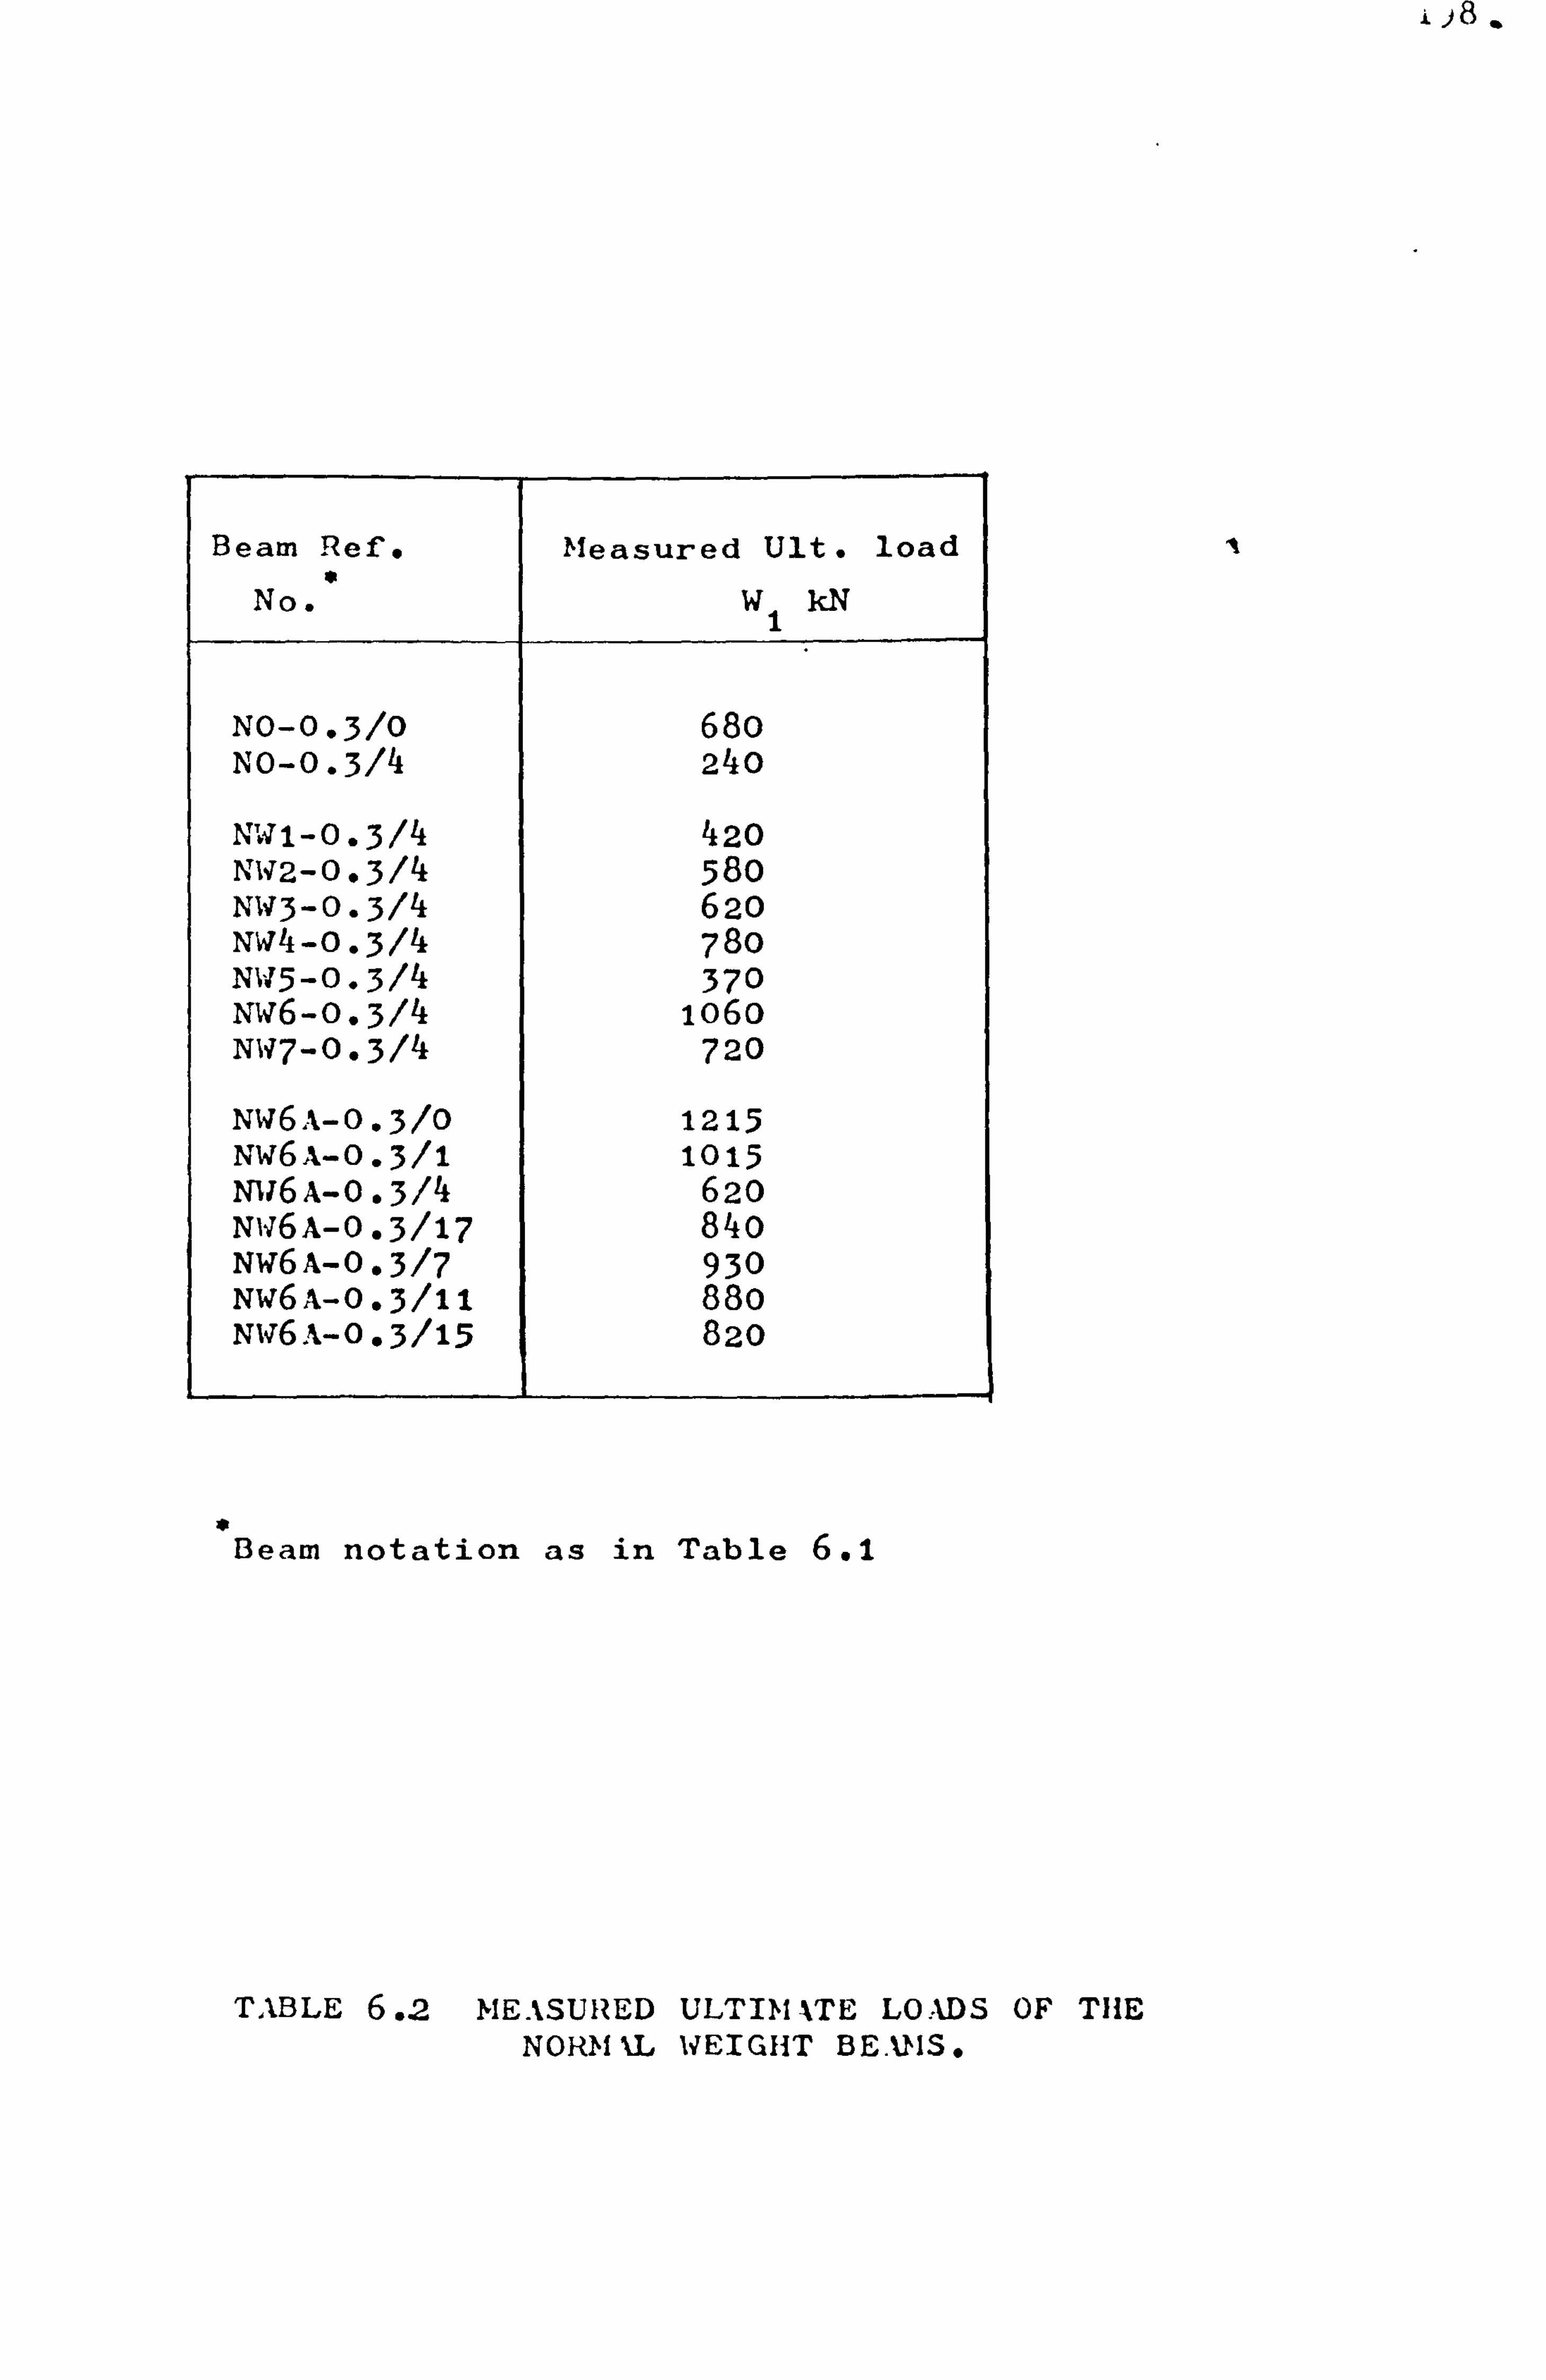
l, C) ý
Beam Ref. "
No.
Measured Ult. load
W1 kN
N0-0.3/0 680
No-0.3/4 240
NW1-0.3/4 420 NW2-0.3/4 580 NW3-0.3/4 620 NW4-0.3/4 780 N115-0.3/4 370 NW6-o. 3/4 1o6o NW7-0.3/4 720
NW6A-0.3/0 1215 Nw6A-0.3/1 1015 Ntit6 A-0.3/4 620 Nw6A-0.3/17 840 NW6A-o. 3/7 930 NW6A-0.3/11 880 Nw6 A-0.3/15 820
Beam notation as in Table 6.1
TABLE 6.2 MEASURED ULTIM \TE LOADS OF THE NORM'1L WEIGHT BE. ANS.

L)9.
Beam Ref.
No.
Normal weight +
concrete+
Lightweight
++ concrete++
Beam Ref. '"
No.
NW6-0.3/4 1.56 1.39 16-0.3/4 NQ-0-3/4 1-15 1.11 114-0.3/4 N`tiT7-o. 3/4 1.06 1.06 W7-0.3/4
N0-0.3/0 1.00 1.00 0-0.3/0 NW3-0.3/4 0.91 0.94 W3-0.3/4 N12-0.3/4 0.85 0.82 112-0.3/4
NR1-0.3/4 0.62 0.67 W1-0.3/4 NW5-0.3/4 0.54 0.62 W5-0.3/4
N0-0.3/4 0.35 0.36 0-0.3/4
NW6A-0.3/0 1.79 W: -0.3,1 1.49 Y 76A-0-3/4 0.91 NW6A-0.3/17 1.24 WA-0-3/7 1.37 NI, T6. A-0.3/11 1.29 NW6 A-0.3/15 1.21
* Beam notation as in Table 6.1
Deam notation as in Table 5.1
+ Measured ultimate loads = ult. load of Beam NO-0.3/O
++ Measured ultimate loads ult. load of Beam 0-0.3/0
TU3LE 6.3 COMPARISON OF THE ULTIMATE STRENGTH OF NORMAL WEIGHT AND LIGHTWEIGHT TEST SI, ECIMENS.

200.
7
f mrn_ý- h±-'7
D 6 mm di a 50mrn Beam thickness
b 100 mm
1 20 mm dia H u
.1 1 4 -4 Z
L 1125 mm 100000 Bearing blocks
TYPE W1 OD
TYPE W4,
TYPE J1111 Hill W7 00
4: 1= Hill
NOTES:
TYPE -=-- TYPE W2 DD W3
TYPE W5 p C1,
TYPE W6
TYPE W6A
Cl
TYPE W6A
II D
(1") Reinforcement details of Group 0 beams (no web reinforcement) as shown in tot, diagram above
(2) Web reinforcement Type W1 to W7 consisted of 10 mn, dinmeter stirrups (web steel ratio 1.13%)
(j) Web reinforcement Type W6% consisted of 6 mm diameter stirrups at 125 mm horizontal spacing. Reinforcement shown in beam without openings (ßenm M6. -0.3/0) and typical beam with openings (ücnm 5i6A-0.3/15)
FIG. 6.1 DIMENSIONS AND REINFORCEMENT DETAILS OF THE NORMAL WEIGHT CONCRETE BEAMS

___. 1 11 z
- .4
FIG. 6.2a CRACK PATTERNS AT FAILU 2E OF THE' NO1tMAL WEIGHT BEAMS (First nine)
(The circled numbers show the sequence in which the cracks were observed; the other numerical figures show the load, in 10 kN units, at which the extent of the cracks were as marked. Beam notation as in Table 6.1)
N0-0.3/0 N0-0314 NW1-0 314
NW2-0.3/4 NW3-0.3/4 NW4-0-3/4
NW 5-0.3/4 N W6-0-3/4 NW 7-0.3/4

64- *Q 10 Z6+ 3
00 64
NW6A-0-3/1
NW6A-0.3/15
not
FIG. 6.2b CRACK PATTERNS AT FAILURE OF TIIG NO, &IAL WEIGHT BE. VIS ('The remaining beams)
(The circled numbers show the sequence in which the cracks were observed; the other numerical figures show the load, in 10 kN units, at which the extent of the cracks were as marked. Beam notation as in Table 6.1)
NW6A-0.3/0 NW6A-0-3/4
NW6A-0.3/17 NW6A-0.3/7 NW6A-0.3/11

203.
900 800 700
600 500 400 300
ö 200 J
100 n
ý 0 I, %1%. (', /1 . -711Z1 - - 3
2,
Lio
5 p
N" 0.3 m
(a) Web steel as in Fig 6.1; x/D= 0.3; opening No 4.
1200 1100 1000
900 800
700
600 500
0 400 ö 300
200
100 0
"Ali
Z ý' Q
0.3
(b) Web steel Type W6A(Fig 6.1); x/D=0.3; opening varies
Beam notation as in Table 6.1
FIG . 6.3 MAXIMUM CR %CK WIDTHS
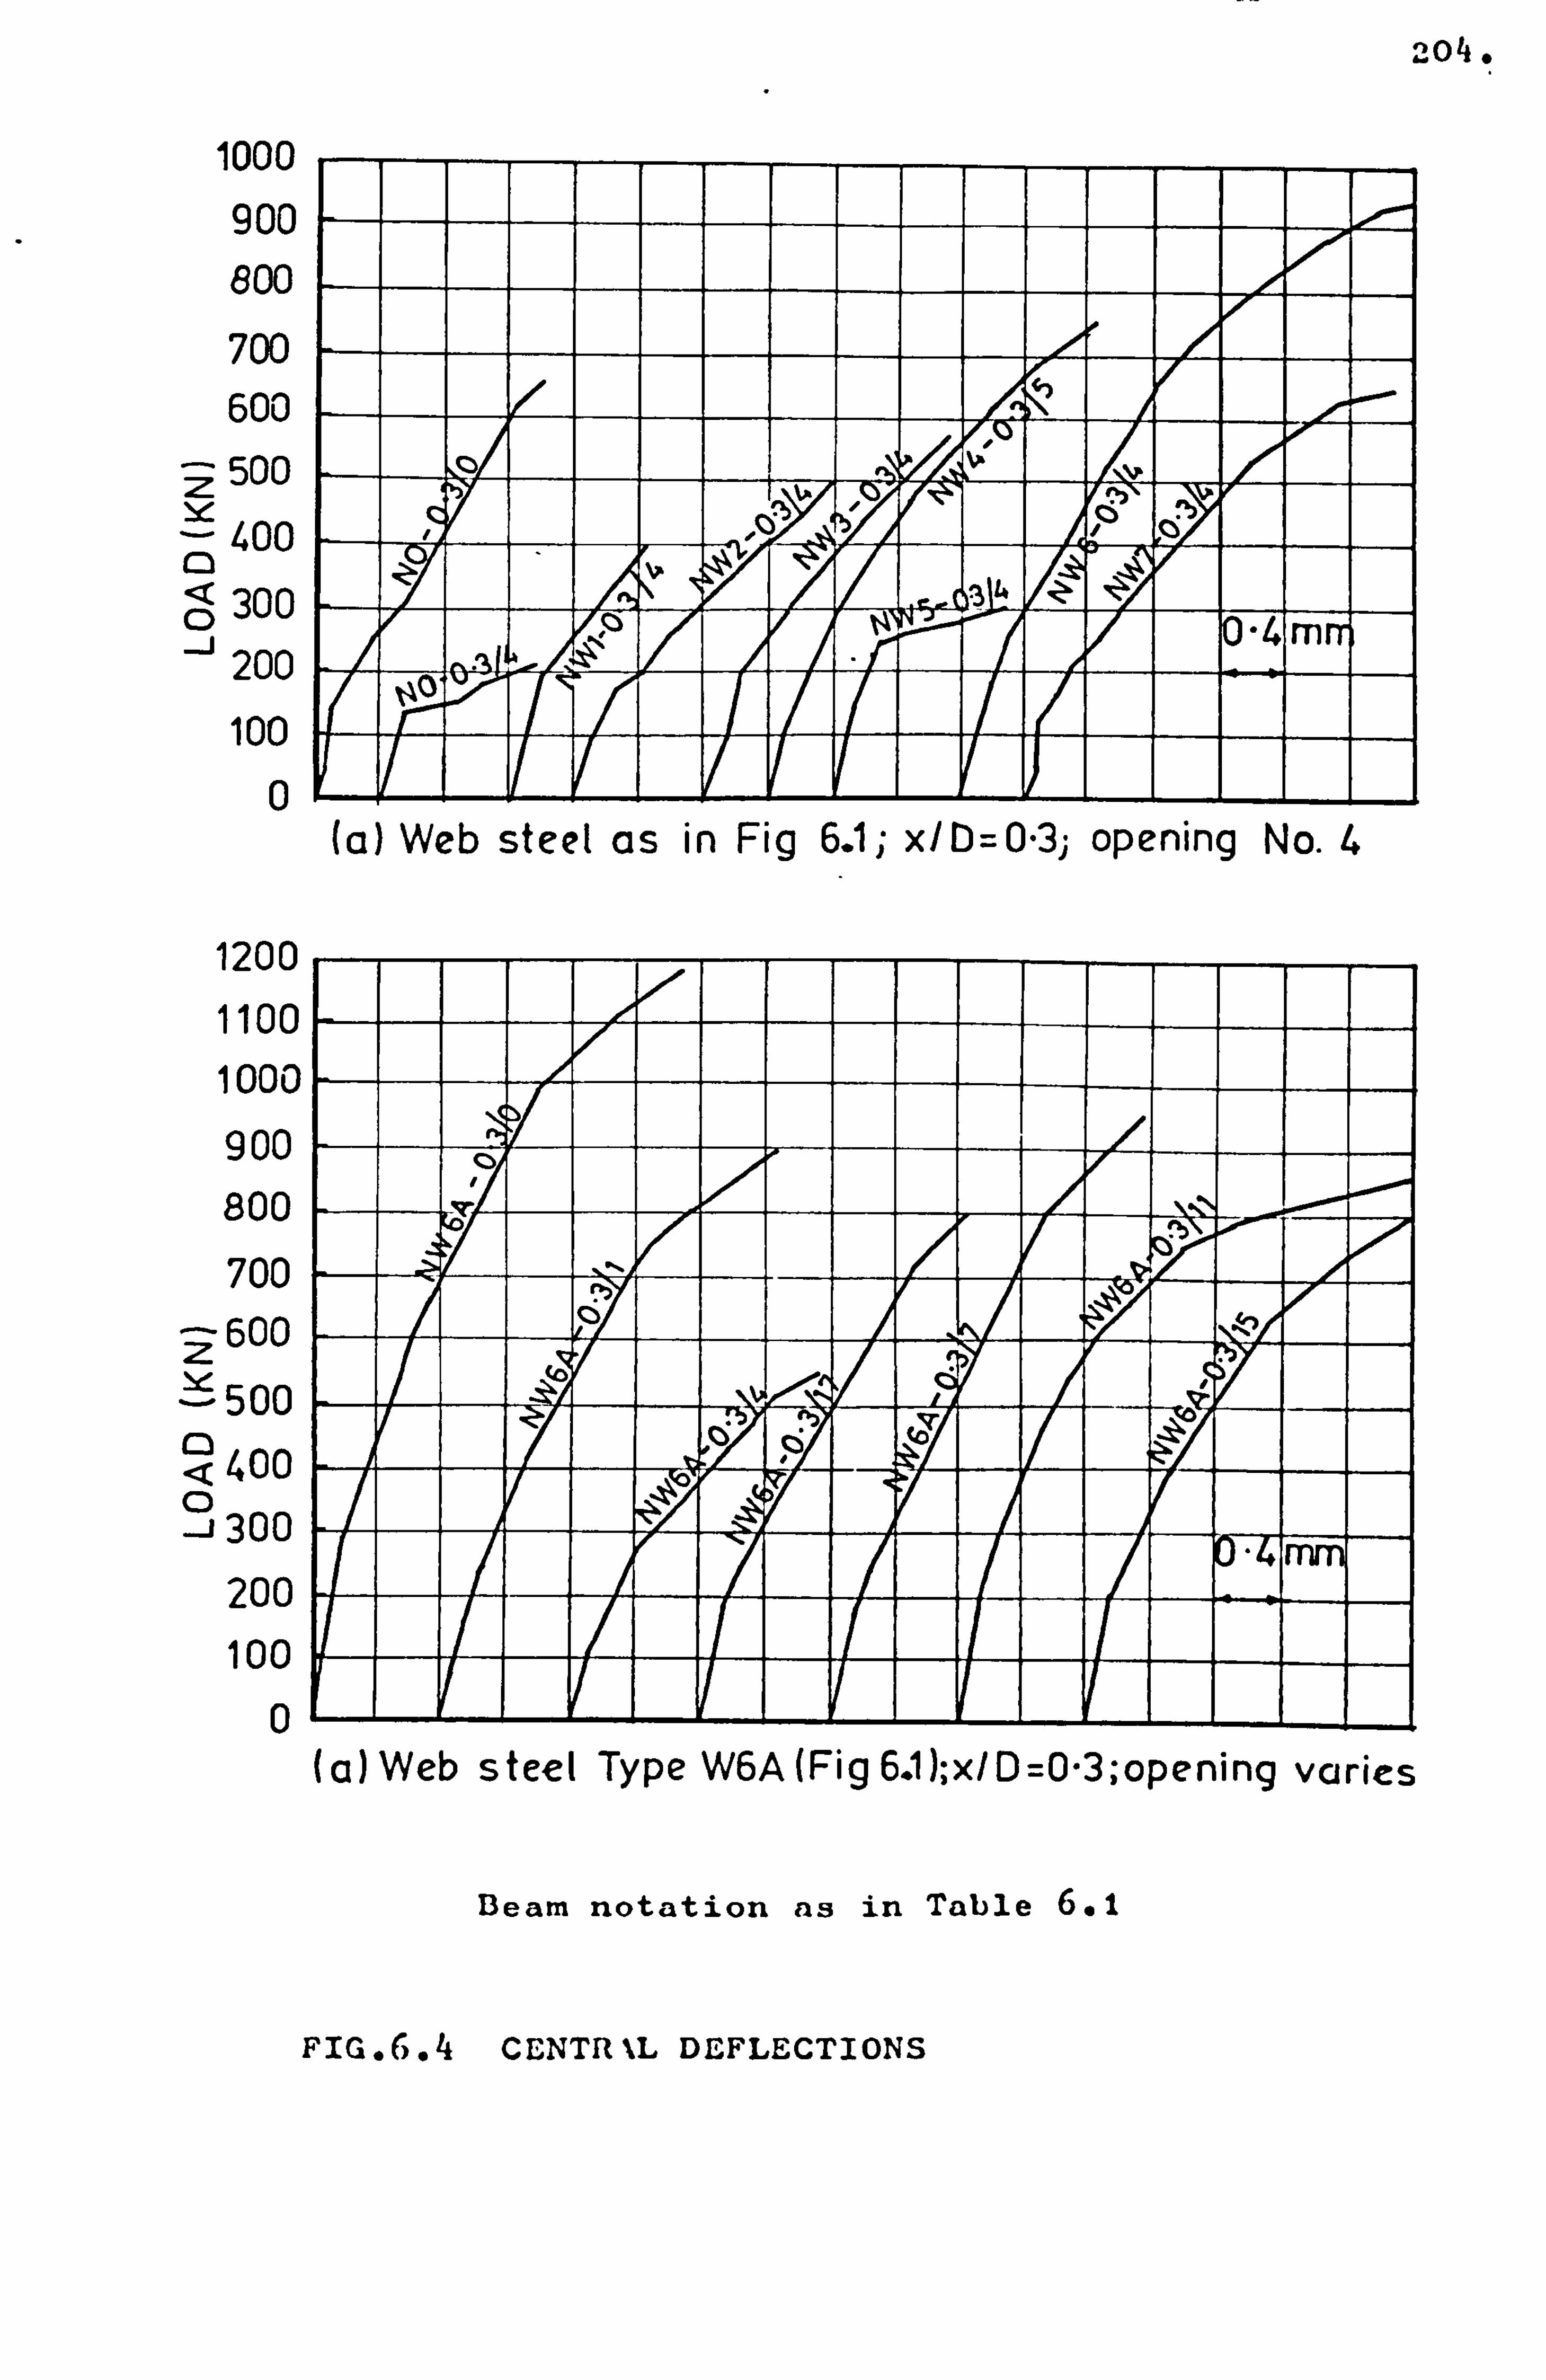
204.
1000 900 800 700 600
500
400 0 ö 300
200
100 0
1200 1100 1000 9 00 800 700
2600 - 500 0 <400
300 200 100
0
h
vý
"41m
(a) Web steel as in Fig 6.1; x/D=0.3; opening No. 4
I
(a) Web steel Type W6A(Fig 6.1); x/D=0.3; opening varies
Beam notation as in Table 6.1
FIG. f .4 CENTR \L DEFLECTIONS

Beam , Ref. No.
Ultimate Measured
W1 kN
Loads Computed
W2 kN
1ý1
`_ 2
M-o. 4/0 660 +695 0.95 M-o. 4/1 580 590 0.98 M-0.4/2 360 406 0.88 M-o. 4/3 445 231 1.93 M-0.4/4 450 270 1.66 M-o. 4/5 600
+ +6oo 1.00 M-o. 4/6 270 102 2.64 M-o. 4/8 340 193 1.76 M-o. 4/9 240 268 0.89 M-0.4/1o 300 241 1.25 M-0.4/11 600
+ +657 0.91 M-0.4/12 520 +653 0.80 M-0.4/13 130 163 0.79
0-0.4/0 660 +590 1.12
0-0.4/2 370 352 1.05 0-0.4/4 340 277 1.22 0-0.4/5 540
+ +550 0.98 0-0.4/6 190 74 2.56 0-0.4/7 420 423 0.99
0-0.25/0 660 $662 1.00 0-0.25/2 360 441 0.81 0-0.25/4 460 337 1.36 0-0.25/5 560 $689 0.81 0-0.25/6 280 125 2.23
Continued next page a
Beam notation as in Table 4.1
+Equation (7.1) used for these beams; Egn. (7.2)used for others.
1
TABLE 7.1 MEASURED AND COMPUTED ULTIM%TE LOADS

Beam , Ref. No.
Ultimate Measured
x, 11 kN
Loads Computed
W2 kN
w1
if 2
0-0.3/0 595 +651 0.91
0-0.3/1 460 +637 0.72 0-0.3/2 390 295 1.32
0-0.3/3 280 275 1.02 0-0.3/4 260 275 0.95 0-0.3/5 200 278 0.72
0-0.3/6 250 287 0.87
0-0,3/7 420 396 1.06
0-0.3/8 380 341 1.11
0-0.3/9 280 325 o. 86 0-0.3/10 210 243 0.86
0-0.3/11 360 467 0.77 0-0.3/12 560
+ +707 0.79 0-0.3/13 300 483 0.62
0-0.3/14 560 + +664 0.84
0-0.3/15 260 183 1.42 0-0.3/16 195 48 4.00
0-0.2/0 655 +720 0.90
0-0.2/4 360 356 1.01
0-0.2/13 500 507 0.99 0-0.2/16 340 92 3.70
Continued next page
s Beam Notation as in Table (5.1)
t +Equation (7.1) used for these beams; equations (7.2)
used for the others
TABLE 7.1 Continued.

. k)7"
Beam "
Ref. No.
Ultimate Measured
W1 kN
Loads Computed
W2 k
Wi
W 2
0-0.3/2R 260 284 0.92 0-0.3/3R 400 266 1.50 0-0.3/48 215 294 0.73 0-0.3/5ß 330 295 1.12
WI-0-3/4 400 "'» W2-0.3/4 490 ""» W3-0.3/4 560 557 1.01 w4-o. 3/4 660 791 0.83 W5-0.3/4 370 ».. «6-0.3/4 825 798 1.03 W7-0.3/4 630 536 1.18
w1(A) 475 '»»
W3(A) 500 552 0.91 w4(A) 650 797 0.82 W7(A) 670 542 1.24
WN-o. 4/o 660 +667 0.99 pari-o. 4/i8 500 356 1.4
WM`-o. 4/18 500 356 1.4
Continued next page
M Beam notation as in Table (5.2)
+Equation (7.1) used for these beams; equations (7.2) used for the others.
TABLE 7.1 Continued.

ý1)8.
Beata " Ref. h'o.
Ultimate Measured
w1 kN
Loads Computed
W2 kN
W1
W 2
No-0.3/0 680 +861 0.79
No-0.3/4 , 240 367 0.65
NW1-0.3/4 420
NW2-0.3/4 580 , ""
NW3-0.3/4 620 651 0.95
NW4-o. 3/4 780 867 0.90
NW5-0.3/4 370
NW6-0.3/4 1060 907 1.17 NW7-0.3/4 720 591 1.22
Nw6A-0.3/0 1215 +991 1.22 Nw6A-0.3/1 1015 +944 1.07 NW6A-0.3/4 620 542 1.14 NW6. %-0.3/17 840 593 1.4 NW6A-0.3/7 930 652 1.4 NW6A-0.3/11 880 845 1.04 NW6A 0.3/15 820 402 2
" Beam notation as in Table (6.2)
+Equation (7.1) used for these beams; equation (7.2)
used for the others.
TABLE 7.1 Continued.
0

209.
kw Ix -ý 2
k2 D
E`ý º
F4
f
i /B
}L Upper Path . ý`2 D
Lower Path
C
w 2
FIG. 7.1 THE STRUCTURAL IDEALIZATION

. lU. Quit
Beam thickness b
y °C Aw
D
As
FIG 7.2(a)
X ý lt
Yý A
Y
y1 ,
B Aw
k2D ,o
As Cý
I
FIG 72 (b) 1 K1X
C1 is an empirical coefficient. For normal weight concrete, C=1.4. For lightweight concrete C=1.35 where the cylinder splitting strength f is determined in accordance with 1STM Standard C330; tC
= 1.0 where ft is determined in accordance with DS 181
C2 is an empirical coefficient equal to 300 N/mm" and 130 N/mm for deformed bars and plain round bars, respectively
A is an empirical coefficient equal to 1.0 for main longitudinal bars (: 1 ) near beam soffit and 1.5 for web reinforcement prooper (k
W) A is equal to the area of the main bars (1 or the area
of the web bars (A w) as the case may be
ft, is the cylinder splitting strength of concrete
FIG-7.2 EXPL %N. %TION OF SYMBOLS
A

211.
x 225
, ýcxl=53'
0
0
10 mm Dia. Stirrups
i
O O
,ý °`ý = 53 20 mm i
k, x1 225 L 1125
r»-
ft = 2-87 N /Tnm2
b= 100 mm
All dimensions in mm.
FIG. 7.3 PROPERTIES %ND DIMENSIONS OF BEAM W3_O. 3/4

V
O a)
v
z Y
Data taken from Table 7.1
212.
FIG-7.4 COMPARISON OF COMPUTED \ND MEASURED ULTIDIATE LOADS
W2 kN (Computed)

213
v,
FIG. 8.1 DESIGN EQUATIONS: GEOMETRIC%L NOTATION
0

214.
i
Symetrical about
x-1400
4500kN
Qx 750
1,
or
a2 D=1000
kxý 1200 ,,., r k2 D= 2600
. L_ L6
Normal wt. concrete. fc = 22.5 N/mm2
fcu = 30.0 N /mm2 ft = 3.0 N/mm2
D= 4800
Deformed bars fy = 410.0 N/mm2
FIG. 8.2 DESIGN EX\1PLE: GEOMETRY AND LOADING
All dimensions in millimetres

215.
Bea b=E
FIG. 8.3 DESIGN EXNNPLE: MAIN STEEL AND WED STEEL
threes)__
DETAILS

=1O.
A
Beam Ref.
No.
CEF3 by /W4
ACI w /W5
PCA W1 Wý
CIRIA J1/lJ7
M-o. 4/O 2.09 1.62 6.2 1.66 0-0.4/0 2.02 2.44 6.1 1.87 0-0.25/0 1.94 2.28 6.0 1.72 0-0.3/0 1.61 2.04 5.1 1.57 0-0.2/0 1.75 2.07 3.7 1.66
Wh_. 0 . 4/0 3.29 2.13
, 10.1 1.75
N0-0.3/0 1.52 1.70' 4.2 1.41 NW6a-0.3/0 2.98 2.37 7.9 2.24
Average values 2.38 2.08 6.2 1.73
a
Beam notation as given in Tables, '*. 195.1 and 6.1
W1 is the measured ultimate of the beams as given in Tables 4.2,5.2 and 6.2
w4 to W are, respectively, the computed design loads aýcording to the CEB-FIP Recommendations. the ACI Building Code, the I'C. \ Concrete Information 3T66 and the CIRIA Guide.
TABLE 9.1 COMPARISON OF COMPUTED DESIGN LOADS

217.
Effective span (/) = to + (the lesser of c, /2 or 0.1/0) + (the lesser of c2/2 or 0.110)
Active height (h. ) =h when I>h
=( when h>1
L
Ö
-A
FIG. 9.1 BASIC DIMENSIONS OF DEEP BEA}IS: CIRIA GUIDE (FIG. 5)9
t
oncentrated top load
ine
FIG. 9,2 MEANING OF SYMBOLS: CIRIA GUIDE (FIG. 14)9

218
TABLE 4 Concrete shear stress parameter, vx (N/mm2 )
Clear shear span theight -. Concrete grade Uý�)
(0 1) 15 20 25 30 40
1.0 2.52 2.91 3.25 3.56 4.11 0.8 2.79 3.22 3.60 3.94 4.55 0.6 3.06 3.53 3.95 4.33 5.00 0.4 3.33 3.85 4.30 4.71 5.44 0.2 3.60 4.16 4.65 5.09 5.88 0 3.87 4.47 5.00 5.48 6.32
TABLE 5 Maximum shear stress parameter, v,,,, (N/mm2)
Concrete grade (%u) º'mrx
15 5.03 20 5.81 25 6.50 30 7.12 40 8.22
TABLE 6 Main (sagging) steel shear stress parameter, v,,,, (N/mm2)
Clear shear span/lieight %main (sagging) steel (p,,,, ) (x/h)
0.2 0.4 0.6 0.8 1.0
1.0 0.20 0.39 0.59 0.78 0.98 0.8 0.24 0.48 0.71 0.95 1.19 0.6 0.29 0.57 0.86 1.15 1.43 0.4 0.34 0.67 1.01 1.34 1.68 0.2 0.38 0.75 1.13 1.50 1.88 0 0.39 0.78 1.17 1.56 1.95
TABLE 7 Horizontal web steel shear parameter, v, ý, h (N/mm2 )
Clear shear span/height %horizontal web reinforcement (p. h) (x/11)
0.25 0.30 0.35 0.4 0.6 0.8 1.0
1.0 0.12 0.15 0.17 0.20 0.29 0.30 0.40 0.8 0.15 0.18 0.21 0.24 0.36 0.48 0.60 0.6 0.18 0.22 0.25 0.29 0.43 0.57 0.72 0.4 0.21 0.25 0.29 0.34 0.50 0.67 0.84 0.2 0.23 0.28 0.33 0.37 0.56 0.75 0.94 0 0.24 0.29 0.34 0.39 0.59 0.78 0.98
TABLE 8 Vertical web steel shear parameter, v,,,,,, (N/mm2 )
Clear shear span/height % vertical web reinforcement (pNý ) Wh')
0.15 0.20 0.30 0.40 0.60 0.80 1.0
1.0 0.07 0.10 0.15 0.20 0.29 0.39 0.49 0.8 0.05 0.06 0.09 0.12 0.18 0.24 0.30 0.6 0.02 0.03 0.05 0.06 0.10 0.12 0.16 0.4 0.01 0.01 0.02 0.02 0.03 0.04 0.05 0.2 0.00 0.00 0.00 0.00 0.00 0.01 0.01 0 0.00 0.00 0.00 0.00 0.00 0.00 0.01
FIG. 9.3 CIRIA DESIGN TABLES (Nos. 4 to 8)9
1
Ad

219.
12 mm &a. bars at 75. cts. each face
I, II I'
12mm dia bars at 150 cts. each face
12m at 1
ia. sti rr C
12 mm dia. stirrups at 150 cts.
Required beam width = 500 mm 4 No. 25 mm dia main
ars (in threes)
FIG. 9.4 BEAM DESIGNED TO CIRI, \ GUIDE

220,
I it - Width of applied kad
iiiii_
Compression band widths for assessing hole admissibility
M 0
Lt M O
N O
N 0
- Centre of compression
- Actual stress trajectory loser to this bne
- Compression band
J Tension band
L
Approx to direction of principal
Effective support length is actual column width, stresses Micateo c, or 0 2la whichever is the less thus --ý--+-
Dimensions of opening 0.2 times width of notional force bands given above
FIG. 9,5 ASSESSMENT OF HOLE ADMISSIDILITY: CIRIA GUIDE (FIG. 19)9

221.
-1
re of Con prc:, tion
x
Compression p bond widths for assessing 0 odmissibihty
0
Tension a
band width .
I Aý
e
BI I
I
O
'-- ö-- -ifiký`i\--
0
Condition of admissibility:
Dimension of hole O. 2 x width of notional force band under consideration.
Examples:
Hole A- adm: and
Holes Il, C, I)
Hole E- not and
issible (cf. opening type 11, Fig. 5.2 5.4)
- max. opening sizes admissible for the force bands considered
admissible (cf. opening type 14, Fig. 5.2 5.4)
FIG. 9.6 CIRIA GUIDE'S CONDITION OF ADMISSIBILITY OF HOLES APPLIED TO TEST SPECIMENS

222.
Notional simply supported deep beams sutou d ig hole
Loads derived from A1c$Pai stresses at centre of hole
FIG. 9.7 SYSTEM OF NOTIONAL DEEP DEANS AROUND AN OPENING: CIRIA GUIDE (FIG. 22)9
o"zst unitload/2
-0.79 -1.15 -0.73
° ý. -071
-0.36
Single span H/L = 2/3 C/L = 1120 Two top point loads at 1/4 span (Stresses propor- tional to unit load/span)
/ 1-9 /
0 OSl 0-45L
FIG. 9.8 TYPICAL PRINCIPAL STRESSES: CIRIA GUIDE (FIG. 51)9

223.
-1 Steel fully anchored Equivalent hole
I /
i L
Actual hole
Sarre area of steel used to reinforce actual We as equivalent hole
Notional simply supported deep beam
FIG. 9.9 REINFORCEMENT AROUND AN OPENING: CIRIA GUIDE (FIG. 24)9

_24
Beam +Lx Embedment
Ref. No. DD Length, mm
'+ ""
fcu rc ft
N/mm2 N/mm2 N/mm2
0-0.3(25fh) 1.25 0-0.3 (25) 1.25 0-0.3 (h) 1.25 0-0.3 (15) 1.25 0-0.3 (10) 1.25 0-0.3 ( 0) 1.25
0-0.55(h) 2.0 0-0.55(10) 2.0 0-0.55(0) 2.0
0.3 200+Std. hook 37.6 0.3 200 36.2 0.3 Std. hook 41.2
0.3 , 120 36.7 0.3 80 39.0 0.3 0 37.2
0.55 Std. hook 39.6 0.55 80 39.8 0.55 0 40.0
31.3 2.53 35.5 2.63 32.7 2.77 31.5 2.48 32.3 2.83 33.0 3.10
36.7 2.50 37.2 2.50 37.7 2.45
" Beam notation: The 0 before the hyphen indicates no web reinforcement; the x/D ratio is given after the hyphen, followed by the embedment length in brackets. For example: 0-0.3(10) refers to a beam having an x/D ratio of 0.30 and an embedment length of 10 bar diameters.
it fcu = cube strength (100 mm)
+fc = cylinder compressive strength (300 mm x 150 mm)
ft = cylinder splitting tensile strength (300 mm x 150 mm - in accordance with ASTM 0330.
TABLE A1.1 PROPERTIES OF TEST SPECIMENS.

Beam Measured Computed
Reference Ultimate pp R Loads ult/ flex
No. pult
kN
0-0.3(25+h) 320 3.37 0-0.3 (25) 320 3.37 0-0.3 (h) 300 3.16 0-0.3 (15) 320 3.37 0-0.3 (io) 300 3.16 0-0.3 (o) i8o 1.89
0-0.55(h) 190 2.52 0-0.55 (10) i90 2.52 0-0.55 ( o) 140 1.86
s Beam notation as given in Table A1.1
ii
Ratio of measured ultimate load (Pult) to computed flexural design load (Pflex ) using Eqn. (9.1).
TABLE Al. 2 ULTIMATE LOADS

,.: 6
E E
N P,
4--
38 mr
Varies
6 mm dia at 89 mm centres horizontally Stirrups in Series A Single bars in Series B
2 No 8 mm dia bars
6 mm dia Horizontal spacing 152 mm Vertical spacing 76 mm Stirrups in Series C Single bars in Series D
2 No 8 mm dia bars
FIG. A1.1 SINGH'S TEST SPECIMENS (Further details are given in lzef. 12)
317 mm or, 508 mm
E E
N i: Rl
-L
38 mm i Varie s
r. 952 mm or 1524
No web reinforcement
2 No 8 mm dia bars
FIG. A1.2 DIMENSIONS AND REINFORCEMENT
DETAILS OF THE PRESENT TEST SPECIMENS
317 mm or 508mm

227.
p-O. 55 (0) -0.55 (10
O-O. 55 (h1
O. 4mm
OO O O r` 0.4 mm
a a ö O 0 o
O F O
Beam notation as in Table (A1.1)
200, Z Y
ioo 0
300
200
goo9
FIG. A1.3 CENTRAL D:. FLi, CTION CURVES

228.
i
II [--- III- 5 ýOl 0_0.55 (1O h0
-o-5 O_ 0.551h;
O. 5 mm
LA N
IT ]
O p `9 i p ý? 0.5 mm
p D 0 O Ö 0 p p p
Beam notation as in Table (Al.! )
FIG. A1.4 MAXIMUM CRACK WIDTHS
200
z
IOO Q
300
Z
200
O
I00

ream notation as in Table '. 1.1
0-0-55(h)
The circled numbers show the mýmquence in which ti; e cr- cl. ' wec( i, bvt'rvedq t'. it other numerical fi.; ures show the load, in 10 kN units, at which the extent of the cracks were as marked.
FIG. ' 11.5 Cit. \CK i' \TTt; KN: i \T F1IlAJU
ý4I
sR -i+'i
.
Yý 1fýýlýýitý Tyf, ý', Ný"1'i'ß ýý 'ýýiýký`týýýýýäýtlýýýýýý
N-..
'1
ý ß"i4 t "1ýYýýCý
gyn. ý_ý ýý
1Yý ''ýF ýt$ý fS. 7"ýTn,
'ý7414 ti L' tý tý'ý'.. " `, ý ife.
,ý .
A, r ý1ý. «t
0-0-5500)
0-0-3(0) 0-0 3(h) UU AMA
0-0-305) 0-0 3 (25) U-U 3(25+h)

Beam L D
x D
Web steel foü fo + ft++ Test
Ref. No. Type % N/mm N/mm2 N/mm age
A-2/0.4 2 0.4 A 1.2 37.4 29.82 2.44 111
B-2/0.4 2 0.4 B 1.2 45.0 36.26 2.53 1119
C-2/0.4 2 0.4 C 1.2 46.6 37.0 2.63 69
Beam notation: The web reinforcement type (Fig. A2.1) is given before the hyphen; the L/D ratio is given after the hyphen, followed by the x/D ratio.
PI fcu = cube strength (100 mm) at completion of test.
fc = cylinder compressive strength (300 mm x 150 mm)
++f t= cylinder splitting tensile strength (300 mm x 150 mm)
- in accordance with ASTri Standard C330.
Age in days at completion of test - all beams were cast on the same day and the duration of each test was approximately 41 days.
TABLE A2.1 PROPERTIES OF TEST SPECIMENS

Beam Measured ACI load Diagonal Singh's test
Ref. No. ult. load kN kN cracking load beams kN
1A-2/0.4 706 283 157 646
B-2/0.4 687 294 216 685
C-2/0.4 726 274 274 724
Beam notation as in Table A2.1
Measured ultimate load of Singh's test beams; further details are given in Reference 32.
TABLE A2.2 MEASURED AND COMPUTED LOADS

E ON
38 mm L 15 24mm
6 mm dia stirrups Horizontal spacing 152 mm Vertical spacing 76 mm
I
6 mm dia stirrups Horizontal spacing 152 mm Vertical spacing 38 mm
and 108 mm
6 mm dia inclined stirrups 45'to horizontal at 76 mm spacing horizontally
FIG. 42.1 GENER 1L ARRANGEMENT AND DETAILS
OF WED REINFORCEMENT
A
TYPE A
TYPE B
TYPE C

V0J"
-2/b"4
600
500 z 400 0 ö 300 J
200
100
0.4 1mm
FIG. A2.2 CENTRAL DEFLECTIONS
B-2/b-4 . -2i 600
500
400 LJ
300 Cl ö 200 J
100
0.1
FIG. A2.3 M kXIMUM DI 4GONAL CRACK WIDTHS
Beam notation as in Table A2.1
The beginning of Stage 1 cycling is indicated by a dot (. ), that of Stage 2 by (x)
and that of Stage 3 by (0)
'A

500
400
Y 30C
200 O J 100
10 . ̀L 4 .u
// v 0.4 mm I
Beam notation as in Table -t2.1
Singh's beams are indicated by an asterisk (");
further details are given in Reference 32.
FIG 1 2.4 COMP URISON OF SINGIH' S AND PRESENT TEST RESULTS: CENTRAL DEFLECTIONS

235.
learn notation as in Table A2.1
Numerical figures show the load, in 10 kn units, at which each crack was observed and the extont of the crack at that load, The symbols Cl to C5 indicate the extent of cracking during load cycling as follows:
y ea rn 1-t, 'J . -k .: e <im v= 2/0 .4
Cl = 120,000 Qyclee, Stage 1 Cl a 45,000 cycles, Stage 1 C2 = 100,000 cycles, hege 2 C2 = 120,000 cyclo: 3, . itage 1
,3: 200,000 cycles, Stage 2 C3 - 11,000 Cycles, Stage 2 C4 - 300,000 cycles, itage 2 C4 = 113x000 cycle;: i, Stage 2 (; 5 a 100,000 cycle., stage 3 C5 - 300,000 cycle., stage 2
Seam 0- 3/004 Cl = 120,000 cycl©sP Stave 1 C2 s 150,000 cycles, Stage 2 C3 = 300,000 cycles, 4ta�e 2 C4 : 100,000 cycles# Stage 3
FIG. A2"5 CROCK IIATT61LNS AT VAILURE;
A-2/ 0.4 C-2/ 0.4
B-2/0.4 B-2/0-4
Top Related
Copyright © 2022 FDOKUMEN

