


Bahasa
Halaman
Hukum


International Journal of
Molecular Sciences
Article
Reconstruction of the Diaminopimelic Acid Pathway toPromote L-lysine Production in Corynebacterium glutamicum
Ning Liu 1, Ting-Ting Zhang 1, Zhi-Ming Rao 1,2,* , Wei-Guo Zhang 1 and Jian-Zhong Xu 1,*
�����������������
Citation: Liu, N.; Zhang, T.-T.; Rao,
Z.-M.; Zhang, W.-G.; Xu, J.-Z.
Reconstruction of the Diaminopimelic
Acid Pathway to Promote L-lysine
Production in Corynebacterium
glutamicum. Int. J. Mol. Sci. 2021, 22,
9065. https://doi.org/10.3390/
ijms22169065
Academic Editor: Andreas Burkovski
Received: 28 July 2021
Accepted: 15 August 2021
Published: 23 August 2021
Publisher’s Note: MDPI stays neutral
with regard to jurisdictional claims in
published maps and institutional affil-
iations.
Copyright: © 2021 by the authors.
Licensee MDPI, Basel, Switzerland.
This article is an open access article
distributed under the terms and
conditions of the Creative Commons
Attribution (CC BY) license (https://
creativecommons.org/licenses/by/
4.0/).
1 The Key Laboratory of Industrial Biotechnology, Ministry of Education, School of Biotechnology,Jiangnan University, 1800# Lihu Road, Wuxi 214122, China; [email protected] (N.L.);[email protected] (T.-T.Z.); [email protected] (W.-G.Z.)
2 National Engineering Laboratory for Cereal Fermentation Technology (NELCF), Jiangnan University,1800# Lihu Road, Wuxi 214122, China
* Correspondence: [email protected] (Z.-M.R.); [email protected] (J.-Z.X.);Tel./Fax: +86-510-85329312 (J.-Z.X.)
Abstract: The dehydrogenase pathway and the succinylase pathway are involved in the synthesis ofL-lysine in Corynebacterium glutamicum. Despite the low contribution rate to L-lysine production, thedehydrogenase pathway is favorable for its simple steps and potential to increase the production of L-lysine. The effect of ammonium (NH4
+) concentration on L-lysine biosynthesis was investigated, andthe results indicated that the biosynthesis of L-lysine can be promoted in a high NH4
+ environment.In order to reduce the requirement of NH4
+, the nitrogen source regulatory protein AmtR wasknocked out, resulting in an 8.5% increase in L-lysine production (i.e., 52.3 ± 4.31 g/L). Subsequently,the dehydrogenase pathway was upregulated by blocking or weakening the tetrahydrodipicolinatesuccinylase (DapD)-coding gene dapD and overexpressing the ddh gene to further enhance L-lysinebiosynthesis. The final strain XQ-5-W4 could produce 189 ± 8.7 g/L L-lysine with the maximumspecific rate (qLys,max.) of 0.35 ± 0.05 g/(g·h) in a 5-L jar fermenter. The L-lysine titer and qLys,max
achieved in this study is about 25.2% and 59.1% higher than that of the original strain withoutenhancement of dehydrogenase pathway, respectively. The results indicated that the dehydrogenasepathway could serve as a breakthrough point to reconstruct the diaminopimelic acid (DAP) pathwayand promote L-lysine production.
Keywords: L-lysine biosynthesis; Corynebacterium glutamicum; diaminopimelic acid pathway;diaminopimelate dehydrogenase; ammonium supply
1. Introduction
L-lysine is an essential amino acid widely used in food, animal feed, medicine, cosmet-ics, and other industries [1]. Methods to produce L-lysine include albuminolysis, chemicalmethod, enzymic method, and microbial fermentation. Microbial fermentation uses renew-able feedstock and produces low amounts of pollutants [2]. Therefore, L-lysine is mainlyproduced by microbial fermentation in the industries, with C. glutamicum and Escherichiacoli being the most commonly used strains [1].
The L-lysine biosynthesis includes two pathways, the diaminopimelic acid (DAP)pathway and the α-aminoadipic acid (AAA) pathway. In the AAA pathway, L-lysine is syn-thesized from α-ketoglutarate and acetylcoenzyme A (acetyl-CoA) in which α-aminoadipicacid serves as an intermediate metabolite. The AAA pathway is commonly found in yeast,fungi, and some species in the domain Archaea [3,4]. In the DAP pathway, however,L-lysine is synthesized from aspartate and pyruvate in which meso-diaminopimelic acid(meso-DAP) serves as an intermediate metabolite (Figure 1) [5]. Commonly found in ar-chaea, algae, fungi, plants, and bacteria [6], the DAP pathway starts with the biosynthesisof L-∆1-tetrahydrodipicolinate (THDPA) from L-aspartate, which is then converted intomeso-DAP, and finally, L-lysine is produced with diaminopimelate deacetylase (DAPDC,
Int. J. Mol. Sci. 2021, 22, 9065. https://doi.org/10.3390/ijms22169065 https://www.mdpi.com/journal/ijms

Int. J. Mol. Sci. 2021, 22, 9065 2 of 17
EC:4.1.1.20) as the catalyst [7]. The conversion into meso-DAP is the essential step that dis-tinguishes the four DAP pathway variations, the succinylase pathway, acetylase pathway,dehydrogenase pathway, and aminotransferase pathway [8]. The four variants share thecommon steps of converting L-aspartate to THDPA by aspartokinase (AK, EC:2.7.2.4), as-partic semialdehyde dehydrogenase (AsaDH, EC:1.2.1.11), dihydrodipicolinate synthetase(DHDPS, EC:4.3.3.7), and dihydrodipicolinate reductase (DHDPR, EC:1.17.1.8) in turn. Dif-ferent enzymes are involved in the four different variant pathways to produce meso-DAP(Figure 1). The succinylase pathway is the most common in most bacteria including E.coli [9]. The acetylase pathway is found only in some Bacillus, and the dehydrogenase path-way only exists in some Gram-positive bacteria (i.e., Corynebacterium and Bacillus) [10] andplants (i.e., Glycine and Zea) [11]. The aminotransferase pathway is found in Cyanobacteria,Chlamydia, Methanothermobacter thermautotrophicus, and Arabidopsis thaliana [12–14]. Amongthe four variants, THDPA is directly converted into meso-DAP in the dehydrogenase path-way. Therefore, the dehydrogenase pathway is more favorable in situations where energyis limited [15]. However, L-lysine accumulation in the dehydrogenase pathway requireshigh NH4
+ concentrations [16] due to the low affinity of diaminopimelate dehydroge-nase (DapDH, E.C. 1.4.1.16) for the substrate. Thus, the application of the dehydrogenasepathway is limited [15].
Int. J. Mol. Sci. 2021, 22, x FOR PEER REVIEW 2 of 18
into meso-DAP, and finally, L-lysine is produced with diaminopimelate deacetylase (DAPDC, EC:4.1.1.20) as the catalyst [7]. The conversion into meso-DAP is the essential step that distinguishes the four DAP pathway variations, the succinylase pathway, acety-lase pathway, dehydrogenase pathway, and aminotransferase pathway [8]. The four var-iants share the common steps of converting L-aspartate to THDPA by aspartokinase (AK, EC:2.7.2.4), aspartic semialdehyde dehydrogenase (AsaDH, EC:1.2.1.11), dihydrodipico-linate synthetase (DHDPS, EC:4.3.3.7), and dihydrodipicolinate reductase (DHDPR, EC:1.17.1.8) in turn. Different enzymes are involved in the four different variant pathways to produce meso-DAP (Figure 1). The succinylase pathway is the most common in most bacteria including E. coli [9]. The acetylase pathway is found only in some Bacillus, and the dehydrogenase pathway only exists in some Gram-positive bacteria (i.e., Corynebacte-rium and Bacillus) [10] and plants (i.e., Glycine and Zea) [11]. The aminotransferase path-way is found in Cyanobacteria, Chlamydia, Methanothermobacter thermautotrophicus, and Ar-abidopsis thaliana [12–14]. Among the four variants, THDPA is directly converted into meso-DAP in the dehydrogenase pathway. Therefore, the dehydrogenase pathway is more fa-vorable in situations where energy is limited [15]. However, L-lysine accumulation in the dehydrogenase pathway requires high NH4+ concentrations [16] due to the low affinity of diaminopimelate dehydrogenase (DapDH, E.C. 1.4.1.16) for the substrate. Thus, the ap-plication of the dehydrogenase pathway is limited [15].
Figure 1. The DAP pathway of L-lysine synthesis. (A) Dehydrogenase pathway, (B) succinylase pathway, (C) acetylase pathway, (D) aminotransferase pathway. Abbreviations: DHDPS Dihydro-dipicolinate synthetase, DHDPR Dihydrodipicolinate reductase, DapDH Diaminopimelate dehy-drogenase, DapD Tetrahydrodipicolinate N-succinyltransferase, DapC Succinyl-amino-ketop-imelate transaminase, DapE N-succinyl-diaminopimelate desuccinylase, DapF Diaminopimelate
Figure 1. The DAP pathway of L-lysine synthesis. (A) Dehydrogenase pathway, (B) succinylasepathway, (C) acetylase pathway, (D) aminotransferase pathway. Abbreviations: DHDPS Dihydrodipi-colinate synthetase, DHDPR Dihydrodipicolinate reductase, DapDH Diaminopimelate dehydro-genase, DapD Tetrahydrodipicolinate N-succinyltransferase, DapC Succinyl-amino-ketopimelatetransaminase, DapE N-succinyl-diaminopimelate desuccinylase, DapF Diaminopimelate epimerase,THDP-NAT Tetrahydrodipicolinate acetylase, AT N-acetylaminoketopimelate aminotransferase,NAD-DAC N-acetyl-diaminopimelate deacetylase, DapL Tetrahydrodipicolinate aminotransferase.

Int. J. Mol. Sci. 2021, 22, 9065 3 of 17
C. glutamicum is a Gram-positive bacterium isolated from soil in 1957 [17,18]. C.glutamicum is often used to produce amino acids commercially, such as L-glutamic acid,L-lysine and L-arginine [19]. Interestingly, two variants of the DAP pathway are foundin C. glutamicum, the succinylase pathway, and the dehydrogenase pathway. Accordingto Figure 1, meso-DAP is biosynthesized from THDPA in one step via the dehydroge-nase pathway [20] and in four steps via the succinylase pathway, both of which involveNH4
+. In addition, the L-lysine biosynthesis efficiency of both pathways depends on theconcentration of NH4
+ in the medium [16]. L-lysine was produced mainly through thedehydrogenase pathway at first but then entirely through the succinylase pathway [16]as the concentration of NH4
+ decreases during the fermentation, resulting in the decreasein the dehydrogenase activity [16,21]. Sonntag et al. reported that 33% of L-lysine wassynthesized via the dehydrogenase pathway and 66% via the succinylase pathway in C.glutamicum [22]. Although the succinylase pathway is important for increasing the titer ofL-lysine, the dehydrogenase pathway has potential in improving the production intensityof L-lysine as only one step is required to biosynthesize meso-DAP. Hence the question: doesupregulating the dehydrogenase pathway promote L-lysine production in C. glutamicum?
In this study, the C. glutamicum XQ-5 strain was developed, which took the dehy-drogenase pathway for meso-DAP biosynthesis to promote L-lysine production. TheDAP pathway of C. glutamicum XQ-5 was reconstructed to upregulate the dehydrogenasepathway in L-lysine biosynthesis during the fermentation process. The strategies of thisstudy include as follows: (1) investigating the effect of different NH4
+ concentrationson L-lysine production; (2) alleviating the nitrogen limitation to improve the efficiencyof L-lysine production; (3) rationally regulating the two pathways to promote L-lysineproduction. As a result, a recombinant strain C. glutamicum XQ-5-W4 (i.e., C. glutamicum XQ-5-dapDW∆amtR/pEC-ddh) derived from C. glutamicum XQ-5 was obtained, which produced189 ± 8.7 g/L L-lysine with the maximum specific rate (qLys,max.) of 0.35 ± 0.05 g/(g·h) ina 5-L jar fermenter, which were 25.2% and 59.1% higher than that of the original strain C.glutamicum XQ-5, respectively.
2. Results and Discussion2.1. The Effects of Different Ammonium (NH4
+) Concentrations on L-lysine Production
Nitrogen is one of the essential nutrients for living cells. The nitrogen utilization isvery important for the growth of bacteria. Ammonium (NH4
+) is the standard componentof the growth medium and the preferred nitrogen source for many bacteria. Both variantsof the DAP pathway in C. glutamicum require the participation of NH4
+. Therefore, theeffect of NH4
+ on L-lysine production was investigated. To do this, eight NH4+ solutions
of different concentrations (i.e., 50, 100, 200, 250, 300, 350, 400, 500 mM) were added to theculture mediums and the cell growth, L-lysine production as well as qLys were monitored.The results showed that the growth of strain XQ-5 was significantly inhibited from highNH4
+ concentration, but the effect of low NH4+ concentration is relatively insignificant
(Figure 2a). Xu et al. observed similar results in which high NH4+ concentration was toxic
to the bacteria [23]. Interestingly, too high or too low NH4+ concentration is not conducive
to L-lysine accumulation (Figure 2b). The L-lysine yield was relatively high at NH4+ con-
centrations of 250 mM, 300 mM and 350 mM, which were 42.3 ± 2.31 g/L, 48.2 ± 3.54 g/L,and 43.9 ± 3.78 g/L, respectively. Interestingly, the maximum specific rate (qLys,max.) wasfound with a 350 mM NH4
+ solution (i.e., 0.22 ± 0.03 g/(g·h)), which was 10% higherthan that with a 300 mM NH4
+ solution (i.e., 0.20 ± 0.01 g/(g·h)) (Figure 2c). These re-sults indicated that an appropriate increase in NH4
+ supply is necessary for the effectivebiosynthesis of L-lysine. Previous research reported that the dehydrogenase pathway isonly active at high NH4
+ concentration [22]. Therefore, increasing the concentration ofNH4
+ may upregulate the dehydrogenase pathway and promote L-lysine biosynthesis. Thetranscription level of the DapDH-coding gene ddh was measured. As might be expected,the transcription level of ddh gene increased with the increase of NH4
+ concentration withina certain range (Figure 2d). It is safe to conclude that the increase of qLys,max at high NH4
+
Int. J. Mol. Sci. 2021, 22, 9065 4 of 17
concentration was related to the increase in ddh gene transcription level, and upregulatingthe dehydrogenase pathway is conducive to promoting L-lysine biosynthesis.
Int. J. Mol. Sci. 2021, 22, x FOR PEER REVIEW 4 of 18
at high NH4+ concentration [22]. Therefore, increasing the concentration of NH4+ may up-regulate the dehydrogenase pathway and promote L-lysine biosynthesis. The transcrip-tion level of the DapDH-coding gene ddh was measured. As might be expected, the tran-scription level of ddh gene increased with the increase of NH4+ concentration within a cer-tain range (Figure 2d). It is safe to conclude that the increase of qLys,max at high NH4+ con-centration was related to the increase in ddh gene transcription level, and upregulating the dehydrogenase pathway is conducive to promoting L-lysine biosynthesis.
Figure 2. The effects of different ammonium (NH4+) concentrations on L-lysine synthesis. (a) Cell growth (OD600) of strain XQ-5 at different NH4+ concentrations. The cell concentration after 25 fold dilution was measured at OD600. (b) L-lysine production of strain XQ-5 at different NH4+ concentrations. (c) The qLys of strain XQ-5 at different NH4+ concentrations. (d) Transcription level of gene ddh at different NH4+ concentrations. All data represent values of three determinations of trip-licate independent experiments.
2.2. Effect of The Upregulated Dehydrogenase Pathway on L-lysine Biosynthesis As mentioned above, upregulating ddh gene promotes the biosynthesis of L-lysine. It
is speculated that upregulating the dehydrogenase pathway may further increase L-lysine production. In order to enhance the effect of the dehydrogenase pathway on L-lysine pro-duction, the ddh gene was overexpressed to investigate whether the qLys and L-lysine pro-duction were improved. The ddh gene was ligated into the plasmid pEC-XK99E, which was then introduced into strain XQ-5 to give the target strain XQ-5/pEC-ddh (i.e., strain XQ-5-1) (Figure 3a). The growth rate, L-lysine production and qLys of strain XQ-5-1 were measured at shake flask fermentation for 72 h, and the effect of the upregulated dehydro-genase pathway on L-lysine production was investigated.
Figure 2. The effects of different ammonium (NH4+) concentrations on L-lysine synthesis. (a) Cell growth (OD600) of strain
XQ-5 at different NH4+ concentrations. The cell concentration after 25 fold dilution was measured at OD600. (b) L-lysine
production of strain XQ-5 at different NH4+ concentrations. (c) The qLys of strain XQ-5 at different NH4
+ concentrations.(d) Transcription level of gene ddh at different NH4
+ concentrations. All data represent values of three determinations oftriplicate independent experiments.
2.2. Effect of The Upregulated Dehydrogenase Pathway on L-lysine Biosynthesis
As mentioned above, upregulating ddh gene promotes the biosynthesis of L-lysine.It is speculated that upregulating the dehydrogenase pathway may further increase L-lysine production. In order to enhance the effect of the dehydrogenase pathway on L-lysine production, the ddh gene was overexpressed to investigate whether the qLys andL-lysine production were improved. The ddh gene was ligated into the plasmid pEC-XK99E,which was then introduced into strain XQ-5 to give the target strain XQ-5/pEC-ddh (i.e.,strain XQ-5-1) (Figure 3a). The growth rate, L-lysine production and qLys of strain XQ-5-1were measured at shake flask fermentation for 72 h, and the effect of the upregulateddehydrogenase pathway on L-lysine production was investigated.
According to Figure 3b, the growth of strain XQ-5-1 was not affected, remaining almostthe same as the original strain. In addition, the final L-lysine production of strain XQ-5-1was 49.3 ± 3.21 g/L, slightly increased compared with strain XQ-5 (i.e., 48.2 ± 3.54 g/L)(Figure 3c). The results showed that the upregulated dehydrogenase pathway had littleeffect on L-lysine production. Similar results were also found in previous reports in which
Int. J. Mol. Sci. 2021, 22, 9065 5 of 17
the overexpression of ddh gene on plasmid had no effect on the L-lysine production ofC. glutamicum [24]. It is speculated that the intracellular NH4
+ concentration limits theincrease of L-lysine production in strains with overexpressed ddh. Due to the low affinityto NH4
+, the dehydrogenase pathway is only adoptable at high NH4+ concentration [16].
However, it is heartening that XQ-5-1 produced the same amount of L-lysine as the originalstrain in a shorter time (Figure 3c). With the same NH4
+ concentration, the qLys,max ofXQ-5-1 was 5–10% higher than that of the original strain (Figures 2c and 3d). Previousresearch suggested that the level of extracellular NH4
+ concentration is higher than theintracellular NH4
+ concentration as the utilization of nitrogen is controlled by AmtR [25].Then, is the increase in intracellular NH4
+ concentration beneficial to L-lysine production?
Int. J. Mol. Sci. 2021, 22, x FOR PEER REVIEW 5 of 18
According to Figure 3b, the growth of strain XQ-5-1 was not affected, remaining al-most the same as the original strain. In addition, the final L-lysine production of strain XQ-5-1 was 49.3 ± 3.21 g/L, slightly increased compared with strain XQ-5 (i.e., 48.2 ± 3.54 g/L) (Figure 3c). The results showed that the upregulated dehydrogenase pathway had little effect on L-lysine production. Similar results were also found in previous reports in which the overexpression of ddh gene on plasmid had no effect on the L-lysine production of C. glutamicum [24]. It is speculated that the intracellular NH4+ concentration limits the increase of L-lysine production in strains with overexpressed ddh. Due to the low affinity to NH4+, the dehydrogenase pathway is only adoptable at high NH4+ concentration [16]. However, it is heartening that XQ-5-1 produced the same amount of L-lysine as the orig-inal strain in a shorter time (Figure 3c). With the same NH4+ concentration, the qLys,max of XQ-5-1 was 5–10% higher than that of the original strain (Figures 2c and 3d). Previous research suggested that the level of extracellular NH4+ concentration is higher than the intracellular NH4+ concentration as the utilization of nitrogen is controlled by AmtR [25]. Then, is the increase in intracellular NH4+ concentration beneficial to L-lysine production?
Figure 3. Effect of dehydrogenase pathway on L-lysine synthesis. (a) The construction process of strain XQ-5-1 and SDS-PAGE analysis of DapDH (i.e., DapDH: 35 kDa). Lane M, protein ruler; lane 1,2: crude enzyme extract (i.e., strain XQ-5-1); lane 3,4: crude enzyme extract (i.e., strain XQ-5). (b) Cell growth (OD600) of strain XQ-5 and XQ-5-1 in shake flask culture. The cell concentration after a 25-fold dilution was measured at OD600. (c) L-lysine production of strain XQ-5 and XQ-5-1 in shake flask culture. (d) The qLys of strain XQ-5-1 in shake flask culture. The data represent mean values and standard deviations obtained from three independent cultivations.
2.3. Effect of Gene amtR Deletion on NH4+ Utilization and L-lysine Synthesis As mentioned above, L-lysine production showed no significant increase with the
overexpression of ddh, possibly due to the low intracellular NH4+ concentration. To ad-dress this limitation, the regulatory proteins controlling the utilization of NH4+ should be inactivated. In C. glutamicum, the expression of genes responding to nitrogen utilization is controlled by the TetR-type regulator AmtR [25]. In contrast with most TetR-type regu-
Figure 3. Effect of dehydrogenase pathway on L-lysine synthesis. (a) The construction process of strain XQ-5-1 andSDS-PAGE analysis of DapDH (i.e., DapDH: 35 kDa). Lane M, protein ruler; lane 1,2: crude enzyme extract (i.e., strainXQ-5-1); lane 3,4: crude enzyme extract (i.e., strain XQ-5). (b) Cell growth (OD600) of strain XQ-5 and XQ-5-1 in shake flaskculture. The cell concentration after a 25-fold dilution was measured at OD600. (c) L-lysine production of strain XQ-5 andXQ-5-1 in shake flask culture. (d) The qLys of strain XQ-5-1 in shake flask culture. The data represent mean values andstandard deviations obtained from three independent cultivations.
2.3. Effect of Gene amtR Deletion on NH4+ Utilization and L-lysine Synthesis
As mentioned above, L-lysine production showed no significant increase with theoverexpression of ddh, possibly due to the low intracellular NH4
+ concentration. Toaddress this limitation, the regulatory proteins controlling the utilization of NH4
+ should beinactivated. In C. glutamicum, the expression of genes responding to nitrogen utilization iscontrolled by the TetR-type regulator AmtR [25]. In contrast with most TetR-type regulators,the dissociation of AmtR from its target promoters is triggered by complex formation of thePII-type signal transduction protein GlnK rather than by the binding of a low-molecularmass ligand [26]. The transcriptional regulator AmtR responses to changes in nitrogenlevels, thus at least 35 genes involved in nitrogen utilization and metabolism needed to beregulated [27]. In order to increase the concentration of NH4
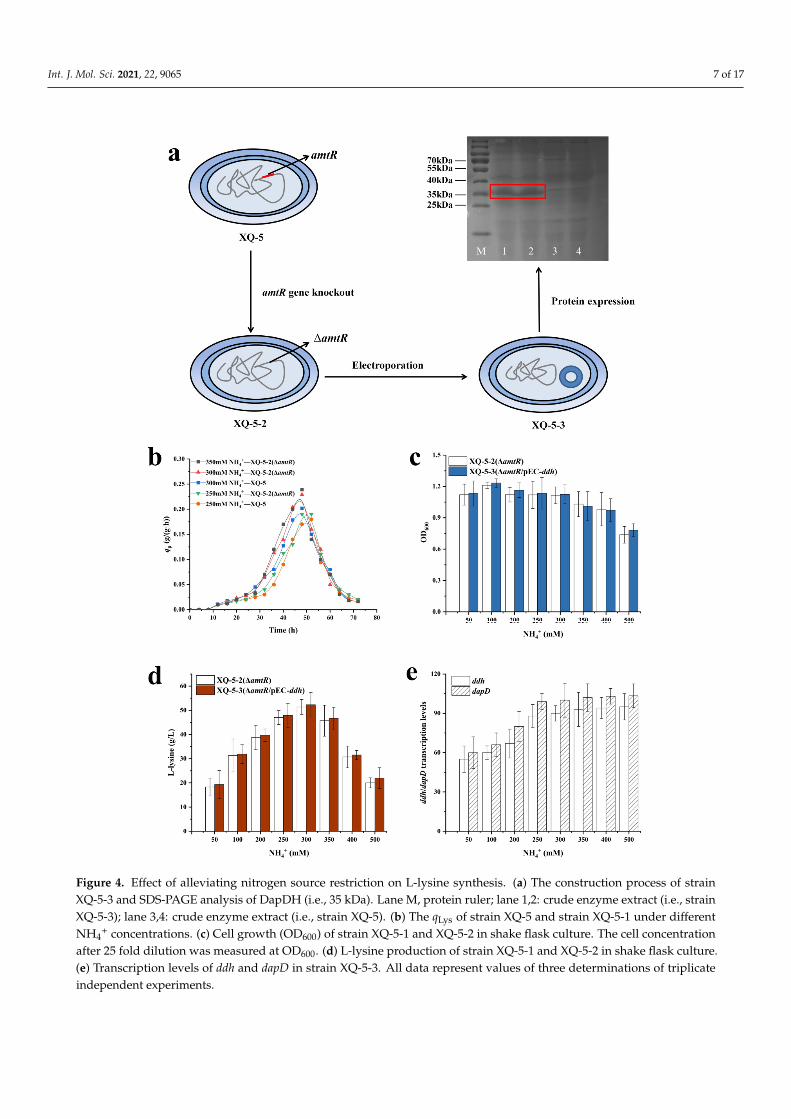
+, the AmtR-coding gene amtRwas deleted to give the target strain C. glutamicum XQ-5-∆amtR (i.e., XQ-5-2) (Figure 4a).

Int. J. Mol. Sci. 2021, 22, 9065 6 of 17
Interestingly, the qLys,max of strain XQ-5-2 at 250 mM NH4+ (i.e., 0.19 ± 0.02 g/(g·h)) was
similar as the strain XQ-5 at 300 mM NH4+ (i.e., 0.20 ± 0.01 g/(g·h)). Moreover, the qLys,max
of strain XQ-5-2 was almost the same at 300 mM (i.e., 0.22 ± 0.03 g/(g·h)) and 350 mMNH4
+ (i.e., 0.23 ± 0.04 g/(g·h)) (Figure 4b). In addition, the highest L-lysine production(i.e., 52.3 ± 4.31 g/L) of strain XQ-5-2 was obtained at 300 mM NH4
+, which was 8.5%higher than that of strain XQ-5 (i.e., 48.2 ± 3.54 g/L) (Figure 4d). Previous results alsoindicated that the deletion of the amtR gene increased the yield of L-lysine [28]. Theseresults indicated that the alleviation of nitrogen restriction increased the intracellularNH4
+ concentration.Subsequently, the plasmid pEC-XK99E-ddh was introduced into strain XQ-5-2 to give
the target strain XQ-5-2/pEC-ddh (i.e., strain XQ-5-3). As expected, the growth of strainXQ-5-2 was inhibited from high NH4
+ concentration (Figure 4c). It should be noted that theL-lysine yield of strain XQ-5-3 was 53.8 ± 3.98 g/L, which is similar to that of strain XQ-5-2(i.e., 52.3 ± 4.31 g/L) (Figure 4d). These results indicated that the overexpression of ddhgene did not significantly increase the L-lysine production of strain XQ-5-2, possibly dueto the fact that the dehydrogenase pathway is still not the dominant pathway for L-lysineproduction of strain XQ-5-3. According to Figure 1, the dehydrogenase pathway is areversible reaction. In addition, previous reports pointed out that DapDH is highly specificto meso-DAP, while L,L-DAP and D,D-DAP are competitive inhibitors [29]. Theoretically,L,L-DAP, an intermediate in the succinylase pathway, inhibits the reverse reaction ofDapDH [29]. Thus, the succinylase pathway was upregulated to supply L,L-DAP duringthe overexpression of ddh. In order to confirm this conjecture, the transcription levels of ddhand dapD were measured in strain XQ-5-3. The results showed that the transcription levelsof ddh and dapD increased with the increase of NH4
+ concentration within a certain range(Figure 4e). The transcription level of ddh was 82% higher at high NH4
+ concentration (i.e.,500 mM) than that at low NH4
+ concentration (i.e., 50 mM). Similarly, the transcription levelof dapD was 92% higher at high NH4
+ concentration (i.e., 500 mM) than that at low NH4+
concentration (i.e., 50 mM). Moreover, it is reported that the expression level of dapD geneincreases after the deletion of amtR gene [28]. These results indicated that the upregulateddapD expression level comes with the upregulated ddh expression level. However, DapD(tetrahydrodipicolinate succinylase, E.C. 2.3.1.117) has a high affinity with the substrateTHDPA [15], making the succinylase pathway the main pathway for biosynthesizingL-lysine rather than the dehydrogenase pathway in spite of the overexpression of ddh.
Int. J. Mol. Sci. 2021, 22, 9065 7 of 17Int. J. Mol. Sci. 2021, 22, x FOR PEER REVIEW 7 of 18
Figure 4. Effect of alleviating nitrogen source restriction on L-lysine synthesis. (a) The construction process of strain XQ-5-3 and SDS-PAGE analysis of DapDH (i.e., 35 kDa). Lane M, protein ruler; lane 1,2: crude enzyme extract (i.e., strain XQ-5-3); lane 3,4: crude enzyme extract (i.e., strain XQ-5). (b) The qLys of strain XQ-5 and strain XQ-5-1 under different NH4+ concentrations. (c) Cell growth (OD600) of strain XQ-5-1 and XQ-5-2 in shake flask culture. The cell concentration after 25
Figure 4. Effect of alleviating nitrogen source restriction on L-lysine synthesis. (a) The construction process of strainXQ-5-3 and SDS-PAGE analysis of DapDH (i.e., 35 kDa). Lane M, protein ruler; lane 1,2: crude enzyme extract (i.e., strainXQ-5-3); lane 3,4: crude enzyme extract (i.e., strain XQ-5). (b) The qLys of strain XQ-5 and strain XQ-5-1 under differentNH4
+ concentrations. (c) Cell growth (OD600) of strain XQ-5-1 and XQ-5-2 in shake flask culture. The cell concentrationafter 25 fold dilution was measured at OD600. (d) L-lysine production of strain XQ-5-1 and XQ-5-2 in shake flask culture.(e) Transcription levels of ddh and dapD in strain XQ-5-3. All data represent values of three determinations of triplicateindependent experiments.

Int. J. Mol. Sci. 2021, 22, 9065 8 of 17
2.4. Blocking the Succinylase Pathway to Upregulate the Dehydrogenase Pathway
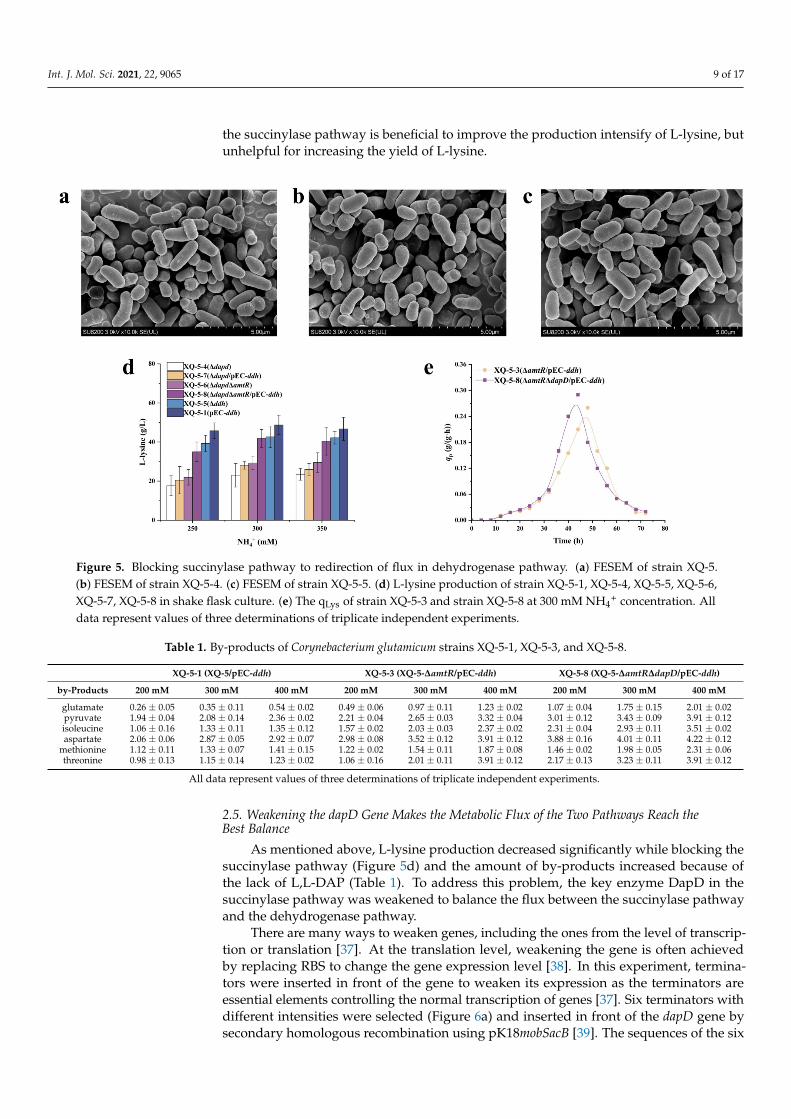
Based on the above results, increasing the expression of ddh gene in the dehydroge-nase pathway showed no significant effect on L-lysine production, possibly due to the factthat the expression level of dapD is increased with the overexpression of ddh. In order toupregulate the dehydrogenase pathway, the succinylase pathway was blocked. The suc-cinylase pathway involves enzymes such as DapC (succinyl-amino-ketopimelate-codinggene dapC), DapE (N-succinyl-diaminopimelate desuccinylase-coding gene dapE), andDapF (diaminopimelate epimerase-coding gene dapF), respectively [30–32]. Previous re-search indicated that the genes dapC and dapE are dispensable for L-lysine overproductionin shake-flask cultures [33,34], whereas the genes dapF and dapD are indispensable for thesuccinylase pathway [15,33]. DapD is the first key enzyme in the succinylase pathway, thusDapD was inactivated to block the succinylase pathway, hence the DapD-deficient strainXQ-5-∆dapD (i.e., strain XQ-5-4). As a control, the DapDH-deficient strain XQ-5-∆ddh (i.e.,strain XQ-5-5) was also constructed. The cell morphology of the three strains (i.e., a:strainXQ-5, b:strain XQ-5-4, c:strain XQ-5-5) were observed with FESEM, and the results indi-cated almost no change in cell morphology compared to the original strain (Figure 5a–c).It is well-known that meso-DAP connects the glycan backbone on the cell wall of manybacteria to give them shape and rigid structure [8]. These results showed that meso-DAPsynthesized by either of these two pathways had met the needs of cell structure.
In order to investigate the L-lysine production of different strains under the differentNH4
+ concentrations, three NH4+ solutions of different concentrations (i.e., 250 mM,
300 mM, and 350 mM) were used in the test. According to Figure 5d, L-lysine pro-duction of strain XQ-5-4 decreased significantly, especially at low NH4
+ concentration(i.e., 17.6 ± 5.11 g/L), indicating that dapD gene is essential for the succinylase path-way and L-lysine production. By contrast, the L-lysine production of strain XQ-5-5 (i.e.,39.3 ± 4.11 g/L) decreased slightly. These results have once again proven that the succiny-lase pathway is the main pathway for L-lysine production rather than the dehydrogenasepathway [22]. It should be noted that the L-lysine production of strain XQ-5-4 increased athigh NH4
+ concentration (Figure 5d), possibly due to the fact that the one-step dehydroge-nase pathway compensated the L-lysine production at high NH4
+ concentration when thesuccinylase pathway was downregulated [34]. Among the recombinant strains, strain XQ-5-∆dapD∆amtR/pEC-ddh (i.e., strain XQ-5-8) accumulated the highest L-lysine production(i.e., 41.9 ± 4.57 g/L) if not counting the strains with succinylase pathway (Figure 5d). It isworth noting that the overexpression of ddh gene in strain XQ-5-6 increased the L-lysineproduction (300 mM) from 29.3 ± 3.49 g/L (strain XQ-5-6) to 41.9 ± 4.57 g/L (strain XQ-5-8). Interestingly, although the L-lysine yield of strain XQ-5-8 (i.e., 41.9 ± 4.57 g/L) waslower than that of strain XQ-5-3 (i.e., 53.8 ± 3.98 g/L), the qLys,max. of strain XQ-5-8 (i.e.,0.30 ± 0.04 g/(g·h)) was 20% higher than that of strain XQ-5-3 (i.e., 0.25 ± 0.03 g/(g·h))(Figure 5e), possibly due to the fact that the L-lysine precursor (i.e., meso-DAP) was biosyn-thesized in one step rather than four steps [35] since the dehydrogenase pathway is the onlypathway for L-lysine production of strain XQ-5-8. These results also showed that the dehy-drogenase pathway has potential to increase L-lysine production. Taken together, theseresults indicated that blocking the succinylase pathway is beneficial to upregulating thedehydrogenase pathway, thus improving the qLys,max. However, the L-lysine productionin strains with blocked the succinylase pathway decreased. Two reasons were proposed:(1) More NH4
+ were required to produce L-lysine in the dehydrogenase pathway. Previousresearches indicated that C. glutamicum strain with the dehydrogenase pathway alonecannot produce L-lysine at low NH4
+ concentration [36] due to the low affinity of thedehydrogenase pathway to NH4
+ in the substrate [16]; (2) the dehydrogenase pathway is areversible process. L,L-DAP cannot be synthesized while blocking the succinylase pathway,thus relieving the competitive inhibition of the reverse reaction [29]. These proposedreasons have been validated by examining the concentration of the by-products (Table 1).As might be expected, strain XQ-5-8 had the highest by-product concentration at highNH4
+ concentration (Table 1). All of the above mentioned results indicated that blocking
Int. J. Mol. Sci. 2021, 22, 9065 9 of 17
the succinylase pathway is beneficial to improve the production intensify of L-lysine, butunhelpful for increasing the yield of L-lysine.
Int. J. Mol. Sci. 2021, 22, x FOR PEER REVIEW 9 of 18
drogenase pathway to NH4+ in the substrate [16]; (2) the dehydrogenase pathway is a re-versible process. L,L-DAP cannot be synthesized while blocking the succinylase pathway, thus relieving the competitive inhibition of the reverse reaction [29]. These proposed rea-sons have been validated by examining the concentration of the by-products (Table 1). As might be expected, strain XQ-5-8 had the highest by-product concentration at high NH4+ concentration (Table 1). All of the above mentioned results indicated that blocking the succinylase pathway is beneficial to improve the production intensify of L-lysine, but un-helpful for increasing the yield of L-lysine.
Figure 5. Blocking succinylase pathway to redirection of flux in dehydrogenase pathway. (a) FESEM of strain XQ-5. (b) FESEM of strain XQ-5-4. (c) FESEM of strain XQ-5-5. (d) L-lysine production of strain XQ-5-1, XQ-5-4, XQ-5-5, XQ-5-6, XQ-5-7, XQ-5-8 in shake flask culture. (e) The qLys of strain XQ-5-3 and strain XQ-5-8 at 300 mM NH4+ concentration. All data represent values of three determinations of triplicate independent experiments.
Table 1. By-products of Corynebacterium glutamicum strains XQ-5-1, XQ-5-3, and XQ-5-8.
XQ-5-1 (XQ-5/pEC-ddh) XQ-5-3 (XQ-5-ΔamtR/pEC-ddh) XQ-5-8 (XQ-5-ΔamtRΔdapD/pEC-ddh) by-Products 200 mM 300 mM 400 mM 200 mM 300 mM 400 mM 200 mM 300 mM 400 mM
glutamate 0.26 ± 0.05 0.35 ± 0.11 0.54 ± 0.02 0.49 ± 0.06 0.97 ± 0.11 1.23 ±
0.02 1.07 ± 0.04 1.75 ± 0.15 2.01 ± 0.02
pyruvate 1.94 ± 0.04 2.08 ± 0.14 2.36 ± 0.02 2.21 ± 0.04 2.65 ± 0.03
3.32 ± 0.04 3.01 ± 0.12 3.43 ± 0.09 3.91 ± 0.12
isoleucine 1.06 ± 0.16 1.33 ± 0.11
1.35 ± 0.12 1.57 ± 0.02 2.03 ± 0.03 2.37 ± 0.02
2.31 ± 0.04 2.93 ± 0.11 3.51 ± 0.02
aspartate 2.06 ± 0.06 2.87 ± 0.05
2.92 ± 0.07 2.98 ± 0.08 3.52 ± 0.12 3.91 ± 0.12
3.88 ± 0.16 4.01 ± 0.11 4.22 ± 0.12
methionine 1.12 ± 0.11 1.33 ± 0.07 1.41 ± 0.15 1.22 ± 0.02 1.54 ± 0.11
1.87 ± 0.08 1.46 ± 0.02 1.98 ± 0.05 2.31 ± 0.06
threonine 0.98 ± 0.13 1.15 ± 0.14 1.23 ± 0.02 1.06 ± 0.16 2.01 ± 0.11
3.91 ± 0.12 2.17 ± 0.13 3.23 ± 0.11 3.91 ± 0.12
All data represent values of three determinations of triplicate independent experiments.
Figure 5. Blocking succinylase pathway to redirection of flux in dehydrogenase pathway. (a) FESEM of strain XQ-5.(b) FESEM of strain XQ-5-4. (c) FESEM of strain XQ-5-5. (d) L-lysine production of strain XQ-5-1, XQ-5-4, XQ-5-5, XQ-5-6,XQ-5-7, XQ-5-8 in shake flask culture. (e) The qLys of strain XQ-5-3 and strain XQ-5-8 at 300 mM NH4
+ concentration. Alldata represent values of three determinations of triplicate independent experiments.
Table 1. By-products of Corynebacterium glutamicum strains XQ-5-1, XQ-5-3, and XQ-5-8.
XQ-5-1 (XQ-5/pEC-ddh) XQ-5-3 (XQ-5-∆amtR/pEC-ddh) XQ-5-8 (XQ-5-∆amtR∆dapD/pEC-ddh)
by-Products 200 mM 300 mM 400 mM 200 mM 300 mM 400 mM 200 mM 300 mM 400 mM
glutamate 0.26 ± 0.05 0.35 ± 0.11 0.54 ± 0.02 0.49 ± 0.06 0.97 ± 0.11 1.23 ± 0.02 1.07 ± 0.04 1.75 ± 0.15 2.01 ± 0.02pyruvate 1.94 ± 0.04 2.08 ± 0.14 2.36 ± 0.02 2.21 ± 0.04 2.65 ± 0.03 3.32 ± 0.04 3.01 ± 0.12 3.43 ± 0.09 3.91 ± 0.12isoleucine 1.06 ± 0.16 1.33 ± 0.11 1.35 ± 0.12 1.57 ± 0.02 2.03 ± 0.03 2.37 ± 0.02 2.31 ± 0.04 2.93 ± 0.11 3.51 ± 0.02aspartate 2.06 ± 0.06 2.87 ± 0.05 2.92 ± 0.07 2.98 ± 0.08 3.52 ± 0.12 3.91 ± 0.12 3.88 ± 0.16 4.01 ± 0.11 4.22 ± 0.12
methionine 1.12 ± 0.11 1.33 ± 0.07 1.41 ± 0.15 1.22 ± 0.02 1.54 ± 0.11 1.87 ± 0.08 1.46 ± 0.02 1.98 ± 0.05 2.31 ± 0.06threonine 0.98 ± 0.13 1.15 ± 0.14 1.23 ± 0.02 1.06 ± 0.16 2.01 ± 0.11 3.91 ± 0.12 2.17 ± 0.13 3.23 ± 0.11 3.91 ± 0.12
All data represent values of three determinations of triplicate independent experiments.
2.5. Weakening the dapD Gene Makes the Metabolic Flux of the Two Pathways Reach theBest Balance
As mentioned above, L-lysine production decreased significantly while blocking thesuccinylase pathway (Figure 5d) and the amount of by-products increased because ofthe lack of L,L-DAP (Table 1). To address this problem, the key enzyme DapD in thesuccinylase pathway was weakened to balance the flux between the succinylase pathwayand the dehydrogenase pathway.
There are many ways to weaken genes, including the ones from the level of transcrip-tion or translation [37]. At the translation level, weakening the gene is often achievedby replacing RBS to change the gene expression level [38]. In this experiment, termina-tors were inserted in front of the gene to weaken its expression as the terminators areessential elements controlling the normal transcription of genes [37]. Six terminators withdifferent intensities were selected (Figure 6a) and inserted in front of the dapD gene bysecondary homologous recombination using pK18mobSacB [39]. The sequences of the six

Int. J. Mol. Sci. 2021, 22, 9065 10 of 17
terminators are listed in Supplementary material (Table S1). Six recombinant bacteria withdifferent weakening degrees were derived from strain XQ-5-3, i.e., XQ-5-W1, XQ-5-W2, XQ-5-W3, XQ-5-W4, XQ-5-W5, and XQ-5-W6. The L-lysine production of strain XQ-5-W1 (i.e.,48.7 ± 4.12 g/L), XQ-5-W2 (i.e., 50.2 ± 5.31 g/L), XQ-5-W5 (i.e., 48.3 ± 5.87 g/L), and XQ-5-W6 (i.e., 41.1 ± 6.44 g/L) were lower than that of the strain XQ-5-3 (i.e., 53.8 ± 3.98 g/L).Conversely, the L-lysine production of strain XQ-5-W3 (i.e., 54.2 ± 4.76 g/L) and XQ-5-W4(i.e., 58.5 ± 5.43 g/L) were higher than that of strain XQ-5-3 (i.e., 53.8 ± 3.98 g/L), especiallystrain XQ-5-W4 (Figure 6b). These results indicated that the introduction of terminators infront of the dapD gene could change the translation level of dapD, thus affecting the flux inthe succinylase pathway. The similar results were also found in previous reports [40]. Thehighest L-lysine yield was found in strain XQ-5-W4 (i.e., 58.5 ± 5.43 g/L), which was 21.4%higher than that of the original strain XQ-5 (i.e., 48.2 ± 3.54 g/L). In addition, the qLys,max ofstrain XQ-5-W4 (i.e., 0.31 ± 0.04 g/(g·h)) and strain XQ-5-8 (i.e., 0.30 ± 0.04 g/(g·h)) weresimilar, about 55% higher than that of strain XQ-5 (i.e., 0.20 ± 0.01 g/(g·h)) (Figure 6c).As expected, the activity of DapD decreased with the increase of terminator strength (i.e.,5.8 ± 0.13 mU/mg-1.3 ± 0.42 mU/mg) (Table 2). In addition, the forward reaction ofDapDH increased with the weakening of the succinylase pathway and the reverse reactionwas also enhanced (Table 2). It is worth noting that the best balance in strain XQ-5-W4 (i.e.,XQ-5-dapDW∆amtR/pEC-ddh) resulted in the best L-lysine yield (i.e., 58.5 ± 5.43 g/L) andqLys,max (i.e., 0.31 ± 0.04 g/(g·h)). At the same time, the by-products of the six strains weremeasured. In comparison, strain XQ-5-W4 has fewer by-products (Table 3).
Int. J. Mol. Sci. 2021, 22, x FOR PEER REVIEW 11 of 18
Figure 6. Balancing the flux in the two variants of DAP pathway to promote L-lysine production. (a) Different strengths of six terminators. (b) L-lysine production of strain XQ-5-W1, XQ-5-W2, XQ-5-W3, XQ-5-W4, XQ-5-W5, and XQ-5-W6 in shake flask culture. (c) qLys of strain XQ-5-1, XQ-5-8, and XQ-5-W4 at 300 mM NH4+ concentration. All data represent values of three determinations of trip-licate independent experiments.
Table 2. The activity DapDH and DapD different recombinant C. glutamicum strains.
Strains Specific Activity (mU/mg of Protein)
DapD DapDH(F-Reaction) DapDH (R-Reaction) XQ-5-W1 5.8 ± 0.13 201 ± 13.6 130 ± 13.8 XQ-5-W2 5.3 ± 0.21 227 ± 22.1 138 ± 18.1 XQ-5-W3 4.5 ± 0.39 241 ± 26.8 145 ± 17.4 XQ-5-W4 3.3 ± 0.26 260 ± 18.4 151 ± 21.2 XQ-5-W5 2.1 ± 0.22 268 ± 19.3 177 ± 19.3 XQ-5-W6 1.3 ± 0.42 275 ± 20.2 194 ± 18.9
All data represent values of three determinations of triplicate independent experiments.
Table 3. By products of C. glutamicum strains XQ-5-W1, XQ-5-W2, XQ-5-W3, XQ-5-W4, XQ-5-W5, and XQ-5-W6.
Strains by-Products (g/L)
Glutamate Pyruvate Isoleucine Aspartate Methionine Threonine XQ-5-W1 0.4 ± 0.03 2.11 ± 0.14 1.5 ± 0.09 2.93 ± 0.18 1.54 ± 0.04 1.26 ± 0.08 XQ-5-W2 0.54 ± 0.04 2.23 ± 0.13 1.64 ± 0.07 2.85 ± 0.12 1.25 ± 0.02 1.75 ± 0.11 XQ-5-W3 0.64 ± 0.12 2.41 ± 0.10 1.32 ± 0.05 2.42 ± 0.12 1.05 ± 0.06 1.35 ± 0.02 XQ-5-W4 0.78 ± 0.04 2.32 ± 0.13 1.24 ± 0.09 2.15 ± 0.11 0.85 ± 0.12 1.65 ± 0.08 XQ-5-W5 1.32 ± 0.07 2.87 ± 0.11 2.01 ± 0.12 2.78 ± 0.05 1.05 ± 0.10 2.75 ± 0.02 XQ-5-W6 1.64 ± 0.12 3.12 ± 0.03 2.64 ± 0.14 3.65 ± 0.02 1.75 ± 0.04 3.01 ± 0.12
All data represent values of three determinations of triplicate independent experiments.
Figure 6. Balancing the flux in the two variants of DAP pathway to promote L-lysine production.(a) Different strengths of six terminators. (b) L-lysine production of strain XQ-5-W1, XQ-5-W2,XQ-5-W3, XQ-5-W4, XQ-5-W5, and XQ-5-W6 in shake flask culture. (c) qLys of strain XQ-5-1, XQ-5-8,and XQ-5-W4 at 300 mM NH4
+ concentration. All data represent values of three determinations oftriplicate independent experiments.
Int. J. Mol. Sci. 2021, 22, 9065 11 of 17
Table 2. The activity DapDH and DapD different recombinant C. glutamicum strains.
StrainsSpecific Activity (mU/mg of Protein)
DapD DapDH(F-Reaction) DapDH (R-Reaction)
XQ-5-W1 5.8 ± 0.13 201 ± 13.6 130 ± 13.8XQ-5-W2 5.3 ± 0.21 227 ± 22.1 138 ± 18.1XQ-5-W3 4.5 ± 0.39 241 ± 26.8 145 ± 17.4XQ-5-W4 3.3 ± 0.26 260 ± 18.4 151 ± 21.2XQ-5-W5 2.1 ± 0.22 268 ± 19.3 177 ± 19.3XQ-5-W6 1.3 ± 0.42 275 ± 20.2 194 ± 18.9
All data represent values of three determinations of triplicate independent experiments.
Table 3. By products of C. glutamicum strains XQ-5-W1, XQ-5-W2, XQ-5-W3, XQ-5-W4, XQ-5-W5,and XQ-5-W6.
Strainsby-Products (g/L)
Glutamate Pyruvate Isoleucine Aspartate Methionine Threonine
XQ-5-W1 0.4 ± 0.03 2.11 ± 0.14 1.5 ± 0.09 2.93 ± 0.18 1.54 ± 0.04 1.26 ± 0.08XQ-5-W2 0.54 ± 0.04 2.23 ± 0.13 1.64 ± 0.07 2.85 ± 0.12 1.25 ± 0.02 1.75 ± 0.11XQ-5-W3 0.64 ± 0.12 2.41 ± 0.10 1.32 ± 0.05 2.42 ± 0.12 1.05 ± 0.06 1.35 ± 0.02XQ-5-W4 0.78 ± 0.04 2.32 ± 0.13 1.24 ± 0.09 2.15 ± 0.11 0.85 ± 0.12 1.65 ± 0.08XQ-5-W5 1.32 ± 0.07 2.87 ± 0.11 2.01 ± 0.12 2.78 ± 0.05 1.05 ± 0.10 2.75 ± 0.02XQ-5-W6 1.64 ± 0.12 3.12 ± 0.03 2.64 ± 0.14 3.65 ± 0.02 1.75 ± 0.04 3.01 ± 0.12
All data represent values of three determinations of triplicate independent experiments.
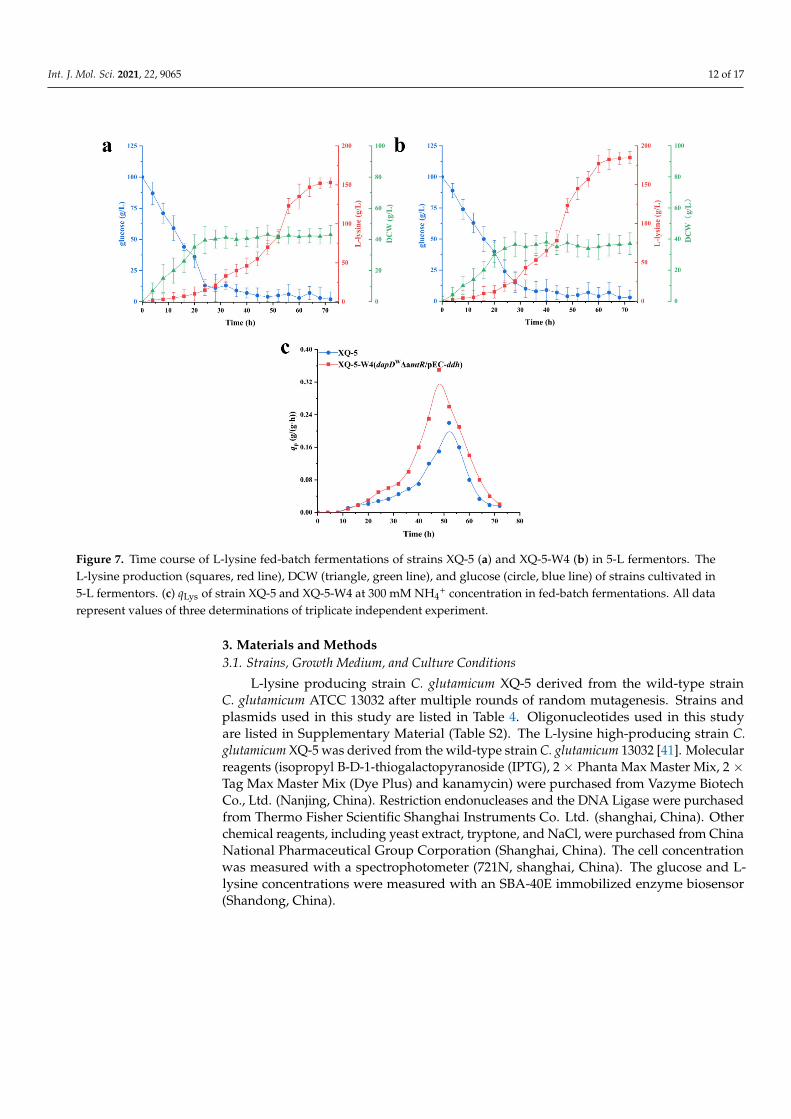
2.6. Fed-Batch Fermentation of C. glutamicum XQ-5-W4
The production performance of strain XQ-5-W4 was investigated in a fed-batch pro-cess. As a comparison, fed-batch fermentation of the original strain XQ-5 was also con-ducted. Figure 7 shows the time profiles of fed-batch fermentations in a 5-L jar fermenter.Fed-batch fermentation of XQ-5-W4 resulted in 189 ± 8.7 g/L of L-lysine with a qLys,maxof 0.35 ± 0.05 g/(g·h) (Figure 7b,c). However, fed-batch fermentation of XQ-5 resulted in151 ± 9.3 g/L of L-lysine with a qLys,max of 0.22 ± 0.02 g/(g·h) (Figure 7a,c). Consistent withthe results of production intensity of L-lysine in shake flasks, the qLys,max of strain XQ-5-W4was higher than that of strain XQ-5 (0.35 ± 0.05 g/(g·h) vs. 0.22 ± 0.02 g/(g·h)) (Figure 7c).In addition, the L-lysine yield of strain XQ-5-W4 stabilized faster, about six hours earlierthan that of strain XQ-5. However, the dry weight of strain XQ-5-W4 was 38.9 ± 5.12 g/L,13.9% lower than that of the original strain (i.e., 45.2 ± 7.64 g/L) (Figure 7a,b). Previousresearch also found the similar result in which the biomass decreased while enhancingthe yield of the target products [23]. Taken together, these results demonstrated that thefinal strain XQ-5-W4 shows an efficient L-lysine production under fed-batch fermentation,making it a very promising platform for L-lysine production.
Int. J. Mol. Sci. 2021, 22, 9065 12 of 17
Int. J. Mol. Sci. 2021, 22, x FOR PEER REVIEW 12 of 18
2.6. Fed-Batch Fermentation of C. glutamicum XQ-5-W4 The production performance of strain XQ-5-W4 was investigated in a fed-batch pro-
cess. As a comparison, fed-batch fermentation of the original strain XQ-5 was also con-ducted. Figure 7 shows the time profiles of fed-batch fermentations in a 5-L jar fermenter. Fed-batch fermentation of XQ-5-W4 resulted in 189 ± 8.7 g/L of L-lysine with a qLys,max of 0.35 ± 0.05 g/(g·h) (Figure 7b,c). However, fed-batch fermentation of XQ-5 resulted in 151 ± 9.3 g/L of L-lysine with a qLys,max of 0.22 ± 0.02 g/(g·h) (Figure 7a,c). Consistent with the results of production intensity of L-lysine in shake flasks, the qLys,max of strain XQ-5-W4 was higher than that of strain XQ-5 (0.35 ± 0.05 g/(g·h) vs. 0.22 ± 0.02 g/(g·h)) (Figure 7c). In addition, the L-lysine yield of strain XQ-5-W4 stabilized faster, about six hours earlier than that of strain XQ-5. However, the dry weight of strain XQ-5-W4 was 38.9 ± 5.12 g/L, 13.9% lower than that of the original strain (i.e., 45.2 ± 7.64 g/L) (Figure 7a,b). Previous research also found the similar result in which the biomass decreased while enhancing the yield of the target products [23]. Taken together, these results demonstrated that the final strain XQ-5-W4 shows an efficient L-lysine production under fed-batch fermentation, making it a very promising platform for L-lysine production.
Figure 7. Time course of L-lysine fed-batch fermentations of strains XQ-5 (a) and XQ-5-W4 (b) in 5-L fermentors. The L-lysine production (squares, red line), DCW (triangle, green line), and glucose (circle, blue line) of strains cultivated in 5-L fermentors. (c) qLys of strain XQ-5 and XQ-5-W4 at 300 mM NH4+ concentration in fed-batch fermentations. All data repre-sent values of three determinations of triplicate independent experiment.
3. Materials and Methods 3.1. Strains, Growth Medium, and Culture Conditions
L-lysine producing strain C. glutamicum XQ-5 derived from the wild-type strain C. glutamicum ATCC 13032 after multiple rounds of random mutagenesis. Strains and plas-mids used in this study are listed in Table 4. Oligonucleotides used in this study are listed in Supplementary Material (Table S2). The L-lysine high-producing strain C. glutamicum
Figure 7. Time course of L-lysine fed-batch fermentations of strains XQ-5 (a) and XQ-5-W4 (b) in 5-L fermentors. TheL-lysine production (squares, red line), DCW (triangle, green line), and glucose (circle, blue line) of strains cultivated in5-L fermentors. (c) qLys of strain XQ-5 and XQ-5-W4 at 300 mM NH4
+ concentration in fed-batch fermentations. All datarepresent values of three determinations of triplicate independent experiment.
3. Materials and Methods3.1. Strains, Growth Medium, and Culture Conditions
L-lysine producing strain C. glutamicum XQ-5 derived from the wild-type strainC. glutamicum ATCC 13032 after multiple rounds of random mutagenesis. Strains andplasmids used in this study are listed in Table 4. Oligonucleotides used in this studyare listed in Supplementary Material (Table S2). The L-lysine high-producing strain C.glutamicum XQ-5 was derived from the wild-type strain C. glutamicum 13032 [41]. Molecularreagents (isopropyl B-D-1-thiogalactopyranoside (IPTG), 2 × Phanta Max Master Mix, 2 ×Tag Max Master Mix (Dye Plus) and kanamycin) were purchased from Vazyme BiotechCo., Ltd. (Nanjing, China). Restriction endonucleases and the DNA Ligase were purchasedfrom Thermo Fisher Scientific Shanghai Instruments Co. Ltd. (shanghai, China). Otherchemical reagents, including yeast extract, tryptone, and NaCl, were purchased from ChinaNational Pharmaceutical Group Corporation (Shanghai, China). The cell concentrationwas measured with a spectrophotometer (721N, shanghai, China). The glucose and L-lysine concentrations were measured with an SBA-40E immobilized enzyme biosensor(Shandong, China).
Int. J. Mol. Sci. 2021, 22, 9065 13 of 17
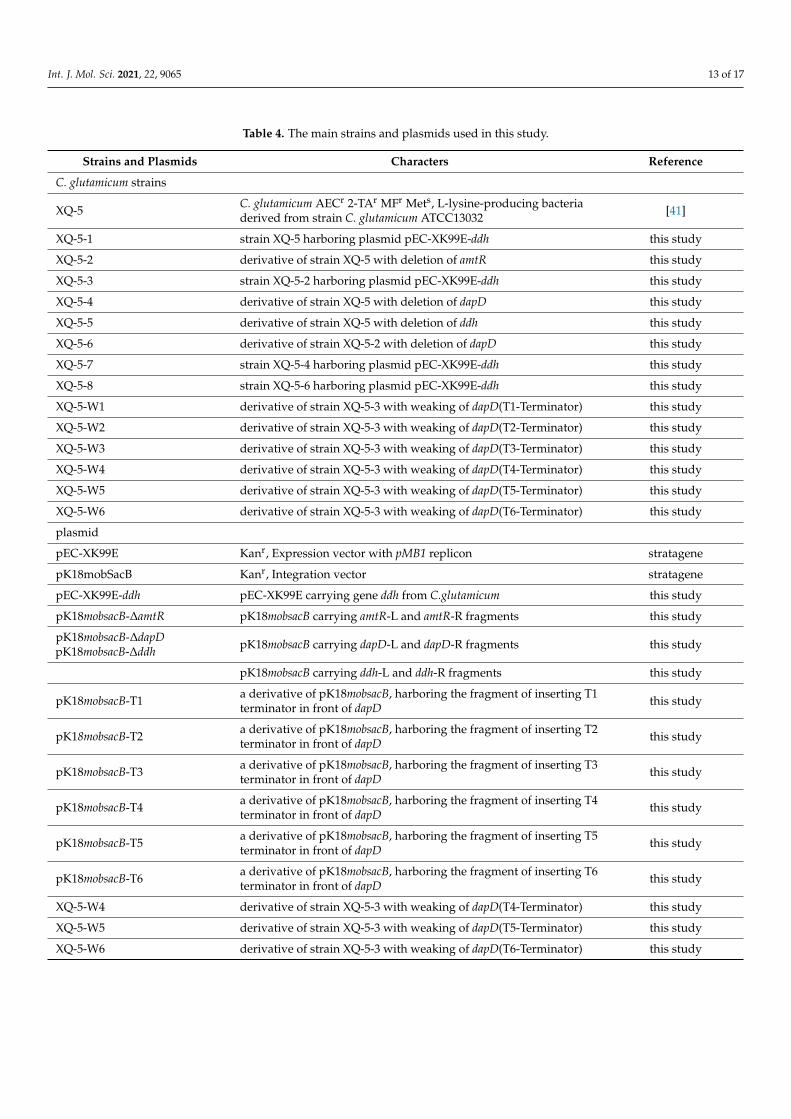
Table 4. The main strains and plasmids used in this study.
Strains and Plasmids Characters Reference
C. glutamicum strains
XQ-5 C. glutamicum AECr 2-TAr MFr Mets, L-lysine-producing bacteriaderived from strain C. glutamicum ATCC13032 [41]
XQ-5-1 strain XQ-5 harboring plasmid pEC-XK99E-ddh this study
XQ-5-2 derivative of strain XQ-5 with deletion of amtR this study
XQ-5-3 strain XQ-5-2 harboring plasmid pEC-XK99E-ddh this study
XQ-5-4 derivative of strain XQ-5 with deletion of dapD this study
XQ-5-5 derivative of strain XQ-5 with deletion of ddh this study
XQ-5-6 derivative of strain XQ-5-2 with deletion of dapD this study
XQ-5-7 strain XQ-5-4 harboring plasmid pEC-XK99E-ddh this study
XQ-5-8 strain XQ-5-6 harboring plasmid pEC-XK99E-ddh this study
XQ-5-W1 derivative of strain XQ-5-3 with weaking of dapD(T1-Terminator) this study
XQ-5-W2 derivative of strain XQ-5-3 with weaking of dapD(T2-Terminator) this study
XQ-5-W3 derivative of strain XQ-5-3 with weaking of dapD(T3-Terminator) this study
XQ-5-W4 derivative of strain XQ-5-3 with weaking of dapD(T4-Terminator) this study
XQ-5-W5 derivative of strain XQ-5-3 with weaking of dapD(T5-Terminator) this study
XQ-5-W6 derivative of strain XQ-5-3 with weaking of dapD(T6-Terminator) this study
plasmid
pEC-XK99E Kanr, Expression vector with pMB1 replicon stratagene
pK18mobSacB Kanr, Integration vector stratagene
pEC-XK99E-ddh pEC-XK99E carrying gene ddh from C.glutamicum this study
pK18mobsacB-∆amtR pK18mobsacB carrying amtR-L and amtR-R fragments this study
pK18mobsacB-∆dapDpK18mobsacB-∆ddh pK18mobsacB carrying dapD-L and dapD-R fragments this study
pK18mobsacB carrying ddh-L and ddh-R fragments this study
pK18mobsacB-T1 a derivative of pK18mobsacB, harboring the fragment of inserting T1terminator in front of dapD this study
pK18mobsacB-T2 a derivative of pK18mobsacB, harboring the fragment of inserting T2terminator in front of dapD this study
pK18mobsacB-T3 a derivative of pK18mobsacB, harboring the fragment of inserting T3terminator in front of dapD this study
pK18mobsacB-T4 a derivative of pK18mobsacB, harboring the fragment of inserting T4terminator in front of dapD this study
pK18mobsacB-T5 a derivative of pK18mobsacB, harboring the fragment of inserting T5terminator in front of dapD this study
pK18mobsacB-T6 a derivative of pK18mobsacB, harboring the fragment of inserting T6terminator in front of dapD this study
XQ-5-W4 derivative of strain XQ-5-3 with weaking of dapD(T4-Terminator) this study
XQ-5-W5 derivative of strain XQ-5-3 with weaking of dapD(T5-Terminator) this study
XQ-5-W6 derivative of strain XQ-5-3 with weaking of dapD(T6-Terminator) this study
Int. J. Mol. Sci. 2021, 22, 9065 14 of 17
E. coli grew in Luria-Bertani (LB) medium at 37 ◦C. C. glutamicum grew in LB-glucose(LBG) medium at 30 ◦C [42]. EPO medium and LB-Brain Heart Infusion-Sorbitol (LBHIS)medium were used to construct the recombinant bacteria [43]. In addition, a 50 µg/mLkanamycin solution was used to build the plasmids and a 25 µg/mL kanamycin solutionwas used to screen the recombinant strains. A 1 mMol/L IPTG solution was used toinduce gene overexpression. Samples were taken from the shake flasks or fermenters everyfour hours.
The single colony was inoculated in LBG liquid medium and incubated at 30 ◦C for12 h with rotation speed 100 r/min. Next, 5 mL of the seed culture was transferred to50 mL of the fermentation medium in a standard 500 mL shake flask and was culturedfor 72 h at 30 ◦C with rotation speed 100 r/min. The fermentation medium contained(per liter) 100 g glucose, 8 g corn steep liquor, 40 g (NH4)2SO4 (≈300 mM), 0.02 g Fe+,0.02 g Mn+, 450 µg VB1, 8 mg VB3, 850 µg VH, 0.6 mg Zn+, 0.53 g KCl, 1 g KH2PO4, 1 gK2HPO4, 4 g MgSO4·7H2O, 50 mg betaine, 8 mL beet molasses, and 40 g CaCO3. Bothmedia were adjusted to pH 7.3 with NaOH. Fermentation conditions: initial pH 7.3 and10% of inoculation volume.
Fed-batch fermentation was carried out in a 5-L jar fermenter (BLBio-5GJ-2-H, BailunBi-Technology Co. Ltd., Shanghai, China). The fermentation medium contained (per liter):70 g glucose, 20 g corn steep liquor, 2 g KH2SO4, 50 g beet molasses, 40 g (NH4)2SO4, 1.5 gMgSO4.7H20, 0.03 g FeSO4, 0.02 g MnSO4, 0.03 g glycine betaine, 600 ug biotin, 300 ugthiamine-HCI, and 2 mL antifoam. Ammonia was used to control pH 7.0 and providenitrogen source for bacteria. The relative dissolved oxygen was controlled at 20–30% bystirring speed and ventilation. The temperature is maintained at 30 ◦C by jacket cooling.OD600, residual sugar concentration and L-Lysine concentration were determined every4 h during fermentation. The prepared feed solution [44] was used to control the glucoseconcentration at about 5 g/L by adjusting the feeding rate. L-lysine concentration wasdetermined as lysine·HCl in duplicates.
3.2. Analytical Methods
The cell concentration after 25-fold dilution was measured at OD600 using a spec-trophotometer. The correlation coefficient between the dry cell weight (DCW) and OD600was 0.32 (1 OD600 = 0.32g DCW). After sample dilution of 100 times, glucose and L-lysineconcentrations were measured with an SBA-40E immobilized enzyme biosensor. Theconcentration of the by-products was measured with high performance liquid chromatog-raphy (HPLC) [44]. Cell morphology was observed via field emission scanning electronmicroscopy (FESEM). Cells of C. glutamicum in the mid-log phase were collected by cen-trifugation and rinsed three times in physiological saline (pH 7.0). Bacterial cells werespread onto a small silicon platelet and air dried under room temperature, followed byin-situ fixation with a 2.5% glutaraldehyde solution in a 0.15 M sodium phosphate buffer(pH7.4) for 10 min. The samples were coated with gold and transferred to FESEM (SU8220,Hitachi, Japan) for observation at an accelerating voltage of 3 kV.
3.3. Construction of C. glutamicum Recombinant Strains
Restriction endonucleases and the DNA Ligase were used to construct the plasmids.In this study, the plasmid pEC-XK99E was used for gene overexpression in C. glutamicum.The suicide plasmid pK18mobsacB was used for gene knockout in C. glutamicum. Firstly,the constructed plasmid was electroporated into C. glutamicum, and then the positivetransformants were screened with a 25 µg/mL kanamycin solution in LBH medium. Thefinal positive transformants were obtained by eliminating the plasmids according to thesucrose lethal principle. The deletions in the chromosome were verified by PCR analysis.
3.4. Real-Time PCR
In order to analyze RNA, cells in exponential phase were collected during shakeflask fermentation for mRNA isolation. RNA was extracted with an RNAiso Plus reagent
Int. J. Mol. Sci. 2021, 22, 9065 15 of 17
(Takara, Dalian, China). The cDNA was synthesized with RevertAidTM First Strand cDNAsynthesis kit (Fermentas, Shanghai, China). The Ct values of the 16S rDNA gene andthose of the ddh and dapD genes were obtained by RT-qPCR using a Bio-Rad CFX96 TouchReal-Time PCR Detection System (Bio-Rad Hercules, CA, USA) with SYBR Premix ExTaqTM II (Takara, Dalian, China). The primer sequences used for RT-qPCR and RT-PCR areshown in Table S3. Each sample was analyzed in triplicate.
3.5. Preparation of Crude Extracts and Enzyme Assays
Crude enzyme solution was prepared to measure the activities of DapDH and DAPD.The preparation method was based on a previous report [45]. Enzyme activity was analyzedin triplicate.
DapDH activity was measured at 30 ◦C. The forward reaction mixture contained200 mM glycine-KOH (pH 10.5), 100 mM (NH4)2SO4, 0.3 mM NADPH, 5 mM THDPA, andcrude enzymes extract. The reverse reaction mixture contained 200 mM glycine/NaOH(pH 10.5), 2 mM NADP+, 4 mM meso-DAP, and crude enzymes extract. One unit is definedas the amount of enzyme which catalyzes the formation or decrease of 1 µmol NADPH(340 nm) per minute [46].
DapD activity was measured by the formation of free coenzyme A (CoA) at 412 nm.The reaction mixture contained 0.1 M Tris-HCI (pH 8.0), 0.5 mM DTNB, 0.2 mM succinyl-CoA, 5 mM 2-aminopimelate, and crude enzymes extract. One unit is defined as theamount of enzyme which catalyzes the formation of 1 µmol CoA per minute [32].
4. Conclusions
For the first time, DAP pathway was reconstructed to optimize L-lysine productionin C. glutamicum, which demonstrated that the dehydrogenase pathway is promisingfor promoting L-lysine production. In C. glutamicum, both the dehydrogenase pathwayand the succinylase pathway are involved in the production of L-lysine, but the relativeproportion of each pathway on L-lysine biosynthesis is different because of the differentdemand for NH4
+ concentration [16]. The proportion of the dehydrogenase pathway onL-lysine production increased when increasing the NH4
+ concentration (Figure 2d). Sincethe L-lysine biosynthesis in the dehydrogenase pathway has less steps, the strain showedthe highest qLys,max at high NH4
+ concentration (Figure 2c). The similar results were alsofound in the AmtR-deficient strain (Figure 4b), as NH4
+ was efficiently transferred intothe cell during inactivation of AmtR [25]. The L-lysine yield and qLys,max in strain XQ-5-2reached 52.3 ± 4.31 g/L and 0.22 ± 0.03 g/(g·h), which were 8.5% and 10% higher thanthat of the original strain XQ-5, respectively. Although the dehydrogenase pathway ispromising in promoting L-lysine production, redirecting the flux into the dehydrogenasepathway while blocking the succinylase pathway is counterproductive to L-lysine produc-tion (Figure 5d). Fortunately, this problem can be overcome by weakening the succinylasepathway (Figure 6b). The target strain C. glutamicum XQ-5-W4 produced 58.5 ± 5.43 g/LL-lysine with a qLys,max. (i.e., 0.31 ± 0.04 g/(g·h)) in shake-flask fermentation, which were21.4% and 55% higher than that of strain XQ-5. In addition, fed-batch fermentation of strainXQ-5-W4 resulted in 189 ± 8.7 g/L of L-lysine with a qLys,max of 0.35 ± 0.05 g/(g·h). Theseresults indicated that the reconstruction of DAP pathway to switch the flux in the variantsof DAP pathway has great potential to promote L-lysine production in C. glutamicum.
Supplementary Materials: The following are available online at https://www.mdpi.com/article/10.3390/ijms22169065/s1.
Author Contributions: J.-Z.X. and Z.-M.R. conceived the experiments. N.L., T.-T.Z. and W.-G.Z.designed and performed the experiments and analyzed the data. N.L. and J.-Z.X. wrote the paper.All authors have read and agreed to the published version of the manuscript.
Funding: This work was supported by the National Natural Science Foundation of China [No. 31601459],the Top-Notch Academic Programs Project of Jiangsu Higher Education Institutions, the 111 project
Int. J. Mol. Sci. 2021, 22, 9065 16 of 17
(Grant number 111-2-06), and the National First class Discipline Program of Light Industry Technologyand Engineering (LITE2018-08).
Institutional Review Board Statement: Not applicable.
Informed Consent Statement: Not applicable.
Data Availability Statement: The data presented in this study are available on request from thecorresponding author.
Acknowledgments: The authors would like to acknowledge Xian Zhang and Xuewei Pan for theirhelp in the data analysis and drawing the figures.
Conflicts of Interest: The authors declare no conflict of interest.
References1. Félix, F.; Letti, L.; Vinícius de Melo Pereira, G.; Bonfim, P.; Soccol, V.; Soccol, C. L-lysine production improvement: A review of the
state of the art and patent landscape focusing on strain development and fermentation technologies. Crit. Rev. Biotechnol. 2019,39, 1031–1055. [CrossRef]
2. Leuchtenberger, W.; Huthmacher, K.; Drauz, K. Biotechnological production of amino acids and derivatives: Current status andprospects. Appl. Microbiol. Biotechnol. 2005, 69, 1–8. [CrossRef] [PubMed]
3. Nishida, H.; Nishiyama, M.; Kobashi, N.; Kosuge, T.; Hoshino, T.; Yamane, H. A prokaryotic gene cluster involved in synthesis oflysine through the amino adipate pathway: A key to the evolution of amino acid biosynthesis. Genome Res. 1999, 9, 1175–1183.[CrossRef] [PubMed]
4. Velasco, A.M.; Leguina, J.I.; Lazcano, A. Molecular Evolution of the Lysine Biosynthetic Pathways. J. Mol. Evol. 2002, 55, 445–449.[CrossRef] [PubMed]
5. Jetten, M.; Sinskey, A. Recent advances in the physiology and genetics of amino acid-producing bacteria. Crit. Rev. Biotechnol.1995, 15, 73–103. [CrossRef]
6. Scapin, G.; Blanchard, J.S. Enzymology of Bacterial Lysine Biosynthesis. Adv. Enzymol. Relat. Areas Mol. Biol. 1998, 72, 279–324.[CrossRef]
7. Liu, Y.; White, R.H.; Whitman, W.B. Methanococci Use the Diaminopimelate Aminotransferase (DapL) Pathway for LysineBiosynthesis. J. Bacteriol. 2010, 192, 3304–3310. [CrossRef] [PubMed]
8. Born, T.L.; Blanchard, J.S. Structure/function studies on enzymes in the diaminopimelate pathway of bacterial cell wall biosyn-thesis. Curr. Opin. Chem. Biol. 1999, 3, 607–613. [CrossRef]
9. Cirilli, M.; Zheng, R.J.; Scapin, G.; Blanchard, J.S. Structural symmetry: The three-dimensional structure of Haemophilusinfluenzae diaminopimelate epimerase. Biochemistry 1998, 37, 16452–16458. [CrossRef]
10. White, P.J. The Essential Role of Diaminopimelate Dehydrogenase in the Biosynthesis of Lysine by Bacillus sphaericus. J. Gen.Microbiol. 1983, 129, 739–749. [CrossRef]
11. Wenko, L.K.; Treick, R.W.; Wilson, K.G. Isolation and characterization of a gene encoding meso-diaminopimelate dehydrogenasefrom Glycine max. Plant Mol. Biol. 1985, 4, 197–204. [CrossRef] [PubMed]
12. Mccoy, A.J.; Adams, N.E.; Hudson, A.O.; Gilvarg, C.; Maurelli, A.T. L,L-diaminopimelate aminotransferase, a trans-kingdomenzyme shared by Chlamydia and plants for synthesis of diaminopimelate/lysine. Proc. Natl. Acad. Sci. USA 2018, 103,17909–17914. [CrossRef]
13. Dobson, R.C.J.; Girón, I.; Hudson, A.O. L,L-Diaminopimelate Aminotransferase from Chlamydomonas reinhardtii: A Target forAlgaecide Development. PLoS ONE 2011, 6, e20439. [CrossRef]
14. Watanabe, N.; Cherney, M.M.; Belkum, M.J.V.; Marcus, S.L.; Flegel, M.D.; Clay, M.D.; Deyholos, M.K.; Vederas, J.C.; James, M.N.G.Crystal structure of L,L-diaminopimelate aminotransferase from Arabidopsis thaliana: A recently discovered enzyme in thebiosynthesis of L-lysine by plants and Chlamydia. J. Mol. Biol. 2007, 371, 685–702. [CrossRef] [PubMed]
15. Wehrmann, A.; Phillipp, B.; Sahm, H.; Eggeling, L. Different modes of diaminopimelate synthesis and their role in cell wallintegrity: A study with Corynebacterium glutamicum. J. Bacteriol. 1998, 180, 3159–3165. [CrossRef]
16. Sahm, H.; Eggeling, L.; de Graaf, A. Pathway analysis and metabolic engineering in Corynebacterium glutamicum. Biol. Chem. 2000,381, 899–910. [CrossRef] [PubMed]
17. UDAKA, S. Screening method for microorganisms accumulating metabolites and its use in the isolation of Micrococcus glutamicus.J. Bacteriol. 1960, 79, 754–755. [CrossRef]
18. Burillo, S.; Luque, I.; Fuentes, I.; Contreras, A. Interactions between the nitrogen signal transduction protein PII and N-acetylglutamate kinase in organisms that perform oxygenic photosynthesis. J. Bacteriol. 2004, 186, 3346–3354. [CrossRef]
19. Bott, M. Offering surprises: TCA cycle regulation in Corynebacterium glutamicum. Trends Microbiol. 2007, 15, 417–425. [CrossRef]20. Misono, H.; Togawa, H.; Yamamoto, T.; Soda, K. Occurrence of meso-alpha, epsilon-diaminopimelate dehydrogenase in Bacillus
sphaericus. Biochem. Biophys. Res. Commun. 1976, 72, 89–93. [CrossRef]21. Rehm, N.; Burkovski, A. Engineering of nitrogen metabolism and its regulation in Corynebacterium glutamicum: Influence on
amino acid pools and production. Appl. Microbiol. Biotechnol. 2011, 89, 239–248. [CrossRef]
Int. J. Mol. Sci. 2021, 22, 9065 17 of 17
22. Sonntag, K.; Eggeling, L.; Graaf, A.A.; Sahm, H. Flux partitioning in the split pathway of lysine synthesis in Corynebacteriumglutamicum Quantification by 13C- and 1H-NMR spectroscopy. Eur. J. Biochem. 2010, 213, 1325–1331. [CrossRef]
23. Xu, M.; Li, J.; Shu, Q.; Tang, M.; Rao, Z. Enhancement of l-arginine production by increasing ammonium uptake in an AmtR-deficient Corynebacterium crenatum mutant. J. Ind. Microbiol. Biotechnol. 2019, 46, 1155–1166. [CrossRef] [PubMed]
24. Yeh, P.; Sicard, A.; Sinskey, A. General organization of the genes specifically involved in the diaminopimelate-lysine biosyntheticpathway of Corynebacterium glutamicum. Mol. Gen. Genet. 1988, 212, 105–111. [CrossRef] [PubMed]
25. Palanca, C.; Rubio, V. Structure of AmtR, the global nitrogen regulator of Corynebacterium glutamicum, in free and DNA-boundforms. FEBS J. 2016, 283, 1039–1059. [CrossRef] [PubMed]
26. Rehm, N.; Georgi, T.; Hiery, E.; Degner, U.; Schmiedl, A.; Burkovski, A.; Bott, M. L-Glutamine as a nitrogen source forCorynebacterium glutamicum: Derepression of the AmtR regulon and implications for nitrogen sensing. Microbiology 2010, 156,3180–3193. [CrossRef]
27. Marc, J.; Reinhard, K.; Andreas, B. Nitrogen regulation in Corynebacterium glutamicum: Isolation of genes involved and biochemicalcharacterization of corresponding proteins. FEMS Microbiol. Lett. 1999, 173, 303–310. [CrossRef]
28. Buchinger, S.; StröSser, J.; Rehm, N.; Hänßler, E.; Hans, S.; Bathe, B.; Schomburg, D.; KräMer, R.; Burkovski, A. A combinationof metabolome and transcriptome analyses reveals new targets of the Corynebacterium glutamicum nitrogen regulator AmtR. J.Biotechnol. 2009, 140, 68–74. [CrossRef]
29. Scapin, G.; Cirilli, M.; Reddy, S.G.; Gao, Y.; Vederas, J.C.; Blanchard, J.S. Substrate and Inhibitor Binding Sites in Corynebacteriumglutamicum Diaminopimelate Dehydrogenase. Biochemistry 1998, 37, 3278–3285. [CrossRef]
30. Dutta, D.; Mishra, S. The structural and energetic aspects of substrate binding and the mechanism of action of the DapE-encodedN-succinyl-L,L-diaminopimelic acid desuccinylase (DapE) investigated using a hybrid QM/MM method. Phys. Chem. Chem.Phys. 2014, 16, 26348–26358. [CrossRef]
31. Sagong, H.Y.; Kim, K.J. Structural basis for redox sensitivity in Corynebacterium glutamicum diaminopimelate epimerase: Anenzyme involved in L-lysine biosynthesis. Sci. Rep. 2017, 7, 42318. [CrossRef]
32. Sagong, H.; Kim, K. Crystal Structure and Biochemical Characterization of Tetrahydrodipicolinate N-Succinyltransferase fromCorynebacterium glutamicum. J. Agric. Food. Chem. 2015, 63, 10641–10646. [CrossRef]
33. Hartmann, M.; Tauch, A.; Eggeling, L.; Bathe, B.; Möckel, B.; Pühler, A.; Kalinowski, J. Identification and characterization of thelast two unknown genes, dapC and dapF, in the succinylase branch of the L-lysine biosynthesis of Corynebacterium glutamicum. J.Biotechnol. 2003, 104, 199–211. [CrossRef]
34. Shaw-Reid, C.; McCormick, M.; Sinskey, A.; Stephanopoulos, G. Flux through the tetrahydrodipicolinate succinylase pathwayis dispensable for L-lysine production in Corynebacterium glutamicum. Appl. Microbiol. Biotechnol. 1999, 51, 325–333. [CrossRef][PubMed]
35. Eggeling, L.; Bott, M. A giant market and a powerful metabolism: L-lysine provided by Corynebacterium glutamicum. Appl.Microbiol. Biotechnol. 2015, 99, 3387–3394. [CrossRef] [PubMed]
36. Misono, H.; Soda, K. Purification and Properties of meso-α, ε-Diaminopimelate D-Dehydrogenase from Bacillus sphaericus. Agric.Biol. Chem. 1980, 44, 227–229. [CrossRef]
37. He, Z.; Duan, Y.; Zhai, W.; Zhang, X.; Shi, J.; Zhang, X.; Xu, Z. Evaluating Terminator Strength Based on Differentiating Effects onTranscription and Translation. ChemBioChem 2020, 21, 2067–2072. [CrossRef]
38. Man, Z.; Xu, M.; Rao, Z.; Guo, J.; Yang, T.; Zhang, X.; Xu, Z. Systems pathway engineering of Corynebacterium crenatum forimproved L-arginine production. Sci. Rep. 2016, 6, 28629. [CrossRef]
39. Chen, Y.J.; Liu, P.; Nielsen, A.A.K.; Brophy, J.A.N.; Clancy, K.; Peterson, T.; Voigt, C.A. Characterization of 582 natural andsynthetic terminators and quantification of their design constraints. Nat. Methods 2013, 10, 659–664. [CrossRef]
40. Zhang, B.; Yu, M.; Zhou, Y.; Ye, B.C. Improvement of L-ornithine production by attenuation of argF in engineered Corynebacteriumglutamicum S9114. Amb Express 2018, 8, 26. [CrossRef]
41. Wang, L.; Yu, H.; Xu, J.; Ruan, H.; Zhang, W. Deciphering the crucial roles of AraC-type transcriptional regulator Cgl2680 onNADPH metabolism and L-lysine production in Corynebacterium glutamicum. World J. Microbiol. Biotechnol. 2020, 36, 82. [CrossRef]
42. Xu, J.; Han, M.; Ren, X.; Zhang, W. Modification of aspartokinase III and dihydrodipicolinate synthetase increases the productionof L-lysine in Escherichia coli. Biochem. Eng. J. 2016, 114, 79–86. [CrossRef]
43. Rest, M.E.V.D.; Lange, C.; Molenaar, D. A heat shock following electroporation induces highly efficient transformation ofCorynebacterium glutamicum with xenogeneic plasmid DNA. Appl. Microbiol. Biotechnol. 1999, 52, 541–545. [CrossRef] [PubMed]
44. Xu, J.; Wu, Z.; Gao, S.; Zhang, W. Rational modification of tricarboxylic acid cycle for improving L-lysine production inCorynebacterium glutamicum. Microb. Cell Factories 2018, 17, 105. [CrossRef] [PubMed]
45. Wang, Y.Y.; Zhang, F.; Xu, J.Z.; Zhang, W.G.; Chen, X.L.; Liu, L.M. Improvement of L-Leucine Production in Corynebacteriumglutamicum by Altering the Redox Flux. Int. J. Mol. Sci. 2019, 20, 2020. [CrossRef] [PubMed]
46. Cremer, J.; Treptow, C.; Eggeling, L.; Sahm, H. Regulation of Enzymes of Lysine Biosynthesis in Corynebacterium glutamicum. J.Gen. Microbiol. 1988, 134, 3221–3229. [CrossRef]
Top Related
Copyright © 2022 FDOKUMEN

