


Bahasa
Halaman
Hukum

Quantitative Analysis of Strategies for Streaming Media Distribution
Marisa A. Vasconcelos Leonardo C. da Rocha Juliano de C. Santos Jose Ismael P. JrLeonardo L. P. da Mata Jussara M. de Almeida Wagner Meira Jr Virgilio A. F. Almeida
Department of Computer Science, Federal University of Minas GeraisAv. Antonio Carlos 6627, Belo Horizonte MG, 31270-010 , Brazil�
isa, lcrocha, juliano, ismaeljr, barroca, jussara, meira, virgilio � @dcc.ufmg.br
Abstract
Streaming media applications are becoming more pop-ular on the late years, as for example, news transmittedlive through the web, music, show, and films. Traditionalclient/server architectures have shown to be inefficient fordistributing streaming media services. The total number ofusers is limited due to the demand of computational re-sources, which are higher than in traditional web applica-tions. One of the proposals for an efficient distribution isthe use of a P2P overlay network. Although there are someworks that evaluate this proposal through simulation, thereis a lack of quantitative analysis of the requirements forserver and network resources (i.e., CPU, server and net-work bandwidth) in actual P2P systems, compared to tradi-tional client/server systems. This work is to fill this gap byproviding experimental results that quantify the savings inserver and network resources if a P2P approach is used fordistributing live streaming media instead of the traditionalclient/server approach. Towards this goal, we build an ex-perimental testbed, in a controlled environment, to evalu-ate actual systems with varying number of clients duringperiods when the distribution structure is static. This ex-perimental testbed is composed of one new efficient andscalable application called streaming servent, one stream-ing server application (Darwin) and a workload consistingthree media files. In this work, we use simple but significa-tive analytical formulas to evaluate the scalability of ourservent application. The experimental results show a sig-nificative scalability potential of the P2P architecture. Forexample, for 24 clients it is necessary to dedicate, on aver-age, 15 Mbits/s of its available network bandwidth to de-liver the stream in a client/server system. In a P2P system,on the other hand, the required average server bandwidthfor delivering the video clip would be just 9 Mbits/s for 24clients, providing a 40% reduction on bandwidth consump-tion.
1. Introduction
The Internet has recently experienced a significant in-crease in streaming media traffic [18], which can be ex-plained by several factors including improvement of net-work bandwidth in the Internet backbone and the availabil-ity of faster “last mile” connections such as cable modemsand DSL as well as the development of more efficientvideo and audio compression methods such as divX [2] andMP3 [3]. The traditional approach to streaming media dis-tribution is a client/server architecture where the distribu-tion of popular media is done via unicast streaming from aserver directly to the clients.
The high server and network bandwidth requirementsof streaming media content distribution motivate the useof multicast distribution, which can be implemented eitherat the network level (IP multicast [9]) or at the applica-tion level [10, 6]. Whereas IP multicast has not been ef-fectively deployed in the Internet, there have been severalproposals for application level multicast, which can be im-plemented through overlay-router networks or peer-to-peeroverlay networks [17].
In overlay-router networks, such as Vcast [10], a centralserver distributes the content to other servers, placed in dif-ferent points in the network, which act as application levelrouters for the streams originated from the central serverto the clients. In case of pre-stored content, these serversmay also (partially) cache some of the streams so that fu-ture client requests may be served locally. The main dis-advantage of this type of architecture is the extra costs in-curred by the need for dedicated servers.
On the other hand, in a peer-to-peer (P2P) overlay net-work, the extra costs are avoided by implementing appli-cation level multicast through cooperation of clients andserver. In other words, the application level multicast dis-tribution tree is built among clients (i.e. peers), which re-quest the stream either from the central server or from an-other client, and may forward the content to other clientsfurther down in the distribution tree. Conceptually, the to-
tal load that would be imposed on the server in a tradi-tional client/server architecture is distributed among serverand clients. Thus, the system is expected to have better scal-ability with practically no extra cost. We consider scalabil-ity as the server’s capacity to keep the quality of the serviceprovided under high loads.
Despite the intuitive appeal of P2P overlay networks, lit-tle has been done to quantify its scalability. In other words,despite a number of related projects, which focus mainlyon simulating alternative policies for dynamically build-ing the P2P distribution tree [6, 8, 17, 13], there is a lackof a quantitative analysis of the requirements in terms ofserver and network resources (i.e., CPU, server and networkbandwidth) in actual P2P systems, compared to traditionalclient/server systems.
The main goal of this paper is to fill this gap by provid-ing experimental results that quantify the savings in serverand network resources if a P2P approach is used for dis-tributing live streaming media instead of the traditionalclient/server approach. Towards this goal, we build an ex-perimental testbed, in a controlled environment, to evaluateactual systems with varying number of clients during peri-ods when the distribution structure is static. In other words,we filter out the issues related to the dynamic behavior ofpeers, network nodes, and focus on the resource require-ments for each architecture with a static distribution tree fora given number of clients.
The main contributions of this paper are:� An experimental testbed for evaluating alterna-tive streaming media distribution mechanisms. In ad-dition to a commercial and publicly available stream-ing server (the Apple Darwin Streaming Server [1]),two key components of this testbed are: (1) a new ef-ficient and scalable application called streamingservent, which can act as both client and server, for-warding packets to other servents in a P2P network and(2) a workload consisting of three media files with dif-ferent duration, average streaming rate and variabilityin the bitrate that stress different aspects of the sys-tem.� Quantitative measures, obtained experimentally, thatshow the scalability of client/server and P2P overlayarchitectures. In particular, we quantify the savings interms of server and network resources as well as theimprovement in the average loss rate and loss dura-tion (i.e., bursts) if a P2P overlay-based distributionof streaming media is used instead of the traditionalunicast client/server mechanism for varying number ofclients.� We use simple analytical formulas (i.e., Little’s Re-sult [11]) to evaluate the scalability of our serventapplication. These analytical results are validated by
the experimental measures collected. Furthermore, wealso show how these simple formulas can be used todefine the distribution tree of a P2P overlay networkgiven the maximum amount of resources (CPU andI/O network bandwidth) a peer is willing to dedicateto content distribution.
The remaining of this paper is organized as follows. Sec-tion 2 presents the related work. Section 3 describes the ex-perimental testbed, the performance metrics used for com-paring the alternative architectures and the workload. Theexperiments are analyzed in Section 4. Finally, Section 5presents our conclusions and future work.
2. Related Work
Peer to peer overlay networks have been the focus of sev-eral recent studies. In [14, 12], the authors provide a charac-terization of the workload and client behavior of two exist-ing P2P file sharing systems, namely Napster and Gnutella.Four other studies have investigated the issues related to im-plementing a P2P architecture for streaming media distribu-tion [6, 13, 8, 19].
In [6], the authors propose the SpreadIt architecture forP2P distribution of live media streams. By using experimen-tally collected measures, such as packet delay and packetloss, as parameters for a simulator of the system, the au-thors evaluate the performance of different strategies for dy-namically rebuilding the P2P distribution tree as clients joinand/or leave the system.
The CoopNet architecture [13], proposed for live andon-demand streams, relies on the independent distributionof multiple descriptions of each stream to improve the me-dia quality received by the clients. The system was com-pared against the traditional client/server approach, usingtrace driven simulation and the access log of September11, 2001 of the MSNBC website as input. The authorsfound that the requirements for server bandwidth are sig-nificantly reduced without placing an unreasonable burdenat the clients. Different from the CoopNet study, our workanalyzes not only server bandwidth but also server CPU uti-lization and packet losses for an actual architecture.
In [8], the authors introduce a P2P media streamingmodel for on-demand streams and propose algorithms fordisseminating media data into the system and searching al-gorithms for locating peers with required objects. The ar-chitecture was simulated and evaluated with several perfor-mance measures under different rate arrivals, including con-stant, flash crowd, and Poisson arrivals. An algorithm forassigning media data to each supplying peer taking into ac-count its out-bound bandwidth is presented in [19]. Like theother studies, this algorithm was only evaluated by means ofsimulation.
Our approach differs from these previous studies in threekey aspects: (1) we experiment with and evaluate a real P2Parchitecture instead of a simulator, (2) we evaluate serverand network resources (CPU, bandwidth) consumption aswell as packet losses as a function of the number of clientsin the system, and (3) we evaluate the system during pe-riods when the client set and the distribution tree is fixed,so that we are able to determine the maximum scalabilityachievable.
3. Evaluation Methodology
This section describes the methodology used to experi-mentally analyze client/server and P2P overlay architecturesfor live media distribution. Section 3.1 describes the exper-imental setup, the media server (Section 3.1.1) and the newservent application (Section 3.1.2). The performance met-rics used to evaluate the two architectures are discussed inSection 3.2. Finally, Section 3.3 presents the main charac-teristics of the workload used in our experiments.
3.1. Experimental Setup
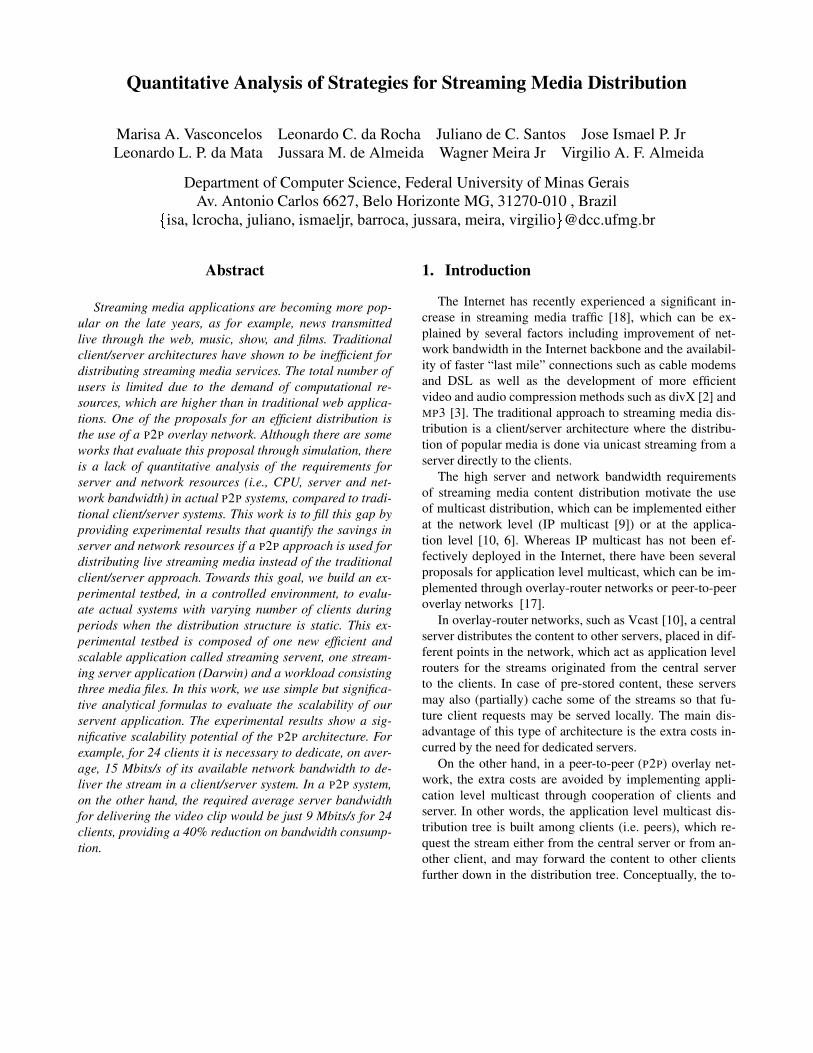
In a client/server architecture, the traditional mechanismfor streaming media distribution in the Internet, an originserver transmits the content directly to each client, typicallyvia unicast streaming. This mechanism creates a single leveldistribution tree rooted at the origin, as illustrated in Fig-ure 1. The server resources, especially server bandwidth,limit the scalability of this centralized approach.
Client
Client
Client Client Client
Client
Darwin Streaming Server
Figure 1. Client/server Architecture
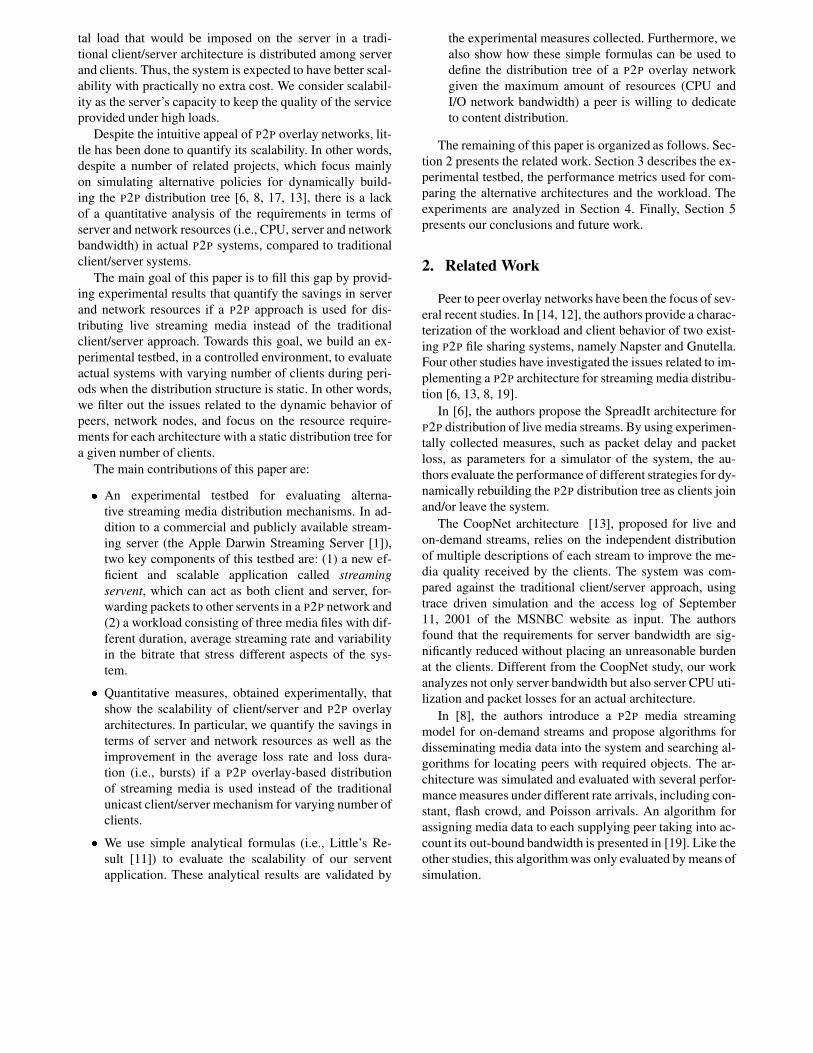
In a peer-to-peer overlay architecture, on the other hand,the distribution tree, also rooted at the origin, may have mul-tiple levels as clients may receive the requested content ei-ther directly from the origin or from another client locatedat a higher level in the tree. Figure 2 illustrates a P2P distri-bution tree with 2 levels. In this decentralized architecture,the server bandwidth requirements are lowered and the sys-tem is expected to have better scalability.
Darwin Streaming Server
Client Client Client Client
Client Client
Level 0
Level 1
Level 2
Figure 2. Peer to Peer Overlay Architecture
In this paper, we build an experimental testbed to quan-tify the resource consumption and the scalability of thesetwo architectures for live media distribution. This testbedconsists of seven PCs running Linux Red Hat 7.3 (kernel2.4.18-3), each with one 750 MHz AMD Duron proces-sor, 256 MB of RAM, and 514 MB of swap disk, con-nected through a dedicated switched Fast Ethernet LAN.In this testbed, the publicly available Darwin streamingserver, briefly described in Section 3.1.1, is used as the ori-gin server, running in one of the seven machines. A newclient application, which has also the capability of forward-ing packets to other clients in a P2P network, is built to gen-erate requests to the server. A number of this new appli-cation, called streaming servent or simply servent and de-scribed in Section 3.1.2, runs in the other six machines.Throughout the rest of this paper, the terms client and ser-vent will be used interchangeably.
We evaluate the client/server and P2P overlay architec-tures for a varying number of clients. For a given numberof clients, a set of three experiments is performed. In eachexperiment, the client (i.e., servent) processes are homoge-neously distributed among all six client machines and si-multaneously request a given file from Darwin. The exper-iment lasts until all data packets have been transmitted toall clients. For the P2P architecture, we consider the two-level distribution tree shown in Figure 2, which, for anygiven number of clients, is statically built at the beginningof each experiment. In determining the number of clientsthat are served by each servent at the intermediate level, wemake the reasonable assumption that clients of a P2P net-work are willing to dedicate only a small fraction of its re-sources to forward content to other clients. Thus, unless oth-erwise noted, we assume each servent process, running onone of the client machines in the intermediate level of theP2P distribution tree, forwards packets to only two clientsin the lower level.
Note that as the number of levels increase, the savings inserver resource consumption are expected to increase, butso is the packet loss observed by the clients at the lower lev-els. Thus, we make the compromise of using only two lev-els in the distribution tree.
3.1.1. Server: Darwin The Darwin Streaming Server [1]is an open source event-driven server developed by Apple. Itruns as a set of processes which perform the standard RTSP,RTP, and RTCP streaming protocols [15, 16]. Darwin oper-ates either by broadcasting the content to all clients or byserving it on demand. In the former, the number of packetssent to each client depends on the time, relative to the begin-ning of the broadcast, when the client established the con-nection with the server, whereas in the latter every clientrequest is served with a complete transmission of the file.In each of our experiments, all client processes are initi-ated at (approximately) the same time. However, the mo-ment on which each client actually starts receiving data de-pends on how fast Darwin is able to process all connec-tion requests. Thus, as we observed in some previous exper-iments, the number of packets sent to each client may varysignificantly. Determining this number, which is needed tocompute the number of packets lost in the streams sent tothe clients, a key measure of the scalability of the systemwould require instrumentation of Darwin. In order to avoidthe possible overhead introduced by this instrumentation,we chose to run Darwin in the on-demand mode.
3.1.2. Streaming Servent In order to implement and ex-periment with a P2P system, we need an application thatcan act as both client and server, forwarding packets toother clients. A few experiments with a previously devel-oped Python application [6], which has this capability, re-vealed a surprisingly high packet loss when even a sin-gle client requested a video from Darwin. We also eval-uated previously developed proxy servers, such as Quick-Time Streaming Proxy. However, the high complexity ofsuch systems, unnecessary to a P2P client application, andsome previously reported performance problems [7] moti-vated us to build a new application, the streaming servent,from scratch. The development of the servent was drivenby efficiency and simplicity. In particular, since our currentgoal is to experiment with distribution of live media con-tent, the servent was built to act as a packet forwarder anddoes not store any content locally. However, the applicationis highly modular facilitating future extensions (e.g. cachingmodule).
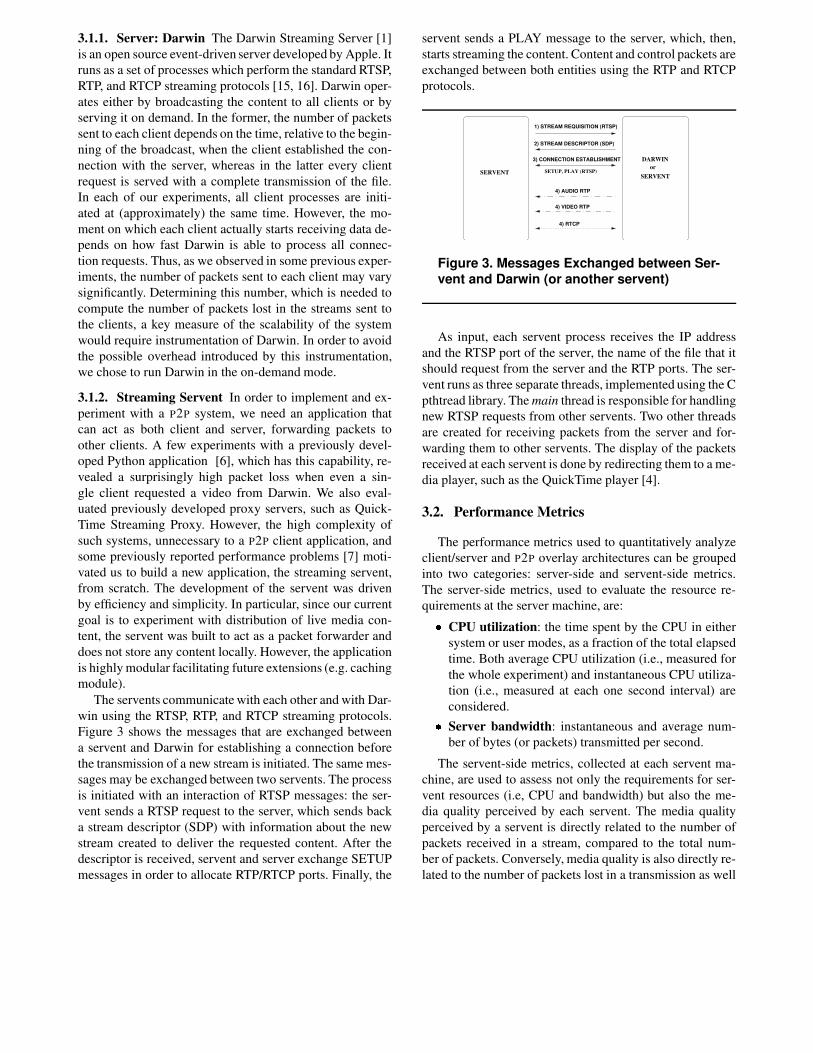
The servents communicate with each other and with Dar-win using the RTSP, RTP, and RTCP streaming protocols.Figure 3 shows the messages that are exchanged betweena servent and Darwin for establishing a connection beforethe transmission of a new stream is initiated. The same mes-sages may be exchanged between two servents. The processis initiated with an interaction of RTSP messages: the ser-vent sends a RTSP request to the server, which sends backa stream descriptor (SDP) with information about the newstream created to deliver the requested content. After thedescriptor is received, servent and server exchange SETUPmessages in order to allocate RTP/RTCP ports. Finally, the
servent sends a PLAY message to the server, which, then,starts streaming the content. Content and control packets areexchanged between both entities using the RTP and RTCPprotocols.
SERVENT SETUP, PLAY (RTSP)
4) AUDIO RTP
4) VIDEO RTP
orSERVENT
DARWIN
1) STREAM REQUISITION (RTSP)
2) STREAM DESCRIPTOR (SDP)
3) CONNECTION ESTABLISHMENT
4) RTCP
Figure 3. Messages Exchanged between Ser-vent and Darwin (or another servent)
As input, each servent process receives the IP addressand the RTSP port of the server, the name of the file that itshould request from the server and the RTP ports. The ser-vent runs as three separate threads, implemented using the Cpthtread library. The main thread is responsible for handlingnew RTSP requests from other servents. Two other threadsare created for receiving packets from the server and for-warding them to other servents. The display of the packetsreceived at each servent is done by redirecting them to a me-dia player, such as the QuickTime player [4].
3.2. Performance Metrics
The performance metrics used to quantitatively analyzeclient/server and P2P overlay architectures can be groupedinto two categories: server-side and servent-side metrics.The server-side metrics, used to evaluate the resource re-quirements at the server machine, are:� CPU utilization: the time spent by the CPU in either
system or user modes, as a fraction of the total elapsedtime. Both average CPU utilization (i.e., measured forthe whole experiment) and instantaneous CPU utiliza-tion (i.e., measured at each one second interval) areconsidered.� Server bandwidth: instantaneous and average num-ber of bytes (or packets) transmitted per second.
The servent-side metrics, collected at each servent ma-chine, are used to assess not only the requirements for ser-vent resources (i.e, CPU and bandwidth) but also the me-dia quality perceived by each servent. The media qualityperceived by a servent is directly related to the number ofpackets received in a stream, compared to the total num-ber of packets. Conversely, media quality is also directly re-lated to the number of packets lost in a transmission as well
as to the number of consecutive packets that were lost ineach loss event, or in other words, the “duration” of a lossevent. Thus, perceived media quality is assessed indirectly,by measuring the quantities described above. The servent-side metrics are:
� CPU utilization: measured both at each one-secondinterval and aggregated for the whole experiment.� Servent bandwidth: instantaneous and average num-ber of bytes (or packets) received and transmitted persecond.� Observed stream bitrate : instantaneous and averagenumber of bytes (or packets) received per second.� Packet loss: instantaneous and average number of RTPpackets lost measured as a fraction of the total numberof packets the client(s) should have received in a trans-mission.� Packet loss duration: distribution of the “duration”of loss events, measured as the number of consecutivepackets lost in each event.
Statistics related to these metrics are gathered by twocollector tools. One tool runs in each (server and client)machine and periodically collects data related to CPU uti-lization and I/O network bandwidth from the /proc file sys-tem. At each one-second interval, the tool extracts data fromthe /proc/stat and /proc/net/dev log files and generates newstatistics. A second collector module runs as part of the ser-vent application and stores a description of each packet re-ceived and sent by the servent in a log file. This descrip-tion includes a sequence number, size, and timestamp. Thelog file is post-processed to compute the number of pack-ets lost and the distribution of packet loss duration observedby each servent, during each experiment.
3.3. Workload
The workload used in our experiments, summarized inTable 1, consists of two VBR video files (a video clip and atrailer) and one audio file (a music), all of them in MOV for-mat. These files have characteristics that span a wide rangeof sizes, durations, average bitrate and, as will become clearin Section 4, variability in the instantaneous bitrate. It is im-portant to note that we have carefully chosen our workloadto represent different classes of media objects that are cur-rently popular in the Internet. Furthermore, the diversity ofthe characteristics of the selected files stress different as-pects of the system operation. Thus, experimenting withthese files allows us to explore different scenarios that oc-cur in real systems.
Type Frame Size Size Bitrate # ofrate (MB) (min) (kbytes/s) RTP
packetsvideo 15 60 04:38,16 217,6 44772cliptrailer 30 22 03:31,17 101,9 18311music - 8 09:54,13 12,5 6193
Table 1. Workload Description
4. Results
This section provides a quantitative evaluation of thescalability of P2P overlay and client/server networks forlive media distribution, measured both in terms of the re-quirements for server resources (Section 4.1) and in termsof packet loss, which directly impacts the quality of mediareceived by each client (Section 4.2). Section 4.3 presentsexperimentally collected measures of the servent require-ments for CPU and bandwidth as a function of the num-ber of clients to which they forward packets (i.e., the ser-vent fan-out). Finally, Section 4.4 shows that simple ana-lytical formulas can be used to assess the scalability of theservent and to determine the maximum fan-out of a serventgiven the amount of resources it is willing to dedicate forforwarding packets to other clients. The results shown be-low are average of three experiments.
4.1. Server Load
This section provides results for the load imposed on theserver, in terms of the requirements for CPU and I/O net-work bandwidth, as a function of the number of clients si-multaneously requesting a stream. These results show that,compared to the traditional client/server solution, both CPUand network bandwidth utilizations are significantly re-duced if a P2P approach is taken. Furthermore, they alsoshow that the savings in the requirements for server re-sources consistently increase with the number of clients. Inother words, the relative cost to upgrade a media server inresponse to an increase in the load is lower if a P2P ap-proach is adopted.
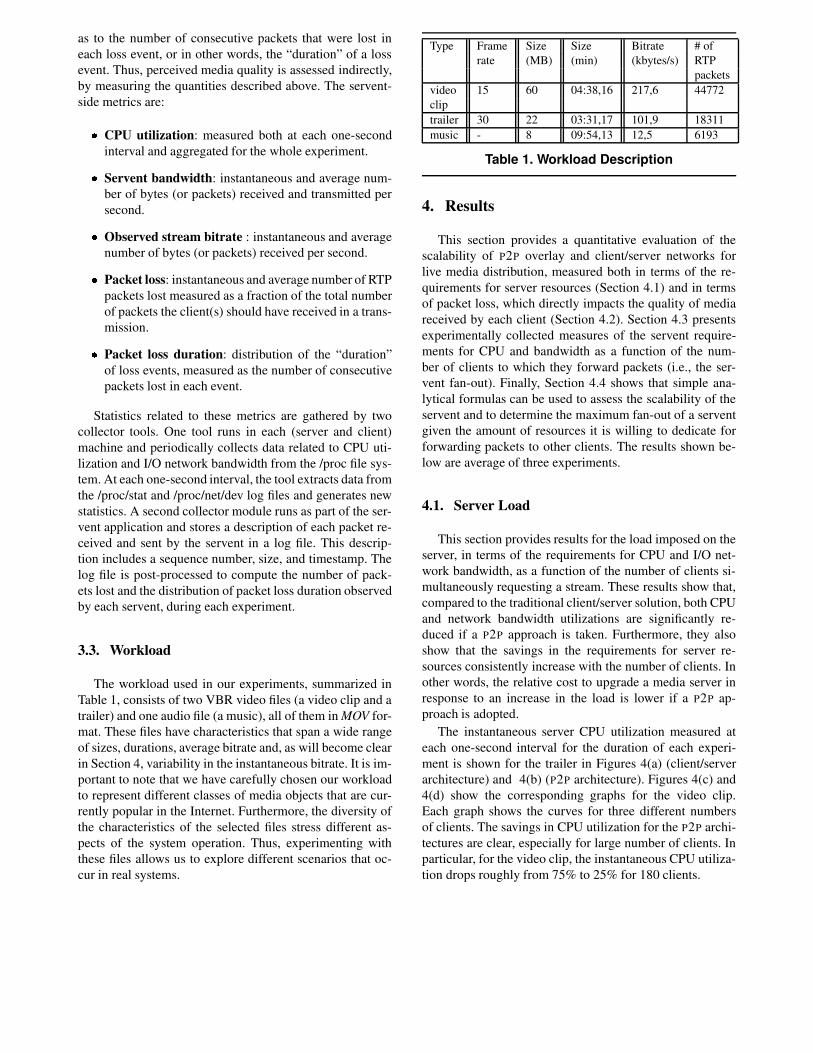
The instantaneous server CPU utilization measured ateach one-second interval for the duration of each experi-ment is shown for the trailer in Figures 4(a) (client/serverarchitecture) and 4(b) (P2P architecture). Figures 4(c) and4(d) show the corresponding graphs for the video clip.Each graph shows the curves for three different numbersof clients. The savings in CPU utilization for the P2P archi-tectures are clear, especially for large number of clients. Inparticular, for the video clip, the instantaneous CPU utiliza-tion drops roughly from 75% to 25% for 180 clients.
0 10 20 30 40 50 60 70 80 90
100
0 20 40 60 80 100 120 140 160 180 200
CP
U U
tiliz
atio
n (%
)
Media Duration (seconds)
180 Clients60 Clients12 Clients
(a) Trailer, Client/Server Architecture
0 10 20 30 40 50 60 70 80 90
100
0 20 40 60 80 100 120 140 160 180 200
CP
U U
tiliz
atio
n (%
)
Media Duration (seconds)
180 Clients60 Clients12 Clients
(b) Trailer, Peer to Peer Architecture
0 10 20 30 40 50 60 70 80 90
100
0 20 40 60 80 100 120 140 160 180 200
CP
U U
tiliz
atio
n (%
)
Media Duration (seconds)
180 Clients60 Clients12 Clients
(c) Video Clip, Client/Server Architecture
0 10 20 30 40 50 60 70 80 90
100
0 20 40 60 80 100 120 140 160 180 200
CP
U U
tiliz
atio
n (%
)
Media Duration (seconds)
180 Clients60 Clients12 Clients
(d) Video Clip, Peer to Peer Architecture
Figure 4. Instantaneous Server CPU Utilization
Figures 4(a) and 4(b) also show a great variability in theCPU utilization observed through time for the trailer, re-flecting the variability in the instantaneous stream bitrate.This variability is due to a large number of scene changes,with action scenes followed by almost completely blackscreens. Note that the same behavior is observed for dif-ferent number of clients and for both client/server and P2Psystems, although it tends to be more significant as the loadon the server increases. The video clip has a much less vari-able instantaneous CPU utilization. However, on average,the CPU utilization is much higher, because of the higheraverage bitrate (200kbytes/s). The music file, not shown inthe Figures, has a roughly constant CPU utilization, witha maximum of around 10% for the client/server architec-ture with 180 clients. These results illustrate the diversity ofour workload, as discussed in Section 3.3.
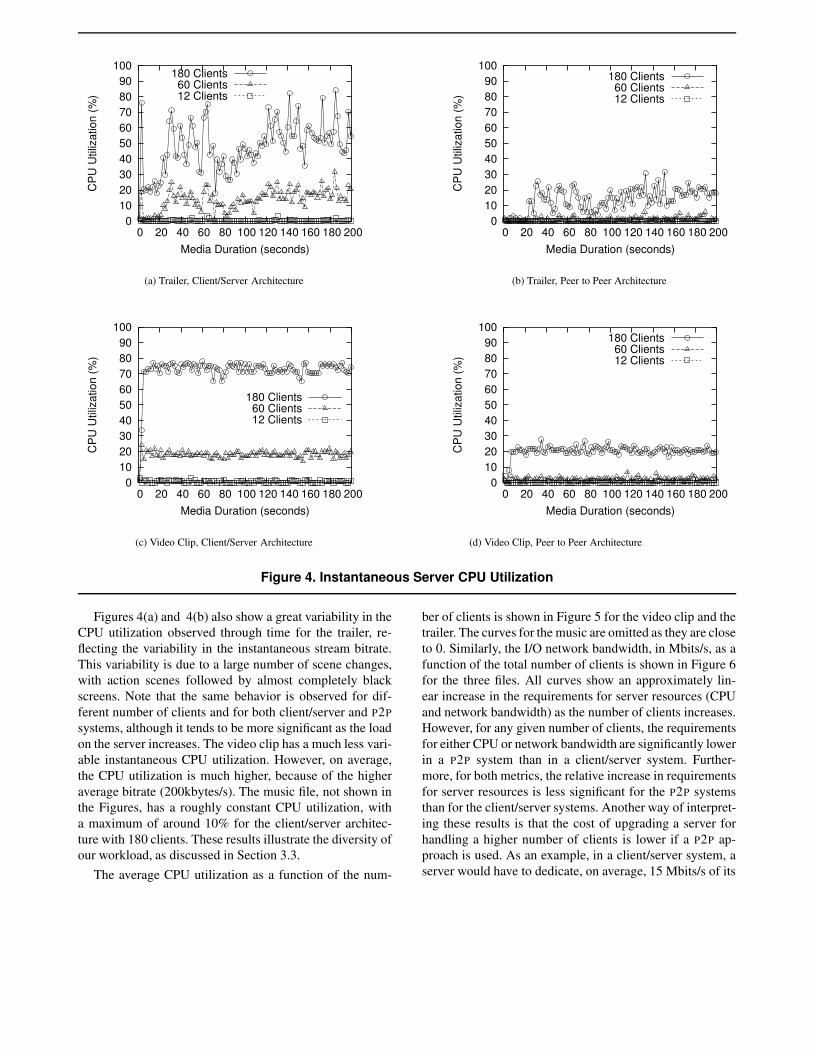
The average CPU utilization as a function of the num-
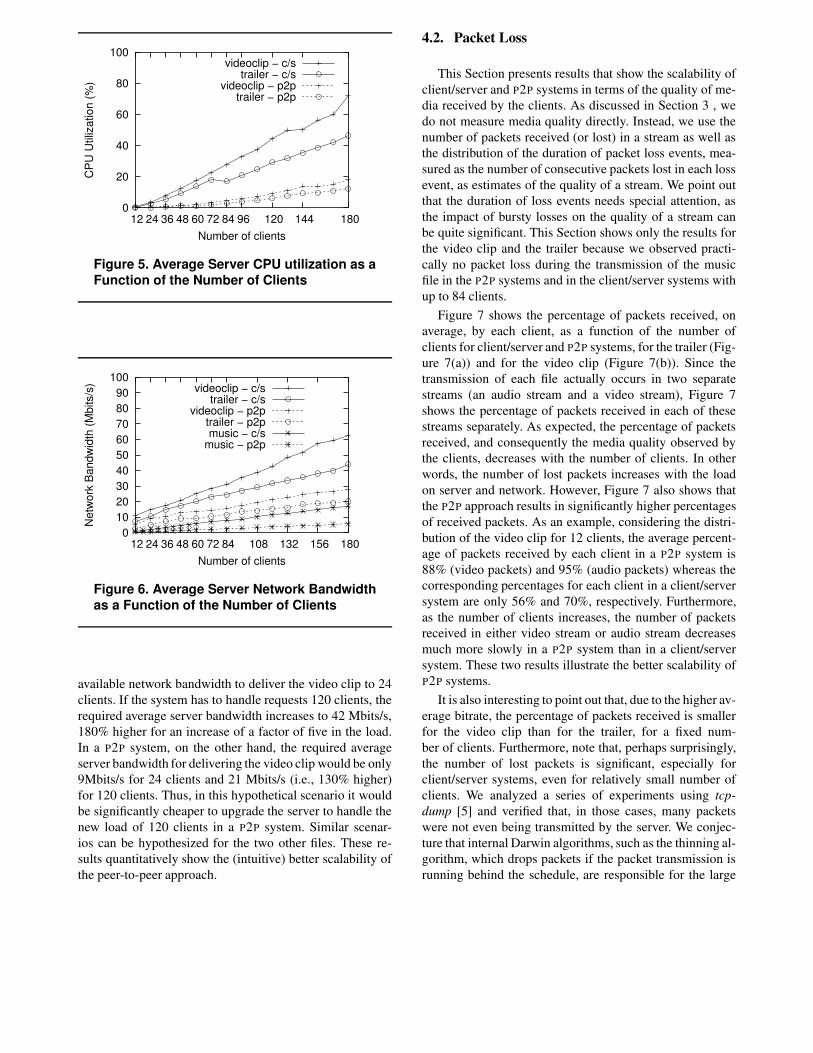
ber of clients is shown in Figure 5 for the video clip and thetrailer. The curves for the music are omitted as they are closeto 0. Similarly, the I/O network bandwidth, in Mbits/s, as afunction of the total number of clients is shown in Figure 6for the three files. All curves show an approximately lin-ear increase in the requirements for server resources (CPUand network bandwidth) as the number of clients increases.However, for any given number of clients, the requirementsfor either CPU or network bandwidth are significantly lowerin a P2P system than in a client/server system. Further-more, for both metrics, the relative increase in requirementsfor server resources is less significant for the P2P systemsthan for the client/server systems. Another way of interpret-ing these results is that the cost of upgrading a server forhandling a higher number of clients is lower if a P2P ap-proach is used. As an example, in a client/server system, aserver would have to dedicate, on average, 15 Mbits/s of its
0
20
40
60
80
100
12 24 36 48 60 72 84 96 120 144 180
CP
U U
tiliz
atio
n (%
)
Number of clients
videoclip − c/strailer − c/s
videoclip − p2ptrailer − p2p
Figure 5. Average Server CPU utilization as aFunction of the Number of Clients
0 10 20 30 40 50 60 70 80 90
100
12 24 36 48 60 72 84 108 132 156 180
Net
wor
k B
andw
idth
(Mbi
ts/s
)
Number of clients
videoclip − c/strailer − c/s
videoclip − p2ptrailer − p2pmusic − c/s
music − p2p
Figure 6. Average Server Network Bandwidthas a Function of the Number of Clients
available network bandwidth to deliver the video clip to 24clients. If the system has to handle requests 120 clients, therequired average server bandwidth increases to 42 Mbits/s,180% higher for an increase of a factor of five in the load.In a P2P system, on the other hand, the required averageserver bandwidth for delivering the video clip would be only9Mbits/s for 24 clients and 21 Mbits/s (i.e., 130% higher)for 120 clients. Thus, in this hypothetical scenario it wouldbe significantly cheaper to upgrade the server to handle thenew load of 120 clients in a P2P system. Similar scenar-ios can be hypothesized for the two other files. These re-sults quantitatively show the (intuitive) better scalability ofthe peer-to-peer approach.
4.2. Packet Loss
This Section presents results that show the scalability ofclient/server and P2P systems in terms of the quality of me-dia received by the clients. As discussed in Section 3 , wedo not measure media quality directly. Instead, we use thenumber of packets received (or lost) in a stream as well asthe distribution of the duration of packet loss events, mea-sured as the number of consecutive packets lost in each lossevent, as estimates of the quality of a stream. We point outthat the duration of loss events needs special attention, asthe impact of bursty losses on the quality of a stream canbe quite significant. This Section shows only the results forthe video clip and the trailer because we observed practi-cally no packet loss during the transmission of the musicfile in the P2P systems and in the client/server systems withup to 84 clients.
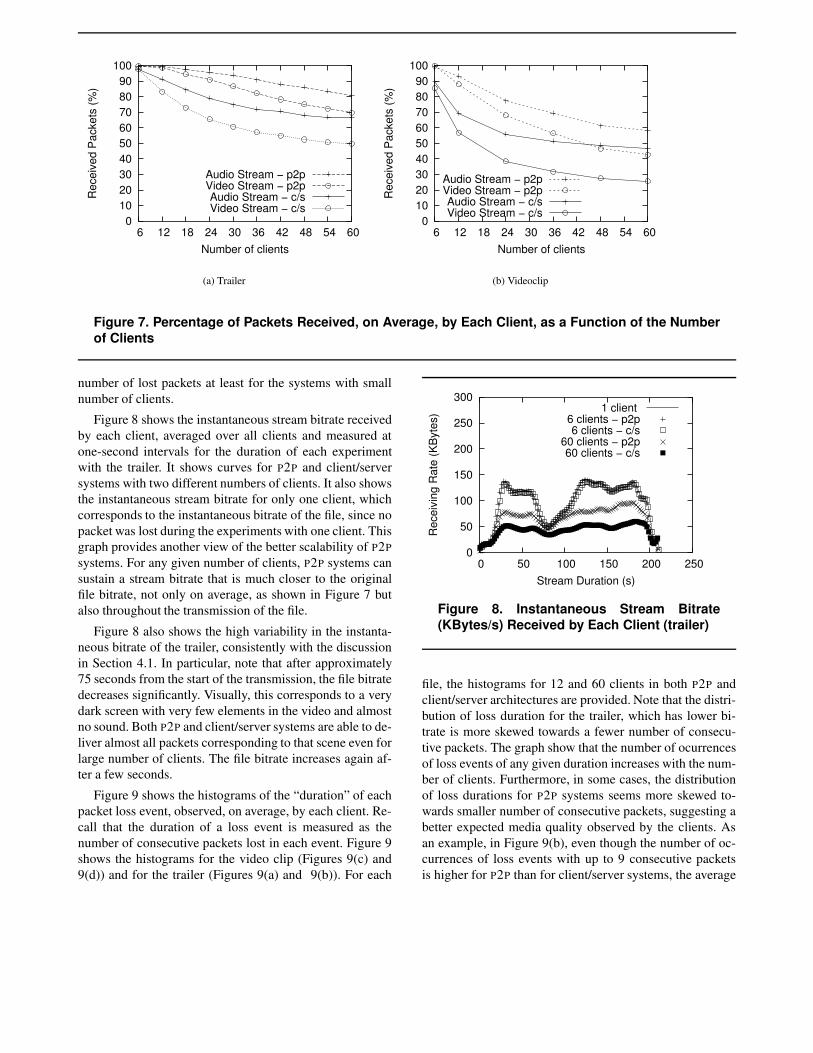
Figure 7 shows the percentage of packets received, onaverage, by each client, as a function of the number ofclients for client/server and P2P systems, for the trailer (Fig-ure 7(a)) and for the video clip (Figure 7(b)). Since thetransmission of each file actually occurs in two separatestreams (an audio stream and a video stream), Figure 7shows the percentage of packets received in each of thesestreams separately. As expected, the percentage of packetsreceived, and consequently the media quality observed bythe clients, decreases with the number of clients. In otherwords, the number of lost packets increases with the loadon server and network. However, Figure 7 also shows thatthe P2P approach results in significantly higher percentagesof received packets. As an example, considering the distri-bution of the video clip for 12 clients, the average percent-age of packets received by each client in a P2P system is88% (video packets) and 95% (audio packets) whereas thecorresponding percentages for each client in a client/serversystem are only 56% and 70%, respectively. Furthermore,as the number of clients increases, the number of packetsreceived in either video stream or audio stream decreasesmuch more slowly in a P2P system than in a client/serversystem. These two results illustrate the better scalability ofP2P systems.
It is also interesting to point out that, due to the higher av-erage bitrate, the percentage of packets received is smallerfor the video clip than for the trailer, for a fixed num-ber of clients. Furthermore, note that, perhaps surprisingly,the number of lost packets is significant, especially forclient/server systems, even for relatively small number ofclients. We analyzed a series of experiments using tcp-dump [5] and verified that, in those cases, many packetswere not even being transmitted by the server. We conjec-ture that internal Darwin algorithms, such as the thinning al-gorithm, which drops packets if the packet transmission isrunning behind the schedule, are responsible for the large
0 10 20 30 40 50 60 70 80 90
100
6 12 18 24 30 36 42 48 54 60
Rec
eive
d P
acke
ts (%
)
Number of clients
Audio Stream − p2pVideo Stream − p2pAudio Stream − c/sVideo Stream − c/s
(a) Trailer
0 10 20 30 40 50 60 70 80 90
100
6 12 18 24 30 36 42 48 54 60
Rec
eive
d P
acke
ts (%
)
Number of clients
Audio Stream − p2pVideo Stream − p2pAudio Stream − c/sVideo Stream − c/s
(b) Videoclip
Figure 7. Percentage of Packets Received, on Average, by Each Client, as a Function of the Numberof Clients
number of lost packets at least for the systems with smallnumber of clients.
Figure 8 shows the instantaneous stream bitrate receivedby each client, averaged over all clients and measured atone-second intervals for the duration of each experimentwith the trailer. It shows curves for P2P and client/serversystems with two different numbers of clients. It also showsthe instantaneous stream bitrate for only one client, whichcorresponds to the instantaneous bitrate of the file, since nopacket was lost during the experiments with one client. Thisgraph provides another view of the better scalability of P2Psystems. For any given number of clients, P2P systems cansustain a stream bitrate that is much closer to the originalfile bitrate, not only on average, as shown in Figure 7 butalso throughout the transmission of the file.
Figure 8 also shows the high variability in the instanta-neous bitrate of the trailer, consistently with the discussionin Section 4.1. In particular, note that after approximately75 seconds from the start of the transmission, the file bitratedecreases significantly. Visually, this corresponds to a verydark screen with very few elements in the video and almostno sound. Both P2P and client/server systems are able to de-liver almost all packets corresponding to that scene even forlarge number of clients. The file bitrate increases again af-ter a few seconds.
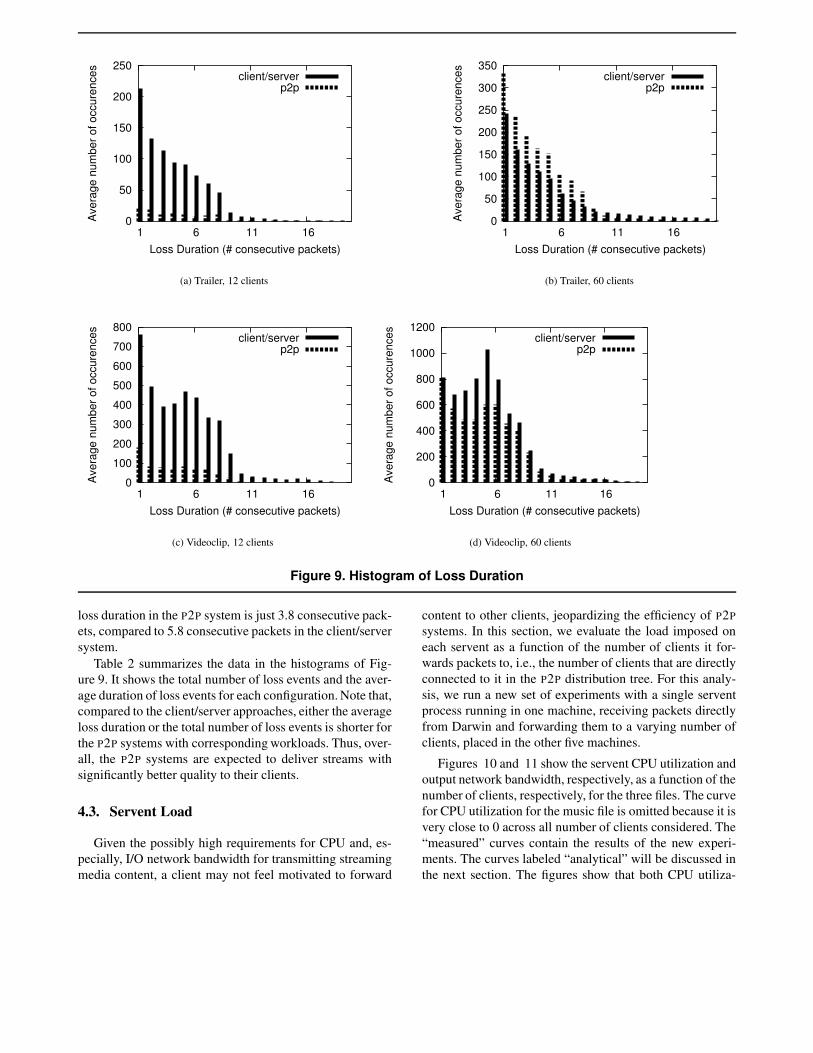
Figure 9 shows the histograms of the “duration” of eachpacket loss event, observed, on average, by each client. Re-call that the duration of a loss event is measured as thenumber of consecutive packets lost in each event. Figure 9shows the histograms for the video clip (Figures 9(c) and9(d)) and for the trailer (Figures 9(a) and 9(b)). For each
0
50
100
150
200
250
300
0 50 100 150 200 250
Rec
eivi
ng R
ate
(KB
ytes
)
Stream Duration (s)
1 client 6 clients − p2p6 clients − c/s
60 clients − p2p60 clients − c/s
Figure 8. Instantaneous Stream Bitrate(KBytes/s) Received by Each Client (trailer)
file, the histograms for 12 and 60 clients in both P2P andclient/server architectures are provided. Note that the distri-bution of loss duration for the trailer, which has lower bi-trate is more skewed towards a fewer number of consecu-tive packets. The graph show that the number of ocurrencesof loss events of any given duration increases with the num-ber of clients. Furthermore, in some cases, the distributionof loss durations for P2P systems seems more skewed to-wards smaller number of consecutive packets, suggesting abetter expected media quality observed by the clients. Asan example, in Figure 9(b), even though the number of oc-currences of loss events with up to 9 consecutive packetsis higher for P2P than for client/server systems, the average
0
50
100
150
200
250
1 6 11 16
Ave
rage
num
ber o
f occ
uren
ces
Loss Duration (# consecutive packets)
client/serverp2p
(a) Trailer, 12 clients
0
50
100
150
200
250
300
350
1 6 11 16
Ave
rage
num
ber o
f occ
uren
ces
Loss Duration (# consecutive packets)
client/serverp2p
(b) Trailer, 60 clients
0
100
200
300
400
500
600
700
800
1 6 11 16
Ave
rage
num
ber o
f occ
uren
ces
Loss Duration (# consecutive packets)
client/serverp2p
(c) Videoclip, 12 clients
0
200
400
600
800
1000
1200
1 6 11 16
Ave
rage
num
ber o
f occ
uren
ces
Loss Duration (# consecutive packets)
client/serverp2p
(d) Videoclip, 60 clients
Figure 9. Histogram of Loss Duration
loss duration in the P2P system is just 3.8 consecutive pack-ets, compared to 5.8 consecutive packets in the client/serversystem.
Table 2 summarizes the data in the histograms of Fig-ure 9. It shows the total number of loss events and the aver-age duration of loss events for each configuration. Note that,compared to the client/server approaches, either the averageloss duration or the total number of loss events is shorter forthe P2P systems with corresponding workloads. Thus, over-all, the P2P systems are expected to deliver streams withsignificantly better quality to their clients.
4.3. Servent Load
Given the possibly high requirements for CPU and, es-pecially, I/O network bandwidth for transmitting streamingmedia content, a client may not feel motivated to forward
content to other clients, jeopardizing the efficiency of P2Psystems. In this section, we evaluate the load imposed oneach servent as a function of the number of clients it for-wards packets to, i.e., the number of clients that are directlyconnected to it in the P2P distribution tree. For this analy-sis, we run a new set of experiments with a single serventprocess running in one machine, receiving packets directlyfrom Darwin and forwarding them to a varying number ofclients, placed in the other five machines.
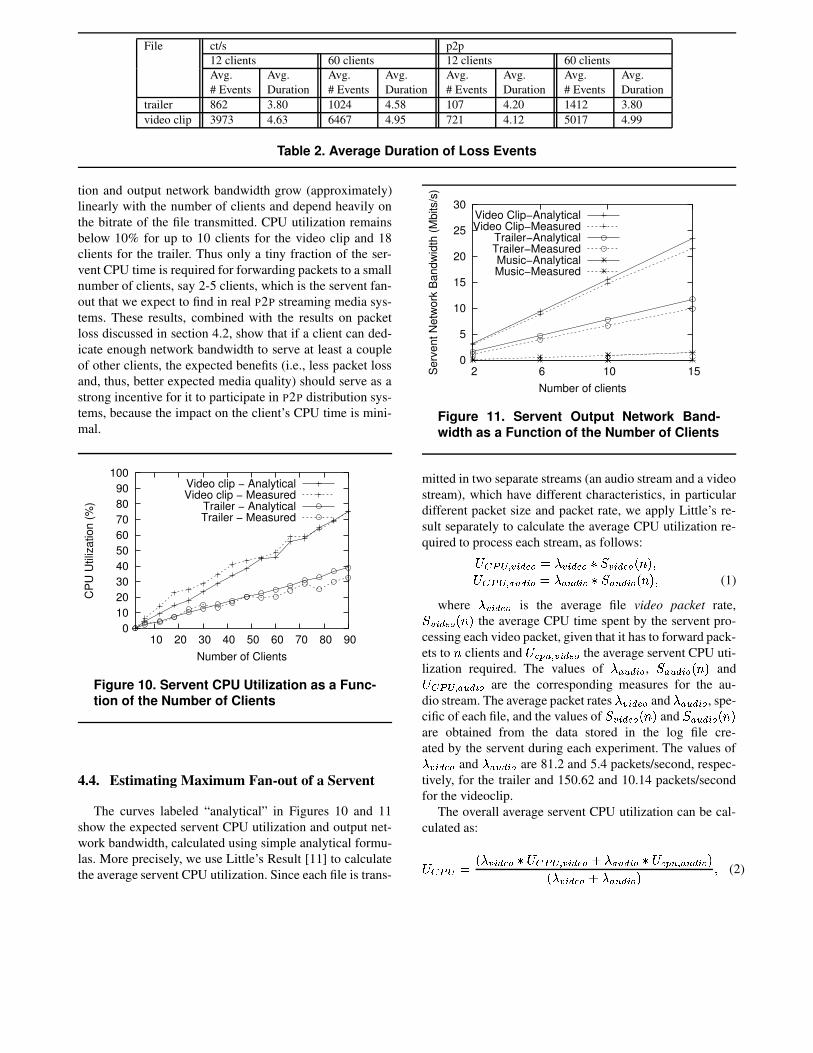
Figures 10 and 11 show the servent CPU utilization andoutput network bandwidth, respectively, as a function of thenumber of clients, respectively, for the three files. The curvefor CPU utilization for the music file is omitted because it isvery close to 0 across all number of clients considered. The“measured” curves contain the results of the new experi-ments. The curves labeled “analytical” will be discussed inthe next section. The figures show that both CPU utiliza-
File ct/s p2p12 clients 60 clients 12 clients 60 clientsAvg. Avg. Avg. Avg. Avg. Avg. Avg. Avg.# Events Duration # Events Duration # Events Duration # Events Duration
trailer 862 3.80 1024 4.58 107 4.20 1412 3.80video clip 3973 4.63 6467 4.95 721 4.12 5017 4.99
Table 2. Average Duration of Loss Events
tion and output network bandwidth grow (approximately)linearly with the number of clients and depend heavily onthe bitrate of the file transmitted. CPU utilization remainsbelow 10% for up to 10 clients for the video clip and 18clients for the trailer. Thus only a tiny fraction of the ser-vent CPU time is required for forwarding packets to a smallnumber of clients, say 2-5 clients, which is the servent fan-out that we expect to find in real P2P streaming media sys-tems. These results, combined with the results on packetloss discussed in section 4.2, show that if a client can ded-icate enough network bandwidth to serve at least a coupleof other clients, the expected benefits (i.e., less packet lossand, thus, better expected media quality) should serve as astrong incentive for it to participate in P2P distribution sys-tems, because the impact on the client’s CPU time is mini-mal.
0 10 20 30 40 50 60 70 80 90
100
10 20 30 40 50 60 70 80 90
CP
U U
tiliz
atio
n (%
)
Number of Clients
Video clip − AnalyticalVideo clip − Measured
Trailer − AnalyticalTrailer − Measured
Figure 10. Servent CPU Utilization as a Func-tion of the Number of Clients
4.4. Estimating Maximum Fan-out of a Servent
The curves labeled “analytical” in Figures 10 and 11show the expected servent CPU utilization and output net-work bandwidth, calculated using simple analytical formu-las. More precisely, we use Little’s Result [11] to calculatethe average servent CPU utilization. Since each file is trans-
0
5
10
15
20
25
30
2 6 10 15Ser
vent
Net
wor
k B
andw
idth
(Mbi
ts/s
)
Number of clients
Video Clip−AnalyticalVideo Clip−Measured
Trailer−AnalyticalTrailer−MeasuredMusic−AnalyticalMusic−Measured
Figure 11. Servent Output Network Band-width as a Function of the Number of Clients
mitted in two separate streams (an audio stream and a videostream), which have different characteristics, in particulardifferent packet size and packet rate, we apply Little’s re-sult separately to calculate the average CPU utilization re-quired to process each stream, as follows:������� �� ������������� ������������� ��������! �"$#�%���� &�'(�) *�����+&�'(�) *������&�'(�) *�,�! �"�#
(1)
where�-�� *���.�
is the average file video packet rate,���� ������/�0 �"the average CPU time spent by the servent pro-
cessing each video packet, given that it has to forward pack-ets to
clients and
��1023'� �� *�����the average servent CPU uti-
lization required. The values of�4&�'(�) *�
,�5&$'6�) ����! �"
and�%���� &�'(�) *�are the corresponding measures for the au-
dio stream. The average packet rates�+�� ������
and�+&�'(�) ��
, spe-cific of each file, and the values of
� �� ������ �! �"and
� &�'(�) *� �! �"are obtained from the data stored in the log file cre-ated by the servent during each experiment. The values of� �� ������
and� &�'(�) *�
are 81.2 and 5.4 packets/second, respec-tively, for the trailer and 150.62 and 10.14 packets/secondfor the videoclip.
The overall average servent CPU utilization can be cal-culated as:
�%���7� �8�-�� ������9���%���� �� *���.��:;�+&�'(�) ����<��1023'� &�'(�) *�="�>� �� ������ :?� &�'(�) *� " #(2)
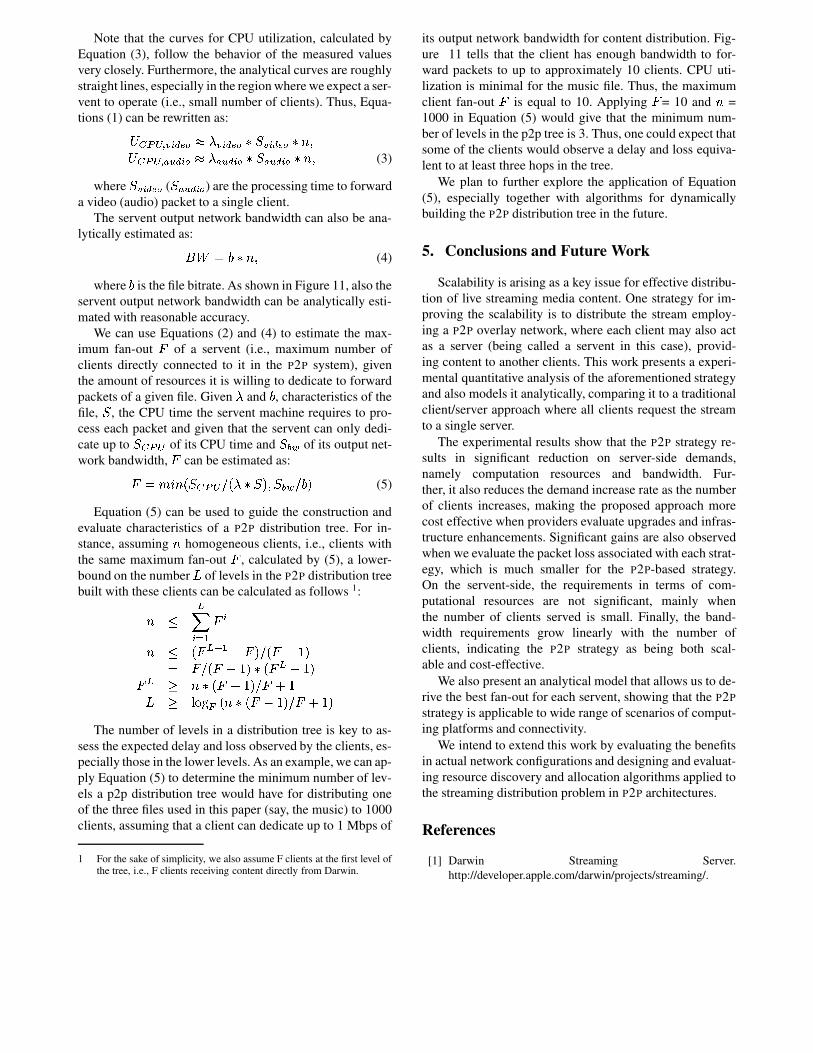
Note that the curves for CPU utilization, calculated byEquation (3), follow the behavior of the measured valuesvery closely. Furthermore, the analytical curves are roughlystraight lines, especially in the region where we expect a ser-vent to operate (i.e., small number of clients). Thus, Equa-tions (1) can be rewritten as:� ���@�A �� ������CB � �� ������ ��� �� *���.� �9 %#� ����� &�'(�) ���B � &�'(�) *� ��� &�'(�) *� �9 %#
(3)
where�5�� *���.�
(��&�'(�) *�
) are the processing time to forwarda video (audio) packet to a single client.
The servent output network bandwidth can also be ana-lytically estimated as:DFE �HG%�9 %#
(4)
whereG
is the file bitrate. As shown in Figure 11, also theservent output network bandwidth can be analytically esti-mated with reasonable accuracy.
We can use Equations (2) and (4) to estimate the max-imum fan-out I of a servent (i.e., maximum number ofclients directly connected to it in the P2P system), giventhe amount of resources it is willing to dedicate to forwardpackets of a given file. Given
�and
G, characteristics of the
file,�
, the CPU time the servent machine requires to pro-cess each packet and given that the servent can only dedi-cate up to
�5����of its CPU time and
��J>Kof its output net-
work bandwidth, I can be estimated as:
I �MLONP ��8�����%QA�>�R����"�#)�5J>K�Q/G$"(5)
Equation (5) can be used to guide the construction andevaluate characteristics of a P2P distribution tree. For in-stance, assuming
homogeneous clients, i.e., clients with
the same maximum fan-out I , calculated by (5), a lower-bound on the number S of levels in the P2P distribution treebuilt with these clients can be calculated as follows 1: T UV *WX I T � I U�Y X9Z I "[QA� I Z]\ "� I QA� I Z^\ "5�_� I U Z]\ "
I U ` a�_� I Z?\ "bQ I : \S ` ced�f�g �! h�_� I Z]\ "[Q I : \ "
The number of levels in a distribution tree is key to as-sess the expected delay and loss observed by the clients, es-pecially those in the lower levels. As an example, we can ap-ply Equation (5) to determine the minimum number of lev-els a p2p distribution tree would have for distributing oneof the three files used in this paper (say, the music) to 1000clients, assuming that a client can dedicate up to 1 Mbps of
1 For the sake of simplicity, we also assume F clients at the first level ofthe tree, i.e., F clients receiving content directly from Darwin.
its output network bandwidth for content distribution. Fig-ure 11 tells that the client has enough bandwidth to for-ward packets to up to approximately 10 clients. CPU uti-lization is minimal for the music file. Thus, the maximumclient fan-out I is equal to 10. Applying I = 10 and
=
1000 in Equation (5) would give that the minimum num-ber of levels in the p2p tree is 3. Thus, one could expect thatsome of the clients would observe a delay and loss equiva-lent to at least three hops in the tree.
We plan to further explore the application of Equation(5), especially together with algorithms for dynamicallybuilding the P2P distribution tree in the future.
5. Conclusions and Future Work
Scalability is arising as a key issue for effective distribu-tion of live streaming media content. One strategy for im-proving the scalability is to distribute the stream employ-ing a P2P overlay network, where each client may also actas a server (being called a servent in this case), provid-ing content to another clients. This work presents a experi-mental quantitative analysis of the aforementioned strategyand also models it analytically, comparing it to a traditionalclient/server approach where all clients request the streamto a single server.
The experimental results show that the P2P strategy re-sults in significant reduction on server-side demands,namely computation resources and bandwidth. Fur-ther, it also reduces the demand increase rate as the numberof clients increases, making the proposed approach morecost effective when providers evaluate upgrades and infras-tructure enhancements. Significant gains are also observedwhen we evaluate the packet loss associated with each strat-egy, which is much smaller for the P2P-based strategy.On the servent-side, the requirements in terms of com-putational resources are not significant, mainly whenthe number of clients served is small. Finally, the band-width requirements grow linearly with the number ofclients, indicating the P2P strategy as being both scal-able and cost-effective.
We also present an analytical model that allows us to de-rive the best fan-out for each servent, showing that the P2Pstrategy is applicable to wide range of scenarios of comput-ing platforms and connectivity.
We intend to extend this work by evaluating the benefitsin actual network configurations and designing and evaluat-ing resource discovery and allocation algorithms applied tothe streaming distribution problem in P2P architectures.
References
[1] Darwin Streaming Server.http://developer.apple.com/darwin/projects/streaming/.
[2] Divx official site. http://www.divx.com/.[3] Mp3.com. http://www.mp3.com/.[4] Quicktime Player. http://www.apple.com/quicktime/.[5] Tcpdump. http://www.tcpdump.org/.[6] H. Deshpande, M. Bawa, and H. Garcia-Molina. Streaming
Live Media over a Peer-to-Peer Network. Technical report,Computer Science Department, Stanford University, Abril2001.
[7] D. Grimm. Quicktime Stream-ing Proxy Performance Improvements.http://www.telecommunications.crc.org.au/content/ ConfPa-pers/grimm.pdf.
[8] M. Hefeeda and B. Bhargava. On-demand Media StreamingOver the Internet. Technical report, Purdue University, 2002.
[9] H. W. Holbrook and D. R. Cheriton. IP Multicast Channels:EXPRESS Support for Large-scale Single-source Applica-tions. In Proc. of the ACM SIGCOMM’99, 1999.
[10] K. A. Hua, D. A. Tran, and R. Villafane. Overlay Multicastfor Video On Demand on the Internet. In Proc. of ACM Sym-posium on Applied Computing, 2003.
[11] D. Menasce and V. Almeida. Capacity Planning for WebServices: metrics, models and methods, chapter Basic Per-formance Concepts. Prentice Hall, 2001.
[12] D. Nogueira, L. Rocha, J. Santos, P. Araujo, V. Almeida, andW. Meira. A Methodology for Workload Characterizationof File-sharing Peer-to-Peer Networks. In Proc. of WWC-5:IEEE 5th Annual Workshop on Workload Characterization,2002.
[13] V. Padmanabhan, H. Wang, P. Chou, and K. Sripanidkulchai.Distributing Streaming Media Content using CooperativeNetworking. In Proc. of the 12th Workshop on Networkand Operating System Support for Digital Audio and Video(NOSSDAV 2002), 2002.
[14] S. Saroiu, P. K. Gummadi, and S. D. Gribble. A Measure-ment Study of Peer-to-Peer File Sharing Systems. In Proc. ofMultimedia Computing and Networking 2002 (MMCN’02),2002.
[15] H. Schulzrinne, S. Casner, R. Frederick, and V. Ja-cobson. RTP: A Transport Protocol for Real-TimeApplications. RFC 1889, IETF, Janeiro 1996.http://www.ietf.org/rfc/rfc1889.txt.
[16] H. Schulzrinne, A. Rao, and R. Lanphier. RTSP: Real-Time Streaming Protocol. RFC 2326, IETF, Abril 1998.http://www.ietf.org/rfc/rfc2326.txt.
[17] D. Tran, K. Hua, and T. Do. ZIGZAG: An Efficient Peer-to-Peer Schema for Media Stre aming. In To appear at IEEEINFOCOM 2003, 2003.
[18] A. Wolman, G. Voelker, N. Sharma, N. Cardwell, M. Brown,T. Landray, D. Pinnel, A. Karlin, and H. Levy. Organization-based Analysis of Web-object Sharing and Caching. In Proc.of 2nd USENIX Conference on Internet Technologies andSystems (USITS ’99), 1999.
[19] D. Xu, M. Hefeeda, S. Hambrusch, and B. Bhargava. OnPeer-to-Peer Media Streaming. In Proc. of IEEE In-ternational Conference on Distributed Computing Systems(ICDCS 2002), 2002.
Top Related
Copyright © 2022 FDOKUMEN

