


Bahasa
Halaman
Hukum

Lehigh UniversityLehigh Preserve
Theses and Dissertations
1-1-1976
Project scheduling under resource constraints anextension of Brooks' Algorithm.James R. Brown
Follow this and additional works at: http://preserve.lehigh.edu/etd
Part of the Industrial Engineering Commons
This Thesis is brought to you for free and open access by Lehigh Preserve. It has been accepted for inclusion in Theses and Dissertations by anauthorized administrator of Lehigh Preserve. For more information, please contact [email protected].
Recommended CitationBrown, James R., "Project scheduling under resource constraints an extension of Brooks' Algorithm." (1976). Theses and Dissertations.Paper 2046.
CORE Metadata, citation and similar papers at core.ac.uk
Provided by Lehigh University: Lehigh Preserve

PROJECT SCHEDULING UNDER RESOURCE CONSTRAINTS
AN EXTENSION OF BROOKS' ALGORITHM
by
James R. Brown
A Thesis
Presented to the Graduate Committee
of Lehigh University
in Candidacy for the Degree of
Master of Science
in
Industrial Engineering
Lehigh University
1976

ProQuest Number: EP76319
All rights reserved
INFORMATION TO ALL USERS The quality of this reproduction is dependent upon the quality of the copy submitted.
In the unlikely event that the author did not send a complete manuscript and there are missing pages, these will be noted. Also, if material had to be removed,
a note will indicate the deletion.
uest
ProQuest EP76319
Published by ProQuest LLC (2015). Copyright of the Dissertation is held by the Author.
All rights reserved. This work is protected against unauthorized copying under Title 17, United States Code
Microform Edition © ProQuest LLC.
ProQuest LLC. 789 East Eisenhower Parkway
P.O. Box 1346 Ann Arbor, Ml 48106-1346

CERTIFICATE OF APPROVAL
This thesis is accepted and approved in partial ful-
fillment of the requirements for the degree of Master of
Science.
Date?
Chairman of the Department of Industrial Engineering
11

ACKNOWLEDGEMENTS
I am deeply indebted to Doctor Gary E. Whitehouse,
my thesis advisor, for his ideas, patience and continued
support. I am also grateful to Doctor Ben L. Wechsler,
my minor advisor, and Mrs. Faith Newhall, who typed the
manuscript. Last but not least, I am indebted to my
parents who always understand.
iii
TABLE OF CONTENTS
Page
Abstract 1
CHAPTER 1 - INTRODUCTION 2
1.1 Project Management - The Activity Network 2 1.2 Resource Considerations - General 4 1.3 Resource Considerations - Procedures 8
CHAPTER 2 - PROJECT SCHEDULING UNDER 10 RESOURCE CONSTRAINTS
2.1 Heuristic Methods 10 2.2 Brooks' Algorithm - ACTIM 10 2.3 ACTRES and TIMRES 15 2.4 A Modification of the TIMRES Criteria 20 2.5 Experimentation 20
CHAPTER 3 - ANALYSIS OF RESULTS 23
3.1 Network Number 5 23 3.2 Network Number 10 26 3.3 Network Number 12 26 3.4 Network Number 14 34
CHAPTER 4 - CONCLUSIONS AND AREAS FOR ; 38 FURTHER STUDY /'
t
4.1 Conclusions 38 4.2 Areas for Further Study 38
BIBLIOGRAPHY 4 0
Appendix A 43
VITA 76
xv
LIST OF TABLES
Page
Table 2.1 Brooks' Algorithm Solution to 12 Network #1 with Three Units of Resource
Table 2.2 Resource Allocation by ACTIM for 17 Network #3 with Total Resources Limited to Five Units
Table 2.3 Resource Allocation by ACTRES for 18 Network #3 with Total Resources Limited to Five Units
Table 2.4 Resource Allocation by TIMRES for 19 Network #3 with Total Resources Limited to Five Units

LIST OF FIGURES
Page
Figure 1.1 Arrow diagram for servicing a car 6
Figure 1.2 Revised arrow diagram for servicing 7 a car
Figure 2.1 Network 1 13
Figure 2.2 Network 3 16
Figure 2.3 Flow Chart of GENRES Search Model 21
Figure 3.1 Network 5 24
Figure 3.2 Duration graph for Network 5 25
Figure 3.3 Network 10 27
Figure 3.4 Duration graph for Network 10 28
Figure 3.5 Network 12 29
Figure 3.6 Duration graph for Network 12 30
Figure 3.7 Gantt Chart and resource loading 32 diagram for Network 12 with constrained resource of 10 men
Figure 3.8 Gantt Chart and resource loading 33 diagram for Network 12 with constrained resource of 11 men
Figure 3.9 Network 14 35
Figure 3.10 Duration graph for Network 14 36
vi
PROJECT SCHEDULING UNDER RESOURCE CONSTRAINTS:
AN EXTENSION OF BROOKS' ALGORITHM
by: James R. Brown
Abstract
In project scheduling by network analysis, traditional
critical path methods fail to include resource considera-
tions. Other methods must be used to allow for resource
considerations. This thesis explores one area of resource
considerations; project scheduling under resource con-
straints. The specific case investigated is the single
resource, single project schedule. A model, entitled the
GENRES search model, is developed. The model utilizes
Brooks' Algorithm (BAG) to generate the project schedule.
The criteria used are various weighted combinations of
ACTIM and ACTRES (Bedworth, Industrial Systems). The best
project schedule is that which gives the least project
duration.
The GENRES model was found effective in finding project
durations equal to or less than that of ACTIM, ACTRES or
TIMRES (the combination of ACTIM and ACTRES with each
given equal weight). The research also found that when
the project completion time found by the algorithm
approaches the critical path duration, resource levelling
procedures may be preferred.

CHAPTER 1
INTRODUCTION
1.1 Project Management - The Activity Network
The term project management encompasses a large field
and may mean different things to different people. One
thing is certain, however, that the "project" approach has
come to occupy an important position in business and
industry. The wealth of literature concerning project
management appearing in recent years is evidence of the
increasing development and use of project management
techniques.
The basis of most of the more successful project
management techniques is the activity network or project
network model. The advent of these techniques began in
the late fifties with the development of PERT (Program
Evaluation and Review Technique) and CPM (Critical Path
Method). These techniques are commonly called critical path
methods and both require the preparation of an activity
network. The activity network is a physical portrayal of
the plan for carrying out a project. The network shows the
precedence relationships of the project's elements which
lead to the project's completion.
Whitehouse states that the basic activity-network
procedure consists of three phases: the planning phase,
the scheduling phase, and the control phase. Moder and
Phillips suggest a further classification within the
scheduling phase. In total, the procedure involves six
steps:
A. The planning phase
Step 1. Project Planning. The activities making
up the project are defined, and their
technological dependencies upon one
another are shown explicitly in the form
of a network diagram.
B. The scheduling phase
Step 2. Time and Resource Estimation. Estimates
of the time required to perform each of
the network activities are made. These
time estimates are based on a stated
resource level (manpower, machinery, etc.)
for each activity.
Step 3. Basic Scheduling. The basic scheduling
computations are commonly called Forward-
Pass Rules and Backward-Pass Rules. These
computations give the earliest and latest
allowable start and finish times for each
activity and identify the critical path
through the network. The amount of slack
or float associated with activities on
the non-critical paths is also determined.
Step 4. Time-cost Trade-offs. Here the time-cost
trade-offs of activity performance times
may be considered if the analyst is
interested in determining the cost of
reducing the project completion time.
Step 5. Resource Allocation. The feasibility of
each schedule must be checked with respect
to resource requirements and availability.
The details of this step are considered
later in this paper.
C. The control phase
Step 6. Project Control. When the network plan
and schedule have been developed to a
satisfactory extent, they are prepared in
final form for use in the field. The
project is controlled, or monitored, by a
comparison of the actual status of the
project against the prevailing schedule.
This monitoring allows for frequent review
and, when necessary, revision of the
project plan.
1.2 Resource Considerations - General
The basic critical-path method provides plans and
schedules that are technologically feasible. However, they
may not always be practical when resource requirements and
availability are considered. The equipment, manpower and
shop space requirements may exceed availability or fluctuate
violently over the course of the project life. Similarly,
a schedule may require that money be spent faster than it
can be raised or may tie up funds that could be used
profitably elsewhere. Thus, some means is required for plan-
ning and scheduling a project that accounts for not only the
work methods employed but also the availability of resources.
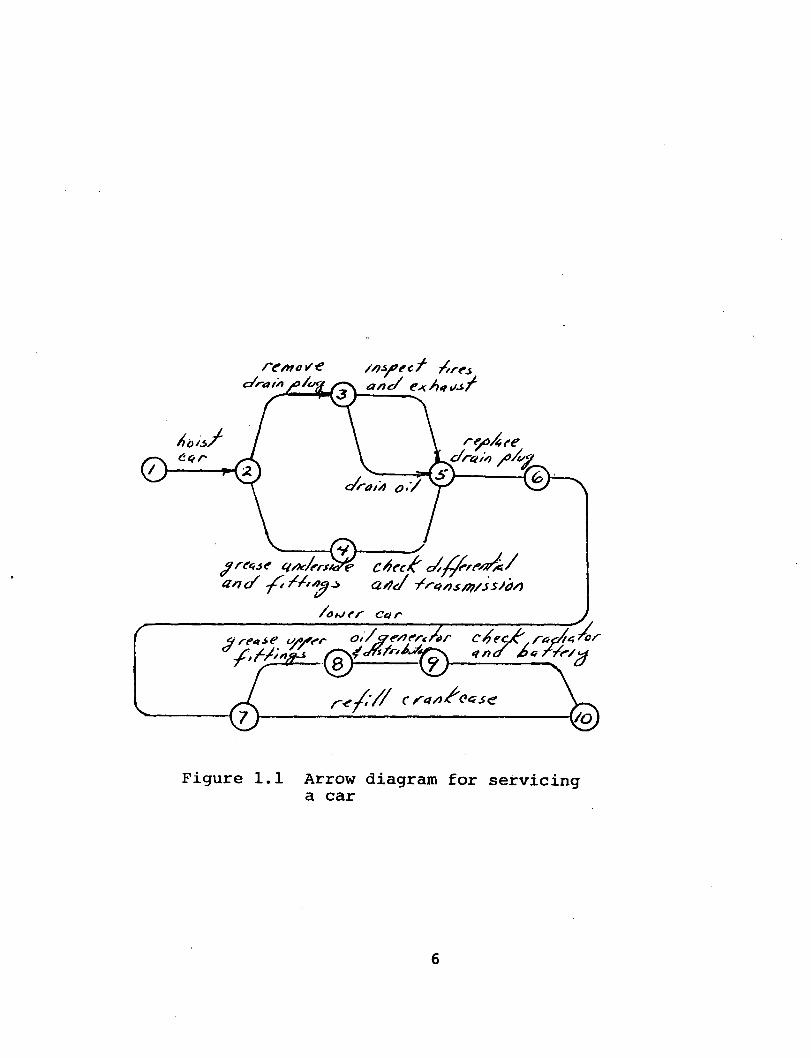
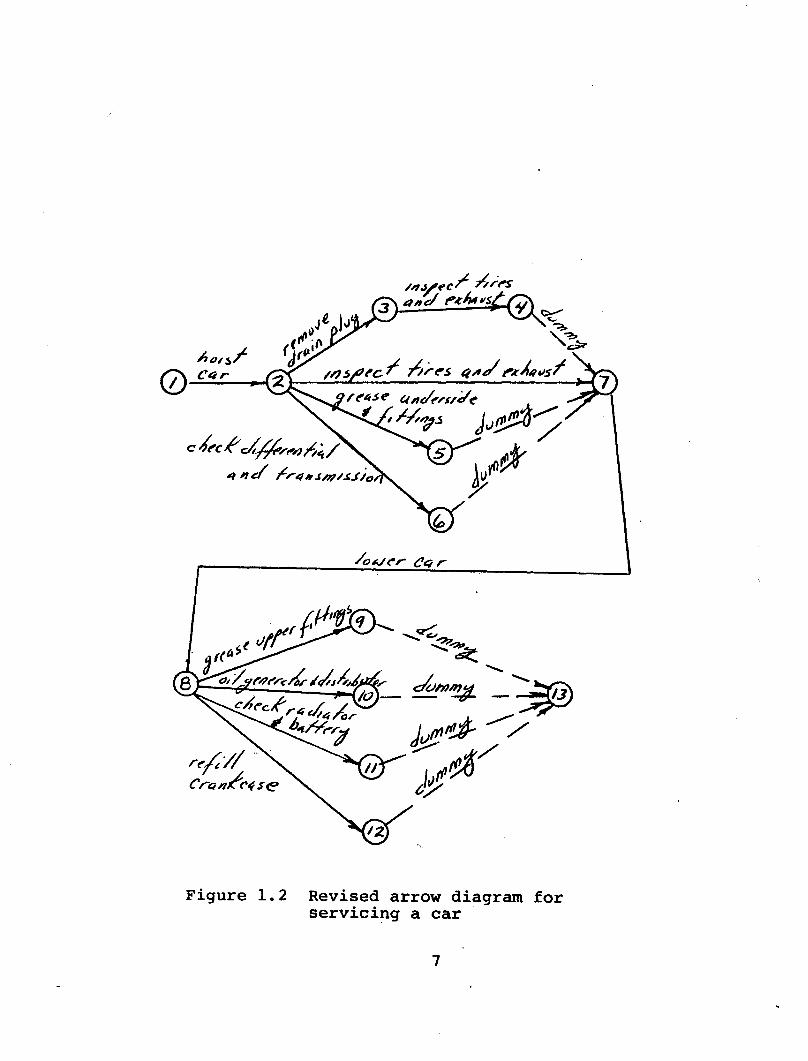
Whitehouse presents an activity network for
servicing a car. In the preparation of this network,
Figure 1.1, two service station attendants were assumed to
be available to perform the project. Thus, after the car is
hoisted, only two activities can occur: remove drain plug
and grease underside fittings. If four attendants were
available, two other activities could also begin: inspect
tires and exhaust and check differential and transmission.
After the car is lowered only two activities may begin
under the assumption of only two attendants. However, four
events are now technologically feasible: grease upper
fittings, oil generator and distributor, check radiator and
battery, and refill crankcase. A revised network is pre-.
sented in Figure 1.2. This network considers only the
technological dependencies of the events. This is the
project planning step or Step 1 suggested in Section 1.1.
The next step is to estimate the time and resources required
to perform each activity. Step 3 would be the performance
of the basic critical path scheduling algorithm. Assuming 5
c/ratAf>/"ftr?\ a/)c/ e«./)4<J±/
c/rcii/) /Osf?
r
®-^
v (y\ ^/
/c otJfr Car
S/re«se oASsr oi/cff/ffsf/ar c r3
r* /;// S* C fr4/)/CQGS<Z
Figure 1.1 Arrow diagram for servicing a car
si
Figure 1.2 Revised arrow diagram for servicing a car
the analyst is satisfied with the resulting project dura-
tion, Step 5 can be performed. If only two service station
attendants are available, then only two activities can
commence from nodes 2 or 8 upon their realization. Some
procedure must now be used to allow for this constraint on
the available resource, manpower.
1.3 Resource Considerations - Procedures
(8 9) Davis ' has categorized the procedures of project
scheduling under resource considerations. Based on the
type of resource allocation problem, three distinct cate-
gories are suggested: (1) time/cost trade-off problems,
(2) resource leveling problems, and (3) constrained resource
problems.
Time/cost trade-off procedures are directed at deter-
mining the least-cost schedule for any given project
duration. These are usually under the assumption of
unlimited resources. The traditional CPM method is such a
time/cost trade-off procedure.
Resource leveling procedures attempt to' reduce any
fluctuations in the level of resource usage while maintain-
ing a given project duration. This project duration is
normally that determined by critical path procedures. Jobs
are then rescheduled within their available slack to give
the most acceptable profile(s) of resource usage over time.
The acceptable profile is judged according to some pre-
8
determined criteria such as maximum utilization of resources,
In the resource leveling procedures, the project
duration is not allowed to increase. This is in contrast
to the constrained resource problem where, out of necessity,
the project duration may exceed that determined by tradi-
tional critical path methods. The constrained resource
problem arises when the amount of resource available during
a project is not sufficient to satisfy the demands of
concurrent activities. To satisfy this constraint,
sequencing decisions are required which often cause an
increase in the critical path duration. The most common
objective of these procedures is to minimize the total
project duration. The procedures available are of three
(2) types: analytical, analogue, or heuristic . The pro-
cedure examined by this thesis is of the heuristic type.
CHAPTER 2
PROJECT SCHEDULING UNDER RESOURCE CONSTRAINTS
2.1 Heuristic Methods
A heuristic method is based on a set of formal decision
rules. These rules derive from assumptions which appear to
be reasonable. Use of an heuristic does not guarantee an
optimum solution. They attempt to provide a solution which
is near-optimal, and they are utilized when the optimal
solution cannot be reached either because no suitable
analytical method is known, or, if known, it is not
technically feasible.
(25 26 27) Analytic methods are available ' ' ' to obtain an
optimal solution to the constrained resource problem. These
include enumerative and mathematical programming techniques.
Both areas are still being researched . However, most
success to date has been found in the application of the
heuristic methods.
2.2 Brooks' Algorithm - ACTIM
One of the available heuristic procedures is the
Brooks' Algorithm (BAG) presented in Chapter 6 of
(3) Bedworth . The algorxthm presents a rule for determining
which activities should receive limited resources first.
The algorithm considers the single project, single resource
case and is best described by example. The example is taken (2)
from Bedworthx ' .
10

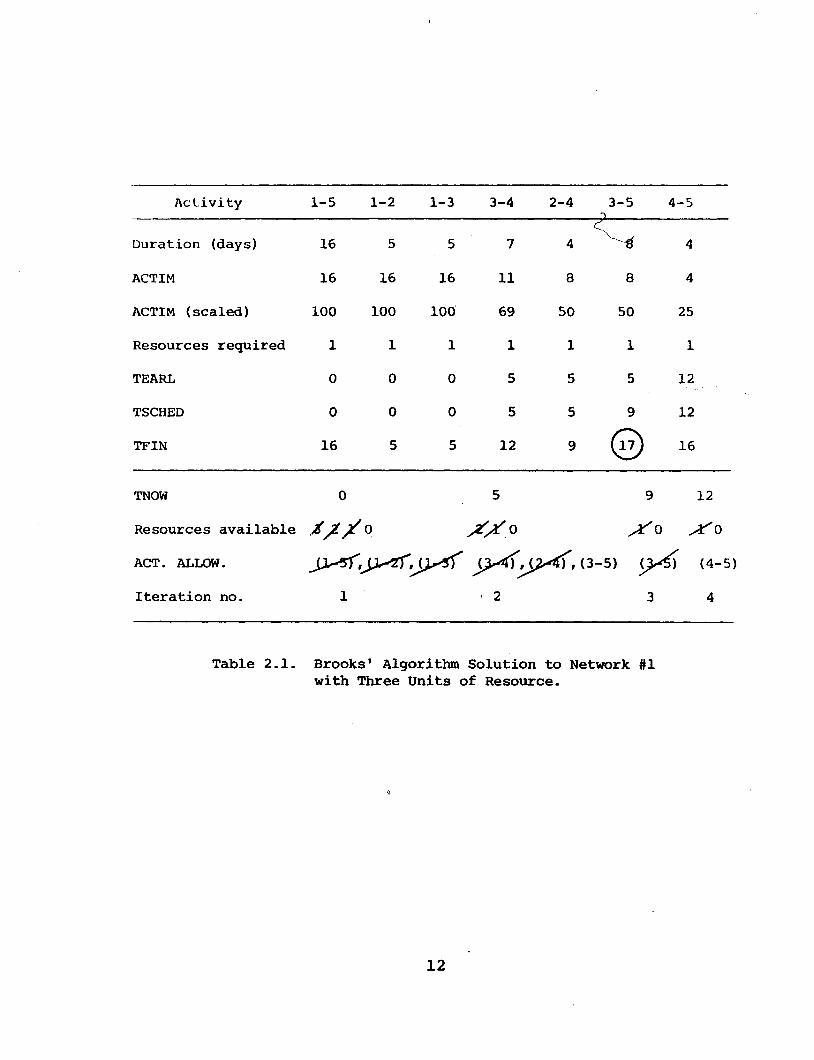
The steps required to assign the single resource with
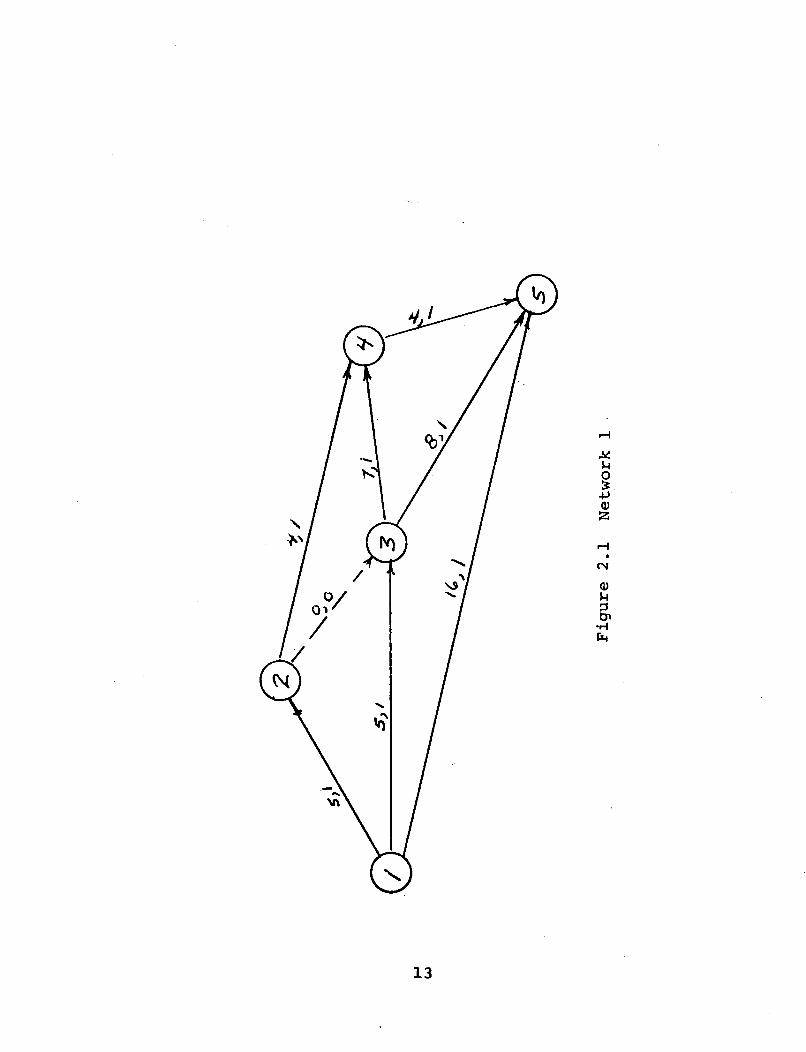
BAG are as follows. (Table 2.1 gives the tabular results
of these steps for Network 1 in Figure 2.1 with three
resources available.)
1. Develop the project network as with the critical
path procedure identifying activities, their required times
and required resources.
2. Determine for each activity the maximum time it
controls through the network on any one path. This is
equivalent to the critical path time minus the latest start
time of the starting node of each activity. These times
are then scaled from 0 to 100. This scaled control time is
designated ACTIM.
3. Rank these in decreasing ACTIM sequence, as in
Table 2.1. The duration and resources required for each
activity are those determined in the first step. The rows
TEARL, TSCHED, TFIN and TNOW need explanation:
a. TEARL is the earliest start time of an
activity determined by traditional
critical path calculations.
b. TSCHED is the actual scheduled starting
time of an activity as determined by BAG.
c. TFIN is the completion time of each activity.
d. TNOW is the time at which resource assign-
ments are now being considered.
11
Activity 1-5 1-2 1-3 3-4 2-4 3-5 •>
4-5
Duration (days) 16 5 5 7 4 ^ 4
ACTIM 16 16 16 11 8 8 4
ACTIM (scaled) 100 100 100 69 50 50 25
Resources required 1 1 1 1 1 1 1
TEARL 0 0 0 5 5 5 12
TSCHED 0 0 0 5 5 9 12
TFIN 16 5 5 12 9 © 16
TNOW 0 5 9 12
Resources available #ji/?Q ^^° ^*"o x*^0
ACT. ALLOW. J>>*f,JJ*<fi'.^)yrf' j^),J^C), (3-5) {^) (4-5)
Iteration no.
Table 2.1. Brooks' Algorithm Solution to Network #1 with Three Units of Resource.
12
U O
-P
25
CM
J-l
cr> •H CM
13

4. Set TNOW at 0. The allowable activities (ACT.
ALLOW.) to be considered for scheduling at TNOW of zero
are those activities with TEARL of 0. These are 1-2, 1-3,
1-5. These are placed in the ACT. ALLOW, row in decreasing
ACTIM order. Ties are scheduled by scheduling the activity
of longest duration first. The number of resources initially
available, 3, are placed in the resources available column.
5. Determine if the first activity in ACT. ALLOW., 1-5,
can be assigned. Activity 1-5 requires only one resource
and three are available, so 1-5 can be assigned. A line
is struck through 1-5 to indicate assignment and the number
of resources available is decreased by one. TSCHED and
TFIN are then set for activity 1-5. This same process is
repeated for the remainder of the ACT. ALLOW, activities
until the resources available are depleted.
6. TNOW is raised to the next TFIN time of 5 which
occurs at the completion of both activities 1-2 and 1-3.
The resources available are now 2. ACT. ALLOW, includes
those activities not assigned at the previous TNOW (in
this case, none) and those new activities whose predecessors
have been completed (2-4, 3-4, 3-5).
7. Repeat this assignment process until all activities
have been scheduled. The latest TFIN gives the duration of
the project, which is 17 days for this example.
14
2.3 ACTRES and TIMRES
The Brooks' Algorithm could be used with any number
of criteria other than ACTIM. A number of these criteria
are discussed by Patterson . Bedworth presents two
other possible control criteria, ACTRES and TIMRES.
ACTRES incorporates both activity time and resource
level in the control criteria. ACTRES is computed by
taking the value of the activity time multiplied by the
number of resource units for an activity plus the maximum
of the ACTRES values following this activity. Again,
after the ACTRES value is calculated for all of the net-
work' s activities, they are appropriately scaled from 0 to
100.
The TIMRES criteria suggested by Bedworth is a
combination of ACTIM and ACTRES. It is calculated by
adding ACTIM and ACTRES. Therefore, ACTIM and ACTRES are
given equal weight in the TIMRES criteria. (To keep
TIMRES on the 0-100 scale, TIMRES is calculated
0.5 (ACTIM) + 0.5 (ACTRES).)
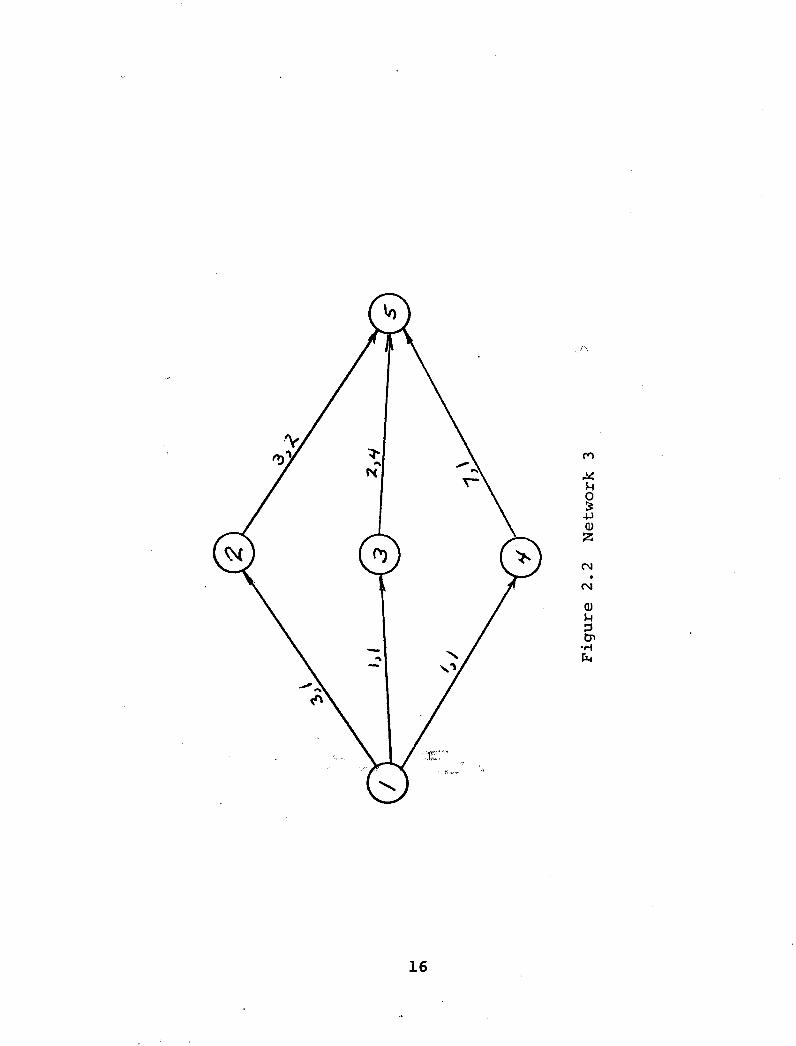
The Resource Allocation Schedule for Network 3 of
Figure 2.2 is shown using ACTIM, ACTRES and TIMRES in
Tables 2.2, 2.3 and 2.4 respectively. Note that each gives
a different project schedule.
15
..A
M U O
J3
QJ
3
•H
16
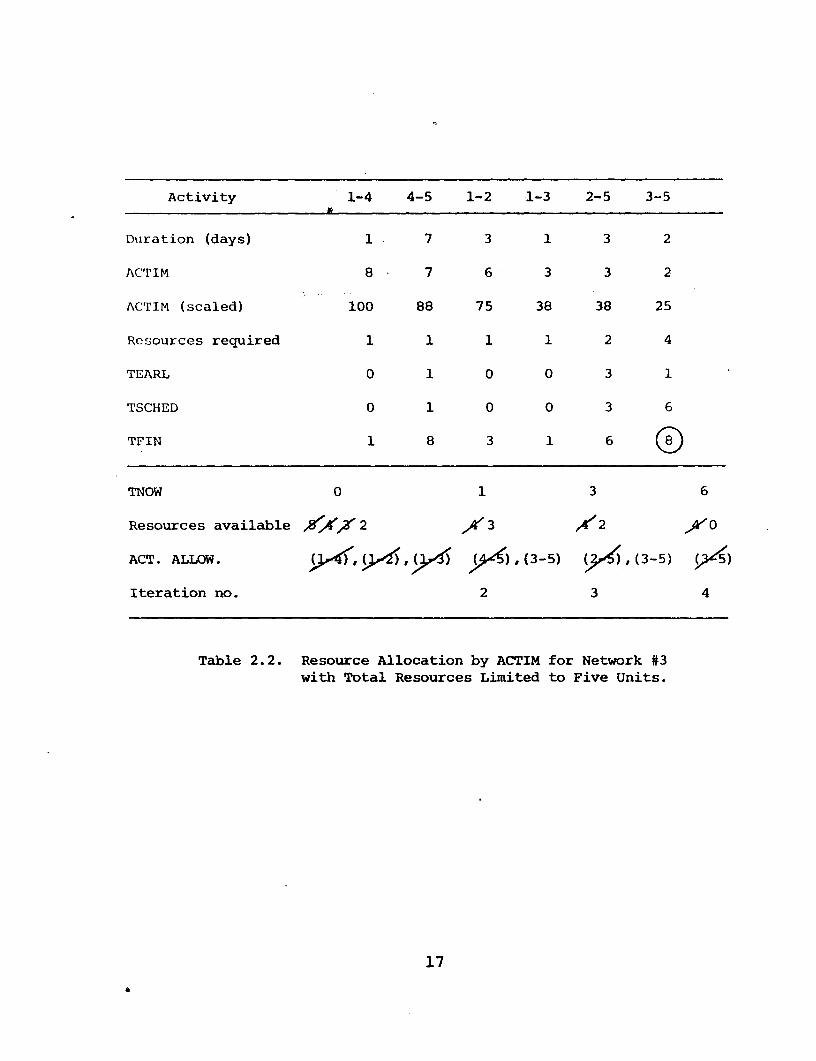
Activity 1-4 »
4-5 1-2 1-3 2-5 3-5
Duration (days) 1 7 3 1 3 2
ACTIM 8 7 6 3 3 2
ACTIM (scaled) 100 88 75 38 38 25
Resources required 1 1 1 1 2 4
TEARL 0 1 0 0 3 1
TSCHED 0 1 0 0 3 6
TFIN 1 8 3 1 6 © TNOW 0 13 6
Resources available /8/*'/2 y^3 /C 2 ^f0
ACT. ALLOW. ^jf,(^KO^tf ^4^), (3-5) (^$1,(3-5) p^5)
Iteration no.
Table 2.2. Resource Allocation by ACTIM for Network #3 with Total Resources Limited to Five Units.
17
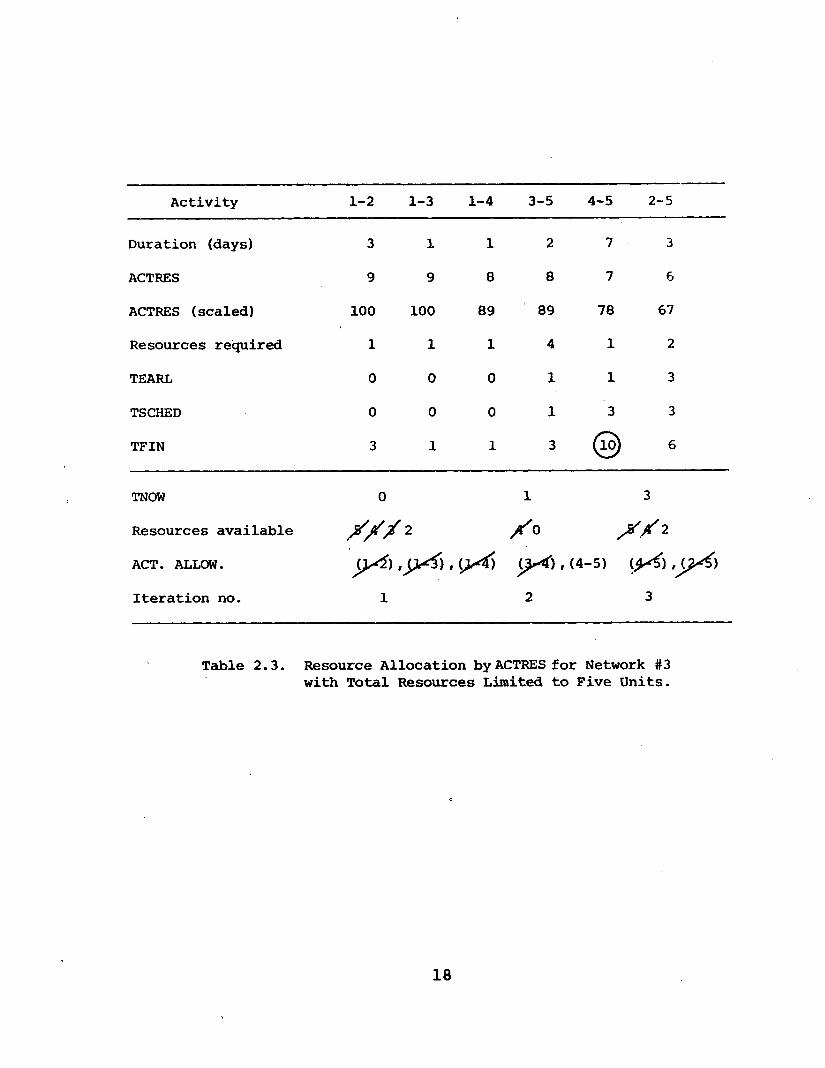
Activity 1-2 1-3 1-4 3-5 4-5 2-5
Duration (days) 3 1 1 2 7 3
ACTRES 9 9 8 8 7 6
ACTRES (scaled) 100 100 89 89 78 67
Resources required 1 1 1 4 1 2
TEARL 0 0 0 1 1 3
TSCHED 0 0 0 1 3 3
TFIN 3 1 1 3 © 6
TNOW 0 1 3
Resources available /// 2 Xo X/2 ACT. ALLOW. pSZ) ,p^i) , (>*£) ^), (4-5) \yi) ,psi) Iteration no. 1 2 3
Table 2.3. Resource Allocation by ACTRES for Network #3 with Total Resources Limited to Five Units.
18
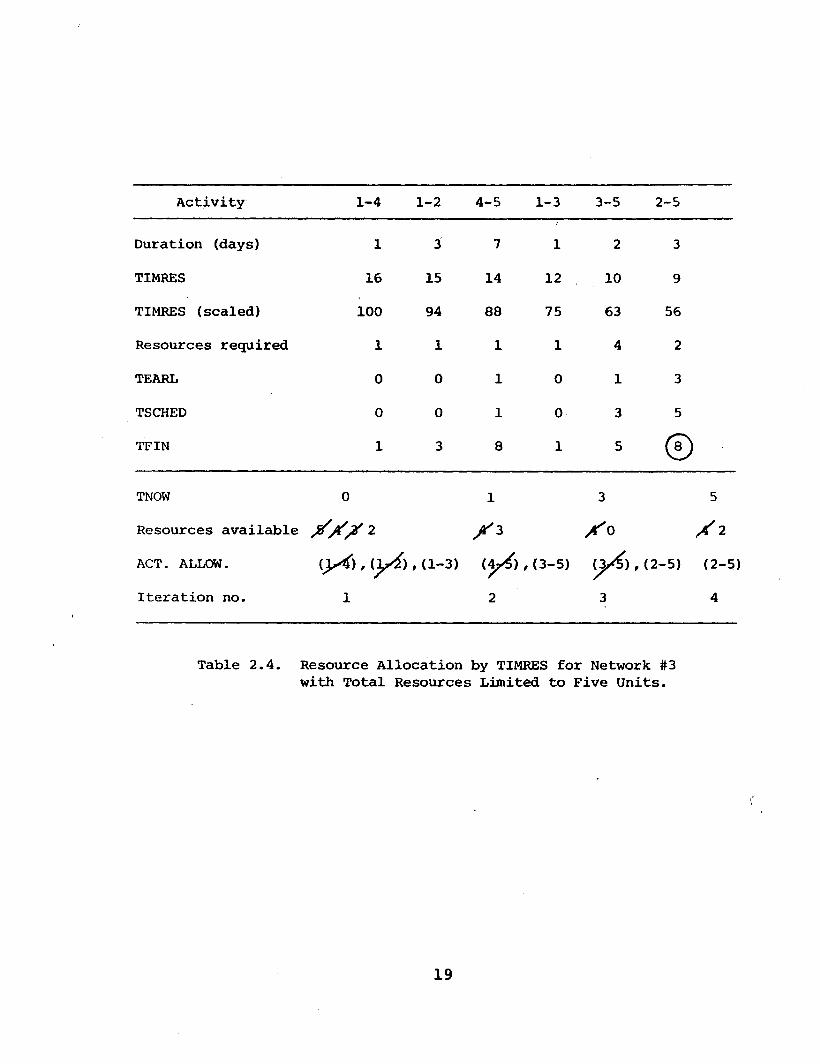
Activity 1-4 1-2 4-5 1-3 3-5 2-5
Duration (days) 1 3 7 1 2 3
TIMRES 16 15 14 12 10 9
TIMRES (scaled) 100 94 88 75 63 56
Resources required 1 1 1 1 4 2
TEARL 0 0 1 0 1 3
TSCHED 0 0 1 0 3 5
TFIN 1 3 8 1 5 © TNOW 0 13 5
Resources available XXX2 X3 X® X1
ACT. ALLOW. gX) , (3^) , d-3) (4^) , (3-5) (3^) , (2-5) (2-
Iteration no. 1 2 3 4
Table 2.4. Resource Allocation by TIMRES for Network #3 with Total Resources Limited to Five Units.
5)
19
2.4 A Modification of the TIMRES Criteria
Particularly for large networks, ACTIM, ACTRES and
TIMRES can each give a different activity sequence which
will result in three possible project schedules. The best
project schedule is chosen as the one resulting in the
least total project duration. The premise of this thesis
is that further project schedules can be generated using
combinations of ACTIM and ACTRES which are not equally
weighted. Various weightings would be tried and the best
project schedule is selected as before. This search
technique lends itself to computer application. Con-
sidering the decreasing cost of computer time, this extended
search appears feasible. For convenience the search model
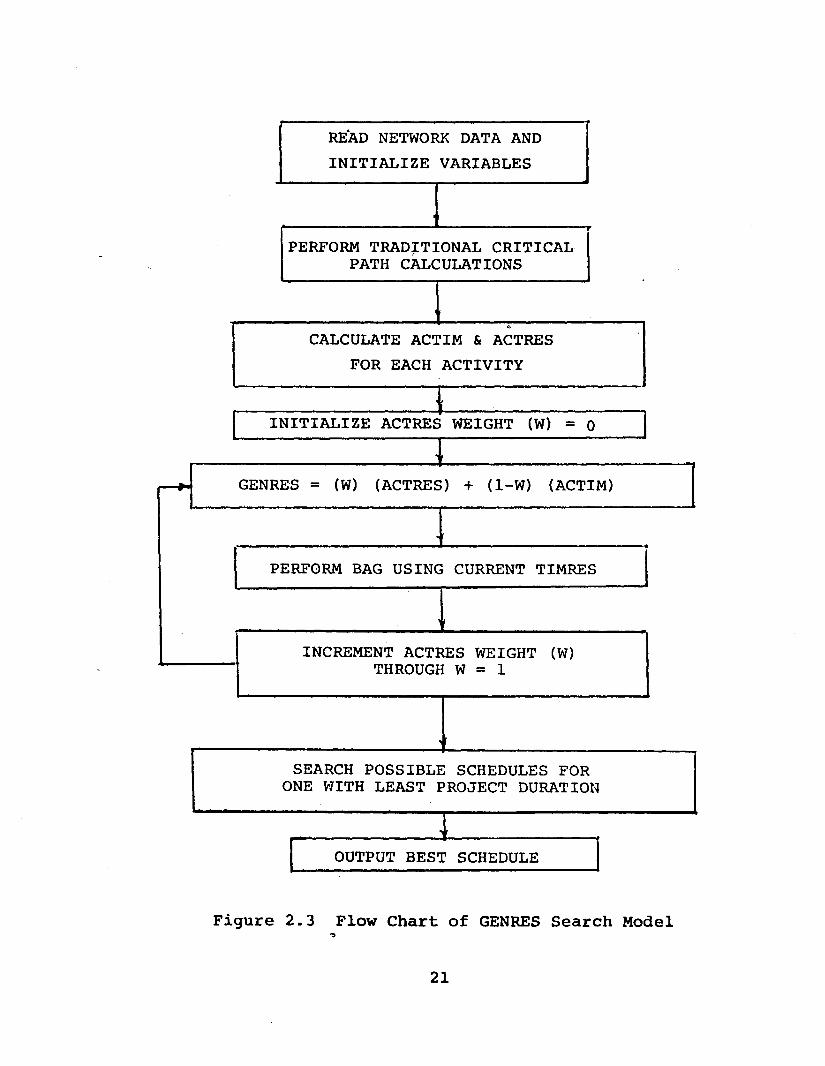
will be called GENRES. A flow chart" of the GENRES search
model is presented in Figure 2.3. A computer program was
constructed from this model.
2.5 Experimentation
Experimentation with the GENRES search model was per-
formed to determine if it does suggest a useful concept.
Sixteen different networks were used in the experimentation.
All of the networks were of the single resource, single
project category. Various levels of the constrained
resource were tested for each network. (For purposes of
brevity, the terms resources and men will be used inter-
changeably.) These levels ranged from the minimum resource
20
r READ NETWORK DATA AND
INITIALIZE VARIABLES
1
PERFORM TRADITIONAL CRITICAL PATH CALCULATIONS
1
CALCULATE ACTIM & ACTRES
FOR EACH ACTIVITY
I INITIALIZE ACTRES WEIGHT (W) = 0
I CTMBP5 — IW\ far-TTJTTC^ J. ( 1 -W\ lTi(-"VTM\
-1
PERFORM BAG USING CURRENT TIMRES
1 INCREMENT ACTRES WEIGHT (W)
THROUGH W = 1
• r
SEARCH POSSIBLE SCHEDULES FOR ONE WITH LEAST PROJECT DURATION
•> r
OUTPUT BEST SCHEDULE
Figure 2.3 Flow Chart of GENRES Search Model
21
level acceptable, i.e., the maximum number of resources
required by any one activity, to that level of resource
which allowed a project duration equal to the critical path
duration.
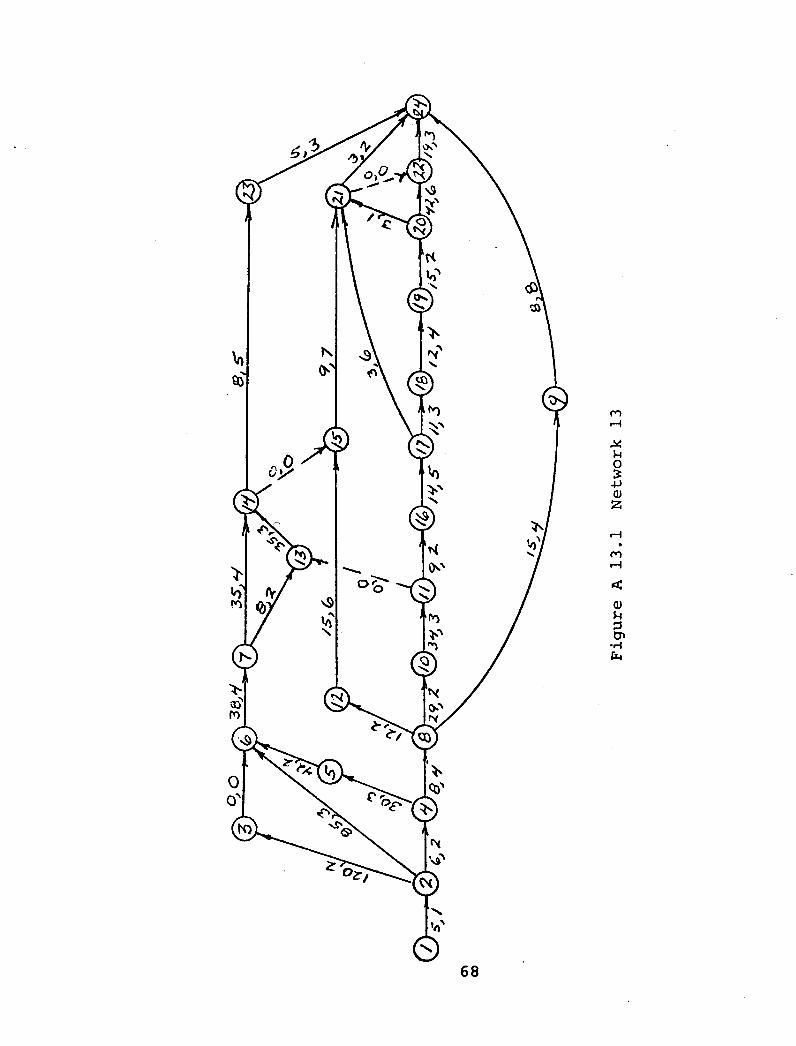
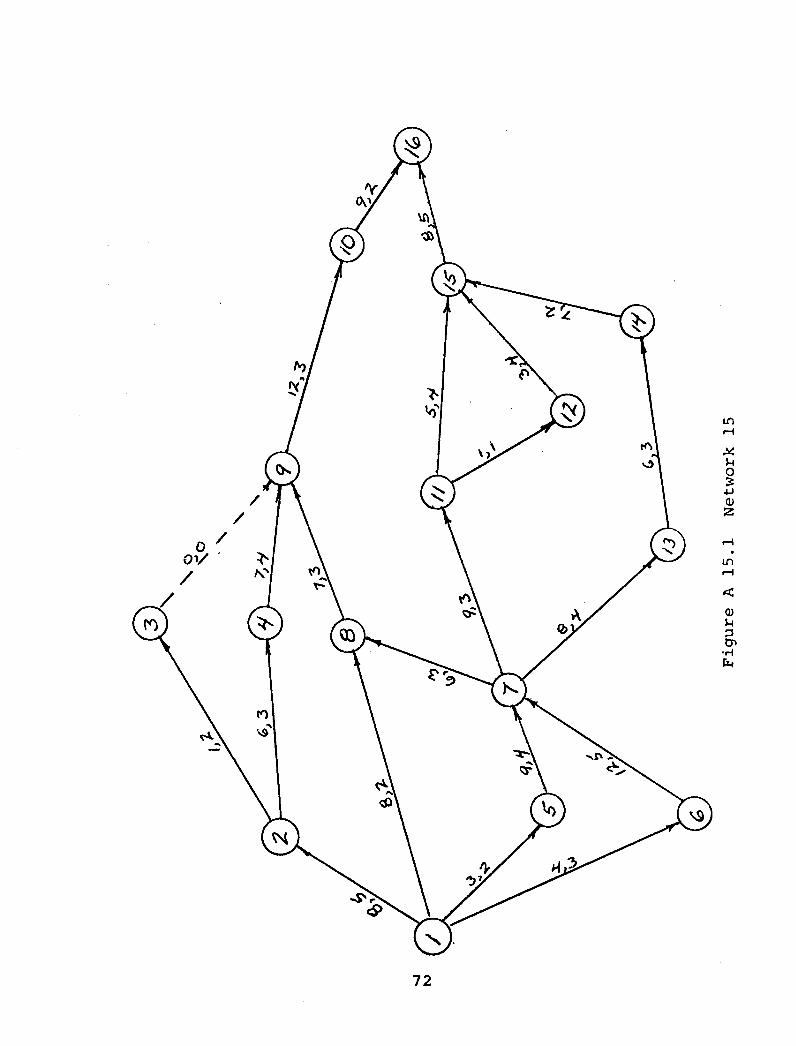
The sixteen networks are presented in Appendix A
together with their experimental results. The experimental
results consist of a plot of total project duration versus
ACTRES weight. The results are presented for various
levels of the constrained resource. The critical path
duration is also shown. These plots will be termed
"duration graphs", and will be repeated in the body when-
ever a specific example is cited.
For all of the networks, ACTRES weights were tried
at increments of 0.1. For certain networks smaller incre-
ments were also tried. These specific cases are discussed
in the next chapter.
f
CHAPTER 3
ANALYSIS OF RESULTS
This chapter discusses four selected networks. These
networks are representative of the studied networks and
are typical of the networks which lead to the conclusions
of Chapter 4. Other networks which exhibit similar
characteristics as these will be noted.
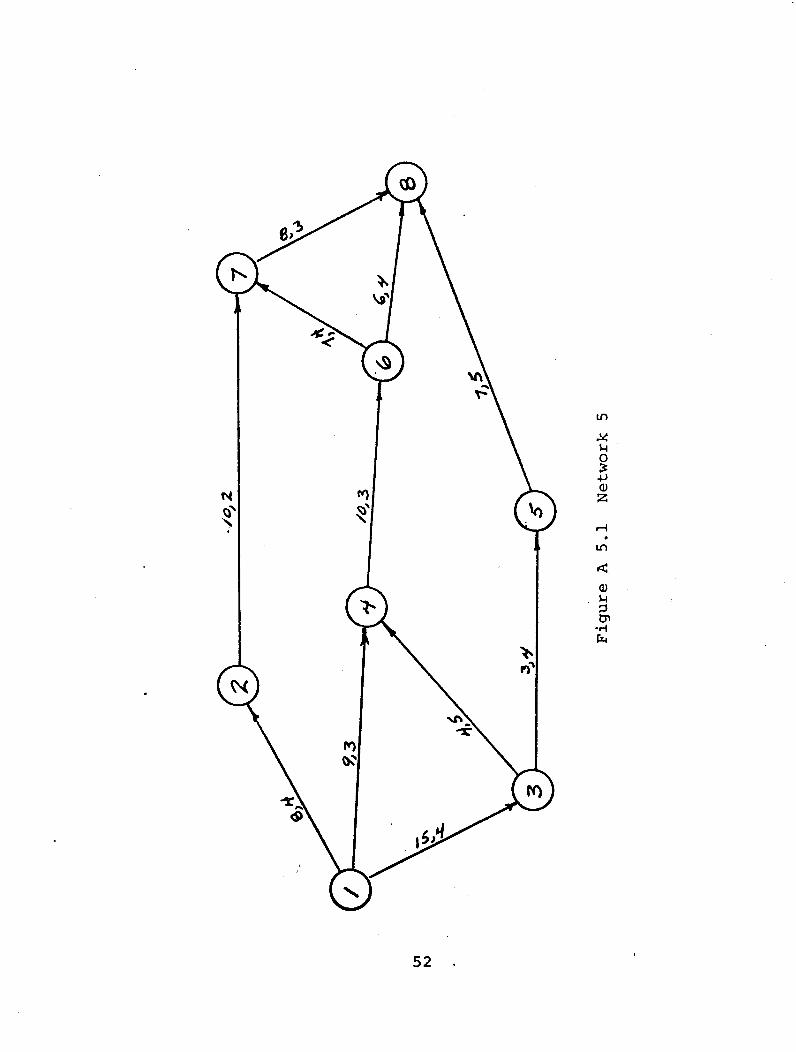
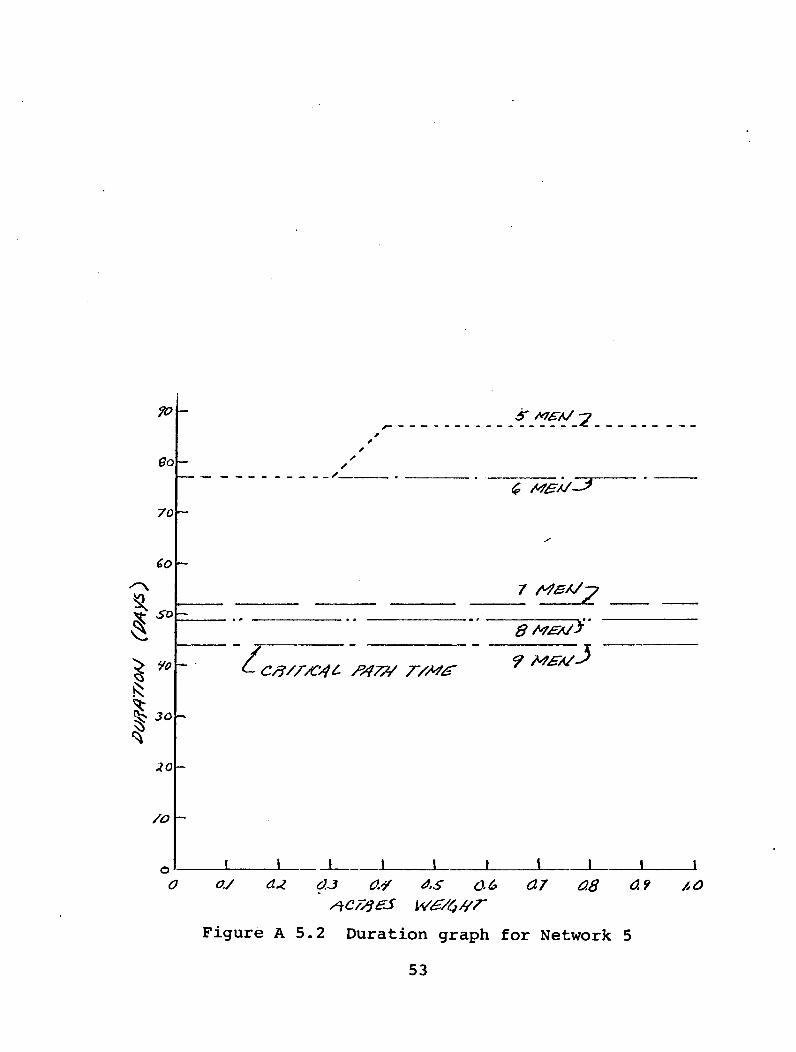
3.1 Network Number 5
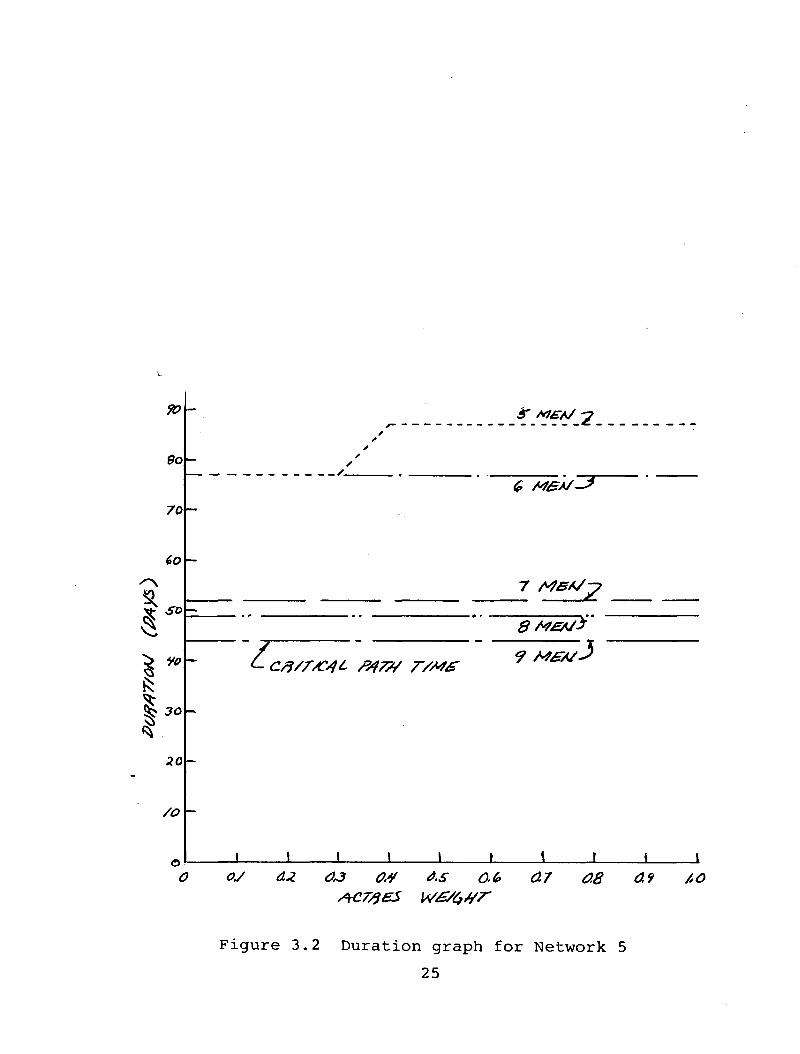
Figures 3.1 and 3.2 show Network Number 5 and its
resultant duration graph. For a resource level of 6, 1,
8 or 9 men the changing ACTRES weighting does not affect
the total project duration. However, for 5 men a change in
the ACTRES weight does cause a change in the project's
total duration. The ACTIM duration is 77 days while the
ACTRES and TIMRES (ACTRES weight of 0.5) duration is 87
days. Bedworth has suggested that if ACTIM is significantly
better than ACTRES, then TIMRES should automatically pick
it up. In this case ACTIM gives better than a 10% reduction
in total project time from ACTRES. This 10 day reduction
(2 work weeks) would be considered by many project managers
to be significant. However, the TIMRES did not pick it up.
The basic question here is how does one define a signifi-
cant difference in this context. Most projects modelled by
activity networks are one-time projects. Each network
model is unique. Any attempt to generalize about this
process appears dangerous. \ 23

in
M U O
+J (U S3
U
•H fa
24
fO-
eo-
70
60-
^P So
Vo-
20-
/O -
OS dl OJ 0.V <t.S 0.6
& M£fiJ -£ •
* •
£ M&A/-*
—
7 MB*/-> —
8M£A/5
9 M£A/J
-
t-cfi/r/c/ic &?7?/ r/M£-
-
1 » 1 1 1 \ \ 1 t 1 CX7 0.8 69 /'0
Figure 3.2 Duration graph for Network 5
25
Many of the studied networks indicate similar
characteristics. However, these are overshadowed by other
observations discussed below.
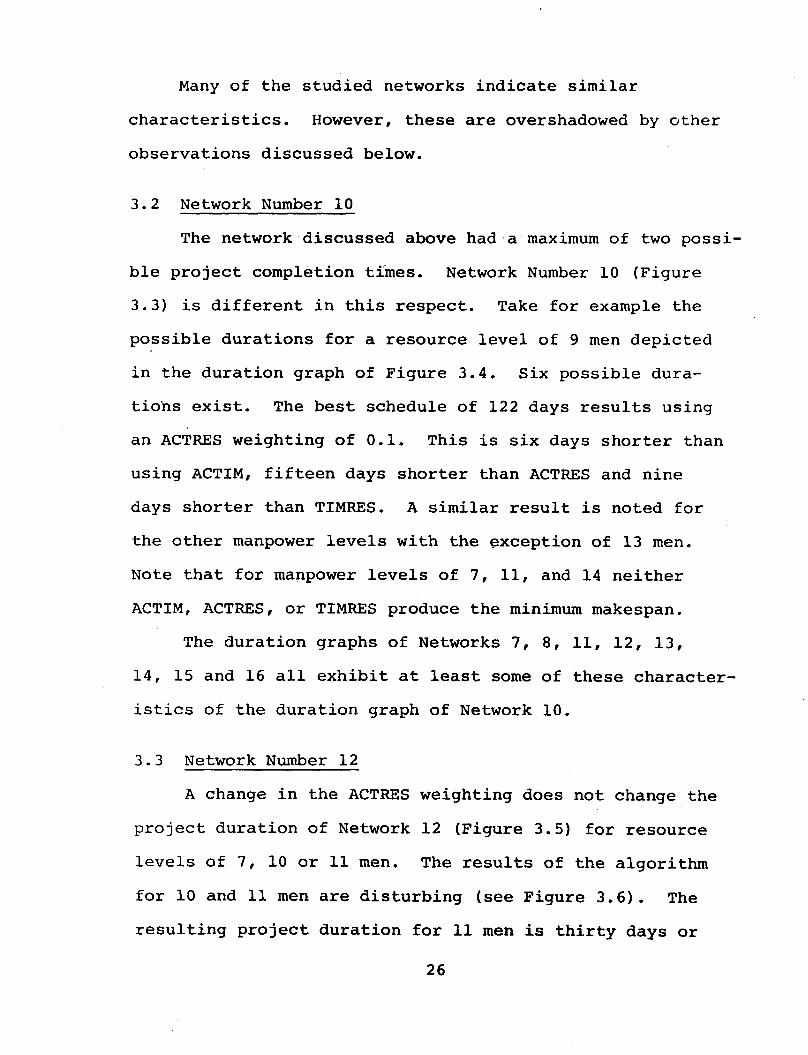
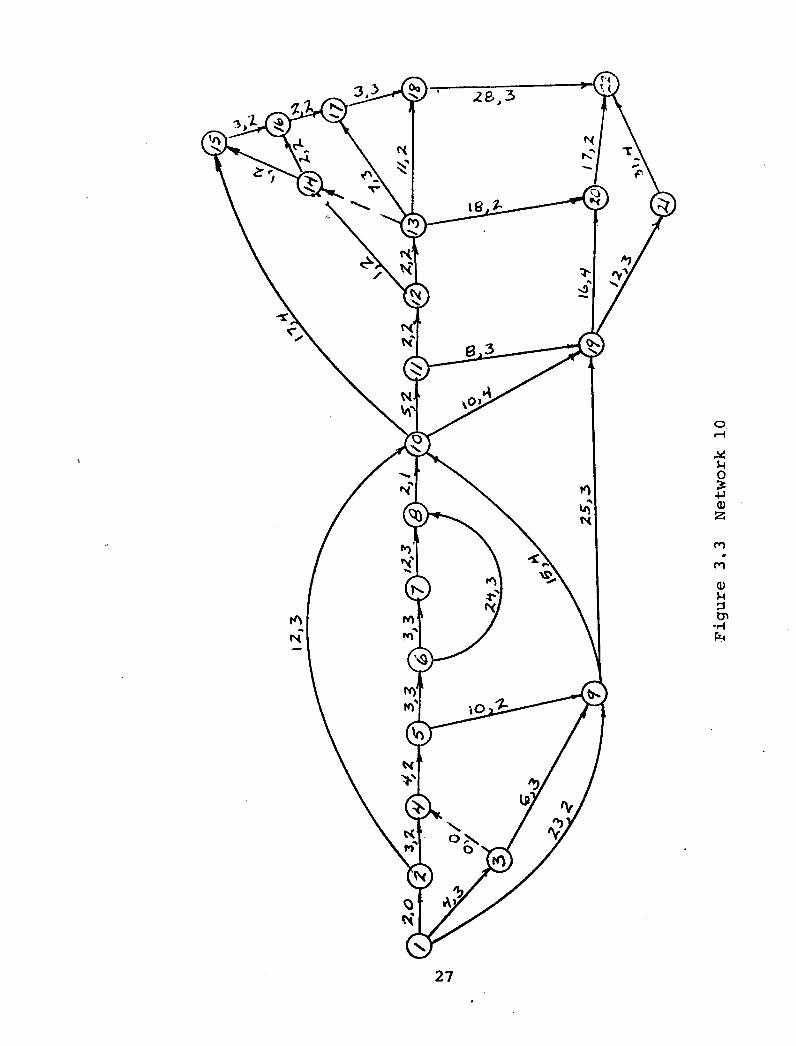
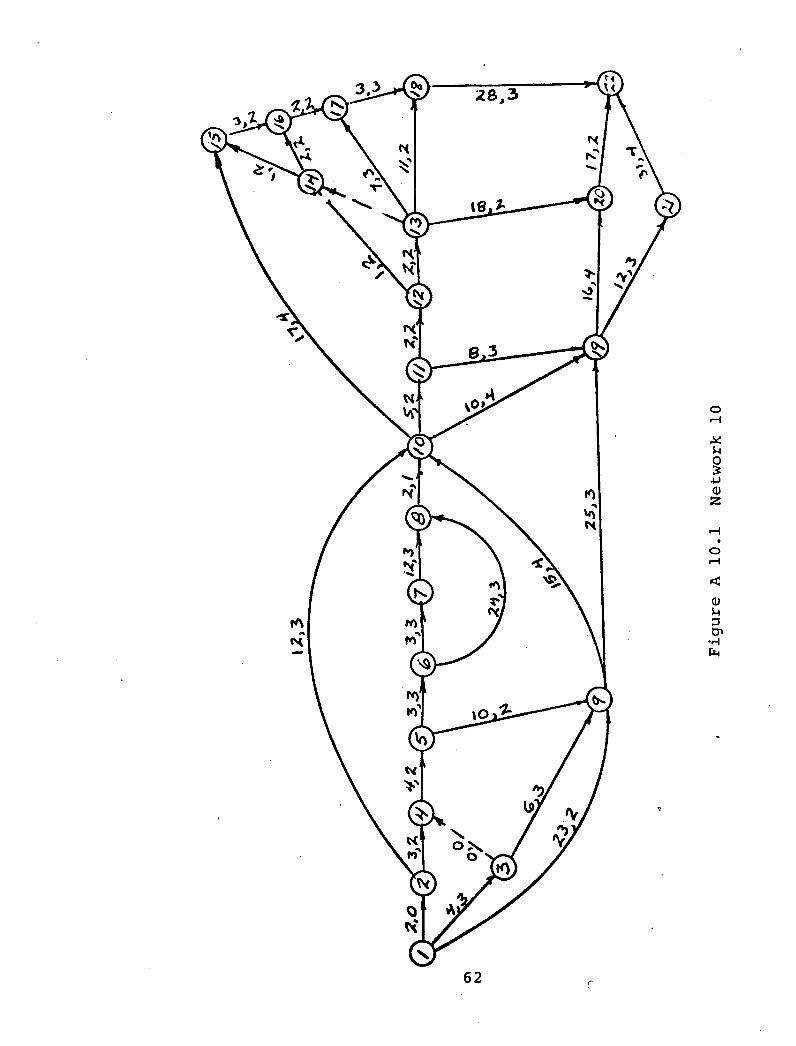
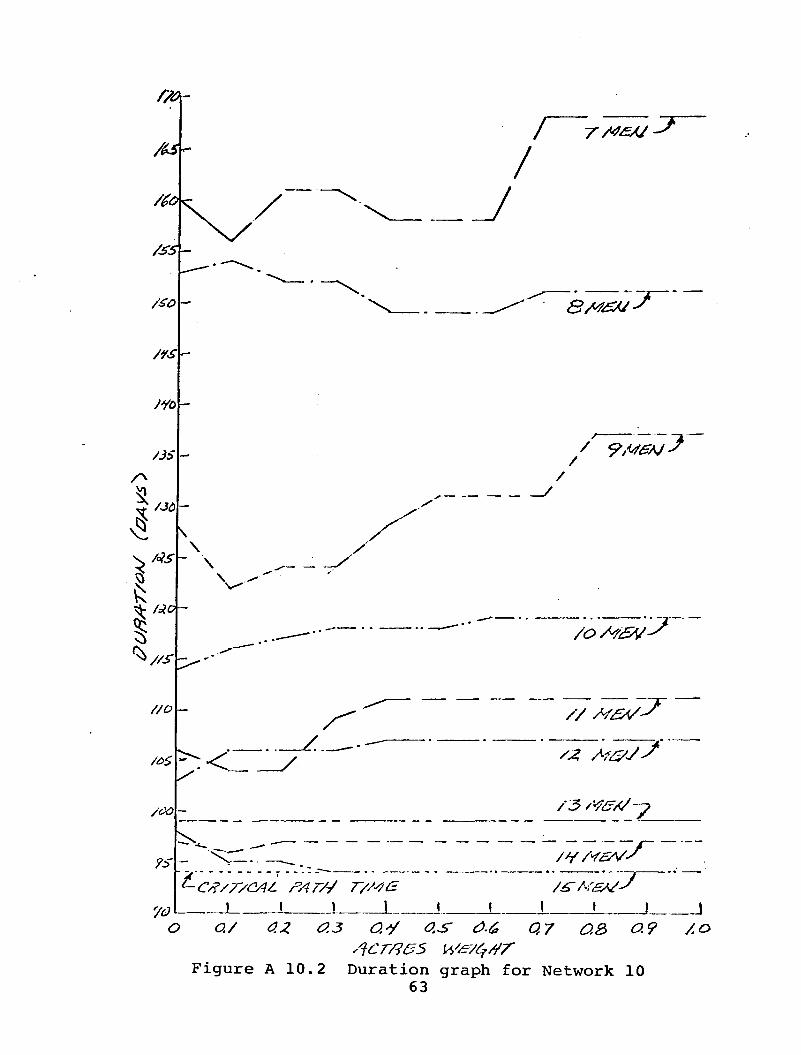
3.2 Network Number 10
The network discussed above had a maximum of two possi-
ble project completion times. Network Number 10 (Figure
3.3) is different in this respect. Take for example the
possible durations for a resource level of 9 men depicted
in the duration graph of Figure 3.4. Six possible dura-
tions exist. The best schedule of 122 days results using
an ACTRES weighting of 0.1. This is six days shorter than
using ACTIM, fifteen days shorter than ACTRES and nine
days shorter than TIMRES. A similar result is noted for
the other manpower levels with the exception of 13 men.
Note that for manpower levels of 7, 11, and 14 neither
ACTIM, ACTRES, or TIMRES produce the minimum makespan.
The duration graphs of Networks 7, 8, 11, 12, 13,
14, 15 and 16 all exhibit at least some of these character-
istics of the duration graph of Network 10.
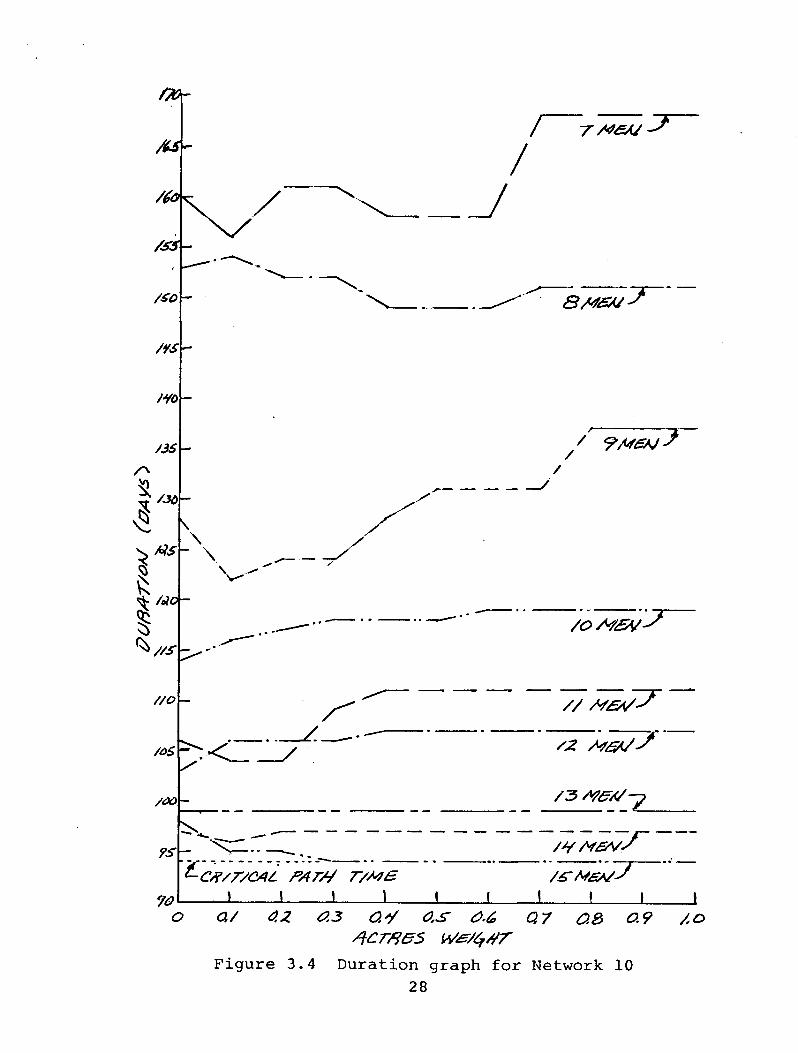
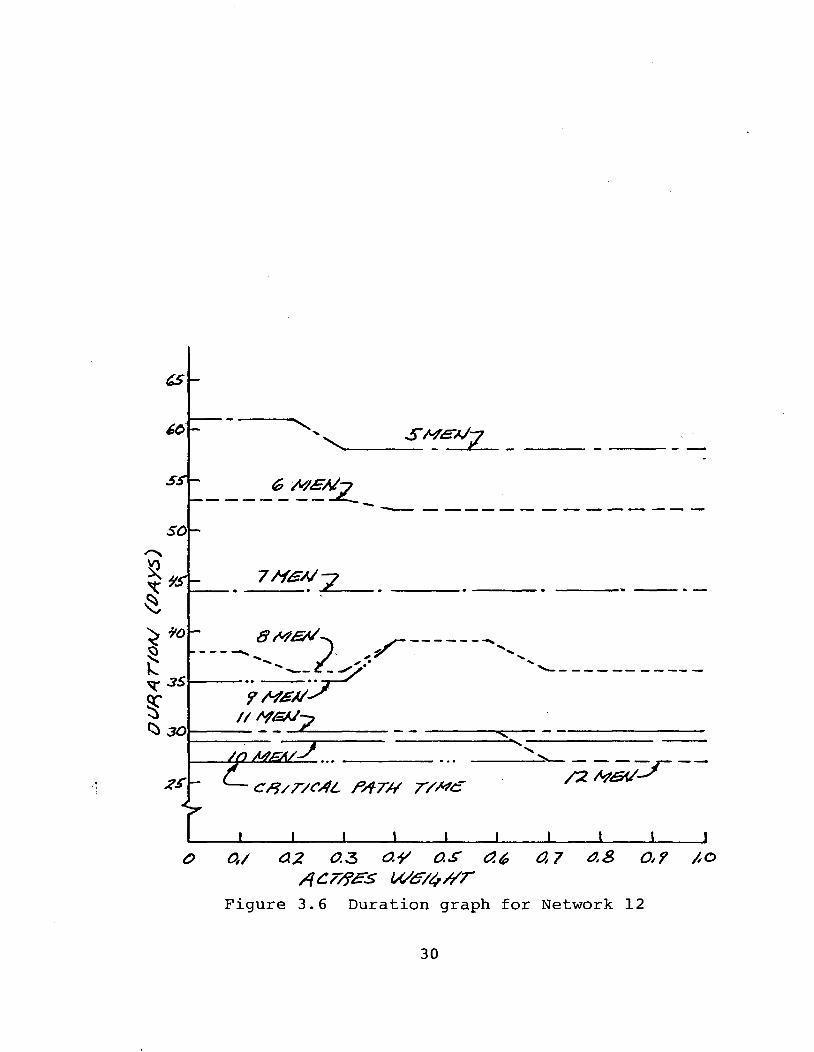
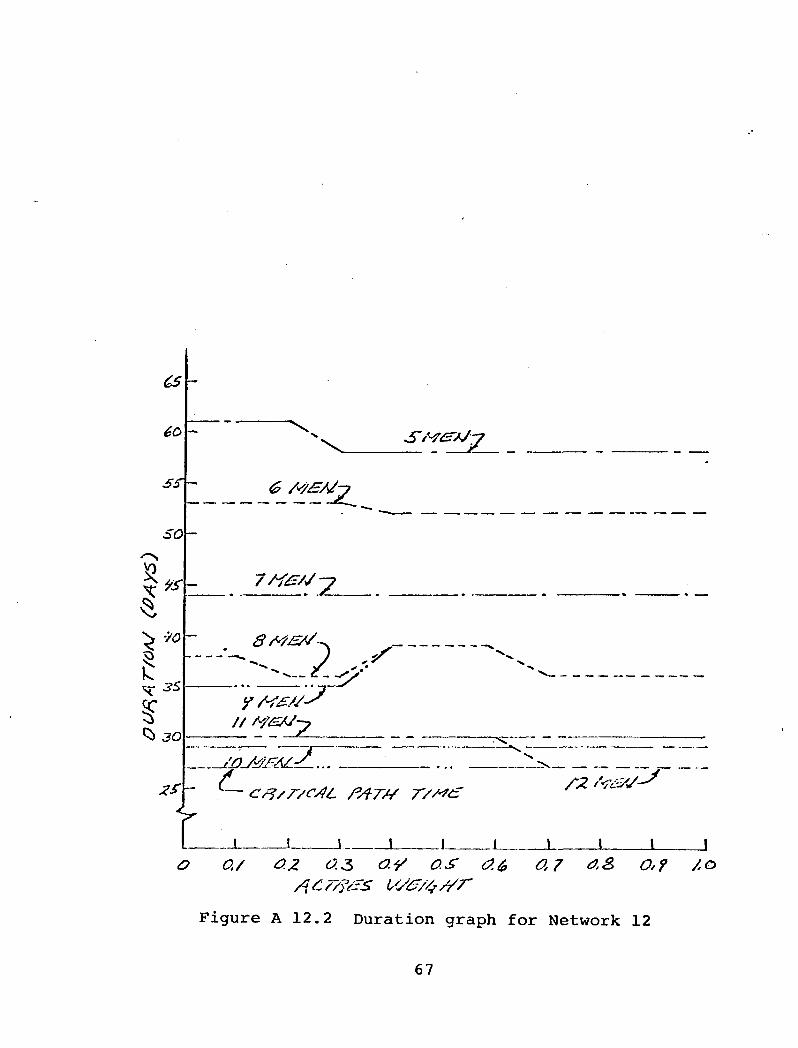
3.3 Network Number 12
A change in the ACTRES weighting does not change the
project duration of Network 12 (Figure 3.5) for resource
levels of 7, 10 or 11 men. The results of the algorithm
for 10 and 11 men are disturbing (see Figure 3.6). The
resulting project duration for 11 men is thirty days or
26
u o
<D M P
•H
27
/
F T/4&J JF
/£o
/ys
wo
/3S
/Jd
MS
^ /alO-
//o
\ \
/o$
/oo
7S-
70
^r.
■c/?/r/cA/- PAW r/Me t l i 1_ ±
SSdSZ/ ~J
/ ' 9M&J?
/
/OM3V ij"
// Mt '£*^F
SX /4&l/<S
/3 M&//y
/// Af&VS
J o a/ o.z 0.3 ay as &.6> Q7 a& 0.9 AO
Figure 3.4 Duration graph for Network 10 28
CN
u O -P
2
in
m
(U U
tn •H CM
66
^Z.-. SO
^ 3S
r -^.
S """^^_/^
^30 — ^ // /y<s*/--?
- c_ x^~ *-— <~#/r;r/l/ PSLTU T/Mtz /2/%SCr-
t _! I I 1 I I I I i 1 a/ &2 o.s o.y o.£ at, o,7 a& o,y /,o
Figure 3.6 Duration graph for Network 12
30

one day longer than that for 10 men. Normally, the decision
to add men to a project is made to reduce the project
duration. The Brooks' Algorithm does not produce this
result.
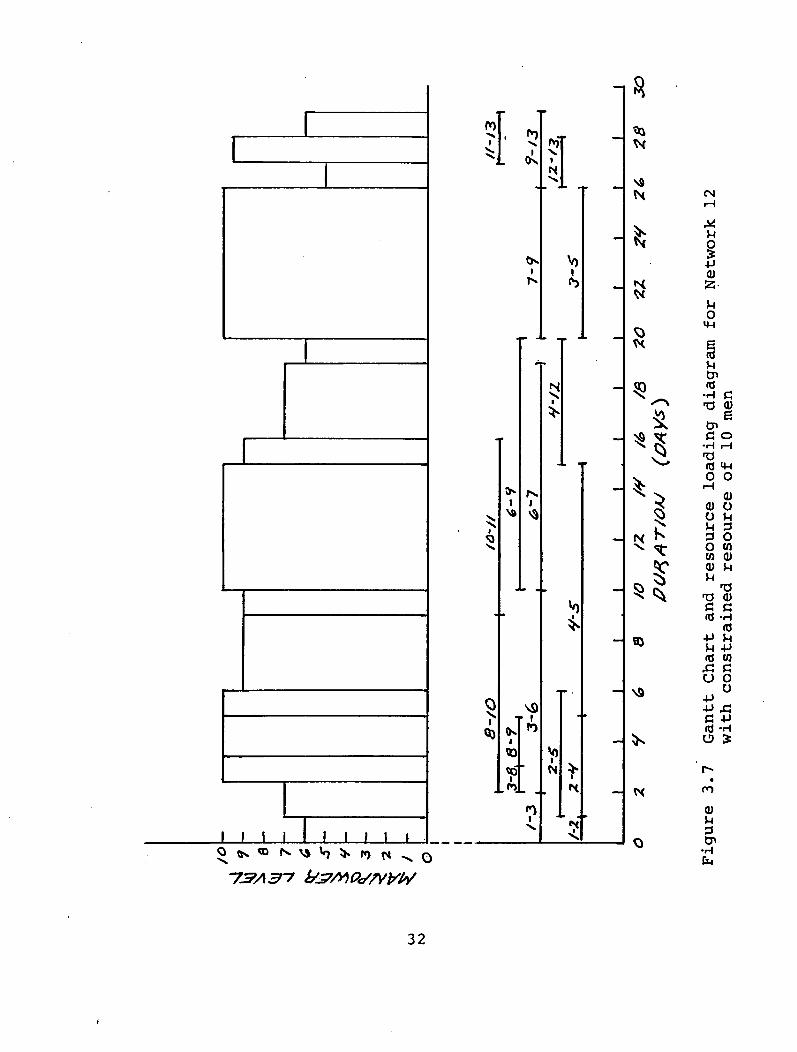
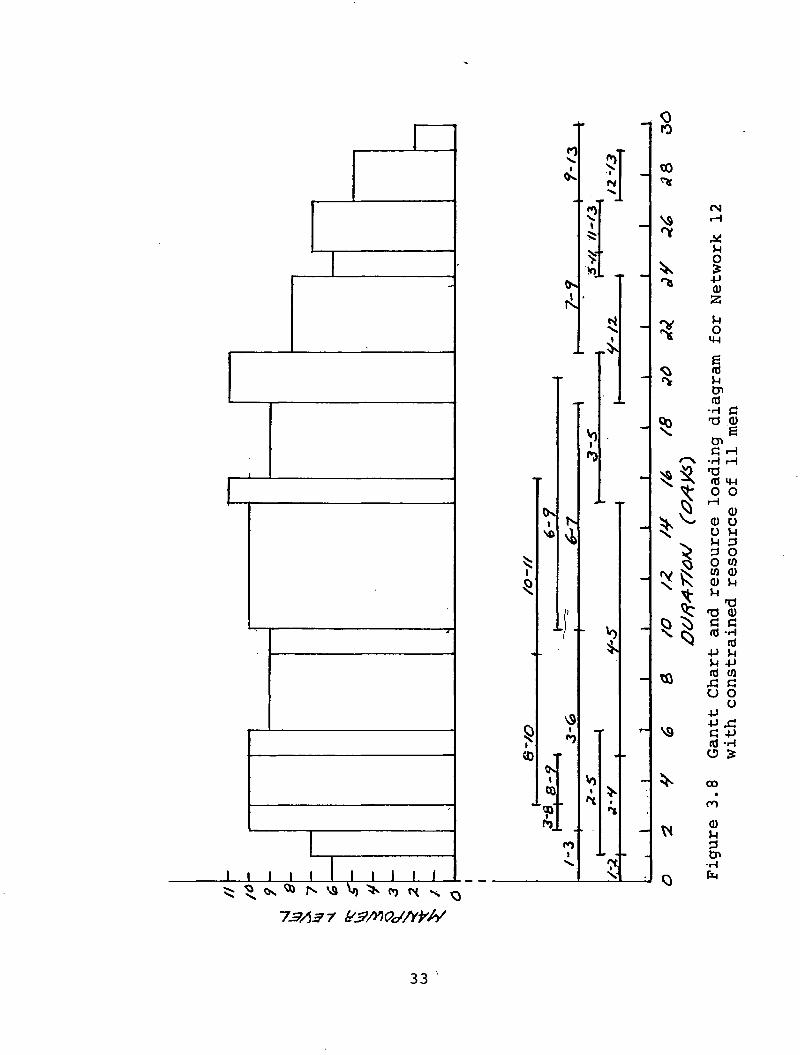
Examination of Figures 3.7 and 3.8 explains this dis-
turbance. The Gantt chart and resource loading diagram
for both 10 and 11 men are the same up until day 15. On
day 15 two activities may start. These are (3-5) and
(4-12), with 3-5 having higher priority. Six men are
already tied up on day 15 by activities (6-7), (6-9) and
(10-11). Therefore with 10 men only activity (4-12),
requiring 3 men versus the five required by (3-5), can
begin. However with 11 men activity (3-5) can begin.
The resulting resource loading diagram is different from
day 15 on for the two levels of constrained resource. For
the 10 men constraint the total labor force of 10 men is
utilized for 6 days (day 20 to day 26). The total labor
force of 11 men is utilized for only two days after day 15
(day 19 to day 21). In essence the resulting resource
utilization is poorer for the 11 men case than for that
of 10 men.
Similar observations were made for Networks 14, 15
and 16. An increase in the level of manpower resulted in
either no decrease in project duration or an increase such
as in Network 12. In all cases this occurred where the
duration was approaching the critical path duration.
31
I ' I I lilt
ro
i V) i
I
5 i
0)
\3 T I
z
T«
3 *T
..4, _ ^ N
^ ^
$
*3
QO
v3
r<
<N
U
§ -P
ss-
o
e «j n
•H c T3 0)
C o •H iH •a o o
<-{ CD
<a o o u
o CO CD
rO CD
<d G
•H (d
•P M U -P <d (0
u o o
■p •p .a C -P id -H u IS
n
a) u en
•H fa
32
J I I I I I I 1 I I
0 10
n _T V. ^
1 > cO &»
. = ' nc
"l CN v. t \a rH
^ nr M
^
U O
Ov oi a) ri. 2
- ^ ^ U o
MH . -^
g <a <d *> u
__ (0 ■H a
V) - ? ■a <u
e »*) C rH
r-\ ■H rH
T *t rd m I O O L _. rH
Ox \
so rce
urce
3 o ^ 5 o w i 5<fc W CD
\
£ n
If- -a
T3 CD
- »0 0
- *$
a c <d -H
td $» -P M
u -p S3
Cha
cons
\9 ■P •p x:
y VS c -P (d -H
<D <S
o £
« Vj ^ CO CO i ^ •
!\ t CO ?» t . MJ
■ - N f> 3 i Cn
N. ?\ •H V 0 P4
33
This suggests that the problem is one of resource leveling
rather than one of scheduling under resource constraints.
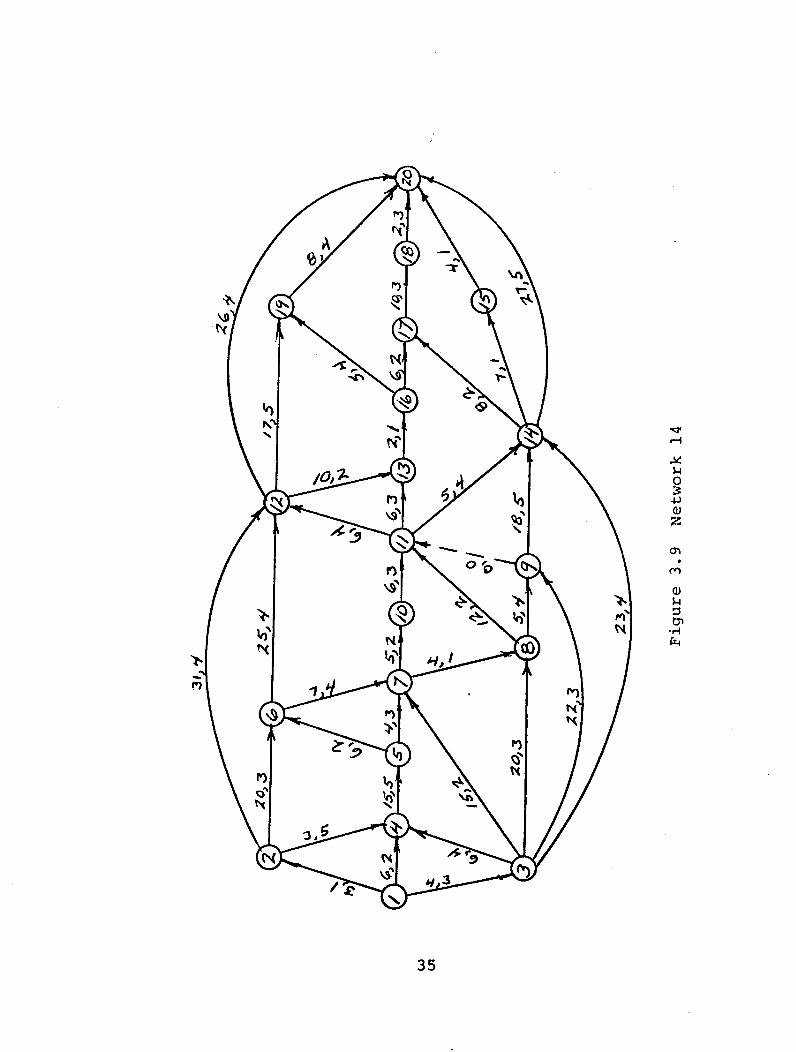
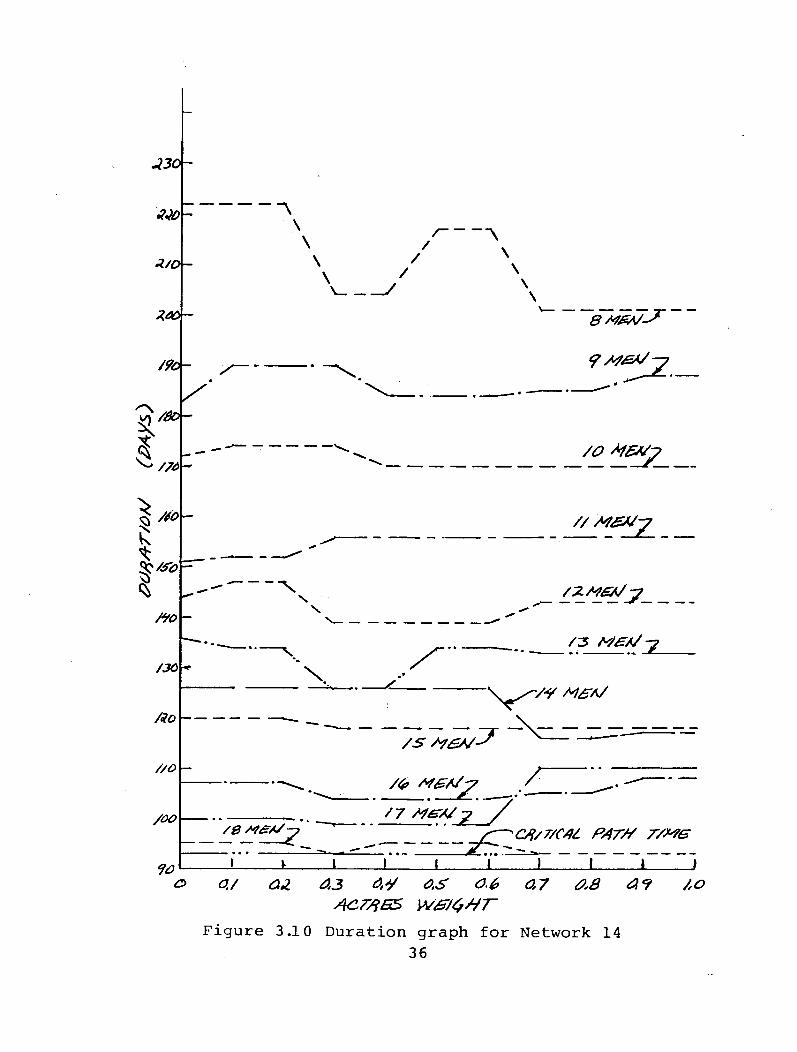
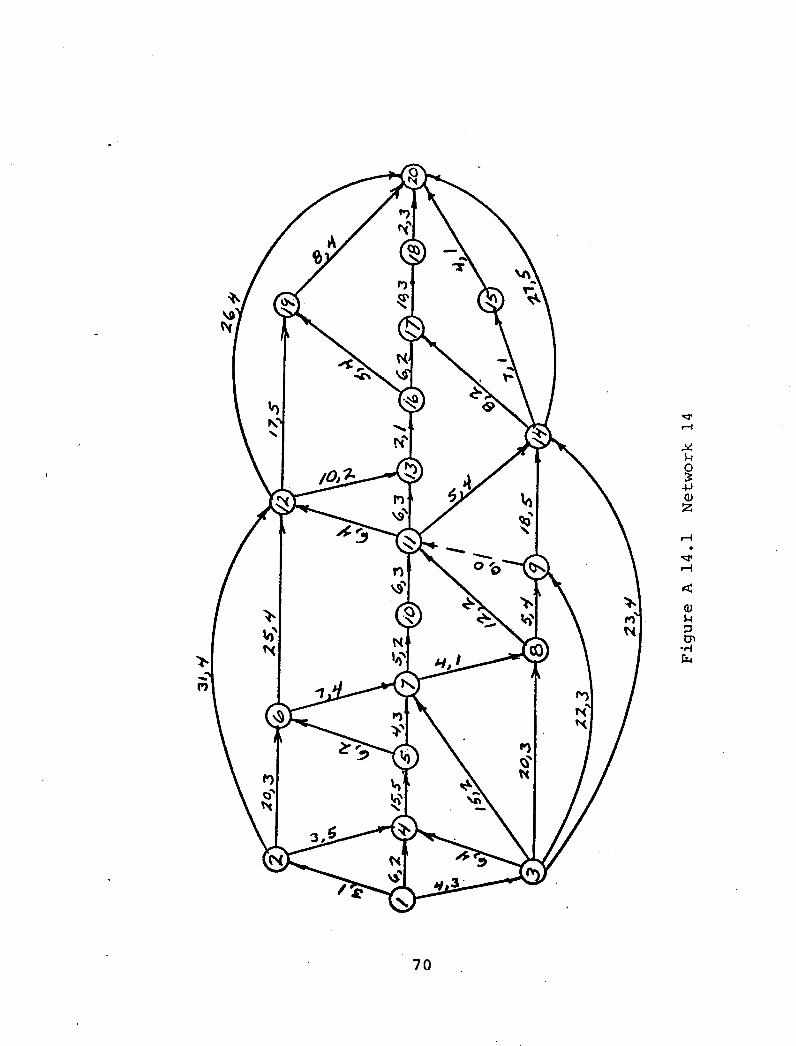
3.4 Network Number 14
The duration graph (Figure 3.10) for Network 14
(Figure 3.9) exhibits many of the characteristics already
discussed. Note that for each level of manpower the project
duration does not vary the same with ACTRES weighting.
For 8 men, there are two local maxima and two local minima.
For 9 men, there are also two local maxima and minima each.
However, these do not occur at the same ACTRES weighting.
Analysis of this and most of the other networks shows that
the best ACTRES weight, i.e., that which yields the least
project duration, can vary from resource level to resource
level for any given network.
The duration graphs presented in this thesis were
produced using 0.10 increments of ACTRES weight. The
GENRES search model was also used with ACTRES weight
increments of 0.05 and 0.01 for Networks 14 and 10.
These finer increments did not produce shorter schedules
for Network 10 at any resource level. Using increments of
0.05 did produce a shorter schedule for Network 14 at a
resource level of 10 men. At an ACTRES weight of 0.05,
the project duration was 171 in contrast with the least
project duration of 172 generated using 0.10 increments.
Using increments of 0.01 did not produce a further
34
u o -p
2
n
CD U D tn
•H
35
130-
\ /
/9o-
I
/JO
//O
/OO
\
\ \ \ \
f /t#£*/
/# ^^7
// M&J-7
"V. /3 M£t/•?
-/L.
/S M&S- -V--; .7"
/0we*/-? •• ^ ^^ >^C4/7/C/U. P4T// T/M£
-l 1 I ! I I I > ) £> a./ az 0,3 M 0,S o.£> 0,7 0.8 47 /,o
Figure 3.10 Duration graph for Network 14 36

reduction in the project duration. The conclusion to be
drawn by this is that the analyst using the model must
decide on the size of the increment in testing the
different ACTRES weightings.
C&
37
CHAPTER 4
CONCLUSIONS AND AREAS FOR FURTHER STUDY
4.1 Conclusions
The following conclusions can be drawn from the
research:
1. The GENRES search model is effective in finding
project schedules with a duration equal to or less than
that of ACTIM, ACTRES or the traditional TIMRES.
2. When the project completion time found by the
Brooks' Algorithm approaches the critical path time, resource
leveling procedures may be preferred.
3. The characteristics of the duration graph for a
given network can vary with resource level.
4. That the decision to use a particular size
increment to test the ACTRES weighting in the search model
must be based on the judgment of the network analyst.
4*2 Areas for Further Study
Three general areas for further study of the GENRES
search model exist. The first is mentioned in the con-
clusions; the adaptation of resource leveling techniques
when the project duration approaches the critical path
duration. This might involve setting further guidelines
for the network analyst.
The second general area is concerned with conclusion
number 4. Further study is required to establish guidelines
38
to help the analyst choose an appropriate increment for
the change in ACTRES weighting.
The other general area is the extension of this
technique to solve other problems of scheduling under
resource constraints. These include the multi-resource,
multi-project and combined multi-resource/multi-project
(3) cases. Bedworth discusses the use of BAG in the multi-
resource case but does not consider its use in the multi-
project case. In these cases different ACTRES weightings
could be used for each resource within each project.
Study in this area would require the preparation of guide-
lines to decide on how many combinations of these weightings
should be tried.
39
BIBLIOGRAPHY
1. Balas, Egon, "Project Scheduling with Resource Constraints," Applications of Mathematical Program- ming Techniques"E. M. L. Beale (ed.), London, England: The English Universities Press Ltd., 1970.
2. Battersby, Albert, Network Analysis for Planning and Scheduling, New York, N. Y.: St. Martin's Press, 1967.
3. Bedworth, David D., Industrial Systems: Planning, Analysis and Control, New York, N. Y.: The Ronald Press Co., 1973.
4. Bennington, G. E. and G. F. McGinnis, "A Critique of Project Planning with Constrained Resources," Proceedings of Symposium on the Theory of Scheduling and Its Applications, New York, N. Y., Springer- Verlag, 1973.
5. Conway, R. W. et. al., Theory of Scheduling, Reading Mass.: Addison-Wesley Publishing Co., 1967.
6. Davis, Edward W., "Networks: Resource Allocation," Journal of Industrial Engineering, April 1974, pp 22-32.
7. Davis, Edward W., (ed.) Project Management: Techniques Applications and Managerial Issues, Norcross, Georgia: American Institute of Industrial Engineers, 1976.
8. Davis, Edward W., "Project Scheduling under Resource Constraints - Historical Review and Categorization of Procedures," AIIE Transactions, December 1973.
9. Davis, Edward W., "Resource Allocation in Project Network Models - A Survey," Journal of Industrial Engineering, April 1966, pp 177-188.
10. Davis, Edward W. and George E. Heidorn, "An Algorithm for Optimal Project Scheduling under Multiple Resource Constraints," Management Science, August 1971, pp B-803-816.
11. Davis, Edward W. and James H. Patterson, "A Comparison of Heuristic and Optimum Solutions in Resource Constrained Project Scheduling, Management Science, April 1975, pp 944-955.
40

12. Fendley, Larry G., "The Development of a Complete Multiproject Scheduling System Using a Forecasting and Sequencing Technique," Proceedings of the 18th Annual A. I.I.E. Conference and Convention, Atlanta, Ga.: A.I.I.E., 1967.
13. Gillett, Billy E., Introduction to Operations Research A Computer-Oriented" Algorithmic Approach, New York, N. Y.: McGraw-Hill, Inc., 1976.
14. Gorenstein, Samuel, "An Algorithm for Project (Job) Sequencing with Resource Constraints," Operations Research, Jul-Aug 1972, pp 835-850.
15. Lambourn, S., "Resource Allocation and Multi-Project Scheduling (RAMPS) - A New Tool in Planning and Control," The Computer Journal, January 1963, pp 300- 304.
16. Lardi, Peter, "Project Planning in Pharmaceutical Research and Development with the Aid of the Critical Path Method," The Practical Application of Project Planning by Network Techniques, Vol. II, pp 207-218, Mars Ogander (ed.), INTERNET 72 Congress, New York, N. Y.: Halsted Press, 1972.
17. Lockyer, K. G., An Introduction to Critical Path Analysis, New York, N. Y.: Pitman Publishing Corp., 1969.
18. Maggard, Michael J. et. al., "Network Analysis with GERTS III QR," Journal of Industrial Engineering, May 1974, pp 24-29.
19. Martino, R. L., Project Management and Control: Vol. Ill, Allocating and Scheduling Resources,~~ New York, N. Y.: American Management Association, 1965.
20. Moder, Joseph J. and Cecil R. Phillips, Project Management with CPM and PERT, New York, N. Y.: Van Nostrand Remhold Co., 1970.
21. Moshman, J. et. al., "RAMPS - A Technique for Resource Allocation and Multi-Project Scheduling," Proceedings, 1963 Spring Joint Computer Conference, Baltimore, Md.: Spartan Books, Inc., 1963.
22. Muth, John F. and Gerald L. Thompson, Industrial Scheduling, Englewood Cliffs, N. J.: Prentice Hall, Inc., 1963.
41
23. O'Brien, J. J. (ed.), Scheduling Handbook, New York, N. Y.: McGraw-Hill Book Co., 1969.
24. Patterson, James H., "Alternate Methods of Project Scheduling with Limited Resources," Naval Research Logistics Quarterly, December 1973, pp 767-784.
25. Pritsker, A. Alan B. et. al., "Multiproject Scheduling with Limited Resources: A Zero-One Programming Approach," Management Science, Sept. 1969, pp 93-108.
26. Schrage, Linus, "Solving Resource-Constrained Network Problems by Implicit Enumeration - Non-preemptive Case," Operations Research, March-April 1970, pp 263-278.
27. Schrage, Linus, "Solving Resource-Constrained Network Problems by Implicit Enumeration - Preemptive Case," Operations Research, May-June 1972, pp 668-677.
28. Shaffer, L. R. et. al., The Critical Path Method, New York, N. Y.: McGraw-Hill, Inc., 1964.
29. Whitehouse, Gary E., Info-Cision - A Network Technique for Analyzing Decision Systems, Bethlehem, Pa., Department of Industrial Engineering, Lehigh University, 1972.
30. Whitehouse, Gary E., Systems Analysis and Design Using Network Techniques, Englewood Cliffs, N. J.: Prentice Hall, Inc., 1973.
31. Wiest, J. D., "A Heuristic Model for Scheduling Large Projects with Limited Resources," Management Science, Feb. 1967, pp B-359-377.
32. Wiest, J. D., "Some Properties of Schedules for Large Projects with Limited Resources," Operations Research, May-June 1964, pp 395-418.
33. Woodgate, H. S., "Planning Networks and Resource Allocation," Datamation, Jan. 1968, pp 36-43.
42

Appendix A
43
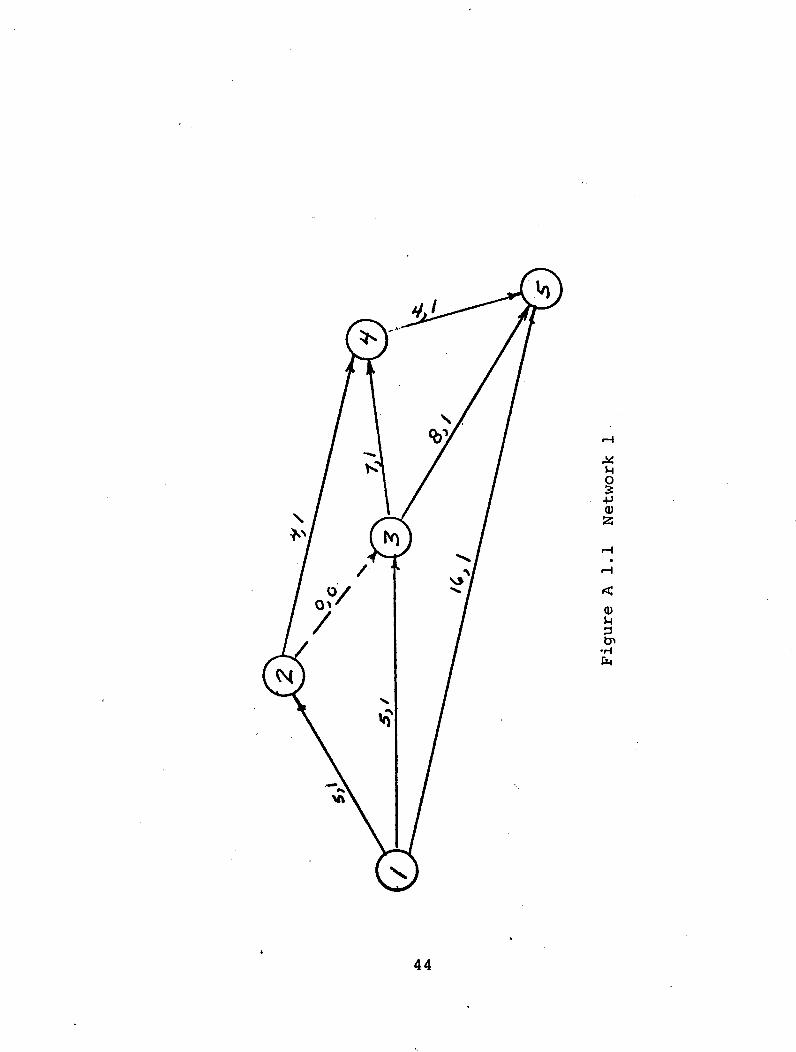
u o -p
53
fa
44
to
ss
so
4S
1- <£ IS
20
/s
/o
/ /**//-*
Z.A4BA/ 1JL
J I ! I ! I'll
c o,/ ai 0.3 av AS <X6 G7 O.8 0.9 /o
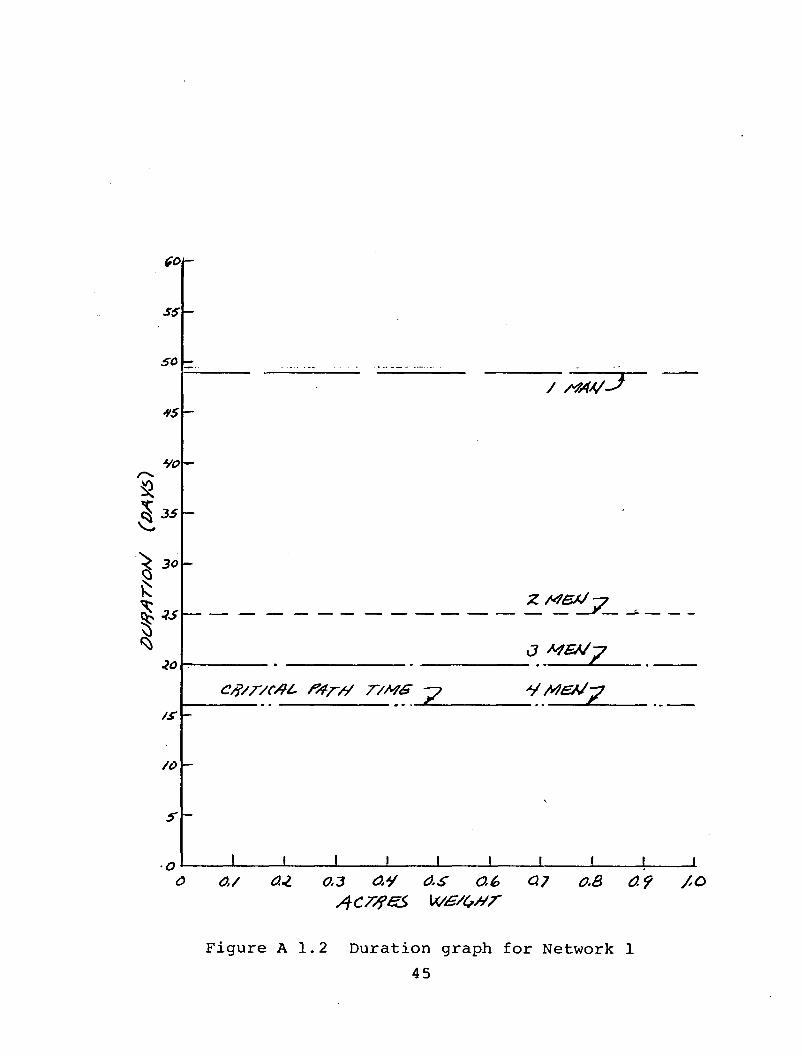
Figure A 1.2 Duration graph for Network 1
45
CM
M U
s -p <D 2
CM
<
^l 3 On
•H
46
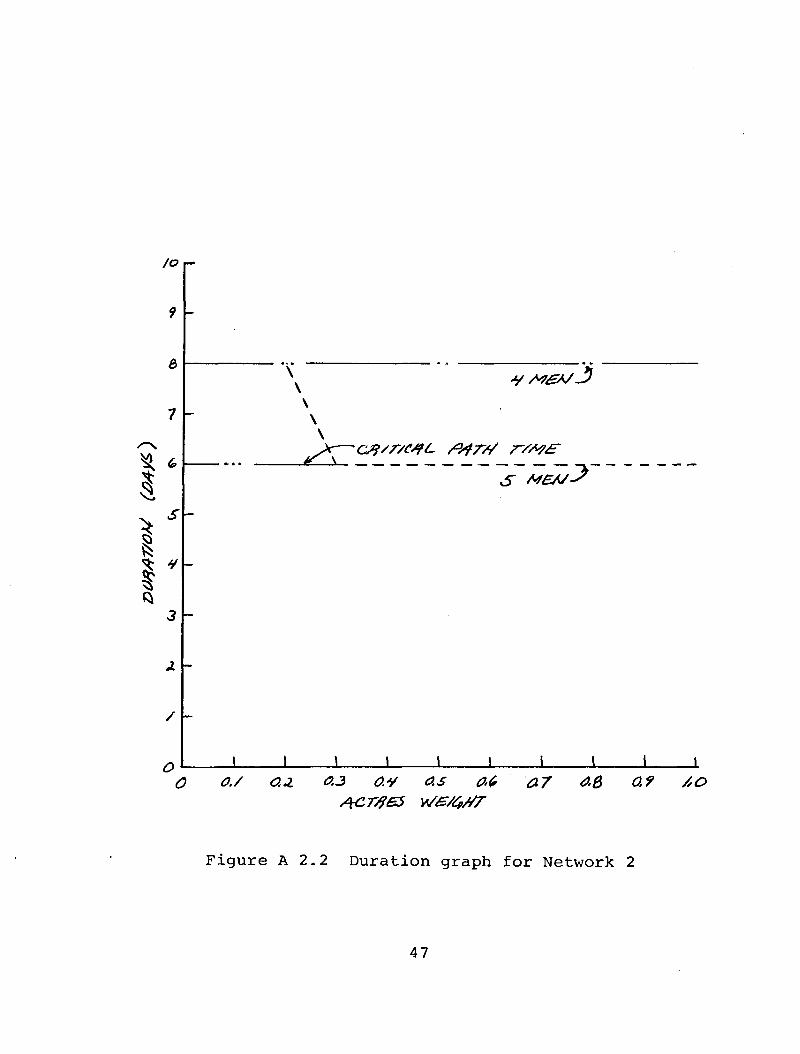
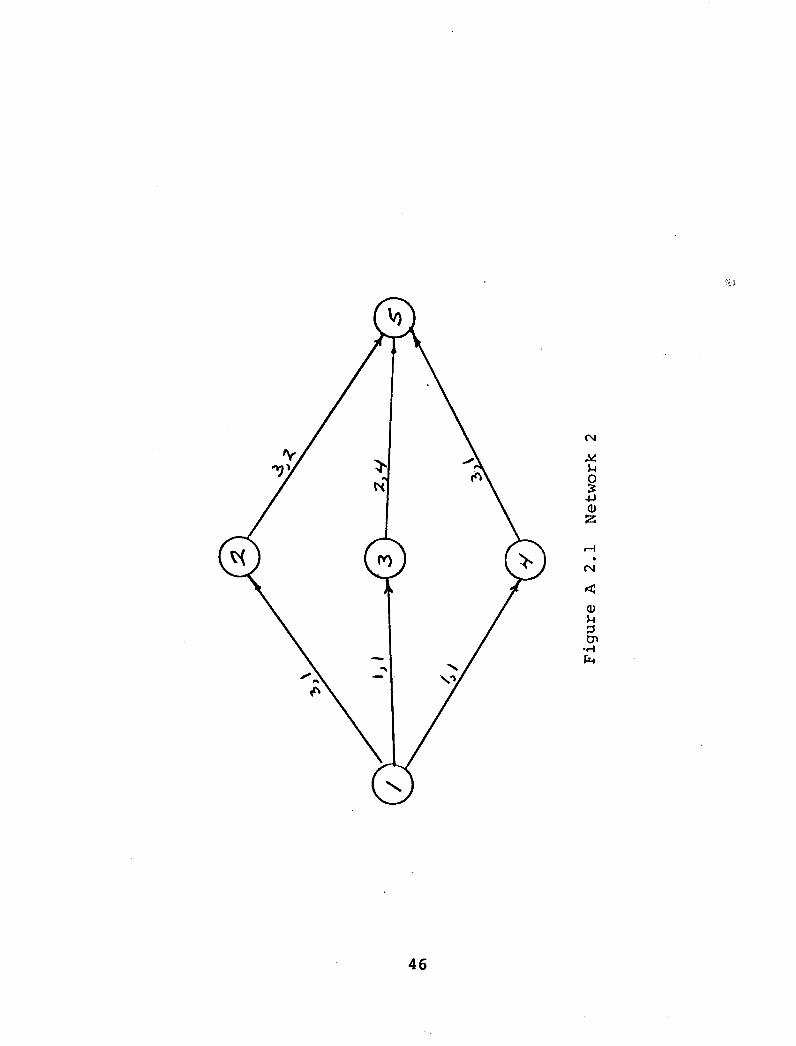
/o
6
V r
/ -
\ \ \
S MEM-
J I ! I 1 L C o./ aj. 0.3 o.¥ o.s at a7 0>8 o.f /,o
Figure A 2.2 Duration graph for Network 2
47
CO
X U
s -p (U 5S
n
•H CM
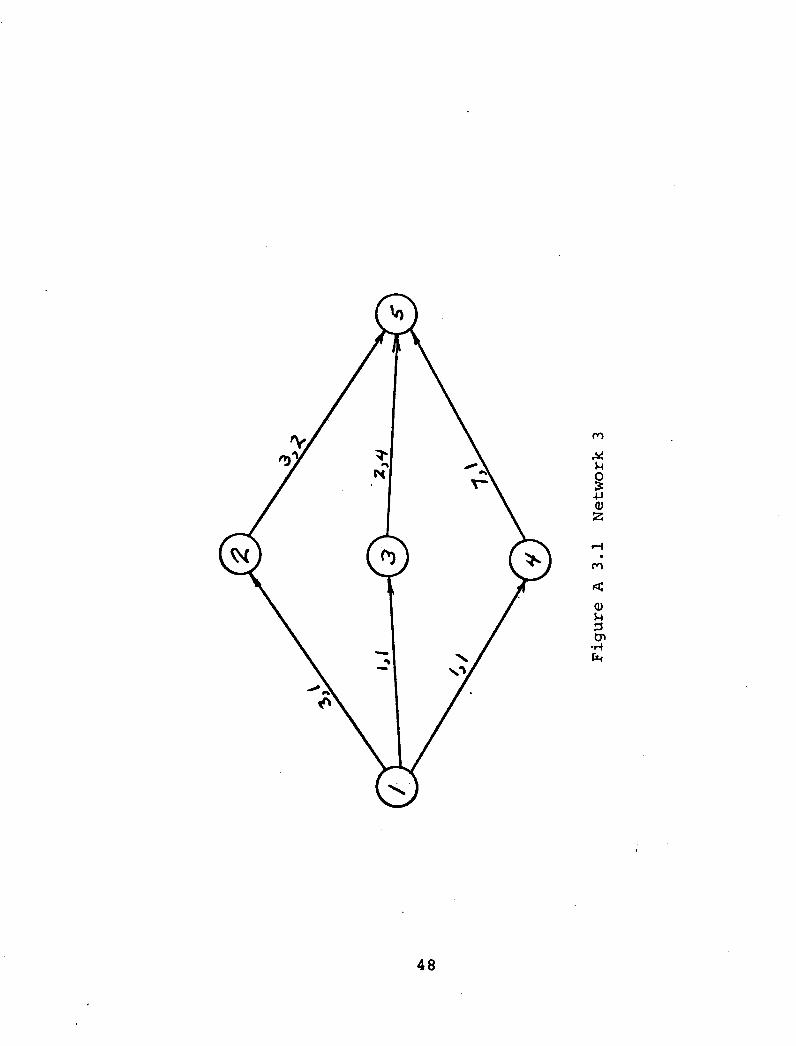
48
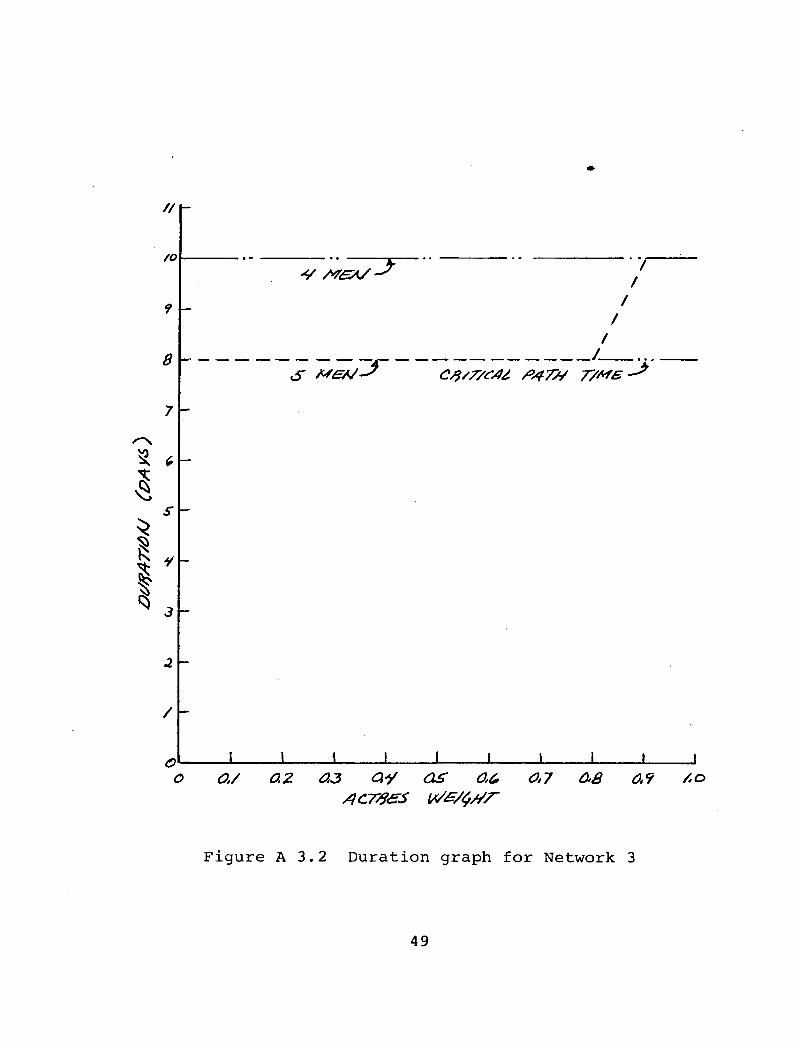
//I-
/o
8
I s
I .2 -
/ ~
<</ MSA/- ~J r
/ /
/ /
J 1 1 I I I 1 I 1 I o ot/ o.2 £3 ay as ac 0,7 o>8 0.9 /<&
Figure A 3.2 Duration graph for Network 3
49
u o
f-\
u
•H p4
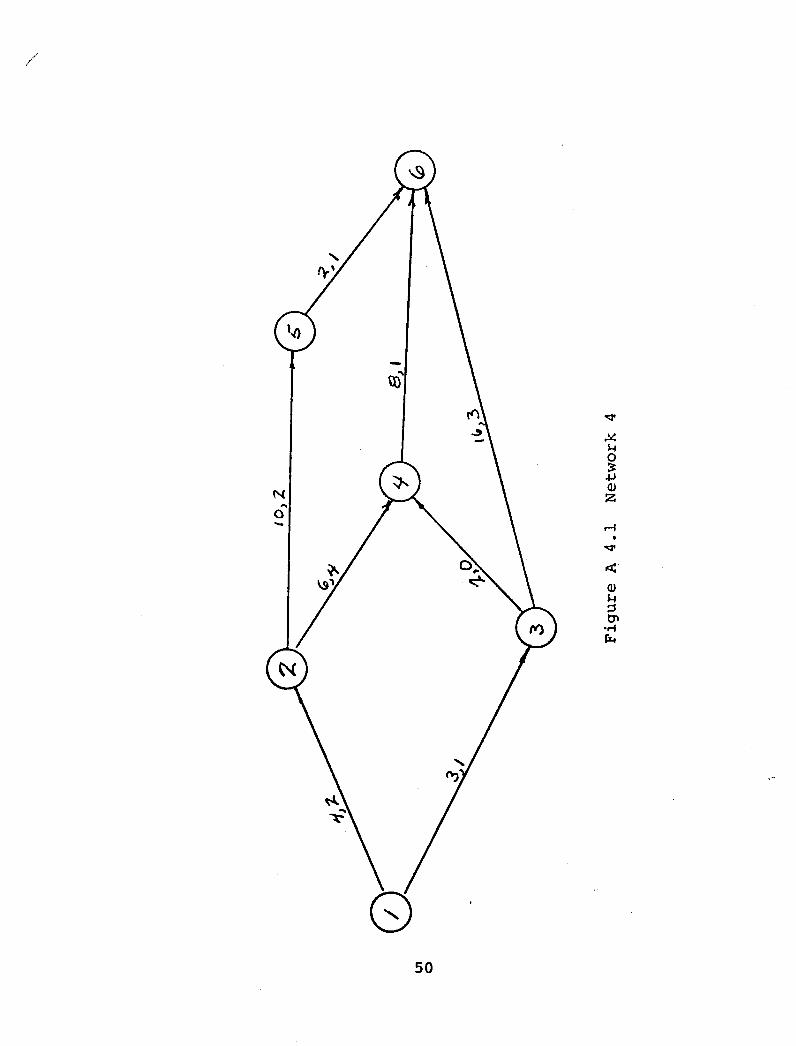
50
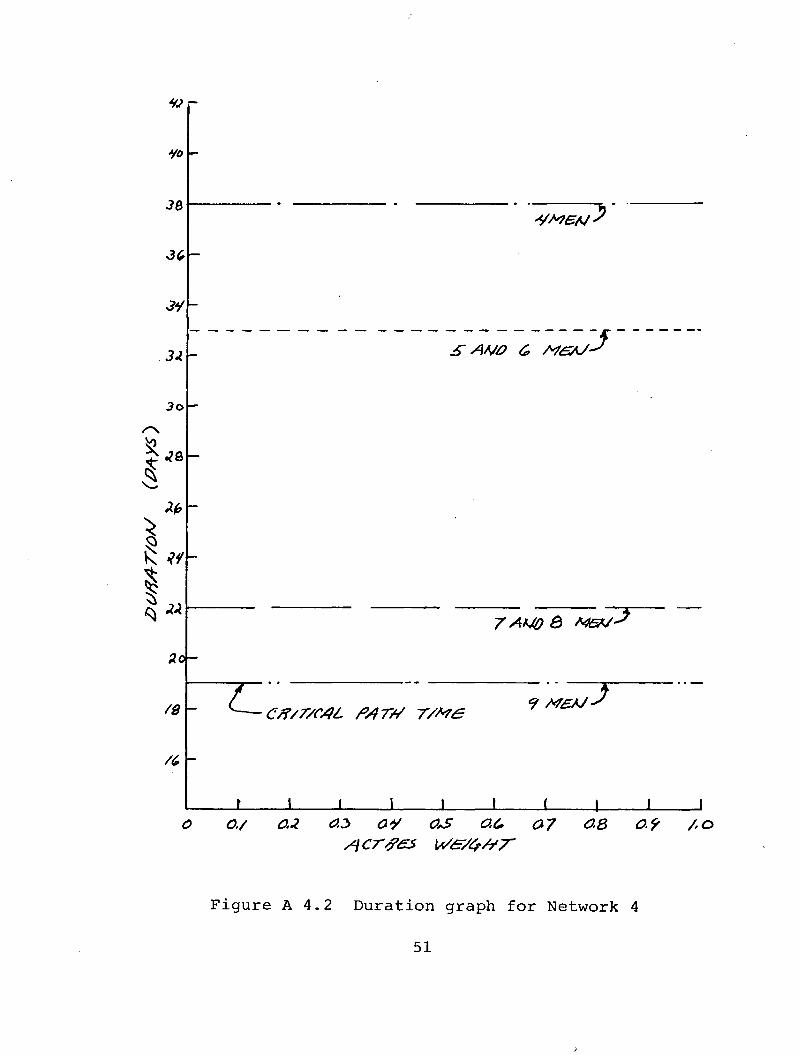
w-
w
3d
3G
3V
<</MeH ~>
3iL SAW 6 M&J-J
3o
s
X L, . r M _ _
7 AKJQ & M5fi/~
_^_
'*\- ^—c/r/r/c/)/, />AT// T/MG 9 Ma/J
i 1 i l I i i i i i a/ o.i as a* o*s ac a7 &8 o? /o
Figure A 4.2 Duration graph for Network 4
51
in
U o •p <u 53
IT)
< <D U 3 Cn
•H
52
?o
eo
70
60
^ So
2.0
/O
o
s s
/
CS/7/C4C &?7?/ r/M&
S~ Ms:*/ ~g
£ MZA/^-J
M5*S-7
8 M&J$
/ 9 M£A/J
J i I J J I i I 1 1 O o./ dj. dJ 0.¥ AS 6-6 d7 0.8 d9 /„0
Aeries w£/(j//r Figure A 5.2 Duration graph for Network 5
53
M U O -P
<
U 3
54
2t
22
Zo
/e
f
7
Q 8
6 -
y-
<3
3 A*5*/ T
J I I 1 I I <? a/ az aj ay o.s o>(> 0,7 o.& a? /o
4 c 7-/1 &s W&/4//T
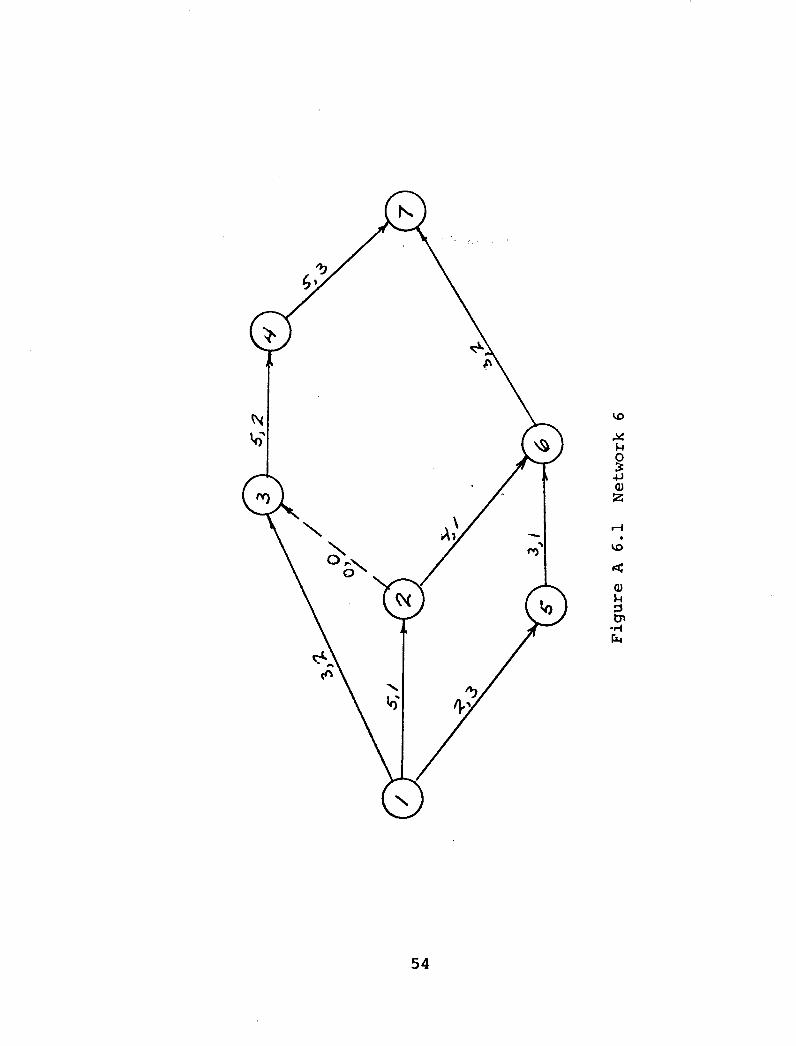
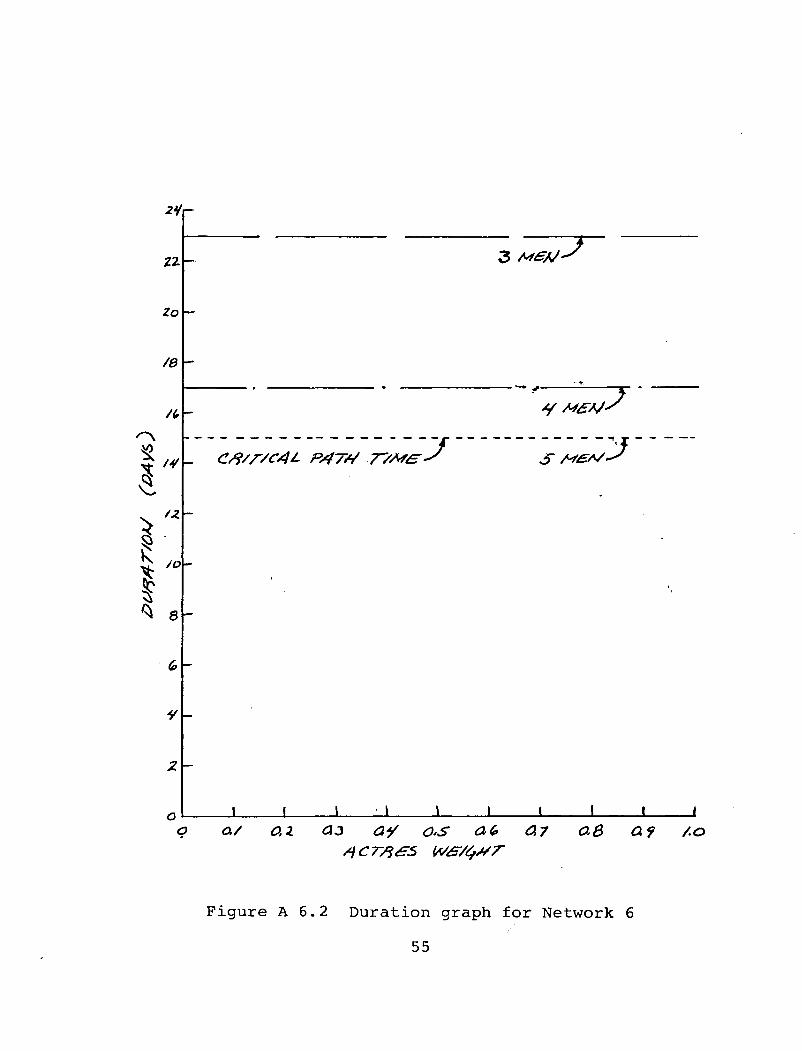
Figure A 6.2 Duration graph for Network 6
55
o -p
53
•H
56
\ \
30-
2S
so
1" 5 /O
s -
\ 5AUO 6 tytzt/
/ 7 M£*/S
r /
8 M£/j3 ■\
I 1 1 I I I ! ! I I
0./ O.Z 0,3 4V O.S d6 47 Q2> Q7 AC
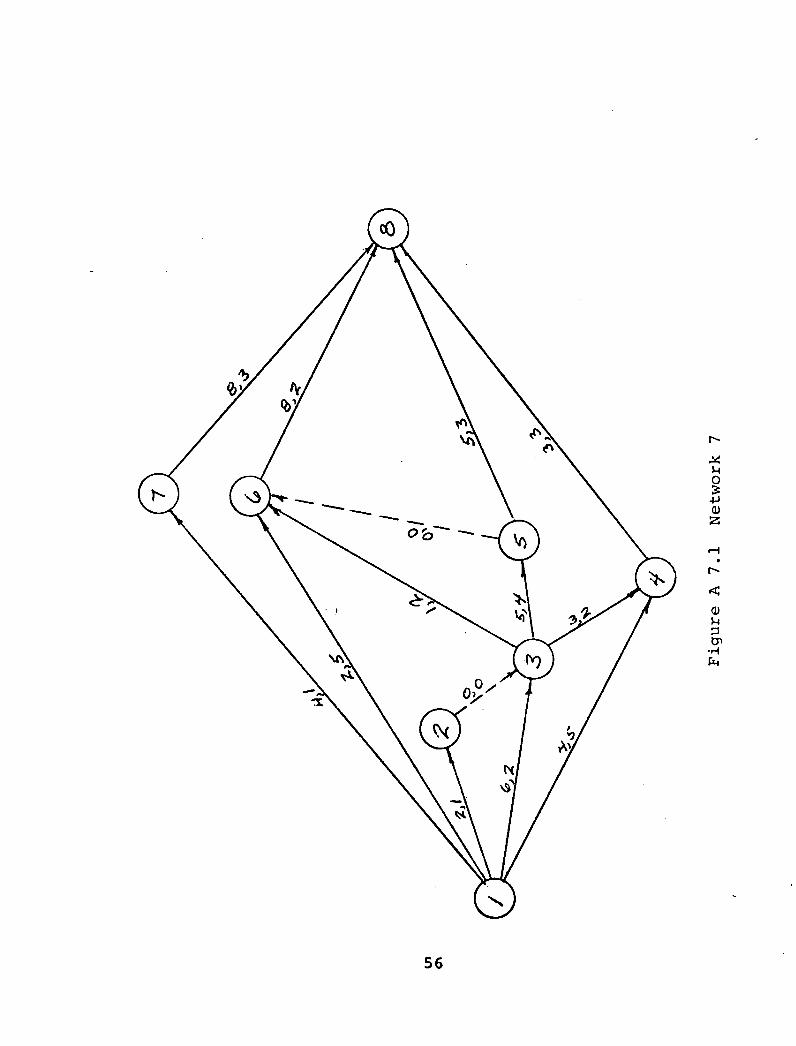
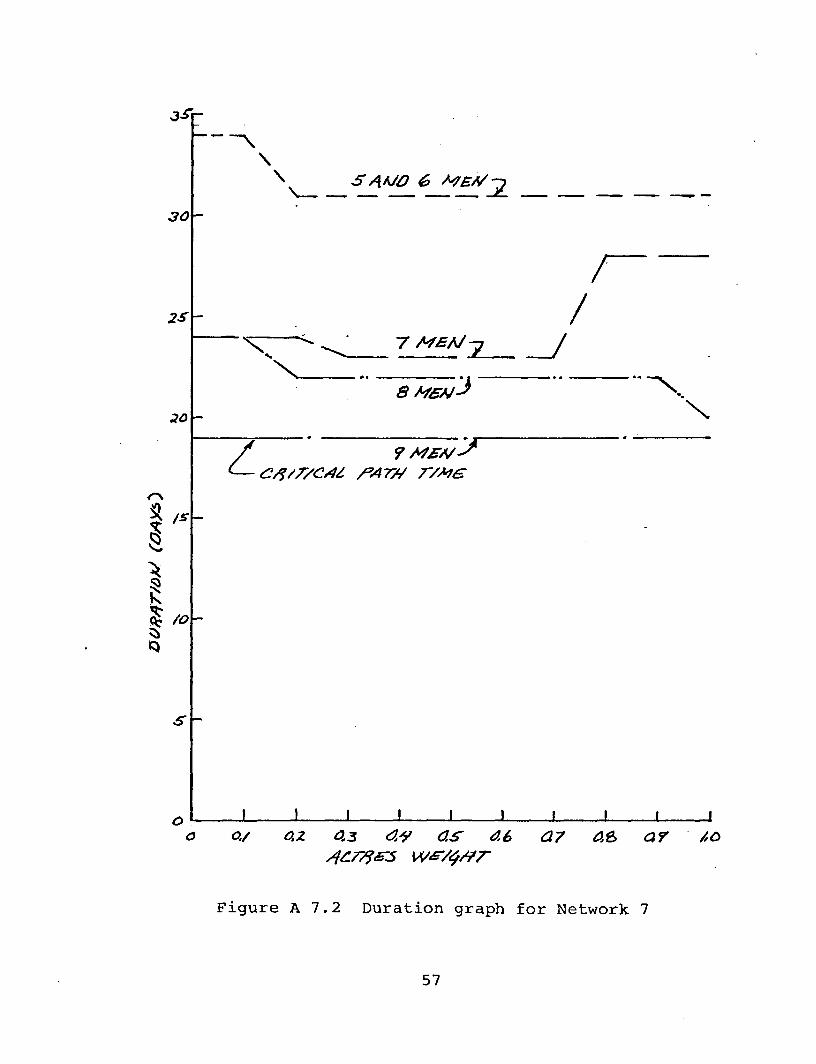
Figure A 1.2 Duration graph for Network 7
57
00
M U O
4-> <D 2
00
3
-H En
58
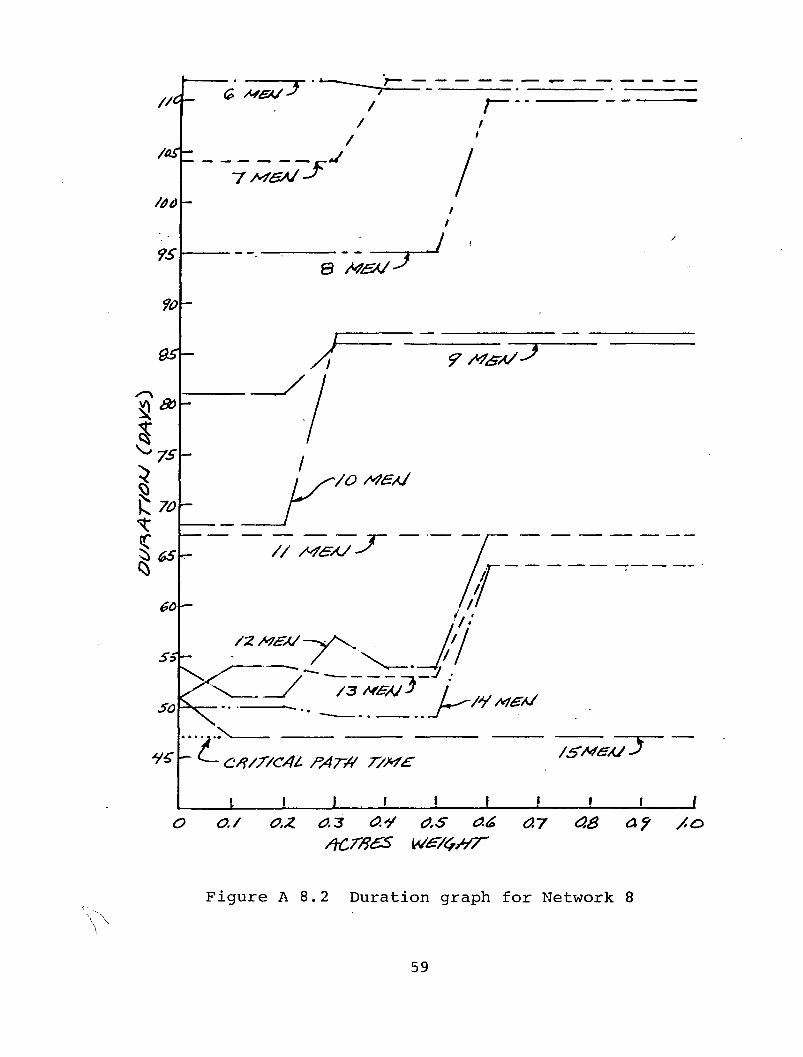
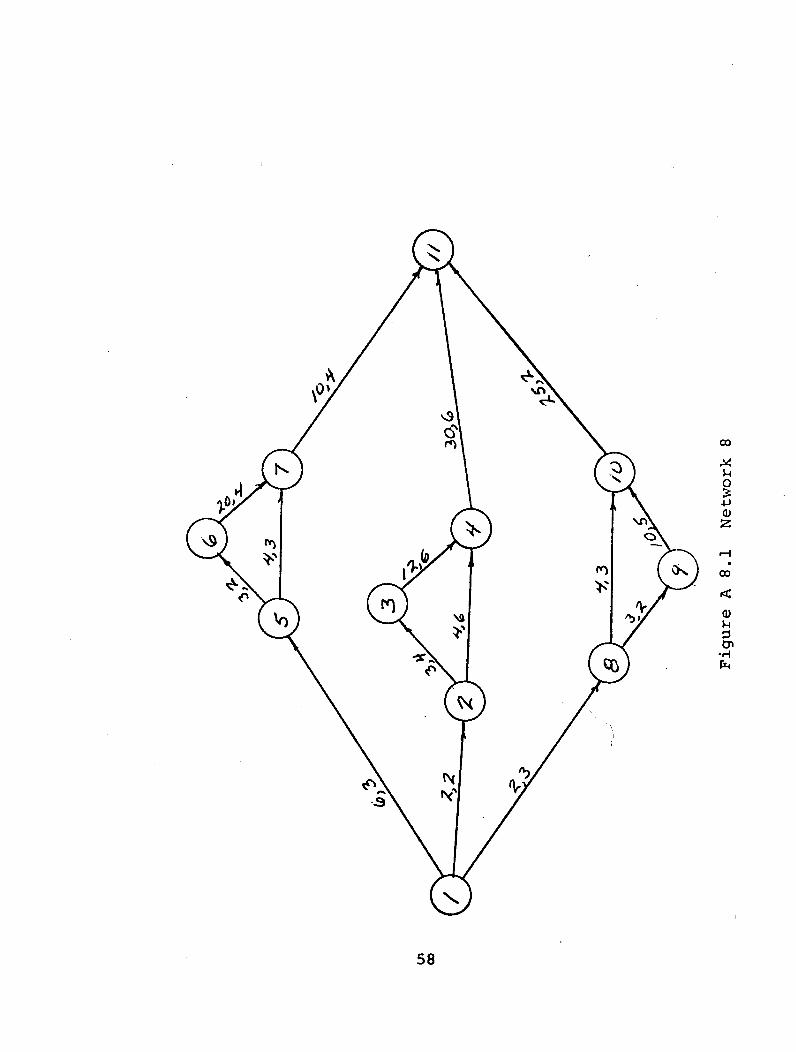
,JT 6 M£*/J ~~?
/aSY-
/0t>
?S
/
7A/5V ~J J
8 M&J ~J J
o o./ o.z a~3 &.* as a& 0.-7 48 a? /<o Across w^/^/yr
Figure A 8.2 Duration graph for Network 8
59
u o > -p o
en
u
•H &4
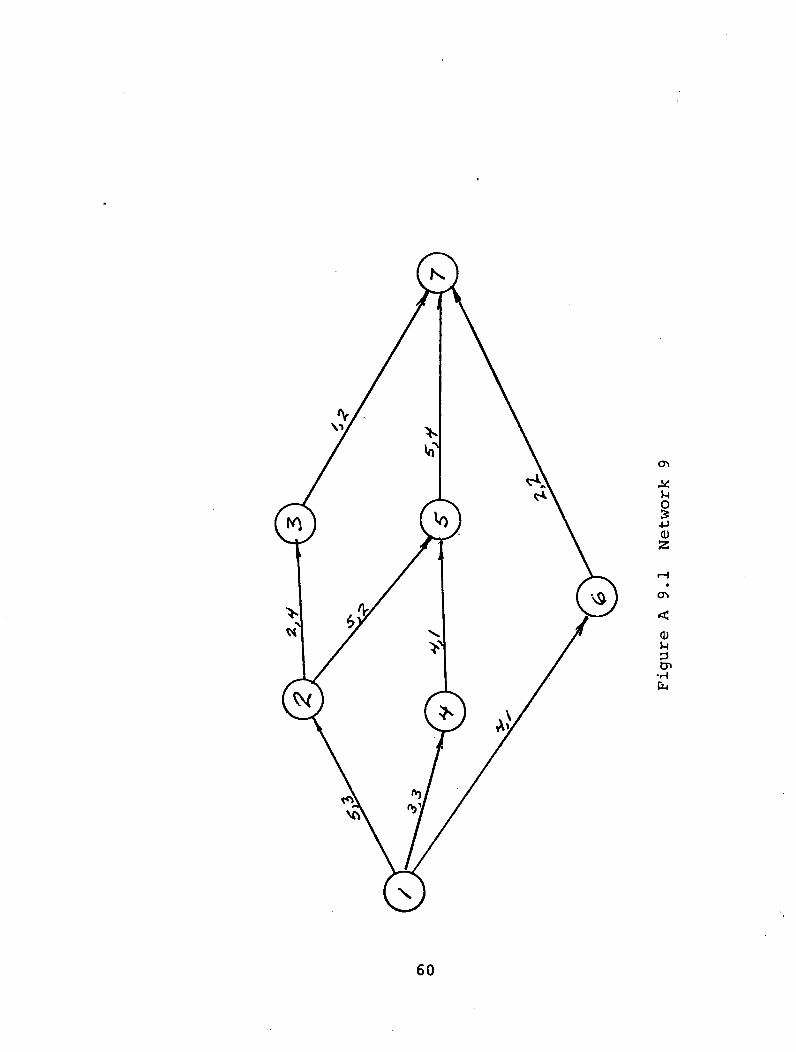
60
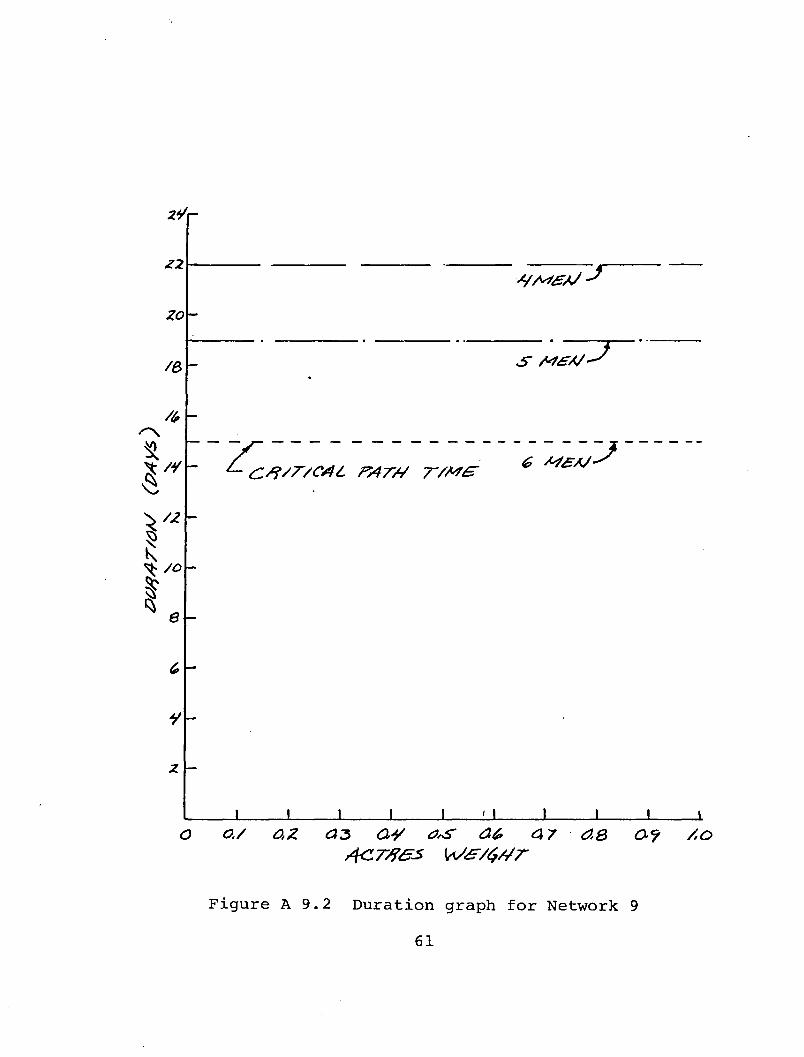
2fr
zz
Zo
4
r ^ /o
6
CfT/CAt. PXT/S T/M&
*/A<4£AJ ~J
/& L S MSAS^
J ! 1 1 I LJ I L o o./ az as ay a<s at, 47 as o.? /,o
Figure A 9.2 Duration graph for Network 9
61
u o
+J
S3
•H fa
&5-
/£o
/YS
WO
/3S
^ /Jd
/
/
SSJSU 7
/
//o
/a$
/CO
?s
70
\ \ v--
/0A7&S J
/3 /'<?&*/~j
/>y/v^v. sv/~
) 1 L L < 1 I 1 l 1 o a/ o.z 0.3 ay as &.£ 0,7 as> a? /.o
Figure A 10.2 Duration graph for Network 10 63
U O
-P <D 2
U 3 cn
-H
K..
64

/t, 16-
13- e /*&*/ z__ /
*
~f
&7
\
y 3 2 /
O o
- Z CX/T/CAL P4T4 7~/M£ /O M& X/>*
J_ 1 _L _L ± ± _L J ^/ o,z 43 a# as- ae> o.7 as a? /.q
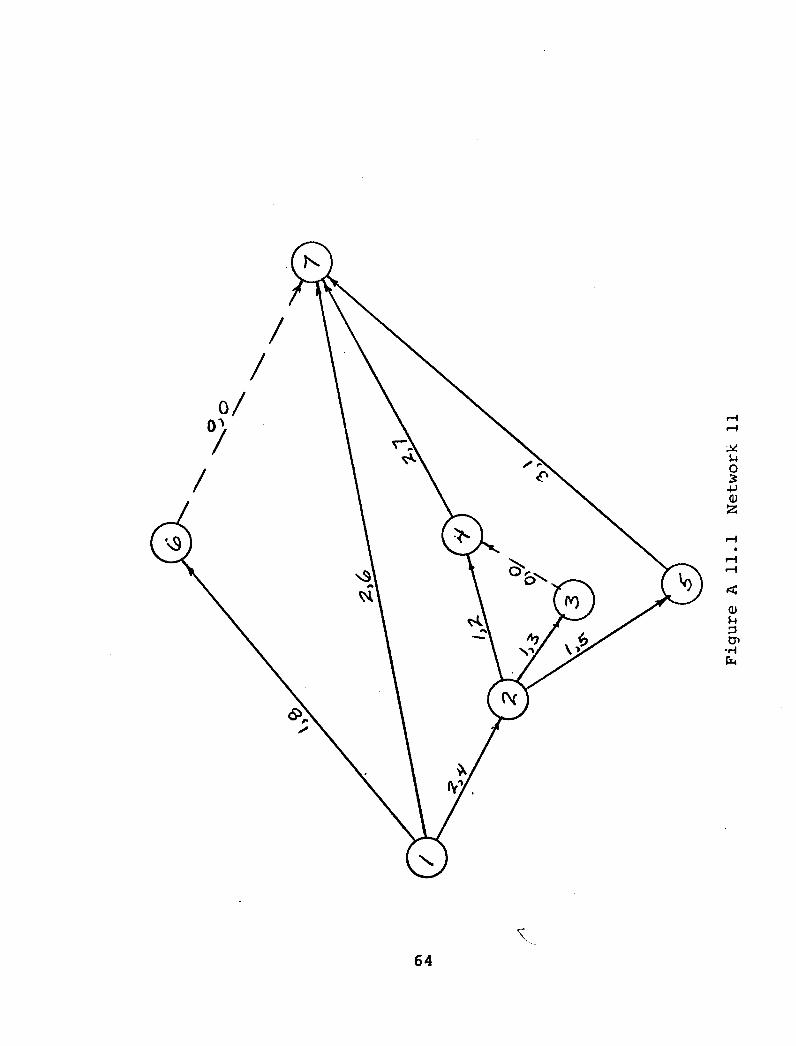
Figure A 11.2 Duration graph for Network 11
65

OM
M U O Ss -P d)
S3
<N
M
•H
cs
50
^
7/%r// rz.
J —^pJ&SAL ...... ._
t J J 1 1 1_ i till oj az a*> o.y as &6 o,7 AS O,? /©
Figure A 12.2 Duration graph for Network 12
67
CO
U o
4-> OJ 2
m
<
U
tn
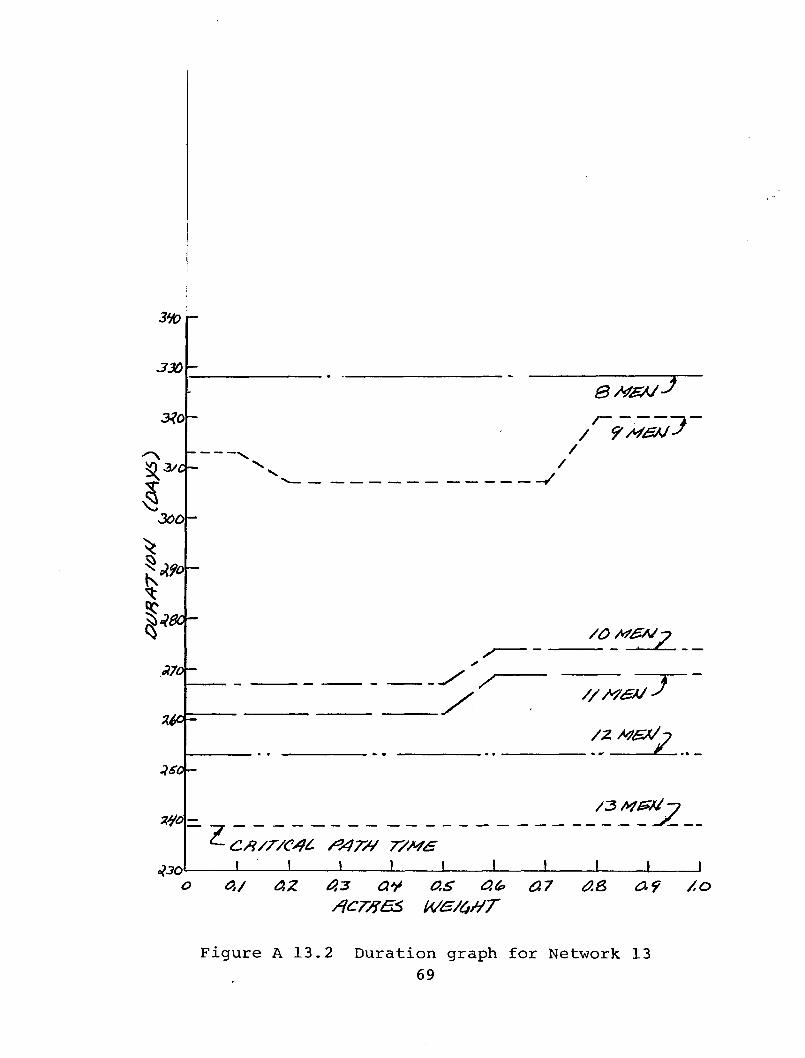
390
330
3?0
I 300
Mo-
tto-
J30
/- s
/ /
-V
/O MSM A^/Vr?
/ZM&tf Z...
/3M&M "2... C/i/r/C/fC /WT4 T/M£
_L— ! 1 I I 1 I I J I o o./ &z a? a* as a&> a7 ae> a*9 /o
/Heroes W&/4HT
Figure A 13.2 Duration graph for Network 13 69
U O
-P
55
tn ■H fa
70

I/O
/?o-
\
\ /—^
\
\
/ \ \
*—' \
<?/<?&/
^//A
|
/3C
Mo
//o
/oo
/O *t&/p
// /s/<£*/-7
A _ /3 M£t/~2 "X.
"Vs V'V M&A/
/s /y^v-
/7 M£TsU'^ / .(^—^JZ " ____/^~^C/l/T/C/}l P4T/Z 7~/*7£
<?01 I I I J J ! ! I 1 ) ' £> oj O! A3 4y a.S 0.6 0.7 0.8 47 /,o
Figure A 14.2 Duration graph for Network 14
71
in
U o
CD Z
in
<D U
en -H
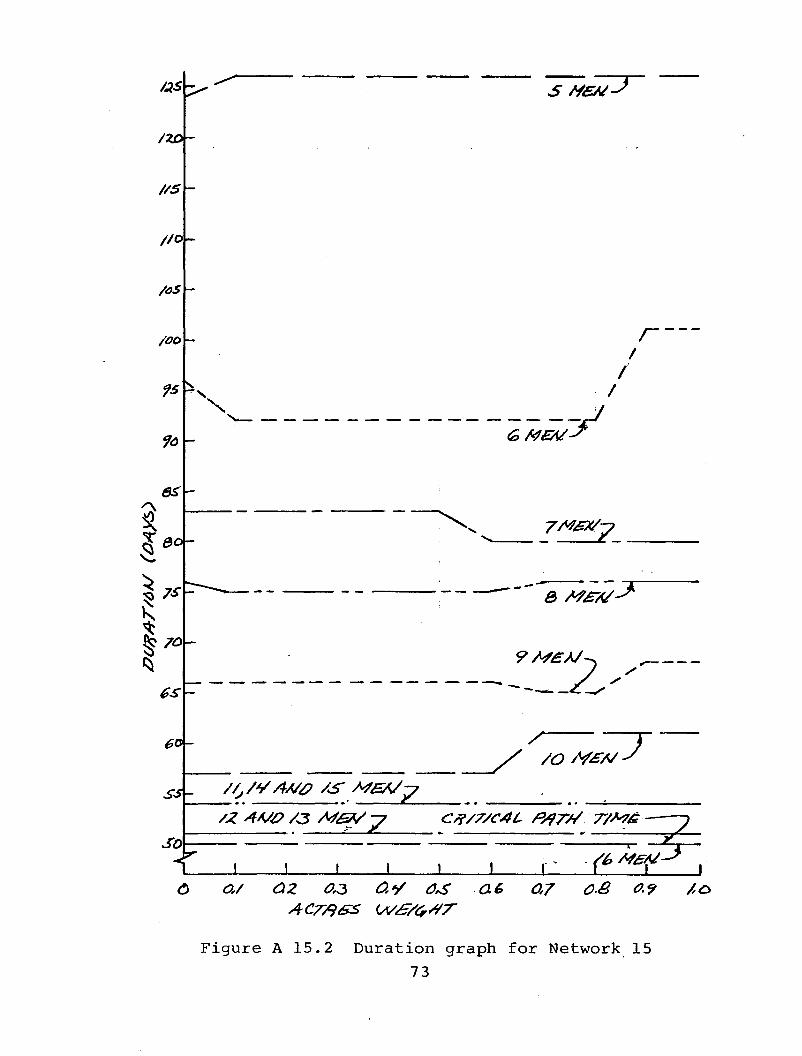
/as
/zo-
//s
//o
/OS
/oo
75
85
%
\
\
6S
eo-
so
S S/&U u
r t
/ /
<2>MB<J -s
\. 7M£X/-->
a wsx/ JT
9S*£A/- 9Af£A/^
/ 7
T • * ■ — ■ — I—■ ■ *■' ■!■ "■' ■ I
/Z 4<V0 /3 M&/-J Cf?/Z/C4L &4TSS T/&£
-f ■ • i i . i ,- ■<*'«£r~l o a/ oz o,3 o.*/ o£ ae> 0,7 o3 0.9 /,&
Figure A 15.2 Duration graph for Network 15
73
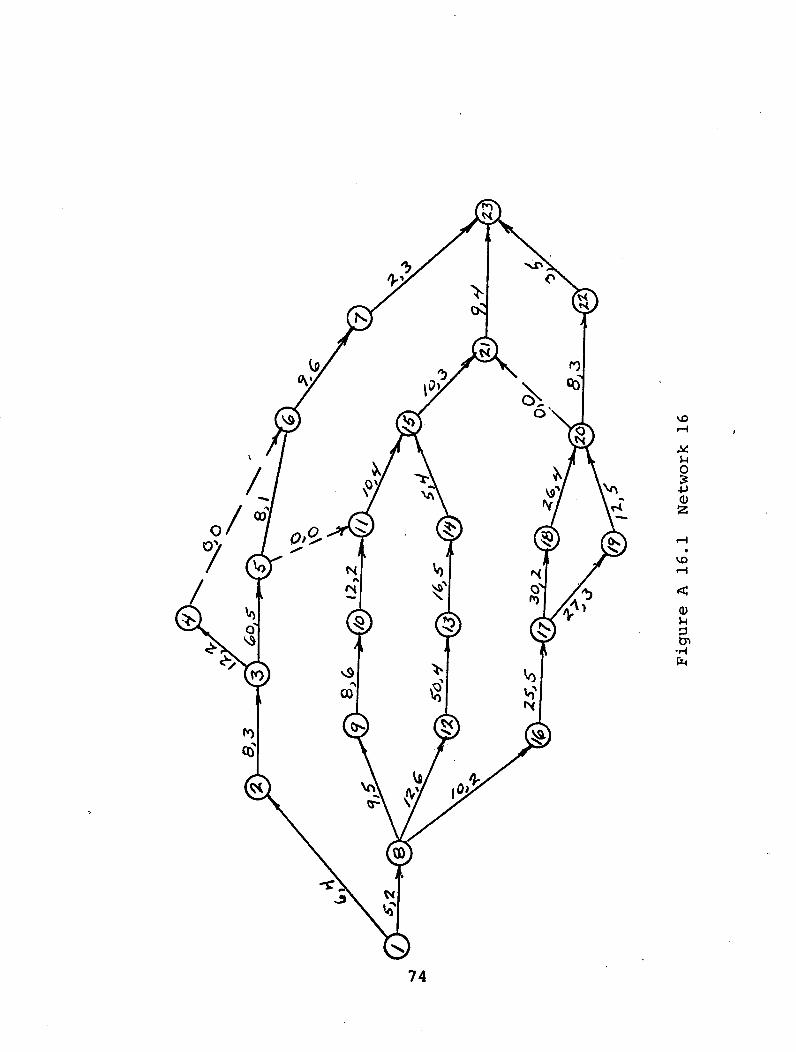
^D
u o :* -p V
<XJ
CO u p
•H
74
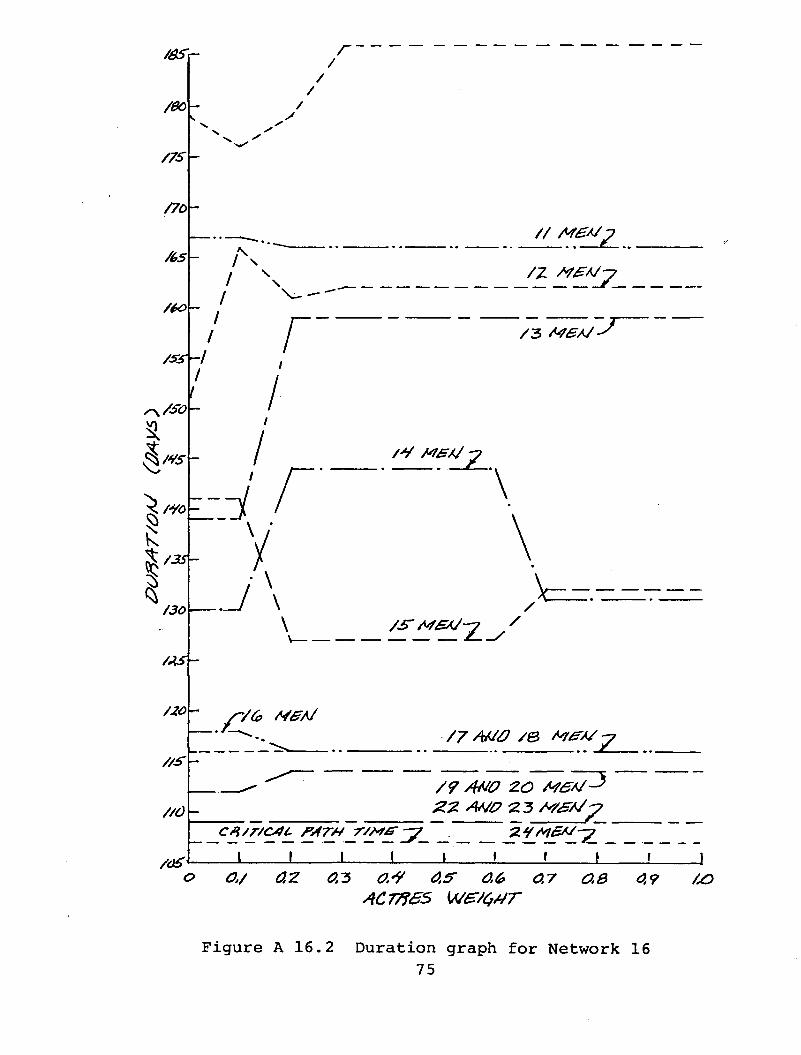
/3Sr ,r
/06
/7S
/70
/to
/ /
/
/s-r / / /3 MS/J
h/ /
\ /30
/AS-
/&
//*
//O
/d£l
As // A4£A/p
I \ /Z /*£M-p
' r i
I I /-V M&/J -y
-j
\ /5"M£*Jy /
..a VG> M&A/ /7 *M0 /& M&*/ T?Z.
1 1 1 l 1 » r \ r |
o a/ az 0.-3 o.<9 a.? a& 0.7 0.3 0,9 /& AC77?eS W&/C4T
Figure A 16.2 Duration graph for Network 16 75

VITA
The author was born in Norristown, Pennsylvania on
October 12, 1951, the son of John W. and Mary R. Brown.
He attended secondary school in Ramsey, New Jersey
and received his high school diploma in 1969 from
Don Bosco High School, Ramsey, New Jersey. He continued
his studies at Lehigh University, where he received the
Bachelor of Science Degree in Civil Engineering
in May 1973.
From June 1973 to January 1975, he was employed by
Yerkes Associates, Inc., Bryn Mawr, Pennsylvania as a
Civil Engineer. During this time, he did graduate work
in Civil Engineering at Villanova University.
In January 1975, he began work toward the Master of
Science in Industrial Engineering at Lehigh University.
During that time, he held positions as Research Assistant
and Teaching Assistant in the Department of Industrial
Engineering. ;
76
Top Related
Copyright © 2022 FDOKUMEN

