


Bahasa
Halaman
Hukum

1
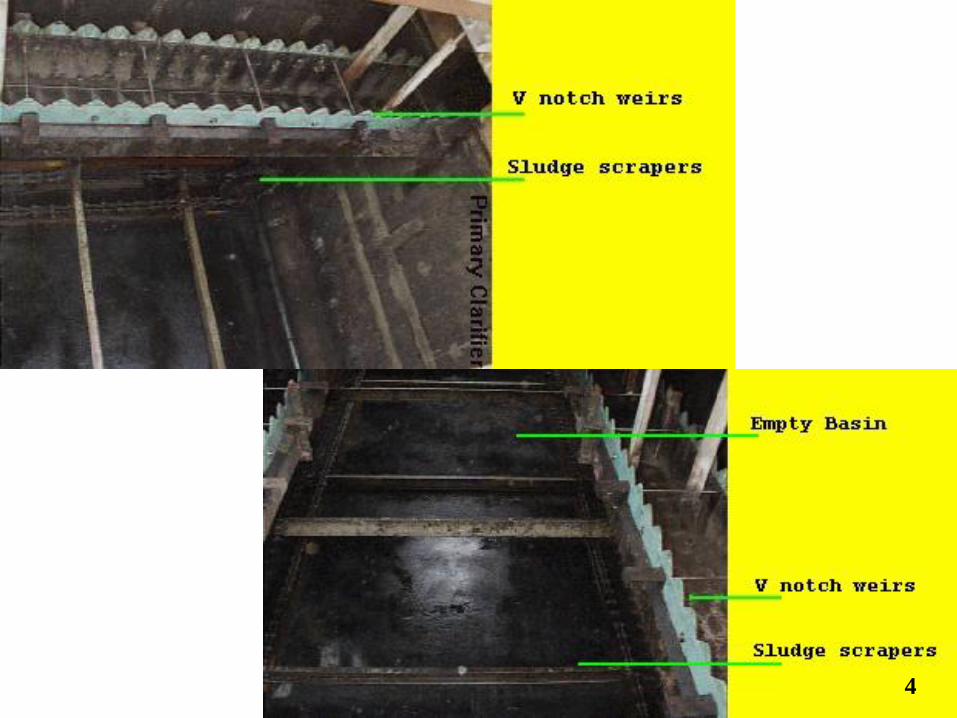
Primary Sedimentation
Objective: To remove settleable organic solids in large basins under relatively quiescent conditions
• Removal efficiency BOD5: 30~40% TSS: 50~70%
• Settled solids: collected by mechanical scrapers into a hopper,
from which they are pumped to a sludge-processing area.
• Oil, grease, and other floating materials: skimmed from the surface
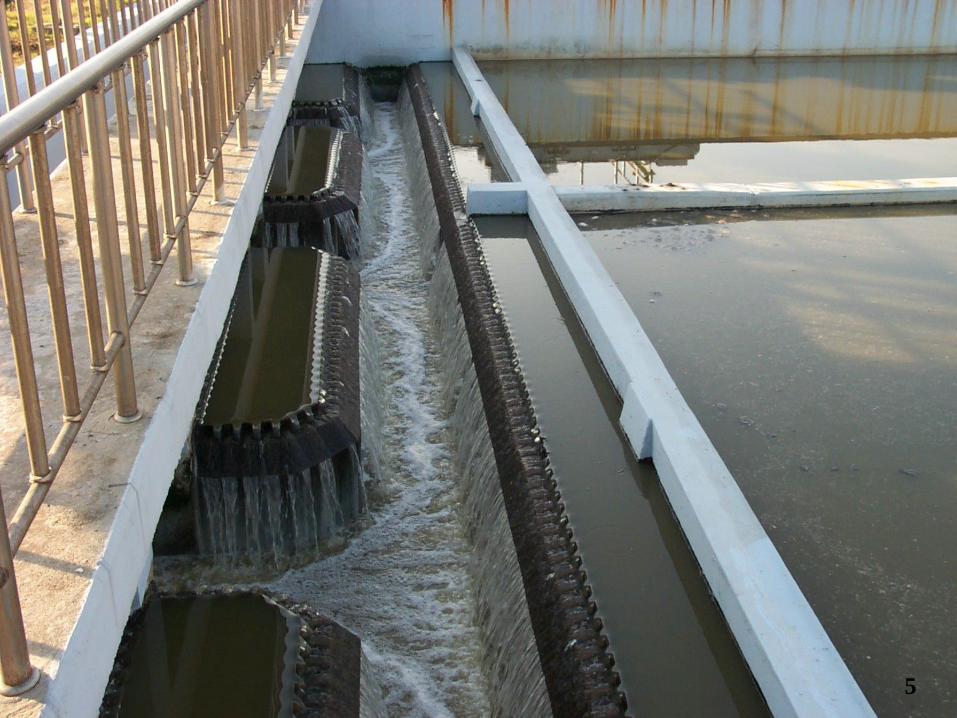
• Effluent: discharged over weirs into a collection trough
2
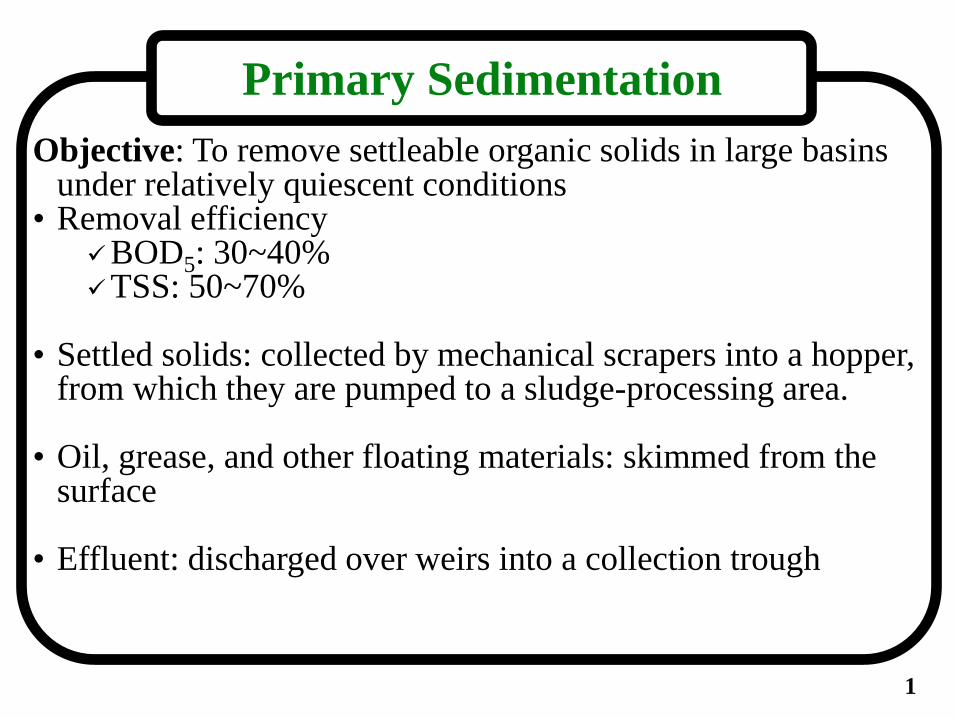
Horizontal Flow Rectangular Sedimentation Tank
3
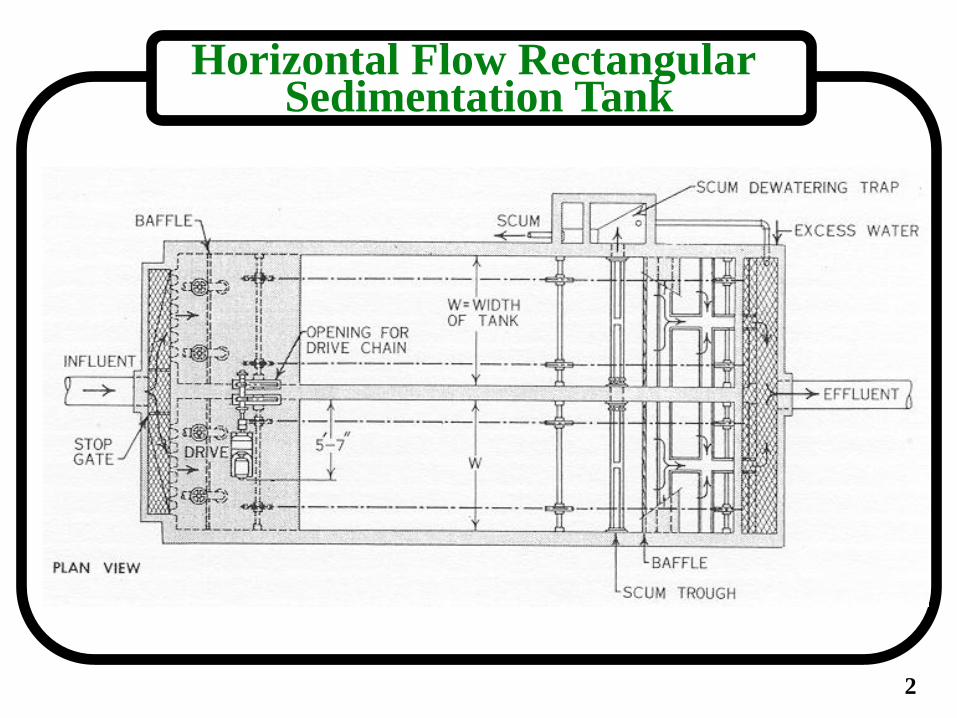
Horizontal Flow Rectangular Sedimentation Tank
Longitudinal section with skimmer
4
5
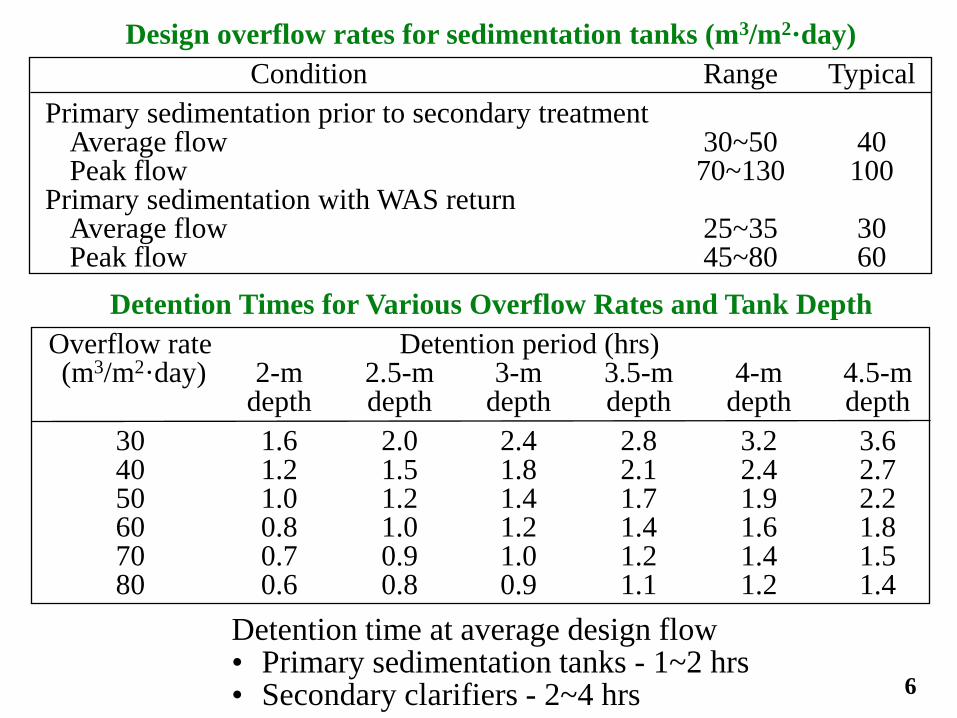
Design overflow rates for sedimentation tanks (m3/m2·day)
Condition Range Typical
Primary sedimentation prior to secondary treatment Average flow 30~50 40 Peak flow 70~130 100 Primary sedimentation with WAS return Average flow 25~35 30 Peak flow 45~80 60
Detention Times for Various Overflow Rates and Tank Depth
Overflow rate Detention period (hrs) (m3/m2·day) 2-m 2.5-m 3-m 3.5-m 4-m 4.5-m depth depth depth depth depth depth
30 1.6 2.0 2.4 2.8 3.2 3.6 40 1.2 1.5 1.8 2.1 2.4 2.7 50 1.0 1.2 1.4 1.7 1.9 2.2 60 0.8 1.0 1.2 1.4 1.6 1.8 70 0.7 0.9 1.0 1.2 1.4 1.5 80 0.6 0.8 0.9 1.1 1.2 1.4
Detention time at average design flow • Primary sedimentation tanks - 1~2 hrs • Secondary clarifiers - 2~4 hrs 6
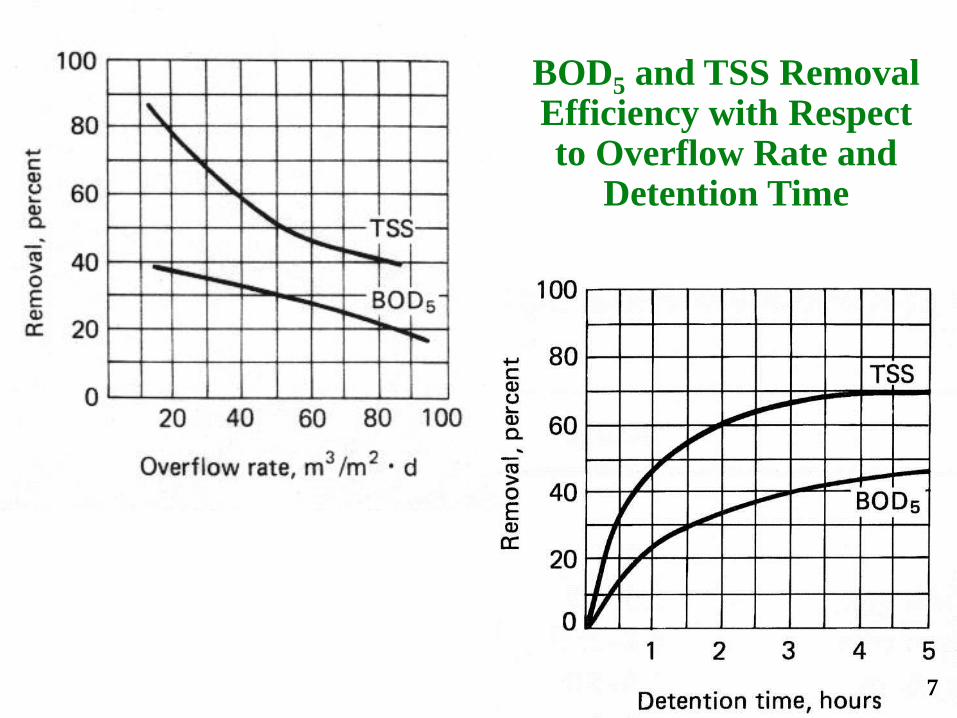
BOD5 and TSS Removal Efficiency with Respect to Overflow Rate and
Detention Time
7
8
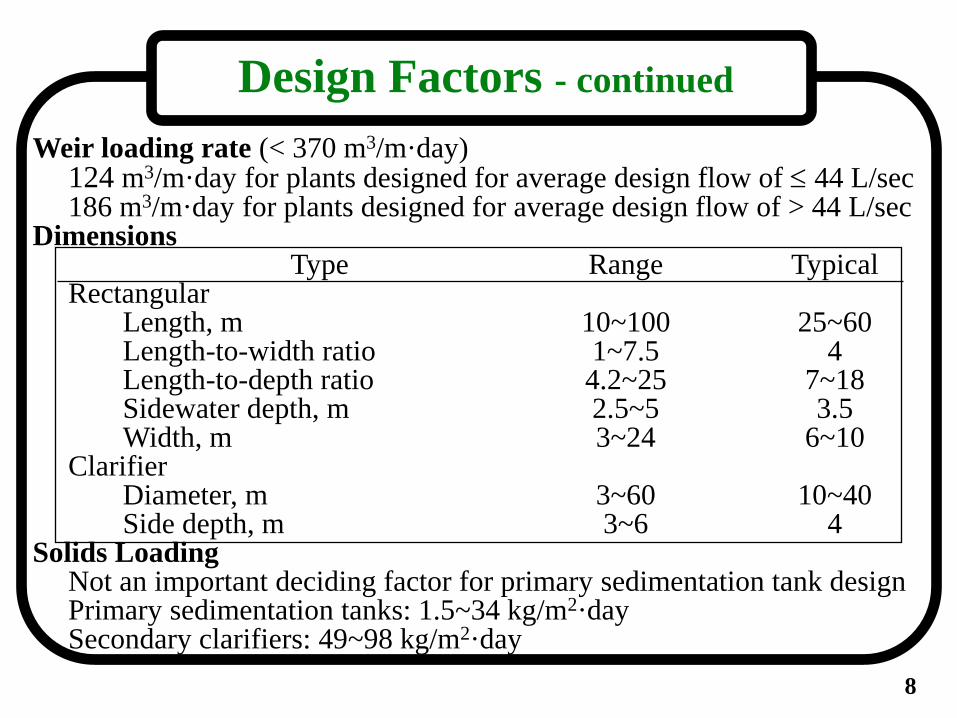
Design Factors - continued
Weir loading rate (< 370 m3/m·day) 124 m3/m·day for plants designed for average design flow of 44 L/sec 186 m3/m·day for plants designed for average design flow of > 44 L/sec Dimensions Type Range Typical Rectangular Length, m 10~100 25~60 Length-to-width ratio 1~7.5 4 Length-to-depth ratio 4.2~25 7~18 Sidewater depth, m 2.5~5 3.5 Width, m 3~24 6~10 Clarifier Diameter, m 3~60 10~40 Side depth, m 3~6 4 Solids Loading Not an important deciding factor for primary sedimentation tank design Primary sedimentation tanks: 1.5~34 kg/m2·day Secondary clarifiers: 49~98 kg/m2·day
9
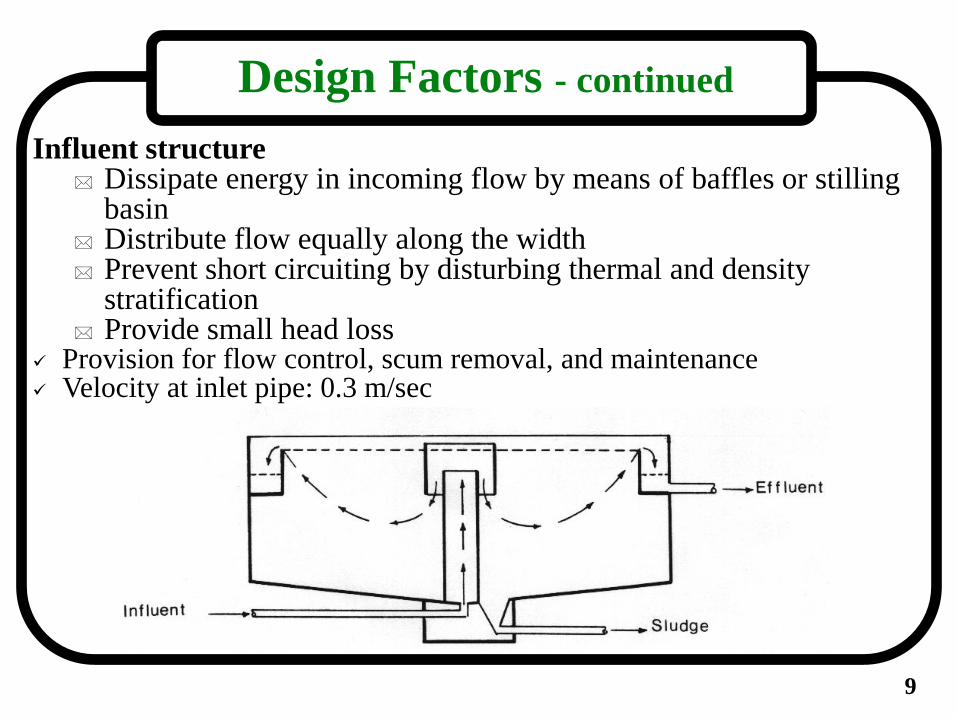
Design Factors - continued
Influent structure Dissipate energy in incoming flow by means of baffles or stilling
basin Distribute flow equally along the width Prevent short circuiting by disturbing thermal and density
stratification Provide small head loss
Provision for flow control, scum removal, and maintenance Velocity at inlet pipe: 0.3 m/sec
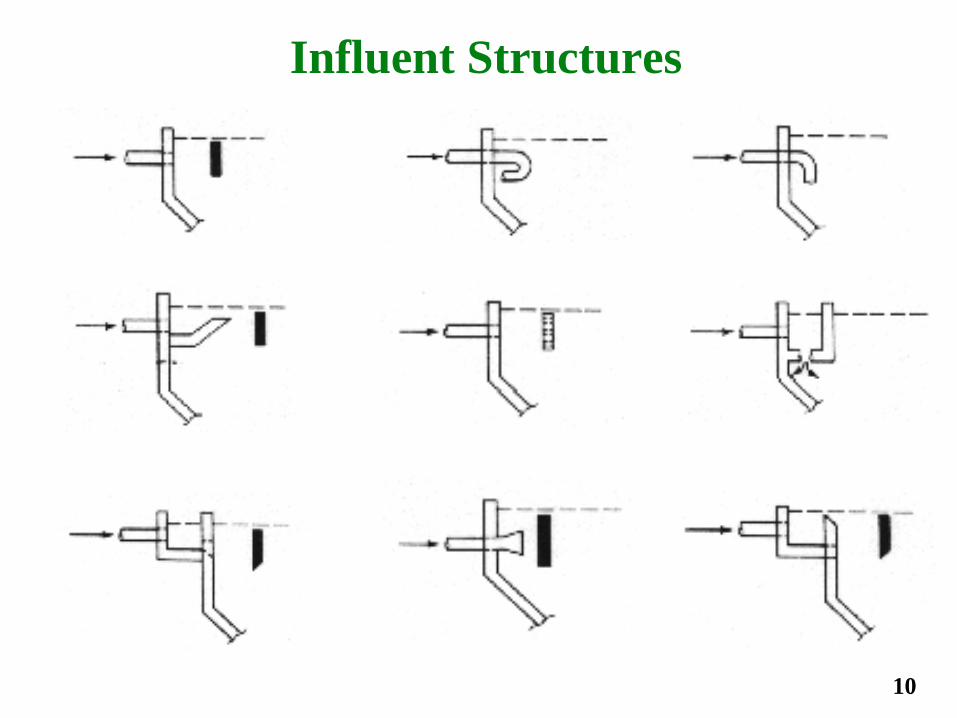
Influent Structures
10
11
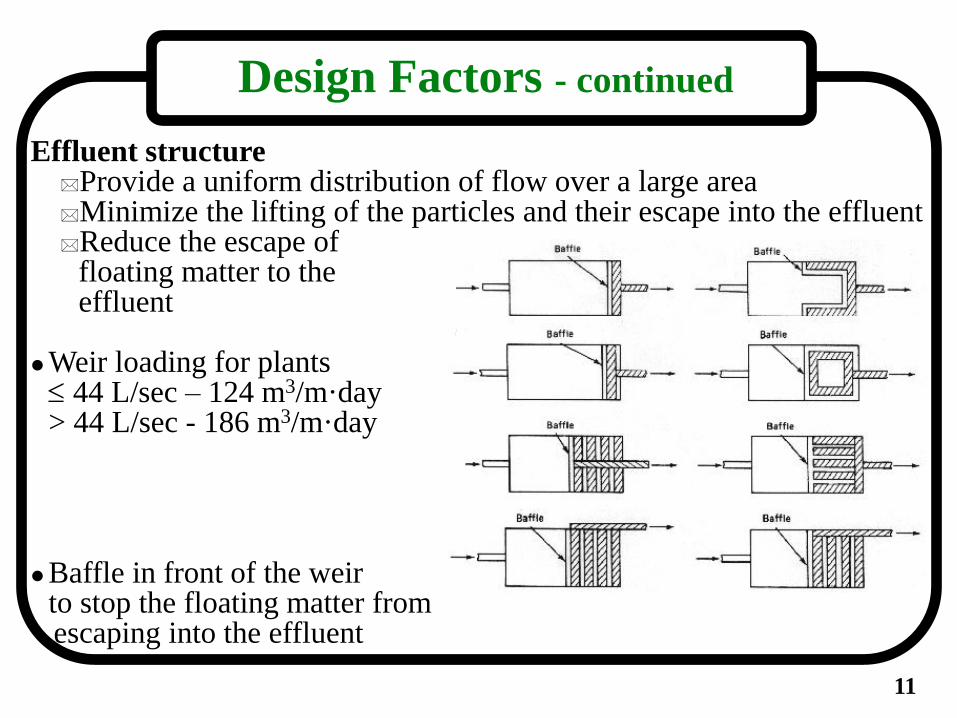
Design Factors - continued
Effluent structure Provide a uniform distribution of flow over a large area Minimize the lifting of the particles and their escape into the effluent Reduce the escape of floating matter to the effluent
Weir loading for plants 44 L/sec – 124 m3/m·day > 44 L/sec - 186 m3/m·day
Baffle in front of the weir to stop the floating matter from escaping into the effluent
12
Design Factors - continued
Sludge collection Bottom slope: to facilitate draining of the tank and to remove the
sludge toward the hopper. Rectangular tanks: 1~2%; circular clarifiers: 40~100 mm/m diameter
Equipment Rectangular tanks
A pair of endless conveyor chains running over sprockets attached to the shafts or moving-bridge sludge collectors having a scraper to push the sludge into the hopper
Suction-type arrangement to withdraw the sludge from basins Circular tanks
Scraping mechanism with radial arms having plows set at an angle supported on center pier ( 10 m diameter) or on a beam spanning the tank (< 10 m diameter) (flight travel speed - 0.02~0.06 revolution/min)
Suction-type units for handling light sludge.

13
Conveyor Chain
One endless chain is connected to a shaft and a drive unit. Linear conveyor speed is 0.3~1 m/min for primary and 0.3
m/min for secondary clarifier Cross-wood (flights) (5 cm thick and 15~20 cm deep) are
attached to the chain at 3-m intervals and are up to 6 m in length.
For tanks greater than 6 m in width, multiple pairs of chains are used.
The floating material is pushed in opposite direction of sludge and is collected in a scum collection box.
Advantages: simple to install, low power consumption, efficient scum collection, and suitable for heavier sludge
Disadvantages: high maintenance cost of chain and flight removal mechanism, dewatering of tanks for gear and chain repair, and potential resuspension of light sludge
14
Information Checklist
Average and peak design flows including the returned flows from other treatment units
All sidestreams from thickener, digester, and dewatering facility
Treatment plant design criteria prepared by the concerned regulatory agencies
Equipment manufacturers and equipment selection guide Information on the existing facility if the plant is being
expanded Available space and topographic map of the plant site Shape of the tank (rectangular, square, or circular) Influent pipe data, to include diameter, flow characteristics,
and approximate water surface elevation or hydraulic grade line
Headloss constrains for sedimentation facility
15
Design Calculations
Design criteria 1. Two rectangular units shall be designed for independent operation.
Allow for a bypass to secondary treatment process when one unit is out of service.
2. Overflow rate and detention times shall be based on an average design flow of 0.44 m3/sec (10 MGD).
3. The overflow rate shall be < 36 m3/m2·day at average design flow. 4. The detention time shall be > 1.5 hrs at average design flow. 5. The influent structure shall be designed to prevent short circuiting
and reduce turbulence. The influent channel shall have a velocity < 0.35 m/sec at design peak flow (0.661 m3/sec through each basin).
6. All sidestreams shall be returned to aeration basins. 7. The weir loading shall be < 186 m3/m·day at average design flow
and < 372 m3/m·day at design peak flow. 8. The launder and outlet channels shall be designed at the peak
design flow of 1.321 m3/sec (0.661 m3/sec through each basin). 9. The average liquid depth in the basin shall be > 3 m. 10. The slope of the tank bottom shall be 1.35%.
16
Design Calculations - continued
Basin dimensions 1. Select basin geometry and provide two rectangular basins with
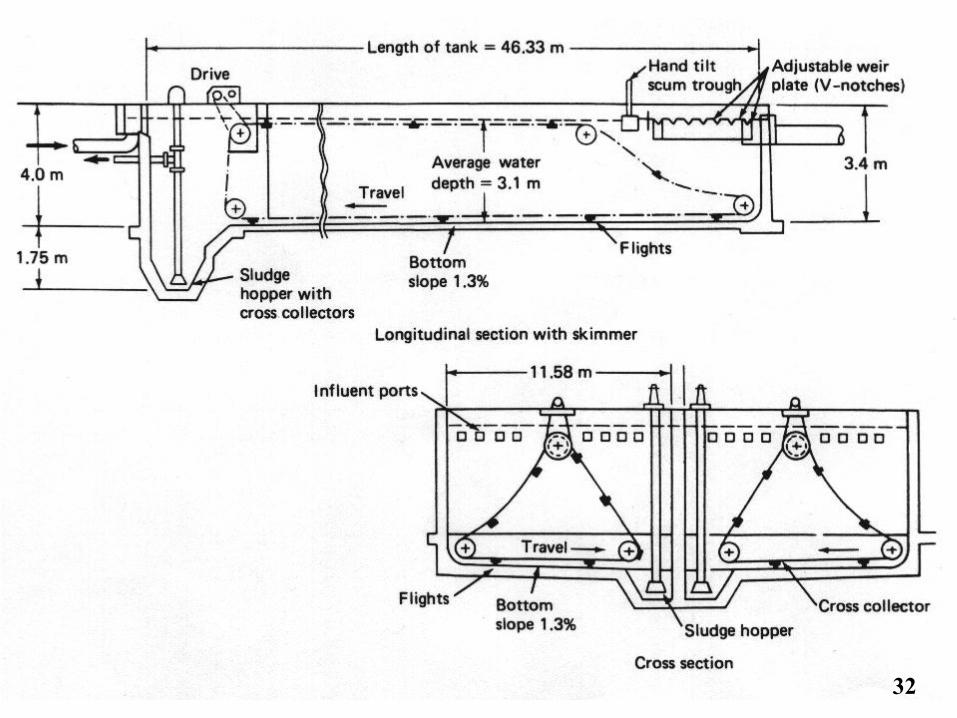
common wall Average design flow through each basin = 0.44/2 = 0.22 m3/sec Overflow rate at average design flow = 36 m3/m2·day Surface area = 0.22 m3/sec × 86,400 sec/day 36 m3/m2·day = 528 m2 Use length-to-width ratio (L:W) = 4:1 ~ OK 4W × W = 528 m2; W = 11.5 m; use W = 11.58 m (38 ft) due to 2
ft increments for sludge collectors. Thus, length = 46.33 m (152 ft). Depth at mid-length of the tank = 4 m (13.1 ft) Length-to-depth ratio = 46.33 m/4 m = 11.6 ~ OK Freeboard = 0.6 m (2 ft) Average depth of the basin = 4.6 m (15 ft)
17
Design Calculations - continued
2. Check overflow rate Overflow rate at average design flow = 0.22 m3/sec × 86,400 sec/day (11.58 m × 46.33 m) = 35.4 m3/m2·day Overflow rate at peak design flow = 0.661 m3/sec × 86,400 sec/day (11.58 m × 46.33 m) = 106.4 m3/m2·day 3. Check detention time Average volume of the basin = 4 m × 11.58 m × 46.33 m = 2,146.0 m3
Detention time at average design flow = 2,146.0 m3 (0.22 m3/sec × 3,600 sec/hr) = 2.7 hrs Detention time at peak design flow = 2,146.0 m3 (0.661 m3/sec × 3,600 sec/hr) = 0.9 hr Influent structure 1. Select the arrangement of the influent structure The influent structure includes a 1-m wide influent channel that
runs across the width of the tank. Eight submerged orifices 34 cm square each, are provided in the inside wall of the channel.
18
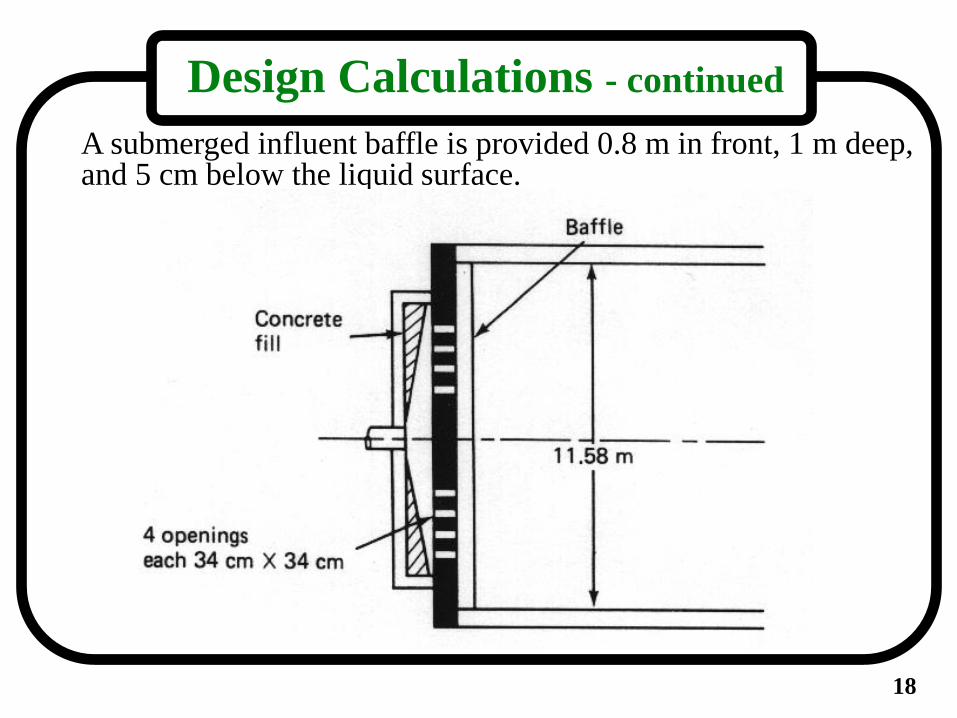
Design Calculations - continued
A submerged influent baffle is provided 0.8 m in front, 1 m deep, and 5 cm below the liquid surface.
19
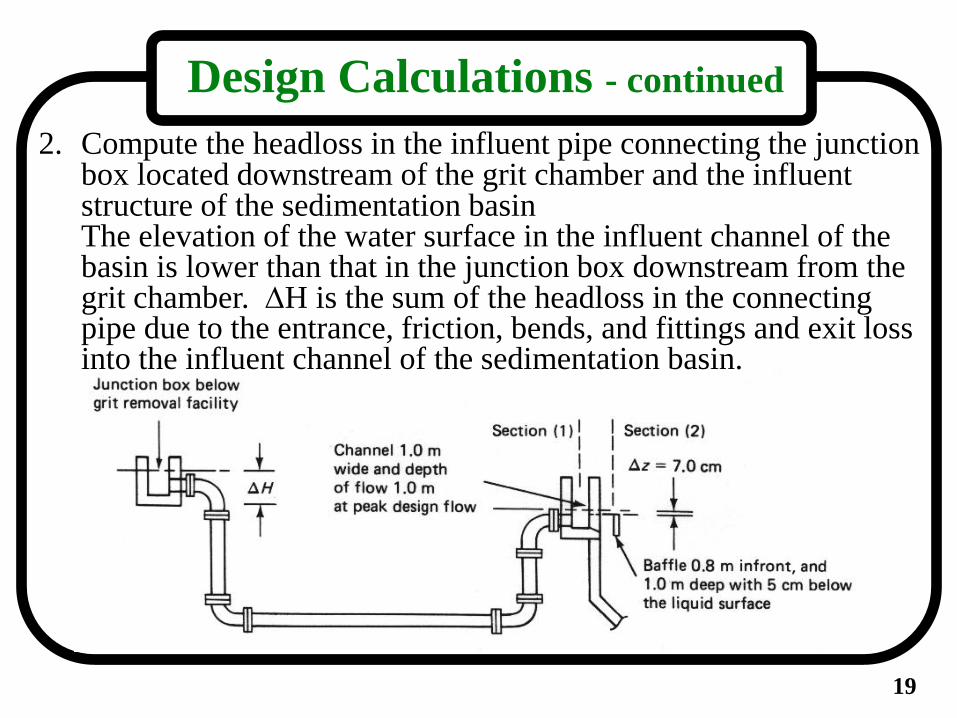
Design Calculations - continued
2. Compute the headloss in the influent pipe connecting the junction box located downstream of the grit chamber and the influent structure of the sedimentation basin
The elevation of the water surface in the influent channel of the basin is lower than that in the junction box downstream from the grit chamber. H is the sum of the headloss in the connecting pipe due to the entrance, friction, bends, and fittings and exit loss into the influent channel of the sedimentation basin.
20
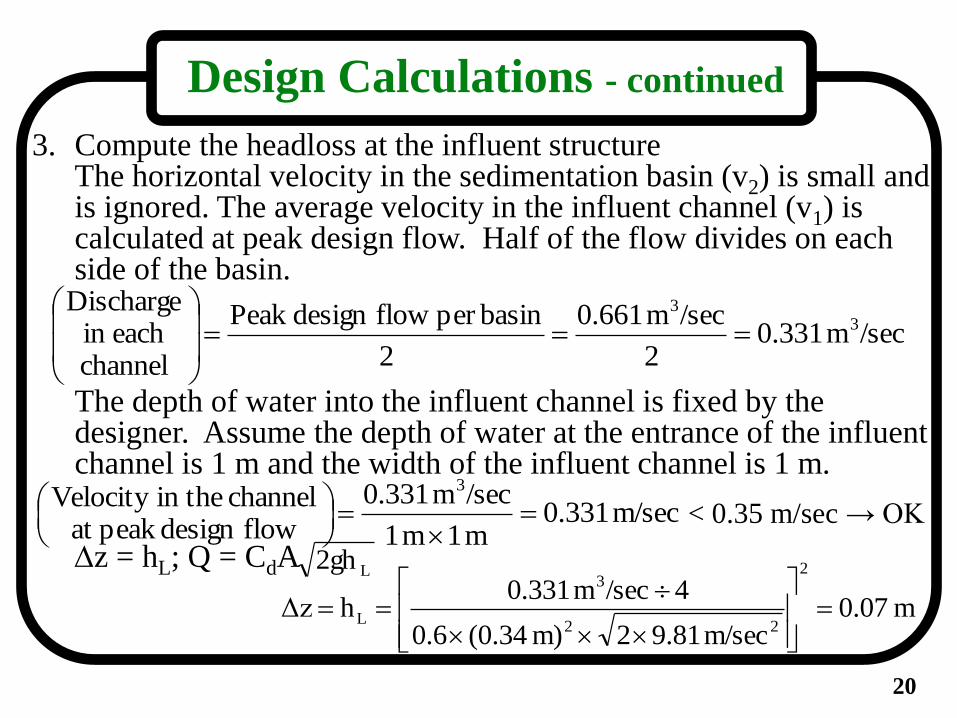
Design Calculations - continued
3. Compute the headloss at the influent structure The horizontal velocity in the sedimentation basin (v2) is small and
is ignored. The average velocity in the influent channel (v1) is calculated at peak design flow. Half of the flow divides on each side of the basin.
The depth of water into the influent channel is fixed by the
designer. Assume the depth of water at the entrance of the influent channel is 1 m and the width of the influent channel is 1 m.
z = hL; Q = CdA
/secm 0.3312
/secm 0.661
2
basinper flowdesign Peak
channeleachin
Discharge3
3
m/sec 0.331m 1 m 1
/secm 0.331
flowdesign peak at channel in theVelocity
3
L2gh
m 0.07m/sec 9.812m) (0.340.6
4 /secm 0.331hΔz
2
22
3
L
< 0.35 m/sec → OK
21
Design Calculations - continued
Effluent structure 1. Select the arrangement of the effluent structure The effluent structure consists of weirs, launder, an outlet box, and
an outlet pipe. Use V-notched weir. 2. Compute the length of the weir Weir loading = 372 m3/m·day at peak design flow Peak design flow per basin = 0.661 m3/sec × 86,400 sec/day = 57,110 m3/day Weir length = 57,110 m3/day 372 m3/m·day = 153.3 m Provide weir notches on both sides of the launder. Thus, Total length of the weir plate = 2(29.5 + 10.38) m + 2(28.3+9.18) m - 1 m = 153.72 m Actual weir loading = 57,110 m3/day 153.72 m = 371.6 m3/m·day ~ OK 3. Compute the number of V-notches Provide 90° standard V-notches at a rate of 20 cm center to center
on both sides of the launders.
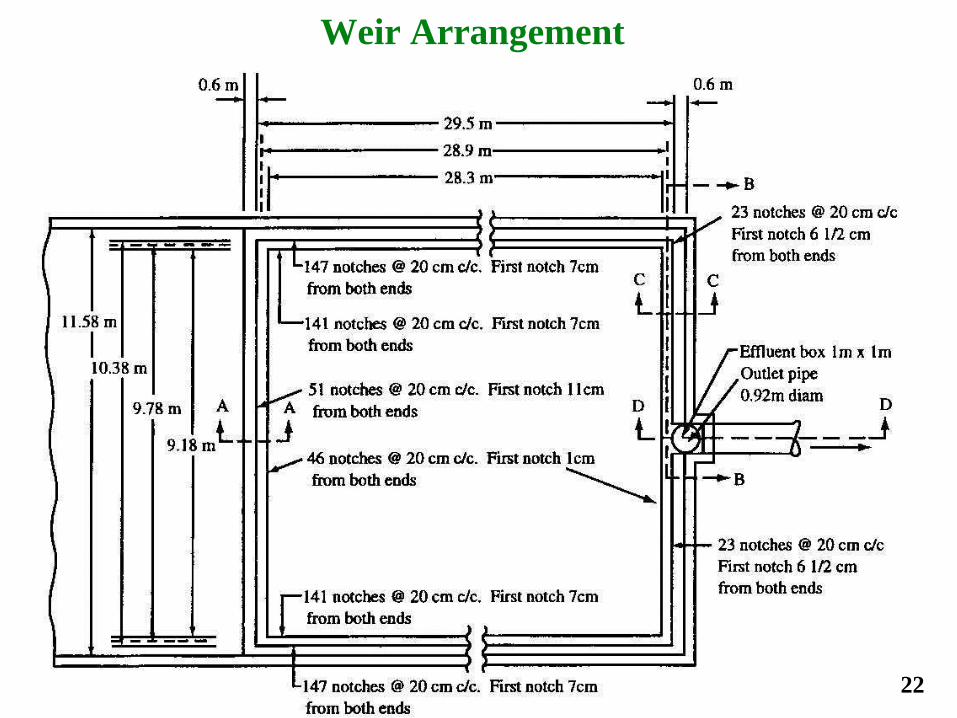
22
Weir Arrangement
23
Design Calculations - continued
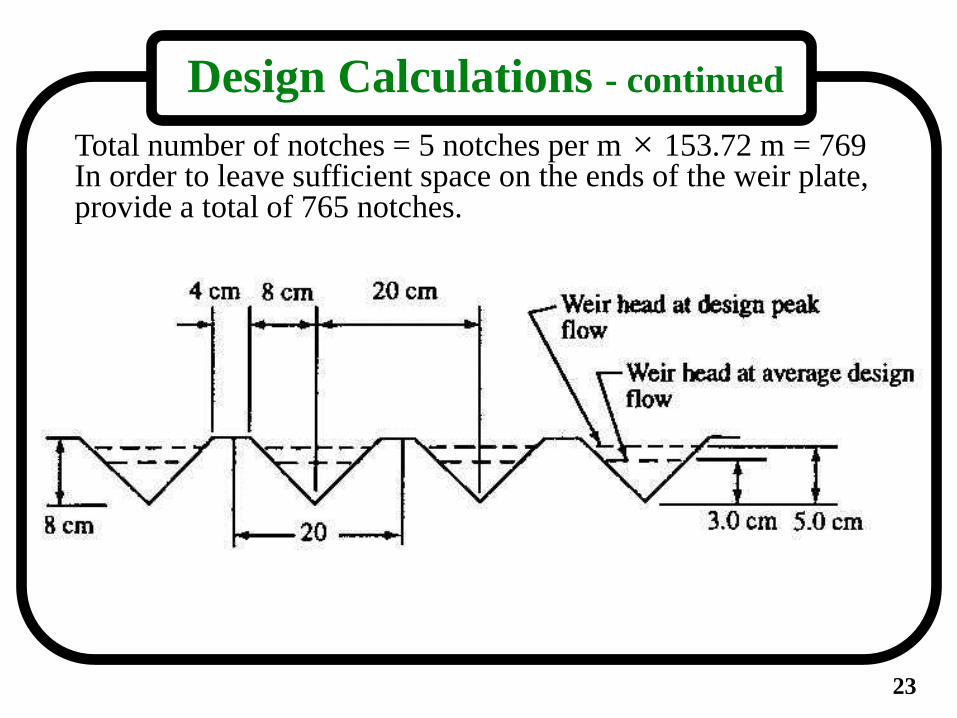
Total number of notches = 5 notches per m × 153.72 m = 769 In order to leave sufficient space on the ends of the weir plate,
provide a total of 765 notches.
24
Design Calculations - continued
4. Compute the head over the V-notches at the average design flow The average discharge per notch at average design flow = 0.22 m3/sec 765 notches = 2.88 × 10⁻⁴ m3/sec per notch The discharge through a V-notch is calculated using the eq. below.
Q = 8/15 Cd 2g ·tan(/2) H5/2
where Cd = 0.6, H = head over notch, m, and = angle of the V- notch = 90°.
2.88 × 10⁻⁴ m3/sec = 8/15 × 0.6 × 2 ×9.81 m/sec2·tan (90/2) H5/2
H = 0.03 m = 3 cm 5. Compute head over V-notches at peak design flow Discharge per notch at peak design flow = 0.661 m3/sec 765 notches = 8.64 × 10⁻⁴ m3/sec per notch 8.64 × 10⁻⁴ m3/sec = 8/15 × 0.584 × 2 ×9.81 m/sec2·tan (90/2) H5/2
H = 0.06 m = 5 cm 6. Check the depth of the notch The total depth of the notch is 8 cm. Max. liquid head over the
notch at peak design flow is 5 cm (safe allowance of 3 cm).
25
Design Calculations - continued
Sludge Quantities 1. Establish sludge characteristics Primary sludge: specific gravity of 1.03 and a solids content of
3~6%. Assume a typical solids content of 4.5%. 2. Compute average quantity of sludge produced per day Amount of solids produced per basin per day at a removal rate of
63% = 260 g/m3 × 0.63 × 0.22 m3/sec ×86,400 sec/day × kg/1,000 g = 3,113.5 kg/day Average quantity of sludge produced per day from both basins = 2 × 3,113.5 kg/day = 6,227 kg/day 3. Compute the volume of sludge produced per minute per basin Volume of sludge at specific gravity of 1.03 and 4.5% solids = 3,113.5 kg/day (1.03 × 1 g/m3 × 1 kg/1,000 g × 0.045 × 106 cm3/m3 × 1,440 min/day) = 0.0467 m3/min per basin 4. Determine sludge pump size and pumping cycle Provide separate sludge pumps for each basin. Arrange such that
each pump will serve both basins in case one pump is out of service.
26
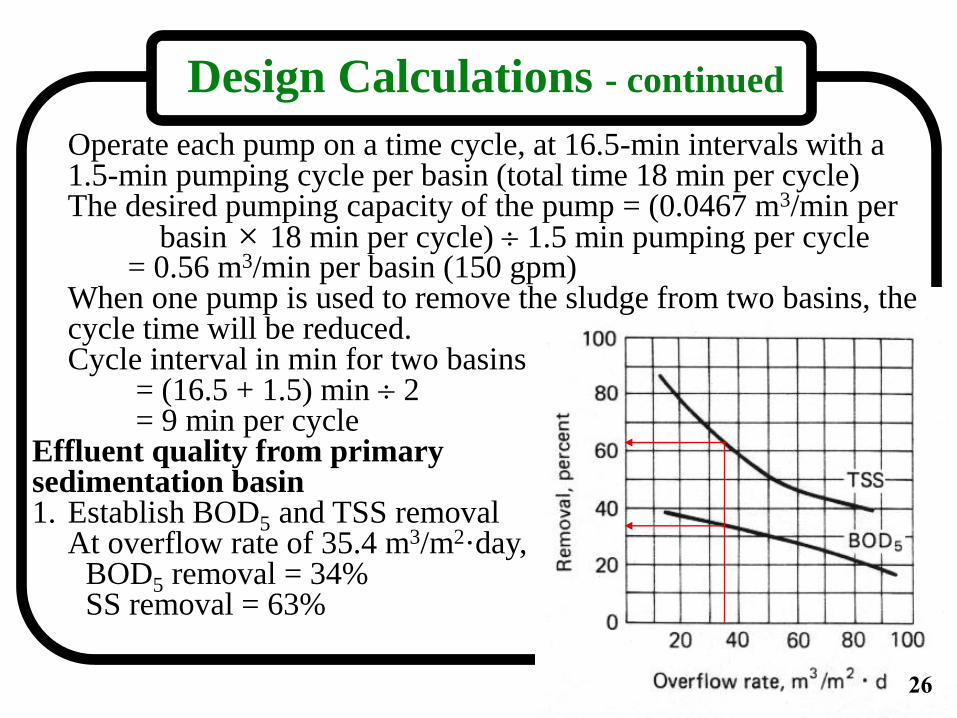
Design Calculations - continued
Operate each pump on a time cycle, at 16.5-min intervals with a 1.5-min pumping cycle per basin (total time 18 min per cycle)
The desired pumping capacity of the pump = (0.0467 m3/min per basin × 18 min per cycle) 1.5 min pumping per cycle = 0.56 m3/min per basin (150 gpm) When one pump is used to remove the sludge from two basins, the
cycle time will be reduced. Cycle interval in min for two basins = (16.5 + 1.5) min 2 = 9 min per cycle Effluent quality from primary sedimentation basin 1. Establish BOD5 and TSS removal At overflow rate of 35.4 m3/m2·day, BOD5 removal = 34% SS removal = 63%
26
27
Design Calculations - continued
2. Compute BOD5 and TSS in the effluent Assume the sidestreams from the thickeners, digesters, and
dewatering facilities are returned to the aeration basin. BOD5 in the primary effluent = 250 g/m3 × (1 - 0.34) × 0.44 m3/sec × 86,400 sec/day × kg/1,000 g = 6,273 kg/day TSS in the primary effluent = 260 g/m3 × (1 - 0.63) × 0.44 m3/sec × 86,400 sec/day × kg/1,000 g = 3,657 kg/day Volume of primary effluent = Average flow to primary - Sludge withdrawal = 0.44 m3/sec × 86,400 sec/day - (6,227 kg/day × 1,000 g/kg) (0.045 g/g × 1.03 × g/cm3 × 106 cm3/m3) = 38,016 m3/day - 134 m3/day = 37,882 m3/day BOD5 conc. in effluent = 6,273 kg/day 37,882 m3/day × 1,000 g/kg = 165.6 g/m3 = 165.6 mg/L TSS conc. in effluent = 3,657 kg/day 37,882 m3/day × 1,000 g/kg = 165.6 g/m3 = 96.5 mg/L Scum quantity: ave. quantity of scum (S.G.=0.95) = 8 kg/1,000 m3 8 kg/1,000 m3 × 38,016 m3/day = 304 kg/day = 0.32 m3/day
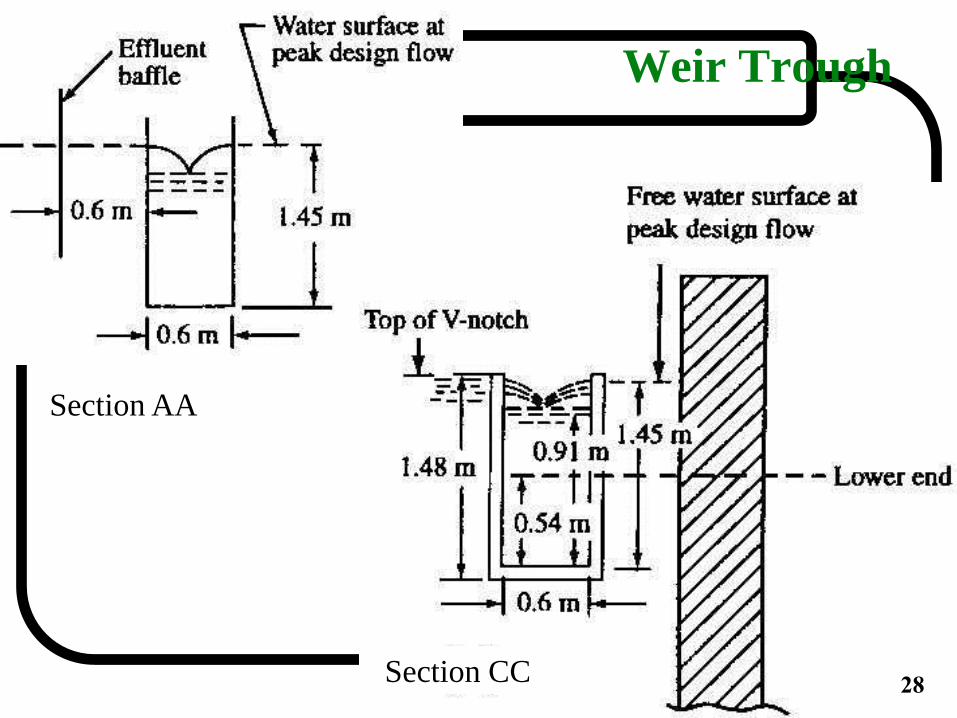
28
Weir Trough
Section AA
Section CC 28
29
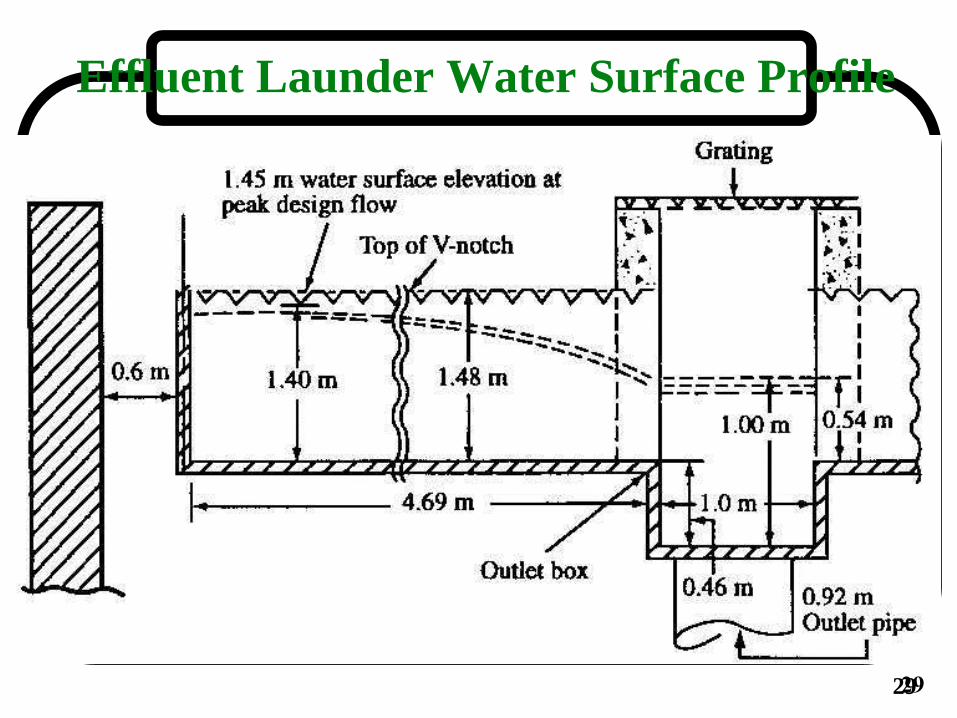
Effluent Launder Water Surface Profile
29
30
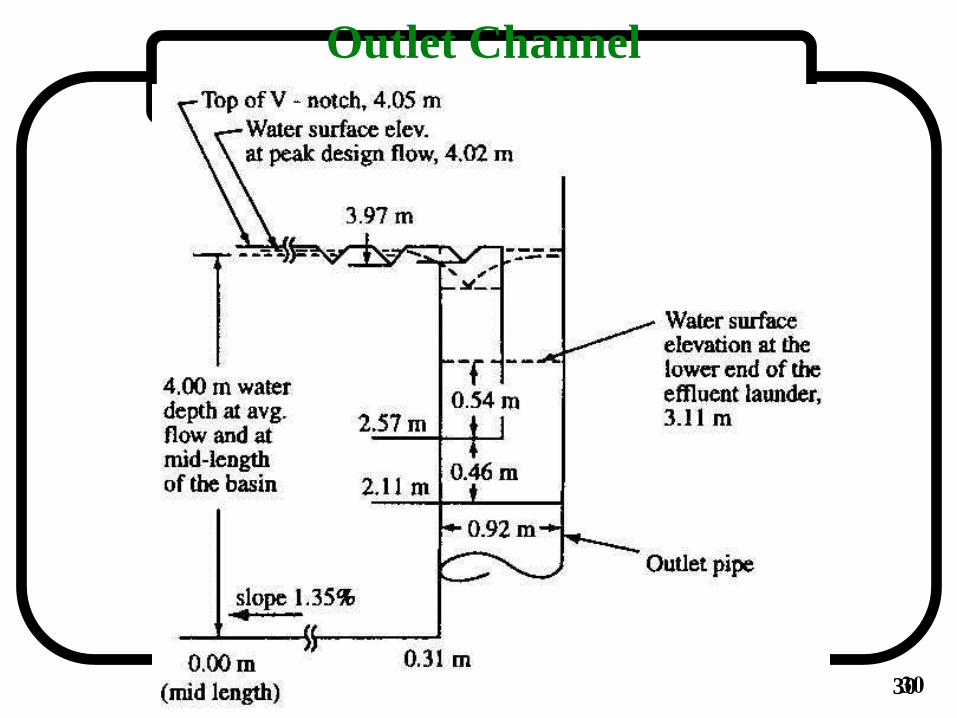
Outlet Channel
30
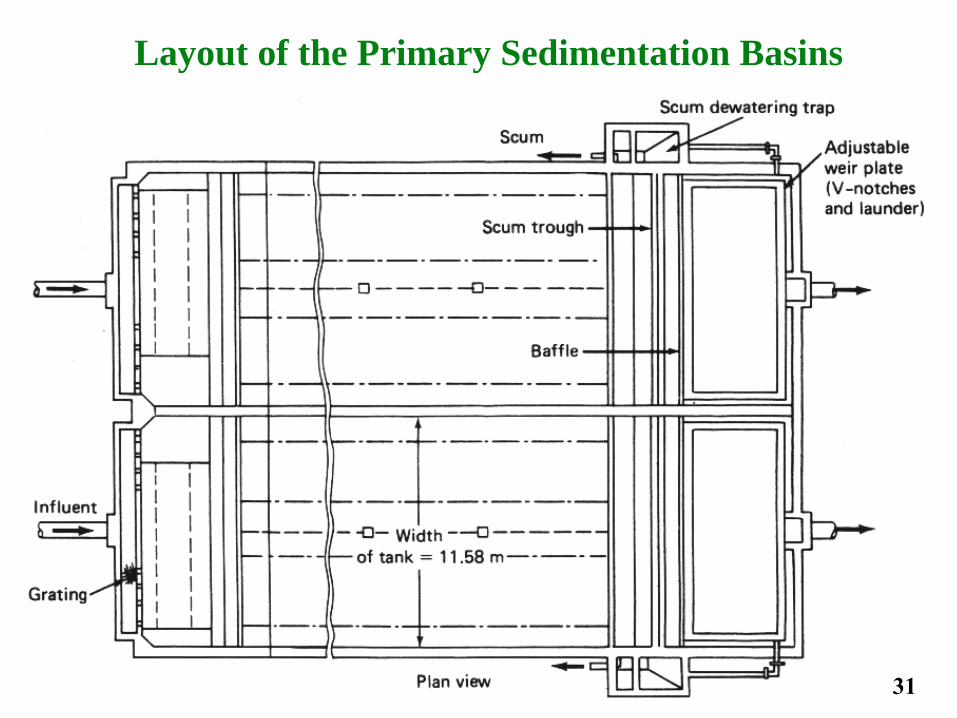
Layout of the Primary Sedimentation Basins
31
32 32
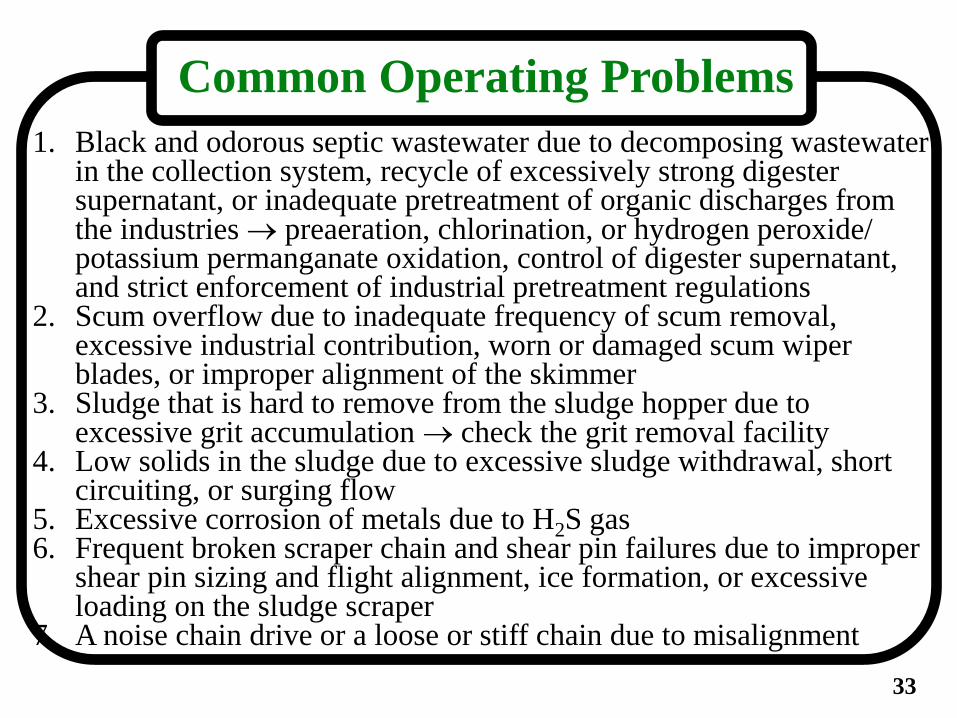
33
Common Operating Problems
1. Black and odorous septic wastewater due to decomposing wastewater in the collection system, recycle of excessively strong digester supernatant, or inadequate pretreatment of organic discharges from the industries preaeration, chlorination, or hydrogen peroxide/ potassium permanganate oxidation, control of digester supernatant, and strict enforcement of industrial pretreatment regulations
2. Scum overflow due to inadequate frequency of scum removal, excessive industrial contribution, worn or damaged scum wiper blades, or improper alignment of the skimmer
3. Sludge that is hard to remove from the sludge hopper due to excessive grit accumulation check the grit removal facility
4. Low solids in the sludge due to excessive sludge withdrawal, short circuiting, or surging flow
5. Excessive corrosion of metals due to H2S gas 6. Frequent broken scraper chain and shear pin failures due to improper
shear pin sizing and flight alignment, ice formation, or excessive loading on the sludge scraper
7. A noise chain drive or a loose or stiff chain due to misalignment
34
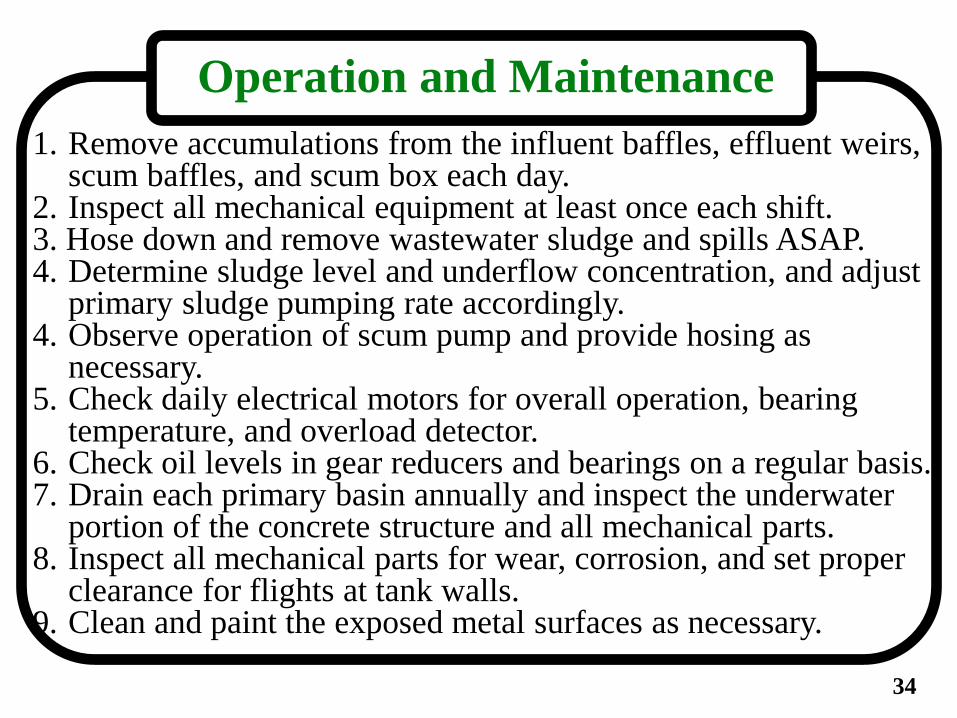
Operation and Maintenance
1. Remove accumulations from the influent baffles, effluent weirs, scum baffles, and scum box each day.
2. Inspect all mechanical equipment at least once each shift. 3. Hose down and remove wastewater sludge and spills ASAP. 4. Determine sludge level and underflow concentration, and adjust
primary sludge pumping rate accordingly. 4. Observe operation of scum pump and provide hosing as
necessary. 5. Check daily electrical motors for overall operation, bearing
temperature, and overload detector. 6. Check oil levels in gear reducers and bearings on a regular basis. 7. Drain each primary basin annually and inspect the underwater
portion of the concrete structure and all mechanical parts. 8. Inspect all mechanical parts for wear, corrosion, and set proper
clearance for flights at tank walls. 9. Clean and paint the exposed metal surfaces as necessary.
Top Related
Copyright © 2022 FDOKUMEN

